UNITED STATES
SECURITIES AND EXCHANGE COMMISSION
Washington, D.C. 20549
FORM 10-K
(Mark One)
☑ ANNUAL REPORT PURSUANT TO SECTION 13 OR 15(d) OF THE SECURITIES EXCHANGE ACT OF 1934
F OR THE FISCAL YEAR ENDED M AY 31, 2012
OR
¨ TRANSITION REPORT PURSUANT TO SECTION 13 OR 15( D ) OF THE SECURITIES EXCHANGE ACT OF 1934
F OR THE TRANSITION PERIOD FROM TO .
Commission File No. 1-10635

(Exact name of Registrant as specified in its charter)
| OREGON | 93-0584541 | |
| (State or other jurisdiction of incorporation) | (IRS Employer Identification No.) | |
| One Bowerman Drive Beaverton, Oregon | 97005-6453 | |
| (Address of principal executive offices) | (Zip Code) | |
| (503) 671-6453 | ||
(Registrant's Telephone Number, Including Area Code)
| SECURITIES REGISTERED PURSUANT TO SECTION 12(B) OF THE ACT: | ||
| Class B Common Stock | New York Stock Exchange | |
| (Title of Each Class) | (Name of Each Exchange on Which Registered) | |
| SECURITIES REGISTERED PURSUANT TO SECTION 12(G) OF THE ACT: | ||
| NONE | ||
Indicate by check mark | YES | NO | ||||||||||
• | if the registrant is a well-known seasoned issuer, as defined in Rule 405 of the Securities Act. | ☑ | ¨ | |||||||||
| • | if the registrant is not required to file reports pursuant to Section 13 or Section 15(d) of the Act. | ¨ | ☑ | |||||||||
| • | whether the Registrant (1) has filed all reports required to be filed by Section 13 or 15(d) of the Securities Exchange Act of 1934 during the preceding 12 months (or for such shorter period that the Registrant was required to file such reports), and (2) has been subject to such filing requirements for the past 90 days. | ☑ | ¨ | |||||||||
| • | whether the registrant has submitted electronically and posted on its corporate Website, if any, every Interactive Data File required to be submitted and posted pursuant to Rule 405 of Regulation S-T (§229.405 of this chapter) during the preceding 12 months (or for such shorter period that the registrant was required to submit and post such files). | ☑ | ¨ | |||||||||
| • | if disclosure of delinquent filers pursuant to Item 405 of Regulation S-K (§229.405 of this chapter) is not contained herein, and will not be contained, to the best of Registrant's knowledge, in definitive proxy or information statements incorporated by reference in Part III of this Form 10-K or any amendment to this Form 10-K. | ¨ | ||||||||||
| • | whether the Registrant is a large accelerated filer, an accelerated filer, a non-accelerated filer, or a smaller reporting company. See the definitions of "large accelerated filer," "accelerated filer" and "smaller reporting company" in Rule 12b-2 of the Exchange Act. | |||||||||||
| Large accelerated filer ☑ | Accelerated filer ¨ | Non-accelerated file ¨ | Smaller Reporting Company ¨ | |||||||||
• | whether the registrant is a shell company (as defined in Rule 12b-2 of the Act). | ¨ | ☑ | |||||||||
As of November 30, 2011, the aggregate market values of the Registrant's Common Stock held by non-affiliates were:
Class A | $ | 2,187,325,079 | ||
Class B | $ | 35,827,172,822 | ||
|
| |||
| $ | 38,014,497,901 |
As of July 19, 2012, the number of shares of the Registrant's Common Stock outstanding were:
Class A | 89,892,248 | |||
Class B | 365,977,972 | |||
|
| |||
| 455,870,220 |
DOCUMENTS INCORPORATED BY REFERENCE:
Parts of Registrant's Proxy Statement for the Annual Meeting of Shareholders to be held on September 20, 2012 are incorporated by reference into Part III of this Report.
NIKE, INC.
ANNUAL REPORT ON FORM 10-K
Table of Contents
| Page | ||||||
| PART I | 1 | |||||
| ||||||
| ITEM 1. | Business | 1 | ||||
| General | 1 | |||||
| Products | 1 | |||||
| Sales and Marketing | 2 | |||||
| United States Market | 2 | |||||
| International Markets | 2 | |||||
| Significant Customer | 3 | |||||
| Orders | 3 | |||||
| Product Research and Development | 3 | |||||
| Manufacturing | 3 | |||||
| International Operations and Trade | 4 | |||||
| Competition | 5 | |||||
| Trademarks and Patents | 5 | |||||
| Employees | 5 | |||||
| Executive Officers of the Registrant | 6 | |||||
| ITEM 1A. | Risk Factors | 7 | ||||
| ITEM 1B. | Unresolved Staff Comments | 12 | ||||
| ITEM 2. | Properties | 12 | ||||
| ITEM 3. | Legal Proceedings | 12 | ||||
| ITEM 4. | Mine Safety Disclosures | 12 | ||||
| PART II | 13 | |||||
| ||||||
| ITEM 5. | Market for Registrant's Common Equity, Related Stockholder Matters and Issuer Purchases of Equity Securities | 13 | ||||
| ITEM 6. | Selected Financial Data | 15 | ||||
| ITEM 7. | Management's Discussion and Analysis of Financial Condition and Results of Operations | 16 | ||||
| ITEM 7A. | Quantitative and Qualitative Disclosures about Market Risk | 35 | ||||
| ITEM 8. | Financial Statements and Supplemental Data | 36 | ||||
| ITEM 9. | Changes in and Disagreements with Accountants on Accounting and Financial Disclosure | 64 | ||||
| ITEM 9A. | Controls and Procedures | 64 | ||||
| ITEM 9B. | Other Information | 64 | ||||
| PART III | 65 | |||||
| ||||||
| (Except for the information set forth under "Executive Officers of the Registrant" in Item 1 above, Part III is incorporated by reference from the Proxy Statement for the NIKE, Inc. 2012 Annual Meeting of Shareholders.) | ||||||
| ITEM 10. | Directors, Executive Officers and Corporate Governance | 65 | ||||
| ITEM 11. | Executive Compensation | 65 | ||||
| ITEM 12. | Security Ownership of Certain Beneficial Owners and Management and Related Stockholder Matters | 65 | ||||
| ITEM 13. | Certain Relationships and Related Transactions, and Director Independence | 65 | ||||
| ITEM 14. | Principal Accountant Fees and Services | 65 | ||||
| PART IV | 66 | |||||
| ||||||
| ITEM 15. | Exhibits and Financial Statement Schedules | 66 | ||||
| Signatures | 70 | |||||
PART I
| ITEM 1. | Business |
General
NIKE, Inc. was incorporated in 1968 under the laws of the state of Oregon. As used in this report, the terms "we", "us", "NIKE" and the "Company" refer to NIKE, Inc. and its predecessors, subsidiaries and affiliates, unless the context indicates otherwise. Our internet address is www.nike.com. On our NIKE Corporate web site, located at www.nikeinc.com, we post the following filings as soon as reasonably practicable after they are electronically filed with or furnished to the Securities and Exchange Commission: our annual report on Form 10-K, our quarterly reports on Form 10-Q, our current reports on Form 8-K and any amendments to those reports filed or furnished pursuant to Section 13(a) or 15(d) of the Securities and Exchange Act of 1934, as amended. All such filings on our NIKE Corporate web site are available free of charge. Also available on the NIKE Corporate web site are the charters of the committees of our board of directors, as well as our corporate governance guidelines and code of ethics; copies of any of these documents will be provided in print to any shareholder who submits a request in writing to NIKE Investor Relations, One Bowerman Drive, Beaverton, Oregon 97005-6453.
Our principal business activity is the design, development and worldwide marketing and selling of high quality footwear, apparel, equipment, accessories and services. NIKE is the largest seller of athletic footwear and athletic apparel in the world. We sell our products to retail accounts, through NIKE-owned retail stores and internet sales, which we refer to as our "Direct to Consumer" operations, and through a mix of independent distributors and licensees, in approximately 190 countries around the world. Virtually all of our products are manufactured by independent contractors. Virtually all footwear and apparel products are produced outside the United States, while equipment products are produced both in the United States and abroad.
Products
We focus our product offerings in seven key categories: Running, Basketball, Football (Soccer), Men's Training, Women's Training, NIKE Sportswear (our sports-inspired products), and Action Sports. We also market products designed for kids, as well as for other athletic and recreational uses such as baseball, cricket, golf, lacrosse, outdoor activities, football (American), tennis, volleyball, walking and wrestling.
NIKE's athletic footwear products are designed primarily for specific athletic use, although a large percentage of the products are worn for casual or leisure purposes. We place considerable emphasis on high quality construction and innovation in products designed for men, women and children. NIKE Sportswear, Running, Basketball, Football (Soccer) and kids' shoes are currently our top-selling footwear categories and we expect them to continue to lead in product sales in the near future.
We sell sports apparel and accessories covering most of the above categories, as well as athletic bags and accessory items. NIKE apparel and accessories feature the same trademarks and are sold through the same marketing and distribution channels. We often market footwear, apparel and accessories in "collections" of similar use or by category. We also market apparel with licensed college and professional team and league logos.
We sell a line of performance equipment under the NIKE Brand name, including bags, socks, sport balls, eyewear, timepieces, digital devices, bats, gloves, protective equipment, golf clubs, and other equipment designed for sports activities. We also sell small amounts of various plastic products to other manufacturers through our wholly-owned subsidiary, NIKE IHM, Inc.
In addition to the products we sell directly to customers through our Direct to Consumer operations, we have entered into license agreements that permit unaffiliated parties to manufacture and sell certain apparel, digital devices and applications and other equipment designed for sports activities.
Our wholly-owned subsidiary, Cole Haan ("Cole Haan"), headquartered in New York, New York, designs and distributes dress and casual footwear, apparel and accessories for men and women under the Cole Haan ® trademark.
Our wholly-owned subsidiary, Converse Inc. ("Converse"), headquartered in North Andover, Massachusetts, designs, distributes and licenses athletic and casual footwear, apparel and accessories under the Converse ® , Chuck Taylor ® , All Star ® , One Star ® , Star Chevron ® and Jack Purcell ® trademarks.
Our wholly-owned subsidiary, Hurley International LLC ("Hurley"), headquartered in Costa Mesa, California, designs and distributes a line of action sports and youth lifestyle apparel and accessories under the Hurley ® trademark.
Our wholly-owned subsidiary, Umbro International Limited ("Umbro"), headquartered in Cheadle, United Kingdom, designs, distributes and licenses athletic and casual footwear, apparel and equipment, primarily for the sport of football (soccer), under the Umbro ® trademark.
As part of our long-term growth strategy, we continually evaluate our existing portfolio of businesses to ensure we are investing in those businesses that are accretive to the NIKE Brand, and with the largest growth potential and highest returns. On May 31, 2012, we announced our intention to divest of the Cole Haan and Umbro businesses, which will allow us to focus our resources on driving growth in the NIKE, Jordan, Converse and Hurley brands. Refer to the "Other Businesses" section under Item 7- Management Discussion and Analysis of Financial Condition and Results of Operations for additional information.
| 1 |
Sales and Marketing
Financial information about geographic and segment operations appears in Note 17 - Operating Segments and Related Information of the accompanying Notes to the Consolidated Financial Statements on page 60.
We experience moderate fluctuations in aggregate sales volume during the year. Historically, revenues in the first and fourth fiscal quarters have slightly exceeded those in the second and third quarters. However, the mix of product sales may vary considerably as a result of changes in seasonal and geographic demand for particular types of footwear, apparel and equipment.
Because NIKE is a consumer products company, the relative popularity of various sports and fitness activities and changing design trends affect the demand for our products. We must therefore respond to trends and shifts in consumer preferences by adjusting the mix of existing product offerings, developing new products, styles and categories, and influencing sports and fitness preferences through aggressive marketing. Failure to respond in a timely and adequate manner could have a material adverse effect on our sales and profitability. This is a continuing risk.
We report our NIKE Brand operations based on our internal geographic organization. Each NIKE Brand geography operates predominantly in one industry: the design, development, marketing and selling of athletic footwear, apparel, and equipment. Our reportable operating segments for the NIKE Brand are: North America, Western Europe, Central & Eastern Europe, Greater China, Japan, and Emerging Markets. Our NIKE Brand Direct to Consumer operations are managed within each geographic segment.
United States Market
In fiscal 2012, sales in the United States including U.S. sales of our Other Businesses accounted for approximately 42% of total revenues, compared to 43% in fiscal 2011 and 42% in fiscal 2010. Our Other Businesses were primarily comprised of our affiliate brands; Cole Haan, Converse, Hurley and Umbro; and NIKE Golf. We sell to thousands of retail accounts in the United States, including a mix of footwear stores, sporting goods stores, athletic specialty stores, department stores, skate, tennis and golf shops, and other retail accounts. During fiscal 2012, our three largest customers accounted for approximately 24% of sales in the United States.
We make substantial use of our "futures" ordering program, which allows retailers to order five to six months in advance of delivery with the commitment that their orders will be delivered within a set time period at a fixed price. In fiscal 2012, 86% of our U.S. wholesale footwear shipments (excluding our Other Businesses) were made under the futures program, compared to 87% in fiscal 2011 and 89% in fiscal 2010. In fiscal 2012, 64% of our U.S. wholesale apparel shipments (excluding our Other Businesses) were made under the futures program, compared to 60% in fiscal 2011 and 62% in fiscal 2010.
We utilize NIKE sales offices to solicit sales in the United States as well as independent sales representatives to sell specialty products for golf, skateboarding and snowboarding products. In addition, our Direct to Consumer operations sell NIKE Brand products through our internet website, www.nikestore.com , and the following in-line and factory retail outlets in the United States:
| U.S. Retail Stores | Number | |||
| NIKE factory stores | 156 | |||
| NIKE in-line stores, including NIKETOWNs and employee-only stores | 28 | |||
| Cole Haan stores (including factory stores) | 109 | |||
| Converse stores (including factory stores) | 62 | |||
| Hurley stores (including factory and employee stores) | 29 | |||
| TOTAL | 384 | |||
NIKE's three significant distribution centers in the United States for NIKE Brand products, including NIKE Golf, are located in Memphis, Tennessee. NIKE also operates and leases one facility in Memphis, Tennessee for NIKE Brand product returns. NIKE Brand apparel and equipment products are also shipped from our Foothill Ranch, California distribution center. Cole Haan products are distributed primarily from Greenland, New Hampshire, and Converse and Hurley products are shipped primarily from Ontario, California.
International Markets
In fiscal 2012, non-U.S. sales (including non-U.S. sales of our Other Businesses) accounted for 58% of total revenues, compared to 57% in fiscal 2011 and 58% in fiscal 2010. We sell our products to retail accounts, through our own Direct to Consumer operations, and through a mix of independent distributors, licensees and sales representatives around the world. We sell to thousands of retail accounts and operate 16 distribution centers outside of the United States. In many countries and regions, including Canada, Asia, some Latin American countries, and Europe, we have a futures ordering program for retailers similar to the United States futures program described above. During fiscal 2012, NIKE's three largest customers outside of the U.S. accounted for approximately 11% of total non-U.S. sales.
Our Direct to Consumer business operates the following in-line and factory retail outlets outside the United States:
| Non-U.S. Retail Stores | Number | |||
| NIKE factory stores | 308 | |||
| NIKE in-line stores, including NIKETOWNs and employee-only stores | 65 | |||
| Cole Haan stores (including factory stores) | 69 | |||
| TOTAL | 442 | |||
| 2 |
International branch offices and subsidiaries of NIKE are located in Argentina, Australia, Austria, Belgium, Bermuda, Brazil, Canada, Chile, China, Croatia, Cyprus, the Czech Republic, Denmark, Finland, France, Germany, Greece, Hong Kong, Hungary, Indonesia, India, Ireland, Israel, Italy, Japan, Korea, Lebanon, Macau, Malaysia, Mexico, New Zealand, the Netherlands, Norway, the Philippines, Poland, Portugal, Russia, Singapore, Slovakia, Slovenia, South Africa, Spain, Sri Lanka, Sweden, Switzerland, Taiwan, Thailand, Turkey, the United Arab Emirates, the United Kingdom, Uruguay and Vietnam.
Significant Customer
No customer accounted for 10% or more of our net sales during fiscal 2012.
Orders
Worldwide futures orders for NIKE Brand athletic footwear and apparel, scheduled for delivery from June through November 2012, were $11.2 billion compared to $10.5 billion for the same period last year. This futures order amount is calculated based upon our forecast of the actual exchange rates under which our revenues will be translated during this period. Reported futures orders are not necessarily indicative of our expectation of revenues for this period. This is because the mix of orders can shift between futures and at-once orders and the fulfillment of certain of these futures orders may fall outside of the scheduled time period noted above. In addition, foreign currency exchange rate fluctuations as well as differing levels of order cancellations and discounts can cause differences in the comparisons between futures orders and actual revenues. Moreover, a significant portion of our revenue is not derived from futures orders, including at-once and close-out sales of NIKE Brand footwear and apparel, sales of NIKE Brand equipment, sales from our Direct to Consumer operations, and sales from our Other Businesses.
Product Research and Development
We believe our research and development efforts are a key factor in our past and future success. Technical innovation in the design and manufacturing process of footwear, apparel, and athletic equipment receive continued emphasis as NIKE strives to produce products that help to reduce injury, enhance athletic performance and maximize comfort.
In addition to NIKE's own staff of specialists in the areas of biomechanics, chemistry, exercise physiology, engineering, industrial design, and related fields, we also utilize research committees and advisory boards made up of athletes, coaches, trainers, equipment managers, orthopedists, podiatrists, and other experts who consult with us and review designs, materials, concepts for product and manufacturing process improvements and compliance with product safety regulations around the world. Employee athletes, athletes engaged under sports marketing contracts and other athletes wear-test and evaluate products during the design and development process.
Manufacturing
Virtually all of our footwear is produced by factories we contract with outside of the United States. In fiscal 2012, contract factories in Vietnam, China and Indonesia, manufactured approximately 41%, 32% and 25% of total NIKE Brand footwear, respectively. We also have manufacturing agreements with independent factories in Argentina, Brazil, India, and Mexico to manufacture footwear for sale primarily within those countries. The largest single footwear factory that we have contracted with accounted for approximately 5% of total fiscal 2012 NIKE Brand footwear production. Almost all of NIKE Brand apparel is manufactured outside of the United States by independent contract manufacturers located in 28 countries. Most of this apparel production occurred in China, Vietnam, Thailand, Sri Lanka, Malaysia, Indonesia, Turkey, Cambodia, Mexico, and El Salvador. The largest single apparel factory that we have contracted with accounted for approximately 8% of total fiscal 2012 apparel production.
The principal materials used in our footwear products are natural and synthetic rubber, plastic compounds, foam cushioning materials, nylon, leather, canvas, and polyurethane films used to make Air-Sole cushioning components. During fiscal 2012, NIKE IHM, Inc., a wholly-owned subsidiary of NIKE, as well as independent contractors in China and Taiwan, were our largest suppliers of the Air-Sole cushioning components used in footwear. The principal materials used in our apparel products are natural and synthetic fabrics and threads, plastic and metal hardware, and specialized performance fabrics designed to repel rain, retain heat, or efficiently transport body moisture. NIKE's independent contractors and suppliers buy raw materials in bulk for the manufacturing of our footwear, apparel and equipment products. Most raw materials are available and purchased by those independent contractors and suppliers in the countries where manufacturing takes place. We have thus far experienced little difficulty in satisfying our raw material requirements.
Since 1972, Sojitz Corporation of America ("Sojitz America"), a large Japanese trading company and the sole owner of our redeemable preferred stock, has performed significant import-export financing services for us. During fiscal 2012, Sojitz America provided financing and purchasing services for NIKE Brand products sold in Argentina, Uruguay, Canada, Brazil, India, Indonesia, the Philippines, Malaysia, South Africa, China, Korea, and Thailand, excluding products produced and sold in the same country. Approximately 19% of NIKE Brand sales occurred in those countries. Any failure of Sojitz America to provide these services or any failure of Sojitz America's banks could disrupt our ability to acquire products from our suppliers and to deliver products to our customers in those jurisdictions. Such a disruption could result in cancelled orders that would adversely affect sales and profitability. However, we believe that any such disruption would be short-term in duration due to the ready availability of alternative sources of financing at competitive rates. Our current agreements with Sojitz America expire on May 31, 2014.
| 3 |
International Operations and Trade
Our international operations and sources of supply are subject to the usual risks of doing business abroad, such as possible revaluation of currencies, export and import duties, anti-dumping measures, quotas, safeguard measures, trade restrictions, restrictions on the transfer of funds and, in certain parts of the world, political instability and terrorism. We have not, to date, been materially affected by any such risk, but cannot predict the likelihood of such developments occurring.
The global economic recession resulted in a significant slow-down in international trade and a sharp rise in protectionist actions around the world. These trends are affecting many global manufacturing and service sectors, and the footwear and apparel industries, as a whole, are not immune. Companies in our industry are facing trade protectionist challenges in many different regions, and in nearly all cases we are working together to address trade issues to reduce the impact to the industry, while observing applicable competition laws. Notwithstanding our efforts, such actions, if implemented, could result in increases in the cost of our products, which may in turn adversely affect our sales or profitability and the imported footwear and apparel industry as a whole. Accordingly, we are actively monitoring the developments described below.
Footwear Imports into the European Union
In 2005, at the request of the European domestic footwear industry, the European Commission ("EC") initiated investigations into leather footwear imported from China and Vietnam. Together with other companies in our industry, we took the position that Special Technology Athletic Footwear (STAF) (i) should not be within the scope of the investigation, and (ii) does not meet the legal requirements of injury and price in an anti-dumping investigation. Our arguments were successful and the EU agreed in October 2006 on definitive duties of 16.5% for China and 10% for Vietnam for non-STAF leather footwear, but excluded STAF from the final measures. Prior to the scheduled expiration in October 2008 of the measures imposed on the non-STAF footwear, the domestic industry requested and the EC agreed to review a petition to extend these restrictions on non-STAF leather footwear. In December 2009, following a review of the ongoing restrictions, EU member states voted to extend the measures for an additional 15 months, until March 31, 2011. In early 2011, the EC declined to further extend the measures and since April 1, 2011 these restrictions have been terminated. The EC noted at the time that it would monitor leather footwear imports from Vietnam and China over the next 12 months. No new trade defense actions have been taken by the EC.
On February 3, 2010, the Chinese government announced it would seek to refer the EU decision (both on the original measures and subsequent review decision) to the World Trade Organization ("WTO") for its further review and decision. On May 18, 2010, the Dispute Settlement Body of the WTO agreed to establish a panel to rule on China's claims against the EU with respect to the above anti-dumping measures. On October 28, 2011, the WTO issued a ruling in which it supported China's positions on a number of issues. Neither party has filed an appeal.
Footwear, Apparel and Equipment Imports into Brazil and Argentina
At the request of certain domestic footwear industry participants, both Brazil and Argentina have initiated independent anti-dumping investigations against footwear made in China. Over the last two years, we have been working with a broad coalition of other companies in our industry to challenge these cases on the basis that the athletic footwear being imported from China (i) should not be within the scope of the investigation, and (ii) does not meet the legal requirements of injury and price in an anti-dumping investigation. In the case of Argentina, in 2010, the final determination made by the administering authorities was favorable to us. In the case of Brazil, the administering authorities agreed to impose an anti-dumping duty against nearly all footwear from China, which we believe will impact all brands in the footwear industry. This decision does not materially affect us. In October 2011, the Brazilian government initiated an anti-circumvention investigation to determine whether Chinese-made products or components were subject to minimal assembly or finishing in Vietnam or Indonesia to evade anti-dumping duties on Chinese-made products. In July 2012, the Brazilian government found no circumvention was taking place and this matter is closed.
Many products, including footwear, apparel and equipment, that we and others in our industry import into Argentina and Brazil are subject to the WTO non-automatic licensing requirements, which means that it may take up to 60 days for those products to clear customs and enter into those jurisdictions. From time to time, in addition to these WTO licensing requirements, these jurisdictions impose further importation restrictions or limitations. As a result, we have experienced delays in our ability to import our products or it has taken longer than the time allowed under the WTO for us to import our products. To date, our business has not been materially affected by these restrictions or delays. In the future, however, if we are unable to import our products into these jurisdictions due to these or other restrictions or if we experience increasing or more frequent delays beyond the WTO-permitted 60 days to import our products, our business could be materially affected.
Footwear, Apparel and Equipment Imports into Turkey
In 2006, Turkey introduced safeguard measures in the form of additional duties on all imported footwear into Turkey with the goal of protecting its local shoe manufacturing industry until August 2009. In June 2009, Turkish shoe-manufacturers submitted, and the Turkish government agreed to review, a request for extension of the safeguard measures claiming that the rehabilitation process of the local Turkish industry was interrupted due to the continuing increase of footwear imports. Despite the importers opposition to the continuation of the safeguard measures, the Turkish authorities extended these safeguard measures until August 2012, but reduced the duty from $3 per pair of footwear to $1.60 per pair of footwear. In June 2012, the government of Turkey launched an expiry review on the footwear safeguards to assess if they should be extended for three additional years (until August 2015). Together with other companies in our industry, we are advocating for exclusion of certain footwear products (STAF shoes) that cannot be manufactured in Turkey and therefore should not be subject to a higher import duty.
In 2011, two new safeguard measures and reviews were initiated by the Turkish Undersecretariat of Foreign Trade ("UFT") on apparel and equipment imports. In January 2011, the UFT began an investigation on apparel imports that could result in a 20-30% increase in import duties applied to imported apparel products, regardless of country of origin and with exceptions for EU
| 4 |
and countries that are included in a cross-cumulation of origin system in the framework of the Free Trade Agreements to which Turkey is a party, subject to evidence of preferential origin. In July 2011, these higher import duties were approved and will be in place through July 2014.
Together with other companies in our industry, we advocated for exclusion of certain apparel products used for sporting activities that cannot be manufactured in Turkey and therefore should not be subject to a higher import duty but no exclusion has been granted.
In February 2011, the UFT began a review of existing safeguard measure on travel goods, handbags and similar accessories and containers listed under applicable regulations. One Turkish bag manufacturers association has requested the continuation of the safeguard measures through April 2014, with the application of an additional import duty of $2.50/kg (max. $3.75/unit) to $2.70/kg (max. $4.25/unit), regardless of country of origin. In October 2011, these higher import duties were approved and will be in place through April 2014.
Together with other companies in our industry, we advocated for the exclusion of non-leather bags from the scope of the continued safeguards but no exclusion has been granted.
Trade Relations with China
China represents an important sourcing country and consumer marketing country for us. Many governments around the world are concerned about China's growing and fast-paced economy, compliance with WTO rules, currency valuation, and high trade surpluses. As a result, a wide range of legislative proposals have been introduced to address these concerns. We are working with broad coalitions of global businesses and trade associations representing a wide variety of sectors (e.g., services, manufacturing, and agriculture) to help ensure any legislation enacted and implemented (i) addresses legitimate and core concerns, (ii) is consistent with international trade rules, and (iii) reflects and considers China's domestic economy and the important role it has in the global economic community. We believe other companies in our industry as well as most other multi-national companies are in a similar position regarding these trade measures.
In the event any of these trade protection measures are implemented, we believe that we have the ability to develop, over a period of time, adequate alternative sources of supply for the products obtained from our present suppliers. If events prevented us from acquiring products from our suppliers in a particular country, our operations could be temporarily disrupted and we could experience an adverse financial impact. However, we believe we could abate any such disruption, and that much of the adverse impact on supply would, therefore, be of a short-term nature. We believe our principal competitors are subject to similar risks.
Competition
The athletic footwear, apparel, and equipment industry is keenly competitive in the United States and on a worldwide basis. We compete internationally with a significant number of athletic and leisure shoe companies, athletic and leisure apparel companies, sports equipment companies, and large companies having diversified lines of athletic and leisure shoes, apparel, and equipment, including Adidas, Puma, and others. The intense competition and the rapid changes in technology and consumer preferences in the markets for athletic and leisure footwear and apparel, and athletic equipment, constitute significant risk factors in our operations.
NIKE is the largest seller of athletic footwear and athletic apparel in the world. Performance and reliability of shoes, apparel, and equipment, new product development, price, product identity through marketing and promotion, and customer support and service are important aspects of competition in the athletic footwear, apparel, and equipment industry. To help market our products, we contract with prominent and influential athletes, coaches, teams, colleges and sports leagues to endorse our brands and use our products, and we actively sponsor sporting events and clinics. We believe that we are competitive in all of these areas.
Trademarks and Patents
We utilize trademarks on nearly all of our products and believe having distinctive marks that are readily identifiable is an important factor in creating a market for our goods, in identifying our brands and the Company, and in distinguishing our goods from the goods of others. We consider our NIKE ® and Swoosh Design ® trademarks to be among our most valuable assets and we have registered these trademarks in almost 150 jurisdictions. In addition, we own many other trademarks that we utilize in marketing our products. We continue to vigorously protect our trademarks against infringement.
NIKE has an exclusive, worldwide license to make and sell footwear using patented "Air" technology. The process utilizes pressurized gas encapsulated in polyurethane. Some of the early NIKE AIR ® patents have expired, which may enable competitors to use certain types of similar technology. Subsequent NIKE AIR ® patents will not expire for several years. We also have over a thousand U.S. and foreign utility patents, and thousands of U.S. and foreign design patents covering components, manufacturing techniques and features used in various athletic and leisure shoes, apparel, athletic equipment, digital devices and golf products. These patents expire at various times, and patents issued for applications filed this year will last from now to 2026 for design patents, and from now to 2032 for utility patents. We believe our success depends primarily upon skills in design, research and development, production, and marketing rather than upon our patent position. However, we have followed a policy of filing applications for United States and foreign patents on inventions, designs, and improvements that we deem valuable.
Employees
As of May 31, 2012, we had approximately 44,000 employees worldwide, including retail and part-time employees. Management considers its relationship with employees to be excellent. None of our employees are represented by a union, except for certain employees in the Emerging Markets geography, where local law requires those employees to be represented by a trade union, and in the United States, where certain employees of Cole Haan are represented by a union. Also, in some countries outside of the United States, local laws require representation for employees by works councils (such as in certain countries in the European Union, in which they are entitled to information and consultation on certain Company decisions) or other employee representation by an organization similar to a union, and in certain European countries, we are required by local law to enter into and/or comply with (industry wide or national) collective bargaining agreements. There has never been a material interruption of operations due to labor disagreements.
| 5 |
Executive Officers of the Registrant
The executive officers of NIKE as of July 19, 2012 are as follows:
Philip H. Knight, Chairman of the Board - Mr. Knight, 74, a director since 1968, is a co-founder of NIKE and, except for the period from June 1983 through September 1984, served as its President from 1968 to 1990 and from June 2000 to December 2004. Prior to 1968, Mr. Knight was a certified public accountant with Price Waterhouse and Coopers & Lybrand and was an Assistant Professor of Business Administration at Portland State University.
Mark G. Parker, President and Chief Executive Officer - Mr. Parker, 56, was appointed CEO and President in January 2006. He has been employed by NIKE since 1979 with primary responsibilities in product research, design and development, marketing, and brand management. Mr. Parker was appointed divisional Vice President in charge of development in 1987, corporate Vice President in 1989, General Manager in 1993, Vice President of Global Footwear in 1998, and President of the NIKE Brand in 2001.
David J. Ayre, Vice President, Global Human Resources - Mr. Ayre, 52, joined NIKE as Vice President, Global Human Resources in 2007. Prior to joining NIKE, he held a number of senior human resource positions with PepsiCo, Inc. since 1990, most recently as head of Talent and Performance Rewards.
Donald W. Blair, Vice President and Chief Financial Officer - Mr. Blair, 54, joined NIKE in November 1999. Prior to joining NIKE, he held a number of financial management positions with PepsiCo, Inc., including Vice President, Finance of Pepsi-Cola Asia, Vice President, Planning of PepsiCo's Pizza Hut Division, and Senior Vice President, Finance of The Pepsi Bottling Group, Inc. Prior to joining PepsiCo, Mr. Blair was a certified public accountant with Deloitte, Haskins, and Sells.
Charles D. Denson, President of the NIKE Brand - Mr. Denson, 56, has been employed by NIKE since 1979. Mr. Denson held several management positions within the Company, including his appointments as Director of USA Apparel Sales in 1994, divisional Vice President, U.S. Sales in 1994, divisional Vice President European Sales in 1997, divisional Vice President and General Manager, NIKE Europe in 1998, Vice President and General Manager of NIKE USA in 2000, and President of the NIKE Brand in 2001.
Gary M. DeStefano, President, Global Operations - Mr. DeStefano, 55, has been employed by NIKE since 1982, with primary responsibilities in sales and regional administration. Mr. DeStefano was appointed Director of Domestic Sales in 1990, divisional Vice President in charge of domestic sales in 1992, Vice President of Global Sales in 1996, Vice President and General Manager of Asia Pacific in 1997, President of USA Operations in 2001, and President of Global Operations in 2006.
Trevor A. Edwards, Vice President, Global Brand and Category Management - Mr. Edwards, 49, joined NIKE in 1992. He was appointed Marketing Manager, Strategic Accounts, Foot Locker in 1993, Director of Marketing, the Americas in 1995, Director of Marketing, Europe in 1997, Vice President, Marketing for Europe, Middle East and Africa in 1999, and Vice President, U.S. Brand Marketing in 2000. Mr. Edwards was appointed corporate Vice President, Global Brand Management in 2002 and Vice President, Global Brand and Category Management in 2006. Prior to NIKE, Mr. Edwards was with the Colgate-Palmolive Company.
Jeanne P. Jackson, President, Direct to Consumer - Ms. Jackson, 60, served as a member of the NIKE, Inc. Board of Directors from 2001 through 2009, when she resigned from our Board and was appointed President, Direct to Consumer. She is founder and CEO of MSP Capital, a private investment company. Ms. Jackson was CEO of Walmart.com from March 2000 to January 2002. She was with Gap, Inc., as President and CEO of Banana Republic from 1995 to 2000, also serving as CEO of Gap, Inc. Direct from 1998 to 2000. Since 1978, she has held various retail management positions with Victoria's Secret, The Walt Disney Company, Saks Fifth Avenue, and Federated Department Stores. Ms. Jackson is the past President of the United States Ski and Snowboard Foundation Board of Trustees, and is a director of McDonald's Corporation. She is a former director of Nordstrom, Inc., and Harrah's Entertainment, Inc.
Hilary K. Krane, Vice President, General Counsel and Corporate Affairs - Ms. Krane, 48, joined NIKE as Vice President and General Counsel in April 2010. In 2011, her responsibilities expanded and she became Vice President, General Counsel and Corporate Affairs. Prior to joining NIKE, Ms. Krane was General Counsel and Senior Vice President for Corporate Affairs at Levi Strauss & Co. where she was responsible for legal affairs and overseeing the global brand protection department from 2006 to 2010. From 1996 to 2006, she was a partner and assistant general counsel at PricewaterhouseCoopers LLP.
Bernard F. Pliska, Vice President, Corporate Controller - Mr. Pliska, 50, joined NIKE as Corporate Controller in 1995. He was appointed Vice President, Corporate Controller in 2003. Prior to NIKE, Mr. Pliska was with Price Waterhouse from 1984 to 1995. Mr. Pliska is a certified public accountant.
John F. Slusher, Vice President, Global Sports Marketing - Mr. Slusher, 43, has been employed by NIKE since 1998 with primary responsibilities in global sports marketing. Mr. Slusher was appointed Director of Sports Marketing for the Asia Pacific and Americas Regions in 2006, divisional Vice President, Asia Pacific & Americas Sports Marketing in September 2007 and Vice President, Global Sports Marketing in November 2007. Prior to joining NIKE, Mr. Slusher was an attorney at the law firm of O'Melveny & Myers from 1995 to 1998.
Eric D. Sprunk, Vice President, Merchandising and Product - Mr. Sprunk, 48, joined NIKE in 1993. He was appointed Finance Director and General Manager of the Americas in 1994, Finance Director, NIKE Europe in 1995, Regional General Manager, NIKE Europe Footwear in 1998, and Vice President & General Manager of the Americas in 2000. Mr. Sprunk was appointed corporate Vice President, Global Footwear in 2001 and Vice President, Merchandising and Product in 2009. Prior to joining NIKE, Mr. Sprunk was a certified public accountant with Price Waterhouse from 1987 to 1993.
Hans van Alebeek, Vice President, Global Operations and Technology - Mr. van Alebeek, 46, joined NIKE as Director of Operations of Europe in 1999, and was appointed Vice President, Operations & Administration in EMEA in 2001, Vice President, Global Operations in 2003, Vice President, Global Operations & Technology in 2004, and Corporate Vice President in November 2005. Prior to joining NIKE, Mr. van Alebeek worked for McKinsey & Company as a management consultant and at N.V. Indivers in business development.
Roger S. Wyett, President, Affiliates - Mr. Wyett, 55, joined NIKE in April 2005 as President and Chief Operating Officer of the Company's Hurley brand and was appointed Vice President, Global Apparel in 2006. In October 2007, Mr. Wyett returned to the Company's Hurley brand as President and Chief Executive Officer, and then in February 2011 was appointed President of Affiliates. Mr. Wyett first joined NIKE in 1994, holding a number of management positions in soccer and NIKE Team Sports. From 2000 to 2005, Mr. Wyett was employed by The Walt Disney Company where he was Senior Vice President for Global Apparel, Accessories and Footwear, and later promoted to Executive Vice President for Global Sales and Marketing for Consumer Products.
| 6 |
| ITEM 1A. | Risk Factors |
Special Note Regarding Forward-Looking Statements and Analyst Reports
Certain written and oral statements, other than purely historical information, including estimates, projections, statements relating to NIKE's business plans, objectives and expected operating results, and the assumptions upon which those statements are based, made or incorporated by reference from time to time by NIKE or its representatives in this report, other reports, filings with the Securities and Exchange Commission, press releases, conferences, or otherwise, are "forward-looking statements" within the meaning of the Private Securities Litigation Reform Act of 1995 and Section 21E of the Securities Exchange Act of 1934, as amended. Forward-looking statements include, without limitation, any statement that may predict, forecast, indicate, or imply future results, performance, or achievements, and may contain the words "believe", "anticipate", "expect", "estimate", "project", "will be", "will continue", "will likely result", or words or phrases of similar meaning. Forward-looking statements involve risks and uncertainties which may cause actual results to differ materially from the forward-looking statements. The risks and uncertainties are detailed from time to time in reports filed by NIKE with the Securities and Exchange Commission, including Forms 8-K, 10-Q, and 10-K, and include, among others, the following: international, national and local general economic and market conditions; the size and growth of the overall athletic footwear, apparel, and equipment markets; intense competition among designers, marketers, distributors and sellers of athletic footwear, apparel, and equipment for consumers and endorsers; demographic changes; changes in consumer preferences; popularity of particular designs, categories of products, and sports; seasonal and geographic demand for NIKE products; difficulties in anticipating or forecasting changes in consumer preferences, consumer demand for NIKE products, and the various market factors described above; difficulties in implementing, operating, and maintaining NIKE's increasingly complex information systems and controls, including, without limitation, the systems related to demand and supply planning, and inventory control; interruptions in data and information technology systems; data security; fluctuations and difficulty in forecasting operating results, including, without limitation, the fact that advance "futures" orders may not be indicative of future revenues due to changes in shipment timing, and the changing mix of futures and at-once orders and order cancellations; the ability of NIKE to sustain, manage or forecast its growth and inventories; the size, timing and mix of purchases of NIKE's products; increases in the cost of materials and energy used to manufacture products, new product development and introduction; the ability to secure and protect trademarks, patents, and other intellectual property; performance and reliability of products; customer service; adverse publicity; the loss of significant customers or suppliers; dependence on distributors and licensees; business disruptions; increased costs of freight and transportation to meet delivery deadlines; increases in borrowing costs due to any decline in our debt ratings; changes in business strategy or development plans; general risks associated with doing business outside the United States, including, without limitation, exchange rate fluctuations, import duties, tariffs, quotas, political and economic instability, and terrorism; changes in government regulations; the impact of, including business and legal developments relating to, climate change; liability and other claims asserted against NIKE; the ability to attract and retain qualified personnel; the effects of our decision to divest of the Cole Haan and Umbro businesses; and other factors referenced or incorporated by reference in this report and other reports.
The risks included here are not exhaustive. Other sections of this report may include additional factors which could adversely affect NIKE's business and financial performance. Moreover, NIKE operates in a very competitive and rapidly changing environment. New risk factors emerge from time to time and it is not possible for management to predict all such risk factors, nor can it assess the impact of all such risk factors on NIKE's business or the extent to which any factor, or combination of factors, may cause actual results to differ materially from those contained in any forward-looking statements. Given these risks and uncertainties, investors should not place undue reliance on forward-looking statements as a prediction of actual results.
Investors should also be aware that while NIKE does, from time to time, communicate with securities analysts, it is against NIKE's policy to disclose to them any material non-public information or other confidential commercial information. Accordingly, shareholders should not assume that NIKE agrees with any statement or report issued by any analyst irrespective of the content of the statement or report. Furthermore, NIKE has a policy against issuing or confirming financial forecasts or projections issued by others. Thus, to the extent that reports issued by securities analysts contain any projections, forecasts or opinions, such reports are not the responsibility of NIKE.
Our products face intense competition.
NIKE is a consumer products company and the relative popularity of various sports and fitness activities and changing design trends affect the demand for our products. The athletic footwear, apparel, and equipment industry is keenly competitive in the United States and on a worldwide basis. We compete internationally with a significant number of athletic and leisure shoe companies, athletic and leisure apparel companies, sports equipment companies, and large companies having diversified lines of athletic and leisure shoes, apparel, and equipment. We also compete with other companies for the production capacity of independent manufacturers that produce our products and for import quota capacity.
Our competitors' product offerings, technologies, marketing expenditures (including expenditures for advertising and endorsements), pricing, costs of production, and customer service are areas of intense competition. This, in addition to rapid changes in technology and consumer preferences in the markets for athletic and leisure footwear and apparel, and athletic equipment, constitute significant risk factors in our operations. If we do not adequately and timely anticipate and respond to our competitors, our costs may increase or the consumer demand for our products may decline significantly.
Failure to maintain our reputation and brand image could negatively impact our business.
Our iconic brands have worldwide recognition, and our success depends on our ability to maintain and enhance our brand image and reputation. Maintaining, promoting and growing our brands will depend on our design and marketing efforts, including advertising and consumer campaigns, as well as product innovation. We could be adversely impacted if we fail to achieve any of these objectives or if the reputation or image of any of our brands is tarnished or receives negative publicity. In addition, adverse publicity about regulatory or legal action against us could damage our reputation and brand image, undermine our customers' confidence in us and reduce long-term demand for our products, even if the regulatory or legal action is unfounded or not material to our operations.
In addition, our success in maintaining, extending and expanding our brand image depends on our ability to adapt to a rapidly changing media environment, including our increasing reliance on social media and online dissemination of advertising campaigns. Negative posts or comments about us on social networking web sites could seriously damage our reputation and brand image. If we do not maintain, extend and expand our brand image, then our product sales, financial condition and results of operations could be materially and adversely affected.
If we are unable to anticipate consumer preferences and develop new products, we may not be able to maintain or increase our net revenues and profits.
Our success depends on our ability to identify, originate and define product trends as well as to anticipate, gauge and react to changing consumer demands in a timely manner. All of our products are subject to changing consumer preferences that cannot be predicted with certainty. Our new products may not receive consumer acceptance as consumer preferences could shift rapidly to different types of performance or other sports apparel or away from these types of products altogether, and our future success depends in part on our ability to anticipate and respond to these changes. If
| 7 |
we fail to anticipate accurately and respond to trends and shifts in consumer preferences by adjusting the mix of existing product offerings, developing new products, designs, styles and categories, and influencing sports and fitness preferences through aggressive marketing, we could experience lower sales, excess inventories and lower profit margins, any of which could have an adverse effect on our results of operations and financial condition. In addition, we market our products globally through a diverse spectrum of advertising and promotional programs and campaigns, including social media and online advertising. If we do not successfully market our products or if advertising and promotional costs increase, these factors could have an adverse effect on our business, financial condition and results of operation.
We rely on technical innovation and high quality products to compete in the market for our products.
Technical innovation and quality control in the design and manufacturing process of footwear, apparel, and athletic equipment is essential to the commercial success of our products. Research and development plays a key role in technical innovation. We rely upon specialists in the fields of biomechanics, exercise physiology, engineering, industrial design and related fields, as well as research committees and advisory boards made up of athletes, coaches, trainers, equipment managers, orthopedists, podiatrists, and other experts to develop and test cutting edge performance products. While we strive to produce products that help to reduce injury, enhance athletic performance and maximize comfort, if we fail to introduce technical innovation in our products, consumer demand for our products could decline, and if we experience problems with the quality of our products, we may incur substantial expense to remedy the problems.
Failure to continue to obtain high quality endorsers of our products could harm our business.
We establish relationships with professional athletes, sports teams and leagues to evaluate, promote, and establish product authenticity with consumers. If certain endorsers were to stop using our products contrary to their endorsement agreements, our business could be adversely affected. In addition, actions taken by athletes, teams or leagues associated with our products that harm the reputations of those athletes, teams or leagues could also harm our brand image with consumers and, as a result, could have an adverse effect on our sales and financial condition. In addition, poor performance by our endorsers, a failure to continue to correctly identify promising athletes to use and endorse our products, or a failure to enter into cost effective endorsement arrangements with prominent athletes and sports organizations could adversely affect our brand and result in decreased sales of our products.
Failure of our contractors or our licensees' contractors to comply with our code of conduct, local laws, and other standards could harm our business.
We work with hundreds of contractors outside of the United States to manufacture our products, and we also have license agreements that permit unaffiliated parties to manufacture or contract to manufacture products using our trademarks. We impose, and require our licensees to impose, on those contractors a code of conduct and other environmental, health, and safety standards for the benefit of workers. We also require these contractors to comply with applicable standards for product safety. However, from time to time contractors may not comply with such standards or applicable local law or our licensees may not require their contractors to comply with such standards or applicable local law. Significant or continuing noncompliance with such standards and laws by one or more contractors could harm our reputation or result in a product recall and, as a result, could have an adverse effect on our sales and financial condition.
Global capital and credit market conditions, and resulting declines in consumer confidence and spending, could have a material adverse effect on our business, operating results, and financial condition.
The uncertain state of the global economy continues to impact businesses around the world. The current political and economic global environment has resulted in continued economic unpredictability, particularly in Europe where there are concerns regarding the increased debt levels of certain countries and their ability to meet future financial obligations, as well as the overall stability of the Euro currency. Continuing volatility and disruption in the global capital and credit markets have led to a tightening of business credit and liquidity, a contraction of consumer credit, business failures, higher unemployment, and declines in consumer confidence and spending in many parts of the world. If global economic and financial market conditions deteriorate or remain weak for an extended period of time, the following factors could have a material adverse effect on our business, operating results, and financial condition:
| • | Slower consumer spending may result in reduced demand for our products, reduced orders from retailers for our products, order cancellations, lower revenues, increased inventories, and lower gross margins. |
| • | We may be unable to find suitable investments that are safe, liquid, and provide a reasonable return. This could result in lower interest income or longer investment horizons. Disruptions to capital markets or the banking system may also impair the value of investments or bank deposits we currently consider safe or liquid. |
| • | We may be unable to access financing in the credit and capital markets at reasonable rates in the event we find it desirable to do so. |
| • | The failure of financial institution counterparties to honor their obligations to us under credit and derivative instruments could jeopardize our ability to rely on and benefit from those instruments. Our ability to replace those instruments on the same or similar terms may be limited under poor market conditions. |
| • | We conduct transactions in various currencies, which increase our exposure to fluctuations in foreign currency exchange rates relative to the U.S. Dollar. Continued volatility in the markets and exchange rates for foreign currencies and contracts in foreign currencies could have a significant impact on our reported financial results and condition. |
| • | Continued volatility and availability in the markets and prices for commodities and raw materials we use in our products and in our supply chain (such as petroleum) could have a material adverse effect on our costs, gross margins, and profitability. |
| • | If retailers of our products experience declining revenues, or retailers experience difficulty obtaining financing in the capital and credit markets to purchase our products, this could result in reduced orders for our products, order cancellations, inability of retailers to timely meet their payment obligations to us, extended payment terms, higher accounts receivable, reduced cash flows, greater expense associated with collection efforts, and increased bad debt expense. |
| • | If retailers of our products experience severe financial difficulty, some may become insolvent and cease business operations, which could reduce the availability of our products to consumers. |
| • | If contract manufacturers of our products or other participants in our supply chain experience difficulty obtaining financing in the capital and credit markets to purchase raw materials or to finance general working capital needs, it may result in delays or non-delivery of shipments of our products. |
Our business is affected by seasonality, which could result in fluctuations in our operating results and stock price.
We experience moderate fluctuations in aggregate sales volume during the year. Historically, revenues in the first and fourth fiscal quarters have slightly exceeded those in the second and third fiscal quarters. However, the mix of product sales may vary considerably from time to time as a result of changes in seasonal and geographic demand for particular types of footwear, apparel and equipment. In addition, our customers may cancel orders, change delivery schedules or change the mix of products ordered with minimal notice. As a result, we may not be able to accurately predict our quarterly sales. Accordingly, our results of operations are likely to fluctuate significantly from period to period. This seasonality, along with other factors that are beyond our control, including general economic conditions, changes in consumer
| 8 |
preferences, weather conditions, availability of import quotas and currency exchange rate fluctuations, could adversely affect our business and cause our results of operations to fluctuate. Our operating margins are also sensitive to a number of factors that are beyond our control, including manufacturing and transportation costs, shifts in product sales mix, geographic sales trends, and currency exchange rate fluctuations, all of which we expect to continue. Results of operations in any period should not be considered indicative of the results to be expected for any future period.
"Futures" orders may not be an accurate indication of our future revenues.
We make substantial use of our "futures" ordering program, which allows retailers to order five to six months in advance of delivery with the commitment that their orders will be delivered within a set period of time at a fixed price. Our futures ordering program allows us to minimize the amount of products we hold in inventory, purchasing costs, the time necessary to fill customer orders, and the risk of non-delivery. We report changes in futures orders in our periodic financial reports. Although we believe futures orders are an important indicator of our future revenues, reported futures orders are not necessarily indicative of our expectation of changes in revenues for any future period. This is because the mix of orders can shift between futures and at-once orders. In addition, foreign currency exchange rate fluctuations, order cancellations, shipping timing, returns, and discounts can cause differences in the comparisons between futures orders and actual revenues. Moreover, a significant portion of our revenue is not derived from futures orders, including at-once and close-out sales of NIKE Brand footwear and apparel, sales of NIKE brand equipment, sales from our Direct to Consumer operations, and sales from our Other Businesses.
Our "futures" ordering program does not prevent excess inventories or inventory shortages, which could result in decreased operating margins and harm to our business.
We purchase products from manufacturers outside of our futures ordering program and in advance of customer orders, which we hold in inventory and resell to customers. There is a risk we may be unable to sell excess products ordered from manufacturers. Inventory levels in excess of customer demand may result in inventory write-downs, and the sale of excess inventory at discounted prices could significantly impair our brand image and have an adverse effect on our operating results and financial condition. Conversely, if we underestimate consumer demand for our products or if our manufacturers fail to supply products we require at the time we need them, we may experience inventory shortages. Inventory shortages might delay shipments to customers, negatively impact retailer and distributor relationships, and diminish brand loyalty.
The difficulty in forecasting demand also makes it difficult to estimate our future results of operations and financial condition from period to period. A failure to accurately predict the level of demand for our products could adversely affect our net revenues and net income, and we are unlikely to forecast such effects with any certainty in advance.
We may be adversely affected by the financial health of our retailers.
We extend credit to our customers based on an assessment of a customer's financial condition, generally without requiring collateral. To assist in the scheduling of production and the shipping of seasonal products, we offer customers the ability to place orders five to six months ahead of delivery under our "futures" ordering program. These advance orders may be cancelled, and the risk of cancellation may increase when dealing with financially ailing retailers or retailers struggling with economic uncertainty. In the past, some customers have experienced financial difficulties, which have had an adverse effect on our business. As a result, retailers may be more cautious than usual with orders as a result of weakness in the retail economy. A slowing economy in our key markets could have an adverse effect on the financial health of our customers, which in turn could have an adverse effect on our results of operations and financial condition. In addition, product sales are dependent in part on high quality merchandising and an appealing store environment to attract consumers, which requires continuing investments by retailers. Retailers who experience financial difficulties may fail to make such investments or delay them, resulting in lower sales and orders for our products.
Consolidation of retailers or concentration of retail market share among a few retailers may increase and concentrate our credit risk, and impair our ability to sell our products.
The athletic footwear, apparel, and equipment retail markets in some countries are dominated by a few large athletic footwear, apparel, and equipment retailers with many stores. These retailers have in the past increased their market share and may continue to do so in the future by expanding through acquisitions and construction of additional stores. These situations concentrate our credit risk with a relatively small number of retailers, and, if any of these retailers were to experience a shortage of liquidity, it would increase the risk that their outstanding payables to us may not be paid. In addition, increasing market share concentration among one or a few retailers in a particular country or region increases the risk that if any one of them substantially reduces their purchases of our products, we may be unable to find a sufficient number of other retail outlets for our products to sustain the same level of sales and revenues.
Failure to adequately protect our intellectual property rights could adversely affect our business.
We utilize trademarks on nearly all of our products and believe that having distinctive marks that are readily identifiable is an important factor in creating a market for our goods, in identifying us, and in distinguishing our goods from the goods of others. We consider our NIKE ® and Swoosh Design ® trademarks to be among our most valuable assets and we have registered these trademarks in almost 150 jurisdictions. In addition, we own many other trademarks that we utilize in marketing our products. We believe that our trademarks, patents, and other intellectual property rights are important to our brand, our success, and our competitive position. We periodically discover products that are counterfeit reproductions of our products or that otherwise infringe on our intellectual property rights. If we are unsuccessful in challenging a party's products on the basis of trademark or design or utility patent infringement, continued sales of these products could adversely affect our sales and our brand and result in the shift of consumer preference away from our products.
The actions we take to establish and protect trademarks, patents, and other intellectual property rights may not be adequate to prevent imitation of our products by others or to prevent others from seeking to block sales of our products as violations of proprietary rights. We may be subject to liability if third parties successfully claim that we infringe their trademarks, patents, or other intellectual property rights. Defending infringement claims could be expensive and time-consuming and might result in our entering into costly license agreements. We also may be subject to significant damages or injunctions against development and sale of certain products.
In addition, the laws of certain foreign countries may not protect intellectual property rights to the same extent as the laws of the United States. We may face significant expenses and liability in connection with the protection of our intellectual property rights outside the United States, and if we are unable to successfully protect our rights or resolve intellectual property conflicts with others, our business or financial condition may be adversely affected.
We are subject to periodic litigation and other regulatory proceedings, which could result in unexpected expense of time and resources.
From time to time we are called upon to defend ourselves against lawsuits and regulatory actions relating to our business. Due to the inherent uncertainties of litigation and regulatory proceedings, we cannot accurately
| 9 |
predict the ultimate outcome of any such proceedings. An unfavorable outcome could have an adverse impact on our business, financial condition and results of operations. In addition, any significant litigation in the future, regardless of its merits, could divert management's attention from our operations and result in substantial legal fees.
Our international operations involve inherent risks which could result in harm to our business.
Virtually all of our athletic footwear and apparel is manufactured outside of the United States, and the majority of our products are sold outside of the United States. Accordingly, we are subject to the risks generally associated with global trade and doing business abroad, which include foreign laws and regulations, varying consumer preferences across geographic regions, political unrest, disruptions or delays in cross-border shipments, and changes in economic conditions in countries in which we manufacture or sell products. In addition, disease outbreaks, terrorist acts and military conflict have increased the risks of doing business abroad. These factors, among others, could affect our ability to manufacture products or procure materials, our ability to import products, our ability to sell products in international markets, and our cost of doing business. If any of these or other factors make the conduct of business in a particular country undesirable or impractical, our business could be adversely affected. In addition, many of our imported products are subject to duties, tariffs, or quotas that affect the cost and quantity of various types of goods imported into the United States and other countries. Any country in which our products are produced or sold may eliminate, adjust or impose new quotas, duties, tariffs, safeguard measures, anti-dumping duties, cargo restrictions to prevent terrorism, restrictions on the transfer of currency, climate change legislation, product safety regulations or other charges or restrictions, any of which could have an adverse effect on our results of operations and financial condition.
Changes in tax laws and unanticipated tax liabilities could adversely affect our effective income tax rate and profitability.
We are subject to income taxes in the United States and numerous foreign jurisdictions. Our effective income tax rate in the future could be adversely affected by a number of factors, including: changes in the mix of earnings in countries with differing statutory tax rates, changes in the valuation of deferred tax assets and liabilities, changes in tax laws, the outcome of income tax audits in various jurisdictions around the world, and any repatriation of non-US earnings for which we have not previously provided for U.S. taxes. We regularly assess all of these matters to determine the adequacy of our tax provision, which is subject to significant discretion.
Currency exchange rate fluctuations could result in lower revenues, higher costs and decreased margins and earnings.
A majority of our products are sold outside of the United States. As a result, we conduct transactions in various currencies, which increase our exposure to fluctuations in foreign currency exchange rates relative to the U.S. Dollar. Our international revenues and expenses generally are derived from sales and operations in foreign currencies, and these revenues and expenses could be affected by currency fluctuations, including amounts recorded in foreign currencies and translated into U.S. Dollars for consolidated financial reporting. Currency exchange rate fluctuations could also disrupt the business of the independent manufacturers that produce our products by making their purchases of raw materials more expensive and more difficult to finance. Foreign currency fluctuations could have an adverse effect on our results of operations and financial condition.
Our hedging activities (see Note 16 - Risk Management and Derivatives in the accompanying Notes to the Consolidated Financial Statements ), which are designed to minimize and delay, but not to completely eliminate, the effects of foreign currency fluctuations may not sufficiently mitigate the impact of foreign currencies on our financial results. Factors that could affect the effectiveness of our hedging activities include accuracy of sales forecasts, volatility of currency markets, and the availability of hedging instruments. Since the hedging activities are designed to minimize volatility, they not only reduce the negative impact of a stronger U.S. Dollar, but they also reduce the positive impact of a weaker U.S. Dollar. Our future financial results could be significantly affected by the value of the U.S. Dollar in relation to the foreign currencies in which we conduct business. The degree to which our financial results are affected for any given time period will depend in part upon our hedging activities.
Our products are subject to risks associated with overseas sourcing, manufacturing, and financing.
The principal materials used in our apparel products - natural and synthetic fabrics and threads, plastic and metal hardware, and specialized performance fabrics designed to repel rain, retain heat, or efficiently transport body moisture - are available in countries where our manufacturing takes place. The principal materials used in our footwear products - natural and synthetic rubber, plastic compounds, foam cushioning materials, nylon, leather, canvas and polyurethane films - are also locally available to manufacturers. NIKE contractors and suppliers buy raw materials in bulk.
There could be a significant disruption in the supply of fabrics or raw materials from current sources or, in the event of a disruption, we might not be able to locate alternative suppliers of materials of comparable quality at an acceptable price, or at all. In addition, we cannot be certain that our unaffiliated manufacturers will be able to fill our orders in a timely manner. If we experience significant increases in demand, or reductions in the availability of materials, or need to replace an existing manufacturer, there can be no assurance that additional supplies of fabrics or raw materials or additional manufacturing capacity will be available when required on terms that are acceptable to us, or at all, or that any supplier or manufacturer would allocate sufficient capacity to us in order to meet our requirements. In addition, even if we are able to expand existing or find new manufacturing or sources of materials, we may encounter delays in production and added costs as a result of the time it takes to train suppliers and manufacturers in our methods, products, quality control standards, and labor, health and safety standards. Any delays, interruption or increased costs in the supply of materials or manufacture of our products could have an adverse effect on our ability to meet retail customer and consumer demand for our products and result in lower revenues and net income both in the short and long-term.
Because independent manufacturers manufacture a majority of our products outside of our principal sales markets, our products must be transported by third parties over large geographic distances. Delays in the shipment or delivery of our products due to the availability of transportation, work stoppages, port strikes, infrastructure congestion, or other factors, and costs and delays associated with consolidating or transitioning between manufacturers, could adversely impact our financial performance. In addition, manufacturing delays or unexpected demand for our products may require us to use faster, but more expensive, transportation methods such as aircraft, which could adversely affect our profit margins. The cost of fuel is a significant component in manufacturing and transportation costs, so increases in the price of petroleum products can adversely affect our profit margins.
In addition, Sojitz America performs significant import-export financing services for most of the NIKE Brand products sold outside of the United States, Europe, Middle East, Africa, and Japan, excluding products produced and sold in the same country. Any failure of Sojitz America to provide these services or any failure of Sojitz America's banks could disrupt our ability to acquire products from our suppliers and to deliver products to our customers outside of the United States, Europe, Middle East, Africa, and Japan. Such a disruption could result in cancelled orders that would adversely affect sales and profitability.
Natural disasters could negatively impact our operating results and financial condition.
Natural disasters such as earthquakes, hurricanes, tsunamis or other adverse weather and climate conditions, whether occurring in the U.S. or abroad, and the consequences and effects thereof, including energy shortages and public health issues, could disrupt our operations, or the operations of our vendors and other suppliers, or result in economic instability that may negatively impact our operating results and financial condition.
| 10 |
Our success depends on our global distribution facilities.
We distribute our products to customers directly from the factory and through distribution centers located throughout the world. Our ability to meet customer expectations, manage inventory, complete sales and achieve objectives for operating efficiencies depends on the proper operation of our distribution facilities, the development or expansion of additional distribution capabilities, and the timely performance of services by third parties (including those involved in shipping product to and from our distribution facilities). Our distribution facilities could be interrupted by information technology problems and disasters such as earthquakes or fires. Any significant failure in our distribution facilities could result in an adverse affect on our business. We maintain business interruption insurance, but it may not adequately protect us from adverse effects that could be caused by significant disruptions in our distribution facilities.
We rely significantly on information technology to operate our business, including our supply chain and retail operations, and any failure, inadequacy, breach, interruption or security failure of that technology or any misappropriation of any data could harm our reputation or our ability to effectively operate our business.
We are heavily dependent on information technology systems and networks, including the Internet and third-party hosted services ("information technology systems"), across our supply chain, including product design, production, forecasting, ordering, manufacturing, transportation, sales, and distribution, as well as for processing financial information for external and internal reporting purposes and other business activities. Our ability to effectively manage and maintain our inventory and to ship products to customers on a timely basis depends significantly on the reliability of these information technology systems. Over the last several years, as part of the ongoing initiative to upgrade our worldwide supply chain, we have implemented new information technology systems in all of the geographical regions in which we operate. Over the next few years, we will work to continue to enhance these systems and related processes in our global operations. The failure of these systems to operate effectively, problems with transitioning to upgraded or replacement systems, or a breach in security of these systems could cause delays in product fulfillment and reduced efficiency of our operations, could require significant capital investments to remediate the problem, and may have an adverse effect on our results of operations and financial condition.
We also use information technology systems to process financial information and results of operations for internal reporting purposes and to comply with regulatory financial reporting, legal and tax requirements. If our information technology systems suffer severe damage, disruption or shutdown and our business continuity plans do not effectively resolve the issues in a timely manner, we could experience delays in reporting our financial results, which could result in lost revenues and profits, as well as reputational damage.
In addition, hackers and data thieves are increasingly sophisticated and operate large scale and complex automated attacks. Any breach of our network may result in the loss of valuable business data, our customers' or employees' personal information or a disruption of our business, which could give rise to unwanted media attention, damage our customer relationships and reputation and result in lost sales, fines or lawsuits. In addition, we must comply with increasingly complex regulatory standards enacted to protect this business and personal data. An inability to maintain compliance with these regulatory standards could subject us to legal risks.
Furthermore, we depend on information technology systems for digital marketing campaigns and activities and electronic communications throughout the world between and among our employees as well as with other third parties, such as other customers, suppliers and consumers. Our information technology systems are critical to many of our operating activities and our business processes may be negatively impacted by any service interruption or shutdown. Misuse, leakage or falsification of information could result in a violation of data privacy laws and regulations and damage our reputation and credibility and have a negative impact on revenues and profits.
Our financial results may be adversely affected if substantial investments in businesses and operations fail to produce expected returns.
From time to time, we may invest in business infrastructure, acquisitions of new businesses, product offering and manufacturing innovation, and expansion of existing businesses, such as our retail operations, which require substantial cash investments and management attention. We believe cost effective investments are essential to business growth and profitability. However, significant investments are subject to typical risks and uncertainties inherent in acquiring or expanding a business. The failure of any significant investment to provide the returns or profitability we expect could have a material adverse effect on our financial results and divert management attention from more profitable business operations.
We depend on key personnel, the loss of whom would harm our business.
Our future success will depend in part on the continued service of key executive officers and personnel. The loss of the services of any key individual could harm us. Our future success also depends on our ability to identify, attract and retain additional qualified personnel. Competition for employees in our industry is intense and we may not be successful in attracting and retaining such personnel.
The sale of a large number of shares held by our Chairman could depress the market price of our common stock.
Philip H. Knight, Co-founder and Chairman of our Board of Directors, beneficially owns over 74.8% of our Class A Common Stock. If all of his Class A Common Stock were converted into Class B Common Stock, Mr. Knight would own over 15.5% of our Class B Common Stock. These shares are available for resale, subject to the requirements of the U.S. securities laws. The sale or prospect of the sale of a substantial number of these shares could have an adverse effect on the market price of our common stock.
Anti-takeover provisions may impair an acquisition of the Company or reduce the price of our common stock.
There are provisions of our articles of incorporation and Oregon law that are intended to protect shareholder interests by providing the Board of Directors a means to attempt to deny coercive takeover attempts or to negotiate with a potential acquirer in order to obtain more favorable terms. Such provisions include a control share acquisition statute, a freeze-out statute, two classes of stock that vote separately on certain issues, and the fact that holders of Class A Common Stock elect three-fourths of the Board of Directors rounded down to the next whole number. However, such provisions could discourage, delay or prevent an unsolicited merger, acquisition or other change in control of our company that some shareholders might believe to be in their best interests or in which shareholders might receive a premium for their common stock over the prevailing market price. These provisions could also discourage proxy contests for control of the Company.
We may fail to meet analyst expectations, which could cause the price of our stock to decline.
Our Class B Common Stock is traded publicly, and at any given time various securities analysts follow our financial results and issue reports on us. These reports include information about our historical financial results as well as the analysts' estimates of our future performance. The analysts' estimates are based upon their own opinions and are often different from our estimates or expectations. If our operating results are below the estimates or expectations of public market analysts and investors, our stock price could decline. In the past, securities class action litigation has been brought against NIKE and other companies following a decline in the market price of their securities. If our stock price is volatile, we may become involved in this type of litigation in the future. Any litigation could result in substantial costs and a diversion of management's attention and resources that are needed to successfully run our business.
| 11 |
| ITEM 1B. | Unresolved Staff Comments |
Not applicable.
| ITEM 2. | Properties |
The following is a summary of principal properties owned or leased by NIKE.
The NIKE World Campus, owned by NIKE and located in Beaverton, Oregon, USA, is a 213 acre facility of 22 buildings which functions as our world headquarters and is occupied by almost 7,000 employees engaged in management, research, design, development, marketing, finance, and other administrative functions from nearly all of our divisions. We also lease various office facilities in the surrounding metropolitan area. We lease a similar, but smaller, administrative facility in Hilversum, the Netherlands, which serves as the headquarters for the Western Europe and Central & Eastern Europe geographies. There are three significant distribution and customer service facilities for NIKE Brand products, including NIKE Golf, in the United States. All three of them are located in Memphis, Tennessee, two of which are owned and one of which is leased. NIKE also operates and leases one facility in Memphis, Tennessee for NIKE Brand product returns. NIKE Brand apparel and equipment are also shipped from our Foothill Ranch, California distribution center, which we lease. Cole Haan also operates a distribution facility in Greenland, New Hampshire, which we lease. Smaller leased distribution facilities for other brands and non-NIKE Brand businesses are located in various parts of the United States. We also own or lease distribution and customer service facilities in many parts of the world, the most significant of which are the distribution facilities located in Tomisato, Japan, Laakdal, Belgium, and Taicang, China, all of which we own.
We manufacture Air-Sole cushioning materials and components at NIKE IHM, Inc. manufacturing facilities located in Beaverton, Oregon and St. Charles, Missouri, which we own. We also manufacture and sell small amounts of various plastic products to other manufacturers through NIKE IHM, Inc.
Aside from the principal properties described above, we lease three production offices outside the United States, over 120 sales offices and showrooms worldwide, and approximately 85 administrative offices worldwide. We lease more than 800 retail stores worldwide, which consist primarily of factory outlet stores. See "United States Market" and "International Markets" starting on page 2 of this Report, respectively. Our leases expire at various dates through the year 2035.
| ITEM 3. | Legal Proceedings |
There are no material pending legal proceedings, other than ordinary routine litigation incidental to our business, to which we are a party or of which any of our property is the subject.
| ITEM 4. | Mine Safety Disclosures |
Not applicable.
| 12 |
PART II
| ITEM 5. | Market for Registrant's Common Equity, Related Stockholder Matters and Issuer Purchases of Equity Securities |
NIKE's Class B Common Stock is listed on the New York Stock Exchange and trades under the symbol NKE. At July 19, 2012, there were 19,740 holders of record of our Class B Common Stock and 18 holders of record of our Class A Common Stock. These figures do not include beneficial owners who hold shares in nominee name. The Class A Common Stock is not publicly traded but each share is convertible upon request of the holder into one share of Class B Common Stock. The following tables set forth, for each of the quarterly periods indicated, the high and low sales prices for the Class B Common Stock as reported on the New York Stock Exchange Composite Tape and dividends declared on the Class A and Class B Common Stock.
| Fiscal 2012 (June 1, 2011 - May 31, 2012) | High | Low | Dividends Declared | |||||||||
First Quarter | $ | 93.66 | $ | 78.58 | $ | 0.31 | ||||||
Second Quarter | 96.75 | 82.50 | 0.36 | |||||||||
Third Quarter | 107.92 | 93.38 | 0.36 | |||||||||
Fourth Quarter | 114.40 | 104.34 | 0.36 | |||||||||
| Fiscal 2011 (June 1, 2010 - May 31, 2011) | High | Low | Dividends Declared | |||||||||
First Quarter | $ | 74.94 | $ | 67.21 | $ | 0.27 | ||||||
Second Quarter | 86.53 | 72.13 | 0.31 | |||||||||
Third Quarter | 92.30 | 81.46 | 0.31 | |||||||||
Fourth Quarter | 89.88 | 75.45 | 0.31 | |||||||||
The following table presents a summary of share repurchases made by NIKE during the quarter ended May 31, 2012 under the four-year, $5 billion share repurchase program approved by our Board of Directors in September 2008.
| Period | Total Number of Shares Purchased | Average Price Paid per Share | Total Number of Shares Purchased as Part of Publicly Announced Plans or Programs | Maximum Dollar Value of Shares (In millions) | ||||||||||||
March 1 - March 31, 2012 | 100,000 | $ | 107.87 | 100,000 | $ | 1,104 | ||||||||||
April 1 - April 30, 2012 | 930,000 | $ | 109.36 | 930,000 | $ | 1,002 | ||||||||||
May 1 - May 31, 2012 | 1,221,100 | $ | 108.52 | 1,221,100 | $ | 870 | ||||||||||
| 2,251,100 | $ | 108.84 | 2,251,100 | |||||||||||||
| 13 |
Performance Graph
The following graph demonstrates a five-year comparison of cumulative total returns for NIKE's Class B Common Stock, the Standard & Poor's 500 Stock Index, the Standard & Poor's Apparel, Accessories & Luxury Goods Index, and the Dow Jones U.S. Footwear Index. The graph assumes an investment of $100 on May 31, 2007 in each of our Class B Common Stock, and the stocks comprising the Standard & Poor's 500 Stock Index, the Standard & Poor's Apparel, Accessories & Luxury Goods Index, and the Dow Jones U.S. Footwear Index. Each of the indices assumes that all dividends were reinvested.
COMPARISON OF 5-YEAR CUMULATIVE TOTAL RETURN AMONG NIKE, INC.; S&P 500 INDEX; S&P APPAREL, ACCESSORIES & LUXURY GOODS INDEX; AND THE DOW JONES U.S. FOOTWEAR INDEX
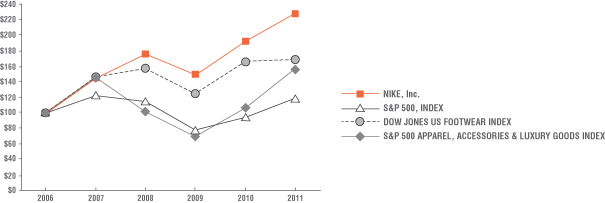
The Dow Jones U.S. Footwear Index consists of NIKE, Deckers Outdoor Corp., Wolverine World Wide, Inc., Iconix Brand Group Inc., Crocs, Inc., and Steven Madden, Ltd. Because NIKE is part of the Dow Jones U.S. Footwear Index, the price and returns of NIKE stock have a substantial effect on this index. The Standard & Poor's Apparel, Accessories & Luxury Goods Index consists of VF Corp., Coach, Inc., Polo Ralph Lauren Corporation, and Fossil, Inc. The Dow Jones U.S. Footwear Index and the Standard & Poor's Apparel, Accessories, and Luxury Goods Index include companies in two major lines of business in which the Company competes. The indices do not encompass all of the Company's competitors, nor all product categories and lines of business in which the Company is engaged.
The stock performance shown on the performance graph above is not necessarily indicative of future performance. The Company will not make nor endorse any predictions as to future stock performance.
The performance graph above is being furnished solely to accompany this Report pursuant to Item 201(e) of Regulation S-K, and is not being filed for purposes of Section 18 of the Securities Exchange Act of 1934, as amended, and is not to be incorporated by reference into any filing of the Company, whether made before or after the date hereof, regardless of any general incorporation language in such filing.
| 14 |
| ITEM 6. | Selected Financial Data |
(Dollars in millions, except per share data and financial ratios) | Financial History | |||||||||||||||||||
| 2012 | 2011 | 2010 | 2009 | 2008 | ||||||||||||||||
| Year Ended May 31, | ||||||||||||||||||||
| Revenues | $ | 24,128 | $ | 20,862 | $ | 19,014 | $ | 19,176 | $ | 18,627 | ||||||||||
| Gross profit | 10,471 | 9,508 | 8,800 | 8,604 | 8,387 | |||||||||||||||
| Gross margin % | 43.4 | % | 45.6 | % | 46.3 | % | 44.9 | % | 45.0 | % | ||||||||||
| Restructuring charges | - | - | - | 195 | - | |||||||||||||||
| Goodwill impairment | - | - | - | 199 | - | |||||||||||||||
| Intangible and other asset impairment | - | - | - | 202 | - | |||||||||||||||
| Net income | 2,223 | 2,133 | 1,907 | 1,487 | 1,883 | |||||||||||||||
| Basic earnings per common share | 4.83 | 4.48 | 3.93 | 3.07 | 3.80 | |||||||||||||||
| Diluted earnings per common share | 4.73 | 4.39 | 3.86 | 3.03 | 3.74 | |||||||||||||||
| Weighted average common shares outstanding | 460.0 | 475.5 | 485.5 | 484.9 | 495.6 | |||||||||||||||
| Diluted weighted average common shares outstanding | 469.8 | 485.7 | 493.9 | 490.7 | 504.1 | |||||||||||||||
| Cash dividends declared per common share | 1.39 | 1.20 | 1.06 | 0.98 | 0.875 | |||||||||||||||
| Cash flow from operations | 1,899 | 1,812 | 3,164 | 1,736 | 1,936 | |||||||||||||||
| Price range of common stock | ||||||||||||||||||||
| High | 114.40 | 92.30 | 78.55 | 70.28 | 70.60 | |||||||||||||||
| Low | 78.58 | 67.21 | 50.16 | 38.24 | 51.50 | |||||||||||||||
| At May 31, | ||||||||||||||||||||
| Cash and equivalents | $ | 2,317 | $ | 1,955 | $ | 3,079 | $ | 2,291 | $ | 2,134 | ||||||||||
| Short-term investments | 1,440 | 2,583 | 2,067 | 1,164 | 642 | |||||||||||||||
| Inventories | 3,350 | 2,715 | 2,041 | 2,357 | 2,438 | |||||||||||||||
| Working capital | 7,666 | 7,339 | 7,595 | 6,457 | 5,518 | |||||||||||||||
| Total assets | 15,465 | 14,998 | 14,419 | 13,250 | 12,443 | |||||||||||||||
| Long-term debt | 228 | 276 | 446 | 437 | 441 | |||||||||||||||
| Redeemable Preferred Stock | 0.3 | 0.3 | 0.3 | 0.3 | 0.3 | |||||||||||||||
| Shareholders' equity | 10,381 | 9,843 | 9,754 | 8,693 | 7,825 | |||||||||||||||
| Year-end stock price | 108.18 | 84.45 | 72.38 | 57.05 | 68.37 | |||||||||||||||
| Market capitalization | 49,546 | 39,523 | 35,032 | 27,698 | 33,577 | |||||||||||||||
| Financial Ratios: | ||||||||||||||||||||
| Return on equity | 22.0 | % | 21.8 | % | 20.7 | % | 18.0 | % | 25.4 | % | ||||||||||
| Return on assets | 14.6 | % | 14.5 | % | 13.8 | % | 11.6 | % | 16.3 | % | ||||||||||
| Inventory turns | 4.5 | 4.8 | 4.6 | 4.4 | 4.5 | |||||||||||||||
| Current ratio at May 31 | 3.0 | 2.9 | 3.3 | 3.0 | 2.7 | |||||||||||||||
| Price/Earnings ratio at May 31 | 22.9 | 19.2 | 18.8 | 18.8 | 18.3 | |||||||||||||||
Selected Quarterly Financial Data
(Unaudited) (Dollars in millions, except per share data) | 1st Quarter | 2nd Quarter | 3rd Quarter | 4th Quarter | ||||||||||||||||||||||||||||
| 2012 | 2011 | 2012 | 2011 | 2012 | 2011 | 2012 | 2011 | |||||||||||||||||||||||||
| Revenues | $ | 6,081 | $ | 5,175 | $ | 5,731 | $ | 4,842 | $ | 5,846 | $ | 5,079 | $ | 6,470 | $ | 5,766 | ||||||||||||||||
| Gross profit | 2,693 | 2,434 | 2,450 | 2,193 | 2,561 | 2,327 | 2,767 | 2,554 | ||||||||||||||||||||||||
| Gross margin % | 44.3 | % | 47.0 | % | 42.7 | % | 45.3 | % | 43.8 | % | 45.8 | % | 42.8 | % | 44.3 | % | ||||||||||||||||
| Net income | 645 | 559 | 469 | 457 | 560 | 523 | 549 | 594 | ||||||||||||||||||||||||
| Basic earnings per common share | 1.39 | 1.17 | 1.02 | 0.96 | 1.22 | 1.10 | 1.20 | 1.27 | ||||||||||||||||||||||||
| Diluted earnings per common share | 1.36 | 1.14 | 1.00 | 0.94 | 1.20 | 1.08 | 1.17 | 1.24 | ||||||||||||||||||||||||
| Weighted average common shares outstanding | 465.0 | 479.6 | 459.2 | 477.9 | 457.5 | 475.3 | 458.1 | 469.3 | ||||||||||||||||||||||||
| Diluted weighted average common shares outstanding | 474.3 | 488.6 | 468.5 | 487.6 | 467.3 | 485.5 | 468.1 | 478.7 | ||||||||||||||||||||||||
| Cash dividends declared per common share | 0.31 | 0.27 | 0.36 | 0.31 | 0.36 | 0.31 | 0.36 | 0.31 | ||||||||||||||||||||||||
| Price range of common stock | ||||||||||||||||||||||||||||||||
High | 93.66 | 74.94 | 96.75 | 86.53 | 107.92 | 92.30 | 114.40 | 89.88 | ||||||||||||||||||||||||
Low | 78.58 | 67.21 | 82.50 | 72.13 | 93.38 | 81.46 | 104.34 | 75.45 | ||||||||||||||||||||||||
| 15 |
| ITEM 7. | Management's Discussion and Analysis of Financial Condition and Results of Operations |
NIKE designs, develops, markets and sells high quality footwear, apparel, equipment, accessories and services worldwide. We are the largest seller of athletic footwear and apparel in the world. We sell our products to retail accounts, through NIKE-owned retail stores and internet sales, which we refer to as our "Direct to Consumer" operations, and through a mix of independent distributors, licensees and sales representatives, worldwide. Our goal is to deliver value to our shareholders by building a profitable global portfolio of branded footwear, apparel, equipment, accessories and service businesses. Our strategy is to achieve long-term revenue growth by creating innovative, "must have" products, building deep personal consumer connections with our brands, and delivering compelling consumer experiences at retail and online.
In addition to achieving long-term revenue growth, we continue to strive to deliver shareholder value by driving operational excellence in several key areas:
| • | Expanding gross margin by: |
| – | Making our supply chain a competitive advantage, |
| – | Reducing product costs through a continued focus on manufacturing efficiency, product design and innovation, |
| – | Utilizing price increases to effectively manage the price-to-value equation for our customers. |
| • | Improving selling and administrative expense productivity by focusing on investments that drive economic returns in the form of incremental revenue and gross profit, and leveraging existing infrastructure across our portfolio of businesses to eliminate duplicative costs, |
| • | Improving working capital efficiency, and |
| • | Deploying capital effectively. |
Through execution of this strategy, our long-term financial goals continue to be:
| • | High-single-digit revenue growth, |
| • | Mid-teens earnings per share growth, |
| • | Increased return on invested capital and accelerated cash flows, and |
| • | Consistent results through effective management of our diversified portfolio of businesses. |
Over the past ten years, we have achieved or exceeded all of these financial goals. During this time, NIKE, Inc.'s revenues and earnings per share have grown 9% and 15%, respectively, on an annual compounded basis. Our return on invested capital has increased from 15% to 22% and we expanded gross margins by 4 percentage points.
Our fiscal 2012 results demonstrated our continued focus toward delivering appropriate returns to our shareholders, while positioning ourselves for sustainable, profitable long-term growth. Despite the ongoing challenges in the global economy, we delivered record revenues and earnings per share in fiscal 2012. Our revenues grew 16% to $24.1 billion, net income increased 4% to $2.2 billion, and we delivered diluted earnings per share of $4.73, an 8% increase from fiscal 2011.
Income before income taxes increased 5% for fiscal 2012, driven by revenue growth and improved leverage on selling and administrative expense, which more than offset a decrease in gross margin and an increase in other expense. The increase in revenues was driven by growth across all NIKE Brand geographies, key categories and product types. Brand strength, innovative products and strong category retail presentation continues to fuel the demand for our NIKE Brand products. During fiscal 2012, we introduced a number of innovations, including the NIKE Fuelband and the Flyknit technology. The NIKE Fuelband is a digital device that tracks one's daily activities through a sport-tested accelerometer, while Flyknit is a new footwear technology that uses advanced materials and proprietary manufacturing technology to produce a form-fitting, lightweight and seamless upper. During this time, we also expanded our NIKE + platform into our Basketball and Training categories, and launched new high performance uniforms for all 32 NFL teams. Revenue for our Other Businesses also grew, reflective of growth across most businesses, led by Converse. Our gross margin continued to be impacted by higher product input costs, including materials and labor, which more than offset the positive impacts of higher product selling prices, the growth of our Direct to Consumer business and benefits from ongoing product cost reduction initiatives.
For fiscal 2012, the growth of our net income was negatively affected by a year-over-year increase in our effective tax rate. However, diluted earnings per share grew at a higher rate than net income due to a 3% decrease in the weighted average number of diluted common shares outstanding, driven by share repurchases during fiscal 2012 and 2011.
As part of our long-term growth strategy, we continually evaluate our existing portfolio of businesses to ensure the Company is investing in those businesses that are accretive to the NIKE Brand, and with the largest growth potential and highest returns. On May 31, 2012, we announced our intention to divest of the Cole Haan and Umbro businesses, which will allow us to focus our resources on driving growth in the NIKE, Jordan, Converse and Hurley brands. For additional details, refer to our "Other Businesses" section below.
While we will continue to face headwinds from higher input costs and foreign exchange volatility in fiscal 2013, we continue to see opportunities to drive future growth and remain committed to effectively managing our business to achieve our financial goals over the long-term, by executing against the operational strategies outlined above.
Results of Operations
| (Dollars in millions, except per share data) | Fiscal 2012 | Fiscal 2011 | FY12 vs. FY11 % Change | Fiscal 2010 | FY11 vs. FY10 % Change | |||||||||||||||
| Revenues | $ | 24,128 | $ | 20,862 | 16 | % | $ | 19,014 | 10 | % | ||||||||||
| Cost of sales | 13,657 | 11,354 | 20 | % | 10,214 | 11 | % | |||||||||||||
Gross profit | 10,471 | 9,508 | 10 | % | 8,800 | 8 | % | |||||||||||||
Gross margin % | 43.4 | % | 45.6 | % | 46.3 | % | ||||||||||||||
| Demand creation expense | 2,711 | 2,448 | 11 | % | 2,356 | 4 | % | |||||||||||||
| Operating overhead expense | 4,720 | 4,245 | 11 | % | 3,970 | 7 | % | |||||||||||||
Total selling and administrative expense | 7,431 | 6,693 | 11 | % | 6,326 | 6 | % | |||||||||||||
% of Revenues | 30.8 | % | 32.1 | % | 33.3 | % | ||||||||||||||
| Income before income taxes | 2,983 | 2,844 | 5 | % | 2,517 | 13 | % | |||||||||||||
| Net income | 2,223 | 2,133 | 4 | % | 1,907 | 12 | % | |||||||||||||
| Diluted earnings per share | 4.73 | 4.39 | 8 | % | 3.86 | 14 | % | |||||||||||||
| 16 |
Consolidated Operating Results
Revenues
| (Dollar in millions) | Fiscal 2012 | Fiscal 2011 | FY12 vs. FY11 % Change | FY12 vs. FY11 Excluding Changes (1) | Fiscal 2010 | FY11 vs. FY10 % Change | FY11 vs. FY10 Excluding | |||||||||||||||||||||
| NIKE, Inc. Revenues: | ||||||||||||||||||||||||||||
| NIKE Brand Revenues by: | ||||||||||||||||||||||||||||
Footwear | $ | 13,426 | $ | 11,518 | 17% | 15% | $ | 10,301 | 12% | 12% | ||||||||||||||||||
Apparel | 6,333 | 5,513 | 15% | 13% | 5,026 | 10% | 10% | |||||||||||||||||||||
Equipment | 1,202 | 1,018 | 18% | 16% | 1,030 | -1% | -2% | |||||||||||||||||||||
Global Brand Divisions | 111 | 96 | 16% | 13% | 86 | 12% | 16% | |||||||||||||||||||||
| Total NIKE Brand | 21,072 | 18,145 | 16% | 15% | 16,443 | 10% | 10% | |||||||||||||||||||||
| Other Businesses | 3,095 | 2,786 | 11% | 11% | 2,564 | 9% | 8% | |||||||||||||||||||||
| Corporate (2) | (39 | ) | (69 | ) | - | - | 7 | - | - | |||||||||||||||||||
| TOTAL NIKE, INC. REVENUES | $ | 24,128 | $ | 20,862 | 16% | 14% | $ | 19,014 | 10% | 10% | ||||||||||||||||||
| Supplemental NIKE Brand Revenues Details: | ||||||||||||||||||||||||||||
| NIKE Brand Revenues by: | ||||||||||||||||||||||||||||
| Sales to Wholesale Customers | $ | 17,431 | $ | 15,173 | 15% | 14% | 13,876 | 9% | 9% | |||||||||||||||||||
| Sales Direct to Consumer | 3,530 | 2,876 | 23% | 21% | 2,481 | 16% | 16% | |||||||||||||||||||||
| Global Brand Divisions | 111 | 96 | 16% | 13% | 86 | 12% | 15% | |||||||||||||||||||||
| TOTAL NIKE BRAND REVENUES | $ | 21,072 | $ | 18,145 | 16% | 15% | $ | 16,443 | 10% | 10% | ||||||||||||||||||
| NIKE Brand Revenues on a Wholesale Equivalent Basis: (3) | ||||||||||||||||||||||||||||
| Sales to Wholesale Customers | $ | 17,431 | $ | 15,173 | 15% | 14% | $ | 13,876 | 9% | 9% | ||||||||||||||||||
| Sales from our Wholesale Operations to Direct to Consumer Operations | 1,978 | 1,598 | 24% | 22% | 1,347 | 19% | 18% | |||||||||||||||||||||
| NIKE BRAND WHOLESALE EQUIVALENT REVENUES | $ | 19,409 | $ | 16,771 | 16% | 14% | $ | 15,223 | 10% | 10% | ||||||||||||||||||
| NIKE Brand Wholesale Equivalent Revenues by Category: (3) | ||||||||||||||||||||||||||||
| Running | $ | 3,702 | $ | 2,795 | 32% | 31% | $ | 2,134 | 31% | 30% | ||||||||||||||||||
| Basketball | 2,230 | 1,908 | 17% | 16% | 1,711 | 12% | 11% | |||||||||||||||||||||
| Football (Soccer) | 2,006 | 1,765 | 14% | 12% | 1,650 | 7% | 8% | |||||||||||||||||||||
| Men's Training | 2,007 | 1,698 | 18% | 17% | 1,459 | 16% | 15% | |||||||||||||||||||||
| Women's Training | 1,015 | 842 | 21% | 19% | 739 | 14% | 13% | |||||||||||||||||||||
| Action Sports | 499 | 470 | 6% | 5% | 403 | 17% | 17% | |||||||||||||||||||||
| Sportswear | 5,560 | 5,150 | 8% | 6% | 5,018 | 3% | 3% | |||||||||||||||||||||
| Others (4) | 2,390 | 2,143 | 12% | 10% | 2,109 | 2% | 2% | |||||||||||||||||||||
| TOTAL NIKE BRAND WHOLESALE EQUIVALENT REVENUES | $ | 19,409 | $ | 16,771 | 16% | 14% | $ | 15,223 | 10% | 10% | ||||||||||||||||||
| (1) | Results have been restated using actual exchange rates in use during the comparative period to enhance the visibility of the underlying business trends by excluding the impact of translation arising from foreign currency exchange rate fluctuations. |
| (2) | Corporate revenues primarily consist of intercompany revenue eliminations and foreign currency revenue-related hedge gains and losses generated by entities within the NIKE Brand geographic operating segments and certain Other Businesses through our centrally managed foreign exchange risk management program. |
| (3) | References to NIKE Brand wholesale equivalent revenues are intended to provide context as to the overall current NIKE Brand market footprint on a wholesale revenue basis. NIKE Brand wholesale equivalent revenues consist of 1) sales to external wholesale customers and 2) internal sales from our wholesale operations to our Direct to Consumer operations at prices that are comparable to prices charged to external wholesale customers. NIKE Brand wholesale equivalent revenues do not include the estimation of sales made by NIKE Brand licensees as the amounts are not material. |
| (4) | Others include all other categories and certain adjustments that are not allocated at the category level. |
| 17 |
Fiscal 2012 Compared to Fiscal 2011
On a currency neutral basis, revenues for NIKE, Inc. grew 14% for fiscal 2012, driven by increases in revenues for both the NIKE Brand and our Other Businesses. Excluding the effects of changes in currency exchange rates, revenues for the NIKE Brand increased 15%, as every NIKE Brand geography delivered higher revenues for fiscal 2012. North America contributed approximately 7 percentage points to the NIKE Brand revenue increase, while the Emerging Markets and Greater China geographies contributed approximately 4 and 2 percentage points to the NIKE Brand revenue growth, respectively. Revenues for our Other Businesses grew 11% during fiscal 2012, contributing 1 percentage point of our consolidated revenue growth.
Excluding the effects of changes in currency exchange rates, NIKE Brand footwear and apparel revenue increased 15% and 13%, respectively, while NIKE Brand equipment revenues increased 16% during fiscal 2012. Continuing to fuel the growth of our NIKE Brand footwear business was the increased demand for performance products, including the NIKE Lunar and FREE technologies. The increase in NIKE Brand footwear revenue for fiscal 2012 was attributable to double-digit percentage growth in unit sales along with a low-single-digit percentage increase in average selling price per pair, primarily reflecting the favorable impact from product price increases, partially offset by higher discounts on close-out sales. The overall increase in footwear sales was driven by growth across all key categories, notably Running, Sportswear and Basketball. For NIKE Brand apparel, the increase in revenue for fiscal 2012 was driven by mid-single-digit percentage increases in both unit sales and average selling prices. The increase in average selling prices was primarily driven by product price increases, partially offset by a higher mix of close-out sales. The overall increase in apparel sales was reflective of increased demand across most key categories.
While wholesale revenues remain the largest component of overall NIKE Brand revenues, we continue to see growth in revenue through our Direct to Consumer channels. Our NIKE Brand Direct to Consumer operations include NIKE owned in-line and factory stores, as well as online sales through NIKE owned websites. For fiscal 2012, Direct to Consumer channels represented approximately 17% of our total NIKE Brand revenues compared to 16% in fiscal 2011. On a currency neutral basis, Direct to Consumer revenues grew 21% for fiscal 2012, as comparable store sales grew 13% and we continue to expand our store network and e-commerce business. Comparable store sales include revenues from NIKE owned in-line and factory stores for which all three of the following requirements have been met: the store has been open at least one year, square footage has not changed by more than 15% within the past year, and the store has not been permanently repositioned within the past year.
Revenues for our Other Businesses consist of results from our affiliate brands; Cole Haan, Converse, Hurley and Umbro; and NIKE Golf. Excluding the impact of currency changes, revenues for these businesses increased by 11% in fiscal 2012, reflecting growth across all businesses except Hurley, which was slightly down for the fiscal year.
Fiscal 2011 Compared to Fiscal 2010
On both a reported and currency neutral basis, revenues for NIKE, Inc. grew 10% for fiscal 2011, driven by increases in revenues for both the NIKE Brand and our Other Businesses. On a currency neutral basis, revenues for the NIKE Brand increased 10% for fiscal 2011, while revenues for our Other Businesses increased 8%. Excluding the effects of changes in currency exchange rates, every NIKE Brand geography except Japan delivered higher revenues for fiscal 2011, led by North America, which contributed approximately 5 percentage points to the NIKE Brand revenue increase. The Emerging Markets and Greater China contributed approximately 3 and 2 percentage points to the NIKE Brand revenue growth, respectively.
By product group, NIKE Brand footwear and apparel revenue increased 12% and 10%, respectively, while NIKE Brand equipment revenues declined 2% during fiscal 2011. Fueling the growth of our NIKE Brand footwear business was the increased demand in our performance products, including the NIKE Lunar and Free technologies. The increase in NIKE Brand footwear revenue for fiscal 2011 was attributable to a high-single-digit percentage increase in unit sales along with a low single-digit percentage increase in the average selling price per pair. The increase in unit sales was primarily driven by double-digit percentage growth in Running, Men's Training, Action Sports and Women's Training products, while the increase in average selling price per pair was primarily driven by price increases on selected products and fewer close-outs as a percentage of total sales. For NIKE Brand apparel, the increase in revenue for fiscal 2011 was primarily driven by a low-double-digit percentage increase in unit sales attributable to strong category presentations and improved product lines, while the average selling price per unit was relatively flat. The increase in unit sales was driven by increased demand in all key categories.
For fiscal 2011, Direct to Consumer channels represented approximately 16% of our total NIKE Brand revenues compared to 15% in fiscal 2010. On a currency neutral basis, Direct to Consumer revenues grew 16% for fiscal 2011 as we continue to expand our store network, increase comparable store sales and build our e-commerce business. Comparable store sales grew 11% for fiscal 2011.
Excluding the impact of currency changes, revenues for Other Businesses increased by 8% in fiscal 2011, reflecting double-digit percentage revenue growth at Converse, Cole Haan and Hurley, and a low-single-digit growth at Umbro, which more than offset a mid-single-digit revenue decline at NIKE Golf.
Futures Orders
Futures orders for NIKE Brand footwear and apparel scheduled for delivery from June through November 2012 were 7% higher than the orders reported for the comparable prior year period. The U.S. Dollar futures order amount is calculated based upon our internal forecast of the currency exchange rates under which our revenues will be translated during this period. Excluding the impact of currency changes, futures orders increased 12%, as unit orders and average selling price per unit each contributed approximately 6 percentage points of growth.
By geography, futures orders growth was as follows:
| Reported Futures Orders Growth | Futures Orders Excluding Currency Changes (1) | |||||||
| North America | 15 | % | 15 | % | ||||
| Western Europe | -2 | % | 8 | % | ||||
| Central & Eastern Europe | 5 | % | 11 | % | ||||
| Greater China | 5 | % | 2 | % | ||||
| Japan | -6 | % | 1 | % | ||||
| Emerging Markets | 10 | % | 20 | % | ||||
| Total NIKE Brand Futures Orders | 7 | % | 12 | % | ||||
| (1) | Growth rates have been restated using constant exchange rates for the comparative period to enhance the visibility of the underlying business trends excluding the impact of foreign currency exchange rate fluctuations. |
| 18 |
The reported futures orders growth is not necessarily indicative of our expectation of revenue growth during this period. This is due to year-over-year changes in shipment timing and because the mix of orders can shift between futures and at-once orders, and the fulfillment of certain orders may fall outside of the schedule noted above. In addition, exchange rate fluctuations as well as differing levels of order cancellations and discounts can cause differences in the comparisons between futures orders and actual revenues. Moreover, a significant portion of our revenue is not derived from futures orders, including at-once and close-out sales of NIKE Brand footwear and apparel, sales of NIKE Brand equipment, sales from our Direct to Consumer operations, and sales from our Other Businesses.
Gross Margin
| (Dollars in millions) | Fiscal 2012 | Fiscal 2011 | FY12 vs. FY11 % Change | Fiscal 2010 | FY11 vs. FY10 % Change | |||||||||||||||
Gross Profit | $ | 10,471 | $ | 9,508 | 10 | % | $ | 8,800 | 8 | % | ||||||||||
Gross Margin % | 43.4 | % | 45.6 | % | (220 | ) bps | 46.3 | % | (70 | ) bps | ||||||||||
Fiscal 2012 Compared to Fiscal 2011
For fiscal 2012, our consolidated gross margin was 220 basis points lower than the prior year period, primarily driven by higher product input costs, including materials and labor, across most businesses. Also contributing to the decrease in gross margin were higher customs duty charges, discounts on close-out sales and an increase in investments in our digital business and infrastructure. Together, these factors decreased consolidated gross margin by approximately 390 basis points. Partially offsetting this decrease were positive impacts from product price increases, lower air freight costs, the growth of our NIKE Brand Direct to Consumer business, and benefits from our ongoing product cost reduction initiatives.
Fiscal 2011 Compared to Fiscal 2010
For fiscal 2011, our consolidated gross margin percentage was 70 basis points lower than the prior year, primarily driven by higher input costs, transportation costs, including additional air freight incurred to meet strong demand for NIKE Brand products across most businesses, and a lower mix of licensee revenue as distribution for certain markets within our Other Businesses transitioned from licensees to operating units of NIKE, Inc. Together, these factors decreased consolidated gross margins by approximately 130 basis points for fiscal 2011, with the most significant erosion in the second half of the fiscal year. These decreases were partially offset by the positive impact from the growth and expanding profitability of our NIKE Brand Direct to Consumer business, a higher mix of full-price sales and favorable impacts from our ongoing product cost efficiency initiatives.
Selling and Administrative Expense
| (Dollars in millions) | Fiscal 2012 | Fiscal 2011 | FY12 vs. FY11 % Change | Fiscal 2010 | FY11 vs. FY10 % Change | |||||||||||||||
Demand creation expense (1) | $ | 2,711 | $ | 2,448 | 11 | % | $ | 2,356 | 4 | % | ||||||||||
Operating overhead expense | 4,720 | 4,245 | 11 | % | 3,970 | 7 | % | |||||||||||||
Selling and administrative expense | $ | 7,431 | $ | 6,693 | 11 | % | $ | 6,326 | 6 | % | ||||||||||
% of Revenues | 30.8 | % | 32.1 | % | (130 | ) bps | 33.3 | % | (120 | ) bps | ||||||||||
| (1) | Demand creation consists of advertising and promotion expenses, including costs of endorsement contracts. |
Fiscal 2012 Compared to Fiscal 2011
Overall, selling and administrative expense grew at a slower rate than revenues for fiscal 2012.
Demand creation expense increased 11% compared to the prior year, mainly driven by an increase in sports marketing expense, marketing support for key product initiatives, including the NIKE Fuelband and NFL uniforms, as well as an increased level of brand event spending around the European Football Championships and London Summer Olympics. For fiscal 2012, changes in currency exchange rates increased the growth of demand creation expense by 1 percentage point.
Compared to the prior year, operating overhead expense increased 11%, primarily attributable to increased investments in our Direct to Consumer operations, higher personnel costs as well as travel expenses to support the growth of our overall business. For fiscal 2012, changes in currency exchange rates increased the growth of operating overhead expense by 1 percentage point.
Fiscal 2011 Compared to Fiscal 2010
In fiscal 2011, the effect of changes in foreign currency exchange rates did not have a significant impact on selling and administrative expense.
Demand creation expense increased 4% compared to the prior year, primarily driven by a higher level of brand event spending around the World Cup and World Basketball Festival in the first half of fiscal 2011, as well as increased spending around key product initiatives and investments in retail product presentation with wholesale customers.
Operating overhead expense increased 7% compared to the prior year. This increase was primarily attributable to increased investments in our Direct to Consumer operations as well as growth in our wholesale operations, where we incurred higher personnel costs and travel expenses as compared to the prior year.
Other Expense (Income), net
| (In millions) | Fiscal 2012 | Fiscal 2011 | Fiscal 2010 | |||||||||
| Other expense (income), net | $ | 54 | $ | (33 | ) | $ | (49 | ) | ||||
| 19 |
Other expense (income), net is comprised of foreign currency conversion gains and losses from the re-measurement of monetary assets and liabilities denominated in non-functional currencies, the impact of certain foreign currency derivative instruments, as well as unusual or non-operating transactions that are outside the normal course of business.
Fiscal 2012 Compared to Fiscal 2011
For fiscal 2012, other expense, net increased $87 million compared to the prior year. This change was primarily driven by a $76 million change in foreign currency net gains in the prior year to net losses in the current year. These impacts, together with a $24 million charge recognized during the fourth quarter of fiscal 2012 for the restructuring of NIKE Brand's Western Europe operations, were partially offset by certain net gains related to non-operating items.
The combination of translation of foreign currency-denominated profits from our international businesses and the year-over-year change in foreign currency related gains and losses included in other expense (income), net did not have a significant impact on our income before income taxes for fiscal 2012.
Fiscal 2011 Compared to Fiscal 2010
For fiscal 2011, other expense (income), net was primarily comprised of net foreign currency gains.
For fiscal 2011, we estimated that the combination of translation of foreign currency-denominated profits from our international businesses and the year-over-year change in foreign currency related net gains included in other expense (income), net had an unfavorable impact of approximately $33 million on our income before income taxes.
Income Taxes
| Fiscal 2012 | Fiscal 2011 | FY12 vs. FY11 % Change | Fiscal 2010 | FY11 vs. FY10 % Change | ||||||||||||||||
Effective tax rate | 25.5 | % | 25.0 | % | 50 bps | 24.2 | % | 80 bps | ||||||||||||
Fiscal 2012 Compared to Fiscal 2011
Our effective tax rate for fiscal 2012 was 50 basis points higher than the effective tax rate for fiscal 2011 primarily due to changes in estimates of uncertain tax position. This impact was partially offset by a reduction in the effective tax rate on operations outside of the United States as a result of changes in geographical mix of foreign earnings.
Fiscal 2011 Compared to Fiscal 2010
Our effective tax rate for fiscal 2011 was 80 basis points higher than the effective tax rate for fiscal 2010 primarily due to the change in geographic mix of earnings. A larger percentage of our earnings in fiscal 2011 were attributable to operations in the U.S., where the statutory tax rate is generally higher than the tax rate on operations outside of the U.S. This impact was partially offset by changes in estimates of uncertain tax positions.
Operating Segments
The Company's reportable operating segments are based on our internal geographic organization. Each NIKE Brand geography operates predominantly in one industry: the design, development, marketing and selling of athletic footwear, apparel, and equipment. Our reportable operating segments for the NIKE Brand are: North America, Western Europe, Central & Eastern Europe, Greater China, Japan, and Emerging Markets. Our NIKE Brand Direct to Consumer operations are managed within each geographic segment.
As part of our centrally managed foreign exchange risk management program, standard foreign currency rates are assigned twice per year to each NIKE Brand entity in our geographic operating segments and certain Other Businesses. These rates are set approximately nine months in advance of the future selling season based on average market spot rates in the calendar month preceding the date they are established. Inventories and cost of sales for geographic operating segments and certain Other Businesses reflect use of these standard rates to record non-functional currency product purchases into the entity's functional currency. Differences between assigned standard foreign currency rates and actual market rates are included in Corporate together with foreign currency hedge gains and losses generated from our centrally managed foreign exchange risk management program.
Certain prior year amounts have been reclassified to conform to fiscal 2012 presentation.
| 20 |
The breakdown of revenues follows:
| (Dollars in millions) | Fiscal 2012 | Fiscal 2011 (1) | FY12 vs. FY11 % Change | FY12 vs. FY11 % Change Excluding Currency | Fiscal 2010 (1) | FY11 vs. FY10 % Change | FY11 vs. FY10 % Change Excluding Currency | |||||||||||||||||||||
| North America | $ | 8,839 | $ | 7,579 | 17 | % | 17 | % | $ | 6,697 | 13 | % | 13 | % | ||||||||||||||
| Western Europe | 4,144 | 3,868 | 7 | % | 4 | % | 3,839 | 1 | % | 6 | % | |||||||||||||||||
Central & Eastern Europe | 1,200 | 1,040 | 15 | % | 17 | % | 999 | 4 | % | 6 | % | |||||||||||||||||
| Greater China | 2,539 | 2,060 | 23 | % | 18 | % | 1,742 | 18 | % | 16 | % | |||||||||||||||||
Japan | 829 | 766 | 8 | % | 1 | % | 882 | -13 | % | -21 | % | |||||||||||||||||
| Emerging Markets | 3,410 | 2,736 | 25 | % | 26 | % | 2,198 | 24 | % | 19 | % | |||||||||||||||||
Global Brand Divisions | 111 | 96 | 16 | % | 13 | % | 86 | 12 | % | 16 | % | |||||||||||||||||
| Total NIKE Brand Revenues | 21,072 | 18,145 | 16 | % | 15 | % | 16,443 | 10 | % | 10 | % | |||||||||||||||||
Other Businesses | 3,095 | 2,786 | 11 | % | 11 | % | 2,564 | 9 | % | 8 | % | |||||||||||||||||
| Corporate (3) | (39 | ) | (69 | ) | - | - | 7 | - | - | |||||||||||||||||||
| TOTAL NIKE, INC. REVENUES | $ | 24,128 | $ | 20,862 | 16 | % | 14 | % | $ | 19,014 | 10 | % | 10 | % | ||||||||||||||
| (1) | Certain prior year amounts have been reclassified to conform to fiscal 2012 presentation. These changes had no impact on previously reported results of operations or shareholders' equity. |
| (2) | Results have been restated using actual exchange rates in use during the comparative period to enhance the visibility of the underlying business trends by excluding the impact of translation arising from foreign currency exchange rate fluctuations. |
| (3) | Corporate revenues primarily consist of certain intercompany revenue eliminations and foreign currency hedge gains and losses related to revenues generated by entities within the NIKE Brand geographic operating segments and certain Other Businesses but managed through our central foreign exchange risk management program. |
The primary financial measure used by the Company to evaluate performance of individual operating segments is earnings before interest and taxes (commonly referred to as "EBIT") which represents net income before interest expense (income), net and income taxes in the consolidated statements of income. As discussed in Note 17 - Operating Segments and Related Information in the accompanying Notes to the Consolidated Financial Statements, certain corporate costs are not included in EBIT of our operating segments.
The breakdown of earnings before interest and taxes is as follows:
| (Dollars in millions) | Fiscal 2012 | Fiscal 2011 (1) | FY12 vs. FY11 % Change | Fiscal 2010 (1) | FY11 vs. FY10 % Change | |||||||||||||||
North America | $ | 2,007 | $ | 1,736 | 16 | % | $ | 1,538 | 13 | % | ||||||||||
| Western Europe | 597 | 730 | -18 | % | 807 | -10 | % | |||||||||||||
Central & Eastern Europe | 234 | 244 | -4 | % | 249 | -2 | % | |||||||||||||
| Greater China | 911 | 777 | 17 | % | 637 | 22 | % | |||||||||||||
Japan | 136 | 114 | 19 | % | 180 | -37 | % | |||||||||||||
| Emerging Markets | 853 | 688 | 24 | % | 521 | 32 | % | |||||||||||||
Global Brand Divisions | (1,177 | ) | (971 | ) | -21 | % | (866 | ) | -12 | % | ||||||||||
| Total NIKE Brand | 3,561 | 3,318 | 7 | % | 3,066 | 8 | % | |||||||||||||
Other Businesses | 341 | 335 | 2 | % | 298 | 12 | % | |||||||||||||
| Corporate | (916 | ) | (805 | ) | -14 | % | (841 | ) | 4 | % | ||||||||||
TOTAL CONSOLIDATED EARNINGS BEFORE INTEREST AND TAXES | $ | 2,986 | $ | 2,848 | 5 | % | $ | 2,523 | 13 | % | ||||||||||
| Interest expense, net | 3 | 4 | - | 6 | - | |||||||||||||||
TOTAL CONSOLIDATED INCOME BEFORE INCOME TAXES | $ | 2,983 | $ | 2,844 | 5 | % | $ | 2,517 | 13 | % | ||||||||||
| (1) | Certain prior year amounts have been reclassified to conform to fiscal 2012 presentation. These changes had no impact on previously reported results of operations or shareholders' equity. |
North America
| (Dollars in millions) | Fiscal 2012 | Fiscal 2011 | FY12 vs. FY11 % Change | FY12 vs. FY11 % Change Currency | Fiscal 2010 | FY11 vs. FY10 % Change | FY11 vs. FY10 % Change Currency | |||||||||||||||||||||
Revenues by: | ||||||||||||||||||||||||||||
Footwear | $ | 5,887 | $ | 5,111 | 15 | % | 15 | % | $ | 4,611 | 11 | % | 11 | % | ||||||||||||||
Apparel | 2,482 | 2,103 | 18 | % | 18 | % | 1,740 | 21 | % | 21 | % | |||||||||||||||||
Equipment | 470 | 365 | 29 | % | 29 | % | 346 | 5 | % | 5 | % | |||||||||||||||||
| TOTAL REVENUES | $ | 8,839 | $ | 7,579 | 17 | % | 17 | % | $ | 6,697 | 13 | % | 13 | % | ||||||||||||||
Revenues by: | ||||||||||||||||||||||||||||
Sales to Wholesale Customers | $ | 6,720 | $ | 5,801 | 16 | % | 16 | % | $ | 5,202 | 12 | % | 11 | % | ||||||||||||||
Sales Direct to Consumer | 2,119 | 1,778 | 19 | % | 19 | % | 1,495 | 19 | % | 19 | % | |||||||||||||||||
| TOTAL REVENUES | $ | 8,839 | $ | 7,579 | 17 | % | 17 | % | $ | 6,697 | 13 | % | 13 | % | ||||||||||||||
| EARNINGS BEFORE INTEREST AND TAXES | $ | 2,007 | $ | 1,736 | 16 | % | $ | 1,538 | 13 | % | ||||||||||||||||||
| 21 |
Fiscal 2012 Compared to Fiscal 2011
Revenues for North America increased 17% for fiscal 2012, driven by growth in both wholesale and Direct to Consumer revenues. Our category offense continued to deliver innovative products, deep brand connections and compelling retail experiences to consumers, driving demand for NIKE Brand products across all seven key categories. North America's Direct to Consumer revenues grew 19% for fiscal 2012, fueled by 15% growth in comparable store sales.
For fiscal 2012, footwear revenue in North America increased 15%, driven by an increase in both unit sales and average selling prices. Unit sales rose at a double-digit rate while average selling price per pair grew at a mid-single-digit rate, reflective of product price increases, partially offset by higher discounts on close-out sales. The overall increase in footwear sales was driven by growth in all key categories, most notably Running, Basketball, Women's Training and Sportswear.
Compared to the prior year, apparel revenue for North America increased 18%, primarily driven by a low-double-digit percentage growth in average selling price per unit and a mid-single-digit percentage growth in unit sales. The increase in average selling price per unit was reflective of product price increases and a greater mix of higher price point products. The overall increase in apparel sales was driven by double-digit percentage growth across most key categories, including Men's Training, Running and Basketball.
For fiscal 2012, EBIT for North America increased 16% as revenue growth and improved selling and administrative expense leverage more than offset a decline in gross margin. Gross margin decreased 90 basis points during fiscal 2012, primarily due to higher product input costs and lower gross margins on close-out sales, which more than offset the favorable impact of selling price increases, lower air freight costs and the growth of our Direct to Consumer business. Selling and administrative expense as a percentage of revenue decreased by 70 basis points for fiscal 2012, as both demand creation and operating overhead expense grew at a slower rate than revenues.
Fiscal 2011 Compared to Fiscal 2010
Revenues for North America increased 13%, driven by double-digit percentage growth in both wholesale and Direct to Consumer revenues. Contributing to the wholesale revenue growth was strong product category presentations at our wholesale customers, improved product lines and earlier shipments of summer season products. North America's Direct to Consumer revenues grew 19%, which contributed approximately 4 percentage points to North America's revenue increase. The growth in the Direct to Consumer business was fueled by 14% growth in comparable store sales.
For fiscal 2011, the increase in North America footwear revenue was primarily driven by double-digit percentage growth in Running, Men's and Women's Training and Football (Soccer) and a single-digit percentage growth in Basketball, partially offset by a low-single-digit percentage decline in sales of our NIKE Brand Sportswear products.
The year-over-year increase in North America apparel revenues was primarily driven by double-digit percentage growth in most key categories, most notably Men's Training, Running, Basketball and Women's Training.
For fiscal 2011, the increase in North America's EBIT was primarily the result of revenue growth and leverage on selling and administrative expense, which more than offset a lower gross margin percentage. The decline in gross margin percentage was due primarily to increased air freight and product input costs, which more than offset the favorable impact from the growth of our Direct to Consumer business and fewer close-out sales.
Western Europe
| (Dollars in millions) | Fiscal 2012 | Fiscal 2011 | FY12 vs. FY11 % Change | FY12 vs. FY11 % Change Excluding Currency Changes | Fiscal 2010 | FY11 vs. FY10 % Change | FY11 vs. FY10 % Change Excluding Currency Changes | |||||||||||||||||||||
Revenues by: | ||||||||||||||||||||||||||||
Footwear | $ | 2,526 | $ | 2,345 | 8 | % | 5 | % | $ | 2,284 | 3 | % | 8 | % | ||||||||||||||
Apparel | 1,377 | 1,303 | 6 | % | 2 | % | 1,311 | -1 | % | 4 | % | |||||||||||||||||
Equipment | 241 | 220 | 10 | % | 5 | % | 244 | -10 | % | -5 | % | |||||||||||||||||
| TOTAL REVENUES | $ | 4,144 | $ | 3,868 | 7 | % | 4 | % | $ | 3,839 | 1 | % | 6 | % | ||||||||||||||
Revenues by: | ||||||||||||||||||||||||||||
Sales to Wholesale Customers | $ | 3,556 | $ | 3,385 | 5 | % | 2 | % | $ | 3,380 | 0 | % | 5 | % | ||||||||||||||
Sales Direct to Consumer | 588 | 483 | 22 | % | 18 | % | 459 | 5 | % | 10 | % | |||||||||||||||||
| TOTAL REVENUES | $ | 4,144 | $ | 3,868 | 7 | % | 4 | % | $ | 3,839 | 1 | % | 6 | % | ||||||||||||||
| EARNINGS BEFORE INTEREST AND TAXES | $ | 597 | $ | 730 | -18 | % | $ | 807 | -10 | % | ||||||||||||||||||
Fiscal 2012 Compared to Fiscal 2011
On a currency neutral basis, revenues for Western Europe increased 4% for fiscal 2012, as most territories reported revenue growth, which more than offset revenue declines in the U.K. & Ireland and Italy. Revenues for the U.K. & Ireland, the largest market in Western Europe, declined 3% for the fiscal 2012 period. Western Europe's Direct to Consumer revenues grew 18% for fiscal 2012, including 8% growth in comparable store sales.
Excluding changes in currency exchange rates, footwear revenue in Western Europe increased 5% for fiscal 2012, primarily driven by a low-single-digit percentage growth in both unit sales and average selling price per pair, primarily reflective of product price increases, partially offset by higher discounts on in-line and close-out sales. The overall increase in footwear sales was driven by growth in Running, Basketball and Football (Soccer), which more than offset a decline in Action Sports.
Excluding changes in currency exchange rates, apparel revenue in Western Europe increased 2% for fiscal 2012. The year-over-year change was primarily driven by a mid-single-digit percentage increase in average selling price per unit, reflective of higher product prices. Partially offsetting the increase in average selling price per unit was a mid-single-digit percentage decline in unit sales. The overall increase in apparel sales was driven by growth in Football (Soccer) and Running, which more than offset a decline in Sportswear.
On a reported basis, revenues for Western Europe increased 7% for fiscal 2012. However, EBIT fell 18%, primarily driven by a 350 basis point decline in gross margin and higher selling and administrative expense as a percentage of revenues. The decline in gross margin was driven by higher product input costs and the negative impact from changes in standard currency rates, which more than offset the favorable impact of product price increases and the growth of our Direct to Consumer business. The increase in selling and administrative expense as a percentage of revenues was mainly driven by an increased level of demand creation spending around the European Football Championships and London Summer Olympics. Also reflected in Western Europe's fiscal 2012 results was a $24 million charge relating to the restructuring of its operations.
| 22 |
Fiscal 2011 Compared to Fiscal 2010
On a currency neutral basis, revenues for Western Europe increased 6% for fiscal 2011, attributable to growth in most territories. Revenues for the U.K. & Ireland, the largest market in Western Europe, grew 5% for fiscal 2011. Western Europe's Direct to Consumer revenues grew 10%, which contributed approximately 1 percentage point to Western Europe's revenue increase. The growth in the Direct to Consumer business was fueled by 6% growth in comparable store sales.
Excluding changes in currency exchange rates, footwear revenue in Western Europe increased 8%, driven by double-digit percentage growth in Running, Football (Soccer) and Action Sports, which more than offset a slight revenue decline in Sportswear.
On a currency neutral basis, apparel revenue in Western Europe increased 4%, primarily driven by double-digit percentage growth in Football (Soccer) and Running, which more than offset a mid-single-digit revenue decline in Sportswear.
For fiscal 2011, the decrease in Western Europe's EBIT was driven by unfavorable foreign currency translation and a lower gross margin percentage, all of which more than offset the increase in revenues and improved leverage on selling and administrative expense. The decline in the gross margin percentage was significantly impacted by the unfavorable year-over-year standard currency rates. Also contributing to the decrease in the gross margin percentage was higher product input and air freight costs, higher royalty expenses related to sales of endorsed team products and higher full price discounts. These factors more than offset the favorable impact of fewer close-out sales.
Central & Eastern Europe
| (Dollars in millions) | Fiscal 2012 | Fiscal 2011 | FY12 vs. FY11 % Change | FY12 vs. FY11 % Change Excluding Currency Changes | Fiscal 2010 | FY11 vs. FY10 % Change | FY11 vs. FY10 % Change Excluding Currency Changes | |||||||||||||||||||||
Revenues by: | ||||||||||||||||||||||||||||
Footwear | $ | 671 | $ | 605 | 11 | % | 13 | % | $ | 562 | 8 | % | 10 | % | ||||||||||||||
Apparel | 441 | 359 | 23 | % | 24 | % | 357 | 1 | % | 3 | % | |||||||||||||||||
Equipment | 88 | 76 | 16 | % | 17 | % | 80 | -5 | % | -4 | % | |||||||||||||||||
| TOTAL REVENUES | $ | 1,200 | $ | 1,040 | 15 | % | 17 | % | $ | 999 | 4 | % | 6 | % | ||||||||||||||
| EARNINGS BEFORE INTEREST AND TAXES | $ | 234 | $ | 244 | -4 | % | $ | 249 | -2 | % | ||||||||||||||||||
Fiscal 2012 Compared to Fiscal 2011
Excluding the changes in currency exchange rates, revenues for Central & Eastern Europe increased 17% for fiscal 2012, driven by growth across most territories, including double-digit growth in Russia and Turkey, which more than offset lower revenues in Greece.
Excluding changes in currency exchange rates, Central & Eastern Europe's footwear revenue grew 13%, primarily driven by double-digit percentage growth in unit sales and a low-single-digit percentage increase in average selling price per pair. The increase in average selling price per pair was reflective of product price increases which more than offset the negative impact of higher discounts on in-line and close-out sales. The overall increase in footwear sales was driven by growth across all key categories, most notably Running, Sportswear and Football (Soccer).
Excluding changes in currency exchange rates, Central & Eastern Europe's apparel revenues grew 24%, mainly driven by double-digit percentage growth in unit sales, offset by a slight decrease in average price per unit, mainly due to less favorable product mix and higher discounts on in-line sales, which more than offset the impact from product price increases. The overall increase in apparel sales was primarily driven by growth in Football (Soccer), Sportswear and Running.
On a reported basis, revenues for Central & Eastern Europe increased 15% for fiscal 2012. However, EBIT fell 4%, primarily driven by a 420 basis point decline in gross margin. The decline in gross margin was primarily due to higher product input costs as well as higher discounts on in-line and close-out products, which more than offset the favorable impact from product price increases. Selling and administrative expense as a percentage of revenues remained relatively flat compared to the prior period.
Fiscal 2011 Compared to Fiscal 2010
Led by Russia and Turkey, most territories within Central & Eastern Europe reported revenue growth during fiscal 2011 as economic conditions in the geography continued to show signs of recovery.
The growth in Central & Eastern Europe's footwear revenues was mainly driven by double-digit percentage growth in Football (Soccer), Running and Action Sports, while the growth in apparel revenues was primarily driven by double-digit percentage growth in Running.
For fiscal 2011, the decrease in Central & Eastern Europe's EBIT was primarily driven by unfavorable foreign currency translation and a lower gross margin percentage, which more than offset the increase in revenues and improved leverage on selling and administrative expense. The decline in the gross margin percentage was primarily due to unfavorable year-over-year standard currency rates, higher air freight costs and an increase in product input costs.
Greater China
| (Dollars in millions) | Fiscal 2012 | Fiscal 2011 | FY12 vs. FY11 % Change | FY12 vs. FY11 % Change Excluding Currency Changes | Fiscal 2010 | FY11 vs. FY10 % Change | FY11 vs. FY10 % Change Excluding Currency Changes | |||||||||||||||||||||
Revenues by: | ||||||||||||||||||||||||||||
Footwear | $ | 1,518 | $ | 1,164 | 30 | % | 25 | % | $ | 953 | 22 | % | 19 | % | ||||||||||||||
Apparel | 896 | 789 | 14 | % | 9 | % | 684 | 15 | % | 13 | % | |||||||||||||||||
Equipment | 125 | 107 | 17 | % | 12 | % | 105 | 2 | % | 1 | % | |||||||||||||||||
| TOTAL REVENUES | $ | 2,539 | $ | 2,060 | 23 | % | 18 | % | $ | 1,742 | 18 | % | 16 | % | ||||||||||||||
| EARNINGS BEFORE INTEREST AND TAXES | $ | 911 | $ | 777 | 17 | % | $ | 637 | 22 | % | ||||||||||||||||||
| 23 |
Fiscal 2012 Compared to Fiscal 2011
Excluding changes in currency exchange rates, Greater China revenues increased 18% for fiscal 2012, driven by continued expansion in the number of both NIKE mono-branded stores owned by our wholesale customers and NIKE owned stores, as well as higher comparable store sales.
Excluding changes in currency exchange rates, the growth in Greater China's footwear revenue for fiscal 2012 was primarily driven by double-digit percentage growth in unit sales and a mid-single-digit growth in average unit price per pair, reflective of product price increases. The overall increase in footwear sales was driven by double-digit percentage growth across most key categories, led by Running and Sportswear.
Excluding changes in currency exchange rates, the growth in Greater China's apparel revenues for fiscal 2012 was mainly driven by a high-single-digit growth in the average selling price per unit and a low-single-digit percentage increase in unit sales. The increase in average selling price was reflective of product price increases, partially offset by higher discounts on in-line and close-out products to accelerate the sales of slower moving apparel inventories.
On a reported basis, revenues for Greater China increased 23% for fiscal 2012, while EBIT grew 17%, as revenue growth was partially offset by a decline in gross margin and an increase in selling and administrative expense as a percentage of revenues. Gross margin decreased 150 basis points for fiscal 2012, primarily attributable to higher product input costs and discounts on close-out products, which more than offset the favorable impact of product price increases. Selling and administrative expense as a percentage of revenues increased 50 basis points, driven by an increase in operating overhead expense.
Fiscal 2011 Compared to Fiscal 2010
Excluding changes in currency exchange rates, Greater China revenues increased 16% for fiscal 2011, driven by expansion in the number of partner-owned stores selling NIKE products, as well as improvement in comparable store sales for partner-owned stores.
For fiscal 2011, the increase in Greater China's footwear revenue was primarily driven by double-digit percentage growth in Running and Sportswear, while the growth in apparel revenue was mainly driven by double-digit percentage increases in Sportswear, Basketball and Men's Training.
For fiscal 2011, EBIT for Greater China grew at a faster rate than revenue as a result of a higher gross margin, improved leverage on selling and administrative expense and favorable foreign currency translation. The improvement in gross margin was primarily attributable to higher product prices, favorable product mix and lower inventory obsolescence expense, which more than offset higher product input costs and warehousing costs from our new China distribution center.
Japan
| (Dollars in millions) | Fiscal 2012 | Fiscal 2011 | FY12 vs. FY11 % Change | FY12 vs. FY11 Excluding | Fiscal 2010 | FY11 vs. FY10 % Change | FY11 vs. FY10 % Change Excluding Currency Changes | |||||||||||||||||||||
Revenues by: | ||||||||||||||||||||||||||||
Footwear | $ | 438 | $ | 396 | 11 | % | 3 | % | $ | 433 | -9 | % | -16 | % | ||||||||||||||
Apparel | 322 | 302 | 7 | % | -1 | % | 357 | -15 | % | -22 | % | |||||||||||||||||
Equipment | 69 | 68 | 1 | % | -4 | % | 92 | -26 | % | -33 | % | |||||||||||||||||
| TOTAL REVENUES | $ | 829 | $ | 766 | 8 | % | 1 | % | $ | 882 | -13 | % | -21 | % | ||||||||||||||
| EARNINGS BEFORE INTEREST AND TAXES | $ | 136 | $ | 114 | 19 | % | $ | 180 | -37 | % | ||||||||||||||||||
Fiscal 2012 Compared to Fiscal 2011
During fiscal 2012, the macroeconomic environment in Japan remained uncertain as the market continued to recover from the effects of the earthquake and tsunami in March 2011. On a currency neutral basis, footwear revenue in Japan increased 3% for fiscal 2012, as growth in Running and Football (Soccer) more than offset a decline in Sportswear.
Excluding changes in currency exchange rates, apparel revenue decreased 1% for fiscal 2012, as the decline in Sportswear more than offset the growth in Running and Football (Soccer).
On a reported basis, EBIT for Japan grew at a faster rate than revenue as a result of improved gross margin and leverage of selling and administrative expenses. The increase in Japan's gross margin was mainly driven by the favorable impact from the year-over-year change in standard currency rates, a decrease in inventory obsolescence expense as well as a lower mix of close-out sales. These favorable impacts were partially offset by higher product input costs.
Fiscal 2011 Compared to Fiscal 2010
On March 11, 2011, Japan experienced a major earthquake and resulting tsunami. While the Company's organization and assets in Japan were not materially damaged, business results for the month of March 2011 were significantly eroded by the natural disaster.
Excluding changes in currency exchange rates, both footwear and apparel revenues in Japan declined, driven by decreases across most key categories. Partially offsetting the decreases was double-digit percentage growth in revenues from Running apparel.
The decrease in Japan's EBIT for fiscal 2011 was primarily due to lower revenues and higher selling and administrative expense as a percentage of revenue, partially offset by an improvement in the gross margin percentage. The improvement in the gross margin percentage was primarily driven by favorable year-over-year standard currency rates and positive impacts from fewer discounts on close-out sales, which more than offset higher product input costs and inventory obsolescence expense.
| 24 |
Emerging Markets
| (Dollars in millions) | Fiscal 2012 | Fiscal 2011 | FY12 vs. FY11 % Change | FY12 vs. FY11 Excluding | Fiscal 2010 | FY11 vs. FY10 % Change | FY11 vs. FY10 % Change | |||||||||||||||||||||
Revenues by: | ||||||||||||||||||||||||||||
Footwear | $ | 2,386 | $ | 1,897 | 26 | % | 27 | % | $ | 1,458 | 30 | % | 24 | % | ||||||||||||||
Apparel | 815 | 657 | 24 | % | 25 | % | 577 | 14 | % | 9 | % | |||||||||||||||||
Equipment | 209 | 182 | 15 | % | 15 | % | 163 | 12 | % | 7 | % | |||||||||||||||||
| TOTAL REVENUES | $ | 3,410 | $ | 2,736 | 25 | % | 26 | % | $ | 2,198 | 24 | % | 19 | % | ||||||||||||||
EARNINGS BEFORE INTEREST AND TAXES | $ | 853 | $ | 688 | 24 | % | $ | 521 | 32 | % | ||||||||||||||||||
Fiscal 2012 Compared to Fiscal 2011
Excluding the changes in currency exchange rates, revenues for the Emerging Markets increased 26% for fiscal 2012 as all territories in the geography reported double-digit revenue growth, led by Argentina, Brazil, Mexico and Korea.
For fiscal 2012, revenue growth for both footwear and apparel in the Emerging Markets was driven by double-digit percentage growth in unit sales and mid-single-digit percentage growth in average selling price per unit, primarily reflective of product price increases. The overall increase in Emerging Markets' footwear and apparel sales was driven by strong demand in nearly all key categories, led by Running and Sportswear.
The increase in Emerging Markets' EBIT for fiscal 2012 was primarily the result of revenue growth and selling and administrative expense leverage, which more than offset a lower gross margin. Gross margin declined 150 basis points for the fiscal year, primarily due to higher product input costs, customs duty charges and inventory obsolescence expense. These factors were partially offset by the favorable impact of changes in standard currency exchange rates and product price increases. Selling and administrative expense as a percentage of revenues decreased 140 basis points, as both demand creation expense and operating overhead grew at a slower rate than revenues.
Fiscal 2011 Compared to Fiscal 2010
Excluding the changes in currency exchange rates, revenues for Emerging Markets increased 19% for fiscal 2011. Most territories in the geography reported double-digit revenue growth for the fiscal year, led by Brazil, Argentina, Mexico, and Korea.
For fiscal 2011, both footwear and apparel revenue growth in the Emerging Markets was driven by strong demand in nearly all key categories, most notably Sportswear and Running.
For fiscal 2011, EBIT for Emerging Markets grew at a faster rate than revenue as a result of higher gross margin percentage, improved leverage on selling and administrative expense and favorable foreign currency translation. The increase in the gross margin percentage was primarily due to a higher mix of in-line product sales, lower warehousing costs and favorable year-over-year standard currency rates, which more than offset the increase in product input costs and higher full-price discounts.
Global Brand Divisions
| (Dollars in millions) | Fiscal 2012 | Fiscal 2011 | FY12 vs. FY11 % Change | FY12 vs. FY11 % Change Excluding Currency Changes | Fiscal 2010 | FY11 vs. FY10 % Change | FY11 vs. FY10 % Change Excluding Currency Changes | |||||||||||||||||||||
Revenues | $ | 111 | $ | 96 | 16 | % | 13 | % | $ | 86 | 12 | % | 16 | % | ||||||||||||||
| (Loss) Before Interest and Taxes | (1,177 | ) | (971 | ) | -21 | % | (866 | ) | -12 | % | ||||||||||||||||||
Global Brand Divisions primarily represent demand creation and operating overhead expenses that are centrally managed for the NIKE Brand. Revenues for the Global Brand Divisions are attributable to NIKE Brand licensing businesses that are not part of a geographic operating segment.
Fiscal 2012 Compared to Fiscal 2011
For fiscal 2012, Global Brand Divisions' loss before interest and taxes increased $206 million, primarily driven by increased investments in our digital business and infrastructure for our Direct to Consumer operations, higher sports marketing expense as well as higher personnel costs to support our global brand functions.
Fiscal 2011 Compared to Fiscal 2010
For fiscal 2011, the increase in Global Brand Divisions' loss before interest and taxes was primarily due to an increase in both operating overhead and centrally managed demand creation expense. The increase in operating overhead expense was mainly driven by increased investments in our Direct to Consumer infrastructure along with higher wages and travel expense. The increase in demand creation expense was primarily driven by a higher level of brand event spending around the World Cup and World Basketball Festival in the first half of fiscal 2011, as well as increased investments in sports marketing.
| 25 |
Other Businesses
| (Dollars in millions) | Fiscal 2012 | Fiscal 2011 | FY12 vs. FY11 % Change | FY12 vs. FY11 % Change Excluding Currency Changes | Fiscal 2010 | FY11 vs. FY10 % Change | FY11 vs. FY10 % Change Excluding Currency Changes | |||||||||||||||||||||
Revenues | ||||||||||||||||||||||||||||
Converse | $ | 1,324 | $ | 1,131 | 17 | % | 17 | % | $ | 983 | 15 | % | 15 | % | ||||||||||||||
NIKE Golf | 726 | 658 | 10 | % | 9 | % | 670 | -2 | % | -3 | % | |||||||||||||||||
Cole Haan | 535 | 521 | 3 | % | 3 | % | 466 | 12 | % | 12 | % | |||||||||||||||||
Hurley | 248 | 252 | -2 | % | -1 | % | 222 | 14 | % | 13 | % | |||||||||||||||||
Umbro | 262 | 224 | 17 | % | 14 | % | 223 | 0 | % | 2 | % | |||||||||||||||||
| TOTAL REVENUES | $ | 3,095 | $ | 2,786 | 11 | % | 11 | % | $ | 2,564 | 9 | % | 8 | % | ||||||||||||||
EARNINGS BEFORE INTEREST AND TAXES | $ | 341 | $ | 335 | 2 | % | $ | 298 | 12 | % | ||||||||||||||||||
Fiscal 2012 Compared to Fiscal 2011
Our Other Businesses are comprised of our affiliate brands; Cole Haan, Converse, Hurley and Umbro; and NIKE Golf.
For fiscal 2012, revenues for our Other Businesses increased 11%, reflecting growth across most businesses, led by Converse. The revenue growth at Converse was primarily driven by increased sales in North America and China, as well as increased revenues in the U.K. as we transitioned that market to direct distribution in the second half of fiscal 2011. Excluding changes in currency exchange rates, revenues for NIKE Golf increased 9% for fiscal 2012, driven by double-digit percentage growth in our apparel business, partially offset by a single-digit percentage decline in our club business. On a currency neutral basis, revenues for Umbro grew 14% primarily driven by sales growth in France due to our acquisition of the exclusive licensee and distributor in March 2011. For fiscal 2012, revenues for Cole Haan grew 3%, mostly driven by growth in our Direct to Consumer operations.
On a reported basis, revenues for our Other Businesses increased 11% for fiscal 2012, while EBIT grew 2%, as earnings growth at Converse was mostly offset by losses at Umbro and Hurley. Higher selling and administrative expense as a percentage of revenues negatively affected profitability at both companies, while lower gross margins also contributed to the decline in Hurley's earnings.
As part of our long-term growth strategy, we continually evaluate our existing portfolio of businesses to ensure the Company is investing in those businesses that are accretive to the NIKE Brand, and with the largest growth potential and highest returns. On May 31, 2012, we announced our intention to divest of the Cole Haan and Umbro businesses, which will allow us to focus our resources on driving growth in the NIKE, Jordan, Converse and Hurley brands. For fiscal 2012 and 2011, Cole Haan and Umbro combined contributed $797 million and $745 million, respectively, in revenues to the Other Businesses portfolio, and losses before interest and taxes of $43 million and $18 million, respectively.
We are currently in the process of preparing these businesses for sale and identifying suitable buyers. Although we are unable to estimate the ultimate gains or losses on the sales of these businesses at this time, we anticipate we will in the future incur certain non-cash charges related to the divestiture of Umbro. Upon the sale of the business, or when the ultimate selling price becomes estimable, we expect to incur non-cash charges to liquidate certain balance sheet accounts, most significantly the cumulative translation adjustment and deferred tax assets related to Umbro. At May 31, 2012, the cumulative translation adjustment was $110 million, net of tax, and the deferred tax asset was $32 million. We may also incur other cash and non-cash charges related to the divestiture of the Cole Haan and Umbro businesses.
Fiscal 2011 Compared to Fiscal 2010
For fiscal 2011, the revenue growth at Converse was primarily driven by increased licensing revenue in China, as well as increased sales in the U.K. as we transitioned that market to direct distribution. Revenues for Cole Haan increased 12%, driven by double-digit percentage growth in our wholesale operations as well as high-single-digit percentage growth in our Direct to Consumer operations. Revenues declined at NIKE Golf, where we experienced significant erosion in our Japan business following the earthquake and tsunami in March 2011.
For fiscal 2011, EBIT for our Other Businesses grew at a faster rate than revenues, primarily as a result of more favorable foreign currency exchange impacts. Gross margin remained relatively flat for fiscal 2011, as the favorable impact from improved product mix was offset by a lower mix of licensee revenues. Selling and administrative expense as a percentage of revenues remained relatively flat for fiscal 2011.
Corporate
| (Dollars in millions) | Fiscal 2012 | Fiscal 2011 | FY12 vs. FY11 % Change | Fiscal 2010 | FY11 vs. FY10 % Change | |||||||||||||||
Revenues | $ | (39 | ) | $ | (69 | ) | - | $ | 7 | - | ||||||||||
| (Loss) Before Interest and Taxes | (916 | ) | (805 | ) | -14 | % | (841 | ) | 4 | % | ||||||||||
Corporate consists largely of unallocated general and administrative expenses, including expenses associated with centrally managed departments; depreciation and amortization related to our corporate headquarters; unallocated insurance, benefit and compensation programs, including stock-based compensation; certain foreign currency gains and losses, including certain hedge gains and losses; corporate eliminations and other items.
Corporate revenues primarily consist of certain intercompany revenue eliminations and foreign currency hedge gains and losses related to revenues generated by entities within the NIKE Brand geographic operating segments and Other Businesses but managed through our central foreign exchange risk management program.
In addition to the foreign currency gains and losses recognized in Corporate revenues, foreign currency results include all other foreign currency hedge results generated through our centrally managed foreign exchange risk management program, other conversion gains and losses arising from re-measurement of monetary assets and liabilities in non-functional currencies, and gains and losses resulting from the difference between actual foreign currency rates and standard rates used to record non-functional currency denominated product purchases within the NIKE Brand geographic operating segments and Other Businesses.
| 26 |
Fiscal 2012 Compared to Fiscal 2011
For fiscal 2012, Corporate expense grew $111 million, mainly due to an increase of $49 million in performance-based compensation and a year-over-year net increase of $73 million from foreign currency impacts. These foreign currency impacts were driven by a year-over-year increase in foreign currency net losses, arising from certain Euro/U.S. Dollar foreign currency hedges and the re-measurement of monetary assets and liabilities in various non-functional currencies, net of related undesignated forward instruments, as a variety of foreign currencies weakened against the U.S. Dollar year-over-year. The above impacts were partially offset by a slight decrease in centrally managed operating overhead expenses.
Fiscal 2011 Compared to Fiscal 2010
For fiscal 2011, the decrease in Corporate expense was primarily driven by year-over-year net foreign currency gains generated by our centrally managed foreign exchange risk management program. Also contributing to the decrease in Corporate expense for fiscal 2011 was a $54 million year-over-year reduction in stock options expense primarily due to a change in accelerated vesting provisions that took effect in the first quarter of fiscal 2011 and a lower estimated fair value for stock options granted in the current year. These benefits more than offset an increase in corporate operating overhead expenses, primarily driven by higher wage-related expense.
Foreign Currency Exposures and Hedging Practices
Overview
As a global company with significant operations outside the United States, in the normal course of business we are exposed to risk arising from changes in currency exchange rates. Our primary foreign currency exposures arise from the recording of transactions denominated in non-functional currencies and the translation of foreign currency denominated results of operations, financial position and cash flows, such as the Euro and Chinese Renminbi, into U.S. Dollars.
Our foreign exchange risk management program is intended to lessen both the positive and negative effects of currency fluctuations on our reported consolidated results of operations, financial position and cash flows. We manage global foreign exchange risk centrally on a portfolio basis to address those risks that are material to NIKE, Inc. We manage these exposures by taking advantage of natural offsets and currency correlations that exist within the portfolio, and where practical, by hedging a portion of the remaining material exposures using derivative instruments such as forward contracts and options. As described below, the implementation of our foreign currency adjustment program enhanced our ability to manage our foreign exchange risk on a portfolio basis by increasing the natural offsets and currency correlation benefits that exist within our portfolio of aggregate foreign exchange exposure. Our hedging policy is designed to partially or entirely offset the impact of exchange rate changes on the underlying net exposures being hedged. Where hedged, our program has the effect of delaying the impact of current market rates on our consolidated financial statements; the length of the delay is dependent upon hedge horizons. We do not hold or issue derivative instruments for trading purposes.
Transactional exposures
We conduct business in various currencies and have transactions which subject us to foreign currency risk. Our most significant transactional foreign currency exposures are:
| • | Product Costs - NIKE's product costs are exposed to fluctuations in foreign currencies in the following ways: |
| 1. | Non-functional currency denominated product purchases: |
| a. | Certain NIKE entities purchase product from the NIKE Trading Company ("NTC"), a wholly-owned centralized sourcing hub that buys NIKE branded products from external factories, predominantly in U.S. Dollars. The NTC, whose functional currency is the U.S. Dollar, then sells the products to NIKE entities in their respective functional currencies. When the NTC sells to a NIKE entity with a different functional currency, the result is a foreign currency exposure for the NTC. |
| b. | Other NIKE entities purchase product directly from external factories in U.S. Dollars. These purchases generate a foreign currency exposure for those NIKE entities with a functional currency other than the U.S. Dollar. |
| In both purchasing scenarios, a weaker U.S. Dollar reduces the inventory cost incurred by NIKE whereas a stronger U.S. Dollar increases its cost. |
| 2. | Factory input costs: In January 2012, NIKE implemented a foreign currency adjustment program with certain factories. The program is designed to more effectively manage foreign currency risk by assuming certain of the factories' foreign currency exposures, some of which are natural offsets to our existing foreign currency exposures. Under this program, our payments to these factories are adjusted for rate fluctuations in the basket of currencies ("factory currency exposure index") in which the labor, materials and overhead costs incurred by the factories in the production of NIKE branded products ("factory input costs") are denominated. |
| For the currency within the factory currency exposure indices that is the local or functional currency of the factory, the currency rate fluctuation affecting the product cost is recorded within inventories and is recognized in cost of sales when the related product is sold to a third-party. All currencies within the indices, excluding the U.S. Dollar and the local or functional currency of the factory, are recognized as embedded derivatives and are recorded at fair value through other expense (income), net. Refer to Note 16 - Risk Management and Derivatives for additional detail. |
| As an offset to the impacts of the fluctuating U.S. Dollar on our non-functional currency denominated product purchases described above, a strengthening U.S. Dollar against the foreign currencies within the factory currency exposure indices decreases NIKE's U.S. Dollar inventory cost. Conversely, a weakening U.S. Dollar against the indexed foreign currencies increases our inventory cost. |
| • | Non-Functional Currency Denominated External Sales - A portion of our Western Europe and Central & Eastern Europe geography revenues are earned in currencies other than the Euro (e.g. British Pound, Polish Zloty) but are recognized at a subsidiary that uses the Euro as its functional currency. These sales generate a foreign currency exposure. |
| • | Other Costs - Non-functional currency denominated costs, such as endorsement contracts, intercompany royalties and other intercompany charges, generate foreign currency risk to a lesser extent. |
| • | Non-Functional Currency Denominated Monetary Assets and Liabilities - Our global subsidiaries have various assets and liabilities, primarily receivables and payables, denominated in currencies other than their functional currencies. These balance sheet items are subject to re-measurement, which may create fluctuations in other expense (income), net within our consolidated results of operations. |
| 27 |
Managing transactional exposures
Transactional exposures are managed on a portfolio basis within our foreign currency risk management program. We manage these exposures by taking advantage of natural offsets and currency correlations that exist within the portfolio and may also elect to use currency forward and option contracts to hedge the remaining effect of exchange rate fluctuations on probable forecasted future cash flows, including certain product cost exposures, non-functional currency denominated external sales and other costs described above. These are accounted for as cash flow hedges in accordance with the accounting standards for derivatives and hedging, except for hedges of the embedded derivatives component of the product costs exposure as discussed below. As of May 31, 2012, there were outstanding currency forward contracts with maturities up to 24 months. The fair value of outstanding currency forward contracts at May 31, 2012 and 2011 was $183 million and $28 million in assets and $32 million and $136 million in liabilities, respectively. The effective portion of the changes in fair value of these instruments is reported in other comprehensive income ("OCI"), a component of shareholders' equity, and reclassified into earnings in the same financial statement line item and in the same period or periods during which the related hedged transactions affect consolidated earnings. The ineffective portion is immediately recognized in earnings as a component of other expense (income), net. Ineffectiveness was not material for the years ended May 31, 2012, 2011 and 2010.
Certain currency forward contracts used to manage the foreign exchange exposure of non-functional currency denominated monetary assets and liabilities subject to re-measurement and the embedded derivative contracts discussed above are not formally designated as hedging instruments under the accounting standards for derivatives and hedging. Accordingly, changes in fair value of these instruments are immediately recognized in other expense (income), net and are intended to offset the foreign currency impact of the re-measurement of the related non-functional currency denominated asset or liability or the embedded derivative contract being hedged. The fair value of undesignated instruments was $55 million and $9 million in assets and $20 million and $17 million in liabilities at May 31, 2012 and 2011, respectively.
Refer to Note 6 - Fair Value Measurements and Note 16 – Risk Management and Derivatives in the accompanying Notes to the Consolidated Financial Statements for additional description of how the above financial instruments are valued and recorded.
Translational exposures
Many of our foreign subsidiaries operate in functional currencies other than the U.S. Dollar. Fluctuations in currency exchange rates create volatility in our reported results as we are required to translate the balance sheets, operational results and cash flows of these subsidiaries into U.S. Dollars for consolidated reporting. The translation of foreign subsidiaries' non-U.S. Dollar denominated balance sheets into U.S. Dollars for consolidated reporting results in a cumulative translation adjustment to OCI within shareholders' equity. In the translation of our consolidated statements of income, a weaker U.S. Dollar in relation to foreign functional currencies benefits our consolidated earnings whereas a stronger U.S. Dollar reduces our consolidated earnings. The impact of foreign exchange rate fluctuations on the translation of our consolidated revenues was a benefit (detriment) of approximately $268 million and $(28) million for the years ended May 31, 2012 and 2011, respectively. The impact of foreign exchange rate fluctuations on the translation of our income before income taxes was a benefit (detriment) of approximately $74 million and $(16) million for the years ended May 31, 2012 and 2011, respectively.
Managing translational exposures
To minimize the impact of translating foreign currency denominated revenues and expenses into U.S. Dollars for consolidated reporting, certain foreign subsidiaries use excess cash to purchase U.S. Dollar denominated available-for-sale investments. The variable future cash flows associated with the purchase and subsequent sale of these U.S. Dollar denominated securities at non-U.S. Dollar functional currency subsidiaries creates a foreign currency exposure that qualifies for hedge accounting under the accounting standards for derivatives and hedging. We utilize forward contracts and/or options to mitigate the variability of the forecasted future purchases and sales of these U.S. Dollar investments. The combination of the purchase and sale of the U.S. Dollar investment and the hedging instrument has the effect of partially offsetting the year-over-year foreign currency translation impact on net earnings in the period the investments are sold. Hedges of available-for-sale investments are accounted for as cash flow hedges. The fair value of instruments used in this manner at May 31, 2012 and 2011 was $27 million and $1 million in assets and $3 million and $21 million in liabilities, respectively. The effective portion of the changes in fair value of these instruments is reported in OCI and reclassified into earnings in other expense (income), net in the period during which the hedged available-for-sale investment is sold and affects earnings. Any ineffective portion is immediately recognized in earnings as a component of other expense (income), net. The impact of ineffective hedges was not material for any period presented.
The combination of translation of foreign currency-denominated profits from our international businesses and the year-over-year change in foreign currency related gains and losses included in other expense (income), net had an insignificant impact on our income before income taxes for the year ended May 31, 2012 and had a unfavorable impact of approximately $33 million for the year ended May 31, 2011.
Refer to Note 6 - Fair Value Measurements and Note 16 - Risk Management and Derivatives in the accompanying Notes to the Consolidated Financial Statements for additional description of how the above financial instruments are valued and recorded.
Net investments in foreign subsidiaries
We are also exposed to the impact of foreign exchange fluctuations on our investments in wholly-owned foreign subsidiaries denominated in a currency other than the U.S. Dollar, which could adversely impact the U.S. Dollar value of these investments and therefore the value of future repatriated earnings. We hedge certain net investment positions in Euro-functional currency foreign subsidiaries to mitigate the effects of foreign exchange fluctuations on these net investments. In accordance with the accounting standards for derivatives and hedging, the effective portion of the change in fair value of the forward contracts designated as net investment hedges is recorded in the cumulative translation adjustment component of accumulated other comprehensive income. Any ineffective portion is immediately recognized in earnings as a component of other expense (income), net. The impact of ineffective hedges was not material for any period presented. To minimize credit risk, we have structured these net investment hedges to be generally less than six months in duration. Upon maturity, the hedges are settled based on the current fair value of the forward contracts with the realized gain or loss remaining in OCI. There were no outstanding net investment hedges as of May 31, 2012. At May 31, 2011, the fair value was $23 million in liabilities. Cash flows from net investment hedge settlements totaled $22 million and $(23) million for the years ended May 31, 2012 and 2011, respectively.
| 28 |
Liquidity and Capital Resources
Cash Flow Activity
Cash provided by operations was $1.9 billion for fiscal 2012 compared to $1.8 billion for fiscal 2011. Our primary source of operating cash flow for fiscal 2012 was net income of $2.2 billion. Our working capital was a net cash outflow of $799 million for fiscal 2012 as compared to a net cash outflow of $708 million for fiscal 2011. Our investments in working capital increased primarily due to an increase in inventory and prepaid expenses. Inventory at the end of fiscal 2012 increased 23% compared to fiscal 2011, primarily due to higher product input costs as well as changes in product mix, which more than offset the favorable impact of changes in currency exchange rates. Inventory units for the NIKE Brand grew 10% compared to the prior year, driven by growth in futures orders and improved factory deliveries. The increase in prepaid expenses was primarily driven by higher prepaid demand creation expenses around the European Football Championships and London Summer Olympics.
Cash provided by investing activities was $514 million during fiscal 2012, compared to a use of cash of $1,021 million for fiscal 2011. The year-over-year increase was primarily due to higher net sales and maturities of short-term investments of $1,124 million (net of purchases) in fiscal 2012, compared to net purchases of $537 million (net of sales and maturities) during fiscal 2011.
Cash used by financing activities was $2.1 billion for fiscal 2012 compared to $2.0 billion for fiscal 2011. The increase in cash used by financing activities was primarily due to higher payments of long-term debt, notes payable, and dividends, which was partially offset by an increase in the proceeds from the exercise of stock options.
In fiscal 2012, we purchased 20.0 million shares of NIKE's class B common stock for $1.8 billion. These repurchases were made under the four-year, $5 billion program approved by our Board of Directors in September 2008, under which stock repurchase activities commenced in December 2009. As of the end of fiscal 2012, we have repurchased 50.3 million shares for $4.1 billion under this program. We continue to expect funding of share repurchases will come from operating cash flow, excess cash, and/or debt. The timing and the amount of shares purchased will be dictated by our capital needs and stock market conditions.
Capital Resources
On November 1, 2011, we entered into a committed credit facility agreement with a syndicate of banks which provides for up to $1 billion of borrowings pursuant to a revolving credit facility with the option to increase borrowings to $1.5 billon with lender approval. The facility matures in November 2016, with a one-year extension option prior to both the second and third anniversary of the closing date, provided that extensions shall not extend beyond November 1, 2018. This facility replaces the prior $1 billion committed credit facility agreement that would have expired in December 2012. As of and for the year ended May 31, 2012, we had no amounts outstanding under our new committed revolving credit facility.
We currently have long-term debt ratings of A+ and A1 from Standard and Poor's Corporation and Moody's Investor Services, respectively. If our long-term debt rating were to decline, the facility fee and interest rate under our committed revolving credit facility would increase. Conversely, if our long-term debt rating were to improve, the facility fee and interest rate would decrease. Changes in our long-term debt rating would not trigger acceleration of maturity of any then-outstanding borrowings or any future borrowings under the committed credit facility. Under this committed revolving credit facility, we have agreed to various covenants. These covenants include limits on our disposal of fixed assets, the amount of debt secured by liens we may incur, as well as a minimum capitalization ratio. In the event we were to have any borrowings outstanding under this facility and failed to meet any covenant, and were unable to obtain a waiver from a majority of the banks in the syndicate, any borrowings would become immediately due and payable. As of May 31, 2012, we were in full compliance with each of these covenants and believe it is unlikely we will fail to meet any of these covenants in the foreseeable future.
Liquidity is also provided by our $1 billion commercial paper program. As of and for the year ended May 31, 2012, no amounts were outstanding under this program. We may issue commercial paper from time to time during fiscal 2013 depending on general corporate needs. We currently have short-term debt ratings of A1 and P1 from Standard and Poor's Corporation and Moody's Investor Services, respectively.
Our previous $760 million shelf registration statement with the Securities and Exchange Commission expired during fiscal 2012. No debt securities were issued under that shelf registration prior to its expiry. We may issue debt securities under a new shelf registration in fiscal 2013 depending on general corporate needs.
As of May 31, 2012, we had cash, cash equivalents and short-term investments totaling $3.8 billion, of which $2.5 billion was held by our foreign subsidiaries. Cash equivalents and short-term investments consist primarily of deposits held at major banks, money market funds, Tier-1 commercial paper, corporate notes, U.S. Treasury obligations, U.S. government sponsored enterprise obligations, and other investment grade fixed income securities. Our fixed income investments are exposed to both credit and interest rate risk. All of our investments are investment grade to minimize our credit risk. While individual securities have varying durations, the average duration of our entire cash equivalents and short-term investment portfolio is less than 120 days as of May 31, 2012.
Despite recent uncertainties in the financial markets, to date we have not experienced difficulty accessing the credit markets or incurred higher interest costs. Future volatility in the capital markets, however, may increase costs associated with issuing commercial paper or other debt instruments or affect our ability to access those markets. We believe that existing cash, cash equivalents, short-term investments and cash generated by operations, together with access to external sources of funds as described above, will be sufficient to meet our domestic and foreign capital needs in the foreseeable future.
We utilize a variety of tax planning and financing strategies to manage our worldwide cash and deploy funds to locations where they are needed. We routinely repatriate a portion of our foreign earnings for which U.S. taxes have previously been provided. We also indefinitely reinvest a significant portion of our foreign earnings, and our current plans do not demonstrate a need to repatriate these earnings. Should we require additional capital in the U.S., we may elect to repatriate indefinitely reinvested foreign funds or raise capital in the U.S. through debt. If we were to repatriate indefinitely reinvested foreign funds, we would be required to accrue and pay additional U.S. taxes less applicable foreign tax credits. If we elect to raise capital in the U.S. through debt, we would incur additional interest expense.
Off-Balance Sheet Arrangements
In connection with various contracts and agreements, we provide routine indemnifications relating to the enforceability of intellectual property rights, coverage for legal issues that arise and other items where we are acting as the guarantor. Currently, we have several such agreements in place. However, based on our historical experience and the estimated probability of future loss, we have determined that the fair value of such indemnifications is not material to our financial position or results of operations.
| 29 |
Contractual Obligations
Our significant long-term contractual obligations as of May 31, 2012 and significant endorsement contracts entered into through the date of this report are as follows:
| Description of Commitment | Cash Payments Due During the Year Ending May 31, | |||||||||||||||||||||||||||
| (In millions) | 2013 | 2014 | 2015 | 2016 | 2017 | Thereafter | Total | |||||||||||||||||||||
| Operating Leases | $ | 408 | $ | 387 | $ | 271 | $ | 224 | $ | 186 | $ | 662 | $ | 2,138 | ||||||||||||||
| Long-term Debt | 49 | 59 | 9 | 109 | 9 | 27 | 262 | |||||||||||||||||||||
| Endorsement Contracts (1) | 856 | 804 | 686 | 491 | 363 | 628 | 3,828 | |||||||||||||||||||||
| Product Purchase Obligations (2) | 2,861 | - | - | - | - | - | 2,861 | |||||||||||||||||||||
Other (3) | 320 | 101 | 38 | 31 | 91 | 1 | 582 | |||||||||||||||||||||
TOTAL | $ | 4,494 | $ | 1,351 | $ | 1,004 | $ | 855 | $ | 649 | $ | 1,318 | $ | 9,671 | ||||||||||||||
| (1) | The amounts listed for endorsement contracts represent approximate amounts of base compensation and minimum guaranteed royalty fees we are obligated to pay athlete and sport team endorsers of our products. Actual payments under some contracts may be higher than the amounts listed as these contracts provide for bonuses to be paid to the endorsers based upon athletic achievements and/or royalties on product sales in future periods. Actual payments under some contracts may also be lower as these contracts include provisions for reduced payments if athletic performance declines in future periods. |
| In addition to the cash payments, we are obligated to furnish our endorsers with NIKE product for their use. It is not possible to determine how much we will spend on this product on an annual basis as the contracts generally do not stipulate a specific amount of cash to be spent on the product. The amount of product provided to the endorsers will depend on many factors, including general playing conditions, the number of sporting events in which they participate, and our own decisions regarding product and marketing initiatives. In addition, the costs to design, develop, source, and purchase the products furnished to the endorsers are incurred over a period of time and are not necessarily tracked separately from similar costs incurred for products sold to customers. |
| (2) | We generally order product at least 4 to 5 months in advance of sale based primarily on futures orders received from customers. The amounts listed for product purchase obligations represent agreements (including open purchase orders) to purchase products in the ordinary course of business that are enforceable and legally binding and that specify all significant terms. In some cases, prices are subject to change throughout the production process. The reported amounts exclude product purchase liabilities included in accounts payable on the consolidated balance sheet as of May 31, 2012. |
| (3) | Other amounts primarily include service and marketing commitments made in the ordinary course of business. The amounts represent the minimum payments required by legally binding contracts and agreements that specify all significant terms, including open purchase orders for non-product purchases. The reported amounts exclude those liabilities included in accounts payable or accrued liabilities on the consolidated balance sheet as of May 31, 2012. |
The total liability for uncertain tax positions was $285 million, excluding related interest and penalties, at May 31, 2012. We are not able to reasonably estimate when or if cash payments of the long-term liability for uncertain tax positions will occur.
We also have the following outstanding short-term debt obligations as of May 31, 2012. Please refer to the accompanying Notes to the Consolidated Financial Statements (Note 7 - Short-Term Borrowings and Credit Lines) for further description and interest rates related to the short-term debt obligations listed below.
| (In millions) | Outstanding as of May 31, 2012 | |||
Notes payable, due at mutually agreed-upon dates within one year of issuance or on demand | $ | 108 | ||
Payable to Sojitz America for the purchase of inventories, generally due 60 days after shipment of goods from a foreign port | $ | 75 | ||
As of May 31, 2012, letters of credit of $138 million were outstanding, which were generally issued for the purchase of inventory and as guarantees of the Company's performance under certain self-insurance and other programs.
Recently Adopted Accounting Standards
In April 2011, the Financial Accounting Standards Board ("FASB") issued new guidance to achieve common fair value measurement and disclosure requirements between U.S. GAAP and International Financial Reporting Standards. This new guidance, which became effective for us beginning March 1, 2012, amends current U.S. GAAP fair value measurement and disclosure guidance to include increased transparency around valuation inputs and investment categorization. The adoption did not have a material impact on our consolidated financial position or results of operations.
In January 2010, the FASB issued guidance to amend the disclosure requirements related to recurring and nonrecurring fair value measurements. The guidance requires additional disclosures about the different classes of assets and liabilities measured at fair value, the valuation techniques and inputs used, the activity in Level 3 fair value measurements, and the transfers between Levels 1, 2, and 3 of the fair value measurement hierarchy. This guidance became effective for us beginning March 1, 2010, except for disclosures relating to purchases, sales, issuances and settlements of Level 3 assets and liabilities, which became effective for us beginning June 1, 2011. As this guidance only requires expanded disclosures, the adoption did not have an impact on our consolidated financial position or results of operations.
In October 2009, the FASB issued new standards that revised the guidance for revenue recognition with multiple deliverables. These new standards impact the determination of when the individual deliverables included in a multiple-element arrangement may be treated as separate units of accounting. Additionally, these new standards modify the manner in which the transaction consideration is allocated across the separately identified deliverables by no longer permitting the residual method of allocating arrangement consideration. These new standards became effective for us beginning June 1, 2011. The adoption did not have a material impact on our consolidated financial position or results of operations.
| 30 |
Recently Issued Accounting Standards
In December 2011, the FASB issued guidance enhancing disclosure requirements surrounding the nature of an entity's right to offset and related arrangements associated with its financial instruments and derivative instruments. This new guidance requires companies to disclose both gross and net information about instruments and transactions eligible for offset in the statement of financial position and instruments and transactions subject to master netting arrangements. This new guidance is effective for us beginning June 1, 2013. As this guidance only requires expanded disclosures, we do not anticipate the adoption will have an impact on our consolidated financial position or results of operations.
In September 2011, the FASB issued updated guidance on the periodic testing of goodwill for impairment. This guidance will allow companies to assess qualitative factors to determine if it is more-likely-than-not that goodwill might be impaired and whether it is necessary to perform the two-step goodwill impairment test required under current accounting standards. This new guidance is effective for us beginning June 1, 2012. We do not expect the adoption will have a material effect on our consolidated financial position or results of operations.
In June 2011, the FASB issued guidance on the presentation of comprehensive income. This new guidance eliminates the current option to report other comprehensive income and its components in the statement of shareholders' equity. Companies will now be required to present the components of net income and other comprehensive income in either one continuous statement, referred to as the statement of comprehensive income, or in two separate, but consecutive statements. This guidance also required companies to present reclassification adjustments out of accumulated other comprehensive income by component in both the statement in which net income is presented and the statement in which other comprehensive income is presented. However, in December 2011, the FASB issued guidance which indefinitely defers the requirement related to the presentation of reclassification adjustments. Both issuances on the presentation of comprehensive income are effective for us beginning June 1, 2012. As this guidance only amends the presentation of the components of comprehensive income, we do not anticipate the adoption will have an impact on our consolidated financial position or results of operations.
Critical Accounting Policies
Our previous discussion and analysis of our financial condition and results of operations are based upon our consolidated financial statements, which have been prepared in accordance with accounting principles generally accepted in the United States of America. The preparation of these financial statements requires us to make estimates and judgments that affect the reported amounts of assets, liabilities, revenues and expenses, and related disclosure of contingent assets and liabilities.
We believe that the estimates, assumptions and judgments involved in the accounting policies described below have the greatest potential impact on our financial statements, so we consider these to be our critical accounting policies. Because of the uncertainty inherent in these matters, actual results could differ from the estimates we use in applying the critical accounting policies. Certain of these critical accounting policies affect working capital account balances, including the policies for revenue recognition, the allowance for uncollectible accounts receivable, inventory reserves, and contingent payments under endorsement contracts. These policies require that we make estimates in the preparation of our financial statements as of a given date. However, since our business cycle is relatively short, actual results related to these estimates are generally known within the six-month period following the financial statement date. Thus, these policies generally affect only the timing of reported amounts across two to three fiscal quarters.
Within the context of these critical accounting policies, we are not currently aware of any reasonably likely events or circumstances that would result in materially different amounts being reported.
Revenue Recognition
We record wholesale revenues when title passes and the risks and rewards of ownership have passed to the customer, based on the terms of sale. Title passes generally upon shipment or upon receipt by the customer depending on the country of the sale and the agreement with the customer. Retail store revenues are recorded at the time of sale.
In some instances, we ship product directly from our supplier to the customer and recognize revenue when the product is delivered to and accepted by the customer. Our revenues may fluctuate in cases when our customers delay accepting shipment of product for periods of up to several weeks.
In certain countries outside of the U.S., precise information regarding the date of receipt by the customer is not readily available. In these cases, we estimate the date of receipt by the customer based upon historical delivery times by geographic location. On the basis of our tests of actual transactions, we have no indication that these estimates have been materially inaccurate historically.
As part of our revenue recognition policy, we record estimated sales returns, discounts and miscellaneous claims from customers as reductions to revenues at the time revenues are recorded. We base our estimates on historical rates of product returns, discounts and claims, specific identification of outstanding claims and outstanding returns not yet received from customers, and estimated returns, discounts and claims expected but not yet finalized with our customers. Actual returns, discounts and claims in any future period are inherently uncertain and thus may differ from our estimates. If actual or expected future returns, discounts and claims were significantly greater or lower than the reserves we had established, we would record a reduction or increase to net revenues in the period in which we made such determination.
Allowance for Uncollectible Accounts Receivable
We make ongoing estimates relating to the ability to collect our accounts receivable and maintain an allowance for estimated losses resulting from the inability of our customers to make required payments. In determining the amount of the allowance, we consider our historical level of credit losses and make judgments about the creditworthiness of significant customers based on ongoing credit evaluations. Since we cannot predict future changes in the financial stability of our customers, actual future losses from uncollectible accounts may differ from our estimates. If the financial condition of our customers were to deteriorate, resulting in their inability to make payments, a larger allowance might be required. In the event we determine that a smaller or larger allowance is appropriate, we would record a credit or a charge to selling and administrative expense in the period in which such a determination is made.
Inventory Reserves
We also make ongoing estimates relating to the net realizable value of inventories based upon our assumptions about future demand and market conditions. If we estimate that the net realizable value of our inventory is less than the cost of the inventory recorded on our books, we record a reserve equal to the difference between the cost of the inventory and the estimated net realizable value. This reserve is recorded as a charge to cost of sales. If changes in market conditions result in reductions in the estimated net realizable value of our inventory below our previous estimate, we would increase our reserve in the period in which we made such a determination and record a charge to cost of sales.
| 31 |
Contingent Payments under Endorsement Contracts
A significant portion of our demand creation expense relates to payments under endorsement contracts. In general, endorsement payments are expensed uniformly over the term of the contract. However, certain contract elements may be accounted for differently, based upon the facts and circumstances of each individual contract.
Some of the contracts provide for contingent payments to endorsers based upon specific achievements in their sports (e.g., winning a championship). We record selling and administrative expense for these amounts when the endorser achieves the specific goal.
Some of the contracts provide for payments based upon endorsers maintaining a level of performance in their sport over an extended period of time (e.g., maintaining a top ranking in a sport for a year). These amounts are reported in selling and administrative expense when we determine that it is probable that the specified level of performance will be maintained throughout the period. In these instances, to the extent that actual payments to the endorser differ from our estimate due to changes in the endorser's athletic performance, increased or decreased selling and administrative expense may be reported in a future period.
Some of the contracts provide for royalty payments to endorsers based upon a predetermined percentage of sales of particular products. We expense these payments in cost of sales as the related sales occur. In certain contracts, we offer minimum guaranteed royalty payments. For contractual obligations for which we estimate we will not meet the minimum guaranteed amount of royalty fees through sales of product, we record the amount of the guaranteed payment in excess of that earned through sales of product in selling and administrative expense uniformly over the remaining guarantee period.
Property, Plant and Equipment and Definite-Lived Assets
Property, plant and equipment, including buildings, equipment, and computer hardware and software are recorded at cost (including, in some cases, the cost of internal labor) and are depreciated over the estimated useful life. Changes in circumstances (such as technological advances or changes to our business operations) can result in differences between the actual and estimated useful lives. In those cases where we determine that the useful life of a long-lived asset should be shortened, we increase depreciation expense over the remaining useful life to depreciate the asset's net book value to its salvage value.
We review the carrying value of long-lived assets or asset groups to be used in operations whenever events or changes in circumstances indicate that the carrying amount of the assets might not be recoverable. Factors that would necessitate an impairment assessment include a significant adverse change in the extent or manner in which an asset is used, a significant adverse change in legal factors or the business climate that could affect the value of the asset, or a significant decline in the observable market value of an asset, among others. If such facts indicate a potential impairment, we would assess the recoverability of an asset group by determining if the carrying value of the asset group exceeds the sum of the projected undiscounted cash flows expected to result from the use and eventual disposition of the assets over the remaining economic life of the primary asset in the asset group. If the recoverability test indicates that the carrying value of the asset group is not recoverable, we will estimate the fair value of the asset group using appropriate valuation methodologies that would typically include an estimate of discounted cash flows. Any impairment would be measured as the difference between the asset group's carrying amount and its estimated fair value.
Goodwill and Indefinite-Lived Intangible Assets
We perform annual impairment tests on goodwill and intangible assets with indefinite lives in the fourth quarter of each fiscal year, or when events occur or circumstances change that would, more likely than not, reduce the fair value of a reporting unit or an intangible asset with an indefinite life below its carrying value. Events or changes in circumstances that may trigger interim impairment reviews include significant changes in business climate, operating results, planned investments in the reporting unit, planned divestitures or an expectation that the carrying amount may not be recoverable, among other factors. The impairment test requires us to estimate the fair value of our reporting units. If the carrying value of a reporting unit exceeds its fair value, the goodwill of that reporting unit is potentially impaired and we proceed to step two of the impairment analysis. In step two of the analysis, we measure and record an impairment loss equal to the excess of the carrying value of the reporting unit's goodwill over its implied fair value if any.
We generally base our measurement of the fair value of a reporting unit on a blended analysis of the present value of future discounted cash flows and the market valuation approach. The discounted cash flows model indicates the fair value of the reporting unit based on the present value of the cash flows that we expect the reporting unit to generate in the future. Our significant estimates in the discounted cash flows model include: our weighted average cost of capital; long-term rate of growth and profitability of the reporting unit's business; and working capital effects. The market valuation approach indicates the fair value of the business based on a comparison of the reporting unit to comparable publicly traded companies in similar lines of business. Significant estimates in the market valuation approach model include identifying similar companies with comparable business factors such as size, growth, profitability, risk and return on investment, and assessing comparable revenue and operating income multiples in estimating the fair value of the reporting unit.
Indefinite-lived intangible assets primarily consist of acquired trade names and trademarks. In measuring the fair value for these intangible assets, we utilize the relief-from-royalty method. This method assumes that trade names and trademarks have value to the extent that their owner is relieved of the obligation to pay royalties for the benefits received from them. This method requires us to estimate the future revenue for the related brands, the appropriate royalty rate and the weighted average cost of capital.
On May 31, 2012, we announced our intention to divest of the Cole Haan and Umbro businesses. As of May 31, 2012, Cole Haan had no goodwill or indefinite-lived intangible assets on our balance sheet, while Umbro had $70 million of goodwill and $164 million of trademark and other intangible assets. As of May 31, 2012, both asset groups for Cole Haan and Umbro did not quality as "assets-held-for-sale" under applicable accounting guidance. The decision to divest these businesses was deemed a triggering event to perform an impairment analysis of Umbro's intangible assets at that date and was considered in our fourth quarter impairment analysis. We are currently in the process of preparing the businesses for divestiture and identifying potential acquirers. Therefore, we believe the weighted use of discounted cash flows and the market valuation approach is the best method for determining the fair value of the Umbro reporting unit because these are the most common valuation methodologies used within our industry; and the blended use of both models compensates for the inherent risks associated with either model if used on a stand-alone basis. As discussed above, the asset groups for Umbro did not qualify as "assets-held-for-sale"; therefore, we did not consider potential disposition costs or cumulative translation adjustments in the carrying value of the Umbro reporting unit in our fiscal 2012 fourth quarter impairment analysis. Because we are still in the preliminary stages of the divestiture process and have not yet identified potential acquirers or the likely deal structure, these methods represent our best estimate of the fair value of the Umbro business. Our analysis determined there was no impairment of intangible assets or goodwill related to Umbro. If the sales process indicates a fair value that is below the current carrying value of the reporting unit, an analysis would be required to determine if impairment charges exist at that point.
| 32 |
Fair Value Measurements
For financial assets and liabilities measured at fair value on a recurring basis, fair value is the price we would receive to sell an asset or pay to transfer a liability in an orderly transaction with a market participant at the measurement date. In general, and where applicable, we use quoted prices in active markets for identical assets or liabilities to determine the fair values of our financial instruments. This pricing methodology applies to our Level 1 investments, including U.S. Treasury securities.
In the absence of active markets for identical assets or liabilities, such measurements involve developing assumptions based on market observable data, including quoted prices for similar assets or liabilities in active markets and quoted prices for identical or similar assets or liabilities in markets that are not active. This pricing methodology applies to our Level 2 investments such as commercial paper and bonds, U.S. agency securities and money market funds. Level 3 investments are valued using internally developed models with unobservable inputs. Assets and liabilities measured using unobservable inputs are an immaterial portion of our portfolio.
A majority of our available-for-sale securities are priced by pricing vendors and are generally Level 1 or Level 2 investments, as these vendors either provide a quoted market price in an active market or use observable inputs without applying significant adjustments in their pricing. Observable inputs include broker quotes, interest rates and yield curves observable at commonly quoted intervals, volatilities and credit risks. Our fair value processes include controls that are designed to ensure appropriate fair values are recorded. These controls include an analysis of period-over-period fluctuations and comparison to another independent pricing vendor.
Hedge Accounting for Derivatives
We use forward and option contracts to hedge certain anticipated foreign currency exchange transactions as well as certain non-functional monetary assets and liabilities. When the specific criteria to qualify for hedge accounting has been met, changes in the fair value of contracts hedging probable forecasted future cash flows are recorded in other comprehensive income, rather than net income, until the underlying hedged transaction affects net income. In most cases, this results in gains and losses on hedge derivatives being released from other comprehensive income into net income some time after the maturity of the derivative. One of the criteria for this accounting treatment is that the forward and option contracts amount should not be in excess of specifically identified anticipated transactions. By their very nature, our estimates of anticipated transactions may fluctuate over time and may ultimately vary from actual transactions. When anticipated transaction estimates or actual transaction amounts decline below hedged levels, or if it is no longer probable that a forecasted transaction will occur by the end of the originally specified time period or within an additional two-month period of time thereafter, we are required to reclassify the cumulative changes in fair values of the over-hedged portion of the related hedge contract from other comprehensive income to other expense (income), net during the quarter in which such changes occur.
We use forward contracts to hedge our investment in the net assets of certain international subsidiaries to offset foreign currency translation related to our net investment in those subsidiaries. The change in fair value of the forward contracts hedging our net investments is reported in the cumulative translation adjustment component of accumulated other comprehensive income within stockholders' equity, to the extent effective, to offset the foreign currency translation adjustments on those investments. As the value of our underlying net investments in wholly-owned international subsidiaries is known at the time a hedge is placed, the designated hedge is matched to the portion of our net investment at risk. Accordingly, the variability involved in net investment hedges is substantially less than that of other types of hedge transactions and we do not expect any material ineffectiveness. We consider, on a quarterly basis, the need to redesignate existing hedge relationships based on changes in the underlying net investment. Should the level of our net investment decrease below hedged levels, the cumulative change in fair value of the over-hedged portion of the related hedge contract would be reported directly to earnings in the period in which changes occur.
Stock-based Compensation
We account for stock-based compensation by estimating the fair value of stock-based compensation on the date of grant using the Black-Scholes option pricing model. The Black-Scholes option pricing model requires the input of highly subjective assumptions including volatility. Expected volatility is estimated based on implied volatility in market traded options on our common stock with a term greater than one year, along with other factors. Our decision to use implied volatility was based on the availability of actively traded options on our common stock and our assessment that implied volatility is more representative of future stock price trends than historical volatility. If factors change and we use different assumptions for estimating stock-based compensation expense in future periods, stock-based compensation expense may differ materially in the future from that recorded in the current period.
Taxes
We record valuation allowances against our deferred tax assets, when necessary. Realization of deferred tax assets (such as net operating loss carry-forwards) is dependent on future taxable earnings and is therefore uncertain. At least quarterly, we assess the likelihood that our deferred tax asset balance will be recovered from future taxable income. To the extent we believe that recovery is not likely, we establish a valuation allowance against our net deferred tax asset, which increases our income tax expense in the period when such determination is made.
In addition, we have not recorded U.S. income tax expense for foreign earnings that we have determined to be indefinitely reinvested outside the U.S., thus reducing our overall income tax expense. The amount of earnings designated as indefinitely reinvested offshore is based upon the actual deployment of such earnings in our offshore assets and our expectations of the future cash needs of our U.S. and foreign entities. Income tax considerations are also a factor in determining the amount of foreign earnings to be indefinitely reinvested offshore.
We carefully review all factors that drive the ultimate disposition of foreign earnings determined to be reinvested offshore and apply stringent standards to overcome the presumption of repatriation. Despite this approach, because the determination involves our future plans and expectations of future events, the possibility exists that amounts declared as indefinitely reinvested offshore may ultimately be repatriated. For instance, the actual cash needs of our U.S. entities may exceed our current expectations, or the actual cash needs of our foreign entities may be less than our current expectations. This would result in additional income tax expense in the year we determined that amounts were no longer indefinitely reinvested offshore. Conversely, our approach may also result in a determination that accumulated foreign earnings (for which U.S. income taxes have been provided) will be indefinitely reinvested offshore. In this case, our income tax expense would be reduced in the year of such determination.
On an interim basis, we estimate what our effective tax rate will be for the full fiscal year. This estimated annual effective tax rate is then applied to the year-to-date pre-tax income excluding infrequently occurring or unusual items, to determine the year-to-date tax expense. The income tax effects of infrequent or unusual items are recognized in the interim period in which they occur. As the fiscal year progresses, we continually refine our estimate based upon actual events and earnings by jurisdiction during the year. This continual estimation process periodically results in a change to our expected effective tax rate for the fiscal year. When this occurs, we adjust the income tax provision during the quarter in which the change in estimate occurs.
On a quarterly basis, we reevaluate the probability that a tax position will be effectively sustained and the appropriateness of the amount recognized for uncertain tax positions based on factors including changes in facts or circumstances, changes in tax law, settled audit issues and new audit activity. Changes in our assessment may result in the recognition of a tax benefit or an additional charge to the tax provision in the period our assessment changes. We recognize interest and penalties related to income tax matters in income tax expense.
| 33 |
Other Contingencies
In the ordinary course of business, we are involved in legal proceedings regarding contractual and employment relationships, product liability claims, trademark rights, and a variety of other matters. We record contingent liabilities resulting from claims against us, including related legal costs, when a loss is assessed to be probable and the amount of the loss is reasonably estimable. Assessing probability of loss and estimating probable losses requires analysis of multiple factors, including in some cases judgments about the potential actions of third-party claimants and courts. Recorded contingent liabilities are based on the best information available and actual losses in any future period are inherently uncertain. If future adjustments to estimated probable future losses or actual losses exceed our recorded liability for such claims, we would record additional charges as other expense (income), net during the period in which the actual loss or change in estimate occurred. In addition to contingent liabilities recorded for probable losses, we disclose contingent liabilities when there is a reasonable possibility that the ultimate loss will materially exceed the recorded liability. While we cannot predict the outcome of pending legal matters with certainty, we do not believe any currently identified claim, proceeding or litigation, either individually or in aggregate, will have a material impact on our results of operations, financial position or cash flows.
| 34 |
| ITEM 7A. | Quantitative and Qualitative Disclosures about Market Risk |
In the normal course of business and consistent with established policies and procedures, we employ a variety of financial instruments to manage exposure to fluctuations in the value of foreign currencies and interest rates. It is our policy to utilize these financial instruments only where necessary to finance our business and manage such exposures; we do not enter into these transactions for speculative purposes.
We are exposed to foreign currency fluctuations, primarily as a result of our international sales, product sourcing and funding activities. Our foreign exchange risk management program is intended to lessen both the positive and negative effects of currency fluctuations on our consolidated results of operations, financial position and cash flows. We use forward exchange contracts and options to hedge certain anticipated but not yet firmly committed transactions as well as certain firm commitments and the related receivables and payables, including third-party and intercompany transactions. We also use forward contracts to hedge our investment in the net assets of certain international subsidiaries to offset foreign currency translation adjustments related to our net investment in those subsidiaries. Where hedged, our program has the effect of delaying the impact of current market rates on our consolidated financial statements dependent upon hedge horizons.
When we begin hedging exposures, the type and duration of each hedge depends on the nature of the exposure and market conditions. Generally, all anticipated and firmly committed transactions that are hedged are to be recognized within 12 to 18 months. The majority of the contracts expiring in more than 12 months relate to the anticipated purchase of inventory. When intercompany loans are hedged, it is typically for their expected duration. Hedged transactions are principally denominated in Euros, British Pounds and Japanese Yen. See section "Foreign Currency Exposures and Hedging Practices" under Item 7 for additional detail.
Our earnings are also exposed to movements in short and long-term market interest rates. Our objective in managing this interest rate exposure is to limit the impact of interest rate changes on earnings and cash flows and to reduce overall borrowing costs. To achieve these objectives, we maintain a mix of commercial paper, bank loans and fixed rate debt of varying maturities and have entered into receive-fixed, pay-variable interest rate swaps.
Market Risk Measurement
We monitor foreign exchange risk, interest rate risk and related derivatives using a variety of techniques including a review of market value, sensitivity analysis, and Value-at-Risk ("VaR"). Our market-sensitive derivative and other financial instruments are foreign currency forward contracts, foreign currency option contracts, interest rate swaps, intercompany loans denominated in non-functional currencies, fixed interest rate U.S. Dollar denominated debt, and fixed interest rate Japanese Yen denominated debt.
We use VaR to monitor the foreign exchange risk of our foreign currency forward and foreign currency option derivative instruments only. The VaR determines the maximum potential one-day loss in the fair value of these foreign exchange rate-sensitive financial instruments. The VaR model estimates assume normal market conditions and a 95% confidence level. There are various modeling techniques that can be used in the VaR computation. Our computations are based on interrelationships between currencies and interest rates (a "variance/co-variance" technique). These interrelationships are a function of foreign exchange currency market changes and interest rate changes over the preceding one year period. The value of foreign currency options does not change on a one-to-one basis with changes in the underlying currency rate. We adjust the potential loss in option value for the estimated sensitivity (the "delta" and "gamma") to changes in the underlying currency rate. This calculation reflects the impact of foreign currency rate fluctuations on the derivative instruments only and does not include the impact of such rate fluctuations on non-functional currency transactions (such as anticipated transactions, firm commitments, cash balances, and accounts and loans receivable and payable), including those which are hedged by these instruments.
The VaR model is a risk analysis tool and does not purport to represent actual losses in fair value that we will incur, nor does it consider the potential effect of favorable changes in market rates. It also does not represent the full extent of the possible loss that may occur. Actual future gains and losses will differ from those estimated because of changes or differences in market rates and interrelationships, hedging instruments and hedge percentages, timing and other factors.
The estimated maximum one-day loss in fair value on our foreign currency sensitive derivative financial instruments, derived using the VaR model, was $21 million and $33 million at May 31, 2012 and 2011, respectively. The VaR decreased year-over-year primarily as a result of decreased foreign currency volatilities at May 31, 2012. Such a hypothetical loss in fair value of our derivatives would be offset by increases in the value of the underlying transactions being hedged. The average monthly change in the fair values of foreign currency forward and foreign currency option derivative instruments was $87 million and $79 million during fiscal 2012 and fiscal 2011, respectively.
The instruments not included in the VaR are intercompany loans denominated in non-functional currencies, fixed interest rate Japanese Yen denominated debt, fixed interest rate U.S. Dollar denominated debt and interest rate swaps. Intercompany loans and related interest amounts are eliminated in consolidation. Furthermore, our non-functional currency intercompany loans are substantially hedged against foreign exchange risk through the use of forward contracts, which are included in the VaR calculation above. Therefore, we consider the interest rate and foreign currency market risks associated with our non-functional currency intercompany loans to be immaterial to our consolidated financial position, results from operations and cash flows.
Details of third-party debt and interest rate swaps are provided in the table below. The table presents principal cash flows and related weighted average interest rates by expected maturity dates. Weighted average interest rates for the fixed rate swapped to floating rate debt reflect the effective interest rates as of May 31, 2012.
| 35 |
Expected Maturity Date Year Ending May 31, | ||||||||||||||||||||||||||||||||
| (Dollars in millions) | 2013 | 2014 | 2015 | 2016 | 2017 | Thereafter | Total | Fair Value | ||||||||||||||||||||||||
| Foreign Exchange Risk | ||||||||||||||||||||||||||||||||
| Japanese Yen Functional Currency | ||||||||||||||||||||||||||||||||
Japanese Yen debt - Fixed rate | ||||||||||||||||||||||||||||||||
Principal payments | $ | 9 | $ | 9 | $ | 9 | $ | 9 | $ | 9 | $ | 27 | $ | 72 | $ | 76 | ||||||||||||||||
Average interest rate | 2.4 | % | 2.4 | % | 2.4 | % | 2.4 | % | 2.4 | % | 2.4 | % | 2.4 | % | ||||||||||||||||||
| Interest Rate Risk | ||||||||||||||||||||||||||||||||
| Japanese Yen Functional Currency | ||||||||||||||||||||||||||||||||
Long-term Japanese Yen debt - Fixed rate | ||||||||||||||||||||||||||||||||
Principal payments | $ | 9 | $ | 9 | $ | 9 | $ | 9 | $ | 9 | $ | 27 | $ | 72 | $ | 76 | ||||||||||||||||
Average interest rate | 2.4 | % | 2.4 | % | 2.4 | % | 2.4 | % | 2.4 | % | 2.4 | % | 2.4 | % | ||||||||||||||||||
| U.S. Dollar Functional Currency | ||||||||||||||||||||||||||||||||
Long-term U.S. Dollar debt - Fixed rate swapped to Floating rate | ||||||||||||||||||||||||||||||||
Principal payments | $ | 40 | $ | - | $ | - | $ | 100 | $ | - | $ | - | $ | 140 | $ | 154 | ||||||||||||||||
Average interest rate | 0.8 | % | 0.0 | % | 0.0 | % | 0.7 | % | 0.0 | % | 0.0 | % | 0.7 | % | ||||||||||||||||||
Long-term U.S. Dollar debt - Fixed rate | ||||||||||||||||||||||||||||||||
Principal payments | $ | - | $ | 50 | $ | - | $ | - | $ | - | $ | - | $ | 50 | $ | 53 | ||||||||||||||||
Average interest rate | 0.0 | % | 4.7 | % | 0.0 | % | 0.0 | % | 0.0 | % | 0.0 | % | 4.7 | % | ||||||||||||||||||
The fixed interest rate Japanese Yen denominated debt instruments were issued by and are accounted for by one of our Japanese subsidiaries. Accordingly, the monthly translation of these instruments, which varies due to changes in foreign exchange rates, is recognized in accumulated other comprehensive income upon the consolidation of this subsidiary.
| ITEM 8. | Financial Statements and Supplemental Data |
Management of NIKE, Inc. is responsible for the information and representations contained in this report. The financial statements have been prepared in conformity with the generally accepted accounting principles we considered appropriate in the circumstances and include some amounts based on our best estimates and judgments. Other financial information in this report is consistent with these financial statements.
Our accounting systems include controls designed to reasonably assure assets are safeguarded from unauthorized use or disposition and provide for the preparation of financial statements in conformity with generally accepted accounting principles. These systems are supplemented by the selection and training of qualified financial personnel and an organizational structure providing for appropriate segregation of duties.
An Internal Audit department reviews the results of its work with the Audit Committee of the Board of Directors, presently consisting of three outside directors. The Audit Committee is responsible for the appointment of the independent registered public accounting firm and reviews with the independent registered public accounting firm, management and the internal audit staff, the scope and the results of the annual examination, the effectiveness of the accounting control system and other matters relating to the financial affairs of NIKE as the Audit Committee deems appropriate. The independent registered public accounting firm and the internal auditors have full access to the Committee, with and without the presence of management, to discuss any appropriate matters.
| 36 |
Management's Annual Report on Internal Control Over Financial Reporting
Management is responsible for establishing and maintaining adequate internal control over financial reporting, as such term is defined in Rule 13a-15(f) and Rule 15d-15(f) of the Securities Exchange Act of 1934, as amended. Internal control over financial reporting is a process designed to provide reasonable assurance regarding the reliability of financial reporting and the preparation of the financial statements for external purposes in accordance with generally accepted accounting principles in the United States of America. Internal control over financial reporting includes those policies and procedures that: (i) pertain to the maintenance of records that, in reasonable detail, accurately and fairly reflect the transactions and dispositions of assets of the Company; (ii) provide reasonable assurance that transactions are recorded as necessary to permit preparation of financial statements in accordance with generally accepted accounting principles, and that receipts and expenditures of the Company are being made only in accordance with authorizations of our management and directors; and (iii) provide reasonable assurance regarding prevention or timely detection of unauthorized acquisition, use or disposition of assets of the Company that could have a material effect on the financial statements.
While "reasonable assurance" is a high level of assurance, it does not mean absolute assurance. Because of its inherent limitations, internal control over financial reporting may not prevent or detect every misstatement and instance of fraud. Controls are susceptible to manipulation, especially in instances of fraud caused by the collusion of two or more people, including our senior management. Also, projections of any evaluation of effectiveness to future periods are subject to the risk that controls may become inadequate because of changes in conditions, or that the degree of compliance with the policies or procedures may deteriorate.
Under the supervision and with the participation of our Chief Executive Officer and Chief Financial Officer, our management conducted an evaluation of the effectiveness of our internal control over financial reporting based upon the framework in Internal Control - Integrated Framework issued by the Committee of Sponsoring Organizations of the Treadway Commission (COSO). Based on the results of our evaluation, our management concluded that our internal control over financial reporting was effective as of May 31, 2012.
PricewaterhouseCoopers LLP, an independent registered public accounting firm, has audited (1) the consolidated financial statements and (2) the effectiveness of our internal control over financial reporting as of May 31, 2012, as stated in their report herein.
| Mark G. Parker | Donald W. Blair | |
| President and Chief Executive Officer | Chief Financial Officer |
| 37 |
Report of Independent Registered Public Accounting Firm
To the Board of Directors and Shareholders of NIKE, Inc.:
In our opinion, the consolidated financial statements listed in the index appearing under Item 15(a)(1) present fairly, in all material respects, the financial position of NIKE, Inc. and its subsidiaries at May 31, 2012 and 2011, and the results of their operations and their cash flows for each of the three years in the period ended May 31, 2012 in conformity with accounting principles generally accepted in the United States of America. In addition, in our opinion, the financial statement schedule listed in the appendix appearing under Item 15(a)(2) presents fairly, in all material respects, the information set forth therein when read in conjunction with the related consolidated financial statements. Also in our opinion, the Company maintained, in all material respects, effective internal control over financial reporting as of May 31, 2012, based on criteria established in Internal Control - Integrated Framework issued by the Committee of Sponsoring Organizations of the Treadway Commission (COSO). The Company's management is responsible for these financial statements and financial statement schedule, for maintaining effective internal control over financial reporting and for its assessment of the effectiveness of internal control over financial reporting, included in Management's Annual Report on Internal Control Over Financial Reporting appearing under Item 8. Our responsibility is to express opinions on these financial statements, on the financial statement schedule, and on the Company's internal control over financial reporting based on our integrated audits. We conducted our audits in accordance with the standards of the Public Company Accounting Oversight Board (United States). Those standards require that we plan and perform the audits to obtain reasonable assurance about whether the financial statements are free of material misstatement and whether effective internal control over financial reporting was maintained in all material respects. Our audits of the financial statements included examining, on a test basis, evidence supporting the amounts and disclosures in the financial statements, assessing the accounting principles used and significant estimates made by management, and evaluating the overall financial statement presentation. Our audit of internal control over financial reporting included obtaining an understanding of internal control over financial reporting, assessing the risk that a material weakness exists, and testing and evaluating the design and operating effectiveness of internal control based on the assessed risk. Our audits also included performing such other procedures as we considered necessary in the circumstances. We believe that our audits provide a reasonable basis for our opinions.
A company's internal control over financial reporting is a process designed to provide reasonable assurance regarding the reliability of financial reporting and the preparation of financial statements for external purposes in accordance with generally accepted accounting principles. A company's internal control over financial reporting includes those policies and procedures that (i) pertain to the maintenance of records that, in reasonable detail, accurately and fairly reflect the transactions and dispositions of the assets of the company; (ii) provide reasonable assurance that transactions are recorded as necessary to permit preparation of financial statements in accordance with generally accepted accounting principles, and that receipts and expenditures of the company are being made only in accordance with authorizations of management and directors of the company; and (iii) provide reasonable assurance regarding prevention or timely detection of unauthorized acquisition, use, or disposition of the company's assets that could have a material effect on the financial statements.
Because of its inherent limitations, internal control over financial reporting may not prevent or detect misstatements. Also, projections of any evaluation of effectiveness to future periods are subject to the risk that controls may become inadequate because of changes in conditions, or that the degree of compliance with the policies or procedures may deteriorate.
/ S / P RICEWATERHOUSE C OOPERS LLP
Portland, Oregon
July 24, 2012
| 38 |
Consolidated Statements Of Income
| Year Ended May 31, | ||||||||||||
| (In millions, except per share data) | 2012 | 2011 | 2010 | |||||||||
Revenues | $ | 24,128 | $ | 20,862 | $ | 19,014 | ||||||
Cost of sales | 13,657 | 11,354 | 10,214 | |||||||||
Gross profit | 10,471 | 9,508 | 8,800 | |||||||||
Demand creation expense | 2,711 | 2,448 | 2,356 | |||||||||
Operating overhead expense | 4,720 | 4,245 | 3,970 | |||||||||
Total selling and administrative expense | 7,431 | 6,693 | 6,326 | |||||||||
Interest expense, net (Notes 6, 7 and 8) | 3 | 4 | 6 | |||||||||
Other expense (income), net (Note 16) | 54 | (33 | ) | (49 | ) | |||||||
Income before income taxes | 2,983 | 2,844 | 2,517 | |||||||||
Income tax expense (Note 9) | 760 | 711 | 610 | |||||||||
Net income | $ | 2,223 | $ | 2,133 | $ | 1,907 | ||||||
Basic earnings per common share (Notes 1 and 12) | $ | 4.83 | $ | 4.48 | $ | 3.93 | ||||||
Diluted earnings per common share (Notes 1 and 12) | $ | 4.73 | $ | 4.39 | $ | 3.86 | ||||||
Dividends declared per common share | $ | 1.39 | $ | 1.20 | $ | 1.06 | ||||||
The accompanying notes to consolidated financial statements are an integral part of this statement.
| 39 |
Consolidated Balance Sheets
| May 31, | ||||||||
| (In millions) | 2012 | 2011 | ||||||
| ASSETS | ||||||||
Current assets: | ||||||||
Cash and equivalents | $ | 2,317 | $ | 1,955 | ||||
Short-term investments (Note 6) | 1,440 | 2,583 | ||||||
Accounts receivable, net (Note 1) | 3,280 | 3,138 | ||||||
Inventories (Notes 1 and 2) | 3,350 | 2,715 | ||||||
Deferred income taxes (Note 9) | 274 | 312 | ||||||
Prepaid expenses and other current assets (Notes 6 and 16) | 870 | 594 | ||||||
| Total current assets | 11,531 | 11,297 | ||||||
Property, plant and equipment, net (Note 3) | 2,279 | 2,115 | ||||||
Identifiable intangible assets, net (Note 4) | 535 | 487 | ||||||
Goodwill (Note 4) | 201 | 205 | ||||||
Deferred income taxes and other assets (Notes 6, 9 and 16) | 919 | 894 | ||||||
| TOTAL ASSETS | $ | 15,465 | $ | 14,998 | ||||
| LIABILITIES AND SHAREHOLDERS' EQUITY | ||||||||
Current liabilities: | ||||||||
Current portion of long-term debt (Note 8) | $ | 49 | $ | 200 | ||||
Notes payable (Note 7) | 108 | 187 | ||||||
Accounts payable (Note 7) | 1,588 | 1,469 | ||||||
Accrued liabilities (Notes 5, 6 and 16) | 2,053 | 1,985 | ||||||
Income taxes payable (Note 9) | 67 | 117 | ||||||
| Total current liabilities | 3,865 | 3,958 | ||||||
| Long-term debt (Note 8) | 228 | 276 | ||||||
| Deferred income taxes and other liabilities (Notes 6, 9 and 16) | 991 | 921 | ||||||
| Commitments and contingencies (Note 15) | - | - | ||||||
| Redeemable Preferred Stock (Note 10) | - | - | ||||||
| Shareholders' equity: | ||||||||
Common stock at stated value (Note 11): | ||||||||
Class A convertible - 90 and 90 shares outstanding | - | - | ||||||
Class B - 368 and 378 shares outstanding | 3 | 3 | ||||||
Capital in excess of stated value | 4,641 | 3,944 | ||||||
Accumulated other comprehensive income (Note 14) | 149 | 95 | ||||||
Retained earnings | 5,588 | 5,801 | ||||||
| Total shareholders' equity | 10,381 | 9,843 | ||||||
| TOTAL LIABILITIES AND SHAREHOLDERS' EQUITY | $ | 15,465 | $ | 14,998 | ||||
The accompanying notes to consolidated financial statements are an integral part of this statement.
| 40 |
Consolidated Statements of Cash Flows
| Year Ended May 31, | ||||||||||||
| (In millions) | 2012 | 2011 | 2010 | |||||||||
| Cash provided by operations: | ||||||||||||
| Net income | $ | 2,223 | $ | 2,133 | $ | 1,907 | ||||||
| Income charges (credits) not affecting cash: | ||||||||||||
Depreciation | 373 | 335 | 324 | |||||||||
Deferred income taxes | (60 | ) | (76 | ) | 8 | |||||||
Stock-based compensation (Note 11) | 130 | 105 | 159 | |||||||||
Amortization and other | 32 | 23 | 72 | |||||||||
Changes in certain working capital components and other assets and liabilities: | ||||||||||||
(Increase) decrease in accounts receivable | (323 | ) | (273 | ) | 182 | |||||||
(Increase) decrease in inventories | (805 | ) | (551 | ) | 285 | |||||||
(Increase) decrease in prepaid expenses and other current assets | (141 | ) | (35 | ) | (70 | ) | ||||||
Increase (decrease) in accounts payable, accrued liabilities and income taxes payable | 470 | 151 | 297 | |||||||||
| Cash provided by operations | 1,899 | 1,812 | 3,164 | |||||||||
| Cash provided (used) by investing activities: | ||||||||||||
Purchases of short-term investments | (2,705 | ) | (7,616 | ) | (3,724 | ) | ||||||
Maturities of short-term investments | 2,585 | 4,313 | 2,334 | |||||||||
Sales of short-term investments | 1,244 | 2,766 | 453 | |||||||||
Additions to property, plant and equipment | (597 | ) | (432 | ) | (335 | ) | ||||||
Disposals of property, plant and equipment | 2 | 1 | 10 | |||||||||
Increase in other assets, net of other liabilities | (37 | ) | (30 | ) | (11 | ) | ||||||
Settlement of net investment hedges | 22 | (23 | ) | 5 | ||||||||
| Cash provided (used) by investing activities | 514 | (1,021 | ) | (1,268 | ) | |||||||
| Cash used by financing activities: | ||||||||||||
Reductions in long-term debt, including current portion | (203 | ) | (8 | ) | (32 | ) | ||||||
(Decrease) increase in notes payable | (65 | ) | 41 | (205 | ) | |||||||
Proceeds from exercise of stock options and other stock issuances | 468 | 345 | 364 | |||||||||
Excess tax benefits from share-based payment arrangements | 115 | 64 | 58 | |||||||||
Repurchase of common stock | (1,814 | ) | (1,859 | ) | (741 | ) | ||||||
Dividends - common and preferred | (619 | ) | (555 | ) | (505 | ) | ||||||
| Cash used by financing activities | (2,118 | ) | (1,972 | ) | (1,061 | ) | ||||||
| Effect of exchange rate changes | 67 | 57 | (47 | ) | ||||||||
| Net increase (decrease) in cash and equivalents | 362 | (1,124 | ) | 788 | ||||||||
| Cash and equivalents, beginning of year | 1,955 | 3,079 | 2,291 | |||||||||
| CASH AND EQUIVALENTS, END OF YEAR | $ | 2,317 | $ | 1,955 | $ | 3,079 | ||||||
| Supplemental disclosure of cash flow information: | ||||||||||||
| Cash paid during the year for: | ||||||||||||
Interest, net of capitalized interest | $ | 29 | $ | 32 | $ | 48 | ||||||
Income taxes | 638 | 736 | 537 | |||||||||
Dividends declared and not paid | 165 | 145 | 131 | |||||||||
The accompanying notes to consolidated financial statements are an integral part of this statement.
| 41 |
Consolidated Statements of Shareholders' Equity
| Common Stock | Capital in Excess of Stated Value | Accumulated Other Comprehensive Income | Retained Earnings | Total | ||||||||||||||||||||||||||||
| Class A | Class B | |||||||||||||||||||||||||||||||
| (In millions, except per share data) | Shares | Amount | Shares | Amount | ||||||||||||||||||||||||||||
| BALANCE AT MAY 31, 2009 | 95 | $ | - | 390 | $ | 3 | $ | 2,871 | $ | 368 | $ | 5,451 | $ | 8,693 | ||||||||||||||||||
| Stock options exercised | 9 | 380 | 380 | |||||||||||||||||||||||||||||
| Conversion to Class B Common Stock | (5 | ) | 5 | - | ||||||||||||||||||||||||||||
| Repurchase of Class B Common Stock | (11 | ) | (7 | ) | (747 | ) | (754 | ) | ||||||||||||||||||||||||
| Dividends on Common stock ($1.06 per share) | (515 | ) | (515 | ) | ||||||||||||||||||||||||||||
| Issuance of shares to employees | 1 | 40 | 40 | |||||||||||||||||||||||||||||
| Stock-based compensation (Note 11) | 159 | 159 | ||||||||||||||||||||||||||||||
| Forfeiture of shares from employees | - | (2 | ) | (1 | ) | (3 | ) | |||||||||||||||||||||||||
| Comprehensive income: | ||||||||||||||||||||||||||||||||
Net income | 1,907 | 1,907 | ||||||||||||||||||||||||||||||
Other comprehensive income (Notes 14 and 16): | ||||||||||||||||||||||||||||||||
Foreign currency translation and other (net of tax benefit of $72) | (159 | ) | (159 | ) | ||||||||||||||||||||||||||||
Net gain on cash flow hedges (net of tax expense of $28) | 87 | 87 | ||||||||||||||||||||||||||||||
Net gain on net investment hedges (net of tax expense of $21) | 45 | 45 | ||||||||||||||||||||||||||||||
Reclassification to net income of previously deferred net gains related to hedge derivatives (net of tax expense of $42) | (122 | ) | (122 | ) | ||||||||||||||||||||||||||||
Reclassification of ineffective hedge gains to net income (net of tax expense of $1) | (4 | ) | (4 | ) | ||||||||||||||||||||||||||||
| Total comprehensive income | (153 | ) | 1,907 | 1,754 | ||||||||||||||||||||||||||||
| BALANCE AT MAY 31, 2010 | 90 | $ | - | 394 | $ | 3 | $ | 3,441 | $ | 215 | $ | 6,095 | $ | 9,754 | ||||||||||||||||||
| Stock options exercised | 7 | 368 | 368 | |||||||||||||||||||||||||||||
| Repurchase of Class B Common Stock | (24 | ) | (14 | ) | (1,857 | ) | (1,871 | ) | ||||||||||||||||||||||||
| Dividends on Common stock ($1.20 per share) | (569 | ) | (569 | ) | ||||||||||||||||||||||||||||
| Issuance of shares to employees | 1 | 49 | 49 | |||||||||||||||||||||||||||||
| Stock-based compensation (Note 11) | 105 | 105 | ||||||||||||||||||||||||||||||
| Forfeiture of shares from employees | - | (5 | ) | (1 | ) | (6 | ) | |||||||||||||||||||||||||
| Comprehensive income: | ||||||||||||||||||||||||||||||||
Net income | 2,133 | 2,133 | ||||||||||||||||||||||||||||||
Other comprehensive income (Notes 14 and 16): | ||||||||||||||||||||||||||||||||
Foreign currency translation and other (net of tax expense of $121) | 263 | 263 | ||||||||||||||||||||||||||||||
Net loss on cash flow hedges (net of tax benefit of $66) | (242 | ) | (242 | ) | ||||||||||||||||||||||||||||
Net loss on net investment hedges (net of tax benefit of $28) | (57 | ) | (57 | ) | ||||||||||||||||||||||||||||
Reclassification to net income of previously deferred net gains related to hedge derivatives (net of tax expense of $24) | (84 | ) | (84 | ) | ||||||||||||||||||||||||||||
Total comprehensive income | (120 | ) | 2,133 | 2,013 | ||||||||||||||||||||||||||||
| 42 |
| Common Stock | Capital in Excess of Stated Value | Accumulated Other Comprehensive Income | Retained Earnings | Total | ||||||||||||||||||||||||||||
| Class A | Class B | |||||||||||||||||||||||||||||||
| (In millions, except per share data) | Shares | Amount | Shares | Amount | ||||||||||||||||||||||||||||
| BALANCE AT MAY 31, 2011 | 90 | $ | - | 378 | $ | 3 | $ | 3,944 | $ | 95 | $ | 5,801 | $ | 9,843 | ||||||||||||||||||
| Stock options exercised | 9 | 528 | 528 | |||||||||||||||||||||||||||||
| Repurchase of Class B Common Stock | (20 | ) | (12 | ) | (1,793 | ) | (1,805 | ) | ||||||||||||||||||||||||
| Dividends on Common stock ($1.39 per share) | (639 | ) | (639 | ) | ||||||||||||||||||||||||||||
| Issuance of shares to employees | 1 | 57 | 57 | |||||||||||||||||||||||||||||
| Stock-based compensation (Note 11) | 130 | 130 | ||||||||||||||||||||||||||||||
| Forfeiture of shares from employees | - | (6 | ) | (4 | ) | (10 | ) | |||||||||||||||||||||||||
| Comprehensive income: | ||||||||||||||||||||||||||||||||
Net income | 2,223 | 2,223 | ||||||||||||||||||||||||||||||
Other comprehensive income (Notes 14 and 16): | ||||||||||||||||||||||||||||||||
Foreign currency translation and other (net of $0 tax) | (295 | ) | (295 | ) | ||||||||||||||||||||||||||||
Net gain on cash flow hedges (net of tax expense of $8) | 255 | 255 | ||||||||||||||||||||||||||||||
Net gain on net investment hedges (net of $0 tax) | 45 | 45 | ||||||||||||||||||||||||||||||
Reclassification to net income of previously deferred net losses related to hedge derivatives (net of tax benefit of $14) | 49 | 49 | ||||||||||||||||||||||||||||||
| Total comprehensive income | 54 | 2,223 | 2,277 | |||||||||||||||||||||||||||||
| Balance at May 31, 2012 | 90 | $ | - | 368 | $ | 3 | $ | 4,641 | $ | 149 | $ | 5,588 | $ | 10,381 | ||||||||||||||||||
The accompanying notes to consolidated financial statements are an integral part of this statement.
| 43 |
Notes to Consolidated Financial Statements
Note 1 | Summary of Significant Accounting Policies | 45 | ||||
Note 2 | Inventories | 48 | ||||
Note 3 | Property, Plant and Equipment | 49 | ||||
Note 4 | Identifiable Intangible Assets and Goodwill | 49 | ||||
Note 5 | Accrued Liabilities | 50 | ||||
Note 6 | Fair Value Measurements | 50 | ||||
Note 7 | Short-Term Borrowings and Credit Lines | 52 | ||||
Note 8 | Long-Term Debt | 52 | ||||
Note 9 | Income Taxes | 53 | ||||
Note 10 | Redeemable Preferred Stock | 55 | ||||
Note 11 | Common Stock and Stock-Based Compensation | 55 | ||||
Note 12 | Earnings Per Share | 57 | ||||
Note 13 | Benefit Plans | 57 | ||||
Note 14 | Accumulated Other Comprehensive Income | 57 | ||||
Note 15 | Commitments and Contingencies | 57 | ||||
Note 16 | Risk Management and Derivatives | 58 | ||||
Note 17 | Operating Segments and Related Information | 60 |
| 44 |
NOTE 1 - Summary of Significant Accounting Policies
Description of Business
NIKE, Inc. is a worldwide leader in the design, marketing and distribution of athletic and sports-inspired footwear, apparel, equipment, accessories and services. Wholly-owned NIKE subsidiaries include Cole Haan, which designs, markets and distributes dress and casual shoes, handbags, accessories and coats; Converse Inc., which designs, markets and distributes athletic and casual footwear, apparel and accessories; Hurley International LLC, which designs, markets and distributes action sports and youth lifestyle footwear, apparel and accessories; and Umbro International Limited, which designs, distributes and licenses athletic and casual footwear, apparel and equipment, primarily for the sport of football (soccer).
Basis of Consolidation
The consolidated financial statements include the accounts of NIKE, Inc. and its subsidiaries (the "Company"). All significant intercompany transactions and balances have been eliminated.
Recognition of Revenues
Wholesale revenues are recognized when title and the risks and rewards of ownership have passed to the customer, based on the terms of sale. This occurs upon shipment or upon receipt by the customer depending on the country of the sale and the agreement with the customer. Retail store revenues are recorded at the time of sale. Provisions for sales discounts, returns and miscellaneous claims from customers are recorded as a reduction to revenue at the time of sale. As of May 31, 2012 and 2011, the Company's reserve balances for sales discounts, returns and miscellaneous claims were $480 million and $423 million, respectively.
Shipping and Handling Costs
Shipping and handling costs are expensed as incurred and included in cost of sales.
Demand Creation Expense
Demand creation expense consists of advertising and promotion costs, including costs of endorsement contracts, television, digital and print advertising, brand events, and retail brand presentation. Advertising production costs are expensed the first time an advertisement is run. Advertising placement costs are expensed in the month the advertising appears, while costs related to brand events are expensed when the event occurs. Costs related to retail brand presentation are expensed when the presentation is completed and delivered.
A significant amount of the Company's promotional expenses result from payments under endorsement contracts. Accounting for endorsement payments is based upon specific contract provisions. Generally, endorsement payments are expensed on a straight-line basis over the term of the contract after giving recognition to periodic performance compliance provisions of the contracts. Prepayments made under contracts are included in prepaid expenses or other assets depending on the period to which the prepayment applies.
Some of the contracts provide for contingent payments to endorsers based upon specific achievements in their sports (e.g., winning a championship). The Company records selling and administrative expense for these amounts when the endorser achieves the specific goal.
Some of the contracts provide for payments based upon endorsers maintaining a level of performance in their sport over an extended period of time (e.g., maintaining a top ranking in a sport for a year). These amounts are recorded in selling and administrative expense when the Company determines that it is probable that the specified level of performance will be maintained throughout the period. In these instances, to the extent that actual payments to the endorser differ from our estimate due to changes in the endorser's athletic performance, increased or decreased selling and administrative expense may be recorded in a future period.
Some of the contracts provide for royalty payments to endorsers based upon a predetermined percentage of sales of particular products. The Company expenses these payments in cost of sales as the related sales occur. In certain contracts, the Company offers minimum guaranteed royalty payments. For contractual obligations for which the Company estimates it will not meet the minimum guaranteed amount of royalty fees through sales of product, the Company records the amount of the guaranteed payment in excess of that earned through sales of product in selling and administrative expense uniformly over the remaining guarantee period.
Through cooperative advertising programs, the Company reimburses retail customers for certain costs of advertising the Company's products. The Company records these costs in selling and administrative expense at the point in time when it is obligated to its customers for the costs, which is when the related revenues are recognized. This obligation may arise prior to the related advertisement being run.
Total advertising and promotion expenses were $2,711 million, $2,448 million, and $2,356 million for the years ended May 31, 2012, 2011 and 2010, respectively. Prepaid advertising and promotion expenses recorded in prepaid expenses and other assets totaled $309 million and $291 million at May 31, 2012 and 2011, respectively.
Cash and Equivalents
Cash and equivalents represent cash and short-term, highly liquid investments with maturities of three months or less at date of purchase. The carrying amounts reflected in the consolidated balance sheets for cash and equivalents approximate fair value.
Short-Term Investments
Short-term investments consist of highly liquid investments, including commercial paper, U.S. treasury, U.S. agency, and corporate debt securities, with maturities over three months from the date of purchase. Debt securities that the Company has the ability and positive intent to hold to maturity are carried at amortized cost. At May 31, 2012 and 2011, the Company did not hold any short-term investments that were classified as trading or held-to-maturity.
At May 31, 2012 and 2011, short-term investments consisted of available-for-sale securities. Available-for-sale securities are recorded at fair value with unrealized gains and losses reported, net of tax, in other comprehensive income, unless unrealized losses are determined to be other than temporary. Realized gains and losses on the sale of securities are determined by specific identification. The Company considers all available-for-sale securities, including those with maturity dates beyond 12 months, as available to support current operational liquidity needs and therefore classifies all securities with maturity dates beyond three months at the date of purchase as current assets within short-term investments on the consolidated balance sheets.
See Note 6 - Fair Value Measurements for more information on the Company's short-term investments.
Allowance for Uncollectible Accounts Receivable
Accounts receivable consists primarily of amounts receivable from customers. We make ongoing estimates relating to the collectability of our
| 45 |
accounts receivable and maintain an allowance for estimated losses resulting from the inability of our customers to make required payments. In determining the amount of the allowance, we consider our historical level of credit losses and make judgments about the creditworthiness of significant customers based on ongoing credit evaluations. Accounts receivable with anticipated collection dates greater than 12 months from the balance sheet date and related allowances are considered non-current and recorded in other assets. The allowance for uncollectible accounts receivable was $95 million and $124 million at May 31, 2012 and 2011, respectively, of which $45 million and $50 million, respectively, was classified as long-term and recorded in other assets.
Inventory Valuation
Inventories are stated at lower of cost or market and valued on an average cost basis.
Property, Plant and Equipment and Depreciation
Property, plant and equipment are recorded at cost. Depreciation for financial reporting purposes is determined on a straight-line basis for buildings and leasehold improvements over 2 to 40 years and for machinery and equipment over 2 to 15 years.
Depreciation and amortization of assets used in manufacturing, warehousing and product distribution are recorded in cost of sales. Depreciation and amortization of other assets are recorded in selling and administrative expense.
Software Development Costs
Internal Use Software . Expenditures for major software purchases and software developed for internal use are capitalized and amortized over a 2 to 10 year period on a straight-line basis. The Company's policy provides for the capitalization of external direct costs of materials and services associated with developing or obtaining internal use computer software. In addition, the Company also capitalizes certain payroll and payroll-related costs for employees who are directly associated with internal use computer software projects. The amount of capitalizable payroll costs with respect to these employees is limited to the time directly spent on such projects. Costs associated with preliminary project stage activities, training, maintenance and all other post-implementation stage activities are expensed as incurred.
Computer Software to be Sold, Leased or Otherwise Marketed . Development costs of computer software to be sold, leased, or otherwise marketed as an integral part of a product are subject to capitalization beginning when a product's technological feasibility has been established and ending when a product is available for general release to customers. In most instances, the Company's products are released soon after technological feasibility has been established. Therefore, costs incurred subsequent to achievement of technological feasibility are usually not significant, and generally most software development costs have been expensed as incurred.
Impairment of Long-Lived Assets
The Company reviews the carrying value of long-lived assets or asset groups to be used in operations whenever events or changes in circumstances indicate that the carrying amount of the assets might not be recoverable. Factors that would necessitate an impairment assessment include a significant adverse change in the extent or manner in which an asset is used, a significant adverse change in legal factors or the business climate that could affect the value of the asset, or a significant decline in the observable market value of an asset, among others. If such facts indicate a potential impairment, the Company would assess the recoverability of an asset group by determining if the carrying value of the asset group exceeds the sum of the projected undiscounted cash flows expected to result from the use and eventual disposition of the assets over the remaining economic life of the primary asset in the asset group. If the recoverability test indicates that the carrying value of the asset group is not recoverable, the Company will estimate the fair value of the asset group using appropriate valuation methodologies, which would typically include an estimate of discounted cash flows. Any impairment would be measured as the difference between the asset group's carrying amount and its estimated fair value.
Identifiable Intangible Assets and Goodwill
The Company performs annual impairment tests on goodwill and intangible assets with indefinite lives in the fourth quarter of each fiscal year, or when events occur or circumstances change that would, more likely than not, reduce the fair value of a reporting unit or an intangible asset with an indefinite life below its carrying value. Events or changes in circumstances that may trigger interim impairment reviews include significant changes in business climate, operating results, planned investments in the reporting unit, planned divestitures or an expectation that the carrying amount may not be recoverable, among other factors. The impairment test requires the Company to estimate the fair value of its reporting units. If the carrying value of a reporting unit exceeds its fair value, the goodwill of that reporting unit is potentially impaired and the Company proceeds to step two of the impairment analysis. In step two of the analysis, the Company measures and records an impairment loss equal to the excess of the carrying value of the reporting unit's goodwill over its implied fair value if any.
The Company generally bases its measurement of the fair value of a reporting unit on a blended analysis of the present value of future discounted cash flows and the market valuation approach. The discounted cash flows model indicates the fair value of the reporting unit based on the present value of the cash flows that the Company expects the reporting unit to generate in the future. The Company's significant estimates in the discounted cash flows model include: its weighted average cost of capital; long-term rate of growth and profitability of the reporting unit's business; and working capital effects. The market valuation approach indicates the fair value of the business based on a comparison of the reporting unit to comparable publicly traded companies in similar lines of business. Significant estimates in the market valuation approach model include identifying similar companies with comparable business factors such as size, growth, profitability, risk and return on investment, and assessing comparable revenue and operating income multiples in estimating the fair value of the reporting unit.
Indefinite-lived intangible assets primarily consist of acquired trade names and trademarks. In measuring the fair value for these intangible assets, the Company utilizes the relief-from-royalty method. This method assumes that trade names and trademarks have value to the extent that their owner is relieved of the obligation to pay royalties for the benefits received from them. This method requires the Company to estimate the future revenue for the related brands, the appropriate royalty rate and the weighted average cost of capital.
On May 31, 2012, the Company announced its intention to divest of the Cole Haan and Umbro businesses. As of May 31, 2012, Cole Haan had no goodwill or indefinite-lived intangible assets on the Company's balance sheet, while Umbro had $70 million of goodwill and $164 million of trademark and other intangible assets. As of May 31, 2012, both asset groups for Cole Haan and Umbro did not quality as "assets-held-for-sale" under applicable accounting guidance. The decision to divest these businesses was deemed a triggering event to perform an impairment analysis of Umbro's intangible assets at that date and was considered in the Company's fourth quarter impairment analysis. The Company is currently in the process of preparing the businesses for divestiture and identifying potential acquirers. Therefore, the Company believes the weighted use of discounted cash flows and the market valuation approach is the best method for determining the fair value of the Umbro reporting unit because these are the most common valuation methodologies used within its industry; and the blended use of both models compensates for the inherent risks associated with either model if used on a stand-alone basis. As discussed above, the asset groups for Umbro did not qualify as "assets-held-for-sale"; therefore, the Company did not consider potential disposition costs or cumulative translation adjustments in the carrying value of the Umbro reporting unit in its fiscal 2012 fourth quarter impairment analysis. Because the Company is still in the preliminary stages of
| 46 |
the divestiture process and has not yet identified potential acquirers or the likely deal structure, these methods represent management's best estimate of the fair value of the Umbro business. The Company's analysis determined there was no impairment of intangible assets or goodwill related to Umbro. If the sales process indicates a fair value that is below the current carrying value of the reporting unit, an analysis would be required to determine if impairment charges exist at that point.
Operating Leases
The Company leases retail store space, certain distribution and warehouse facilities and office space under operating leases. Operating lease agreements may contain rent escalation clauses, rent holidays or certain landlord incentives, including tenant improvement allowances. Rent expense for non-cancelable operating leases with scheduled rent increases or landlord incentives are recognized on a straight-line basis over the lease term, beginning with the effective lease commencement date, which is generally the date in which the Company takes possession of or controls the physical use of the property. Certain leases also provide for contingent rents, which are determined as a percentage of sales in excess of specified levels. A contingent rent liability is recognized together with the corresponding rent expense when specified levels have been achieved or when the Company determines that achieving the specified levels during the period is probable.
Fair Value Measurements
The Company measures certain financial assets and liabilities at fair value on a recurring basis, including derivatives and available-for-sale securities. Fair value is the price the Company would receive to sell an asset or pay to transfer a liability in an orderly transaction with a market participant at the measurement date. The Company uses a three-level hierarchy established by the FASB that prioritizes fair value measurements based on the types of inputs used for the various valuation techniques (market approach, income approach, and cost approach).
The levels of hierarchy are described below:
| • | Level 1: Observable inputs such as quoted prices in active markets for identical assets or liabilities. |
| • | Level 2: Inputs other than quoted prices that are observable for the asset or liability, either directly or indirectly; these include quoted prices for similar assets or liabilities in active markets and quoted prices for identical or similar assets or liabilities in markets that are not active. |
| • | Level 3: Unobservable inputs in which there is little or no market data available, which require the reporting entity to develop its own assumptions. |
The Company's assessment of the significance of a particular input to the fair value measurement in its entirety requires judgment and considers factors specific to the asset or liability. Financial assets and liabilities are classified in their entirety based on the most conservative level of input that is significant to the fair value measurement.
Pricing vendors are utilized for certain Level 1 or Level 2 investments. These vendors either provide a quoted market price in an active market or use observable inputs without applying significant adjustments in their pricing. Observable inputs include broker quotes, interest rates and yield curves observable at commonly quoted intervals, volatilities and credit risks. The Company's fair value processes include controls that are designed to ensure appropriate fair values are recorded. These controls include an analysis of period-over-period fluctuations and comparison to another independent pricing vendor.
Refer to Note 6 - Fair Value Measurements for additional information.
Foreign Currency Translation and Foreign Currency Transactions
Adjustments resulting from translating foreign functional currency financial statements into U.S. Dollars are included in the foreign currency translation adjustment, a component of accumulated other comprehensive income in shareholders' equity.
The Company's global subsidiaries have various assets and liabilities, primarily receivables and payables, which are denominated in currencies other than their functional currency. These balance sheet items are subject to remeasurement, the impact of which is recorded in other expense (income), net, within the consolidated statements of income.
Accounting for Derivatives and Hedging Activities
The Company uses derivative financial instruments to limit exposure to changes in foreign currency exchange rates and interest rates. All derivatives are recorded at fair value on the balance sheet and changes in the fair value of derivative financial instruments are either recognized in other comprehensive income (a component of shareholders' equity), debt or net income depending on the nature of the underlying exposure, whether the derivative is formally designated as a hedge, and, if designated, the extent to which the hedge is effective. The Company classifies the cash flows at settlement from derivatives in the same category as the cash flows from the related hedged items. For undesignated hedges and designated cash flow hedges, this is within the cash provided by operations component of the consolidated statements of cash flows. For designated net investment hedges, this is generally within the cash provided or used by investing activities component of the cash flow statement. As our fair value hedges are receive-fixed, pay-variable interest rate swaps, the cash flows associated with these derivative instruments are periodic interest payments while the swaps are outstanding. These cash flows are reflected within the cash provided by operations component of the cash flow statement.
See Note 16 - Risk Management and Derivatives for more information on the Company's risk management program and derivatives.
Stock-Based Compensation
The Company estimates the fair value of options and stock appreciation rights granted under the NIKE, Inc. 1990 Stock Incentive Plan (the "1990 Plan") and employees' purchase rights under the Employee Stock Purchase Plans ("ESPPs") using the Black-Scholes option pricing model. The Company recognizes this fair value, net of estimated forfeitures, as selling and administrative expense in the consolidated statements of income over the vesting period using the straight-line method.
See Note 11 - Common Stock and Stock-Based Compensation for more information on the Company's stock programs.
Income Taxes
The Company accounts for income taxes using the asset and liability method. This approach requires the recognition of deferred tax assets and liabilities for the expected future tax consequences of temporary differences between the carrying amounts and the tax basis of assets and liabilities. The Company records a valuation allowance to reduce deferred tax assets to the amount management believes is more likely than not to be realized. United States income taxes are provided currently on financial statement earnings of non-U.S. subsidiaries that are expected to be repatriated. The Company determines annually the amount of undistributed non-U.S. earnings to invest indefinitely in its non-U.S. operations.
The Company recognizes a tax benefit from uncertain tax positions in the financial statements only when it is more likely than not that the position will be sustained upon examination by relevant tax authorities. The Company recognizes interest and penalties related to income tax matters in income tax expense.
See Note 9 - Income Taxes for further discussion.
| 47 |
Earnings Per Share
Basic earnings per common share is calculated by dividing net income by the weighted average number of common shares outstanding during the year. Diluted earnings per common share is calculated by adjusting weighted average outstanding shares, assuming conversion of all potentially dilutive stock options and awards.
See Note 12 - Earnings Per Share for further discussion.
Management Estimates
The preparation of financial statements in conformity with generally accepted accounting principles requires management to make estimates, including estimates relating to assumptions that affect the reported amounts of assets and liabilities and disclosure of contingent assets and liabilities at the date of financial statements and the reported amounts of revenues and expenses during the reporting period. Actual results could differ from these estimates.
Recently Adopted Accounting Standards
In April 2011, the Financial Accounting Standards Board ("FASB") issued new guidance to achieve common fair value measurement and disclosure requirements between U.S. GAAP and International Financial Reporting Standards. This new guidance, which became effective for the Company beginning March 1, 2012, amends current U.S. GAAP fair value measurement and disclosure guidance to include increased transparency around valuation inputs and investment categorization. The adoption did not have a material impact on the Company's consolidated financial position or results of operations.
In January 2010, the FASB issued guidance to amend the disclosure requirements related to recurring and nonrecurring fair value measurements. The guidance requires additional disclosures about the different classes of assets and liabilities measured at fair value, the valuation techniques and inputs used, the activity in Level 3 fair value measurements, and the transfers between Levels 1, 2, and 3 of the fair value measurement hierarchy (as described in Note 6. -Fair Value Measurements). This guidance became effective for the Company beginning March 1, 2010, except for disclosures relating to purchases, sales, issuances and settlements of Level 3 assets and liabilities, which became effective for the Company beginning June 1, 2011. As this guidance only requires expanded disclosures, the adoption did not have an impact on the Company's consolidated financial position or results of operations.
In October 2009, the FASB issued new standards that revised the guidance for revenue recognition with multiple deliverables. These new standards impact the determination of when the individual deliverables included in a multiple-element arrangement may be treated as separate units of accounting. Additionally, these new standards modify the manner in which the transaction consideration is allocated across the separately identified deliverables by no longer permitting the residual method of allocating arrangement consideration. These new standards became effective for the Company beginning June 1, 2011. The adoption did not have a material impact on the Company's consolidated financial position or results of operations.
Recently Issued Accounting Standards
In December 2011, the FASB issued guidance enhancing disclosure requirements surrounding the nature of an entity's right to offset and related arrangements associated with its financial instruments and derivative instruments. This new guidance requires companies to disclose both gross and net information about instruments and transactions eligible for offset in the statement of financial position and instruments and transactions subject to master netting arrangements. This new guidance is effective for the Company beginning June 1, 2013. As this guidance only requires expanded disclosures, the Company does not anticipate the adoption will have an impact on its consolidated financial position or results of operations.
In September 2011, the FASB issued updated guidance on the periodic testing of goodwill for impairment. This guidance will allow companies to assess qualitative factors to determine if it is more-likely-than-not that goodwill might be impaired and whether it is necessary to perform the two-step goodwill impairment test required under current accounting standards. This new guidance is effective for the Company beginning June 1, 2012. The Company does not expect the adoption will have a material effect on its consolidated financial position or results of operations.
In June 2011, the FASB issued guidance on the presentation of comprehensive income. This new guidance eliminates the current option to report other comprehensive income and its components in the statement of shareholders' equity. Companies will now be required to present the components of net income and other comprehensive income in either one continuous statement, referred to as the statement of comprehensive income, or in two separate, but consecutive statements. This guidance also required companies to present reclassification adjustments out of accumulated other comprehensive income by component in both the statement in which net income is presented and the statement in which other comprehensive income is presented. However, in December 2011, the FASB issued guidance which indefinitely defers the requirement related to the presentation of reclassification adjustments. Both issuances on the presentation of comprehensive income are effective for the Company beginning June 1, 2012. As this guidance only amends the presentation of the components of comprehensive income, the Company does not anticipate the adoption will have an impact on its consolidated financial position or results of operations.
| NOTE 2 - Inventories |
Inventory balances of $3,350 million and $2,715 million at May 31, 2012 and 2011, respectively, were substantially all finished goods.
| 48 |
NOTE 3 - Property, Plant and Equipment
Property, plant and equipment included the following:
| As of May 31, | ||||||||
| (In millions) | 2012 | 2011 | ||||||
| Land | $ | 252 | $ | 237 | ||||
| Buildings | 1,158 | 1,124 | ||||||
| Machinery, equipment and internal-use software | 2,755 | 2,487 | ||||||
| Leasehold improvements | 968 | 931 | ||||||
| Construction in process | 111 | 127 | ||||||
| Total property, plant and equipment, gross | 5,244 | 4,906 | ||||||
| Less accumulated depreciation | 2,965 | 2,791 | ||||||
| TOTAL PROPERTY, PLANT AND EQUIPMENT, NET | $ | 2,279 | $ | 2,115 | ||||
Capitalized interest was not material for the years ended May 31, 2012, 2011, and 2010.
NOTE 4 - Identifiable Intangible Assets and Goodwill
The following table summarizes the Company's identifiable intangible asset balances as of May 31, 2012 and 2011:
| May 31, 2012 | May 31, 2011 | |||||||||||||||||||||||
| (In millions) | Gross Carrying Amount | Accumulated Amortization | Net Carrying Amount | Gross Carrying Amount | Accumulated Amortization | Net Carrying Amount | ||||||||||||||||||
| Amortized intangible assets: | ||||||||||||||||||||||||
Patents | $ | 99 | $ | (29 | ) | $ | 70 | $ | 80 | $ | (24 | ) | $ | 56 | ||||||||||
Trademarks | 41 | (26 | ) | 15 | 44 | (25 | ) | 19 | ||||||||||||||||
Other | 94 | (30 | ) | 64 | 47 | (22 | ) | 25 | ||||||||||||||||
| TOTAL | $ | 234 | $ | (85 | ) | $ | 149 | $ | 171 | $ | (71 | ) | $ | 100 | ||||||||||
Unamortized intangible assets - Trademarks | 386 | 387 | ||||||||||||||||||||||
IDENTIFIABLE INTANGIBLE ASSETS, NET | $ | 535 | $ | 487 | ||||||||||||||||||||
The effect of foreign exchange fluctuations for the year ended May 31, 2012 decreased unamortized intangible assets by approximately $2 million, resulting from the strengthening of the U.S. Dollar in relation to the British Pound.
Amortization expense, which is included in selling and administrative expense, was $22 million, $16 million, and $14 million for the years ended May 31, 2012, 2011, and 2010, respectively. The estimated amortization expense for intangible assets subject to amortization for each of the years ending May 31, 2013 through May 31, 2017 are as follows: 2013: $21 million; 2014: $19 million; 2015: $15 million; 2016: $14 million; 2017: $13 million.
All goodwill balances are included in the Company's "Other" category for segment reporting purposes. The following table summarizes the Company's goodwill balance as of May 31, 2012 and 2011:
| (In millions) | Goodwill | Accumulated Impairment | Goodwill, net | |||||||||
| May 31, 2010 | $ | 387 | $ | (199 | ) | $ | 188 | |||||
| Umbro France (1) | 10 | - | 10 | |||||||||
| Other (2) | 7 | - | 7 | |||||||||
| May 31, 2011 | 404 | (199 | ) | 205 | ||||||||
| Other (2) | (4 | ) | - | (4 | ) | |||||||
| MAY 31, 2012 | $ | 400 | $ | (199 | ) | $ | 201 | |||||
| (1) | In March 2011, Umbro acquired the remaining 51% of the exclusive licensee and distributor of the Umbro brand in France for approximately $15 million. |
| (2) | Other consists of foreign currency translation adjustments on Umbro goodwill. |
| 49 |
NOTE 5 - Accrued Liabilities
Accrued liabilities included the following:
| May 31, | ||||||||
| (In millions) | 2012 | 2011 | ||||||
| Compensation and benefits, excluding taxes | $ | 711 | $ | 628 | ||||
| Endorsement compensation | 294 | 284 | ||||||
| Taxes other than income taxes | 179 | 214 | ||||||
| Dividends payable | 165 | 145 | ||||||
| Import and logistics costs | 133 | 98 | ||||||
| Advertising and marketing | 132 | 139 | ||||||
| Fair value of derivatives | 55 | 186 | ||||||
| Other (1) | 384 | 291 | ||||||
| TOTAL ACCRUED LIABILITIES | $ | 2,053 | $ | 1,985 | ||||
| (1) | Other consists of various accrued expenses with no individual item accounting for more than 5% of the balance at May 31, 2012 and 2011. |
NOTE 6 - Fair Value Measurements
The following table presents information about the Company's financial assets and liabilities measured at fair value on a recurring basis as of May 31, 2012 and 2011, and indicates the fair value hierarchy of the valuation techniques utilized by the Company to determine such fair value. Refer to Note 1 – Summary of Significant Accounting Policies for additional detail regarding the Company's fair value measurement methodology.
| May 31, 2012 | ||||||||||||||||||
Fair Value Measurements Using | Assets/Liabilities at Fair Value | |||||||||||||||||
| (In millions) | Level 1 | Level 2 | Level 3 | Balance Sheet Classification | ||||||||||||||
| ASSETS | ||||||||||||||||||
| Derivatives: | ||||||||||||||||||
Foreign exchange forwards and options | $ | - | $ | 265 | $ | - | $ | 265 | Other current assets and other long-term assets | |||||||||
Embedded derivatives | - | 1 | - | 1 | Other current assets | |||||||||||||
Interest rate swap contracts | - | 15 | - | 15 | Other current assets and other long-term assets | |||||||||||||
| Total derivatives | - | 281 | - | 281 | ||||||||||||||
| Available-for-sale securities: | ||||||||||||||||||
U.S. Treasury securities | 226 | - | - | 226 | Cash and equivalents | |||||||||||||
U.S. Agency securities | - | 254 | - | 254 | Cash and equivalents | |||||||||||||
Commercial paper and bonds | - | 159 | - | 159 | Cash and equivalents | |||||||||||||
Money market funds | - | 770 | - | 770 | Cash and equivalents | |||||||||||||
U.S. Treasury securities | 927 | - | - | 927 | Short-term investments | |||||||||||||
U.S. Agency securities | - | 230 | - | 230 | Short-term investments | |||||||||||||
Commercial paper and bonds | - | 283 | - | 283 | Short-term investments | |||||||||||||
Non-marketable preferred stock | - | - | 3 | 3 | Other long-term assets | |||||||||||||
| Total available-for-sale securities | 1,153 | 1,696 | 3 | 2,852 | ||||||||||||||
| TOTAL ASSETS | $ | 1,153 | $ | 1,977 | $ | 3 | $ | 3,133 | ||||||||||
| LIABILITIES | ||||||||||||||||||
| Derivatives: | ||||||||||||||||||
| Foreign exchange forwards and options | $ | - | $ | 55 | $ | - | $ | 55 | Accrued liabilities and other long-term liabilities | |||||||||
| TOTAL LIABILITIES | $ | - | $ | 55 | $ | - | $ | 55 | ||||||||||
| 50 |
| May 31, 2011 | ||||||||||||||||||||
Fair Value Measurements Using | Assets / Liabilities at Fair Value | |||||||||||||||||||
| (In millions) | Level 1 | Level 2 | Level 3 | Balance Sheet Classification | ||||||||||||||||
ASSETS | ||||||||||||||||||||
| Derivatives: | ||||||||||||||||||||
Foreign exchange forwards and options | $ | - | $ | 38 | $ | - | $ | 38 | Other current assets and other long-term assets | |||||||||||
Interest rate swap contracts | - | 15 | - | 15 | Other current assets and other long-term assets | |||||||||||||||
| Total derivatives | - | 53 | - | 53 | ||||||||||||||||
| Available-for-sale securities: | ||||||||||||||||||||
U.S. Treasury securities | 125 | - | - | 125 | Cash and equivalents | |||||||||||||||
Commercial paper and bonds | - | 157 | - | 157 | Cash and equivalents | |||||||||||||||
Money market funds | - | 780 | - | 780 | Cash and equivalents | |||||||||||||||
U.S. Treasury securities | 1,473 | - | - | 1,473 | Short-term investments | |||||||||||||||
U.S. Agency securities | - | 308 | - | 308 | Short-term investments | |||||||||||||||
Commercial paper and bonds | - | 802 | - | 802 | Short-term investments | |||||||||||||||
| Total available-for-sale securities | 1,598 | 2,047 | - | 3,645 | ||||||||||||||||
| TOTAL ASSETS | $ | 1,598 | $ | 2,100 | $ | - | $ | 3,698 | ||||||||||||
| LIABILITIES | ||||||||||||||||||||
| Derivatives: | ||||||||||||||||||||
Foreign exchange forwards and options | $ | - | $ | 197 | $ | - | $ | 197 | Accrued liabilities and other long-term liabilities | |||||||||||
| TOTAL LIABILITIES | $ | - | $ | 197 | $ | - | $ | 197 | ||||||||||||
Derivative financial instruments include foreign exchange forwards, embedded derivatives and interest rate swap contracts. The fair value of derivative contracts is determined using observable market inputs such as the daily market foreign currency rates, forward pricing curves, currency volatilities, currency correlations and interest rates, and considers nonperformance risk of the Company and that of its counterparties. Adjustments relating to these nonperformance risks were not material at May 31, 2012 or 2011. Refer to Note 16 - Risk Management and Derivatives for additional detail.
Available-for-sale securities are comprised of investments in U.S. Treasury and agency securities, money market funds, corporate commercial paper and bonds. These securities are valued using market prices on both active markets (Level 1) and less active markets (Level 2). Pricing vendors are utilized for certain Level 1 or Level 2 investments. These vendors either provide a quoted market price in an active market or use observable inputs without applying significant adjustments in their pricing. Observable inputs include broker quotes, interest rates and yield curves observable at commonly quoted intervals, volatilities and credit risks.
The Company's Level 3 assets are comprised of investments in certain non-marketable preferred stock. These investments are valued using internally developed models with unobservable inputs. These Level 3 investments are an immaterial portion of our portfolio. Changes in Level 3 investment assets were immaterial during the year ended May 31, 2012. As of May 31, 2011, the Company had no Level 3 assets and liabilities.
No transfers among the levels within the fair value hierarchy occurred during the years ended May 31, 2012 or 2011.
As of May 31, 2012 and 2011, the Company had no assets or liabilities that were required to be measured at fair value on a non-recurring basis.
Short-Term Investments
As of May 31, 2012 and 2011, short-term investments consisted of available-for-sale securities. As of May 31, 2012, the Company held $1,129 million of available-for-sale securities with maturity dates within one year from purchase date and $311 million with maturity dates over one year and less than five years from purchase date within short-term investments. As of May 31, 2011, the Company held $2,253 million of available-for-sale securities with maturity dates within one year from purchase date and $330 million with maturity dates over one year and less than five years from purchase date within short-term investments.
Short-term investments classified as available-for-sale consist of the following at fair value:
| As of May 31, | ||||||||
| (In millions) | 2012 | 2011 | ||||||
| Available-for-sale investments: | ||||||||
U.S. treasury and agencies | $ | 1,157 | $ | 1,781 | ||||
Commercial paper and bonds | 283 | 802 | ||||||
| TOTAL AVAILABLE-FOR-SALE INVESTMENTS | $ | 1,440 | $ | 2,583 | ||||
Included in interest expense, net was interest income of $30 million for each of the years ended May 31, 2012, 2011, and 2010, related to cash and equivalents and short-term investments.
For fair value information regarding notes payable and long-term debt, refer to Note 7 - Short-Term Borrowings and Credit Lines and Note 8 - Long-Term Debt.
| 51 |
NOTE 7 - Short-Term Borrowings and Credit Lines
Notes payable and interest-bearing accounts payable to Sojitz Corporation of America ("Sojitz America") as of May 31, 2012 and 2011, are summarized below:
| May 31, | ||||||||||||||||
| 2012 | 2011 | |||||||||||||||
| (In millions) | Borrowings | Interest Rate | Borrowings | Interest Rate | ||||||||||||
| Notes payable: | ||||||||||||||||
U.S. operations | 30 | 5.50 | % (1) | 35 | 0.00 | % (1) | ||||||||||
Non-U.S. operations | 78 | 9.46 | % (1) | 152 | 7.05 | % (1) | ||||||||||
| TOTAL NOTES PAYABLE | $ | 108 | $ | 187 | ||||||||||||
| Interest-Bearing Accounts Payable: | ||||||||||||||||
| Sojitz America | $ | 75 | 1.10 | % | $ | 111 | 0.99 | % | ||||||||
| (1) | Weighted average interest rate includes non-interest bearing overdrafts. |
The carrying amounts reflected in the consolidated balance sheets for notes payable approximate fair value.
The Company purchases through Sojitz America certain athletic footwear, apparel and equipment it acquires from non-U.S. suppliers. These purchases are for the Company's operations outside of the United States, Europe and Japan. Accounts payable to Sojitz America are generally due up to 60 days after shipment of goods from the foreign port. The interest rate on such accounts payable is the 60-day London Interbank Offered Rate ("LIBOR") as of the beginning of the month of the invoice date, plus 0.75%.
As of May 31, 2012 and 2011, the Company had no amounts outstanding under its commercial paper program.
In November 2011, the Company entered into a committed credit facility agreement with a syndicate of banks which provides for up to $1 billion of borrowings pursuant to a revolving credit facility with the option to increase borrowings to $1.5 billion with lender approval. The facility matures in November 2016, with a one-year extension option prior to both the second and third anniversary of the closing date, provided that extensions shall not extend beyond November 1, 2018. This facility replaces the prior $1 billion committed credit facility agreement that would have expired in December 2012. Based on the Company's current long-term senior unsecured debt ratings of A+ and A1 from Standard and Poor's Corporation and Moody's Investor Services, respectively, the interest rate charged on any outstanding borrowings would be the prevailing LIBOR plus 0.56%. The facility fee is 0.065% of the total commitment. Under this committed credit facility, the Company must maintain, among other things, certain minimum specified financial ratios with which the Company was in compliance at May 31, 2012. No amounts were outstanding under this facility as of May 31, 2012 or 2011.
NOTE 8 - Long-Term Debt
Long-term debt, net of unamortized premiums and discounts and swap fair value adjustments, is comprised of the following:
| Book Value Outstanding As of May 31, | ||||||||||||||||||||
| Scheduled Maturity (Dollars in millions) | Original Principal | Interest Rate | Interest Payments | 2012 | 2011 | |||||||||||||||
| Corporate Bond Payables: (1) | ||||||||||||||||||||
July 23, 2012 | $ | 25 | 5.66 | % | Semi-Annually | $ | 25 | $ | 26 | |||||||||||
August 7, 2012 | $ | 15 | 5.40 | % | Semi-Annually | 15 | 16 | |||||||||||||
October 1, 2013 | $ | 50 | 4.70 | % | Semi-Annually | 50 | 50 | |||||||||||||
October 15, 2015 | $ | 100 | 5.15 | % | Semi-Annually | 115 | 114 | |||||||||||||
| Japanese Yen Notes: | ||||||||||||||||||||
June 26, 2011 | ¥ | 10,500 | 4.30 | % | Semi-Annually | - | 130 | |||||||||||||
February 14, 2012 | ¥ | 5,000 | 1.52 | % | Semi-Annually | - | 62 | |||||||||||||
August 20, 2001 through November 20, 2020 (2) | ¥ | 9,000 | 2.60 | % | Quarterly | 50 | 54 | |||||||||||||
August 20, 2001 through November 20, 2020 (2) | ¥ | 4,000 | 2.00 | % | Quarterly | 22 | 24 | |||||||||||||
Total | 277 | 476 | ||||||||||||||||||
Less current maturities | 49 | 200 | ||||||||||||||||||
TOTAL LONG-TERM DEBT | $ | 228 | $ | 276 | ||||||||||||||||
| (1) | For each of these notes, except the $50 million note maturing in October 1, 2013, the Company has entered into interest rate swap agreements whereby the Company receives fixed interest payments at the same rate as the notes and pays variable interest payments based on the six-month LIBOR plus a spread. Each swap has the same notional amount and maturity date as the corresponding note. At May 31, 2012, the interest rates payable on these swap agreements ranged from approximately 0.6% to 1.0%. |
| (2) | NIKE Logistics YK assumed a total of ¥13.0 billion in loans as part of its agreement to purchase a distribution center in Japan, which serves as collateral for the loans. These loans mature in equal quarterly installments during the period August 20, 2001 through November 20, 2020. |
The scheduled maturity of long-term debt in each of the years ending May 31, 2013 through 2017 are $49 million, $59 million, $9 million, $109 million and $9 million, respectively, at face value.
The fair value of the Company's long-term debt, including the current portion, was approximately $283 million at May 31, 2012 and $482 million at May 31, 2011. The fair value of long-term debt is estimated based upon quoted prices of similar instruments (level 2).
| 52 |
NOTE 9 - Income Taxes
Income before income taxes is as follows:
| Year Ended May 31, | ||||||||||||
| (In millions) | 2012 | 2011 | 2010 | |||||||||
| Income before income taxes: | ||||||||||||
United States | $ | 792 | $ | 1,084 | $ | 699 | ||||||
Foreign | 2,191 | 1,760 | 1,818 | |||||||||
| TOTAL INCOME BEFORE INCOME TAXES | $ | 2,983 | $ | 2,844 | $ | 2,517 | ||||||
The provision for income taxes is as follows:
| Year Ended May 31, | ||||||||||||
| (In millions) | 2012 | 2011 | 2010 | |||||||||
| Current: | ||||||||||||
United States | ||||||||||||
Federal | $ | 274 | $ | 289 | $ | 200 | ||||||
State | 51 | 57 | 50 | |||||||||
Foreign | 495 | 441 | 349 | |||||||||
| Total | 820 | 787 | 599 | |||||||||
| Deferred: | ||||||||||||
United States | ||||||||||||
Federal | (54 | ) | (61 | ) | 18 | |||||||
State | 4 | - | (1 | ) | ||||||||
Foreign | (10 | ) | (15 | ) | (6 | ) | ||||||
| Total | (60 | ) | (76 | ) | 11 | |||||||
| TOTAL INCOME TAX EXPENSE | $ | 760 | $ | 711 | $ | 610 | ||||||
A reconciliation from the U.S. statutory federal income tax rate to the effective income tax rate follows:
| Year Ended May 31, | ||||||||||||
| 2012 | 2011 | 2010 | ||||||||||
| Federal income tax rate | 35.0 | % | 35.0 | % | 35.0 | % | ||||||
| State taxes, net of federal benefit | 1.3 | % | 1.3 | % | 1.3 | % | ||||||
| Foreign earnings | -11.5 | % | -10.5 | % | -12.7 | % | ||||||
| Other, net | 0.7 | % | -0.8 | % | 0.6 | % | ||||||
| EFFECTIVE INCOME TAX RATE | 25.5 | % | 25.0 | % | 24.2 | % | ||||||
The effective tax rate for fiscal 2012 was 50 basis points higher than the effective tax rate for fiscal 2011 primarily due to changes in uncertain tax positions, partially offset by a reduction in the effective tax rate on operations outside of the United States as a result of changes in geographical mix of foreign earnings. The effective tax rate for fiscal 2011 was 80 basis points higher than the effective tax rate for fiscal 2010 primarily due to the change in geographic mix of earnings. A larger percentage of our earnings in fiscal 2011 were attributable to operations in the U.S., where the statutory tax rate is generally higher than the effective tax rate on operations outside of the U.S. This impact was partially offset by changes to uncertain tax positions.
| 53 |
Deferred tax assets and (liabilities) are comprised of the following:
| May 31, | ||||||||
| (In millions) | 2012 | 2011 | ||||||
| Deferred tax assets: | ||||||||
Allowance for doubtful accounts | $ | 18 | $ | 19 | ||||
Inventories | 40 | 63 | ||||||
Sales return reserves | 85 | 72 | ||||||
Deferred compensation | 177 | 152 | ||||||
Stock-based compensation | 144 | 148 | ||||||
Reserves and accrued liabilities | 68 | 66 | ||||||
Foreign loss carry-forwards | 76 | 60 | ||||||
Foreign tax credit carry-forwards | 216 | 236 | ||||||
Hedges | - | 21 | ||||||
Undistributed earnings of foreign subsidiaries | 82 | - | ||||||
Other | 71 | 86 | ||||||
| Total deferred tax assets | 977 | 923 | ||||||
| Valuation allowance | (81 | ) | (51 | ) | ||||
| Total deferred tax assets after valuation allowance | 896 | 872 | ||||||
| Deferred tax liabilities: | ||||||||
Undistributed earnings of foreign subsidiaries | - | (40 | ) | |||||
Property, plant and equipment | (186 | ) | (151 | ) | ||||
Intangibles | (98 | ) | (97 | ) | ||||
Other | (21 | ) | (21 | ) | ||||
| Total deferred tax liability | (305 | ) | (309 | ) | ||||
| NET DEFERRED TAX ASSET | $ | 591 | $ | 563 | ||||
The following is a reconciliation of the changes in the gross balance of unrecognized tax benefits, excluding interest and penalties:
| May 31, | ||||||||||||
| (In millions) | 2012 | 2011 | 2010 | |||||||||
| Unrecognized tax benefits, as of the beginning of the period | $ | 212 | $ | 282 | $ | 274 | ||||||
| Gross increases related to prior period tax positions | 48 | 13 | 87 | |||||||||
| Gross decreases related to prior period tax positions | (25 | ) | (98 | ) | (122 | ) | ||||||
| Gross increases related to current period tax positions | 91 | 59 | 52 | |||||||||
| Gross decreases related to current period tax positions | (1 | ) | (6 | ) | - | |||||||
| Settlements | (20 | ) | (43 | ) | (3 | ) | ||||||
| Lapse of statute of limitations | (9 | ) | (8 | ) | (9 | ) | ||||||
| Changes due to currency translation | (11 | ) | 13 | 3 | ||||||||
| UNRECOGNIZED TAX BENEFITS, AS OF THE END OF THE PERIOD | $ | 285 | $ | 212 | $ | 282 | ||||||
As of May 31, 2012, the total gross unrecognized tax benefits, excluding related interest and penalties, were $285 million, $165 million of which would affect the Company's effective tax rate if recognized in future periods.
The Company recognizes interest and penalties related to income tax matters in income tax expense. The liability for payment of interest and penalties increased $17 million, $10 million, and $6 million during the years ended May 31, 2012, 2011, and 2010, respectively. As of May 31, 2012 and 2011, accrued interest and penalties related to uncertain tax positions were $108 million and $91 million, respectively (excluding federal benefit).
The Company is subject to taxation primarily in the U.S., China, the Netherlands, and Brazil, as well as various state and other foreign jurisdictions. The Company has concluded substantially all U.S. federal income tax matters through fiscal year 2010. The Company is currently under audit by the Internal Revenue Service for the 2011 and 2012 tax years. The Company's major foreign jurisdictions, China, the Netherlands and Brazil, have concluded substantially all income tax matters through calendar 2001, fiscal 2006 and calendar 2004, respectively. The Company estimates that it is reasonably possible that the total gross unrecognized tax benefits could decrease by up to $58 million within the next 12 months as a result of resolutions of global tax examinations and the expiration of applicable statutes of limitations.
The Company has indefinitely reinvested approximately $5.5 billion of the cumulative undistributed earnings of certain foreign subsidiaries. Such earnings would be subject to U.S. taxation if repatriated to the U.S. The amount of unrecognized deferred tax liability associated with the indefinitely reinvested undistributed earnings at May 31, 2012 is $1.8 billion.
A portion of the Company's foreign operations are benefitting from tax holidays that will phase out in fiscal 2019 and fiscal 2021. These tax holidays may be extended when certain conditions are met or may be terminated early if certain conditions are not met. The decrease in income tax expense for the year ended May 31, 2012 as a result of these arrangements was approximately $103 million ($0.22 per diluted share) and $36 million ($0.07 per diluted share) for the year ended May 31, 2011.
Deferred tax assets at May 31, 2012 and 2011 were reduced by a valuation allowance relating to tax benefits of certain subsidiaries with operating losses. The net change in the valuation allowance was an increase of $30 million and $15 million for the years ended May 31, 2012 and 2011, respectively.
| 54 |
The Company has recorded deferred tax assets of $216 million at May 31, 2012 for foreign tax credit carry-forwards with expiration dates between 2020 and 2022.
The Company has available domestic and foreign loss carry-forwards of $247 million at May 31, 2012. Such losses, if not utilized, will expire as follows:
| Year Ending May 31, | ||||||||||||||||||||||||||||||||||||||||
| (In millions) | 2013 | 2014 | 2015 | 2016 | 2017- 2032 | Indefinite | Total | |||||||||||||||||||||||||||||||||
| Net Operating Losses | $ | - | 8 | 3 | 8 | 131 | 97 | $ | 247 | |||||||||||||||||||||||||||||||
During the years ended May 31, 2012, 2011, and 2010, income tax benefits attributable to employee stock-based compensation transactions of $120 million, $68 million, and $57 million, respectively, were allocated to shareholders' equity.
NOTE 10 - Redeemable Preferred Stock
Sojitz America is the sole owner of the Company's authorized Redeemable Preferred Stock, $1 par value, which is redeemable at the option of Sojitz America or the Company at par value aggregating $0.3 million. A cumulative dividend of $0.10 per share is payable annually on May 31 and no dividends may be declared or paid on the common stock of the Company unless dividends on the Redeemable Preferred Stock have been declared and paid in full. There have been no changes in the Redeemable Preferred Stock in the three years ended May 31, 2012, 2011, and 2010. As the holder of the Redeemable Preferred Stock, Sojitz America does not have general voting rights but does have the right to vote as a separate class on the sale of all or substantially all of the assets of the Company and its subsidiaries, on merger, consolidation, liquidation or dissolution of the Company or on the sale or assignment of the NIKE trademark for athletic footwear sold in the United States.
NOTE 11 - Common Stock and Stock-Based Compensation
The authorized number of shares of Class A Common Stock, no par value, and Class B Common Stock, no par value, are 175 million and 750 million, respectively. Each share of Class A Common Stock is convertible into one share of Class B Common Stock. Voting rights of Class B Common Stock are limited in certain circumstances with respect to the election of directors. There are no differences in the dividend and liquidation preferences or participation rights of the Class A and Class B common stockholders.
In 1990, the Board of Directors adopted, and the shareholders approved, the NIKE, Inc. 1990 Stock Incentive Plan (the "1990 Plan"). The 1990 Plan provides for the issuance of up to 163 million previously unissued shares of Class B Common Stock in connection with stock options and other awards granted under the plan. The 1990 Plan authorizes the grant of non-statutory stock options, incentive stock options, stock appreciation rights, restricted stock, restricted stock units, and performance-based awards. The exercise price for stock options and stock appreciation rights may not be less than the fair market value of the underlying shares on the date of grant. A committee of the Board of Directors administers the 1990 Plan. The committee has the authority to determine the employees to whom awards will be made, the amount of the awards, and the other terms and conditions of the awards. Substantially all stock option grants outstanding under the 1990 Plan were granted in the first quarter of each fiscal year, vest ratably over four years, and expire 10 years from the date of grant.
The following table summarizes the Company's total stock-based compensation expense recognized in selling and administrative expense:
| Year Ended May 31, | ||||||||||||||
| (In millions) | 2012 | 2011 | 2010 | |||||||||||
| Stock options (1) | $96 | $ | 77 | $ | 135 | |||||||||
| ESPPs | 16 | 14 | 14 | |||||||||||
| Restricted stock | 18 | 14 | 10 | |||||||||||
| TOTAL STOCK-BASED COMPENSATION EXPENSE | $130 | $ | 105 | $ | 159 | |||||||||
| (1) | Expense for stock options includes the expense associated with stock appreciation rights. Accelerated stock option expense is recorded for employees eligible for accelerated stock option vesting upon retirement. In the first quarter of fiscal 2011, the Company changed the accelerated vesting provisions of its stock option plan. Under the new provisions, accelerated stock option expense for years ended May 31, 2012 and 2011 was $17 million and $12 million, respectively. The accelerated stock option expense for the year ended May 31, 2010 was $74 million. |
As of May 31, 2012, the Company had $151 million of unrecognized compensation costs from stock options, net of estimated forfeitures, to be recognized as selling and administrative expense over a weighted average period of 2.2 years.
| 55 |
The weighted average fair value per share of the options granted during the years ended May 31, 2012, 2011, and 2010, as computed using the Black-Scholes pricing model, was $22.15, $17.68, and $23.43, respectively. The weighted average assumptions used to estimate these fair values are as follows:
| Year Ended May 31, | ||||||||||||
| 2012 | 2011 | 2010 | ||||||||||
| Dividend yield | 1.4 | % | 1.6 | % | 1.9 | % | ||||||
| Expected volatility | 29.5 | % | 31.5 | % | 57.6 | % | ||||||
| Weighted average expected life (in years) | 5.0 | 5.0 | 5.0 | |||||||||
| Risk-free interest rate | 1.4 | % | 1.7 | % | 2.5 | % | ||||||
The Company estimates the expected volatility based on the implied volatility in market traded options on the Company's common stock with a term greater than one year, along with other factors. The weighted average expected life of options is based on an analysis of historical and expected future exercise patterns. The interest rate is based on the U.S. Treasury (constant maturity) risk-free rate in effect at the date of grant for periods corresponding with the expected term of the options.
The following summarizes the stock option transactions under the plan discussed above:
| Shares | (1) | | Weighted Average Option Price | | ||||
| (In millions) | ||||||||
| Options outstanding May 31, 2009 | 38.8 | $ | 43.69 | |||||
Exercised | (8.6 | ) | 37.64 | |||||
Forfeited | (0.6 | ) | 51.92 | |||||
Granted | 6.4 | 52.79 | ||||||
| Options outstanding May 31, 2010 | 36.0 | $ | 46.60 | |||||
Exercised | (7.0 | ) | 42.70 | |||||
Forfeited | (0.5 | ) | 58.08 | |||||
Granted | 6.3 | 69.20 | ||||||
| Options outstanding May 31, 2011 | 34.8 | $ | 51.29 | |||||
Exercised | (9.0 | ) | 45.62 | |||||
Forfeited | (0.4 | ) | 71.04 | |||||
Granted | 6.8 | 91.74 | ||||||
| Options outstanding May 31, 2012 | 32.2 | $ | 61.18 | |||||
| Options exercisable at May 31, | ||||||||
2010 | 20.4 | 41.16 | ||||||
2011 | 20.1 | 44.05 | ||||||
2012 | 17.0 | $ | 48.75 | |||||
| (1) | Includes stock appreciation rights transactions. |
The weighted average contractual life remaining for options outstanding and options exercisable at May 31, 2012 was 6.3 years and 4.6 years, respectively. The aggregate intrinsic value for options outstanding and exercisable at May 31, 2012 was $1,512 million and $1,008 million, respectively. The aggregate intrinsic value was the amount by which the market value of the underlying stock exceeded the exercise price of the options. The total intrinsic value of the options exercised during the years ended May 31, 2012, 2011, and 2010 was $453 million, $267 million, and $239 million, respectively.
In addition to the 1990 Plan, the Company gives employees the right to purchase shares at a discount to the market price under employee stock purchase plans ("ESPPs"). Employees are eligible to participate through payroll deductions of up to 10% of their compensation. At the end of each six-month offering period, shares are purchased by the participants at 85% of the lower of the fair market value at the beginning or the end of the offering period. Employees purchased 0.8 million shares during each of the three years ended May 31, 2012, 2011 and 2010.
From time to time, the Company grants restricted stock units and restricted stock to key employees under the 1990 Plan. The number of shares underlying such awards granted to employees during the years ended May 31, 2012, 2011, and 2010 were 0.4 million, 0.2 million, and 0.5 million with weighted average values per share of $98.99, $70.23, and $53.16, respectively. Recipients of restricted stock are entitled to cash dividends and to vote their respective shares throughout the period of restriction. Recipients of restricted stock units are entitled to dividend equivalent cash payments upon vesting. The value of all grants of restricted stock and restricted stock units was established by the market price on the date of grant. During the years ended May 31, 2012, 2011, and 2010, the aggregate fair value of restricted stock and restricted stock units vested was $22 million, $15 million, and $8 million, respectively, determined as of the date of vesting.
| 56 |
NOTE 12 - Earnings Per Share
The following is a reconciliation from basic earnings per share to diluted earnings per share. Options to purchase an additional 0.1 million, 0.2 million, and 0.2 million shares of common stock were outstanding at May 31, 2012, 2011, and 2010, respectively, but were not included in the computation of diluted earnings per share because the options were anti-dilutive.
| Year Ended May 31, | ||||||||||||
| (In millions, except per share data) | 2012 | 2011 | 2010 | |||||||||
| Determination of shares: | ||||||||||||
Weighted average common shares outstanding | 460.0 | 475.5 | 485.5 | |||||||||
Assumed conversion of dilutive stock options and awards | 9.8 | 10.2 | 8.4 | |||||||||
| DILUTED WEIGHTED AVERAGE COMMON SHARES OUTSTANDING | 469.8 | 485.7 | 493.9 | |||||||||
| Basic earnings per common share | $ | 4.83 | $ | 4.48 | $ | 3.93 | ||||||
| Diluted earnings per common share | $ | 4.73 | $ | 4.39 | $ | 3.86 | ||||||
NOTE 13 - Benefit Plans
The Company has a profit sharing plan available to most U.S.-based employees. The terms of the plan call for annual contributions by the Company as determined by the Board of Directors. A subsidiary of the Company also had a profit sharing plan available to its U.S.-based employees prior to fiscal 2012. The terms of the plan called for annual contributions as determined by the subsidiary's executive management. Contributions of $40 million, $39 million, and $35 million were made to the plans and are included in selling and administrative expense for the years ended May 31, 2012, 2011, and 2010, respectively. The Company has various 401(k) employee savings plans available to U.S.-based employees. The Company matches a portion of employee contributions. Company contributions to the savings plans were $44 million, $39 million, and $34 million for the years ended May 31, 2012, 2011, and 2010, respectively, and are included in selling and administrative expense.
The Company also has a Long-Term Incentive Plan ("LTIP") that was adopted by the Board of Directors and approved by shareholders in September 1997 and later amended in fiscal 2007. The Company recognized $51 million, $31 million, and $24 million of selling and administrative expense related to cash awards under the LTIP during the years ended May 31, 2012, 2011, and 2010, respectively.
The Company has pension plans in various countries worldwide. The pension plans are only available to local employees and are generally government mandated. The liability related to the unfunded pension liabilities of the plans was $115 million and $93 million at May 31, 2012 and 2011, respectively, which was primarily classified as long-term in other liabilities.
NOTE 14 - Accumulated Other Comprehensive Income
The components of accumulated other comprehensive income, net of tax, are as follows:
| May 31, | ||||||||
| (In millions) | 2012 | 2011 | ||||||
| Cumulative translation adjustment and other | $ | (127 | ) | $ | 168 | |||
| Net deferred gain (loss) on cash flow hedge derivatives | 181 | (123 | ) | |||||
| Net deferred gain on net investment hedge derivatives | 95 | 50 | ||||||
| ACCUMULATED OTHER COMPREHENSIVE INCOME | $ | 149 | $ | 95 | ||||
Refer to Note 16 – Risk Management and Derivatives for more information on the Company's risk management program and derivatives.
NOTE 15 - Commitments and Contingencies
The Company leases space for certain of its offices, warehouses and retail stores under leases expiring from 1 to 23 years after May 31, 2012. Rent expense was $494 million, $446 million, and $416 million for the years ended May 31, 2012, 2011 and 2010, respectively. Amounts of minimum future annual rental commitments under non-cancelable operating leases in each of the five years ending May 31, 2013 through 2017 are $408 million, $387 million, $271 million, $224 million, $186 million, respectively, and $662 million in later years.
As of May 31, 2012 and 2011, the Company had letters of credit outstanding totaling $138 million and $99 million, respectively. These letters of credit were generally issued for the purchase of inventory and guarantees of the Company's performance under certain self-insurance and other programs.
In connection with various contracts and agreements, the Company provides routine indemnifications relating to the enforceability of intellectual property rights, coverage for legal issues that arise and other items where the Company is acting as the guarantor. Currently, the Company has several such agreements in place. However, based on the Company's historical experience and the estimated probability of future loss, the Company has determined that the fair value of such indemnifications is not material to the Company's financial position or results of operations.
In the ordinary course of its business, the Company is involved in various legal proceedings involving contractual and employment relationships, product liability claims, trademark rights, and a variety of other matters. While the Company cannot predict the outcome of its pending legal matters with certainty, the Company does not believe any currently identified claim, proceeding or litigation, either individually or in aggregate, will have a material impact on the Company's results of operations, financial position or cash flows.
| 57 |
NOTE 16 - Risk Management and Derivatives
The Company is exposed to global market risks, including the effect of changes in foreign currency exchange rates and interest rates, and uses derivatives to manage financial exposures that occur in the normal course of business. The Company does not hold or issue derivatives for trading purposes.
The Company may elect to designate certain derivatives as hedging instruments under the accounting standards for derivatives and hedging. The Company formally documents all relationships between designated hedging instruments and hedged items as well as its risk management objective and strategy for undertaking hedge transactions. This process includes linking all derivatives designated as hedges to either recognized assets or liabilities or forecasted transactions.
The majority of derivatives outstanding as of May 31, 2012 are designated as cash flow or fair value hedges. All derivatives are recognized on the balance sheet at fair value and classified based on the instrument's maturity date. The total notional amount of outstanding derivatives as of May 31, 2012 was approximately $7 billion, which is primarily comprised of cash flow hedges for Euro/U.S. Dollar, British Pound/Euro, and Japanese Yen/U.S. Dollar currency pairs.
The following table presents the fair values of derivative instruments included within the consolidated balance sheets as of May 31, 2012 and 2011:
| Asset Derivatives | Liability Derivatives | |||||||||||||||||||||||
| (In millions) | Balance Sheet Location | May 31, 2012 | May 31, 2011 | Balance Sheet Location | May 31, 2012 | May 31, 2011 | ||||||||||||||||||
| Derivatives formally designated as hedging instruments: | ||||||||||||||||||||||||
Foreign exchange forwards and options | | Prepaid expenses and other current assets | | $ | 203 | $ | 22 | Accrued liabilities | $ | 35 | $ | 170 | ||||||||||||
Interest rate swap contracts | | Prepaid expenses and other current assets | | - | - | Accrued liabilities | - | - | ||||||||||||||||
Foreign exchange forwards and options | | Deferred income taxes and other long-term assets | | 7 | 7 | | Deferred income taxes and other long-term liabilities | | - | 10 | ||||||||||||||
Interest rate swap contracts | | Deferred income taxes and other long-term assets | | 15 | 15 | | Deferred income taxes and other long-term liabilities | | - | - | ||||||||||||||
Total derivatives formally designated as hedging instruments | 225 | 44 | 35 | 180 | ||||||||||||||||||||
| Derivatives not designated as hedging instruments: | ||||||||||||||||||||||||
Foreign exchange forwards and options | | Prepaid expenses and other current assets | | $ | 55 | $ | 9 | Accrued liabilities | $ | 20 | $ | 16 | ||||||||||||
Embedded derivatives | | Prepaid expenses and other current assets | | 1 | - | Accrued liabilities | - | - | ||||||||||||||||
Foreign exchange forwards and options | | Deferred income taxes and other long-term assets | | - | - | | Deferred income taxes and other long-term liabilities | | - | 1 | ||||||||||||||
| Total derivatives not designated as hedging instruments | 56 | 9 | 20 | 17 | ||||||||||||||||||||
| TOTAL DERIVATIVES | $ | 281 | $ | 53 | $ | 55 | $ | 197 | ||||||||||||||||
The following tables present the amounts affecting the consolidated statements of income for years ended May 31, 2012, 2011 and 2010:
Derivatives formally designated (In millions) | Amount of Gain (Loss) Recognized in Other Comprehensive Income on Derivatives (1) | Amount of Gain (Loss) Reclassified From Accumulated Other Comprehensive Income into Income (1) | ||||||||||||||||||||||||||
| Year Ended May 31, | Location of Gain (Loss) Reclassified From Accumulated Other Comprehensive Income Into Income (1) | Year Ended May 31, | ||||||||||||||||||||||||||
| 2012 | 2011 | 2010 | 2012 | 2011 | 2010 | |||||||||||||||||||||||
| Derivatives designated as cash flow hedges: | ||||||||||||||||||||||||||||
Foreign exchange forwards and options | $ | (29 | ) | $ | (87 | ) | $ | (30 | ) | Revenue | $ | 5 | $ | (30 | ) | $ | 51 | |||||||||||
Foreign exchange forwards and options | 253 | (152 | ) | 89 | Cost of sales | (57 | ) | 103 | 60 | |||||||||||||||||||
Foreign exchange forwards and options | 3 | (4 | ) | 5 | Selling and administrative expense | (2 | ) | 1 | 1 | |||||||||||||||||||
Foreign exchange forwards and options | 36 | (65 | ) | 51 | Other expense (income), net | (9 | ) | 34 | 56 | |||||||||||||||||||
| Total designated cash flow hedges | $ | 263 | $ | (308 | ) | $ | 115 | $ | (63 | ) | $ | 108 | $ | 168 | ||||||||||||||
| Derivatives designated as net investment hedges: | ||||||||||||||||||||||||||||
Foreign exchange forwards and options | $ | 45 | $ | (85 | ) | $ | 66 | Other expense (income), net | $ | - | $ | - | $ | - | ||||||||||||||
| (1) | For the years ended May 31, 2012, 2011, and 2010, the amounts recorded in other expense (income), net as a result of hedge ineffectiveness and the discontinuance of cash flow hedges because the forecasted transactions were no longer probable of occurring were immaterial. |
| 58 |
| Amount of Gain (Loss) Recognized in Income on Derivatives | Location of Gain (Loss) Recognized in Income on Derivatives | |||||||||||||||
| Year Ended May 31, | ||||||||||||||||
| (In millions) | 2012 | 2011 | 2010 | |||||||||||||
| Derivatives designated as fair value hedges: | ||||||||||||||||
Interest rate swaps (1) | $ | 6 | $ | 6 | $ | 7 | Interest expense (income), net | |||||||||
| Derivatives not designated as hedging instruments: | ||||||||||||||||
Foreign exchange forwards and options | 64 | (30 | ) | (91 | ) | Other expense (income), net | ||||||||||
Embedded derivatives | $ | 1 | $ | - | $ | - | Other expense (income), net | |||||||||
| (1) | All interest rate swap agreements meet the shortcut method requirements under the accounting standards for derivatives and hedging. Accordingly, changes in the fair values of the interest rate swap agreements are considered to exactly offset changes in the fair value of the underlying long-term debt. Refer to "Fair Value Hedges" in this note for additional detail. |
Refer to Note 5 - Accrued Liabilities for derivative instruments recorded in accrued liabilities, Note 6 -Fair Value Measurements for a description of how the above financial instruments are valued, Note 14 - Accumulated Other Comprehensive Income and the consolidated statements of shareholders' equity for additional information on changes in other comprehensive income for the years ended May 31, 2012, 2011 and 2010.
Cash Flow Hedges
The purpose of the Company's foreign currency hedging activities is to protect the Company from the risk that the eventual cash flows resulting from transactions in foreign currencies will be adversely affected by changes in exchange rates. Foreign currency exposures that the Company may elect to hedge in this manner include product cost exposures, non-functional currency denominated external and intercompany revenues, selling and administrative expenses, investments in U.S. Dollar-denominated available-for-sale debt securities and certain other intercompany transactions.
Product cost exposures are primarily generated through non-functional currency denominated product purchases and the foreign currency adjustment program described below. NIKE entities primarily purchase products in two ways: 1) Certain NIKE entities purchase product from the NIKE Trading Company ("NTC"), a wholly-owned centralized sourcing hub that buys NIKE branded products from external factories, predominantly in U.S. Dollars. The NTC, whose functional currency is the U.S. Dollar, then sells the products to NIKE entities in their respective functional currencies. When the NTC sells to a NIKE entity with a different functional currency, the result is a foreign currency exposure for the NTC; 2) Other NIKE entities purchase product directly from external factories in U.S. Dollars. These purchases generate a foreign currency exposure for those NIKE entities with a functional currency other than the U.S. Dollar.
In January 2012, the Company implemented a foreign currency adjustment program with certain factories. The program is designed to more effectively manage foreign currency risk by assuming certain of the factories' foreign currency exposures, some of which are natural offsets to our existing foreign currency exposures. Under this program, the Company's payments to these factories are adjusted for rate fluctuations in the basket of currencies ("factory currency exposure index") in which the labor, materials and overhead costs incurred by the factories in the production of NIKE branded products ("factory input costs") are denominated. For the portion of the indices denominated in the local or functional currency of the factory, the Company may elect to place formally designated cash flow hedges. For all currencies within the indices, excluding the U.S. Dollar and the local or functional currency of the factory, an embedded derivative is created upon the factory's acceptance of NIKE's purchase order. Embedded derivatives are separated from the related purchase order and their accounting treatment is described further below.
The Company's policy permits the utilization of derivatives to reduce its foreign currency exposures where internal netting or other strategies cannot be effectively employed. Hedged transactions are denominated primarily in Euros, British Pounds and Japanese Yen. The Company may enter into hedge contracts typically starting 12 to 18 months in advance of the forecasted transaction and may place incremental hedges for up to 100% of the exposure by the time the forecasted transaction occurs.
All changes in fair value of derivatives designated as cash flow hedges, excluding any ineffective portion, are recorded in other comprehensive income until net income is affected by the variability of cash flows of the hedged transaction. In most cases, amounts recorded in other comprehensive income will be released to net income some time after the maturity of the related derivative. Effective hedge results are classified within the consolidated statements of income in the same manner as the underlying exposure, with the results of hedges of non-functional currency denominated revenues and product cost exposures, excluding embedded derivatives as described below, recorded in revenues or cost of sales, when the underlying hedged transaction affects consolidated net income. Results of hedges of selling and administrative expense are recorded together with those costs when the related expense is recorded. Results of hedges of anticipated purchases and sales of U.S. Dollar-denominated available-for-sale securities are recorded in other expense (income), net when the securities are sold. Results of hedges of certain anticipated intercompany transactions are recorded in other expense (income), net when the transaction occurs. The Company classifies the cash flows at settlement from these designated cash flow hedge derivatives in the same category as the cash flows from the related hedged items, generally within the cash provided by operations component of the cash flow statement.
Premiums paid on options are initially recorded as deferred charges. The Company assesses the effectiveness of options based on the total cash flows method and records total changes in the options' fair value to other comprehensive income to the degree they are effective.
The Company formally assesses, both at a hedge's inception and on an ongoing basis, whether the derivatives that are used in the hedging transaction have been highly effective in offsetting changes in the cash flows of hedged items and whether those derivatives may be expected to remain highly effective in future periods. Effectiveness for cash flow hedges is assessed based on forward rates. Ineffectiveness was not material for the years ended May 31, 2012, 2011 and 2010.
The Company discontinues hedge accounting prospectively when (1) it determines that the derivative is no longer highly effective in offsetting changes in the cash flows of a hedged item (including hedged items such as firm commitments or forecasted transactions); (2) the derivative expires or is sold, terminated, or exercised; (3) it is no longer probable that the forecasted transaction will occur; or (4) management determines that designating the derivative as a hedging instrument is no longer appropriate.
When the Company discontinues hedge accounting because it is no longer probable that the forecasted transaction will occur in the originally expected period, but is expected to occur within an additional two-month period of time thereafter, the gain or loss on the derivative remains in accumulated other comprehensive income and is reclassified to net income when the forecasted transaction affects consolidated net income. However, if it is probable that a forecasted transaction will not occur by the end of the originally specified time period or within an additional two-month period of time thereafter, the gains and losses that were accumulated in other comprehensive income will be recognized immediately in other expense (income), net. In all situations in which hedge accounting is discontinued and the derivative remains outstanding, the Company will carry the derivative at its fair value on the balance sheet, recognizing future changes in the fair value in other expense (income), net. For the years ended May 31, 2012, 2011 and 2010, the amounts recorded in other expense (income), net as a result of the
| 59 |
discontinuance of cash flow hedging because the forecasted transaction was no longer probable of occurring were immaterial.
As of May 31, 2012, $162 million of deferred net gains (net of tax) on both outstanding and matured derivatives accumulated in other comprehensive income are expected to be reclassified to net income during the next 12 months concurrent with the underlying hedged transactions also being recorded in net income. Actual amounts ultimately reclassified to net income are dependent on the exchange rates in effect when derivative contracts that are currently outstanding mature. As of May 31, 2012, the maximum term over which the Company is hedging exposures to the variability of cash flows for its forecasted transactions is 24 months.
Fair Value Hedges
The Company is also exposed to the risk of changes in the fair value of certain fixed-rate debt attributable to changes in interest rates. Derivatives currently used by the Company to hedge this risk are receive-fixed, pay-variable interest rate swaps. As of May 31, 2012, all interest rate swap agreements are designated as fair value hedges of the related long-term debt and meet the shortcut method requirements under the accounting standards for derivatives and hedging. Accordingly, changes in the fair values of the interest rate swap agreements are considered to exactly offset changes in the fair value of the underlying long-term debt. The cash flows associated with the Company's fair value hedges are periodic interest payments while the swaps are outstanding, which are reflected within the cash provided by operations component of the cash flow statement. The Company recorded no ineffectiveness from its interest rate swaps designated as fair value hedges for the years ended May 31, 2012, 2011, or 2010.
Net Investment Hedges
The Company also hedges the risk of variability in foreign-currency-denominated net investments in wholly-owned international operations. All changes in fair value of the derivatives designated as net investment hedges, except ineffective portions, are reported in the cumulative translation adjustment component of other comprehensive income along with the foreign currency translation adjustments on those investments. The Company classifies the cash flows at settlement of its net investment hedges within the cash provided or used by investing component of the cash flow statement. The Company assesses hedge effectiveness based on changes in forward rates. The Company recorded no ineffectiveness from its net investment hedges for the years ended May 31, 2012, 2011, or 2010.
Embedded Derivatives
As described above, for currencies within the factory currency exposure indices that are neither the U.S. Dollar nor the local or functional currency of the factory, an embedded derivative is created upon the factory's acceptance of NIKE's purchase order. Embedded derivatives are treated as foreign currency forward contracts that are bifurcated from the related purchase order and recorded at fair value as a derivative asset or liability on the balance sheet with their corresponding change in fair value recognized in other expense (income), net from the date a purchase order is accepted by a factory through the date the purchase price is no longer subject to foreign currency fluctuations. At May 31, 2012, the notional amount of embedded derivatives was approximately $131 million. For the year ended May 31, 2012, a $1 million gain was recorded within other expense (income), net related to embedded derivatives. There were no amounts recognized in other expense (income), net for the years ended May 31, 2011 or 2010.
Undesignated Derivative Instruments
The Company may elect to enter into foreign exchange forwards to mitigate the change in fair value of specific assets and liabilities on the balance sheet and/or the embedded derivative contracts explained above. These forwards are not designated as hedging instruments under the accounting standards for derivatives and hedging. Accordingly, these undesignated instruments are recorded at fair value as a derivative asset or liability on the balance sheet with their corresponding change in fair value recognized in other expense (income), net, together with the re-measurement gain or loss from the hedged balance sheet position or embedded derivative contract. The Company classifies the cash flows at settlement from undesignated instruments in the same category as the cash flows from the related hedged items, generally within the cash provided by operations component of the cash flow statement.
Credit Risk
The Company is exposed to credit-related losses in the event of non-performance by counterparties to hedging instruments. The counterparties to all derivative transactions are major financial institutions with investment grade credit ratings. However, this does not eliminate the Company's exposure to credit risk with these institutions. This credit risk is limited to the unrealized gains in such contracts should any of these counterparties fail to perform as contracted. To manage this risk, the Company has established strict counterparty credit guidelines that are continually monitored and managed according to prescribed guidelines. The Company also utilizes a portfolio of financial institutions either headquartered or operating in the same countries in which the Company conducts its business.
The Company's derivative contracts contain credit risk related contingent features designed to protect against significant deterioration in counterparties' creditworthiness and their ultimate ability to settle outstanding derivative contracts in the normal course of business. The Company's bilateral credit related contingent features require the owing entity, either the Company or the derivative counterparty, to post collateral for the portion of the fair value in excess of $50 million should the fair value of outstanding derivatives per counterparty be greater than $50 million. Additionally, a certain level of decline in credit rating of either the Company or the counterparty could also trigger collateral requirements. As of May 31, 2012, the Company was in compliance with all credit risk related contingent features and the aggregate fair value of derivative instruments with credit risk related contingent features that were in a net liability position was $6 million. Accordingly, the Company was not required to post any collateral as a result of these contingent features. Given the considerations described above, the Company considers the impact of the risk of counterparty default to be immaterial.
NOTE 17 - Operating Segments and Related Information
Operating Segments. The Company's operating segments are evidence of the structure of the Company's internal organization. The major segments are defined by geographic regions for operations participating in NIKE Brand sales activity excluding NIKE Golf. Each NIKE Brand geographic segment operates predominantly in one industry: the design, development, marketing and selling of sports and fitness footwear, apparel, and equipment. The Company's reportable operating segments for the NIKE Brand are: North America, Western Europe, Central & Eastern Europe, Greater China, Japan, and Emerging Markets. The Company's NIKE Brand Direct to Consumer operations are managed within each geographic segment.
The Company's "Other" category is broken into two components for presentation purposes to align with the way management views the Company. The "Global Brand Divisions" category primarily represents NIKE Brand licensing businesses that are not part of a geographic operating segment, demand creation and operating overhead expenses that are centrally managed for the NIKE Brand, and costs associated with product development and supply chain operations. The "Other Businesses" category primarily consists of the activities of Cole Haan, Converse Inc., Hurley International LLC, NIKE Golf and Umbro Ltd. Activities represented in the "Other" category are considered immaterial for individual disclosure.
| 60 |
Corporate consists of unallocated general and administrative expenses, which include expenses associated with centrally managed departments, depreciation and amortization related to the Company's headquarters, unallocated insurance and benefit programs, including stock-based compensation, certain foreign currency gains and losses, including hedge gains and losses, certain corporate eliminations and other items.
The primary financial measure used by the Company to evaluate performance of individual operating segments is earnings before interest and taxes (commonly referred to as "EBIT"), which represents net income before interest expense, net and income taxes in the consolidated statements of income. Reconciling items for EBIT represent corporate expense items that are not allocated to the operating segments for management reporting.
As part of our centrally managed foreign exchange risk management program, standard foreign currency rates are assigned twice per year to each NIKE Brand entity in our geographic operating segments and certain Other Businesses. These rates are set approximately nine months in advance of the future selling season based on average market spot rates in the calendar month preceding the date they are established. Inventories and cost of sales for geographic operating segments and certain Other Businesses reflect use of these standard rates to record non-functional currency product purchases in the entity's functional currency. Differences between assigned standard foreign currency rates and actual market rates are included in Corporate, together with foreign currency hedge gains and losses generated from our centrally managed foreign exchange risk management program and other conversion gains and losses.
Accounts receivable, inventories and property, plant and equipment for operating segments are regularly reviewed by management and are therefore provided below. Additions to long-lived assets as presented in the following table represent capital expenditures.
Certain prior year amounts have been reclassified to conform to fiscal 2012 presentation.
| 61 |
| Year Ended May 31, | ||||||||||||
| (In millions) | 2012 | 2011 | 2010 | |||||||||
| REVENUE | ||||||||||||
North America | $ | 8,839 | $ | 7,579 | $ | 6,697 | ||||||
Western Europe | 4,144 | 3,868 | 3,839 | |||||||||
Central & Eastern Europe | 1,200 | 1,040 | 999 | |||||||||
Greater China | 2,539 | 2,060 | 1,742 | |||||||||
Japan | 829 | 766 | 882 | |||||||||
Emerging Markets | 3,410 | 2,736 | 2,198 | |||||||||
Global Brand Divisions | 111 | 96 | 86 | |||||||||
| Total NIKE Brand | 21,072 | 18,145 | 16,443 | |||||||||
Other Businesses | 3,095 | 2,786 | 2,564 | |||||||||
Corporate | (39 | ) | (69 | ) | 7 | |||||||
| TOTAL NIKE CONSOLIDATED REVENUES | $ | 24,128 | $ | 20,862 | $ | 19,014 | ||||||
| EARNINGS BEFORE INTEREST AND TAXES | ||||||||||||
North America | $ | 2,007 | $ | 1,736 | $ | 1,538 | ||||||
Western Europe | 597 | 730 | 807 | |||||||||
Central & Eastern Europe | 234 | 244 | 249 | |||||||||
Greater China | 911 | 777 | 637 | |||||||||
Japan | 136 | 114 | 180 | |||||||||
Emerging Markets | 853 | 688 | 521 | |||||||||
Global Brand Divisions | (1,177 | ) | (971 | ) | (866 | ) | ||||||
| Total NIKE Brand | 3,561 | 3,318 | 3,066 | |||||||||
Other Businesses | 341 | 335 | 298 | |||||||||
Corporate | (916 | ) | (805 | ) | (841 | ) | ||||||
| Total NIKE Consolidated Earnings Before Interest and Taxes | 2,986 | 2,848 | 2,523 | |||||||||
Interest expense, net | 3 | 4 | 6 | |||||||||
| TOTAL NIKE CONSOLIDATED EARNINGS BEFORE TAXES | $ | 2,983 | $ | 2,844 | $ | 2,517 | ||||||
| ADDITIONS TO LONG-LIVED ASSETS | ||||||||||||
North America | $ | 131 | $ | 79 | $ | 45 | ||||||
Western Europe | 93 | 75 | 59 | |||||||||
Central & Eastern Europe | 20 | 5 | 4 | |||||||||
Greater China | 38 | 43 | 80 | |||||||||
Japan | 14 | 9 | 12 | |||||||||
Emerging Markets | 27 | 21 | 11 | |||||||||
Global Brand Divisions | 131 | 44 | 30 | |||||||||
| Total NIKE Brand | 454 | 276 | 241 | |||||||||
Other Businesses | 34 | 38 | 52 | |||||||||
Corporate | 109 | 118 | 42 | |||||||||
| TOTAL ADDITIONS TO LONG-LIVED ASSETS | $ | 597 | $ | 432 | $ | 335 | ||||||
| DEPRECIATION | ||||||||||||
North America | $ | 78 | $ | 70 | $ | 65 | ||||||
Western Europe | 62 | 52 | 57 | |||||||||
Central & Eastern Europe | 6 | 4 | 4 | |||||||||
Greater China | 25 | 19 | 11 | |||||||||
Japan | 23 | 22 | 26 | |||||||||
Emerging Markets | 15 | 14 | 12 | |||||||||
Global Brand Divisions | 53 | 39 | 33 | |||||||||
| Total NIKE Brand | 262 | 220 | 208 | |||||||||
Other Businesses | 45 | 44 | 46 | |||||||||
Corporate | 66 | 71 | 70 | |||||||||
| TOTAL DEPRECIATION | $ | 373 | $ | 335 | $ | 324 | ||||||
| 62 |
| May 31, | ||||||||
| (In millions) | 2012 | 2011 | ||||||
| ACCOUNTS RECEIVABLE, NET | ||||||||
North America | $ | 1,149 | $ | 1,069 | ||||
Western Europe | 420 | 500 | ||||||
Central & Eastern Europe | 261 | 290 | ||||||
Greater China | 221 | 140 | ||||||
Japan | 152 | 153 | ||||||
Emerging Markets | 476 | 466 | ||||||
Global Brand Divisions | 30 | 23 | ||||||
| Total NIKE Brand | 2,709 | 2,641 | ||||||
Other Businesses | 549 | 471 | ||||||
Corporate | 22 | 26 | ||||||
| TOTAL ACCOUNTS RECEIVABLE, NET | $ | 3,280 | $ | 3,138 | ||||
| INVENTORIES | ||||||||
North America | $ | 1,272 | $ | 1,034 | ||||
Western Europe | 488 | 434 | ||||||
Central & Eastern Europe | 180 | 145 | ||||||
Greater China | 217 | 152 | ||||||
Japan | 83 | 82 | ||||||
Emerging Markets | 521 | 429 | ||||||
Global Brand Divisions | 35 | 25 | ||||||
| Total NIKE Brand | 2,796 | 2,301 | ||||||
Other Businesses | 511 | 414 | ||||||
Corporate | 43 | - | ||||||
| TOTAL INVENTORIES | $ | 3,350 | $ | 2,715 | ||||
| PROPERTY, PLANT AND EQUIPMENT, NET | ||||||||
North America | $ | 378 | $ | 330 | ||||
Western Europe | 314 | 338 | ||||||
Central & Eastern Europe | 30 | 13 | ||||||
Greater China | 191 | 179 | ||||||
Japan | 359 | 360 | ||||||
Emerging Markets | 59 | 58 | ||||||
Global Brand Divisions | 205 | 116 | ||||||
| Total NIKE Brand | 1,536 | 1,394 | ||||||
Other Businesses | 146 | 164 | ||||||
Corporate | 597 | 557 | ||||||
| TOTAL PROPERTY, PLANT AND EQUIPMENT, NET | $ | 2,279 | $ | 2,115 | ||||
| 63 |
Revenues by Major Product Lines. Revenues to external customers for NIKE Brand products are attributable to sales of footwear, apparel and equipment. Other revenues to external customers primarily include external sales by Cole Haan, Converse, Hurley, NIKE Golf, and Umbro.
| Year Ended May 31, | ||||||||||||
| (In millions) | 2012 | 2011 | 2010 | |||||||||
| Footwear | $ | 13,426 | $ | 11,518 | $ | 10,301 | ||||||
| Apparel | 6,333 | 5,513 | 5,026 | |||||||||
| Equipment | 1,202 | 1,018 | 1,030 | |||||||||
| Other | 3,167 | 2,813 | 2,657 | |||||||||
| TOTAL NIKE CONSOLIDATED REVENUES | $ | 24,128 | $ | 20,862 | $ | 19,014 | ||||||
Revenues and Long-Lived Assets by Geographic Area
Geographical area information is similar to what is reflected above under operating segments with the exception of the Other activity, which has been allocated to the geographical areas based on the location where the sales originated. Revenues derived in the United States were $10,247 million, $8,956 million, and $7,914 million for the years ended May 31, 2012, 2011, and 2010, respectively. The Company's largest concentrations of long-lived assets primarily consist of the Company's world headquarters and distribution facilities in the United States and distribution facilities in Japan, Belgium and China. Long-lived assets attributable to operations in the United States, which are comprised of net property, plant & equipment, were $1,260 million, $1,115 million, and $1,070 million at May 31, 2012, 2011, and 2010, respectively. Long-lived assets attributable to operations in Japan were $363 million at May 31, 2012 and 2011, and $336 million at May 31, 2010. Long-lived assets attributable to operations in Belgium were $164 million, $182 million, and $164 million at May 31, 2012, 2011, and 2010, respectively. Long-lived assets attributable to operations in China were $188 million, $175 million, and $144 million at May 31, 2012, 2011, and 2010, respectively.
Major Customers
No customer accounted for 10% or more of the Company's net revenues during the years ended May 31, 2012, 2011, and 2010.
| ITEM 9. | Changes In and Disagreements with Accountants on Accounting and Financial Disclosure |
There has been no change of accountants nor any disagreements with accountants on any matter of accounting principles or practices or financial statement disclosure required to be reported under this Item.
| ITEM 9A. | Controls and Procedures |
We maintain disclosure controls and procedures that are designed to ensure information required to be disclosed in our Exchange Act reports is recorded, processed, summarized and reported within the time periods specified in the Securities and Exchange Commission's rules and forms and that such information is accumulated and communicated to our management, including our Chief Executive Officer and Chief Financial Officer, as appropriate, to allow for timely decisions regarding required disclosure. In designing and evaluating the disclosure controls and procedures, management recognizes that any controls and procedures, no matter how well designed and operated, can provide only reasonable assurance of achieving the desired control objectives, and management is required to apply its judgment in evaluating the cost-benefit relationship of possible controls and procedures.
We carry out a variety of on-going procedures, under the supervision and with the participation of our management, including our Chief Executive Officer and Chief Financial Officer, to evaluate the effectiveness of the design and operation of our disclosure controls and procedures. Based on the foregoing, our Chief Executive Officer and Chief Financial Officer concluded that our disclosure controls and procedures were effective at the reasonable assurance level as of May 31, 2012.
"Management's Annual Report on Internal Control Over Financial Reporting" is included in Item 8 on page 37 of this Report.
There has been no change in our internal control over financial reporting during our most recent fiscal quarter that has materially affected, or is reasonable likely to materially affect, our internal control over financial reporting.
| ITEM 9B. | Other Information |
On July 20, 2012, the Compensation Committee of the Company's Board of Directors approved the grant of restricted stock units under the Company's 1990 Stock Incentive Plan (the "RSUs"), to Donald W. Blair, Vice President and Chief Financial Officer, and Eric D. Sprunk, Vice President, Merchandising & Product. The grant to Mr. Blair consists of 32,231 RSUs, and the grant to Mr. Sprunk consists of 53,718 RSUs. Each RSU obligates the Company upon vesting of the RSU to issue to the RSU holder one share of NIKE Class B Common Stock plus a cash payment equal to the total amount of dividends paid per share between grant and vesting of the RSU. One hundred percent of the RSUs are scheduled to vest for Mr. Blair on July 20, 2015, and for Mr. Sprunk on July 20, 2017, subject to their continued employment with the Company through the applicable vesting date. In addition, the RSUs will become 100% vested upon (i) the recipient's earlier death or disability, or (ii) if a "change in control" of the Company occurs and within two years after the change in control, the recipient's employment is terminated by the Company without "cause" or by him for "good reason," as such terms are defined in the Company's current form of Restricted Stock Unit Agreement. Shares acquired under the RSUs are subject to the Company's Policy for Recoupment of Incentive Compensation.
| 64 |
PART III
| ITEM 10. | Directors, Executive Officers and Corporate Governance |
The information required by Item 401 of Regulation S-K regarding directors is included under "Election of Directors" in the definitive Proxy Statement for our 2012 Annual Meeting of Shareholders and is incorporated herein by reference. The information required by Item 401 of Regulation S-K regarding executive officers is included under "Executive Officers of the Registrant" in Item 1 of this Report. The information required by Item 405 of Regulation S-K is included under "Election of Directors - Section 16(a) Beneficial Ownership Reporting Compliance" in the definitive Proxy Statement for our 2012 Annual Meeting of Shareholders and is incorporated herein by reference. The information required by Item 406 of Regulation S-K is included under "Corporate Governance - Code of Business Conduct and Ethics" in the definitive Proxy Statement for our 2012 Annual Meeting of Shareholders and is incorporated herein by reference. The information required by Items 407(d)(4) and (d)(5) of Regulation S-K regarding the Audit Committee of the Board of Directors is included under "Corporate Governance - Board Committees" in the definitive Proxy Statement for our 2012 Annual Meeting of Shareholders and is incorporated herein by reference.
| ITEM 11. | Executive Compensation |
The information required by Items 402, 407(e)(4) and 407(e)(5) of Regulation S-K regarding executive compensation is included under "Election of Directors - Director Compensation for Fiscal 2012," "Compensation Discussion and Analysis," "Executive Compensation," "Election of Directors - Compensation Committee Interlocks and Insider Participation" and "Compensation Committee Report" in the definitive Proxy Statement for our 2012 Annual Meeting of Shareholders and is incorporated herein by reference.
| ITEM 12. | Security Ownership of Certain Beneficial Owners and Management and Related Stockholder Matters |
The information required by Item 201(d) of Regulation S-K is included under "Executive Compensation - Equity Compensation Plans" in the definitive Proxy Statement for our 2012 Annual Meeting of Shareholders and is incorporated herein by reference. The information required by Item 403 of Regulation S-K is included under "Election of Directors - Stock Holdings of Certain Owners and Management" in the definitive Proxy Statement for our 2012 Annual Meeting of Shareholders and is incorporated herein by reference.
| ITEM 13. | Certain Relationships and Related Transactions, and Director Independence |
The information required by Items 404 and 407(a) of Regulation S-K is included under "Election of Directors - Transactions with Related Persons" and "Corporate Governance - Director Independence" in the definitive Proxy Statement for our 2012 Annual Meeting of Shareholders and is incorporated herein by reference.
| ITEM 14. | Principal Accountant Fees and Services |
The information required by Item 9(e) of Schedule 14A is included under "Ratification Of Independent Registered Public Accounting Firm" in the definitive Proxy Statement for our 2012 Annual Meeting of Shareholders and is incorporated herein by reference.
| 65 |
PART IV
| ITEM 15. | Exhibits and Financial Statement Schedules |
| (a) | The following documents are filed as part of this report: | |||
| Form 10-K Page No. | ||||
| 1. | Financial Statements: | |||
| Report of Independent Registered Public Accounting Firm | 38 | |||
| Consolidated Statements of Income for each of the three years ended May 31, 2012, May 31, 2011 and May 31, 2010 | 39 | |||
| Consolidated Balance Sheets at May 31, 2012 and May 31, 2011 | 40 | |||
| Consolidated Statements of Cash Flows for each of the three years ended May 31, 2012, May 31, 2011 and May 31, 2010 | 41 | |||
| Consolidated Statements of Shareholders' Equity for each of the three years ended May 31, 2012, May 31, 2011 and May 31, 2010 | 42 | |||
| Notes to Consolidated Financial Statements | 44 | |||
| 2. | Financial Statement Schedule: | |||
| II - Valuation and Qualifying Accounts | 68 | |||
| All other schedules are omitted because they are not applicable or the required information is shown in the financial statements or notes thereto. | ||||
| 3. | Exhibits: | |||
| 66 |
| 3.1 | Restated Articles of Incorporation, as amended (incorporated by reference to Exhibit 3.1 to the Company's Quarterly Report on Form 10-Q for the fiscal quarter ended August 31, 2005). | |
| 3.2 | Third Restated Bylaws, as amended (incorporated by reference to Exhibit 3.2 to the Company's Current Report on Form 8-K filed February 20, 2007). | |
| 4.1 | Restated Articles of Incorporation, as amended (see Exhibit 3.1). | |
| 4.2 | Third Restated Bylaws, as amended (see Exhibit 3.2). | |
| 10.1 | Form of Non-Statutory Stock Option Agreement for options granted to non-employee directors prior to May 31, 2010 under the 1990 Stock Incentive Plan (incorporated by reference to Exhibit 10.3 to the Company's Current Report on Form 8-K filed June 21, 2005).* | |
| 10.2 | Form of Non-Statutory Stock Option Agreement for options granted to non-employee directors after May 31, 2010 under the 1990 Stock Incentive Plan (incorporated by reference to Exhibit 10.2 to the Company's Annual Report on Form 10-K for the fiscal year ended May 31, 2010).* | |
| 10.3 | Form of Non-Statutory Stock Option Agreement for options granted to executives prior to May 31, 2010 under the 1990 Stock Incentive Plan (incorporated by reference to Exhibit 10.1 to the Company's Annual Report on Form 10-K for the fiscal year ended May 31, 2009).* | |
| 10.4 | Form of Non-Statutory Stock Option Agreement for options granted to executives after May 31, 2010 under the 1990 Stock Incentive Plan.* | |
| 10.5 | Form of Indemnity Agreement entered into between the Company and each of its officers and directors (incorporated by reference to Exhibit 10.2 to the Company's Annual Report on Form 10-K for the fiscal year ended May 31, 2008).* | |
| 10.6 | NIKE, Inc. 1990 Stock Incentive Plan (incorporated by reference to Exhibit 10.2 to the Company's Current Report on Form 8-K filed on September 24, 2010).* | |
| 10.7 | NIKE, Inc. Executive Performance Sharing Plan.* | |
| 10.8 | NIKE, Inc. Long-Term Incentive Plan (incorporated by reference to Exhibit 10.5 to the Company's Annual Report on Form 10-K for the fiscal year ended May 31, 2008).* | |
| 10.9 | NIKE, Inc. Deferred Compensation Plan (Amended and Restated effective January 1, 2009) (incorporated by reference to Exhibit 10.8 to the Company's Annual Report on Form 10-K for the fiscal year ended May 31, 2009).* | |
| 10.10 | NIKE, Inc. Deferred Compensation Plan (Amended and Restated effective June 1, 2004) (applicable to amounts deferred before January 1, 2005) (incorporated by reference to Exhibit 10.6 to the Company's Annual Report on Form 10-K for the fiscal year ended May 31, 2004).* | |
| 10.11 | Amendment No. 1 effective January 1, 2008 to the NIKE, Inc. Deferred Compensation Plan (June 1, 2004 Restatement) (incorporated by reference to Exhibit 10.9 to the Company's Annual Report on Form 10-K for the fiscal year ended May 31, 2009).* | |
| 10.12 | NIKE, Inc. Foreign Subsidiary Employee Stock Purchase Plan (incorporated by reference to Exhibit 10.1 to the Company's Quarterly Report on Form 10-Q for the fiscal quarter ended November 30, 2008).* | |
| 10.13 | Amended and Restated Covenant Not To Compete and Non-Disclosure Agreement between NIKE, Inc. and Mark G. Parker dated July 24, 2008 (incorporated by reference to Exhibit 10.1 to the Company's Current Report on Form 8-K filed July 24, 2008).* | |
| 10.14 | Amended and Restated Covenant Not to Compete and Non-Disclosure Agreement between NIKE, Inc. and Charles D. Denson dated July 24, 2008 (incorporated by reference to Exhibit 10.2 to the Company's Current Report on Form 8-K filed July 24, 2008).* | |
| 10.15 | Form of Long-Term Incentive Award Agreement under the Long-Term Incentive Plan (incorporated by reference to Exhibit 10.15 to the Company's Annual Report on Form 10-K for the fiscal year ended May 31, 2010).* | |
| 10.16 | Form of Restricted Stock Bonus Agreement under the 1990 Stock Incentive Plan for awards prior to May 31, 2010 (incorporated by reference to Exhibit 10.2 to the Company's Current Report on Form 8-K filed June 21, 2005).* | |
| 10.17 | Form of Restricted Stock Agreement under the 1990 Stock Incentive Plan for awards after May 31, 2010 (incorporated by reference to Exhibit 10.2 to the Company's Current Report on Form 8-K filed July 20, 2010).* | |
| 10.18 | Form of Restricted Stock Unit Agreement under the 1990 Stock Incentive Plan.* | |
| 10.19 | Covenant Not to Compete and Non-Disclosure Agreement between NIKE, Inc. and Donald W. Blair dated November 10, 1999 (incorporated by reference to Exhibit 10.15 to the Company's Annual Report on Form 10-K for the fiscal year ended May 31, 2006).* | |
| 10.20 | Covenant Not to Compete and Non-Disclosure Agreement between NIKE, Inc. and Gary DeStefano (incorporated by reference to Exhibit 10.1 to the Company's Current Report on Form 8-K filed August 11, 2006).* | |
| 10.21 | Covenant Not to Compete and Non-Disclosure Agreement between NIKE, Inc. and Eric D. Sprunk dated April 18, 2001 (incorporated by reference to Exhibit 10.23 to the Company's Annual Report on Form 10-K for the fiscal year ended May 31, 2010).* | |
| 10.22 | Policy for Recoupment of Incentive Compensation (incorporated by reference to Exhibit 10.3 to the Company's Current Report on Form 8-K filed July 20, 2010).* | |
| 10.23 | Credit Agreement dated as of November 1, 2011 among NIKE, Inc., Bank of America, N.A., individually and as Agent and the other banks party thereto (incorporated by reference to Exhibit 10.1 to the Company's Current Report on Form 8-K filed November 2, 2011). | |
| 12.1 | Computation of Ratio of Earnings to Fixed Charges. | |
| 21 | Subsidiaries of the Registrant. | |
| 23 | Consent of PricewaterhouseCoopers LLP, Independent Registered Public Accounting Firm (set forth on page 69 of this Annual Report on Form 10-K). | |
| 31.1 | Rule 13a-14(a)/15d-14(a) Certification of Chief Executive Officer. | |
| 31.2 | Rule 13a-14(a)/15d-14(a) Certification of Chief Financial Officer. | |
| 32 | Section 1350 Certifications. | |
| 101.INS | XBRL Instance Document |
| 67 |
| 101.SCH | XBRL Taxonomy Extension Schema | |
| 101.CAL | XBRL Taxonomy Extension Calculation Linkbase | |
| 101.DEF | XBRL Taxonomy Extension Definition Document | |
| 101.LAB | XBRL Taxonomy Extension Label Linkbase | |
| 101.PRE | XBRL Taxonomy Extension Presentation Linkbase |
| * | Management contract or compensatory plan or arrangement. |
The Exhibits filed herewith do not include certain instruments with respect to long-term debt of NIKE and its subsidiaries, inasmuch as the total amount of debt authorized under any such instrument does not exceed 10 percent of the total assets of NIKE and its subsidiaries on a consolidated basis. NIKE agrees, pursuant to Item 601(b)(4)(iii) of Regulation S-K, that it will furnish a copy of any such instrument to the SEC upon request.
Upon written request to Investor Relations, NIKE, Inc., One Bowerman Drive, Beaverton, Oregon 97005-6453, NIKE will furnish shareholders with a copy of any Exhibit upon payment of $.10 per page, which represents our reasonable expenses in furnishing Exhibits.
SCHEDULE II - Valuation and qualifying accounts
| (In millions) | Balance at Beginning of Period | Charged to Costs and Expenses | Charged to Other Accounts | Write-Offs Net of Recoveries | Balance at End of Period | |||||||||||||||
Allowance for doubtful accounts (current and non-current) (1) | ||||||||||||||||||||
| For the year ended May 31, 2010 | $ | 111 | $ | 46 | $ | (10 | ) | $ | (30 | ) | $ | 117 | ||||||||
| For the year ended May 31, 2011 | 117 | 25 | 15 | (33 | ) | 124 | ||||||||||||||
| For the year ended May 31, 2012 | 124 | 24 | (10 | ) | (43 | ) | 95 | |||||||||||||
| (1) | The non-current portion of the allowance for doubtful accounts is classified in deferred income taxes and other assets on the consolidated balance sheets. |
| 68 |
Consent of Independent Registered Public Accounting Firm
We hereby consent to the incorporation by reference in the Registration Statements on Form S-8 (Nos. 033-63995, 333-63581, 333-63583, 333-68864, 333-68886, 333-71660, 333-104822, 333-117059, 333-133360, 333-164248, 333-171647, and 333-173727) of NIKE, Inc. of our report dated July 24, 2012 relating to the financial statements, financial statement schedule and the effectiveness of internal control over financial reporting, which appears in this Form 10-K.
/s/ PRICEWATERHOUSECOOPERS LLP
Portland, Oregon
July 24, 2012
| 69 |
Signatures
Pursuant to the requirements of Section 13 or 15(d) of the Securities Exchange Act of 1934, the registrant has duly caused this report to be signed on its behalf by the undersigned, thereunto duly authorized.
| NIKE, INC. | ||
| By: | /s/ MARK G. PARKER | |
| Mark G. Parker | ||
| Chief Executive Officer and President | ||
| Date: | July 24, 2012 | |
Pursuant to the requirements of the Securities Exchange Act of 1934, as amended, this report has been signed below by the following persons on behalf of the registrant and in the capacities and on the dates indicated.
| Signature | Title | Date | ||
| PRINCIPAL EXECUTIVE OFFICER AND DIRECTOR: | ||||
/s/ MARK G. PARKER Mark G. Parker | Director, Chief Executive Officer and President | July 24, 2012 | ||
| PRINCIPAL FINANCIAL OFFICER: | ||||
/s/ DONALD W. BLAIR Donald W. Blair | Chief Financial Officer | July 24, 2012 | ||
| PRINCIPAL ACCOUNTING OFFICER: | ||||
/s/ BERNARD F. PLISKA Bernard F. Pliska | Corporate Controller | July 24, 2012 | ||
| DIRECTORS: | ||||
/s/ PHILIP H. KNIGHT Philip H. Knight | Director, Chairman of the Board | July 24, 2012 | ||
/s/ ELIZABETH J. COMSTOCK Elizabeth J. Comstock | Director | July 24, 2012 | ||
/s/ JOHN G. CONNORS John G. Connors | Director | July 24, 2012 | ||
/s/ TIMOTHY D. COOK Timothy D. Cook | Director | July 24, 2012 | ||
/s/ ALAN B. GRAF, JR. Alan B. Graf, Jr. | Director | July 24, 2012 | ||
/s/ DOUGLAS G. HOUSER Douglas G. Houser | Director | July 24, 2012 | ||
/s/ JOHN C. LECHLEITER John C. Lechleiter | Director | July 24, 2012 | ||
/s/ JOHNATHAN A. RODGERS Johnathan A. Rodgers | Director | July 24, 2012 | ||
/s/ ORIN C. SMITH Orin C. Smith | Director | July 24, 2012 | ||
/s/ JOHN R. THOMPSON, JR. John R. Thompson, Jr. | Director | July 24, 2012 | ||
/s/ PHYLLIS M. WISE Phyllis M. Wise | Director | July 24, 2012 |
| 70 |