UNITED STATES
SECURITIES AND EXCHANGE COMMISSION
Washington, D.C. 20549
|
FORM 10-Q
|
(Mark One)
x | QUARTERLY REPORT PURSUANT TO SECTION 13 OR 15(d) OF THE SECURITIES EXCHANGE ACT OF 1934 |
For the quarterly period ended June 30, 2017
OR
o | TRANSITION REPORT PURSUANT TO SECTION 13 OR 15(d) OF THE SECURITIES EXCHANGE ACT OF 1934 |
For the transition period from to
Commission File Number: 001-35727
|
Netflix, Inc.
(Exact name of Registrant as specified in its charter)
|
Delaware | 77-0467272 |
(State or other jurisdiction of incorporation or organization) | (I.R.S. Employer Identification Number) |
100 Winchester Circle, Los Gatos, California 95032
(Address and zip code of principal executive offices)
(408) 540-3700
(Registrant's telephone number, including area code)
|
Indicate by check mark whether the registrant (1) has filed all reports required to be filed by Section 13 or 15(d) of the Securities Exchange Act of 1934 during the preceding 12 months (or for such shorter period that the registrant was required to file such reports) and (2) has been subject to such filing requirements for the past 90 days. Yes x No o
Indicate by check mark whether the registrant has submitted electronically and posted on its corporate Web site, if any, every Interactive Data File required to be submitted and posted pursuant to Rule 405 of Regulation S-T (§232.405 of this chapter) during the preceding 12 months (or for such shorter period that the registrant was required to submit and post such files). Yes x No o
Indicate by check mark whether the registrant is a large accelerated filer, an accelerated filer, a non-accelerated filer, a smaller reporting company, or an emerging growth company. See definitions of "large accelerated filer," "accelerated filer," "smaller reporting company," and "emerging growth company" in Rule 12b-2 of the Exchange Act.
Large accelerated filer | x |
| Accelerated filer | o |
Non-accelerated filer | o | (Do not check if a smaller reporting company) | Smaller reporting company | o |
|
|
| Emerging growth company | o |
If an emerging growth company, indicate by check mark if the registrant has elected not to use the extended transition period for complying with any new or revised financial accounting standards provided pursuant to Section 13(a) of the Exchange Act. o
Indicate by check mark whether the registrant is a shell company (as defined by Rule 12b-2 of the Exchange Act). Yes o No x
As of June 30, 2017 , there were 431,749,744 shares of the registrant's common stock, par value $0.001, outstanding.
Table of Contents
|
| Page |
| Part I. Financial Information |
|
Item 1. | Consolidated Financial Statements |
|
| Consolidated Statements of Operations | 3 |
| Consolidated Statements of Comprehensive Income | 4 |
| Consolidated Statements of Cash Flows | 5 |
| Consolidated Balance Sheets | 6 |
| Notes to Consolidated Financial Statements | 7 |
Item 2. | Management's Discussion and Analysis of Financial Condition and Results of Operations | 18 |
Item 3. | Quantitative and Qualitative Disclosures About Market Risk | 31 |
Item 4. | Controls and Procedures | 31 |
| Part II. Other Information | 32 |
Item 1. | Legal Proceedings | 32 |
Item 1A. | Risk Factors | 32 |
Item 6. | Exhibits | 32 |
Signatures |
| 33 |
Exhibit Index |
| 34 |
2
Table of Contents
NETFLIX, INC.
Consolidated Statements of Operations
(unaudited)
(in thousands, except per share data)
| Three Months Ended |
| Six Months Ended | ||||||||||||
| June 30, |
| June 30, |
| June 30, |
| June 30, | ||||||||
Revenues | $ | 2,785,464 | |
| $ | 2,105,204 | |
| $ | 5,422,099 | |
| $ | 4,062,940 | |
Cost of revenues | 1,902,308 | |
| 1,473,098 | |
| 3,559,332 | |
| 2,842,638 | | ||||
Marketing | 274,323 | |
| 216,029 | |
| 545,593 | |
| 424,039 | | ||||
Technology and development | 267,083 | |
| 207,300 | |
| 524,191 | |
| 410,808 | | ||||
General and administrative | 213,943 | |
| 138,407 | |
| 408,234 | |
| 265,632 | | ||||
Operating income | 127,807 | |
| 70,370 | |
| 384,749 | |
| 119,823 | | ||||
Other income (expense): |
|
|
|
|
|
|
| ||||||||
Interest expense | (55,482 | ) |
| (35,455 | ) |
| (102,224 | ) |
| (70,992 | ) | ||||
Interest and other income (expense) | (58,363 | ) |
| 16,317 | |
| (44,771 | ) |
| 42,280 | | ||||
Income before income taxes | 13,962 | |
| 51,232 | |
| 237,754 | |
| 91,111 | | ||||
Provision for (benefit from) income taxes | (51,638 | ) |
| 10,477 | |
| (6,068 | ) |
| 22,698 | | ||||
Net income | $ | 65,600 | |
| $ | 40,755 | |
| $ | 243,822 | |
| $ | 68,413 | |
Earnings per share: |
|
|
|
|
|
|
| ||||||||
Basic | $ | 0.15 | |
| $ | 0.10 | |
| $ | 0.57 | |
| $ | 0.16 | |
Diluted | $ | 0.15 | |
| $ | 0.09 | |
| $ | 0.55 | |
| $ | 0.16 | |
Weighted-average common shares outstanding: |
|
|
|
|
|
|
| ||||||||
Basic | 431,396 | |
| 428,483 | |
| 431,000 | |
| 428,300 | | ||||
Diluted | 446,262 | |
| 438,154 | |
| 445,862 | |
| 438,073 | | ||||
See accompanying notes to the consolidated financial statements.
3
Table of Contents
NETFLIX, INC.
Consolidated Statements of Comprehensive Income
(unaudited)
(in thousands)
| Three Months Ended |
| Six Months Ended | ||||||||||||
| June 30, |
| June 30, |
| June 30, |
| June 30, | ||||||||
Net income | $ | 65,600 | |
| $ | 40,755 | |
| $ | 243,822 | |
| $ | 68,413 | |
Other comprehensive income (loss): |
|
|
|
|
|
|
| ||||||||
Foreign currency translation adjustments | 14,347 | |
| (4,446 | ) |
| 16,926 | |
| 3,096 | | ||||
Change in unrealized gains (losses) on available-for-sale securities, net of tax of $89, $388, $166, and $1,222, respectively | 144 | |
| 636 | |
| 271 | |
| 2,001 | | ||||
Total other comprehensive income (loss) | 14,491 | |
| (3,810 | ) |
| 17,197 | |
| 5,097 | | ||||
Comprehensive income | $ | 80,091 | |
| $ | 36,945 | |
| $ | 261,019 | |
| $ | 73,510 | |
See accompanying notes to the consolidated financial statements.
4
Table of Contents
NETFLIX, INC.
Consolidated Statements of Cash Flows
(unaudited)
(in thousands)
| Three Months Ended |
| Six Months Ended | ||||||||||||
| June 30, |
| June 30, |
| June 30, |
| June 30, | ||||||||
Cash flows from operating activities: |
|
|
|
|
|
|
| ||||||||
Net income | $ | 65,600 | |
| $ | 40,755 | |
| $ | 243,822 | |
| $ | 68,413 | |
Adjustments to reconcile net income to net cash used in operating activities: |
|
|
|
|
|
|
| ||||||||
Additions to streaming content assets | (2,664,421 | ) |
| (1,791,766 | ) |
| (5,013,087 | ) |
| (4,108,365 | ) | ||||
Increase in streaming content liabilities | 514,890 | |
| 238,517 | |
| 881,147 | |
| 1,144,240 | | ||||
Amortization of streaming content assets | 1,550,794 | |
| 1,175,361 | |
| 2,856,477 | |
| 2,233,882 | | ||||
Amortization of DVD content assets | 16,511 | |
| 20,021 | |
| 35,109 | |
| 40,462 | | ||||
Depreciation and amortization of property, equipment and intangibles | 18,551 | |
| 14,131 | |
| 33,600 | |
| 28,929 | | ||||
Stock-based compensation expense | 44,028 | |
| 44,112 | |
| 88,916 | |
| 86,534 | | ||||
Excess tax benefits from stock-based compensation | - | |
| (13,323 | ) |
| - | |
| (24,639 | ) | ||||
Other non-cash items | 11,519 | |
| 9,040 | |
| 33,185 | |
| 21,797 | | ||||
Foreign currency remeasurement loss on long-term debt | 64,220 | |
| - | |
| 64,220 | |
| - | | ||||
Deferred taxes | (20,702 | ) |
| (17,876 | ) |
| (47,466 | ) |
| (34,479 | ) | ||||
Changes in operating assets and liabilities: |
|
|
|
|
|
|
| ||||||||
Other current assets | (80,199 | ) |
| 24,091 | |
| (105,601 | ) |
| 38,399 | | ||||
Accounts payable | (12,439 | ) |
| 8,795 | |
| (23,439 | ) |
| (11,103 | ) | ||||
Accrued expenses | (48,042 | ) |
| 2,099 | |
| 45,500 | |
| 43,331 | | ||||
Deferred revenue | 46,609 | |
| 22,753 | |
| 61,830 | |
| 50,255 | | ||||
Other non-current assets and liabilities | (41,447 | ) |
| (3,003 | ) |
| (32,597 | ) |
| (32,539 | ) | ||||
Net cash used in operating activities | (534,528 | ) |
| (226,293 | ) |
| (878,384 | ) |
| (454,883 | ) | ||||
Cash flows from investing activities: |
|
|
|
|
|
|
| ||||||||
Acquisition of DVD content assets | (7,624 | ) |
| (17,924 | ) |
| (32,996 | ) |
| (41,131 | ) | ||||
Purchases of property and equipment | (65,231 | ) |
| (10,814 | ) |
| (117,754 | ) |
| (19,239 | ) | ||||
Change in other assets | (1,064 | ) |
| 907 | |
| (1,833 | ) |
| 551 | | ||||
Purchases of short-term investments | (14,246 | ) |
| (18,492 | ) |
| (72,020 | ) |
| (53,454 | ) | ||||
Proceeds from sale of short-term investments | 14,128 | |
| 18,752 | |
| 69,876 | |
| 26,940 | | ||||
Proceeds from maturities of short-term investments | 17,605 | |
| 24,675 | |
| 22,705 | |
| 87,700 | | ||||
Net cash (used in) provided by investing activities | (56,432 | ) |
| (2,896 | ) |
| (132,022 | ) |
| 1,367 | | ||||
Cash flows from financing activities: |
|
|
|
|
|
|
| ||||||||
Proceeds from issuance of debt | 1,420,510 | |
| - | |
| 1,420,510 | |
| - | | ||||
Debt issuance costs | (15,013 | ) |
| - | |
| (15,013 | ) |
| - | | ||||
Proceeds from issuance of common stock | 14,826 | |
| 4,232 | |
| 39,004 | |
| 7,768 | | ||||
Excess tax benefits from stock-based compensation | - | |
| 13,323 | |
| - | |
| 24,639 | | ||||
Other financing activities | 63 | |
| 57 | |
| 124 | |
| 112 | | ||||
Net cash provided by financing activities | 1,420,386 | |
| 17,612 | |
| 1,444,625 | |
| 32,519 | | ||||
Effect of exchange rate changes on cash and cash equivalents | 11,527 | |
| (2,742 | ) |
| 16,982 | |
| 2,592 | | ||||
Net change in cash and cash equivalents | 840,953 | |
| (214,319 | ) |
| 451,201 | |
| (418,405 | ) | ||||
Cash and cash equivalents, beginning of period | 1,077,824 | |
| 1,605,244 | |
| 1,467,576 | |
| 1,809,330 | | ||||
Cash and cash equivalents, end of period | $ | 1,918,777 | |
| $ | 1,390,925 | |
| $ | 1,918,777 | |
| $ | 1,390,925 | |
Supplemental disclosure: |
|
|
|
|
|
|
| ||||||||
Change in investing activities included in liabilities | $ | (3,493 | ) |
| $ | (1,254 | ) |
| $ | (20,165 | ) |
| $ | (1,757 | ) |
See accompanying notes to the consolidated financial statements.
5
Table of Contents
NETFLIX, INC.
Consolidated Balance Sheets
(in thousands, except share and par value data)
| As of | ||||||
| June 30, |
| December 31, | ||||
| (unaudited) |
|
| ||||
Assets |
|
|
| ||||
Current assets: |
|
|
| ||||
Cash and cash equivalents | $ | 1,918,777 | |
| $ | 1,467,576 | |
Short-term investments | 246,125 | |
| 266,206 | | ||
Current content assets, net | 4,149,111 | |
| 3,726,307 | | ||
Other current assets | 386,772 | |
| 260,202 | | ||
Total current assets | 6,700,785 | |
| 5,720,291 | | ||
Non-current content assets, net | 9,078,474 | |
| 7,274,501 | | ||
Property and equipment, net | 309,831 | |
| 250,395 | | ||
Other non-current assets | 428,133 | |
| 341,423 | | ||
Total assets | $ | 16,517,223 | |
| $ | 13,586,610 | |
Liabilities and Stockholders' Equity |
|
|
| ||||
Current liabilities: |
|
|
| ||||
Current content liabilities | $ | 4,095,374 | |
| $ | 3,632,711 | |
Accounts payable | 273,398 | |
| 312,842 | | ||
Accrued expenses | 248,871 | |
| 197,632 | | ||
Deferred revenue | 505,302 | |
| 443,472 | | ||
Total current liabilities | 5,122,945 | |
| 4,586,657 | | ||
Non-current content liabilities | 3,356,090 | |
| 2,894,654 | | ||
Long-term debt | 4,836,502 | |
| 3,364,311 | | ||
Other non-current liabilities | 89,186 | |
| 61,188 | | ||
Total liabilities | 13,404,723 | |
| 10,906,810 | | ||
Commitments and contingencies (Note 6) | | |
| | | ||
Stockholders' equity: |
|
|
| ||||
Common stock, $0.001 par value; 4,990,000,000 shares authorized at June 30, 2017 and December 31, 2016; 431,749,744 and 430,054,212 issued and outstanding at June 30, 2017 and December 31, 2016, respectively | 1,727,858 | |
| 1,599,762 | | ||
Accumulated other comprehensive loss | (31,368 | ) |
| (48,565 | ) | ||
Retained earnings | 1,416,010 | |
| 1,128,603 | | ||
Total stockholders' equity | 3,112,500 | |
| 2,679,800 | | ||
Total liabilities and stockholders' equity | $ | 16,517,223 | |
| $ | 13,586,610 | |
See accompanying notes to the consolidated financial statements.
6
Table of Contents
NETFLIX, INC.
Notes to Consolidated Financial Statements
(unaudited)
1. Basis of Presentation and Summary of Significant Accounting Policies
The accompanying interim consolidated financial statements of Netflix, Inc. and its wholly owned subsidiaries (the "Company") have been prepared in conformity with accounting principles generally accepted in the United States ("U.S.") and are consistent in all material respects with those applied in the Company's Annual Report on Form 10-K for the year ended December 31, 2016 filed with the Securities and Exchange Commission (the "SEC") on January 27, 2017. The preparation of consolidated financial statements in conformity with U.S. generally accepted accounting principles ("GAAP") requires management to make estimates and judgments that affect the amounts reported in the consolidated financial statements and accompanying notes. Significant items subject to such estimates and assumptions include the streaming content asset amortization policy; the recognition and measurement of income tax assets and liabilities; and the valuation of stock-based compensation. The Company bases its estimates on historical experience and on various other assumptions that the Company believes to be reasonable under the circumstances. On a regular basis, the Company evaluates the assumptions, judgments and estimates. Actual results may differ from these estimates.
The interim financial information is unaudited, but reflects all normal recurring adjustments that are, in the opinion of management, necessary to fairly present the information set forth herein. The interim consolidated financial statements should be read in conjunction with the audited consolidated financial statements and related notes included in the Company's Annual Report on Form 10-K for the year ended December 31, 2016 . Interim results are not necessarily indicative of the results for a full year.
The Company has three reportable segments: Domestic streaming, International streaming and Domestic DVD, all of which derive revenue from monthly membership fees. See Note 10 for further detail on the Company's segments.
There have been no material changes in the Company's significant accounting policies, other than the adoption of Accounting Standards Update ("ASU") 2016-09 described below and in Note 9, as compared to the significant accounting policies described in the Company's Annual Report on Form 10-K for the year ended December 31, 2016 .
In March 2016, the Financial Accounting Standards Board ("FASB") issued ASU 2016-09, Improvements to Employee Share-Based Payment Accounting , which amends Accounting Standards Codification ("ASC") Topic 718, Compensation - Stock Compensation . ASU 2016-09 simplifies several aspects of the accounting for share-based payment transactions, including the income tax consequences, classification of awards as either equity or liabilities, and classification on the statement of cash flows. Under the new standard, all excess tax benefits and tax deficiencies are recorded as a component of the provision for income taxes in the reporting period in which they occur. Additionally, ASU 2016-09 requires that the Company present excess tax benefits on the Statement of Cash Flows as an operating activity. ASU 2016-09 is effective for fiscal years beginning after December 15, 2016. The Company adopted ASU 2016-09 in the first quarter of 2017 and elected to apply this adoption prospectively. Prior periods have not been adjusted. See Note 9 for information regarding the impact on the Company's financial statements.
In May 2014, the FASB issued ASU 2014-09, Revenue from Contracts with Customers (Topic 606) which amended the existing accounting standards for revenue recognition. ASU 2014-09 establishes principles for recognizing revenue upon the transfer of promised goods or services to customers, in an amount that reflects the expected consideration received in exchange for those goods or services. In July 2015, the FASB deferred the effective date for annual reporting periods beginning after December 15, 2017 (including interim reporting periods within those periods). Early adoption is permitted to the original effective date for annual reporting periods beginning after December 15, 2016 (including interim reporting periods within those periods). The amendments may be applied retrospectively to each prior period (full retrospective) or retrospectively with the cumulative effect recognized as of the date of initial application (modified retrospective). The Company will adopt ASU 2014-09 in the first quarter of 2018 and has updated its planned adoption method to the modified retrospective approach. Because the Company's primary source of revenues is from monthly membership fees which are recognized ratably over each monthly membership period, the Company does not expect the impact on its consolidated financial statements to be material.
In February 2016, the FASB issued ASU 2016-02, Leases (Topic 842) in order to increase transparency and comparability among organizations by recognizing lease assets and lease liabilities on the balance sheet for those leases classified as operating leases under previous GAAP. ASU 2016-02 requires that a lessee should recognize a liability to make lease payments (the lease liability) and a right-of-use asset representing its right to use the underlying asset for the lease term on the balance sheet. ASU 2016-02 is effective for fiscal years beginning after December 15, 2018 (including interim periods within those periods) using a modified retrospective approach and early adoption is permitted. The Company will adopt ASU 2016-02 in the first quarter of 2019. Although the Company is in the process of evaluating the impact of adoption of the ASU on its consolidated financial statements, the Company currently believes the most significant changes will be related to the recognition of new right-of-use assets and lease liabilities on the Company's balance sheet for real estate operating leases.
In November 2016, the FASB issued ASU 2016-18, Restricted Cash , which requires amounts generally described as restricted cash and restricted cash equivalents be included with cash and cash equivalents when reconciling the total beginning and ending amounts for the periods shown on the statement of cash flows. ASU 2016-08 is effective for fiscal years beginning after December 15, 2017 (including interim periods
7
Table of Contents
within those periods) using a retrospective transition method to each period presented and early adoption is permitted. The Company will adopt ASU 2016-18 in the first quarter of 2018 and does not expect the impact on its consolidated financial statements to be material.
2. Earnings Per Share
Basic earnings per share is computed using the weighted-average number of outstanding shares of common stock during the period. Diluted earnings per share is computed using the weighted-average number of outstanding shares of common stock and, when dilutive, potential common shares outstanding during the period. Potential common shares consist of incremental shares issuable upon the assumed exercise of stock options. The computation of earnings per share is as follows:
| Three Months Ended |
| Six Months Ended | ||||||||||||
| June 30, |
| June 30, |
| June 30, |
| June 30, | ||||||||
| (in thousands, except per share data) | ||||||||||||||
Basic earnings per share: |
|
|
|
|
|
|
| ||||||||
Net income | $ | 65,600 | |
| $ | 40,755 | |
| $ | 243,822 | |
| $ | 68,413 | |
Shares used in computation: |
|
|
|
|
|
|
| ||||||||
Weighted-average common shares outstanding | 431,396 | |
| 428,483 | |
| 431,000 | |
| 428,300 | | ||||
Basic earnings per share | $ | 0.15 | |
| $ | 0.10 | |
| $ | 0.57 | |
| $ | 0.16 | |
|
|
|
|
|
|
|
| ||||||||
Diluted earnings per share: |
|
|
|
|
|
|
| ||||||||
Net income | $ | 65,600 | |
| $ | 40,755 | |
| $ | 243,822 | |
| $ | 68,413 | |
Shares used in computation: |
|
|
|
|
|
|
| ||||||||
Weighted-average common shares outstanding | 431,396 | |
| 428,483 | |
| 431,000 | |
| 428,300 | | ||||
Employee stock options | 14,866 | |
| 9,671 | |
| 14,862 | |
| 9,773 | | ||||
Weighted-average number of shares | 446,262 | |
| 438,154 | |
| 445,862 | |
| 438,073 | | ||||
Diluted earnings per share | $ | 0.15 | |
| $ | 0.09 | |
| $ | 0.55 | |
| $ | 0.16 | |
Employee stock options with exercise prices greater than the average market price of the common stock were excluded from the diluted calculation as their inclusion would have been anti-dilutive. The following table summarizes the potential common shares excluded from the diluted calculation:
| Three Months Ended |
| Six months ended | ||||||||
| June 30, |
| June 30, |
| June 30, |
| June 30, | ||||
| (in thousands) | ||||||||||
Employee stock options | 215 | |
| 1,930 | |
| 226 | |
| 1,634 | |
8
Table of Contents
3. Short-term Investments
The Company's investment policy is consistent with the definition of available-for-sale securities. The Company does not buy and hold securities principally for the purpose of selling them in the near future. The Company's policy is focused on the preservation of capital, liquidity and investment return. From time to time, the Company may sell certain securities but the objectives are generally not to generate profits on short-term differences in price. The following tables summarize, by major security type, the Company's assets that are measured at fair value on a recurring basis, the category using the fair value hierarchy and where they are classified on the Consolidated Balance Sheets:
| As of June 30, 2017 | ||||||||||||||||||||||||||
| Amortized |
| Gross |
| Gross |
| Estimated |
| Cash and cash equivalents |
| Short-term investments |
| Non-current assets (1) | ||||||||||||||
| (in thousands) | ||||||||||||||||||||||||||
Cash | $ | 1,348,434 | |
| $ | - | |
| $ | - | |
| $ | 1,348,434 | |
| $ | 1,344,799 | |
| $ | - | |
| $ | 3,635 | |
Level 1 securities: |
|
|
|
|
|
|
|
|
|
|
|
|
| ||||||||||||||
Money market funds | 275,248 | |
| | |
| - | |
| 275,248 | |
| 273,978 | |
| - | |
| 1,270 | | |||||||
Level 2 securities: |
|
|
|
|
|
|
|
|
|
|
|
|
| ||||||||||||||
Time Deposits | 300,000 | |
| - | |
| - | |
| 300,000 | |
| 300,000 | |
| - | |
| - | | |||||||
Corporate debt securities | 189,190 | |
| 228 | |
| (392 | ) |
| 189,026 | |
| - | |
| 189,026 | |
| - | | |||||||
Government securities | 35,906 | |
| - | |
| (169 | ) |
| 35,737 | |
| - | |
| 35,737 | |
| - | | |||||||
Agency securities | 21,569 | |
| - | |
| (207 | ) |
| 21,362 | |
| - | |
| 21,362 | |
| - | | |||||||
Total | $ | 2,170,347 | |
| $ | 228 | |
| $ | (768 | ) |
| $ | 2,169,807 | |
| $ | 1,918,777 | |
| $ | 246,125 | |
| $ | 4,905 | |
| As of December 31, 2016 | ||||||||||||||||||||||||||
| Amortized Cost |
| Gross Unrealized Gains |
| Gross Unrealized Losses |
| Estimated Fair Value |
| Cash and cash equivalents |
| Short-term investments |
| Non-current assets (1) | ||||||||||||||
| (in thousands) | ||||||||||||||||||||||||||
Cash | $ | 1,267,523 | |
| $ | - | |
| $ | - | |
| $ | 1,267,523 | |
| $ | 1,264,126 | |
| $ | - | |
| $ | 3,397 | |
Level 1 securities: |
|
|
|
|
|
|
|
|
|
|
|
|
| ||||||||||||||
Money market funds | 204,967 | |
| - | |
| - | |
| 204,967 | |
| 203,450 | |
| - | |
| 1,517 | | |||||||
Level 2 securities: |
|
|
|
|
|
|
|
|
|
|
|
|
| ||||||||||||||
Corporate debt securities | 199,843 | |
| 110 | |
| (731 | ) |
| 199,222 | |
| - | |
| 199,222 | |
| - | | |||||||
Government securities | 35,944 | |
| - | |
| (128 | ) |
| 35,816 | |
| - | |
| 35,816 | |
| - | | |||||||
Certificates of deposit | 9,833 | |
| - | |
| - | |
| 9,833 | |
| - | |
| 9,833 | |
| - | | |||||||
Agency securities | 21,563 | |
| - | |
| (228 | ) |
| 21,335 | |
| - | |
| 21,335 | |
| - | | |||||||
Total | $ | 1,739,673 | |
| $ | 110 | |
| $ | (1,087 | ) |
| $ | 1,738,696 | |
| $ | 1,467,576 | |
| $ | 266,206 | |
| $ | 4,914 | |
(1) Primarily restricted cash that is related to workers compensation deposits and letter of credit agreements.
Fair value is a market-based measurement that is determined based on the assumptions that market participants would use in pricing an asset or liability. The hierarchy level assigned to each security in the Company's available-for-sale portfolio and cash equivalents is based on its assessment of the transparency and reliability of the inputs used in the valuation of such instrument at the measurement date. The fair value of available-for-sale securities and cash equivalents included in the Level 1 category is based on quoted prices that are readily and regularly available in an active market. The fair value of available-for-sale securities included in the Level 2 category is based on observable inputs, such as quoted prices for similar assets at the measurement date; quoted prices in markets that are not active; or other inputs that are observable, either directly or indirectly. These values were obtained from an independent pricing service and were evaluated using pricing models that vary by asset class and may incorporate available trade, bid and other market information and price quotes from well-established independent pricing vendors and broker-dealers. The Company's procedures include controls to ensure that appropriate fair values are recorded, such as comparing prices obtained from multiple independent sources. See Note 5 to the consolidated financial statements for further information regarding the fair value of the Company's senior notes.
Because the Company does not intend to sell the investments that are in an unrealized loss position and it is not likely that the Company will be required to sell any investments before recovery of their amortized cost basis, the Company does not consider those investments with an unrealized loss to be other-than-temporarily impaired at June 30, 2017 or December 31, 2016 , respectively. There were no material other-than-temporary impairments or credit losses related to available-for-sale securities in the three and six months ended June 30, 2017 and 2016 , respectively. In addition, there were no material gross realized gains or losses in the three and six months ended June 30, 2017 and 2016 , respectively.
9
Table of Contents
The estimated fair value of short-term investments by contractual maturity as of June 30, 2017 is as follows:
| (in thousands) | ||
Due within one year | $ | 55,718 | |
Due after one year and through five years | 190,407 | | |
Total short-term investments | $ | 246,125 | |
4. Balance Sheet Components
Content Assets
Content assets consisted of the following:
| As of | ||||||
| June 30, |
| December 31, | ||||
| (in thousands) | ||||||
Licensed content, net | $ | 11,195,034 | |
| $ | 9,595,315 | |
|
|
|
| ||||
Produced content, net | | |
| | | ||
Released, less amortization | 861,967 | |
| 335,400 | | ||
In production | 1,057,283 | |
| 1,010,463 | | ||
In development | 95,240 | |
| 34,215 | | ||
| 2,014,490 | |
| 1,380,078 | | ||
DVD, net | 18,061 | |
| 25,415 | | ||
Total | $ | 13,227,585 | |
| $ | 11,000,808 | |
|
|
|
| ||||
Current content assets, net | $ | 4,149,111 | |
| $ | 3,726,307 | |
Non-current content assets, net | $ | 9,078,474 | |
| $ | 7,274,501 | |
Produced content is included in "Non-current content assets, net" on the Consolidated Balance Sheets. Certain original content is licensed and therefore not included in produced content. Of the produced content that has been released, approximately 29% , 77% and over 80% of the unamortized cost is expected to be amortized over the next twelve, thirty-six and forty-eight months, respectively. The amount of accrued participations and residuals to be paid during the next twelve months is not material.
Property and Equipment, Net
Property and equipment and accumulated depreciation consisted of the following:
|
| As of |
|
| ||||||
|
| June 30, |
| December 31, |
| Estimated Useful Lives | ||||
|
| (in thousands) |
|
| ||||||
Information technology assets |
| $ | 213,447 | |
| $ | 185,345 | |
| 3 years |
Furniture and fixtures |
| 45,374 | |
| 32,185 | |
| 3 years | ||
Buildings |
| 40,681 | |
| 40,681 | |
| 30 years | ||
Leasehold improvements |
| 205,514 | |
| 107,945 | |
| Over life of lease | ||
DVD operations equipment |
| 70,152 | |
| 70,152 | |
| 5 years | ||
Corporate aircraft |
| 29,304 | |
| - | |
| 8 years | ||
Capital work-in-progress |
| 11,409 | |
| 108,296 | |
| | ||
Property and equipment, gross |
| 615,881 | |
| 544,604 | |
|
| ||
Less: Accumulated depreciation |
| (306,050 | ) |
| (294,209 | ) |
|
| ||
Property and equipment, net |
| $ | 309,831 | |
| $ | 250,395 | |
|
|
10
The decrease in capital work-in-progress from December 31, 2016 is primarily due to leasehold improvements for the Company's expanded Los Gatos, California headquarters and the Company's new Los Angeles, California facility, both of which were placed into operation in the first quarter of 2017.
5. Long-term Debt
As of June 30, 2017 , the Company had aggregate outstanding long-term debt of $4,836.5 million , net of $48.2 million of issuance costs, with varying maturities (the "Notes"). Each of the Notes were issued at par and are senior unsecured obligations of the Company. Interest is payable semi-annually at fixed rates.
The following table provides a summary of the Company's Notes and the fair values based on quoted market prices in less active markets as of June 30, 2017 and December 31, 2016 :
|
|
|
|
|
|
|
|
| Level 2 Fair Value as of | ||||||||
| Principal Amount at Par |
| Issuance Date |
| Maturity |
| Interest Payment Dates |
| June 30, 2017 |
| December 31, 2016 | ||||||
| (in millions) |
|
|
|
|
|
|
| (in millions) | ||||||||
3.625% Senior Notes (1) | $ | 1,484.7 | |
| May 2017 |
| 2027 |
| May 15 and November 15 |
| $ | 1,513 | |
| $ | - | |
4.375% Senior Notes | 1,000.0 | |
| October 2016 |
| 2026 |
| May 15 and November 15 |
| 1,004 | |
| 975 | | |||
5.50% Senior Notes | 700.0 | |
| February 2015 |
| 2022 |
| April 15 and October 15 |
| 762 | |
| 758 | | |||
5.875% Senior Notes | 800.0 | |
| February 2015 |
| 2025 |
| April 15 and October 15 |
| 888 | |
| 868 | | |||
5.750% Senior Notes | 400.0 | |
| February 2014 |
| 2024 |
| March 1 and September 1 |
| 438 | |
| 431 | | |||
5.375% Senior Notes | 500.0 | |
| February 2013 |
| 2021 |
| February 1 and August 1 |
| 541 | |
| 539 | | |||
| $ | 4,884.7 | |
|
|
|
|
|
|
|
|
|
| ||||
(1) Debt is denominated in euro with a €1,300 million aggregate principal amount and is remeasured into U.S. dollars at each balance sheet date. Total proceeds were $1,420.5 million and remeasurement loss on long-term debt was $64.2 million for the three months ending June 30, 2017 .
Each of the Notes are repayable in whole or in part upon the occurrence of a change of control, at the option of the holders, at a purchase price in cash equal to 101% of the principal plus accrued interest. The Company may redeem the Notes prior to maturity in whole or in part at an amount equal to the principal amount thereof plus accrued and unpaid interest and an applicable premium. The Notes include, among other terms and conditions, limitations on the Company's ability to create, incur or allow certain liens; enter into sale and lease-back transactions; create, assume, incur or guarantee additional indebtedness of certain of the Company's subsidiaries; and consolidate or merge with, or convey, transfer or lease all or substantially all of the Company's and its subsidiaries assets, to another person. As of June 30, 2017 and December 31, 2016 , the Company was in compliance with all related covenants.
6. Commitments and Contingencies
Streaming Content
As of June 30, 2017 , the Company had $15.7 billion of obligations comprised of $4.1 billion included in "Current content liabilities" and $3.4 billion of "Non-current content liabilities" on the Consolidated Balance Sheets and $8.2 billion of obligations that are not reflected on the Consolidated Balance Sheets as they did not yet meet the criteria for asset recognition.
As of December 31, 2016 , the Company had $14.5 billion of obligations comprised of $3.6 billion included in "Current content liabilities" and $2.9 billion of "Non-current content liabilities" on the Consolidated Balance Sheets and $8.0 billion of obligations that are not reflected on the Consolidated Balance Sheets as they did not yet meet the criteria for asset recognition.
The expected timing of payments for these streaming content obligations is as follows:
Table of Contents
| As of | ||||||
| June 30, |
| December 31, | ||||
| (in thousands) | ||||||
Less than one year | $ | 6,592,517 | |
| $ | 6,200,611 | |
Due after one year and through three years | 7,461,470 | |
| 6,731,336 | | ||
Due after three years and through five years | 1,488,760 | |
| 1,386,934 | | ||
Due after five years | 156,640 | |
| 160,606 | | ||
Total streaming content obligations | $ | 15,699,387 | |
| $ | 14,479,487 | |
Content obligations include amounts related to the acquisition, licensing and production of streaming content. Obligations that are in non-U.S. dollar currencies are translated to the U.S. dollar at period end rates. An obligation for the production of content includes non-cancelable commitments under creative talent and employment agreements. An obligation for the acquisition and licensing of content is incurred at the time the Company enters into an agreement to obtain future titles. Once a title becomes available, a content liability is recorded on the Consolidated Balance Sheets. Certain agreements include the obligation to license rights for unknown future titles, the ultimate quantity and/or fees for which are not yet determinable as of the reporting date. Traditional film output deals, like the U.S. output deal with Disney, or certain TV series license agreements where the number of seasons to be aired is unknown, are examples of such license agreements. The Company does not include any estimated obligation for these future titles beyond the known minimum amount. However, the unknown obligations are expected to be significant.
Legal Proceedings
From time to time, in the normal course of its operations, the Company is subject to litigation matters and claims, including claims relating to employee relations, business practices and patent infringement. Litigation can be expensive and disruptive to normal business operations. Moreover, the results of complex legal proceedings are difficult to predict and the Company's view of these matters may change in the future as the litigation and events related thereto unfold. The Company expenses legal fees as incurred. The Company records a provision for contingent losses when it is both probable that a liability has been incurred and the amount of the loss can be reasonably estimated. An unfavorable outcome to any legal matter, if material, could have an adverse effect on the Company's operations or its financial position, liquidity or results of operations.
The Company is involved in litigation matters not listed herein but does not consider the matters to be material either individually or in the aggregate at this time. The Company's view of the matters not listed may change in the future as the litigation and events related thereto unfold.
Indemnification
In the ordinary course of business, the Company has entered into contractual arrangements under which it has agreed to provide indemnification of varying scope and terms to business partners and other parties with respect to certain matters, including, but not limited to, losses arising out of the Company's breach of such agreements and out of intellectual property infringement claims made by third parties. In these circumstances, payment may be conditional on the other party making a claim pursuant to the procedures specified in the particular contract.
The Company's obligations under these agreements may be limited in terms of time or amount, and in some instances, the Company may have recourse against third parties for certain payments. In addition, the Company has entered into indemnification agreements with its directors and certain of its officers that will require it, among other things, to indemnify them against certain liabilities that may arise by reason of their status or service as directors or officers. The terms of such obligations vary.
It is not possible to make a reasonable estimate of the maximum potential amount of future payments under these or similar agreements due to the conditional nature of the Company's obligations and the unique facts and circumstances involved in each particular agreement. No amount has been accrued in the accompanying consolidated financial statements with respect to these indemnification obligations.
7. Stockholders' Equity
Stock Option Plan
In June 2011, the Company adopted the 2011 Stock Plan. The 2011 Stock Plan provides for the grant of incentive stock options to employees and for the grant of non-statutory stock options, stock appreciation rights, restricted stock and restricted stock units to employees, directors and consultants. As of June 30, 2017 , 11.9 million shares were reserved for future grants under the 2011 Stock Plan.
12
Table of Contents
A summary of the activities related to the Company's stock option plans is as follows:
|
|
| Options Outstanding |
|
|
|
| ||||||||
| Shares |
| Number of |
| Weighted- (per share) |
| Weighted-Average Remaining |
| Aggregate | ||||||
Balances as of December 31, 2016 | 13,289,953 | |
| 22,437,347 | |
| $ | 44.83 | |
|
|
|
| ||
Granted | (1,374,941 | ) |
| 1,374,941 | |
| 145.41 | |
|
|
|
| |||
Exercised | - | |
| (1,695,532 | ) |
| 23.11 | |
|
|
|
| |||
Expired | - | |
| (1,561 | ) |
| $ | 3.25 | |
|
|
|
| ||
Balances as of June 30, 2017 | 11,915,012 | |
| 22,115,195 | |
| $ | 52.75 | |
| 6.11 |
| $ | 2,141,769 | |
Vested and exercisable as of June 30, 2017 |
|
| 22,115,195 | |
| $ | 52.75 | |
| 6.11 |
| $ | 2,141,769 | | |
The aggregate intrinsic value in the table above represents the total pretax intrinsic value (the difference between the Company's closing stock price on the last trading day of the second quarter of 2017 and the exercise price, multiplied by the number of in-the-money options) that would have been received by the option holders had all option holders exercised their options on the last trading day of the second quarter of 2017 . This amount changes based on the fair market value of the Company's common stock.
A summary of the amounts related to option exercises, is as follows:
| Three Months Ended |
| Six Months Ended | ||||||||||||
| June 30, |
| June 30, |
| June 30, |
| June 30, | ||||||||
| (in thousands) | ||||||||||||||
Total intrinsic value of options exercised | $ | 101,727 | |
| $ | 37,268 | |
| $ | 208,824 | |
| $ | 68,725 | |
Cash received from options exercised | $ | 14,826 | |
| $ | 4,232 | |
| $ | 39,004 | |
| $ | 7,768 | |
Stock-based Compensation
Stock options granted are exercisable for the full ten year contractual term regardless of employment status. The following table summarizes the assumptions used to value option grants using the lattice-binomial model and the valuation data:
| Three Months Ended |
| Six Months Ended | ||||||||||||
| June 30, |
| June 30, |
| June 30, |
| June 30, | ||||||||
Dividend yield | - | % |
| - | % |
| - | % |
| - | % | ||||
Expected volatility | 34 | % |
| 45 | % |
| 34% - 37% | |
| 45% - 50% | | ||||
Risk-free interest rate | 2.37 | % |
| 1.83 | % |
| 2.37%- 2.45% | |
| 1.83% - 2.04% | | ||||
Suboptimal exercise factor | 2.51 | |
| 2.48 | |
| 2.48 - 2.51 | |
| 2.48 | | ||||
Weighted-average fair value (per share) | $ | 67.21 | |
| $ | 48.38 | |
| $ | 64.67 | |
| $ | 49.52 | |
Total stock-based compensation expense (in thousands) | $ | 44,028 | |
| $ | 44,112 | |
| $ | 88,916 | |
| $ | 86,534 | |
Total income tax impact on provision (in thousands) | $ | 14,477 | |
| $ | 16,571 | |
| $ | 29,178 | |
| $ | 32,534 | |
The Company considers several factors in determining the suboptimal exercise factor, including the historical and estimated option exercise behavior.
The Company calculates expected volatility based solely on implied volatility. The Company believes that implied volatility of publicly traded options in its common stock is more reflective of market conditions, and given consistently high trade volumes of the options, can reasonably be expected to be a better indicator of expected volatility than historical volatility of its common stock.
In valuing shares issued under the Company's employee stock option plans, the Company bases the risk-free interest rate on U.S. Treasury zero-coupon issues with terms similar to the contractual term of the options. The Company does not anticipate paying any cash dividends in the foreseeable future and therefore uses an expected dividend yield of zero in the option valuation model. The Company does not use a post-vesting termination rate as options are fully vested upon grant date.
13
Table of Contents
8. Accumulated Other Comprehensive Loss
The following table summarizes the changes in the accumulated balance of other comprehensive income (loss), net of tax, for the three and six months ended June 30, 2017 :
| Foreign currency |
| Change in unrealized gains on available-for-sale securities |
| Total | ||||||
| (in thousands) | ||||||||||
Balance as of March 31, 2017 | $ | (45,387 | ) |
| $ | (472 | ) |
| $ | (45,859 | ) |
Other comprehensive income before reclassifications | 14,347 | |
| 144 | |
| 14,491 | | |||
Net decrease in other comprehensive loss | 14,347 | |
| 144 | |
| 14,491 | | |||
Balance as of June 30, 2017 | $ | (31,040 | ) |
| $ | (328 | ) |
| $ | (31,368 | ) |
| Foreign currency |
| Change in unrealized gains on available-for-sale securities |
| Total | ||||||
| (in thousands) | ||||||||||
Balance as of December 31, 2016 | $ | (47,966 | ) |
| $ | (599 | ) |
| $ | (48,565 | ) |
Other comprehensive income before reclassifications | 16,926 | |
| 271 | |
| 17,197 | | |||
Net decrease in other comprehensive loss | 16,926 | |
| 271 | |
| 17,197 | | |||
Balance as of June 30, 2017 | $ | (31,040 | ) |
| $ | (328 | ) |
| $ | (31,368 | ) |
The amounts reclassified from accumulated other comprehensive loss were immaterial for the three and six months ended June 30, 2017 .
9. Income Taxes
The effective tax rates for the three months ended June 30, 2017 and 2016 were (370)% and 20% , respectively. The effective tax rate for the six months ended June 30, 2017 and 2016 were (3)% and 25% , respectively. The effective tax rate for the three and six months ended June 30, 2017 differed from the Federal statutory rate primarily due to the recognition of excess tax benefits as a component of the provision for income taxes attributable to the adoption of ASU 2016-09, foreign income taxed at rates lower than the U.S. statutory rate and Federal and California research and development ("R&D") credits, partially offset by state taxes and non-deductible expenses. The effective tax rate for the three and six months ended June 30, 2016 differed from the Federal statutory rate primarily due to Federal and California R&D credits partially offset by state taxes, foreign taxes and non-deductible expenses. The decrease in effective tax rate for the three and six months ended June 30, 2017 as compared to the same period in 2016 was due primarily to the recognition of excess tax benefits attributable to the adoption of ASU 2016-09 and an increase in foreign income taxed at rates lower than the US statutory rate.
Gross unrecognized tax benefits were $29.3 million and $19.7 million as of June 30, 2017 and December 31, 2016 , respectively. The gross unrecognized tax benefits, if recognized by the Company, will result in a reduction of approximately $25.8 million to the provision for income taxes thereby favorably impacting the Company's effective tax rate. As of June 30, 2017 , gross unrecognized tax benefits of $8.9 million was classified as "Other non-current liabilities" and $20.4 million as a reduction to deferred tax assets which was classified as "Other non-current assets" in the Consolidated Balance Sheets. The Company includes interest and penalties related to unrecognized tax benefits within the "Provision (benefit) for income taxes" on the Consolidated Statements of Operations and "Other non-current liabilities" in the Consolidated Balance Sheets. Interest and penalties included in the Company's "Provision (benefit) for income taxes" were not material in any of the periods presented.
Deferred tax assets include $318.2 million and $227.2 million classified as "Other non-current assets" on the Consolidated Balance Sheets as of June 30, 2017 and December 31, 2016 , respectively. In evaluating its ability to realize the net deferred tax assets, the Company considered all available positive and negative evidence, including its past operating results and the forecast of future market growth, forecasted earnings, future taxable income, and prudent and feasible tax planning strategies. As of June 30, 2017 , the Company has a valuation allowance of $21.9 million primarily due to foreign tax credit carryovers. As of December 31, 2016 , it was considered more likely than not that substantially all deferred tax assets would be realized.
As a result of the adoption of ASU 2016-09 in the first quarter of 2017, the Company recorded a cumulative effect adjustment to increase retained earnings by $43.6 million with a corresponding increase to deferred tax assets for the Federal and state net operating losses attributable to excess tax benefits from stock-based compensation which had not been previously recognized. All excess tax benefits and deficiencies in the current and future periods will be recognized as income tax expense in the Company's Consolidated Statement of Operations in the reporting
14
Table of Contents
period in which they occur. This will result in increased volatility in the Company's effective tax rate. For the three and six months ended June 30, 2017 , the Company recognized a discrete tax benefit related to the excess tax benefits from stock-based compensation of $32.8 million and $68.8 million , respectively.
The Company files U.S. Federal, state and foreign tax returns. The Company is currently under examination by the IRS for 2014 and 2015. The 2008 through 2015 state tax returns are subject to examination by state tax authorities. The Company has no significant foreign jurisdiction audits underway. The years 2011 through 2016 remain subject to examination by foreign tax authorities. Given the potential outcome of the current examinations as well as the impact of the current examinations on the potential expiration of the statute of limitations, it is reasonably possible that the balance of unrecognized tax benefits could significantly change within the next twelve months. At this time, an estimate of the range of reasonably possible adjustments to the balance of unrecognized tax benefits cannot be made.
10. Segment Information
The Company has three reportable segments: Domestic streaming, International streaming and Domestic DVD. Segment information is presented in the same manner that the Company's chief operating decision maker ("CODM") reviews the operating results in assessing performance and allocating resources. The Company's CODM reviews revenues and contribution profit (loss) for each of the reportable segments. Contribution profit (loss) is defined as revenues less cost of revenues and marketing expenses incurred by the segment. The Company has aggregated the results of the International operating segments into one reportable segment because these operating segments share similar long-term economic and other qualitative characteristics.
The Domestic streaming segment derives revenues from monthly membership fees for services consisting solely of streaming content to members in the United States. The International streaming segment derives revenues from monthly membership fees for services consisting solely of streaming content to members outside the United States. The Domestic DVD segment derives revenues from monthly membership fees for services consisting solely of DVD-by-mail. Revenues and the related payment card fees are attributed to the operating segment based on the nature of the underlying membership (streaming or DVD) and the geographic region from which the membership originates. There are no internal revenue transactions between the Company's segments.
The vast majority of the cost of revenues relate to content expenses, which include the amortization of streaming content assets and other costs associated with the licensing and acquisition of streaming content. In connection with the Company's global expansion, content acquired, licensed, and produced increasingly includes global rights. The Company allocates this content between the International and Domestic streaming segments based on estimated fair market value. Content expenses for each streaming segment thus include both expenses directly incurred by the segment as well as an allocation of expenses incurred for global or multi-territory rights. Other costs of revenues such as delivery costs are primarily attributed to the operating segment based on amounts directly incurred by the segment. Marketing expenses consist primarily of advertising expenses and payments made to marketing partners, including consumer electronics ("CE") manufacturers, multichannel video programming distributors ("MVPDs"), mobile operators and internet service providers ("ISPs"), which are generally included in the segment in which the expenditures are directly incurred.
The Company's long-lived tangible assets were located as follows:
| As of | ||||||
| June 30, |
| December 31, 2016 | ||||
| (in thousands) | ||||||
United States | $ | 286,897 | |
| $ | 236,977 | |
International | 22,934 | |
| 13,418 | | ||
15
Table of Contents
The following tables represent segment information for the three and six months ended June 30, 2017 :
| As of/ Three Months Ended June 30, 2017 | ||||||||||||||
| Domestic |
| International |
| Domestic |
| Consolidated | ||||||||
| (in thousands) | ||||||||||||||
Total memberships at end of period (1) | 51,921 | |
| 52,031 | |
| 3,758 | |
| - | | ||||
Revenues | $ | 1,505,499 | |
| $ | 1,165,228 | |
| $ | 114,737 | |
| $ | 2,785,464 | |
Cost of revenues | 831,962 | |
| 1,017,612 | |
| 52,734 | |
| 1,902,308 | | ||||
Marketing | 113,608 | |
| 160,715 | |
| - | |
| 274,323 | | ||||
Contribution profit (loss) | $ | 559,929 | |
| $ | (13,099 | ) |
| $ | 62,003 | |
| $ | 608,833 | |
Other operating expenses |
|
|
|
|
|
| 481,026 | | |||||||
Operating income |
|
|
|
|
|
| 127,807 | | |||||||
Other income (expense) |
|
|
|
|
|
| (113,845 | ) | |||||||
Benefit from income taxes |
|
|
|
|
|
| (51,638 | ) | |||||||
Net income |
|
|
|
|
|
| $ | 65,600 | | ||||||
| As of/ Six Months Ended June 30, 2017 | ||||||||||||||
| Domestic |
| International |
| Domestic |
| Consolidated | ||||||||
| (in thousands) | ||||||||||||||
Total memberships at end of period (1) | 51,921 | |
| 52,031 | |
| 3,758 | |
| - | | ||||
Revenues | $ | 2,975,541 | |
| $ | 2,211,427 | |
| $ | 235,131 | |
| $ | 5,422,099 | |
Cost of revenues | 1,581,450 | |
| 1,864,929 | |
| 112,953 | |
| 3,559,332 | | ||||
Marketing | 228,646 | |
| 316,947 | |
| - | |
| 545,593 | | ||||
Contribution profit | $ | 1,165,445 | |
| $ | 29,551 | |
| $ | 122,178 | |
| $ | 1,317,174 | |
Other operating expenses |
|
|
|
|
|
| 932,425 | | |||||||
Operating income |
|
|
|
|
|
| 384,749 | | |||||||
Other income (expense) |
|
|
|
|
|
| (146,995 | ) | |||||||
Benefit from income taxes |
|
|
|
|
|
| (6,068 | ) | |||||||
Net income |
|
|
|
|
|
| $ | 243,822 | | ||||||
The following tables represent segment information for the three and six months ended June 30, 2016 :
| As of/ Three Months Ended June 30, 2016 | ||||||||||||||
| Domestic |
| International |
| Domestic |
| Consolidated | ||||||||
| (in thousands) | ||||||||||||||
Total memberships at end of period (1) | 47,129 | |
| 36,048 | |
| 4,530 | |
| - | | ||||
Revenues | $ | 1,208,271 | |
| $ | 758,201 | |
| $ | 138,732 | |
| $ | 2,105,204 | |
Cost of revenues | 707,106 | |
| 698,162 | |
| 67,830 | |
| 1,473,098 | | ||||
Marketing | 86,806 | |
| 129,223 | |
| - | |
| 216,029 | | ||||
Contribution profit (loss) | $ | 414,359 | |
| $ | (69,184 | ) |
| $ | 70,902 | |
| $ | 416,077 | |
Other operating expenses |
|
|
|
|
|
| 345,707 | | |||||||
Operating income |
|
|
|
|
|
| 70,370 | | |||||||
Other income (expense) |
|
|
|
|
|
| (19,138 | ) | |||||||
Provision for income taxes |
|
|
|
|
|
| 10,477 | | |||||||
Net income |
|
|
|
|
|
| $ | 40,755 | | ||||||
16
Table of Contents
| As of/ Six Months Ended June 30, 2016 | ||||||||||||||
| Domestic |
| International |
| Domestic |
| Consolidated | ||||||||
| (in thousands) | ||||||||||||||
Total memberships at end of period (1) | 47,129 | |
| 36,048 | |
| 4,530 | |
| - | | ||||
Revenues | $ | 2,369,512 | |
| $ | 1,409,949 | |
| $ | 283,479 | |
| $ | 4,062,940 | |
Cost of revenues | 1,373,652 | |
| 1,328,061 | |
| 140,925 | |
| 2,842,638 | | ||||
Marketing | 168,748 | |
| 255,291 | |
| - | |
| 424,039 | | ||||
Contribution profit (loss) | $ | 827,112 | |
| $ | (173,403 | ) |
| $ | 142,554 | |
| $ | 796,263 | |
Other operating expenses |
|
|
|
|
|
| 676,440 | | |||||||
Operating income |
|
|
|
|
|
| 119,823 | | |||||||
Other income (expense) |
|
|
|
|
|
| (28,712 | ) | |||||||
Provision for income taxes |
|
|
|
|
|
| 22,698 | | |||||||
Net income |
|
|
|
|
|
| $ | 68,413 | | ||||||
The following table represents the amortization of content assets:
| Domestic Streaming |
| International Streaming |
| Domestic DVD |
| Consolidated | ||||||||
| (in thousands) | ||||||||||||||
Three months ended June 30, |
|
|
|
|
|
|
| ||||||||
2017 | $ | 696,688 | |
| $ | 854,106 | |
| $ | 16,511 | |
| $ | 1,567,305 | |
2016 | 581,390 | |
| 593,971 | |
| 20,021 | |
| 1,195,382 | | ||||
Six months ended June 30, |
|
|
|
|
|
|
| ||||||||
2017 | 1,305,436 | |
| 1,551,041 | |
| 35,109 | |
| 2,891,586 | | ||||
2016 | 1,112,129 | |
| 1,121,753 | |
| 40,462 | |
| 2,274,344 | | ||||
(1) | A membership (also referred to as a subscription or a member) is defined as the right to receive Netflix service following sign-up and a method of payment being provided. Memberships are assigned to territories based on the geographic location used at time of sign-up as determined by the Company's internal systems, which utilize industry standard geo-location technology. The Company offers free-trial memberships to certain new and rejoining members. Total members include those who are on a free-trial as long as a method of payment has been provided. A membership is canceled and ceases to be reflected in the above metrics as of the effective cancellation date. Voluntary cancellations become effective at the end of the prepaid membership period, while involuntary cancellation of the service, as a result of a failed method of payment, becomes effective immediately. |
17
Table of Contents
Item 2. | Management's Discussion and Analysis of Financial Condition and Results of Operations |
Forward-Looking Statements
This Quarterly Report on Form 10-Q contains forward-looking statements within the meaning of the federal securities laws. These forward-looking statements include, but are not limited to statements regarding: our core strategy; the impact of, and the Company's response to, new accounting standards; content amortization; pricing changes; dividends; impact of foreign currency and exchange rate fluctuations, including on net income, revenues and average revenues per paying member; investments in global streaming, including original content; impact of content on membership growth; cash use in connection with the acquisition, licensing and production of content; liquidity and free cash flow; unrecognized tax benefits; deferred tax assets; effective tax rate; accessing and obtaining additional capital; accounting treatment for changes related to content assets; and future contractual obligations, including unknown streaming content obligations and timing of payments. These forward-looking statements are subject to risks and uncertainties that could cause actual results and events to differ materially from those included in forward-looking statements. Factors that might cause or contribute to such differences include, but are not limited to, those discussed in our Annual Report on Form 10-K for the year ended December 31, 2016 filed with the Securities and Exchange Commission ("SEC") on January 27, 2017, in particular the risk factors discussed under the heading "Risk Factors" in Part I, Item IA.
We assume no obligation to revise or publicly release any revision to any forward-looking statements contained in this Quarterly Report on Form 10-Q, unless required by law.
Investors and others should note that we announce material financial information to our investors using our investor relations Web site (http://ir.netflix.com), SEC filings, press releases, public conference calls and webcasts. We use these channels, as well as social media, to communicate with our members and the public about our company, our services and other issues. It is possible that the information we post on social media could be deemed to be material information. Therefore, we encourage investors, the media, and others interested in our company to review the information we post on the United States ("U.S.") social media channels listed on our investor relations Web site.
Overview
We are the world's leading internet television network with 104 million streaming members in over 190 countries enjoying more than 125 million hours of TV shows and movies per day, including original series, documentaries and feature films. Members can watch as much as they want, anytime, anywhere, on nearly any internet-connected screen. Members can play, pause and resume watching, all without commercials or commitments. Additionally, in the U.S., our members can receive DVDs delivered quickly to their homes.
We are a pioneer in the internet delivery of TV shows and movies, launching our streaming service in 2007. Since this launch, we have developed an ecosystem for internet-connected screens and have added increasing amounts of content that enable consumers to enjoy TV shows and movies directly on their internet-connected screens. As a result of these efforts, we have experienced growing consumer acceptance of, and interest in, the delivery of TV shows and movies directly over the internet. Historically, the first and fourth quarters (October through March) represent our greatest membership growth across our Domestic and International streaming segments. Our membership growth may be impacted by the release of certain high-profile original content, which may affect historical seasonal patterns. Internationally, we expect each market to demonstrate more predictable seasonal patterns as our service offering in each market becomes more established and we have a longer history to assess such patterns.
Our core strategy is to grow our streaming membership business globally within the parameters of our profit margin targets. We are continuously improving our members' experience by expanding our streaming content with a focus on a programming mix of content that delights our members. In addition, we are perpetually enhancing our user interface and extending our streaming service to more internet-connected screens. Our members can also download a selection of titles for offline viewing.
Results of Operations
The following represents our consolidated performance highlights:
| As of/ Three Months Ended |
| Change | |||||||||||
| June 30, |
| June 30, |
| Q2'17 vs. Q2'16 | |||||||||
| (in thousands, except revenue per membership and percentages) | |||||||||||||
Global streaming memberships at end of period | 103,952 | |
| 83,177 | |
| 20,775 | |
| 25 | % | |||
Global streaming average monthly revenue per paying membership | $ | 9.21 | |
| $ | 8.32 | |
| $ | 0.89 | |
| 11 | % |
Revenues | 2,785,464 | |
| 2,105,204 | |
| 680,260 | |
| 32 | % | |||
Global operating income | 127,807 | |
| 70,370 | |
| 57,437 | |
| 82 | % | |||
Global operating margin | 4.6 | % |
| 3.3 | % |
| 1.3 | % |
| 39 | % | |||
Net income | 65,600 | |
| 40,755 | |
| 24,845 | |
| 61 | % | |||
18
Table of Contents
Consolidated revenues for the three months ended June 30, 2017 increased $680.3 million as compared to the three months ended June 30, 2016 due to growth in the average number of paid streaming memberships globally, the majority of which was growth in our international memberships reflecting our expansion and focus on Netflix as a global internet TV network. In addition, the average monthly revenue per paying streaming membership increased primarily due to price changes and plan mix. The increase in operating income for the three months ended June 30, 2017 as compared to the same period in 2016 was due primarily to increased revenues partially offset by increased content expenses as we continue to acquire, license and produce content, including more Netflix originals, as well as increased headcount costs to support continued improvements in our streaming service, our international expansion, and increased content production activities. The increase in net income was comprised of an increase in operating income and an increase in the tax benefit primarily due to the adoption of ASU 2016-09 in the first quarter of 2017, partially offset by an increase in interest expense primarily due to the higher principal of notes outstanding and an increase in foreign exchange losses primarily due to the remeasurement of our euro denominated senior notes.
We offer three types of streaming membership plans. In the U.S. our "basic" plan is priced at $7.99 per month and includes access to standard definition quality streaming on a single screen at a time. Our "standard" plan is our most popular streaming plan and is priced at $9.99 per month and includes access to high definition quality streaming on two screens concurrently. Our "premium" plan is priced at $11.99 per month and includes access to high definition and ultra-high definition quality content on four screens concurrently. Internationally, the membership plans are structured similarly to the U.S. and range in price from the U.S. dollar equivalent of approximately $5.00 per month to $18.00 per month.
We expect that from time to time the prices of our membership plans in each country may change. For instance, in May 2014, in the U.S., we increased the price of our standard plan from $7.99 per month to $8.99 per month with existing memberships grandfathered for a two year period. In October 2015, in the U.S., we increased the price of this same standard plan from $8.99 per month to $9.99 per month with existing memberships grandfathered for a one year period. In 2016, we phased out grandfathered pricing, giving members the option of electing the basic streaming plan at $7.99 per month, continuing on the standard streaming plan at the higher price of $9.99 per month, or electing the premium plan at $11.99 per month.
The following represents the key elements to our segment results of operations:
• | We define contribution profit (loss) as revenues less cost of revenues and marketing expenses incurred by the segment. We believe this is an important measure of our operating segment performance as it represents each segment's performance before global corporate costs. |
• | For the Domestic and International streaming segments, content expenses, which include the amortization of the streaming content assets and other expenses associated with the licensing and acquisition of streaming content, represent the vast majority of cost of revenues. Streaming content rights were generally obtained for our current geographic regions. As we expanded internationally, we obtained additional rights for new geographies. With our global expansion, we now aspire to obtain global rights for our content. We allocate this content between the Domestic and International streaming segments based on estimated fair market value. Other cost of revenues such as streaming delivery expenses, customer service and payment processing fees, including those we pay to our integrated payment partners, tend to be lower as a percentage of total cost of revenues. We have built our own global content delivery network ("Open Connect") to help us efficiently stream a high volume of content to our members over the internet. Streaming delivery expenses, therefore, include equipment costs related to Open Connect and all third-party costs, such as cloud computing costs, associated with delivering streaming content over the internet. Cost of revenues in the Domestic DVD segment consist primarily of delivery expenses, content expenses, including amortization of DVD content assets and revenue sharing expenses, and other expenses associated with our DVD processing and customer service centers. Delivery expenses for the Domestic DVD segment consist of the postage costs to mail DVDs to and from our members and the packaging and label costs for the mailers. |
• | For the Domestic and International streaming segments, marketing expenses consist primarily of advertising expenses and revenue sharing payments made to our marketing partners, including CE manufacturers, MVPDs, mobile operators and ISPs. Advertising expenses include promotional activities such as digital and television advertising. Marketing expenses are incurred by our Domestic and International streaming segments given our focus on building consumer awareness of the streaming offerings, and in particular our original content. Marketing expenses incurred by our International streaming segment have been significant and fluctuate dependent upon the number of international territories in which our streaming service is offered and the timing of the launch of new territories. |
• | We have demonstrated our ability to grow domestic streaming contribution margin as evidenced by the increase in contribution margin from 17% in 2012 to 37% in the second quarter of 2017 . As a result of our focus on growing the streaming segments, contribution margins for the Domestic and International streaming segments are lower than for our Domestic DVD segment. |
19
Table of Contents
Domestic Streaming Segment
Three months ended June 30, 2017 as compared to the three months ended June 30, 2016
|
| As of/ Three Months Ended |
| Change | |||||||||||
|
| June 30, |
| June 30, |
| Q2'17 vs. Q2'16 | |||||||||
|
| (in thousands, except revenue per membership and percentages) | |||||||||||||
Memberships: |
|
|
|
|
|
|
|
| |||||||
Net additions |
| 1,067 | |
| 162 | |
| 905 | |
| 559 | % | |||
Memberships at end of period |
| 51,921 | |
| 47,129 | |
| 4,792 | |
| 10 | % | |||
Paid memberships at end of period |
| 50,323 | |
| 46,004 | |
| 4,319 | |
| 9 | % | |||
Average monthly revenue per paying membership |
| $ | 10.07 | |
| $ | 8.78 | |
| $ | 1.29 | |
| 15 | % |
|
|
|
|
|
|
|
|
| |||||||
Contribution profit: |
|
|
|
|
|
|
|
| |||||||
Revenues |
| $ | 1,505,499 | |
| $ | 1,208,271 | |
| $ | 297,228 | |
| 25 | % |
Cost of revenues |
| 831,962 | |
| 707,106 | |
| 124,856 | |
| 18 | % | |||
Marketing |
| 113,608 | |
| 86,806 | |
| 26,802 | |
| 31 | % | |||
Contribution profit |
| 559,929 | |
| 414,359 | |
| 145,570 | |
| 35 | % | |||
Contribution margin |
| 37 | % |
| 34 | % |
|
|
|
| |||||
In the Domestic streaming segment, we derive revenues from monthly membership fees for services consisting solely of streaming content to our members in the United States. The increase in our domestic streaming revenues was primarily due to the 9% growth in the average number of paid memberships, as well as a 15% increase in the average monthly revenue per paying membership, resulting from our price changes and plan mix. In the second half of 2016, we phased out grandfathered pricing and cancellations by members whose grandfathered pricing expired were not material. Our standard plan continues to be the most popular plan choice for new memberships.
The increase in domestic streaming cost of revenues was primarily due to a $114.6 million increase in content expenses relating to our existing and new streaming content, including more exclusive and original programming.
Domestic marketing expenses increased primarily due to increased advertising and public relations.
Our Domestic streaming segment had a contribution margin of 37% for the three months ended June 30, 2017 , which increased as compared to the contribution margin of 34% for the three months ended June 30, 2016 due to growth in paid memberships and revenue which continued to outpace content spending.
Six months ended June 30, 2017 as compared to the six months ended June 30, 2016
|
| As of/ Six Months Ended |
| Change | |||||||||||
|
| June 30, |
| June 30, |
| YTD'17 vs. YTD'16 | |||||||||
|
| (in thousands, except revenue per membership and percentages) | |||||||||||||
Memberships: |
|
|
|
|
|
|
|
| |||||||
Net additions |
| 2,490 | |
| 2,391 | |
| 99 | |
| 4 | % | |||
Memberships at end of period |
| 51,921 | |
| 47,129 | |
| 4,792 | |
| 10 | % | |||
Paid memberships at end of period |
| 50,323 | |
| 46,004 | |
| 4,319 | |
| 9 | % | |||
Average monthly revenue per paying membership |
| $ | 10.07 | |
| $ | 8.74 | |
| $ | 1.33 | |
| 15 | % |
|
|
|
|
|
|
|
|
| |||||||
Contribution profit: |
|
|
|
|
|
|
|
| |||||||
Revenues |
| $ | 2,975,541 | |
| $ | 2,369,512 | |
| $ | 606,029 | |
| 26 | % |
Cost of revenues |
| 1,581,450 | |
| 1,373,652 | |
| 207,798 | |
| 15 | % | |||
Marketing |
| 228,646 | |
| 168,748 | |
| 59,898 | |
| 35 | % | |||
Contribution profit |
| 1,165,445 | |
| 827,112 | |
| 338,333 | |
| 41 | % | |||
Contribution margin |
| 39 | % |
| 35 | % |
|
|
|
| |||||
The increase in our domestic streaming revenues was primarily due to the 9% growth in the average number of paid memberships, as well as a 15% increase in average monthly revenue per paying membership, resulting from our price changes and plan mix.
20
Table of Contents
The increase in domestic streaming cost of revenues was primarily due to a $195.0 million increase in content expenses relating to our existing and new streaming content, including more exclusive and original programming.
Domestic marketing expenses increased primarily due to increased advertising and public relations.
Our Domestic streaming segment had a contribution margin of 39% for the six months ended June 30, 2017 , which increased as compared to the contribution margin of 35% for the six months ended June 30, 2016 due to growth in paid memberships and revenue which continued to outpace content spending.
International Streaming Segment
Three months ended June 30, 2017 as compared to the three months ended June 30, 2016
|
| As of/ Three Months Ended |
| Change | |||||||||||
|
| June 30, |
| June 30, |
| Q2'17 vs. Q2'16 | |||||||||
|
| (in thousands, except revenue per membership and percentages) | |||||||||||||
Memberships: |
|
|
|
|
|
|
|
| |||||||
Net additions |
| 4,137 | |
| 1,515 | |
| 2,622 | |
| 173 | % | |||
Memberships at end of period |
| 52,031 | |
| 36,048 | |
| 15,983 | |
| 44 | % | |||
Paid memberships at end of period |
| 48,713 | |
| 33,892 | |
| 14,821 | |
| 44 | % | |||
Average monthly revenue per paying membership |
| $ | 8.29 | |
| $ | 7.67 | |
| $ | 0.62 | |
| 8 | % |
|
|
|
|
|
|
|
|
| |||||||
Contribution profit (loss): |
|
|
|
|
|
|
|
| |||||||
Revenues |
| $ | 1,165,228 | |
| $ | 758,201 | |
| $ | 407,027 | |
| 54 | % |
Cost of revenues |
| 1,017,612 | |
| 698,162 | |
| 319,450 | |
| 46 | % | |||
Marketing |
| 160,715 | |
| 129,223 | |
| 31,492 | |
| 24 | % | |||
Contribution profit (loss) |
| (13,099 | ) |
| (69,184 | ) |
| 56,085 | |
| 81 | % | |||
Contribution margin |
| (1 | )% |
| (9 | )% |
|
|
| | | ||||
In the International streaming segment, we derive revenues from monthly membership fees for services consisting solely of streaming content to our members outside the United States. We launched our streaming service in Canada in September 2010 and have expanded our services internationally as shown below.
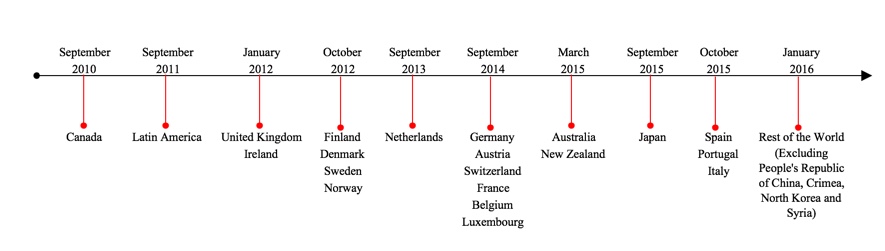
The increase in our international revenues was due to the 42% growth in the average number of paid international memberships, in addition to an 8% increase in the average monthly revenue per paying membership. The increase in the average monthly revenue per paying membership was due to price changes and plan mix offset partially by unfavorable fluctuations in foreign exchange rates. We estimate that international revenues in the second quarter of 2017 would have been approximately $22.6 million higher if foreign exchange rates had remained consistent with the foreign exchange rates from the second quarter of 2016 . If foreign currency exchange rates fluctuate more than expected, revenues and average revenue per paying membership may differ from our expectations. Average paid international streaming memberships accounted for 48% of global average paid streaming memberships for the three months ended June 30, 2017 , as compared to 42% of global average paid streaming memberships for the same period in 2016 .
The increase in international cost of revenues was primarily due to a $284.3 million increase in content expenses relating to our existing and new streaming content, including more exclusive and original programming. Other costs increased $35.1 million primarily due to
21
Table of Contents
increases in our streaming delivery expenses, costs associated with our customer service call centers and payment processing fees, all driven by our growing member base.
International marketing expenses increased mainly due to increased advertising and public relations.
International contribution loss for the three months ended June 30, 2017 was $13.1 million as compared to a contribution loss of $69.2 million for the three months ended June 30, 2016 as profit growth in our more mature markets offset investments in newer markets.
Six months ended June 30, 2017 as compared to the six months ended June 30, 2016
|
| As of/ Six Months Ended |
| Change | |||||||||||
|
| June 30, |
| June 30, |
| YTD'17 vs. YTD'16 | |||||||||
|
| (in thousands, except revenue per membership and percentages) | |||||||||||||
Memberships: |
|
|
|
|
|
|
|
| |||||||
Net additions |
| 7,666 | |
| 6,024 | |
| 1,642 | |
| 27 | % | |||
Memberships at end of period |
| 52,031 | |
| 36,048 | |
| 15,983 | |
| 44 | % | |||
Paid memberships at end of period |
| 48,713 | |
| 33,892 | |
| 14,821 | |
| 44 | % | |||
Average monthly revenue per paying membership |
| $ | 8.20 | |
| $ | 7.50 | |
| $ | 0.70 | |
| 9 | % |
|
|
|
|
|
|
|
|
| |||||||
Contribution profit (loss): |
|
|
|
|
|
|
|
| |||||||
Revenues |
| $ | 2,211,427 | |
| $ | 1,409,949 | |
| $ | 801,478 | |
| 57 | % |
Cost of revenues |
| 1,864,929 | |
| 1,328,061 | |
| 536,868 | |
| 40 | % | |||
Marketing |
| 316,947 | |
| 255,291 | |
| 61,656 | |
| 24 | % | |||
Contribution profit (loss) |
| 29,551 | |
| (173,403 | ) |
| 202,954 | |
| 117 | % | |||
Contribution margin |
| 1 | % |
| (12 | )% |
|
|
|
| |||||
The increase in our international revenues was due to the 44% growth in our average number of paid international memberships, in addition to a 9% increase in the average monthly revenue per paying membership. The increase in the average monthly revenue per paying membership was due to price changes and plan mix, partially offset by unfavorable fluctuations in foreign exchange rates. We estimate that international revenues in the six months ended June 30, 2017 would have been approximately $34.4 million higher if foreign exchange rates had remained consistent with the foreign exchange rates for the six months ended June 30, 2016.
The increase in international cost of revenues was primarily due to a $471.4 million increase in content expenses relating to our existing and new streaming content, including more exclusive and original programming. Other costs increased $65.5 million primarily due to increases in our streaming delivery expenses, costs associated with our customer service call centers and payment processing fees, all driven by our growing member base, partially offset by decreases resulting from exchange rate fluctuations.
International marketing expenses for the six months ended June 30, 2017 increased mainly due to increased advertising and public relations, as well as increased payments to our partners.
International contribution profit grew to $29.6 million as opposed to a $173.4 million loss for the six months ended June 30, 2017 as compared to the six months ended June 30, 2016 as profit growth in our more mature markets offset investments in newer markets.
22
Table of Contents
Domestic DVD Segment
Three months ended June 30, 2017 as compared to the three months ended June 30, 2016
|
| As of/ Three Months Ended |
| Change | |||||||||||
|
| June 30, |
| June 30, |
| Q2'17 vs. Q2'16 | |||||||||
|
| (in thousands, except revenue per membership and percentages) | |||||||||||||
Memberships: |
|
|
|
|
|
|
|
| |||||||
Net losses |
| (186 | ) |
| (211 | ) |
| (25 | ) |
| (12 | )% | |||
Memberships at end of period |
| 3,758 | |
| 4,530 | |
| (772 | ) |
| (17 | )% | |||
Paid memberships at end of period |
| 3,692 | |
| 4,435 | |
| (743 | ) |
| (17 | )% | |||
Average monthly revenue per paying membership |
| $ | 10.12 | |
| $ | 10.18 | |
| $ | (0.06 | ) |
| (1 | )% |
|
|
|
|
|
|
|
|
| |||||||
Contribution profit: |
|
|
|
|
|
|
|
| |||||||
Revenues |
| $ | 114,737 | |
| $ | 138,732 | |
| $ | (23,995 | ) |
| (17 | )% |
Cost of revenues |
| 52,734 | |
| 67,830 | |
| (15,096 | ) |
| (22 | )% | |||
Contribution profit |
| 62,003 | |
| 70,902 | |
| (8,899 | ) |
| (13 | )% | |||
Contribution margin |
| 54 | % |
| 51 | % |
|
|
|
| |||||
In the Domestic DVD segment, we derive revenues from our DVD-by-mail membership services. The price per plan for DVD-by-mail varies from $4.99 to $14.99 per month according to the plan chosen by the member. DVD-by-mail plans differ by the number of DVDs that a member may have out at any given point. Members electing access to high definition Blu-ray discs, in addition to standard definition DVDs, pay a surcharge ranging from $2 to $3 per month for our most popular plans.
Our Domestic DVD segment contribution margin was relatively flat for the three months ended June 30, 2017 , as compared to the three months ended June 30, 2016 , as the decrease in DVD revenues driven by the decline in the average number of paid memberships was offset by a decrease in Domestic DVD cost of revenues resulting from lower content expenses and delivery expenses due to the decline in the number of DVD memberships and reduced usage by those members.
Six months ended June 30, 2017 as compared to the six months ended June 30, 2016
|
| As of/ Six Months Ended |
| Change | |||||||||||
|
| June 30, |
| June 30, |
| YTD'17 vs. YTD'16 | |||||||||
|
| (in thousands, except revenue per membership and percentages) | |||||||||||||
Memberships: |
|
|
|
|
|
|
|
| |||||||
Net losses |
| (356 | ) |
| (374 | ) |
| (18 | ) |
| (5 | )% | |||
Memberships at end of period |
| 3,758 | |
| 4,530 | |
| (772 | ) |
| (17 | )% | |||
Paid memberships at end of period |
| 3,692 | |
| 4,435 | |
| (743 | ) |
| (17 | )% | |||
Average monthly revenue per paying membership |
| $ | 10.14 | |
| $ | 10.21 | |
| $ | (0.07 | ) |
| (1 | )% |
|
|
|
|
|
|
|
|
| |||||||
Contribution profit: |
|
|
|
|
|
|
|
| |||||||
Revenues |
| $ | 235,131 | |
| $ | 283,479 | |
| $ | (48,348 | ) |
| (17 | )% |
Cost of revenues |
| 112,953 | |
| 140,925 | |
| (27,972 | ) |
| (20 | )% | |||
Contribution profit |
| 122,178 | |
| 142,554 | |
| (20,376 | ) |
| (14 | )% | |||
Contribution margin |
| 52 | % |
| 50 | % |
|
|
|
| |||||
Our Domestic DVD segment contribution margin was relatively flat for the six months ended June 30, 2017 , as compared to the six months ended June 30, 2016 , as the decrease in DVD revenues driven by the decline in the average number of paid memberships was offset by a decrease in Domestic DVD cost of revenues resulting from lower content expenses and delivery expenses due to the decline in the number of DVD memberships and reduced usage by those members.
23
Table of Contents
Consolidated Operating Expenses
Technology and Development
Technology and development expenses consist of payroll and related costs incurred in making improvements to our service offerings, including testing, maintaining and modifying our user interface, our recommendation, merchandising and streaming delivery technology and infrastructure. Technology and development expenses also include costs associated with computer hardware and software.
Three months ended June 30, 2017 as compared to the three months ended June 30, 2016
| Three Months Ended |
| Change | |||||||||||
| June 30, |
| June 30, |
| Q2'17 vs. Q2'16 | |||||||||
| (in thousands, except percentages) | |||||||||||||
Technology and development | $ | 267,083 | |
| $ | 207,300 | |
| $ | 59,783 | |
| 29 | % |
As a percentage of revenues | 10 | % |
| 10 | % |
|
|
|
| |||||
The increase in technology and development expenses was primarily due to a $40.7 million increase in personnel-related costs, including stock-based compensation expense, resulting from an increase in compensation for existing employees and a 4% growth in average headcount supporting continued improvements in our streaming service and our international expansion. In addition, third party expenses, including costs associated with cloud computing, increased $13.1 million.
Six months ended June 30, 2017 as compared to the six months ended June 30, 2016
| Six Months Ended |
| Change | |||||||||||
| June 30, |
| June 30, |
| YTD'17 vs. YTD'16 | |||||||||
| (in thousands, except percentages) | |||||||||||||
Technology and development | $ | 524,191 | |
| $ | 410,808 | |
| $ | 113,383 | |
| 28 | % |
As a percentage of revenues | 10 | % |
| 10 | % |
|
|
|
| |||||
The increase in technology and development expenses was primarily due to a $78.3 million increase in personnel-related costs, including stock-based compensation expense, resulting from an increase in compensation for existing employees and a 4% growth in average headcount supporting continued improvements in our streaming service and our international expansion. In addition, third party expenses, including costs associated with cloud computing, increased $21.9 million.
General and Administrative
General and administrative expenses consist of payroll and related expenses for corporate personnel, as well as professional fees and other general corporate expenses.
Three months ended June 30, 2017 as compared to the three months ended June 30, 2016
| Three Months Ended |
| Change | |||||||||||
| June 30, |
| June 30, |
| Q2'17 vs. Q2'16 | |||||||||
| (in thousands, except percentages) | |||||||||||||
General and administrative | $ | 213,943 | |
| $ | 138,407 | |
| $ | 75,536 | |
| 55 | % |
As a percentage of revenues | 8 | % |
| 7 | % |
|
|
|
| |||||
General and administrative expenses increased primarily due to a $51.7 million increase in personnel-related costs, including stock-based compensation expense, resulting from a 54% increase in average headcount primarily to support our international and original content expansion, and an increase in compensation for existing employees. In addition, facilities-related costs increased $12.0 million, primarily driven by costs for our expanded Los Gatos, California headquarters and new Los Angeles, California facility, both of which were placed into operation in the first quarter of 2017.
24
Table of Contents
Six months ended June 30, 2017 as compared to the six months ended June 30, 2016
| Six Months Ended |
| Change | |||||||||||
| June 30, |
| June 30, |
| YTD'17 vs. YTD'16 | |||||||||
| (in thousands, except percentages) | |||||||||||||
General and administrative | $ | 408,234 | |
| $ | 265,632 | |
| $ | 142,602 | |
| 54 | % |
As a percentage of revenues | 8 | % |
| 7 | % |
|
|
|
| |||||
General and administrative expenses increased primarily due to a $97.4 million increase in personnel-related costs, including stock-based compensation expense, resulting from a 55% increase in average headcount primarily to support our international and original content expansion, and an increase in compensation for existing employees. In addition, facilities-related costs increased $28.0 million, primarily driven by costs for our expanded Los Gatos, California headquarters and new Los Angeles, California facility, both of which were placed into operation in the first quarter of 2017. In addition, third party expenses increased $16.9 million.
Interest Expense
Interest expense consists primarily of the interest associated with our outstanding long-term debt obligations, including the amortization of debt issuance costs, as well as interest on our lease financing obligations.
Three months ended June 30, 2017 as compared to the three months ended June 30, 2016
|
| Three Months Ended |
| Change | |||||||||||
|
| June 30, |
| June 30, |
| Q2'17 vs. Q2'16 | |||||||||
|
| (in thousands, except percentages) | |||||||||||||
Interest expense |
| $ | (55,482 | ) |
| $ | (35,455 | ) |
| $ | (20,027 | ) |
| (56 | )% |
As a percentage of revenues |
| (2 | )% |
| (2 | )% |
|
|
|
| |||||
Six months ended June 30, 2017 as compared to the six months ended June 30, 2016
|
| Six Months Ended |
| Change | |||||||||||
|
| June 30, |
| June 30, |
| YTD'17 vs. YTD'16 | |||||||||
|
| (in thousands, except percentages) | |||||||||||||
Interest expense |
| $ | (102,224 | ) |
| $ | (70,992 | ) |
| $ | (31,232 | ) |
| (44 | )% |
As a percentage of revenues |
| (2 | )% |
| (2 | )% |
|
|
|
| |||||
Interest expense primarily consisted of interest on our Notes of $53.3 million and $98.1 million for the three and six months ended June 30, 2017 . The increase in interest expense for the three and six months ended June 30, 2017 as compared to the three and six months ended June 30, 2016 was primarily due to the higher average aggregate principal of interest bearing notes outstanding.
Interest and Other Income (Expense)
Interest and other income (expense) consists primarily of foreign exchange gains and losses on foreign currency denominated balances and interest earned on cash, cash equivalents and short-term investments.
Three months ended June 30, 2017 as compared to the three months ended June 30, 2016
|
| Three Months Ended |
| Change | |||||||||||
|
| June 30, |
| June 30, |
| Q2'17 vs. Q2'16 | |||||||||
|
| (in thousands, except percentages) | |||||||||||||
Interest and other income (expense) |
| $ | (58,363 | ) |
| $ | 16,317 | |
| $ | (74,680 | ) |
| (458 | )% |
As a percentage of revenues |
| (2 | )% |
| 1 | % |
|
|
|
| |||||
25
Table of Contents
Six months ended June 30, 2017 as compared to the six months ended June 30, 2016
|
| Six Months Ended |
| Change | |||||||||||
|
| June 30, |
| June 30, |
| YTD'17 vs. YTD'16 | |||||||||
|
| (in thousands, except percentages) | |||||||||||||
Interest and other income (expense) |
| $ | (44,771 | ) |
| $ | 42,280 | |
| $ | (87,051 | ) |
| (206 | )% |
As a percentage of revenues |
| (1 | )% |
| 1 | % |
|
|
|
| |||||
Interest and other income (expense) increased for the three and six months ended June 30, 2017 , due to foreign exchange losses of $60.7 million and $49.4 million, respectively, compared to gains of $14.0 million and $38.2 million, respectively, for the corresponding periods in 2016 . In both the three and six months ended June 30, 2017 , the foreign exchange losses were primarily driven by the $64.2 million loss from the remeasurement of our €1,300.0 million Senior Notes partially offset by the remeasurement of cash and content liability positions in currencies other than the functional currencies of our European and U.S. entities.
Provision for Income Taxes
The effective tax rates for the three months ended June 30, 2017 and 2016 were (370)% and 20%, respectively. The effective tax rate for the three months ended June 30, 2017 differed from the Federal statutory rate primarily due to the recognition of excess tax benefits attributable to the adoption of ASU 2016-09, foreign income taxed at rates lower than the U.S. statutory rate and Federal and California research and development ("R&D") credits partially offset by state taxes and non-deductible expenses. The effective tax rate for the three months ended June 30, 2016 , differed from the Federal statutory rate primarily due to the Federal and California R&D credits partially offset by state taxes, foreign taxes and non-deductible expenses. The decrease in our effective tax rate for the three months ended June 30, 2017 , as compared to the same period in 2016 was due primarily to the recognition of the excess tax benefits attributable to the adoption of ASU 2016-09 and an increase in foreign income taxed at rates lower than the U.S. statutory rate.
The effective tax rates for the six months ended June 30, 2017 and 2016 were (3%) and 25%, respectively. The effective tax rates for the six months ended June 30, 2017, differed from the Federal statutory rate primarily due to the recognition of excess tax benefits attributable to the adoption of ASU 2016-09, foreign income taxed at rates lower than the U.S. statutory rate and Federal and California R&D credits, partially offset by state taxes and non-deductible expenses. The effective tax rate for the six months ended June 30, 2016, differed from the Federal statutory rate primarily due to the Federal and California research and development credits partially offset by state taxes, foreign taxes and non-deductible expenses. The decrease in our effective tax rate for the three and six months ended June 30, 2017 as compared to the same periods in 2016 was attributable primarily due to the recognition of the excess tax benefits attributable to the adoption of ASU 2016-09 and an increase in foreign income taxed at rates lower than the U.S. statutory rate.
Liquidity and Capital Resources
Cash, cash equivalents and short-term investments increased $431.1 million from $1,733.8 million as of December 31, 2016 to $2,164.9 million as of June 30, 2017 . The increase in cash, cash equivalents and short-term investments in the six months ended June 30, 2017 was primarily due to the proceeds from the issuance of debt partially offset by cash used in operations.
Our primary uses of cash include the acquisition, licensing and production of content, streaming delivery, marketing programs and personnel-related costs. Investments in original content, and in particular content that we produce and own, require more cash upfront relative to licensed content. We expect to significantly increase our investments in global streaming content, particularly in original content, which will impact our liquidity and result in future negative free cash flows for many years. We currently anticipate that cash flows from operations, together with available funds and access to financing sources, will continue to be sufficient to meet our cash needs for at least the next twelve months.
In May 2017, we issued €1,300.0 million of long-term debt. Long-term debt, net of debt issuance costs, was $4,836.5 million and $3,364.3 million as of June 30, 2017 , and December 31, 2016 , respectively. See Note 5 to the consolidated financial statements for additional information. Our ability to obtain any additional financing that we may choose to, or need to, obtain will depend on, among other things, our development efforts, business plans, operating performance and the condition of the capital markets at the time we seek financing. We may not be able to obtain such financing on terms acceptable to us or at all. If we raise additional funds through the issuance of equity or debt securities, those securities may have rights, preferences or privileges senior to the rights of our common stock, and our stockholders may experience dilution.
26
Table of Contents
As of June 30, 2017 , cash and cash equivalents held by our foreign subsidiaries amounted to $396.8 million . If these funds are needed for our operations in the U.S., we would be required to accrue and pay U.S. income taxes and foreign withholding taxes on the portion associated with undistributed earnings for certain foreign subsidiaries.
Free Cash Flow
We define free cash flow as cash provided by (used in) operating and investing activities excluding the non-operational cash flows from purchases, maturities and sales of short-term investments. We believe free cash flow is an important liquidity metric because it measures, during a given period, the amount of cash generated that is available to repay debt obligations, make investments in content and for certain other activities or the amount of cash used in operations, including investments in global streaming content. Free cash flow is considered a non-GAAP financial measure and should not be considered in isolation of, or as a substitute for, net income, operating income, cash flow (used in) provided by operating activities, or any other measure of financial performance or liquidity presented in accordance with GAAP.
In assessing liquidity in relation to our results of operations, we compare free cash flow to net income, noting that the three major recurring differences are excess content payments over expense, non-cash stock-based compensation expense and other working capital differences. The excess content payments over expense is variable based on the payment terms of our content agreements and is expected to increase as we enter into more agreements with upfront cash payments, such as licensing and production of original content. In the first half of 2017, the ratio of content payments over content expense was 1.4. Working capital differences include deferred revenue, taxes and semi-annual interest payments on our outstanding debt. Our receivables from members generally settle quickly and deferred revenue is a source of cash flow.
Three months ended June 30, 2017 as compared to the three months ended June 30, 2016
| Three Months Ended | ||||||
| June 30, |
| June 30, | ||||
| (in thousands) | ||||||
Net cash used in operating activities | $ | (534,528 | ) |
| $ | (226,293 | ) |
Net cash used in investing activities | (56,432 | ) |
| (2,896 | ) | ||
Net cash provided by financing activities | 1,420,386 | |
| 17,612 | | ||
|
|
|
| ||||
Non-GAAP free cash flow reconciliation: |
|
|
| ||||
Net cash used in operating activities | (534,528 | ) |
| (226,293 | ) | ||
Acquisition of DVD content assets | (7,624 | ) |
| (17,924 | ) | ||
Purchases of property and equipment | (65,231 | ) |
| (10,814 | ) | ||
Change in other assets | (1,064 | ) |
| 907 | | ||
Non-GAAP free cash flow | $ | (608,447 | ) |
| $ | (254,124 | ) |
Cash used in operating activities increased $308.2 million to $534.5 million for the three months ended June 30, 2017 , compared to the same period of 2016 . The significant net cash used in operations is due primarily to the increase in investments in streaming content that requires more upfront payments. The payments for streaming content assets increased $596.3 million or 38%. In addition, we had increased payments associated with higher operating expenses. The increased use of cash was partially offset by a $680.3 million or 32% increase in revenues.
Cash used in investing activities increased $53.5 million, primarily due to an increase in the purchases of property and equipment of $54.4 million, primarily due to the expansion of our Los Gatos, California headquarters and our new Los Angeles, California facility.
Cash provided by financing activities increased $1,402.8 million in the quarter ended June 30, 2017 , due to the proceeds from the issuance of debt of $1,405.5 million, net of $15.0 million of issuance costs.
Free cash flow was $674.0 million lower than net income for the three months ended June 30, 2017 primarily due to $598.7 million of cash payments for streaming content assets over streaming amortization expense coupled with $119.3 million of non-favorable other working capital differences partially offset by $44.0 million of non-cash stock-based compensation expense.
Free cash flow was $294.9 million lower than net income for the three months ended June 30, 2016 , primarily due to $377.9 million of cash payments for streaming content assets over streaming amortization expense partially offset by $44.1 million of non-cash stock-based compensation expense and $38.9 million favorable other working capital differences.
27
Table of Contents
Six months ended June 30, 2017 as compared to the six months ended June 30, 2016
| Six Months Ended | ||||||
| June 30, |
| June 30, | ||||
| (in thousands) | ||||||
Net cash used in operating activities | $ | (878,384 | ) |
| $ | (454,883 | ) |
Net cash (used in) provided by investing activities | (132,022 | ) |
| 1,367 | | ||
Net cash provided by financing activities | 1,444,625 | |
| 32,519 | | ||
|
|
|
| ||||
Non-GAAP free cash flow reconciliation: |
|
|
| ||||
Net cash used in operating activities | (878,384 | ) |
| (454,883 | ) | ||
Acquisition of DVD content assets | (32,996 | ) |
| (41,131 | ) | ||
Purchases of property and equipment | (117,754 | ) |
| (19,239 | ) | ||
Change in other assets | (1,833 | ) |
| 551 | | ||
Non-GAAP free cash flow | $ | (1,030,967 | ) |
| $ | (514,702 | ) |
Cash used in operating activities increased $423.5 million to $878.4 million for the six months ended June 30, 2017 , compared to the same period of 2016 . The significant net cash used in operations is due primarily to the increase in investments in streaming content that requires more upfront payments. The payments for streaming content assets increased $1,167.8 million or 39%. In addition, we had increased payments associated with higher operating expenses. The increased use of cash was partially offset by a $1,359.2 million or 33% increase in revenues.
Cash provided by investing activities decreased $133.4 million, primarily due to a decrease in the proceeds from the sale and maturities of short-term investments of $40.6 million, net of purchases, coupled with an increase in the purchases of property and equipment of $98.5 million, primarily related to the expansion of our Los Gatos, California headquarters and our new Los Angeles, California facility.
Cash provided by financing activities increased $1,412.1 million in the six months ended June 30, 2017 , due to the proceeds from the issuance of debt of $1,405.5 million, net of $15.0 million of issuance costs.
Free cash flow was $1,274.8 million lower than net income for the six months ended June 30, 2017 primarily due to $1,275.5 million of cash payments for streaming content assets over streaming amortization expense coupled with $88.2 million non-favorable other working capital differences, partially offset by $88.9 million of non-cash stock-based compensation expenses.
Free cash flow was $583.1 million lower than net income for the six months ended June 30, 2016 , primarily due to $730.2 million of cash payments for streaming content assets over streaming amortization expense partially offset by $86.5 million of non-cash stock-based compensation expense and $60.6 million favorable other working capital differences.
Contractual Obligations
For the purpose of this table, contractual obligations for purchases of goods or services are defined as agreements that are enforceable and legally binding and that specify all significant terms, including: fixed or minimum quantities to be purchased; fixed, minimum or variable price provisions; and the approximate timing of the transaction. The expected timing of the payment of the obligations discussed below is estimated based on information available to us as of June 30, 2017 . Timing of payments and actual amounts paid may be different depending on the time of receipt of goods or services or changes to agreed-upon amounts for some obligations. The following table summarizes our contractual obligations as of June 30, 2017 :
| Payments due by Period | ||||||||||||||||||
Contractual obligations (in thousands): | Total |
| Less than |
| 1-3 years |
| 3-5 years |
| More than | ||||||||||
Streaming content obligations (1) | $ | 15,699,387 | |
| $ | 6,592,517 | |
| $ | 7,461,470 | |
| $ | 1,488,760 | |
| $ | 156,640 | |
Debt (2) | 6,663,805 | |
| 235,189 | |
| 465,893 | |
| 1,632,601 | |
| 4,330,122 | | |||||
Lease obligations (3) | 695,877 | |
| 85,859 | |
| 167,447 | |
| 148,051 | |
| 294,520 | | |||||
Other purchase obligations (4) | 699,110 | |
| 428,448 | |
| 190,878 | |
| 40,371 | |
| 39,413 | | |||||
Total | $ | 23,758,179 | | | $ | 7,342,013 | |
| $ | 8,285,688 | |
| $ | 3,309,783 | |
| $ | 4,820,695 | |
28
Table of Contents
(1) | As of June 30, 2017 , streaming content obligations were comprised of $4.1 billion included in "Current content liabilities" and $3.4 billion of "Non-current content liabilities" on the Consolidated Balance Sheets and $8.2 billion of obligations that are not reflected on the Consolidated Balance Sheets as they did not then meet the criteria for recognition. |
Streaming content obligations increased $1.2 billion from $14.5 billion as of December 31, 2016 to $15.7 billion as of June 30, 2017 , primarily due to multi-year commitments associated with the continued expansion of our exclusive and original programming.
Streaming content obligations include amounts related to the acquisition, licensing and production of streaming content. An obligation for the production of content includes non-cancelable commitments under creative talent and employment agreements. An obligation for the acquisition and licensing of content is incurred at the time we enter into an agreement to obtain future titles. Once a title becomes available, a content liability is recorded on the Consolidated Balance Sheets. Certain agreements include the obligation to license rights for unknown future titles, the ultimate quantity and/or fees for which are not yet determinable as of the reporting date. Traditional film output deals, like the U.S. output deal with Disney, or certain TV series license agreements where the number of seasons to be aired is unknown, are examples of these types of agreements. The contractual obligations table above does not include any estimated obligation for the unknown future titles, payment for which could range from less than one year to more than five years. However, these unknown obligations are expected to be significant and we believe could include approximately $3 billion to $5 billion over the next three years, with the payments for the vast majority of such amounts expected to occur after the next twelve months. The foregoing range is based on considerable management judgments and the actual amounts may differ. Once we know the title that we will receive and the license fees, we include the amount in the contractual obligations table above.
(2) | Long-term debt obligations include our Notes consisting of principal and interest payments. See Note 5 to the consolidated financial statements for further details. |
(3) | Lease obligations include lease financing obligations of $17.1 million related to a portion of our current Los Gatos, California headquarters for which we are the deemed owner for accounting purposes, commitments of $529.7 million for our expanded headquarters in Los Gatos, California, and our new office space in Los Angeles, California and other commitments of $149.1 million for facilities under non-cancelable operating leases. These leases have expiration dates varying through approximately 2028. |
(4) | Other purchase obligations include all other non-cancelable contractual obligations. These contracts are primarily related to streaming delivery, DVD content acquisition, and miscellaneous open purchase orders for which we have not received the related services or goods. |
As of June 30, 2017 , we had gross unrecognized tax benefits of $29.3 million which was classified in "Other non-current liabilities" and a reduction to deferred tax assets which was classified as "Other non-current assets" in the consolidated balance sheets. At this time, an estimate of the range of reasonably possible adjustments to the balance of unrecognized tax benefits cannot be made.
Off-Balance Sheet Arrangements
We do not have transactions with unconsolidated entities, such as entities often referred to as structured finance or special purpose entities, whereby we have financial guarantees, subordinated retained interests, derivative instruments, or other contingent arrangements that expose us to material continuing risks, contingent liabilities, or any other obligation under a variable interest in an unconsolidated entity that provides financing, liquidity, market risk, or credit risk support to us.
Indemnification
The information set forth under Note 6 to the consolidated financial statements under the caption "Indemnification" is incorporated herein by reference.
Critical Accounting Policies and Estimates
The preparation of consolidated financial statements in conformity with accounting principles generally accepted in the United States of America requires management to make estimates and assumptions that affect the reported amounts of assets and liabilities, disclosures of contingent assets and liabilities at the date of the consolidated financial statements, and the reported amounts of revenues and expenses during the reported periods. The Securities and Exchange Commission ("SEC") has defined a company's critical accounting policies as the ones that are most important to the portrayal of a company's financial condition and results of operations, and which require a company to make its most difficult and subjective judgments. Based on this definition, we have identified the critical accounting policies and judgments addressed below. We base our estimates on historical experience and on various other assumptions that we believe to be reasonable under the circumstances. Actual results may differ from these estimates.
29
Table of Contents
Streaming Content
We acquire, license and produce content, including original programing, in order to offer our members unlimited viewing of TV shows and films. The content licenses are for a fixed fee and specific windows of availability. Payment terms for certain content licenses and the production of content require more upfront cash payments relative to the amortization expense. Payments for content, including additions to streaming assets and the changes in related liabilities, are classified within "Net cash used in operating activities" on the Consolidated Statements of Cash Flows.
For licenses we capitalize the fee per title and record a corresponding liability at the gross amount of the liability when the license period begins, the cost of the title is known and the title is accepted and available for streaming. The portion available for streaming within one year is recognized as "Current content assets, net" and the remaining portion as "Non-current content assets, net" on the Consolidated Balance Sheets.
For productions, we capitalize costs associated with the production, including development cost, direct costs and production overhead. We include these amounts in "Non-current content assets, net" on the Consolidated Balance Sheets. Participations and residuals are expensed in line with the amortization of production costs.
Based on factors including historical and estimated viewing patterns, we amortize the content assets (licensed and produced) in "Cost of revenues" on the Consolidated Statements of Operations, over the shorter of each title's contractual window of availability or estimated period of use, beginning with the month of first availability. The amortization period typically ranges from six months to five years. For content where we expect more upfront viewing, due to the additional merchandising and marketing efforts, we amortize on an accelerated basis. We review factors that impact the amortization of the content assets on a regular basis. Our estimates related to these factors require considerable management judgment.
Our business model is subscription based as opposed to a model generating revenues at a specific title level. Therefore, content assets, both licensed and produced are reviewed in aggregate at the operating segment level when an event or change in circumstances indicates a change in the expected usefulness or that the fair value may be less than amortized cost. To date, we have not identified any such event or changes in circumstances. If such changes are identified in the future, these aggregated content assets will be stated at the lower of unamortized cost, net realizable value or fair value. In addition, unamortized costs for assets that have been, or are expected to be, abandoned are written off. No material write-down from unamortized cost was recorded in any of the periods presented.
Income Taxes
We record a provision for income taxes for the anticipated tax consequences of our reported results of operations using the asset and liability method. Deferred income taxes are recognized by applying enacted statutory tax rates applicable to future years to differences between the consolidated financial statement carrying amounts of existing assets and liabilities and their respective tax bases as well as net operating loss and tax credit carryforwards. The effect on deferred tax assets and liabilities of a change in tax rates is recognized in income in the period that includes the enactment date. The measurement of deferred tax assets is reduced, if necessary, by a valuation allowance for any tax benefits for which future realization is uncertain. As of June 30, 2017 , there was a valuation allowance of $21.9 million primarily related to foreign tax credit carryovers. There was no valuation allowance as of June 30, 2016 .
Although we believe our assumptions, judgments and estimates are reasonable, changes in tax laws or our interpretation of tax laws and the resolution of any tax audits could significantly impact the amounts provided for income taxes in our consolidated financial statements.
In evaluating our ability to recover our deferred tax assets, in full or in part, we consider all available positive and negative evidence, including our past operating results, and our forecast of future earnings, future taxable income and prudent and feasible tax planning strategies. The assumptions utilized in determining future taxable income require significant judgment and are consistent with the plans and estimates we are using to manage the underlying businesses. Actual operating results in future years could differ from our current assumptions, judgments and estimates. In the event we were to determine that we would not be able to realize all or part of our net deferred tax assets in the future, an adjustment to the deferred tax assets would be charged to earnings in the period in which we make such determination.
We did not recognize certain tax benefits from uncertain tax positions within the provision for income taxes. We may recognize a tax benefit only if it is more likely than not the tax position will be sustained on examination by the taxing authorities, based on the technical merits of the position. The tax benefits recognized in the consolidated financial statements from such positions are then measured based on the largest benefit that has a greater than 50% likelihood of being realized upon settlement. At June 30, 2017 , our estimated gross unrecognized tax benefits were $29.3 million of which $25.8 million , if recognized, would favorably impact our future earnings. Due to uncertainties in any tax audit outcome, our estimates of the ultimate settlement of our unrecognized tax positions may change and the actual tax benefits may differ significantly from the estimates. See Note 9 to the consolidated financial statements for further information regarding income taxes.
Stock-Based Compensation
We grant fully vested non-qualified stock options to our employees on a monthly basis. As a result of immediate vesting, stock-based compensation expense is fully recognized on the grant date, and no estimate is required for post-vesting option forfeitures. Stock-based compensation expense at the grant date is based on the total number of options granted and an estimate of the fair value of the awards.
30
Table of Contents
We calculate the fair value of our stock option grants using a lattice-binomial model. This model requires the input of highly subjective assumptions. Changes in the subjective input assumptions can materially affect the estimate of fair value of options granted and our results of operations could be impacted.
• | Expected Volatility: The Company calculates expected volatility based solely on implied volatility. We believe that implied volatility of publicly traded options in our common stock is more reflective of market conditions and, given consistently high trade volumes of the options, can reasonably be expected to be a better indicator of expected volatility than historical volatility of our common stock. An increase/decrease of 10% in our computation of expected volatility would increase/decrease the total stock-based compensation expense by approximately $5.4 million for the three months ended June 30, 2017 . |
• | Suboptimal Exercise Factor: Our computation of the suboptimal exercise factor is based on historical and estimated option exercise behavior. An increase/decrease in the suboptimal exercise factor of 10% would increase/decrease the total stock-based compensation expense by approximately $1.1 million for the three months ended June 30, 2017 . |
Recent Accounting Pronouncements
The information set forth under Note 1 to the consolidated financial statements under the caption "Basis of Presentation and Summary of Significant Accounting Policies" is incorporated herein by reference.
Item 3. | Quantitative and Qualitative Disclosures About Market Risk |
For financial market risks related to changes in interest rates, reference is made to Item 7A "Quantitative and Qualitative Disclosures About Market Risk" contained in Part II of our Annual Report on Form 10-K for the year ended December 31, 2016 . Our exposure to market risk has not changed significantly since December 31, 2016 .
Foreign Currency Risk
International revenues and cost of revenues account for 41% and 52%, respectively, of consolidated amounts for the six months ended June 30, 2017 . The majority of international revenues and a smaller portion of expenses are denominated in currencies other than the U.S. dollar and we therefore have foreign currency risk related to these currencies, which are primarily the euro, the British pound, the Canadian dollar, the Australian dollar, the Japanese yen and the Brazilian real.
Accordingly, changes in exchange rates, and in particular a weakening of foreign currencies relative to the U.S. dollar may negatively affect our revenue and contribution profit (loss) of our International streaming segment as expressed in U.S. dollars. In the six months ended June 30, 2017 , we believe our international revenues would have been approximately $34.4 million higher had foreign currency exchange rates remained consistent with those in same period of 2016 .
We have also experienced and will continue to experience fluctuations in our net income as a result of gains (losses) on the settlement and the remeasurement of monetary assets and liabilities denominated in currencies that are not the functional currency. In the six months ended June 30, 2017 , we recognized a $49.4 million foreign exchange loss which resulted primarily from the remeasurement of our €1,300.0 million Senior Notes and was partially offset by the remeasurement of cash and content liability positions in currencies other than the functional currencies of our European and U.S. entities.
In addition, the effect of exchange rate changes on cash and cash equivalents in the six months ended June 30, 2017 was $17.0 million.
We do not use foreign exchange contracts or derivatives to hedge any foreign currency exposures. The volatility of exchange rates depends on many factors that we cannot forecast with reliable accuracy. Our continued international expansion increases our exposure to exchange rate fluctuations and as a result such fluctuations could have a significant impact on our future results of operations.
Item 4. | Controls and Procedures |
Evaluation of Disclosure Controls and Procedures
Our management, with the participation of our Chief Executive Officer and Chief Financial Officer, evaluated the effectiveness of our disclosure controls and procedures (as defined in Rules 13a-15(e) and 15d-15(e) under the Securities Exchange Act of 1934, as amended) as of the end of the period covered by this Quarterly Report on Form 10-Q. Based on that evaluation, our Chief Executive Officer and Chief Financial Officer concluded that our disclosure controls and procedures as of the end of the period covered by this Quarterly Report on Form 10-Q were effective in providing reasonable assurance that information required to be disclosed by us in reports that we file or submit under the Securities Exchange Act of 1934, as amended, is (i) recorded, processed, summarized and reported within the time periods specified in the Securities and Exchange Commission's rules and forms and (ii) accumulated and communicated to our management, including our Chief Executive Officer and Chief Financial Officer, as appropriate, to allow timely decisions regarding required disclosures.
Our management, including our Chief Executive Officer and Chief Financial Officer, does not expect that our disclosure controls and procedures or our internal controls will prevent all error and all fraud. A control system, no matter how well conceived and operated, can
31
Table of Contents
provide only reasonable, not absolute, assurance that the objectives of the control system are met. Further, the design of a control system must reflect the fact that there are resource constraints, and the benefits of controls must be considered relative to their costs. Because of the inherent limitations in all control systems, no evaluation of controls can provide absolute assurance that all control issues and instances of fraud, if any, within the Company have been detected.
Changes in Internal Control Over Financial Reporting
There were no changes in our internal control over financial reporting that occurred during the quarter ended June 30, 2017 , that have materially affected, or are reasonably likely to materially affect, our internal control over financial reporting.
PART II. OTHER INFORMATION
Item 1. | Legal Proceedings |
The information set forth under Note 6 in the notes to the consolidated financial statements under the caption "Legal Proceedings" is incorporated herein by reference.
Item 1A. | Risk Factors |
There have been no material changes from the risk factors as previously disclosed under the heading "Risk Factors" in the Company's Annual Report on Form 10-K for the year ended December 31, 2016 .
Item 6. | Exhibits |
(a) Exhibits:
See Exhibit Index immediately following the signature page of this Quarterly Report on Form 10-Q.
32
Table of Contents
SIGNATURES
Pursuant to the requirements of the Securities Exchange Act of 1934, the registrant has duly caused this report to be signed on its behalf by the undersigned thereunto duly authorized.
|
| NETFLIX, INC. | |
Dated: | July 19, 2017 | By: | /s/ REED HASTINGS |
|
|
| Reed Hastings Chief Executive Officer (Principal executive officer) |
|
|
|
|
Dated: | July 19, 2017 | By: | /s/ DAVID WELLS |
|
|
| David Wells Chief Financial Officer (Principal financial and accounting officer) |
33
Table of Contents
EXHIBIT INDEX
Exhibit Number |
| Exhibit Description |
| Incorporated by Reference |
| Filed | ||||||
|
|
|
| Form |
| File No. |
| Exhibit |
| Filing Date |
|
|
|
|
|
|
|
|
|
| |||||
4.8 |
| Indenture, dated as of May 2, 2017, by and between the Company and Wells Fargo Bank, National Association, as Trustee. |
|
|
| 001-35727 |
| 4.1 |
| May 2, 2017 |
|
|
|
|
|
|
|
|
|
|
|
|
|
|
|
4.9 |
| Form of Note (included in Exhibit 4.8) |
|
|
| 001-35727 |
| 4.2 |
| May 2, 2017 |
|
|
|
|
|
|
|
|
|
|
|
|
|
|
|
10.12 |
| Purchase Agreement, dated as of April 26, 2017, between the Company and Morgan Stanley & Co. International plc, as representative of the Initial Purchasers listed on Schedule 1 thereto. |
|
|
| 001-35727 |
| 10.1 |
| April 24, 2017 |
|
|
|
|
|
|
|
|
|
|
|
|
|
|
|
10.13 |
| Registration Rights Agreement, dated as of May 2, 2017, by and between the Company and Morgan Stanley & Co. International plc, as representative of the Initial Purchasers listed in Schedule 1 thereto. |
|
|
| 001-35727 |
| 10.1 |
| May 2, 2017 |
|
|
|
|
|
|
|
|
|
|
|
|
|
|
|
10.14 |
| Executive Severance and Retention Incentive Plan, as amended and restated as of July 12, 2017 |
|
|
|
|
|
|
|
|
| X |
|
|
|
|
|
|
|
|
|
|
|
|
|
31.1 |
| Certification of Chief Executive Officer Pursuant to Section 302 of the Sarbanes-Oxley Act of 2002 |
|
|
|
|
|
|
|
|
| X |
|
|
|
|
|
|
|
| |||||
31.2 |
| Certification of Chief Financial Officer Pursuant to Section 302 of the Sarbanes-Oxley Act of 2002 |
|
|
|
|
|
|
|
|
| X |
|
|
|
|
|
|
|
| |||||
32.1* |
| Certifications of Chief Executive Officer and Chief Financial Officer Pursuant to Section 906 of the Sarbanes-Oxley Act of 2002 |
|
|
|
|
|
|
|
|
| X |
|
|
|
|
|
|
|
| |||||
101 |
| The following financial information from Netflix, Inc.'s Quarterly Report on Form 10-Q for the quarter ended June 30, 2017 filed with the SEC on July 19, 2017, formatted in XBRL includes: (i) Consolidated Statements of Operations for the Three and Six Months Ended June 30, 2017 and 2016, (ii) Consolidated Statements of Comprehensive Income for the Three and Six Months Ended June 30, 2017 and 2016 (iii) Consolidated Balance Sheets as of June 30, 2017 and December 31, 2016, (iv) Consolidated Statements of Cash Flows for the Three and Six Months Ended June 30, 2017 and 2016 and (v) the Notes to the Consolidated Financial Statements. |
|
|
|
|
|
|
|
|
| X |
* | These certifications are not deemed filed by the SEC and are not to be incorporated by reference in any filing we make under the Securities Act of 1933 or the Securities Exchange Act of 1934, irrespective of any general incorporation language in any filings. |
34