UNITED STATES SECURITIES AND EXCHANGE COMMISSION
Washington, D.C. 20549
FORM 10-K
ANNUAL REPORT PURSUANT TO SECTIONS 13 OR 15(d) OF
THE SECURITIES EXCHANGE ACT OF 1934
(Mark One)
| x | ANNUAL REPORT PURSUANT TO SECTION 13 OR 15(d) OF THE SECURITIES EXCHANGE ACT OF 1934 |
For the fiscal year ended October 31, 2011
OR
| ¨ | TRANSITION REPORT PURSUANT TO SECTION 13 OR 15(d) OF THE SECURITIES EXCHANGE ACT OF 1934 |
For the transition period from to
Commission file number 0-7977
NORDSON CORPORATION
(Exact name of Registrant as specified in its charter)
| Ohio | 34-0590250 | |
| (State of incorporation) | (I.R.S. Employer Identification No.) | |
28601 Clemens Road Westlake, Ohio | 44145 | |
| (Address of principal executive offices) | (Zip Code) | |
| (440) 892-1580 | ||
| (Registrant's Telephone Number, including area code) | ||
Securities registered pursuant to Section 12(b) of the Act:
Common Shares with no par value
Securities registered pursuant to Section 12(g) of the Act:
None
Indicate by check mark if the registrant is a well-known seasoned issuer, as defined in Rule 405 of the Securities Act. Yes x No ¨
Indicate by check mark if the registrant is not required to file reports pursuant to Section 13 or Section 15(d) of the Act. Yes ¨ No x
Indicate by check mark whether the Registrant (1) has filed all reports required to be filed by Section 13 or 15 (d) of the Securities Exchange Act of 1934 during the preceding 12 months, and (2) has been subject to such filing requirements for the past 90 days. Yes x No ¨
Indicate by check mark whether the registrant has submitted electronically and posted on its corporate Web site, if any, every Interactive Data File required to be submitted and posted pursuant to Rule 405 of Regulation S-T (§232.405 of this chapter) during the preceding 12 months (or for such shorter period that the Registrant was required to submit and post such files). Yes x No ¨
Indicate by check mark if disclosure of delinquent filers pursuant to Item 405 of Regulation S-K is not contained herein, and will not be contained, to the best of registrant's knowledge, in definitive proxy or information statements incorporated by reference in Part III of this Form 10-K or any amendment to this Form 10-K. x
Indicate by check mark whether the Registrant is a large accelerated filer, an accelerated filer, a non-accelerated filer or a smaller reporting company. See definition of "large accelerated filer," "accelerated filer" and "smaller reporting company" in Rule 12b-2 of the Exchange Act. (Check one):
| Large accelerated filer x | Accelerated filer ¨ | Non-accelerated filer ¨ | Smaller reporting company ¨ | |||
| (Do not check if smaller reporting company) | ||||||
Indicate by check mark whether the Registrant is a shell company (as defined in Rule 12b-2 of the Exchange Act). Yes ¨ No x
The aggregate market value of Common Shares no par value per share, held by nonaffiliates (based on the closing sale price on the Nasdaq Stock Market) as of April 29, 2011 was approximately $3,670,599,000.
There were 65,343,146 Common Shares outstanding as of November 30, 2011.
Documents incorporated by reference:
Portions of the Proxy Statement for the 2012 Annual Meeting - Part III
Table of Contents
PART I | 1 | |||||||
Item 1. | Business | 1 | ||||||
| General Description of Business | 1 | |||||||
| Corporate Purpose and Goals | 1 | |||||||
Financial Information About Operating Segments, Foreign and Domestic Operations and Export Sales | 2 | |||||||
| Principal Products and Uses | 2 | |||||||
| Manufacturing and Raw Materials | 4 | |||||||
| Intellectual Property | 4 | |||||||
| Seasonal Variation in Business | 5 | |||||||
| Working Capital Practices | 5 | |||||||
| Customers | 5 | |||||||
| Backlog | 5 | |||||||
| Government Contracts | 5 | |||||||
| Competitive Conditions | 5 | |||||||
| Research and Development | 5 | |||||||
| Environmental Compliance | 6 | |||||||
| Employees | 6 | |||||||
| Available Information | 6 | |||||||
Item 1A. | Risk Factors | 7 | ||||||
Item 1B. | Unresolved Staff Comments | 10 | ||||||
Item 2. | Properties | 11 | ||||||
Item 3. | Legal Proceedings | 12 | ||||||
Item 4. | Removed and Reserved | 12 | ||||||
| Executive Officers of the Company | 13 | |||||||
PART II | 14 | |||||||
Item 5. | Market for the Company's Common Equity, Related Stockholder Matters and Issuer Purchases of Equity Securities | 14 | ||||||
| Market Information and Dividends | 14 | |||||||
| Performance Graph | 15 | |||||||
Item 6. | Selected Financial Data | 16 | ||||||
Item 7. | Management's Discussion and Analysis of Financial Condition and Results of Operations | 17 | ||||||
| Critical Accounting Policies and Estimates | 17 | |||||||
Item 7A. | Quantitative and Qualitative Disclosures About Market Risk | 29 | ||||||
Item 8. | Financial Statements and Supplementary Data | 31 | ||||||
| Consolidated Statements of Income | 31 | |||||||
| Consolidated Balance Sheets | 32 | |||||||
| Consolidated Statements of Shareholders' Equity | 33 | |||||||
| Consolidated Statements of Cash Flows | 34 | |||||||
| Notes to Consolidated Financial Statements | 35 | |||||||
| Management's Report on Internal Control Over Financial Reporting | 69 | |||||||
| Report of Independent Registered Public Accounting Firm | 70 | |||||||
| Report of Independent Registered Public Accounting Firm | 71 | |||||||
i
Table of Contents
Item 9. | Changes in and Disagreements With Accountants on Accounting and Financial Disclosure | 72 | ||||||
Item 9A. | Controls and Procedures | 72 | ||||||
Item 9B. | Other Information | 72 | ||||||
PART III | 72 | |||||||
Item 10. | Directors, Executive Officers and Corporate Governance | 72 | ||||||
Item 11. | Executive Compensation | 73 | ||||||
Item 12. | Security Ownership of Certain Beneficial Owners and Management and Related Stockholder Matters | 73 | ||||||
| Equity Compensation Table | 73 | |||||||
Item 13. | Certain Relationships and Related Transactions, and Director Independence | 73 | ||||||
Item 14. | Principal Accountant Fees and Services | 73 | ||||||
PART IV | 74 | |||||||
Item 15. | Exhibits and Financial Statement Schedule | 74 | ||||||
| (a) 1. Financial Statements | 74 | |||||||
| (a) 2. Financial Statement Schedule | 74 | |||||||
| (a) 3. Exhibits | 74 | |||||||
| Signatures | 75 | |||||||
| Schedule II - Valuation and Qualifying Accounts and Reserves | 77 | |||||||
| Index to Exhibits | 78 | |||||||
| Subsidiaries of the Registrant | 81 | |||||||
| Consent of Independent Registered Public Accounting Firm | 84 | |||||||
| Certifications | 85 | |||||||
ii
PART I
NOTE REGARDING AMOUNTS AND FISCAL YEAR REFERENCES
In this annual report, all amounts related to United States dollars and foreign currency and to the number of Nordson Corporation's common shares, except for per share earnings and dividend amounts, are expressed in thousands.
Unless otherwise noted, all references to years relate to our fiscal year ending October 31.
| Item 1. | Business |
General Description of Business
Nordson engineers, manufactures and markets differentiated products and systems used for adhesive, coating, sealant and biomaterial dispensing, fluid management, testing and inspection, curing, and surface treatment, backed with application expertise and direct global sales and service. Nordson serves a wide variety of consumer non-durable, consumer durable and technology end markets including packaging, nonwovens, electronics, medical, appliances, energy, transportation, building and construction, and general product assembly and finishing.
Our strategy for long-term growth is based on a customer-driven focus and a global mindset. Headquartered in Westlake, Ohio, our products are marketed through a network of direct operations in more than 30 countries. Consistent with this global strategy, 75 percent of our revenues are generated outside the United States.
We have 4,094 employees worldwide. Principal manufacturing facilities are located in the United States in California, Colorado, Georgia, Minnesota, New Jersey, Ohio and Rhode Island, as well as in Belgium, China, Germany, India, the Netherlands and the United Kingdom.
Corporate Purpose and Goals
We strive to be a vital, self-renewing, worldwide organization that, within the framework of ethical behavior and enlightened citizenship, grows and produces wealth for our customers, employees, shareholders and communities.
We operate for the purpose of creating balanced, long-term benefits for all of our constituencies: customers, employees, shareholders and communities.
Although every quarter may not produce increased sales, earnings and earnings per share, or exceed the comparative prior year's quarter, we do expect to produce long-term gains. When short-term swings occur, we do not intend to alter our basic objectives in efforts to mitigate the impact of these natural occurrences.
Growth is achieved by seizing opportunities with existing products and markets, investing in systems to maximize productivity and pursuing growth markets. This strategy is augmented through product line additions, engineering, research and development, and acquisition of companies that can serve multinational industrial markets.
We create benefits for our customers through a Package of Values ® , which includes carefully engineered, durable products; strong service support; the backing of a well-established worldwide company with financial and technical strengths; and a corporate commitment to deliver what was promised.
We strive to provide genuine customer satisfaction; it is the foundation upon which we continue to build our business.
Complementing our business strategy is the objective to provide opportunities for employee self-fulfillment, growth, security, recognition and equitable compensation. This goal is met through Human Resources' facilitation of employee training and leadership training and the creation of on-the-job growth opportunities. The result is a highly qualified and professional management team capable of meeting corporate objectives.
1
We recognize the value of employee participation in the planning process. Strategic and operating plans are developed by all business units and divisions, resulting in a sense of ownership and commitment on the part of employees in accomplishing our objectives. In addition, employees participate in Lean and Six Sigma initiatives to continuously improve our processes.
We are an equal opportunity employer.
We are committed to contributing approximately five percent of domestic pretax earnings to human services, education and other charitable activities, particularly in communities where we have major facilities.
Financial Information About Operating Segments, Foreign and Domestic Operations and Export Sales
In accordance with accounting standards, we have reported information about our three operating segments. This information is contained in Note 16 of Notes to Consolidated Financial Statements, which can be found in Part II, Item 8 of this document.
Principal Products and Uses
We engineer, manufacture and market differentiated products and systems used for precision dispensing, testing and inspection, fluid management, surface treatment and curing. Our technology-based systems can be found in manufacturing facilities around the world producing a wide range of goods for consumer durable, consumer non-durable and technology end markets. Equipment ranges from single-use components to manual, stand-alone units for low-volume operations to microprocessor-based automated systems for high-speed, high-volume production lines.
We market our products in the United States and in more than 50 other countries, primarily through a direct sales force and also through qualified distributors and sales representatives. We have built a worldwide reputation for creativity and expertise in the design and engineering of high-technology application equipment that meets the specific needs of our customers. We create value for our customers by developing solutions that increase uptime, enable faster line speeds and reduce consumption of materials.
The following is a summary of the products and markets served by our operating segments:
| 1. | Adhesive Dispensing Systems |
This segment delivers our proprietary precision dispensing technology to diverse markets for applications that commonly reduce material consumption, increase line efficiency and enhance product strength, durability, brand and appearance.
| • | Nonwovens - Equipment for applying adhesives, lotions, liquids and fibers to disposable products. Key strategic markets include adult incontinence products, baby diapers and child-training pants, feminine hygiene products and surgical drapes, gowns, shoe covers and face masks. |
| • | Packaging - Automated adhesive dispensing systems used in the food and beverage and packaged goods industries. Key strategic markets include food packages and wrappers and drink containers. |
| • | Product Assembly - Adhesive and sealant dispensing systems for bonding or sealing plastic, metal and wood products and for use in the paper and paperboard converting industries. Key strategic markets include appliances, automotive components, building and construction materials, electronics, furniture, solar energy, and the manufacturing of bags, sacks, books, envelopes and folding cartons. |
| • | Web Coating and Extruding - Laminating and coating systems used to manufacture continuous-roll goods in the nonwovens, textile, paper and flexible packaging industries. Key strategic markets include carpet, labels, tapes, textiles, and flexible pouches and wraps. |
2
| 2. | Advanced Technology Systems |
This segment integrates our proprietary product technologies found in progressive stages of a customer's production process, such as surface preparation, precisely controlled dispensing of material onto the surface, bond testing and X-ray inspection to ensure quality. This segment primarily serves the specific needs of electronics, medical and related high-tech industries.
| • | Surface Preparation - Automated gas plasma treatment systems used to clean and condition surfaces for the semiconductor, medical and printed circuit board industries. Key strategic markets include contact lenses, electronics, medical instruments and devices, printed circuit boards and semiconductors. |
| • | Dispensing Systems - Controlled manual and automated systems for applying materials in customer processes typically requiring extreme precision and material conservation. These systems include piezoelectric and motionless two-component mixing dispensing systems. Key strategic markets include aerospace, biomaterial application, electronics (cell phones, liquid crystal displays, micro hard drives, microprocessors, printed circuit boards, micro electronic mechanical systems (MEMS), and tablets), general industrial, life sciences (dental and medical devices, including pacemakers and stents), light emitting diodes (LED) and solar energy. |
| • | Fluid Management - Precision engineered, plastic molded, single use fluid connection components used in critical medical and industrial flow control applications. Key strategic markets include anesthesia, cardiovascular and ophthalmic surgery, blood management, pneumatic control systems, water treatment, and analytical instrumentation. |
| • | Bond Testing and Inspection Systems - Bond testing and automated optical and x-ray inspection systems used in the semiconductor and printed circuit board industries. Key strategic markets include electronics (desktop, netbook and notebook computers, digital music players, mobile phones and tablets), light emitting diodes (LED), printed circuit board assemblies and semiconductor packages. |
| 3. | Industrial Coating Systems |
This segment provides both standard and highly-customized equipment used primarily for applying coatings, paint, finishes, sealants and other materials, and curing and drying of dispensed material. This segment primarily serves the consumer durables market.
| • | Automotive - Automated and manual dispensing systems used to apply materials in the automotive, heavy truck and recreational vehicle manufacturing industries. Key strategic markets include powertrain components, body assembly and final trim applications. |
| • | Container Coating - Automated and manual dispensing and curing systems used to coat and cure containers. Key strategic markets include beverage containers and food cans. |
| • | Curing and Drying Systems - Ultraviolet equipment used primarily in curing and drying operations for specialty coatings, semiconductor materials and paints. Key strategic markets include electronics, containers, and durable goods products. |
| • | Liquid Finishing - Automated and manual dispensing systems used to apply liquid paints and coatings to consumer and industrial products. Key strategic markets include automotive components, construction, metal shelving and drums. |
| • | Powder Coating - Automated and manual dispensing systems used to apply powder paints and coatings to a variety of metal, plastic and wood products. Key strategic markets include agriculture and construction equipment, appliances, automotive components, home and office furniture, lawn and garden equipment, pipe coating, and wood and metal shelving. |
3
Manufacturing and Raw Materials
Our production operations include machining and assembly. We manufacture specially designed parts and assemble components into finished equipment. Many components are made in standard modules that can be used in more than one product or in combination with other components for a variety of models. We have principal manufacturing operations in the United States in Amherst, Ohio; Norcross, Swainsboro and Dawsonville, Georgia; Carlsbad, California; Ft. Collins, Colorado; St. Paul, Minnesota; Robbinsville, New Jersey and East Providence, Rhode Island; as well as in Temse, Belgium; Shanghai and Suzhou, China; Luneburg, Germany; Bangalore, India; Maastricht, the Netherlands and in Aylesbury, United Kingdom.
Principal materials used to make our products are metals and plastics, typically in sheets, bar stock, castings, forgings, tubing and pellets. We also purchase many electrical and electronic components, fabricated metal parts, high-pressure fluid hoses, packings, seals and other items integral to our products. Suppliers are competitively selected based on cost, quality and service. All significant raw materials that we use are available through multiple sources.
Senior operating executives supervise an extensive quality control program for our equipment, machinery and systems.
Natural gas and other fuels are our primary energy sources. However, standby capacity for alternative sources is available if needed.
Intellectual Property
We maintain procedures to protect our intellectual property (including patents, trademarks and copyrights) both domestically and internationally. Risk factors associated with our intellectual property are discussed in Item 1A Risk Factors.
Our intellectual property portfolios include valuable patents, trade secrets, know-how, domain names, trademarks and trade names. As of October 31, 2011, we held 380 United States patents and 790 foreign patents and had 187 United States patent applications and 741 foreign patent applications pending, but there is no assurance that any patent application will be issued. We continue to apply for and obtain patent protection for new products on an ongoing basis.
Patents covering individual products extend for varying periods according to the date of filing or grant and legal term of patents in various countries where a patent is obtained. Our current patent portfolio has expiration dates ranging from November 2011 to December 2035. The actual protection a patent provides, which can vary from country to country, depends upon the type of patent, the scope of its coverage, and the availability of legal remedies in each country. We believe, however, that the duration of our patents generally exceeds the life cycles of the technologies disclosed and claimed in the patents.
We believe our trademarks are important assets and we aggressively manage our brands. We also own a number of trademarks in the United States and foreign countries, including registered trademarks for Nordson, Asymtek, ColorMax, Control Coat, Dage, EFD, and Saturn and various common law trademarks which are important to our business, inasmuch as they identify Nordson and our products to our customers. As of October 31, 2011, we had a total of 988 trademark registrations in the United States and in various foreign countries.
We rely upon a combination of nondisclosure and other contractual arrangements and trade secret laws to protect our proprietary rights and also enter into confidentiality and intellectual property agreements with our employees that require them to disclose any inventions created during employment, convey all rights to inventions to us, and restrict the distribution of proprietary information.
We protect and promote our intellectual property portfolio and take those actions we deem appropriate to enforce our intellectual property rights and to defend our right to sell our products. Although in aggregate our intellectual property is important to our operations, we do not believe that the loss of any one patent, trademark, or group of related patents or trademarks would have a material adverse effect on our results of operations or financial position of our overall business.
4
Seasonal Variation in Business
Generally, the highest volume of sales occurs in our fourth quarter due in large part to the timing of customers' capital spending programs. First quarter sales volume is typically the lowest of the year due to customer holiday shutdowns.
Working Capital Practices
No special or unusual practices affect our working capital. However, we generally require advance payments as deposits on customized equipment and systems and, in certain cases, require progress payments during the manufacturing of these products. We have initiated a number of new processes focused on reduction of manufacturing lead times. These initiatives have resulted in lower investment in inventory while maintaining the capability to respond promptly to customer needs.
Customers
We serve a broad customer base, both in terms of industries and geographic regions. In 2011, no single customer accounted for five percent or more of sales.
Backlog
Our backlog of open orders increased to approximately $131,000 at October 31, 2011 from approximately $128,000 at October 31, 2010. The amounts for both years were calculated based upon exchange rates in effect at October 31, 2011. The increase can be traced primarily to acquisitions completed during the year. All orders in the 2011 year-end backlog are expected to be shipped to customers in 2012.
Government Contracts
Our business neither includes nor depends upon a significant amount of governmental contracts or subcontracts. Therefore, no material part of our business is subject to renegotiation or termination at the option of the government.
Competitive Conditions
Our equipment is sold in competition with a wide variety of alternative bonding, sealing, caulking, finishing, coating, testing and inspection, and fluid management techniques . Any production process that requires surface preparation or modification, application of material to a substrate or surface, curing, testing and inspection, or fluid management is a potential use for our equipment.
Many factors influence our competitive position, including pricing, product quality and service. We enjoy a leadership position in our business segments by delivering high-quality, innovative products and technologies, as well as after-the-sale service and technical support. Working with customers to understand their processes and developing the application solutions that help them meet their production requirements also contributes to our leadership position. Our worldwide network of direct sales and technical resources also is a competitive advantage.
Research and Development
Investments in research and development are important to our long-term growth, enabling us to keep pace with changing customer and marketplace needs through the development of new products and new applications for existing products. We place strong emphasis on technology developments and improvements through internal engineering and research teams. Research and development expenses were approximately $26,997 in 2011, compared with approximately $23,835 in 2010 and $25,528 in 2009.
5
Environmental Compliance
We are subject to extensive federal, state, local and foreign environmental, safety and health laws and regulations concerning, among other things, emissions to the air, discharges to land and water and the generation, handling, treatment and disposal of hazardous waste and other materials. Under certain of these laws, we can be held strictly liable for hazardous substance contamination of any real property we have ever owned, operated or used as a disposal site or for natural resource damages associated with such contamination. We are also required to maintain various related permits and licenses, many of which require periodic modification and renewal. The operation of manufacturing plants unavoidably entails environmental, safety and health risks, and we could incur material unanticipated costs or liabilities in the future if any of these risks were realized in ways or to an extent that we did not anticipate.
We believe that we operate in compliance, in all material respects, with applicable environmental laws and regulations. Compliance with environmental laws and regulations requires continuing management effort and expenditures. We have incurred, and will continue to incur, costs and capital expenditures to comply with these laws and regulations and to obtain and maintain the necessary permits and licenses. We believe that the cost of complying with environmental laws and regulations will not have a material effect on our earnings, liquidity or competitive position but cannot assure that material compliance-related costs and expenses may not arise in the future. For example, future adoption of new or amended environmental laws, regulations or requirements or newly discovered contamination or other circumstances that could require us to incur costs and expenses that may have a material effect, but cannot be presently anticipated.
We believe that policies, practices and procedures have been properly designed to prevent unreasonable risk of material environmental damage arising from our operations. We accrue for estimated environmental liabilities with charges to expense and believe our environmental accrual is adequate to provide for our portion of the costs of all such known environmental liabilities. Compliance with federal, state and local environmental protection laws during 2011 had no material effect on our capital expenditures, earnings or competitive position. Based upon consideration of currently available information, we believe liabilities for environmental matters will not have a material adverse affect on our financial position, operating results or liquidity, but we cannot assure that material environmental liabilities may not arise in the future.
Employees
As of October 31, 2011, we had 4,094 full- and part-time employees, including 137 at our Amherst, Ohio, facility who are represented by a collective bargaining agreement that expires on November 3, 2013. No material work stoppages have been experienced at any of our facilities during any of the periods covered by this report.
Available Information
Our proxy statement, annual report to the Securities and Exchange Commission (Form 10-K), quarterly reports (Form 10-Q) and current reports (Form 8-K) and amendments to those reports filed or furnished pursuant to Section 13(a) or 15(d) of the Securities Exchange Act of 1934 are available free of charge at http://www.nordson.com/investors as soon as reasonably practical after such material is electronically filed with, or furnished to, the SEC. Copies of these reports may also be obtained free of charge by sending written requests to Corporate Communications, Nordson Corporation, 28601 Clemens Road, Westlake, Ohio 44145.
6
| Item 1A. | Risk Factors |
In an enterprise as diverse as ours, a wide range of factors could affect future performance. We discuss in this section some of the risk factors that, if they actually occurred, could materially and adversely affect our business, financial condition, value and results of operations. You should consider these risk factors in connection with evaluating the forward-looking statements contained in this Annual Report on Form 10-K because these factors could cause our actual results and financial condition to differ materially from those projected in forward-looking statements.
The significant risk factors affecting our operations include the following:
Changes in United States or international economic conditions could adversely affect the profitability of any of our operations.
In 2011, 25 percent of our revenue was derived from domestic customers, while 75 percent was derived from international customers. Our largest markets include appliance, automotive, construction, container, electronics assembly, food and beverage, furniture, life sciences and medical, light emitting diodes (LED), metal finishing, nonwovens, packaging, paper and paperboard converting and semiconductor. A slowdown in any of these specific end markets could directly affect our revenue stream and profitability.
A portion of our product sales is attributable to industries and markets, such as the semiconductor and metal finishing industries, which historically have been cyclical and sensitive to relative changes in supply and demand and general economic conditions. The demand for our products depends, in part, on the general economic conditions of the industries or national economies of our customers. Downward economic cycles in our customers' industries or countries may reduce sales of some of our products. It is not possible to predict accurately the factors that will affect demand for our products in the future.
Any significant downturn in the health of the general economy, either globally, regionally or in the markets in which we sell products could have an adverse effect on our revenues and financial performance, resulting in impairment of assets.
Significant movements in foreign currency exchange rates or change in monetary policy may harm our financial results.
We are exposed to fluctuations in foreign currency exchange rates, particularly with respect to the euro, the yen, the pound sterling and the Chinese yuan. Any significant change in the value of the currencies of the countries in which we do business against the United States dollar could affect our ability to sell products competitively and control our cost structure, which could have a material adverse effect on our business, financial condition and results of operations. For additional detail related to this risk, see Item 7A, Quantitative and Qualitative Disclosure About Market Risk.
The majority of our consolidated revenues in 2011 were generated in currencies other than the United States dollar, which is our reporting currency. We recognize foreign currency transaction gains and losses arising from our operations in the period incurred. As a result, currency fluctuations between the United States dollar and the currencies in which we do business have caused and will continue to cause foreign currency transaction and translation gains and losses, which historically have been material and could continue to be material. We cannot predict the effects of exchange rate fluctuations upon our future operating results because of the number of currencies involved, the variability of currency exposures and the potential volatility of currency exchange rates. We take actions to manage our foreign currency exposure, such as entering into hedging transactions, where available, but we cannot assure that our strategies will adequately protect our consolidated operating results from the effects of exchange rate fluctuations.
We also face risks arising from the imposition of exchange controls and currency devaluations. Exchange controls may limit our ability to convert foreign currencies into United States dollars or to remit dividends and other payments by our foreign subsidiaries or customers located in or conducting business in a country imposing controls. Currency devaluations diminish the United States dollar value of the currency of the country instituting the devaluation and, if they occur or continue for significant periods, could adversely affect our earnings or cash flow.
7
Failure to retain our existing senior management team or the inability to attract and retain qualified personnel could hurt our business and inhibit our ability to operate and grow successfully.
Our success will continue to depend to a significant extent on the continued service of our executive management team and the ability to recruit, hire and retain other key management personnel to support our growth and operational initiatives and replace executives who retire or resign. Failure to retain our leadership team and attract and retain other important management and technical personnel could place a constraint on our global growth and operational initiatives which could lead to inefficient and ineffective management and operations, which would likely harm our revenues, operations and product development efforts and eventually result in a decrease in profitability.
The inability to continue to develop new products could limit our revenue and profitability.
Innovation is critical to our success. We believe that we must continue to enhance our existing products and to develop and manufacture new products with improved capabilities in order to continue to be a market leader. We also believe that we must continue to make improvements in our productivity in order to maintain our competitive position. Our inability to anticipate, respond to or utilize changing technologies could have a material adverse effect on our business and our consolidated results of operations.
Inability to access capital could impede growth or the repayment or refinancing of existing indebtedness.
The limits imposed on us by the restrictive covenants contained in our credit facilities could prevent us from making acquisitions or cause us to lose access to these facilities.
Our existing credit facilities contain restrictive covenants that limit our ability to, among other things:
| • | borrow money or guarantee the debts of others; |
| • | use assets as security in other transactions; |
| • | make investments or other restricted payments or distributions; |
| • | change our business or enter into new lines of business; |
| • | sell or acquire assets or merge with or into other companies. |
In addition, our credit facilities require us to meet financial ratios, including "total indebtedness" to "consolidated trailing earnings before interest taxes depreciation and amortization" (EBITDA) both as defined in the credit facility, and consolidated trailing EBITDA to consolidated trailing interest expense as defined in the credit facility.
These restrictions could limit our ability to plan for or react to market conditions or meet extraordinary capital needs and could otherwise restrict our financing activities.
Our ability to comply with the covenants and other terms of our credit facilities will depend on our future operating performance. If we fail to comply with such covenants and terms, we will be in default and the maturity of the related debt could be accelerated and become immediately due and payable. We may be required to obtain waivers from our lenders in order to maintain compliance under our credit facilities, including waivers with respect to our compliance with certain financial covenants. If we are unable to obtain necessary waivers and the debt under our credit facilities is accelerated, we would be required to obtain replacement financing at prevailing market rates.
We may need new or additional financing in the future to expand our business or refinance existing indebtedness. If we are unable to access capital on satisfactory terms and conditions, we may not be able to expand our business or meet our payment requirements under our existing credit facilities. Our ability to obtain new or additional financing will depend on a variety of factors, many of which are beyond our control. We may not be able to obtain new or additional financing because we have substantial debt or because we may not have sufficient cash flow to service or repay our existing or future debt. In addition, depending on market conditions and our financial performance, neither debt nor equity financing may be available on satisfactory terms or at all. Finally, as a consequence of worsening financial market conditions, our credit facility providers may not provide the agreed credit if they become undercapitalized.
8
Our growth strategy includes acquisitions, and we may not be able to execute on our acquisition strategy or integrate acquisitions successfully.
Our recent historical growth has depended, and our future growth is likely to continue to depend, in part on our acquisition strategy and the successful integration of acquired businesses into our existing operations. We intend to continue to seek additional acquisition opportunities both to expand into new markets and to enhance our position in existing markets throughout the world. We cannot assure, however, that we will be able to successfully identify suitable acquisition opportunities, prevail against competing potential acquirers, negotiate appropriate acquisition terms, obtain financing that may be needed to consummate such acquisitions, complete proposed acquisitions, successfully integrate acquired businesses into our existing operations or expand into new markets. In addition, we cannot assure that any acquisition, once successfully integrated, will perform as planned, be accretive to earnings, or prove to be beneficial to our operations and cash flow.
The success of our acquisition strategy is subject to other risks and uncertainties, including:
| • | our ability to realize operating efficiencies, synergies or other benefits expected from an acquisition, and possible delays in realizing the benefits of the acquired company or products; |
| • | diversion of management's time and attention from other business concerns; |
| • | difficulties in retaining key employees, customers or suppliers of the acquired business; |
| • | difficulties in maintaining uniform standards, controls, procedures and policies throughout acquired companies; |
| • | adverse effects on existing business relationships with suppliers or customers; |
| • | the risks associated with the assumption of contingent or undisclosed liabilities of acquisition targets; |
| • | the ability to generate future cash flows or the availability of financing. |
In addition, an acquisition could adversely impact our operating performance as a result of the incurrence of acquisition-related debt, acquisition expenses, the amortization of acquisition-acquired assets, or possible future impairments of goodwill or intangible assets associated with the acquisition.
We may also face liability with respect to acquired businesses for violations of environmental laws occurring prior to the date of our acquisition, and some or all of these liabilities may not be covered by environmental insurance secured to mitigate the risk or by indemnification from the sellers from which we acquired these businesses. We could also incur significant costs, including, but not limited to, remediation costs, natural resources damages, civil or criminal fines and sanctions and third-party claims, as a result of past or future violations of, or liabilities associated with environmental laws.
Our inability to protect our intellectual property rights could adversely affect product sales and financial performance.
Difficulties in acquiring and maintaining our intellectual property rights could also adversely affect our business and financial position. Our performance may depend in part on our ability to establish, protect and enforce intellectual property rights with respect to our patented technologies and proprietary rights and to defend against any claims of infringement. These activities involve complex and constantly evolving legal, scientific and factual questions and uncertainties. Our ability to compete effectively with other companies depends in part on our ability to maintain and enforce our patents and other proprietary rights, which are essential to our business. These measures afford only limited protection and may not in all cases prevent our competitors from gaining access to our intellectual property and proprietary information.
9
Litigation has been and may continue to be necessary to enforce our intellectual property rights, to protect our trade secrets and to determine the validity and scope of our proprietary rights. In addition, we may face claims of infringement that could interfere with our ability to use technology or other intellectual property rights that are material to our business operations. If litigation that we initiate is unsuccessful, we may not be able to protect the value of some of our intellectual property. If a claim of infringement against us is successful, we may be required to pay royalties or license fees to continue to use technology or other intellectual property rights that we have been using or we may be unable to obtain necessary licenses from third parties at a reasonable cost or within a reasonable time. If we are unable to timely obtain licenses on reasonable terms, we may be forced to cease selling or using any of our products that incorporate the challenged intellectual property, or to redesign or, in the case of trademark claims, rename our products to avoid infringing the intellectual property rights of third parties. This may not always be possible or, if possible, may be time consuming and expensive. Intellectual property litigation, whether successful or unsuccessful, could be expensive to us and divert some of our resources. Our intellectual property rights may not be as valuable as we believe, which could result in a competitive disadvantage or adversely affect our business and financial performance.
Political conditions in foreign countries in which we operate could adversely affect us.
We conduct our manufacturing, sales and distribution operations on a worldwide basis and are subject to risks associated with doing business outside the United States. In 2011, approximately 75 percent of our total sales were to customers outside the United States. We expect that international operations and United States export sales will continue to be important to our business for the foreseeable future. Both sales from international operations and export sales are subject in varying degrees to risks inherent in doing business outside the United States. Such risks include, but are not limited to, the following:
| • | risks of economic instability; |
| • | unanticipated or unfavorable circumstances arising from host country laws or regulations; |
| • | restrictions on the transfer of funds into or out of a country; |
| • | currency exchange rate fluctuations; |
| • | difficulties in enforcing agreements and collecting receivables through some foreign legal systems; |
| • | international customers with longer payment cycles than customers in the United States; |
| • | potential negative consequences from changes to taxation policies; |
| • | the disruption of operations from foreign labor and political disturbances; |
| • | the imposition of tariffs, import or export licensing requirements; |
| • | exchange controls or other trade restrictions including transfer pricing restrictions when products produced in one country are sold to an affiliated entity in another country. |
Any of these events could reduce the demand for our products, limit the prices at which we can sell our products, or otherwise have an adverse effect on our operating performance.
We could be adversely affected by rapid changes in interest rates.
Any period of unexpected or rapid increase in interest rates may also adversely affect our profitability. At October 31, 2011, we had $319,156 of total debt and notes payable outstanding, of which 60 percent was priced at interest rates that float with the market. A one percent increase in the interest rate on the floating rate debt in 2011 would have resulted in approximately $785 of additional interest expense. A higher level of floating rate debt would increase the exposure to changes in interest rates. For additional detail related to this risk, see Item 7A, Quantitative and Qualitative Disclosure About Market Risk.
| Item 1B. | Unresolved Staff Comments |
None.
10
| Item 2. | Properties |
The following table summarizes our principal properties as of October 31, 2011.
Location | Description of Property | Approximate Square Feet | ||||
Amherst, Ohio 1, 2, 3 | A manufacturing, laboratory and office complex | 585,000 | ||||
Norcross, Georgia 1 | A manufacturing, laboratory and office building | 150,000 | ||||
Dawsonville, Georgia 1 | A manufacturing, laboratory and office building | 134,000 | ||||
East Providence, Rhode Island 2 | A manufacturing, warehouse and office building | 116,000 | ||||
Duluth, Georgia 1 | An office and laboratory building | 110,000 | ||||
Carlsbad, California 2 | Two manufacturing and office buildings (leased) | 88,000 | ||||
Robbinsville, New Jersey 2 | A manufacturing, warehouse and office building (leased) | 88,000 | ||||
Swainsboro, Georgia 1 | A manufacturing building | 59,000 | ||||
Ft. Collins, Colorado 2 | A manufacturing, warehouse and office building (leased) | 42,000 | ||||
Vista, California 2 | A manufacturing building (leased) | 41,000 | ||||
St. Paul, Minnesota 2 | A manufacturing, warehouse and office building (leased) | 27,000 | ||||
Westlake, Ohio | Corporate headquarters | 28,000 | ||||
Luneburg, Germany 1 | A manufacturing and laboratory building | 130,000 | ||||
Shanghai, China 1, 3 | A manufacturing, warehouse and office building (leased) | 92,000 | ||||
Erkrath, Germany 1,2, 3 | An office, laboratory and warehouse building (leased) | 63,000 | ||||
Bangalore, India 1, 2, 3 | A manufacturing, warehouse and office building | 56,000 | ||||
Shanghai, China 1,2, 3 | An office and laboratory building | 54,000 | ||||
Temse, Belgium 1 | A manufacturing, warehouse and office building (leased) | 44,000 | ||||
Tokyo, Japan 1, 2, 3 | An office, laboratory and warehouse building (leased) | 42,000 | ||||
Aylesbury, U.K. 1,2 | A manufacturing, warehouse and office building (leased) | 36,000 | ||||
Mexico City, Mexico 1, 2, 3 | A warehouse and office building (leased) | 23,000 | ||||
Suzhou, China 2 | A manufacturing, warehouse and office building (leased) | 22,000 | ||||
Lagny Sur Marne, France 1, 3 | An office building (leased) | 17,000 | ||||
Segrate, Italy 1, 3 | An office, laboratory and warehouse building (leased) | 7,000 | ||||
Singapore 1, 2, 3 | A warehouse and office building (leased) | 6,000 | ||||
Business Segment - Property Identification Legend
1 - Adhesive Dispensing Systems
2 - Advanced Technology Systems
3 - Industrial Coating Systems
The facilities listed above have adequate, suitable and sufficient capacity (production and nonproduction) to meet present and foreseeable demand for our products.
Other properties at international subsidiary locations and at branch locations within the United States are leased. Lease terms do not exceed 25 years and generally contain a provision for cancellation with some penalty at an earlier date.
In addition, we lease equipment under various operating and capitalized leases. Information about leases is reported in Note 6 of Notes to Consolidated Financial Statements that can be found in Part II, Item 8 of this document.
11
| Item 3. | Legal Proceedings |
We are involved in pending or potential litigation regarding environmental, product liability, patent, contract, employee and other matters arising from the normal course of business. Including the environmental matter discussed below, it is our opinion, after consultation with legal counsel, that resolutions of these matters are not expected to result in a material effect on our financial condition, quarterly or annual operating results or cash flows.
Environmental - We have voluntarily agreed with the City of New Richmond, Wisconsin and other Potentially Responsible Parties to share costs associated with the remediation of the City of New Richmond municipal landfill (the "Site") and constructing a potable water delivery system serving the impacted area down gradient of the Site. At October 31, 2011 and 2010, our accrual for the ongoing operation, maintenance and monitoring obligation at the Site was $795 and $885, respectively.
The liability for environmental remediation represents management's best estimate of the probable and reasonably estimable undiscounted costs related to known remediation obligations. The accuracy of our estimate of environmental liability is affected by several uncertainties such as additional requirements that may be identified in connection with remedial activities, the complexity and evolution of environmental laws and regulations, and the identification of presently unknown remediation requirements. Consequently, our liability could be greater than our current estimate. However, we do not expect that the costs associated with remediation will have a material adverse effect on our financial condition or results of operations.
| Item 4. | Removed and Reserved |
12
Executive Officers of the Company
Our executive officers as of October 31, 2011, were as follows:
Name | Age | Officer Since | Position or Office with The Company and Business Experience During the Past Five (5) Year Period | |||||||
Michael F. Hilton | 57 | 2010 | President and Chief Executive Officer, 2010 Senior Vice President and General Manager-Electronics and Performance Materials Segment of Air Products and Chemicals, Inc., 2007 Vice President and General Manager-Electronics and Performance Materials Segment of Air Products and Chemicals, Inc., 2006 | |||||||
John J. Keane | 50 | 2003 | Senior Vice President, 2005 | |||||||
Peter G. Lambert | 51 | 2005 | Senior Vice President, 2010 | |||||||
| Vice President, 2005 | ||||||||||
Douglas C. Bloomfield | 52 | 2005 | Vice President, 2005 | |||||||
Gregory P. Merk | 40 | 2006 | Vice President, 2006 | |||||||
Shelly M. Peet | 46 | 2007 | Vice President, 2009 | |||||||
| Vice President, Chief Information Officer, 2007 | ||||||||||
| Director, Corporate Information Services and Chief Information Officer, 2003 | ||||||||||
Gregory A. Thaxton | 50 | 2007 | Vice President, Chief Financial Officer, 2008 | |||||||
| Vice President, Controller, 2007 | ||||||||||
| Corporate Controller and Chief Accounting Officer, 2006 | ||||||||||
Robert E. Veillette | 59 | 2007 | Vice President, General Counsel and Secretary, 2007 | |||||||
| Secretary and Assistant General Counsel, 2002 | ||||||||||
13
PART II
| Item 5. | Market for the Company's Common Equity, Related Stockholder Matters and Issuer Purchases of Equity Securities |
Market Information and Dividends
(a) Our common shares are listed on the Nasdaq Global Select Market under the symbol NDSN. As of November 30, 2011, there were 1,698 registered shareholders. The table below is a summary of dividends paid per common share and the range of closing market prices during each quarter of 2011 and 2010.
| Dividend Paid | Common Share Price | |||||||||||
Quarters | High | Low | ||||||||||
2011: | ||||||||||||
First | $ | .105 | $ | 47.58 | $ | 38.06 | ||||||
Second | .105 | 58.75 | 47.56 | |||||||||
Third | .105 | 59.01 | 48.98 | |||||||||
Fourth | .125 | 50.50 | 37.21 | |||||||||
2010: | ||||||||||||
First | $ | .095 | $ | 31.94 | $ | 26.05 | ||||||
Second | .095 | 37.96 | 27.11 | |||||||||
Third | .095 | 36.87 | 27.39 | |||||||||
Fourth | .105 | 39.88 | 31.64 | |||||||||
Source: NASDAQ OMX
| (b) | Use of Proceeds. Not applicable. |
| (c) | Issuer Purchases of Equity Securities |
| Total Number of Shares Repurchased | Average Price Paid per Share | Total Number of Shares Repurchased as Part of Publicly Announced Plans or Programs (1) | Maximum Number or Approximate Value of Shares That May Yet Be Purchased Under the Plans or Programs (1) | |||||||||||||
August 1, 2011 to August 31, 2011 | 539 | $ | 43.40 | 539 | 939 | |||||||||||
September 1, 2011 to September 30, 2011 | 1,186 | $ | 41.73 | 1,186 | $ | 89,664 | ||||||||||
October 1, 2011 to October 31, 2011 | 448 | $ | 41.84 | 448 | $ | 70,905 | ||||||||||
|
|
|
| |||||||||||||
Total | 2,173 | 2,173 | ||||||||||||||
|
|
|
| |||||||||||||
(1) In May 2011, the board of directors approved a stock repurchase program of up to 2,000 shares. This program was completed in September 2011, and the board of directors approved an additional repurchase program of up to $100,000. Uses for repurchased shares include the funding of benefit programs including stock options, nonvested stock and 401(k) matching. Shares purchased are treated as treasury shares until used for such purposes. The repurchase programs are being funded using working capital and proceeds from borrowings under our credit facilities.
14
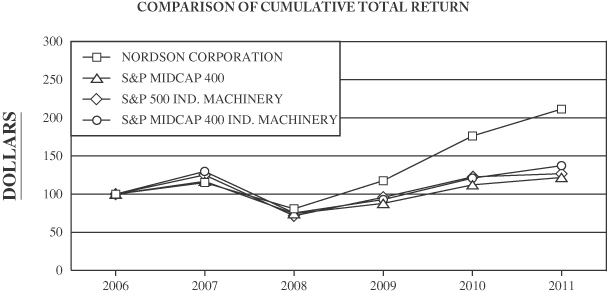
Performance Graph
The following is a graph that compares the five-year cumulative return, calculated on a dividend-reinvested basis, from investing $100 on November 1, 2006 in Nordson common shares, the S&P MidCap 400 Index, the S&P 500 Industrial Machinery Index, and the S&P MidCap 400 Industrial Machinery Index.
| Period Ending October 31 | ||||||||||||
| Company/Market/Peer Group | 2006 | 2007 | 2008 | 2009 | 2010 | 2011 | ||||||
Nordson Corporation | $100.00 | $115.32 | $80.62 | $117.69 | $176.15 | $211.33 | ||||||
S&P MidCap 400 | $100.00 | $117.02 | $74.35 | $ 87.87 | $112.15 | $121.74 | ||||||
S&P 500 Ind. Machinery | $100.00 | $125.19 | $71.65 | $ 95.87 | $122.67 | $126.92 | ||||||
S&P MidCap 400 Ind. Machinery | $100.00 | $129.99 | $75.26 | $ 93.04 | $120.92 | $137.53 | ||||||
Source: Morningstar
15
| Item 6. | Selected Financial Data |
Five-Year Summary
| 2011 | 2010 | 2009 | 2008 | 2007 | ||||||||||||||||
(In thousands except for per-share amounts) | ||||||||||||||||||||
Operating Data (a) | ||||||||||||||||||||
Sales | $ | 1,233,159 | $ | 1,041,551 | $ | 819,165 | $ | 1,124,829 | $ | 993,649 | ||||||||||
Cost of sales | 484,727 | 419,937 | 350,239 | 494,394 | 439,804 | |||||||||||||||
% of sales | 39 | 40 | 43 | 44 | 44 | |||||||||||||||
Selling and administrative expenses | 429,489 | 384,752 | 337,294 | 434,476 | 401,294 | |||||||||||||||
% of sales | 35 | 37 | 41 | 39 | 40 | |||||||||||||||
Severance and restructuring costs | 1,589 | 2,029 | 16,396 | 5,621 | 409 | |||||||||||||||
Goodwill and long-lived asset impairments | 1,811 | - | 243,043 | - | - | |||||||||||||||
Operating profit (loss) | 315,543 | 234,833 | (127,807 | ) | 190,338 | 152,142 | ||||||||||||||
% of sales | 26 | 23 | (16 | ) | 17 | 15 | ||||||||||||||
Net income (loss) | 222,364 | 168,048 | (160,055 | ) | 117,504 | 90,692 | ||||||||||||||
% of sales | 18 | 16 | (20 | ) | 10 | 9 | ||||||||||||||
Financial Data (a) | ||||||||||||||||||||
Working capital | $ | 294,796 | $ | 259,117 | $ | 190,249 | $ | 180,317 | $ | 180,010 | ||||||||||
Net property, plant and equipment and other non-current assets | 827,493 | 535,323 | 544,003 | 782,356 | 801,916 | |||||||||||||||
Total invested capital (b) | 853,071 | 567,323 | 508,989 | 847,253 | 846,911 | |||||||||||||||
Total assets | 1,304,450 | 986,354 | 890,674 | 1,166,669 | 1,211,840 | |||||||||||||||
Long-term liabilities | 550,966 | 289,368 | 364,276 | 388,561 | 450,809 | |||||||||||||||
Shareholders' equity | 571,323 | 505,072 | 369,976 | 574,112 | 531,117 | |||||||||||||||
Return on average invested capital - % (c) | 35 | 32 | 10 | (d) | 15 | 14 | ||||||||||||||
Return on average shareholders' equity - % (e) | 39 | 40 | 13 | (f) | 20 | 19 | ||||||||||||||
Per-Share Data (a)(g) | ||||||||||||||||||||
Average number of common shares | 67,616 | 67,610 | 67,129 | 67,492 | 67,094 | |||||||||||||||
Average number of common shares and common share equivalents | 68,425 | 68,442 | 67,129 | 68,613 | 68,363 | |||||||||||||||
Basic earnings (loss) per share | $ | 3.29 | $ | 2.49 | $ | (2.38 | ) | $ | 1.74 | $ | 1.35 | |||||||||
Diluted earnings (loss) per share | 3.25 | 2.46 | (2.38 | ) | 1.71 | 1.33 | ||||||||||||||
Dividends per common share | 0.44 | 0.39 | 0.36875 | 0.365 | 0.35 | |||||||||||||||
Book value per common share | 8.71 | 7.44 | 5.49 | 8.52 | 7.88 | |||||||||||||||
| (a) | See accompanying Notes to Consolidated Financial Statements. |
| (b) | Notes payable, plus current portion of long-term debt, plus long-term debt, minus cash and marketable securities, plus shareholders' equity. |
| (c) | Net income (loss), plus after-tax interest expense on borrowings as a percentage of average quarterly borrowings (net of cash) plus average quarterly shareholders' equity over five accounting periods. |
| (d) | The percentage for 2009 excludes goodwill and long-lived asset impairment charges. Including these charges, the return on average invested capital for 2009 would have been negative 21 percent. |
| (e) | Net income (loss) as a percentage of average quarterly shareholders' equity over five accounting periods. |
| (f) | The percentage for 2009 excludes goodwill and long-lived asset impairment charges. Including these charges, the return on average shareholder equity for 2009 would have been negative 28 percent. |
| (g) | Amounts adjusted for 2-for-1 stock split effective April 12, 2011. |
16
| Item 7. | Management's Discussion and Analysis of Financial Condition and Results of Operations |
NOTE REGARDING AMOUNTS AND FISCAL YEAR REFERENCES
In this annual report, all amounts related to United States dollars and foreign currency and to the number of Nordson Corporation's common shares, except for per share earnings and dividend amounts, are expressed in thousands.
Unless otherwise noted, all references to years relate to our fiscal year ending October 31.
Critical Accounting Policies and Estimates
Our consolidated financial statements and accompanying notes have been prepared in accordance with accounting principles generally accepted in the United States. The preparation of these financial statements requires management to make estimates, judgments and assumptions that affect reported amounts of assets, liabilities, revenues and expenses. On an ongoing basis, we evaluate the accounting policies and estimates that are used to prepare financial statements. We base our estimates on historical experience and assumptions believed to be reasonable under current facts and circumstances. Actual amounts and results could differ from these estimates used by management.
Certain accounting policies that require significant management estimates and are deemed critical to our results of operations or financial position are discussed below. On a regular basis, critical accounting policies are reviewed with the Audit Committee of the board of directors.
Revenue Recognition - Most of our revenues are recognized upon shipment, provided that persuasive evidence of an arrangement exists, the sales price is fixed or determinable, collectibility is reasonably assured, and title and risk of loss have passed to the customer. In October 2009, the FASB issued an accounting standard update on multiple deliverable arrangements, which we adopted on November 1, 2010. This accounting standard update establishes a relative selling price hierarchy for determining the selling price of a deliverable based on vendor specific objective evidence (VSOE) if available, third-party evidence (TPE) if vendor-specific objective evidence is not available, or best estimated selling price (BESP) if neither vendor-specific objective evidence nor third-party evidence is available. Our multiple deliverable arrangements include installation, installation supervision, training, and spare parts, which tend to be completed in a short period of time, at an insignificant cost, and utilizing skills not unique to us, and, therefore, are typically regarded as inconsequential or perfunctory. Revenue for undelivered items is deferred and included within accrued liabilities in the accompanying balance sheet. Revenues deferred in 2011, 2010 and 2009 were not material. The requirements of this standard did not significantly change our units of accounting or how we allocate arrangement consideration to various units of accounting. The adoption of this standard had no material impact on our financial position or results of operations.
Goodwill - Goodwill is the excess of purchase price over the fair value of tangible and identifiable intangible net assets acquired in various business combinations. Goodwill is not amortized but is tested for impairment annually at the reporting unit level, or more often if indications of impairment exist. Our reporting units are the Adhesive Dispensing Systems segment, the Industrial Coating Systems segment and one level below the Advanced Technology Systems segment.
The goodwill impairment test is a two-step process. In the first step, performed in the fourth quarter of each year, we calculate a reporting unit's fair value using a discounted cash flow valuation methodology and compare the result against the reporting unit's carrying value of net assets. If the carrying value of a reporting unit exceeds its fair value, then a second step is performed to determine if goodwill is impaired. In step one, the assumptions used for discounted cash flow, revenue growth, operating margin, and working capital turnover are based on general management's strategic plans tempered by performance trends and reasonable expectations about those trends. Terminal value calculations employ a published formula known as the "Gordon Growth Model Method" that essentially captures the present value of perpetual cash flows beyond the last projected period assuming a constant Weighted Average Cost of Capital methodology (WACC) and growth rate. For each reporting unit, sensitivity calculations vary the discount and terminal growth rates in order to provide a range of assurance that our expected assumptions are fair for detecting impairment.
17
Discount rates were developed using a WACC methodology. The WACC represents the blended average required rate of return for equity and debt capital based on observed market return data and company specific risk factors. For 2011, the discount rates used ranged from 10 percent to 19 percent depending upon the reporting unit's size, end market volatility, and projection risk. The calculated internal rate of return for the step one consolidated valuation was 11.3 percent, the same as the calculated WACC for total Nordson.
To test the reasonableness of the discounted cash flow valuations, we performed the control premium test, which compares the sum of the fair values calculated for our reporting units (net of debt) to the market value of equity. The control premium was negative 11 percent as of the test date of August 1, 2011 and 0 percent as of our year-end of October 31, 2011. These comparisons indicated that the discounted cash flow valuation was reasonable. In addition, indications of value derived for each reporting unit using the market approach reconciled reasonably with the results of the discounted cash flow approach.
In 2011 and 2010, the results of our step one testing indicated no impairment; therefore, the second step of impairment testing was not necessary.
In 2009, we determined that the second step of impairment testing was necessary. In the second step, a hypothetical purchase price allocation of the reporting unit's assets and liabilities is performed using the fair value calculated in step one. The difference between the fair value of the reporting unit and the hypothetical fair value of assets and liabilities is the implied goodwill amount. Impairment is recorded if the carrying value of the reporting unit's goodwill is higher than its implied goodwill. Based upon the results of our impairment testing, we recognized an impairment charge for a reduction in the carrying value of goodwill in the amount of $232,789, relating to six reporting units as follows: Dage $166,916, Picodostec $7,530, YESTech $26,149, March Plasma Systems $16,449, UV Curing $12,129, and Industrial Coating Systems $3,616.
The excess of fair value (FV) over carrying value (CV) was compared to the carrying value for each reporting unit. Based on the results shown in the table below and based on our measurement date of August 1, 2011, our conclusion is that no indicators of impairment exist in 2011. Potential events or circumstances, such as a sustained downturn in global economies, could have a negative effect on estimated fair values.
| WACC | Excess of FV over CV | Goodwill | ||||||||||
Adhesive Dispensing | 10.0 | % | 792 | % | $ | 42,427 | ||||||
Asymtek | 13.5 | % | 2939 | % | $ | 15,151 | ||||||
EFD | 12.0 | % | 92 | % | $ | 297,632 | ||||||
Dage and YESTech | 19.0 | % | 54 | % | $ | 14,397 | ||||||
We acquired Value Plastics, Inc ("Value Plastics") on August 26, 2011, subsequent to the measurement date for impairment testing. Determination of the preliminary fair value associated with this acquisition was completed with the assistance of an independent valuation specialist on October 5, 2011. Since the date of valuation, no events or changes in circumstances have occurred that would more likely than not reduce the fair value of Value Plastics below its carrying value. For future valuation purposes, Value Plastics will be a component of EFD.
Other Long-Lived Assets - Our test for recoverability of long-lived depreciable and amortizable assets uses undiscounted cash flows. Long-lived assets are grouped at the lowest level for which there are identifiable cash flows. The total carrying value of long-lived assets for each reporting unit has been compared to the forecasted cash flows of each reporting unit's long-lived assets being tested. Cash flows have been defined as earnings before interest, taxes, depreciation, and amortization, less annual maintenance capital spending.
Estimates of future cash flows used to test the recoverability of a long-lived asset (asset group) are based on the remaining useful life of the asset. We believe that the relative value of long-lived assets within each reporting unit is a reasonable proxy for the relative importance of the assets in the production of cash flow. To get to a reasonable forecast period, the aggregate net book value of long-lived assets was divided by the current depreciation and amortization value to arrive at a blended remaining useful life. Our calculations for 2011 showed the undiscounted aggregate value of cash flows over the remaining useful life for each reporting unit was greater than the respective carrying value of the long-lived assets within each reporting unit, so no impairment charges were recognized.
18
Inventories - Inventories are valued at the lower of cost or market. Cost was determined using the last-in, first-out (LIFO) method for 26 percent of consolidated inventories at October 31, 2011, and 25 percent at October 31, 2010, with the first-in, first-out (FIFO) method used for the remaining inventory. On an ongoing basis, inventory is tested for technical obsolescence, as well as for future demand and changes in market conditions. We have historically maintained inventory reserves to reflect those conditions when the cost of inventory is not expected to be recovered. Reserves are also maintained for inventory used for demonstration purposes. The inventory reserve balance was $16,050, $16,802 and $15,740 at October 31, 2011, 2010 and 2009, respectively.
Pension Plans and Postretirement Medical Plans - The measurement of liabilities related to our pension plans and postretirement medical plans is based on management's assumptions related to future factors, including interest rates, return on pension plan assets, compensation increases, mortality and turnover assumptions, and health care cost trend rates.
The weighted-average discount rate used to determine the present value of our domestic pension plan obligations was 4.46 percent at October 31, 2011 and 5.21 percent at October 31, 2010. The discount rate for these plans, which comprised 79 percent of the worldwide pension obligations at October 31, 2011, was based on quality fixed income investments with a duration period approximately equal to the period over which pension obligations are expected to be settled. The weighted-average discount rate used to determine the present value of our various international pension plan obligations was 4.43 percent at October 31, 2011, compared to 4.17 percent at October 31, 2010. The discount rates used for the international plans were determined by using quality fixed income investments with a duration period approximately equal to the period over which pension obligations are expected to be settled.
In determining the expected return on plan assets, we consider both historical performance and an estimate of future long-term rates of return on assets similar to those in our plans. We consult with and consider the opinions of financial and actuarial experts in developing appropriate return assumptions. The expected rate of return (long-term investment rate) on domestic pension assets used to determine net benefit costs was 8.25 percent in 2011 and 8.51 percent in 2010. The average expected rate of return on international pension assets used to determine net benefit costs was 4.84 percent in 2011 and 4.85 percent in 2010.
The assumed rate of compensation increases used to determine the present value of our domestic pension plan obligations was 3.20 percent at October 31, 2011 and 3.30 percent at October 31, 2010. The assumed rate of compensation increases used to determine the present value of our international pension plan obligations was 3.16 percent at October 31, 2011, compared to 3.21 percent at October 31, 2010.
Annual expense amounts are determined based on the discount rate used at the end of the prior year. Differences between actual and assumed investment returns on pension plan assets result in actuarial gains or losses that are amortized into expense over a period of years.
Economic assumptions have a significant effect on the amounts reported. The effect of a one percent change in the discount rate, expected return on assets and compensation increase is shown in the table below. Bracketed numbers represent decreases in expense and obligation amounts.
| United States | International | |||||||||||||||
| 1% Point Increase | 1% Point Decrease | 1% Point Increase | 1% Point Decrease | |||||||||||||
Discount rate: | ||||||||||||||||
Effect on total service and interest cost components in 2011 | $ | (3,107 | ) | $ | 3,696 | $ | (324 | ) | $ | 405 | ||||||
Effect on pension obligation as of October 31, 2011 | $ | (34,776 | ) | $ | 43,229 | $ | (11,917 | ) | $ | 13,847 | ||||||
Expected return on assets: | ||||||||||||||||
Effect on total service and interest cost components in 2011 | $ | (1,889 | ) | $ | 1,888 | $ | (302 | ) | $ | 301 | ||||||
Effect on pension obligation as of October 31, 2011 | $ | - | $ | - | $ | - | $ | - | ||||||||
Compensation increase: | ||||||||||||||||
Effect on total service and interest cost components in 2011 | $ | 2,816 | $ | (2,291 | ) | $ | 462 | $ | (420 | ) | ||||||
Effect on pension obligation as of October 31, 2011 | $ | 14,649 | $ | (12,040 | ) | $ | 8,575 | $ | (7,062 | ) | ||||||
19
With respect to the domestic postretirement medical plan, the discount rate used to value the benefit obligation decreased from 5.25 percent at October 31, 2010 to 4.50 percent at October 31, 2011. The annual rate of increase in the per capita cost of covered benefits (the health care cost trend rate) is assumed to be 9.36 percent in 2012, decreasing gradually to 5.00 percent in 2016.
For the international postretirement plan, the discount rate used to value the benefit obligation was 5.85 percent at October 31, 2011 and 5.75 percent at October 31, 2010. The annual rate of increase in the per capita cost of covered benefits (the health care cost trend rate) is assumed to be 7.00 percent in 2012, decreasing gradually to 3.50 percent in 2031.
The discount rate and the health care cost trend rate assumptions have a significant effect on the amounts reported. For example, a one-percentage point change in the discount rate and assumed health care cost trend rate would have the following effects:
| United States | International | |||||||||||||||
| 1% Point Increase | 1% Point Decrease | 1% Point Increase | 1% Point Decrease | |||||||||||||
Discount rate: | ||||||||||||||||
Effect on total service and interest cost components in 2011 | $ | (628 | ) | $ | 753 | $ | (9 | ) | $ | 11 | ||||||
Effect on postretirement obligation as of October 31, 2011 | $ | (10,119 | ) | $ | 12,871 | $ | (135 | ) | $ | 181 | ||||||
Health care trend rate: | ||||||||||||||||
Effect on total service and interest cost components in 2011 | $ | 871 | $ | (688 | ) | $ | 19 | $ | (14 | ) | ||||||
Effect on postretirement obligation as of October 31, 2011 | $ | 11,804 | $ | (9,476 | ) | $ | 174 | $ | (132 | ) | ||||||
Employees hired after January 1, 2002, are not eligible to participate in the domestic postretirement medical plan.
Pension and postretirement expenses in 2012 are expected to be approximately $7,000 higher than 2011, primarily due to changes in the discount rate, expected rate of return on assets and changes in demographic assumptions.
Financial Instruments - Assets, liabilities and commitments that are to be settled in cash and are denominated in foreign currencies are sensitive to changes in currency exchange rates. We enter into foreign currency forward contracts, which are derivative financial instruments, to reduce the risk of foreign currency exposures resulting from the collection of receivables, payables and loans denominated in foreign currencies. The maturities of these contracts are usually less than 90 days. Forward contracts are not designated as hedging instruments and therefore are marked to market each accounting period, and the resulting gains or losses are included in "other-net" within other income (expense) in the Consolidated Statement of Income.
Warranties - We provide customers with a product warranty that requires us to repair or replace defective products within a specified period of time (generally one year) from the date of delivery or first use. An accrual is recorded for expected warranty costs for products shipped through the end of each accounting period. In determining the amount of the accrual, we rely primarily on historical warranty claims. Amounts charged to the warranty reserve were $7,217, $6,068 and $3,824 in 2011, 2010 and 2009, respectively. The reserve balance was $6,528, $5,242 and $4,587 at October 31, 2011, 2010 and 2009, respectively.
Long-Term Incentive Plan (LTIP) - Under the long-term incentive plan, executive officers and selected other key employees receive share awards based solely on corporate performance measures over three-year performance periods. Awards vary based on the degree to which corporate performance equals or exceeds predetermined threshold, target and maximum performance levels at the end of a performance period. No award will occur unless certain threshold performance objectives are equaled or exceeded. The amount of compensation expense is based upon current performance projections for each three-year period and the percentage of the requisite service that has been rendered. The calculations are also based upon the grant date fair value determined using the closing market price of common stock at the grant date, reduced by the implied value of dividends not to be paid. Awards are recorded as capital in excess of stated value in shareholders' equity. The amount recorded at October 31, 2011 for the plans originating in 2009, 2010 and 2011 was $6,081.
20
Compensation expense attributable to all LTIP performance periods for executive officers and selected other key employees for 2011 and 2010 was $4,067 and $3,879, respectively. There was $5,014 credited to expense in 2009 due to economic effects.
2011 and 2010
Sales - Worldwide sales for 2011 were $1,233,159, an increase of 18.4 percent from 2010 sales of $1,041,551. Sales volume increased 15.2 percent, and favorable currency effects caused by the weaker U.S. dollar increased sales by 3.2 percent. Three acquisitions were made during 2011; Micromedics, Inc. ("Micromedics") and Value Plastics, which were included within the Advanced Technology Systems segment, and Constructiewerkhuizen G. Verbruggen NV ("Verbruggen"), which was included within the Adhesive Systems segment. The effect on sales volume of these acquisitions, less sales associated with UV graphic arts and lamps product lines divested in 2010, was less than one percent.
As used throughout this Form 10-K, geographic regions include the Americas (Canada, Mexico and Central and South America), Asia Pacific (excluding Japan), Europe, Japan, and the United States.
Sales of the Adhesive Dispensing Systems segment were $611,911 in 2011, an increase of $86,621, or 16.5 percent, from 2010 sales of $525,290. The increase was the result of a sales volume increase of 12.1 percent and favorable currency effects that increased sales by 4.4 percent. The sales volume increase generated by the Verbruggen acquisition was less than one percent. Sales volume increased in all geographic regions and was particularly strong in the Americas region. Sales increased in both consumer non-durable and consumer durable end markets.
Sales of the Advanced Technology Systems segment were $438,634 in 2011, an increase of $69,185, or 18.7 percent, from 2010 sales of $369,449. The increase was the result of a sales volume increase of 17.0 percent and favorable currency effects that increased sales by 1.7 percent. Within the segment, volume increases occurred in all geographic regions and were most pronounced in the United States. The sales volume increase generated by the Micromedics and Value Plastics acquisitions was three percent; however, this was offset by two percent resulting from the UV graphic arts and lamps product lines divested in 2010. Higher demand for consumer electronics drove the sales increase within this segment.
In 2011, sales of the Industrial Coating Systems segment were $182,614, an increase of $35,802, or 24.4 percent, from 2010 sales of $146,812. The increase was the result of a sales volume increase of 21.4 percent and favorable currency effects that increased sales by 3.0 percent. Sales volume increased in all geographic regions and was most pronounced in the Asia Pacific and Americas regions. Within this segment, sales increased across all product lines.
Sales outside the United States accounted for 74.7 percent of our sales in 2011, up from 73.7 percent last year. Sales increased in all five geographic regions in which we operate. In the United States, sales were $312,328 in 2011, an increase of 14.1 percent from 2010. In the Americas, sales were $102,077, up 30.8 percent from 2010. Sales volume increased 27.0 percent, and favorable currency effects increased sales by 3.8 percent. In Europe, sales were $390,319 in 2011, an increase of 16.1 percent from 2010. Sales volume increased 12.0 percent, and favorable currency effects increased sales by 4.1 percent. In Japan, sales were $111,003, up 19.0 percent from 2010. Sales volume increased 9.2 percent, and favorable currency effects added 9.8 percent. In Asia Pacific, sales were $317,432 in 2011, an increase of 21.9 percent from 2010. Sales volume increased 19.0 percent, and favorable currency effects added 2.9 percent.
It is estimated that the effect of pricing on total revenue was neutral relative to 2010.
Operating profit - Cost of sales in 2011 were $484,727, up 15.4 percent from 2010. The increase compared to 2010 is due to increased sales volume. Gross margins, expressed as a percentage of sales, increased to 60.7 percent in 2011 from 59.7 percent in 2010. The gross margin percentage increase in 2011 was due to higher absorption of fixed overhead costs, low-cost sourcing, more profitable product line mix and favorable currency effects.
Selling and administrative expenses, excluding severance and restructuring costs, were $429,489 in 2011, an increase of $44,737, or 11.6 percent, from 2010. The increase was largely due to the effects of acquisitions, a
21
$3,120 fee paid to withdraw from a multiemployer employee pension fund in Japan, and higher incentive compensation expenses resulting from a higher level of business activity in 2011. In addition, currency translation effects increased selling and administrative expenses by 2.6 percent. Selling and administrative expenses as a percentage of sales decreased to 34.8 percent in 2011 from 36.9 percent in 2010, due to the higher level of sales and the favorable effects of restructuring activities.
In 2011, restructuring initiatives were announced in the Adhesive Dispensing Systems segment that resulted in severance costs and other termination fees of $1,589. In 2008, a cost reduction program that involved a combination of non-workforce related efficiencies and workforce reductions primarily in the United States and Europe was announced. Total severance and related costs of these actions were $2,029 in 2010, which were recorded in the Corporate segment.
As a result of the 2011 Adhesive Dispensing Systems segment restructuring initiatives, three facilities were written down to their fair value based on third-party appraisals. Total impairment charges for the three facilities were $1,811.
Operating profit as a percent of sales was 25.6 percent in 2011 compared to 22.5 percent in 2010. The increase was primarily due to higher sales volume supported by a more efficient cost structure.
Segment operating margins in 2011 and 2010 were as follows:
Segment | 2011 | 2010 | ||||||
Adhesive Dispensing Systems | 34.4 | % | 31.7 | % | ||||
Advanced Technology Systems | 26.2 | % | 22.8 | % | ||||
Industrial Coating Systems | 14.8 | % | 9.9 | % | ||||
Operating capacity for each of our segments can support fluctuations in order activity without significant changes in operating costs. Also, currency translation affects reported operating margins. Operating margins for each segment were favorably impacted by a weaker dollar during the year as compared to 2010.
Operating profit as a percent of sales for the Adhesive Dispensing Systems segment increased to 34.4 percent in 2011 from 31.7 percent in 2010. The increase was primarily due to higher sales volume supported by a more efficient cost structure. Operating profit for 2011 included impairment losses of $1,811 on three facilities that were written down to their fair value and severance costs and other termination fees of $1,589.
Operating profit as a percent of sales for the Advanced Technology Systems segment was 26.2 percent in 2011 compared to 22.8 percent in 2010. The current year included charges of $3,003 related to short-term inventory purchase accounting adjustments. The operating profit increase was primarily due to higher sales volume supported by a more efficient cost structure.
Operating profit as a percent of sales for the Industrial Coating Systems segment was 14.8 percent in 2011 compared to 9.9 percent of sales in 2010. The increase was primarily due to higher sales volume supported by a more efficient cost structure.
Interest and other income (expense) - Interest expense in 2011 was $5,069, a decrease of $1,194, or 19.1 percent, from 2010. The decrease was primarily due to lower borrowing levels and lower interest rates in 2011. Other income in 2011 was $3,518 compared to $1,930 in 2010. Included in these amounts were foreign currency gains of $2,200 in 2011 and $1,221 in 2010.
Income taxes - Income tax expense in 2011 was $92,197, or 29.3 percent of pre-tax income, as compared to $63,271, or 27.4 percent of pre-tax income in 2010.
Income tax expense for 2011 includes a benefit of $2,027 from a reduction in unrecognized tax benefits, primarily related to settlements with tax authorities. In December 2010, the U.S. Congress passed and the President signed the Tax Relief, Unemployment Insurance Reauthorization, and Job Creation Act of 2010, which provided retroactive reinstatement of a research credit. As a result, income tax expense for 2011 includes a tax benefit of $1,580 related to research credit generated in 2010.
22
The 2010 effective tax rate was positively impacted by a tax benefit of $10,243 from the write-off of the tax basis in our UV graphics arts and lamps product lines. The 2010 tax rate was also positively impacted by the consolidation of certain operations and legal entities, resulting in a $3,616 tax benefit, and by the utilization of foreign operating tax loss carryforwards.
The 2010 effective rate was negatively impacted by an additional tax charge of $5,249 resulting from the enactment of the Patient Protection and Affordable Care Act and the subsequent enactment of the Health Care and Education Reconciliation Act of 2010. This charge was due to a reduction in the value of a deferred tax asset as a result of a change to the tax treatment associated with Medicare Part D subsidies.
Net income (loss) - Net income was $222,364, or $3.25 per diluted share, in 2011, compared to net income of $168,048, or $2.46 per diluted share in 2010.
Recently issued accounting standards - In October 2009, the Financial Accounting Standards Board ("FASB") issued authoritative guidance on multiple-deliverable revenue arrangements that addresses the unit of accounting for arrangements involving multiple deliverables. The guidance also addresses how arrangement consideration should be allocated to separate units of accounting, when applicable, and expands the disclosure requirements for multiple-deliverable arrangements. We adopted this standard on November 1, 2010, and there were no material changes to our revenue deferral amounts.
In December 2010, the FASB issued guidance that provides requirements over pro forma revenue and earnings disclosures related to business combinations. This guidance will require disclosure of revenue and earnings of the combined business as if the combination occurred at the start of the prior annual reporting period only. This guidance is effective beginning in 2012, and is not expected to have a material impact on the consolidated financial statements.
In May 2011, the FASB clarified the guidance around fair value measurements and disclosures. The guidance requires the disclosure of quantitative information about unobservable inputs used, a description of the valuation processes used, and a qualitative discussion around the sensitivity of the measurements. It will be effective beginning in the second quarter of 2012. We do not expect the adoption will have a significant impact on our consolidated financial statements.
In June 2011, the FASB issued an Accounting Standards Update (ASU) that amends current comprehensive income guidance. This ASU eliminates the option to present the components of other comprehensive income as part of the statement of shareholders' equity. Instead, comprehensive income must be reported in either a single continuous statement of comprehensive income which contains two sections, net income and other comprehensive income, or in two separate but consecutive statements. This guidance will be effective beginning in 2013 and is not expected to impact our consolidated financial statements, as it only results in a change in the format of presentation.
In September 2011, the FASB issued guidance amending the way companies test for goodwill impairment. Companies will have the option to first assess qualitative factors to determine whether the existence of events or circumstances leads to a determination that it is more likely than not that the fair value of a reporting unit is less than its carrying amount. If, after assessing the totality of events or circumstances, companies determine it is more likely than not that the fair value of a reporting unit is greater than its carrying amount, then performing the two-step impairment test is unnecessary. This guidance is effective for interim and annual periods beginning after December 15, 2011, with early adoption permitted. We do not expect the adoption will have a significant impact on our consolidated financial statements.
2010 and 2009
Sales - Worldwide sales for 2010 were $1,041,551, an increase of 27.1 percent from 2009 sales of $819,165. Sales volume increased 25.5 percent, and favorable currency effects caused by the weaker U.S. dollar increased sales by 1.6 percent.
As used throughout this Form 10-K, geographic regions include the Americas (Canada, Mexico and Central and South America), Asia Pacific (excluding Japan), Europe, Japan, and the United States.
Sales of the Adhesive Dispensing Systems segment were $525,290 in 2010, an increase of $64,544, or 14.0 percent, from 2009 sales of $460,746. The increase was the result of a sales volume increase of 12.0 percent and favorable currency effects that increased sales by 2.0 percent. Sales volume increased in all geographic regions and was particularly strong in Asia Pacific.
23
Sales of the Advanced Technology Systems segment were $369,449 in 2010, an increase of $127,202, or 52.5 percent, from 2009 sales of $242,247. The increase was the result of a sales volume increase of 51.9 percent and favorable currency effects that increased sales by 0.6 percent. Within the segment, significant volume increases occurred in all geographic regions and were most pronounced in Asia Pacific due to higher demand in consumer electronics end markets.
In 2010, sales of the Industrial Coating Systems segment were $146,812, an increase of $30,640, or 26.4 percent, from 2009 sales of $116,172. The increase was the result of a sales volume increase of 24.6 percent and favorable currency effects that increased sales by 1.8 percent. Sales volume, which increased in all geographic regions except Japan, was most pronounced in Asia Pacific.
Sales outside the United States accounted for 73.7 percent of our sales in 2010, up from 71.4 percent last year. Sales increased in all five geographic regions in which we operate. In the United States, sales were $273,652 in 2010, an increase of 16.9 percent from 2009. In the Americas, sales were $78,058 up 28.7 percent from 2009. Sales volume increased 21.1 percent, and favorable currency effects increased sales by 7.6 percent. In Europe, sales were $336,119 in 2010, an increase of 14.0 percent from 2009. Sales volume increased 14.4 percent, and unfavorable currency effects reduced sales by 0.4 percent. In Japan, sales were $93,318, up 14.3 percent from 2009. Sales volume increased 8.4 percent, and favorable currency effects added 5.9 percent. In Asia Pacific, sales were $260,404 in 2010, an increase of 76.1 percent from 2009. Sales volume increased 73.0 percent, and favorable currency effects added 3.1 percent.
It is estimated that the effect of pricing on total revenue was neutral relative to 2009.
Operating profit - Cost of sales in 2010 were $419,937, up 19.9 percent from 2009. The increase compared to 2009 is due to increased sales volume. Gross margins, expressed as a percentage of sales, increased to 59.7 percent in 2010 from 57.2 percent in 2009. The gross margin percentage increase in 2010 was due to higher absorption of fixed overhead costs, the impact of cost reduction activities taken in 2009, more profitable product line mix and favorable currency effects.
Selling and administrative expenses, excluding severance and restructuring costs, were $384,752 in 2010, an increase of $47,458, or 14.1 percent, from 2009. The increase was largely due to higher incentive compensation expenses resulting from a higher level of business activity in 2010. In addition, currency translation effects increased selling and administrative costs by 1.5 percent. Selling and administrative expenses as a percentage of sales decreased to 36.9 percent in 2010 from 41.2 percent in 2009 due to the higher level of sales and the favorable effects of restructuring activities.
On June 30, 2010, we sold our graphic arts and lamps product lines to Baldwin Technology Company, Inc. These product lines were reported in the Advanced Technology Systems segment. We recognized a pretax loss on disposition of $357, which is reflected in selling and administrative expenses in the Consolidated Statement of Income. Results of operations and net assets of the divested product lines were immaterial to our consolidated results of operations, financial position and cash flows.
In September 2008, a cost reduction program that involved a combination of non-workforce related efficiencies and workforce reductions primarily in the United States and Europe was announced. In response to the continuing economic crisis, additional cost reduction actions were taken in 2009 and 2010. Total severance and related costs of these actions were $5,561 in 2008 and $16,396 in 2009 and $2,029 in 2010. Severance costs were recorded in the Corporate segment.
In 2009, we recognized goodwill and long-lived asset impairment charges of $243,043. Of this amount, $232,789 related to goodwill, $8,282 related to indefinite lived trade name assets and $1,972 related to other long-lived assets. Additional information regarding these charges is described in the Critical Accounting Policies and Estimates section.
Operating profit as a percent of sales was 22.5 percent in 2010 compared to negative 15.6 percent in 2009. Goodwill and long-lived impairment charges accounted for 29.7 percent of the 38.1 percent change. The remainder of the change was primarily due to sales mix yielding higher gross margins, effects of cost reduction activities taken in 2008 and 2009 that resulted in operating costs increasing at a slower rate than sales, and higher severance and restructuring costs in 2009.
24
Segment operating margins in 2010 and 2009 were as follows:
Segment | 2010 | 2009 | ||||||
Adhesive Dispensing Systems | 31.7 | % | 27.7 | % | ||||
Advanced Technology Systems | 22.8 | % | (88.7 | )% | ||||
Industrial Coating Systems | 9.9 | % | (5.9 | )% | ||||
Operating capacity for each of our segments can support fluctuations in order activity without significant changes in operating costs. Also, currency translation affects reported operating margins. In 2010, operating margins for each segment were favorably impacted by a weaker dollar during the year as compared to 2009.
Operating profit as a percent of sales for the Adhesive Dispensing Systems segment increased to 31.7 percent in 2010 from 27.7 percent in 2009. The increase was primarily due to higher gross margin percentages and to sales volume increasing at a higher rate than selling and administrative expenses.
Operating profit as a percent of sales for the Advanced Technology Systems segment was 22.8 percent in 2010 compared to an operating loss of 88.7 percent of sales in 2009. The change was due primarily to goodwill and long-lived asset impairment charges of $239,427 in 2009. Excluding these impairment charges, operating margin was 10.2 percent. The increase from 10.2 percent to 22.8 percent was primarily due to sales volume increasing at a higher rate than selling and administrative expenses.
Operating profit as a percent of sales for the Industrial Coating Systems segment was 9.9 percent in 2010 compared to an operating loss of 5.9 percent of sales in 2009. Operating profit in 2009 included a goodwill impairment charge of $3,616. Excluding this charge, operating margin was negative 2.8 percent in 2009. The profitability improvement in 2010 was primarily due to higher gross margin percentages and to sales volume increasing at a higher rate than selling and administrative expenses.
Interest and other income (expense) - Interest expense in 2010 was $6,263, a decrease of $1,508, or 19.4 percent, from 2009. The decrease was primarily due to lower borrowing levels in 2010. Interest income was $819 in 2010, up from $492 in 2009. The increase was primarily due to a higher level of short-term investments in 2010. Other income in 2010 was $1,930 compared to $7,895 in 2009. Included in these amounts were foreign currency gains of $1,221 in 2010 and $1,571 in 2009. Other income in 2009 also included a $5,011 gain on the sale of real estate in Westlake, Ohio.
Income taxes - Income tax expense in 2010 was $63,271, or 27.4 percent of pre-tax income. Income tax expense in 2009 was $32,864. Most of the goodwill and long-lived asset impairment charges recorded in 2009 were not deductible for income tax purposes.
The 2010 effective tax rate was positively impacted by a tax benefit of $10,243 from the write-off of the tax basis in our UV graphics arts and lamps product lines. The 2010 tax rate was also positively impacted by consolidation of certain operations and legal entities, resulting in a $3,616 tax benefit, and by the utilization of foreign operating tax loss carryforwards.
The 2010 effective rate was negatively impacted by an additional tax charge of $5,249 resulting from the enactment of the Patient Protection and Affordable Care Act and the subsequent enactment of the Health Care and Education Reconciliation Act of 2010. This charge was due to a reduction in the value of a deferred tax asset as a result of a change to the tax treatment associated with Medicare Part D subsidies.
Net income (loss) - Net income was $168,048, or $2.46 per diluted share, in 2010. This compares to a net loss of $160,055, or $2.38 per diluted share, in 2009.
Liquidity and Capital Resources
Cash provided by operating activities was $246,727 in 2011, up from $140,186 in 2010. The primary sources were net income, non-cash items and the tax benefit from the exercise of stock options, the sum of which is $251,299, compared to $213,756 in 2010. Operating assets and liabilities used $4,572 of cash in 2011 compared to $73,570 in 2010. The primary reasons for the change were a smaller increase in accounts receivable from 2010 to 2011 as compared to the increase from 2009 to 2010 and one-time postretirement payments and cash contributions to U.S. pension plans totaling $79,514 in 2010.
25
Cash used by investing activities was $305,506 in 2011, as compared to $41,324 in 2010. Capital expenditures were $20,239 in 2011, up from $14,317 in the prior year. Significant capital expenditures in 2011 included the continuing rollout of SAP enterprise management software, completion of our new corporate headquarters building that replaced the facility sold in 2009 and various projects that improve manufacturing and distribution operations. The acquisitions of Micromedics, Verbruggen and Value Plastics used cash of $292,980 in 2011, and the acquisition of GLT used cash of $18,576 in 2010. Cash proceeds of $7,552 were received in 2011 from the maturity of bank certificates of deposit that had been purchased in 2010 and classified as short-term marketable securities.
Cash of $50,703 was provided by financing activities in 2011, compared to cash used by financing activities of $79,275 in 2010. Included in 2011 were net short and long-term borrowings of $206,692, compared to net repayments of $45,135 in the prior year. The change is primarily due to our three acquisitions in 2011 and an increase in purchase of treasury shares from $24,935 in 2010 to $137,989 in 2011. Issuance of common shares related to employee benefit plans generated $9,652 of cash in 2011, down from $13,828 in 2010, and the tax benefit from stock option exercises was $6,924 in the current year, down from $7,798 in the prior year. These decreases were the result of fewer stock option exercises. Dividend payments were $29,838 in 2011, up from $26,439 in 2010 due to an increase in the annual dividend to $0.44 per share from $0.39 per share.
The following is a summary of significant changes by balance sheet caption from October 31, 2010 to October 31, 2011. Receivables increased due to higher accounts and notes receivable resulting from higher sales in the fourth quarter of 2011 compared to the fourth quarter of 2010. This increase was partially offset by a decrease in other receivables due to a lower value of foreign exchange contracts. The increase in inventories is due to a higher level of business activity in the fourth quarter of 2011 compared to the fourth quarter of 2010 and inventory held by three acquisitions completed in 2011. Goodwill increased primarily due to three acquisitions completed in 2011 that added $200,823 of goodwill. The increase in other intangibles - net was due to $86,237 of intangibles added as a result of the 2011 acquisitions, partially offset by $8,018 of amortization. The increase in accounts payable is primarily due to a higher level of business activity in the fourth quarter of 2011 compared to the fourth quarter of 2010 and accounts payable of three acquisitions completed in 2011. The decrease in income taxes payable is largely due to higher estimated U.S. tax payments in 2011. The increase in accrued liabilities is primarily due to accruals for salaries and incentive compensation. Current maturities of long-term debt decreased due to scheduled repayments of Senior Notes. The increase in long-term pension and retirement obligations and long-term postretirement obligations is the result of a decrease in the discount rate for U.S. plans, lower expected returns on pension assets and updated demographic assumptions. Long-term deferred tax liabilities increased primarily as a result of purchase accounting adjustments related to the 2011 acquisitions, partially offset by the tax effect of pension and postretirement amounts recorded in other comprehensive income.
In December 2008, the board of directors approved a stock repurchase program of up to 1,000 shares, and 513 shares were repurchased under this program through February 2011. In May 2011, the board of directors approved a program that replaced the December 2008 program with a new program that allowed for the repurchase of up to 2,000 shares. This program was completed in September 2011, and the board of directors approved an additional repurchase program of up to $100,000. Uses for repurchased shares include the funding of benefit programs including stock options, nonvested stock and 401(k) matching. During 2011, we repurchased 3,024 shares within these programs for a total amount of $134,163 using working capital and proceeds from borrowings under our credit facilities.
26
The following table summarizes contractual obligations as of October 31, 2011:
Obligations | Payments Due by Period | |||||||||||||||||||
| Total | Less than 1 Year | 1-3 Years | 4-5 Years | After 5 Years | ||||||||||||||||
Long-term debt (1) | $ | 319,123 | $ | 5,664 | $ | 66,339 | $ | 21,354 | $ | 225,766 | ||||||||||
Interest payments on long-term debt (1) | 11,826 | 4,200 | 3,782 | 2,137 | 1,707 | |||||||||||||||
Capital lease obligations (2) | 12,414 | 5,481 | 6,247 | 686 | - | |||||||||||||||
Operating leases (2) | 35,802 | 10,955 | 10,673 | 5,079 | 9,095 | |||||||||||||||
Notes payable (3) | 33 | 33 | - | - | - | |||||||||||||||
Contributions related to pension and postretirement benefits (4) | 14,400 | 14,400 | - | - | - | |||||||||||||||
Purchase obligations (5) | 34,284 | 34,215 | 69 | - | - | |||||||||||||||
|
|
|
|
|
|
|
|
|
| |||||||||||
Total obligations | $ | 427,882 | $ | 74,948 | $ | 87,110 | $ | 29,256 | $ | 236,568 | ||||||||||
|
|
|
|
|
|
|
|
|
| |||||||||||
(1) We have a $400,000 unsecured, multicurrency credit facility with a group of banks that expires in 2012 and may be increased to $500,000 under certain conditions. At October 31, 2011, $192,200 was outstanding under this facility, compared to $46,000 outstanding at October 31, 2010. There are two primary financial covenants that must be met under this facility. The first covenant limits the amount of total indebtedness that can be incurred to 3.5 times consolidated trailing EBITDA (both indebtedness and EBITDA as defined in the credit agreement). The second covenant requires consolidated trailing EBITDA to be at least three times consolidated trailing interest expense (both as defined in the credit agreement). At October 31, 2011, we were in compliance with all debt covenants, and the amount we could borrow under the credit facility would not have been limited by any debt covenants. Borrowings under this credit facility were classified as due after five years, because a new revolving credit agreement was entered into on December 9, 2011 that expires on December 9, 2016. See Note 21.
In 2008, we entered into a Note Purchase and Private Shelf Agreement (the Agreement) with Prudential Investment Management, Inc. The Agreement consists of a $50,000 Senior Note and a $100,000 Private Shelf Facility. The Private Shelf Facility expired in February 2011. The Senior Note bears interest at a rate of 4.98 percent and matures on February 22, 2013 and is unsecured. The Agreement contains customary events of default and covenants related to limitations on indebtedness and the maintenance of certain financial ratios. We were in compliance with all covenants at October 31, 2011.
On June 30, 2011, we entered into a $150,000 three-year Private Shelf Note agreement with New York Life Investment Management LLC. Borrowings under the agreement may be up to 12 years, with an average life of up to 10 years and are unsecured. The interest rate on each borrowing can be fixed or floating and is based upon the market rate at the borrowing date. This agreement contains customary events of default and covenants related to limitations on indebtedness and the maintenance of certain financial ratios. At October 31, 2011, $75,000 was outstanding under this facility at a fixed rate of 2.21 percent per annum. We were in compliance with all covenants at October 31, 2011, and the amount we could borrow would not have been limited by any debt covenants.
See Note 8 for additional information.
(2) See Note 6 for additional information.
(3) We have various lines of credit with foreign banks totaling $43,305, of which $43,272 was unused at October 31, 2011. See Note 7 for additional information.
(4) Pension and postretirement plan funding amounts after 2012 will be determined based on the future funded status of the plans and therefore cannot be estimated at this time. See Note 3 for additional information.
(5) Purchase obligations primarily represent commitments for materials used in our manufacturing processes that are not recorded in our Consolidated Balance Sheet.
We believe that the combination of present capital resources, internally generated funds and unused financing sources are more than adequate to meet cash requirements for 2012. There are no significant restrictions limiting the transfer of funds from international subsidiaries to the parent company.
27
Outlook
Our operating performance and balance sheet position for 2011 were both stronger than 2010, as we continued to experience excellent recovery since 2009, which was affected by disruptions in global financial markets and the general economic environment. Going forward, we are well-positioned to manage our liquidity needs that arise from working capital requirements, capital expenditures, and principal and interest payments on indebtedness. Primary sources of capital to meet these needs are cash provided by operations and borrowings under our loan agreements. In 2011, cash from operations was 20 percent of revenue, compared to 13 percent in 2010, which included voluntary contributions to our U.S. pension plans and one-time postretirement payments representing 8 percent of revenue. Funds provided by borrowings occurred under a $400,000 five-year committed revolving line of credit with a group of domestic and international banks that was set to expire in 2012. As of December 9, 2011, we replaced our existing revolving loan agreement, and balances outstanding under the prior facility were transferred to a new $500,000 unsecured multicurrency credit facility with a group of banks. This facility has a five-year term and includes a $40,000 subfacility for swing-line loans. It may be increased from $500,000 to $750,000 under certain conditions. As of October 31, 2011, we had $207,800 under the previous facility as available borrowing capacity, which has been expanded under the replacement facility. In addition, in June 2011, we entered into a $150,000 three-year Private Shelf agreement with New York Life Investment Management LLC. As of October 31, we had $75,000 borrowing capacity. While these facilities provide the contractual terms for any borrowing, we cannot be assured that these facilities would be available in the event that these financial institutions failed to remain sufficiently capitalized.
We move forward with caution in our approach to 2012, given the global economic uncertainty that is primarily due to anxiety over European sovereign debt issues. The rebound effect in order growth since 2009 has moderated to more normal business levels. Though the near- term global macroeconomic outlook remains somewhat unclear, our growth potential has been demonstrated over time from our capacity to build and enhance our core by entering emerging markets and pursuing market adjacencies. We drive value for our customers through our application expertise, differentiated technology and direct sales and service support. Our priorities also are focused on continued operational improvements by employing Lean methodologies to our business processes. We expect these efforts will provide sufficient cash from operations to meet our liquidity needs, as well as enable us to invest in the development of new applications and markets for our technologies and pursue strategic acquisition opportunities. With respect to contractual spending, the table above presents our financial obligations as $427,882, of which $74,948 is payable in 2012. In September 2011, the board of directors approved a stock repurchase program of up to $100,000. The repurchase program is being funded using working capital and proceeds from borrowings under our credit facilities. Under this authorization, the timing and actual number of shares subject to repurchase are at the discretion of management and are contingent on a number of factors including levels of cash generation from operations, cash requirements for acquisitions, repayment of debt and our share price. Capital expenditures for 2012 will be focused primarily upon our continued efforts to leverage our information systems platform, as well as various projects that improve manufacturing and distribution operations.
Effects of Foreign Currency
The impact of changes in foreign currency exchange rates on sales and operating results cannot be precisely measured due to fluctuating selling prices, sales volume, product mix and cost structures in each country where we operate. As a general rule, a weakening of the United States dollar relative to foreign currencies has a favorable effect on sales and net income, while a strengthening of the dollar has a detrimental effect.
In 2011, as compared with 2010, the United States dollar was generally weaker against foreign currencies. If 2010 exchange rates had been in effect during 2011, sales would have been approximately $33,499 lower and third-party costs would have been approximately $17,872 lower. In 2010, as compared with 2009, the United States dollar was generally weaker against foreign currencies. If 2009 exchange rates had been in effect during 2010, sales would have been approximately $12,944 lower and third-party costs would have been approximately $5,208 lower. These effects on reported sales do not include the impact of local price adjustments made in response to changes in currency exchange rates.
28
| Item 7A. | Quantitative and Qualitative Disclosures About Market Risk |
We operate internationally and enter into intercompany transactions denominated in foreign currencies. Consequently, we are subject to market risk arising from exchange rate movements between the dates foreign currencies are recorded and the dates they are settled. We regularly use foreign exchange contracts to reduce our risks related to most of these transactions. These contracts, primarily associated with the euro, yen and pound sterling, typically have maturities of 90 days or less, and generally require the exchange of foreign currencies for United States dollars at rates stated in the contracts. Gains and losses from changes in the market value of these contracts offset foreign exchange losses and gains, respectively, on the underlying transactions. Other transactions denominated in foreign currencies are designated as hedges of our net investments in foreign subsidiaries or are intercompany transactions of a long-term investment nature. As a result of the use of foreign exchange contracts on a routine basis to reduce the risks related to most of our transactions denominated in foreign currencies, as of October 31, 2011, we did not have material foreign currency exposure.
Note 9 to the financial statements contains additional information about our foreign currency transactions and the methods and assumptions used to record these transactions.
A portion of our operations is financed with short-term and long-term borrowings and is subject to market risk arising from changes in interest rates.
The tables that follow present principal repayments and related weighted-average interest rates by expected maturity dates of fixed-rate debt.
At October 31, 2011
| 2012 | 2013 | 2014 | 2015 | 2016 | There- after | Total Value | Fair Value | |||||||||||||||||||||||||
Annual repayments of long-term debt | $ | 5,664 | $ | 55,668 | $ | 10,671 | $ | 10,675 | $ | 10,679 | $ | 33,566 | $ | 126,923 | $ | 121,650 | ||||||||||||||||
Average interest rate of total borrowings outstanding during the year | 3.32 | % | 3.37 | % | 2.23 | % | 2.24 | % | 2.24 | % | 2.25 | % | 3.32 | % | ||||||||||||||||||
At October 31, 2010
| 2011 | 2012 | 2013 | 2014 | 2015 | There- after | Total Value | Fair Value | |||||||||||||||||||||||||
Annual repayments of long-term debt | $ | 14,260 | $- | $ | 50,000 | $ | - | $ | - | $ | - | $ | 64,260 | $ | 66,495 | |||||||||||||||||
Average interest rate of total borrowings outstanding during the year | 5.51 | % | 4.98 | % | 4.98 | % | - | % | - | % | - | % | 5.51 | % | ||||||||||||||||||
We also have variable-rate notes payable and long-term debt. The weighted average interest rate of this debt was 0.5 percent at October 31, 2011 and 0.7 percent at October 31, 2010. A one percent increase in interest rates would have resulted in additional interest expense of approximately $785 on the variable rate notes payable and long-term debt in 2011.
29
Inflation
Inflation affects profit margins as the ability to pass cost increases on to customers is restricted by the need for competitive pricing. Although inflation has been modest in recent years and has had no material effect on the years covered by these financial statements, we continue to seek ways to minimize the impact of inflation through focused efforts to increase productivity.
Trends
The Five-Year Summary in Item 6 documents our historical financial trends. Over this period, the world's economic conditions fluctuated significantly. Our solid performance is attributed to our participation in diverse geographic and industrial markets and our long-term commitment to develop and provide quality products and worldwide service to meet our customers' changing needs.
Safe Harbor Statements Under the Private Securities Litigation Reform Act of 1995
This Form 10-K, particularly "Management's Discussion and Analysis," contains forward-looking statements within the meaning of the Securities Act of 1933, as amended, the Securities Exchange Act of 1934, as amended, and the Private Securities Litigation Reform Act of 1995. Such statements relate to, among other things, income, earnings, cash flows, changes in operations, operating improvements, businesses in which we operate and the United States and global economies. Statements in this 10-K that are not historical are hereby identified as "forward-looking statements" and may be indicated by words or phrases such as "anticipates," "supports," "plans," "projects," "expects," "believes," "should," "would," "could," "hope," "forecast," "management is of the opinion," use of the future tense and similar words or phrases.
In light of these risks and uncertainties, actual events and results may vary significantly from those included in or contemplated or implied by such statements. Readers are cautioned not to place undue reliance on such forward-looking statements. These forward-looking statements speak only as of the date made. We undertake no obligation to publicly update or revise any forward-looking statements, whether as a result of new information, future events or otherwise, except as required by law. Factors that could cause our actual results to differ materially from the expected results are discussed in Item 1A, Risk Factors.
30
| Item 8. | Financial Statements and Supplementary Data |
Consolidated Statements of Income
| Years ended October 31, 2011, 2010 and 2009 | 2011 | 2010 | 2009 | |||||||||
(In thousands except for per-share amounts) | ||||||||||||
Sales | $ | 1,233,159 | $ | 1,041,551 | $ | 819,165 | ||||||
Operating costs and expenses: | ||||||||||||
Cost of sales | 484,727 | 419,937 | 350,239 | |||||||||
Selling and administrative expenses | 429,489 | 384,752 | 337,294 | |||||||||
Severance and restructuring costs | 1,589 | 2,029 | 16,396 | |||||||||
Goodwill and long-lived asset impairments | 1,811 | - | 243,043 | |||||||||
|
|
|
|
|
| |||||||
| 917,616 | 806,718 | 946,972 | ||||||||||
|
|
|
|
|
| |||||||
Operating profit (loss) | 315,543 | 234,833 | (127,807 | ) | ||||||||
Other income (expense): | ||||||||||||
Interest expense | (5,069 | ) | (6,263 | ) | (7,771 | ) | ||||||
Interest and investment income | 569 | 819 | 492 | |||||||||
Other - net | 3,518 | 1,930 | 7,895 | |||||||||
|
|
|
|
|
| |||||||
| (982 | ) | (3,514 | ) | 616 | ||||||||
|
|
|
|
|
| |||||||
Income (loss) before income taxes | 314,561 | 231,319 | (127,191 | ) | ||||||||
Income tax provision: | ||||||||||||
Current | 91,481 | 36,441 | 28,809 | |||||||||
Deferred | 716 | 26,830 | 4,055 | |||||||||
|
|
|
|
|
| |||||||
| 92,197 | 63,271 | 32,864 | ||||||||||
|
|
|
|
|
| |||||||
Net income (loss) | $ | 222,364 | $ | 168,048 | $ | (160,055 | ) | |||||
|
|
|
|
|
| |||||||
Average common shares | 67,616 | 67,610 | 67,129 | |||||||||
Incremental common shares attributable to outstanding stock options, nonvested stock and deferred stock-based compensation | 809 | 832 | - | |||||||||
|
|
|
|
|
| |||||||
Average common shares and common share equivalents | 68,425 | 68,442 | 67,129 | |||||||||
|
|
|
|
|
| |||||||
Basic earnings (loss) per share | $ | 3.29 | $ | 2.49 | $ | (2.38 | ) | |||||
Diluted earnings (loss) per share | $ | 3.25 | $ | 2.46 | $ | (2.38 | ) | |||||
Dividends declared per common share | $ | 0.44 | $ | 0.39 | $ | 0.36875 | ||||||
Basic and diluted earnings per share, average common shares and common share equivalents, and dividends declared per share have been restated to give effect to a two-for-one stock split. See Note 10 for additional information.
The accompanying notes are an integral part of the consolidated financial statements.
31
Consolidated Balance Sheets
| October 31, 2011 and 2010 | 2011 | 2010 | ||||||
| (In thousands) | ||||||||
Assets | ||||||||
Current assets: | ||||||||
Cash and cash equivalents | $ | 37,408 | $ | 42,329 | ||||
Marketable securities | - | 7,840 | ||||||
Receivables - net | 254,310 | 243,790 | ||||||
Inventories - net | 141,912 | 117,721 | ||||||
Deferred income taxes | 35,693 | 33,576 | ||||||
Prepaid expenses | 7,634 | 5,775 | ||||||
|
|
|
| |||||
Total current assets | 476,957 | 451,031 | ||||||
Property, plant and equipment - net | 130,883 | 116,395 | ||||||
Goodwill | 547,826 | 347,326 | ||||||
Intangible assets - net | 120,699 | 42,927 | ||||||
Other assets | 28,085 | 28,675 | ||||||
|
|
|
| |||||
| $ | 1,304,450 | $ | 986,354 | |||||
|
|
|
| |||||
Liabilities and shareholders' equity | ||||||||
Current liabilities: | ||||||||
Notes payable | $ | 33 | $ | 2,160 | ||||
Accounts payable | 46,381 | 40,262 | ||||||
Income taxes payable | 15,283 | 24,336 | ||||||
Accrued liabilities | 101,294 | 96,133 | ||||||
Customer advance payments | 9,375 | 10,999 | ||||||
Current maturities of long-term debt | 5,664 | 14,260 | ||||||
Current obligations under capital leases | 4,131 | 3,764 | ||||||
|
|
|
| |||||
Total current liabilities | 182,161 | 191,914 | ||||||
Long-term debt | 313,459 | 96,000 | ||||||
Obligations under capital leases | 5,202 | 3,316 | ||||||
Pension and retirement obligations | 123,058 | 103,327 | ||||||
Postretirement obligations | 71,943 | 53,919 | ||||||
Deferred income taxes | 17,415 | 9,745 | ||||||
Other liabilities | 19,889 | 23,061 | ||||||
Shareholders' equity: | ||||||||
Preferred shares, no par value; 10,000 shares authorized; none issued | - | - | ||||||
Common shares, no par value; 160,000 shares authorized; 98,023 shares issued at October 31, 2011 and 2010 | 12,253 | 12,253 | ||||||
Capital in excess of stated value | 272,928 | 255,595 | ||||||
Retained earnings | 990,221 | 797,695 | ||||||
Accumulated other comprehensive loss | (80,012 | ) | (66,306 | ) | ||||
Common shares in treasury, at cost | (624,067 | ) | (494,165 | ) | ||||
|
|
|
| |||||
Total shareholders' equity | 571,323 | 505,072 | ||||||
|
|
|
| |||||
| $ | 1,304,450 | $ | 986,354 | |||||
|
|
|
| |||||
The accompanying notes are an integral part of the consolidated financial statements.
32
Consolidated Statements of Shareholders' Equity
| Years ended October 31, 2011, 2010 and 2009 | 2011 | 2010 | 2009 | |||||||||
(In thousands) | ||||||||||||
Number of common shares in treasury | ||||||||||||
Balance at beginning of year | 30,152 | 30,667 | 30,607 | |||||||||
Shares issued under company stock and employee benefit plans | (936 | ) | (1,448 | ) | (353 | ) | ||||||
Purchase of treasury shares | 3,206 | 933 | 413 | |||||||||
|
|
|
|
|
| |||||||
Balance at end of year | 32,422 | 30,152 | 30,667 | |||||||||
|
|
|
|
|
| |||||||
Common shares | ||||||||||||
Balance at beginning and ending of year | $ | 12,253 | $ | 12,253 | $ | 12,253 | ||||||
|
|
|
|
|
| |||||||
Capital in excess of stated value | ||||||||||||
Balance at beginning of year | $ | 255,595 | $ | 241,494 | $ | 244,096 | ||||||
Shares issued under company stock and employee benefit plans | 1,564 | (1,330 | ) | (2,073 | ) | |||||||
Tax benefit from stock option and restricted stock transactions | 6,924 | 7,798 | 285 | |||||||||
Stock-based compensation | 8,845 | 7,633 | (814 | ) | ||||||||
|
|
|
|
|
| |||||||
Balance at end of year | $ | 272,928 | $ | 255,595 | $ | 241,494 | ||||||
|
|
|
|
|
| |||||||
Retained earnings | ||||||||||||
Balance at beginning of year | $ | 797,695 | $ | 656,086 | $ | 840,888 | ||||||
Net income (loss) | 222,364 | 168,048 | (160,055 | ) | ||||||||
Dividends paid ($.44 per share in 2011, $.39 per share in 2010, and $.36875 per share in 2009) | (29,838 | ) | (26,439 | ) | (24,747 | ) | ||||||
|
|
|
|
|
| |||||||
Balance at end of year | $ | 990,221 | $ | 797,695 | $ | 656,086 | ||||||
|
|
|
|
|
| |||||||
Accumulated other comprehensive income (loss) | ||||||||||||
Balance at beginning of year | $ | (66,306 | ) | $ | (55,470 | ) | $ | (40,795 | ) | |||
Translation adjustments | 562 | (4,361 | ) | 40,240 | ||||||||
Remeasurement of supplemental pension liability, net of tax of $1,648 in 2010 and $2,074 in 2009 | - | (2,746 | ) | (3,457 | ) | |||||||
Settlement loss recognized, net of tax of $(3,085) in 2010 and $(728) in 2009 | - | 5,126 | 1,188 | |||||||||
Net prior service cost (credit) occurring during the year, net of tax of $(315) in 2011, $3 in 2010 and $(421) in 2009 | 414 | 18 | 726 | |||||||||
Net actuarial loss occurring during the year, net of tax of $9,002 in 2011, $4,756 in 2010 and $30,339 in 2009 | (14,682 | ) | (8,873 | ) | (53,372 | ) | ||||||
|
|
|
|
|
| |||||||
Balance at end of year | $ | (80,012 | ) | $ | (66,306 | ) | $ | (55,470 | ) | |||
|
|
|
|
|
| |||||||
Common shares in treasury, at cost | ||||||||||||
Balance at beginning of year | $ | (494,165 | ) | $ | (484,387 | ) | $ | (482,330 | ) | |||
Shares issued under company stock and employee benefit plans | 13,315 | 20,309 | 5,131 | |||||||||
Purchase of treasury shares | (143,217 | ) | (30,087 | ) | (7,188 | ) | ||||||
|
|
|
|
|
| |||||||
Balance at end of year | $ | (624,067 | ) | $ | (494,165 | ) | $ | (484,387 | ) | |||
|
|
|
|
|
| |||||||
Total shareholders' equity | $ | 571,323 | $ | 505,072 | $ | 369,976 | ||||||
|
|
|
|
|
| |||||||
Comprehensive income | ||||||||||||
Net income (loss) | $ | 222,364 | $ | 168,048 | $ | (160,055 | ) | |||||
Translation adjustments | 562 | (4,361 | ) | 40,240 | ||||||||
Remeasurement of supplemental pension liability, net of tax of $1,648 in 2010 and $2,074 in 2009 | - | (2,746 | ) | (3,457 | ) | |||||||
Settlement loss recognized, net of tax of $(3,085) in 2010 and $(728) in 2009 | - | 5,126 | 1,188 | |||||||||
Net prior service cost (credit) occurring during the year, net of tax of $(315) in 2011, $3 in 2010 and $(421) in 2009 | 414 | 18 | 726 | |||||||||
Net actuarial loss occurring during the year, net of tax of $9,002 in 2011, $4,756 in 2010 and $30,339 in 2009 | (14,682 | ) | (8,873 | ) | (53,372 | ) | ||||||
|
|
|
|
|
| |||||||
Total comprehensive income (loss) | $ | 208,658 | $ | 157,212 | $ | (174,730 | ) | |||||
|
|
|
|
|
| |||||||
The accompanying notes are an integral part of the consolidated financial statements.
33
Consolidated Statements of Cash Flows
| Years ended October 31, 2011, 2010 and 2009 | 2011 | 2010 | 2009 | |||||||||
| (In thousands) | ||||||||||||
Cash flows from operating activities: | ||||||||||||
Net income (loss) | $ | 222,364 | $ | 168,048 | $ | (160,055 | ) | |||||
Adjustments to reconcile net income to net cash provided by operating activities: | ||||||||||||
Depreciation | 20,758 | 22,625 | 26,310 | |||||||||
Amortization | 8,018 | 6,263 | 5,100 | |||||||||
Goodwill and long-lived asset impairments | 1,811 | - | 243,043 | |||||||||
Provision for losses on receivables | 977 | 607 | 1,998 | |||||||||
Deferred income taxes | 716 | 26,830 | 4,055 | |||||||||
Tax benefit from the exercise of stock options | (6,924 | ) | (7,798 | ) | (284 | ) | ||||||
Non-cash stock compensation | 8,845 | 7,633 | (814 | ) | ||||||||
(Gain)/loss on sale of property, plant and equipment | 362 | (18 | ) | (4,324 | ) | |||||||
Loss on divestiture | - | 357 | - | |||||||||
Other | (5,628 | ) | (10,791 | ) | 23,500 | |||||||
Changes in operating assets and liabilities: | ||||||||||||
Receivables | (4,474 | ) | (50,732 | ) | 42,182 | |||||||
Inventories | (14,666 | ) | (15,004 | ) | 22,688 | |||||||
Other current assets | (1,619 | ) | 222 | 1,170 | ||||||||
Other noncurrent assets | 875 | (2,837 | ) | (872 | ) | |||||||
Accounts payable | 4,389 | 7,046 | (10,257 | ) | ||||||||
Income taxes payable | (1,993 | ) | 18,170 | 5,456 | ||||||||
Accrued liabilities | 3,263 | 5,466 | (20,766 | ) | ||||||||
Customer advance payments | (2,382 | ) | 2,614 | 853 | ||||||||
Other noncurrent liabilities | 12,035 | (38,515 | ) | (10,306 | ) | |||||||
|
|
|
|
|
| |||||||
Net cash provided by operating activities | 246,727 | 140,186 | 168,677 | |||||||||
Cash flows from investing activities: | ||||||||||||
Additions to property, plant and equipment | (20,239 | ) | (14,317 | ) | (12,514 | ) | ||||||
Proceeds from sale of property, plant and equipment | 161 | 354 | 8,611 | |||||||||
Sale of product lines | - | (990 | ) | - | ||||||||
Acquisition of businesses, net of cash acquired | (292,980 | ) | (18,576 | ) | - | |||||||
Proceeds from sale of (purchases of) marketable securities | 7,552 | (7,795 | ) | (36 | ) | |||||||
|
|
|
|
|
| |||||||
Net cash used in investing activities | (305,506 | ) | (41,324 | ) | (3,939 | ) | ||||||
Cash flows from financing activities: | ||||||||||||
Proceeds from short-term borrowings | 190 | 12,566 | 613 | |||||||||
Repayment of short-term borrowings | (2,361 | ) | (11,411 | ) | (41,591 | ) | ||||||
Proceeds from long-term debt | 1,039,800 | 116,000 | 46,200 | |||||||||
Repayment of long-term debt | (830,937 | ) | (162,290 | ) | (132,490 | ) | ||||||
Repayment of capital lease obligations | (4,738 | ) | (4,392 | ) | (5,158 | ) | ||||||
Issuance of common shares | 9,652 | 13,828 | 2,986 | |||||||||
Purchase of treasury shares | (137,989 | ) | (24,935 | ) | (7,115 | ) | ||||||
Tax benefit from the exercise of stock options | 6,924 | 7,798 | 284 | |||||||||
Dividends paid | (29,838 | ) | (26,439 | ) | (24,747 | ) | ||||||
|
|
|
|
|
| |||||||
Net cash provided by (used in) financing activities | 50,703 | (79,275 | ) | (161,018 | ) | |||||||
Effect of exchange rate changes on cash | 3,155 | 3,961 | 3,306 | |||||||||
|
|
|
|
|
| |||||||
Increase (decrease) in cash and cash equivalents | (4,921 | ) | 23,548 | 7,026 | ||||||||
Cash and cash equivalents at beginning of year | 42,329 | 18,781 | 11,755 | |||||||||
|
|
|
|
|
| |||||||
Cash and cash equivalents at end of year | $ | 37,408 | $ | 42,329 | $ | 18,781 | ||||||
|
|
|
|
|
| |||||||
The accompanying notes are an integral part of the consolidated financial statements.
34
Notes to Consolidated Financial Statements
NOTE REGARDING AMOUNTS AND FISCAL YEAR REFERENCES
In this annual report, all amounts related to United States dollars and foreign currency and to the number of Nordson Corporation's common shares, except for per share earnings and dividend amounts, are expressed in thousands.
Unless otherwise noted, all references to years relate to our fiscal year ending October 31.
Note 1 - Significant accounting policies
Consolidation - The consolidated financial statements include the accounts of Nordson Corporation and majority-owned and controlled subsidiaries. All significant intercompany accounts and transactions have been eliminated in consolidation.
Use of estimates - The preparation of financial statements in conformity with generally accepted accounting principles in the United States requires management to make estimates and assumptions that affect the amounts reported in the consolidated financial statements and notes. Actual amounts could differ from these estimates.
Fiscal year - Our fiscal year ends on October 31.
Revenue recognition - Most of our revenues are recognized upon shipment, provided that persuasive evidence of an arrangement exists, the sales price is fixed or determinable, collectibility is reasonably assured, and title and risk of loss have passed to the customer. In October 2009, the FASB issued an accounting standard update on multiple deliverable arrangements, which we adopted effective November 1, 2010. This accounting standard update establishes a relative selling price hierarchy for determining the selling price of a deliverable based on vendor specific objective evidence (VSOE) if available, third-party evidence (TPE) if vendor-specific objective evidence is not available, or best estimated selling price (BESP) if neither vendor-specific objective evidence nor third-party evidence is available. Our multiple deliverable arrangements include installation, installation supervision, training, and spare parts, which tend to be completed in a short period of time, at an insignificant cost, and utilizing skills not unique to us, and, therefore, are typically regarded as inconsequential or perfunctory. Revenue for undelivered items is deferred and included within accrued liabilities in the accompanying balance sheet. Revenues deferred in 2011, 2010 and 2009 were not material. The requirements of this standard did not significantly change our units of accounting or how we allocate arrangement consideration to various units of accounting. The adoption of this standard had no material impact on our financial position or results of operations.
Shipping and handling costs - Amounts billed to customers for shipping and handling are recorded as revenue. Shipping and handling expenses are included in cost of sales.
Advertising costs - Advertising costs are expensed as incurred and were $9,008, $8,267 and $6,512 in 2011, 2010 and 2009, respectively.
Research and development - Research and development costs are expensed as incurred and were $26,997, $23,835 and $25,528 in 2011, 2010 and 2009, respectively.
Earnings per share - Basic earnings per share are computed based on the weighted-average number of common shares outstanding during each year, while diluted earnings per share are based on the weighted-average number of common shares and common share equivalents outstanding. Common share equivalents consist of shares issuable upon exercise of stock options computed using the treasury stock method, as well as nonvested (restricted) stock and deferred stock-based compensation. Options whose exercise price is higher than the average market price are excluded from the calculation of diluted earnings per share because the effect would be anti-dilutive. Options for 71 common shares were excluded from the 2011 calculation, and for 2010, options for 17 common shares were excluded from the calculation of diluted earnings per share, because their effect would have been anti-dilutive. When a loss is reported the denominator of diluted earnings per share cannot be adjusted for the dilutive impact of stock options and awards because doing so will result in anti-dilution. Therefore, for 2009, basic weighted-average shares outstanding are used in calculating diluted earnings per share.
35
Notes to Consolidated Financial Statements - (Continued)
Cash and cash equivalents - Highly liquid instruments with maturities of 90 days or less at date of purchase are considered to be cash equivalents. Cash and cash equivalents are carried at cost.
Marketable securities - Marketable securities consist primarily of short-term notes with maturities greater than 90 days at date of purchase, and all contractual maturities were within one year or could be callable within one year. Our marketable securities are classified as available for sale and are recorded at quoted market prices that approximate cost.
Allowance for doubtful accounts - An allowance for doubtful accounts is maintained for estimated losses resulting from the inability of customers to make required payments. The amount of the allowance is determined principally on the basis of past collection experience and known factors regarding specific customers. Accounts are written off against the allowance when it becomes evident that collection will not occur.
Inventories - Inventories are valued at the lower of cost or market. Cost was determined using the last-in, first-out (LIFO) method for 26 percent of consolidated inventories at October 31, 2011, and 25 percent at October 31, 2010. The first-in, first-out (FIFO) method is used for all other inventories. Consolidated inventories would have been $6,779 and $7,855 higher than reported at October 31, 2011 and October 31, 2010, respectively, had the FIFO method, which approximates current cost, been used for valuation of all inventories. LIFO liquidations in 2009 increased cost of goods sold by $85.
Property, plant and equipment and depreciation - Property, plant and equipment are carried at cost. Additions and improvements that extend the lives of assets are capitalized, while expenditures for repairs and maintenance are expensed as incurred. Plant and equipment are depreciated for financial reporting purposes using the straight-line method over the estimated useful lives of the assets or, in the case of property under capital leases, over the terms of the leases. Leasehold improvements are depreciated over the shorter of the lease term or their useful lives. Useful lives are as follows:
Land improvements | 15-25 years | |||
Buildings | 20-40 years | |||
Machinery and equipment | 3-12 years | |||
Enterprise management systems | 5-13 years |
Depreciation expense is included in cost of sales and selling and administrative expenses.
Internal use software costs are expensed or capitalized depending on whether they are incurred in the preliminary project stage, application development stage or the post-implementation stage. Amounts capitalized are amortized over the estimated useful lives of the software beginning with the project's completion. All re-engineering costs are expensed as incurred. Interest costs on significant capital projects are capitalized. No interest was capitalized in 2011, 2010 or 2009.
Goodwill and intangible assets - Goodwill is the excess of cost of an acquired entity over the amounts assigned to assets acquired and liabilities assumed in a business combination. The majority of goodwill relates to and is assigned directly to specific reporting units. Goodwill is not amortized but is subject to annual impairment testing. Our annual impairment testing is performed as of August 1. Testing is done more frequently if an event occurs or circumstances change that would indicate the fair value of a reporting unit is less than the carrying amount of those assets.
36
Notes to Consolidated Financial Statements - (Continued)
Other amortizable intangible assets, which consist primarily of patent/technology costs, customer relationships, noncompete agreements, and trade names, are amortized over their useful lives on a straight-line basis. At October 31, 2011, the weighted average useful lives for each major category of amortizable intangible assets were:
Patent/technology costs | 13.5 years | |||
Customer relationships | 19.5 years | |||
Noncompete agreements | 7.4 years | |||
Trade names | 18.1 years |
Foreign currency translation - The financial statements of subsidiaries outside the United States are generally measured using the local currency as the functional currency. Assets and liabilities of these subsidiaries are translated at the rates of exchange at the balance sheet dates. Income and expense items are translated at average monthly rates of exchange. The resulting translation adjustments are included in accumulated other comprehensive income (loss), a separate component of shareholders' equity. Generally, gains and losses from foreign currency transactions, including forward contracts, of these subsidiaries and the United States parent are included in net income. Gains and losses from intercompany foreign currency transactions of a long-term investment nature are included in accumulated other comprehensive income (loss).
Accumulated other comprehensive loss - Accumulated other comprehensive loss at October 31, 2011 and 2010, consisted of:
| 2011 | 2010 | |||||||
Translation adjustments | $ | 37,040 | $ | 36,478 | ||||
Pension and postretirement benefit plan adjustments | (117,052 | ) | (102,784 | ) | ||||
|
|
|
| |||||
| $ | (80,012 | ) | $ | (66,306 | ) | |||
|
|
|
| |||||
Warranties - Our standard warranty program provides for repair or replacement of defective products within a specified time period (generally one year) measured from the date of delivery or first use. The estimate for future warranty-related costs is calculated based on actual historical return rates. Based on analysis of return rates and other factors, warranty provisions are adjusted as necessary. The liability for warranty costs is included in other accrued liabilities in the Consolidated Balance Sheet.
Following is a reconciliation of the product warranty liability for 2011 and 2010:
| 2011 | 2010 | |||||||
Balance at beginning of year | $ | 5,242 | $ | 4,587 | ||||
Accruals for warranties | 7,217 | 6,068 | ||||||
Warranty assumed from acquisition | 72 | 60 | ||||||
Warranty of divested product lines | - | (201 | ) | |||||
Warranty payments | (6,017 | ) | (5,210 | ) | ||||
Currency adjustments | 14 | (62 | ) | |||||
|
|
|
| |||||
Balance at end of year | $ | 6,528 | $ | 5,242 | ||||
|
|
|
| |||||
Presentation - Certain amounts for 2010 and 2009 have been reclassified to conform to 2011 presentation.
37
Notes to Consolidated Financial Statements - (Continued)
Note 2 - Recently issued accounting standards
In October 2009, the Financial Accounting Standards Board ("FASB") issued authoritative guidance on multiple-deliverable revenue arrangements that addresses the unit of accounting for arrangements involving multiple deliverables. The guidance also addresses how arrangement consideration should be allocated to separate units of accounting, when applicable, and expands the disclosure requirements for multiple-deliverable arrangements. We adopted this standard on November 1, 2010, and there were no material changes to our revenue deferral amounts.
In December 2010, the FASB issued guidance that provides requirements over pro forma revenue and earnings disclosures related to business combinations. This guidance will require disclosure of revenue and earnings of the combined business as if the combination occurred at the start of the prior annual reporting period only. This guidance is effective beginning in 2012, and is not expected to have a material impact on the consolidated financial statements.
In May 2011, the FASB clarified the guidance around fair value measurements and disclosures. The guidance requires the disclosure of quantitative information about unobservable inputs used, a description of the valuation processes used, and a qualitative discussion around the sensitivity of the measurements. It will be effective beginning in the second quarter of 2012. We do not expect the adoption will have a significant impact on our consolidated financial statements.
In June 2011, the FASB issued an Accounting Standards Update (ASU) that amends current comprehensive income guidance. This ASU eliminates the option to present the components of other comprehensive income as part of the statement of shareholders' equity. Instead, comprehensive income must be reported in either a single continuous statement of comprehensive income which contains two sections, net income and other comprehensive income, or in two separate but consecutive statements. This guidance will be effective beginning in 2013 and is not expected to impact our consolidated financial statements, as it only results in a change in the format of presentation.
In September 2011, the FASB issued guidance amending the way companies test for goodwill impairment. Companies will have the option to first assess qualitative factors to determine whether the existence of events or circumstances leads to a determination that it is more likely than not that the fair value of a reporting unit is less than its carrying amount. If, after assessing the totality of events or circumstances, companies determine it is more likely than not that the fair value of a reporting unit is greater than its carrying amount, then performing the two-step impairment test is unnecessary. This guidance is effective for interim and annual periods beginning after December 15, 2011, with early adoption permitted. We do not expect the adoption will have a significant impact on our consolidated financial statements.
Note 3 - Retirement, pension and other postretirement plans
Retirement plans - We have funded contributory retirement plans covering certain employees. Our contributions are primarily determined by the terms of the plans, subject to the limitation that they shall not exceed the amounts deductible for income tax purposes. We also sponsor unfunded contributory supplemental retirement plans for certain employees. Generally, benefits under these plans vest gradually over a period of approximately three years from date of employment, and are based on the employee's contribution. The expense applicable to retirement plans for 2011, 2010 and 2009 was approximately $8,594, $7,945 and $7,703, respectively.
Pension plans - We have various pension plans covering a portion of our United States and international employees. Pension plan benefits are generally based on years of employment and, for salaried employees, the level of compensation. Actuarially determined amounts are contributed to United States plans to provide sufficient assets to meet future benefit payment requirements. We also sponsor an unfunded supplemental pension plan for certain employees. International subsidiaries fund their pension plans according to local requirements.
38
Notes to Consolidated Financial Statements - (Continued)
A reconciliation of the benefit obligations, plan assets, accrued benefit cost and the amount recognized in financial statements for pension plans is as follows:
| United States | International | |||||||||||||||
| 2011 | 2010 | 2011 | 2010 | |||||||||||||
Change in benefit obligation: | ||||||||||||||||
Benefit obligation at beginning of year | $ | 237,370 | $ | 224,966 | $ | 71,936 | $ | 61,631 | ||||||||
Service cost | 6,058 | 5,997 | 2,097 | 1,632 | ||||||||||||
Interest cost | 12,008 | 11,883 | 2,973 | 2,791 | ||||||||||||
Participant contributions | - | - | 124 | 128 | ||||||||||||
Plan amendments | 5 | 643 | (1,210 | ) | - | |||||||||||
Addition of plan from business combination | - | - | - | 1,241 | ||||||||||||
Foreign currency exchange rate change | - | - | 345 | (448 | ) | |||||||||||
Actuarial (gain) loss | 21,289 | 18,336 | (2,567 | ) | 7,966 | |||||||||||
Benefits paid | (7,781 | ) | (24,455 | ) | (2,337 | ) | (3,005 | ) | ||||||||
|
|
|
|
|
|
|
| |||||||||
Benefit obligation at end of year | $ | 268,949 | $ | 237,370 | $ | 71,361 | $ | 71,936 | ||||||||
|
|
|
|
|
|
|
| |||||||||
Change in plan assets: | ||||||||||||||||
Beginning fair value of plan assets | $ | 175,864 | $ | 113,356 | $ | 29,799 | $ | 28,833 | ||||||||
Actual return on plan assets | 15,946 | 17,266 | 672 | 994 | ||||||||||||
Company contributions | 672 | 69,697 | 3,788 | 3,446 | ||||||||||||
Participant contributions | - | - | 124 | 128 | ||||||||||||
Foreign currency exchange rate change | - | - | 121 | (597 | ) | |||||||||||
Benefits paid | (7,781 | ) | (24,455 | ) | (2,337 | ) | (3,005 | ) | ||||||||
|
|
|
|
|
|
|
| |||||||||
Ending fair value of plan assets | $ | 184,701 | $ | 175,864 | $ | 32,167 | $ | 29,799 | ||||||||
|
|
|
|
|
|
|
| |||||||||
Funded status at end of year | $ | (84,248 | ) | $ | (61,506 | ) | $ | (39,194 | ) | $ | (42,137 | ) | ||||
|
|
|
|
|
|
|
| |||||||||
Amounts recognized in financial statements: | ||||||||||||||||
Noncurrent asset | $ | - | $ | - | $ | 191 | $ | 497 | ||||||||
Accrued benefit liability | (571 | ) | (467 | ) | (4 | ) | (346 | ) | ||||||||
Long-term pension and retirement obligations | (83,677 | ) | (61,039 | ) | (39,381 | ) | (42,288 | ) | ||||||||
|
|
|
|
|
|
|
| |||||||||
Total amount recognized in financial statements | $ | (84,248 | ) | $ | (61,506 | ) | $ | (39,194 | ) | $ | (42,137 | ) | ||||
|
|
|
|
|
|
|
| |||||||||
Benefits paid pursuant to distribution provisions of our United States plans for 2010 included lump sum settlement payments of $17,151.
39
Notes to Consolidated Financial Statements - (Continued)
| United States | International | |||||||||||||||
| 2011 | 2010 | 2011 | 2010 | |||||||||||||
Amounts recognized in accumulated other comprehensive (gain) loss: | ||||||||||||||||
Net actuarial (gain) loss | $ | 136,927 | $ | 123,449 | $ | 14,937 | $ | 17,486 | ||||||||
Prior service cost (credit) | 2,035 | 2,695 | (1,201 | ) | 14 | |||||||||||
|
|
|
|
|
|
|
| |||||||||
Accumulated other comprehensive (gain) loss | $ | 138,962 | $ | 126,144 | $ | 13,736 | $ | 17,500 | ||||||||
|
|
|
|
|
|
|
| |||||||||
Amounts expected to be recognized during next fiscal year: | ||||||||||||||||
Amortization of net actuarial (gain) loss | $ | 11,356 | $ | 7,226 | $ | 579 | $ | 857 | ||||||||
Amortization of prior service cost (credit) | 667 | 666 | (98 | ) | 5 | |||||||||||
|
|
|
|
|
|
|
| |||||||||
Total | $ | 12,023 | $ | 7,892 | $ | 481 | $ | 862 | ||||||||
|
|
|
|
|
|
|
| |||||||||
The following table summarizes the changes in accumulated other comprehensive (gain) loss:
| United States | International | |||||||||||||||
| 2011 | 2010 | 2011 | 2010 | |||||||||||||
Balance at beginning of year | $ | 126,144 | $ | 124,496 | $ | 17,500 | $ | 9,569 | ||||||||
Net (gain) loss arising during the year | 20,917 | 15,787 | (1,773 | ) | 8,319 | |||||||||||
Prior service cost (credit) arising during the year | 5 | 643 | (1,210 | ) | - | |||||||||||
Net gain (loss) recognized during the year | (7,438 | ) | (6,181 | ) | (858 | ) | (369 | ) | ||||||||
Settlement loss | - | (8,022 | ) | - | (190 | ) | ||||||||||
Prior service (cost) credit recognized during the year | (666 | ) | (579 | ) | (5 | ) | (49 | ) | ||||||||
Exchange rate effect during the year | - | - | 82 | 220 | ||||||||||||
|
|
|
|
|
|
|
| |||||||||
Balance at end of year | $ | 138,962 | $ | 126,144 | $ | 13,736 | $ | 17,500 | ||||||||
|
|
|
|
|
|
|
| |||||||||
Information regarding the accumulated benefit obligation is as follows:
| United States | International | |||||||||||||||
| 2011 | 2010 | 2011 | 2010 | |||||||||||||
For all plans: | ||||||||||||||||
Accumulated benefit obligation | $ | 261,767 | $ | 223,966 | $ | 56,529 | $ | 55,865 | ||||||||
For plans with benefit obligations in excess of plan assets: | ||||||||||||||||
Projected benefit obligation | 268,949 | 237,370 | 64,945 | 60,050 | ||||||||||||
Accumulated benefit obligation | 261,767 | 223,966 | 54,749 | 49,631 | ||||||||||||
Fair value of plan assets | 184,701 | 175,864 | 30,185 | 23,047 | ||||||||||||
40
Notes to Consolidated Financial Statements - (Continued)
Net pension benefit costs include the following components:
| United States | International | |||||||||||||||||||||||
| 2011 | 2010 | 2009 | 2011 | 2010 | 2009 | |||||||||||||||||||
Service cost | $ | 6,058 | $ | 5,997 | $ | 4,177 | $ | 2,097 | $ | 1,632 | $ | 1,315 | ||||||||||||
Interest cost | 12,008 | 11,883 | 11,897 | 2,973 | 2,791 | 2,625 | ||||||||||||||||||
Expected return on plan assets | (15,575 | ) | (14,716 | ) | (11,982 | ) | (1,466 | ) | (1,348 | ) | (1,210 | ) | ||||||||||||
Amortization of prior service cost (credit) | 666 | 579 | 603 | 5 | 49 | 49 | ||||||||||||||||||
Amortization of net actuarial (gain) loss | 7,438 | 6,181 | 854 | 858 | 369 | (19 | ) | |||||||||||||||||
Settlement loss | - | 8,022 | 1,629 | - | 190 | 287 | ||||||||||||||||||
|
|
|
|
|
|
|
|
|
|
|
| |||||||||||||
Total benefit cost | $ | 10,595 | $ | 17,946 | $ | 7,178 | $ | 4,467 | $ | 3,683 | $ | 3,047 | ||||||||||||
|
|
|
|
|
|
|
|
|
|
|
| |||||||||||||
Net periodic pension cost for 2010 and 2009 included settlement losses of $8,212 and $1,916, respectively, due to lump sum retirement payments.
The weighted average assumptions used in the valuation of pension benefits were as follows:
| United States | International | |||||||||||||||||||||||
| 2011 | 2010 | 2009 | 2011 | 2010 | 2009 | |||||||||||||||||||
Assumptions used to determine benefit obligations at October 31: | ||||||||||||||||||||||||
Discount rate | 4.46 | % | 5.21 | % | 5.50 | % | 4.43 | % | 4.17 | % | 4.78 | % | ||||||||||||
Rate of compensation increase | 3.20 | 3.30 | 3.30 | 3.16 | 3.21 | 2.86 | ||||||||||||||||||
Assumptions used to determine net benefit costs for the years ended October 31: | ||||||||||||||||||||||||
Discount rate | 5.21 | 5.50 | 8.00 | 4.17 | 4.78 | 5.87 | ||||||||||||||||||
Expected return on plan assets | 8.25 | 8.51 | 8.48 | 4.84 | 4.85 | 5.04 | ||||||||||||||||||
Rate of compensation increase | 3.30 | 3.30 | 3.30 | 3.21 | 2.86 | 3.45 | ||||||||||||||||||
The amortization of prior service cost is determined using a straight-line amortization of the cost over the average remaining service period of employees expected to receive benefits under the plans.
In determining the expected return on plan assets, we consider both historical performance and an estimate of future long-term rates of return on assets similar to those in our plans. We consult with and consider the opinions of financial and other professionals in developing appropriate return assumptions.
41
Notes to Consolidated Financial Statements - (Continued)
Economic assumptions have a significant effect on the amounts reported. The effect of a one percent change in the discount rate, expected return on assets and compensation increase is shown in the table below. Bracketed numbers represent decreases in expense and obligation amounts.
| United States | International | |||||||||||||||
| 1% Point Increase | 1% Point Decrease | 1% Point Increase | 1% Point Decrease | |||||||||||||
Discount rate: | ||||||||||||||||
Effect on total service and interest cost components in 2011 | $ | (3,107 | ) | $ | 3,696 | $ | (324 | ) | $ | 405 | ||||||
Effect on pension obligation as of October 31, 2011 | $ | (34,776 | ) | $ | 43,229 | $ | (11,917 | ) | $ | 13,847 | ||||||
Expected return on assets: | ||||||||||||||||
Effect on total service and interest cost components in 2011 | $ | (1,889 | ) | $ | 1,888 | $ | (302 | ) | $ | 301 | ||||||
Effect on pension obligation as of October 31, 2011 | $ | - | $ | - | $ | - | $ | - | ||||||||
Compensation increase: | ||||||||||||||||
Effect on total service and interest cost components in 2011 | $ | 2,816 | $ | (2,291 | ) | $ | 462 | $ | (420 | ) | ||||||
Effect on pension obligation as of October 31, 2011 | $ | 14,649 | $ | (12,040 | ) | $ | 8,575 | $ | (7,062 | ) | ||||||
The allocation of pension plan assets as of October 31, 2011 and 2010 is as follows:
| United States | International | |||||||||||||||
| 2011 | 2010 | 2011 | 2010 | |||||||||||||
Asset Category | ||||||||||||||||
Equity securities | 22% | 83% | -% | -% | ||||||||||||
Debt securities | 33 | 16 | - | - | ||||||||||||
Insurance contracts | - | - | 58 | 59 | ||||||||||||
Pooled investment funds | 44 | - | 41 | 40 | ||||||||||||
Other | 1 | 1 | 1 | 1 | ||||||||||||
|
|
|
|
|
|
|
| |||||||||
Total | 100% | 100% | 100% | 100% | ||||||||||||
|
|
|
|
|
|
|
| |||||||||
Our investment objective for defined benefit plan assets is to meet the plans' benefit obligations, while minimizing the potential for future required plan contributions.
Our United States plans comprise 85 percent of the worldwide pension assets. The investment strategies focus on asset class diversification, liquidity to meet benefit payments and an appropriate balance of long-term investment return and risk. Target ranges for asset allocations are determined by dynamically matching the actuarial projections of the plans' future liabilities and benefit payments with expected long-term rates of return on the assets, taking into account investment return volatility and correlations across asset classes. The current target in "return-seeking assets" is 50 percent and 50 percent in fixed income. Plan assets are diversified across several investment managers and are generally invested in liquid funds that are selected to track broad market equity and bond indices. Investment risk is carefully controlled with plan assets rebalanced to target allocations on a periodic basis and continual monitoring of investment managers' performance relative to the investment guidelines established with each investment manager.
Our international plans comprise 15 percent of the worldwide pension assets. Asset allocations are developed on a country-specific basis. Our investment strategy is to cover pension obligations with insurance contracts or to employ independent managers to invest the assets.
42
Notes to Consolidated Financial Statements - (Continued)
The fair values of our pension plan assets at October 31, 2011 by asset category are in the table below.
| United States | International | |||||||||||||||||||||||||||||||
| Total | Level 1 | Level 2 | Level 3 | Total | Level 1 | Level 2 | Level 3 | |||||||||||||||||||||||||
Cash | $ | 618 | $ | 618 | $ | - | $ | - | $ | 322 | $ | 322 | $ | - | $ | - | ||||||||||||||||
Money market funds | 1,845 | 1,845 | - | - | - | - | - | - | ||||||||||||||||||||||||
Equity securities: | ||||||||||||||||||||||||||||||||
Basic materials | 5,081 | 5,081 | - | - | - | - | - | - | ||||||||||||||||||||||||
Consumer goods | 5,942 | 5,942 | - | - | - | - | - | - | ||||||||||||||||||||||||
Financial | 6,989 | 6,989 | - | - | - | - | - | - | ||||||||||||||||||||||||
Healthcare | 4,062 | 4,062 | - | - | - | - | - | - | ||||||||||||||||||||||||
Industrial goods | 3,993 | 3,993 | - | - | - | - | - | - | ||||||||||||||||||||||||
Technology | 4,767 | 4,767 | - | - | - | - | - | - | ||||||||||||||||||||||||
Utilities | 1,578 | 1,578 | - | - | - | - | - | - | ||||||||||||||||||||||||
Mutual funds | 7,353 | 7,353 | - | - | - | - | - | - | ||||||||||||||||||||||||
Fixed income securities: | ||||||||||||||||||||||||||||||||
U.S. Government | 24,224 | 2,445 | 21,779 | - | - | - | - | - | ||||||||||||||||||||||||
Corporate | 35,514 | - | 35,514 | - | - | - | - | - | ||||||||||||||||||||||||
Other | 826 | - | 826 | - | - | - | - | - | ||||||||||||||||||||||||
Other types of investments: | ||||||||||||||||||||||||||||||||
Insurance contracts | - | - | - | - | 18,501 | - | - | 18,501 | ||||||||||||||||||||||||
Pooled investment funds | 81,062 | - | 81,062 | - | 13,344 | - | 13,344 | - | ||||||||||||||||||||||||
Other | 847 | 847 | - | - | - | - | - | - | ||||||||||||||||||||||||
|
|
|
|
|
|
|
|
|
|
|
|
|
|
|
| |||||||||||||||||
| $ | 184,701 | $ | 45,520 | $ | 139,181 | $ | - | $ | 32,167 | $ | 322 | $ | 13,344 | $ | 18,501 | |||||||||||||||||
|
|
|
|
|
|
|
|
|
|
|
|
|
|
|
| |||||||||||||||||
43
Notes to Consolidated Financial Statements - (Continued)
The fair values of our pension plan assets at October 31, 2010 by asset category are in the table below.
| United States | International | |||||||||||||||||||||||||||||||
| Total | Level 1 | Level 2 | Level 3 | Total | Level 1 | Level 2 | Level 3 | |||||||||||||||||||||||||
Cash | $ | 580 | $ | 580 | $ | - | $ | - | $ | - | $ | - | $ | - | $ | - | ||||||||||||||||
Money market funds | 19,224 | 19,224 | - | - | 309 | 309 | - | - | ||||||||||||||||||||||||
Equity securities: | ||||||||||||||||||||||||||||||||
Basic materials | 6,776 | 6,776 | - | - | - | - | - | - | ||||||||||||||||||||||||
Consumer goods | 7,789 | 7,789 | - | - | - | - | - | - | ||||||||||||||||||||||||
Financial | 9,768 | 9,768 | - | - | - | - | - | - | ||||||||||||||||||||||||
Healthcare | 4,483 | 4,483 | - | - | - | - | - | - | ||||||||||||||||||||||||
Industrial goods | 4,623 | 4,623 | - | - | - | - | - | - | ||||||||||||||||||||||||
Technology | 4,339 | 4,339 | - | - | - | - | - | - | ||||||||||||||||||||||||
Utilities | 1,839 | 1,839 | - | - | - | - | - | - | ||||||||||||||||||||||||
Mutual funds | 87,339 | 87,339 | - | - | - | - | - | - | ||||||||||||||||||||||||
Fixed income securities: | ||||||||||||||||||||||||||||||||
U.S. Government | 14,329 | 4,068 | 10,261 | - | - | - | - | - | ||||||||||||||||||||||||
Corporate | 14,489 | - | 14,489 | - | - | - | - | - | ||||||||||||||||||||||||
Other | 57 | - | 57 | - | - | - | - | - | ||||||||||||||||||||||||
Other types of investments: | ||||||||||||||||||||||||||||||||
Insurance contracts | - | - | - | - | 17,699 | - | - | 17,699 | ||||||||||||||||||||||||
Pooled investment funds | - | - | - | - | 11,791 | - | 11,791 | - | ||||||||||||||||||||||||
Other | 229 | 229 | - | - | - | - | - | - | ||||||||||||||||||||||||
|
|
|
|
|
|
|
|
|
|
|
|
|
|
|
| |||||||||||||||||
| $ | 175,864 | $ | 151,057 | $ | 24,807 | $ | - | $ | 29,799 | $ | 309 | $ | 11,791 | $ | 17,699 | |||||||||||||||||
|
|
|
|
|
|
|
|
|
|
|
|
|
|
|
| |||||||||||||||||
At October 31, 2011 and 2010, the pension plans did not have any investment in our common shares.
The inputs and methodology used to measure fair value of plan assets are consistent with those described in Note 18. Following are the valuation methodologies used to measure these assets:
| • | Money market funds - Money market funds are public investment vehicles that are valued with a net asset value of one dollar. This is a quoted price in an active market and is classified as Level 1. |
| • | Equity securities - Common stocks are valued at the closing price reported on the active market on which the individual securities are traded and are classified as Level 1. Mutual funds are valued at the net asset values of the shares at year-end, as determined by the closing price reported on the active market on which the individual securities are traded and are classified as Level 1. |
| • | Fixed income securities - U.S. Treasury bills reflect the closing price on the active market in which the securities are traded and are classified as Level 1. Securities of U.S. agencies are valued using bid evaluations and a classified as Level 2. Corporate fixed income securities are valued using evaluated prices, such as dealer quotes, bids and offers and are therefore classified as Level 2. |
| • | Insurance contracts - Insurance contracts are investments with various insurance companies. The assets are valued at the fair value as reported by the insurance companies. These contracts do not hold any specific assets. These investments are classified as Level 3. |
44
Notes to Consolidated Financial Statements - (Continued)
| • | Pooled investment funds - These are public investment vehicles valued using the net asset value. The net asset value is based on the value of the assets owned by the plan, less liabilities. These investments are not quoted on an active exchange and are classified as Level 2. |
The following table sets forth a summary of changes in fair value of the pension plan investments classified as Level 3 for the years ended October 31, 2011 and 2010:
| 2011 | 2010 | |||||||
Balance at beginning of year | $ | 17,699 | $ | 17,600 | ||||
Net unrealized gains | 55 | 692 | ||||||
Purchases, sales, issuances and settlements, net | 679 | (231 | ) | |||||
Transfers in (out) | - | - | ||||||
Foreign currency translation | 68 | (362 | ) | |||||
|
|
|
| |||||
Balance at end of year | $ | 18,501 | $ | 17,699 | ||||
|
|
|
| |||||
Contributions to pension plans in 2012 are estimated to be approximately $12,500.
Retiree pension benefit payments, which reflect expected future service, are anticipated to be paid as follows:
Year | United States | International | ||||||
2012 | $ | 12,762 | $ | 1,942 | ||||
2013 | 11,443 | 1,989 | ||||||
2014 | 12,669 | 2,399 | ||||||
2015 | 13,982 | 2,840 | ||||||
2016 | 14,243 | 2,288 | ||||||
2017-2021 | 92,072 | 17,271 | ||||||
Contributions and retiree pension benefit payments for 2012 include amounts related to the termination of a plan.
Other postretirement plans - We have an unfunded postretirement benefit plan covering the majority of our United States employees. Employees hired after January 1, 2002, are not eligible to participate in this plan. The plan provides medical and life insurance benefits. The plan is contributory, with retiree contributions in the form of premiums that are adjusted annually, and contains other cost-sharing features, such as deductibles and coinsurance. We also sponsor an unfunded, non-contributory postretirement benefit plan that provides medical and life insurance benefits for certain international employees.
45
Notes to Consolidated Financial Statements - (Continued)
A reconciliation of the benefit obligations, accrued benefit cost and the amount recognized in financial statements for other postretirement plans is as follows:
| United States | International | |||||||||||||||
| 2011 | 2010 | 2011 | 2010 | |||||||||||||
Change in benefit obligation: | ||||||||||||||||
Benefit obligation at beginning of year | $ | 55,599 | $ | 52,858 | $ | 659 | $ | 605 | ||||||||
Service cost | 1,122 | 837 | 31 | 29 | ||||||||||||
Interest cost | 2,932 | 2,504 | 41 | 45 | ||||||||||||
Participant contributions | 1,307 | 1,143 | - | - | ||||||||||||
Plan amendment | - | (1,171 | ) | - | - | |||||||||||
Foreign currency exchange rate change | - | - | 13 | 37 | ||||||||||||
Actuarial (gain) loss | 14,409 | 1,326 | (62 | ) | (53 | ) | ||||||||||
Benefits paid | (1,977 | ) | (1,898 | ) | (4 | ) | (4 | ) | ||||||||
|
|
|
|
|
|
|
| |||||||||
Benefit obligation at end of year | $ | 73,392 | $ | 55,599 | $ | 678 | $ | 659 | ||||||||
|
|
|
|
|
|
|
| |||||||||
Change in plan assets: | ||||||||||||||||
Beginning fair value of plan assets | $ | - | $ | - | $ | - | $ | - | ||||||||
Company contributions | 670 | 755 | 4 | 4 | ||||||||||||
Participant contributions | 1,307 | 1,143 | - | - | ||||||||||||
Benefits paid | (1,977 | ) | (1,898 | ) | (4 | ) | (4 | ) | ||||||||
|
|
|
|
|
|
|
| |||||||||
Ending fair value of plan assets | $ | - | $ | - | $ | - | $ | - | ||||||||
|
|
|
|
|
|
|
| |||||||||
Funded status at end of year | $ | (73,392 | ) | $ | (55,599 | ) | $ | (678 | ) | $ | (659 | ) | ||||
|
|
|
|
|
|
|
| |||||||||
Amounts recognized in financial statements: | ||||||||||||||||
Accrued benefit liability | $ | (2,123 | ) | $ | (2,339 | ) | $ | (4 | ) | $ | (4 | ) | ||||
Long-term postretirement obligations | (71,269 | ) | (53,260 | ) | (674 | ) | (655 | ) | ||||||||
|
|
|
|
|
|
|
| |||||||||
Total amount recognized in financial statements | $ | (73,392 | ) | $ | (55,599 | ) | $ | (678 | ) | $ | (659 | ) | ||||
|
|
|
|
|
|
|
| |||||||||
The 2010 Amendment noted in the preceding table relates to changes in deductibles and out-of-pocket maximums and changes in limits for certain benefits.
| United States | International | |||||||||||||||
| 2011 | 2010 | 2011 | 2010 | |||||||||||||
Amounts recognized in accumulated other comprehensive (gain) loss: | ||||||||||||||||
Net actuarial (gain) loss | $ | 37,690 | $ | 24,887 | $ | (260 | ) | $ | (203 | ) | ||||||
Prior service cost (credit) | (2,316 | ) | (3,464 | ) | - | - | ||||||||||
|
|
|
|
|
|
|
| |||||||||
Accumulated other comprehensive (gain) loss | $ | 35,374 | $ | 21,423 | $ | (260 | ) | $ | (203 | ) | ||||||
|
|
|
|
|
|
|
| |||||||||
Amounts expected to be recognized during next fiscal year: | ||||||||||||||||
Amortization of net actuarial (gain) loss | $ | 2,681 | $ | 1,498 | $ | (14 | ) | $ | (5 | ) | ||||||
Amortization of prior service cost (credit) | (584 | ) | (1,147 | ) | - | - | ||||||||||
|
|
|
|
|
|
|
| |||||||||
Total | $ | 2,097 | $ | 351 | $ | (14 | ) | $ | (5 | ) | ||||||
|
|
|
|
|
|
|
| |||||||||
46
Notes to Consolidated Financial Statements - (Continued)
The following table summarizes the changes in accumulated other comprehensive (gain) loss:
| United States | International | |||||||||||||||
| 2011 | 2010 | 2011 | 2010 | |||||||||||||
Balance at beginning of year | $ | 21,423 | $ | 21,291 | $ | (203 | ) | $ | (146 | ) | ||||||
Net (gain) loss arising during the year | 14,410 | 1,326 | (62 | ) | (53 | ) | ||||||||||
Prior service cost (credit) arising during the year | - | (1,171 | ) | - | - | |||||||||||
Net gain (loss) recognized during the year | (1,606 | ) | (1,170 | ) | 8 | 5 | ||||||||||
Prior service credit (cost) recognized during the year | 1,147 | 1,147 | - | - | ||||||||||||
Exchange rate effect during the year | - | - | (3 | ) | (9 | ) | ||||||||||
|
|
|
|
|
|
|
| |||||||||
Balance at end of year | $ | 35,374 | $ | 21,423 | $ | (260 | ) | $ | (203 | ) | ||||||
|
|
|
|
|
|
|
| |||||||||
Net postretirement benefit costs include the following components:
| United States | International | |||||||||||||||||||||||
| 2011 | 2010 | 2009 | 2011 | 2010 | 2009 | |||||||||||||||||||
Service cost | $ | 1,122 | $ | 837 | $ | 589 | $ | 31 | $ | 29 | $ | 23 | ||||||||||||
Interest cost | 2,932 | 2,504 | 2,926 | 41 | 44 | 35 | ||||||||||||||||||
Amortization of prior service cost (credit) | (1,147 | ) | (1,147 | ) | (1,009 | ) | - | - | - | |||||||||||||||
Amortization of net actuarial (gain) loss | 1,606 | 1,170 | 765 | (8 | ) | (5 | ) | (11 | ) | |||||||||||||||
|
|
|
|
|
|
|
|
|
|
|
| |||||||||||||
Total benefit cost | $ | 4,513 | $ | 3,364 | $ | 3,271 | $ | 64 | $ | 68 | $ | 47 | ||||||||||||
|
|
|
|
|
|
|
|
|
|
|
| |||||||||||||
The weighted average assumptions used in the valuation of postretirement benefits were as follows:
| United States | International | |||||||||||||||||||||||
| 2011 | 2010 | 2009 | 2011 | 2010 | 2009 | |||||||||||||||||||
Assumptions used to determine benefit obligations at October 31: | ||||||||||||||||||||||||
Discount rate | 4.50 | % | 5.25 | % | 5.50 | % | 5.85 | % | 5.75 | % | 6.75 | % | ||||||||||||
Health care cost trend rate | 9.36 | 9.00 | 8.25 | 7.00 | 6.80 | 7.50 | ||||||||||||||||||
Rate to which health care cost trend rate is assumed to decline (ultimate trend rate) | 5.00 | 5.00 | 4.50 | 3.50 | 4.80 | 4.80 | ||||||||||||||||||
Year the rate reaches the ultimate trend rate | 2016 | 2020 | 2015 | 2031 | 2013 | 2013 | ||||||||||||||||||
Assumption used to determine net benefit costs for the years ended October 31: | ||||||||||||||||||||||||
Discount rate | 5.25 | % | 5.50 | % | 8.00 | % | 5.75 | % | 6.75 | % | 7.70 | % | ||||||||||||
47
Notes to Consolidated Financial Statements - (Continued)
The discount rate and the health care cost trend rate assumptions have a significant effect on the amounts reported. For example, a one-percentage point change in the discount rate and the assumed health care cost trend rate would have the following effects:
| United States | International | |||||||||||||||
| 1% Point Increase | 1% Point Decrease | 1% Point Increase | 1% Point Decrease | |||||||||||||
Discount rate: | ||||||||||||||||
Effect on total service and interest cost components in 2011 | $ | (628 | ) | $ | 753 | $ | (9 | ) | $ | 11 | ||||||
Effect on postretirement obligation as of | $ | (10,119 | ) | $ | 12,871 | $ | (135 | ) | $ | 181 | ||||||
Health care trend rate: | ||||||||||||||||
Effect on total service and interest cost components in 2011 | $ | 871 | $ | (688 | ) | $ | 19 | $ | (14 | ) | ||||||
Effect on postretirement obligation as of | $ | 11,804 | $ | (9,476 | ) | $ | 174 | $ | (132 | ) | ||||||
Contributions to postretirement plans in 2012 are estimated to be approximately $1,900.
Retiree postretirement benefit payments are anticipated to be paid as follows:
| United States | International | |||||||||||
Year | With Medicare Part D Subsidy | Without Medicare Part D Subsidy | ||||||||||
2012 | $ | 2,123 | $ | 1,872 | $ | 4 | ||||||
2013 | 2,316 | 2,013 | 4 | |||||||||
2014 | 2,693 | 2,345 | 8 | |||||||||
2015 | 2,955 | 2,556 | 16 | |||||||||
2016 | 3,238 | 2,787 | 17 | |||||||||
2017-2021 | 18,483 | 15,279 | 115 | |||||||||
Note 4 - Income taxes
Income tax expense includes the following:
| 2011 | 2010 | 2009 | ||||||||||
Current: | ||||||||||||
U.S. federal | $ | 53,983 | $ | 9,811 | $ | 14,370 | ||||||
State and local | 2,029 | 29 | 858 | |||||||||
Foreign | 35,469 | 26,601 | 13,581 | |||||||||
|
|
|
|
|
| |||||||
Total current | 91,481 | 36,441 | 28,809 | |||||||||
Deferred: | ||||||||||||
U.S. federal | 1,851 | 34,097 | 7,281 | |||||||||
State and local | 23 | (2,771 | ) | 906 | ||||||||
Foreign | (1,158 | ) | (4,496 | ) | (4,132 | ) | ||||||
|
|
|
|
|
| |||||||
Total deferred | 716 | 26,830 | 4,055 | |||||||||
|
|
|
|
|
| |||||||
| $ | 92,197 | $ | 63,271 | $ | 32,864 | |||||||
|
|
|
|
|
| |||||||
48
Notes to Consolidated Financial Statements - (Continued)
Earnings before income taxes of domestic operations, which are calculated after intercompany profit eliminations, were $181,258, $130,149 and $21,864 in 2011, 2010 and 2009, respectively.
Foreign income tax expense includes a benefit related to the utilization of loss carryforwards of $682, $1,876 and $5 in 2011, 2010 and 2009, respectively.
Income tax expense for 2011 includes a benefit of $2,027 from a reduction in unrecognized tax benefits, primarily related to settlements with tax authorities. In December 2010, the U.S. Congress passed and the President signed the Tax Relief, Unemployment Insurance Reauthorization, and Job Creation Act of 2010, which provided retroactive reinstatement of a research credit. As a result, income tax expense for 2011 includes a tax benefit of $1,580 related to research credit generated in 2010.
During 2010 we sold our UV Curing graphic arts and lamps product lines to Baldwin Technology Company, Inc., as discussed in Note 14, and we recognized $10,243 in tax benefits from the write-off of our tax basis in the product lines. Income tax expense for 2010 was negatively impacted by the enactment in March 2010 of the Patient Protection and Affordable Care Act and the subsequent enactment of the Health Care and Education Reconciliation Act of 2010, resulting in an additional tax charge of $5,249. The charge is due to a reduction in the value of our deferred tax asset as a result of a change to the tax treatment associated with Medicare Part D subsidies.
Expense in 2009 included a benefit of $2,752 related to remeasurement of unrecognized tax benefits and a benefit of $531 related to an adjustment to a prior tax year.
The principal items accounting for the difference in income taxes computed at the U.S. statutory rate and income tax shown in the Consolidated Statements of Income for 2011, 2010, and 2009 are as follows:
| 2011 | 2010 | 2009 | ||||||||||
Tax at statutory rate of 35% | $ | 110,096 | $ | 80,962 | $ | (44,517 | ) | |||||
Impact of goodwill charge | - | - | 79,064 | |||||||||
Domestic Production Deduction | (5,530 | ) | (1,737 | ) | (1,134 | ) | ||||||
Foreign tax rate variances, net of foreign tax credits | (7,906 | ) | (10,550 | ) | 1,279 | |||||||
State and local taxes, net of federal income tax benefit | 1,310 | (1,828 | ) | 1,160 | ||||||||
Tax expense related to tax law change | - | 5,249 | - | |||||||||
Tax benefit from sale of UV product lines | - | (10,243 | ) | - | ||||||||
Amounts related to prior years | (4,123 | ) | 776 | (3,283 | ) | |||||||
Other - net | (1,650 | ) | 642 | 295 | ||||||||
|
|
|
|
|
| |||||||
Provision for income taxes | $ | 92,197 | $ | 63,271 | $ | 32,864 | ||||||
|
|
|
|
|
| |||||||
The Domestic Production Deduction, enacted by the American Jobs Creation Act of 2004, allows a deduction with respect to income from certain United States manufacturing activities.
Earnings before income taxes of international operations, which are calculated before intercompany profit elimination entries, were $133,303, $101,170 and $(149,055) in 2011, 2010 and 2009, respectively. Deferred income taxes are not provided on undistributed earnings of international subsidiaries that are intended to be permanently invested in those operations. These undistributed earnings aggregated approximately $391,679 and $340,354 at October 31, 2011 and 2010, respectively. Should these earnings be distributed, applicable foreign tax credits would substantially offset United States taxes due upon the distribution.
49
Notes to Consolidated Financial Statements - (Continued)
At October 31, 2011 and 2010, total unrecognized tax benefits were $2,576 and $4,078, respectively. The amounts that, if recognized, would impact the effective tax rate were $2,517 and $4,019 at October 31, 2011 and 2010, respectively. A reconciliation of the beginning and ending amount of unrecognized tax benefits for 2011, 2010 and 2009 is as follows:
| 2011 | 2010 | 2009 | ||||||||||
Balance at beginning of year | $ | 4,078 | $ | 3,969 | $ | 7,685 | ||||||
Additions based on tax positions related to the current year | 387 | 388 | 515 | |||||||||
Additions for tax positions of prior years | 138 | 359 | - | |||||||||
Reductions for tax positions of prior years | - | (638 | ) | (3,267 | ) | |||||||
Settlements | (2,027 | ) | - | (964 | ) | |||||||
Lapse of statute of limitations | - | - | - | |||||||||
|
|
|
|
|
| |||||||
Balance at end of year | $ | 2,576 | $ | 4,078 | $ | 3,969 | ||||||
|
|
|
|
|
| |||||||
At October 31, 2011 and 2010, we had accrued interest expense related to unrecognized tax benefits of $327 and $460, respectively. We include interest accrued related to unrecognized tax benefits in interest expense. Penalties, if incurred, would be recognized as other income (expense).
We are subject to United States Federal income tax as well as income taxes in numerous state and foreign jurisdictions. We are subject to examination in the U.S. by the Internal Revenue Service (IRS) for the 2009 through 2011 tax years; tax years prior to 2009 have been examined by the IRS. Generally, major state and foreign jurisdiction tax years remain open to examination for tax years after 2006. Within the next twelve months, it is reasonably possible that certain foreign statute of limitations periods would expire, which could result in a decrease in our unrecognized tax benefits in a range of $0 to $500. The portion of the possible reduction that, if recognized, would impact the effective tax rate is $0 to $500.
Significant components of deferred tax assets and liabilities are as follows:
| 2011 | 2010 | |||||||
Deferred tax assets: | ||||||||
Sales to international subsidiaries and related consolidation adjustments | $ | 10,315 | $ | 8,919 | ||||
Employee benefits | 79,027 | 63,520 | ||||||
Other accruals not currently deductible for taxes | 12,114 | 11,681 | ||||||
Tax credit and loss carryforwards | 10,812 | 5,664 | ||||||
Inventory adjustments | 4,085 | 3,585 | ||||||
Translation of foreign currency accounts | 716 | 316 | ||||||
Other - net | - | 268 | ||||||
|
|
|
| |||||
Total deferred tax assets | 117,069 | 93,953 | ||||||
Valuation allowance | (4,287 | ) | (5,729 | ) | ||||
|
|
|
| |||||
Total deferred tax assets | 112,782 | 88,224 | ||||||
Deferred tax liabilities: | ||||||||
Depreciation and amortization | 94,487 | 64,198 | ||||||
Translation of foreign currency accounts | 17 | - | ||||||
Other - net | - | 195 | ||||||
|
|
|
| |||||
Total deferred tax liabilities | 94,504 | 64,393 | ||||||
|
|
|
| |||||
Net deferred tax assets | $ | 18,278 | $ | 23,831 | ||||
|
|
|
| |||||
50
Notes to Consolidated Financial Statements - (Continued)
At October 31, 2011, we had $645 of tax credit carryforwards that will expire in 2013 through 2017. We also had $19,117 Federal, $55,798 state and $575 foreign operating loss carryforwards, of which $74,915 will expire in 2012 through 2031, and $575 of which has an indefinite carryforward period. The net change in the valuation allowance was a decrease of $1,442 in 2011 and a decrease of $2,081 in 2010. The valuation allowance of $4,287 at October 31, 2011, relates primarily to tax credits and loss carryforwards that may expire before being realized.
Note 5 - Details of balance sheet
| 2011 | 2010 | |||||||
Receivables: | ||||||||
Accounts | $ | 235,240 | $ | 215,960 | ||||
Notes | 16,082 | 11,035 | ||||||
Other | 6,299 | 20,148 | ||||||
|
|
|
| |||||
| 257,621 | 247,143 | |||||||
Allowance for doubtful accounts | (3,311 | ) | (3,353 | ) | ||||
|
|
|
| |||||
| $ | 254,310 | $ | 243,790 | |||||
|
|
|
| |||||
Inventories: | ||||||||
Finished goods | $ | 98,879 | $ | 83,459 | ||||
Work-in-process | 13,971 | 15,614 | ||||||
Raw materials and finished parts | 51,891 | 43,305 | ||||||
|
|
|
| |||||
| 164,741 | 142,378 | |||||||
Obsolescence and other reserves | (16,050 | ) | (16,802 | ) | ||||
LIFO reserve | (6,779 | ) | (7,855 | ) | ||||
|
|
|
| |||||
| $ | 141,912 | $ | 117,721 | |||||
|
|
|
| |||||
Property, plant and equipment: | ||||||||
Land | $ | 7,791 | $ | 7,810 | ||||
Land improvements | 3,392 | 2,325 | ||||||
Buildings | 121,870 | 115,111 | ||||||
Machinery and equipment | 207,734 | 207,740 | ||||||
Enterprise management system | 43,006 | 37,249 | ||||||
Construction-in-progress | 5,623 | 8,544 | ||||||
Leased property under capitalized leases | 16,796 | 14,879 | ||||||
|
|
|
| |||||
| 406,212 | 393,658 | |||||||
Accumulated depreciation and amortization | (275,329 | ) | (277,263 | ) | ||||
|
|
|
| |||||
| $ | 130,883 | $ | 116,395 | |||||
|
|
|
| |||||
Accrued liabilities: | ||||||||
Salaries and other compensation | $ | 44,068 | $ | 40,334 | ||||
Pension and retirement | 1,030 | 1,675 | ||||||
Taxes other than income taxes | 9,252 | 8,110 | ||||||
Other | 46,944 | 46,014 | ||||||
|
|
|
| |||||
| $ | 101,294 | $ | 96,133 | |||||
|
|
|
| |||||
51
Notes to Consolidated Financial Statements - (Continued)
Note 6 - Leases
We have lease commitments expiring at various dates, principally for manufacturing, warehouse and office space, automobiles and office equipment. Many leases contain renewal options and some contain purchase options and residual guarantees.
Rent expense for all operating leases was approximately $12,292, $12,266 and $11,801 in 2011, 2010 and 2009, respectively.
Amortization of assets recorded under capital leases is recorded in depreciation expense.
Assets held under capitalized leases and included in property, plant and equipment are as follows:
| 2011 | 2010 | |||||||
Transportation equipment | $ | 14,215 | $ | 13,870 | ||||
Other | 2,581 | 1,009 | ||||||
|
|
|
| |||||
Total capitalized leases | 16,796 | 14,879 | ||||||
Accumulated amortization | (6,969 | ) | (7,799 | ) | ||||
|
|
|
| |||||
Net capitalized leases | $ | 9,827 | $ | 7,080 | ||||
|
|
|
| |||||
At October 31, 2011, future minimum lease payments under noncancelable capitalized and operating leases are as follows:
| Capitalized Leases | Operating Leases | |||||||
Year: | ||||||||
2012 | $ | 5,481 | $ | 10,955 | ||||
2013 | 4,036 | 6,244 | ||||||
2014 | 2,211 | 4,429 | ||||||
2015 | 637 | 2,863 | ||||||
2016 | 49 | 2,216 | ||||||
Later years | - | 9,095 | ||||||
|
|
|
| |||||
Total minimum lease payments | 12,414 | $ | 35,802 | |||||
|
| |||||||
Less amount representing executory costs | 1,812 | |||||||
|
| |||||||
Net minimum lease payments | 10,602 | |||||||
Less amount representing interest | 1,269 | |||||||
|
| |||||||
Present value of net minimum lease payments | 9,333 | |||||||
Less current portion | 4,131 | |||||||
|
| |||||||
Long-term obligations at October 31, 2011 | $ | 5,202 | ||||||
|
| |||||||
52
Notes to Consolidated Financial Statements - (Continued)
Note 7 - Notes payable
Bank lines of credit and notes payable are summarized as follows:
| 2011 | 2010 | |||||||
Maximum borrowings under bank lines of credit: | ||||||||
Domestic banks | $ | - | $ | - | ||||
Foreign banks | 43,305 | 39,710 | ||||||
|
|
|
| |||||
Total | $ | 43,305 | $ | 39,710 | ||||
|
|
|
| |||||
Outstanding notes payable: | ||||||||
Domestic bank debt | $ | - | $ | - | ||||
Foreign bank debt | 33 | 2,160 | ||||||
|
|
|
| |||||
Total | $ | 33 | $ | 2,160 | ||||
|
|
|
| |||||
Weighted-average interest rate on notes payable | 1.5 | % | 4.1 | % | ||||
Unused bank lines of credit | $ | 43,272 | $ | 37,550 | ||||
Note 8 - Long-term debt
A summary of long-term debt is as follows:
| 2011 | 2010 | |||||||
Revolving credit agreement, due 2017 | $ | 192,200 | $ | 46,000 | ||||
Senior notes, due 2005-2011 | - | 14,260 | ||||||
Private shelf facility, due 2012-2020 | 75,000 | - | ||||||
Senior notes, due 2013 | 50,000 | 50,000 | ||||||
Development loans, due 2011-2026 | 1,923 | - | ||||||
|
|
|
| |||||
| 319,123 | 110,260 | |||||||
Less current maturities | 5,664 | 14,260 | ||||||
|
|
|
| |||||
Long-term maturities | $ | 313,459 | $ | 96,000 | ||||
|
|
|
| |||||
Revolving credit agreement - This $400,000 revolving credit agreement is with a group of banks which was scheduled to expire in 2012; however, we replaced this agreement with a new $500,000 unsecured, multi-currency credit agreement with a group of banks. The balance outstanding under the prior agreement was transferred to the new agreement. Borrowings under the prior agreement were classified as long-term, because a new revolving credit agreement was entered into on December 9, 2011, as discussed in Note 21. Payment of quarterly commitment fees is required. The weighted average interest rate for borrowings under this agreement was 0.54 percent at October 31, 2011.
Senior notes, due 2005-2011 - These fixed rate notes with a group of insurance companies had an original weighted-average life of 6.5 years at the time of issuance in 2001.
Private shelf facility - On June 30, 2011, we entered into a $150,000 three-year Private Shelf Note agreement with New York Life Investment Management LLC (NYLIM). Borrowings under the agreement may be up to 12 years, with an average life of up to 10 years, and are unsecured. The interest rate on each borrowing can be fixed or floating and is based upon the market rate at the borrowing date. At October 31, 2011, $75,000 was outstanding under this facility at a fixed rate of 2.21 percent per annum.
Senior note, due 2013 - This note is payable in one installment and has a fixed interest rate of 4.98 percent.
53
Notes to Consolidated Financial Statements - (Continued)
Development loans, due 2011-2026 - These fixed-rate loans with the State of Ohio and Cuyahoga County, Ohio were issued in 2011 in connection with the construction of our new corporate headquarters building and are payable in monthly installments over 15 years beginning in 2011. The interest rate on the State of Ohio loan is 3.00 percent, and the interest rate on the Cuyahoga County loan is 3.50 percent.
Annual maturities - The annual maturities of long-term debt for the five years subsequent to October 31, 2011, are as follows: $5,664 in 2012; $55,668 in 2013; $10,671 in 2014; and $10,675 in 2015 and $10,679 in 2016.
Note 9 - Financial instruments
We operate internationally and enter into intercompany transactions denominated in foreign currencies. Consequently, we are subject to market risk arising from exchange rate movements between the dates foreign currency transactions occur and the dates they are settled. We regularly use foreign currency forward contracts to reduce our risks related to most of these transactions. These contracts usually have maturities of 90 days or less and generally require us to exchange foreign currencies for U.S. dollars at maturity, at rates stated in the contracts. These contracts are not designated as hedging instruments under U.S. GAAP. Accordingly, the changes in the fair value of the hedges of balance sheet positions are recognized in each accounting period in "other-net" on the Consolidated Statement of Income together with the transaction gain or loss from the hedged balance sheet position. In 2011, we recognized net losses of $11,277 on foreign exchange contracts and net gains of $13,477 from the change in fair value of balance sheet positions. In 2010, we recognized net gains of $7,970 on foreign exchange contracts and net losses of $6,749 from the change in fair value of balance sheet positions. We do not use financial instruments for trading or speculative purposes.
The following table summarizes, by currency, forward exchange contracts outstanding at October 31, 2011 and 2010:
| Sell | Buy | |||||||||||||||
| Notional Amounts | Fair Market Value | Notional Amounts | Fair Market Value | |||||||||||||
October 31, 2011 contract amounts: | ||||||||||||||||
Euro | $ | 10,920 | $ | 10,967 | $ | 88,209 | $ | 87,736 | ||||||||
Pound sterling | 29,381 | 29,465 | 56,028 | 56,515 | ||||||||||||
Japanese yen | 16,723 | 16,416 | 15,788 | 15,566 | ||||||||||||
Others | 13,827 | 13,891 | 33,001 | 33,473 | ||||||||||||
|
|
|
|
|
|
|
| |||||||||
Total | $ | 70,851 | $ | 70,739 | $ | 193,026 | $ | 193,290 | ||||||||
|
|
|
|
|
|
|
| |||||||||
October 31, 2010 contract amounts: | ||||||||||||||||
Euro | $ | 17,145 | $ | 17,601 | $ | 171,870 | $ | 181,430 | ||||||||
Pound sterling | - | - | 25,832 | 26,576 | ||||||||||||
Japanese yen | 12,947 | 13,260 | 18,678 | 19,490 | ||||||||||||
Others | 6,357 | 6,545 | 28,361 | 29,854 | ||||||||||||
|
|
|
|
|
|
|
| |||||||||
Total | $ | 36,449 | $ | 37,406 | $ | 244,741 | $ | 257,350 | ||||||||
|
|
|
|
|
|
|
| |||||||||
We also use intercompany foreign currency transactions of a long-term investment nature to hedge the value of investment in wholly-owned subsidiaries. For hedges of the net investment in foreign operations, realized and unrealized gains and losses are shown in the cumulative translation adjustment account included in total comprehensive income. For 2011 and 2010, net losses of $170 and $999, respectively, were included in the cumulative translation adjustment account related to foreign denominated fixed-rate debt designated as a hedge of net investment in foreign operations.
54
Notes to Consolidated Financial Statements - (Continued)
We are exposed to credit-related losses in the event of nonperformance by counterparties to financial instruments. These financial instruments include cash deposits and forward exchange contracts. We periodically monitor the credit ratings of these counterparties in order to minimize our exposure. Our customers represent a wide variety of industries and geographic regions. As of October 31, 2011, there were no significant concentrations of credit risk.
The carrying amounts and fair values of financial instruments, other than receivables and accounts payable, are shown in the table below. The carrying values of receivables and accounts payable approximate fair value due to the short-term nature of these instruments.
| 2011 | 2010 | |||||||||||||||
| Carrying Amount | Fair Value | Carrying Amount | Fair Value | |||||||||||||
Cash and cash equivalents | $ | 37,408 | $ | 37,408 | $ | 42,329 | $ | 42,329 | ||||||||
Marketable securities | - | - | 7,840 | 7,840 | ||||||||||||
Notes payable | 33 | 33 | 2,160 | 2,160 | ||||||||||||
Long-term debt | 319,123 | 313,850 | 110,260 | 112,495 | ||||||||||||
Forward exchange contracts (net) | 376 | 376 | 11,653 | 11,653 | ||||||||||||
We used the following methods and assumptions in estimating the fair value of financial instruments:
| • | Cash, cash equivalents and notes payable are valued at their carrying amounts due to the relatively short period to maturity of the instruments. |
| • | Marketable securities are valued at quoted market prices, which are considered to be Level 1 inputs under the fair value hierarchy. |
| • | Long-term debt is valued by discounting future cash flows at currently available rates for borrowing arrangements with similar terms and conditions, which are considered to be Level 2 inputs under the fair value hierarchy. |
| • | Foreign exchange contracts are estimated using quoted exchange rates, which are considered to be Level 2 inputs under the fair value hierarchy. |
Note 10 - Capital shares
Preferred - We have authorized 10,000 Series A convertible preferred shares without par value. No preferred shares were outstanding in 2011, 2010 or 2009.
Common - On March 1, 2011, the Board of Directors declared a 2-for-1 stock split on our common shares, paid in the form of a 100 percent stock dividend on April 12, 2011 for all shares outstanding on March 25, 2011. Accordingly, all per-share amounts and number of common shares and common share equivalents have been adjusted retroactively to reflect the stock split.
We have 160,000 authorized common shares without par value. At October 31, 2011 and 2010, there were 98,023 common shares issued. At October 31, 2011 and 2010, the number of outstanding common shares, net of treasury shares, was 65,601 and 67,871, respectively.
Common shares repurchased as part of publicly announced programs during 2011, 2010 and 2009 were as follows:
Year | Number of Shares | Total Amount | Average per Share | |||||||||
2011 | 3,024 | $ | 134,163 | $ | 44.37 | |||||||
2010 | 697 | $ | 22,047 | $ | 31.63 | |||||||
2009 | 394 | $ | 6,826 | $ | 17.31 | |||||||
55
Notes to Consolidated Financial Statements - (Continued)
Note 11 - Stock-based compensation
The amended and restated 2004 long-term performance plan, approved by shareholders in 2008, provides for the granting of stock options, stock appreciation rights, nonvested (restricted) stock, stock purchase rights, stock equivalent units, nonvested (restricted) stock units, cash awards and other stock- or performance-based incentives. The number of common shares available for grant is 2.5 percent of the number of common shares outstanding as of the first day of each year. At the end of 2011, there were 1,640 shares available for grant in 2012.
Stock options - Nonqualified or incentive stock options may be granted to our employees and directors. Generally, options granted to employees may be exercised beginning one year from the date of grant at a rate not exceeding 25 percent per year for executive officers and 20 percent per year for other employees and expire 10 years from the date of grant. Vesting accelerates upon the occurrence of events that involve or may result in a change of control. Option exercises are satisfied through the issuance of treasury shares on a first-in, first-out basis. We recognized compensation expense of $2,906, $2,231 and $3,026 for 2011, 2010 and 2009, respectively.
Following is a summary of stock options for 2011:
| Number of Options | Weighted-Average Exercise Price Per Share | Aggregate Intrinsic Value | Weighted-Average Remaining Term | |||||||||||||
Outstanding at October 31, 2010 | 2,362 | $ | 20.15 | |||||||||||||
Granted | 287 | $ | 43.32 | |||||||||||||
Exercised | (787 | ) | $ | 18.92 | ||||||||||||
Forfeited or expired | (11 | ) | $ | 28.20 | ||||||||||||
|
| |||||||||||||||
Outstanding at October 31, 2011 | 1,851 | $ | 24.22 | $ | 41,011 | 6.2 years | ||||||||||
|
| |||||||||||||||
Vested at October 31, 2011 or expected to vest | 1,773 | $ | 23.93 | $ | 39,791 | 6.1 years | ||||||||||
Exercisable at October 31, 2011 | 944 | $ | 19.79 | $ | 25,100 | 4.5 years | ||||||||||
Summarized information on currently outstanding options follows:
| Range of Exercise Price | ||||||||||||
| $11 - $20 | $21 - $28 | $29 - $44 | ||||||||||
Number outstanding | 843 | 655 | 353 | |||||||||
Weighted-average remaining contractual life, in years | 4.7 | 6.5 | 8.9 | |||||||||
Weighted-average exercise price | $ | 15.69 | $ | 26.22 | $ | 40.85 | ||||||
Number exercisable | 596 | 331 | 17 | |||||||||
Weighted-average exercise price | $ | 16.24 | $ | 25.62 | $ | 30.70 | ||||||
As of October 31, 2011, there was $6,859 of total unrecognized compensation cost related to nonvested stock options. That cost is expected to be amortized over a weighted average period of approximately 2.0 years.
The Black-Scholes option valuation model was developed for use in estimating the fair value of traded options that have no vesting restrictions and are fully transferable. Option valuation models require the input of highly subjective assumptions, including the expected stock price volatility. The fair value of each option grant was estimated at the date of grant using the Black-Scholes option-pricing model with the following assumptions:
| 2011 | 2010 | |||
Expected volatility | .431-.451 | .429-.442 | ||
Expected dividend yield | 1.28% | 1.35-1.40% | ||
Risk-free interest rate | 1.89%-2.25% | 2.27-3.18% | ||
Expected life of the option (in years) | 5.4-6.3 | 5.4-6.3 |
56
Notes to Consolidated Financial Statements - (Continued)
The weighted-average expected volatility used to value options granted in 2011 and 2010 was .443 and .436, respectively. The weighted-average dividend yield used to value the 2010 options was 1.39%.
Historical information was the primary basis for the selection of the expected volatility, expected dividend yield and the expected lives of the options. The risk-free interest rate was selected based upon yields of United States Treasury issues with terms equal to the expected life of the option being valued.
The weighted average grant date fair value of stock options granted during 2011, 2010 and 2009 was $16.80, $11.08 and $5.31, respectively.
The total intrinsic value of options exercised during 2011, 2010 and 2009 was $23,076, $22,821 and $2,024, respectively. Cash received from the exercise of stock options for 2011, 2010 and 2009 was $9,652, $13,828 and $2,986, respectively. The tax benefit realized from tax deductions from exercises for 2011, 2010 and 2009 was $6,924, $7,798 and $284, respectively.
Nonvested (restricted) stock - We may grant nonvested (restricted) stock to our employees and directors. These shares may not be disposed of for a designated period of time (generally six months to five years) defined at the date of grant. For employee recipients, shares are forfeited on a pro-rata basis in the event employment is terminated as a consequence of the employee recipient's early retirement, disability or death prior to the lapse of any restrictions. Restrictions lapse in the event of a recipient's retirement at or after normal retirement age. Termination for any other reason prior to the lapse of any restrictions results in forfeiture of the shares. For non-employee directors, all restrictions lapse in the event of disability or death of the non-employee director. Termination of service as a director for any other reason within one year of date of grant results in a pro-rata forfeiture of shares.
As shares are issued, deferred stock-based compensation equivalent to the fair market value on the date of grant is charged to shareholders' equity and subsequently amortized over the restriction period. Tax benefits arising from the lapse of restrictions on the stock are recognized when realized and credited to capital in excess of stated value.
The following table summarizes 2011 activity related to nonvested stock:
| Number of Shares | Weighted-Average Grant Date Fair Value Per Share | |||||||
Nonvested at October 31, 2010 | 80 | $ | 24.70 | |||||
Granted | 38 | $ | 43.41 | |||||
Vested | (36 | ) | $ | 21.11 | ||||
Forfeited | (1 | ) | $ | 43.32 | ||||
|
| |||||||
Nonvested at October 31, 2011 | 81 | $ | 34.95 | |||||
|
| |||||||
As of October 31, 2011, there was $1,614 of unrecognized compensation cost related to nonvested stock. The cost is expected to be amortized over a weighted average period of 1.7 years. The amount charged to expense related to nonvested stock was $1,278, $774 and $507 in 2011, 2010 and 2009, respectively.
Deferred directors compensation - Non-employee directors may defer all or part of their compensation until retirement. Compensation may be deferred as cash or as stock equivalent units. Deferred cash amounts are recorded as liabilities. Additional stock equivalent units are earned when common stock dividends are declared.
57
Notes to Consolidated Financial Statements - (Continued)
The following is a summary of the activity related to deferred director compensation during 2011:
| Number of Shares | Weighted-Average Grant Date Fair Value Per Share | |||||||
Outstanding at October 31, 2010 | 267 | $ | 16.54 | |||||
Deferrals | 3 | $ | 48.82 | |||||
Restricted stock units vested | 18 | $ | 16.55 | |||||
Dividend equivalents | 2 | $ | 47.99 | |||||
Distributions | (47 | ) | $ | 15.27 | ||||
|
| |||||||
Outstanding at October 31, 2011 | 243 | $ | 17.51 | |||||
|
| |||||||
The amount charged to expense related to this plan was $265, $351 and $333 in 2011, 2010 and 2009, respectively.
Long-Term Incentive Plan - Under the Long-Term Incentive Plan, executive officers and selected other key employees receive common stock awards based solely on corporate performance measures over three-year performance periods. Awards vary based on the degree to which corporate performance exceeds predetermined threshold, target and maximum performance levels at the end of a performance period. No award will occur unless certain threshold performance objectives are exceeded.
The amount of compensation expense is based upon current performance projections for each three-year period and the percentage of the requisite service that has been rendered. The calculations are also based upon the grant date fair value determined using the closing market price of common stock at the grant date, reduced by the implied value of dividends not to be paid. This value was $42.02 per share for both the executive officer and the selected other key employees for 2011. The per-share values for 2010 were $26.10 and $29.52 for the executive officer group and $26.10 for the selected other key employees. The per-share value for 2009 was $13.23. These performance-based equity grants are recorded in shareholders' equity. The cumulative amounts recorded in shareholders' equity at October 31, 2011 and October 31, 2010 were $6,081 and $3,879, respectively. There was no cumulative amount recorded in shareholders' equity at October 31, 2009. The amounts charged to expense for executive officers and selected other key employees in 2011 and 2010 were $4,067 and $3,879, respectively. There was $5,014 credited to expense for executive officers and selected other employees in 2009.
Shares reserved for future issuance - At October 31, 2011, there were 139,354 of common shares reserved for future issuance through the exercise of outstanding options or rights.
Note 12 - Severance and restructuring costs
In 2011, we announced a restructuring of the Georgia operations of our Adhesive Dispensing Systems segment in order to optimize operations and better serve our customers. The restructuring involves the expansion of our facility in Duluth and construction of a new facility in Swainsboro, where operations from our existing Swainsboro facility, as well as facilities in Norcross and Dawsonville, will be transferred. Severance costs and other termination fees associated with this action will occur through the third quarter of 2012 and are estimated to be approximately $2,400. Payments are expected to begin in the first quarter of 2012. Of the total expense amount, $1,557 was recorded in 2011.
As a result of this restructuring initiative, the existing facilities in Swainsboro, Norcross and Dawsonville will be sold. We assessed the fair value of the three facilities involved and remeasured to fair value two of them using third-party property appraisals or market-corroborated inputs. The amount of Level 2 long-lived assets measured at fair value on a non-recurring basis was $4,150. Impairment losses of $1,322 on the two facilities were recorded in goodwill and long-lived asset impairments on the Consolidated Statement of Income.
58
Notes to Consolidated Financial Statements - (Continued)
In order to optimize Adhesive Dispensing Systems segment operations in Germany, a restructuring initiative was taken that will result in severance costs of approximately $200. Of that amount, $32 was recorded in 2011. In addition, we assessed the fair value of a facility and remeasured it to fair value using a third party appraisal. The amount of Level 2 long-lived assets measured at fair value on a non-recurring basis was $932. An impairment loss of $489 was recorded in goodwill and long-lived asset impairments on the Consolidated Statement of Income.
Cost reduction activities were taken in 2008 through 2010 primarily in response to economic conditions and with the objective of improving operating efficiencies. Total severance and related costs of these actions were $23,986 of which $5,561 occurred in 2008, $16,396 occurred in 2009, and $2,029 occurred in 2010. The severance costs were recorded in the Corporate segment. Substanially all of the $923 accrual balance at October 31, 2010 was utilized in 2011.
Note 13 - Acquisitions
Business acquisitions have been accounted for as purchases, with the acquired assets and liabilities recorded at estimated fair value on the dates of acquisition. The cost in excess of the net assets of the business acquired is included in goodwill. Operating results after the respective dates of acquisitions are included in the Consolidated Statement of Income.
Value Plastics
On August 26, 2011, we acquired 100 percent of the outstanding shares of Value Plastics, a leading designer and manufacturer of precision engineered, plastic molded, single-use fluid connection components headquartered in Fort Collins, Colorado. Value Plastics' products are used primarily in critical flow control applications for healthcare and medical device markets. Cash, and proceeds from our revolving loan agreement and private shelf facility with NYLIM, were used for the purchase. Value Plastics supports our strategic objective of building upon our medical and life sciences platform and complements our growing positions in biomaterial delivery devices and medical device assembly. Our global reach and infrastructure will provide opportunities to leverage the business' profitable growth beyond its primary domestic markets served and into general industrial markets. Value Plastics is being reported in our Advanced Technology Systems segment.
The preliminary allocation of purchase price is shown in the table below. Although we do not expect changes, new information may be obtained about facts or circumstances that existed as of the acquisition date that, if known, would affect the measurement amounts recorded to date.
Fair values: | ||||
Assets acquired | $ | 26,647 | ||
Liabilities assumed | (18,930 | ) | ||
Intangible assets subject to amortization | 74,720 | |||
Goodwill | 179,050 | |||
|
| |||
| 261,487 | ||||
Less cash acquired | (3,108 | ) | ||
|
| |||
Purchase price | $ | 258,379 | ||
|
|
The intangible assets include customer relationships of $40,400 that will be amortized over 25 years, technology and know-how of $18,500 that will be amortized over 15 years and a tradename asset of $15,400 that will be amortized over 20 years. None of the goodwill associated with the Value Plastics acquisition is tax deductible; however, they had $15,600 of existing goodwill related to a previous acquisition that is tax deductible.
59
Notes to Consolidated Financial Statements - (Continued)
The following unaudited pro forma financial information for 2011 and 2010 assumes the acquisition occurred as of the beginning of 2010, after giving effect to certain adjustments, including amortization of intangible assets, interest expense on acquisition debt and income tax effects. The pro forma results have been prepared for comparative purposes only and are not necessarily indicative of the results of operations which may occur in the future or that would have occurred had the acquisition of Value Plastics been affected on the date indicated, nor are they necessarily indicative of our future results of operations.
Years ended October 31 | 2011 | 2010 | ||||||
Sales | $ | 1,259,127 | $ | 1,067,729 | ||||
Net income | $ | 224,934 | $ | 166,921 | ||||
Basic earnings per share | $ | 3.33 | $ | 2.47 | ||||
Diluted earnings per share | $ | 3.29 | $ | 2.44 | ||||
Proforma results for 2010 were adjusted to include $375 of acquisition-related expenses and $4,575 of nonrecurring expense related to the fair value adjustment to acquisition-date inventory. Proforma results for 2011 were adjusted to exclude $375 of acquisition-related expenses and $2,401 of nonrecurring expense related to the fair value adjustment to acquisition-date inventory. Proforma results for both years include $3,829 of pretax amortization expense related to Value Plastics' intangible assets.
Other 2011 acquisitions
On November 1, 2010, we acquired 100 percent of the outstanding shares of Micromedics, a St. Paul, Minnesota company that is a leader in applying and dispensing biomaterials for controlling bleeding, healing wounds and other related medical procedures. The acquisition date fair value of the consideration transferred, which consisted solely of cash, was $21,296. Based on the fair value of the assets acquired and the liabilities assumed, goodwill of $13,312 and identifiable intangible assets of $7,500 were recorded, of which customer relationships is the primary asset valued at $4,550 and amortized over 10 years. Goodwill associated with this acquisition is not tax deductible. Micromedics is being reported in our Advanced Technology Systems segment.
On June 30, 2011, we acquired 100% of the outstanding shares of Verbruggen, a Belgium manufacturer of flat dies and coextrusion equipment for the multi-layer flexible packaging industry. The acquisition date fair value of the consideration transferred, which consisted solely of cash, was $13,305. Based on the fair value of the assets acquired and the liabilities assumed, goodwill of $8,461 and identifiable intangible assets of $4,017 were recorded, of which customer relationships is the primary asset valued at $2,900 and amortized over 11 years. Goodwill associated with this acquisition is not tax deductible. Verbruggen is being reported in our Adhesive Dispensing Systems segment.
Assuming the Micromedics and Verbruggen acquisitions had taken place at the beginning of 2009, pro-forma results for 2011, 2010 and 2009 would not have been materially different.
2010 acquisition
On January 5, 2010, we acquired 100 percent of the outstanding shares of G L T Gesellschaft für Löttechnik mbH ("GLT"), a German distributor of EFD dispensing systems and related products. The acquisition date fair value of the consideration transferred, which consisted solely of cash, was $18,576. Based on the fair value of the assets acquired and the liabilities assumed, goodwill of $6,034 and identifiable intangible assets of $7,270 were recorded. The identifiable intangible assets consist primarily of $5,661 of customer relationships that are being amortized over 10 years. GLT is being reported in our Advanced Technology Systems segment. Assuming this acquisition had taken place at the beginning of 2009, pro-forma results for 2010 and 2009 would not have been materially different.
60
Notes to Consolidated Financial Statements - (Continued)
Note 14 - Divestiture
On June 30, 2010, we sold our UV Curing graphic arts and lamps product lines to Baldwin Technology Company, Inc. These product lines were reported in the Advanced Technology Systems segment. This divestiture did not qualify for discontinued operations treatment, because it was not a component of an entity, as its operations and cash flows were not clearly distinguished from the rest of the entity. During 2010, we recognized a pretax loss on disposition of $357, which is reflected in selling and administrative expenses in the Consolidated Statement of Income. We recognized a pre-tax impairment charge of $14,101 in 2009, including $12,129 of goodwill impairment, to write down the carrying amount of the assets held for sale to the estimated fair value less costs to sell. The tax benefit related to the write-off of our tax basis in the investment in these product lines is discussed in Note 4.
Note 15 - Supplemental information for the statement of cash flows
| 2011 | 2010 | 2009 | ||||||||||
Cash operating activities: | ||||||||||||
Interest paid | $ | 5,253 | $ | 6,518 | $ | 7,986 | ||||||
Income taxes paid | 96,487 | 21,526 | 24,893 | |||||||||
Non-cash investing and financing activities: | ||||||||||||
Capitalized lease obligations incurred | $ | 8,154 | $ | 5,468 | $ | 3,257 | ||||||
Capitalized lease obligations terminated | 534 | 721 | 2,376 | |||||||||
Shares acquired and issued through exercise of stock options | 5,228 | 5,151 | 73 | |||||||||
Note 16 - Operating segments and geographic area data
We conduct business in three primary operating segments: Adhesive Dispensing Systems, Advanced Technology Systems, and Industrial Coating Systems. Effective November 1, 2010, the Industrial Coating Systems segment includes our industrial UV Curing product line that had previously been reported in the Advanced Technology Systems segment, where it was combined with our former UV Curing graphic arts and lamps product lines that were sold in 2010. This change more closely reflects the change in management of this product line and its related growth opportunities. Prior year results have been reclassified to reflect the segment change.
The composition of segments and measure of segment profitability is consistent with that used by our chief operating decision maker. The primary measure used by the chief operating decision maker for purposes of making decisions about allocating resources to the segments and assessing performance is operating profit, which equals sales less cost of sales and certain operating expenses. Items below the operating profit line of the Consolidated Statement of Income (interest and investment income, interest expense and other income/expense) are excluded from the measure of segment profitability reviewed by our chief operating decision maker and are not presented by operating segment. In addition, the measure of segment operating profit that is reported to and reviewed by the chief operating decision maker excludes severance costs associated with the cost reduction program that began in 2008 and expense in 2011 related to the withdrawal from a multiemployer employee pension fund in Japan. The accounting policies of the segments are generally the same as those described in Note 1, Significant Accounting Policies.
No single customer accounted for five percent or more of sales in 2011, 2010 or 2009.
61
Notes to Consolidated Financial Statements - (Continued)
The following table presents information about our reportable segments:
| Adhesive Dispensing Systems | Advanced Technology Systems | Industrial Coating Systems | Corporate | Total | ||||||||||||||||
Year ended October 31, 2011 | ||||||||||||||||||||
Net external sales | $ | 611,911 | $ | 438,634 | $ | 182,614 | $ | - | $ | 1,233,159 | ||||||||||
Depreciation | 7,087 | 7,869 | 2,837 | 2,965 | 20,758 | |||||||||||||||
Operating profit | 210,350 | (a) | 114,903 | 26,977 | (36,687 | ) (b) | 315,543 | |||||||||||||
Identifiable assets (c) | 286,974 | 692,295 | 70,622 | 270,500 | 1,320,391 | |||||||||||||||
Expenditures for long-lived assets | 4,477 | 4,842 | 2,428 | 8,492 | 20,239 | |||||||||||||||
Year ended October 31, 2010 | ||||||||||||||||||||
Net external sales | $ | 525,290 | $ | 369,449 | $ | 146,812 | $ | - | $ | 1,041,551 | ||||||||||
Depreciation | 8,014 | 7,641 | 2,851 | 4,119 | 22,625 | |||||||||||||||
Operating profit (loss) | 166,255 | 84,247 | 14,588 | (30,257 | ) (b) | 234,833 | ||||||||||||||
Identifiable assets (c) | 251,881 | 477,563 | 61,256 | 206,663 | (d) | 997,363 | ||||||||||||||
Expenditures for long-lived assets | 1,857 | 2,792 | 548 | 9,120 | 14,317 | |||||||||||||||
Year ended October 31, 2009 | ||||||||||||||||||||
Net external sales | $ | 460,746 | $ | 242,247 | $ | 116,172 | $ | - | $ | 819,165 | ||||||||||
Depreciation | 9,087 | 7,268 | 3,326 | 6,629 | 26,310 | |||||||||||||||
Operating profit | 127,589 | (214,781 | ) (e) | (6,895 | ) (e) | (33,720 | ) (b) | (127,807 | ) | |||||||||||
Identifiable assets (c) | 226,904 | 448,196 | 53,176 | 168,686 | (d) | 896,962 | ||||||||||||||
Expenditures for long-lived assets | 1,922 | 7,089 | 865 | 2,638 | 12,514 | |||||||||||||||
| (a) | Includes $1,811 of impairment charges related to write down of assets to fair value, and $1,589 of severance charges and other termination fees. |
| (b) | Includes $3,120 of expense related to the withdrawal from a multiemployer employee pension fund in Japan in 2011 and severance charges of $2,029 and $16,396 in 2010 and 2009, respectively. |
| (c) | Includes notes and accounts receivable net of customer advance payments and allowance for doubtful accounts, inventories net of reserves, property, plant and equipment net of accumulated depreciation and goodwill. |
| (d) | Corporate assets are principally cash and cash equivalents, deferred income taxes, investments, capital leases, headquarter facilities, the major portion of our enterprise management system, and intangible assets. |
| (e) | Includes goodwill and long-lived asset impairments of $239,427 in the Advanced Technology Systems segment and $3,616 in the Industrial Coating Systems segment. |
62
Notes to Consolidated Financial Statements - (Continued)
We have significant sales and long-lived assets in the following geographic areas:
| 2011 | 2010 | 2009 | ||||||||||
Net external sales | ||||||||||||
United States | $ | 312,328 | $ | 273,652 | $ | 234,038 | ||||||
Americas | 102,077 | 78,058 | 60,632 | |||||||||
Europe | 390,319 | 336,119 | 294,951 | |||||||||
Japan | 111,003 | 93,318 | 81,678 | |||||||||
Asia Pacific | 317,432 | 260,404 | 147,866 | |||||||||
|
|
|
|
|
| |||||||
Total net external sales | $ | 1,233,159 | $ | 1,041,551 | $ | 819,165 | ||||||
|
|
|
|
|
| |||||||
Long-lived assets | ||||||||||||
United States | $ | 90,994 | $ | 80,974 | $ | 79,675 | ||||||
Americas | 2,933 | 1,865 | 1,703 | |||||||||
Europe | 16,312 | 13,401 | 15,329 | |||||||||
Japan | 3,496 | 3,587 | 3,257 | |||||||||
Asia Pacific | 17,148 | 16,568 | 18,327 | |||||||||
|
|
|
|
|
| |||||||
Total long-lived assets | $ | 130,883 | $ | 116,395 | $ | 118,291 | ||||||
|
|
|
|
|
| |||||||
Sales in 2010 and 2009 include reclassification adjustments primarily into Asia Pacific from the United States based on more accurate end-user destination information for products sold by our Advanced Technology Systems segment to certain global customers.
A reconciliation of total segment operating income to total consolidated income before income taxes is as follows:
| 2011 | 2010 | 2009 | ||||||||||
Total profit (loss) for reportable segments | $ | 315,543 | $ | 234,833 | $ | (127,807 | ) | |||||
Interest expense | (5,069 | ) | (6,263 | ) | (7,771 | ) | ||||||
Interest and investment income | 569 | 819 | 492 | |||||||||
Other-net | 3,518 | 1,930 | 7,895 | |||||||||
|
|
|
|
|
| |||||||
Income (loss) before income taxes | $ | 314,561 | $ | 231,319 | $ | (127,191 | ) | |||||
|
|
|
|
|
| |||||||
A reconciliation of total assets for reportable segments to total consolidated assets is as follows:
| 2011 | 2010 | 2009 | ||||||||||
Total assets for reportable segments | $ | 1,320,391 | $ | 997,363 | $ | 896,962 | ||||||
Customer advance payments | 9,375 | 10,999 | 8,807 | |||||||||
Eliminations | (25,316 | ) | (22,008 | ) | (15,095 | ) | ||||||
|
|
|
|
|
| |||||||
Total consolidated assets | $ | 1,304,450 | $ | 986,354 | $ | 890,674 | ||||||
|
|
|
|
|
| |||||||
63
Notes to Consolidated Financial Statements - (Continued)
Note 17 - Goodwill and intangible assets
Goodwill is the excess of purchase price over the fair value of tangible and identifiable intangible net assets acquired in various business combinations. Goodwill is not amortized but is tested for impairment annually at the reporting unit level, or more often if indications of impairment exist. We assess the fair value of reporting units on a non-recurring basis using a combination of two valuation methods, a market approach and an income approach, to estimate the fair value of our reporting units. The implied fair value of our reporting units is determined based on significant unobservable inputs; accordingly, these inputs fall within Level 3 of the fair value hierarchy.
Our reporting units are the Adhesive Dispensing Systems segment, the Industrial Coating Systems segment and one level below the Advanced Technology Systems segment.
The goodwill impairment test is a two-step process. In the first step, performed in the fourth quarter of each year, we calculate a fair value using a discounted cash flow valuation methodology and compare the result against the carrying value for net assets of each reporting unit. Indications of value derived for each reporting unit using the market approach are corroborated with the results of the discounted cash flow approach. If the carrying value of a reporting unit exceeds its fair value, then a second step is performed to determine if goodwill is impaired. In the second step, a hypothetical purchase price allocation of the reporting unit's assets and liabilities is performed using the fair value calculated in step one. The difference between the fair value of the reporting unit and the hypothetical fair value of assets and liabilities is the implied goodwill amount. Impairment is recorded if the carrying value of the reporting unit's goodwill is higher than its implied goodwill. Based upon results of step one in 2011 and 2010, the second step of the goodwill impairment test was not necessary.
We acquired Value Plastics on August 26, 2011, subsequent to the measurement date for impairment testing. Determination of the preliminary fair value associated with this acquisition was completed with the assistance of an independent valuation specialist on October 5, 2011. Since the date of valuation, no events or changes in circumstances have occurred that would more likely than not reduce the fair value of Value Plastics below its carrying value. For future valuation purposes, Value Plastics will be a component of EFD.
In 2009, the second step of the goodwill impairment test was performed and we recognized an impairment charge related to a reduction in the carrying value of goodwill in the amount of $232,789, relating to six reporting units as follows: Dage $166,916, Picodostec $7,530, YESTech $26,149, March Plasma Systems $16,449, UV Curing $12,129, and Industrial Coating Systems $3,616. These amounts represented the accumulated impairment losses at October 31, 2011 and 2010.
On November 1, 2010 we completed the acquisition of Micromedics that resulted in $13,312 of goodwill. On June 30, 2011 we completed the acquisition of Verbruggen that resulted in $8,461 of goodwill. On August 26, 2011, we completed the acquisition of Value Plastics that resulted in $179,050 of goodwill.
Changes in the carrying amount of goodwill during 2011 by operating segment follow:
| Adhesive Dispensing Systems | Advanced Technology Systems | Industrial Coating Systems | Total | |||||||||||||
Balance at October 31, 2010 | $ | 33,783 | $ | 313,543 | $ | - | $ | 347,326 | ||||||||
Acquisitions/Adjustment | 8,638 | 192,362 | - | 201,000 | ||||||||||||
Currency effect | (459 | ) | (41 | ) | - | (500 | ) | |||||||||
|
|
|
|
|
|
|
| |||||||||
Balance at October 31, 2011 | $ | 41,962 | $ | 505,864 | $ | - | $ | 547,826 | ||||||||
|
|
|
|
|
|
|
| |||||||||
64
Notes to Consolidated Financial Statements - (Continued)
Information regarding intangible assets subject to amortization follows:
| October 31, 2011 | ||||||||||||
| Carrying Amount | Accumulated Amortization | Net Book Value | ||||||||||
Patent/technology costs | $ | 43,235 | $ | 11,571 | $ | 31,664 | ||||||
Customer relationships | 78,324 | 11,843 | 66,481 | |||||||||
Noncompete agreements | 5,042 | 3,727 | 1,315 | |||||||||
Trade name | 22,143 | 1,530 | 20,613 | |||||||||
Other | 1,437 | 811 | 626 | |||||||||
|
|
|
|
|
| |||||||
Total | $ | 150,181 | $ | 29,482 | $ | 120,699 | ||||||
|
|
|
|
|
| |||||||
| October 31, 2010 | ||||||||||||
| Carrying Amount | Accumulated Amortization | Net Book Value | ||||||||||
Patent/technology costs | $ | 23,429 | $ | 9,084 | $ | 14,345 | ||||||
Customer relationships | 30,630 | 8,273 | 22,357 | |||||||||
Noncompete agreements | 5,982 | 4,857 | 1,125 | |||||||||
Trade name | 1,684 | 479 | 1,205 | |||||||||
Other | 1,432 | 636 | 796 | |||||||||
|
|
|
|
|
| |||||||
Total | $ | 63,157 | $ | 23,329 | $ | 39,828 | ||||||
|
|
|
|
|
| |||||||
In 2010 and 2009, indefinite-lived intangible assets consisted of trademarks and trade names. These assets were not subject to amortization but needed to be tested for impairment annually or more often if indications of impairment existed. The impairment test consisted of a comparison of the fair value of the intangible asset with its carrying amount. If the carrying amount of an intangible asset exceeded its fair value, an impairment charge was recognized in an amount equal to that excess. After an impairment charge was recognized, the adjusted carrying amount of the intangible asset became its new accounting basis. Subsequent reversal of a previously recognized impairment charge is prohibited.
The common valuation technique for determining the fair value of trademark and trade names is the "relief from royalty method" which is based on significant unobservable inputs; accordingly, these inputs fall within Level 3 of the fair value hierarchy. The theory is that these assets relieve the owner from having to pay a hypothetical royalty attributable to an exclusive license for selling products under the trademark or trade name. The value of the hypothetical exclusive license is based upon the present value of a stream of hypothetical royalty payments, using assumptions for revenue growth (the same as for goodwill testing), discount rates (slightly more risk premium than for goodwill testing), royalty rates (based on market data), and tax amortization benefits (based upon statutory guidance). No impairment charges were recorded in 2010. In 2009, this testing resulted in impairment charges totaling $8,282 as follows by reporting unit: Dage $5,365, Picodostec $157, YESTech $350, and TAH Industries $2,410. The charge for the TAH trade name was due to our branding program, under which TAH product lines are being integrated into and marketed as "Nordson EFD" over the next several years. Accordingly, the TAH trade name was converted to a finite-lived asset.
At October 31, 2010, $3,099 of trademark and trade name intangible assets were not subject to amortization. Effective November 1, 2010, the Dage trade name was converted from an indefinite lived asset to a finite lived asset with a remaining life of 20 years.
Amortization expense for 2011 and 2010 was $8,018 and $6,263, respectively.
65
Notes to Consolidated Financial Statements - (Continued)
Estimated amortization expense for each of the five succeeding years follows:
Year | Amounts | |||
2012 | $ | 10,359 | ||
2013 | $ | 9,713 | ||
2014 | $ | 8,881 | ||
2015 | $ | 8,330 | ||
2016 | $ | 7,793 | ||
Note 18 - Fair value measurements
The inputs to the valuation techniques used to measure fair value are classified into the following categories:
Level 1: Quoted market prices in active markets for identical assets or liabilities.
Level 2: Observable market based inputs or unobservable inputs that are corroborated by market data.
Level 3: Unobservable inputs that are not corroborated by market data.
The following table presents the classification of our assets and liabilities measured at fair value on a recurring basis at October 31, 2011:
| Total | Level 1 | Level 2 | Level 3 | |||||||||||||
Assets: | ||||||||||||||||
Rabbi trust (a) | $ | 13,678 | $ | - | $ | 13,678 | $ | - | ||||||||
Forward exchange contracts (b) | 1,401 | - | 1,401 | - | ||||||||||||
|
|
|
|
|
|
|
| |||||||||
Total assets at fair value | $ | 15,079 | $ | - | $ | 15,079 | $ | - | ||||||||
|
|
|
|
|
|
|
| |||||||||
Liabilities: | ||||||||||||||||
Deferred compensation plans (c) | $ | 6,278 | $ | 6,278 | $ | - | $ | - | ||||||||
Forward exchange contracts (b) | 1,025 | - | 1,025 | - | ||||||||||||
|
|
|
|
|
|
|
| |||||||||
Total liabilities at fair value | $ | 7,303 | $ | 6,278 | $ | 1,025 | $ | - | ||||||||
|
|
|
|
|
|
|
| |||||||||
| (a) | We maintain a rabbi trust that serves as an investment to shadow our deferred compensation plan liability. The investment assets of the trust consist of life insurance policies for which we recognize income or expense based upon changes in cash surrender value. |
| (b) | We enter into foreign currency forward contracts to reduce the risk of foreign currency exposures resulting from receivables, payables, intercompany receivables, intercompany payables and loans denominated in foreign currencies. The maturities of these contracts are usually less than 90 days. Foreign exchange contracts are valued using market exchange rates. These foreign exchange contracts are not designated as hedges. |
| (c) | Senior management and other highly compensated employees may defer up to 100 percent of their salary and incentive compensation into various non-qualified deferred compensation plans. Deferrals can be allocated to various market performance measurement funds. Changes in the value of compensation deferred under these plans are recognized each period based on the fair value of the underlying measurement funds. |
Fair value disclosures related to impairments of long-lived assets are disclosed in Note 12, and fair value disclosures related to goodwill and indefinite-lived intangible assets are disclosed in Note 17.
66
Notes to Consolidated Financial Statements - (Continued)
Note 19 - Quarterly financial data (unaudited)
| First | Second | Third | Fourth | |||||||||||||
2011: | ||||||||||||||||
Sales | $ | 270,962 | $ | 318,924 | $ | 312,255 | $ | 331,018 | ||||||||
Gross margin | 166,171 | 197,752 | 188,050 | 196,459 | ||||||||||||
Net income | 45,897 | 65,242 | 56,550 | 54,675 | ||||||||||||
Earnings per share: | ||||||||||||||||
Basic | 0.67 | 0.96 | 0.83 | 0.82 | ||||||||||||
Diluted | 0.67 | 0.95 | 0.82 | 0.81 | ||||||||||||
2010: | ||||||||||||||||
Sales | $ | 220,589 | $ | 251,659 | $ | 279,121 | $ | 290,182 | ||||||||
Gross margin | 131,675 | 153,867 | 165,801 | 170,271 | ||||||||||||
Net income | 26,732 | 32,431 | 55,329 | 53,556 | ||||||||||||
Earnings per share: | ||||||||||||||||
Basic | 0.40 | 0.48 | 0.81 | 0.79 | ||||||||||||
Diluted | 0.39 | 0.47 | 0.80 | 0.78 | ||||||||||||
The sum of the per-share amounts for the four quarters of 2011 and 2010 do not equal the annual per-share amounts due to differences in the average number of shares outstanding during the respective periods.
During the first quarter of 2011, net income tax benefits of $1,242 were recorded as a result of the Tax Relief, Unemployment Insurance Reauthorization, and Job Creation Act of 2010 that was passed by the U.S. Congress and signed by the President in December 2010. During the third quarter of 2011, a favorable adjustment to unrecognized tax benefits primarily related to settlements with tax authorities reduced income taxes by $2,027. The third quarter also included expense of $3,136 related to a fee paid to withdraw from a multiemployer employee pension fund in Japan.
During the first quarter of 2010, net income tax benefits of $3,500 were recorded as a result of the consolidation of certain operations and legal entities. During the second quarter of 2010, an additional tax charge of $5,255 was recorded resulting from the enactment of the Patient Protection and Affordable Care Act and the subsequent enactment of the Health Care and Education Reconciliation Act of 2010. The charge was due to a reduction in the value of our deferred tax asset as a result of a change to the tax treatment associated with Medicare Part D subsidies. During the third quarter of 2010, a tax benefit of $10,700 was recognized as a result of the write-off of the tax basis of the UV graphic arts business sold on June 30, 2010.
67
Notes to Consolidated Financial Statements - (Continued)
Note 20 - Contingencies
We are involved in pending or potential litigation regarding environmental, product liability, patent, contract, employee and other matters arising from the normal course of business. Including the environmental matter discussed below, it is our opinion, after consultation with legal counsel, that resolutions of these matters are not expected to result in a material effect on our financial condition, quarterly or annual operating results or cash flows.
Environmental - We have voluntarily agreed with the City of New Richmond, Wisconsin and other Potentially Responsible Parties to share costs associated with the remediation of the City of New Richmond municipal landfill (the "Site") and constructing a potable water delivery system serving the impacted area down gradient of the Site. At October 31, 2011, and 2010 our accrual for the ongoing operation, maintenance and monitoring obligation at the Site was $795 and $885, respectively. The liability for environmental remediation represents management's best estimate of the probable and reasonably estimable undiscounted costs related to known remediation obligations. The accuracy of our estimate of environmental liability is affected by several uncertainties such as additional requirements that may be identified in connection with remedial activities, the complexity and evolution of environmental laws and regulations, and the identification of presently unknown remediation requirements. Consequently, our liability could be greater than our current estimate. However, we do not expect that the costs associated with remediation will have a material adverse effect on our financial condition or results of operations.
Note 21 - Subsequent events
On December 9, 2011 we entered into a $500,000 unsecured multicurrency credit facility with a group of banks. This facility has a five-year term and includes a $40,000 subfacility for swing-line loans. It may be increased from $500,000 to $750,000 under certain conditions. The new facility contains customary events of default and covenants related to limitations on indebtedness and the maintenance of certain financial ratios. It replaced our existing revolving loan agreement that was scheduled to expire in 2012. Balances outstanding under the prior facility were transferred to the new facility.
68
Management's Report on Internal Control Over Financial Reporting
The management of Nordson Corporation is responsible for establishing and maintaining adequate internal control over financial reporting.
Using criteria set forth by the Committee of Sponsoring Organizations of the Treadway Commission (COSO) in Internal Control-Integrated Framework, Nordson's management assessed the effectiveness of our internal control over financial reporting as of October 31, 2011.
Based on our assessment, management concluded that our internal control over financial reporting was effective as of October 31, 2011.
The independent registered public accounting firm, Ernst & Young LLP, has also audited the effectiveness of our internal control over financial reporting as of October 31, 2011. Their report is included herein.
/s/ M ICHAEL F. H ILTON | /s/ G REGORY A. T HAXTON | |||
| President and Chief Executive Officer | Senior Vice President, Chief Financial Officer | |||
| December 16, 2011 | December 16, 2011 |
69
Report of Independent Registered Public Accounting Firm
The Board of Directors and Shareholders of Nordson Corporation
We have audited Nordson Corporation's internal control over financial reporting as of October 31, 2011, based on criteria established in Internal Control - Integrated Framework issued by the Committee of Sponsoring Organizations of the Treadway Commission (the COSO criteria). Nordson Corporation's management is responsible for maintaining effective internal control over financial reporting, and for its assessment of the effectiveness of internal control over financial reporting included in the accompanying "Management's Report on Internal Control Over Financial Reporting". Our responsibility is to express an opinion on the company's internal control over financial reporting based on our audit.
We conducted our audit in accordance with the standards of the Public Company Accounting Oversight Board (United States). Those standards require that we plan and perform the audit to obtain reasonable assurance about whether effective internal control over financial reporting was maintained in all material respects. Our audit included obtaining an understanding of internal control over financial reporting, assessing the risk that a material weakness exists, testing and evaluating the design and operating effectiveness of internal control based on the assessed risk, and performing such other procedures as we considered necessary in the circumstances. We believe that our audit provides a reasonable basis for our opinion.
A company's internal control over financial reporting is a process designed to provide reasonable assurance regarding the reliability of financial reporting and the preparation of financial statements for external purposes in accordance with generally accepted accounting principles. A company's internal control over financial reporting includes those policies and procedures that (1) pertain to the maintenance of records that, in reasonable detail, accurately and fairly reflect the transactions and dispositions of the assets of the company; (2) provide reasonable assurance that transactions are recorded as necessary to permit preparation of financial statements in accordance with generally accepted accounting principles, and that receipts and expenditures of the company are being made only in accordance with authorizations of management and directors of the company; and (3) provide reasonable assurance regarding prevention or timely detection of unauthorized acquisition, use, or disposition of the company's assets that could have a material effect on the financial statements.
Because of its inherent limitations, internal control over financial reporting may not prevent or detect misstatements. Also, projections of any evaluation of effectiveness to future periods are subject to the risk that controls may become inadequate because of changes in conditions, or that the degree of compliance with the policies or procedures may deteriorate.
In our opinion, Nordson Corporation maintained, in all material respects, effective internal control over financial reporting as of October 31, 2011, based on the COSO criteria.
We also have audited, in accordance with the standards of the Public Company Accounting Oversight Board (United States), the consolidated balance sheets of Nordson Corporation as of October 31, 2011 and 2010, and the related consolidated statements of income, shareholders' equity, and cash flows for each of the three years in the period ended October 31, 2011 of Nordson Corporation and our report dated December 16, 2011 expressed an unqualified opinion thereon.
 |
Cleveland, Ohio
December 16, 2011
70
Report of Independent Registered Public Accounting Firm
The Board of Directors and Shareholders of Nordson Corporation
We have audited the accompanying consolidated balance sheets of Nordson Corporation as of October 31, 2011 and 2010 and the related consolidated statements of income, shareholders' equity, and cash flows for each of the three years in the period ended October 31, 2011. Our audits also included the financial statement schedule listed in the Index at Item 15(a). These financial statements and schedule are the responsibility of the Company's management. Our responsibility is to express an opinion on these financial statements and schedule based on our audits.
We conducted our audits in accordance with the standards of the Public Company Accounting Oversight Board (United States). Those standards require that we plan and perform the audit to obtain reasonable assurance about whether the financial statements are free of material misstatement. An audit includes examining, on a test basis, evidence supporting the amounts and disclosures in the financial statements. An audit also includes assessing the accounting principles used and significant estimates made by management, as well as evaluating the overall financial statement presentation. We believe that our audits provide a reasonable basis for our opinion.
In our opinion, the financial statements referred to above present fairly, in all material respects, the consolidated financial position of Nordson Corporation at October 31, 2011 and 2010, and the consolidated results of its operations and its cash flows for each of the three years in the period ended October 31, 2011, in conformity with U.S. generally accepted accounting principles. Also, in our opinion, the related financial statement schedule, when considered in relation to the basic financial statements taken as a whole, presents fairly in all material respects the information set forth therein.
We also have audited, in accordance with the standards of the Public Company Accounting Oversight Board (United States), Nordson Corporation's internal control over financial reporting as of October 31, 2011, based on criteria established in Internal Control-Integrated Framework issued by the Committee of Sponsoring Organizations of the Treadway Commission and our report dated December 16, 2011 expressed an unqualified opinion thereon.
| |
Cleveland, Ohio
December 16, 2011
71
| Item 9. | Changes in and Disagreements With Accountants on Accounting and Financial Disclosure |
None.
| Item 9A. | Controls and Procedures |
(a) Evaluation of disclosure controls and procedures. Our management, with the participation of the principal executive officer (president and chief executive officer) and the principal financial officer (vice president, chief financial officer), has reviewed and evaluated our disclosure controls and procedures (as defined in the Securities Exchange Act Rule 13a-15e) as of October 31, 2011. Based on that evaluation, our management, including the principal executive and financial officers, has concluded that our disclosure controls and procedures were effective as of October 31, 2011 in ensuring that information required to be disclosed in the reports that we file or submit under the Securities Exchange Act of 1934 is recorded, processed, summarized and reported within the time periods specified in the SEC's rules and forms and is accumulated and communicated to our management, including the principal executive officer and the principal financial officer, as appropriate to allow timely decisions regarding required disclosure.
(b) Management's report on internal control over financial reporting . The Report of Management on Internal Control over Financial Reporting and the Report of Independent Registered Public Accounting Firm thereon are set forth in Part II, Item 8 of this Annual Report on Form 10-K.
(c) Changes in internal control over reporting . There were no changes in our internal controls over financial reporting that occurred during the fourth quarter of 2011 that have materially affected, or are reasonably likely to materially affect, our internal control over financial reporting.
| Item 9B. | Other Information |
None.
PART III
| Item 10. | Directors, Executive Officers and Corporate Governance |
The information required by this Item is incorporated by reference to the captions "Election of Directors" and "Section 16(a) Beneficial Ownership Reporting Compliance" of our definitive Proxy Statement for the 2012 Annual Meeting of Shareholders. Information regarding Audit Committee financial experts is incorporated by reference to the caption "Election of Directors" of our definitive Proxy Statement for the 2012 Annual Meeting of Shareholders.
Our executive officers serve for a term of one year from date of election to the next organizational meeting of the board of directors and until their respective successors are elected and qualified, except in the case of death, resignation or removal. Information concerning executive officers is contained in Part I of this report under the caption "Executive Officers of the Company."
We have adopted a code of ethics for all employees and directors, including the principal executive officer, other executive officers, principal finance officer and other finance personnel. A copy of the code of ethics is available free of charge on our Web site at http://www.nordson.com/governance. We intend to satisfy our disclosure requirement under Item 5.05 of Form 8-K regarding any amendment to or waiver of a provision of our code of ethics that applies to our principal executive officer, principal financial officer, principal accounting officer or controller or persons performing similar functions and that relates to any element of the code of ethics definition enumerated in Item 406(b) of Regulation S-K by posting such information on our Web site.
72
| Item 11. | Executive Compensation |
The information required by this Item is incorporated by reference to the captions "Directors Compensation for Fiscal Year 2011," "Summary Compensation for Fiscal Year 2011," "Grants of Plan-Based Awards for Fiscal Year 2011," "Option Exercises and Stock Vested for Fiscal Year 2011," "Pension Benefits for Fiscal Year 2011," "Nonqualified Deferred Compensation for Fiscal Year 2011" and "Potential Payments Upon Termination or Change of Control" in our definitive Proxy Statement for the 2012 Annual Meeting of Shareholders.
| Item 12. | Security Ownership of Certain Beneficial Owners and Management and Related Stockholder Matters |
The information required by this Item is incorporated by reference to the caption "Ownership of Nordson Common Shares" in our definitive Proxy Statement for the 2012 Annual Meeting of Shareholders.
Equity Compensation Table
The following table sets forth information regarding equity compensation plans in effect as of October 31, 2011.
Plan category | Number of securities to be issued upon exercise of outstanding options, warrants and rights | Weighted-average exercise price of outstanding options, warrants and rights | Number of securities remaining available for future issuance under equity compensation plans (excluding securities reflected in first reporting column) | |||||||||
Equity compensation plans approved by security holders | 1,851 | $24.22 | 1,640 | |||||||||
Equity compensation plans not approved by security holders | - | - | - | |||||||||
|
|
|
|
|
| |||||||
Total | 1,851 | $24.22 | 1,640 | |||||||||
|
|
|
|
|
| |||||||
The number of Common Shares available for grant is 2.5 percent of the number of Common Shares outstanding as of the first day of each year.
| Item 13. | Certain Relationships and Related Transactions, and Director Independence |
The information required by this Item is incorporated by reference to the caption "Review of Transactions with Related Persons" in our definitive Proxy Statement for the 2012 Annual Meeting of Shareholders.
| Item 14. | Principal Accountant Fees and Services |
The information required by this Item is incorporated by reference to the caption "Fees Paid to Ernst and Young LLP" in our definitive Proxy Statement for the 2012 Annual Meeting of Shareholders.
73
PART IV
| Item 15. | Exhibits and Financial Statement Schedule |
The following are filed as part of this report:
(a) 1. Financial Statements
The following financial statements are included in Part II, Item 8:
Consolidated Statements of Income for each of the three years in the period ending October 31, 2011
Consolidated Balance Sheets as of October 31, 2011 and October 31, 2010
Consolidated Statements of Shareholders' Equity for each of the three years in the period ending October 31, 2011
Consolidated Statements of Cash Flows for each of the three years in the period ending October 31, 2011
Notes to Consolidated Financial Statements
Reports of Independent Registered Public Accounting Firm
(a) 2. Financial Statement Schedule
Schedule II Valuation and Qualifying Accounts and Reserves for each of the three years in the period ending October 31, 2011.
No other consolidated financial statement schedules are presented because the schedules are not required, because the required information is not present or not present in amounts sufficient to require submission of the schedule, or because the information required is included in the financial statements, including the notes thereto.
(a) 3. Exhibits
The exhibits listed on the accompanying index to exhibits are filed as part of this Annual Report on Form 10-K.
74
Signatures
Pursuant to the requirements of Section 13 or 15(d) of the Securities Exchange Act of 1934, the Registrant has duly caused this report to be signed on its behalf by the undersigned, thereunto duly authorized.
NORDSON CORPORATION
Date: December 16, 2011
By: /s/ G REGORY A. T HAXTON |
Gregory A. Thaxton |
Senior Vice President, Chief Financial Officer |
Pursuant to the requirements of the Securities Exchange Act of 1934, this report has been signed below by the following persons on behalf of the Registrant and in the capacities and on the dates indicated.
/s/ M ICHAEL F. H ILTON | December 16, 2011 | |||
Michael F. Hilton | ||||
Director, President and | ||||
Chief Executive Officer | ||||
(Principal Executive Officer) | ||||
/s/ G REGORY A. T HAXTON | December 16, 2011 | |||
Gregory A. Thaxton | ||||
Senior Vice President, Chief Financial Officer | ||||
(Principal Financial Officer) | ||||
(Principal Accounting Officer) | ||||
/s/ J OSEPH P. K EITHLEY | December 16, 2011 | |||
Joseph P. Keithley | ||||
Chairman of the Board | ||||
/s/ L EE C. B ANKS | December 16, 2011 | |||
Lee C. Banks | ||||
Director | ||||
/s/ R ANDOLPH W. C ARSON | December 16, 2011 | |||
Randolph W. Carson | ||||
Director | ||||
/s/ D R . D AVID W. I GNAT | December 16, 2011 | |||
Dr. David W. Ignat | ||||
Director | ||||
/s/ M ICHAEL J. M ERRIMAN , J R . | December 16, 2011 | |||
Michael J. Merriman, Jr. | ||||
Director | ||||
/s/ M ARY G. P UMA | December 16, 2011 | |||
Mary G. Puma | ||||
Director |
75
Signatures - Continued
/s/ V ICTOR L. R ICHEY , J R . | December 16, 2011 | |||
Victor L. Richey, Jr. | ||||
Director | ||||
/s/ W ILLIAM L. R OBINSON | December 16, 2011 | |||
William L. Robinson | ||||
Director |
76
Schedule II - Valuation and Qualifying Accounts and Reserves
| Balance
at Beginning of Year | Assumed from Acquisitions | Charged to Expense | Deductions | Currency Effects | Balance at End of Year | |||||||||||||||||||
Allowance for Doubtful Accounts | ||||||||||||||||||||||||
2009 | $ | 3,067 | - | 1,998 | 1,654 | 317 | $ | 3,728 | ||||||||||||||||
2010 | $ | 3,728 | 6 | 607 | 901 | (87 | ) | $ | 3,353 | |||||||||||||||
2011 | $ | 3,353 | 22 | 977 | 1,047 | 6 | $ | 3,311 | ||||||||||||||||
Inventory Obsolescence and Other Reserves | ||||||||||||||||||||||||
2009 | $ | 13,133 | - | 5,654 | 4,234 | 1,187 | $ | 15,740 | ||||||||||||||||
2010 | $ | 15,740 | 187 | 4,233 | 3,061 | (297 | ) | $ | 16,802 | |||||||||||||||
2011 | $ | 16,802 | 8 | 3,982 | 4,850 | 108 | $ | 16,050 | ||||||||||||||||
77
NORDSON CORPORATION
Index to Exhibits
(Item 15(a) (3))
Exhibit | Description | |
| (3) | Articles of Incorporation and By-Laws | |
| 3-a | 1989 Amended Articles of Incorporation | |
| 3-a-1 | Certificate of Amendment to 1989 Amended Articles of Incorporation | |
| 3-b | 1998 Amended Regulations (incorporated herein by reference to Exhibit 3-b to Registrant's Annual Report on Form 10-K for the year ended October 31, 2010) | |
| (4) | Instruments Defining the Rights of Security Holders, including indentures | |
| 4-a | $400 million Credit Agreement dated July 13, 2007 between Nordson Corporation and various financial institutions (incorporated herein by reference to Exhibit 10.1 to Registrant's Form 8-K dated July 16, 2007) | |
| 4-b | $100 million Senior Note Purchase Agreement dated May 15, 2001 between Nordson Corporation and various insurance companies (incorporated herein by reference to Exhibit 4-c to Registrant's Annual Report on Form 10-K for the year ended October 31, 2006) | |
| 4-c | Note Purchase and Private Shelf Agreement dated February 22, 2008 between Nordson Corporation and Prudential Investment Management, Inc. (incorporated herein by reference to Exhibit 10.1 to Registrant's Form 8-K dated February 25, 2008) | |
| 4-d | Note Purchase and Private Shelf Agreement for $150 million between Nordson Corporation and New York Life Investment Management LLC dated as of June 30, 2011 (incorporated herein by reference to Exhibit 4.1 to Registrant's Quarterly Report on Form 10-Q for the quarter ended July 31, 2011) | |
| 4-e | $500 million Credit Agreement dated December 9, 2011 between Nordson Corporation and various financial institutions (incorporated herein by reference to Exhibit 4.1 to Registrant's Form 8-K dated December 12, 2011) | |
| (10) | Material Contracts | |
| 10-a | Amended and Restated Nordson Corporation 2004 Management Incentive Compensation Plan (incorporated herein by reference to Exhibit 10.1 to Registrant's Form 8-K dated February 25, 2008)* | |
| 10-b | Nordson Corporation Deferred Compensation Plan (incorporated herein by reference to Exhibit 10-b to Registrant's Annual Report on Form 10-K for the year ended October 31, 2006)* | |
| 10-b-1 | Nordson Corporation 2005 Deferred Compensation Plan (incorporated herein by reference to Exhibit 10-b-1 to Registrant's Annual Report on Form 10-K for the year ended October 31, 2010)* | |
| 10-b-2 | Nordson Corporation 2005 Deferred Compensation Plan (as Amended and Restated Effective January 1, 2009) (incorporated herein by reference to Exhibit 10.01-a to Registrant's Form 8-K dated December 16, 2008)* | |
| 10-c | Indemnity Agreement (incorporated herein by reference to Exhibit 10-c to Registrant's Annual Report on Form 10-K for the year ended October 31, 2007)* | |
| 10-d | Restated Nordson Corporation Excess Defined Contribution Retirement Plan Agreement (incorporated herein by reference to Exhibit 10-d to Registrant's Annual Report on Form 10-K for the year ended October 31, 2009)* | |
| 10-d-1 | First Amendment to Nordson Corporation Excess Defined Contribution Retirement Plan (incorporated herein by reference to Exhibit 10-d-1 to Registrant's Annual Report on Form 10-K for the year ended October 31, 2006)* | |
| 10-d-2 | Nordson Corporation 2005 Excess Defined Contribution Benefit Plan* | |
| 10-d-3 | Nordson Corporation 2005 Excess Defined Contribution Retirement Plan (as Amended and Restated Effective January 1, 2009) (incorporated herein by reference to Exhibit 10.01-c to Registrant's Form 8-K dated December 16, 2008)* |
78
Index to Exhibits - Continued
Exhibit | Description | |
| 10-e | Nordson Corporation Excess Defined Benefit Pension Plan (incorporated herein by reference to Exhibit 10-d to Registrant's Annual Report on Form 10-K for the year ended October 31, 2009)* | |
| 10-e-1 | Second Amendment to Nordson Corporation Excess Defined Benefit Pension Plan (incorporated herein by reference to Exhibit 10-e-1 to Registrant's Annual Report on Form 10-K for the year ended October 31, 2006)* | |
| 10-e-2 | Nordson Corporation 2005 Excess Defined Benefit Pension Plan (incorporated herein by reference to Exhibit 10-e-2 to Registrant's Annual Report on Form 10-K for the year ended October 31, 2010)* | |
| 10-e-3 | Nordson Corporation 2005 Excess Defined Benefit Pension Plan (as Amended and Restated Effective January 1, 2009) (incorporated herein by reference to Exhibit 10.01-b to Registrant's Form 8-K dated December 16, 2008)* | |
| 10-g | Nordson Corporation 1993 Long-Term Performance Plan, as amended March 12, 1998 Agreement (incorporated herein by reference to Exhibit 10-g to Registrant's Annual Report on Form 10-K for the year ended October 31, 2008)* | |
| 10-g-1 | Amended and Restated Nordson Corporation 2004 Long-Term Performance Plan (incorporated herein by reference to Exhibit 10.2 to Registrant's Form 8-K dated February 25, 2008)* | |
| 10-h | Nordson Corporation Assurance Trust Agreement (incorporated herein by reference to Exhibit 10-h to Registrant's Annual Report on Form 10-K for the year ended October 31, 2010)* | |
| 10-h-1 | Form of Change in Control Retention Agreement between the Registrant and Executive Officers (incorporated herein by reference to Exhibit 10.2 to Registrant's Form 8-K dated December 16, 2008)* | |
| 10-i | Compensation Committee Rules of the Nordson Corporation 2004 Long Term Performance Plan governing directors' deferred compensation (incorporated herein by reference to Exhibit 10-i to Registrant's Annual Report on Form 10-K for the year ended October 31, 2010)* | |
| 10-j | Compensation Committee Rules of the Nordson Corporation Amended and Restated Nordson Corporation 2004 Long Term Performance Plan governing directors' deferred compensation (incorporated herein by reference to Exhibit 10-j to Registrant's Annual Report on Form 10-K for the year ended October 31, 2010)* | |
| 10-l | Stock Purchase Agreement between John Greasley, Nordson Corporation and Dage Holdings Limited (incorporated herein by reference to Exhibit 99.3(b) to Registrant's Form 8-K dated December 19, 2006) | |
| 10-m | Employment Agreement between Registrant and Michael F. Hilton (incorporated herein by reference to Exhibit 99.3 to Registrant's Form 8-K dated December 21, 2009)* | |
| 10-n | Employment Agreement (Change in Control Retention Agreement) between Registrant and Michael F. Hilton (incorporated herein by reference to Exhibit 99.4 to Registrant's Form 8-K dated December 21, 2009)* | |
| 10-o | Supplemental Retirement Agreement between the Registrant and Michael F. Hilton (incorporated herein by reference to Exhibit 10-o to Registrant's Annual Report on Form 10-K for the year ended October 31, 2010)* | |
| 10-p | Stock Purchase Agreement by and among VP Acquisition Holdings, Inc., the Stockholders of VP Acquisition Holdings, Inc., the Optionholders of VP Acquisition Holdings, Inc., American Capital, Ltd., as Securityholder Representative, and Nordson Corporation dated as of July 15, 2011 (incorporated herein by reference to Exhibit 4.1 to Registrant's Quarterly Report on Form 10-Q for the quarter ended July 31, 2011) | |
| (21) | Subsidiaries of the Registrant | |
| (23) | Consent of Independent Registered Public Accounting Firm |
79
Index to Exhibits - Continued
Exhibit | Description | |
| 31.1 | Certification pursuant to Rule 13a-14(a)/15d-14(a) of the Securities Exchange Act of 1934 by the Chief Executive Officer, as adopted pursuant to Section 302 of the Sarbanes-Oxley Act of 2002 | |
| 31.2 | Certification pursuant to Rule 13a-14(a)/15d-14(a) of the Securities Exchange Act of 1934 by the Chief Financial Officer, as adopted pursuant to Section 302 of the Sarbanes-Oxley Act of 2002 | |
| 32.1 | Certification of CEO pursuant to 18 U.S.C. Section 1350, as adopted pursuant to Section 906 of the Sarbanes-Oxley Act of 2002 | |
| 32.2 | Certification of CFO pursuant to 18 U.S.C. Section 1350, as adopted pursuant to Section 906 of the Sarbanes-Oxley Act of 2002 | |
| 99-a | Form S-8 Undertakings (Nos. 33-18309 and 33-33481) | |
| 101 | The following financial information from Nordson Corporation's Annual Report on Form 10-K for the year ended October 31, 2011, formatted in Extensible Business Reporting Language (XBRL): (i) the Consolidated Statements of Income for the years ended October 31, 2011, 2010 and 2009, (ii) the Consolidated Balance Sheets at October 31, 2011 and 2010, (iii) the Consolidated Statements of Changes in Shareholders' Equity for the years ended October 31, 2011, 2010 and 2009, (iv) the Consolidated Statements of Cash Flows for the years ended October 31, 2011, 2010 and 2009, and (iv) Notes to Consolidated Financial Statements. |
*Indicates management contract or compensatory plan, contract or arrangement in which one or more directors and/or executive officers of Nordson Corporation may be participants.
80