|
|
|
|
|
UNITED STATES
SECURITIES AND EXCHANGE COMMISSION
Washington, D.C. 20549
FORM 10-K
(Mark One) |
|
x | ANNUAL REPORT PURSUANT TO SECTION 13 OR 15(d) OF THE SECURITIES EXCHANGE ACT OF 1934 |
For the fiscal year ended August 28, 2014
OR
o | TRANSITION REPORT PURSUANT TO SECTION 13 OR 15(d) OF THE SECURITIES EXCHANGE ACT OF 1934 |
For the transition period from to
Commission file number 1-10658
Micron Technology, Inc.
(Exact name of registrant as specified in its charter)
Delaware | 75-1618004 |
(State or other jurisdiction of incorporation or organization) | (IRS Employer Identification No.) |
8000 S. Federal Way, Boise, Idaho | 83716-9632 |
(Address of principal executive offices) | (Zip Code) |
Registrant's telephone number, including area code | (208) 368-4000 |
Securities registered pursuant to Section 12(b) of the Act: | |
Title of each class | Name of each exchange on which registered |
Common Stock, par value $.10 per share | NASDAQ Global Select Market |
Securities registered pursuant to Section 12(g) of the Act:
None
(Title of Class)
Indicate by check mark if the registrant is a well-known seasoned issuer, as defined in Rule 405 of the Securities Act. Yes T No ¨
Indicate by check mark if the registrant is not required to file reports pursuant to Section 13 or 15(d) of the Act. Yes ¨ No T
Indicate by check mark whether the registrant (1) has filed all reports required to be filed by Section 13 or 15(d) of the Securities Exchange Act of 1934 during the preceding 12 months (or for such shorter period that the registrant was required to file such reports), and (2) has been subject to such filing requirements for the past 90 days. Yes T No ¨
Indicate by check mark whether the registrant has submitted electronically and posted on its corporate Website, if any, every Interactive Data File required to be submitted and posted pursuant to Rule 405 of Regulation S-T (§ 232.405 of this chapter) during the preceding 12 months (or for such shorter period that the registrant was required to submit and post such files). Yes T No ¨
Indicate by check mark if disclosure of delinquent filers pursuant to Item 405 of Regulation S-K (§ 229.405 of this chapter) is not contained herein, and will not be contained, to the best of registrant's knowledge, in definitive proxy or information statements incorporated by reference in Part III of this Form 10-K or any amendment to this Form 10-K. T
Large Accelerated Filer x | Accelerated Filer o | Non-Accelerated Filer o (Do not check if a smaller reporting company) | Smaller Reporting Company o |
Indicate by check mark whether the registrant is a shell company (as defined in Rule 12b-2 of the Exchange Act). Yes o No x
The aggregate market value of the voting stock held by non-affiliates of the registrant, based upon the closing price of such stock on February 27, 2014, as reported by the NASDAQ Global Select Market, was approximately $21.3 billion . Shares of common stock held by each executive officer and director and by each person who owns 5% or more of the outstanding common stock have been excluded in that such persons may be deemed to be affiliates. This determination of affiliate status is not necessarily a conclusive determination for other purposes.
The number of outstanding shares of the registrant's common stock as of October 16, 2014, was 1,073,455,204 .
DOCUMENTS INCORPORATED BY REFERENCE: Portions of the Proxy Statement for the registrant's Fiscal 2014 Annual Meeting of Shareholders to be held on January 22, 2015, are incorporated by reference into Part III of this Annual Report on Form 10-K.
|
|
|
|
|
Definitions of Commonly Used Terms
As used herein, "we," "our," "us" and similar terms include Micron Technology, Inc. and its subsidiaries, unless the context indicates otherwise. Abbreviations, terms or acronyms are commonly used or found in multiple locations throughout this report and include the following:
Term |
| Definition |
| Term |
| Definition |
2019 Notes |
| 1.258% Secured Senior Notes due 2019 |
| MAI |
| Micron Akita, Inc. |
2022 Notes |
| 5.875% Senior Notes due 2022 |
| Mb |
| Megabit |
2025 Notes |
| 5.500% Senior Notes due 2025 |
| Micron |
| Micron Technology, Inc. |
2031 Notes |
| The 2031A and 2031B Notes |
| MIT |
| Micron Technology, Italia, S.r.l. |
2031A Notes |
| 1.500% Convertible Senior Notes due 2031 |
| MLC |
| Multi-Level Cell |
2031B Notes |
| 1.875% Convertible Senior Notes due 2031 |
| MMJ |
| Micron Memory Japan, Inc. |
2032 Notes |
| The 2032C and 2032D Notes |
| MMJ Companies |
| Micron Akita, Inc. and Micron Memory Japan, Inc. |
2032C Notes |
| 2.375% Convertible Senior Notes due 2032 |
| MMJ Group |
| MMJ and its subsidiaries |
2032D Notes |
| 3.125% Convertible Senior Notes due 2032 |
| MMT |
| Micron Memory Taiwan Co., Ltd. |
2033 Notes |
| The 2033E and 2033F Notes |
| MP Mask |
| MP Mask Technology Center, LLC |
2033E Notes |
| 1.625% Convertible Senior Notes due 2033 |
| MTI |
| Micron Technology, Inc. |
2033F Notes |
| 2.125% Convertible Senior Notes due 2033 |
| Nanya |
| Nanya Technology Corporation |
2043G Notes |
| 3.00% Convertible Senior Notes due 2043 |
| Numonyx |
| Numonyx Holdings B.V. |
Aptina |
| Aptina Imaging Corporation |
| Photronics |
| Photronics, Inc. |
DRAM |
| Dynamic Random Access Memory |
| PSRAM |
| Pseudo-static Dynamic Random Access Memory |
Elpida |
| Elpida Memory, Inc. |
| Qimonda |
| Qimonda AG |
Gb |
| 1 gigabit |
| R&D |
| Research and Development |
GB |
| 1 gigabyte |
| Rexchip |
| Rexchip Electronics Corporation |
HP |
| Hewlett-Packard Company |
| RLDRAM |
| Reduced Latency Dynamic Random Access Memory |
IM Flash |
| IMFT and IMFS |
| SEC |
| Securities and Exchange Commission |
IMFS |
| IM Flash Singapore, LLP |
| SG&A |
| Selling, General and Administration |
IMFT |
| IM Flash Technologies, LLC |
| SLC |
| Single-Level Cell |
Inotera |
| Inotera Memories, Inc. |
| SSD |
| Solid-State Drive |
Intel |
| Intel Corporation |
| ST |
| STMicroelectronics S.r.l. |
Japan Court |
| Tokyo District Court |
| Tera Probe |
| Tera Probe, Inc. |
LIBOR |
| London Interbank Offered Rate |
| TLC |
| Triple-Level Cell |
LPDRAM |
| Mobile Low Power Dynamic Random Access Memory |
| VIE |
| Variable Interest Entity |
PART I
ITEM 1. BUSINESS
The following discussion contains trend information and other forward-looking statements that involve a number of risks and uncertainties. Forward-looking statements include, but are not limited to, statements such as those made in "Products" regarding increased sales of DDR4 products, growth in demand for NAND Flash products and SSDs and in "Manufacturing" regarding the transition to smaller line-width process technologies and 3D NAND Flash. Our actual results could differ materially from our historical results and those discussed in the forward-looking statements. Factors that could cause actual results to differ materially include, but are not limited to, those identified in "Item 1A. Risk Factors." All period references are to our fiscal periods unless otherwise indicated.
Corporate Information
Micron, a Delaware corporation, was incorporated in 1978. Our executive offices are located at 8000 South Federal Way, Boise, Idaho 83716-9632 and our telephone number is (208) 368-4000. Information about us is available on the internet at www.micron.com. Copies of our Annual Report on Form 10-K, Quarterly Reports on Form 10-Q and Current Reports on Form 8-K, as well as any amendments to these reports, are available through our website as soon as reasonably practicable after they are electronically filed with or furnished to the SEC. Materials filed by us with the SEC are also available at the SEC's Public Reference Room at 100 F Street, NE, Washington, D.C. 20549. Information on the operation of the Public Reference Room is available by calling (800) SEC-0330. Also available on our website are our: Corporate Governance Guidelines, Governance Committee Charter, Compensation Committee Charter, Audit Committee Charter and Code of Business Conduct and Ethics. Any amendments or waivers of our Code of Business Conduct and Ethics will also be posted on our website at www.micron.com within four business days of the amendment or waiver. Copies of these documents are available to shareholders upon request. Information contained or referenced on our website is not incorporated by reference and does not form a part of this Annual Report on Form 10-K.
Overview
We are one of the world's leading providers of advanced semiconductor solutions. Through our worldwide operations, we manufacture and market a full range of DRAM, NAND Flash and NOR Flash memory, as well as other innovative memory technologies, packaging solutions and semiconductor systems for use in leading-edge computing, consumer, networking, automotive, industrial, embedded and mobile products. We market our products through our internal sales force, independent sales representatives and distributors primarily to Original Equipment Manufacturers ("OEMs") and retailers located around the world. Our success is largely dependent on the market acceptance of our diversified portfolio of semiconductor products, efficient utilization of our manufacturing infrastructure, successful ongoing development of advanced product and process technologies and generating a return on R&D investments.
We obtain products for sale to our customers from our wholly-owned manufacturing facilities and our joint ventures. In recent years, we have increased our manufacturing scale and product diversity through strategic acquisitions and various partnering arrangements.
We make significant investments to develop the proprietary product and process technologies that are implemented in our worldwide manufacturing facilities and through our joint ventures. These investments enable our production of semiconductor products with increasing functionality and performance at lower costs. We generally reduce the manufacturing cost of each generation of product through advancements in product and process technologies, such as our leading-edge line-width process technology. We continue to introduce new generations of products that offer improved performance characteristics, such as higher data transfer rates, reduced package size, lower power consumption, improved read/ write reliability and increased memory density. To leverage our significant investments in R&D, we have formed, and may continue to form, strategic joint ventures that allow us to share the costs of developing memory product and process technologies with joint venture partners. In addition, from time to time, we also sell and/or license technology to other parties. We continue to pursue additional opportunities to monetize our investment in intellectual property through partnering and other arrangements.
1
On July 31, 2013, we completed the acquisition of Elpida, now known as MMJ, and a controlling interest in Rexchip, now known as MMT (together, the "MMJ Acquisition"). The MMJ Acquisition included a 300mm DRAM wafer fabrication facility located in Hiroshima, Japan, a 300mm DRAM wafer fabrication facility in Taichung City, Taiwan and an assembly and test facility located in Akita, Japan. These wafer fabrication facilities together represented approximately 30% of our total wafer capacity for 2014. The operations from the MMJ Acquisition, which are included primarily in our MBU and CNBU segments, include the manufacture of Mobile DRAM targeted to mobile phones and tablets and computing DRAM targeted to desktop PCs, servers, notebooks and workstations. In connection with the MMJ Acquisition, we recorded net assets of $2.60 billion, noncontrolling interests of $168 million and a gain on the transaction of $1.48 billion in 2013. (See "Part II – Item 8. Financial Statements and Supplementary Data – Notes to Consolidated Financial Statements – Micron Memory Japan, Inc." note.)
The MMJ Companies are currently subject to corporate reorganization proceedings under the Corporate Reorganization Act of Japan. Because the plans of reorganization of the MMJ Companies provide for ongoing payments to creditors following the MMJ Acquisition, these proceedings are continuing and the MMJ Companies remain subject to the oversight of the Japan Court and of the trustees appointed by the Japan Court (including a trustee designated by us, who we refer to as the business trustee, and a trustee designated by the Japan Court, who we refer to as the legal trustee), pending completion of the reorganization proceedings. As a result of this oversight and related consent rights of the Japan Court and the legal trustee, our ability to effectively integrate the MMJ Companies as part of our global operations or to cause the MMJ Companies to take certain actions that we deem advisable for their businesses could be adversely affected if the Japan Court or the legal trustee is unwilling to consent to various actions. For more information, see "Item 3. Legal Proceedings – Reorganization Proceedings of the MMJ Companies" and "Item 1A. Risk Factors."
Business Segments
In the third quarter of 2014, we reorganized our business units. All prior period amounts reflect this reorganization. Factors used to identify our segments include, among others, markets, customers and products. Segment information reported herein is consistent with how it is reviewed and evaluated by our chief operating decision makers. We have the following four business units, which are our reportable segments:
Compute and Networking Business Unit ("CNBU"): Includes DRAM and NOR Flash products sold to the compute, networking, graphics and cloud server markets.
Mobile Business Unit ("MBU"): Includes DRAM, NAND Flash and NOR Flash products sold to the smartphone, feature phone and tablet mobile-device market.
Storage Business Unit ("SBU"): Includes NAND Flash components and SSDs sold into enterprise and client storage, cloud and removable storage markets. SBU also includes NAND Flash products sold to Intel through our IMFT joint venture.
Embedded Business Unit ("EBU"): Includes DRAM, NAND Flash and NOR Flash products sold into automotive and industrial applications, as well as the connected home and consumer electronics markets.
For more information regarding our segments, see "Part II – Item 8. Financial Statements and Supplementary Data – Notes to Consolidated Financial Statements – Segment Information."
Products
DRAM
DRAM products are high-density, low-cost-per-bit, random access memory devices that provide high-speed data storage and retrieval with a variety of performance, pricing and other characteristics. Sales of DRAM products were 68%, 48% and 39% of our total net sales in 2014, 2013 and 2012, respectively. DRAM products are sold by CNBU, MBU and EBU.
DDR3 DRAM is a standardized, high-density, high-volume, DRAM product, which offers high speed and high bandwidth at a relatively low cost. DDR3 products are primarily targeted at computers, servers, networking devices and communications equipment. In 2014, we offered DDR3 products in 1Gb, 2Gb and 4Gb densities. We also offered next generation DDR4 DRAM products in 2014 and we expect sales of these products to increase significantly in 2015 as they replace DDR3 DRAM products in many applications. Sales of DDR3 DRAM products were 40%, 31% and 20% of our total net sales in 2014, 2013 and 2012, respectively.
2
LPDRAM products offer lower power consumption relative to other DRAM products and are used primarily in mobile phones, tablets, embedded applications, ultra-thin laptop computers and other mobile consumer devices that require low power consumption. We offer DDR4, DDR3, DDR2 and DDR versions of LPDRAM. Sales of mobile LPDRAM products were 20%, 6% and 3% of our total net sales in 2014, 2013 and 2012, respectively.
We also offer other DRAM products targeted to specialty markets including DDR2 DRAM, DDR DRAM, GDDR5 DRAM, SDRAM, RLDRAM and PSRAM. These products are used primarily in networking devices, servers, consumer electronics, communications equipment, computer peripherals, automotive and industrial applications as well as computer memory upgrades. In 2014, we began selling Hybrid Memory Cube ("HMC") products, which are semiconductor memory devices where vertical stacks of DRAM die that are connected using through-silicon-via interconnects are placed above a small, high-speed logic layer. HMC enables ultra-high system performance with significantly lower power-per-bit.
NAND Flash Memory
NAND Flash products are electrically re-writeable, non-volatile semiconductor memory devices that retain content when power is turned off. NAND Flash sales were 27%, 40% and 44% of our total net sales in 2014, 2013 and 2012, respectively. NAND Flash is ideal for mass-storage devices due to its fast erase and write times, high density and low cost per bit relative to other solid-state memories. Embedded NAND Flash-based storage devices are utilized in mobile phones, SSDs, tablets, computers, industrial and automotive applications, networking and other personal and consumer applications. Removable storage devices, such as USB and Flash memory cards, are used with applications such as PCs, digital still cameras and mobile phones. The market for NAND Flash products has grown rapidly and we expect it to continue to grow due to demand for these and other embedded and removable storage devices. NAND Flash products are sold by SBU, EBU, MBU and CNBU.
Our NAND Flash products feature a small cell structure that enables higher densities for demanding applications. We offer high-speed SLC, MLC and TLC NAND Flash products that are compatible with advanced interfaces. MLC and TLC products have two and three times, respectively, the bit density of SLC products. In 2014, we offered SLC NAND Flash products in 1Gb to 64Gb densities; 2-bit-per-cell MLC NAND Flash products in 8Gb to 128Gb densities; and 3-bit-per-cell TLC NAND Flash products in 64Gb to 128Gb densities.
We offer client and enterprise SSDs which feature higher performance, reduced-power consumption and enhanced reliability as compared to typical hard disk drives. Our client SSDs are targeted at notebooks, desktops, workstations and other consumer applications. Using our NAND Flash process technology and a leading-edge SATA 6 Gb per second interface, our SSDs deliver read and write speeds that help improve boot and application load times and deliver higher performance than hard disk drives. Our client SSDs feature industry-leading encryption for corporate users and are offered in a 2.5-inch, M.2. and mSATA modules, with densities up to 1 terabyte. Our enterprise SSDs are targeted at server and storage applications and incorporate our Extended Performance and Enhanced Reliability Technology (XPERT) architecture, which closely incorporates the storage and controller through highly optimized firmware algorithms and hardware enhancements. The end result is a set of market-focused enterprise features that deliver ultra-low latencies, improved data transfer time, power-loss protection and cost-effectiveness, along with higher capacities and power efficiency. We offer enterprise SSDs with capacities up to 1.4 terabytes. We expect that demand for both client and enterprise SSDs will continue to increase significantly over the next several years.
We also offer managed NAND Multi-Chip Package ("MCP") products, which incorporate our NAND Flash. Our managed NAND products include e-MMC, e-MCP and embedded USB. Our e-MMC products combine NAND Flash with a logic controller that performs media management and Error Code Correction ("ECC"), which provides reduced ECC complexity, better system performance, improved reliability, easy integration and lower overall system costs. Our e-MCP products combine e-MMC with LPDRAM on the same substrate, which improves overall functionality and performance while simplifying system design.
Through our Lexar® brand, we sell high-performance digital media products and other flash-based storage products through retail and OEM channels. Our digital media products include a variety of flash memory cards and JumpDrive™ products with a range of speeds, capacities and value-added features. We offer flash memory cards in a variety of speeds and capacities and in all major media formats, including CompactFlash, Memory Stick and Secure Digital ("SD"). CompactFlash and Memory Stick products sold by us incorporate our patented controller technology. Other products, including SD memory cards and some JumpDrive products, incorporate third party controllers. We also manufacture products that are sold under other brand names and resell flash memory products that are purchased from other NAND Flash suppliers.
3
NOR Flash Memory
NOR Flash products are electrically re-writeable, non-volatile semiconductor memory devices that retain content when power is turned off, offer fast read times due to random access capability and have execute-in-place ("XiP") capability that enables processors to read NOR Flash without first accessing RAM. These capabilities make NOR ideal for storing program code in wireless and embedded applications. Our NOR Flash sales were 3%, 9% and 12% of our total net sales for 2014, 2013 and 2012, respectively. NOR Flash products are sold primarily by EBU and CNBU.
We offer both parallel and serial interface NOR Flash products in a broad range of densities, packages and features. Our parallel NOR Flash products are constructed to meet the needs of the consumer electronics, industrial, wired and wireless communications, computing and automotive applications. These products offer high densities, XiP performance, architectural flexibility and proven reliability in rigorous industrial settings. Our serial NOR Flash products are designed to meet the needs of consumer electronics, industrial, automotive, wired and wireless communications and computing applications. These products offer industry-standard packaging, pinouts, command sets and chipset compatibility.
Partnering Arrangements
The following is a summary of our partnering arrangements as of August 28, 2014 :
Entity |
|
|
| Member or Partner |
| Micron Ownership Interest |
| Formed/ Acquired |
| Product Market |
Consolidated entities: |
|
|
|
|
|
|
|
| ||
IMFT | (1) |
|
| Intel Corporation |
| 51% |
| 2006 |
| NAND Flash |
MP Mask | (2) |
|
| Photronics, Inc. |
| 50% |
| 2006 |
| Photomasks |
|
|
|
|
|
|
|
|
|
|
|
Equity method investments: |
|
|
|
|
|
|
|
| ||
Inotera | (3) |
|
| Nanya Technology Corporation |
| 33% |
| 2009 |
| DRAM |
Tera Probe | (4) |
|
| Various |
| 40% |
| 2013 |
| Wafer Probe |
(1) | IMFT: We partner with Intel for the design, development and manufacture of NAND Flash and certain emerging memory products. In connection therewith, we formed a joint venture with Intel, IMFT, to manufacture NAND Flash memory products for the exclusive use of the members. The members share the output of IMFT generally in proportion to their investment. We sell NAND Flash products to Intel through IMFT at long-term negotiated prices approximating cost. We generally share product design and other research and development costs for NAND Flash and certain emerging memory technologies equally with Intel. The IMFT joint venture agreement extends through 2024 and includes certain buy-sell rights with an Intel put right, commencing in January 2015, and our call right commencing in January 2018, pursuant to which Intel may elect to sell to us, or we may elect to purchase from Intel, Intel's interest in IMFT. If Intel elects to sell to us, we would set the closing date of the transaction within two years following such election and could elect to receive financing of the purchase price from Intel for one to two years from the closing date. (See "Part II – Item 8. Financial Statements and Supplementary Data – Notes to Consolidated Financial Statements – Equity – Noncontrolling Interests in Subsidiaries – IMFT" note.) |
(2) | MP Mask: We produce photomasks for leading-edge and advanced next generation semiconductors through MP Mask, a joint venture with Photronics. The MP Mask joint venture agreement allows either party to terminate the joint venture in either May 2016, provided notice is given prior to May 2015, or in each five-year successive period following May 2016, provided such notice is given at least twelve months prior to the end of the successive five-year period. We and Photronics also have supply arrangements wherein we purchase a substantial majority of the reticles produced by MP Mask. (See "Part II – Item 8. Financial Statements and Supplementary Data – Notes to Consolidated Financial Statements – Equity – Noncontrolling Interests in Subsidiaries – MP Mask" note.) |
4
(3) | Inotera: We partner with Nanya for the manufacture of DRAM products. In connection therewith, we have partnered with Nanya in Inotera, a DRAM memory company in Taiwan. Through December 2012, we purchased 50% of Inotera's wafer production capacity based on a margin-sharing formula among Nanya, Inotera and us. Since January 2013, we have purchased substantially all of Inotera's DRAM output at a discount from market prices for our comparable components under a new supply agreement (the "Inotera Supply Agreement"). The Inotera Supply Agreement has a three-year term (currently through December 2016) that contemplates annual negotiations with respect to potential successive one-year extensions. If the parties do not agree to an extension, the agreement will terminate following the end of the then-existing term plus a subsequent three-year wind-down period. In the event of a wind-down, our share of Inotera's capacity would decline over the wind-down period. We are currently in negotiations regarding the extension of the Inotera Supply Agreement. (See "Part II – Item 8. Financial Statements and Supplementary Data – Notes to Consolidated Financial Statements – Equity Method Investments – Inotera" note.) |
(4) | Tera Probe: We have an approximate 40% ownership interest in Tera Probe, an entity that provides semiconductor probe and wafer testing services to us and others. |
Manufacturing
Our manufacturing facilities are located in the United States, China, Japan, Malaysia, Puerto Rico, Singapore and Taiwan. Our Inotera joint venture has a wafer fabrication facility in Taiwan. Nearly all of our products are manufactured on 300mm wafers in facilities that generally operate 24 hours per day, 7 days per week. Semiconductor manufacturing is extremely capital intensive, requiring large investments in sophisticated facilities and equipment. A significant portion of our semiconductor equipment is replaced every three to five years with increasingly advanced equipment. DRAM, NAND Flash and NOR Flash products share a number of common manufacturing processes, enabling us to leverage our product and process technologies and manufacturing infrastructure across these product lines. In 2014, we transitioned one of our Singapore wafer fabrication facilities from production of DRAM to NAND Flash.
Our process for manufacturing semiconductor products is complex, involving a number of precise steps, including wafer fabrication, assembly and test. Efficient production of semiconductor products requires utilization of advanced semiconductor manufacturing techniques and effective deployment of these techniques across multiple facilities. The primary determinants of manufacturing cost are process line-width, number of mask layers, number of fabrication steps and number of good die produced on each wafer. Other factors that contribute to manufacturing costs are wafer size, cost and sophistication of manufacturing equipment, equipment utilization, process complexity, cost of raw materials, labor productivity, package type and cleanliness of the manufacturing environment. We continuously enhance our production processes, reducing die sizes and transitioning to higher density products. In 2014, the majority of our DRAM production was manufactured on our 30nm line-width process technology. We expect that in 2015 that the majority of our DRAM production will be manufactured on our 25nm and 20nm line-width process technologies. In 2014, a majority of our NAND Flash memory production was manufactured on 20nm line-width process technology. We expect that in 2015 a majority of our NAND Flash production will be manufactured on our 16nm line-width process technology. We expect to begin sampling 3D NAND Flash products in the fourth quarter of calendar 2014 and to begin volume production in the second half of calendar 2015.
Wafer fabrication occurs in a highly controlled, clean environment to minimize dust and other yield and quality-limiting contaminants. Despite stringent manufacturing controls, individual circuits may be nonfunctional or wafers may need to be scrapped due to equipment errors, minute impurities in materials, defects in photomasks, circuit design marginalities or defects and dust particles. Success of our manufacturing operations depends largely on minimizing defects to maximize yield of high-quality circuits. In this regard, we employ rigorous quality controls throughout the manufacturing, screening and testing processes. We are able to recover certain devices by testing and grading them to their highest level of functionality.
We test our products at various stages in the manufacturing process, perform high temperature burn-in on finished products and conduct numerous quality control inspections throughout the entire production flow. In addition, we use our proprietary AMBYX™ line of intelligent test and burn-in systems to perform simultaneous circuit tests of semiconductor memory die during the burn-in process, capturing quality and reliability data and reducing testing time and cost.
We sell semiconductor products in both packaged and unpackaged (i.e. "bare die") forms. Our packaged products include memory modules, SSDs, MCPs, managed NAND, memory cards and USB devices. We assemble many products in-house and, in some cases, outsource assembly services where we can reduce costs and minimize our capital investment. We contract with independent foundries and assembly and testing companies to manufacture NAND Flash media products such as memory cards and USB devices.
5
In recent years, we have produced an increasingly broad portfolio of products, which enhances our ability to allocate resources to our most profitable products but also increases the complexity of our manufacturing operations. Although our product lines generally use similar manufacturing processes, our overall cost efficiency can be affected by frequent conversions to new products, the allocation of manufacturing capacity to more complex, smaller-volume parts and the reallocation of manufacturing capacity across various product lines.
Availability of Raw Materials
Our operations require raw materials that meet exacting standards. We generally have multiple sources of supply for our raw materials. However, only a limited number of suppliers are capable of delivering certain raw materials that meet our standards. In some cases, materials are provided by a single supplier. Various factors could reduce the availability of raw materials such as silicon wafers, photomasks, chemicals, gases, photoresist, lead frames and molding compound. Shortages may occur from time to time in the future. We and/or our suppliers could be affected by laws and regulations enacted in response to concerns regarding climate change, which could increase the cost and limit the supply of our raw materials. In addition, disruptions in transportation lines could delay our receipt of raw materials. Lead times for the supply of raw materials have been extended in the past. If our supply of raw materials is disrupted or our lead times extended, our business, results of operations or financial condition could be materially adversely affected.
Marketing and Customers
Our products are sold into compute and graphics, mobile, SSD and other storage, automotive, industrial, medical and other embedded and server markets. Market concentrations from 2014 net sales were approximately as follows: 30% for compute and graphics (including desktop PCs, notebooks and workstations); 20% for mobile; 20% for SSD and other storage; 10% for automotive, industrial, medical and other embedded; and 10% for server. Sales to Kingston, primarily DRAM, were 10% of our net sales in 2014 . Sales to Intel, primarily NAND Flash products through IM Flash, were 8% of our net sales in 2014 , 10% of our net sales in 2013 and 12% of our net sales in 2012 . Sales to HP, primarily DRAM, were 9% of our net sales in 2014 , 10% of our net sales in 2013 and 8% of our net sales in 2012 .
Our semiconductor memory products are offered under the Micron, Lexar®, Crucial™, SpecTek® and Elpida brand names and private labels. We market our semiconductor memory products primarily through our own direct sales force and maintain sales or representative offices in our primary markets around the world. We sell Lexar-branded NAND Flash memory products primarily through retail channels and our Crucial-branded products through a web-based customer direct sales channel as well as through channel and distribution partners. Our products are also offered through independent sales representatives and distributors. Independent sales representatives obtain orders subject to final acceptance by us and are compensated on a commission basis. We make shipments against these orders directly to the customer. Distributors carry our products in inventory and typically sell a variety of other semiconductor products, including competitors' products. We maintain inventory at locations in close proximity to certain key customers to facilitate rapid delivery of products. Many of our customers require a thorough review or qualification of semiconductor products, which may take several months.
Backlog
Because of volatile industry conditions, customers are reluctant to enter into long-term, fixed-price contracts. Accordingly, new order volumes for our semiconductor products fluctuate significantly. We typically accept orders with acknowledgment that the terms may be adjusted to reflect market conditions at the date of shipment. For these reasons, we do not believe that our order backlog as of any particular date is a reliable indicator of actual sales for any succeeding period.
6
Product Warranty
Because the design and manufacturing process for semiconductor products is highly complex, it is possible that we may produce products that do not comply with customer specifications, contain defects or are otherwise incompatible with end uses. In accordance with industry practice, we generally provide a limited warranty that our products are in compliance with our specifications existing at the time of delivery. Under our general terms and conditions of sale, liability for certain failures of product during a stated warranty period is usually limited to repair or replacement of defective items or return of, or a credit with respect to, amounts paid for such items. Under certain circumstances, we provide more extensive limited warranty coverage than that provided under our general terms and conditions.
Competition
We face intense competition in the semiconductor memory market from a number of companies, including Samsung Electronics Co., Ltd.; SanDisk Corporation; SK Hynix Inc. and Toshiba Corporation. Some of our competitors are large corporations or conglomerates that may have greater resources to withstand downturns in the semiconductor markets in which we compete, invest in technology and capitalize on growth opportunities. Our competitors seek to increase silicon capacity, improve yields, reduce die size and minimize mask levels in their product designs resulting in significantly increased worldwide supply and downward pressure on prices. Many of our high-volume memory products are manufactured to industry standard specifications and as such have similar performance characteristics to those of our competitors. For these high-volume memory products, the principal competitive factors are generally price and performance characteristics including: operating speed, power consumption, reliability, compatibility, size and form factors. For our other memory products, the aforementioned performance characteristics generally take precedence to pricing.
Research and Development
Our process technology R&D efforts are focused primarily on development of successively smaller line-width process technologies, as well as new, fundamentally different memory structures, materials and packages, which are designed to facilitate our transition to next generation memory products. Additional process technology R&D efforts focus on the enablement of advanced computing and mobile memory architectures, the investigation of new opportunities that leverage our core semiconductor expertise and the development of new manufacturing materials. Product design and development efforts include our high density DDR3 and DDR4 DRAM and LPDRAM products as well as high density and mobile NAND Flash memory (including 3D NAND and MLC and TLC technologies), NOR Flash memory, specialty memory, SSDs , HMCs and other memory technologies and systems.
Our R&D expenses were $1.37 billion, $931 million and $918 million in 2014, 2013 and 2012, respectively. We share certain R&D process technology and design costs for NAND Flash and emerging technologies with Intel. We shared R&D process and design costs for DRAM with Nanya through December 2012, when our cost-sharing agreement was terminated. As a result of reimbursements under our Intel and Nanya cost-sharing arrangements, our overall R&D expenses were reduced by $137 million, $146 million and $225 million in 2014, 2013 and 2012, respectively.
To compete in the semiconductor memory industry, we must continue to develop technologically advanced products and processes. We believe that expansion of our semiconductor product offerings is necessary to meet expected market demand for specific memory solutions. Our process, design and package development efforts occur at multiple locations across the world, with our largest R&D centers located in Boise, Idaho; Hiroshima, Japan; Hashimoto, Japan; and Milpitas, California. We have several additional product design centers in other strategic locations around the world. In addition, we develop photolithography mask technology at our MP Mask joint venture facility in Boise.
R&D expenses vary primarily with the number of development wafers processed, the cost of advanced equipment dedicated to new product and process development and personnel costs. Because of the lead times necessary to manufacture our products, we typically begin to process wafers before completion of performance and reliability testing. We deem development of a product complete once the product has been thoroughly reviewed and tested for performance and reliability. R&D expenses can vary significantly depending on the timing of product qualification.
7
Geographic Information
Sales to customers outside the United States totaled $13.81 billion for 2014 and included sales of $6.72 billion in China, $2.31 billion in Taiwan, $1.25 billion in Japan, $1.25 billion in Europe and $1.79 billion in the rest of the Asia Pacific region (excluding China, Japan and Taiwan). Sales to customers outside the United States totaled $7.56 billion for 2013 and $6.97 billion for 2012. As of August 28, 2014, we had net property, plant and equipment of $3.28 billion in the United States, $3.10 billion in Singapore, $1.22 billion in Japan, $761 million in Taiwan, $242 million in China, and $75 million in other countries. (See "Part II – Item 8. Financial Statements and Supplementary Data – Notes to Consolidated Financial Statements – Geographic Information" note and "Item 1A. Risk Factors.")
Patents and Licenses
In recent years, we have been recognized as a leader in per capita and quality of patents issued. As of August 28, 2014 , we owned approximately 16,500 U.S. patents and 4,000 foreign patents. In addition, we have thousands of U.S. and foreign patent applications pending. Our patents have various terms expiring through 2033.
We have a number of patent and intellectual property license agreements and have from time to time licensed or sold our intellectual property to third parties. Some of these license agreements require us to make one-time or periodic payments while others have resulted in us receiving payments. We may need to obtain additional patent licenses or renew existing license agreements in the future and we may enter into additional sales or licenses of intellectual property and partnering arrangements. We are unable to predict whether these license agreements can be obtained or renewed on acceptable terms.
Employees
As of August 28, 2014, we had approximately 30,400 employees.
Environmental Compliance
Government regulations impose various environmental controls on raw materials and discharges, emissions and solid wastes from our manufacturing processes. In 2014, our wafer fabrication facilities continued to conform to the requirements of ISO 14001 certification. To continue certification, we must meet annual requirements in environmental policy, compliance, planning, management, structure and responsibility, training, communication, document control, operational control, emergency preparedness and response, record keeping and management review. While we have not experienced any material adverse effects to our operations from environmental regulations, changes in the regulations could necessitate additional capital expenditures, modification of our operations or other compliance actions.
Directors and Executive Officers of the Registrant
Our executive officers are appointed annually by the Board of Directors and our directors are elected annually by our shareholders. Any directors appointed by the Board of Directors to fill vacancies on the Board serve until the next election by the shareholders. All officers and directors serve until their successors are duly chosen or elected and qualified, except in the case of earlier death, resignation or removal.
As of August 28, 2014 , the following executive officers and directors were subject to the reporting requirements of Section 16(a) of the Securities Exchange Act of 1934, as amended.
8
Name |
| Age |
| Position |
Mark W. Adams |
| 50 |
| President |
Scott J. DeBoer |
| 48 |
| Vice President of Research & Development |
D. Mark Durcan |
| 53 |
| Director and Chief Executive Officer |
Ronald C. Foster |
| 63 |
| Vice President of Finance and Chief Financial Officer |
Patrick T. Otte |
| 51 |
| Vice President of Human Resources |
Joel L. Poppen |
| 50 |
| Vice President of Legal Affairs, General Counsel, and Corporate Secretary |
Brian M. Shirley |
| 45 |
| Vice President Memory Technology and Solutions |
Steven L. Thorsen, Jr. |
| 49 |
| Vice President of Worldwide Sales and Corporate Marketing |
Robert L. Bailey |
| 57 |
| Director |
Richard M. Beyer |
| 65 |
| Director |
Patrick J. Byrne |
| 53 |
| Director |
D. Warren A. East |
| 52 |
| Director |
Mercedes Johnson |
| 60 |
| Director |
Lawrence N. Mondry |
| 54 |
| Director |
Robert E. Switz |
| 67 |
| Chairman |
Mark W. Adams joined us in June 2006 and served as our Vice President of Digital Media and Vice President of Worldwide Sales before being appointed our President in February 2012. From January 2006, until he joined us, Mr. Adams was the Chief Operating Officer of Lexar Media, Inc. Mr. Adams served as the Vice President of Sales and Marketing for Creative Labs, Inc. from December 2002 to January 2006. From March 2000 to September 2002, Mr. Adams was the Chief Executive Officer of Coresma, Inc. Mr. Adams holds a BA in Economics from Boston College and an MBA from Harvard Business School.
Scott J. DeBoer joined us in February 1995 as a process development engineer and has served in various leadership positions since that time. Dr. DeBoer became an officer in May 2007 and, in January 2013, he was appointed our Vice President of Research & Development. Dr. DeBoer holds a PhD in Electrical Engineering and an MS in Physics from Iowa State University. He completed his undergraduate degree at Hastings College.
D. Mark Durcan joined us in June 1984 and has served in various positions since that time. Mr. Durcan was appointed our Chief Operating Officer in February 2006, President in June 2007 and Director and Chief Executive Officer in February 2012. Mr. Durcan has been an officer since 1996. Mr. Durcan is a member of the Board of Directors of MWI Veterinary Supply, Inc. and Freescale Semiconductor, Inc. Mr. Durcan holds a BS and MChE in Chemical Engineering from Rice University. Mr. Durcan has served on our Board of Directors since February 2012.
Ronald C. Foster joined us in April 2008 and is the Chief Financial Officer and Vice President of Finance. He was appointed to his current position in 2008 after serving as a member of our Board of Directors from June 2004 to April 2005. Before joining Micron, Mr. Foster was the Chief Financial Officer of FormFactor, Inc. He previously served as the Chief Financial Officer for JDS Uniphase, Inc., and Novell, Inc. Mr. Foster holds a BA in Economics from Whitman College and an MBA from the University of Chicago.
Patrick T. Otte joined us in October 1987 and has served in various positions, including production and operations manager in several of our fabrication facilities and site director for our facility in Manassas, Virginia. Mr. Otte has served as our Vice President of Human Resources since March 2007. Mr. Otte holds a BA in Religious Education from St. Paul Bible College.
Joel L. Poppen joined us in October 1995 and has held various positions of increased responsibility, including Deputy General Counsel. He was appointed to his current position in December 2013. Mr. Poppen holds a BS in Electrical Engineering from the University of Illinois and a JD from the Duke University School of Law.
Brian M. Shirley joined us in August 1992 and has served in various leadership positions since that time. Mr. Shirley became Vice President of Memory in February 2006, Vice President of DRAM Solutions in June 2010 and has served as Vice President Memory Technology and Solutions since April 2014. Mr. Shirley holds a BS in Electrical Engineering from Stanford University.
Steven L. Thorsen, Jr. joined us in September 1988 and has served in various leadership positions since that time including Vice President and Chief Procurement Officer. Mr. Thorsen became Vice President of Worldwide Sales in April 2012. Mr. Thorsen holds a BA in Business Administration from Washington State University.
9
Robert L. Bailey was the Chairman of the Board of Directors of PMC-Sierra ("PMC") from 2005 until May 2011 and also served as PMC's Chairman from February 2000 until February 2003. Mr. Bailey has served as a director of PMC since October 1996. He also served as the President and Chief Executive Officer of PMC Sierra, Ltd. from July 1997 until May 2008. PMC is a leading provider of broadband communication and semiconductor storage solutions for the next-generation Internet. Mr. Bailey currently serves on the Board of Directors of Entropic Communications. Mr. Bailey holds a BS in Electrical Engineering from the University of Bridgeport and an MBA from the University of Dallas. He has served on our Board of Directors since 2007.
Richard M. Beyer was Chairman and CEO of Freescale Semiconductor from 2008 through June 2012 and continues to serve as a Director with Freescale. Prior to Freescale, Mr. Beyer was President, Chief Executive Officer and Director of Intersil Corporation from 2002 to 2008. He has also previously served in executive management roles at FVC.com, VLSI Technology and National Semiconductor Corporation. He currently serves on the Board of Directors of Dialog Semiconductor and Analog Devices. Mr. Beyer served three years as an officer in the United States Marine Corps. He holds a BA and an MA in Russian from Georgetown University and an MBA in Marketing and International Business from Columbia University Graduate School of Business. Mr. Beyer joined our Board of Directors in January 2013.
Patrick J. Byrne has served as the President of Tektronix, Inc., a subsidiary of Danaher Corporation, since July 2014. Mr. Byrne was Vice President of Strategy and Business Development and Chief Technical Officer of Danaher Corporation from November 2012 to July 2014. Danaher Corporation designs, manufactures, and markets innovative products and services to professional, medical, industrial, and commercial customers. Prior to that, Mr. Byrne was the Director, President and Chief Executive Officer of Intermec, Inc. from 2007 to May 2012. Mr. Byrne was with Agilent Technologies, Inc. from 1999 to 2007 and served in various management positions. Mr. Byrne holds a BS in Electrical Engineering from the University of California, Berkeley, and an MS in Electrical Engineering from Stanford University. Mr. Byrne joined our Board of Directors in April 2011.
D. Warren A. East was the CEO of ARM Holdings PLC from October 2001 to July 2013. He originally joined ARM in 1994, and served in various roles prior to being appointed CEO. He currently serves on the board of BT Group plc, De La Rule PLC, Inc. and Rolls Royce plc. Mr. East is a chartered engineer, Distinguished Fellow of the British Computer Society, Fellow of the Institution of Engineering and Technology, Fellow of the Royal Academy of Engineering and a Companion of the Chartered Management Institute. Mr. East holds a BA BSc(Eng) and an MBA MEng in Engineering Science from Oxford University and an MBA and honorary doctorate from Cranfield University. Mr. East joined our Board of Directors in July 2013.
Mercedes Johnson was the Senior Vice President and Chief Financial Officer of Avago Technologies Limited, a supplier of analog interface components for communications, industrial and consumer applications, from December 2005 to August 2008. She also served as the Senior Vice President, Finance, of Lam Research Corporation ("Lam") from June 2004 to January 2005 and as Lam's Chief Financial Officer from May 1997 to May 2004. Ms. Johnson holds a degree in Accounting from the University of Buenos Aires and currently serves on the Board of Directors for Intersil Corporation, Juniper Networks, Inc. and Teradyne, Inc. Ms. Johnson is the Chairman of the Board's Audit Committee and has served on our Board of Directors since 2005.
Lawrence N. Mondry has been the Chief Executive Officer of Apollo Brands, a consumer products portfolio company, since February 2014. Mr Mondry was the Chief Executive Officer of Flexi Compras Corporation, a rent-to-own retailer, from June 2013 to February 2014. Mr. Mondry was the President and Chief Executive Officer of CSK Auto Corporation ("CSK"), a specialty retailer of automotive aftermarket parts, from August 2007 to July 2008. Prior to his appointment at CSK, Mr. Mondry served as the Chief Executive Officer of CompUSA Inc. from November 2003 to May 2006. Mr. Mondry joined CompUSA in 1990. Mr. Mondry is the Chairman of the Board's Governance Committee and Compensation Committee. He has served on our Board of Directors since 2005.
Robert E. Switz was the Chairman, President and Chief Executive Officer of ADC Telecommunications, Inc., ("ADC"), a supplier of network infrastructure products and services from August 2003 until December 2010, when Tyco Electronics Ltd. acquired ADC. Mr. Switz joined ADC in 1994 and throughout his career there held numerous leadership positions. Mr. Switz holds an MBA from the University of Bridgeport and a BS in Business Administration from Quinnipiac University. Mr. Switz also serves on the Board of Directors for Broadcom Corporation, Cyan Optics, Inc., GT Advanced Technologies and Pulse Electronics Corporation. He has served on our Board of Directors since 2006 and was appointed Chairman of the Board in February 2012.
There are no family relationships between any of our directors or executive officers.
10
ITEM 1A. RISK FACTORS
In addition to the factors discussed elsewhere in this Form 10-K, the following are important factors which could cause actual results or events to differ materially from those contained in any forward-looking statements made by or on behalf of us.
We have experienced dramatic declines in average selling prices for our semiconductor memory products which have adversely affected our business.
If average selling prices for our memory products decrease faster than we can decrease per gigabit costs, our business, results of operations or financial condition could be materially adversely affected. We have experienced significant decreases in our average selling prices per gigabit in recent years as noted in the table below and may continue to experience such decreases in the future. In some prior periods, average selling prices for our memory products have been below our manufacturing costs and we may experience such circumstances in the future.
|
| DRAM |
|
| Trade NAND Flash* |
|
|
|
|
|
|
|
| (percentage change in average selling prices) | |||
2014 from 2013 |
| 6% |
|
| (23)% |
2013 from 2012 |
| (11)% |
|
| (18)% |
2012 from 2011 |
| (45)% |
|
| (55)% |
2011 from 2010 |
| (39)% |
|
| (12)% |
* Trade NAND Flash excludes sales to Intel from IMFT. |
|
|
|
|
|
We may be unable to maintain or improve gross margins.
Our gross margins are dependent upon continuing decreases in per gigabit manufacturing costs achieved through improvements in our manufacturing processes, including reducing the die size of our existing products. In future periods, we may be unable to reduce our per gigabit manufacturing costs at sufficient levels to maintain or improve gross margins. Factors that may limit our ability to reduce costs include, but are not limited to, strategic product diversification decisions affecting product mix, the increasing complexity of manufacturing processes, difficulty in transitioning to smaller line-width process technologies, technological barriers and changes in process technologies or products that may require relatively larger die sizes. Per gigabit manufacturing costs may also be affected by the relatively smaller production quantities and shorter product lifecycles of certain specialty memory products.
The semiconductor memory industry is highly competitive.
We face intense competition in the semiconductor memory market from a number of companies, including Samsung Electronics Co., Ltd.; SanDisk Corporation; SK Hynix Inc. and Toshiba Corporation. Some of our competitors are large corporations or conglomerates that may have greater resources to withstand downturns in the semiconductor markets in which we compete, invest in technology and capitalize on growth opportunities. Consolidation of industry competitors could put us at a competitive disadvantage. In addition, some governments, such as China, may be considering providing, or have provided, significant financial assistance to some of our competitors or to new entrants. Our competitors seek to increase silicon capacity, improve yields, reduce die size and minimize mask levels in their product designs. Transitions to smaller line-width process technologies and product and process improvements have resulted in significant increases in the worldwide supply of semiconductor memory. Increases in worldwide supply of semiconductor memory also result from semiconductor memory fab capacity expansions, either by way of new facilities, increased capacity utilization or reallocation of other semiconductor production to semiconductor memory production. Our competitors may increase capital expenditures resulting in future increases in worldwide supply. Increases in worldwide supply of semiconductor memory, if not accompanied by commensurate increases in demand, would lead to further declines in average selling prices for our products and would materially adversely affect our business, results of operations or financial condition.
11
Our Inotera Supply Agreement involves numerous risks.
We have a supply agreement with Inotera (the "Inotera Supply Agreement") under which we are obligated to purchase substantially all of Inotera's DRAM output over an initial three-year term at a purchase price based on a discount from market prices for our comparable components, currently through December 2016. The Inotera Supply Agreement contemplates annual negotiations with respect to potential successive one-year extensions, and if the parties do not agree to an extension, the agreement will terminate following the end of the then-existing term plus a subsequent three-year wind-down period. In the event of a wind-down, our share of Inotera's capacity would decline over the wind-down period. We are currently in negotiations regarding the extension of the Inotera Supply Agreement. There can be no assurance that we will be able to reach an agreement. Our Inotera Supply Agreement involves numerous additional risks including the following:
• | higher costs for supply obtained under the Inotera Supply Agreement as compared to our wholly-owned facilities; |
• | difficulties and delays in ramping production at Inotera; |
• | difficulties in transferring technology to Inotera; and |
• | difficulties in coming to an agreement with Nanya regarding major corporate decisions, such as capital expenditures or capital structure. |
For 2014, we purchased $2.68 billion of DRAM products from Inotera and our supply from Inotera accounted for 38% of our aggregate DRAM gigabit production. If our supply of DRAM from Inotera is impacted, our business, results of operations or financial condition could be materially adversely affected.
Debt obligations could adversely affect our financial condition.
We are engaged in a capital intensive business subject to significant changes in supply and demand and product pricing and recent periods of consolidation, any of which could result in our incurrence or assumption of indebtedness. In recent periods, our debt levels have increased. As of August 28, 2014 , we had debt with a carrying value of $6.59 billion. In addition, the conversion value in excess of principal amount for our convertible notes outstanding as of August 28, 2014 was $2.99 billion. In 2014, we paid $2.30 billion to repurchase and settle conversion obligations for convertible notes with a principal amount of $1.09 billion. In the first quarter of 2015, we paid $389 million to settle conversion obligations for convertible notes with a principal amount of $114 million as of August 28, 2014 . As of August 28, 2014 , we had two credit facilities available that provide for up to $408 million of additional financing, subject to outstanding balances of trade receivables and other conditions. Events and circumstances may occur which would cause us to not be able to satisfy the applicable drawdown conditions and utilize either of these facilities. We have in the past and expect in the future to continue to incur additional debt to finance our capital investments, including debt incurred in connection with asset-backed financing.
Our debt obligations could adversely impact us. For example, these obligations could:
• | require us to use a large portion of our cash flow to pay principal and interest on debt, which will reduce the amount of cash flow available to fund working capital, capital expenditures, acquisitions, research and development expenditures and other business activities; |
• | continue to dilute our earnings per share as a result of the conversion provisions in our convertible notes; |
• | require us to continue to pay cash amounts substantially in excess of the principal amounts upon settlement of our convertible notes to minimize dilution of our earnings per share; |
• | limit our future ability to raise funds for capital expenditures, strategic acquisitions or business opportunities, research and development and other general corporate requirements; |
• | contribute to a future downgrade of our credit rating, which could increase future borrowing costs; and |
• | increase our vulnerability to adverse economic and semiconductor memory industry conditions. |
Our ability to meet our payment obligations under our debt instruments depends on our ability to generate significant cash flow in the future. This, to some extent, is subject to general economic, financial, competitive, legislative and regulatory factors as well as other factors that are beyond our control. There can be no assurance that our business will generate cash flow from operations, or that additional capital will be available to us, in an amount sufficient to enable us to meet our debt payment obligations and to fund other liquidity needs. If we are unable to generate sufficient cash flow to service our debt obligations, we may need to refinance or restructure our debt, sell assets, reduce or delay capital investments, or seek to raise additional capital. If we were unable to implement one or more of these alternatives, we may be unable to meet our debt payment obligations, which could have a material adverse effect on our business and results of operations.
12
We may be unable to generate sufficient cash flows or obtain access to external financing necessary to fund our operations, make scheduled debt payments and make adequate capital investments.
Our cash flows from operations depend primarily on the volume of semiconductor memory sold, average selling prices and per unit manufacturing costs. To develop new product and process technologies, support future growth, achieve operating efficiencies and maintain product quality, we must make significant capital investments in manufacturing technology, capital equipment, facilities, R&D and product and process technology. We estimate that capital spending for 2015 will be approximately $3.6 billion to $4.0 billion. In addition, as a result of the MMJ Acquisition, we believe that our future capital spending will be higher than our historical levels as we integrate our manufacturing operations and support the increase of capacity resulting from the transaction. As of August 28, 2014 , we had cash and equivalents of $4.15 billion, short-term investments of $384 million and long-term marketable investments of $819 million. Cash and investments included $1.60 billion held by MMJ and its consolidated subsidiaries and $84 million held by IMFT, none of which is generally available to finance our other operations.
As a result of the corporate reorganization proceedings with the Japan Court under the Corporate Reorganization Act of Japan (the "Japan Proceedings"), for so long as such proceedings are continuing, the MMJ Companies and their subsidiaries are subject to certain restrictions on dividends, loans and advances. The plans of reorganization of the MMJ Companies prohibit the MMJ Companies from paying dividends, including any cash dividends, to us and require that excess earnings be used in their businesses or to fund the MMJ Companies' installment payments. These prohibitions would also effectively prevent the subsidiaries of the MMJ Companies from paying cash dividends to us in respect of the shares of such subsidiaries owned by the MMJ Companies, as any such dividends would have to be first paid to the MMJ Companies which are prohibited from repaying those amounts to us as dividends under the plans of reorganization. In addition, pursuant to an order of the Japan Court, the MMJ Companies cannot make loans or advances, other than certain ordinary course advances, to us without the consent of the Japan Court. Moreover, loans or advances by subsidiaries of the MMJ Companies may be considered outside of the ordinary course of business and subject to approval of the legal trustees and Japan Court. As a result, the assets of the MMJ Companies and their subsidiaries, while available to satisfy the MMJ Companies' installment payments and the other obligations, capital expenditures and other operating needs of the MMJ Companies and their subsidiaries, are not available for use by us in our other operations. Furthermore, certain uses of the assets of the MMJ Companies, including investments in certain capital expenditures in MMT, may require consent of MMJ's trustees and/or the Japan Court.
In the past we have utilized external sources of financing when needed. As a result of our current debt levels, expected debt amortization and general economic conditions, it may be difficult for us to obtain financing on terms acceptable to us. There can be no assurance that we will be able to generate sufficient cash flows, use cash held by MMJ to fund its capital expenditures, access capital markets or find other sources of financing to fund our operations, make debt amortization payments and make adequate capital investments to remain competitive in terms of technology development and cost efficiency. Our inability to do the foregoing could have a material adverse effect on our business and results of operations.
The acquisition of our ownership interest in Inotera from Qimonda has been challenged by the administrator of the insolvency proceedings for Qimonda.
On January 20, 2011, Dr. Michael Jaffé, administrator for Qimonda insolvency proceedings, filed suit against MTI and Micron Semiconductor B.V., our Netherlands subsidiary ("Micron B.V."), in the District Court of Munich, Civil Chamber. The complaint seeks to void under Section 133 of the German Insolvency Act a share purchase agreement between Micron B.V. and Qimonda signed in fall 2008 pursuant to which Micron B.V. purchased substantially all of Qimonda's shares of Inotera Memories, Inc. (the "Inotera Shares"), representing approximately 55% of our total shares in Inotera, and seeks an order requiring us to retransfer those shares to the Qimonda estate. The complaint also seeks, among other things, to recover damages for the alleged value of the joint venture relationship with Inotera and to terminate under Sections 103 or 133 of the German Insolvency Code a patent cross-license between us and Qimonda entered into at the same time as the share purchase agreement.
13
Following a series of hearings with pleadings, arguments and witnesses on behalf of the Qimonda estate, on March 13, 2014, the Court issued judgments: (1) ordering Micron B.V. to pay approximately $1 million in respect of certain Inotera shares sold in connection with the original share purchase; (2) ordering Micron B.V. to disclose certain information with respect to any Inotera Shares sold by it to third parties; (3) ordering Micron B.V. to disclose the benefits derived by it from ownership of the Inotera Shares, including in particular, any profits distributed on such shares and all other benefits; (4) denying Qimonda's claims against Micron Technology for any damages relating to the joint venture relationship with Inotera; and (5) determining that Qimonda's obligations under the patent cross-license agreement are cancelled. In addition, the Court issued interlocutory judgments ordering, among other things: (1) that Micron B.V. transfer to the Qimonda estate the Inotera Shares still owned by it and pay to the Qimonda estate compensation in an amount to be specified for any Inotera Shares sold to third parties; and (2) that Micron B.V. pay the Qimonda estate as compensation an amount to be specified for benefits derived by it from ownership of the Inotera Shares. The interlocutory judgments have no immediate, enforceable effect on us, and, accordingly, we expect to be able to continue to operate with full control of the Inotera Shares subject to further developments in the case. We have filed a notice of appeal, and the parties have submitted briefs to the appeals court. A hearing on the matter is scheduled for February 2, 2015.
We are unable to predict the outcome of the matter and therefore cannot estimate the range of possible loss. The final resolution of this lawsuit could result in the loss of the Inotera shares or equivalent monetary damages, unspecified damages based on the benefits derived by Micron B.V. from the ownership of the Inotera Shares, and/or the termination of the patent cross-license, which could have a material adverse effect on our business, results of operation or financial condition. As of August 28, 2014, the Inotera Shares had a carrying value for purposes of our financial reporting of $505 million and a market value of $2.06 billion.
Our future success depends on our ability to develop and produce competitive new memory technologies.
Our key semiconductor memory technologies of DRAM, NAND Flash and NOR Flash face technological barriers to continue to meet long-term customer needs. These barriers include potential limitations on the ability to shrink products in order to reduce costs, meet higher density requirements and improve power consumption and reliability. To meet these requirements, we expect that new memory technologies will be developed by the semiconductor memory industry. Our competitors are working to develop new memory technologies that may offer performance and/or cost advantages to our existing memory technologies and render existing technologies obsolete. Accordingly, our future success may depend on our ability to develop and produce viable and competitive new memory technologies . There can be no assurance of the following:
• | that we will be successful in developing competitive new semiconductor memory technologies; |
• | that we will be able to cost-effectively manufacture new products; |
• | that we will be able to successfully market these technologies; and |
• | that margins generated from sales of these products will allow us to recover costs of development efforts. |
If our efforts to develop new semiconductor memory technologies are unsuccessful, our business, results of operations or financial condition may be materially adversely affected.
New product development may be unsuccessful.
We are developing new products that complement our traditional memory products or leverage their underlying design or process technology. We have made significant investments in product and process technologies and anticipate expending significant resources for new semiconductor product development, including system-level memory products, over the next several years. The process to develop DRAM, NAND Flash, NOR Flash and certain specialty memory products requires us to demonstrate advanced functionality and performance, many times well in advance of a planned ramp of production, in order to secure design wins with our customers. There can be no assurance that our product development efforts will be successful, that we will be able to cost-effectively manufacture new products, that we will be able to successfully market these products or that margins generated from sales of these products will allow us to recover costs of development efforts.
14
Products that fail to meet specifications, are defective or that are otherwise incompatible with end uses could impose significant costs on us.
Products that do not meet specifications or that contain, or are perceived by our customers to contain, defects or that are otherwise incompatible with end uses could impose significant costs on us or otherwise materially adversely affect our business, results of operations or financial condition. From time to time we experience problems with nonconforming, defective or incompatible products after we have shipped such products. In recent periods we have further diversified and expanded our product offerings which could potentially increase the chance that one or more of our products could fail to meet specifications in a particular application. As a result of these problems we could be adversely affected in several ways, including the following:
• | we may be required to compensate customers for costs incurred or damages caused by defective or incompatible product or replace products; |
• | we could incur a decrease in revenue or adjustment to pricing commensurate with the reimbursement of such costs or alleged damages; and |
• | we may encounter adverse publicity, which could cause a decrease in sales of our products. |
A determination that our products or manufacturing processes infringe the intellectual property rights of others or entering into a license agreement covering such intellectual property could materially adversely affect our business, results of operations or financial condition.
As is typical in the semiconductor and other high technology industries, from time to time others have asserted, and may in the future assert, that our products or manufacturing processes infringe their intellectual property rights. We are unable to predict the outcome of assertions of infringement made against us. A court determination that our products or manufacturing processes infringe the intellectual property rights of others could result in significant liability and/or require us to make material changes to our products and/or manufacturing processes. Any of the foregoing results could have a material adverse effect on our business, results of operations or financial condition. (See "Item 1. Legal Proceedings.")
We have a number of intellectual property license agreements. Some of these license agreements require us to make one time or periodic payments. We may need to obtain additional patent licenses or renew existing license agreements in the future. We are unable to predict whether these license agreements can be obtained or renewed on acceptable terms.
Our joint ventures and strategic relationships involve numerous risks.
We have entered into strategic relationships to manufacture products and develop new manufacturing process technologies and products. These relationships include our IMFT NAND Flash joint venture with Intel, our Inotera DRAM joint venture with Nanya and our MP Mask joint venture with Photronics. These joint ventures and strategic relationships are subject to various risks that could adversely affect the value of our investments and our results of operations. These risks include the following:
• | our interests could diverge from our partners or we may not be able to agree with partners on ongoing manufacturing and operational activities, or on the amount, timing or nature of further investments in our joint venture; |
• | we may experience difficulties in transferring technology to joint ventures; |
• | we may experience difficulties and delays in ramping production at joint ventures; |
• | our control over the operations of our joint ventures is limited; |
• | we may recognize losses from our equity method investments in future periods; |
• | due to financial constraints, our joint venture partners may be unable to meet their commitments to us or our joint ventures and may pose credit risks for our transactions with them; |
• | due to differing business models or long-term business goals, our partners may decide not to join us in funding capital investment by our joint ventures, which may result in higher levels of cash expenditures by us; |
• | cash flows may be inadequate to fund increased capital requirements; |
• | we may experience difficulties or delays in collecting amounts due to us from our joint ventures and partners; |
• | the terms of our partnering arrangements may turn out to be unfavorable; and |
• | changes in tax, legal or regulatory requirements may necessitate changes in the agreements with our partners. |
If our joint ventures and strategic relationships are unsuccessful, our business, results of operations or financial condition may be materially adversely affected.
15
The operations of the MMJ Companies will be subject to continued oversight by the Japan Court during the pendency of the corporate reorganization proceedings.
Because the plans of reorganization of the MMJ Companies provide for ongoing payments to creditors following the closing of our acquisition of MMJ, the Japan Proceedings are continuing, and the MMJ Companies remain subject to the oversight of the Japan Court and of the trustees (including a trustee designated by us, who we refer to as the business trustee, and a trustee designated by the Japan Court, who we refer to as the legal trustee), pending completion of the Japan Proceedings. The Japan Proceedings and oversight of the Japan Court are expected to continue until the final creditor payment is made under the MMJ Companies' plans of reorganization, which is scheduled to occur in December 2019, but may occur on a later date to the extent any claims of creditors remain unfixed on the final scheduled installment payment date. Although we may be able to petition the court to terminate the Japan Proceedings once two-thirds of all payments under the plans of reorganization are made, there can be no assurance that the Japan Court will grant any such petition.
During the pendency of the Japan Proceedings, the MMJ Companies are obligated to provide periodic financial reports to the Japan Court and may be required to obtain the consent of the Japan Court prior to taking a number of significant actions relating to their businesses, including transferring or disposing of, or acquiring, certain material assets, incurring or guaranteeing material indebtedness, settling disputes or entering into certain material agreements. The consent of the legal trustee may also be required for matters that would likely have a material impact on the operations or assets of the MMJ Companies and their subsidiaries or for transfers of material assets, to the extent the matters or transfers would reasonably be expected to materially and adversely affect execution of the plans of reorganization of the MMJ Companies. Accordingly, during the pendency of the Japan Proceedings, our ability to effectively integrate the MMJ Companies as part of our global operations or to cause the MMJ Companies to take certain actions that we deem advisable for their businesses could be adversely affected if the Japan Court or the legal trustee is unwilling to consent to various actions that we may wish to take with respect to the MMJ Companies.
If our manufacturing process is disrupted, our business, results of operations or financial condition could be materially adversely affected.
We manufacture products using highly complex processes that require technologically advanced equipment and continuous modification to improve yields and performance. Difficulties in the manufacturing process or the effects from a shift in product mix can reduce yields or disrupt production and may increase our per gigabit manufacturing costs. We maintain operations and continuously implement new product and process technology at our manufacturing operations which are widely dispersed in multiple locations in several countries including the U.S., Singapore, Taiwan, Japan and China. Additionally, our control over operations at our IMFT, Inotera, MP Mask and Tera Probe joint ventures is limited by our agreements with our partners. From time to time, we have experienced disruptions in our manufacturing process as a result of power outages, improperly functioning equipment, equipment failures, earthquakes or other environmental acts. If production at a fabrication facility is disrupted for any reason, manufacturing yields may be adversely affected or we may be unable to meet our customers' requirements and they may purchase products from other suppliers. This could result in a significant increase in manufacturing costs or loss of revenues or damage to customer relationships, any of which could materially adversely affect our business, results of operations or financial condition.
We may incur additional restructure or other charges in future periods.
In recent periods, we have implemented restructure activities and may implement restructure initiatives in future periods. As a result, we could incur restructure charges (including but not limited to severance and other termination benefits, losses on disposition or impairment of equipment or other long-lived assets and inventory write downs), lose production output, lose key personnel and experience disruptions in our operations and difficulties in the timely delivery of products. In connection with these actions, we recorded charges of $40 million for 2014 and $126 million for 2013. We do not anticipate incurring any significant additional costs for these prior restructure activities. We may incur additional restructure charges or other losses associated with other initiatives in future periods.
16
Changes in foreign currency exchange rates could materially adversely affect our business, results of operations or financial condition.
Across our multi-national operations, there are transactions and balances denominated in currencies other than the U.S. dollar (our reporting currency), primarily the euro, the Singapore dollar, the New Taiwan dollar, the yen and the yuan. We recorded net losses from changes in currency exchange rates of $28 million for 2014 and $229 million for 2013. Based on our foreign currency exposures from monetary assets and liabilities, offset by balance sheet hedges, we estimate that a 10% adverse change in exchange rates versus the U.S. dollar would result in losses of approximately $7 million as of August 28, 2014 . In addition, a significant portion of our manufacturing costs are denominated in foreign currencies. Exchange rates for some of these currencies against the U.S. dollar, particularly the yen, have been volatile in recent periods. If these currencies strengthen against the U.S. dollar, our manufacturing costs could significantly increase. In the event that the exchange rates for U.S. dollar adversely change against our foreign currency exposures in the euro, Singapore dollar, New Taiwan dollar, the yen and the yuan, our results of operations or financial condition may be adversely affected.
We may make future acquisitions and/or alliances, which involve numerous risks.
Acquisitions and the formation or operation of alliances, such as joint ventures and other partnering arrangements, involve numerous risks including the following:
• | integrating the operations, technologies and products of acquired or newly formed entities into our operations; |
• | increasing capital expenditures to upgrade and maintain facilities; |
• | increased debt levels; |
• | the assumption of unknown or underestimated liabilities; |
• | the use of cash to finance a transaction, which may reduce the availability of cash to fund working capital, capital expenditures, research and development expenditures and other business activities; |
• | diverting management's attention from normal daily operations; |
• | managing larger or more complex operations and facilities and employees in separate and diverse geographic areas; |
• | hiring and retaining key employees; |
• | requirements imposed by governmental authorities in connection with the regulatory review of a transaction, which may include, among other things, divestitures or restrictions on the conduct of our business or the acquired business; |
• | inability to realize synergies or other expected benefits; |
• | failure to maintain customer, vendor and other relationships; |
• | inadequacy or ineffectiveness of an acquired company's internal financial controls, disclosure controls and procedures, and/or environmental, health and safety, anti-corruption, human resource, or other policies or practices; and |
• | impairment of acquired intangible assets and goodwill as a result of changing business conditions, technological advancements or worse-than-expected performance of the acquired business. |
In recent years, supply of memory products has significantly exceeded customer demand resulting in significant declines in average selling prices for DRAM, NAND Flash and NOR Flash products. Resulting operating losses have led to the deterioration in the financial condition of a number of industry participants, including the liquidation of Qimonda and the 2012 bankruptcy filing by Elpida (now known as MMJ). These types of proceedings often lead to court-directed processes involving the sale of related businesses or assets. We believe the global memory industry is experiencing a period of consolidation as a result of these market conditions and other factors, and we may engage in discussions regarding potential acquisitions and similar opportunities arising out of these industry conditions. To the extent we are successful in completing any such transactions, we could be subject to some or all of the risks described above, including the risks pertaining to funding, assumption of liabilities, integration challenges and increases in debt that may accompany such transactions. Acquisitions of, or alliances with, high-technology companies are inherently risky and may not be successful and may materially adversely affect our business, results of operations or financial condition.
17
The limited availability of raw materials, supplies or capital equipment could materially adversely affect our business, results of operations or financial condition.
Our operations require raw materials, and in certain cases, third party services, that meet exacting standards. We generally have multiple sources of supply for our raw materials and services. However, only a limited number of suppliers are capable of delivering certain raw materials and services that meet our standards. In some cases, materials, components or services are provided by a single supplier. Various factors could reduce the availability of raw materials or components such as silicon wafers, controllers, photomasks, chemicals, gases, photoresist, lead frames and molding compound. Shortages may occur from time to time in the future. We and/or our suppliers could be affected by laws and regulations enacted in response to concerns regarding climate change, which could increase the cost and limit the supply of our raw materials. In addition, disruptions in transportation lines could delay our receipt of raw materials. Lead times for the supply of raw materials have been extended in the past. If our supply of raw materials or services is disrupted or our lead times extended, our business, results of operations or financial condition could be materially adversely affected.
Our operations are dependent on our ability to procure advanced semiconductor manufacturing equipment that enables the transition to lower cost manufacturing processes. For certain key types of equipment, including photolithography tools, we are sometimes dependent on a single supplier. From time to time we have experienced difficulties in obtaining some equipment on a timely basis due to the supplier's limited capacity. Our inability to timely obtain this equipment could adversely affect our ability to transition to next generation manufacturing processes and reduce costs. Delays in obtaining equipment could also impede our ability to ramp production at new facilities and increase our overall costs of the ramp. If we are unable to timely obtain advanced semiconductor manufacturing equipment, our business, results of operations or financial condition could be materially adversely affected.
We may incur additional tax expense or become subject to additional tax exposure.
We are subject to income taxes in the United States and numerous foreign jurisdictions, including among others, Singapore, where we currently have arrangements that allow us to compute our tax provision at rates below the local statutory rates. Our domestic and international taxes are dependent upon the distribution of our earnings among these different jurisdictions. Our provision for income taxes and cash tax liabilities in the future could be adversely affected by numerous factors, including challenges by tax authorities to our tax structure, income before taxes being lower than anticipated in countries with lower statutory tax rates and higher than anticipated in countries with higher statutory tax rates, changes in the valuation of deferred tax assets and liabilities and changes in tax laws and regulations. We and our subsidiaries file income tax returns with the U.S. federal government, various U.S. states and various foreign jurisdictions throughout the world. Our U.S. federal and state tax returns remain open to examination for 2010 through 2014. In addition, tax returns open to examination in multiple foreign taxing jurisdictions range from the years 2005 to 2014. The results of audits and examinations of previously filed tax returns and continuing assessments of our tax exposures may have an adverse effect on our provision for income taxes and cash tax liability.
We may not utilize all of our net deferred tax assets.
We have substantial deferred tax assets, which include, among others, net operating loss and credit carryforwards. As of August 28, 2014 , our U.S. federal and state net operating loss carryforwards, including uncertain tax benefits, were $3.89 billion and $1.71 billion , respectively, which, if not utilized, will expire at various dates from 2015 through 2033. As of August 28, 2014 , our foreign net operating loss carryforwards were $5.37 billion, including $3.95 billion pertaining to Japan, which, if not utilized, substantially all will expire at various dates from 2018 through 2023. As of August 28, 2014 , we had valuation allowances of $1.29 billion and $979 million against our net deferred tax assets in the U.S. and Japan, respectively.
A downturn in the worldwide economy may harm our business.
Downturns in the worldwide economy have harmed our business in the past and future downturns could also adversely affect our business. Adverse economic conditions affect demand for devices that incorporate our products, such as personal computers, mobile devices, solid-state drives and servers. Reduced demand for these products could result in significant decreases in our average selling prices and product sales. A deterioration of current conditions in worldwide credit markets could limit our ability to obtain external financing to fund our operations and capital expenditures. In addition, we may experience losses on our holdings of cash and investments due to failures of financial institutions and other parties. Difficult economic conditions may also result in a higher rate of loss on our accounts receivables due to credit defaults. As a result, our business, results of operations or financial condition could be materially adversely affected.
18
Our results of operations could be affected by natural disasters and other events in the locations in which we or our customers or suppliers operate.
We have manufacturing and other operations in locations subject to natural occurrences such as severe weather and geological events including earthquakes or tsunamis that could disrupt operations. In addition, our suppliers and customers also have operations in such locations. A natural disaster, fire, explosion or other event that results in a prolonged disruption to our operations, or the operations of our customers or suppliers, may materially adversely affect our business, results of operations or financial condition.
We face risks associated with our international sales and operations that could materially adversely affect our business, results of operations or financial condition.
Sales to customers outside the United States approximated 84% of our consolidated net sales for 2014. In addition, a substantial portion of our manufacturing operations are located outside the United States. In particular, a significant portion of our manufacturing operations are concentrated in Taiwan, Singapore and Japan. Our international sales and operations are subject to a variety of risks, including:
• | export and import duties, changes to import and export regulations, customs regulations and processes and restrictions on the transfer of funds; |
• | compliance with U.S. and international laws involving international operations, including the Foreign Corrupt Practices Act, export control laws and similar rules and regulations; |
• | political and economic instability; |
• | problems with the transportation or delivery of our products; |
• | issues arising from cultural or language differences and labor unrest; |
• | longer payment cycles and greater difficulty in collecting accounts receivable; |
• | compliance with trade, technical standards and other laws in a variety of jurisdictions; |
• | contractual and regulatory limitations on our ability to maintain flexibility with our staffing levels; |
• | disruptions to our manufacturing operations as a result of actions imposed by foreign governments; |
• | changes in economic policies of foreign governments; and |
• | difficulties in staffing and managing international operations. |
These factors may materially adversely affect our business, results of operations or financial condition.
Breaches of our network security could expose us to losses.
We manage and store on our network systems various proprietary information and sensitive or confidential data relating to our operations. We also process, store, and transmit large amounts of data relating to our customers and employees, including sensitive personal information. Computer programmers and hackers may be able to gain unauthorized access to our network system and steal proprietary information, compromise confidential information, create system disruptions, or cause shutdowns. These parties may also be able to develop and deploy viruses, worms, and other malicious software programs that disrupt our operations and create security vulnerabilities. Attacks on our network systems could result in significant losses and damage our reputation with customers.
We are subject to counterparty default risks.
We have numerous arrangements with financial institutions that subject us to counterparty default risks, including cash deposits, investments, capped-call contracts on our stock and derivative instruments. As a result, we are subject to the risk that the counterparty to one or more of these arrangements will default on its performance obligations. A counterparty may not comply with their contractual commitments which could then lead to their defaulting on their obligations with little or no notice to us, which could limit our ability to take action to mitigate our exposure. Additionally, our ability to mitigate our exposures may be constrained by the terms of our contractual arrangements or because market conditions prevent us from taking effective action. If one of our counterparties becomes insolvent or files for bankruptcy, our ability to recover any losses suffered as a result of that counterparty's default may be limited by the liquidity of the counterparty or the applicable laws governing the bankruptcy proceeding. In the event of such default, we could incur significant losses, which could adversely impact our business, results of operations or financial condition.
19
Compliance with new regulations regarding the use of conflict minerals could limit the supply and increase the cost of certain metals used in manufacturing our products.
Increased focus on environmental protection and social responsibility initiatives led to the passage of Section 1502 of the Dodd-Frank Wall Street Reform and Consumer Protection Act of 2010 (the "Dodd-Frank Act") and its implementing SEC regulations. The Dodd-Frank Act imposes new supply chain diligence and disclosure requirements for certain manufacturers of products containing specific minerals that may originate in or near the Democratic Republic of the Congo (the "DRC") and finance or benefit local armed groups. These "conflict minerals" are commonly found in materials used in the manufacture of semiconductors. The implementation of these new regulations may limit the sourcing and availability of some of these materials. This in turn may affect our ability to obtain materials necessary for the manufacture of our products in sufficient quantities and may affect related material pricing. Some of our customers may elect to disqualify us as a supplier if we are unable to verify that our products are DRC conflict free.
ITEM 1B. UNRESOLVED STAFF COMMENTS
None.
ITEM 2. PROPERTIES
Our corporate headquarters are located in Boise, Idaho. The following is a summary of our principal facilities as of August 28, 2014 :
Location |
| Principal Operations |
Boise, Idaho |
| R&D, including wafer fabrication; reticle manufacturing; test and module assembly |
Lehi, Utah |
| Wafer fabrication |
Manassas, Virginia |
| Wafer fabrication |
Singapore |
| Three wafer fabrication facilities and a test, assembly and module assembly facility |
Aguadilla, Puerto Rico |
| Module assembly and test |
Xi'an, China |
| Module assembly and test |
Muar, Malaysia |
| Assembly and test |
Taichung City, Taiwan |
| Wafer fabrication |
Hiroshima, Japan |
| Wafer fabrication |
Akita, Japan |
| Module assembly and test |
Substantially all of the capacity of the facilities listed above is fully utilized. Our Inotera joint venture has a 300mm wafer fabrication facility in Kueishan, Taiwan. Under our supply agreement with Inotera, we purchase substantially all of the output of Inotera. We also own and lease a number of other facilities in locations throughout the world that are used for design, research and development, and sales and marketing activities.
In December 2013, we sold our 200mm wafer fabrication equipment in Kiryat Gat, Israel to Intel and terminated the related facility lease with Intel. Intel manufactured wafers for us at the Kiryat Gat facility through 2014 through a series of arrangements.
Our facility in Lehi is owned and operated by our IMFT joint venture with Intel. (See "Part II – Item 8. Financial Statements and Supplementary Data – Notes to Consolidated Financial Statements – Equity – Noncontrolling Interests in Subsidiaries – IMFT" note.)
We believe that our existing facilities are suitable and adequate for our present purposes. We do not identify or allocate assets by operating segment. (See "Part II – Item 8. Financial Statements and Supplementary Data – Notes to Consolidated Financial Statements – Geographic Information" note.)
20
ITEM 3. LEGAL PROCEEDINGS
Reorganization Proceedings of the MMJ Companies
On July 31, 2013, we completed the acquisition of Elpida, now known as MMJ, a Japanese corporation, pursuant to the terms and conditions of an Agreement on Support for Reorganization Companies (as amended, the "Sponsor Agreement") that we entered into on July 2, 2012 with the trustees of the MMJ Companies' pending corporate reorganization proceedings under the Corporate Reorganization Act of Japan.
The MMJ Companies filed petitions for commencement of corporate reorganization proceedings with the Japan Court under the Corporate Reorganization Act of Japan on February 27, 2012, and the Japan Court issued an order to commence the reorganization proceedings (the "Japan Proceedings") on March 23, 2012. On July 2, 2012, we entered into the Sponsor Agreement with the legal trustees of the MMJ Companies and the Japan Court approved the Sponsor Agreement. Under the Sponsor Agreement, we agreed to provide certain support for the reorganization of the MMJ Companies and the trustees agreed to prepare and seek approval from the Japan Court and the MMJ Companies' creditors of plans of reorganization consistent with such support.
The trustees initially submitted the proposed plans of reorganization for the MMJ Companies to the Japan Court on August 21, 2012 and submitted final proposed plans on October 29, 2012. On October 31, 2012, the Japan Court approved submission of the trustees' proposed plans of reorganization to creditors for approval. On February 26, 2013, the MMJ Companies' creditors approved the reorganization plans and on February 28, 2013, the Japan Court issued an order approving the plans of reorganization. Appeals filed by certain creditors of MMJ in Japan challenging the plan approval order issued by the Japan Court were denied.
In a related action, MMJ filed a Verified Petition for Recognition and Chapter 15 Relief in the United States Bankruptcy Court for the District of Delaware (the "U.S. Court") on March 19, 2012 and, on April 24, 2012, the U.S. Court entered an order that, among other things, recognized MMJ's corporate reorganization proceeding as a foreign main proceeding pursuant to 11 U.S.C. § 1517(b). On June 25, 2013, the U.S. Court issued a recognition order, which recognized the order of the Japan Court approving MMJ's plan of reorganization. On November 19, 2013, the U.S. Court closed the U.S. Chapter 15 proceeding.
The plans of reorganization provide for payments by the MMJ Companies to their secured and unsecured creditors in an aggregate amount of 200 billion yen, less certain expenses of the reorganization proceedings and certain other items. The plans of reorganization also provided for the investment by us pursuant to the Sponsor Agreement of 60 billion yen ($615 million) paid at closing in cash into MMJ in exchange for 100% ownership of MMJ's equity and the use of such investment to fund the initial installment payment by the MMJ Companies to their creditors of 60 billion yen, subject to reduction for certain items specified in the Sponsor Agreement and plans of reorganization.
Under MMJ's plan of reorganization, secured creditors will recover 100% of the amount of their fixed claims and unsecured creditors will recover at least 17.4% of the amount of their fixed claims. The actual recovery of unsecured creditors will be higher, however, based, in part, on events and circumstances occurring following the plan approval. The remaining portion of the unsecured claims will be discharged, without payment, over the period that payments are made pursuant to the plans of reorganization. The secured creditors will be paid in full on or before the sixth installment payment date, while the unsecured creditors will be paid in seven installments. MAI's plan of reorganization provides that secured creditors will recover 100% of the amount of their claims, whereas unsecured creditors will recover 19% of the amount of their claims. The secured creditors of MAI were paid in full on the first installment payment date, while the unsecured creditors will be paid in seven installments.
21
Because the plans of reorganization of the MMJ Companies provide for ongoing payments to creditors following the closing of the MMJ acquisition, the Japan Proceedings are continuing and the MMJ Companies remain subject to the oversight of the Japan Court and of the trustees (including a trustee designated by us, who we refer to as the business trustee, and a trustee designated by the Japan Court, who we refer to as the legal trustee), pending completion of the reorganization proceedings. The business trustee will make decisions in relation to the operation of the businesses of the MMJ Companies, other than decisions in relation to acts that need to be carried out in connection with the Japan Proceedings, which will be the responsibility of the legal trustee. The Japan Proceedings and oversight of the Japan Court will continue until the final creditor payment is made under the MMJ Companies' plans of reorganization, which is scheduled to occur in December 2019, but may occur on a later date to the extent any claims of creditors remain unfixed on the final scheduled installment payment date. The MMJ Companies may petition the Japan Court for an early termination of the Japan Proceedings once two-thirds of all payments under the plans of reorganization are made. Although such early terminations are customarily granted, there can be no assurance that the Japan Court will grant any such petition in these particular cases.
During the pendency of the Japan Proceedings, the MMJ Companies are obligated to provide periodic financial reports to the Japan Court and may be required to obtain the consent of the Japan Court prior to taking a number of significant actions relating to their businesses, including transferring or disposing of, or acquiring, certain material assets, incurring or guaranteeing material indebtedness, settling material disputes, or entering into certain material agreements. The consent of the legal trustee may also be required for matters that would likely have a material impact on the operations or assets of the MMJ Companies and their subsidiaries or for transfers of material assets, to the extent the matters or transfers would reasonably be expected to materially and adversely affect execution of the plans of reorganization of the MMJ Companies. Accordingly, during the pendency of the Japan Proceedings, our ability to effectively integrate the MMJ Companies as part of our global operations or to cause the MMJ Companies to take certain actions that we deem advisable for their businesses could be adversely affected if the Japan Court or the legal trustee is unwilling to consent to various actions that we may wish to take with respect to the MMJ Companies.
Rambus
On May 5, 2004, Rambus, Inc. ("Rambus") filed a complaint in the Superior Court of the State of California (San Francisco County) against us and other DRAM suppliers which alleged that the defendants harmed Rambus by engaging in concerted and unlawful efforts affecting Rambus DRAM by eliminating competition and stifling innovation in the market for computer memory technology and computer memory chips. Rambus' complaint alleged various causes of action under California state law including, among other things, a conspiracy to restrict output and fix prices, a conspiracy to monopolize, intentional interference with prospective economic advantage, and unfair competition. Rambus sought a judgment for damages of approximately $3.90 billion, joint and several liability, trebling of damages awarded, punitive damages, a permanent injunction enjoining the defendants from the conduct alleged in the complaint, interest, and attorneys' fees and costs. Trial began on June 20, 2011, and the case went to the jury on September 21, 2011. On November 16, 2011, the jury found for us on all claims. On April 2, 2012, Rambus filed a notice of appeal to the California 1st District Court of Appeal.
We were engaged in litigation with Rambus relating to certain of Rambus' patents and certain of our claims and defenses. Our lawsuits with Rambus related to patent matters were pending in the U.S. District Court for the District of Delaware, U.S. District Court for the Northern District of California, Germany, France, and Italy.
In December 2013, we settled all pending litigation between us and Rambus, including all antitrust and patent matters. We also entered into a seven-year term patent cross-license agreement with Rambus that allows us to avoid costs of patent-related litigation during the term. We agreed to pay Rambus up to $10 million per quarter over seven years, for a total of $280 million, beginning in the second quarter of 2014. The primary benefits we received from these arrangements were (1) the settlement and termination of all existing litigation, (2) the avoidance of future litigation expenses and (3) the avoidance of future management and customer disruptions. As a result, other operating expense for the first quarter of 2014 included a $233 million charge to accrue a liability, which reflects the discounted value of amounts due under this arrangement.
22
Patent Matters
On September 1, 2011, HSM Portfolio LLC and Technology Properties Limited LLC filed a patent infringement action in the U.S. District Court for the District of Delaware against us and seventeen other defendants, including MMJ and Elpida Memory (USA) Inc. On August 22, 2013, the plaintiffs filed a third amended complaint. The third amended complaint alleges that certain of our DRAM and image sensor products infringe four U.S. patents and that certain MMJ and Elpida Memory (USA) Inc. DRAM products infringe two U.S. patents and seeks damages, attorneys' fees, and costs. Trial currently is scheduled for February 22, 2016. On March 23, 2012, MMJ and Elpida Memory (USA) Inc. filed a Notice of Filing and Hearing on Petition Under Chapter 15 of the U.S. Bankruptcy Code and Issuance of Provisional Relief that included an order of the U.S. Bankruptcy Court for the District of Delaware staying judicial proceedings against MMJ and Elpida Memory (USA) Inc. Accordingly, the plaintiffs' case against MMJ and Elpida Memory (USA) was stayed. On June 25, 2013, the U.S. Bankruptcy Court for the District of Delaware entered its Order (1) Granting Recognition of the Japanese Reorganization Plan of MMJ and the Tokyo District Court's Confirmation Orders, (2) Entrusting MMJ's U.S. Assets to Foreign Representatives and Approving Certain Plan Transactions, (3) Granting Permanent Injunction, and (4) Granting Related Relief (the "Recognition Order"). Pursuant to the Recognition Order, the plaintiffs are permanently enjoined from continuing their case against MMJ and Elpida Memory (USA) Inc. in respect of any claim or claims arising prior to the commencement of the Japan Proceeding (as defined in the Recognition Order).
On December 5, 2011, the Board of Trustees for the University of Illinois (the "University") filed a patent infringement action against us in the U.S. District Court for the Central District of Illinois. The complaint alleges that unspecified semiconductor products of ours infringe three U.S. patents and seeks injunctive relief, damages, attorneys' fees, and costs. We have filed three petitions for inter-partes review by the Patent and Trademark Office, challenging the validity of each of the patents in suit. The Patent Trial and Appeal Board ("PTAB") held a hearing in connection with the three petitions on December 9, 2013. On March 10, 2014, the PTAB issued written decisions finding that each and every claim in the three patents in suit is invalid, and cancelled all claims. The University has appealed the PTAB rulings to the U.S. Court of Appeals for the Federal Circuit.
On April 27, 2012, Semcon Tech, LLC filed a patent infringement action against us in the U.S. District Court for the District of Delaware. The complaint alleges that our use of various chemical mechanical planarization systems purchased from Applied Materials infringes a single U.S. patent and seeks injunctive relief, damages, attorneys' fees, and costs. Trial is currently scheduled for August 21, 2015.
On December 7, 2007, Tessera, Inc. filed a patent infringement action against MMJ, Elpida Memory (USA) Inc., and numerous other defendants, in the United States District Court for the Eastern District of Texas. The complaint alleges that certain MMJ and Elpida Memory (USA) Inc. products infringe four U.S. patents and seeks injunctive relief, damages, attorneys' fees, and costs. Prior to answering the complaint, MMJ and Elpida Memory (USA) Inc. and other defendants filed motions to stay the case pending final resolution of a case before the International Trade Commission ("ITC") against MMJ and Elpida Memory (USA) Inc. and other respondents, alleging infringement of the same patents asserted in the Eastern District of Texas case (In The Matter of Certain Semiconductor Chips with Minimized Chip Package Size and Products Containing Same (III), ITC No. 337-TA-630 (the "ITC Action")). On February 25, 2008, the Eastern District of Texas Court granted the defendants' motion to stay the action. On December 29, 2009, the ITC issued a Notice of Final Determination in the ITC Action finding no violation by MMJ and Elpida Memory (USA) Inc. Tessera, Inc. subsequently appealed the matter to the U.S. Court of Appeals for the Federal Circuit. On May 23, 2011, the Federal Circuit affirmed the ITC's Final Determination. Additionally, by operation of the Recognition Order, plaintiff in that action is permanently enjoined from continuing its case against MMJ and Elpida Memory (USA) in respect of any claim or claims arising prior to the commencement of the Japan Proceeding (as defined in the Recognition Order). On July 30, 2014, we entered into a five-year term patent cross-license agreement with Tessera, which also settled the pending litigation against MMJ and Elpida Memory (USA). The agreement, which requires us to make quarterly payments over its term, gives us "life-of-product" protection for specifically identified DRAM products and a term license for certain other products.
Among other things, the above lawsuits pertain to certain of our DDR, DDR2, DDR3, SDR SDRAM, PSRAM, RLDRAM, LPDRAM, NAND Flash, image sensor products and certain other memory products we manufacture, which account for a significant portion of our net sales.
23
Except for the Tessera matter discussed above, we are unable to predict the outcome of assertions of infringement made against us and therefore cannot estimate the range of possible loss. A determination that our products or manufacturing processes infringe the intellectual property rights of others or entering into a license agreement covering such intellectual property could result in significant liability and/or require us to make material changes to our products and/or manufacturing processes. Any of the foregoing could have a material adverse effect on our business, results of operations or financial condition.
Antitrust Matters
A number of purported class action price-fixing lawsuits have been filed against us and other DRAM suppliers. Four cases have been filed in the U.S. District Court for the Northern District of California asserting claims on behalf of a purported class of individuals and entities that indirectly purchased DRAM and/or products containing DRAM from various DRAM suppliers during the time period from April 1, 1999 through at least June 30, 2002. The complaints allege a conspiracy to increase DRAM prices in violation of federal and state antitrust laws and state unfair competition law, and/or unjust enrichment relating to the sale and pricing of DRAM products. The complaints seek joint and several damages, trebled, monetary damages, restitution, costs, interest and attorneys' fees. In addition, at least sixty-four cases have been filed in various state courts asserting claims on behalf of a purported class of indirect purchasers of DRAM. In July 2006, the Attorneys General for approximately forty U.S. states and territories filed suit in the U.S. District Court for the Northern District of California. The complaints allege, among other things, violations of the Sherman Act, Cartwright Act, and certain other states' consumer protection and antitrust laws and seek joint and several damages, trebled, as well as injunctive and other relief. On October 3, 2008, the California Attorney General filed a similar lawsuit in California Superior Court, purportedly on behalf of local California government entities, alleging, among other things, violations of the Cartwright Act and state unfair competition law. On June 23, 2010, we executed a settlement agreement resolving these purported class-action indirect purchaser cases and the pending cases of the Attorneys General relating to alleged DRAM price-fixing in the United States. Subject to certain conditions, we agreed to pay approximately $67 million in aggregate in three equal installments over a two-year period. We paid the full amount into an escrow account by the end of the first quarter of 2013 in accordance with the settlement agreement.
On June 21, 2010, the Brazil Secretariat of Economic Law of the Ministry of Justice ("SDE") announced that it had initiated an investigation relating to alleged anticompetitive activities within the DRAM industry. The SDE's Notice of Investigation names various DRAM manufacturers and certain executives, including us, and focuses on the period from July 1998 to June 2002.
We are unable to predict the outcome of these matters and therefore cannot estimate the range of possible loss, except as noted in the above discussion of the U.S. indirect purchaser cases. The final resolution of these alleged violations of antitrust laws could result in significant liability and could have a material adverse effect on our business, results of operations or financial condition.
Securities Matters
On July 12, 2013, seven former shareholders of Elpida (now known as MMJ) filed a complaint against Messrs. Sakamoto, Adachi, Gomi, Shirai, Tsay-Jiu, Wataki, Kinoshita, and Takahasi in their capacity as members of the board of directors of MMJ as of February 2013. The complaint alleges that the defendants engaged in various acts and misrepresentations to hide the financial condition of MMJ and deceive shareholders prior to MMJ filing a petition for corporate reorganization on February 27, 2013. The plaintiffs seek joint and several damages equal to the market value of shares owned by each of the plaintiffs on February 23, 2013, along with attorneys' fees and interest. At a hearing on September 25, 2013, the plaintiffs withdrew the complaint against Mr. Tsay-Jiu.
We are unable to predict the outcome of this matter and therefore cannot estimate the range of possible loss. The final resolution of this matter could result in significant liability and could have a material adverse effect on our business, results of operations or financial condition.
24
Qimonda
On January 20, 2011, Dr. Michael Jaffé, administrator for Qimonda insolvency proceedings, filed suit against MTI and Micron Semiconductor B.V., our Netherlands subsidiary ("Micron B.V."), in the District Court of Munich, Civil Chamber. The complaint seeks to void under Section 133 of the German Insolvency Act a share purchase agreement between Micron B.V. and Qimonda signed in fall 2008 pursuant to which Micron B.V. purchased substantially all of Qimonda's shares of Inotera Memories, Inc. (the "Inotera Shares"), representing approximately 55% of our total shares in Inotera, and seeks an order requiring us to retransfer those shares to the Qimonda estate. The complaint also seeks, among other things, to recover damages for the alleged value of the joint venture relationship with Inotera and to terminate under Sections 103 or 133 of the German Insolvency Code a patent cross-license between us and Qimonda entered into at the same time as the share purchase agreement.
Following a series of hearings with pleadings, arguments and witnesses on behalf of the Qimonda estate, on March 13, 2014, the Court issued judgments: (1) ordering Micron B.V. to pay approximately $1 million in respect of certain Inotera shares sold in connection with the original share purchase; (2) ordering Micron B.V. to disclose certain information with respect to any Inotera Shares sold by it to third parties; (3) ordering Micron B.V. to disclose the benefits derived by it from ownership of the Inotera Shares, including in particular, any profits distributed on such shares and all other benefits; (4) denying Qimonda's claims against Micron Technology for any damages relating to the joint venture relationship with Inotera; and (5) determining that Qimonda's obligations under the patent cross-license agreement are cancelled. In addition, the Court issued interlocutory judgments ordering, among other things: (1) that Micron B.V. transfer to the Qimonda estate the Inotera Shares still owned by it and pay to the Qimonda estate compensation in an amount to be specified for any Inotera Shares sold to third parties; and (2) that Micron B.V. pay the Qimonda estate as compensation an amount to be specified for benefits derived by it from ownership of the Inotera Shares. The interlocutory judgments have no immediate, enforceable effect on us, and, accordingly, we expect to be able to continue to operate with full control of the Inotera Shares subject to further developments in the case. We have filed a notice of appeal, and the parties have submitted briefs to the appeals court. A hearing on the matter is scheduled for February 2, 2015.
We are unable to predict the outcome of the matter and therefore cannot estimate the range of possible loss. The final resolution of this lawsuit could result in the loss of the Inotera Shares or equivalent monetary damages, unspecified damages based on the benefits derived by Micron B.V. from the ownership of the Inotera Shares, and/or the termination of the patent cross-license, which could have a material adverse effect on our business, results of operation or financial condition. As of August 28, 2014, the Inotera Shares had a carrying value for purposes of our financial reporting of $505 million and a market value of $2.06 billion.
(See "Item 1A. Risk Factors.")
ITEM 4. MINE SAFETY DISCLOSURES
Not Applicable.
25
PART II
ITEM 5. MARKET FOR REGISTRANT'S COMMON EQUITY, RELATED STOCKHOLDER MATTERS AND ISSUER PURCHASES OF EQUITY SECURITIES
Market for Common Stock
Our common stock is listed on the NASDAQ Global Select Market and trades under the symbol "MU." The following table represents the high and low closing sales prices for our common stock for each quarter of 2014 and 2013, as reported by Bloomberg L.P.:
|
| Fourth Quarter |
| Third Quarter |
| Second Quarter |
| First Quarter | ||||||||
2014: |
|
|
|
|
|
|
|
| ||||||||
High |
| $ | 34.64 | |
| $ | 28.61 | |
| $ | 25.49 | |
| $ | 21.17 | |
Low |
| 28.59 | |
| 21.13 | |
| 20.67 | |
| 13.57 | | ||||
|
|
|
|
|
|
|
|
| ||||||||
2013: |
|
|
|
|
|
|
|
| ||||||||
High |
| $ | 14.97 | |
| $ | 11.89 | |
| $ | 8.38 | |
| $ | 6.70 | |
Low |
| 11.68 | |
| 8.25 | |
| 5.93 | |
| 5.17 | | ||||
Holders of Record
As of October 16, 2014, there were 2,471 shareholders of record of our common stock.
Dividends
We have not declared or paid cash dividends since 1996 and do not intend to pay cash dividends for the foreseeable future.
As a result of the Japan Proceedings, for so long as such proceedings are continuing, the MMJ Group is subject to certain restrictions on dividends, loans and advances. Our ability to access IMFT's cash and other assets through dividends, loans or advances, including to finance our other operations, is subject to agreement by Intel.
Equity Compensation Plan Information
The information required by this item is incorporated by reference from the information set forth in Item 12 of this Annual Report on Form 10-K.
Issuer Purchases of Equity Securities
During the fourth quarter of 2014 , we acquired, as payment of withholding taxes or exercise prices in connection with the vesting or exercise of equity awards, 5,479 shares of our common stock at an average price per share of $32.02 . We retired these shares in the fourth quarter of 2014 .
26
Period |
| (a) Total number of shares purchased |
| (b) Average price paid per share |
| (c) Total number of shares (or units) purchased as part of publicly announced plans or programs |
| (d) Maximum number (or approximate dollar value) of shares (or units) that may yet be purchased under the plans or programs | |||||
May 30, 2014 | – | July 3, 2014 |
| 1,914 | |
| $ | 29.65 | |
| N/A |
| N/A |
July 4, 2014 | – | July 31, 2014 |
| 3,395 | |
| 33.42 | |
| N/A |
| N/A | |
August 1, 2014 | – | August 28, 2014 |
| 170 | |
| 30.70 | |
| N/A |
| N/A | |
|
|
|
| 5,479 | |
| 32.02 | |
|
|
|
| |
Performance Graph
The following graph illustrates a five-year comparison of cumulative total returns for our common stock, the S&P 500 Composite Index and the Philadelphia Semiconductor Index (SOX) from August 31, 2009, through August 31, 2014. We operate on a 52 or 53 week fiscal year which ends on the Thursday closest to August 31. Accordingly, the last day of our fiscal year varies. For consistent presentation and comparison to the industry indices shown herein, we have calculated our stock performance graph assuming an August 31 year end.
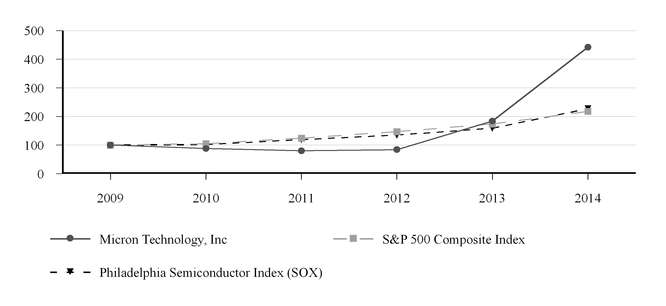
Note: Management cautions that the stock price performance information shown in the graph above is provided as of August 31 for the years presented and may not be indicative of current stock price levels or future stock price performance.
The performance graph above assumes $100 was invested on August 31, 2009 in common stock of Micron Technology, Inc., the S&P 500 Composite Index and the Philadelphia Semiconductor Index (SOX). Any dividends paid during the period presented were assumed to be reinvested. The performance was plotted using the following data:
|
| 2009 |
| 2010 |
| 2011 |
| 2012 |
| 2013 |
| 2014 | ||||||||||||
Micron Technology, Inc. |
| $ | 100 | |
| $ | 88 | |
| $ | 80 | |
| $ | 84 | |
| $ | 184 | |
| $ | 442 | |
S&P 500 Composite Index |
| 100 | |
| 105 | |
| 124 | |
| 147 | |
| 174 | |
| 218 | | ||||||
Philadelphia Semiconductor Index (SOX) |
| 100 | |
| 102 | |
| 119 | |
| 135 | |
| 159 | |
| 227 | | ||||||
27
ITEM 6. SELECTED FINANCIAL DATA
|
| 2014 |
| 2013 |
| 2012 |
| 2011 |
| 2010 | ||||||||||
|
|
|
|
|
|
|
|
|
|
| ||||||||||
|
| (in millions except per share amounts) | ||||||||||||||||||
Net sales |
| $ | 16,358 | |
| $ | 9,073 | |
| $ | 8,234 | |
| $ | 8,788 | |
| $ | 8,482 | |
Gross margin |
| 5,437 | |
| 1,847 | |
| 968 | |
| 1,758 | |
| 2,714 | | |||||
Operating income (loss) |
| 3,087 | |
| 236 | |
| (612 | ) |
| 761 | |
| 1,612 | | |||||
Net income (loss) |
| 3,079 | |
| 1,194 | |
| (1,031 | ) |
| 190 | |
| 1,900 | | |||||
Net income (loss) attributable to Micron |
| 3,045 | |
| 1,190 | |
| (1,032 | ) |
| 167 | |
| 1,850 | | |||||
Diluted earnings (loss) per share |
| 2.54 | |
| 1.13 | |
| (1.04 | ) |
| 0.17 | |
| 1.85 | | |||||
|
|
|
|
|
|
|
|
|
|
| ||||||||||
Cash and short-term investments |
| 4,534 | |
| 3,101 | |
| 2,559 | |
| 2,160 | |
| 2,913 | | |||||
Total current assets |
| 10,245 | |
| 8,911 | |
| 5,758 | |
| 5,832 | |
| 6,333 | | |||||
Property, plant and equipment, net |
| 8,682 | |
| 7,626 | |
| 7,103 | |
| 7,555 | |
| 6,601 | | |||||
Total assets |
| 22,498 | |
| 19,118 | |
| 14,328 | |
| 14,752 | |
| 14,693 | | |||||
Total current liabilities |
| 4,811 | |
| 4,125 | |
| 2,243 | |
| 2,480 | |
| 2,702 | | |||||
Long-term debt |
| 4,955 | |
| 4,452 | |
| 3,038 | |
| 1,861 | |
| 1,648 | | |||||
Redeemable convertible notes |
| 57 | |
| - | |
| - | |
| - | |
| - | | |||||
Total Micron shareholders' equity |
| 10,771 | |
| 9,142 | |
| 7,700 | |
| 8,470 | |
| 8,020 | | |||||
Noncontrolling interests in subsidiaries |
| 802 | |
| 864 | |
| 717 | |
| 1,382 | |
| 1,796 | | |||||
Total equity |
| 11,573 | |
| 10,006 | |
| 8,417 | |
| 9,852 | |
| 9,816 | | |||||
On July 31, 2013, we completed the MMJ Acquisition, in which we acquired Elpida, now known as MMJ, and a controlling interest in Rexchip, now known as MMT. The MMJ Group's products include mobile DRAM targeted to mobile phones and tablets and computing DRAM targeted to desktop PCs, servers, notebooks and workstations. The MMJ Acquisition included a 300mm DRAM wafer fabrication facility located in Hiroshima, Japan, a 300mm DRAM wafer fabrication facility in Taichung City, Taiwan and an assembly and test facility located in Akita, Japan. In connection with the MMJ Acquisition, we recorded net assets of $2.60 billion , noncontrolling interests of $168 million and a gain on the transaction of $1.48 billion in 2013. (See "Item 8. Financial Statements and Supplementary Data – Notes to Consolidated Financial Statements – Micron Memory Japan, Inc." note.)
We entered into a joint venture relationship with Intel to form IMFT in 2006 and IMFS in 2007 to manufacture NAND Flash memory products for the exclusive use of the members. We have owned 51% of IMFT from inception through August 28, 2014 . Our ownership percentage of IMFS had increased from 51% at inception to 82% as of April 6, 2012 due to a series of contributions by us that were not fully matched by Intel. On April 6, 2012 , we entered into a series of agreements with Intel to restructure IM Flash, in which we acquired Intel's remaining 18% interest in IMFS for $466 million . In addition, we acquired IMFT's assets located at our Virginia wafer fabrication facility, for which Intel received a distribution from IMFT of $139 million . For both transactions, the amounts Intel received approximated the book values of Intel's interests in the assets acquired. We consolidate IM Flash and report Intel's ownership interests as noncontrolling interests in subsidiaries. (See "Item 8. Financial Statements and Supplementary Data – Notes to Consolidated Financial Statements – Equity – Noncontrolling Interests in Subsidiaries – IM Flash" note.)
On May 7, 2010, we acquired Numonyx, which manufactured and sold primarily NOR Flash and NAND Flash memory products. The total fair value of the consideration paid for Numonyx was $1.11 billion and consisted of 138 million shares of our common stock issued to the Numonyx shareholders and 5 million restricted stock units issued to employees of Numonyx. In connection with the acquisition, we recorded net assets of $1.55 billion. Because the fair value of the net assets acquired exceeded the purchase price, we recognized a gain on the acquisition of $437 million in 2010. In addition, we recognized a $51 million income tax benefit in connection with the acquisition.
28
We have a noncontrolling interest in Inotera, a publicly-traded DRAM manufacturer in Taiwan. Through December 2012, we purchased 50% of Inotera's wafer production capacity based on a margin-sharing formula among Nanya, Inotera and us. Since January 2013, we have purchased substantially all of Inotera's DRAM output at a discount from market prices for our comparable components under a new supply agreement (the "Inotera Supply Agreement"). Our costs for supply from Inotera increased in 2014 from 2013 due to changes in average selling prices for our DRAM products and the changes in the pricing terms. The Inotera Supply Agreement has a three-year term (currently through December 2016) that contemplates annual negotiations with respect to potential successive one-year extensions. If the parties do not agree to an extension, the agreement will terminate following the end of the then-existing term plus a subsequent three-year wind-down period. In the event of a wind-down, our share of Inotera's capacity would decline over the wind-down period. In 2014, our cost of products purchased from Inotera was significantly higher than our cost of similar products manufactured in our wholly-owned facilities. We are currently in negotiations regarding the extension of the Inotera Supply Agreement. There can be no assurance that we will be able to reach an agreement. As of August 28, 2014 , our ownership interest in Inotera was 33% . (See "Item 8. Financial Statements and Supplementary Data – Notes to Consolidated Financial Statements – Equity Method Investments – Inotera" note.)
(See "Item 1A. Risk Factors" and "Item 8. Financial Statements and Supplementary Data – Notes to Consolidated Financial Statements.")
29
ITEM 7. MANAGEMENT'S DISCUSSION AND ANALYSIS OF FINANCIAL CONDITION AND RESULTS OF OPERATIONS
The following discussion contains trend information and other forward-looking statements that involve a number of risks and uncertainties. Forward-looking statements include, but are not limited to, statements such as those made in "Operating Expenses and Other" regarding SG&A and R&D expenses for the first quarter of 2015 and future Restructure and Asset Impairment costs; and in "Liquidity and Capital Resources" regarding our pursuit of additional financing and debt restructuring, regarding the use of cash on hand to fund any repurchases of common stock, regarding the sufficiency of our cash and investments, cash flows from operations and available financing to meet our requirements for at least the next 12 months, regarding capital spending in 2015 and regarding the timing of payments for certain contractual obligations. Our actual results could differ materially from our historical results and those discussed in the forward-looking statements. Factors that could cause actual results to differ materially include, but are not limited to, those identified in "Part I, Item 1A. Risk Factors." This discussion should be read in conjunction with the consolidated financial statements and accompanying notes for the year ended August 28, 2014. All period references are to our fiscal periods unless otherwise indicated. Our fiscal year is the 52 or 53-week period ending on the Thursday closest to August 31 and fiscal 2014, 2013 and 2012 each contained 52 weeks. Our fiscal 2015 will contain 53 weeks and the first quarter of fiscal 2015 will contain 14 weeks. All production data includes the production of IMFT and Inotera. All tabular dollar amounts are in millions.
Our Management's Discussion and Analysis ("MD&A") is provided in addition to the accompanying consolidated financial statements and notes to assist readers in understanding our results of operations, financial condition and cash flows. MD&A is organized as follows:
• | Overview: Highlights of key transactions and events. |
• | Results of Operations: An analysis of our financial results consisting of the following: |
◦ | Consolidated results; |
◦ | Operating results by business segment; |
◦ | Operating results by product; and |
◦ | Operating expenses and other. |
• | Liquidity and Capital Resources: An analysis of changes in our balance sheet and cash flows and discussion of our financial condition and potential sources of liquidity. |
• | Off-Balance Sheet Arrangements: Description of off-balance sheet arrangements. |
• | Critical Accounting Estimates: Accounting estimates that we believe are most important to understanding the assumptions and judgments incorporated in our reported financial results and forecasts. |
Overview
For an overview of our business, see "Item 1 – Business – Overview." Our results of operations for 2014 were affected by the following key transaction.
Acquisition of Micron Memory Japan, Inc.
On July 31, 2013, we completed the MMJ Acquisition, in which we acquired Elpida, now known as MMJ, and a controlling interest in Rexchip, now known as MMT. In 2014, we purchased additional interests in MMT, increasing our ownership interest to 99.5%. In connection with the MMJ Acquisition, we recorded net assets of $2.60 billion, noncontrolling interests of $168 million and a gain on the transaction of $1.48 billion in 2013. In the second quarter of 2014, the provisional amounts recorded in connection with the MMJ Acquisition were adjusted, primarily for pre-petition liabilities. As a result, other non-operating expense for 2014 included these measurement period adjustments of $33 million. (See "Item 8. Financial Statements – Notes to Consolidated Financial Statements – Micron Memory Japan, Inc." note.)
The MMJ Acquisition included a 300mm DRAM wafer fabrication facility located in Hiroshima, Japan, a 300mm DRAM wafer fabrication facility in Taichung City, Taiwan and an assembly and test facility located in Akita, Japan. These wafer fabrication facilities together represented approximately 30% of our total wafer capacity for 2014. The MMJ Group's products include mobile DRAM targeted to mobile phones and tablets, and computing DRAM targeted to desktop PCs, servers, notebooks and workstations. The operations from the MMJ Acquisition are included primarily in the MBU and CNBU segments.
30
Results of Operations
Consolidated Results
For the year ended |
| 2014 |
| 2013 |
| 2012 | |||||||||||||||
Net sales |
| $ | 16,358 | |
| 100 | % |
| $ | 9,073 | |
| 100 | % |
| $ | 8,234 | |
| 100 | % |
Cost of goods sold |
| 10,921 | |
| 67 | % |
| 7,226 | |
| 80 | % |
| 7,266 | |
| 88 | % | |||
Gross margin |
| 5,437 | |
| 33 | % |
| 1,847 | |
| 20 | % |
| 968 | |
| 12 | % | |||
|
|
|
|
|
|
|
|
|
|
|
|
| |||||||||
SG&A |
| 707 | |
| 4 | % |
| 562 | |
| 6 | % |
| 620 | |
| 8 | % | |||
R&D |
| 1,371 | |
| 8 | % |
| 931 | |
| 10 | % |
| 918 | |
| 11 | % | |||
Restructure and asset impairments |
| 40 | |
| - | % |
| 126 | |
| 1 | % |
| 10 | |
| - | % | |||
Other operating (income) expense, net |
| 232 | |
| 1 | % |
| (8 | ) |
| - | % |
| 32 | |
| - | % | |||
Operating income (loss) |
| 3,087 | |
| 19 | % |
| 236 | |
| 3 | % |
| (612 | ) |
| (7 | )% | |||
|
|
|
| | |
|
|
|
|
|
|
|
| ||||||||
Gain on MMJ Acquisition |
| (33 | ) |
| - | % |
| 1,484 | |
| 16 | % |
| - | |
| - | % | |||
Interest income (expense), net |
| (329 | ) |
| (2 | )% |
| (217 | ) |
| (2 | )% |
| (171 | ) |
| (2 | )% | |||
Other non-operating income (expense), net |
| 8 | |
| - | % |
| (218 | ) |
| (2 | )% |
| 29 | |
| - | % | |||
Income tax (provision) benefit |
| (128 | ) |
| (1 | )% |
| (8 | ) |
| - | % |
| 17 | |
| - | % | |||
Equity in net income (loss) of equity method investees |
| 474 | |
| 3 | % |
| (83 | ) |
| (1 | )% |
| (294 | ) |
| (4 | )% | |||
Net income attributable to noncontrolling interests |
| (34 | ) |
| - | % |
| (4 | ) |
| - | % |
| (1 | ) |
| - | % | |||
Net income (loss) attributable to Micron |
| $ | 3,045 | |
| 19 | % |
| $ | 1,190 | |
| 13 | % |
| $ | (1,032 | ) |
| (13 | )% |
Business Segments
We have the following four business units, which are our reportable segments:
Compute and Networking Business Unit ("CNBU"): Includes DRAM and NOR Flash products sold to the compute, networking, graphics and cloud server markets.
Mobile Business Unit ("MBU"): Includes DRAM, NAND Flash and NOR Flash products sold to the smartphone, feature phone and tablet mobile-device market.
Storage Business Unit ("SBU"): Includes NAND Flash components and SSDs sold into enterprise and client storage, cloud and removable storage markets. SBU also includes NAND Flash products sold to Intel through our IMFT joint venture.
Embedded Business Unit ("EBU"): Includes DRAM, NAND Flash and NOR Flash products sold into automotive and industrial applications, as well as the connected home and consumer electronics markets.
Our other operations do not meet the thresholds of a reportable segment and are reported under All Other. In the third quarter of 2014, we reorganized our business units. All prior period amounts reflect this reorganization.
Net Sales
For the year ended |
| 2014 |
| 2013 |
| 2012 | |||||||||||||||
CNBU |
| $ | 7,333 | |
| 45 | % |
| $ | 3,462 | |
| 38 | % |
| $ | 2,667 | |
| 32 | % |
MBU |
| 3,627 | |
| 22 | % |
| 1,214 | |
| 13 | % |
| 1,176 | |
| 14 | % | |||
SBU |
| 3,480 | |
| 21 | % |
| 2,824 | |
| 31 | % |
| 2,842 | |
| 35 | % | |||
EBU |
| 1,774 | |
| 11 | % |
| 1,275 | |
| 14 | % |
| 1,097 | |
| 13 | % | |||
All Other |
| 144 | |
| 1 | % |
| 298 | |
| 4 | % |
| 452 | |
| 6 | % | |||
|
| $ | 16,358 | |
| 100 | % |
| $ | 9,073 | |
| 100 | % |
| $ | 8,234 | |
| 100 | % |
31
Total net sales for 2014 increased 80% as compared to 2013 primarily due to higher CNBU and MBU sales resulting from the MMJ Acquisition. Net sales for all segments in 2014 also benefitted, as compared to 2013, from increases in DRAM and NAND Flash sales volumes driven primarily by higher manufacturing output as a result of improvements in product and process technology and an increased share of output from Inotera.
Total net sales for 2013 increased 10% as compared to 2012 reflecting increases in CNBU, EBU and MBU sales primarily due to higher levels of DRAM and NAND Flash gigabit sales volumes partially offset by declines in average selling prices. The increases in gigabit sales volumes for 2013 were primarily attributable to manufacturing efficiencies driven by improvements in product and process technologies, increased DRAM supply from Inotera due to the restructuring of our supply agreement and $355 million of DRAM sales from the MMJ Acquisition after its acquisition on July 31, 2013.
Gross Margin
Our overall gross margin percentage improved to 33% for 2014 from 20% for 2013 primarily due to improvements in the gross margin percentage for CNBU and MBU as a result of higher margins for DRAM products. The gross margin improvements for CNBU and MBU for 2014 as compared to 2013 resulted primarily from the MMJ Acquisition, manufacturing cost reductions and higher average selling prices for CNBU.
Through December 2012, we purchased 50% of Inotera's wafer production capacity based on a margin-sharing formula among Nanya, Inotera and us. Since January 2013, we have purchased substantially all of Inotera's DRAM output at a discount from market prices for our comparable components under a new supply agreement (the "Inotera Supply Agreement"). Our costs for supply from Inotera increased in 2014 from 2013 due to increases in average selling prices for our DRAM products and the changes in the pricing terms. The Inotera Supply Agreement has a three-year term (currently through December 2016) that contemplates annual negotiations with respect to potential successive one-year extensions. If the parties do not agree to an extension, the agreement will terminate following the end of the then-existing term plus a subsequent three-year wind-down period. In the event of a wind-down, our share of Inotera's capacity would decline over the wind-down period. In 2014, our cost of products purchased from Inotera was significantly higher than our cost of similar products manufactured in our wholly-owned facilities. We are currently in negotiations regarding the extension of the Inotera Supply Agreement. There can be no assurance that we will be able to reach an agreement. Under the Inotera supply agreements, we purchased $2.68 billion , $1.26 billion , and $646 million of DRAM products in 2014, 2013 and 2012, respectively.
Our gross margin percentage on sales of DRAM products for 2014 improved from 2013 primarily due to reductions in costs and increases in average selling prices. Cost reductions for 2014 primarily reflected improvements in product and process technologies and the comparatively lower manufacturing costs of the MMJ Group, partially offset by higher costs for product obtained under the Inotera supply agreements. For 2014 and the fourth quarter of 2013, our costs of goods sold for DRAM products included the sale of the MMJ Group's inventories recorded at fair value in the MMJ Acquisition, which was higher than the manufacturing cost of such inventories. This increased our costs of goods sold by approximately $153 million for 2014 and $41 million for 2013.
Our overall gross margin percentage improved to 20% for 2013 from 12% for 2012 due to improvements in the gross margin percentage for CNBU, and to a lesser extent EBU, SBU and MBU, primarily due to manufacturing cost reductions partially offset by declines in average selling prices. Manufacturing cost reductions for 2013 primarily resulted from improvements in product and process technologies.
Operating Results by Business Segments
CNBU
For the year ended |
| 2014 |
| 2013 |
| 2012 | ||||||
Net sales |
| $ | 7,333 | |
| $ | 3,462 | |
| $ | 2,667 | |
Operating income (loss) |
| 1,957 | |
| 160 | |
| (458 | ) | |||
32
CNBU sales and operating results track closely with our average selling prices, gigabit sales volumes and cost per gigabit for our consolidated sales of DRAM products. (See "Operating Results by Product – DRAM" for further detail.) CNBU sales for 2014 increased 112% as compared to 2013 primarily due to (1) the MMJ Acquisition, (2) higher average selling prices, (3) increased DRAM supply from Inotera as a result of the restructuring of our supply agreement and (4) higher output due to improvements in product and process technologies. CNBU sales for 2014 as compared to 2013 were adversely impacted by the transition of production at one of our Singapore wafer fabrication facilities from DRAM to NAND Flash. CNBU operating income for 2014 improved from 2013 primarily due to the MMJ Acquisition, higher average selling prices and manufacturing cost reductions.
CNBU sales for 2013 increased 30% as compared to 2012 primarily due to increases in gigabits sold partially offset by declines in average selling prices. CNBU operating margin for 2013 improved from 2012 primarily due to manufacturing cost reductions as a result of improved product and process technologies partially offset by declines in average selling prices. CNBU results of operations for 2013 included sales of $153 million and operating income of $21 million from the acquired MMJ Group. CNBU sales and operating margins for 2012 were adversely impacted by a $58 million charge for a settlement with a customer.
MBU
For the year ended |
| 2014 |
| 2013 |
| 2012 | ||||||
Net sales |
| $ | 3,627 | |
| $ | 1,214 | |
| $ | 1,176 | |
Operating income (loss) |
| 683 | |
| (265 | ) |
| (371 | ) | |||
In 2014, MBU sales were comprised primarily of DRAM, NAND Flash and NOR Flash, in decreasing order of revenue, with mobile DRAM products accounting for a significant majority of the sales. MBU sales for 2014 increased 199% as compared to 2013 primarily due significant increases in mobile DRAM sales as a result of the MMJ Acquisition. MBU operating margin for 2014 also improved from 2013 primarily due to the MMJ Acquisition and manufacturing cost reductions, which significantly outpaced declines in average selling prices.
MBU sales increased 3% for 2013 as compared to 2012 primarily due to higher sales of mobile DRAM products as a result of the MMJ Acquisition partially offset by declines in sales of wireless NOR Flash products. MBU results of operations for 2013 included sales of $192 million and operating income of $22 million from the MMJ Group. Sales of wireless NOR Flash products declined in 2014 as a result of weakness in market demand and our customer group in particular, as well as a continued transition by customers to NAND Flash. The improvement in MBU operating margin for 2013 from 2012 was primarily due to reductions in manufacturing, SG&A and R&D costs.
SBU
For the year ended |
| 2014 |
| 2013 |
| 2012 | ||||||
Net sales |
| $ | 3,480 | |
| $ | 2,824 | |
| $ | 2,842 | |
Operating income |
| 255 | |
| 173 | |
| 199 | | |||
SBU sales and operating results track closely with our average selling prices, gigabit sales volumes and cost per gigabit for our sales of NAND Flash products. (See "Operating Results by Product – NAND Flash" for further detail.) SBU sales for 2014 increased 23% from 2013 primarily due to increases in gigabits sold partially offset by declines in average selling prices. Increases in gigabits sold for 2014 were primarily due to the transition in 2014 of production at one of our wafer fabrication facilities in Singapore from DRAM to NAND Flash and improvements in product and process technologies. SBU sells a portion of its products to Intel through our IMFT joint venture at long-term negotiated prices approximating cost. SBU sales of NAND Flash products to Intel under this arrangement were $423 million , $387 million and $718 million for 2014 , 2013 and 2012 , respectively. All other SBU products are sold to OEMs, resellers, retailers and other customers (including Intel), which we collectively refer to as "trade customers."
SBU sales of NAND Flash products to trade customers for 2014 increased 26% as compared to 2013 primarily due to an increase in gigabits sold partially offset by declines in average selling prices. SBU operating income for 2014 improved from 2013 primarily due to higher gigabit sales volumes as manufacturing cost reductions were essentially offset by declines in average selling prices.
33
SBU sales for 2013 were relatively unchanged from 2012 as increases in gigabits sold were partially offset by declines in average selling prices. Increases in gigabits sold for 2013 were primarily due to improvements in product and process technologies. SBU sales of NAND Flash products to trade customers for 2013 increased 22% as compared to 2012 primarily due to increases in gigabits sold partially offset by declines in average selling prices. On April 6, 2012 , we acquired Intel's interests and supply rights from IM Flash wafer fabrication facilities in Singapore and Virginia, resulting in subsequent increases in our sales to trade customers. SBU operating income for 2013 declined from 2012 primarily due to decreases in average selling prices and increases in R&D costs mitigated by manufacturing cost reductions. Manufacturing cost reductions resulted primarily from improvements in product and process technologies.
EBU
For the year ended |
| 2014 |
| 2013 |
| 2012 | ||||||
Net sales |
| $ | 1,774 | |
| $ | 1,275 | |
| $ | 1,097 | |
Operating income |
| 331 | |
| 227 | |
| 129 | | |||
In 2014, EBU sales were comprised of DRAM, NAND Flash and NOR Flash in decreasing order of revenue. EBU sales for 2014 increased 39% as compared to 2013 primarily due to increased sales volumes of DRAM and NAND Flash products partially offset by declines in average selling prices. EBU operating income for 2014 improved as compared to 2013 primarily due to higher margins on sales of DRAM and NAND Flash products as a result of the increase in sales and cost reductions.
In 2013, EBU sales were comprised of DRAM, NOR Flash and NAND Flash in decreasing order of revenue. EBU sales increased 16% for 2013 as compared to 2012 primarily due to increased sales volumes of DRAM, NAND Flash and NOR Flash products as EBU continued to expand its customer base, partially offset by declines in average selling prices. EBU operating income for 2013 improved from 2012 primarily due to manufacturing cost reductions and higher sales volumes partially offset by declines in average selling prices.
Operating Results by Product
Net Sales by Product
For the year ended |
| 2014 |
| 2013 |
| 2012 | |||||||||||||||
DRAM |
| $ | 11,164 | |
| 68 | % |
| $ | 4,361 | |
| 48 | % |
| $ | 3,178 | |
| 39 | % |
NAND Flash |
| 4,468 | |
| 27 | % |
| 3,589 | |
| 40 | % |
| 3,627 | |
| 44 | % | |||
NOR Flash |
| 505 | |
| 3 | % |
| 792 | |
| 9 | % |
| 977 | |
| 12 | % | |||
Other |
| 221 | |
| 2 | % |
| 331 | |
| 3 | % |
| 452 | |
| 5 | % | |||
|
| $ | 16,358 | |
| 100 | % |
| $ | 9,073 | |
| 100 | % |
| $ | 8,234 | |
| 100 | % |
In order to balance our future product mix in anticipation of the closing of the MMJ Acquisition, in the fourth quarter of 2013, we began to transition production at one of our wafer fabrication facilities in Singapore from DRAM to NAND Flash. This transition to NAND Flash production is substantially complete. During this period of transition, there was a marginal reduction in wafer production.
DRAM
For the year ended |
| 2014 |
| 2013 | ||
|
|
|
|
| ||
|
| (percentage change from prior period) | ||||
Net sales |
| 156 | % |
| 37 | % |
Average selling prices per gigabit |
| 6 | % |
| (11 | )% |
Gigabits sold |
| 142 | % |
| 55 | % |
Cost per gigabit |
| (20 | )% |
| (25 | )% |
34
The increase in gigabit sales of DRAM products for 2014 as compared to 2013 was primarily due to higher production volumes resulting from the MMJ Acquisition, increased supply under the new Inotera Supply Agreement and improved product and process technologies, partially offset by the transition of one of our wafer fabrication facilities in Singapore from DRAM to NAND Flash. In 2014, DRAM products produced by our MMJ Group facilities constituted 54% of our aggregate DRAM gigabit production as compared to 9% in 2013.
In 2014, our cost of products purchased from Inotera was significantly higher than our cost of similar products manufactured in our wholly-owned facilities and were higher than our costs in 2013. DRAM products acquired from Inotera accounted for 38% of our DRAM gigabit production for 2014 as compared to 54% for 2013 and 46% for 2012.
Our gross margin percentage on sales of DRAM products for 2014 improved from 2013 primarily due to reductions in costs and increases in average selling prices. Cost reductions for 2014 primarily reflected improvements in product and process technologies and the comparatively lower manufacturing costs of the MMJ Group, partially offset by higher costs for product obtained under the Inotera supply agreement and the sale of the MMJ Group's inventories recorded in the MMJ Acquisition.
The increase in gigabit sales of DRAM products for 2013 as compared to 2012 was primarily due to increased output obtained from our Inotera joint venture under the new supply agreement, improved product and process technologies and the MMJ Acquisition on July 31, 2013. Our gross margin percentage on sales of DRAM products for 2013 improved from 2012 primarily due to manufacturing cost reductions as a result of improvements in product and process technologies partially offset by declines in average selling prices. DRAM sales and gross margins for 2012 were adversely impacted by the effects of a $58 million charge to revenue for a settlement with a customer.
NAND Flash
We sell a portion of our output of NAND Flash products to Intel through IMFT at long-term negotiated prices approximating cost. (See "Operating Results by Business Segments – Storage Business Unit" for further detail.) We sell the remainder of our NAND Flash products to trade customers.
For the year ended |
| 2014 |
| 2013 | ||
|
|
|
|
| ||
|
| (percentage change from prior period) | ||||
Sales to trade customers: |
|
|
|
| ||
Net sales |
| 27 | % |
| 15 | % |
Average selling prices per gigabit |
| (23 | )% |
| (18 | )% |
Gigabits sold |
| 65 | % |
| 40 | % |
Cost per gigabit |
| (23 | )% |
| (22 | )% |
Increases in NAND Flash gigabits sold to trade customers for 2014 as compared to 2013 were primarily due to the transition of one of our wafer fabrication facilities in Singapore from DRAM to NAND Flash production and improved product and process technologies. Our gross margin percentage on sales of trade NAND Flash products for 2014 was relatively unchanged from 2013 as manufacturing cost reductions offset declines in average selling prices. Manufacturing cost reductions for 2014 as compared to 2013 primarily resulted from improvements in product and process technologies.
Increases in NAND Flash gigabits sold to trade customers for 2013 as compared to 2012 were primarily due to improved product and process technologies, increased output available for sale to trade customers due to the restructure of our IM Flash agreement with Intel in April 2012 and the ramp-up of our fabrication facility in Singapore throughout 2012. Our gross margin percentage on sales of NAND Flash products for 2013 improved from 2012 as manufacturing cost reductions outpaced declines in average selling prices. Manufacturing cost reductions for 2013 as compared to 2012 reflect improvements in product and process technologies.
NOR Flash
Sales of NOR Flash products for 2014 declined as compared to 2013 primarily due to decreases in sales of wireless NOR Flash products as a result of the continued transition of wireless applications to NAND Flash products. Our gross margin percentage on sales of NOR Flash products for 2014 declined as compared to 2013 primarily due to costs of underutilized capacity in connection with the decrease in production of wireless products and decreases in average selling prices.
35
Sales of NOR Flash products for 2013 declined as compared to 2012 primarily due to decreases in sales of wireless NOR Flash products as a result of weakness in demand from certain customers and the continued transition of wireless applications to NAND Flash products, which led to significant declines in average selling prices. Our gross margin percentage on sales of NOR Flash products for 2013 improved as compared to 2012 primarily due to cost reductions.
Operating Expenses and Other
Selling, General and Administrative
SG&A expenses for 2014 increased 26% as compared to 2013 primarily due to the incremental costs resulting from the MMJ Acquisition and higher payroll costs resulting primarily from the reinstatement of variable pay plans. We expect that SG&A expenses will approximate $195 million to $205 million for the first quarter of 2015.
SG&A expenses for 2013 decreased 9% as compared to 2012 primarily due to a reduction in legal costs and lower variable pay costs partially offset by $50 million of consulting and other costs incurred in connection with the MMJ Acquisition.
Research and Development
R&D expenses for 2014 increased 47% from 2013 primarily due to the incremental costs resulting from the MMJ Acquisition, higher payroll costs resulting primarily from the reinstatement of variable pay plans and increased resources dedicated to development efforts. We expect that R&D expenses, net of amounts reimbursable from our R&D partners, will be approximately $395 million to $405 million for the first quarter of 2015.
R&D expenses for 2013 increased 1% from 2012 primarily due to lower reimbursements from Nanya under partnering arrangements offset by lower payroll costs primarily resulting from the suspension of variable pay plans and a lower volume of development wafers processed.
As a result of amounts reimbursable from Intel under a joint development program for NAND Flash and certain emerging memory technologies, R&D expenses were reduced by $137 million , $127 million and $87 million for 2014, 2013 and 2012, respectively. As a result of amounts reimbursable from Nanya under a DRAM R&D joint development program, R&D expenses were reduced by $19 million and $138 million for 2013 and 2012, respectively. Effective January 1, 2013, Nanya ceased participating in the DRAM joint development program.
Our process technology R&D efforts are focused primarily on development of successively smaller line-width process technologies which are designed to facilitate our transition to next generation memory products. Additional process technology R&D efforts focus on the enablement of advanced computing and mobile memory architectures, the investigation of new opportunities that leverage our core semiconductor expertise and the development of new manufacturing materials. Product design and development efforts include our high density DDR3 and DDR4 DRAM, Mobile LPDRAM products, high density NAND Flash memory (including 3D NAND and MLC and TLC technologies), SSDs, Hybrid Memory Cubes, specialty memory, NOR Flash memory, and other memory technologies and systems.
Restructure and Asset Impairments
For the year ended |
| 2014 |
| 2013 |
| 2012 | ||||||
Loss on impairment of LED assets |
| $ | (6 | ) |
| $ | 33 | |
| $ | - | |
Loss on impairment of MIT assets |
| (5 | ) |
| 62 | |
| - | | |||
Gain on termination of lease to Transform |
| - | |
| (25 | ) |
| - | | |||
Loss on restructure of ST consortium agreement |
| - | |
| 26 | |
| - | | |||
Other |
| 51 | |
| 30 | |
| 10 | | |||
|
| $ | 40 | |
| $ | 126 | |
| $ | 10 | |
36
In order to optimize operations, improve efficiency and increase our focus on our core memory operations, we have entered into various restructure activities. For 2014 and 2013, other restructure included charges associated with our efforts to wind down our 200mm operations primarily in Agrate, Italy and Kiryat Gat, Israel and charges associated with workforce optimization activities, primarily related to our MBU and EBU operating segments. As of August 28, 2014 , we had accrued $14 million for unpaid other restructure activities related to our workforce optimization activity. As of August 28, 2014 , we do not anticipate incurring any significant additional costs for these restructure activities. (See "Item 8. Financial Statements and Supplementary Data – Notes to Consolidated Financial Statements – Restructure and Asset Impairments.")
Interest Income (Expense)
Net interest expense for 2014 , 2013 and 2012, included aggregate amounts of amortization of debt discount and other costs of $167 million , $122 million and $81 million , respectively.
Income Taxes
Income tax provision (benefit) for 2014 included $249 million of expenses related to the utilization of deferred tax assets by the MMJ Group partially offset by a $190 million benefit from increases in amount of MMJ Group's deferred tax assets expected to be realized based on our forecasted utilization of net operating losses. The remaining tax provision for 2014 primarily reflects taxes on our other non-U.S. operations. The provision (benefit) for taxes on U.S. operations for 2014 was substantially offset by changes in the valuation allowance. As of August 28, 2014, we had valuation allowances of $1.29 billion against substantially all U.S. net deferred tax assets and $1.15 billion related to our foreign subsidiaries, primarily related to net operating loss carryforwards. Our valuation allowance decreased $712 million for 2014 primarily due to the utilization of U.S. and foreign net operating losses and due to the $190 million benefit to deferred tax assets of the MMJ Group. The amount of the deferred tax asset considered realizable could be adjusted if significant positive evidence increases. Management continues to evaluate future financial performance to determine whether such performance is sufficient evidence to support reversal of the valuation allowances. Our unrecognized tax benefits increased $150 million in 2014, primarily due to transfer pricing and other matters, which was substantially offset by changes in our deferred tax asset valuation allowance.
We currently operate in several tax jurisdictions where we have arrangements that allow us to compute our tax provision at rates below the local statutory rates that expire in whole or in part at various dates through 2026. These arrangements benefitted our tax provision in 2014, 2013 and 2012 by $286 million, $141 million and $52 million, respectively.
Income taxes for 2013 and 2012 primarily reflect taxes on our non-U.S. operations offset by benefits of $19 million and $56 million, respectively, from the favorable resolution of prior year tax matters and a change in tax laws applicable to prior years.
(See "Item 8. Financial Statements and Supplementary Data - Notes to Consolidated Financial Statements - Income Taxes.")
Equity in Net Income (Loss) of Equity Method Investees
We recognize our share of earnings or losses from the entities listed below under the equity method, generally on a two-month lag. Equity in net income (loss) of equity method investees, net of tax, included the following:
For the year ended |
| 2014 |
| 2013 |
| 2012 | ||||||
Inotera |
| $ | 465 | |
| $ | (79 | ) |
| $ | (189 | ) |
Tera Probe |
| 11 | |
| - | |
| - | | |||
Other |
| (2 | ) |
| (4 | ) |
| (105 | ) | |||
|
| $ | 474 | |
| $ | (83 | ) |
| $ | (294 | ) |
Our equity in net income (loss) of Inotera improved for 2014 as compared to 2013 primarily due to Inotera's improved operating results as a result of higher selling prices and lower manufacturing costs. Higher selling prices resulted from the new Inotera Supply Agreement coupled with an improved market.
Losses in 2012 for our other equity method investments were primarily attributable to Transform Solar Pty Ltd. As of August 30, 2012, Transform's operations were substantially discontinued. (See "Item 8. Financial Statements and Supplementary Data – Notes to Consolidated Financial Statements – Equity Method Investments.")
37
Other Operating and Non-Operating
In 2014, we settled all pending litigation between us and Rambus, including all antitrust and patent matters, and entered into a patent cross-license agreement. As a result, other operating expense for 2014 included a $233 million charge to accrue a liability, which reflects the discounted value of amounts due under this arrangement. (See "Item 8. Financial Statements and Supplementary Data – Notes to Consolidated Financial Statements – Contingencies" note.)
Other non-operating expense for 2014 included losses from the restructure of our debt of $184 million . Other non-operating expense for 2013 included losses of $31 million from the restructure of our debt. (See "Item 8. Financial Statements and Supplementary Data – Notes to Consolidated Financial Statements – Debt" note.)
Other non-operating expense included losses from changes in currency exchange rates of $28 million, $229 million and $6 million for 2014, 2013 and 2012, respectively. The loss for 2013 includes a $228 million loss for currency contracts to hedge our yen-denominated obligations in connection with the MMJ Acquisition. (See "Item 8. Financial Statements and Supplementary Data – Notes to Consolidated Financial Statements – Derivative Instruments" note.)
On August 15, 2014, ON Semiconductor Corporation acquired Aptina for approximately $433 million and we recognized a non-operating gain of $119 million on the sale of our shares based on our diluted ownership interest of approximately 27% .
On May 15, 2014, Inotera issued 400 million common shares in a public offering at a price equal to 31.50 New Taiwan dollars per share, which was in excess of our carrying value per share. As a result of the issuance, our ownership interest decreased from 35% to 33% and we recognized a non-operating gain of $93 million in 2014.
Further discussion of other operating and non-operating income and expenses can be found in the following notes contained in "Item 8. Financial Statements and Supplementary Data – Notes to Consolidated Financial Statements":
• | Equity Plans |
• | Other Operating (Income) Expense, Net |
• | Other Non-Operating Income (Expense), Net |
Liquidity and Capital Resources
Our primary sources of liquidity are cash generated from operations and financing obtained from capital markets. Specifically, in 2014, we generated cash from operations of $5.70 billion and obtained $2.21 billion of proceeds from issuance of debt. Cash generated from operations is highly dependent on selling prices for our products, which can vary significantly from period to period. We are continuously evaluating alternatives for efficiently financing our capital expenditures, dilution-management activities (including repurchases of convertible notes or equity) and ongoing operations. We expect, from time to time in the future, to engage in a variety of transactions for such purposes, including the issuance or incurrence of secured and unsecured debt and the refinancing and restructuring of existing debt.
On October 27, 2014, we announced that our Board of Directors authorized the discretionary repurchase of up to
$1.00 billion of our outstanding common stock. Any repurchases under the new authorization may be made in open market purchases, block trades, privately negotiated transactions and/or derivative transactions, subject to market conditions and our ongoing determination that it is the best use of available cash. We expect to use cash on hand to fund any repurchases. The repurchase authorization does not obligate us to acquire any common stock.
We expect that our cash and investments, cash flows from operations and available financing will be sufficient to meet our requirements at least through 2015.
38
As of |
| 2014 |
| 2013 | ||||
Cash and equivalents and short-term investments: |
|
|
|
| ||||
Bank deposits |
| $ | 2,445 | |
| $ | 1,619 | |
Money market funds |
| 1,281 | |
| 1,188 | | ||
Certificates of deposit |
| 410 | |
| 47 | | ||
Corporate bonds |
| 154 | |
| 112 | | ||
Government securities |
| 136 | |
| 72 | | ||
Commercial paper |
| 107 | |
| 61 | | ||
Asset-backed securities |
| 1 | |
| 2 | | ||
|
| $ | 4,534 | |
| $ | 3,101 | |
|
|
|
|
| ||||
Long-term marketable investments |
| $ | 819 | |
| $ | 499 | |
As of August 28, 2014 , $2.80 billion of our cash and equivalents and short-term investments was held by foreign subsidiaries, of which $758 million was denominated in currencies other than the U.S. dollar. To mitigate credit risk, we invest through high-credit-quality financial institutions and, by policy, generally limit the concentration of credit exposure by restricting the amount of investments with any single obligor.
Limitations on the Use of Cash and Investments
MMJ Group: Cash and equivalents and short-term investments in the table above included an aggregate of $1.60 billion held by the MMJ Group as of August 28, 2014 . As a result of the corporate reorganization proceedings of the MMJ Companies entered into in March 2012 and for so long as such proceedings are continuing, the MMJ Companies and their subsidiaries are subject to certain restrictions on dividends, loans and advances. The plans of reorganization of the MMJ Companies prohibit the MMJ Companies from paying dividends, including any cash dividends, to us and require that excess earnings be used in their businesses or to fund the MMJ Companies' installment payments. These prohibitions also effectively prevent the subsidiaries of the MMJ Companies from paying cash dividends to us as any such dividends would have to be first paid to the MMJ Companies which are prohibited from repaying those amounts to us as dividends under the plans of reorganization. In addition, pursuant to an order of the Japan Court, the MMJ Companies cannot make loans or advances, other than certain ordinary course advances, to us without the consent of the Japan Court. Moreover, loans or advances by subsidiaries of the MMJ Companies may be considered outside of the ordinary course of business and subject to approval of the legal trustee and Japan Court. As a result, the assets of the MMJ Group, while available to satisfy the MMJ Companies' installment payments and the other obligations, capital expenditures and other operating needs of the MMJ Group, are not available for use by us in our other operations. Moreover, certain uses of the assets of the MMJ Group, including investments in certain capital expenditures and in MMT, may require consent of MMJ's trustees and/or the Japan Court.
IMFT: Cash and equivalents and short-term investments in the table above included $84 million held by IMFT as of August 28, 2014 . Our ability to access funds held by IMFT to finance our other operations is subject to agreement by Intel and contractual limitations. Amounts held by IMFT are not anticipated to be available to finance our other operations.
Indefinitely Reinvested: As of August 28, 2014 , we had $2.70 billion of cash and equivalents and short-term investments that were held by foreign subsidiaries whose earnings were considered to be indefinitely reinvested and repatriation of these funds to the U.S. would subject these funds to U.S. federal income taxes. Determination of the amount of unrecognized deferred tax liabilities related to investments in these foreign subsidiaries is not practicable.
Operating Activities
Net cash provided by operating activities was $5.70 billion for 2014, due primarily to a strong market for our products and our continued focus on cost-efficient operations. Operating cash flows in 2014 also benefitted by a $671 million increase in accounts payable and accrued expenses offset by a $518 million increase in receivables.
39
Investing Activities
Net cash used for investing activities was $2.45 billion for 2014, which consisted primarily of cash expenditures of $2.66 billion for property plant and equipment and $506 million for the acquisition of available-for-sale securities (net of proceeds from sales and maturities of $557 million) offset by the use of $534 million of restricted cash in connection with the first MMJ creditor installment payment.
We believe that to develop new product and process technologies, support future growth, achieve operating efficiencies and maintain product quality, we must continue to invest in manufacturing technologies, facilities and capital equipment, and R&D. We estimate that capital spending for 2015 will be approximately $3.6 billion to $4.0 billion. The actual amounts for 2015 will vary depending on market conditions. As of August 28, 2014, we had commitments of approximately $1.18 billion for the acquisition of property, plant and equipment, substantially all of which is expected to be paid within one year.
Financing Activities
Net cash used by financing activities was $1.95 billion for 2014, which included $3.84 billion for repayments of debt (including $1.20 billion for the amount in excess of principal of our convertible notes), $479 million of payments on equipment purchase contracts and $92 million of net cash received from noncontrolling interests offset by $2.21 billion of proceeds from issuance of debt and by $265 million of proceeds from issuance of common stock under our equity plans.
2014 Debt Restructure
Throughout 2014, we reduced the dilutive effects of our convertible notes by exchanging, converting or repurchasing a portion of these notes using cash generated from operations and proceeds from issuing non-convertible debt with near investment-grade covenants. Approximately 90% of our Free Cash Flow (cash flows from operating activities less expenditures for property, plant and equipment less payments on equipment purchase contracts) generated during 2014 was used for these dilution-management activities. As a result, we eliminated convertible notes that would have been converted into 118 million shares of our common stock.
In 2014, we initiated a series of actions to restructure our debt, including exchanges, conversions and settlements, repurchases, issuances and early repayments. The following table presents the net effect of each of the actions:
|
| Increase (Decrease) in Principal |
| Increase (Decrease) in Carrying Value |
| Increase (Decrease) in Cash |
| (Decrease) in Equity |
| Loss (1) | ||||||||||
Exchanges |
| $ | 585 | |
| $ | 282 | |
| $ | - | |
| $ | (238 | ) |
| $ | 49 | |
Conversions and settlements (2) |
| (770 | ) |
| (437 | ) |
| (1,446 | ) |
| (886 | ) |
| 130 | | |||||
Repurchases |
| (320 | ) |
| (269 | ) |
| (857 | ) |
| (567 | ) |
| 23 | | |||||
Issuances |
| 2,212 | |
| 2,212 | |
| 2,157 | |
| - | |
| - | | |||||
Early repayments |
| (336 | ) |
| (334 | ) |
| (339 | ) |
| - | |
| 3 | | |||||
|
| $ | 1,371 | |
| $ | 1,454 | |
| $ | (485 | ) |
| $ | (1,691 | ) |
| $ | 205 | |
(1) | The loss on 2014 debt restructure activities was recorded as $184 million in other non-operating expense and $21 million in interest expense in 2014. |
(2) The change in carrying value includes an increase of $275 million for the reclassification of the fair value of the equity component to debt in connection with our election to settle the conversions of the 2031B Notes in cash.
• | Exchanges : Exchanged $440 million in aggregate principal amount of our 2027 Notes, 2031A Notes and 2031B Notes into $1.03 billion principal amount at maturity of 2043G Notes. |
• | Conversions and Settlement : Holders of substantially all of our remaining 2014 Notes, 2027 Notes and 2031A Notes (with an aggregate principal amount of $770 million ) converted their notes and we settled the conversions in cash for $1.45 billion . |
40
• | Repurchases : Repurchased $320 million in aggregate principal amount of our 2031B Notes, 2032C Notes and 2032D Notes in privately-negotiated transactions for an aggregate of $857 million in cash. |
• | Issuances : Issued $600 million in principal amount of 5.875% senior notes due February 2022 and $1.15 billion in principal amount of 5.500% senior notes due February 2025. Issued $462 million in principal amount of 1.258% senior notes due 2019 Notes, payable in 10 semi-annual installments commencing in July 2014. |
• | Early Repayments : Repaid $334 million of notes and capital leases prior to their scheduled maturities. |
Subsequent to 2014, we settled an aggregate principal amount of $114 million of our remaining 2031B Notes for $389 million and repaid a $120 million note prior to its scheduled maturity.
Available Credit Facilities : As of August 28, 2014 , we had credit facilities available that provide for up to $408 million of additional financing, subject to outstanding balances of trade receivables and other conditions.
(See "Item 8. Financial Statements and Supplementary Data – Notes to Consolidated Financial Statements – Debt" note.)
Potential Settlement Obligations of Convertible Notes
Since the closing price of our common stock for at least 20 trading days in the 30 trading day periods ended on June 30, 2014 and September 30, 2014 exceeded 130% of the initial conversion price per share of our 2032 Notes and 2033 Notes, holders of those notes have the right to convert their notes at any time through December 31, 2014. For our convertible notes, we have: (1) the requirement to pay cash for the principal amount and the option to pay either cash, shares of our common stock or any combination thereof for any remaining conversion obligation, or (2) the option to pay cash, issue shares of common stock or any combination thereof for the aggregate amount due upon conversion.
The following table summarizes the potential settlements, as of August 28, 2014, that we could be required to make if all holders converted their 2032 Notes and 2033 Notes:
|
| Initial Conversion Price Per Share |
| Settlement Option for Principal Amount |
| Outstanding Principal |
| If Settled With Minimum Cash Required (1) |
| If Settled Entirely With Cash (2) | |||||||||||
|
|
|
|
| Cash |
| Remainder in Shares |
| Cash | ||||||||||||
2032C Notes |
| $ | 9.63 | |
| Cash and/or shares |
| $ | 362 | |
| $ | - | |
| 38 | |
| $ | 1,235 | |
2032D Notes |
| 9.98 | |
| Cash and/or shares |
| 344 | |
| - | |
| 34 | |
| 1,129 | | ||||
2033E Notes |
| 10.93 | |
| Cash |
| 300 | |
| 300 | |
| 18 | |
| 900 | | ||||
2033F Notes |
| 10.93 | |
| Cash |
| 300 | |
| 300 | |
| 18 | |
| 900 | | ||||
|
|
|
|
|
| $ | 1,306 | |
| $ | 600 | |
| 108 | |
| $ | 4,164 | | ||
(1) | We are required to settle the principal amount of the 2033 Notes in cash. The remaining conversion obligation paid in shares is based on our closing share price of $32.81 as of August 28, 2014 . |
(2) | Based on our closing share price of $32.81 as of August 28, 2014 . Assumes we elect cash settlement for the entire obligation. |
41
Contractual Obligations
|
| Payments Due by Period | ||||||||||||||||||
As of August 28, 2014 |
| Total |
| Less than 1 year |
| 1-3 years | |
| 3-5 years | |
| More than 5 years | ||||||||
Notes payable (1)(2) |
| $ | 7,959 | |
| $ | 976 | |
| $ | 1,001 | |
| $ | 1,601 | |
| $ | 4,381 | |
Capital lease obligations (2) |
| 998 | |
| 356 | |
| 404 | |
| 115 | |
| 123 | | |||||
Operating leases (3) |
| 116 | |
| 22 | |
| 32 | |
| 25 | |
| 37 | | |||||
Purchase obligations |
| 1,869 | |
| 1,724 | |
| 117 | |
| 12 | |
| 16 | | |||||
Other long-term liabilities (4)(5) |
| 1,060 | |
| 335 | |
| 411 | |
| 206 | |
| 108 | | |||||
Total |
| $ | 12,002 | |
| $ | 3,413 | |
| $ | 1,965 | |
| $ | 1,959 | |
| $ | 4,665 | |
(1) Amounts include MMJ Creditor Installment Payments, convertible notes and other notes. Any future redemption or conversion of convertible debt could impact the amount and timing of our cash payments.
(2) Amounts reflect principal and interest.
(3) Amounts do not include contingent lease payments.
(4) Amounts represent future cash payments to satisfy other long-term liabilities recorded on our consolidated balance sheet, including $335 million for the current portion of these long-term liabilities.
(5) We are unable to reliably estimate the timing of future payments related to uncertain tax positions and noncurrent deferred tax liabilities; therefore, $255 million in aggregate of long-term income taxes payable and noncurrent deferred tax liabilities has been excluded from the preceding table. However, other noncurrent liabilities recorded on our consolidated balance sheet included these uncertain tax positions and noncurrent deferred tax liabilities.
The obligations disclosed above do not include current liabilities, except for the current portion of long-term debt. The expected timing of payment amounts of the obligations discussed above is estimated based on current information. Timing and actual amounts paid may differ depending on the timing of receipt of goods or services, market prices, changes to agreed-upon amounts or timing of certain events for some obligations.
Purchase obligations include all commitments to purchase goods or services of either a fixed or minimum quantity that meet any of the following criteria: (1) they are noncancellable, (2) we would incur a penalty if the agreement was canceled, or (3) we must make specified minimum payments even if we do not take delivery of the contracted products or services ("take-or-pay"). If the obligation to purchase goods or services is noncancellable, the entire value of the contract was included in the above table. If the obligation is cancellable, but we would incur a penalty if canceled, the dollar amount of the penalty was included as a purchase obligation. Contracted minimum amounts specified in take-or-pay contracts are also included in the above table as they represent the portion of each contract that is a firm commitment.
Under the Inotera Supply Agreement, effective on January 1, 2013, we are obligated to purchase for a three-year term (currently through December 2016) substantially all of Inotera's output at a purchase price based on a discount from market prices for our comparable components. The Inotera Supply Agreement contemplates annual negotiations with respect to potential successive one-year extensions, and if the parties do not agree to an extension, the agreement will terminate following the end of the then-existing term plus a subsequent three-year wind-down period. In the event of a wind-down, our share of Inotera's capacity would decline over the three year wind-down period. We purchased $2.68 billion of DRAM products from Inotera in 2014 under the Inotera Supply Agreement. The Inotera Supply Agreement does not contain a fixed or minimum purchase quantity as quantities are based on qualified production output and pricing fluctuates as it is based on market prices. Therefore, we did not include our obligations under the Inotera Supply Agreement in the contractual obligations table above.
42
Off-Balance Sheet Arrangements
We have entered into capped calls, which are intended to reduce the effect of potential dilution from our convertible notes. The capped calls provide for our receipt of cash or shares, at our election, from our counterparties if the trading price of our stock is above a specified initial strike price at the expiration dates. The amounts receivable varies based on the trading price of our stock, up to specified cap prices. The dollar value of the cash or shares that we would receive from the capped calls on their expiration dates ranges from $0 if the trading price of our stock is below the initial strike price for all of the capped calls to $864 million if the trading price of our stock is at or above the cap price for all of the capped calls. To purchase the capped calls, we paid $57 million in 2011, $103 million in 2012 and $48 million in 2013, respectively. The amounts paid were recorded as charges to additional capital. For further details of our capped call arrangements, see "Item 8. Financial Statements and Supplementary Data – Notes to Consolidated Financial Statements – Equity – Micron Shareholders' Equity – Capped Calls" note.
Critical Accounting Estimates
The preparation of financial statements and related disclosures in conformity with U.S. GAAP requires management to make estimates and judgments that affect the reported amounts of assets, liabilities, revenues, expenses and related disclosures. Estimates and judgments are based on historical experience, forecasted events and various other assumptions that we believe to be reasonable under the circumstances. Estimates and judgments may vary under different assumptions or conditions. We evaluate our estimates and judgments on an ongoing basis. Our management believes the accounting policies below are critical in the portrayal of our financial condition and results of operations and requires management's most difficult, subjective or complex judgments.
Business Acquisitions : Accounting for acquisitions requires us to estimate the fair value of consideration paid and the individual assets and liabilities acquired, which involves a number of judgments, assumptions and estimates that could materially affect the amount and timing of costs recognized. Accounting for acquisitions can also involve significant judgment to determine when control of the acquired entity is transferred. We typically obtain independent third party valuation studies to assist in determining fair values, including assistance in determining future cash flows, appropriate discount rates and comparable market values. The items involving the most significant assumptions, estimates and judgments included determining the fair value of the following:
• | Property, plant and equipment, including determination of values in a continued-use model; |
• | Deferred tax assets, including projections of future taxable income and tax rates; |
• | Inventory, including estimated future selling prices, timing of product sales and completion costs for work in process; and |
• | Debt, including discount rate and timing of payments. |
Consolidations : We have interests in joint venture entities that are VIEs. Determining whether to consolidate a VIE requires judgment in assessing (1) whether an entity is a VIE and (2) if we are the entity's primary beneficiary. To determine if we are the primary beneficiary of a VIE, we evaluate whether we have (a) the power to direct the activities that most significantly impact the VIE's economic performance and (b) the obligation to absorb losses or the right to receive benefits of the VIE that could potentially be significant to the VIE. Our evaluation includes identification of significant activities and an assessment of our ability to direct those activities based on governance provisions and arrangements to provide or receive product and process technology, product supply, operations services, equity funding and financing and other applicable agreements and circumstances. Our assessment of whether we are the primary beneficiary of our VIEs requires significant assumptions and judgment.
Contingencies : We are subject to the possibility of losses from various contingencies. Considerable judgment is necessary to estimate the probability and amount of any loss from such contingencies. An accrual is made when it is probable that a liability has been incurred or an asset has been impaired and the amount of loss can be reasonably estimated. We accrue a liability and charge operations for the estimated costs of adjudication or settlement of asserted and unasserted claims existing as of the balance sheet date. In accounting for the resolution of contingencies, considerable judgment is necessary to estimate amounts pertaining to periods prior to the resolution, which are charged to operations in the period of resolution, and amounts related to future periods.
43
Income Taxes : We are required to estimate our provision for income taxes and amounts ultimately payable or recoverable in numerous tax jurisdictions around the world. These estimates involve judgment and interpretations of regulations and are inherently complex. Resolution of income tax treatments in individual jurisdictions may not be known for many years after completion of any fiscal year. We are also required to evaluate the realizability of our deferred tax assets on an ongoing basis in accordance with U.S. GAAP, which requires the assessment of our performance and other relevant factors. Realization of deferred tax assets is dependent on our ability to generate future taxable income. In recent periods, our results of operations have benefitted from increases in the amount of deferred taxes we expect to realize, primarily from the levels of capital spending and increases in the amount of taxable income we expect to realize in Japan and Taiwan. Our income tax provision or benefit is dependent, in part, on our ability to forecast future taxable income in these and other jurisdictions. Such forecasts are inherently difficult and involve numerous judgments including, among others, projecting future average selling prices and sales volumes, manufacturing and overhead costs, levels of capital spending and other factors that significantly impact our analyses of the amount of net deferred tax assets that are more likely than not to be realized.
Inventories : Inventories are stated at the lower of average cost or market value. Cost includes labor, material and overhead costs, including product and process technology costs. Determining market value of inventories involves numerous judgments, including projecting average selling prices and sales volumes for future periods and costs to complete products in work in process inventories. To project average selling prices and sales volumes, we review recent sales volumes, existing customer orders, current contract prices, industry analyses of supply and demand, seasonal factors, general economic trends and other information. When these analyses reflect estimated market values below our manufacturing costs, we record a charge to cost of goods sold in advance of when the inventory is actually sold. Differences in forecasted average selling prices used in calculating lower of cost or market adjustments can result in significant changes in the estimated net realizable value of product inventories and accordingly the amount of write-down recorded. For example, a 5% variance in the estimated selling prices would have changed the estimated market value of our memory inventory by approximately $254 million as of August 28, 2014. Due to the volatile nature of the semiconductor memory industry, actual selling prices and volumes often vary significantly from projected prices and volumes and, as a result, the timing of when product costs are charged to operations can vary significantly.
U.S. GAAP provides for products to be grouped into categories in order to compare costs to market values. The amount of any inventory write-down can vary significantly depending on the determination of inventory categories. Inventories are primarily categorized as memory (including DRAM, NAND Flash and NOR Flash) for purposes of determining lower of average cost or market. The major characteristics we consider in determining inventory categories are product type and markets.
Property, Plant and Equipment : We review the carrying value of property, plant and equipment for impairment when events and circumstances indicate that the carrying value of an asset or group of assets may not be recoverable from the estimated future cash flows expected to result from its use and/or disposition. In cases where undiscounted expected future cash flows are less than the carrying value, an impairment loss is recognized equal to the amount by which the carrying value exceeds the estimated fair value of the assets. The estimation of future cash flows involves numerous assumptions which require judgment by us, including, but not limited to, future use of the assets for our operations versus sale or disposal of the assets, future selling prices for our products and future production and sales volumes. In addition, judgment is required in determining the groups of assets for which impairment tests are separately performed.
Research and Development : Costs related to the conceptual formulation and design of products and processes are expensed as R&D as incurred. Determining when product development is complete requires judgment by us. We deem development of a product complete once the product has been thoroughly reviewed and tested for performance and reliability. Subsequent to product qualification, product costs are valued in inventory.
Stock-based Compensation : Stock-based compensation is estimated at the grant date based on the fair value of the award and is recognized as expense using the straight-line amortization method over the requisite service period. For performance-based stock awards, the expense recognized is dependent on the probability of the performance measure being achieved. We utilize forecasts of future performance to assess these probabilities and this assessment requires considerable judgment.
Determining the appropriate fair-value model and calculating the fair value of stock-based awards at the grant date requires considerable judgment, including estimating stock price volatility, expected option life and forfeiture rates. We develop these estimates based on historical data and market information which can change significantly over time. A small change in the estimates used can result in a relatively large change in the estimated valuation. We use the Black-Scholes option valuation model to value employee stock awards. We estimate stock price volatility based on an average of its historical volatility and the implied volatility derived from traded options on our stock.
44
Recently Issued Accounting Standards
See "Item 8. Financial Statements and Supplementary Data – Notes to Consolidated Financial Statements – Recently Issued Accounting Standards" note.
ITEM 7A. QUANTITATIVE AND QUALITATIVE DISCLOSURES ABOUT MARKET RISK
Interest Rate Risk
We are exposed to interest rate risk related to our indebtedness and our investment portfolio. Substantially all of our indebtedness is at fixed interest rates. As a result, the fair value of our debt fluctuates based on changes in market interest rates. We estimate that, as of August 28, 2014 and August 29, 2013, a hypothetical decrease in market interest rates of 1% would increase the fair value of our convertible notes and other notes by approximately $250 million and $147 million, respectively. The increase in interest expense caused by a 1% increase in the interest rates of our variable-rate debt would not be significant.
As of August 28, 2014 and August 29, 2013, we held debt securities of $1,653 million and $787 million, respectively, that were subject to interest rate risk. We estimate that a 0.5% increase in market interest rates would decrease the fair value of these instruments by approximately $6 million as of August 28, 2014 and $4 million as of August 29, 2013.
Foreign Currency Exchange Rate Risk
The information in this section should be read in conjunction with the information related to changes in the exchange rates of foreign currency in "Item 1A. Risk Factors." Changes in foreign currency exchange rates could materially adversely affect our results of operations or financial condition.
The functional currency for all of our operations is the U.S. dollar. As a result of our foreign operations, we incur costs and carry certain assets and liabilities that are denominated in foreign currencies. The substantial majority of our revenues are transacted in the U.S. dollar; however, significant amounts of our operating expenditures and capital purchases are incurred in or exposed to other currencies, primarily the euro, the shekel, the Singapore dollar, the New Taiwan dollar, the yen and the yuan. We have established currency risk management programs for our operating expenditures and capital purchases to hedge against fluctuations in fair value and the volatility of future cash flows caused by changes in exchange rates. We utilize currency forward and option contracts in these hedging programs. Our hedging programs reduce, but do not always entirely eliminate, the impact of currency exchange rate movements. We do not use derivative financial instruments for trading or speculative purposes.
To hedge our exposure to changes in currency exchange rates from our monetary assets and liabilities, we utilize a rolling hedge strategy with currency forward contracts that generally mature within 35 days. Based on our foreign currency exposures from monetary assets and liabilities, offset by balance sheet hedges, we estimate that a 10% adverse change in exchange rates versus the U.S. dollar would result in losses of approximately $7 million as of August 28, 2014 and $19 million as of August 29, 2013 . To hedge the exposure of changes in cash flows from changes in currency exchange rates for certain capital expenditures and forecasted operating cash flows, we utilize currency forward contracts that generally mature within 12 months and currency options that generally mature within 12 to 18 months.
As of August 28, 2018, under the terms and conditions of the MMJ Companies' plans of reorganization, we are obligated to pay 142 billion yen (or the equivalent of $1.37 billion based on exchange rates as of August 28, 2014) to the external creditors of the MMJ Companies. The installment payments are due at the end of each calendar year beginning in 2014 through 2019. To mitigate the risk that increases in exchange rates have on the payments due in 2014 and 2015, we entered into forward contracts to purchase 20 billion yen on November 28, 2014 and 10 billion yen on November 27, 2015. In addition, the MMJ Companies' cash and equivalent balances in yen mitigate the foreign currency exchange risk associated with the remaining installment payments due in 2015 and after. (See "Item 8 – Financial Statements and Supplementary Data – Notes to Consolidated Financial Statements – Debt – MMJ Creditor Installment Payments.")
45
ITEM 8. FINANCIAL STATEMENTS AND SUPPLEMENTARY DATA
Index to Consolidated Financial Statements
| Page |
|
|
Consolidated Financial Statements as of August 28, 2014 and August 29, 2013 and for the fiscal years ended August 28, 2014, August 29, 2013 and August 30, 2012: |
|
|
|
Consolidated Statements of Operations | 47 |
|
|
Consolidated Statements of Comprehensive Income | 48 |
|
|
Consolidated Balance Sheets | 49 |
|
|
Consolidated Statements of Changes in Equity | 50 |
|
|
Consolidated Statements of Cash Flows | 51 |
|
|
Notes to Consolidated Financial Statements | 52 |
|
|
Report of Independent Registered Public Accounting Firm | 97 |
|
|
Financial Statement Schedules: |
|
|
|
Schedule I – Condensed Financial Information of the Registrant | 107 |
|
|
Schedule II – Valuation and Qualifying Accounts | 113 |
46
MICRON TECHNOLOGY, INC.
CONSOLIDATED STATEMENTS OF OPERATIONS
(in millions except per share amounts)
For the year ended |
| August 28, |
| August 29, |
| August 30, | ||||||
Net sales |
| $ | 16,358 | |
| $ | 9,073 | |
| $ | 8,234 | |
Cost of goods sold |
| 10,921 | |
| 7,226 | |
| 7,266 | | |||
Gross margin |
| 5,437 | |
| 1,847 | |
| 968 | | |||
|
|
|
|
|
|
| ||||||
Selling, general and administrative |
| 707 | |
| 562 | |
| 620 | | |||
Research and development |
| 1,371 | |
| 931 | |
| 918 | | |||
Restructure and asset impairments |
| 40 | |
| 126 | |
| 10 | | |||
Other operating (income) expense, net |
| 232 | |
| (8 | ) |
| 32 | | |||
Operating income (loss) |
| 3,087 | |
| 236 | |
| (612 | ) | |||
|
|
|
|
|
|
| ||||||
Gain on MMJ Acquisition |
| (33 | ) |
| 1,484 | |
| - | | |||
Interest income |
| 23 | |
| 14 | |
| 8 | | |||
Interest expense |
| (352 | ) |
| (231 | ) |
| (179 | ) | |||
Other non-operating income (expense), net |
| 8 | |
| (218 | ) |
| 29 | | |||
|
| 2,733 | |
| 1,285 | |
| (754 | ) | |||
|
|
|
|
|
|
| ||||||
Income tax (provision) benefit |
| (128 | ) |
| (8 | ) |
| 17 | | |||
Equity in net income (loss) of equity method investees |
| 474 | |
| (83 | ) |
| (294 | ) | |||
Net income (loss) |
| 3,079 | |
| 1,194 | |
| (1,031 | ) | |||
|
|
|
|
|
|
| ||||||
Net income attributable to noncontrolling interests |
| (34 | ) |
| (4 | ) |
| (1 | ) | |||
Net income (loss) attributable to Micron |
| $ | 3,045 | |
| $ | 1,190 | |
| $ | (1,032 | ) |
|
|
|
|
|
|
| ||||||
Earnings (loss) per share: |
|
|
|
|
|
| ||||||
Basic |
| $ | 2.87 | |
| $ | 1.16 | |
| $ | (1.04 | ) |
Diluted |
| 2.54 | |
| 1.13 | |
| (1.04 | ) | |||
|
|
|
|
|
|
| ||||||
Number of shares used in per share calculations: |
|
|
|
|
|
| ||||||
Basic |
| 1,060 | |
| 1,022 | |
| 991 | | |||
Diluted |
| 1,198 | |
| 1,057 | |
| 991 | | |||
See accompanying notes to consolidated financial statements.
47
MICRON TECHNOLOGY, INC.
CONSOLIDATED STATEMENTS OF COMPREHENSIVE INCOME
(in millions)
For the year ended |
| August 28, |
| August 29, |
| August 30, | ||||||
Net income (loss) |
| $ | 3,079 | |
| $ | 1,194 | |
| $ | (1,031 | ) |
|
|
|
|
|
|
| ||||||
Other comprehensive income (loss), net of tax: |
|
|
|
|
|
| ||||||
Gain (loss) on derivatives, net |
| (9 | ) |
| (9 | ) |
| (18 | ) | |||
Foreign currency translation adjustments |
| (2 | ) |
| (5 | ) |
| (16 | ) | |||
Pension liability adjustments |
| 3 | |
| (1 | ) |
| - | | |||
Gain (loss) on investments, net |
| 1 | |
| (1 | ) |
| (24 | ) | |||
Other comprehensive income (loss) |
| (7 | ) |
| (16 | ) |
| (58 | ) | |||
Total comprehensive income (loss) |
| 3,072 | |
| 1,178 | |
| (1,089 | ) | |||
Comprehensive (income) loss attributable to noncontrolling interests |
| (34 | ) |
| (5 | ) |
| 5 | | |||
Comprehensive income (loss) attributable to Micron |
| $ | 3,038 | |
| $ | 1,173 | |
| $ | (1,084 | ) |
See accompanying notes to consolidated financial statements.
48
MICRON TECHNOLOGY, INC.
CONSOLIDATED BALANCE SHEETS
(in millions except par value amounts)
As of |
| August 28, |
| August 29, | ||||
Assets |
|
|
|
| ||||
Cash and equivalents |
| $ | 4,150 | |
| $ | 2,880 | |
Short-term investments |
| 384 | |
| 221 | | ||
Receivables |
| 2,906 | |
| 2,329 | | ||
Inventories |
| 2,455 | |
| 2,649 | | ||
Restricted cash |
| - | |
| 556 | | ||
Other current assets |
| 350 | |
| 276 | | ||
Total current assets |
| 10,245 | |
| 8,911 | | ||
Long-term marketable investments |
| 819 | |
| 499 | | ||
Property, plant and equipment, net |
| 8,682 | |
| 7,626 | | ||
Equity method investments |
| 971 | |
| 396 | | ||
Intangible assets, net |
| 468 | |
| 386 | | ||
Deferred tax assets |
| 816 | |
| 861 | | ||
Other noncurrent assets |
| 497 | |
| 439 | | ||
Total assets |
| $ | 22,498 | |
| $ | 19,118 | |
|
|
|
|
| ||||
Liabilities and equity |
|
|
|
| ||||
Accounts payable and accrued expenses |
| $ | 2,698 | |
| $ | 2,115 | |
Deferred income |
| 309 | |
| 243 | | ||
Equipment purchase contracts |
| 166 | |
| 182 | | ||
Current debt |
| 1,638 | |
| 1,585 | | ||
Total current liabilities |
| 4,811 | |
| 4,125 | | ||
Long-term debt |
| 4,955 | |
| 4,452 | | ||
Other noncurrent liabilities |
| 1,102 | |
| 535 | | ||
Total liabilities |
| 10,868 | |
| 9,112 | | ||
|
|
|
|
| ||||
Commitments and contingencies |
| | |
| | | ||
|
|
|
|
| ||||
Redeemable convertible notes |
| 57 | |
| - | | ||
|
|
|
|
| ||||
Micron shareholders' equity: |
|
|
|
| ||||
Common stock, $0.10 par value, 3,000 shares authorized, 1,073 shares issued and outstanding (1,044 as of August 29, 2013) |
| 107 | |
| 104 | | ||
Additional capital |
| 7,879 | |
| 9,187 | | ||
Retained earnings (accumulated deficit) |
| 2,729 | |
| (212 | ) | ||
Accumulated other comprehensive income |
| 56 | |
| 63 | | ||
Total Micron shareholders' equity |
| 10,771 | |
| 9,142 | | ||
Noncontrolling interests in subsidiaries |
| 802 | |
| 864 | | ||
Total equity |
| 11,573 | |
| 10,006 | | ||
Total liabilities and equity |
| $ | 22,498 | |
| $ | 19,118 | |
See accompanying notes to consolidated financial statements.
49
MICRON TECHNOLOGY, INC.
CONSOLIDATED STATEMENTS OF CHANGES IN EQUITY
|
| Micron Shareholders |
|
|
|
| |||||||||||||||||||||||||
|
| Common Stock |
| Additional Capital |
| Retained Earnings (Accumulated Deficit) |
| Accumulated Other Comprehensive Income (Loss) |
| Total Micron Shareholders' Equity |
| Noncontrolling Interests in Subsidiaries |
| Total Equity | |||||||||||||||||
|
| Number of Shares |
| Amount |
|
|
|
|
|
| |||||||||||||||||||||
Balance at September 1, 2011 |
| 984 | |
| $ | 98 | |
| $ | 8,610 | |
| $ | (370 | ) |
| $ | 132 | |
| $ | 8,470 | |
| $ | 1,382 | |
| $ | 9,852 | |
Net loss |
|
| |
|
| |
|
| |
| (1,032 | ) |
|
|
| (1,032 | ) |
| 1 | |
| (1,031 | ) | ||||||||
Other comprehensive income (loss), net |
|
|
|
|
|
|
|
|
| (52 | ) |
| (52 | ) |
| (6 | ) |
| (58 | ) | |||||||||||
Contributions from noncontrolling interests |
|
|
|
|
|
|
|
|
|
|
| - | |
| 197 | |
| 197 | | ||||||||||||
Issuance of convertible notes |
|
|
|
|
| 191 | |
|
|
|
|
| 191 | |
|
|
| 191 | | ||||||||||||
Conversion of 2013 Notes |
| 27 | |
| 3 | |
| 135 | |
|
|
|
|
| 138 | |
|
|
| 138 | | ||||||||||
Stock-based compensation expense |
|
|
|
|
| 87 | |
|
|
|
|
| 87 | |
|
|
| 87 | | ||||||||||||
Stock issued under stock plans |
| 8 | |
| 1 | |
| 5 | |
|
|
|
|
| 6 | |
|
|
| 6 | | ||||||||||
Acquisition of noncontrolling interest in IMFS |
|
|
|
|
|
|
|
|
|
|
| - | |
| (466 | ) |
| (466 | ) | ||||||||||||
Distributions to noncontrolling interests |
|
|
|
|
|
|
|
|
|
|
| - | |
| (391 | ) |
| (391 | ) | ||||||||||||
Purchase and settlement of capped calls |
|
|
|
|
| (102 | ) |
|
|
|
|
| (102 | ) |
|
|
| (102 | ) | ||||||||||||
Repurchase and retirement of stock |
| (1 | ) |
| - | |
| (6 | ) |
| - | |
|
|
| (6 | ) |
|
|
| (6 | ) | |||||||||
Balance at August 30, 2012 |
| 1,018 | |
| $ | 102 | |
| $ | 8,920 | |
| $ | (1,402 | ) |
| $ | 80 | |
| $ | 7,700 | |
| $ | 717 | |
| $ | 8,417 | |
Net income |
|
| |
|
|
|
|
| 1,190 | |
|
|
| 1,190 | |
| 4 | |
| 1,194 | | ||||||||||
Other comprehensive income (loss), net |
|
|
|
|
|
|
|
|
| (17 | ) |
| (17 | ) |
| 1 | |
| (16 | ) | |||||||||||
MMJ Acquisition |
|
|
|
|
|
|
|
|
|
|
| - | |
| 168 | |
| 168 | | ||||||||||||
Stock issued under stock plans |
| 27 | |
| 2 | |
| 148 | |
|
|
|
|
| 150 | |
|
|
| 150 | | ||||||||||
Stock-based compensation expense |
|
|
|
|
| 91 | |
|
|
|
|
| 91 | |
|
|
| 91 | | ||||||||||||
Issuance and repurchase of convertible notes |
|
|
|
|
| 57 | |
|
|
|
|
| 57 | |
|
|
| 57 | | ||||||||||||
Contributions from noncontrolling interests |
|
|
|
|
|
|
|
|
|
|
| - | |
| 11 | |
| 11 | | ||||||||||||
Distributions to noncontrolling interests |
|
|
|
|
|
|
|
|
|
|
| - | |
| (37 | ) |
| (37 | ) | ||||||||||||
Purchase and settlement of capped calls |
|
|
|
|
| (24 | ) |
|
|
|
|
| (24 | ) |
|
|
| (24 | ) | ||||||||||||
Repurchase and retirement of stock |
| (1 | ) |
| - | |
| (5 | ) |
| - | |
|
|
| (5 | ) |
|
|
| (5 | ) | |||||||||
Balance at August 29, 2013 |
| 1,044 | |
| $ | 104 | |
| $ | 9,187 | |
| $ | (212 | ) |
| $ | 63 | |
| $ | 9,142 | |
| $ | 864 | |
| $ | 10,006 | |
Net income |
|
|
|
|
|
|
| 3,045 | |
|
|
| 3,045 | |
| 34 | |
| 3,079 | | |||||||||||
Other comprehensive income (loss), net |
|
|
|
|
|
|
|
|
| (7 | ) |
| (7 | ) |
|
|
| (7 | ) | ||||||||||||
Stock issued under stock plans |
| 36 | |
| 4 | |
| 262 | |
|
|
|
|
| 266 | |
|
|
| 266 | | ||||||||||
Stock-based compensation expense |
|
|
|
|
| 115 | |
|
|
|
|
| 115 | |
|
|
| 115 | | ||||||||||||
Contributions from noncontrolling interests |
|
|
|
|
|
|
|
|
|
|
| - | |
| 102 | |
| 102 | | ||||||||||||
Settlement of capped calls |
|
|
|
|
| 86 | |
|
|
|
|
| 86 | |
|
|
| 86 | | ||||||||||||
Exchange, conversion and repurchase of convertible notes |
|
|
|
|
| (1,691 | ) |
|
|
|
|
| (1,691 | ) |
|
|
| (1,691 | ) | ||||||||||||
Acquisitions of noncontrolling interests |
|
|
|
|
| 34 | |
|
|
|
|
| 34 | |
| (180 | ) |
| (146 | ) | |||||||||||
Redeemable convertible notes |
|
|
|
|
| (57 | ) |
|
|
|
|
| (57 | ) |
|
|
| (57 | ) | ||||||||||||
Distributions to noncontrolling interests |
|
|
|
|
|
|
|
|
|
|
| - | |
| (18 | ) |
| (18 | ) | ||||||||||||
Repurchase and retirement of stock |
| (7 | ) |
| (1 | ) |
| (57 | ) |
| (104 | ) |
|
|
| (162 | ) |
|
|
| (162 | ) | |||||||||
Balance at August 28, 2014 |
| 1,073 | |
| $ | 107 | |
| $ | 7,879 | |
| $ | 2,729 | |
| $ | 56 | |
| $ | 10,771 | |
| $ | 802 | |
| $ | 11,573 | |
See accompanying notes to consolidated financial statements.
50
MICRON TECHNOLOGY, INC.
CONSOLIDATED STATEMENTS OF CASH FLOWS
(in millions)
For the year ended |
| August 28, |
| August 29, |
| August 30, | ||||||
Cash flows from operating activities |
|
|
|
|
|
| ||||||
Net income (loss) |
| $ | 3,079 | |
| $ | 1,194 | |
| $ | (1,031 | ) |
Adjustments to reconcile net income (loss) to net cash provided by operating activities: |
|
| |
|
| |
|
| ||||
Depreciation expense and amortization of intangible assets |
| 2,103 | |
| 1,804 | |
| 2,141 | | |||
Amortization of debt discount and other costs |
| 167 | |
| 122 | |
| 81 | | |||
Loss on restructure of debt |
| 195 | |
| 31 | |
| - | | |||
Stock-based compensation |
| 115 | |
| 91 | |
| 87 | | |||
(Gain) on MMJ Acquisition |
| 33 | |
| (1,484 | ) |
| - | | |||
(Gains) losses from currency hedges, net |
| 27 | |
| 222 | |
| 19 | | |||
Equity in net (income) loss of equity method investees |
| (474 | ) |
| 83 | |
| 294 | | |||
Gain from disposition of interest in Aptina |
| (119 | ) |
| - | |
| - | | |||
Gain from Inotera issuance of shares |
| (97 | ) |
| (48 | ) |
| - | | |||
Noncash restructure and asset impairments |
| (17 | ) |
| 112 | |
| (6 | ) | |||
Change in operating assets and liabilities: |
|
| |
|
| |
|
| ||||
Receivables |
| (518 | ) |
| (409 | ) |
| 238 | | |||
Inventories |
| 194 | |
| 83 | |
| 258 | | |||
Accounts payable and accrued expenses |
| 671 | |
| 22 | |
| 182 | | |||
Deferred income taxes, net |
| 68 | |
| (7 | ) |
| 3 | | |||
Other noncurrent liabilities |
| 243 | |
| (15 | ) |
| (89 | ) | |||
Other |
| 29 | |
| 10 | |
| (63 | ) | |||
Net cash provided by operating activities |
| 5,699 | |
| 1,811 | |
| 2,114 | | |||
|
|
|
|
|
|
| ||||||
Cash flows from investing activities |
|
| |
|
| |
|
| ||||
Expenditures for property, plant and equipment |
| (2,658 | ) |
| (1,244 | ) |
| (1,699 | ) | |||
Purchases of available-for-sale securities |
| (1,063 | ) |
| (924 | ) |
| (564 | ) | |||
Payments to settle hedging activities |
| (26 | ) |
| (253 | ) |
| (62 | ) | |||
Additions to equity method investments |
| - | |
| - | |
| (187 | ) | |||
Proceeds from sales and maturities of available-for-sale securities |
| 557 | |
| 678 | |
| 152 | | |||
Decrease in restricted cash |
| 536 | |
| - | |
| 5 | | |||
Cash received from disposition of interest in Aptina |
| 105 | |
| - | |
| - | | |||
Other |
| 96 | |
| 31 | |
| 43 | | |||
Net cash provided by (used for) investing activities |
| (2,453 | ) |
| (1,712 | ) |
| (2,312 | ) | |||
|
|
|
|
|
|
| ||||||
Cash flows from financing activities |
|
| |
|
| |
|
| ||||
Repayments of debt |
| (3,843 | ) |
| (743 | ) |
| (203 | ) | |||
Payments on equipment purchase contracts |
| (479 | ) |
| (214 | ) |
| (172 | ) | |||
Cash paid to purchase stock under equity plans |
| (76 | ) |
| (5 | ) |
| (6 | ) | |||
Acquisitions of noncontrolling interests |
| (18 | ) |
| - | |
| (466 | ) | |||
Distributions to noncontrolling interests |
| (10 | ) |
| (37 | ) |
| (391 | ) | |||
Proceeds from issuance of debt |
| 2,212 | |
| 1,121 | |
| 1,065 | | |||
Proceeds from issuance of stock under equity plans |
| 265 | |
| 150 | |
| 5 | | |||
Contributions from noncontrolling interests |
| 102 | |
| 11 | |
| 197 | | |||
Proceeds from equipment sale-leaseback transactions |
| 14 | |
| 126 | |
| 609 | | |||
Other |
| (115 | ) |
| (87 | ) |
| (141 | ) | |||
Net cash provided by (used for) financing activities |
| (1,948 | ) |
| 322 | |
| 497 | | |||
|
|
|
|
|
|
| ||||||
Effect of changes in currency exchange rates on cash and equivalents |
| (28 | ) |
| - | |
| - | | |||
|
|
|
|
|
|
| ||||||
Net increase (decrease) in cash and equivalents |
| 1,270 | |
| 421 | |
| 299 | | |||
Cash and equivalents at beginning of period |
| 2,880 | |
| 2,459 | |
| 2,160 | | |||
Cash and equivalents at end of period |
| $ | 4,150 | |
| $ | 2,880 | |
| $ | 2,459 | |
|
|
|
|
|
|
| ||||||
Supplemental disclosures |
|
| |
|
| |
|
| ||||
Income taxes refunded (paid), net |
| $ | (43 | ) |
| $ | 4 | |
| $ | 13 | |
Interest paid, net of amounts capitalized |
| (163 | ) |
| (107 | ) |
| (72 | ) | |||
Noncash investing and financing activities: |
|
| |
|
| |
|
| ||||
Exchange of convertible notes |
| 756 | |
| - | |
| - | | |||
Equipment acquisitions on contracts payable and capital leases |
| 587 | |
| 443 | |
| 897 | | |||
Acquisition of noncontrolling interest |
| 127 | |
| - | |
| - | | |||
Conversion of notes to stock, net of unamortized issuance cost |
| - | |
| - | |
| 138 | | |||
See accompanying notes to consolidated financial statements.
51
MICRON TECHNOLOGY, INC.
NOTES TO CONSOLIDATED FINANCIAL STATEMENTS
(All tabular amounts in millions except per share amounts)
Significant Accounting Policies
Basis of Presentation: We are one of the world's leading providers of advanced semiconductor solutions. Through our worldwide operations, we manufacture and market a full range of DRAM, NAND Flash and NOR Flash memory, as well as other innovative memory technologies, packaging solutions and semiconductor systems for use in leading-edge computing, consumer, networking, automotive, industrial, embedded and mobile products. The accompanying consolidated financial statements include the accounts of Micron Technology, Inc. and its consolidated subsidiaries and have been prepared in accordance with accounting principles generally accepted in the United States of America.
Certain reclassifications have been made to prior period amounts to conform to current period presentation. Certain deferred tax assets in prior years were corrected with corresponding changes in the valuation allowance, resulting in no change to net deferred tax assets. Changes in these items were not material for any period presented.
Our fiscal year is the 52 or 53-week period ending on the Thursday closest to August 31. Fiscal years 2014, 2013 and 2012 each contained 52 weeks. Fiscal year 2015 will contain 53 weeks, and the first quarter of fiscal 2015 will contain 14 weeks. All period references are to our fiscal periods unless otherwise indicated.
Use of Estimates: The preparation of financial statements and related disclosures in conformity with accounting principles generally accepted in the United States of America requires our management to make estimates and judgments that affect the reported amounts of assets, liabilities, revenues, expenses and related disclosures. Estimates and judgments are based on historical experience, forecasted events and various other assumptions that we believe to be reasonable under the circumstances. Estimates and judgments may differ under different assumptions or conditions. We evaluate our estimates and judgments on an ongoing basis. Actual results could differ from estimates.
Product Warranty: We generally provide a limited warranty that our products are in compliance with our specifications existing at the time of delivery. Under our general terms and conditions of sale, liability for certain failures of product during a stated warranty period is usually limited to repair or replacement of defective items or return of, or a credit with respect to, amounts paid for such items. Under certain circumstances, we provide more extensive limited warranty coverage than that provided under our general terms and conditions. Our warranty obligations are not significant.
Revenue Recognition: We recognize product or license revenue when persuasive evidence that a sales arrangement exists, delivery has occurred, the price is fixed or determinable and collectability is reasonably assured. If we are unable to reasonably estimate returns or the price is not fixed or determinable, sales made under agreements allowing rights of return or price protection are deferred until customers have resold the product.
Research and Development: Costs related to the conceptual formulation and design of products and processes are expensed as research and development as incurred. Determining when product development is complete requires judgment. Development of a product is deemed complete once the product has been thoroughly reviewed and has passed tests for performance and reliability. Subsequent to product qualification, product costs are valued in inventory. Product design and other research and development costs for certain technologies are shared with our joint venture partners. Amounts receivable from cost-sharing arrangements are reflected as a reduction of research and development expense. (See "Equity Method Investments" and "Equity – Noncontrolling Interests in Subsidiaries" notes.)
Stock-based Compensation: Stock-based compensation is measured at the grant date, based on the fair value of the award, and recognized as expense under the straight-line attribution method over the requisite service period. We issue new shares upon the exercise of stock options or conversion of share units. (See "Equity Plans" note.)
Stock Repurchases: When we repurchase and retire our common stock, any excess of the repurchase price paid over par value is allocated between paid-in capital and retained earnings.
Functional Currency: The U.S. dollar is the functional currency for all of our consolidated operations.
52
Financial Instruments: Cash equivalents include highly liquid short-term investments with original maturities to us of three months or less that are readily convertible to known amounts of cash. Investments with maturities greater than three months and less than one year are included in short-term investments. Investments with remaining maturities greater than one year are included in long-term marketable investments. The carrying value of investment securities sold is determined using the specific identification method.
Derivative and Hedging Instruments: We use derivative instruments to manage a portion of our exposure to changes in currency exchange rates from our monetary assets and liabilities or future cash flows and to reduce the volatility that changes in interest rates on variable-rate debt have on our earnings. Our currency derivatives have consisted of forward and option contracts and interest rate swap contracts. We do not use derivative instruments for trading or speculative purposes. Derivative instruments are measured at their fair values and recognized as either assets or liabilities. The accounting for changes in the fair value of derivative instruments is based on the intended use of the derivative and the resulting designation. For derivative instruments that are not designated as hedges for accounting purpose, gains or losses from changes in fair values are recognized in other non-operating income (expense). For derivative instruments designated as cash-flow hedges, the effective portion of the gain or loss is included as a component of other comprehensive income (loss), and the ineffective or excluded portion of the gain or loss is included in other non-operating income (expense). The amounts in accumulated other comprehensive income (loss) for these cash flow hedges are reclassified into earnings in the same line items of the consolidated statements of operation and in the same periods in which the underlying transactions affect earnings. Effectiveness is measured by comparing the cumulative change in the fair value of the hedge contract with the cumulative change in the forecasted cash flows of the hedged item. For the effectiveness assessment of our cash-flow hedges, changes in the time value are excluded for forward contracts.
We seek to enter into master netting arrangements with our counterparties to mitigate credit risk in derivative hedge transactions. These master netting arrangements allow us and our counterparties to net settle amounts owed to each other. Derivative assets and liabilities that can be net settled with each counterparty under these arrangements have been presented in our consolidated balance sheet on a net basis.
(See "Derivative Instruments" note.)
Inventories: Inventories are stated at the lower of average cost or market value. Cost includes depreciation, labor, material and overhead costs, including product and process technology costs. Determining market values of inventories involves numerous judgments, including projecting future average selling prices, sales volumes and costs to complete products in work in process inventories. When market values are below costs, we record a charge to cost of goods sold to write down inventories to their estimated market value in advance of when the inventories are actually sold. Inventories are primarily categorized as memory (including DRAM, NAND Flash and NOR Flash) for purposes of determining lower of average cost or market. The major characteristics considered in determining inventory categories for purposes of determining the lower of cost or market value are product type and markets. We remove amounts from inventory and charge such amounts to cost of goods sold on an average cost basis.
Product and Process Technology: Costs incurred to (1) acquire product and process technology, (2) patent technology and (3) maintain patent technology are capitalized and amortized on a straight-line basis over periods ranging up to 12.5 years. We capitalize a portion of the costs incurred to patent technology based on historical and projected patents issued as a percent of patents we file. Capitalized product and process technology costs are amortized over the shorter of (1) the estimated useful life of the technology, (2) the patent term or (3) the term of the technology agreement. Fully-amortized assets are removed from product and process technology and accumulated amortization.
Property, Plant and Equipment: Property, plant and equipment is stated at cost and depreciated using the straight-line method over estimated useful lives of generally 10 to 30 years for buildings, generally 5 to 7 years for equipment and generally 3 to 5 years for software. Assets held for sale are carried at the lower of cost or estimated fair value and are included in other noncurrent assets. When property, plant or equipment is retired or otherwise disposed, the net book value is removed and we recognize any gain or loss in our results of operations.
We capitalize interest on borrowings during the active construction period of capital projects. Capitalized interest is added to the cost of the underlying assets and amortized over the useful lives of the assets.
53
Variable Interest Entities
We have interests in entities that are VIEs. If we are the primary beneficiary of a VIE, we are required to consolidate it. To determine if we are the primary beneficiary, we evaluate whether we have the power to direct the activities that most significantly impact the VIE's economic performance and the obligation to absorb losses or the right to receive benefits of the VIE that could potentially be significant to the VIE. Our evaluation includes identification of significant activities and an assessment of our ability to direct those activities based on governance provisions and arrangements to provide or receive product and process technology, product supply, operations services, equity funding, financing and other applicable agreements and circumstances. Our assessments of whether we are the primary beneficiary of our VIEs require significant assumptions and judgments.
Unconsolidated Variable Interest Entities
Inotera: Inotera is a VIE because its equity is not sufficient to permit it to finance its activities without additional support from its shareholders. We have determined that we do not have the power to direct the activities of Inotera that most significantly impact its economic performance, primarily due to (1) limitations on our governance rights that require the consent of other parties for key operating decisions and (2) Inotera's dependence on Nanya for financing and the ability of Inotera to operate in Taiwan. Therefore, we do not consolidate Inotera and we account for our interest under the equity method. See "Equity Method Investments – Inotera" note.
EQUVO Entities: EQUVO HK Limited and EQUVA Capital 1 Pte. Ltd. (together, the "EQUVO Entities") are special purpose entities created to facilitate equipment sale-leaseback financing transactions between us and a consortium of financial institutions. Neither we nor the financing entities have an equity interest in the EQUVO Entities. The EQUVO Entities are VIEs because their equity is not sufficient to permit them to finance their activities without additional support from the financing entities and because the third-party equity holder lacks characteristics of a controlling financial interest. By design, the arrangements with the EQUVO Entities are merely financing vehicles and we do not bear any significant risks from variable interests with the EQUVO Entities. Therefore, we have determined that we do not have the power to direct the activities of the EQUVO Entities that most significantly impact their economic performance and we do not consolidate the EQUVO Entities.
SC Hiroshima Energy Corporation : SC Hiroshima Energy Corporation ("SCHE") is an entity created to construct and operate a cogeneration, electrical power plant to support our wafer manufacturing facility in Hiroshima, Japan. SCHE is a VIE due to the nature of its tolling agreements with us and our purchase and call options for SCHE's assets. We do not have an equity ownership interest in SCHE. We do not control the operation and maintenance of the plant, which we have determined are the activities of SCHE that most significantly impact its economic performance. Therefore, we do not consolidate SCHE.
Consolidated Variable Interest Entities
IMFT: IMFT is a VIE because all of its costs are passed to us and its other member, Intel, through product purchase agreements and IMFT is dependent upon us or Intel for any additional cash requirements. The primary activities of IMFT are driven by the constant introduction of product and process technology. Because we perform a significant majority of the technology development, we have the power to direct its key activities. In addition, IMFT manufactures certain products exclusively for us using our technology. We also determined that we have the obligation to absorb losses and the right to receive benefits from IMFT that could potentially be significant to it. As a result, we have determined that we have the power to direct the activities of IMFT that most significantly impact its economic performance and, therefore, we consolidate IMFT.
IMFS: Prior to April 6, 2012 , IMFS was a VIE because all of its costs were passed to us and its other member, Intel, through product purchase agreements and IMFS was dependent upon us or Intel for any additional cash requirements. Prior to April 6, 2012 , we determined that we had the power to direct the activities of IMFS that most significantly impacted its economic performance. Therefore, we consolidated IMFS. On April 6, 2012 , we acquired Intel's remaining interests in IMFS and it ceased to be a VIE.
MP Mask: MP Mask is a VIE because substantially all of its costs are passed to us and its other member, Photronics, through product purchase agreements and MP Mask is dependent upon us or Photronics for any additional cash requirements. We have tie-breaking voting rights over key operating decisions and nearly all key MP Mask activities are driven by our supply needs. We also determined that we have the obligation to absorb losses and the right to receive benefits from MP Mask that could potentially be significant to it. As a result, we have determined that we have the power to direct the activities of MP Mask that most significantly impact its economic performance and, therefore, we consolidate MP Mask.
54
(See "Equity – Noncontrolling Interests in Subsidiaries" note.)
Recently Issued Accounting Standards
In May 2014, the Financial Accounting Standards Board ("FASB") issued Accounting Standard Update ("ASU") 2014-09 – Revenue from Contracts with Customers , which will supersede nearly all existing revenue recognition guidance under U.S. GAAP. The core principal of this ASU is that an entity should recognize revenue when it transfers promised goods or services to customers in an amount that reflects the consideration to which the entity expects to be entitled in exchange for those goods or services. This ASU also requires additional disclosure about the nature, amount, timing and uncertainty of revenue and cash flows arising from customer contracts, including significant judgments and changes in judgments and assets recognized from costs incurred to obtain or fulfill a contract. This ASU will be effective for us in our first quarter of 2018. Early adoption is not permitted. The ASU allows for either full retrospective or modified retrospective adoption. We are evaluating the transition method that will be elected and the potential effects of the adoption of this ASU on our financial statements.
Micron Memory Japan, Inc.
On July 31, 2013, we acquired Elpida, now known as MMJ, and a controlling interest in Rexchip, now known as MMT, for an aggregate of $949 million in cash (collectively, "the MMJ Acquisition"). The MMJ Acquisition included (1) the acquisition of MMJ, including its 65% interest in MMT and (2) the acquisition of an additional 24% interest in MMT from Powerchip Technology Corporation (the "MMT Share Purchase"). The MMJ Acquisition was treated as a single business combination because: (1) the two transactions were entered into and closed contemporaneously, and (2) the MMT Share Purchase was negotiated in contemplation of the acquisition of MMJ and its completion was contingent on the closing of the acquisition of MMJ.
In 2014, we purchased additional interests in MMT, increasing our ownership interest to 99.5% . (See "Equity – Noncontrolling Interest in Subsidiaries – MMT" note.)
The MMJ Acquisition included a 300 mm DRAM wafer fabrication facility located in Hiroshima, Japan, a 300 mm DRAM wafer fabrication facility located in Taichung City, Taiwan and an assembly and test facility located in Akita, Japan. The operations from the MMJ Acquisition, which are included primarily in our MBU and CNBU segments, include the manufacture of Mobile DRAM targeted to mobile phones and tablets and computing DRAM targeted to desktop PCs, servers, notebooks and workstations.
We estimated the provisional fair values of the assets and liabilities of the MMJ Group as of the July 31, 2013 acquisition date using an in-use model, which reflects its value through its use in combination with other assets as a group. In the second quarter of 2014, the provisional amounts recorded in connection with the MMJ Acquisition were adjusted, primarily for pre-petition liabilities, and we recognized a charge in 2014 for these measurement period adjustments. The valuation of assets acquired and liabilities assumed were as follows:
55
Assets acquired and liabilities assumed: |
|
| ||
Cash and equivalents |
| $ | 999 | |
Receivables |
| 697 | | |
Inventories |
| 962 | | |
Restricted cash |
| 557 | | |
Other current assets |
| 142 | | |
Property, plant and equipment |
| 935 | | |
Equity method investment |
| 40 | | |
Intangible assets |
| 10 | | |
Deferred tax assets |
| 811 | | |
Other noncurrent assets |
| 66 | | |
Accounts payable and accrued expenses |
| (387 | ) | |
Equipment purchase contracts |
| (22 | ) | |
Current portion of long-term debt |
| (673 | ) | |
Long-term debt |
| (1,461 | ) | |
Other noncurrent liabilities |
| (75 | ) | |
Total net assets acquired |
| 2,601 | | |
Noncontrolling interests in MMJ |
| 168 | | |
Consideration |
| 949 | | |
Preliminary gain on acquisition recognized in 2013 |
| 1,484 | | |
Adjustment for primarily pre-petition liabilities |
| (33 | ) | |
Final gain on acquisition |
| $ | 1,451 | |
Our results of operations for 2013 include $355 million of net sales and $46 million of operating income from the MMJ Group's operations after the July 31, 2013 acquisition date. Included in the selling, general and administrative expenses in results of operations for 2013 are transaction costs of $50 million incurred in connection with the MMJ Acquisition.
The acquisition of MMJ was pursuant to the terms and conditions of an Agreement on Support for Reorganization Companies (as amended, the "Sponsor Agreement") that we entered into in July 2012 with the trustees of the MMJ Companies pursuant to and in connection with the MMJ Companies' corporate reorganization proceedings under the Corporate Reorganization Act of Japan. As a result of the Japan Proceedings, for so long as such proceedings are continuing, the MMJ Companies are subject to certain restrictions on dividends, loans and advances. The plans of reorganization of the MMJ Companies prohibit the MMJ Companies from paying dividends, including any cash dividends, to us and require that excess earnings be used in their businesses or to fund the MMJ Companies' installment payments. These prohibitions would also effectively prevent the subsidiaries of the MMJ Companies from paying cash dividends to us as any such dividends would have to be first paid to the MMJ Companies which are prohibited from repaying those amounts to us as dividends under the plans of reorganization. In addition, pursuant to an order of the Japan Court, the MMJ Companies cannot make loans or advances, other than certain ordinary course advances, to us without the consent of the Japan Court. Moreover, loans or advances by subsidiaries of the MMJ Companies may be considered outside the ordinary course of business and may require consent of MMJ's trustees or, in certain cases, approval by the Japan Court. As a result, the assets of the MMJ Companies, while available to satisfy the MMJ Companies' installment payments and other obligations, capital expenditures and other operating needs of the MMJ Companies, are not available for use by us in our other operations. Certain uses of the assets of the MMJ Companies, including investments in certain capital expenditures and in MMT, may require consent of MMJ's trustees or, in certain cases, approval by the Japan Court. Disposition of certain assets of the MMJ Companies may also require consent of one or more of the secured creditors.
56
Unaudited Pro Forma Financial Information
The following unaudited pro forma financial information presents the combined results of operations as if the MMJ Acquisition had occurred on September 2, 2011. The pro forma financial information includes the accounting effects of the business combination, including adjustments to the amortization of intangible assets, depreciation of property, plant and equipment, interest expense and elimination of intercompany activities. The historical results of operations of the MMJ Group for the eleven months ended May 31, 2013 included a gain of $1.69 billion for the forgiveness of debt related to liabilities subject to compromise upon approval of the bankruptcy by the creditors and the Japan Court and, for the year ended June 30, 2012, included a $2.83 billion loss for impairment of long-lived assets. No adjustments were made to the unaudited pro forma financial information for these items, consistent with the requirements for preparation of the pro forma financial information. The unaudited pro forma financial information below is not necessarily indicative of either future results of operations or results that might have been achieved had the MMJ Acquisition occurred on September 2, 2011.
For the year ended |
| 2013 |
| 2012 | ||||
Net sales |
| $ | 12,494 | |
| $ | 11,492 | |
Net income (loss) |
| 3,825 | |
| (4,439 | ) | ||
Net income (loss) attributable to Micron |
| 3,770 | |
| (4,471 | ) | ||
|
|
|
|
| ||||
Earnings (loss) per share: |
|
|
|
| ||||
Basic |
| $ | 3.69 | |
| $ | (4.51 | ) |
Diluted |
| 3.57 | |
| (4.51 | ) | ||
The unaudited pro forma financial information for 2013 includes our results for the year ended August 29, 2013, which includes one month of results from the MMJ Group following the closing of the MMJ Acquisition, and the results of the MMJ Group, including the adjustments described above, for the eleven months ended May 31, 2013. The pro forma information for 2012 includes our results for the year ended August 30, 2012 and the results of the MMJ Group, including the adjustments described above, for the year ended June 30, 2012.
Investments
The fair values of available-for-sale investments, which approximated amortized costs, were as follows:
As of |
| 2014 |
| 2013 | ||||
Money market funds |
| $ | 1,281 | |
| $ | 1,188 | |
Corporate bonds |
| 561 | |
| 414 | | ||
Certificates of deposit |
| 437 | |
| 349 | | ||
Government securities |
| 420 | |
| 168 | | ||
Asset-backed securities |
| 128 | |
| 97 | | ||
Commercial paper |
| 107 | |
| 61 | | ||
Marketable equity securities |
| 1 | |
| 6 | | ||
|
| $ | 2,935 | |
| $ | 2,283 | |
57
The table below presents the fair value of available-for-sale debt securities by contractual maturity:
As of |
| 2014 | ||
Money market funds |
| $ | 1,281 | |
Due in 1 year or less |
| 835 | | |
Due in 1 - 2 years |
| 438 | | |
Due in 2 - 4 years |
| 351 | | |
Due after 4 years |
| 29 | | |
|
| $ | 2,934 | |
Net unrealized holding gains reclassified out of accumulated other comprehensive income from sales of available-for-sale securities were $31 million for 2012 and were not significant for any other period presented. Proceeds from sales of available-for-sale securities for 2014, 2013 and 2012 were $355 million , $526 million and $149 million , respectively. Gross realized gains from sales of available-for-sale securities were $34 million for 2012 and gross realized gains and losses for all other periods presented were not significant.
Receivables
As of |
| 2014 |
| 2013 | ||||
Trade receivables (net of allowance for doubtful accounts of $3 and $5, respectively) |
| $ | 2,524 | |
| $ | 2,069 | |
Income and other taxes |
| 104 | |
| 74 | | ||
Other |
| 278 | |
| 186 | | ||
|
| $ | 2,906 | |
| $ | 2,329 | |
As of August 28, 2014 and August 29, 2013 , other receivables included $70 million and $34 million , respectively, due from Intel for amounts related to product design and process development activities under cost-sharing agreements for NAND Flash and certain emerging memory technologies. (See "Equity – Noncontrolling Interests in Subsidiaries – IMFT" note.)
Inventories
As of |
| 2014 |
| 2013 | ||||
Finished goods |
| $ | 898 | |
| $ | 796 | |
Work in process |
| 1,372 | |
| 1,719 | | ||
Raw materials and supplies |
| 185 | |
| 134 | | ||
|
| $ | 2,455 | |
| $ | 2,649 | |
Property, Plant and Equipment
As of |
| 2014 |
| 2013 | ||||
Land |
| $ | 86 | |
| $ | 86 | |
Buildings (includes $289 and $209, respectively, from capital leases) |
| 5,093 | |
| 4,835 | | ||
Equipment (includes $1,108 and $1,305, respectively, from capital leases) |
| 17,781 | |
| 15,600 | | ||
Construction in progress |
| 114 | |
| 84 | | ||
Software |
| 358 | |
| 315 | | ||
|
| 23,432 | |
| 20,920 | | ||
Accumulated depreciation (includes $693 and $463, respectively, from capital leases) |
| (14,750 | ) |
| (13,294 | ) | ||
|
| $ | 8,682 | |
| $ | 7,626 | |
58
Depreciation expense was $1,993 million , $1,721 million and $2,053 million for 2014 , 2013 and 2012 , respectively. Other noncurrent assets included land held for development of $57 million as of August 28, 2014 and $54 million as of August 29, 2013.
As of August 28, 2014, production equipment and buildings with carrying values of $476 million and land with a carrying value of $43 million were pledged as collateral under various notes payable. (See "Debt – Other Notes Payable" note.)
Equity Method Investments
As of |
| 2014 |
| 2013 | ||||||||||
|
| Investment Balance |
| Ownership Percentage |
| Investment Balance |
| Ownership Percentage | ||||||
Inotera (1) |
| $ | 914 | |
| 33 | % |
| $ | 344 | |
| 35 | % |
Tera Probe |
| 48 | |
| 40 | % |
| 40 | |
| 40 | % | ||
Other |
| 9 | |
| Various | |
| 12 | |
| Various | | ||
|
| $ | 971 | |
|
| |
| $ | 396 | |
|
| |
(1) Entity is a variable interest entity.
As of August 28, 2014 , substantially all of our maximum exposure to loss from our VIEs that were not consolidated was the $914 million carrying value of our investment in Inotera. We may also incur losses in connection with our rights and obligations to purchase substantially all of Inotera's wafer production capacity under a supply agreement with Inotera.
We recognize our share of earnings or losses from our equity method investees generally on a two-month lag. Equity in net income (loss) of equity method investees, net of tax, included the following:
For the year ended |
| 2014 |
| 2013 |
| 2012 | ||||||
Inotera |
| $ | 465 | |
| $ | (79 | ) |
| $ | (189 | ) |
Tera Probe |
| 11 | |
| - | |
| - | | |||
Other |
| (2 | ) |
| (4 | ) |
| (105 | ) | |||
|
| $ | 474 | |
| $ | (83 | ) |
| $ | (294 | ) |
The summarized financial information in the tables below reflects aggregate amounts for all of our equity method investees. Financial information is presented for equity method investments as of the respective dates and for the periods through which we recorded our proportionate share of each investee's results of operations. Summarized results of operations are presented only for the periods subsequent to the acquisition or through the disposition of our ownership interests.
As of |
| 2014 |
| 2013 | ||||
Current assets |
| $ | 2,233 | |
| $ | 1,018 | |
Noncurrent assets |
| 2,502 | |
| 2,634 | | ||
Current liabilities |
| 1,417 | |
| 1,912 | | ||
Noncurrent liabilities |
| 254 | |
| 435 | | ||
For the years ended |
| 2014 |
| 2013 |
| 2012 | ||||||
Net sales |
| $ | 3,382 | |
| $ | 1,788 | |
| $ | 1,798 | |
Gross margin |
| 1,576 | |
| 1 | |
| (451 | ) | |||
Operating income (loss) |
| 1,371 | |
| (203 | ) |
| (751 | ) | |||
Net income (loss) |
| 1,339 | |
| (188 | ) |
| (793 | ) | |||
59
Inotera
We have partnered with Nanya in Inotera, a Taiwan DRAM memory company, since 2009. In 2012, we contributed $170 million to Inotera, which increased our ownership percentage to 40% . In 2013, Inotera issued 634 million common shares to Nanya and certain of its affiliates in a private placement at a price equal to 9.47 New Taiwan dollars per share, which was in excess of our carrying value per share. As a result of the issuance, our ownership interest decreased from 40% to 35% and we recognized a non-operating gain of $48 million in 2013. On May 15, 2014, Inotera issued 400 million common shares in a public offering at a price equal to 31.50 New Taiwan dollars per share, which was in excess of our carrying value per share. As a result of the issuance, our ownership interest decreased from 35% to 33% and we recognized a non-operating gain of $93 million in 2014. As of August 28, 2014 , we held a 33% ownership interest in Inotera, Nanya and certain of its affiliates held a 33% ownership interest and the remaining ownership interest in Inotera was publicly held.
As of August 28, 2014 , the market value of our equity interest in Inotera was $3.72 billion based on the closing trading price of 51.90 New Taiwan dollars per share in an active market. As of August 28, 2014 and August 29, 2013 , there were gains of $44 million and $44 million , respectively, in accumulated other comprehensive income (loss) for cumulative translation adjustments from our equity investment in Inotera.
The net carrying value of our initial and subsequent investments was less than our proportionate share of Inotera's equity at the time of those investments. These differences are being amortized as a net credit to our earnings through equity in net income (loss) of equity method investees (the "Inotera Amortization"). For 2012, we recognized $48 million of Inotera Amortization and as of August 30, 2012, the remaining amount of unrecognized Inotera Amortization was not significant.
Through December 2012, we purchased 50% of Inotera's wafer production capacity based on a margin-sharing formula among Nanya, Inotera and us. Since January 2013, we have purchased substantially all of Inotera's DRAM output at a discount from market prices for our comparable components under a new supply agreement (the "Inotera Supply Agreement"). Our costs for supply from Inotera increased in 2014 from 2013 due to changes in average selling prices for our DRAM products and the changes in the pricing terms. The Inotera Supply Agreement has a three-year term (currently through December 2016) that contemplates annual negotiations with respect to potential successive one-year extensions. If the parties do not agree to an extension, the agreement will terminate following the end of the then-existing term plus a subsequent three-year wind-down period. In the event of a wind-down, our share of Inotera's capacity would decline over the wind-down period. In 2014, our cost of products purchased from Inotera was significantly higher than our cost of similar products manufactured in our wholly-owned facilities. We are currently in negotiations regarding the extension of the Inotera Supply Agreement. There can be no assurance that we will be able to reach an agreement. Under the Inotera supply agreements, we purchased $2.68 billion , $1.26 billion and $646 million of DRAM products in 2014, 2013 and 2012 respectively.
Pursuant to a DRAM R&D joint development program with Nanya, which was effective through December 31, 2012, our R&D costs were reduced by $19 million and $138 million in 2013 and 2012, respectively. Nanya ceased participating in the DRAM joint development program after December 31, 2012.
Tera Probe
In 2013, as part of the MMJ Acquisition, we acquired a 40% interest in Tera Probe, which provides semiconductor wafer testing and probe services to us and others. The initial net carrying value of our investment was less than our proportionate share of Tera Probe's equity and the difference is being amortized as a credit to our earnings through equity in net income (loss) of equity method investees (the "Tera Probe Amortization"). As of August 28, 2014 , the remaining balance of the Tera Probe Amortization was $26 million and is expected to be amortized over a weighted-average period of 6 years.
As of August 28, 2014 , the market value of our equity interest in Tera Probe was $39 million based on the closing trading price of 1,087 yen per share in an active market and was $9 million below our carrying value. We evaluated our investment in Tera Probe and concluded that the decline in the market value below our carrying value was not an other-than-temporary impairment primarily because of the limited amount of time the fair value was below the carrying value and historical volatility of Tera Probe's stock price.
We incurred manufacturing costs for 2014 and 2013 of $117 million and $13 million , respectively, for services performed by Tera Probe.
60
Other
Transform: In 2010, we acquired a 50% interest in Transform, a developer, manufacturer and marketer of photovoltaic technology and solar panels, from Origin. As of August 28, 2014 , we and Origin each held a 50% ownership interest in Transform. In 2012, the Board of Directors of Transform approved a liquidation plan and as a result, we recognized a charge of $69 million in 2012. As of August 30, 2012, Transform's operations were substantially discontinued.
Aptina: We held an equity interest in Aptina until August 15, 2014. On August 15, 2014, ON Semiconductor Corporation acquired Aptina for approximately $433 million and we recognized a non-operating gain of $119 million based on our diluted ownership interest of approximately 27% . The gain approximated our share of the consideration because the carrying value of our investment had been reduced to zero in the second quarter of 2012, at which time we ceased recognizing our proportionate share of Aptina's losses.
Through May 3, 2013, we manufactured components for Complementary Metal-Oxide Semiconductor ("CMOS") image sensors for Aptina under a wafer supply agreement. Subsequent to May 3, 2013, we provided various services for Aptina under a service agreement. For 2014, 2013 and 2012, we recognized net sales of $43 million , $182 million and $372 million , respectively, from products sold to and services performed for Aptina, and cost of goods sold of $37 million , $219 million and $395 million , respectively. In 2013, we assigned to LFoundry Marsica L.r.l. ("LFoundry") our supply agreement with Aptina to manufacture components for image sensors at our 200 mm Avezzano facility. (See "Restructure and Asset Impairments" note.)
In connection with the sale of our 200 mm Avezzano facility to LFoundry in 2013, we entered into a short-term, interest-free, unsecured loan agreement with Aptina. As of August 29, 2013, other current assets included $45 million for amounts due under the loan agreement, which was repaid in 2014.
Intangible Assets
As of |
| 2014 |
| 2013 | ||||||||||||
|
| Gross Amount |
| Accumulated Amortization |
| Gross Amount |
| Accumulated Amortization | ||||||||
Product and process technology |
| $ | 809 | |
| $ | (341 | ) |
| $ | 642 | |
| $ | (269 | ) |
Customer relationships |
| 1 | |
| (1 | ) |
| 127 | |
| (114 | ) | ||||
|
| $ | 810 | |
| $ | (342 | ) |
| $ | 769 | |
| $ | (383 | ) |
During 2014 and 2013 , we capitalized $177 million and $100 million , respectively, for product and process technology with weighted-average useful lives of 6 years and 7 years, respectively. Amortization expense was $110 million , $83 million and $88 million for 2014 , 2013 and 2012 , respectively. Annual amortization expense is estimated to be $112 million for 2015 , $98 million for 2016 , $88 million for 2017 , $77 million for 2018 and $31 million for 2019 .
Accounts Payable and Accrued Expenses
As of |
| 2014 |
| 2013 | ||||
Accounts payable |
| $ | 1,119 | |
| $ | 1,048 | |
Related party payables |
| 673 | |
| 374 | | ||
Salaries, wages and benefits |
| 456 | |
| 267 | | ||
Customer advances |
| 98 | |
| 140 | | ||
Income and other taxes |
| 71 | |
| 47 | | ||
Other |
| 281 | |
| 239 | | ||
|
| $ | 2,698 | |
| $ | 2,115 | |
As of August 28, 2014 and August 29, 2013 , related party payables included $660 million and $345 million , respectively, due to Inotera primarily for the purchase of DRAM products under the Inotera Supply Agreement. As of August 28, 2014 and August 29, 2013 , related party payables also included $13 million and $29 million , respectively, due to Tera Probe for probe services performed. (See "Equity Method Investments" note.)
61
As of August 28, 2014 , customer advances included $90 million for amounts received from a customer in 2014 under a DRAM supply agreement to be applied to purchases at market pricing through September 2016. As of August 28, 2014 , other noncurrent liabilities included $90 million from this DRAM supply agreement. As of August 29, 2013 , customer advances included $134 million for amounts received from Intel, all of which was applied to Intel's purchases of NAND Flash in 2014 under a supply agreement. (See "Equity – Noncontrolling Interests in Subsidiaries – IMFT" note.)
Debt
|
|
|
|
|
| 2014 |
| 2013 | ||||||||||||||||||||||
Instrument (1) |
| Stated Rate |
| Effective Rate |
| Current |
| Long-Term |
| Total |
| Current |
| Long-Term |
| Total | ||||||||||||||
MMJ creditor installment payments |
| N/A | |
| 6.25 | % |
| $ | 192 | |
| $ | 939 | |
| $ | 1,131 | |
| $ | 527 | |
| $ | 1,117 | |
| $ | 1,644 | |
Capital lease obligations (2) |
| N/A | |
| N/A | |
| 323 | |
| 588 | |
| 911 | |
| 407 | |
| 845 | |
| 1,252 | | ||||||
2014 convertible senior notes |
| 1.875 | % |
| 7.88 | % |
| - | |
| - | |
| - | |
| 465 | |
| - | |
| 465 | | ||||||
2019 senior notes |
| 1.258 | % |
| 1.97 | % |
| 92 | |
| 324 | |
| 416 | |
| - | |
| - | |
| - | | ||||||
2022 senior notes |
| 5.875 | % |
| 6.14 | % |
| - | |
| 600 | |
| 600 | |
| - | |
| - | |
| - | | ||||||
2025 senior notes |
| 5.500 | % |
| 5.56 | % |
| - | |
| 1,150 | |
| 1,150 | |
| - | |
| - | |
| - | | ||||||
2027 convertible senior notes |
| 1.875 | % |
| 6.95 | % |
| - | |
| - | |
| - | |
| - | |
| 147 | |
| 147 | | ||||||
2031A convertible senior notes |
| 1.500 | % |
| 6.55 | % |
| - | |
| - | |
| - | |
| - | |
| 277 | |
| 277 | | ||||||
2031B convertible senior notes (3) |
| 1.875 | % |
| 6.98 | % |
| 362 | |
| - | |
| 362 | |
| - | |
| 253 | |
| 253 | | ||||||
2032C convertible senior notes (4) |
| 2.375 | % |
| 5.95 | % |
| - | |
| 314 | |
| 314 | |
| - | |
| 463 | |
| 463 | | ||||||
2032D convertible senior notes (4) |
| 3.125 | % |
| 6.33 | % |
| - | |
| 288 | |
| 288 | |
| - | |
| 369 | |
| 369 | | ||||||
2033E convertible senior notes (4)(5) |
| 1.625 | % |
| 4.50 | % |
| 278 | |
| - | |
| 278 | |
| - | |
| 272 | |
| 272 | | ||||||
2033F convertible senior notes (4)(5) |
| 2.125 | % |
| 4.93 | % |
| 265 | |
| - | |
| 265 | |
| - | |
| 260 | |
| 260 | | ||||||
2043G convertible senior notes |
| 3.000 | % |
| 6.76 | % |
| - | |
| 636 | |
| 636 | |
| - | |
| - | |
| - | | ||||||
Other notes payable |
| 2.289 | % |
| 3.40 | % |
| 126 | |
| 116 | |
| 242 | |
| 186 | |
| 449 | |
| 635 | | ||||||
|
|
|
|
|
| $ | 1,638 | |
| $ | 4,955 | |
| $ | 6,593 | |
| $ | 1,585 | |
| $ | 4,452 | |
| $ | 6,037 | | ||
(1) | We have either the obligation or the option to pay cash for the aggregate amount due upon conversion for all of our convertible notes. Since it is our current intent to settle in cash the principal amount of all of our convertible notes upon conversion, the dilutive effect of such notes on earnings per share is computed under the treasury stock method. |
(2) Weighted-average imputed rate of 4.3% and 4.1% as of August 28, 2014 and August 29, 2013 , respectively.
(3) | Amount recorded for 2014 includes the debt and equity components, which was reclassified as a result of our obligation to settle the conversions of the 2031B Notes. |
(4) | Since the closing price of our common stock for at least 20 trading days in the 30 trading day period ending on June 30, 2014 exceeded 130% of the initial conversion price per share, holders have the right to convert their notes at any time during the calendar quarter ended September 30, 2014. The closing price of our common stock also exceeded the thresholds for the calendar quarter ended September 30, 2014; therefore, these notes are convertible by the holders through December 31, 2014. |
(5) As a result of these notes being convertible at the option of the holder through September 30, 2014, and because the terms of these notes would require us to pay cash for the principal amount of any converted notes, amounts are classified as current.
Our senior notes are unsecured obligations ranking equally in right of payment with all of our other existing and future unsecured indebtedness, and are effectively subordinated to all of our other existing and future secured indebtedness, to the extent of the value of the assets securing such indebtedness. Our parent company, MTI, has $3.89 billion of debt including all of our convertible notes, the 2022 Notes and the 2025 Notes, which are structurally subordinated to $1.57 billion of capital lease obligations and notes payable of its subsidiaries. MTI guarantees certain debt obligations of its subsidiaries. MTI does not guarantee the MMJ creditor installment payments. MTI's guarantees of its subsidiary debt obligations are unsecured obligations ranking equally in right of payment with all of MTI's other existing and future unsecured indebtedness.
62
2014 Debt Restructure
In 2014, we initiated a series of actions to restructure our debt, including exchanges, conversions and settlements, repurchases, issuances and early repayments. The following table presents the net effect of each of the actions:
|
| Increase (Decrease) in Principal |
| Increase (Decrease) in Carrying Value |
| Increase (Decrease) in Cash |
| (Decrease) in Equity |
| Loss (1) | ||||||||||
Exchanges |
| $ | 585 | |
| $ | 282 | |
| $ | - | |
| $ | (238 | ) |
| $ | 49 | |
Conversions and settlements |
| (770 | ) |
| (437 | ) |
| (1,446 | ) |
| (886 | ) |
| 130 | | |||||
Repurchases |
| (320 | ) |
| (269 | ) |
| (857 | ) |
| (567 | ) |
| 23 | | |||||
Issuances |
| 2,212 | |
| 2,212 | |
| 2,157 | |
| - | |
| - | | |||||
Early repayments |
| (336 | ) |
| (334 | ) |
| (339 | ) |
| - | |
| 3 | | |||||
|
| $ | 1,371 | |
| $ | 1,454 | |
| $ | (485 | ) |
| $ | (1,691 | ) |
| $ | 205 | |
(1) | The loss on 2014 debt restructure activities was recorded as $184 million in other non-operating expense and $21 million in interest expense in 2014. |
• | Exchanges : Exchanged $440 million in aggregate principal amount of our 2027 Notes, 2031A Notes and 2031B Notes into $1.03 billion principal amount at maturity of 2043G Notes. |
• | Conversions and Settlements : Holders of substantially all of our remaining 2014 Notes, 2027 Notes and 2031A Notes (with an aggregate principal amount of $770 million ) converted their notes and we settled the conversions in cash for $1.45 billion. |
• | Repurchases : Repurchased $320 million in aggregate principal amount of our 2031B Notes, 2032C Notes and 2032D Notes in privately-negotiated transactions for an aggregate of $857 million in cash. |
• | Issuances : Issued $600 million in principal amount of 5.875% senior notes due February 2022 and $1.15 billion in principal amount of 5.500% senior notes due February 2025. Issued $462 million in principal amount of 1.258% senior notes due 2019 Notes, payable in 10 semi-annual installments commencing in July 2014. |
• | Early Repayments : Repaid $334 million of notes and capital leases prior to their scheduled maturities. (See "Other Notes Payable" below.) |
Subsequent to 2014, we settled an aggregate principal amount of $114 million of our remaining 2031B Notes for $389 million in cash and repaid a $120 million note prior to its scheduled maturity. (See "Other Notes Payable" below.)
The following discussion provides further details of our 2014 debt restructure activities:
Exchanges : During 2014, in a series of separate non-cash transactions, we exchanged portions of our 2027 Notes, 2031A Notes and 2031B Notes (collectively, the "Exchanged Notes") into 2043G Notes (collectively, the "Exchange Transactions"). In connection with the Exchange Transactions, which were accounted for as extinguishments, we issued to holders of the Exchanged Notes new 2043G Notes with an aggregate principal amount at issuance of $820 million , which accrete up to a principal amount at maturity of $1.03 billion (see further discussion in "2043G Notes" below). The liability and equity components of the Exchanged Notes had previously been stated separately within debt and additional capital in our consolidated balance sheet. As a result, our accounting for the Exchanged Notes affected debt and equity. In connection with the Exchange Transactions, we recognized a loss of $49 million based primarily on the difference between the carrying values and the fair values of the debt components of the Exchanged Notes, of which $38 million was included in other non-operating expense for 2014. The fair value of the debt component of each of the Exchanged Notes was determined as if they were stand-alone instruments using interest rates for similar nonconvertible debt issued by entities with credit ratings comparable to ours at the time of issuance (based on Level 2 fair value measurements). The table below summarizes the Exchange Transactions:
63
|
| Principal Amount |
| Carrying Value of Debt |
| Equity | ||||||
Amounts reduced in connection with the Exchanged Notes: |
|
|
|
|
|
| ||||||
2027 Notes |
| $ | 80 | |
| $ | 68 | |
| $ | 51 | |
2031A Notes |
| 155 | |
| 125 | |
| 148 | | |||
2031B Notes |
| 205 | |
| 152 | |
| 212 | | |||
|
| 440 | |
| 345 | |
| 411 | | |||
Amounts added in connection with the issued notes: |
|
|
|
|
|
| ||||||
2043G Notes |
| 1,025 | |
| 627 | |
| 173 | | |||
|
|
|
|
|
|
| ||||||
Net increase (decrease) as a result of the Exchange Transactions |
| $ | 585 | |
| $ | 282 | |
| $ | (238 | ) |
Conversions and Settlements : During 2014, we initiated a series of actions resulting in a number of debt conversions and settlements. Those actions included the following:
Termination of Conversion Rights of our 2027 Notes – On November 7, 2013, we announced the termination of the conversion rights for our remaining 2027 Notes, effective on December 13, 2013. Prior to such effective date, substantially all of the holders of our 2027 Notes exercised their option to convert their notes and, in each case, we elected to settle the conversion amount entirely in cash.
Redemption of our 2031A Notes – On November 7, 2013, we called for the redemption of our remaining 2031A Notes effective on December 7, 2013. Prior to such effective date, substantially all of the holders of our 2031A Notes exercised their option to convert their notes and, in each case, we elected to settle the conversion amount entirely in cash.
Redemption of our 2014 Notes – On January 31, 2014, we called for the redemption of our remaining 2014 Notes effective on March 3, 2014. Prior to such effective date, substantially all of the holders of our 2014 Notes exercised their option to convert their notes and, in each case, we elected to settle the conversion amount entirely in cash.
Redemption of our 2031B Notes – On July 23, 2014, we called for the redemption of our remaining 2031B Notes with a principal amount of $ 114 million effective on August 22, 2014. Prior to such effective date, substantially all of the holders of our 2031B Notes exercised their option to convert their notes and, in each case, we elected to settle the conversion amount entirely in cash. All conversions of the 2031B Notes were settled in the first quarter of 2015.
As a result of our elections to settle the conversion amounts in cash, each of the settlement obligations became derivative debt liabilities subject to mark-to-market accounting treatment. Under the terms of the indentures for the above notes, cash settlement amounts for these derivative debt liabilities were determined based on the shares underlying the converted notes multiplied by the volume-weighted-average price of our common stock over a period of 20 consecutive trading days, beginning three days after the holder's election to convert their notes. Therefore, we reclassified the fair values of the equity components of each of the converted notes from additional capital to derivative debt liabilities within current debt in our consolidated balance sheet. In connection with the above, we used an aggregate of $1.45 billion in cash in 2014 and $389 million in 2015 to settle conversion activities. A summary of the conversion activities for these notes is as follows:
64
|
| Debt Principal |
| (Increase) Decrease in Carrying Value of Debt |
| Equity Component Reclassified To Debt (1) |
| Loss (2) | ||||||||
2014 Notes |
| $ | 485 | |
| $ | 478 | |
| $ | 341 | |
| $ | 9 | |
2027 Notes |
| 95 | |
| 80 | |
| 58 | |
| 42 | | ||||
2031A Notes |
| 190 | |
| 154 | |
| 217 | |
| 70 | | ||||
2031B Notes (3) |
| - | |
| (275 | ) |
| 270 | |
| 9 | | ||||
|
| $ | 770 | |
| $ | 437 | |
| $ | 886 | |
| $ | 130 | |
(1) Based on Level 2 fair value measurements.
(2) The loss on conversion and settlement activities was recorded as $120 million in other non-operating expense and $10 million in interest expense in 2014.
(3) In the first quarter of 2015, we used an aggregate of $389 million in cash to settle the remaining 2031B Notes. In connection therewith, we incurred an additional charge of $24 million for the settlement of the 2031B Notes in the first quarter of 2015.
Repurchases : During 2014, we repurchased $320 million in aggregate principal amount of our 2031B Notes, 2032C Notes and 2032D Notes in privately-negotiated transactions for an aggregate of $857 million in cash, collectively referred to herein as the "Repurchased Notes." In connection with the Repurchased Notes, we recognized losses (based on Level 2 fair value measurements) of $23 million in 2014, which were included in other non-operating expense.
The liability and equity components of the Repurchased Notes had previously been stated separately within debt and additional capital in our consolidated balance sheet. As a result, our accounting for the Repurchased Notes affect debt and equity. The table below summarizes amounts reduced in 2014 in connection with the Repurchased Notes:
|
| Principal Amount |
| Carrying Value of Debt |
| Equity | ||||||
2031B Notes |
| $ | 26 | |
| $ | 19 | |
| $ | 43 | |
2032C Notes |
| 188 | |
| 161 | |
| 316 | | |||
2032D Notes |
| 106 | |
| 89 | |
| 208 | | |||
|
| $ | 320 | |
| $ | 269 | |
| $ | 567 | |
Issuances : During 2014, as part of our debt restructure activities, we issued the following senior notes:
5.875% Senior Notes due February 2022 : On February 10, 2014, we issued $600 million in principal amount of the 2022 Notes. Issuance costs for the 2022 Notes totaled $14 million .
The 2022 Notes contain covenants that, among other things, limit, in certain circumstances, our ability and/or the ability of our domestic restricted subsidiaries (which are generally subsidiaries in the U.S. in which we own at least 80% of the voting stock) to (1) create or incur certain liens and enter into sale and lease-back transactions, (2) create, assume, incur or guarantee certain additional secured indebtedness and unsecured indebtedness of certain of our domestic restricted subsidiaries, and (3) consolidate with or merge with or into, or convey, transfer or lease all or substantially all of our assets, to another entity. These covenants are subject to a number of limitations, exceptions and qualifications.
Cash Redemption at Our Option: Prior to February 15, 2017, we may redeem the 2022 Notes, in whole or in part, at a price equal to the principal amount of the 2022 Notes to be redeemed plus a make-whole premium as described in the indenture governing the 2022 Notes, together with accrued and unpaid interest. On or after February 15, 2017, we may redeem the 2022 Notes, in whole or in part, at prices above the principal amount that decline over time, as specified in the indenture, together with accrued and unpaid interest. Additionally, prior to February 15, 2017, we may use the net cash proceeds of one or more equity offerings to redeem up to 35% of the aggregate principal amount of the 2022 Notes at a price equal to 105.875% of the principal amount together with accrued and unpaid interest.
5.500% Senior Notes due February 2025 : On July 28, 2014, we issued $1.15 billion in principal amount of the 2025 Notes. Issuance costs for the 2025 Notes totaled $13 million .
65
The 2025 Notes contain covenants that, among other things, limit, in certain circumstances, our ability and/or the ability of our domestic restricted subsidiaries (which are generally subsidiaries in the U.S. in which we own at least 80% of the voting stock) to (1) create or incur certain liens and enter into sale and lease-back transactions, (2) create, assume, incur or guarantee certain additional secured indebtedness and unsecured indebtedness of certain of our domestic restricted subsidiaries, and (3) consolidate with or merge with or into, or convey, transfer or lease all or substantially all of our assets, to another entity. These covenants are subject to a number of limitations, exceptions and qualifications.
Cash Redemption at Our Option: Prior to August 1, 2019, we may redeem the 2025 Notes, in whole or in part, at a price equal to the principal amount of the 2025 Notes to be redeemed plus a make-whole premium as described in the indenture governing the 2025 Notes, together with accrued and unpaid interest. On or after August 1, 2019, we may redeem the 2025 Notes, in whole or in part, at prices above the principal amount that decline over time, as specified in the indenture, together with accrued and unpaid interest. Additionally, prior to August 1, 2017, we may use the net cash proceeds of one or more equity offerings to redeem up to 35% of the aggregate principal amount of the 2025 Notes at a price equal to 105.5% of the principal amount together with accrued and unpaid interest.
2013 Debt Restructure
During 2013, we repurchased $464 million of aggregate principal amount of our 2014 Notes for $477 million in cash in privately negotiated transactions. The liability and equity components of the 2014 Notes had previously been stated separately within debt and additional capital in our consolidated balance sheet. As a result, the repurchase resulted in the derecognition of $431 million in debt for the principal amount (net of $33 million of debt discount) and $15 million in additional capital for the equity component. We recognized a loss of $31 million (based on Level 2 fair value measurements) in 2013, which was included in other non-operating expense.
MMJ Creditor Installment Payments
Under the MMJ Companies' plans of reorganization, which set forth the treatment of the MMJ Companies' pre-petition creditors and their claims, the MMJ Companies were required to pay 200 billion yen, less certain expenses of the reorganization proceedings and other items, to their secured and unsecured creditors in seven annual installment payments (the "MMJ Creditor Installment Payments"). The MMJ Creditor Installment Payments do not provide for interest and were recorded at fair value in the MMJ Acquisition. The fair-value discount is accreted to interest expense over the term of the installment payments.
Under the MMJ Companies' corporate reorganization proceedings, the secured creditors of MMJ will recover 100% of their amount of their fixed claims in 6 annual installment payments through December 2018 and the unsecured creditors will recover at least 17.4% of the amount of their fixed claims in 7 annual installment payments through December 2019. In October 2013, we paid the first installment payment of 51 billion yen to the reorganization creditors of the MMJ Companies. The secured creditors of MAI were paid in full with a portion of the first installment payment made in October 2013, while the unsecured creditors of MAI will recover at least 19% of the amount of their claims in 7 installment payments through December 2019. The remaining portion of the unsecured claims of the creditors of the MMJ Companies not recovered pursuant to the Reorganization Proceedings will be discharged, without payment, through December 2019.
The following table presents the remaining amounts of MMJ Creditor Installment Payments (stated in Japanese yen and U.S. dollars) and the amount of unamortized discount as of August 28, 2014:
|
| MMJ Creditor Installment Payments | ||||||
2015 |
| ¥ | 20,330 | |
| $ | 196 | |
2016 |
| 20,197 | |
| 194 | | ||
2017 |
| 20,063 | |
| 193 | | ||
2018 |
| 19,928 | |
| 192 | | ||
2019 |
| 28,674 | |
| 276 | | ||
2020 |
| 33,024 | |
| 318 | | ||
|
| 142,216 | |
| 1,369 | | ||
Less unamortized discount |
| (24,700 | ) |
| (238 | ) | ||
MMJ Creditor Installment Payments |
| ¥ | 117,516 | |
| $ | 1,131 | |
66
Pursuant to the terms of the Sponsor Agreement, we entered into a series of agreements with the MMJ Companies, including supply agreements, research and development services agreements and general services agreements, which are intended to generate operating cash flows to meet the requirements of the MMJ Companies' businesses, including the funding of the MMJ Creditor Installment Payments.
Capital Lease Obligations
We have various capital lease obligations due in periodic installments with a weighted-average remaining term of 4.1 years as of August 28, 2014 . In 2013, we received $126 million in proceeds from equipment sale-leaseback transactions and as a result recorded capital lease obligations aggregating $126 million at a weighted-average effective interest rate of 4.3% , payable in periodic installments through July 2017 .
Convertible Notes With Debt and Equity Components
Accounting standards for convertible debt instruments that may be fully or partially settled in cash upon conversion require the debt and equity components to be separately accounted for in a manner that reflects a nonconvertible borrowing rate when interest expense is recognized in subsequent periods. The amount initially recorded as debt is based on the fair value of the debt component as a standalone instrument, determined using an interest rate for similar nonconvertible debt issued by entities with credit ratings similar to ours at the time of issuance. The difference between the debt recorded at inception and its principal amount is accreted to principal through interest expense through the estimated life of the note.
The terms of our convertible notes give holders the right to require us to repurchase all or a portion of their notes at a date or dates earlier than the contractual maturity of the notes or upon the occurrence of certain events or circumstances. In these cases, we amortize any initial debt discount or imputed interest over the period from issuance of the notes through the earliest date that holders can require us to repurchase all or a portion of their notes. As a result, the period of amortization can be significantly shorter than the contractual maturity. (See "Holder Put Date" in the table below.)
As of August 28, 2014 , the trading price of our common stock was higher than the initial conversion prices of all of our outstanding convertible notes. As a result, the conversion values were in excess of principal amounts for such notes. The following table summarizes certain features of our convertible notes outstanding as of August 28, 2014 :
|
| Holder Put Date |
| Outstanding Principal |
| Underlying Shares |
| Initial Conversion Price Per Share |
| Conversion Price Per Share Threshold (1) |
| Conversion Value in Excess of Principal (2) | |||||||||
2032C Notes |
| May 2019 |
| $ | 362 | |
| 38 | |
| $ | 9.63 | |
| $ | 12.52 | |
| $ | 873 | |
2032D Notes |
| May 2021 |
| 344 | |
| 34 | |
| 9.98 | |
| 12.97 | |
| 785 | | ||||
2033E Notes |
| February 2018 |
| 300 | |
| 27 | |
| 10.93 | |
| 14.21 | |
| 600 | | ||||
2033F Notes |
| February 2020 |
| 300 | |
| 27 | |
| 10.93 | |
| 14.21 | |
| 600 | | ||||
2043G Notes (3) |
| November 2028 |
| 1,025 | |
| 35 | |
| 29.16 | |
| 37.91 | |
| 128 | | ||||
|
|
|
| $ | 2,331 | |
| 161 | |
|
|
|
|
| $ | 2,986 | | ||||
(1) | Holders have the right to convert all or a portion of their notes at a date or dates earlier than the contractual maturity if, during any calendar quarter, the closing price of our common stock for at least 20 trading days in the 30 consecutive trading days ending on the last trading day of the preceding calendar quarter is more than 130% of the initial conversion price. |
(2) | Based on our closing share price of $32.81 as of August 28, 2014 . |
(3) | The original principal amount of $820 million accretes up to $917 million in November 2028 and $1.03 billion at maturity in 2043. |
67
The debt and equity components of all of our convertible notes outstanding as of August 28, 2014 were required to be accounted for separately. Principal and carrying amounts of the liability components for our convertible notes were as follows:
As of |
|
|
| 2014 |
| 2013 | ||||||||||||||||||||
|
| Term (Years) (1) |
| Outstanding Principal |
| Unamortized Discount |
| Net Carrying Amount |
| Outstanding Principal |
| Unamortized Discount |
| Net Carrying Amount | ||||||||||||
2014 Notes |
| N/A |
| $ | - | |
| $ | - | |
| $ | - | |
| $ | 485 | |
| $ | (20 | ) |
| $ | 465 | |
2027 Notes |
| N/A |
| - | |
| - | |
| - | |
| 175 | |
| (28 | ) |
| 147 | | ||||||
2031A Notes |
| N/A |
| - | |
| - | |
| - | |
| 345 | |
| (68 | ) |
| 277 | | ||||||
2031B Notes (2) | N/A |
| 114 | |
| (27 | ) |
| 362 | |
| 345 | |
| (92 | ) |
| 253 | | |||||||
2032C Notes |
| 5 |
| 362 | |
| (48 | ) |
| 314 | |
| 550 | |
| (87 | ) |
| 463 | | ||||||
2032D Notes |
| 7 |
| 344 | |
| (56 | ) |
| 288 | |
| 450 | |
| (81 | ) |
| 369 | | ||||||
2033E Notes |
| 3 |
| 300 | |
| (22 | ) |
| 278 | |
| 300 | |
| (28 | ) |
| 272 | | ||||||
2033F Notes |
| 5 |
| 300 | |
| (35 | ) |
| 265 | |
| 300 | |
| (40 | ) |
| 260 | | ||||||
2043G Notes |
| 14 |
| 1,025 | |
| (389 | ) |
| 636 | |
| - | |
| - | |
| - | | ||||||
|
|
|
| $ | 2,445 | |
| $ | (577 | ) |
| $ | 2,143 | |
| $ | 2,950 | |
| $ | (444 | ) |
| $ | 2,506 | |
(1) | Expected term for amortization of the remaining debt discount as of August 28, 2014 . The expected term of the 2031B Notes was not applicable because substantially all of the holders had exercised their option to convert their notes, which were settled in cash in the first quarter of 2015. |
(2) As holders had elected to convert these notes and we elected to settle the conversions in cash, net carrying amount for 2014 included the debt and equity components, which was reclassified as a result of our obligation to settle the conversions of the 2031B Notes.
Carrying amounts of the equity components, which are included in additional capital in the accompanying consolidated balance sheets, for our convertible notes, were as follows:
As of |
| 2014 |
| 2013 | ||||
2014 Notes |
| $ | - | |
| $ | 353 | |
2027 Notes |
| - | |
| 40 | | ||
2031A Notes |
| - | |
| 89 | | ||
2031B Notes |
| - | |
| 109 | | ||
2032C Notes |
| 67 | |
| 101 | | ||
2032D Notes |
| 69 | |
| 90 | | ||
2033E Notes (excludes $22 million as of 2014 in mezzanine equity) |
| 8 | |
| 30 | | ||
2033F Notes (excludes $35 million as of 2014 in mezzanine equity) |
| 7 | |
| 42 | | ||
2043G Notes |
| 173 | |
| - | | ||
|
| $ | 324 | |
| $ | 854 | |
68
Interest expense for our convertible notes consisting of contractual interest and amortization of discount and issuance costs aggregated $132 million , $156 million and $124 million for 2014 , 2013 and 2012 . Interest expense by note was as follows:
|
| Contractual Interest |
| Amortization of Discount and Issuance Costs | ||||||||||||||||||||
For the year ended |
| 2014 |
| 2013 |
| 2012 |
| 2014 |
| 2013 |
| 2012 | ||||||||||||
2014 Notes |
| $ | 2 | |
| $ | 13 | |
| $ | 18 | |
| $ | 14 | |
| $ | 37 | |
| $ | 47 | |
2027 Notes |
| 1 | |
| 3 | |
| 3 | |
| 2 | |
| 7 | |
| 6 | | ||||||
2031A Notes |
| 1 | |
| 5 | |
| 5 | |
| 3 | |
| 12 | |
| 11 | | ||||||
2031B Notes |
| 3 | |
| 6 | |
| 6 | |
| 5 | |
| 10 | |
| 10 | | ||||||
2032C Notes |
| 11 | |
| 13 | |
| 5 | |
| 12 | |
| 14 | |
| 5 | | ||||||
2032D Notes |
| 13 | |
| 14 | |
| 5 | |
| 8 | |
| 9 | |
| 3 | | ||||||
2033E Notes |
| 5 | |
| 3 | |
| - | |
| 7 | |
| 4 | |
| - | | ||||||
2033F Notes |
| 6 | |
| 3 | |
| - | |
| 6 | |
| 3 | |
| - | | ||||||
2043G Notes |
| 24 | |
| - | |
| - | |
| 9 | |
| - | |
| - | | ||||||
|
| $ | 66 | |
| $ | 60 | |
| $ | 42 | |
| $ | 66 | |
| $ | 96 | |
| $ | 82 | |
2019 Notes
On December 20, 2013, we issued $462 million in principal amount of the 2019 Notes. The 2019 Notes mature on January 15, 2019 and are collateralized by certain equipment, which had a carrying value of $190 million as of August 28, 2014. The principal amount of the 2019 Notes is payable in 10 semi-annual installments in January and July of each year, commencing in July 2014. The Export-Import Bank of the United States (the "Ex-Im Bank") guaranteed payment of all regularly scheduled installment payments of principal of, and interest on, the 2019 Notes. We paid $23 million to Ex-Im Bank for its guarantee upon issuance of the 2019 Notes.
The 2019 Notes contains covenants which are customary for financings of this type, including negative covenants that limit or restrict our ability to create liens or dispose of the equipment securing the 2019 Notes. Events of default also include, among others, the occurrence of any event or circumstance that, in the reasonable judgment of Ex-Im Bank, is likely materially and adversely to affect our ability to perform any payment obligation, or any of our other material obligations under the indenture, the 2019 Notes or under any other related transaction documents to which Ex-Im Bank is a party.
Cash Redemption at Our Option: At any time prior to the maturity date of the 2019 Notes, we may redeem the 2019 Notes, in whole or in part, at a price equal to the principal amount of the 2019 Notes to be redeemed plus a make-whole premium as described in the indenture, together with accrued and unpaid interest.
2031B Notes
On July 26, 2011, we issued $345 million of 2031B Notes due August 2031. During 2014, we exchanged $205 million of aggregate principal amount in the Exchange Transaction, repurchased $26 million of aggregate principal amount for cash and called for the redemption of the remaining $114 million of aggregate principal amount effective on August 22, 2014. Prior to such effective date, substantially all of the holders of the 2031B Notes had converted their notes, which were settled in cash with payments of $389 million in the first quarter of 2015.
2032C and 2032D Notes
On April 18, 2012, we issued $550 million of the 2032C Notes and $450 million of the 2032D Notes, each due May 2032. The initial conversion rate for the 2032C Notes is 103.8907 shares of common stock per $1,000 principal amount, equivalent to an initial conversion price of approximately $9.63 per share of common stock. The initial conversion rate for the 2032D Notes is 100.1803 shares of common stock per $1,000 principal amount, equivalent to an initial conversion price of approximately $9.98 per share of common stock. Interest is payable in May and November of each year. During 2014, we repurchased in privately-negotiated transactions $188 million and $106 million of aggregate principal amounts of the 2032C and 2032D Notes, respectively, for cash.
69
Conversion Rights : Holders may convert their 2032 Notes under the following circumstances: (1) if the 2032 Notes are called for redemption; (2) during any calendar quarter if the closing price of our common stock for at least 20 trading days in the 30 consecutive trading days ending on the last trading day of the preceding calendar quarter is more than 130% of the conversion price of the 2032 Notes (approximately $12.52 per share for the 2032C Notes and $12.97 per share for the 2032D Notes); (3) if the trading price of the 2032 Notes is less than 98% of the product of the closing price of our common stock and the conversion rate of the 2032 Notes during the periods specified in the indenture; (4) if specified distributions or corporate events occur, as set forth in the indenture for the 2032 Notes; or (5) at any time after February 1, 2032.
We have the option to pay cash, issue shares of common stock or any combination thereof for the aggregate amount due upon conversion. It is our intent to settle the principal amount of the 2032 Notes in cash upon any conversion. As a result, only the amounts payable in excess of the principal amounts upon conversion of the 2032 Notes are considered in diluted earnings per share under the treasury stock method.
Cash Redemption at Our Option : We may redeem for cash the 2032C Notes on or after May 1, 2016 and the 2032D Notes on or after May 1, 2017 if the volume weighted average price of our common stock has been at least 130% of the conversion price for at least 20 trading days during any 30 consecutive trading day period. The redemption price will equal the principal amount plus accrued and unpaid interest. If we redeem the 2032C Notes prior to May 4, 2019, or the 2032D Notes prior to May 4, 2021, we will also pay a make-whole premium in cash equal to the present value of all remaining scheduled payments of interest from the redemption date to May 4, 2019 for the 2032C Notes, or to May 4, 2021 for the 2032D Notes, using a discount rate equal to 1.50%.
Cash Repurchase at the Option of the Holder : We may be required by the holders of the 2032 Notes to repurchase for cash all or a portion of the 2032C Notes on May 1, 2019 and all or a portion of the 2032D Notes on May 1, 2021 at a price equal to the principal amount plus accrued and unpaid interest. Upon a change in control or a termination of trading, as defined in the indenture, holders of the 2032 Notes may require us to repurchase for cash all or a portion of their 2032 Notes at a price equal to the principal amount plus accrued and unpaid interest.
2033E and 2033F Notes
On February 12, 2013, we issued $300 million of the 2033E Notes and $300 million of the 2033F Notes. The initial conversion rate for the 2033 Notes is 91.4808 shares of common stock per $1,000 principal amount, equivalent to an initial conversion price of approximately $10.93 per share of common stock. Interest is payable in February and August of each year.
Conversion Rights : Holders may convert their 2033 Notes under the following circumstances: (1) if the 2033 Notes are called for redemption; (2) during any calendar quarter if the closing price of our common stock for at least 20 trading days in the 30 consecutive trading days ending on the last trading day of the preceding calendar quarter is more than 130% of the conversion price of the 2033 Notes (approximately $14.21 per share); (3) if the trading price of the 2033 Notes is less than 98% of the product of the closing price of our common stock and the conversion rate of the 2033 Notes during the periods specified in the indenture; (4) if specified distributions or corporate events occur, as set forth in the indenture for the 2033 Notes; or (5) at any time after November 15, 2032.
Upon conversion, we will pay cash equal to the lesser of the aggregate principal amount and the conversion value of the notes being converted and cash, shares of common stock or a combination of cash and shares of common stock, at our option, for any remaining conversion obligation. As a result, only the amounts payable in excess of the principal amounts upon conversion of the 2033 Notes are considered in diluted earnings per share under the treasury stock method.
Cash Redemption at Our Option : We may redeem for cash the 2033E Notes on or after February 20, 2018 and the 2033F Notes on or after February 20, 2020 at a price equal the principal amount plus accrued and unpaid interest.
Cash Repurchase at the Option of the Holder : We may be required by the holders of the 2033 Notes to repurchase for cash all or a portion of the 2033E Notes on February 15, 2018 and on February 15, 2023 and all or a portion of the 2033F Notes on February 15, 2020 and on February 15, 2023 at a price equal to the principal amount plus accrued and unpaid interest. Upon a change in control or a termination of trading, as defined in the indenture, holders of the 2033 Notes may require us to repurchase for cash all or a portion of their 2033 Notes at a price equal to the principal amount plus accrued and unpaid interest.
70
2043G Notes
In connection with the Exchange Transactions, on November 12, 2013, we issued $1.03 billion principal amount of the 2043G Notes. Each $1,000 of principal amount at maturity had an original issue price of $800 . An amount equal to the difference between the original issue price and the principal amount at maturity will accrete in accordance with a schedule set forth in the indenture. The initial conversion rate for the 2043G Notes is 34.2936 shares of common stock per $1,000 principal amount at maturity, equivalent to an initial conversion price of approximately $29.16 per share of common stock.
Upon issuance of the 2043G Notes, we recorded $627 million of debt, $173 million of additional capital and $5 million of deferred debt issuance costs (included in other noncurrent assets). The amount recorded as debt was based on the fair value of the debt component as a standalone instrument and was determined using an interest rate for similar nonconvertible debt issued by entities with credit ratings comparable to ours at the time of issuance (Level 2 fair value measurements). We recorded a debt discount of $398 million for the difference between the debt recorded at inception and the principal amount at maturity. Holders of the 2043G Notes have the right to require us to repurchase all or a portion of their notes on November 15, 2028 at the accreted principal amount, which is scheduled to be $917 million at such date. We have the option to pay cash, issue shares of common stock or any combination thereof, for the aggregate amount due upon conversion. It is our current intent to settle in cash the principal amount of the 2043G Notes upon conversion. As a result, the dilutive effect of the 2043G Notes in earnings per share is computed under the treasury stock method.
Conversion Rights: Holders may convert their 2043G Notes under the following circumstances: (1) if the 2043G Notes are called for redemption; (2) during any calendar quarter if the closing price of our common stock for at least 20 trading days in the 30 consecutive trading days ending on the last trading day of the preceding calendar quarter is more than 130% of the conversion price of the 2043G Notes (approximately $37.91 per share); (3) if the trading price of the 2043G Notes is less than 98% of the product of the closing price of our common stock and the conversion rate of the 2043G Notes during the periods specified in the indenture; (4) if specified distributions or corporate events occur, as set forth in the indenture; or (5) at any time after August 15, 2043.
Cash Redemption at Our Option: Prior to November 20, 2018, we may redeem for cash the 2043G Notes if the closing price of our common stock is more than 130% of the conversion price for at least 20 trading days in the 30 consecutive trading days ending within five trading days prior to the date on which we provide notice of redemption at a redemption would equal to the principal amount at maturity plus accrued and unpaid interest. On or after November 20, 2018, we may redeem for cash the 2043G Notes without regard to the closing price of our common stock at a price equal the accreted principal amount plus accrued and unpaid interest. If we redeem the 2043G Notes prior to November 20, 2018, we are required to pay in cash a make-whole premium as specified in the indenture.
Cash Repurchase at the Option of the Holder: Holders of the 2043G Notes may require us to repurchase for cash all or a portion of the 2043G Notes on November 15, 2028 at a price equal to the accreted principal amount at such date plus accrued and unpaid interest. Holders of the 2043G Notes may also require us to repurchase for cash all or a portion of their 2043G Notes at a price equal to the accreted principal amount plus accrued and unpaid interest upon a change in control or a termination of trading, as defined in the indenture.
Other Notes Payable
On August 27, 2013, we borrowed $312 million under a four -year term loan, collateralized by a security interest in certain production equipment. Principal was payable in equal quarterly installments, commencing on November 27, 2013. Interest accrued at a variable rate equal to the three -month London Interbank Offered Rate ("LIBOR") rate plus a margin of 3.25% per annum. Also on August 27, 2013, we entered into a variable-for-fixed interest rate swap calculated on an aggregate notional amount equal to the scheduled outstanding balance of the loan. The interest rate swap effectively fixed the rate at 4.2% per annum. On August 27, 2014, we repaid the remaining carrying value of $252 million of this note prior to its scheduled maturity and terminated the interest rate swaps.
On October 2, 2012, we entered into a facility agreement to obtain financing collateralized by certain production equipment. Amounts drawn were payable in 10 equal semi-annual installments beginning six months after the draw date. On October 18, 2012, we drew $173 million with interest at 2.4% per annum. On January 31, 2013, we drew the remaining available amount under the facility of $41 million with interest at 2.4% per annum. On July 31, 2014, we repaid $32 million of this facility prior to its scheduled maturity and as of August 28, 2014 , the outstanding principal balance was $120 million . On October 17, 2014, subsequent to fiscal 2014, we repaid the remaining carrying value of $120 million on this facility prior to its scheduled maturity date.
71
On July 31, 2013, in connection with the MMJ Acquisition, we recorded a note payable of $120 million , collateralized by certain property, plant and equipment. Principal on the note is payable in equal quarterly installments through May 2016. Interest accrues at a variable rate of 0.85% above the secondary market rate for 90 -day New Taiwan dollar commercial paper, subject to a minimum interest rate of 2.50% per annum. As of August 28, 2014 , the outstanding balance was $70 million .
On February 27, 2014, in connection with our acquisition of an additional 9.9% interest in MMT, we recorded a $127 million note payable to the seller for the present value of the monthly installments, due from March 2014 through December 2014. (See "Equity – Noncontrolling Interests in Subsidiaries – MMT" note.) As of August 28, 2014 , the outstanding balance was $52 million .
In connection with the IM Flash joint venture agreements, on April 6, 2012, we borrowed $65 million under a two -year senior unsecured promissory note from Intel, payable in approximately equal quarterly installments with interest at a rate of three -month LIBOR minus 50 basis points. The note was fully repaid in 2014 according to the scheduled terms. (See "Equity – Noncontrolling Interests in Subsidiaries – IMFT" note.)
Revolving Credit Facilities
On September 5, 2012, we entered into a three -year revolving credit facility. Under this credit facility, we can draw up to the lesser of $255 million or 80% of the net outstanding balance of certain trade receivables, with any amounts drawn collateralized by a security interest in such receivables. The availability of the facility is subject to certain customary conditions, including the absence of any event or circumstance that has a material adverse effect on our business or financial condition. The revolving credit facility contains customary covenants and a repayment provision in the event that the aging of the receivables exceeds a specified threshold. Interest is payable on any outstanding principal balance at a variable rate equal to the 30 -day Singapore Interbank Offering Rate plus 2.8% per annum. As of August 28, 2014 , we had not drawn any of the amounts available under this facility.
On June 27, 2013, we entered into a senior secured three -year revolving credit facility, collateralized by a security interest in certain trade receivables. Under this facility, we can draw up to 85% of the net outstanding balance of certain trade receivables, subject to certain adjustments, including an availability block that has the effect of limiting the maximum committed draw amount to approximately $153 million . The revolving credit facility contains customary covenants and conditions, including as a funding condition the absence of any event or circumstance that has a material adverse effect on our business or financial condition. Generally, interest is payable on any outstanding principal balance at a variable rate equal to the LIBOR plus a spread from 1.5% to 2.0% , or at our option, at a rate equal to an alternate base rate (defined as the highest of (1) the prime rate, (2) one-month LIBOR plus 1.0% or (3) the Federal Funds Effective Rate) plus a spread from 0.5% to 1.0% . In either case, the spread added to the applicable interest rate basis varies depending upon the amount of the monthly average undrawn availability under the facility. As of August 28, 2014 , we had not drawn any of the amounts available under this facility.
Maturities of Notes Payable and Future Minimum Lease Payments
As of August 28, 2014 , maturities of notes payable (including the MMJ Creditor Installment Payments) and future minimum lease payments under capital lease obligations were as follows:
|
| Notes Payable |
| Capital Lease Obligations | ||||
2015 |
| $ | 803 | |
| $ | 356 | |
2016 |
| 352 | |
| 301 | | ||
2017 |
| 320 | |
| 103 | | ||
2018 |
| 602 | |
| 60 | | ||
2019 |
| 684 | |
| 55 | | ||
2020 and thereafter |
| 3,628 | |
| 123 | | ||
Unamortized discounts and interest, respectively |
| (707 | ) |
| (87 | ) | ||
|
| $ | 5,682 | |
| $ | 911 | |
72
Commitments
As of August 28, 2014 , we had commitments of approximately $1.18 billion for the acquisition of property, plant and equipment. We lease certain facilities and equipment under operating leases. Total rental expense was $57 million , $41 million and $48 million for 2014 , 2013 and 2012 , respectively. Minimum future rental commitments as of August 28, 2014 were as follows:
|
| Operating Lease Commitments | ||
2015 |
| $ | 22 | |
2016 |
| 18 | | |
2017 |
| 14 | | |
2018 |
| 13 | | |
2019 |
| 12 | | |
2020 and thereafter |
| 37 | | |
|
| $ | 116 | |
Contingencies
We have accrued a liability and charged operations for the estimated costs of adjudication or settlement of various asserted and unasserted claims existing as of the balance sheet date, including those described below. We are currently a party to other legal actions arising from the normal course of business, none of which is expected to have a material adverse effect on our business, results of operations or financial condition.
Rambus
On May 5, 2004, Rambus, Inc. ("Rambus") filed a complaint in the Superior Court of the State of California (San Francisco County) against us and other DRAM suppliers which alleged that the defendants harmed Rambus by engaging in concerted and unlawful efforts affecting Rambus DRAM by eliminating competition and stifling innovation in the market for computer memory technology and computer memory chips. Rambus' complaint alleged various causes of action under California state law including, among other things, a conspiracy to restrict output and fix prices, a conspiracy to monopolize, intentional interference with prospective economic advantage, and unfair competition. Rambus sought a judgment for damages of approximately $3.90 billion, joint and several liability, trebling of damages awarded, punitive damages, a permanent injunction enjoining the defendants from the conduct alleged in the complaint, interest, and attorneys' fees and costs. Trial began on June 20, 2011, and the case went to the jury on September 21, 2011. On November 16, 2011, the jury found for us on all claims. On April 2, 2012, Rambus filed a notice of appeal to the California 1st District Court of Appeal.
We were engaged in litigation with Rambus relating to certain of Rambus' patents and certain of our claims and defenses. Our lawsuits with Rambus related to patent matters were pending in the U.S. District Court for the District of Delaware, U.S. District Court for the Northern District of California, Germany, France, and Italy.
In December 2013, we settled all pending litigation between us and Rambus, including all antitrust and patent matters. We also entered into a seven-year term patent cross-license agreement with Rambus that allows us to avoid costs of patent-related litigation during the term. We agreed to pay Rambus up to $10 million per quarter over seven years, for a total of $280 million, beginning in the second quarter of 2014. The primary benefits we received from these arrangements were (1) the settlement and termination of all existing litigation, (2) the avoidance of future litigation expenses and (3) the avoidance of future management and customer disruptions. As a result, other operating expense for the first quarter of 2014 included a $233 million charge to accrue a liability, which reflects the discounted value of amounts due under this arrangement.
73
Patent Matters
As is typical in the semiconductor and other high technology industries, from time to time others have asserted, and may in the future assert, that our products or manufacturing processes infringe their intellectual property rights.
On September 1, 2011, HSM Portfolio LLC and Technology Properties Limited LLC filed a patent infringement action in the U.S. District Court for the District of Delaware against us and seventeen other defendants, including MMJ and Elpida Memory (USA) Inc. On August 22, 2013, the plaintiffs filed a third amended complaint. The third amended complaint alleges that certain of our DRAM and image sensor products infringe four U.S. patents and that certain MMJ and Elpida Memory (USA) Inc. DRAM products infringe two U.S. patents and seeks damages, attorneys' fees, and costs. Trial currently is scheduled for February 22, 2016. On March 23, 2012, MMJ and Elpida Memory (USA) Inc. filed a Notice of Filing and Hearing on Petition Under Chapter 15 of the U.S. Bankruptcy Code and Issuance of Provisional Relief that included an order of the U.S. Bankruptcy Court for the District of Delaware staying judicial proceedings against MMJ and Elpida Memory (USA) Inc. Accordingly, the plaintiffs' case against MMJ and Elpida Memory (USA) was stayed. On June 25, 2013, the U.S. Bankruptcy Court for the District of Delaware entered its Order (1) Granting Recognition of the Japanese Reorganization Plan of MMJ and the Tokyo District Court's Confirmation Orders, (2) Entrusting MMJ's U.S. Assets to Foreign Representatives and Approving Certain Plan Transactions, (3) Granting Permanent Injunction, and (4) Granting Related Relief (the "Recognition Order"). Pursuant to the Recognition Order, the plaintiffs are permanently enjoined from continuing their case against MMJ and Elpida Memory (USA) Inc. in respect of any claim or claims arising prior to the commencement of the Japan Proceeding (as defined in the Recognition Order).
On December 5, 2011, the Board of Trustees for the University of Illinois (the "University") filed a patent infringement action against us in the U.S. District Court for the Central District of Illinois. The complaint alleges that unspecified semiconductor products of ours infringe three U.S. patents and seeks injunctive relief, damages, attorneys' fees, and costs. We have filed three petitions for inter-partes review by the Patent and Trademark Office, challenging the validity of each of the patents in suit. The Patent Trial and Appeal Board ("PTAB") held a hearing in connection with the three petitions on December 9, 2013. On March 10, 2014, the PTAB issued written decisions finding that each and every claim in the three patents in suit is invalid, and cancelled all claims. The University has appealed the PTAB rulings to the U.S. Court of Appeals for the Federal Circuit.
On April 27, 2012, Semcon Tech, LLC filed a patent infringement action against us in the U.S. District Court for the District of Delaware. The complaint alleges that our use of various chemical mechanical planarization systems purchased from Applied Materials infringes a single U.S. patent and seeks injunctive relief, damages, attorneys' fees, and costs. Trial is currently scheduled for August 21, 2015.
On December 7, 2007, Tessera, Inc. filed a patent infringement action against MMJ, Elpida Memory (USA) Inc., and numerous other defendants, in the United States District Court for the Eastern District of Texas. The complaint alleges that certain MMJ and Elpida Memory (USA) Inc. products infringe four U.S. patents and seeks injunctive relief, damages, attorneys' fees, and costs. Prior to answering the complaint, MMJ and Elpida Memory (USA) Inc. and other defendants filed motions to stay the case pending final resolution of a case before the International Trade Commission ("ITC") against MMJ and Elpida Memory (USA) Inc. and other respondents, alleging infringement of the same patents asserted in the Eastern District of Texas case (In The Matter of Certain Semiconductor Chips with Minimized Chip Package Size and Products Containing Same (III), ITC No. 337-TA-630 (the "ITC Action")). On February 25, 2008, the Eastern District of Texas Court granted the defendants' motion to stay the action. On December 29, 2009, the ITC issued a Notice of Final Determination in the ITC Action finding no violation by MMJ and Elpida Memory (USA) Inc. Tessera, Inc. subsequently appealed the matter to the U.S. Court of Appeals for the Federal Circuit. On May 23, 2011, the Federal Circuit affirmed the ITC's Final Determination. Additionally, by operation of the Recognition Order, plaintiff in that action is permanently enjoined from continuing its case against MMJ and Elpida Memory (USA) in respect of any claim or claims arising prior to the commencement of the Japan Proceeding (as defined in the Recognition Order). On July 30, 2014, we entered into a five-year term patent cross-license agreement with Tessera, which also settled the pending litigation against MMJ and Elpida Memory (USA). The agreement, which requires us to make quarterly payments over its term, gives us "life-of-product" protection for specifically identified DRAM products and a term license for certain other products. We capitalized an intangible asset for the term of the agreement and also recorded a $66 million charge to cost of goods sold in the fourth quarter of 2014.
Among other things, the above lawsuits pertain to certain of our DDR, DDR2, DDR3, SDR SDRAM, PSRAM, RLDRAM, LPDRAM, NAND Flash, image sensor products and certain other memory products we manufacture, which account for a significant portion of our net sales.
74
Except for the Tessera matter discussed above, we are unable to predict the outcome of assertions of infringement made against us and therefore cannot estimate the range of possible loss. A determination that our products or manufacturing processes infringe the intellectual property rights of others or entering into a license agreement covering such intellectual property could result in significant liability and/or require us to make material changes to our products and/or manufacturing processes. Any of the foregoing could have a material adverse effect on our business, results of operations or financial condition.
Antitrust Matters
At least sixty-eight purported class action price-fixing lawsuits have been filed against us and other DRAM suppliers in various federal and state courts in the United States and in Puerto Rico on behalf of indirect purchasers alleging a conspiracy to increase DRAM prices in violation of federal and state antitrust laws and state unfair competition law, and/or unjust enrichment relating to the sale and pricing of DRAM products during the period from April 1999 through at least June 2002. The complaints seek joint and several damages, trebled, in addition to restitution, costs and attorneys' fees. A number of these cases were removed to federal court and transferred to the U.S. District Court for the Northern District of California for consolidated pre-trial proceedings. In July 2006, the Attorneys General for approximately forty U.S. states and territories filed suit in the U.S. District Court for the Northern District of California. The complaints allege, among other things, violations of the Sherman Act, Cartwright Act, and certain other states' consumer protection and antitrust laws and seek joint and several damages, trebled, as well as injunctive and other relief. On October 3, 2008, the California Attorney General filed a similar lawsuit in California Superior Court, purportedly on behalf of local California government entities, alleging, among other things, violations of the Cartwright Act and state unfair competition law. On June 23, 2010, we executed a settlement agreement resolving these purported class-action indirect purchaser cases and the pending cases of the Attorneys General relating to alleged DRAM price-fixing in the United States. Subject to certain conditions, we agreed to pay approximately $67 million in aggregate in three equal installments over a two-year period. We paid the full amount into an escrow account by the end of the first quarter of 2013 in accordance with the settlement agreement.
On June 21, 2010, the Brazil Secretariat of Economic Law of the Ministry of Justice ("SDE") announced that it had initiated an investigation relating to alleged anticompetitive activities within the DRAM industry. The SDE's Notice of Investigation names various DRAM manufacturers and certain executives, including us, and focuses on the period from July 1998 to June 2002.
We are unable to predict the outcome of these matters and therefore cannot estimate the range of possible loss, except as noted in the above discussion of the U.S. indirect purchaser cases. The final resolution of these alleged violations of antitrust laws could result in significant liability and could have a material adverse effect on our business, results of operations or financial condition.
Securities Matters
On July 12, 2013, seven former shareholders of Elpida (now known as MMJ) filed a complaint against Messrs. Sakamoto, Adachi, Gomi, Shirai, Tsay-Jiu, Wataki, Kinoshita, and Takahasi in their capacity as members of the board of directors of MMJ as of February 2013. The complaint alleges that the defendants engaged in various acts and misrepresentations to hide the financial condition of MMJ and deceive shareholders prior to MMJ filing a petition for corporate reorganization on February 27, 2013. The plaintiffs seek joint and several damages equal to the market value of shares owned by each of the plaintiffs on February 23, 2013, along with attorneys' fees and interest. At a hearing on September 25, 2013, the plaintiffs withdrew the complaint against Mr. Tsay-Jiu.
We are unable to predict the outcome of this matter and therefore cannot estimate the range of possible loss. The final resolution of this matter could result in significant liability and could have a material adverse effect on our business, results of operations or financial condition.
75
Qimonda
On January 20, 2011, Dr. Michael Jaffé, administrator for Qimonda insolvency proceedings, filed suit against MTI and Micron Semiconductor B.V., our Netherlands subsidiary ("Micron B.V."), in the District Court of Munich, Civil Chamber. The complaint seeks to void under Section 133 of the German Insolvency Act a share purchase agreement between Micron B.V. and Qimonda signed in fall 2008 pursuant to which Micron B.V. purchased substantially all of Qimonda's shares of Inotera Memories, Inc. (the "Inotera Shares"), representing approximately 55% of our total shares in Inotera, and seeks an order requiring us to retransfer those shares to the Qimonda estate. The complaint also seeks, among other things, to recover damages for the alleged value of the joint venture relationship with Inotera and to terminate under Sections 103 or 133 of the German Insolvency Code a patent cross-license between us and Qimonda entered into at the same time as the share purchase agreement.
Following a series of hearings with pleadings, arguments and witnesses on behalf of the Qimonda estate, on March 13, 2014, the Court issued judgments: (1) ordering Micron B.V. to pay approximately $1 million in respect of certain Inotera shares sold in connection with the original share purchase; (2) ordering Micron B.V. to disclose certain information with respect to any Inotera Shares sold by it to third parties; (3) ordering Micron B.V. to disclose the benefits derived by it from ownership of the Inotera Shares, including in particular, any profits distributed on such shares and all other benefits; (4) denying Qimonda's claims against Micron Technology for any damages relating to the joint venture relationship with Inotera; and (5) determining that Qimonda's obligations under the patent cross-license agreement are cancelled. In addition, the Court issued interlocutory judgments ordering, among other things: (1) that Micron B.V. transfer to the Qimonda estate the Inotera Shares still owned by it and pay to the Qimonda estate compensation in an amount to be specified for any Inotera Shares sold to third parties; and (2) that Micron B.V. pay the Qimonda estate as compensation an amount to be specified for benefits derived by it from ownership of the Inotera Shares. The interlocutory judgments have no immediate, enforceable effect on us, and, accordingly, we expect to be able to continue to operate with full control of the Inotera Shares subject to further developments in the case. We have filed a notice of appeal, and the parties have submitted briefs to the appeals court. A hearing on the matter is scheduled for February 2, 2015.
We are unable to predict the outcome of the matter and therefore cannot estimate the range of possible loss. The final resolution of this lawsuit could result in the loss of the Inotera Shares or equivalent monetary damages, unspecified damages based on the benefits derived by Micron B.V. from the ownership of the Inotera Shares, and/or the termination of the patent cross-license, which could have a material adverse effect on our business, results of operation or financial condition. As of August 28, 2014, the Inotera Shares had a carrying value in equity method investments for purposes of our financial reporting of $505 million and a market value of $2.06 billion.
Other
In the normal course of business, we are a party to a variety of agreements pursuant to which we may be obligated to indemnify the other party. It is not possible to predict the maximum potential amount of future payments under these types of agreements due to the conditional nature of our obligations and the unique facts and circumstances involved in each particular agreement. Historically, our payments under these types of agreements have not had a material adverse effect on our business, results of operations or financial condition.
Redeemable Convertible Notes
Under the terms of the indentures of the 2033E and 2033F Notes, upon conversion, we would be required to pay cash equal to the lesser amount of (1) the aggregate principal amount or (2) the conversion value of the notes being converted (we could pay cash, shares of common stock or a combination thereof, at our option, for the remainder, if any, of our conversion obligation). Additionally, the 2033E and 2033F Notes were convertible at the option of the holders as of August 28, 2014 . Therefore, the 2033E and 2033F Notes were classified as current debt and the aggregate difference of $57 million between the principal amount and the carrying value was classified as redeemable convertible notes in the mezzanine section of the accompanying consolidated balance sheet as of August 28, 2014 . (See "Debt" note.)
76
Equity
Micron Shareholders' Equity
Capped Calls
Issued and Outstanding Capped Calls : We have entered into capped calls, which are intended to reduce the effect of potential dilution from our convertible notes. The capped calls provide for our receipt of cash or shares, at our election, from our counterparties if the trading price of our stock is above a specified initial strike price at the expiration date. The amount receivable varies based on the trading price of our stock, up to a specified cap price. The dollar value of the cash or shares that we would receive from the capped calls upon their expiration date ranges from $0 if the trading price of our stock is below the initial strike price for all of the capped calls to $864 million if the trading price of our stock is at or above the cap price for all of the capped calls. We paid $57 million in 2011 to purchase the 2031 Capped Calls, $103 million in 2012 to purchase the 2032 Capped Calls and $48 million in 2013 to purchase the 2033 Capped Calls. The amounts paid were recorded as charges to additional capital.
The following table presents information related to the issued and outstanding capped calls as of August 28, 2014 :
Capped Calls |
| |
|
|
| Strike Price |
| Cap Price Range |
| Underlying Common Shares |
| Value at Expiration (1) | |||||||||||||||
| Expiration Dates |
|
| Low |
| High |
|
| Minimum |
| Maximum | ||||||||||||||||
2031 |
| Jul 2015 | – | Feb 2016 |
| $ | 9.50 | |
| $ | 12.67 | |
| $ | 13.17 | |
| 34 | |
| $ | - | |
| $ | 117 | |
2032C |
| May 2016 | – | Nov 2017 |
| 9.80 | |
| 14.26 | |
| 15.69 | |
| 56 | |
| - | |
| 307 | | |||||
2032D |
| Nov 2016 | – | May 2018 |
| 10.16 | |
| 14.62 | |
| 16.04 | |
| 44 | |
| - | |
| 244 | | |||||
2033E |
| Jan 2018 | – | Feb 2018 |
| 10.93 | |
| 14.51 | |
| 14.51 | |
| 27 | |
| - | |
| 98 | | |||||
2033F |
| Jan 2020 | – | Feb 2020 |
| 10.93 | |
| 14.51 | |
| 14.51 | |
| 27 | |
| - | |
| 98 | | |||||
|
|
|
|
|
|
|
|
|
|
|
| 188 | |
| $ | - | |
| $ | 864 | | ||||||
(1) | Settlement in cash on the respective expiration dates would result in us receiving an amount ranging from zero, if the market price per share of our common stock is at or below the low strike price, to the maximum amount if the market price per share of our common stock is at or above the high cap price. If share settlement were elected, the number of shares received would be determined by the value of the capped calls at the time of settlement divided by the share price on the settlement date. Settlement of the capped calls prior to the expiration dates may be for an amount less than the maximum value at expiration. |
Unwind of Capped Calls : In May 2014, we and the counterparties agreed to terminate and unwind a portion of our 2031 Capped Calls. We elected share settlement and received 3 million shares of our stock, equivalent to approximately $86 million based on the trading stock price at the time of the unwind. The shares were retired from treasury stock in 2014.
Restrictions on Net Assets
As a result of the Japan Proceedings, for so long as such proceedings are continuing, the MMJ Group is subject to certain restrictions on dividends, loans and advances. In addition, our ability to access IMFT's cash and other assets through dividends, loans or advances, including to finance our other operations, is subject to agreement by Intel. As a result, our total restricted net assets (net assets less intercompany balances and noncontrolling interests) as of August 28, 2014 were $3.10 billion for the MMJ Group, which included cash and equivalents of $1.60 billion , and $793 million for IMFT.
(See "Micron Memory Japan, Inc." note and "IMFT" below.)
77
Accumulated Other Comprehensive Income (Loss)
Changes in accumulated other comprehensive income (loss) by component for the year ended August 28, 2014 , were as follows:
|
| Cumulative Foreign Currency Translation Adjustments |
| Gains (Losses) on Derivative Instruments, Net |
| Gains (Losses) on Investments, Net |
| Pension Liability Adjustments |
| Total | ||||||||||
Balance as of August 29, 2013 |
| $ | 44 | |
| $ | 21 | |
| $ | - | |
| $ | (2 | ) |
| $ | 63 | |
Other comprehensive income before reclassifications |
| 1 | |
| (4 | ) |
| 4 | |
| 1 | |
| 2 | | |||||
Amount reclassified out of accumulated other comprehensive income |
| (3 | ) |
| (4 | ) |
| (3 | ) |
| 1 | |
| (9 | ) | |||||
Tax effects |
| - | |
| (1 | ) |
| - | |
| 1 | |
| - | | |||||
Other comprehensive income (loss) |
| (2 | ) |
| (9 | ) |
| 1 | |
| 3 | |
| (7 | ) | |||||
Balance as of August 28, 2014 |
| $ | 42 | |
| $ | 12 | |
| $ | 1 | |
| $ | 1 | |
| $ | 56 | |
Noncontrolling Interests in Subsidiaries
As of |
| 2014 |
| 2013 | ||||||||||
|
| Noncontrolling Interest Balance |
| Noncontrolling Interest Percentage |
| Noncontrolling Interest Balance |
| Noncontrolling Interest Percentage | ||||||
IMFT (1) |
| $ | 693 | |
| 49 | % |
| $ | 601 | |
| 49 | % |
MP Mask (1) |
| 93 | |
| 50 | % |
| 92 | |
| 50 | % | ||
MMT |
| 9 | |
| | |
| 155 | |
| 11 | % | ||
Other |
| 7 | |
| Various | |
| 16 | |
| Various | | ||
|
| $ | 802 | |
|
|
| $ | 864 | |
|
| ||
(1) Entity is a variable interest entity.
IMFT
Since inception in 2006 through August 28, 2014 , we have owned 51% of IMFT, a venture between us and Intel to manufacture NAND Flash memory products and certain emerging memory technologies for the exclusive use of the members. IMFT is governed by a Board of Managers and the number of managers appointed by each member to the board varies based on the members' respective ownership interests, which is based on cumulative contributions to IMFT. The IMFT joint venture agreement extends through 2024 and includes certain buy-sell rights with an Intel put right, commencing in January 2015, and our call right commencing in January 2018, pursuant to which Intel may elect to sell to us, or we may elect to purchase from Intel, Intel's interest in IMFT. If Intel elects to sell to us, we would set the closing date of the transaction within two years following such election and could elect to receive financing of the purchase price from Intel for one to two years from the closing date.
IMFT manufactures NAND Flash memory products using designs and technology we develop with Intel. We generally share with Intel the costs of product design, other NAND Flash R&D costs and R&D costs of certain emerging memory technologies. Our R&D expenses were reduced by reimbursements from Intel of $137 million , $127 million and $87 million for 2014 , 2013 and 2012 , respectively.
We sell a portion of our products to Intel through our IMFT venture at long-term negotiated prices approximating cost. Sales of NAND Flash products to Intel under this arrangement were $423 million , $387 million and $718 million for 2014 , 2013 and 2012 , respectively. Receivables from Intel for sales of NAND Flash products as of August 28, 2014 and August 29, 2013 , were $66 million and $68 million , respectively.
78
The following table presents the assets and liabilities of IMFT included in our consolidated balance sheets, excluding intercompany balances:
As of |
| 2014 |
| 2013 | ||||
Assets |
|
|
|
| ||||
Cash and equivalents |
| $ | 84 | |
| $ | 62 | |
Receivables |
| 73 | |
| 76 | | ||
Inventories |
| 48 | |
| 49 | | ||
Other current assets |
| 5 | |
| 4 | | ||
Total current assets |
| 210 | |
| 191 | | ||
Property, plant and equipment, net |
| 1,545 | |
| 1,382 | | ||
Other noncurrent assets |
| 47 | |
| 46 | | ||
Total assets |
| $ | 1,802 | |
| $ | 1,619 | |
|
|
|
|
| ||||
Liabilities |
|
| |
|
| | ||
Accounts payable and accrued expenses |
| $ | 92 | |
| $ | 88 | |
Deferred income |
| 8 | |
| 9 | | ||
Equipment purchase contracts |
| 14 | |
| 78 | | ||
Current portion of long-term debt |
| 21 | |
| 6 | | ||
Total current liabilities |
| 135 | |
| 181 | | ||
Long-term debt |
| 71 | |
| 13 | | ||
Other noncurrent liabilities |
| 110 | |
| 118 | | ||
Total liabilities |
| $ | 316 | |
| $ | 312 | |
Amounts exclude intercompany balances that were eliminated in our consolidated balance sheets.
Our ability to access IMFT's cash and other assets through dividends, loans or advances, including to finance our other operations, is subject to agreement by Intel. Creditors of IMFT have recourse only to IMFT's assets and do not have recourse to any other of our assets.
The following table presents IMFT's distributions to and contributions from its shareholders:
For the year ended |
| 2014 |
| 2013 |
| 2012 | ||||||
IMFT distributions to Micron |
| $ | 10 | |
| $ | 38 | |
| $ | 439 | |
IMFT distributions to Intel |
| 10 | |
| 37 | |
| 391 | | |||
Micron contributions to IMFT |
| 106 | |
| 12 | |
| 48 | | |||
Intel contributions to IMFT |
| 102 | |
| 11 | |
| 46 | | |||
IMFS
We partnered with Intel to form IMFS in 2007 to manufacture NAND Flash memory products for the exclusive use of the members. Our ownership percentage of IMFS had increased from 51% at inception to 82% in April 2012 due to a series of contributions by us that were not fully matched by Intel. In April 2012, we entered into a series of agreements with Intel and acquired Intel's remaining 18% interest in IMFS for $466 million . In addition, we acquired IMFT's assets located at our Virginia wafer fabrication facility, for which Intel received a distribution from IMFT of $139 million . For both transactions, the amounts Intel received approximated the book values of Intel's interests in the assets acquired. Additionally, we received a $300 million deposit from Intel, substantially all of which was applied to Intel's purchases of NAND Flash products from 2012 to 2014 under a supply agreement. In 2012, Micron and Intel paid capital contributions to IMFS of $103 million and $131 million , respectively.
IMFS sold products to the joint venture members generally in proportion to their ownership interests at long-term negotiated prices approximating cost. IMFS sales of NAND Flash product to Intel for 2012 were $158 million and as a result of the April 2012 agreements, Intel had no continuing rights to the output from the IMFS and Virginia facilities.
79
MP Mask
In 2006, we formed a joint venture with Photronics to produce photomasks for leading-edge and advanced next generation semiconductors. The MP Mask joint venture agreement allows either party to terminate the joint venture in either May 2016, provided notice is given prior to May 2015, or in each five -year successive period following May 2016, provided such notice is given at least twelve months prior to the end of the successive five-year period. At inception and through August 28, 2014 , we owned approximately 50% and Photronics owned approximately 50% of MP Mask. We contributed $21 million to MP Mask and Photronics contributed $20 million to MP Mask in 2012. We purchase a substantial majority of the photomasks produced by MP Mask pursuant to a supply arrangement.
The following table presents the assets and liabilities of MP Mask included in our consolidated balance sheets:
As of |
| 2014 |
| 2013 | ||||
Current assets |
| $ | 24 | |
| $ | 26 | |
Noncurrent assets (primarily property, plant and equipment) |
| 203 | |
| 182 | | ||
Current liabilities |
| 28 | |
| 25 | | ||
Noncurrent liabilities |
| 14 | |
| - | | ||
Creditors of MP Mask have recourse only to MP Mask's assets and do not have recourse to any other of our assets.
In February 2012, we sold to Photronics for $35 million a photomask production facility we had leased to them under an operating lease. The proceeds were equal to our net carrying value and no gain or loss was realized from the sale.
MMT
As of August 29, 2013, noncontrolling interests in MMT were 11% . In 2014, we purchased additional interests in MMT for an aggregate of $146 million , and as of August 28, 2014, noncontrolling interests in MMT were less than 1%. Substantially all of the MMT shares purchased in 2014 were financed with a short-term loan from a seller. As a result of the purchases of MMT shares in 2014, in aggregate, noncontrolling interests decreased by $180 million and additional capital increased by $34 million . (See "Debt – Other Notes Payable" note.)
Derivative Instruments
We use derivative instruments to manage a portion of our exposure to changes in currency exchange rates from our monetary assets and liabilities and to reduce the volatility that changes in interest rates on variable-rate debt have on our earnings. We also have convertible note settlement obligations which became derivative instruments as a result of our elections to settle conversions in cash. We do not use derivative instruments for speculative purpose.
Derivative Instruments without Hedge Accounting Designation
Currency Derivatives: We use derivative instruments to manage a portion of our exposure to changes in currency exchange rates from our monetary assets and liabilities. Our primary objective in entering into currency derivatives is to reduce the volatility that changes in currency exchange rates have on our earnings.
To hedge our exposures to monetary assets and liabilities, we generally utilize a rolling hedge strategy with currency forward contracts that mature within 35 days. At the end of each reporting period, monetary assets and liabilities denominated in currencies other than the U.S. dollar are remeasured in U.S. dollars and the associated outstanding forward contracts are marked-to-market. Currency forward contracts are valued at fair values based on the middle of bid and ask prices of dealers or exchange quotations (Level 2 fair value measurements). In connection with the currency exchange rate risk associated with the MMJ Acquisition in July 2013, we entered into currency exchange transactions (the "MMJ Acquisition Hedges"). The MMJ Acquisition Hedges were not designated for hedge accounting and were remeasured at fair value each period. We recorded losses from the MMJ Acquisition Hedges of $228 million in 2013 and gains of $8 million in 2012. To mitigate the risk of the yen strengthening against the U.S. dollar on the MMJ creditor installment payments due in December 2014 and December 2015, we entered into forward contracts to purchase 20 billion yen on November 28, 2014 and 10 billion yen on November 27, 2015.
80
Realized and unrealized gains and losses on currency derivatives without hedge accounting designation as well as the change in the underlying monetary assets and liabilities due to changes in currency exchange rates are included in other non-operating income (expense).
Interest Rate Swaps: As of August 29, 2013 w e were party to interest rate swap contracts scheduled to mature in August 2017 to hedge against the variability of future interest payments due on variable-rate debt, which effectively converted the variable-rate debt to fixed-rate debt. We designated 80% of the swaps as cash flow hedges and the remaining 20% were not designated for hedge accounting treatment. On August 27, 2014, we repaid the remaining carrying value of $252 million of the note prior to its scheduled maturity and terminated the interest rate swaps.
Convertible Notes Settlement Obligations: In connection with our debt restructure activities in 2014, holders elected to convert substantially all of the outstanding 2014 Notes, 2027 Notes, 2031A Notes and 2031B Notes. As a result of our elections to settle the conversion amounts in cash, each of the settlement obligations became derivative debt liabilities subject to mark-to-market accounting treatment for a period of approximately 30 days, beginning on the date we notified the holder of our intention to settle the obligation in cash through the settlement date. The fair values of the underlying derivative settlement obligations were initially determined using the Black-Scholes option valuation model (Level 2 fair value measurements). The Black-Scholes model requires the input of assumptions, including the stock price, expected stock-price volatility, estimated option life, risk-free interest rate and dividend rate. The subsequent measurements and final settlement amounts of our convertible notes settlement obligations were based on the volume-weighted average stock price (Level 1 fair value measurements). Changes in fair values of the derivative settlement obligations were included in other non-operating income (expense), net.
Total gross notional amounts and fair values for derivative instruments without hedge accounting designation were as follows:
|
| Notional Amount (1) |
| Fair Value of | ||||||||||||||||
Current Assets (2) |
| Noncurrent Assets (3) |
| Current Liabilities (4) |
| Noncurrent Liabilities (5) | ||||||||||||||
As of August 28, 2014 |
|
|
|
|
|
|
|
|
|
| ||||||||||
Currency forward contracts: |
|
|
|
|
|
|
|
|
|
| ||||||||||
Yen |
| $ | 554 | |
| $ | - | |
| $ | - | |
| $ | (12 | ) |
| $ | (6 | ) |
Singapore dollar |
| 330 | |
| - | |
| - | |
| - | |
| - | | |||||
Euro |
| 245 | |
| - | |
| - | |
| (1 | ) |
| - | | |||||
Shekel |
| 62 | |
| - | |
| - | |
| (1 | ) |
| - | | |||||
|
| $ | 1,191 | |
|
|
|
|
|
|
|
| ||||||||
|
|
|
|
|
|
|
|
|
|
| ||||||||||
Convertible notes settlement obligations |
| 12 | |
| - | |
| - | |
| (389 | ) |
| - | | |||||
|
| |
| $ | - | |
| $ | - | |
| $ | (403 | ) |
| $ | (6 | ) | ||
As of August 29, 2013 |
|
|
|
|
|
|
|
|
|
| ||||||||||
Currency forward contracts: |
|
|
|
|
|
|
|
|
|
| ||||||||||
Yen |
| $ | 336 | |
| $ | 1 | |
| $ | 3 | |
| $ | - | |
| $ | - | |
Singapore dollar |
| 218 | |
| - | |
| - | |
| - | |
| - | | |||||
Euro |
| 217 | |
| 1 | |
| - | |
| (1 | ) |
| - | | |||||
Shekel |
| 78 | |
| - | |
| - | |
| (1 | ) |
| - | | |||||
Interest rate swap contracts |
| 62 | |
| - | |
| - | |
| - | |
| - | | |||||
Currency options - New Taiwan dollar |
| 351 | |
| - | |
| - | |
| - | |
| - | | |||||
|
| $ | 1,262 | |
| $ | 2 | |
| $ | 3 | |
| $ | (2 | ) |
| $ | - | |
(1) | Notional amounts of forward, option and interest rate swap contracts in U.S. dollars and convertible notes settlement obligations in shares. |
(2) | Included in receivables - other. |
(3) | Included in other noncurrent assets. |
(4) | Included in accounts payable and accrued expenses - other for forward, option and interest rate swap contracts and in current debt for convertible notes settlement obligations. |
(5) | Included in other noncurrent liabilities. |
81
Net gains (losses) for derivative instruments without hedge accounting designation were as follows:
For the year ended |
| 2014 |
| 2013 |
| 2012 |
| Location | ||||||
Convertible notes settlement obligations |
| $ | (59 | ) |
| $ | - | |
| $ | - | |
| Other non-operating income (expense) |
Foreign exchange contracts |
| (27 | ) |
| (222 | ) |
| (17 | ) |
| Other non-operating income (expense) | |||
Derivative Instruments with Cash Flow Hedge Accounting Designation
Currency Derivatives: We utilize currency forward contracts that generally mature within 12 months and currency options that generally mature within 12 to 18 months to hedge our exposure to changes in cash flows from changes in currency exchange rates for certain capital expenditures and forecasted operating cash flows. Currency forward contracts are measured at fair value based on market-based observable inputs including currency exchange spot and forward rates, interest rate and credit risk spread (Level 2 fair value measurements). Currency options are measured at their fair value using a modified Black-Scholes option valuation model using inputs of the current spot rate, strike price, risk-free interest rate, maturity, volatility and credit-risk spread (Level 2 fair value measurements).
Interest Rate Swaps: As noted above in "Derivative Instruments without Hedge Designation – Interest Rate Swaps," we were party to interest rate swap contracts scheduled to mature in August 2017 to hedge against the variability in future interest payments due on variable-rate debt and we designated 80% of the swaps as cash flow hedges. On August 27, 2014, we repaid the remaining carrying value of $252 million of the note prior to its scheduled maturity and terminated the interest rate swaps. Amounts reclassified from accumulated other comprehensive income (loss) were not significant.
For derivative instruments designated as cash flow hedges, the effective portion of the realized and unrealized gain or loss on the derivatives is included as a component of accumulated other comprehensive income (loss). Amounts in accumulated other comprehensive income (loss) are reclassified into earnings in the same line items of the consolidated statements of operation and in the same periods in which the underlying transactions affect earnings. The ineffective or excluded portion of the realized and unrealized gain or loss is included in other non-operating income (expense). Total gross notional amounts and fair values for derivative instruments with cash flow hedge accounting designation were as follows:
|
| Notional Amount (in U.S. Dollars) |
| Fair Value of Current Liabilities (1) | ||||
As of August 28, 2014 |
|
|
|
| ||||
Currency forward contracts: |
|
|
|
| ||||
Yen |
| $ | 94 | |
| $ | (2 | ) |
Euro |
| 24 | |
| - | | ||
|
| $ | 118 | |
| $ | (2 | ) |
As of August 29, 2013 |
|
| |
|
| | ||
Currency forward contracts: |
|
|
|
| ||||
Yen |
| $ | 6 | |
| $ | (1 | ) |
Euro |
| 6 | |
| - | | ||
Interest swap contracts |
| 250 | |
| - | | ||
Currency options - Yen |
| 21 | |
| (2 | ) | ||
|
| $ | 283 | |
| $ | (3 | ) |
(1) | Included in accounts payable and accrued expenses - other. |
For 2014 , 2013 and 2012, we recognized losses of $4 million , $8 million and $9 million , respectively, in accumulated other comprehensive income (loss) from the effective portion of cash flow hedges. The ineffective and excluded portions of cash flow hedges recognized in other non-operating income (expense) were not significant in 2014, 2013 or 2012. For 2014 , 2013 and 2012, we reclassified gains of $4 million , $1 million and $9 million , respectively, from accumulated other comprehensive income (loss) to earnings. As of August 28, 2014 , $8 million of gains from cash flow hedges included in accumulated other accumulated comprehensive income (loss) is expected to be reclassified into earnings in the next 12 months.
82
Derivative Counterparty Credit Risk and Master Netting Arrangements
Our derivative instruments expose us to credit risk to the extent the counterparties may be unable to meet the terms of the derivative instrument. As of August 28, 2014 , our maximum exposure to loss due to credit risk if counterparties fail completely to perform according to the terms of the contracts was generally equal to the fair value of our assets for these contracts as listed in the tables above. We seek to mitigate such risk by limiting our counterparties to major financial institutions and by spreading risk across multiple financial institutions. In addition, we monitor the potential risk of loss with any one counterparty resulting from this type of credit risk on an ongoing basis.
We also seek to enter into master netting arrangements with our counterparties to mitigate credit risk in derivative hedge transactions. These master netting arrangements allow us and our counterparties to net settle amounts owed to each other. Derivative assets and liabilities that can be net settled with each counterparty under these arrangements have been presented in our consolidated balance sheet on a net basis. As of August 28, 2014 amounts netted were not significant.
Fair Value Measurements
Accounting standards establish three levels of inputs that may be used to measure fair value: quoted prices in active markets for identical assets or liabilities (referred to as Level 1), inputs other than Level 1 that are observable for the asset or liability either directly or indirectly (referred to as Level 2) and unobservable inputs to the valuation methodology that are significant to the measurement of fair value of assets or liabilities (referred to as Level 3).
Fair Value Measurements on a Recurring Basis
All marketable debt and equity investments are classified as available-for-sale and are carried at fair value. Assets measured at fair value on a recurring basis were as follows:
As of |
| 2014 |
| 2013 | ||||||||||||||||||||
|
| Level 1 |
| Level 2 |
| Total |
| Level 1 |
| Level 2 |
| Total | ||||||||||||
Cash equivalents: |
|
|
|
|
|
|
|
|
|
|
|
| ||||||||||||
Money market funds |
| $ | 1,281 | |
| $ | - | |
| $ | 1,281 | |
| $ | 1,188 | |
| $ | - | |
| $ | 1,188 | |
Certificates of deposit |
| - | |
| 402 | |
| 402 | |
| - | |
| 38 | |
| 38 | | ||||||
Commercial paper |
| - | |
| 22 | |
| 22 | |
| - | |
| 35 | |
| 35 | | ||||||
|
| 1,281 | |
| 424 | |
| 1,705 | |
| 1,188 | |
| 73 | |
| 1,261 | | ||||||
Short-term investments: |
|
|
|
|
|
|
|
|
|
|
|
| ||||||||||||
Corporate bonds |
| - | |
| 154 | |
| 154 | |
| - | |
| 112 | |
| 112 | | ||||||
Government securities |
| - | |
| 136 | |
| 136 | |
| - | |
| 72 | |
| 72 | | ||||||
Commercial paper |
| - | |
| 85 | |
| 85 | |
| - | |
| 26 | |
| 26 | | ||||||
Certificates of deposit |
| - | |
| 8 | |
| 8 | |
| - | |
| 9 | |
| 9 | | ||||||
Asset-backed securities |
| - | |
| 1 | |
| 1 | |
| - | |
| 2 | |
| 2 | | ||||||
|
| - | |
| 384 | |
| 384 | |
| - | |
| 221 | |
| 221 | | ||||||
Long-term marketable investments: |
|
|
|
|
|
|
|
|
|
|
|
| ||||||||||||
Corporate bonds |
| - | |
| 407 | |
| 407 | |
| - | |
| 302 | |
| 302 | | ||||||
Government securities |
| - | |
| 284 | |
| 284 | |
| - | |
| 96 | |
| 96 | | ||||||
Asset-backed securities |
| - | |
| 127 | |
| 127 | |
| - | |
| 95 | |
| 95 | | ||||||
Marketable equity securities |
| 1 | |
| - | |
| 1 | |
| 6 | |
| - | |
| 6 | | ||||||
|
| 1 | |
| 818 | |
| 819 | |
| 6 | |
| 493 | |
| 499 | | ||||||
Restricted cash: |
|
|
|
|
|
|
|
|
|
|
|
| ||||||||||||
Certificates of deposit |
| - | |
| 27 | |
| 27 | |
| - | |
| 302 | |
| 302 | | ||||||
|
| - | |
| 27 | |
| 27 | |
| - | |
| 302 | |
| 302 | | ||||||
|
|
|
|
|
|
|
|
|
|
|
|
| ||||||||||||
|
| $ | 1,282 | |
| $ | 1,653 | |
| $ | 2,935 | |
| $ | 1,194 | |
| $ | 1,089 | |
| $ | 2,283 | |
83
Government securities consist of securities issued directly by or deemed to be guaranteed by government entities such as U.S. and non U.S. agency securities, government bonds and treasury securities. Level 2 securities are valued using information obtained from pricing services, which obtain quoted market prices for similar instruments, non-binding market consensus prices that are corroborated by observable market data, or various other methodologies, to determine the appropriate value at the measurement date. We perform supplemental analysis to validate information obtained from our pricing services. As of August 28, 2014 , no adjustments were made to such pricing information.
Fair Value Measurements on a Nonrecurring Basis
In connection with the Exchange Transactions, we determined the fair value for the debt component of the Exchanged Notes as if it were a stand-alone instrument using an interest rate for similar nonconvertible debt issued by entities with credit ratings comparable to ours at the time of issuance (Level 2). In connection with the debt conversions and settlements in 2014, we determined the initial fair value of the equity component of the converted notes that was reclassified to debt using the Black-Scholes option valuation model (Level 2). The Black-Scholes model requires the input of assumptions, including the stock price, expected stock-price volatility, estimated option life, risk-free interest rate and dividend rate. The subsequent measurements of our convertible notes settlement obligations were based on the value-weighted average stock price (Level 1). Changes in fair values of the derivatives settlement obligations were included in other non-operating income (expense).
Our non-marketable securities, equity method investments, and non-financial assets such as intellectual property and property, plant and equipment are carried at cost unless impairment is deemed to have occurred.
During 2012, the Board of Directors of Transform approved a liquidation plan. As a result, we impaired our investment in Transform to the estimated liquidation values for its assets and liabilities measured using unobservable inputs (Level 3). The fair values of Transform's primary assets, semiconductor equipment and a manufacturing facility, were based on quotations obtained from equipment dealers, which consider the remaining useful life and configuration of the equipment and sales of similar manufacturing facilities, and properties in comparable markets, respectively. Based on our valuation of Transform's net assets, we recognized an other-than-temporary impairment charge of $69 million in equity in net income (losses) of equity method investees.
In connection with our restructure and asset impairment charges, the fair value of our 200 mm wafer fabrication equipment in Kiryat Gat, Israel was determined primarily based on the expected proceeds of the sale and the fair value of a supply agreement to manufacture NOR flash memory at the facility (Level 3 fair value measurement). The fair values of our MIT assets and our Light-emitting Diode ("LED") production assets were based on quotations obtained from equipment dealers, which consider the remaining useful life and configuration of the equipment (Level 3 fair value measurement). (See "Restructure and Asset Impairments" note.)
Fair Value of Financial Instruments
Amounts reported as cash and equivalents, receivables, and accounts payable and accrued expenses approximate fair value. The estimated fair value and carrying value of debt instruments (carrying value excludes the equity and mezzanine components of our convertible notes, which are classified in equity) were as follows:
As of |
| 2014 |
| 2013 | ||||||||||||
|
| Fair Value |
| Carrying Value |
| Fair Value |
| Carrying Value | ||||||||
Convertible notes |
| $ | 5,886 | |
| $ | 2,143 | |
| $ | 4,167 | |
| $ | 2,506 | |
MMJ creditor installment payments and other notes | 3,634 | |
| 3,539 | |
| 2,269 | |
| 2,279 | | |||||
The fair values of our convertible notes were determined based on inputs that are observable in the market or that could be derived from, or corroborated with, observable market data, including the trading price of our convertible notes, when available, our stock price and interest rates based on similar debt issued by parties with credit ratings similar to ours (Level 2). The fair value of our other debt instruments was estimated based on discounted cash flows using inputs that are observable in the market or that could be derived from, or corroborated with, observable market data, including interest rates based on similar debt issued by parties with credit ratings similar to ours (Level 2).
84
Equity Plans
As of August 28, 2014 , we had an aggregate of 161 million shares of common stock reserved for the issuance of stock options and restricted stock awards, of which 62 million shares were subject to outstanding awards and 99 million shares were available for future awards. Awards are subject to terms and conditions as determined by our Board of Directors.
Stock Options
Our stock options are generally exercisable in increments of either one-fourth or one-third per year beginning one year from the date of grant. Stock options issued after February 2014 generally expire eight years from the date of grant. Options issued from October 2004 to February 2014 generally expire six years from the date of grant.
Option activity for 2014 is summarized as follows:
|
| Number of Shares |
| Weighted-Average Exercise Price Per Share |
| Weighted-Average Remaining Contractual Life (In Years) |
| Aggregate Intrinsic Value | |||||
Outstanding at August 29, 2013 |
| 71 | |
| $ | 7.41 | |
|
|
|
| ||
Granted |
| 12 | |
| 22.61 | |
|
|
|
| |||
Exercised |
| (32 | ) |
| 8.27 | |
|
|
|
| |||
Cancelled or expired |
| (3 | ) |
| 9.27 | |
|
|
|
| |||
Outstanding at August 28, 2014 |
| 48 | |
| 10.57 | |
| 3.8 |
| $ | 1,078 | | |
|
|
|
|
|
|
|
|
| |||||
Exercisable at August 28, 2014 |
| 14 | |
| $ | 6.88 | |
| 2.4 |
| $ | 362 | |
Expected to vest after August 28, 2014 |
| 33 | |
| 11.92 | |
| 4.3 |
| 692 | | ||
The weighted-average grant-date fair value per share was $9.64 , $3.34 and $3.18 for options granted during 2014 , 2013 and 2012 , respectively. The total intrinsic value was $421 million , $103 million , and $6 million for options exercised during 2014 , 2013 and 2012 , respectively.
The fair values of option awards were estimated at each grant date using the Black-Scholes option valuation model. The Black-Scholes model requires the input of assumptions, including the expected stock-price volatility and estimated option life. The expected volatilities utilized were based on implied volatilities from traded options on our stock and on historical volatility. The expected lives of options granted were based, in part, on historical experience and on the terms and conditions of the options. The risk-free interest rates utilized were based on the U.S. Treasury yield in effect at each grant date. No dividends were assumed in estimated option values. Assumptions used in the Black-Scholes model are presented below:
For the year ended |
| 2014 |
| 2013 |
| 2012 | |||
Average expected life in years |
| 4.9 | |
| 5.1 | |
| 5.1 | |
Weighted-average expected volatility |
| 48 | % |
| 59 | % |
| 66 | % |
Weighted-average risk-free interest rate |
| 1.6 | % |
| 0.7 | % |
| 0.9 | % |
85
Restricted Stock and Restricted Stock Units ("Restricted Stock Awards")
As of August 28, 2014 , there were 13 million shares of Restricted Stock Awards outstanding, of which 1 million were performance-based Restricted Stock Awards. For service-based Restricted Stock Awards, restrictions generally lapse in one-fourth increments during each year of employment after the grant date. For performance-based Restricted Stock Awards, vesting is contingent upon meeting certain performance goals. Restricted Stock Awards activity for 2014 is summarized as follows:
|
| Number of Shares |
| Weighted-Average Grant Date Fair Value Per Share | |||
Outstanding at August 29, 2013 |
| 13 | |
| $ | 6.49 | |
Granted |
| 7 | |
| 21.88 | | |
Restrictions lapsed |
| (6 | ) |
| 6.29 | | |
Cancelled |
| (1 | ) |
| 8.75 | | |
Outstanding at August 28, 2014 |
| 13 | |
| 15.08 | | |
|
|
|
|
| |||
Expected to vest after August 28, 2014 |
| 13 | |
| $ | 14.91 | |
For the year ended |
| 2014 |
| 2013 |
| 2012 | ||||||
Weighted-average grant-date fair values per share |
| $ | 21.88 | |
| $ | 6.23 | |
| $ | 5.43 | |
Aggregate fair values at vesting date |
| 115 | |
| 17 | |
| 32 | | |||
Stock-based Compensation Expense
For the year ended |
| 2014 |
| 2013 |
| 2012 | ||||||
Stock-based compensation expense by caption: |
|
|
|
|
|
| ||||||
Cost of goods sold |
| $ | 39 | |
| $ | 27 | |
| $ | 23 | |
Selling, general and administrative |
| 50 | |
| 45 | |
| 47 | | |||
Research and development |
| 25 | |
| 18 | |
| 17 | | |||
Other |
| 1 | |
| 1 | |
| - | | |||
|
| $ | 115 | |
| $ | 91 | |
| $ | 87 | |
|
|
|
|
|
|
| ||||||
Stock-based compensation expense by type of award: |
|
|
|
|
|
| ||||||
Stock options |
| $ | 61 | |
| $ | 57 | |
| $ | 57 | |
Restricted stock awards |
| 54 | |
| 34 | |
| 30 | | |||
|
| $ | 115 | |
| $ | 91 | |
| $ | 87 | |
Stock-based compensation expense of $9 million and $6 million was capitalized and remained in inventory as of August 28, 2014 and August 29, 2013 , respectively. As of August 28, 2014 , $275 million of total unrecognized compensation costs, net of estimated forfeitures, related to non-vested awards was expected to be recognized through the fourth quarter of 2018 , resulting in a weighted-average period of 1.4 years. Stock-based compensation expense in the above presentation does not reflect any significant income tax benefits, which is consistent with our treatment of income or loss from our U.S. operations. (See "Income Taxes" note.)
86
Employee Benefit Plans
We have employee retirement plans at our U.S. and international sites. Details of the more significant plans are discussed as follows:
Employee Savings Plan for U.S. Employees
We have 401(k) retirement plans ("RAM Plans") under which U.S. employees may contribute up to 75% of their eligible pay (subject to IRS annual contribution limits) to various savings alternatives, none of which include direct investment in our stock. We match in cash eligible contributions from employees up to 5% of the employee's annual eligible earnings. Contribution expense for the RAM Plans was $44 million , $41 million and $41 million in 2014 , 2013 and 2012 , respectively.
Retirement Plans
We have pension plans in various countries. The pension plans are only available to local employees and are generally government mandated. As of August 28, 2014 , the projected benefit obligations of our plans was $164 million and plan assets were $90 million . As of August 29, 2013 , the projected benefit obligations of our plans was $196 million and plan assets were $116 million . Pension expense was not significant for 2014, 2013 or 2012.
Restructure and Asset Impairments
For the year ended |
| 2014 |
| 2013 |
| 2012 | ||||||
Loss on impairment of LED assets |
| $ | (6 | ) |
| $ | 33 | |
| $ | - | |
Loss on impairment of MIT assets |
| (5 | ) |
| 62 | |
| - | | |||
Gain on termination of lease to Transform |
| - | |
| (25 | ) |
| - | | |||
Loss on restructure of ST Consortium agreement |
| - | |
| 26 | |
| - | | |||
Other |
| 51 | |
| 30 | |
| 10 | | |||
|
| $ | 40 | |
| $ | 126 | |
| $ | 10 | |
In order to optimize operations, improve efficiency and increase our focus on our core memory operations, we have entered into various restructure activities. For 2014, our MBU and EBU operating segments recorded restructure and asset impairment charges of $21 million and $20 million , respectively. For 2013, restructure and asset impairment charges of $20 million , $14 million , $12 million and $12 million were recorded by our SBU, EBU, MBU and CNBU operating segments, respectively. Our other segments that do not meet the thresholds of a reportable segment recorded the remaining restructure and asset impairment charges. (See "Segments" note.) As of August 28, 2014 , we had accrued $14 million for unpaid other restructure activities related to our workforce optimization activities. As of August 28, 2014 , we do not anticipate incurring any significant additional costs for these restructure activities.
For 2014 and 2013, other restructure included charges associated with workforce optimization activities and with our efforts to wind down our 200 mm operations primarily in Agrate, Italy and Kiryat Gat, Israel.
For 2013, we also recognized charges of $33 million primarily to impair certain production assets used in the development of LED technology, $62 million to impair the assets of MIT, a wholly-owned subsidiary, to their estimated fair values in connection with the sale of MIT to LFoundry, and $26 million in connection with the restructure of a consortium agreement with ST, whereby certain assets and approximately 500 employees from our Agrate, Italy fabrication facility were transferred to ST. For 2013, we also recognized a gain of $25 million related to the termination of a lease with Transform, an equity method investee, to a portion of our manufacturing facilities in Boise, Idaho.
(See "Fair Value Measurements" note.)
87
Other Operating (Income) Expense, Net
For the year ended |
| 2014 |
| 2013 |
| 2012 | ||||||
Rambus settlement |
| $ | 233 | |
| $ | - | |
| $ | - | |
(Gain) loss on disposition of property, plant and equipment |
| 10 | |
| (3 | ) |
| 5 | | |||
Other |
| (11 | ) |
| (5 | ) |
| 27 | | |||
|
| $ | 232 | |
| $ | (8 | ) |
| $ | 32 | |
In December 2013, we settled all pending litigation between us and Rambus, including all antitrust and patent matters. As a result, other operating expense for 2014 included a $233 million charge to accrue a liability, which reflects the discounted value of amounts due under this arrangement. (See "Contingencies" note.)
Other operating expense for 2012 included $17 million from the termination of a lease with IMFT and $10 million to write off a receivable in connection with resolution of certain prior year tax matters.
Other Non-Operating Income (Expense), Net
For the year ended |
| 2014 |
| 2013 |
| 2012 | ||||||
Loss on restructure of debt |
| $ | (184 | ) |
| $ | (31 | ) |
| $ | - | |
Gain (loss) from changes in currency exchange rates |
| (28 | ) |
| (229 | ) |
| (6 | ) | |||
Gain from disposition of interest in Aptina |
| 119 | |
| - | |
| - | | |||
Gain from issuance of Inotera shares |
| 93 | |
| 48 | |
| - | | |||
Other |
| 8 | |
| (6 | ) |
| 35 | | |||
|
| $ | 8 | |
| $ | (218 | ) |
| $ | 29 | |
Income Taxes
For the year ended |
| 2014 |
| 2013 |
| 2012 | ||||||
Income (loss) before income taxes, net income attributable to noncontrolling interests and equity in net income (loss) of equity method investees: |
|
|
|
|
|
| ||||||
Foreign |
| $ | 2,619 | |
| $ | 839 | |
| $ | 274 | |
U.S. |
| 114 | |
| 446 | |
| (1,028 | ) | |||
|
| $ | 2,733 | |
| $ | 1,285 | |
| $ | (754 | ) |
|
|
|
|
|
|
| ||||||
Income tax (provision) benefit: |
|
|
|
|
|
| ||||||
Current: |
|
|
|
|
|
| ||||||
Foreign |
| $ | (46 | ) |
| $ | (17 | ) |
| $ | (22 | ) |
U.S. federal |
| (3 | ) |
| - | |
| 14 | | |||
State |
| (2 | ) |
| - | |
| - | | |||
|
| (51 | ) |
| (17 | ) |
| (8 | ) | |||
Deferred: |
|
|
|
|
|
| ||||||
Foreign |
| (81 | ) |
| 9 | |
| 25 | | |||
U.S. federal |
| 4 | |
| - | |
| - | | |||
|
| (77 | ) |
| 9 | |
| 25 | | |||
Income tax (provision) benefit |
| $ | (128 | ) |
| $ | (8 | ) |
| $ | 17 | |
88
Income tax (provision) benefit computed using the U.S. federal statutory rate reconciled to income tax (provision) benefit was as follows:
For the year ended |
| 2014 |
| 2013 |
| 2012 | ||||||
U.S. federal income tax (provision) benefit at statutory rate |
| $ | (956 | ) |
| $ | (450 | ) |
| $ | 264 | |
Change in unrecognized tax benefits |
| (152 | ) |
| 2 | |
| 52 | | |||
State taxes, net of federal benefit |
| (39 | ) |
| 6 | |
| 9 | | |||
Gain on MMJ Acquisition |
| (11 | ) |
| 520 | |
| - | | |||
Change in valuation allowance |
| 544 | |
| (418 | ) |
| (368 | ) | |||
Foreign tax rate differential |
| 474 | |
| 339 | |
| 77 | | |||
Tax credits |
| 11 | |
| 36 | |
| 2 | | |||
Transaction costs related to the MMJ Acquisition |
| - | |
| (38 | ) |
| - | | |||
Other |
| 1 | |
| (5 | ) |
| (19 | ) | |||
Income tax (provision) benefit |
| $ | (128 | ) |
| $ | (8 | ) |
| $ | 17 | |
Deferred income taxes reflect the net tax effects of temporary differences between the bases of assets and liabilities for financial reporting and income tax purposes as well as carryforwards. Deferred tax assets and liabilities consist of the following:
As of |
| 2014 |
| 2013 | ||||
Deferred tax assets: |
|
|
|
| ||||
Net operating loss and tax credit carryforwards |
| $ | 3,162 | |
| $ | 4,048 | |
Property, plant and equipment |
| 284 | |
| 313 | | ||
Accrued salaries, wages and benefits |
| 152 | |
| 107 | | ||
Other accrued liabilities |
| 113 | |
| 8 | | ||
Other |
| 104 | |
| 169 | | ||
Gross deferred tax assets |
| 3,815 | |
| 4,645 | | ||
Less valuation allowance |
| (2,443 | ) |
| (3,155 | ) | ||
Deferred tax assets, net of valuation allowance |
| 1,372 | |
| 1,490 | | ||
|
|
|
|
| ||||
Deferred tax liabilities: |
|
|
|
| ||||
Debt discount |
| (291 | ) |
| (294 | ) | ||
Unremitted earnings on certain subsidiaries |
| (115 | ) |
| (126 | ) | ||
Product and process technology |
| (29 | ) |
| (74 | ) | ||
Other |
| (67 | ) |
| (14 | ) | ||
Deferred tax liabilities |
| (502 | ) |
| (508 | ) | ||
|
|
|
|
| ||||
Net deferred tax assets |
| $ | 870 | |
| $ | 982 | |
|
|
|
|
| ||||
Reported as: |
|
|
|
| ||||
Current deferred tax assets (included in other current assets) |
| $ | 228 | |
| $ | 123 | |
Noncurrent deferred tax assets |
| 816 | |
| 861 | | ||
Current deferred tax liabilities (included in accounts payable and accrued expenses) |
| (4 | ) |
| (2 | ) | ||
Noncurrent deferred tax liabilities (included in other noncurrent liabilities) |
| (170 | ) |
| - | | ||
Net deferred tax assets |
| $ | 870 | |
| $ | 982 | |
89
As of August 28, 2014, we had a valuation allowance of $1.29 billion against substantially all U.S. net deferred tax assets, primarily related to net operating loss carryforwards. The valuation allowance is based on our assessment of the deferred tax assets that are more likely than not to be realized. As of August 28, 2014, we had partial valuation allowances of $979 million for Japan and $179 million for our other foreign subsidiaries against net deferred tax assets, primarily related to net operating loss carryforwards. As of August 28, 2014, we had $3.95 billion of net operating loss carryforwards in Japan of which $2.76 billion is subject to a valuation allowance. Our valuation allowance decreased $712 million in 2014 primarily due to the utilization of U.S. and foreign net operating losses as well as adjustments based on management's reassessment of the amount of foreign net operating losses that are more likely than not to be realized.
As of August 28, 2014 , our federal, state and foreign net operating loss carryforward amounts and expiration periods as reported to tax authorities, were as follows:
Year of Expiration |
| U.S. Federal |
| State |
| Japan |
| Other Foreign |
| Total | ||||||||||
2015 - 2019 |
| $ | - | |
| $ | 102 | |
| $ | 83 | |
| $ | 513 | |
| $ | 698 | |
2020 - 2024 |
| - | |
| 179 | |
| 3,862 | |
| 872 | |
| 4,913 | | |||||
2025 - 2029 |
| 2,081 | |
| 934 | |
| - | |
| - | |
| 3,015 | | |||||
2030 - 2033 |
| 1,812 | |
| 493 | |
| - | |
| - | |
| 2,305 | | |||||
Indefinite |
| - | |
| - | |
| - | |
| 39 | |
| 39 | | |||||
|
| $ | 3,893 | |
| $ | 1,708 | |
| $ | 3,945 | |
| $ | 1,424 | |
| $ | 10,970 | |
As of August 28, 2014, our federal and state tax credit carryforward amounts and expiration periods were as follows:
Year of Tax Credit Expiration |
| Federal |
| State |
| Total | ||||||
2015 - 2019 |
| $ | 9 | |
| $ | 69 | |
| $ | 78 | |
2020 - 2024 |
| 91 | |
| 55 | |
| 146 | | |||
2025 - 2029 |
| 78 | |
| 38 | |
| 116 | | |||
2030 - 2034 |
| 72 | |
| - | |
| 72 | | |||
Indefinite |
| - | |
| 31 | |
| 31 | | |||
|
| $ | 250 | |
| $ | 193 | |
| $ | 443 | |
We have not recognized deferred tax assets of $207 million for excess tax benefits that arose directly from tax deductions related to equity compensation greater than amounts recognized for financial reporting. These excess stock compensation benefits will be credited to additional paid-in capital if realized. We use the "with and without" method, as described in ASC 740, for purposes of determining when excess tax benefits have been realized.
Provision has been made for deferred taxes on undistributed earnings of non-U.S. subsidiaries to the extent that dividend payments from such companies are expected to result in additional tax liabilities. Remaining undistributed earnings of $4.91 billion as of August 28, 2014 have been indefinitely reinvested; therefore, no provision has been made for taxes due on approximately $6.55 billion of the excess of the financial reporting amount over the tax basis of investments in foreign subsidiaries that are indefinitely reinvested. Determination of the amount of unrecognized deferred tax liabilities related to investments in these foreign subsidiaries is not practicable.
90
Below is a reconciliation of the beginning and ending amount of unrecognized tax benefits:
For the year ended |
| 2014 |
| 2013 |
| 2012 | ||||||
Beginning unrecognized tax benefits |
| $ | 78 | |
| $ | 77 | |
| $ | 121 | |
Increases related to tax positions taken during current year |
| 152 | |
| 4 | |
| 6 | | |||
Foreign currency translation increases (decreases) to tax positions |
| 1 | |
| 4 | |
| (9 | ) | |||
Settlements with tax authorities |
| (1 | ) |
| (8 | ) |
| (29 | ) | |||
Decreases related to tax positions from prior years |
| (1 | ) |
| - | |
| (14 | ) | |||
Lapse of statute of limitations |
| (1 | ) |
| - | |
| - | | |||
Increases related to tax positions from prior years |
| - | |
| - | |
| 2 | | |||
Unrecognized tax benefits acquired in current year |
| - | |
| 1 | |
| - | | |||
Ending unrecognized tax benefits |
| $ | 228 | |
| $ | 78 | |
| $ | 77 | |
Included in the unrecognized tax benefits balance as of August 28, 2014 , August 29, 2013 and August 30, 2012 were $66 million , $63 million and $66 million , respectively, of unrecognized income tax benefits, which if recognized, would affect our effective tax rate. The increase in unrecognized tax benefits in fiscal 2014 primarily related to transfer pricing and other matters which were substantially offset by changes in our deferred tax asset valuation allowance. We recognize interest and penalties related to income tax matters within income tax expense. As of August 28, 2014 , August 29, 2013 and August 30, 2012 , the amount accrued for interest and penalties related to uncertain tax positions was $19 million , $16 million and $12 million , respectively. The resolution of tax audits or lapses of statute of limitations could reduce our unrecognized tax benefits. Although each matter is individually insignificant and the timing of final resolution is uncertain, the estimated potential reduction in our unrecognized tax benefits in the next 12 months ranges from $0 to $77 million , including interest and penalties.
We currently operate in several tax jurisdictions where we have arrangements that allow us to compute our tax provision at rates below the local statutory rates that expire in whole or in part at various dates through 2026. These arrangements benefitted our tax provision in 2014 , 2013 and 2012 by $286 million ( $0.24 per diluted share), $141 million ( $0.13 per diluted share) and $52 million ( $0.05 per diluted share), respectively.
We and our subsidiaries file income tax returns with the U.S. federal government, various U.S. states and various foreign jurisdictions throughout the world. Our U.S. federal and state tax returns remain open to examination for 2010 through 2014. In addition, tax returns open to examination in multiple foreign taxing jurisdictions range from the years 2005 to 2014. We believe that adequate amounts of taxes and related interest and penalties have been provided for, and any adjustments as a result of examinations are not expected to materially adversely affect our business, results of operations or financial condition.
Earnings Per Share
For the year ended |
| 2014 |
| 2013 |
| 2012 | ||||||
Net income (loss) available to Micron shareholders – Basic |
| $ | 3,045 | |
| $ | 1,190 | |
| $ | (1,032 | ) |
Dilutive effect related to equity method investment |
| (2 | ) |
| - | |
| - | | |||
Net income (loss) available to Micron shareholders – Diluted |
| $ | 3,043 | |
| $ | 1,190 | |
| $ | (1,032 | ) |
|
|
|
|
|
|
| ||||||
Weighted-average common shares outstanding – Basic |
| 1,060 | |
| 1,022 | |
| 991 | | |||
Dilutive effect of equity plans and convertible notes |
| 138 | |
| 35 | |
| - | | |||
Weighted-average common shares outstanding – Diluted |
| 1,198 | |
| 1,057 | |
| 991 | | |||
|
|
|
|
|
|
| ||||||
Earnings (loss) per share: |
|
|
|
|
|
| ||||||
Basic |
| $ | 2.87 | |
| $ | 1.16 | |
| $ | (1.04 | ) |
Diluted |
| 2.54 | |
| 1.13 | |
| (1.04 | ) | |||
91
Listed below are the potential common shares, as of the end of the periods shown, that could dilute basic earnings per share in the future that were not included in the computation of diluted earnings per share because to do so would have been antidilutive:
For the year ended |
| 2014 |
| 2013 |
| 2012 | |||
Equity plans |
| 7 | |
| 40 | |
| 105 | |
Convertible notes |
| 26 | |
| 186 | |
| 258 | |
O ur 2031B Notes, 2033 Notes and 2043 Notes, and, to the extent our 2027 Notes and 2031A Notes were outstanding during the periods presented, contain terms that upon conversion require us to settle the aggregate principal amount in cash and the remainder of our conversion obligation amount in either shares of our common stock or cash, at our election. Our 2032 Notes, and, to the extent our 2014 Notes were outstanding during the periods presented, contain terms that upon conversion provide us the option to pay cash, issue shares of common stock or any combination thereof for the aggregate amount due. It is our current intent to settle the principal amount of our 2032 Notes in cash upon conversion. As a result of these conversion terms, the shares underlying the 2014 Notes, 2027 Notes, 2031 Notes, 2032 Notes, 2033 Notes and 2043 Notes were considered in diluted earnings per share for the period they were outstanding during 2014 under the treasury stock method. (See "Debt" note.)
Segment Information
In the third quarter of 2014, we reorganized our business units. All prior period amounts reflect this reorganization. Factors used to identify our segments include, among others, markets, customers and products. Segment information reported herein is consistent with how it is reviewed and evaluated by our chief operating decision makers. We have the following four business units, which are our reportable segments:
Compute and Networking Business Unit ("CNBU"): Includes DRAM and NOR Flash products sold to the compute, networking, graphics and cloud server markets.
Mobile Business Unit ("MBU"): Includes DRAM, NAND Flash and NOR Flash products sold to the smartphone, feature phone and tablet mobile-device market.
Storage Business Unit ("SBU"): Includes NAND Flash components and SSDs sold into enterprise and client storage, cloud and removable storage markets. SBU also includes NAND Flash products sold to Intel through our IMFT joint venture.
Embedded Business Unit ("EBU"): Includes DRAM, NAND Flash and NOR Flash products sold into automotive and industrial applications, as well as the connected home and consumer electronics markets.
Our other operations do not meet the thresholds of a reportable segment and are reported under All Other.
Certain operating expenses directly associated with the activities of a specific segment are charged to that segment. Other indirect operating expenses (income) are generally allocated to segments based on their respective percentage of cost of goods sold or forecasted wafer production. The unallocated amount in 2014 related to the Rambus settlement.
We do not identify or report internally our assets or capital expenditures by segment, nor do we allocate gains and losses from equity method investments, interest, other non-operating income or expense items or taxes to segments. There are no differences in the accounting policies for segment reporting and our consolidated results of operations.
92
For the year ended |
| 2014 |
| 2013 |
| 2012 | ||||||
Net sales: |
|
|
|
|
|
| ||||||
CNBU |
| $ | 7,333 | |
| $ | 3,462 | |
| $ | 2,667 | |
MBU |
| 3,627 | |
| 1,214 | |
| 1,176 | | |||
SBU |
| 3,480 | |
| 2,824 | |
| 2,842 | | |||
EBU |
| 1,774 | |
| 1,275 | |
| 1,097 | | |||
All Other |
| 144 | |
| 298 | |
| 452 | | |||
|
| $ | 16,358 | |
| $ | 9,073 | |
| $ | 8,234 | |
|
|
|
|
|
|
| ||||||
Operating income (loss): |
|
|
|
|
|
| ||||||
CNBU |
| $ | 1,957 | |
| $ | 160 | |
| $ | (458 | ) |
MBU |
| 683 | |
| (265 | ) |
| (371 | ) | |||
SBU |
| 255 | |
| 173 | |
| 199 | | |||
EBU |
| 331 | |
| 227 | |
| 129 | | |||
All Other |
| 94 | |
| (59 | ) |
| (111 | ) | |||
Unallocated |
| (233 | ) |
| - | |
| - | | |||
|
| $ | 3,087 | |
| $ | 236 | |
| $ | (612 | ) |
Depreciation and amortization expense was as follows:
For the year ended |
| 2014 |
| 2013 |
| 2012 | ||||||
CNBU |
| $ | 878 | |
| $ | 687 | |
| $ | 755 | |
MBU |
| 475 | |
| 293 | |
| 372 | | |||
SBU |
| 512 | |
| 551 | |
| 649 | | |||
EBU |
| 226 | |
| 215 | |
| 228 | | |||
All Other |
| 11 | |
| 67 | |
| 140 | | |||
Depreciation and amortization expense included in operating income (loss) |
| 2,102 | |
| 1,813 | |
| 2,144 | | |||
Other amortization |
| 168 | |
| 113 | |
| 78 | | |||
Total depreciation and amortization expense |
| $ | 2,270 | |
| $ | 1,926 | |
| $ | 2,222 | |
Product Sales
For the year ended |
| 2014 |
| 2013 |
| 2012 | ||||||
DRAM |
| $ | 11,164 | |
| $ | 4,361 | |
| $ | 3,178 | |
NAND Flash |
| 4,468 | |
| 3,589 | |
| 3,627 | | |||
NOR Flash |
| 505 | |
| 792 | |
| 977 | | |||
Other |
| 221 | |
| 331 | |
| 452 | | |||
|
| $ | 16,358 | |
| $ | 9,073 | |
| $ | 8,234 | |
93
Certain Concentrations
Markets with concentrations of net sales were approximately as follows:
For the year ended |
| 2014 |
| 2013 |
| 2012 | |||
Compute and graphics |
| 30 | % |
| 20 | % |
| 15 | % |
Mobile |
| 20 | % |
| 15 | % |
| 15 | % |
Solid state drives and other storage |
| 20 | % |
| 25 | % |
| 25 | % |
Automotive, industrial, medical and other embedded |
| 10 | % |
| 15 | % |
| 15 | % |
Server |
| 10 | % |
| 10 | % |
| 10 | % |
Customer concentrations included net sales to Kingston of 10% for 2014, net sales to Intel of 10% and 12% for 2013 and 2012 , respectively, and net sales to HP of 10% for 2013. Substantially all of our sales to Kingston are included in our CNBU segment, substantially all of our sales to Intel are included in our SBU segment and substantially all of our sales to HP are included in our CNBU and SBU segments.
Certain of the raw materials and production equipment we use in manufacturing semiconductor products are available from multiple sources and in sufficient supply; however, only a limited number of suppliers are capable of delivering certain raw materials and production equipment that meet our standards. In some cases, materials are provided by a single supplier.
Financial instruments that potentially subject us to concentrations of credit risk consist principally of cash, money market accounts, certificates of deposit, fixed-rate debt securities, trade receivables and derivative contracts. We invest through high-credit-quality financial institutions and, by policy, generally limit the concentration of credit exposure by restricting investments with any single obligor. A concentration of credit risk may exist with respect to receivables as a substantial portion of our customers are affiliated with the computing industry. We perform ongoing credit evaluations of customers worldwide and generally do not require collateral from our customers. Historically, we have not experienced significant losses on receivables. A concentration of risk may also exist with respect to derivatives as the number of counterparties to our currency hedges is limited and the notional amounts are relatively large. We seek to mitigate such risk by limiting our counterparties to major financial institutions and through entering into master netting arrangements. The capped calls expose us to credit risk to the extent the counterparties may be unable to meet the terms of the agreements. We seek to mitigate such risk by limiting our counterparties to major financial institutions and by spreading the risk across several major financial institutions. In addition, the potential risk of loss with any one counterparty resulting from this type of credit risk is monitored on an ongoing basis.
Geographic Information
Geographic net sales based on customer ship-to location were as follows:
For the year ended |
| 2014 |
| 2013 |
| 2012 | ||||||
China |
| $ | 6,715 | |
| $ | 3,783 | |
| $ | 2,936 | |
United States |
| 2,551 | |
| 1,512 | |
| 1,262 | | |||
Taiwan |
| 2,313 | |
| 980 | |
| 1,022 | | |||
Asia Pacific (excluding China, Taiwan and Japan) |
| 1,791 | |
| 946 | |
| 1,327 | | |||
Japan |
| 1,253 | |
| 589 | |
| 460 | | |||
Europe |
| 1,252 | |
| 820 | |
| 827 | | |||
Other |
| 483 | |
| 443 | |
| 400 | | |||
|
| $ | 16,358 | |
| $ | 9,073 | |
| $ | 8,234 | |
94
Net property, plant and equipment by geographic area was as follows:
As of |
| 2014 |
| 2013 | ||||
United States |
| $ | 3,282 | |
| $ | 3,041 | |
Singapore |
| 3,101 | |
| 3,225 | | ||
Japan |
| 1,221 | |
| 615 | | ||
Taiwan |
| 761 | |
| 307 | | ||
China |
| 242 | |
| 350 | | ||
Other |
| 75 | |
| 88 | | ||
|
| $ | 8,682 | |
| $ | 7,626 | |
Quarterly Financial Information (Unaudited)
(in millions except per share amounts)
2014 |
| Fourth Quarter |
| Third Quarter |
| Second Quarter |
| First Quarter | ||||||||
Net sales |
| $ | 4,227 | |
| $ | 3,982 | |
| $ | 4,107 | |
| $ | 4,042 | |
Gross margin |
| 1,385 | |
| 1,368 | |
| 1,403 | |
| 1,281 | | ||||
Operating income |
| 828 | |
| 839 | |
| 869 | |
| 551 | | ||||
Net income |
| 1,151 | |
| 806 | |
| 741 | |
| 381 | | ||||
Net income attributable to Micron |
| 1,150 | |
| 806 | |
| 731 | |
| 358 | | ||||
|
|
|
|
|
|
|
|
| ||||||||
Earnings per share: |
|
|
|
|
|
|
|
| ||||||||
Basic |
| $ | 1.08 | |
| $ | 0.76 | |
| $ | 0.69 | |
| $ | 0.34 | |
Diluted |
| 0.96 | |
| 0.68 | |
| 0.61 | |
| 0.30 | | ||||
The results of operations for the first quarter of 2014 included a $233 million charge to accrue a liability for the settlement of all pending litigation between us and Rambus, including all antitrust and patent matters, which reflects the discounted value of amounts due under the arrangement. (See "Contingencies" note.)
The results of operations in the first, second, third and fourth quarters of 2014 included losses of $92 million , $80 million , $16 million and $17 million , respectively, for losses on restructure of debt. (See "Debt – 2014 Debt Restructure" note.)
The results of operations for the fourth quarter of 2014 included a gain of $93 million from the issuance of shares by Inotera, which reduced our ownership interest from 35% to 33% . (See "Equity Method Investments – Inotera" note.)
The results of operations for the fourth quarter of 2014 included a gain of $119 million from the sale of interest in Aptina to ON Semiconductor Corporation. (See "Equity Method Investments – Other" note.)
The results of operations for the fourth quarter of 2014 included a $66 million charge associated with a license agreement with Tessera executed in the fourth quarter of 2014. (See "Contingencies" note.)
The results of operations for the fourth quarter of 2014 included a $190 million income tax benefit from increases in the amounts of the MMJ Group's deferred tax assets expected to be realized based on our forecasted utilization of net operating losses. (See "Income Taxes" note.)
95
2013 |
| Fourth Quarter |
| Third Quarter |
| Second Quarter |
| First Quarter | ||||||||
Net sales |
| $ | 2,843 | |
| $ | 2,318 | |
| $ | 2,078 | |
| $ | 1,834 | |
Gross margin |
| 708 | |
| 556 | |
| 366 | |
| 217 | | ||||
Operating income (loss) |
| 207 | |
| 149 | |
| (23 | ) |
| (97 | ) | ||||
Net income (loss) |
| 1,710 | |
| 43 | |
| (284 | ) |
| (275 | ) | ||||
Net income (loss) attributable to Micron |
| 1,708 | |
| 43 | |
| (286 | ) |
| (275 | ) | ||||
|
|
|
|
|
|
|
|
| ||||||||
Earnings (loss) per share: |
|
| |
|
| |
|
| |
|
| | ||||
Basic |
| $ | 1.65 | |
| $ | 0.04 | |
| $ | (0.28 | ) |
| $ | (0.27 | ) |
Diluted |
| 1.51 | |
| 0.04 | |
| (0.28 | ) |
| (0.27 | ) | ||||
The results of operations for the fourth quarter of 2013 included a gain of $1.48 billion for the MMJ Acquisition. The fourth quarter of 2013 includes the MMJ Group's results of operation from the July 31, 2013 acquisition date. (See "Micron Memory Japan, Inc." note.)
The results of operations for the fourth quarter of 2013 included a gain of $48 million from the issuance of shares by Inotera, which reduced our ownership interest from 40% to 35% . (See "Equity Method Investments – Inotera" note.)
The results of operations for the fourth, third, second and first quarters of 2013 included losses of $3 million , $47 million , $120 million and $58 million , respectively, for the MMJ Acquisition Hedges. (See "Derivative Instruments – Derivative Instruments without Hedge Accounting Designation" note.)
In 2013 we took action to dispose of 200 mm wafer manufacturing facilities and optimize operations including our workforce. The results of operations for the fourth, third and second quarters of 2013 include charges of $32 million , $55 million and $60 million , respectively, for the restructure and asset impairments. The results of operations for the first quarter of 2013 included a credit of $21 million for restructure activities. (See "Restructure and Asset Impairments" note.)
The results of operations in the second quarter of 2013 included a loss of $31 million on extinguishment of debt. (See "Debt – 2013 Debt Restructure" note.)
96
Report of Independent Registered Public Accounting Firm
To the Board of Directors and Shareholders
of Micron Technology, Inc.
In our opinion, the consolidated financial statements listed in the index appearing under Item 8 present fairly, in all material respects, the financial position of Micron Technology, Inc. and its subsidiaries at August 28, 2014 and August 29, 2013, and the results of their operations and their cash flows for each of the three years in the period ended August 28, 2014 in conformity with accounting principles generally accepted in the United States of America. In addition, in our opinion, the financial statement schedules listed in the index appearing under Item 8 present fairly, in all material respects, the information set forth therein when read in conjunction with the related consolidated financial statements. Also in our opinion, the Company maintained, in all material respects, effective internal control over financial reporting as of August 28, 2014, based on criteria established in Internal Control - Integrated Framework (2013) issued by the Committee of Sponsoring Organizations of the Treadway Commission (COSO). The Company's management is responsible for these financial statements and financial statement schedules, for maintaining effective internal control over financial reporting and for its assessment of the effectiveness of internal control over financial reporting, included in Management's Report on Internal Control over Financial Reporting appearing under Item 9A. Our responsibility is to express opinions on these financial statements, on the financial statement schedules, and on the Company's internal control over financial reporting based on our integrated audits. We conducted our audits in accordance with the standards of the Public Company Accounting Oversight Board (United States). Those standards require that we plan and perform the audits to obtain reasonable assurance about whether the financial statements are free of material misstatement and whether effective internal control over financial reporting was maintained in all material respects. Our audits of the financial statements included examining, on a test basis, evidence supporting the amounts and disclosures in the financial statements, assessing the accounting principles used and significant estimates made by management, and evaluating the overall financial statement presentation. Our audit of internal control over financial reporting included obtaining an understanding of internal control over financial reporting, assessing the risk that a material weakness exists, and testing and evaluating the design and operating effectiveness of internal control based on the assessed risk. Our audits also included performing such other procedures as we considered necessary in the circumstances. We believe that our audits provide a reasonable basis for our opinions.
A company's internal control over financial reporting is a process designed to provide reasonable assurance regarding the reliability of financial reporting and the preparation of financial statements for external purposes in accordance with generally accepted accounting principles. A company's internal control over financial reporting includes those policies and procedures that (i) pertain to the maintenance of records that, in reasonable detail, accurately and fairly reflect the transactions and dispositions of the assets of the company; (ii) provide reasonable assurance that transactions are recorded as necessary to permit preparation of financial statements in accordance with generally accepted accounting principles, and that receipts and expenditures of the company are being made only in accordance with authorizations of management and directors of the company; and (iii) provide reasonable assurance regarding prevention or timely detection of unauthorized acquisition, use, or disposition of the company's assets that could have a material effect on the financial statements.
Because of its inherent limitations, internal control over financial reporting may not prevent or detect misstatements. Also, projections of any evaluation of effectiveness to future periods are subject to the risk that controls may become inadequate because of changes in conditions, or that the degree of compliance with the policies or procedures may deteriorate.
/s/ PricewaterhouseCoopers LLP
San Jose, CA
October 27, 2014
97
ITEM 9. CHANGES IN AND DISAGREEMENTS WITH ACCOUNTANTS ON ACCOUNTING AND FINANCIAL DISCLOSURE
None.
ITEM 9A. CONTROLS AND PROCEDURES
An evaluation was carried out under the supervision and with the participation of our management, including our principal executive officer and principal financial officer, of the effectiveness of the design and operation of our disclosure controls and procedures (as defined in Rule 13a-15(e) and 15d-15(e) under the Securities Exchange Act of 1934) as of the end of the period covered by this report. Based upon that evaluation, the principal executive officer and principal financial officer concluded that those disclosure controls and procedures were effective to ensure that information required to be disclosed by us in the reports that we file or submit under the Exchange Act are recorded, processed, summarized and reported, within the time periods specified in the Commission's rules and forms and that such information is accumulated and communicated to our management, including the principal executive officer and principal financial officer, to allow timely decision regarding disclosure.
During the fourth quarter of 2014, there were no changes in our internal control over financial reporting that have materially affected, or are reasonably likely to materially affect, our internal control over financial reporting.
Management's Report on Internal Control over Financial Reporting
Our management is responsible for establishing and maintaining adequate internal control over financial reporting. Internal control over financial reporting is a process designed to provide reasonable assurance regarding the reliability of financial reporting and the preparation of financial statements for external purposes in accordance with accounting principles generally accepted in the United States of America. Our internal control over financial reporting includes those policies and procedures that (i) pertain to the maintenance of records that in reasonable detail accurately reflect the transactions and dispositions of our assets; (ii) provide reasonable assurance that transactions are recorded as necessary to permit preparation of financial statements in accordance with generally accepted accounting principles, and that our receipts and expenditures are being made only in accordance with authorizations of our management and directors; and (iii) provide reasonable assurance regarding prevention or timely detection of unauthorized acquisition, use or disposition of our assets that could have a material effect on our financial statements.
Because of its inherent limitations, internal control over financial reporting may not prevent or detect misstatements. Also, projections of any evaluation of effectiveness to future periods are subject to the risk that controls may become inadequate because of changes in conditions, or that the degree of compliance with the policies or procedures may deteriorate.
Management conducted an evaluation of the effectiveness of our internal control over financial reporting based on the framework in "Internal Control – Integrated Framework" (2013) issued by the Committee of Sponsoring Organizations of the Treadway Commission. Based on this evaluation, management concluded that our internal control over financial reporting was effective as of August 28, 2014 . The effectiveness of our internal control over financial reporting as of August 28, 2014 has been audited by PricewaterhouseCoopers LLP, an independent registered public accounting firm, as stated in their report, which is included in Part II, Item 8, of this Form 10-K.
ITEM 9B. OTHER INFORMATION
None.
98
PART III
ITEM 10. DIRECTORS, EXECUTIVE OFFICERS AND CORPORATE GOVERNANCE
ITEM 11. EXECUTIVE COMPENSATION
ITEM 12. SECURITY OWNERSHIP OF CERTAIN BENEFICIAL OWNERS AND MANAGEMENT AND RELATED STOCKHOLDER MATTERS
ITEM 13. CERTAIN RELATIONSHIPS AND RELATED TRANSACTIONS, AND DIRECTOR INDEPENDENCE
ITEM 14. PRINCIPAL ACCOUNTING FEES AND SERVICES
Certain information concerning our executive officers is included under the caption, "Directors and Executive Officers of the Registrant," in Part I, Item 1 of this report. Other information required by Items 10, 11, 12, 13 and 14 will be contained in our Proxy Statement which will be filed with the Securities and Exchange Commission within 120 days after August 28, 2014 and is incorporated herein by reference.
99
PART IV
ITEM 15. EXHIBITS, FINANCIAL STATEMENT SCHEDULES
The following documents are filed as part of this report:
1. |
| Financial Statements: See Index to Consolidated Financial Statements under Item 8. |
2. |
| Certain Financial Statement Schedules have been omitted since they are either not required, not applicable or the information is otherwise included. |
3. |
| Exhibits. |
Exhibit Number |
| Description of Exhibit |
1.4 |
| Purchase Agreement dated as of April 12, 2012, by and among Micron Technology, Inc. and Morgan Stanley & Co. LLC and J.P. Morgan Securities, LLC, as representatives of the initial purchasers (1) |
1.5 |
| Purchase Agreement, dated as of February 6, 2013, by and among Micron Technology, Inc. and Morgan Stanley & Co. LLC, J.P. Morgan Securities LLC and Goldman, Sachs & Co., as representatives of the initial purchasers (2) |
2.1* |
| English Translation of Agreement on Support for Reorganization Companies with Nobuaki Kobayashi and Ykio Sakamoto, the trustees of Elpida Memory, Inc. and its wholly-owned subsidiary, Akita Elpida Memory, Inc. dated July 2, 2012 (3) |
2.2* |
| Share Purchase Agreement dated July 2, 2012, among Micron Technology, Inc., Micron Semiconductor B.V, Powerchip Technology Corporation, Li-Hsin Investment Co. Ltd., Quantum Vision Corporation, Maxchip Electronics Corporation and Dr. Frank Huang (4) |
2.3* |
| English Translation of Agreement Amending Agreement on Support for Reorganization Companies, dated October 29, 2012, by and among Micron Technology, Inc. and Nobuaki Kobayashi and Yukio Sakamoto, the trustees of Elpida Memory, Inc. and Akita Elpida Memory, Inc. (5) |
2.4* |
| English Translation of Agreement Amending Agreement on Support for Reorganization Companies, dated July 31, 2013, by and among Micron Technology, Inc. and Nobuaki Kobayashi and Yukio Sakamoto, the trustees of Elpida Memory, Inc. and Akita Elpida Memory, Inc. (6) |
2.5 |
| English Translation of the Reorganization Plan of Elpida Memory, Inc. (6) |
3.1 |
| Restated Certificate of Incorporation of the Registrant (7) |
3.2 |
| Bylaws of the Registrant, Amended and Restated (8) |
4.1 |
| Indenture dated November 3, 2010, by and between Micron Technology, Inc. and Wells Fargo Bank, National Association (9) |
4.2 |
| Form of Note (included in Exhibit 4.1) (9) |
4.3 |
| Indenture dated as of April 18, 2012, by and between Micron Technology, Inc. and U.S. Bank National Association, as Trustee for 2.375% Convertible Senior Notes due 2032 (1) |
4.4 |
| Indenture dated as of April 18, 2012, by and between Micron Technology, Inc. and U.S. Bank National Association, as Trustee for 3.125% Convertible Senior Notes due 2032 (1) |
4.5 |
| Form of 2032C Note (included in Exhibit 4.3) (1) |
4.6 |
| Form of 2032D Note (included in Exhibit 4.4) (1) |
4.7 |
| Indenture dated as of May 23, 2007, by and between Micron Technology, Inc. and Wells Fargo Bank, National Association, as trustee (10) |
4.8 |
| Convertible Senior Indenture between the Company and Wells Fargo Bank, National Association, dated as of April 15, 2009 (11) |
4.9 |
| Form of 4.25% Convertible Senior Note due October 15, 2013 (included in Exhibit 4.8) (11) |
4.10 |
| Indenture dated July 26, 2011, by and between Micron Technology, Inc. and U.S. Bank National Association, as Trustee for 1.50% Convertible Senior Notes due 2031 (12) |
4.11 |
| Indenture dated July 26, 2011, by and between Micron Technology, Inc. and U.S. Bank National Association, as Trustee for 1.875% Convertible Senior Notes due 2031 (12) |
4.12 |
| Form of 2031A Note (included in Exhibit 4.10) (12) |
4.13 |
| Form of 2031B Note (included in Exhibit 4.11) (12) |
4.14 |
| Indenture, dated as of February 12, 2013, by and between Micron Technology, Inc. and U.S. Bank National Association, as trustee (2) |
100
4.15 |
| Indenture, dated as of February 12, 2013, by and between Micron Technology, Inc. and U.S. Bank National Association, as trustee (2) |
4.16 |
| Form of 2033E Note (included in Exhibit 4.14) (2) |
4.17 |
| Form of 2033F Note (included in Exhibit 4.15) (2) |
4.18 |
| Indenture, dated as of November 12, 2013, by and between the Company & U.S. Bank National Association (13) |
4.19 |
| Form of New Note (included in Exhibit 4.18) (13) |
4.20 |
| Indenture dated as of December 16, 2013, by and among Micron Semiconductor Asia Pte., Ltd., Wells Fargo Bank, National Association, and Export-Import Bank of the United States (14) |
4.21 |
| Indenture dated as of February 10, 2014, by and between Micron Technology, Inc. and U.S. Bank National Association, as Trustee (15) |
4.22 |
| Form of Note (included in Exhibit 4.21) (15) |
4.23 |
| Indenture, dated as of July 28, 2014, by and between Micron Technology, Inc. and U.S. Bank National Association, as Trustee (16) |
4.24 |
| Form of Note (included in Exhibit 4.23) (16) |
10.1 |
| Executive Officer Performance Incentive Plan, as Amended (17) |
10.2 |
| 1994 Stock Option Plan, as Amended (17) |
10.3 |
| 1994 Stock Option Plan Form of Agreement and Terms and Conditions (18) |
10.4 |
| 1997 Nonstatutory Stock Option Plan, as Amended (4) |
10.5 |
| 1998 Non-Employee Director Stock Incentive Plan, as Amended (17) |
10.6 |
| 1998 Nonstatutory Stock Option Plan, as Amended (4) |
10.7 |
| 2001 Stock Option Plan, as Amended (4) |
10.8 |
| 2001 Stock Option Plan Form of Agreement (19) |
10.9 |
| 2004 Equity Incentive Plan, as Amended and Restated |
10.10 |
| 2004 Equity Incentive Plan Forms of Agreement and Terms and Conditions |
10.11 |
| Amended and Restated 2007 Equity Incentive Plan (20) |
10.12 |
| 2007 Equity Incentive Plan Forms of Agreement (21) |
10.13 |
| Nonstatutory Stock Option Plan, as Amended (4) |
10.14 |
| Nonstatutory Stock Option Plan Form of Agreement and Terms and Conditions (18) |
10.15 |
| Lexar Media, Inc. 1996 Stock Option Plan, as Amended (17) |
10.16 |
| Lexar Media, Inc. 2000 Equity Incentive Plan, as Amended (17) |
10.17 |
| Numonyx Holdings B.V. Equity Incentive Plan (22) |
10.18 |
| Numonyx Holdings B.V. Equity Incentive Plan Forms of Agreement (22) |
10.19* |
| Patent License Agreement dated September 15, 2006, by and among Toshiba Corporation, Acclaim Innovations, LLC and Micron Technology, Inc. (23) |
10.20* |
| Amended and Restated Limited Liability Company Operating Agreement of IM Flash Technologies, LLC dated as of February 27, 2007, between Micron Technology, Inc. and Intel Corporation (24) |
10.21 |
| Form of Indemnification Agreement between the Registrant and its officers and directors (14) |
10.22 |
| Form of Severance Agreement between the Company and its officers (25) |
10.23 |
| Form of Agreement and Amendment to Severance Agreement between the Company and its officers (26) |
10.24* |
| Master Agreement dated as of November 18, 2005, between Micron Technology, Inc. and Intel Corporation (27) |
10.25* |
| Product Designs Assignment Agreement dated January 6, 2006, between Intel Corporation and Micron Technology, Inc. (27) |
10.26* |
| Supply Agreement dated as of January 6, 2006, between Micron Technology, Inc. and IM Flash Technologies, LLC (27) |
10.27* |
| Supply Agreement dated as of January 6, 2006, between Intel Corporation and IM Flash Technologies, LLC (27) |
10.28 |
| Capped Call Confirmation (Reference No. CEODL6) by and between Micron Technology, Inc. and Morgan Stanley & Co. International plc (10) |
10.29 |
| Capped Call Confirmation (Reference No. 53228800) by and between Micron Technology, Inc. and Credit Suisse International (10) |
101
10.30 |
| Capped Call confirmation (Reference No. 53228855) by and between Micron Technology, Inc. and Credit Suisse International (10) |
10.31* |
| Master Agreement dated as of April 21, 2008, by and between Nanya Technology Corporation and Micron Technology, Inc. (28) |
10.32* |
| Technology Transfer and License Agreement for 68-50nm Process Nodes, dated as of April 21, 2008, by and between Micron Technology, Inc. and Nanya Technology Corporation (28) |
10.33 |
| Form of Severance Agreement (29) |
10.34 |
| Share Purchase Agreement by and among Micron Technology, Inc. as the Buyer Parent, Micron Semiconductor B.V., as the Buyer, Qimonda Ag as the Seller Parent and Qimonda Holding B.V., as the Seller Sub dated as of October 11, 2008 (17) |
10.35* |
| Master Agreement dated November 26, 2008, among Micron Technology, Inc., Micron Semiconductor B.V., Nanya Technology Corporation, MeiYa Technology Corporation and Inotera Memories, Inc. (17) |
10.36* |
| Facilitation Agreement, dated November 26, 2008, by and between Micron Semiconductor B.V., Nanya Technology Corporation and Inotera Memories, Inc. (17) |
10.37* |
| Supply Agreement dated November 26, 2008, by and among Micron Technology, Inc., Nanya Technology Corporation and Inotera Memories, Inc. (17) |
10.38* |
| Amended and Restated Joint Development Program Agreement dated November 26, 2008, by and between Nanya Technology Corporation and Micron Technology, Inc. (17) |
10.39* |
| Amended and Restated Technology Transfer and License Agreement, dated November 26, 2008, by and between Micron Technology, Inc. and Nanya Technology Corporation (17) |
10.40* |
| Technology Transfer Agreement dated November 26, 2008, by and among Nanya Technology Corporation, Micron Technology, Inc. and Inotera Memories, Inc. (17) |
10.41* |
| Technology Transfer Agreement for 68-50nm Process Nodes, dated October 11, 2008, by and between Micron Technology, Inc. and Inotera Memories, Inc. (17) |
10.42 |
| Capped Call Confirmation (Reference No. SDB 1630322480) dated as of April 8, 2009, by and between Micron Technology, Inc. and Goldman, Sachs & Co. (30) |
10.43 |
| Capped Call Confirmation (Reference No. CGPWK6) dated as of April 8, 2009, by and between Micron Technology, Inc. and Morgan Stanley & Co International plc (30) |
10.44 |
| Capped Call Confirmation (Reference No. 325758) dated as of April 8, 2009, by and between Micron Technology, Inc. and Deutsche Bank AG, London Branch (30) |
10.45* |
| Amended and Restated Joint Venture Agreement between Micron Semiconductor, B.V. and Nanya Technology Corporation dated January 11, 2010 (31) |
10.46* |
| Second Amended and Restated Technology Transfer and License Agreement between MTI and Nanya Technology Corp. (NTC) dated July 2, 2010 (32) |
10.47* |
| Joint Development Program and Cost Sharing Agreement between MTI and Nanya Technology Corp. (NTC) dated July 2, 2010 (32) |
10.48 |
| Purchase Agreement dated July 20, 2011, between Micron Technology, Inc. and Morgan Stanley & Co. LLC, as representative of the initial purchasers (12) |
10.49 |
| Form of Capped Call Confirmation dated as of July 20, 2011, between the Company and Société Genérale (33) |
10.50 |
| Form of Capped Call Confirmation dated as of July 22, 2011 (33) |
10.51* |
| 2012 Master Agreement by and among Intel Corporation, Intel Technology Asia PTE LTD, Micron Technology, Inc., Micron Semiconductor Asia PTE LTD, IM Flash Technologies, LLC and IM Flash Singapore, LLP dated February 27, 2012 (34) |
10.52* |
| MTV Asset Purchase and Sale Agreement dated April 6, 2012, among Micron Technology, Inc., Intel Corporation and IM Flash Technologies, LLC (35) |
10.53* |
| Second Amended and Restated Limited Liability Company Operating Agreement of IM Flash Technologies, LLC dated April 6, 2012, between Micron Technology, Inc. and Intel Corporation (36) |
10.54* |
| Amendment to the Master Agreement dated April 6, 2012, between Intel Corporation and Micron Technology, Inc. (36) |
10.55* |
| Amended and Restated Supply Agreement dated April 6, 2012, between Intel Corporation and IM Flash Technologies, LLC (36) |
10.56* |
| Amended and Restated Supply Agreement dated April 6, 2012, between Micron Technology, Inc. and IM Flash Technologies, LLC (36) |
10.57* |
| Product Supply Agreement dated April 6, 2012, among Micron Technology, Inc., Intel Corporation and Micron Semiconductor Asia PTE LTD (36) |
102
10.58* |
| Wafer Supply Agreement dated April 6, 2012, among Micron Technology, Inc., Intel Corporation and Micron Singapore (36) |
10.59* |
| Deposit Agreement dated April 6, 2012, between Micron Technology, Inc. and Intel Corporation (36) |
10.60 |
| First Amendment to the Limited Liability Partnership Agreement dated April 6, 2012, between Micron Semiconductor Asia PTE LTD and Intel Technology PTE LTD (36) |
10.61 |
| Form of Capped Call Confirmation (1) |
10.62* |
| Supply Agreement, dated January 17, 2013, by and among Micron Technology, Inc., Micron Semiconductor Asia Pte. Ltd. and Inotera Memories, Inc. (37) |
10.63* |
| Joint Venture Agreement, dated January 17, 2013, by and among Micron Semiconductor B.V., Numonyx Holdings B.V., Micron Technology Asia Pacific, Inc. and Nanya Technology Corporation (37) |
10.64* |
| Facilitation Agreement, dated January 17, 2013, by and among Micron Semiconductor B.V., Numonyx Holdings B.V., Micron Technology Asia Pacific, Inc., Nanya Technology Corporation and Inotera Memories, Inc. (37) |
10.65 |
| Micron Guaranty Agreement, dated January 17, 2013, by Micron Technology, Inc. in favor of Nanya Technology Corporation (37) |
10.66* |
| Technology Transfer and License Option Agreement for 20NM Process Node, dated January 17, 2013, by and between Micron Technology, Inc. and Nanya Technology Corporation (38) |
10.67* |
| Omnibus IP Agreement, dated January 17, 2013, by and between Nanya Technology Corporation and Micron Technology, Inc. (37) |
10.68* |
| Second Amended and Restated Technology Transfer and License Agreement for 68-50NM Process Nodes, dated January 17, 2013, by and between Micron Technology, Inc. and Nanya Technology Corporation (38) |
10.69* |
| Third Amended and Restated Technology Transfer and License Agreement, dated January 17, 2013, by and between Micron Technology, Inc. and Nanya Technology Corporation (37) |
10.70* |
| Omnibus IP Agreement, dated January 17, 2013, by and between Micron Technology, Inc. and Inotera Currency Option Transaction 590297603-2 Trade Date March 26, 2013, by and between Micron Technology, Inc. and Deutsche Bank AG, London Branch (37) |
10.71 |
| Currency Option Transaction 590297603-2 Trade Date March 26, 2013, by and between Micron Technology, Inc. and Deutsche Bank AG, London Branch (35) |
10.72 |
| Currency Option Transaction 590297604-2 Trade Date March 26, 2013, by and between Micron Technology, Inc. and Deutsche Bank AG, London Branch (35) |
10.73 |
| Currency Option Transaction 590297605-2 Trade Date March 26, 2013, by and between Micron Technology, Inc. and Deutsche Bank AG, London Branch (35) |
10.74 |
| Currency Option Transaction 590332910-1 Trade Date March 26, 2013, by and between Micron Technology, Inc. and Deutsche Bank AG, London Branch (35) |
10.75 |
| Currency Option Transaction 590332913-1 Trade Date March 26, 2013, by and between Micron Technology, Inc. and Deutsche Bank AG, London Branch (35) |
10.76 |
| Currency Option Transaction 590332916-1 Trade Date March 26, 2013, by and between Micron Technology, Inc. and Deutsche Bank AG, London Branch (35) |
10.77 |
| Foreign Exchange Forward and Currency Option Transactions (Ref. No. 5371036; 5371039) dated March 26, 2013, by and between Micron Technology, Inc. and Morgan Stanley Bank, N.A. (35) |
10.78 |
| Currency Exchange Confirmation (Ref. No. SDB2634749868-2634749919) dated March 26, 2013, by and between Micron Technology, Inc. and J. Aron & Company, an affiliate of the Goldman Sachs Group, Inc. (35) |
10.79* |
| English Translation of Front-End Manufacturing Supply Agreement, dated July 31, 2013, by and between Micron Semiconductor Asia Pte. Ltd. and Elpida Memory, Inc. (39) |
10.80* |
| English Translation of Research and Development Engineering Services Agreement, dated July 31, 2013, by and between Micron Technology, Inc. and Elpida Memory, Inc. (6) |
10.81* |
| English Translation of General Services Agreement, dated July 31, 2013, by and between Micron Semiconductor Asia Pte. Ltd. and Elpida Memory, Inc. (39) |
10.82 |
| Form of Capped Call Confirmation (2) |
10.83 |
| Purchase Agreement, dated as of February 5, 2014, by and among Micron Technology, Inc. and Morgan Stanley & Co. LLC, Goldman, Sachs & Co. and Credit Suisse Securities (USA) LLC, as representatives of the initial purchasers (40) |
10.84 |
| Registration Rights Agreement, dated as of February 10, 2014, by and among Micron Technology, Inc. and Morgan Stanley & Co. LLC, Goldman, Sachs & Co. and Credit Suisse Securities (USA) LLC, as representatives of the initial purchasers (15) |
103
10.85 |
| Purchase Agreement, dated as of July 23, 2014, by and among Micron Technology, Inc. and Morgan Stanley & Co LLC, Goldman, Sachs & Co. and Credit Suisse Securities (USA) LLC, as representatives of the initial purchasers (41) |
10.86 |
| Registration Rights Agreement dated as of July 28, 2014, by and among Micron Technology, Inc. and Morgan Stanley & Co. LLC, Goldman, Sachs & Co. and Credit Suisse Securities (USA) LLC, as representatives of the initial purchasers (16) |
21.1 |
| Subsidiaries of the Registrant |
23.1 |
| Consent of Independent Registered Public Accounting Firm |
31.1 |
| Rule 13a-14(a) Certification of Chief Executive Officer |
31.2 |
| Rule 13a-14(a) Certification of Chief Financial Officer |
32.1 |
| Certification of Chief Executive Officer Pursuant to 18 U.S.C. 1350 |
32.2 |
| Certification of Chief Financial Officer Pursuant to 18 U.S.C. 1350 |
101.INS |
| XBRL Instance Document |
101.SCH |
| XBRL Taxonomy Extension Schema Document |
101.CAL |
| XBRL Taxonomy Extension Calculation Linkbase Document |
101.DEF |
| XBRL Taxonomy Extension Definition Linkbase Document |
101.LAB |
| XBRL Taxonomy Extension Label Linkbase Document |
101.PRE |
| XBRL Taxonomy Extension Presentation Linkbase Document |
104
(1) |
| Incorporated by reference to Current Report on Form 8-K dated April 12, 2012 |
(2) |
| Incorporated by reference to Current Report on Form 8-K dated February 6, 2013 |
(3) |
| Incorporated by reference to Current Report on Form 8-K/A dated July 2, 2012, and filed October 31, 2012 |
(4) |
| Incorporated by reference to Annual Report on Form 10-K for the fiscal year ended August 30, 2012 |
(5) |
| Incorporated by reference to Current Report on Form 8-K dated October 29, 2012 |
(6) |
| Incorporated by reference to Current Report on Form 8-K dated July 31, 2013 |
(7) |
| Incorporated by reference to Quarterly Report on Form 10-Q for the fiscal quarter ended May 31, 2001 |
(8) |
| Incorporated by reference to Current Report on Form 8-K dated April 9, 2014 |
(9) |
| Incorporated by reference to Current Report on Form 8-K dated November 3, 2010 |
(10) |
| Incorporated by reference to Current Report on Form 8-K dated May 17, 2007 |
(11) |
| Incorporated by reference to Current Report on Form 8-K dated April 15, 2009 |
(12) |
| Incorporated by reference to Current Report on Form 8-K dated July 26, 2011 |
(13) |
| Incorporated by reference to Current Report on Form 8-K dated November 12, 2013 |
(14) |
| Incorporated by reference to Quarterly Report on Form 10-Q for the fiscal quarter ended February 27, 2014 |
(15) |
| Incorporated by reference to Current Report on Form 8-K dated February 10, 2014 |
(16) |
| Incorporated by reference to Current Report on Form 8-K dated July 28, 2014 |
(17) |
| Incorporated by reference to Quarterly Report on Form 10-Q for the fiscal quarter ended December 4, 2008 |
(18) |
| Incorporated by reference to Quarterly Report on Form 10-Q for the fiscal quarter ended March 3, 2005 |
(19) |
| Incorporated by reference to Current Report on Form 8-K dated April 3, 2005 |
(20) |
| Incorporated by reference to Registration Statement on Form S-8 (Reg. No. 333-196293) |
(21) |
| Incorporated by reference to Registration Statement on Form S-8 (Registration No. 333-148357) |
(22) |
| Incorporated by reference to Registration Statement on Form S-8 (Reg. No. 333-167536) |
(23) |
| Incorporated by reference to Quarterly Report on Form 10-Q for the fiscal quarter ended November 30, 2006 |
(24) |
| Incorporated by reference to Quarterly Report on Form 10-Q for the fiscal quarter ended March 1, 2007 |
(25) |
| Incorporated by reference to Annual Report on Form 10-K for the fiscal year ended August 28, 2003 |
(26) |
| Incorporated by reference to Quarterly Report on Form 10-Q for the fiscal quarter ended February 27, 1997 |
(27) |
| Incorporated by reference to Quarterly Report on Form 10-Q for the fiscal quarter ended December 1, 2005 |
(28) |
| Incorporated by reference to Quarterly Report on Form 10-Q for the fiscal quarter ended May 29, 2008 |
(29) |
| Incorporated by reference to Current Report on Form 8-K dated October 26, 2007 |
(30) |
| Incorporated by reference to Current Report on Form 8-K dated April 8, 2009 |
(31) |
| Incorporated by reference to Quarterly Report on Form 10-Q for the fiscal quarter ended March 4, 2010 |
(32) |
| Incorporated by reference to Annual Report on Form 10-K for the fiscal year ended September 2, 2010 |
(33) |
| Incorporated by reference to Annual Report on Form 10-K for the fiscal year ended September 1, 2011 |
(34) |
| Incorporated by reference to Quarterly Report on Form 10-Q for the fiscal quarter ended March 1, 2012 |
(35) |
| Incorporated by reference to Quarterly Report on Form 10-Q for the fiscal quarter ended May 30, 2013 |
(36) |
| Incorporated by reference to Quarterly Report on Form 10-Q for the fiscal quarter ended May 31, 2012 |
(37) |
| Incorporated by reference to Quarterly Report on Form 10-Q for the fiscal quarter ended February 28, 2013 |
(38) |
| Incorporated by reference to Quarterly Report on Form 10-Q/A Amendment 2 for the fiscal quarter ended February 28, 2013 |
(39) |
| Incorporated by reference to Current Report on Form 8-K/A dated July 31, 2013, and filed October 2, 2013 |
(40) |
| Incorporated by reference to Current Report on Form 8-K dated February 5, 2014 |
(41) |
| Incorporated by reference to Current Report on Form 8-K dated July 23, 2014 |
* Portions of this exhibit have been omitted pursuant to a request for confidential treatment filed with the Commission.
105
SIGNATURES
Pursuant to the requirements of Section 13 or 15(d) of the Securities Exchange Act of 1934, the Registrant has duly caused this report to be signed on its behalf by the undersigned, thereunto duly authorized, in the City of Boise, State of Idaho, on the 27th day of October 2014 .
| Micron Technology, Inc. | |
| By: | /s/ Ronald C. Foster |
|
| Ronald C. Foster Vice President of Finance and Chief Financial Officer |
|
| (Principal Financial and Accounting Officer) |
Pursuant to the requirements of the Securities Exchange Act of 1934, this Annual Report has been signed below by the following persons on behalf of the Registrant and in the capacities and on the dates indicated.
Signature | Title | Date |
|
|
|
/s/ D. Mark Durcan | Chief Executive Officer | October 27, 2014 |
(D. Mark Durcan) | (Principal Executive Officer) |
|
|
|
|
/s/ Ronald C. Foster | Vice President of Finance, | October 27, 2014 |
(Ronald C. Foster) | Chief Financial Officer |
|
| (Principal Financial and |
|
| Accounting Officer) |
|
|
|
|
/s/ Robert L. Bailey | Director | October 27, 2014 |
(Robert L. Bailey) |
|
|
|
|
|
|
|
|
/s/ Richard M. Beyer | Director | October 27, 2014 |
(Richard M. Beyer) |
|
|
|
|
|
|
|
|
/s/ Patrick J. Byrne | Director | October 27, 2014 |
(Patrick J. Byrne) |
|
|
|
|
|
|
|
|
/s/ Warren East | Director | October 27, 2014 |
(Warren East) |
|
|
|
|
|
|
|
|
/s/ Mercedes Johnson | Director | October 27, 2014 |
(Mercedes Johnson) |
|
|
|
|
|
|
|
|
/s/ Lawrence N. Mondry | Director | October 27, 2014 |
(Lawrence N. Mondry) |
|
|
|
|
|
|
|
|
/s/ Robert E. Switz | Chairman of the Board | October 27, 2014 |
(Robert E. Switz) | Director |
|
106
SCHEDULE I
CONDENSED FINANCIAL INFORMATION OF THE REGISTRANT
MICRON TECHNOLOGY, INC.
(Parent Company Only)
CONDENSED STATEMENTS OF OPERATIONS AND COMPREHENSIVE INCOME
(in millions)
For the year ended |
| August 28, |
| August 29, |
| August 30, | ||||||
Net sales |
| $ | 5,819 | |
| $ | 4,404 | |
| $ | 4,590 | |
Cost of goods sold |
| 3,514 | |
| 3,721 | |
| 4,194 | | |||
Gross margin |
| 2,305 | |
| 683 | |
| 396 | | |||
|
|
|
|
|
|
| ||||||
Selling, general and administrative |
| 264 | |
| 238 | |
| 281 | | |||
Research and development |
| 1,389 | |
| 921 | |
| 917 | | |||
Other operating (income) expense, net |
| 251 | |
| 77 | |
| 18 | | |||
Operating income (loss) |
| 401 | |
| (553 | ) |
| (820 | ) | |||
|
|
|
|
|
|
| ||||||
Gain on MMJ Acquisition |
| (33 | ) |
| 1,484 | |
| - | | |||
Interest income (expense), net |
| (209 | ) |
| (189 | ) |
| (160 | ) | |||
Other non-operating income (expense), net |
| (86 | ) |
| (248 | ) |
| 17 | | |||
|
| 73 | |
| 494 | |
| (963 | ) | |||
|
|
|
|
|
|
| ||||||
Income tax (provision) benefit |
| 18 | |
| (1 | ) |
| 8 | | |||
Equity in earnings (loss) of subsidiaries |
| 2,956 | |
| 703 | |
| 29 | | |||
Equity in net loss of equity method investees |
| (2 | ) |
| (6 | ) |
| (106 | ) | |||
Net income (loss) attributable to Micron |
| 3,045 | |
| 1,190 | |
| (1,032 | ) | |||
Other comprehensive income (loss) |
| (7 | ) |
| (17 | ) |
| (52 | ) | |||
Comprehensive income (loss) attributable to Micron |
| $ | 3,038 | |
| $ | 1,173 | |
| $ | (1,084 | ) |
See accompanying notes to condensed financial statements.
107
SCHEDULE I
CONDENSED FINANCIAL INFORMATION OF THE REGISTRANT
MICRON TECHNOLOGY, INC.
(Parent Company Only)
CONDENSED BALANCE SHEETS
(in millions except par value amounts)
As of |
| August 28, |
| August 29, | ||||
Assets |
|
|
|
| ||||
Cash and equivalents |
| $ | 1,249 | |
| $ | 1,202 | |
Short-term investments |
| 384 | |
| 221 | | ||
Receivables |
| 114 | |
| 159 | | ||
Notes and accounts receivable from subsidiaries |
| 1,767 | |
| 826 | | ||
Finished goods |
| 84 | |
| 88 | | ||
Work in process |
| 228 | |
| 332 | | ||
Raw materials and supplies |
| 68 | |
| 43 | | ||
Other current assets |
| 215 | |
| 30 | | ||
Total current assets |
| 4,109 | |
| 2,901 | | ||
Investment in subsidiaries |
| 10,149 | |
| 7,465 | | ||
Long-term marketable investments |
| 819 | |
| 499 | | ||
Noncurrent notes receivable from and prepaid expenses to subsidiaries |
| 111 | |
| 573 | | ||
Property, plant and equipment, net |
| 1,519 | |
| 1,613 | | ||
Equity method investments |
| 9 | |
| 12 | | ||
Other noncurrent assets |
| 595 | |
| 472 | | ||
Total assets |
| $ | 17,311 | |
| $ | 13,535 | |
|
|
|
|
| ||||
Liabilities and equity |
|
|
|
| ||||
Accounts payable and accrued expenses |
| $ | 758 | |
| $ | 650 | |
Short-term debt and accounts payable to subsidiaries |
| 619 | |
| 416 | | ||
Current debt |
| 1,077 | |
| 646 | | ||
Other current liabilities |
| 38 | |
| 44 | | ||
Total current liabilities |
| 2,492 | |
| 1,756 | | ||
Long-term debt |
| 3,231 | |
| 2,438 | | ||
Other noncurrent liabilities |
| 760 | |
| 199 | | ||
Total liabilities |
| 6,483 | |
| 4,393 | | ||
|
|
|
|
| ||||
Commitments and contingencies |
| | |
| | | ||
|
|
|
|
| ||||
Redeemable convertible notes |
| 57 | |
| - | | ||
|
|
|
|
| ||||
Micron shareholders' equity: |
|
|
|
| ||||
Common stock, $0.10 par value, 3,000 shares authorized, 1,073 shares issued and outstanding (1,044 as of August 29, 2013) |
| 107 | |
| 104 | | ||
Other equity |
| 10,664 | |
| 9,038 | | ||
Total Micron shareholders' equity |
| 10,771 | |
| 9,142 | | ||
Total liabilities and equity |
| $ | 17,311 | |
| $ | 13,535 | |
See accompanying notes to condensed financial statements.
108
SCHEDULE I
CONDENSED FINANCIAL INFORMATION OF THE REGISTRANT
MICRON TECHNOLOGY, INC.
(Parent Company Only)
CONDENSED STATEMENTS OF CASH FLOWS
(in millions)
For the year ended |
| August 28, |
| August 29, |
| August 30, | ||||||
Net cash (used for) provided by operating activities |
| $ | 888 | |
| $ | (347 | ) |
| $ | (48 | ) |
|
|
|
|
|
|
| ||||||
Cash flows from investing activities |
|
|
|
|
|
| ||||||
Purchases of available-for-sale securities |
| (1,047 | ) |
| (924 | ) |
| (559 | ) | |||
Expenditures for property, plant, and equipment |
| (323 | ) |
| (281 | ) |
| (682 | ) | |||
Cash contributions to subsidiaries |
| (121 | ) |
| (23 | ) |
| (84 | ) | |||
Expenditures for intangible assets |
| (43 | ) |
| (34 | ) |
| (40 | ) | |||
Payments to settle hedging activities |
| (27 | ) |
| (256 | ) |
| (51 | ) | |||
Cash paid for MMJ Acquisition |
| - | |
| (596 | ) |
| - | | |||
Loan to equity method investee |
| - | |
| (45 | ) |
| - | | |||
Cash paid to terminate lease to IMFT |
| - | |
| - | |
| (107 | ) | |||
Additions to equity method investments |
| - | |
| - | |
| (17 | ) | |||
Proceeds from sales and maturities of available-for-sale securities |
| 557 | |
| 678 | |
| 151 | | |||
Proceeds from repayment of loans to subsidiaries, net |
| 379 | |
| 851 | |
| 556 | | |||
Cash distributions from subsidiaries |
| 227 | |
| 38 | |
| 499 | | |||
Cash received from disposition of interest in Aptina |
| 105 | |
| - | |
| - | | |||
Proceeds from receipt of loan payments |
| 56 | |
| - | |
| - | | |||
Proceeds from sales of property, plant and equipment |
| 45 | |
| 38 | |
| 63 | | |||
Proceeds from settlement of hedging activities |
| 23 | |
| 38 | |
| 26 | | |||
Other |
| 7 | |
| 9 | |
| (28 | ) | |||
Net cash used for investing activities |
| (162 | ) |
| (507 | ) |
| (273 | ) | |||
|
|
|
|
|
|
| ||||||
Cash flows from financing activities |
|
|
|
|
|
| ||||||
Repayments of debt |
| (2,469 | ) |
| (777 | ) |
| (117 | ) | |||
Cash paid to purchase stock under equity plans |
| (76 | ) |
| (5 | ) |
| (6 | ) | |||
Payments on equipment purchase contracts |
| (69 | ) |
| (73 | ) |
| (41 | ) | |||
Payments of licensing obligations |
| (47 | ) |
| (31 | ) |
| (18 | ) | |||
Debt issuance costs |
| (33 | ) |
| (17 | ) |
| (21 | ) | |||
Cash paid for capped call transactions |
| - | |
| (48 | ) |
| (103 | ) | |||
Proceeds from issuance of debt |
| 1,750 | |
| 693 | |
| 1,113 | | |||
Proceeds from issuance of stock under equity plans |
| 265 | |
| 150 | |
| 5 | | |||
Proceeds from equipment sale-leaseback transactions |
| - | |
| 126 | |
| 439 | | |||
Cash received for capped call transactions |
| - | |
| 24 | |
| - | | |||
Other |
| 1 | |
| 2 | |
| - | | |||
Net cash provided by (used for) financing activities |
| (678 | ) |
| 44 | |
| 1,251 | | |||
|
|
|
|
|
|
| ||||||
Effect of changes in currency exchange rates on cash and cash equivalents |
| (1 | ) |
| - | |
| - | | |||
|
|
|
|
|
|
| ||||||
Net increase (decrease) in cash and equivalents |
| 47 | |
| (810 | ) |
| 930 | | |||
Cash and equivalents at beginning of period |
| 1,202 | |
| 2,012 | |
| 1,082 | | |||
Cash and equivalents at end of period |
| $ | 1,249 | |
| $ | 1,202 | |
| $ | 2,012 | |
See accompanying notes to condensed financial statements.
109
MICRON TECHNOLOGY, INC.
SCHEDULE I
CONDENSED FINANCIAL INFORMATION OF THE REGISTRANT
NOTES TO CONDENSED FINANCIAL STATEMENTS
(All tabular amounts in millions)
Basis of Presentation
Micron, a Delaware corporation, was incorporated in 1978. Micron is the parent company of its consolidated subsidiaries and, together with its consolidated subsidiaries, is one of the world's leading providers of advanced semiconductor solutions.
These condensed financial statements have been prepared on a parent-only basis. Under this parent-only presentation, Micron's investments in its consolidated subsidiaries are presented under the equity method of accounting. In accordance with Rule 12-04 of Regulation S-X, these parent-only financial statements do not include all of the information and footnotes required by Generally Accepted Accounting Principles (GAAP) in the United States for annual financial statements. Because these parent-only financial statements and notes do not include all of the information and footnotes required by GAAP in the U.S. for annual financial statements, these parent-only financial statements and other information included should be read in conjunction with Micron's audited Consolidated Financial Statements contained within Part II, Item 8 of this Form 10-K for the year ended August 28, 2014 .
Long-Term Debt
|
|
|
|
|
| 2014 |
| 2013 | ||||||||||||||||||||||
Instrument (1) |
| Stated Rate |
| Effective Rate |
| Current |
| Long-Term |
| Total |
| Current |
| Long-Term |
| Total | ||||||||||||||
Capital lease obligations (2) |
| N/A | |
| N/A | |
| $ | 172 | |
| $ | 233 | |
| $ | 405 | |
| $ | 156 | |
| $ | 397 | |
| $ | 553 | |
2014 convertible senior notes |
| 1.875 | % |
| 7.88 | % |
| - | |
| - | |
| - | |
| 465 | |
| - | |
| 465 | | ||||||
2022 senior notes |
| 5.875 | % |
| 6.14 | % |
| - | |
| 600 | |
| 600 | |
| - | |
| - | |
| - | | ||||||
2025 senior notes |
| 5.500 | % |
| 5.56 | % |
| - | |
| 1,150 | |
| 1,150 | |
| - | |
| - | |
| - | | ||||||
2027 convertible senior notes |
| 1.875 | % |
| 6.95 | % |
| - | |
| - | |
| - | |
| - | |
| 147 | |
| 147 | | ||||||
2031A convertible senior notes |
| 1.500 | % |
| 6.55 | % |
| - | |
| - | |
| - | |
| - | |
| 277 | |
| 277 | | ||||||
2031B convertible senior notes (3) |
| 1.875 | % |
| 6.98 | % |
| 362 | |
| - | |
| 362 | |
| - | |
| 253 | |
| 253 | | ||||||
2032C convertible senior notes (4) |
| 2.375 | % |
| 5.95 | % |
| - | |
| 314 | |
| 314 | |
| - | |
| 463 | |
| 463 | | ||||||
2032D convertible senior notes (4) |
| 3.125 | % |
| 6.33 | % |
| - | |
| 288 | |
| 288 | |
| - | |
| 369 | |
| 369 | | ||||||
2033E convertible senior notes (4)(5) |
| 1.625 | % |
| 4.50 | % |
| 278 | |
| - | |
| 278 | |
| - | |
| 272 | |
| 272 | | ||||||
2033F convertible senior notes (4)(5) |
| 2.125 | % |
| 4.93 | % |
| 265 | |
| - | |
| 265 | |
| - | |
| 260 | |
| 260 | | ||||||
2043G convertible senior notes |
| 3.000 | % |
| 6.76 | % |
| - | |
| 636 | |
| 636 | |
| - | |
| - | |
| - | | ||||||
Other |
| 1.650 | % |
| 1.65 | % |
| - | |
| 10 | |
| 10 | |
| 25 | |
| - | |
| 25 | | ||||||
|
|
|
|
|
| $ | 1,077 | |
| $ | 3,231 | |
| $ | 4,308 | |
| $ | 646 | |
| $ | 2,438 | |
| $ | 3,084 | | ||
(1) | Micron has either the obligation or the option to pay cash for the aggregate amount due upon conversion for all of its convertible notes. Since it is Micron's current intent to settle in cash the principal amount of all of its convertible notes upon conversion, the dilutive effect of such notes on earnings per share is computed under the treasury stock method. |
(2) Weighted-average imputed rate of 4.7% and 4.7% as of August 28, 2014 and August 29, 2013 , respectively.
(3) | Amount recorded for 2014 includes the debt and equity components, which was reclassified as a result of Micron's obligation to settle the conversions of the 2031B Notes. |
(4) | Since the closing price of Micron's common stock for at least 20 trading days in the 30 trading day period ending on June 30, 2014 exceeded 130% of the initial conversion price per share, holders have the right to convert their notes at any time during the calendar quarter ended September 30, 2014. The closing price of Micron's common stock also exceeded the thresholds for the calendar quarter ended September 30, 2014; therefore, these notes are convertible by the holders through December 31, 2014. |
110
(5) As a result of these notes being convertible at the option of the holder through September 30, 2014, and because the terms of these notes would require Micron to pay cash for the principal amount of any converted notes, amounts are classified as current.
Micron's senior notes are unsecured obligations ranking equally in right of payment with all of Micron's other existing and future unsecured indebtedness, and are effectively subordinated to all of Micron's other existing and future secured indebtedness, to the extent of the value of the assets securing such indebtedness. The convertible notes, 2022 Notes and 2025 Notes of Micron are structurally subordinated to $1.57 billion of other notes payable of its subsidiaries and capital lease obligations. MTI guarantees certain debt obligations of its subsidiaries. MTI does not guarantee the MMJ creditor installment payments. As of August 28, 2014 , Micron had guaranteed $610 million of debt obligations of its subsidiaries. Micron's guarantees of its subsidiary debt obligations are unsecured obligations ranking equally in right of payment with all of its other existing and future unsecured indebtedness.
Capital Lease Obligations
Micron has various capital lease obligations due in periodic installments with a weighted-average remaining term of 2 years . In 2013 , Micron received $126 million in proceeds from equipment sale-leaseback transactions and, as a result, recorded capital lease obligations aggregating $126 million with a weighted-average effective interest rate of 4.3% , payable in periodic installments through July 2017 .
As of August 28, 2014 and August 29, 2013 , Micron had production equipment with carrying values of $305 million and $458 million , respectively, under capital leases.
Convertible Senior Notes and Other Senior Notes
For further information, see "Part II – Item 8. Financial Statements and Supplementary Data – Notes to Consolidated Financial Statements – Debt" to Micron's consolidated financial statements.
Maturities of Notes Payable and Future Minimum Lease Payments
As of August 28, 2014 , maturities of notes payable and future minimum lease payments under capital lease obligations were as follows:
|
| Notes Payable |
| Capital Lease Obligations | ||||
2015 |
| $ | 389 | |
| $ | 188 | |
2016 |
| - | |
| 200 | | ||
2017 |
| - | |
| 30 | | ||
2018 |
| 300 | |
| 3 | | ||
2019 |
| 362 | |
| 3 | | ||
2020 and thereafter |
| 3,320 | |
| 6 | | ||
Discounts and interest, respectively |
| (468 | ) |
| (25 | ) | ||
|
| $ | 3,903 | |
| $ | 405 | |
Commitments
Micron has provided various financial guarantees issued in the normal course of business on behalf of its subsidiaries. These contracts include debt guarantees and guarantees on certain banking facilities. Micron enters into these arrangements to facilitate commercial transactions with third parties by enhancing the value of the transaction to the third party. Micron has entered into agreements covering certain activities of its subsidiaries, and occasionally Micron may be required to perform under such agreements on behalf of its subsidiaries.
111
As of August 28, 2014 , the maximum potential amount of future payments Micron could have been required to make under its debt guarantees was approximately $610 million . Substantially all of this amount relates to guarantees for debt of wholly-owned entities whereby Micron would be obligated to perform under the guarantee if a subsidiary were to default on the terms of their debt arrangements. In the event of performance under the guarantee, Micron would be permitted to seek reimbursement from the subsidiary company(s) through liquidation of the assets collateralized by the various debt instruments. At the time these contracts were entered into, the collateralized assets approximated the value of the outstanding guarantees. The majority of these guarantees expire at various times between December 2014 and January 2019 . Micron also guarantees credit facilities of certain of its subsidiaries that provide for up to $408 million of financing. As of August 28, 2014 , no amounts had been drawn under these credit facilities.
Micron guarantees certain banking facilities for its wholly-owned consolidated entities. Substantially all of these guarantees relate to bank overdraft protections. The maximum potential amount of future payments Micron could be required to make under these guarantees varies based on the extent of potential overdrafts. Micron's business processes substantially mitigate the risk of wholly-owned subsidiaries overdrafting their bank accounts. The majority of these guarantees have no contractual expiration.
Contingencies
As is typical in the semiconductor and other high technology industries, from time to time others have asserted, and may in the future assert, that Micron and its subsidiaries' products or manufacturing processes infringe their intellectual property rights. Micron has accrued a liability and charged operations for the estimated costs of adjudication or settlement of various asserted and unasserted claims existing as of the balance sheet date. Micron is currently a party to various litigation regarding patent, antitrust, commercial and other matters. Micron is a party to the matters listed in the "Contingencies" note in the consolidated financial statements, with the exception of the complaint filed on July 12, 2013 by seven former shareholders of Elpida (now known as MMJ) against the board of directors of MMJ as of February 2013 and the patent infringement case Tessera Inc., which was resolved on July 30, 2014. For further information, see "Part II – Item 8. Financial Statements and Supplementary Data – Notes to Consolidated Financial Statements – Contingencies" to Micron's consolidated financial statements.
Redeemable Convertible Notes
For further information, see "Part II – Item 8. Financial Statements and Supplementary Data – Notes to Consolidated Financial Statements – Redeemable Convertible Notes" to Micron's consolidated financial statements.
Related Party Transaction
Substantially all of Micron's activities relate to manufacturing services performed for a subsidiary and to royalties received from its subsidiaries for use of product and process technology. Micron's net sales to consolidated subsidiaries were $5.64 billion , $4.19 billion and $4.15 billion for 2014 , 2013 and 2012 , respectively. Gross margins on manufacturing activities are commensurate with market rates for such services. Transactions between Micron and its consolidated subsidiaries are eliminated in consolidation.
Micron engages in various transactions with its equity method investees and eliminates the profits or losses on those transactions to the extent of its ownership interest until such time as the profits or losses are realized. As of August 28, 2014 , Micron held a 50% ownership interest in Transform and, until August 15, 2014, an equity interest in Aptina. Net sales for 2014 , 2013 and 2012 also included $43 million , $182 million and $372 million , respectively, from products sold to and services performed for Aptina.
On August 15, 2014, ON Semiconductor Corporation acquired Aptina for approximately $433 million and Micron recognized a non-operating gain of $119 million on the sale of its shares based on its diluted ownership interest of approximately 27% . The gain approximated Micron's share of the consideration because the carrying value of its investment had been reduced to zero since the second quarter of 2012, at which time Micron ceased recognizing its proportionate share of Aptina's losses. For further information regarding transactions between Micron and its equity method investees, see "Part II – Item 8. Financial Statements and Supplementary Data – Notes to Consolidated Financial Statements – Equity Method Investments – Other" to Micron's consolidated financial statements.
112
SCHEDULE II
VALUATION AND QUALIFYING ACCOUNTS
(in millions)
MICRON TECHNOLOGY, INC.
| Balance at Beginning of Year |
| Business Acquisitions |
| Charged (Credited) to Costs and Expenses |
| Deductions/ Write-Offs |
| Balance at End of Year | ||||||||||
Allowance for Doubtful Accounts |
|
|
|
|
|
|
|
|
| ||||||||||
Year ended August 28, 2014 | $ | 5 | |
| $ | - | |
| $ | - | |
| $ | (2 | ) |
| $ | 3 | |
Year ended August 29, 2013 | 5 | |
| - | |
| 1 | |
| (1 | ) |
| 5 | | |||||
Year ended August 30, 2012 | 3 | |
| - | |
| 5 | |
| (3 | ) |
| 5 | | |||||
|
|
|
|
|
|
|
|
|
| ||||||||||
Deferred Tax Asset Valuation Allowance |
| |
|
| |
|
| |
|
| |
|
| | |||||
Year ended August 28, 2014 | $ | 3,155 | |
| $ | - | |
| $ | (544 | ) |
| $ | (168 | ) |
| $ | 2,443 | |
Year ended August 29, 2013 | 1,470 | |
| 1,292 | |
| 418 | |
| (25 | ) |
| 3,155 | | |||||
Year ended August 30, 2012 | 1,169 | |
| - | |
| 368 | |
| (67 | ) |
| 1,470 | | |||||
Certain deferred tax assets in prior years were corrected with corresponding changes in the valuation allowance, resulting in no change to net deferred tax assets. Changes in these items were not material for any period presented.
113