UNITED STATES
SECURITIES AND EXCHANGE COMMISSION
Washington, D.C. 20549
FORM 10-K
x | ANNUAL REPORT PURSUANT TO SECTION 13 OR 15(d) OF THE SECURITIES EXCHANGE ACT OF 1934 |
For the fiscal year ended
January 31, 2011
Commission File No. 0-18370
MFRI, Inc.
(Exact name of registrant as specified in its charter)

Delaware | 36-3922969 |
(State or other jurisdiction of incorporation or organization) | (I.R.S. Employer Identification No.) |
7720 N. Lehigh Avenue, Niles, Illinois | 60714 |
(Address of principal executive offices) | (Zip Code) |
(847) 966-1000
(Registrant's telephone number, including area code)
Securities registered pursuant to Section 12(b) of the Act:
Title of each class | Name of each exchange on which registered |
Common Stock, $.01 per share | The NASDAQ Stock Market, LLC |
Securities registered pursuant to Section 12(g) of the Act: None
Indicate by check mark whether the registrant is a well-known seasoned issuer, as defined in Rule 405 of the Securities Act. Yes o No x
Indicate by check mark if the registrant is not required to file reports pursuant to Section 13 or Section 15(d) of the Act. Yes o No x
Indicate by check mark whether the registrant (1) has filed all reports required to be filed by Section 13 or 15(d) of the Securities Exchange Act of 1934 during the preceding 12 months (or for such shorter period that the registrant was required to file such reports), and (2) has been subject to such filing requirements for the past 90 days. Yes x No o
Indicate by check mark whether the registrant has submitted electronically and posted on its corporate web site, if any, every Interactive Data File required to be submitted and posted pursuant to Rule 405 of Regulation S-T during the preceding 12 months (or for such shorter period that the registrant was required to submit and post such files). Yes o No o
Indicate by check mark if disclosure of delinquent filers pursuant to Item 405 of Regulation S-K is not contained herein, and will not be contained, to the best of registrant's knowledge, in definitive proxy or information statements incorporated by reference in Part III of this FORM 10-K or any amendment to this FORM 10-K. Yes x No o
Indicate by check mark whether the registrant is a large accelerated filer, an accelerated filer, a non-accelerated filer, or a smaller reporting company. See definition of "accelerated filer and large accelerated filer" in Rule 12b-2 of the Exchange Act. (Check one): Large accelerated filer o Accelerated filer o Non-accelerated filer o Smaller reporting company x
Indicate by check mark whether the Registrant is a shell company (as defined in Rule 12b-2 of The Exchange Act) Yes o No x
The aggregate market value of the voting and non-voting common equity held by non-affiliates of the registrant (the exclusion of the market value of the shares owned by any person shall not be deemed an admission by the registrant that such person is an affiliate of the registrant) was $34,981,103 based on the closing sale price of $6.30 per share as reported on the NASDAQ Global Market on July 31, 2010.
The number of shares of the registrant's common stock outstanding at March 31, 2011 was 6,854,646 .
DOCUMENTS INCORPORATED BY REFERENCE
Portions of the proxy statement for the 2010 Annual Meeting of Stockholders are incorporated by reference in Part III.
MFRI, Inc.
FORM 10-K
For the fiscal period ended
January 31, 2011
TABLE OF CONTENTS
Item |
| Page | |
Part I |
|
| |
1. | Business | 1 |
|
| Piping Systems Business | 2 |
|
| Filtration Products Business
| 3 |
|
| Industrial Process Cooling Equipment Business | 5 |
|
| Employees
| 6 |
|
| International
| 6 |
|
| Executive Officers of the Registrant
| 7 |
|
1A. | Risk Factors
| 8 |
|
1B. | Unresolved Staff Comments
| 10 |
|
2. | Properties | 10 |
|
3. | Legal Proceedings
| 11 |
|
4. | RESERVED
| 11 |
|
|
|
| |
Part II |
|
| |
5. | Market for Registrant's Common Equity, Related Stockholder Matters and Issuer Purchases of Equity Securities | 11 |
|
6. | Selected Financial Data | 13 |
|
7. | Management's Discussion and Analysis of Financial Condition and Results of Operations | 13 |
|
7A. | Quantitative and Qualitative Disclosures About Market Risk | 23 |
|
8. | Financial Statements and Supplementary Data | 24 |
|
9. | Changes in and Disagreements with Accountants on Accounting and Financial Disclosure | 24 |
|
9A. | Controls and Procedures | 24 |
|
9B. | Other Information | 24 |
|
|
|
| |
Part III |
|
| |
10. | Directors, Executive Officers and Corporate Governance | 25 |
|
11. | Executive Compensation | 25 |
|
12. | Security Ownership of Certain Beneficial Owners and Management and Related Stockholder Matters | 25 |
|
13. | Certain Relationships and Related Transactions, and Director Independence | 25 |
|
14. | Principal Accountant Fees and Services | 25 |
|
|
|
| |
Part IV |
|
| |
15. | Exhibits and Financial Statement Schedules | 25 |
|
|
|
| |
Report of Independent Registered Public Accounting Firm | 26 |
| |
Signatures | 54 |
| |
PART I
Forward Looking Statements
Statements in this Form 10-K that are not historical facts, so-called "forward-looking statements," are made pursuant to the safe harbor provisions of the Private Securities Litigation Reform Act of 1995. Investors are cautioned that all forward-looking statements involve risks and uncertainties, including those detailed in MFRI's filings with the Securities and Exchange Commission ("SEC"). See "Risk Factors" in Item 1A.
Item 1. BUSINESS
MFRI, Inc., collectively with its subsidiaries ("MFRI", the "Company" or the "Registrant"), is engaged in the manufacture and sale of products in three distinct business segments: piping systems, filtration products and industrial process cooling equipment. Corporate and other includes the installation of heating, ventilation and air conditioning ("HVAC") systems. This activity is not sufficiently large to constitute a reportable segment. The Company's fiscal year ends on January 31. Years and balances described as 2010 and 2009 are the fiscal years ended January 31, 2011 and 2010 , respectively. In the year ended January 31, 2011 , no customer accounted for 10% or more of the Company's net sales.
Information with respect to the Company's business segments is included in the following discussions of the separate business segments and in the financial statements and related notes thereto.
MFRI, Inc.'s Operating Units
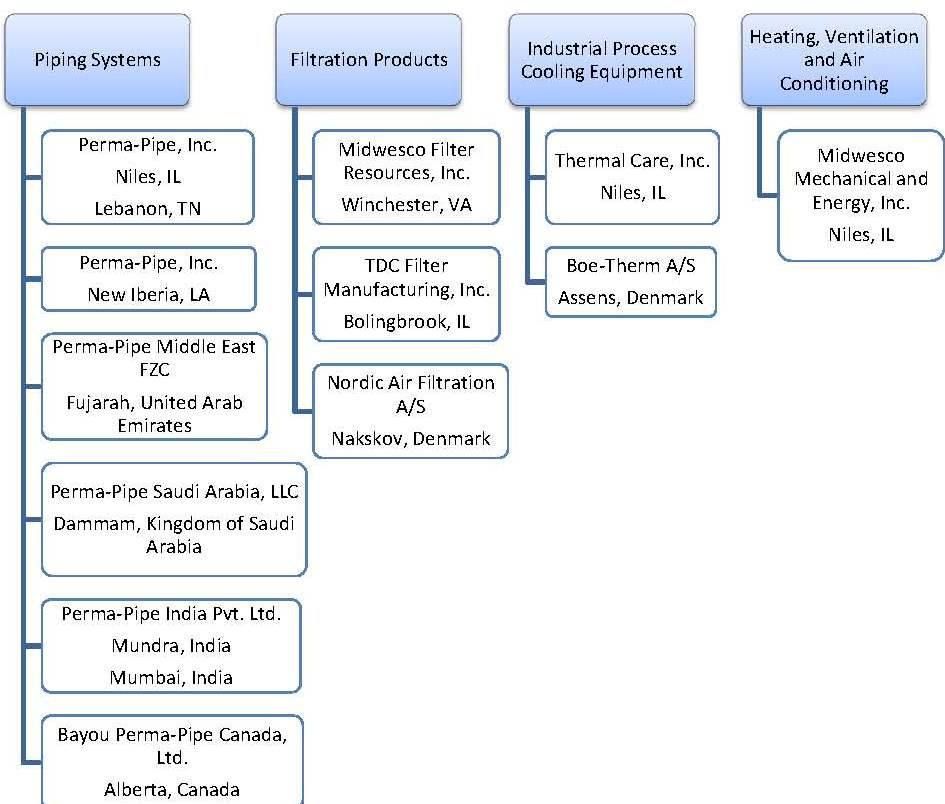
All subsidiaries shown are, directly or indirectly, wholly owned by MFRI except Bayou Perma-Pipe Canada, Ltd., which is owned 49% by MFRI and 51% by an unrelated party.
1
Available Information
The Company files with, and furnishes to the SEC, reports including annual meeting materials, annual reports on Form 10-K, quarterly reports on Form 10-Q, and current reports on Form 8-K, as well as amendments thereto. The Company maintains a website www.mfri.com , where these reports and related materials are available free of charge as soon as reasonably practicable after the Company electronically delivers such material to the SEC. The information on the Company's website is not part of this annual report on Form 10-K, and is not incorporated into this or any other filings by the Company with the SEC.
Piping Systems
Products and Services. The Company engineers, designs, manufactures and sells specialty piping leak detection and location systems. Piping systems include (i) industrial and secondary containment piping systems for transporting chemicals, hazardous fluids and petroleum products, (ii) insulated and jacketed district heating and cooling ("DHC") piping systems for efficient energy distribution to multiple locations from central energy plants, and (iii) oil and gas gathering flow and long lines for oil and mineral transportation. The Company's leak detection and location systems are sold with many of its piping systems, and on a stand-alone basis to monitor areas where fluid intrusion may contaminate the environment, endanger personal safety, cause a fire hazard, impair essential services or damage equipment or property.
The Company's piping systems are frequently custom fabricated to job site dimensions and/or to incorporate provisions for thermal expansion due to varying temperatures. This custom fabrication helps to minimize the amount of field labor required by the installation contractor. Most of the Company's piping systems are produced for underground installations and, therefore, require trenching, which is done by unaffiliated installation contractors.
The Company's piping systems business is seasonal. See "Management's Discussion and Analysis of Financial Condition and Results of Operations - Piping Systems Business."
Marketing. The customer base is industrially and geographically diverse. In the United States of America ("U.S."), the Company employs national and regional sales managers who use and assist a network of independent manufacturers' representatives, none of whom sells products that are competitive with the Company's piping systems. Globally, the Company employs a direct sales force as well as an exclusive agent network for several countries in the Middle and Far East to market and sell products and services.
Recent Development. An additional insulated pipe manufacturing plant is being established in Dammam, Saudi Arabia to better serve the Gulf Cooperation Council ("GCC"), and nearby countries. This new state-of-the-art manufacturing facility will serve the special requirements of the oil and gas industry as well as the rapidly growing market for district cooling networks. Perma-Pipe Saudi Arabia, ("PPSA"), will feature Perma-Pipe's Xtru-Therm automated spray polyurethane insulation and several jacketing systems including polyethylene, metal and fiber reinforced plastic offering a comprehensive product range. PPSA will also be equipped to custom manufacture pipe spools and a complete range of pre-insulated fittings. The Company has received an industrial license and the required commercial registration and expects the plant to be fully operational in 2011.
Patents and Trademarks. The Company owns several patents covering its piping and electronic leak detection systems. The patents are not material either individually or in the aggregate to the overall business because the Company believes sales in the business would not be materially reduced if patent protection were not available. The Company owns numerous trademarks connected with its piping and leak detection systems business including the following: Perma-Pipe®, Chil-Gard®, Double Quik®, Escon-A®, FluidWatch®, Galva-Gard®, Polytherm®, Pal-AT®, Stereo-Heat®, LiquidWatch®, PalCom®, Xtru-therm®, Auto-Therm®, Pex-Gard®, Multi-Therm®, and Ultra-Therm®. The Company also owns a Canadian trademarks for Ric-Wil®, Perma-Pipe™, and Pal-at™, a Denmark trademark for Ric-Wil®, France trademark for Perma-Pipe®, German trademark for Perma-Pipe®, Oman trademarks for Perma-Pipe®, Pal-At® and Xtru-therm®, Kuwait trademarks for Perma-Pipe®, Pal-At® and Xtru-therm®, Saudi Arabia trademarks for Perma-Pipe® and Xtru-therm®, Singapore trademarks for Perma-Pipe®, Pal-At® and Xtru-therm®, India trademarks for Perma-Pipe™, Pal-At™ and Xtru-therm™, Australia trademark for
2
Ric-Wil® and Pal-at™, and United Kingdom trademarks for Polytherm®, Perma-Pipe® and Ric-Wil®, Hong Kong trademarks for Perma-Pipe®, Pal-At®, Xtru-therm® and Ric-Wil®.
Backlog. As of January 31, 2011 , the backlog (uncompleted firm orders) was $46.5 million, substantially all of which is expected to be completed in 2011. As of January 31, 2010 , the backlog was $48.8 million.
Raw Materials. The basic raw materials used in production are pipes and tubes made of carbon steel, alloy, copper, ductile iron, plastics and various chemicals such as polyols, isocyanate, urethane resin, polyethylene and fiberglass, mostly purchased in bulk quantities. The Company believes there are currently adequate supplies or sources of availability of these needed raw materials.
The sensor cables used in the leak detection and location systems are manufactured to the Company's specifications by companies regularly engaged in the business of manufacturing such cables. The Company owns patents for some of the features of its sensor cables. The Company assembles the monitoring component of the leak detection and location system from standard components purchased from many sources.
Competition. The piping systems business is highly competitive. The Company believes its principal competition in this segment consists of between ten and twenty major competitors and more small competitors. The Company believes quality, service, a comprehensive product line and price are the key competitive factors. The Company also believes it has a more comprehensive line for DHC than any of its competitors. Some competitors of the Company have greater financial resources and some have cost advantages as a result of manufacturing a limited range of products.
Government Regulation. The demand for the Company's leak detection and location systems and secondary containment piping systems, a small percentage of the total annual piping sales, is driven by federal and state environmental regulation with respect to hazardous waste. The Federal Resource Conservation and Recovery Act requires, in some cases, that the storage, handling and transportation of fluids through underground pipelines feature secondary containment and leak detection. The National Emission Standard for hydrocarbon airborne particulates requires reduction of airborne volatile organic compounds and fugitive emissions. Under this regulation, many major refineries are required to recover fugitive vapors and dispose of the recovered material in a process sewer system, which then becomes a hazardous secondary waste system that must be contained. Although there can be no assurances as to the ultimate effects of these governmental regulations, the Company believes it may increase the demand for its piping systems products.
Filtration Products
Products and Services. The Company manufactures and sells a wide variety of filter elements for cartridge collectors and baghouse air filtration and particulate collection systems. The principle types of industrial air filtration and particulate collection systems in use are baghouses, cartridge collectors, electrostatic precipitators, scrubbers and mechanical collectors. This equipment is used to eliminate particulate from the air by passing particulate laden gases through fabric filters (filter bags) or pleated media filter elements, in the case of baghouses or cartridge collectors, between electrically charged collector plates, in the case of electrostatic precipitators and contact with liquid reagents (scrubbers). The Company manufactures filter elements in standard industry sizes, shapes and filtration media and to custom specifications, maintaining manufacturing standards for more than 10,000 styles of filter elements to suit substantially all industrial applications. Filter elements are manufactured from industrial yarn, fabric and paper purchased in bulk. Most filter elements are produced from cellulose, acrylic, fiberglass, polyester, aramid, laminated membranes, or polypropylene fibers. The Company also manufactures filter elements from more specialized materials, sometimes using special finishes.
The Company markets numerous filter related products and accessories used during the installation, operation and maintenance of cartridge collectors and baghouses, including wire cages used to support filter bags, spring assemblies for proper tensioning of filter bags and clamps and hanger assemblies for attaching filter elements. In addition, the Company markets other hardware items used in the operation and maintenance of cartridge collectors and baghouses. The Company also provides maintenance services, consisting primarily of air filtration system
3
inspection and filter element replacement, using a network of independent contractors.
Over the past three years, the Company's filtration products business has supplied filter elements to more than 4,000 user locations. The Company has particular expertise in supplying filter bags for use with electric arc furnaces in the steel industry. The Company believes its production capacity and quality control procedures make it a leading supplier of filter bags to large users in the electric power industry. Orders from the electric power industry tend to be substantial in size, but are usually at lower margins than from other industries.
Marketing. The customer base is industrially and geographically diverse. These products and services are used primarily by operators of utility and industrial coal-fired boilers, incinerators and cogeneration plants and by producers of metals, cement, chemicals and other industrial products.
The Company has an integrated sales program for its filtration products business, which consists of field-based sales personnel, manufacturers' representatives, a telemarketing operation and computer-based customer information systems. The Company believes the computer-based information systems are instrumental in increasing sales of filter-related products and accessories and maintenance services, as well as sales of filter elements. The Company's filtration products are marketed domestically under the names, Midwesco Filter and TDC Filter Manufacturing.
The Company markets its U.S. manufactured filtration products internationally using domestically based sales resources to target major users in foreign countries. The Denmark filtration facility markets pleated filter elements throughout Europe and Asia, primarily to original equipment manufacturers.
Trademarks. The Company owns the following trademarks covering its filtration products: Seamless Tube®, Leak Seeker®, Prekote®, We Take the Dust Out of Industry®, Pleatkeeper®, Pleat Plus® and EFC®.
Backlog. As of January 31, 2011 , the backlog was $19.9 million, substantially all of which is expected to be completed in 2011. As of January 31, 2010 , the backlog was $21.4 million. Customers had until recently been delaying their purchase decisions in response to the economic climate; however, new infrastructure project spending continues to be at reduced levels.
Raw Materials. The basic raw materials used are industrial fibers and media supplied by leading producers of such materials. The majority of raw materials purchased are woven fiberglass fabric, yarns for manufacturing Seamless Tube® products and other woven, felted, spun bond, laminated membranes, and cellulose media. Only a limited number of suppliers are available for some of these materials. The Company believes supplies of all materials are adequate to meet current demand.
Competition. The filtration products industry is highly competitive. In addition, new installations of cartridge collectors and baghouses are subject to competition from alternative technologies including electrostatic precipitators, scrubbers, and mechanical collectors described above under Products and Services. The Company believes, based on domestic sales, that its principle competitors in this segment consist of approximately five major competitors and at least 50 smaller competitors, most of which are doing business on a regional or local basis. In Europe, several companies supply filtration products, and the Company is a relatively small participant in that market. Some of the Company's competitors have greater financial resources than the Company.
The Company believes quality, service, and price are the most important competitive factors in its filtration products business. Often, a manufacturer has a competitive advantage when its products have performed successfully for a particular customer in the past. Additional effort is required by a competitor to market products to such a customer. In certain applications, the Company's proprietary Seamless Tube® product and customer support provide the Company with a competitive advantage. Some competitors may have a competitive advantage with respect to their own proprietary products and processes, such as specialized fabrics and fabric finishes. In addition, some competitors may have cost advantages with respect to products as a result of lower wage rates and/or greater vertical integration.
4
Government Regulation . The Company's filtration products business is dependent upon governmental regulation of air pollution at the federal and state levels. Federal clean air legislation requires compliance with national primary and secondary ambient air quality standards for specific pollutants, including particulate. The states are primarily responsible for implementing these standards and, in some cases, have adopted more stringent standards than those issued by the U.S. Environmental Protection Agency ("EPA") under the Clean Air Act Amendments of 1990 ("Clean Air Act"). In addition, the EPA issued its own fine particle pollution standards in 1997 and 2006.
Industrial Process Cooling Equipment
Products and Services. The Company engineers, designs, manufactures and sells cooling and temperature control equipment for industrial applications. The Company believes it manufactures the most complete line of chillers available in its primary markets. Products include: chillers (portable and central); cooling towers; plant circulating assemblies; hot water, hot oil, and negative pressure temperature controllers; water treatment equipment; specialty cooling devices for printing presses and ink management; and replacement parts and various accessories relating to the foregoing products. The Company's products are used to optimize manufacturing productivity by quickly removing heat from manufacturing processes and providing accurate temperature control. The Company combines chillers and/or cooling towers with plant circulating systems to create plant wide systems that account for a large portion of its business. The Company specializes in customizing cooling systems and computerized controls according to customer specifications.
The principle markets for the Company's cooling and temperature control products are thermoplastics processing and the printing industries. The Company also sells its products to original equipment manufacturers, to other cooling manufacturers on a private branded basis and to manufacturers in the laser, metallizing, machine tool, and various other industries.
Marketing. The Company sells its products in the global thermoplastics and printing markets as well as to other industrial applications that require specialized heat transfer equipment. Domestic thermoplastics processors are the largest market served by the Company, representing the core of its business. The Company's cooling products are sold through independent manufacturers' representatives on an exclusive territory basis. Temperature control products are sold through a network of independent dealers/distributors in major industrial markets.
The Company believes the total annual U.S. market for water cooling equipment in the plastics industry was more than $100 million on a pre-recession basis, and the Company is one of the three largest suppliers of such equipment to the plastics industry. The Company believes the plastics industry is a mature industry with growth consistent with that of the national economy. The Company has increased sales to non-plastics industries that require specialized heat transfer equipment, usually sold to end users as a package by the supplier of the primary equipment, particularly in the laser, metalizing, and machine tool industries. The Company believes the size of this market was more than $200 million annually prior to the current recession. The original equipment manufacturer distributes products to the end user in these markets.
Trademarks. The Company has registered the trademarks Thermal Care®, AWS® and Applied Web Systems®.
Backlog. As of January 31, 2011 , the backlog was $4.3 million, substantially all of which is expected to be completed in 2011. As of January 31, 2010 , the backlog was $2.4 million.
Raw Materials. The Company uses prefabricated sheet metal and subassemblies manufactured by both Thermal Care and outside vendors for chillers and temperature control fabrication. Cooling towers are manufactured using fiberglass and hardware components purchased from several sources. The Company believes its access to sheet metal, subassemblies, fiberglass and hardware components is adequate to meet demands.
Competition. The Company believes there are about 15 competitors selling cooling equipment in the domestic plastics market. The Company further believes three manufacturers, including the Company, account for approximately 50% of the domestic plastics cooling equipment market. Many international customers, with relatively small cooling needs, are able to purchase small refrigeration units (portable chillers), which are
5
manufactured in their respective local markets at prices below that which the Company can offer due to issues such as freight cost and customs duties. However, such local manufacturers often lack the technology and products needed for plant wide cooling systems. The Company believes its reputation for producing quality plant wide cooling products results in a significant portion of the Company's business in the cooling product area. Temperature control units, which are sold globally, compete with both local and European manufacturers. The quality, reliability, features and range of temperature control applications addressed by the Company's products provide a competitive advantage.
The Company believes quality, service, a comprehensive product line and price are the key competitive factors in its industrial process cooling equipment business. The Company believes it has a more comprehensive line of cooling products than any of its competitors. Certain competitors of the Company have cost advantages as a result of manufacturing in non-union shops and offering a limited range of products. Some of the Company's competitors may have greater financial resources than the Company.
Government Regulation. The Company does not expect compliance with federal, state and local provisions regulating the discharge of materials into the environment or otherwise relating to the protection of the environment to have a material effect on capital expenditures, earnings or the Company's competitive position. Management is not aware of the need for any material capital expenditures for environmental control facilities for the foreseeable future. Regulations, promulgated under the Clean Air Act, prohibit the manufacture and sale of certain refrigerants. The Company does not use those refrigerants in its products. The Company expects that suitable refrigerants conforming to federal, state and local laws and regulations will continue to be available to the Company, although no assurances can be given as to the ultimate effect of the Clean Air Act and related laws on the Company.
Employees
As of February 28, 2011 , the Company had 1,123 full-time employees, of whom 38.1% worked outside the U.S.
International
The Company's international operations as of January 31, 2011 include subsidiaries and a joint venture in five foreign countries on three continents. The Company's international operations contributed approximately 27.6% of revenue in 2010 , 29.0% of revenue in 2009 , and 30.7% of revenue in 2008.
Refer to the Business Segment descriptions on pages 1 through 5 above and Note 1 - Business and Segment Information in the Notes to Consolidated Financial Statements for additional information on international activities. International operations are subject to risks inherent in conducting business in foreign countries, including price controls, exchange controls, limitations on participation in local enterprises, nationalization, expropriation and other governmental action, and changes in currency exchange rates.
6
EXECUTIVE OFFICERS OF THE REGISTRANT
The following table set forth information regarding the executive officers of the Company as of March 15, 2011:
Name | Offices and Positions, if any, held with the Company; Age | Executive Officer of the Company or its Predecessor since |
David Unger | Director, Chairman of the Board, and Chief Executive Officer of the Company; Age 76 | 1972 |
|
|
|
Bradley E. Mautner | Director, President and Chief Operating Officer of the Company; Age 55 | 1994 |
|
|
|
Michael D. Bennett | Vice President, Chief Financial Officer, Secretary and Treasurer; Age 66 | 1989 |
|
|
|
Timothy P. Murphy | Vice President; Age 61 | 2008 |
|
|
|
Fati A. Elgendy | President, Perma-Pipe; Age 62 | 1990 |
|
|
|
Robert A. Maffei | Vice President, Perma-Pipe; Age 63 | 1987 |
|
|
|
John Mark Foster | President, Midwesco Filter; Age 49 | 2008 |
|
|
|
Stephen C. Buck | President, Thermal Care; Age 62 | 2007 |
|
|
|
Edward A. Crylen | President, Midwesco Mechanical and Energy; Age 59 | 2006 |
All of the executive officers serve at the discretion of the Board of Directors.
David Unger
, Chairman of the Board and Chief Executive Officer since 1989; President from 1994 until 2004.
Bradley E. Mautner,
President and Chief Operating Officer since December 2004; Executive Vice President from December 2002 to December 2004;Vice President from December 1996 through December 2002; Director since 1994. Bradley E. Mautner is the son of Henry M. Mautner, a director.
Michael D. Bennett,
Chief Financial Officer and Vice President since August 1989.
Timothy P. Murphy,
Vice President of Human Resources ("HR") since May 2008. Prior to joining the Company, Mr. Murphy spent 28 years as a business consultant in roles including Principal Partner of Murphy & Hill Consulting, Managing Director of the Bay Area office of RHR, International and Consultant with YSC, Ltd. Mr. Murphy previously consulted to the Company from 1985 to 2008.
Fati A. Elgendy
, President and Chief Operating Officer of Perma-Pipe since March 1995.
Robert A. Maffei
, Vice President, Director of Sales and Marketing of Perma-Pipe since August 1996.
John Mark Foster,
President of Midwesco Filter since August, 2008. Mr. Foster previously worked at Saint-Gobain (PAR: SGO) in the areas of industrial/project engineering and plant management, followed by positions in market management, human resources and a series of North American and European general management assignments.
7
Stephen C. Buck,
Presidentof Thermal Care since October, 2007. Mr. Buck joined Thermal Care after a 22 year career most recently as President - Safety Products Group with Federal Signal Corporation (NYSE: FSS), which manufactures and markets products to industrial and municipal customers worldwide. Prior to his employment with Federal Signal Corporation, Mr. Buck held various positions in marketing and management for companies in computer hardware/software, oil field services and telecommunications.
Edward A. Crylen,
President and Chief Operating Officer of Midwesco Mechanical and Energy, since its formation in December 2006. From 1989 to December 2006, he was President of the Midwesco Mechanical and Energy, division of Midwesco, Inc. (affiliate) that was primarily owned by two principal stockholders who were also members of management.
Item 1A. RISK FACTORS
The Company's business, financial condition, results of operations and cash flows are subject to various risks, including, but not limited to those set forth below, which could cause actual results to vary materially from recent results or from anticipated future results. These risk factors should be considered together with information included elsewhere in this Annual Report on Form 10-K.
Economic Factors . All of the Company's businesses, directly or indirectly, serve markets that continue to be adversely impacted by the continuing global economic climate. Although the economy appears to be improving, the timing of economic recovery in the markets we serve remains uncertain. A further downturn in one or more of our significant markets could have a material adverse effect on the Company's business, results of operations or financial condition. Because economic and market conditions vary within the Company's business segments, the Company's future performance by business segment will also vary. In addition, the Company is exposed to fluctuations in currency exchange rates and commodity prices. Failure to successfully manage any of these risks could have an adverse impact on the Company's financial position, results of operations and cash flows.
Customer Access to Capital Funds. Uncertainty about current economic market conditions in the U.S. and globally poses risks that the Company's customers may postpone spending for capital improvement and maintenance projects in response to tighter credit markets or negative financial news, which could have a material negative effect on the demand for the Company's products. The adverse effect of the credit availability experienced by the Emirate of Dubai has significantly decelerated construction activity both in the United Arab Emirates ("U.A.E.") and across other GCC countries, negatively impacting sales volume at the U.A.E. facility.
International rapid growth. Potential international future rapid growth could place a significant strain on management, operations and financial systems as well as on the Company's ability to attract and retain competent employees. Future operating results depend on the Company's ability to continue to implement and improve operating and financial controls and management information systems. Failure to effectively manage growth could materially adversely impact the business, financial conditions and results of operations.
Changes in Government Policies and Laws, Worldwide Economic Conditions . International sales represent a significant portion of the Company's total sales and continued growth and profitability may involve further international expansion. The Company's financial results could be affected by changes in trade, monetary and fiscal policies, laws and regulations, or other activities of U.S. and non U.S. governments, agencies and similar organizations. These conditions include, but are not limited, to changes in a country's or region's economic or political conditions, trade regulations affecting production, pricing and marketing of products, local labor conditions and regulations, reduced protection of intellectual property rights in some countries, changes in the regulatory or legal environment, restrictions on currency exchange activities, burdensome taxes and tariffs and other trade barriers. International risks and uncertainties, including changing social and economic conditions as well as terrorism, political hostilities and war, could lead to reduced international sales and reduced profitability associated with such sales.
Government regulation. Demand for the Company's leak detection and location and secondary containment piping systems is driven primarily by government regulation with respect to hazardous waste. Laws such as the Federal
8
Resource Conservation and Recovery Act and standards such as the National Emission Standard for Hydrocarbon Airborne Particulates have increased the demand for the Company's leak detection and location and secondary containment piping systems. The Company's filtration products business, to a large extent, is dependent on governmental regulation of air pollution at the federal and state levels. The Company believes that continuing growth in the sale of filtration products and services will be materially dependent on continuing enforcement of environmental laws such as the Clean Air Act. Although changes in such environmental regulations could significantly alter the demand for the Company's products and services, the Company does not believe such a change is likely to decrease demand in the foreseeable future.
Financing. If there were an event of default under the Company's current revolving credit facility, the holders of the defaulted debt could cause all amounts outstanding with respect to that debt to be due and payable immediately. The Company cannot assure that the assets or cash flow would be sufficient to fully repay amounts due under any of the financing arrangements, if accelerated upon an event of default, or, that the Company would be able to repay, refinance or restructure the payments under any such arrangements. Complying with the covenants under the Company's revolving credit facility may limit management's discretion by restricting options such as:
· incurring additional debt;
· entering into transactions with affiliates;
· making investments or other restricted payments;
· paying dividends or make other distributions; and
· creating liens.
Any additional financing the Company may obtain could contain similar or more restrictive covenants. The Company's ability to comply with any covenants may be adversely affected by general economic conditions, political decisions, industry conditions and other events beyond management's control.
Competition. The businesses in which the Company is engaged are highly competitive. Many of the competitors are larger and have more resources than the Company. Additionally, many of the Company's products are also subject to competition from alternative technologies and alternative products. To the extent the Company relies upon a single source for key components of several of its products, the Company believes there are alternate sources available for such components; however, there can be no assurance that the interruption of supplies of such components would not have an adverse effect on the financial condition of the Company, and that the Company, if required to do so, would be able to negotiate agreements with alternative sources on acceptable terms.
Backlog. The Company defines backlog as the revenue value in dollars attributed to confirmed customer purchase orders that have not yet been recognized as revenues. However, by industry practice, orders may be canceled or modified at any time. When a customer cancels an order, the customer is responsible for all finished goods, all direct and indirect costs incurred, and also for a reasonable allowance for anticipated profits. No assurance can be given that these amounts will be recovered after cancellation. Any cancellation or delay in orders may result in lower than expected revenues.
Percentage-of-completion method of accounting. The Company measures and recognizes a portion of revenue and profits under the percentage-of-completion accounting methodology. This methodology allows revenue and profits to be recognized proportionally over the life of a contract by comparing the amount of the cost incurred to date against the total amount of cost expected to be incurred. The effect of revisions to revenue and total estimated cost is recorded when the amounts are known and can be reasonably estimated. These revisions can occur at any time and could be material. On a historical basis, management believes that reasonably reliable estimates of the progress towards completion on long-term contracts have been made. However, given the uncertainties associated with these types of contracts, it is possible for actual cost to vary from estimates previously made, which may result in reductions or reversals of previously recorded revenue and profits.
Regulatory and legal requirements . As a public company, the Company is required to comply with the reporting obligations of the Securities Exchange Act of 1934. Keeping informed of, and in compliance with, changing laws,
9
regulations and standards relating to corporate governance, public disclosure and accounting standards, including the Sarbanes-Oxley Act, Dodd-Frank Act, as well as new and proposed SEC regulations and accounting standards, has required an increased amount of management attention and external resources. Compliance with such requirements may result in increased general and administrative expenses and an increased allocation of management time and attention to compliance activities.
Item 1B. UNRESOLVED STAFF COMMENTS
None
Item 2. PROPERTIES
Piping Systems Business
Illinois | Owned production facilities and office space | 16,800 square feet |
Louisiana | Owned production facilities and leased land | 18,900 square feet |
Tennessee | Owned production facilities and office space | 131,800 square feet on approximately 23.5 acres |
Canada | Joint venture owned production facilities and office space | 87,160 square feet on approximately 128 acres |
India | Leased production facilities, office space and land | 227,390 square feet |
United Arab Emirates | Leased office space and land for production facilities | 117,900 square feet on 16 acres |
Saudi Arabia | Planned production facilities on leased land | 88,960 square feet |
Filtration Products Business
Illinois | Bolingbrook - owned production facilities and office space | 101,500 square feet on 5.5 acres |
| Cicero - owned former production facilities and office space currently idle | 130,700 square feet on 2.8 acres |
Virginia | Owned production facilities | 97,500 square feet on 5.0 acres |
| Leased production and office space | 67,000 square feet |
Denmark | Owned production facilities and office space | 69,800 square feet on 3.5 acres |
Industrial Process Cooling Equipment Business
Illinois | Owned production facilities and office space | 87,600 square feet on 8.1 acres |
Denmark | Owned production facilities and office space | 16,500 square feet |
The Company's principal executive offices, which occupy approximately 23,400 square feet of space in Niles, Illinois, are owned by the Company. The Company believes its properties and equipment are well maintained and in good operating condition and, that productive capacities will be adequate for present and currently anticipated needs.
The Company has four significant lease agreements as follows:
• | Planned production facilities and land of approximately 88,960 square feet in the Kingdom of Saudi Arabia is leased through 2030. |
10
• | Office Space and land for production facilities of approximately 117,900 square feet in the U.A.E. leased until June 30, 2012. |
• | Production facilities, office space and land of approximately 227,390 square feet in India are leased through October, 2012 and December, 2012, respectively. |
• | Production facilities and office space of approximately 67,000 square feet in Virginia are leased through July 31, 2012 and July 31, 2013, respectively. |
For further information, see Note 6 - Lease Information, in the Notes to Consolidated Financial Statements.
Item 3. LEGAL PROCEEDINGS
The Company had no pending litigation material to its business.
Item 4. RESERVED
PART II
Item 5.
MARKET FOR REGISTRANT'S COMMON EQUITY, RELATED STOCKHOLDER MATTERS AND ISSUER PURCHASES OF EQUITY SECURITIES
The Company's fiscal year ends on January 31. Years and balances described as 2010, 2009, 2008, 2007, and 2006 are the fiscal years ended January 31, 2011, 2010, 2009, 2008, and 2007, respectively.
The Company's Common Stock is traded on the Nasdaq Global Market under the symbol "MFRI". The following table sets forth, for the periods indicated, the high and low Common Stock sale prices as reported by the Nasdaq Global Market for 2010 and for 2009.
| High |
| Low |
|
2010 |
|
| ||
First Quarter | $7.21 | $6.16 | ||
Second Quarter | 6.95 |
| 5.86 |
|
Third Quarter | 8.76 |
| 6.25 |
|
Fourth Quarter | 11.00 |
| 7.68 |
|
2009 |
|
| ||
First Quarter | 6.43 |
| 4.85 |
|
Second Quarter | 8.04 |
| 5.45 |
|
Third Quarter | 7.43 |
| 6.00 |
|
Fourth Quarter | 7.32 |
| 6.38 |
|
As of March 15, 2011, there were 73 stockholders of record.
STOCK PRICE PERFORMANCE GRAPH
The Stock Price Performance Graph compares the yearly dollar change in the Company's cumulative total stockholder return on its Common Stock with the cumulative total returns of the Nasdaq Composite Index (the "Nasdaq Index"), the Russell 2000 Index and the S&P Smallcap 600 Index. The Company has selected these indices because they include companies with similar market capitalizations to the Company, as the most appropriate comparisons because the Company has three distinctly different business segments and no industry "peer" group is comparable to the Company. The comparison assumes $100.00 investments on January 31, 2006 in the Company's
11
Common Stock, the Nasdaq Index, the Russell 2000 Index, and the S&P Smallcap 600 Index and further assumes reinvestment of dividends.
COMPARISON OF 5 YEAR CUMULATIVE TOTAL RETURN*
Among MFRI, Inc., the NASDAQ Composite Index,
the S&P Smallcap 600 Index and the Russell 2000 Index
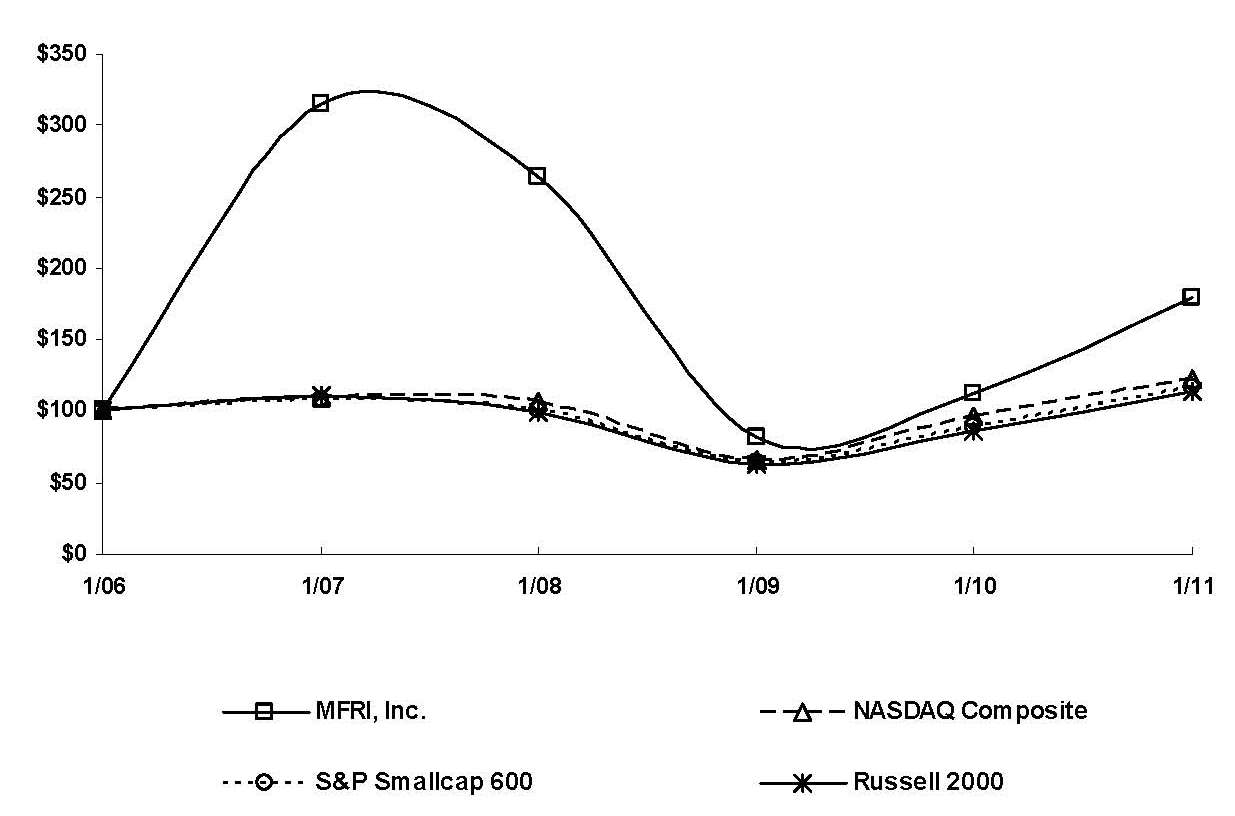
*$100 invested on 1/31/06 in stock or index, including reinvestment of dividends.
Copyright© 2011 S&P, a division of the McGraw-Hill Companies Inc. All rights reserved.
Fiscal year ending January 31, | 2006 |
| 2007 |
| 2008 |
| 2009 |
| 2010 |
| 2011 |
|
MFRI, Inc. | $100.00 | $315.70 | $264.13 | $81.82 | $112.73 | $180.08 | ||||||
NASDAQ Composite | 100.00 |
| 109.00 |
| 107.06 |
| 66.17 |
| 96.82 |
| 122.57 |
|
S&P Smallcap 600 | 100.00 |
| 108.41 |
| 100.73 |
| 63.73 |
| 88.56 |
| 115.95 |
|
Russell 2000 | 100.00 |
| 110.44 |
| 99.63 |
| 62.92 |
| 86.72 |
| 113.92 |
|
The Company has never declared or paid a cash dividend and does not anticipate paying cash dividends on its Common Stock in the foreseeable future. Management presently intends to retain all available funds for the development of the business and for use as working capital. Future dividend policy will depend upon the Company's earnings, capital requirements, financial condition and other relevant factors. The Company's line of credit agreement does not permit the payment of dividends. For further information, see Note 5 - Debt in the Notes to Consolidated Financial Statements.
Neither the Company nor any "affiliated purchaser" as defined in Rule 10b-18 purchased any shares of the Company's Common Stock during the period covered by this report. The Company has not made any sale of unregistered securities during the preceding three years.
The Transfer Agent and Registrar for the Common Shares is Continental Stock Transfer & Trust Company, 17 Battery Place, New York, New York 10004, (212) 509-4000.
12
Equity Compensation Plan Information
The following table provides information regarding the number of shares of Common Stock to be issued upon exercise of outstanding options, warrants and rights under the Company's equity compensation plans and the weighted average exercise price and number of shares of Common Stock remaining available for issuance under those plans as of January 31, 2011 .
Plan Category | Number of shares to be | Weighted-average exercise | Number of shares | ||
Equity compensation plans approved by stockholders | 777,441 |
| $11.88 | 479,157 |
|
Item 6. SELECTED FINANCIAL DATA
The following selected financial data for the Company for the years 2010, 2009, 2008, 2007, and 2006 are derived from the financial statements of the Company. The information set forth below should be read in conjunction with "Management's Discussion and Analysis of Financial Condition and Results of Operations" included herein in response to Item 7 and the consolidated financial statements and related notes included herein in response to Item 8.
Referenced as | 2010 |
| 2009 |
| 2008 |
| 2007 |
| 2006 |
|
|
|
| January 31, |
|
| |||||
(In thousands, except per share data) | 2011 |
| 2010 |
| 2009 |
| 2008 |
| 2007 |
|
Statements of Operations Data |
|
|
|
|
| |||||
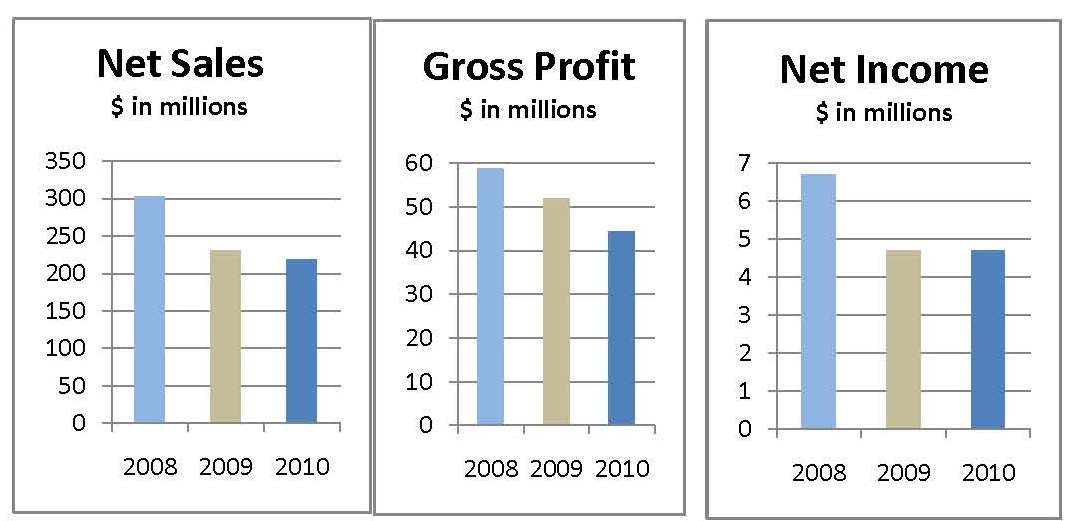
Net sales | $218,598 | $230,381 | $303,066 | $239,487 | $213,471 | |||||
Income from operations | 2,898 |
| 7,197 |
| 10,792 |
| 2,896 |
| 8,942 |
|
Net income (loss) | 4,510 |
| 4,671 |
| 6,689 |
| (298 | ) | 4,593 |
|
Net income (loss) per share - basic | 0.66 | 0.68 |
| 0.98 |
| (0.04 | ) | 0.86 |
| |
Net income (loss) per share - diluted | 0.66 | 0.68 |
| 0.98 |
| (0.04 | ) | 0.82 |
| |
|
|
|
|
|
| |||||
Balance Sheet Data |
|
|
|
|
| |||||
Total assets | $163,275 | $150,547 | $181,148 | $140,412 | $121,440 | |||||
Long-term debt (excluding capital | 36,009 |
| 33,877 |
| 41,763 |
| 19,556 |
| 29,606 |
|
Capital leases, less current portion | 183 |
| 195 |
| 327 |
| 152 |
| 238 |
|
Item 7.
MANAGEMENT'S DISCUSSION AND ANALYSIS ("MD&A") OF FINANCIAL CONDITION AND RESULTS OF OPERATIONS
The statements contained under the caption "Management's Discussion and Analysis of Financial Condition and Results of Operations" and other information contained elsewhere in this annual report, which can be identified by the use of forward-looking terminology such as "may," "will," "expect," "continue," "remains," "intend," "aim," "should," "prospects," "could," "future," "potential," "believes," "plans," "likely" and "probable" or the negative thereof or other variations thereon or comparable terminology, constitute "forward-looking statements" within the meaning of Section 27A of the Securities Act of 1933, as amended, and Section 21E of the Securities Exchange Act of 1934, as amended, and are subject to the safe harbors created thereby. These statements should be considered as subject to the many risks and uncertainties that exist in the Company's operations and business environment. Such risks and uncertainties could cause actual results to differ materially from those projected as a result of many factors, including but not limited to those under the heading Item 1A. Risk Factors.
13
CONSOLIDATED RESULTS OF OPERATIONS
Consolidated Backlog(In thousands ): | 1/31/2011 |
| 1/31/2010 |
|
Piping Systems | $46,452 | $48,770 | ||
Filtration Products | 19,935 |
| 21,400 |
|
Industrial Process Cooling Equipment | 4,332 |
| 2,380 |
|
Corporate and Other | 9,751 |
| 790 |
|
Total | $80,470 | $73,340 | ||
MFRI, Inc. is engaged in the manufacture and sale of products in three reportable business segments: piping systems, filtration products, and industrial process cooling equipment. Piping systems' domestic sales and earnings are seasonal, typically lower during the fourth and first quarters due to unfavorable weather for construction over much of North America, and are correspondingly higher during the second and third quarters. The Company website address is www.mfri.com .
The analysis presented below and discussed in more detail throughout the MD&A was organized to provide instructive information for understanding the business going forward. However, this discussion should be read in conjunction with the consolidated financial statements in Item 8 of this report, including the notes thereto. An overview of the segment results is provided in Note 1 - Business and Segment Information to the consolidated financial statements in Item 8 of this report.
Critical Accounting Policies and Estimates
MD&A discusses the audited consolidated financial statements, which have been prepared in accordance with accounting principles generally accepted in the United States of America. The preparation of these financial statements requires management to make estimates and assumptions that affect the reported amounts of assets and liabilities and the disclosure of contingent assets and liabilities at the date of the financial statements and the reported amounts of revenues and expenses during the reporting period.
Management believes that judgments and estimates related to the following critical accounting policies could materially affect the consolidated financial statements:
• | Revenue recognition |
• | Percentage of completion revenue recognition |
• | Inventory |
• | Income taxes |
• | Equity-based compensation |
• | Fair value of financial instruments |
In the fourth quarter of 2010, there were no changes in the above critical accounting policies.
14
All of the Company's businesses directly or indirectly serve markets that were adversely impacted by recent global economic conditions. Although improvement is expected, the timing of economic recovery in the markets we serve remains uncertain. A further downturn in one or more of our significant markets could have a material adverse effect on the Company's business, results of operations or financial condition. Because economic and market conditions vary within the Company's business segments, the Company's future performance by business segment will also vary. Should the current credit crisis and general economic recession continue, the Company could continue to experience a period of declining net sales, which could adversely impact the Company's results of operations. The adverse effect of the credit crisis experienced by the Emirate of Dubai has significantly decelerated construction activity both in the U.A.E. and across other GCC countries, negatively impacting sales volume at the U.A.E. facility.
2010 Compared to 2009
Net sales were $218.6 million in 2010 , a decrease of 5.1% from $230.4 million in 2009 . Year-to-date sales increased in the industrial process cooling and filtration products businesses while decreasing in the piping systems business. HVAC activity decreased in the current year; however, the backlog in 2010 increased to $9.8 million.
Gross profit of $44.5 million in 2010 decreased 14.4% from $51.9 million in 2009 . Gross margin was 20.3% compared to 22.5% in 2009 . Virtually the entire gross profit decline occurred in the piping systems, which decreased to $27.3 million in 2010 from $38.0 million in 2009 . The decrease in gross profit was attributed primarily to lower volume of the piping systems business in the U.A.E and a significant decrease in sales associated with the completion of the India pipeline project. The filtration products and industrial process cooling businesses each experienced an increase in their gross profits for the period, primarily due to increased sales volume, margin improvements and benefits from previous expense reduction initiatives.
General and administrative expenses decreased 12.0% to $27.9 million from $31.7 million. The reduction was mainly due to lower profit-based management incentive compensation expense, lower legal expenses, and reduced foreign exchange loss in the current year partially offset by an increase in deferred compensation expense.
Selling expenses increased 4.6% to $13.6 million from $13.0 million. Commission expense increased in the filtration products and industrial process cooling businesses, and trade show activity was higher in the piping systems business.
The Company's worldwide effective income tax rates for 2010 and 2009 were (72.1)% and 12.0% , respectively. For additional information, see the Income Tax section of the MD&A and see Note 7 - Income Taxes in the Notes to the Financial Statements.
Net income was level at $4.5 million. The fourth quarter produced a net loss of $1.5 million significantly better than the net loss of $5.8 million in the comparable prior-year's quarter. The filtration products and industrial process cooling businesses and the piping systems joint venture drove this improvement. Another factor was the look-through rules of Subpart F passive income which expired December 31, 2009, and then were retroactively extended in December 2010. In the second quarter, the Company had recorded $0.3 million in tax expense related to passive income that was reversed in the fourth quarter.
2009 Compared to 2008
Net sales were $230.4 million in 2009 , a decrease of 24.0% from $303.1 million in 2008, with decreased sales in the piping systems business, the filtration products business and the industrial process cooling business. This decrease was most pronounced in the fourth quarter. The 2009 fourth quarter compared to prior-year's quarter decreased 40.6%, with all segments and geographies down. In the piping systems business, district heating and cooling as well as oil and gas products experienced softer market conditions. Other contributing factors were the completion of the India pipeline project in the third quarter 2009 and the dramatically weaker market conditions in Dubai. The HVAC business also showed decreased sales as construction decisions for new projects have been deferred.
15
Gross profit of $51.9 million decreased 11.9% from $58.9 million. Gross margin rose to 22.5% from 19.5%.
General and administrative expenses increased 2.9% to $31.7 million from $30.8 million. The increase was mainly due to increased legal fees associated with collection activities in the U.A.E., foreign exchange loss, increased deferred compensation expense and increased stock compensation expense.
Selling expenses decreased 10.5% to $13.0 million from $14.6 million. This decrease was primarily driven by the industrial process cooling equipment business and the filtration product business, which had decreased commission expense from lower sales and a decline in compensation and related expenses due to staff reductions.
The Company's worldwide effective income tax rates for 2009 and 2008 were 12.0% and 17.0% , respectively.
Net income was $4.7 million in 2009, down from net income of $6.7 million in 2008 primarily due to decreased sales, the reasons summarized above and those discussed in more detail below. The fourth quarter produced a net loss of $5.8 million compared to a net loss of $0.8 million in the prior-year's quarter. The net loss in the fourth quarter of 2009 was higher than the same period in 2008 due to lower sales in all segments and compressed margins due to competitive factors.
Piping Systems
Piping systems' domestic sales and earnings are seasonal, typically lower during the fourth and first quarters due to unfavorable weather for construction over much of North America, and are correspondingly higher during the second and third quarters.
|
|
|
| % (Decrease) Increase | ||||||
(In thousands) | 2010 |
| 2009 |
| 2008 |
| 2010 |
| 2009 |
|
Net sales | $104,559 | $111,665 | $151,792 | (6.4 | )% | (26.4 | )% | |||
|
|
|
|
|
| |||||
Gross profit | 27,303 | 37,974 | 37,871 | (28.1 | )% | 0.3 | % | |||
Percentage of net sales | 26.1 | % | 34.0 | % | 24.9 | % |
|
| ||
|
|
|
|
|
| |||||
Income from operations | 13,831 | 22,399 | 24,037 | (38.3 | )% | (6.8 | )% | |||
Percentage of net sales | 13.2 | % | 20.1 | % | 15.8 | % |
|
| ||
2010 Compared to 2009
Despite significant sales drops in the Middle East and India, net sales of $104.6 million decreased only 6.4% from $111.7 million, in the prior-year, attributed primarily to a rise in sales in both domestic heating and cooling, and oil and gas products. The insulation of pipe for a crude oil pipeline project in India began full production in the third quarter 2008 and contributed to the increase in sales of $11.3 million in 2009 when the Company had successfully completed the production on the India pipeline project. Significantly smaller India pipeline sales followed in 2010.
Gross margin decreased to 26.1% of net sales from 34.0% of net sales in the prior-year attributed primarily to
the reduced volume in the U.A.E. and the significantly lower sales associated with the India pipeline project in the current year.
General and administrative expense decreased to $10.3 million or 9.9% of net sales in 2010 from $12.8 million or 11.4% of net sales in 2009. This decrease was primarily due to less profit-based management incentive expense, lower legal fees, and staff reductions in the U.A.E.
Selling expense increased to $3.1 million or 3.0% of net sales in 2010 from $2.8 million or 2.5% of net sales in
16
2009. The increase was mainly due to advertising and trade show activities, partially offset by a decrease in commission expense.
2009 Compared to 2008
Net sales of $111.7 million decreased 26.4% from $151.8 million, attributed primarily to a drop in sales in both international and domestic heating and cooling, as well as oil and gas products due to the economic slowdown both in the U.S. and in the U.A.E. The insulation of pipe for a crude oil pipeline project in India began full production in the third quarter 2008 and contributed to sales in 2009. As of October 31, 2009, the Company had completed the India pipeline project, and has received additional orders for at least 150 kilometers (93 miles), which began in May of 2010.
The adverse effect of the credit crisis experienced by the Emirate of Dubai has significantly decelerated construction activity both in the U.A.E. and across other GCC countries, negatively impacting sales volume at the U.A.E. facility.
Gross margin as a percent of net sales increased to 34.0% in 2009 from 24.9% in 2008, primarily due to production efficiencies in the international operations and the favorable adjustment of cost estimates associated with the completion of the India pipeline project. Gross profit in the U.A.E. also improved due to decreased raw material costs.
General and administrative expense increased to $12.8 million or 11.4% of net sales in 2009 from $11.0 million or 7.2% of net sales in 2008. The increase in general and administrative expenses was primarily due to increased legal fees associated with collection activities in the U.A.E., increased profit-based management incentive expense and foreign exchange loss.
Selling expense remained level at $2.8 million in 2009. As a percentage of sale, selling expenses decreased to 2.5% of net sales in 2009 from 1.9% of net sales in 2008.
Filtration Products
The timing of large orders can have a material effect on net sales and gross profit from period to period. Pricing on large orders was extremely competitive and therefore resulted in relatively low gross margins in all periods.
The Company's filtration products business is dependent on government regulation of air quality at the federal and state levels. The Company believes that growth in the sale of its filtration products and services will be materially dependent on continued enforcement of environmental laws such as the Clean Air Act. Although there can be no assurance what the ultimate effect of the Clean Air Act will be on the Company's filtration products business, the Company believes the Clean Air Act is likely to have a positive long-term effect on demand for the Company's filtration products and services.
|
|
|
| % Increase (Decrease) | ||||||
(In thousands) | 2010 |
| 2009 |
| 2008 |
| 2010 |
| 2009 |
|
Net sales | $85,133 | $80,819 | $105,390 | 5.3 | % | (23.3 | )% | |||
|
|
|
|
|
| |||||
Gross profit | 10,394 | 6,733 | 11,424 | 54.4 | % | (41.1 | )% | |||
Percentage of net sales | 12.2 | % | 8.3 | % | 10.8 | % |
|
| ||
|
|
|
|
|
| |||||
Loss from operations | (1,335) | (5,290) | (2,936) | 74.8 | % | (80.2 | )% | |||
Percentage of net sales | (1.6 | )% | (6.5 | )% | (2.8 | )% |
|
| ||
17
2010 Compared to 2009
Net sales increased 5.3% to $85.1 million in 2010 from $80.8 million in 2009. Improving business conditions in filtration markets led to increased sales.
Gross margin increased to 12.2% of net sales from 8.3% of net sales in 2009 primarily due to cost containment efforts, improved product mix and the benefit of higher volume leveraged against reduced fixed costs.
In July 2010, the Company announced that the facility in South Africa would close in the third quarter. Expenses
related to the closing were approximately $577 thousand. These expenses are included in cost of goods sold, general and administrative and selling expenses.
General and administrative expenses decreased to $4.8 million or 5.6% of net sales from $5.2 million or 6.4% of net sales in 2009. The decrease is mainly driven by lower foreign exchange loss in 2010 and lower professional expenses partially offset by closing costs related to the facility in South Africa.
Selling expenses increased to $7.0 million from $6.8 million in 2009 primarily as a result of higher commissions for external agents and additional advertising costs. Selling expenses as a percentage of net sales decreased to 8.2% in 2010 from 8.5% of net sales in 2009.
2009 Compared to 2008
Net sales decreased 23.3% to $80.8 million in 2009 from $105.4 million in 2008. Sales declines were the result of lower market demand across all filtration products. Customers delayed their purchases and curtailing infrastructure projects in response to the economic climate.
Gross margin as a percent of net sales decreased to 8.3% in 2009 from 10.8% in 2008, primarily due to the lower pricing driven by excess capacity in the filter bag markets.
General and administrative expenses increased to $5.2 million or 6.4% of net sales from $5.1 million or 4.8% of net sales in 2008. The increase was primarily due to additional professional costs, higher bank fees, and foreign currency exchange loss. These factors were partially offset by personnel reductions.
Selling expense decreased to $6.8 million in 2009 from $7.6 million in 2008. The dollar decrease in selling expense was primarily due to fewer selling personnel, decreased commission expense related to lower sales and decreased advertising expense. Selling expenses as a percentage of net sales increased to 8.5% from 7.2% in the prior-year due to the effect of lower sales.
Industrial Process Cooling Equipment
|
|
|
| % Increase (Decrease) | ||||||
(In thousands) | 2010 |
| 2009 |
| 2008 |
| 2010 |
| 2009 |
|
Net sales | $26,220 | $21,818 | $31,738 | 20.2 | % | (31.3 | )% | |||
|
|
|
|
|
| |||||
Gross profit | 7,044 | 4,977 | 7,919 | 41.5 | % | (37.2 | )% | |||
Percentage of net sales | 26.9 | % | 22.8 | % | 25.0 | % |
|
| ||
|
|
|
|
|
| |||||
Income (loss) from operations | 295 | (1,935) | (1,765) | 115.2 | % | (9.6 | )% | |||
Percentage of net sales | 1.1 | % | (8.9 | )% | (5.6 | )% |
|
| ||
2010 Compared to 2009
Net sales of $26.2 million increased 20.2% from $21.8 million in 2009 due to improving business conditions in the
18
plastic and industrial market sectors.
Gross margin increased to 26.9% of net sales in 2010 from 22.8% of net sales in 2009 primarily due to product mix, lower warranty costs and higher sales volume to spread fixed overhead expenses.
General and administrative expenses decreased to $3.2 million or 12.3% of net sales from $3.5 million or 16.2%
of net sales in 2009. The change in spending was a result of lower compensation expenses and fewer professional expenses partially offset by increased incentive compensation expense.
Selling expenses increased to $3.5 million in 2010 from $3.4 million in 2009. This was primarily driven by higher commission expense due to the increase in net sales partially offset by salary reductions and staff reductions. Selling expense as a percentage of net sales decreased to 13.5% from 15.5% of net sales in 2009.
2009 Compared to 2008
Net sales decreased 31.3% to $21.8 million in 2009 from $31.7 million in 2008. The decrease was primarily due to lower demand for products in all market sectors.
Gross margin decreased to 22.8% in 2009 from 25.0% in 2008, primarily due to lower sales volume and an unfavorable product mix.
General and administrative expense decreased to $3.5 million in 2009 from $4.4 million in 2008. The change in spending was the result of reduced outside product development services and lower compensation and related expenses due to workforce reductions. General and administrative expenses as a percentage of net sales increased to 16.2% from 14.0% in the prior-year due to the effect of lower sales.
Selling expense decreased to $3.4 million in 2009 from $4.1 million in 2009. This was primarily driven by decreased commission expense from lower sales, and a decline in compensation and related expenses due to workforce reductions. Selling expense as a percentage of net sales increased to 15.5% from 13.0% in the prior-year due to the effect of lower sales.
Corporate and Other
2010 Compared to 2009
Net sales of $2.7 million in 2010 decreased from $16.1 million in 2009 due to decreased construction activity. During 2009, the Company worked off existing backlog. New construction has been adversely affected by the current economy. In 2010, the Company obtained new orders for approximately $11.3 million.
General and administrative expenses decreased 5.9% to $9.6 million from $10.2 million in 2009. The decrease was due mainly to lower profit-based management incentive compensation expense, lower SOX404 compliance expense and decreased stock compensation expense partially offset by increased deferred compensation expense. General and administrative expenses as a percentage of consolidated net sales remained the same in 2009 and 2010.
Interest expense decreased to $1.9 million from $2.1 million in 2009 primarily due to lower borrowings and interest rates. Interest income increased to $0.7 million from $0.2 million due to interest earned overseas in the piping systems business.
2009 Compared to 2008
Net sales increased to $16.1 million in 2009 from $14.1 million in 2008 related to the HVAC systems business.
General and administrative expense decreased 0.4% to $10.2 million in 2009 from $10.3 million in 2008, but increased as a percentage of consolidated net sales to 4.4% in 2009 from 3.4% in 2008. The dollar decrease was
19
due mainly to lower profit-based management incentive expense and lower expenses incurred to comply with SOX404, partially offset by increased deferred compensation expense, increased stock compensation expense, and hiring.
Interest expense decreased 32.5% to $1.9 million in 2009 from $2.8 million, net of capitalized interest, in 2008 primarily due to decreased borrowings and lower interest rates.
INCOME TAXES
The Company's worldwide effective income tax rates were (72.2)% , 12.0% , and 17.0% in 2010, 2009, and 2008 , respectively. The effective tax rate in the periods presented was the result of the mix of income earned in multiple tax jurisdictions with various income tax rates. Income earned in the U.A.E. is not subject to any local country income tax. The effective tax rates in 2010 and 2009 were less than the statutory U.S. federal income tax rate, mainly due to the large portion of income earned in the U.A.E.
Several valuation allowances impacted the effective tax rates. In 2010, the Company closed its operations in South Africa and released intercompany liabilities. Related income was offset by existing NOLs for which a prior valuation allowance had been previously provided. This release of liabilities increased the federal NOL. During 2009, the Company established a partial valuation allowance of $0.8 million for the $1.3 million research and development credits, as the Company no longer believed that it was more likely than not that a portion of the research and development credits would be utilized within the next five years.
During 2010, the Company reevaluated the need for a valuation allowance against deferred tax assets and determined that no additional reserve was needed. As of January 31, 2010 and January 31, 2011 , no valuation allowance was deemed necessary on the federal NOL. For additional information, see Note 7 - Income Taxes in the Notes to the Financial Statements.
As of January 31, 2011 , the Company had undistributed earnings of foreign subsidiaries for which deferred taxes have not been provided. The Company intends and has the ability to reinvest these earnings for the foreseeable future outside the U.S. If these amounts were distributed to the U.S., in the form of dividends or otherwise, the Company would be subject to additional U.S. income taxes. Determination of the amount of unrecognized deferred income tax liabilities on these earnings is not practicable because such liability, if any, is dependent on circumstances existing if and when remittance occurs.
A reconciliation of the effective income tax rate to the U.S. Statutory tax rate is as follows:
| 2010 |
| 2009 |
|
Statutory tax rate | 34.0 | % | 34.0 | % |
Differences in foreign tax rate | (60.7 | )% | (54.9 | )% |
Valuation allowance for foreign and state NOLs | (20.8 | )% | 5.4 | % |
State taxes, net of federal benefit | (16.6 | )% | 1.7 | % |
Nontaxable income from the Canadian joint venture | (12.8 | )% | (0.9 | )% |
Cash Surrender Value of deferred compensation plan | (4.9 | )% | (0.3 | )% |
All other, net expense | 9.6 | % | 12.9 | % |
Research tax credit, net of valuation allowance | - | % | 14.1 | % |
Effective tax rate | (72.2 | )% | 12.0 | % |
For further information, see Note 7 - Income Taxes in the Notes to Consolidated Financial Statements.
LIQUIDITY AND CAPITAL RESOURCES
Cash and cash equivalents as of January 31, 2011 were $16.7 million as compared to $8.1 million at January 31, 2010 . The Company's working capital was $58.8 million at January 31, 2011 compared to $53.3 million at
20
January 31, 2010 . Cash provided by operations in 2010 was $8.7 million compared to $34.6 million at January 31, 2010 . Compared to January 31, 2010 trade accounts payable increased $4.8 million, primarily due to the purchase of inventory for production in the filtration business.
Net cash used in investing activities in 2010 included $3.9 million for capital expenditures, primarily for machinery and equipment in the piping systems business. The Company estimates that capital expenditures for 2011 will be approximately $13.9 million, of which the Company may finance capital expenditures through real estate mortgages, equipment financing loans, internally generated funds and its revolving line of credit. The majority of such expenditures relates to foreign growth within the piping systems business.
Debt totaled $39.3 million at January 31, 2011 , an increase of $2.1 million since January 31, 2010 . Net cash provided by financing activities was $3.4 million. Other long-term liabilities of $3.3 million were composed primarily of deferred compensation and accrued pension cost.
The following table summarizes the Company's estimated contractual obligations at January 31, 2011 .
(In thousands) |
| January 31, |
| |||||||||||
Contractual Obligations | Total |
| 2012 |
| 2013 |
| 2014 |
| 2015 |
| 2016 |
| Thereafter |
|
Revolving line domestic (1) | $18,252 | $0 | $0 | $18,252 | $0 | $0 | $0 | |||||||
Mortgages (2) | 19,266 |
| 1,458 |
| 1,160 |
| 932 |
| 935 |
| 934 | 13,847 |
| |
Revolving line foreign | 2,412 |
| 710 |
| 1,312 |
| 15 |
| 15 |
| 15 | 345 |
| |
Term loans (3) | 7,365 |
| 1,723 |
| 1,493 |
| 1,787 |
| 184 |
| 89 | 2,089 |
| |
Subtotal | 47,295 |
| 3,891 |
| 3,965 |
| 20,986 |
| 1,134 |
| 1,038 |
| 16,281 |
|
Capitalized lease obligations | 460 |
| 254 |
| 102 |
| 45 |
| 31 |
| 28 |
| - |
|
Operating lease obligations (4) | 6,500 |
| 1,534 |
| 1,119 |
| 555 |
| 366 |
| 247 | 2,679 |
| |
Projected pension contributions (5) | 3,855 |
| 590 |
| 318 |
| 328 |
| 347 |
| 361 | 1,911 |
| |
Deferred compensation (6) | 5,138 |
| 109 |
| 531 |
| 99 |
| 99 |
| 99 |
| 4,201 |
|
Employment agreements (7) | 101 |
| - |
| - |
| - |
| - |
| - |
| 101 |
|
Uncertain tax position obligations (8) | 1,016 |
| - |
| - |
| - |
| - |
| - |
| 1,016 |
|
Total | $64,365 | $6,378 | $6,035 | $22,013 | $1,977 | $1,773 | $26,189 | |||||||
Notes to Contractual Obligations Table
(1) Interest obligations exclude floating rate interest on debt payable under the domestic revolving line of credit. Based on the amount of such debt at January 31, 2011 , and the weighted average interest rates of 3.16% on that debt at that date, such interest was being incurred at an annual rate of approximately $0.6 million.
(2) Scheduled maturities, including interest.
(3) Term loan obligations exclude floating rate interest on term loan with a January 31, 2011 balance of $1.5 million. Based on the amount of such debt as of January 31, 2011 , and the weighted average interest rates of 2.92% on that debt at that date, such interest was being incurred at an annual rate of approximately $49,421 .
(4) Minimum contractual amounts, assuming no changes in variable expenses.
(5) Includes expected employer contributions for fiscal year ending January 31, 2012 and estimated future benefit payments reflecting expected future service.
(6) Non-qualified deferred compensation plan - The Company has deferred compensation agreements with key employees. Vesting is based on years of service. Life insurance contracts have been purchased which may be used to fund the Company's obligation under these agreements. Payment estimates calculated by the third party administrator, have been included.
(7) Refer to the proxy statement for a description of compensation plans for Named Executive Officers.
(8) Refer to Note 7 - Income Taxes in the Notes to Consolidated Financial Statements for a description of the uncertain tax position obligations.
21
Financing
On July 11, 2002, the Company entered into a secured loan and security agreement with a financial institution ("Loan Agreement"). Under the terms of the Loan Agreement as amended, which matures on November 30, 2013, the Company can borrow up to $38.0 million, subject to borrowing base and other requirements, under a revolving line of credit. The Loan Agreement covenants restrict debt, liens, investments, do not permit payment of dividends, and require attainment of certain levels of profitability and cash flows. At January 31, 2011 , the Company was in compliance with all covenants under the Loan Agreement. Interest rates are based on options selected by the Company as follows: (a) a margin in effect plus a prime rate; or (b) a margin in effect plus the LIBOR rate for the corresponding interest period. At January 31, 2011 , the prime rate was 3.25% , the LIBOR rate was 0.375% , and the margins added to the prime rate and the LIBOR rate, which are determined each quarter based on the applicable financial statement ratio, were 0.5 and 2.25 percentage points, respectively. Monthly interest payments were made during the years ended January 31, 2011 and 2010 . As of January 31, 2011 , the Company had borrowed $18.3 million and had $7.0 million available to it under the revolving line of credit. In addition, $0.1 million of availability was used under the Loan Agreement primarily to support letters of credit to guarantee amounts committed for inventory purchases. The Loan Agreement provides that all payments by the Company's customers are deposited in a bank account from which all funds may only be used to pay the debt under the Loan Agreement. At January 31, 2011 , the amount of such restricted cash was $1.0 million. Cash required for operations is provided by draw-downs on the line of credit.
The Company also has credit arrangements used by its Denmark and U.A.E. subsidiaries. These credit arrangements are in the form of overdraft facilities at rates competitive in the countries in which the Company operates. At January 31, 2011 , borrowings under these credit arrangements totaled $2.2 million; an additional $7.5 million remained unused.
CRITICAL ACCOUNTING ESTIMATES AND POLICIES
Reclassifications. Reclassifications were made to prior-year financial statements to conform to the current-year presentations.
Revenue recognition. The Company recognizes revenues including shipping and handling charges billed to customers, when all the following criteria are met: (i) persuasive evidence of an arrangement exists, (ii) the seller's price to the buyer is fixed or determinable, and (iii) collectability is reasonably assured. All subsidiaries of the Company, except as noted below, recognize revenues upon shipment or delivery of goods or services when title and risk of loss pass to customers.
Percentage of completion method revenue recognition. All divisions recognize revenues under the above stated revenue recognition policy except for sizable complex contracts that require periodic recognition of income. For these contracts, the Company uses the "percentage of completion" accounting method. Under this approach, income is recognized in each reporting period based on the status of the uncompleted contracts and the current estimates of costs to complete. The choice of accounting method is made at the time the contract is received based on the expected length and complexity of the project. The percentage of completion is determined by the relationship of costs incurred to the total estimated costs of the contract. Provisions are made for estimated losses on uncompleted contracts in the period in which such losses are determined. Changes in job performance, job conditions, and estimated profitability, including those arising from contract penalty provisions and final contract settlements, may result in revisions to costs and income. Such revisions are recognized in the period in which they are determined. Claims for additional compensation due the Company are recognized in contract revenues when realization is probable and the amount can be reliably estimated.
Inventories. Inventories are stated at the lower of cost or market. Cost is determined using the first-in, first-out method for all inventories.
Income Taxes. Deferred income taxes have been provided for temporary differences arising from differences in the basis of assets and liabilities for tax and financial reporting purposes. Deferred income taxes on temporary
22
differences have been recorded at the current tax rate. The Company assesses its deferred tax assets for realizability at each reporting period.
The Company recognizes the financial statement benefit of a tax position only after determining that the relevant tax authority would more likely than not sustain the position following an audit. For tax positions meeting the more likely than not threshold, the amount recognized in the financial statements is the largest benefit that has a greater than 50 percent likelihood of being realized upon ultimate settlement with the relevant tax authority.
Equity-based compensation. Stock compensation expense for employee equity awards is recognized ratably over the requisite service period of the award. The Black-Scholes option-pricing model is utilized to estimate the fair value of awards. Determining the fair value of stock options using the Black-Scholes model requires judgment, including estimates for (1) risk-free interest rate - an estimate based on the yield of zero-coupon treasury securities with a maturity equal to the expected life of the option; (2) expected volatility - an estimate based on the historical volatility of the Company's Common Stock; and (3) expected life of the option - an estimate based on historical experience including the effect of employee terminations.
Fair value of financial instruments . The carrying values of cash and cash equivalents, accounts receivable and accounts payable are based upon reasonable estimates of their fair value due to their short-term nature. The carrying value of the cash surrender value of life insurance policies approximated fair value and was based on the market value of the underlying investments, which may increase or decrease due to fluctuations in the overall financial markets. The carrying amount of the Company's short-term debt, revolving line of credit and long-term debt approximate fair value because the majority of the amounts outstanding accrue interest at variable rates.
The Company entered into an interest rate swap agreement to reduce its exposure to market risks from changing interest rates under the revolving credit agreement. Any differences paid or received on the interest rate swap agreements are recognized as adjustments to interest expense over the life of the swap, thereby adjusting the effective interest rate on the underlying obligation.
New accounting pronouncements. See "Financial Statements - Notes to Condensed Consolidated Financial Statements," Note 2 - "New Accounting Pronouncements," for information regarding new accounting pronouncements.
Item 7A.
QUANTITATIVE AND QUALITATIVE DISCLOSURES ABOUT MARKET RISK
The Company is subject to market risk associated with changes in foreign currency exchange rates, interest rates and commodity prices. Foreign currency exchange rate risk is mitigated through maintenance of local production facilities in the markets served, often, though not always, invoicing customers in the same currency as the source of the products and use of foreign currency denominated debt in Denmark, India, and the U.A.E. At times, the Company has attempted to mitigate interest rate risk by maintaining a balance of fixed and floating rate debt.
The Company may enter into an interest rate swap agreement from time to time to reduce its exposure to market risks from changing interest rates under the revolving credit agreement. Under the terms of swap agreements, the Company agrees to exchange, at specified intervals, the difference between fixed and variable interest amounts calculated by reference to the notional principal amount. Any differences paid or received on the interest rate swap agreements are recognized as adjustments to interest expense over the life of the swap, thereby adjusting the effective interest rate on the underlying obligation. Financial instruments are not held or issued for trading purposes.
At January 31, 2011 one interest rate swap agreement was in effect with a notional value of $9.0 million maturing in 2013. The swap agreement, which reduces the exposure to market risks from changing interest rates, exchanges the variable rate to fixed interest rate payments of 2.23% plus LIBOR margin. For additional information, see Note 12 - Fair Value of Financial Instruments in the Notes to Consolidated Financial Statements.
23
A hypothetical ten percent change in market interest rates over the next year would increase or decrease interest on the Company's floating rate debt instruments by approximately $17,800 .
Commodity price risk is the possibility of higher or lower costs due to changes in the prices of commodities, such as ferrous alloys which the Company uses in the production of piping systems. The Company attempts to mitigate such risks by obtaining price commitments from its commodity suppliers and, when it appears appropriate, purchasing quantities in advance of likely price increases.
Item 8.
FINANCIAL STATEMENTS AND SUPPLEMENTARY DATA
The consolidated financial statements of the Company for each of the three years in the periods ended as of January 31, 2011, 2010 and 2009 and the notes thereto are set forth elsewhere herein.
Item 9.
CHANGES IN AND DISAGREEMENTS WITH ACCOUNTANTS ON ACCOUNTING AND FINANCIAL DISCLOSURE
None.
Item 9A.
CONTROLS AND PROCEDURES
The Chief Executive Officer and Chief Financial Officer have evaluated the effectiveness of the company's disclosure controls and procedures (as defined in Rule 13a-15(e) and 15d-15(e) under the Securities Exchange Act of 1934, as amended) as of January 31, 2011 . Based on that evaluation, the Chief Executive Officer and Chief Financial Officer concluded that the Company's disclosure controls and procedures were effective as of as of January 31, 2011 to ensure that information required to be disclosed in the reports that are filed or submitted under the Securities Exchange Act of 1934 is recorded, processed, summarized and reported, within the time periods specified in the SEC's rules and forms and is accumulated and communicated to the issuer's management, including the principal executive and financial officers, to allow timely decisions regarding required disclosure.
Management's Report on Internal Control Over Financial Reporting. The Company's management is responsible for establishing and maintaining adequate internal control over financial reporting, as such term is defined in Rule 13a-15(f) under the Exchange Act. As required by Rule 13a-15(c) under the Exchange Act, MFRI's management carried out an evaluation, with the participation o f the Chief Executive Officer and Chief Financial Officer, of the effectiveness of its internal control over financial reporting as of the end of the last fiscal year. The framework on which such evaluation was based is contained in the report entitled "Internal Control-Integrated Framework" issued by the Committee of Sponsoring Organizations of the Treadway Commission (the "COSO Report").
The Company's system of internal control over financial reporting is designed to provide reasonable assurance regarding the reliability of financial reporting and the preparation of financial statements for external purposes in accordance with generally accepted accounting principles. Because of its inherent limitations, internal control over financial reporting may not prevent or detect misstatements. Also, projections of any evaluation of effectiveness to future periods are subject to the risk that controls may become inadequate because of changes in conditions, or that the degree of compliance with the policies or procedures may deteriorate.
Based on its assessment, management has concluded that the Company has maintained effective internal control over financial reporting as of January 31, 2011 , based on criteria in the COSO Report.
Change in Internal Controls. There has been no change in internal control over financial reporting that occurred during the last fiscal year that has materially affected, or is reasonably likely to materially affect, internal control over financial reporting.
Item 9B.
OTHER INFORMATION
None
24
PART III
Item 10.
DIRECTORS, EXECUTIVE OFFICERS AND CORPORATE GOVERNANCE
Information with respect to this item is incorporated herein by reference to the Company's definitive proxy statement for the 2011 annual meeting of stockholders.
Information with respect to executive officers of the Company is included in Item 1, Part I hereof under the caption "Executive Officers of the Registrant".
Item 11.
EXECUTIVE COMPENSATION
Information with respect to this item is incorporated herein by reference to the Company's definitive proxy statement for the 2011 annual meeting of stockholders.
Item 12.
SECURITY OWNERSHIP OF CERTAIN BENEFICIAL OWNERS AND MANAGEMENT
AND RELATED STOCKHOLDER MATTERS
Information with respect to this item is incorporated herein by reference to the Company's definitive proxy statement for the 2011 annual meeting of stockholders.
Item 13.
CERTAIN RELATIONSHIPS AND RELATED TRANSACTIONS, AND DIRECTOR INDEPENDENCE
Information with respect to this item is incorporated herein by reference to the Company's definitive proxy statement for the 2011 annual meeting of stockholders.
Item 14.
PRINCIPAL ACCOUNTANT FEES AND SERVICES
Information with respect to this item is incorporated herein by reference to the Company's definitive proxy statement for the 2011 annual meeting of stockholders.
PART IV
Item 15.
EXHIBITS AND FINANCIAL STATEMENT SCHEDULES
a. List of documents filed as part of this report:
(1) Financial Statements - Consolidated Financial Statements of the Company
Refer to Part II, Item 8 of this report.
(2) Financial Statement Schedules
Schedule II - Valuation and Qualifying Accounts
b. Exhibits: The exhibits, as listed in the Exhibit Index included herein, are submitted as a separate section of this report.
c. The response to this portion of Item 15 is submitted under 15a (2) above.
25

REPORT OF INDEPENDENT REGISTERED PUBLIC ACCOUNTING FIRM
Board of Directors and Shareholders
MFRI Inc. and Subsidiaries
We have audited the accompanying consolidated balance sheets of MFRI Inc. (a Delaware corporation) and Subsidiaries as of January 31, 2011 and 2010, and the related consolidated statements of operations, stockholders' equity, comprehensive income (loss), and cash flows for each of the three years in the period ended January 31, 2011. These financial statements are the responsibility of the Company's management. Our responsibility is to express an opinion on these financial statements based on our audits.
We conducted our audits in accordance with the standards of the Public Company Accounting Oversight Board (United States). Those standards require that we plan and perform the audit to obtain reasonable assurance about whether the financial statements are free of material misstatement. The Company is not required to have, nor were we engaged to perform an audit of its internal control over financial reporting. Our audit included consideration of internal control over financial reporting as a basis for designing audit procedures that are appropriate in the circumstances, but not for the purpose of expressing an opinion on the effectiveness of the Company's internal control over financial reporting. Accordingly, we express no such opinion. An audit includes examining, on a test basis, evidence supporting the amounts and disclosures in the financial statements, assessing the accounting principles used and significant estimates made by management, as well as evaluating the overall financial statement presentation. We believe that our audits provide a reasonable basis for our opinion.
In our opinion, the consolidated financial statements referred to above present fairly, in all material respects, the financial position of MFRI Inc. and Subsidiaries as of January 31, 2011 and 2010, and the results of their operations and their cash flows for each of the three years in the period ended January 31, 2011 in conformity with accounting principles generally accepted in the United States of America.
/s/ GRANT THORNTON LLP
Chicago, Illinois
April 14, 2011
26
MFRI, INC. AND SUBSIDIARIES
CONSOLIDATED STATEMENTS OF OPERATIONS
Referenced as | 2010 |
| 2009 |
| 2008 |
|
| Fiscal Year Ended January 31, | |||||
(In thousands, except per share data) | 2011 |
| 2010 |
| 2009 |
|
|
|
|
| |||
Net sales | $218,598 | $230,381 | $303,066 | |||
Cost of sales | 174,140 |
| 178,435 |
| 244,118 |
|
Gross profit | 44,458 |
| 51,946 |
| 58,948 |
|
|
|
|
| |||
Operating expenses: |
|
|
| |||
General and administrative expense | 27,926 |
| 31,720 |
| 30,818 |
|
Selling expense | 13,634 |
| 13,029 |
| 14,550 |
|
Impairment of goodwill | - |
| - |
| 2,788 |
|
Total operating expenses | 41,560 |
| 44,749 |
| 48,156 |
|
|
|
|
| |||
Income from operations | 2,898 |
| 7,197 |
| 10,792 |
|
|
|
|
| |||
Income from joint ventures | 983 |
| 21 |
| 104 |
|
|
|
|
| |||
Interest expense, net | 1,261 |
| 1,912 |
| 2,834 |
|
Income before income taxes | 2,620 |
| 5,306 |
| 8,062 |
|
|
|
|
| |||
Income tax (benefit) expense | (1,890 | ) | 635 |
| 1,373 |
|
|
|
|
| |||
Net income | $4,510 | $4,671 | $6,689 | |||
|
|
|
| |||
Weighted average number of common shares outstanding |
|
|
| |||
Basic | 6,842 |
| 6,824 |
| 6,797 |
|
Diluted | 6,850 |
| 6,855 |
| 6,853 |
|
Earnings per share
|
|
|
| |||
Basic | $0.66 | $0.68 | $0.98 | |||
Diluted | 0.66 |
| 0.68 |
| 0.98 |
|
See accompanying Notes to Consolidated Financial Statements.
27
MFRI, INC. AND SUBSIDIARIES
CONSOLIDATED BALANCE SHEETS
| January 31, | |||
(In thousands, except per share data) | 2011 | 2010 | ||
ASSETS |
|
| ||
Current assets |
|
| ||
Cash and cash equivalents | $16,718 | $8,067 | ||
Restricted cash | 984 |
| 641 |
|
Trade accounts receivable, less allowance for doubtful accounts of $346 at January 31, 2011 and $379 at January 31, 2010 | 36,634 |
| 36,157 |
|
Inventories, net | 35,509 |
| 35,349 |
|
Prepaid expenses and other current assets | 4,575 |
| 4,037 |
|
Deferred tax assets - current | 2,389 |
| 3,127 |
|
Costs and estimated earnings in excess of billings on uncompleted contracts | 2,055 |
| 2,769 |
|
Income tax receivable | 204 |
| 1,414 |
|
Total current assets | 99,068 |
| 91,561 |
|
Property, plant and equipment, net of accumulated depreciation | 43,655 |
| 45,812 |
|
Other assets |
|
| ||
Deferred tax assets - long-term | 8,470 |
| 4,187 |
|
Note receivable from joint venture | 4,270 |
| 4,003 |
|
Investments in joint ventures | 3,078 |
| 2,491 |
|
Cash surrender value of deferred compensation plan | 2,869 |
| 2,097 |
|
Other assets | 1,605 |
| 1,559 |
|
Patents, net of accumulated amortization | 260 |
| 238 |
|
Total other assets | 20,552 |
| 14,575 |
|
Total assets | $163,275 | $151,948 | ||
LIABILITIES AND STOCKHOLDERS' EQUITY |
|
| ||
Current liabilities |
|
| ||
Trade accounts payable | $19,296 | $13,024 | ||
Commissions and management incentives payable | 6,867 |
| 9,895 |
|
Accrued compensation and payroll taxes | 4,332 |
| 3,812 |
|
Other accrued liabilities | 3,166 |
| 4,116 |
|
Current maturities of long-term debt | 3,082 |
| 3,118 |
|
Customers' deposits | 1,913 |
| 3,521 |
|
Billings in excess of costs and estimated earnings on uncompleted contracts | 1,597 |
| 796 |
|
Total current liabilities | 40,253 |
| 38,282 |
|
|
|
| ||
Long-term liabilities |
|
| ||
Long-term debt, less current maturities | 36,192 |
| 34,072 |
|
Deferred compensation liabilities | 5,138 |
| 3,892 |
|
Other long-term liabilities | 3,271 |
| 3,140 |
|
Total long-term liabilities | 44,601 |
| 41,104 |
|
Stockholders' equity |
|
| ||
Common stock, $.01 par value, authorized 50,000 shares; 6,851 issued and outstanding at January 31, 2011 and 6,836 issued and outstanding at January 31, 2010 | 69 |
| 68 |
|
Additional paid-in capital | 49,055 |
| 48,086 |
|
Retained earnings | 28,104 |
| 23,594 |
|
Accumulated other comprehensive income | 1,193 |
| 814 |
|
Total stockholders' equity | 78,421 |
| 72,562 |
|
Total liabilities and stockholders' equity | $163,275 | $151,948 | ||
See accompanying Notes to Consolidated Financial Statements.
28
MFRI, INC. AND SUBSIDIARIES
CONSOLIDATED STATEMENTS OF STOCKHOLDERS' EQUITY
(In thousands) | Common Stock | Additional Paid-in Capital | Retained Earnings | Accumulated Other Comprehensive Income (Loss) | Total Comprehensive Income (Loss) | |||||||
Shares | Amount | |||||||||||
Balances at February 1, 2008 | 6,787 |
| $68 | $46,551 | $12,234 | $927 | $232 | |||||
|
|
|
|
|
|
| ||||||
Net income |
|
|
| 6,689 |
|
| 6,689 |
| ||||
Stock options exercised | 28 |
|
| 83 |
|
|
|
| ||||
Stock-based compensation expense |
|
| 745 |
|
|
|
| |||||
Tax expense from stock options exercised |
|
| (457 | ) |
|
|
| |||||
Pension liability adjustment (net of taxes of $749) |
|
|
|
| (435 | ) | (435 | ) | ||||
Foreign currency translation adjustment |
|
|
|
| (2,227 | ) | (2,227 | ) | ||||
Balances at January 31, 2009 | 6,815 |
| $68 | $46,922 | $18,923 | $(1,735) | $4,027 | |||||
|
|
|
|
|
|
| ||||||
Net income |
|
|
| 4,671 |
|
| 4,671 |
| ||||
Stock options exercised | 21 |
|
| 61 |
|
|
|
| ||||
Stock-based compensation expense |
|
| 1,076 |
|
|
|
| |||||
Excess tax benefit from stock options exercised |
|
| 27 |
|
|
|
| |||||
Pension liability adjustment (net of taxes of $649) |
|
|
|
| 164 |
| 164 |
| ||||
Foreign currency translation adjustment |
|
|
|
| 2,385 |
| 2,385 |
| ||||
Balances at January 31, 2010 | 6,836 |
| $68 | $48,086 | $23,594 | $814 | $7,220 | |||||
|
|
|
|
|
|
| ||||||
Net income |
|
|
| 4,510 |
|
| 4,510 |
| ||||
Stock options exercised | 15 |
| 1 |
| 45 |
|
|
|
| |||
Stock-based compensation expense |
|
| 895 |
|
|
|
| |||||
Excess tax benefit from stock options exercised |
|
| 29 |
|
|
|
| |||||
Interest Rate Swap (net of taxes of $43) |
|
|
|
| (334 | ) | (334 | ) | ||||
Pension liability adjustment (net of taxes of $525) |
|
|
|
| 203 |
| 203 |
| ||||
Foreign currency translation adjustment |
|
|
|
| 510 |
| 510 |
| ||||
Balances at January 31, 2011 | 6,851 |
| $69 | $49,055 | $28,104 | $1,193 | $4,889 | |||||
See accompanying Notes to Consolidated Financial Statements.
29
MFRI, INC. AND SUBSIDIARIES
CONSOLIDATED STATEMENTS OF CASH FLOWS
| January 31, | |||||
(In thousands) | 2011 |
| 2010 |
| 2009 |
|
Operating activities |
|
|
| |||
Net income | $4,510 | $4,671 | $6,689 | |||
Adjustments to reconcile net income to net cash flows provided by operating activities |
|
|
| |||
Depreciation and amortization | 6,070 |
| 6,338 |
| 5,776 |
|
Deferred tax benefit | (3,914 | ) | (1,231 | ) | (71 | ) |
Income from joint ventures | (983 | ) | (21 | ) | (104 | ) |
Stock-based compensation expense | 895 |
| 1,076 |
| 745 |
|
Cash surrender value of deferred compensation plan | (377 | ) | (814 | ) | 300 |
|
(Loss) gain on sale of fixed assets | 69 |
| 60 |
| (108 | ) |
Provision for uncollectible accounts | (39 | ) | (130 | ) | 114 |
|
Impairment of Goodwill | - |
| - |
| 2,788 |
|
Changes in operating assets and liabilities |
|
|
| |||
Accounts payable | 4,820 |
| (9,765 | ) | 4,995 |
|
Accrued compensation and payroll taxes | (2,583 | ) | (296 | ) | 4,556 |
|
Inventories | 1,706 |
| 15,273 |
| (8,297 | ) |
Customers' deposits | (1,607 | ) | (4,921 | ) | 4,121 |
|
Income taxes receivable and payable | 1,214 |
| (2,085 | ) | 1,174 |
|
Prepaid expenses and other current assets | (1,408 | ) | 395 |
| (5,910 | ) |
Accounts receivable, net | (449 | ) | 24,309 |
| (21,131 | ) |
Other assets and liabilities | 763 |
| 1,728 |
| 2,198 |
|
Net cash provided by (used in) operating activities | 8,687 |
| 34,587 |
| (2,165 | ) |
|
|
|
| |||
Investing activities |
|
|
| |||
Additions to property, plant and equipment | (4,030 | ) | (5,262 | ) | (18,464 | ) |
Proceeds from sales of property and equipment | 96 |
| 17 |
| - |
|
Investment in joint ventures | - |
| (1,960 | ) | 297 |
|
Net cash used in investing activities | (3,934 | ) | (7,205 | ) | (18,167 | ) |
|
|
|
| |||
Financing activities |
|
|
| |||
Borrowings | 151,258 |
| 188,179 |
| 130,668 |
|
Payment of debt | (148,904 | ) | (206,287 | ) | (108,878 | ) |
Net borrowings (payment) | 2,354 |
| (18,108 | ) | 21,790 |
|
Increase (decrease) in drafts payable | 1,166 |
| (4,725 | ) | 192 |
|
Payment on capitalized lease obligations | (198 | ) | (170 | ) | (53 | ) |
Stock options exercised | 45 |
| 61 |
| 83 |
|
Tax benefit (expense) of stock options exercised | 29 |
| 27 |
| (457 | ) |
Net cash provided by (used in) financing activities | 3,396 |
| (22,915 | ) | 21,555 |
|
|
|
|
| |||
Effect of exchange rate changes on cash and cash equivalents | 502 |
| 865 |
| (1,153 | ) |
Net increase in cash and cash equivalents | 8,651 |
| 5,332 |
| 70 |
|
Cash and cash equivalents - beginning of period | 8,067 |
| 2,735 |
| 2,665 |
|
Cash and cash equivalents - end of period | $16,718 | $8,067 | $2,735 | |||
Supplemental cash flow information |
|
|
| |||
Cash paid for |
|
|
| |||
Interest expense, net | $1,992 | $1,993 | $2,733 | |||
Income taxes paid, net | 1,108 |
| 4,199 |
| 131 |
|
See accompanying Notes to Consolidated Financial Statements.
30
MFRI, INC. AND SUBSIDIARIES
NOTES TO CONSOLIDATED FINANCIAL STATEMENTS
YEARS ENDED
January 31, 2011, 2010 and 2009
(Tabular dollars in thousands, except per share data)
Note 1 - Business and Segment Information
MFRI, Inc. ("MFRI", the "Company", or the "Registrant") was incorporated in Delaware on October 12, 1993. MFRI is engaged in the manufacture and sale of products in three distinct business segments: piping systems, filtration products and industrial process cooling equipment.
Fiscal Year. The Company's fiscal year ends on January 31. Years and balances described as 2010, 2009, and 2008 are the fiscal years ended January 31, 2011, 2010 and 2009 , respectively.
Nature of Business. The piping systems business engineers, designs, manufactures and sells specialty piping and leak detection and location systems. This segment's specialty piping systems include (i) industrial and secondary containment piping systems for transporting chemicals, waste streams and petroleum liquids, (ii) insulated and jacketed district heating and cooling piping systems for efficient energy distribution to multiple locations from central energy plants, and (iii) oil and gas gathering flow and long lines for oil and mineral transportation. The piping systems business' leak detection and location systems are sold as part of many of its piping systems products, and on a stand-alone basis, to monitor areas where fluid intrusion may contaminate the environment, endanger personal safety, cause a fire hazard, impair essential services or damage equipment or property. The filtration products business manufactures and sells a wide variety of filter elements for use in industrial air filtration systems and particulate collection systems. Air filtration systems are used in a wide variety of industries to limit particulate emissions, primarily to comply with environmental regulations. The filtration products business markets air filtration related products and accessories, and provides maintenance services, consisting primarily of dust collector inspection, filter cleaning and filter replacement. The industrial process cooling equipment business engineers, designs, manufactures and sells industrial process cooling equipment, including chillers, cooling towers, plant circulating systems, and related accessories for use in industrial process applications. Corporate and other includes the installation of HVAC systems, that is not sufficiently large to constitute a reportable segment. The Company's products are sold both within the U.S. and internationally.
MFRI's reportable segments are strategic businesses that offer different products and services. Each is managed separately based on fundamental operating differences. Each strategic business was acquired as a unit and management at the time of acquisition was retained. The Company evaluates performance based on gross profit and income or loss from operations.
31
The following is information relevant to the Company's business segments:
| 2010 |
| 2009 |
| 2008 |
|
Net sales |
|
|
| |||
Piping Systems | $104,559 | $111,665 | $151,792 | |||
Filtration Products | 85,133 | 80,819 |
| 105,390 |
| |
Industrial Process Cooling Equipment | 26,220 | 21,818 |
| 31,738 |
| |
Corporate and Other | 2,686 | 16,079 |
| 14,146 |
| |
Total net sales | $218,598 | $230,381 | $303,066 | |||
Gross profit (loss) |
|
|
|
|
|
|
Piping Systems | $27,303 | $37,974 | $37,871 | |||
Filtration Products | 10,394 |
| 6,733 |
| 11,424 |
|
Industrial Process Cooling Equipment | 7,044 |
| 4,977 |
| 7,919 |
|
Corporate and Other | (283 | ) | 2,262 |
| 1,734 |
|
Total gross profit | $44,458 | $51,946 | $58,948 | |||
Income (loss) from operations |
|
|
|
|
|
|
Piping Systems | $13,831 | $22,399 | $24,037 | |||
Filtration Products | (1,335 | ) | (5,290 | ) | (2,936 | ) |
Industrial Process Cooling Equipment | 295 |
| (1,935 | ) | (1,765 | ) |
Corporate and Other | (9,893 | ) | (7,977 | ) | (8,544 | ) |
Total income from operations | $2,898 | $7,197 | $10,792 | |||
Income (loss) before income taxes |
|
|
|
|
|
|
Piping Systems | $14,814 | $22,420 | $24,141 | |||
Filtration Products | (1,335 | ) | (5,290 | ) | (2,936 | ) |
Industrial Process Cooling Equipment | 295 |
| (1,935 | ) | (1,765 | ) |
Corporate and Other | (11,154 | ) | (9,889 | ) | (11,378 | ) |
Total income before income taxes | $2,620 | $5,306 | $8,062 | |||
Segment assets |
|
|
|
|
|
|
Piping Systems | $77,371 | $76,557 | $87,803 | |||
Filtration Products | 56,427 |
| 50,957 |
| 64,865 |
|
Industrial Process Cooling Equipment | 10,545 |
| 8,447 |
| 10,527 |
|
Corporate and Other | 18,932 |
| 15,987 |
| 17,953 |
|
Total segment assets | $163,275 | $151,948 | $181,148 | |||
Capital expenditures |
|
|
|
|
|
|
Piping Systems | $2,578 | $3,716 | $6,641 | |||
Filtration Products | 1,218 |
| 1,127 |
| 10,925 |
|
Industrial Process Cooling Equipment | 34 |
| 32 |
| 73 |
|
Corporate and Other | 200 |
| 387 |
| 825 |
|
Total capital expenditures | $4,030 | $5,262 | $18,464 | |||
Depreciation and amortization |
|
|
|
|
|
|
Piping Systems | $3,401 | $3,561 | $3,210 | |||
Filtration Products | 1,822 |
| 1,939 |
| 1,626 |
|
Industrial Process Cooling Equipment | 167 |
| 225 |
| 368 |
|
Corporate and Other | 680 |
| 613 |
| 572 |
|
Total depreciation and amortization | $6,070 | $6,338 | $5,776 | |||
32
| 2010 |
| 2009 |
| 2008 |
|
Impairment of goodwill |
|
|
|
|
|
|
Filtration Products | $0 | $0 | $1,688 | |||
Industrial Process Cooling Equipment | - |
| - |
| 1,100 |
|
Total impairment of goodwill | $0 | $0 | $2,788 | |||
Geographic Information. Net sales are attributed to a geographic area based on the destination of the product shipment. Long-lived assets are based on the physical location of the assets and consist of property, plant and equipment used in the generation of revenues in the geographic area.
| 2010 |
| 2009 |
| 2008 |
|
Net sales |
|
|
| |||
United States | $144,336 | $150,871 | $197,274 | |||
Middle East | 31,927 |
| 32,150 |
| 52,193 |
|
Europe | 17,286 |
| 17,410 |
| 24,915 |
|
India | 9,772 |
| 16,110 |
| 13,801 |
|
Canada | 6,936 |
| 5,500 |
| 4,742 |
|
All other Asia | 3,809 |
| 2,490 |
| 3,715 |
|
Mexico, South America, Central America and the Caribbean | 3,336 |
| 3,195 |
| 4,879 |
|
Africa | 817 |
| 2,360 |
| 999 |
|
Other | 379 |
| 295 |
| 548 |
|
Total net sales | $218,598 | $230,381 | $303,066 | |||
|
|
|
| |||
Long-lived assets |
|
|
| |||
United States | $31,375 | $30,851 | $30,892 | |||
Middle East | 6,050 |
| 7,478 |
| 6,871 |
|
Denmark | 4,585 |
| 4,909 |
| 4,959 |
|
India | 1,645 |
| 2,360 |
| 4,363 |
|
South Africa | - |
| 214 |
| 171 |
|
Total long-lived assets | $43,655 | $45,812 | $47,256 | |||
Note 2 - Significant Accounting Policies
Use of Estimates. The preparation of financial statements in conformity with U.S. generally accepted accounting principles requires management to make estimates and assumptions that affect the reported amounts of assets and liabilities and disclosures of contingent assets and liabilities at the date of the financial statements, and the reported amounts of revenues and expenses during the reporting period. Actual results could differ from those estimates.
Revenue Recognition. The Company recognizes revenues including shipping and handling charges billed to customers, when all the following criteria are met: (i) persuasive evidence of an arrangement exists, (ii) the seller's price to the buyer is fixed or determinable, and (iii) collectability is reasonably assured. All subsidiaries of the Company, except as noted below, recognize revenues upon shipment or delivery of goods or services when title and risk of loss pass to customers.
Percentage of Completion Revenue Recognition. All divisions recognize revenues under the above stated revenue recognition policy except for sizable complex contracts - that require periodic recognition of income. For these contracts, the Company uses the "percentage of completion" accounting method. Under this approach, income is recognized in each reporting period based on the status of the uncompleted contracts and the current estimates of costs to complete. The choice of accounting method is made at the time the contract is received based on the expected length and complexity of the project. The percentage of completion is determined by the relationship of
33
costs incurred to the total estimated costs of the contract. Provisions are made for estimated losses on uncompleted contracts in the period in which such losses are determined. Changes in job performance, job conditions, and estimated profitability, including those arising from contract penalty provisions and final contract settlements, may result in revisions to costs and income. Such revisions are recognized in the period in which they are determined. Claims for additional compensation due the Company are recognized in contract revenues when realization is probable and the amount can be reliably estimated.
Shipping and Handling. Shipping and handling costs are included in cost of goods sold, and the amounts invoiced to customers relating to shipping and handling are included in net sales.
Operating Cycle. The length of the piping systems business contracts vary, but are typically less than one year. The Company includes in current assets and liabilities amounts realizable and payable in the normal course of contract completion unless completion of such contracts extends significantly beyond one year. The Company's other businesses do not have an operating cycle beyond one year.
Principles of Consolidation. The consolidated financial statements include the accounts of the Company and its domestic and foreign subsidiaries, all of which are wholly owned. All significant intercompany balances and transactions have been eliminated.
Translation of Foreign Currency. Assets and liabilities of consolidated foreign subsidiaries are translated into U.S. dollars at exchange rates in effect at year-end. Revenues and expenses are translated at average exchange rates prevailing during the year. Gains or losses on foreign currency transactions and the related tax effects are reflected in net income. The resulting translation adjustments are included in stockholders' equity as part of accumulated comprehensive income.
Contingencies. The Company is subject to various legal proceedings and claims that arise in the ordinary course of business, including those involving environmental, tax, product liability and general liability claims. The Company accrues for such liabilities when it is probable that future costs will be incurred and such costs can be reasonably estimated. Such accruals are based on developments to date, the Company's estimates of the outcomes of these matters, and its experience in contesting, litigating and settling other similar matters. The Company does not currently anticipate the amount of any ultimate liability with respect to these matters will materially affect the Company's financial position, liquidity or future operations.
Cash and Cash Equivalents. All highly liquid investments with a maturity of three months or less when purchased are considered to be cash equivalents. The balance is primarily cash and cash equivalents at the foreign subsidiaries. The Company has not experienced any losses as a result of its cash concentration. Consequently, no significant concentration of credit risk is considered to exist. Accounts payable included drafts payable of $3.8 million and $2.6 million as of January 31, 2011 and 2010 , respectively.
Restricted Cash. The Loan Agreement requires that all payments by the Company's customers are deposited in a bank account from which all funds may only be used to pay the debt under the Loan Agreement.
Accounts Receivable. The majority of the Company's accounts receivable are due from geographically dispersed contractors and manufacturing companies. Credit is extended based on an evaluation of a customer's financial condition, including the availability of credit insurance. In the U.S. collateral is not generally required. In the U.A.E., letters of credit are obtained for substantially all orders. Accounts receivable are due within various time periods specified in the terms applicable to the specific customer and are stated at amounts due from customers net of an allowance for claims and doubtful accounts. The allowance for doubtful accounts was calculated using a percentage of sales method based upon collection history and an estimate of uncollectible accounts. Management may exercise its judgment in adjusting the provision as a consequence of known items, such as current economic factors and credit trends. Accounts receivable adjustments are recorded against the allowance for doubtful accounts.
Concentration of Credit Risk. The Company has a broad customer base doing business in all regions of the U.S. as
34
well as other areas in the world. In the fiscal years ended January 31, 2011, 2010 and 2009 , no customer accounted for 10% or more of the Company's net sales.
Other Comprehensive Income (Loss). Other comprehensive income (loss) is defined as the change in equity resulting from transactions from non-owner sources. Other comprehensive income (loss) consisted of the following: minimum pension liability, foreign currency translation, and interest rate swap.
Pension Plan. The Winchester facility has a defined benefit plan covering its hourly employees. The benefits are based on fixed amounts multiplied by years of service of retired participants. The Company engages outside actuaries to calculate its obligations and costs. The funding policy is to contribute such amounts as are necessary to provide for benefits attributed to service to date and those expected to be earned in the future. The amounts contributed to the plan are sufficient to meet the minimum funding requirements set forth in the Employee Retirement Income Security Act of 1974.
Inventories. Inventories are stated at the lower of cost or market. Cost is determined using the first-in, first-out method for all inventories.
Inventories | 2010 |
| 2009 |
|
Raw materials | $29,780 | $28,477 | ||
Work in process | 1,963 |
| 2,679 |
|
Finished goods | 4,940 |
| 5,444 |
|
Subtotal | 36,683 |
| 36,600 |
|
Less allowances | 1,174 |
| 1,251 |
|
Inventories, net | $35,509 | $35,349 | ||
Long-Lived Assets. Property, plant and equipment are stated at cost. Interest is capitalized in connection with the construction of facilities and amortized over the asset's estimated useful life. Interest of $0.2 million was capitalized during 2008. Long-lived assets are reviewed for possible impairment whenever events indicate that the carrying amount of such assets may not be recoverable. If such a review indicates impairment, the carrying amount of such assets is reduced to an estimated fair value.
Depreciation is computed using the straight-line method over the estimated useful lives of the assets, which range from three to 30 years. Leasehold improvements are depreciated over the remaining life of the lease or its useful life whichever is shorter. Amortization of assets under capital leases is included in depreciation and amortization.
Property, plant and equipment | 2010 |
| 2009 |
|
Land, buildings and improvements | $33,460 | $32,867 | ||
Machinery and equipment | 46,138 |
| 43,996 |
|
Furniture, office equipment and computer systems | 13,229 |
| 12,706 |
|
Transportation equipment | 486 |
| 561 |
|
Subtotal | 93,313 |
| 90,130 |
|
Less accumulated depreciation and amortization | 49,658 |
| 44,318 |
|
Property, plant and equipment, net | $43,655 | $45,812 | ||
Goodwill Impairment. The goodwill impairment assessment performed for 2008 identified the effect of economic conditions at that time, on both the risks considered and the calculations made. The assessment considered uncertainty about economic conditions that could pose risks to the Company's customer demand in the U.S. and globally, and incorporated discount rates that were higher than prior years in calculating the present value of estimated future cash flows. Based on its completed assessment of estimated future cash flows, the Company concluded that as of January 31, 2009, the goodwill of $1.7 million related to the filtration products business and $1.1 million related to the industrial process cooling equipment business were both fully impaired. As a result, the
35
Company recorded a noncash charge of $2.8 million during the fourth quarter of 2008 related to the impairment of goodwill.
Other Intangible Assets with Definite Lives. The Company owns several patents covering the features of its piping and electronic leak detection systems. The patents are not material either individually or in the aggregate to the overall business because the Company believes sales in the business would not be materially reduced if patent protection were not available. Patents are capitalized and amortized on a straight-line basis over a period not to exceed the legal lives of the patents. Gross patents in thousands were $2,430 and $2,400 as of January 31, 2011 and 2010 . Accumulated amortization in thousands was $2,169 and $2,162 as of January 31, 2011 and 2010 , respectively. Future amortizations over the next five years ending January 31 will be $62,100 in 2011 , $31,700 in 2012 , $28,400 in 2013 , $25,900 in 2014 , $22,700 in 2015 , and $89,600 thereafter.
Investment in Joint Ventures. In October 2009, the Company invested $5.88 million, which consisted of $1.96 million for a 49% interest and $3.92 million for a note receivable, in a Canadian joint venture with The Bayou Companies, Inc., a subsidiary of Insituform Technologies, Inc. This joint venture completed an acquisition of Garneau, Inc's pipe coating and insulation facility and associated assets located in Camrose, Alberta, Canada, which provides the Company the opportunity to participate in the growing oil sands market.
In April 2002, the piping system business and two unrelated companies formed an equally owned joint venture to more efficiently market their complementary thermal insulation products and systems for use in undersea pipeline flow assurance projects worldwide. The joint venture agreement expired on December 31, 2009.
The Company accounts for the investments in joint ventures using the equity method. The financial results are included in the Company's consolidated financial statements.
| 2010 | 2009 | 2008 |
Share of income from joint ventures | $983 | $21 | $104 |
.
Research and development expenses consist of materials, salaries and related expenses of engineering personnel, and outside services related to product development projects. Research and development costs are expensed as incurred. Research and development expense was $1.8 million in 2010 , $2.5 million in 2009 and $2.5 million in 2008 .
Income Taxes. Deferred income taxes have been provided for temporary differences arising from differences in the basis of assets and liabilities for tax and financial reporting purposes. Deferred income taxes on temporary differences have been recorded at the current tax rate. The Company assesses its deferred tax assets for realizability at each reporting period.
The Company recognizes the financial statement benefit of a tax position only after determining that the relevant tax authority would more likely than not sustain the position following an audit. For tax positions meeting the more likely than not threshold, the amount recognized in the financial statements is the largest benefit that has a greater than 50 percent likelihood of being realized upon ultimate settlement with the relevant tax authority. For further information, see Note 7 - Income Taxes in the Notes to Consolidated Financial Statements.
Net Income Per Common Share. Earnings per share ("EPS") are computed by dividing net income by the weighted average number of common shares outstanding (basic) plus all potentially dilutive common shares outstanding during the year (diluted).
36
Basic weighted average number of common shares outstanding | 2010 |
| 2009 |
| 2008 |
|
Basic weighted average number of common shares outstanding | 6,842 |
| 6,824 |
| 6,797 |
|
Dilutive effect of stock options | 8 |
| 31 |
| 56 |
|
Weighted average number of common shares outstanding assuming full dilution | 6,850 |
| 6,855 |
| 6,853 |
|
|
|
|
| |||
Weighted average number of stock options not included in the computation of diluted EPS of common stock because the option exercise prices exceeded the average market prices | 385 |
| 571 |
| 292 |
|
Expired or canceled options during the year | 50 |
| 27 |
| 20 |
|
Stock options with an exercise price below the average stock price | 441 |
| 110 |
| 258 |
|
In 2010 , a total of 15,038 stock options were exercised.
Equity-based Compensation. Stock compensation expense for employee equity awards are recognized ratably over the requisite service period of the award. The Black-Scholes option-pricing model is utilized to estimate the fair value of awards. Determining the fair value of stock options using the Black-Scholes model requires judgment, including estimates for (1) risk-free interest rate - an estimate based on the yield of zero-coupon treasury securities with a maturity equal to the expected life of the option; (2) expected volatility - an estimate based on the historical volatility of the Company's Common Stock; and (3) expected life of the option - an estimate based on historical experience including the effect of employee terminations. If any of these assumptions differ significantly from actual, stock-based compensation expense could be impacted.
Fair Value of Financial Instruments . The carrying values of cash and cash equivalents, accounts receivable and accounts payable are reasonable estimates of their fair value due to their short-term nature. The carrying amount of the Company's short-term debt, revolving line of credit and long-term debt approximate fair value because the majority of the amounts outstanding accrue interest at variable rates.
The Company entered into an interest rate swap agreement to reduce its exposure to market risks from changing interest rates under the revolving credit agreement. Any differences paid or received on the interest rate swap agreements are recognized as adjustments to interest expense over the life of the swap, thereby adjusting the effective interest rate on the underlying obligation.
Reclassifications. Reclassifications were made to prior-year financial statements to conform to the current-year presentations.
New Accounting Pronouncements . In July 2010, the Financial Accounting Standards Board, ("FASB") issued Accounting Standards Update, or ASU, 2010-20 "Disclosures about the Credit Quality of Financing Receivables and Allowance for Credit Losses." The new disclosure guidance expands the existing requirements. The enhanced disclosures provide information on the nature of credit risk in a company's financing of receivables, how that risk is analyzed in determining the related allowance for credit losses, and changes to the allowance during the reporting period. The new disclosures became effective for the Company's interim and annual reporting periods ending after December 15, 2010. The Company adopted the provisions of this ASU as of January 31, 2011 and the provisions did not have a material impact on the Company's consolidated financial statements.
In March 2010, the FASB issued ASU 2010-11, "Derivatives and Hedging - Scope Exception Related to Embedded Credit Derivatives". The amendments are effective for each reporting entity at the beginning of its first fiscal quarter beginning after June 15, 2010. The Company adopted the provisions of ASU 2010-11 as of August 1, 2010 and the provisions did not have a material impact on the Company's consolidated financial statements.
Other accounting standards that have been issued by the FASB or other standards-setting bodies that do not require adoption until a future date are not expected to have a material impact on the consolidated financial statements upon adoption.
37
Note 3 - Retention
Retention receivable is the amount withheld by a customer until a contract is completed. Retention receivables of $2.2 million and $6.5 million were included in the balance of trade accounts receivable as of January 31, 2011 and 2010 , respectively.
Retention payable is the amount withheld by the Company until a contract is completed. Retention payables of $0.2 million and $0.5 million were included in the balance of trade accounts payable as of January 31, 2011 and 2010 , respectively.
Note 4 - Costs and Estimated Earnings on Uncompleted Contracts | 2010 |
| 2009 |
|
Costs incurred on uncompleted contracts | $40,039 | $44,797 | ||
Estimated earnings | 6,668 |
| 10,186 |
|
Earned revenue | 46,707 |
| 54,983 |
|
Less billings to date | 46,249 |
| 52,652 |
|
Total | $458 | $2,331 | ||
Balance sheet classification |
|
| ||
Costs and estimated earnings in excess of billings on uncompleted contracts | $2,055 | $3,127 | ||
Billings in excess of costs and estimated earnings on uncompleted contracts | (1,597 | ) | (796 | ) |
Total | $458 | $2,331 | ||
Note 5 - Debt
Debt | 2010 |
| 2009 |
|
Revolving line domestic | $18,252 | $17,725 | ||
Mortgage notes | 11,864 |
| 12,080 |
|
Revolving lines foreign | 2,180 |
| 1,830 |
|
Term loans | 6,562 |
| 5,159 |
|
Capitalized lease obligations (See Note 6 - Lease Information) | 416 |
| 396 |
|
Total debt | 39,274 |
| 37,190 |
|
Less current maturities | 3,082 |
| 3,118 |
|
Total long-term debt | $36,192 | $34,072 | ||
The following table summarizes the Company's scheduled maturities at January 31,:
| Total | 2012 | 2013 | 2014 | 2015 | 2016 | Thereafter |
Revolving line domestic | $18,252 | $0 | $0 | $18,252 | $0 | $0 | $0 |
Mortgages | 11,864 | 752 | 503 | 286 | 303 | 320 | 9,700 |
Revolving line foreign | 2,180 | 609 | 1,241 | 0 | 0 | 0 | 330 |
Term loans | 6,562 | 1,488 | 1,313 | 1,667 | 94 | 0 | 2,000 |
Capitalized lease obligations | 416 | 233 | 91 | 38 | 27 | 27 | 0 |
Total | $39,274 | $3,082 | $3,148 | $20,243 | $424 | $347 | $12,030 |
On July 11, 2002, the Company entered into a secured loan and security agreement with a financial institution ("Loan Agreement"). Under the terms of the Loan Agreement as amended, which matures on November 30, 2013, the Company can borrow up to $38.0 million, subject to borrowing base and other requirements, under a revolving line of credit. The Loan Agreement covenants restrict debt, liens, and investments, do not permit payment of dividends, and require attainment of certain levels of profitability and cash flows. At January 31, 2011 , the
38
Company was in compliance with all covenants under the Loan Agreement. Interest rates are based on options selected by the Company as follows: (a) a margin in effect plus a prime rate; or (b) a margin in effect plus the LIBOR rate for the corresponding interest period. At January 31, 2011 , the prime rate was 3.25% and the margins added to the prime rate and the LIBOR rate, which are determined each quarter based on the applicable financial statement ratio, were 0.5 and 2.25 percentage points, respectively. Monthly interest payments were made during the year ended January 31, 2011 and 2010 . As of January 31, 2011 , the Company had borrowed $18.3 million and had $7.0 million available to it under the revolving line of credit. In addition, $0.1 million of availability was used under the Loan Agreement primarily to support letters of credit to guarantee amounts committed for inventory purchases. The Loan Agreement provides that all payments by the Company's customers are deposited in a bank account from which all funds may only be used to pay the debt under the Loan Agreement. At January 31, 2011 , the amount of such restricted cash was $1.0 million. Cash required for operations is provided by draw-downs on the line of credit. The weighted average interest rates based on the the domestic revolving line balance at January 31, 2011 and 2010 , were 3.16% and 2.62%, respectively.
The Company guarantees the subsidiaries' debt including all foreign debt.
Mortgages. On July 10, 2010, the Company obtained a loan in the amount of 4,649,000 Danish Kroners ("DKK")
(approximately $850 thousand U.S. dollars at the prevailing exchange rate at the time of the transaction) from a Danish bank under a mortgage note secured by its industrial process cooling manufacturing facility in Denmark. The loan has an interest rate of 3.29%, quarterly payments of approximately $16 thousand for both principal and interest, and matures in July 2030.
On March 4, 2008, the Company borrowed $5.4 million under a mortgage note secured by the filtration products manufacturing facility located in Bolingbrook, Illinois and matures March 2033. The 25 year mortgage resets its interest rate every five years based on a published index. The initial interest rate is 6.54% during the first five years with monthly payments of $37 thousand for principal and interest combined.
On January 18, 2008, the Company borrowed $3.7 million under a mortgage note secured by its manufacturing and office facility in Niles, Illinois. The loan bears interest at 6.26% with monthly payments of $23 thousand for both principal and interest based on an amortization schedule of 30 years with a balloon payment at maturity in January 2018.
On December 31, 2005, the Company obtained a loan in the amount of 7,067,000 DKK (approximately $1.1 million U.S. dollars at the prevailing exchange rate at the time of the transaction) from a Danish bank to partially finance a building addition at its Filtration facility in Denmark. The loan bears interest at 4.28% with quarterly payments of $23 thousand for both principal and interest, and matures in December 2025.
On May 11, 2005, the Company obtained a loan in the amount of 3,241,500 DKK (approximately $536,000 U.S. dollars at the prevailing exchange rate at the time of the transaction) from a Danish bank to partially finance the building addition. The loan bears interest at 4.89% with quarterly payments of $11 thousand for both principal and interest, and matures in May 2025.
On July 31, 2002, Perma-Pipe, Inc. borrowed $1.8 million under a mortgage note secured by its manufacturing facility in Lebanon, Tennessee. From the proceeds, $1.0 million was used for a payment of amounts borrowed under the Note Purchase Agreements with the remaining proceeds used to repay amounts borrowed under the Loan Agreement. The loan bears interest at 7.75% with monthly payments of $21 thousand for both principal and interest, and matures in July 2012
On April 26, 2002, Midwesco Filter borrowed $2.0 million under a mortgage note secured by its manufacturing facility in Winchester, Virginia. Proceeds from the mortgage, net of a prior mortgage loan were used to make principal payments to the lenders under the Prior Term Loans and the bank which was the lender under the Company's revolving line of credit at that time. The loan bears interest at 7.10% with a monthly payment of $24 thousand for both principal and interest, and matures in April 2012.
39
Revolving Lines Foreign. The Company also has credit arrangements used by its Denmark and U.A.E. subsidiaries. These credit arrangements are in the form of overdraft facilities at rates competitive in the countries in which the Company operates. The interest rate at the Denmark subsidiaries was 4.5% January 31, 2011 , and the interest rate at the U.A.E subsidiaries was 5.0% at January 31, 2011. At January 31, 2011 , borrowings under these credit arrangements totaled $2.2 million an additional $7.5 million remained unused.
Term Loans. On May 14, 2010, Perma-Pipe, Inc. borrowed $1.0 million under an equipment loan secured by equipment. The loan bears interest at 5.8393% with monthly payments of $24 thousand for both principal and interest, and matures May 2014.
The Company purchased insurance on the lives of key executive officers. As beneficiary, the Company receives the cash surrender value if the policy is terminated and, upon death of the insured, receives all benefits payable. Cash surrender value of life insurance is reported in long term assets on the balance sheet. On April 27, 2010, the Company obtained a loan with no maturity date in the amount of $2.0 million collateralized by the cash surrender value of the policies. The loans carry interest at a rate of 4.25% and require interest only payments annually.
On March 9, 2007, the filtration products business Denmark location obtained a loan in the amount of 1,343,200 Euros (approximately $1.8 million U.S. dollars at the prevailing exchange rate at the time of the transaction) from a Danish bank to finance capital expenditures and other expenses. The loan matures May 2011. The loan bears interest at a floating rate at January 31, 2011 of 5.00% per annum with monthly principal payments of $35,300.
On August 28, 2007, the Company amended and restated the Term Loan Note to $3.0 million ("Term Loan"). Interest rates under the Term Loan are based on options selected by the Company as follows: (a) a margin in effect plus a prime rate; or (b) a margin in effect plus the LIBOR rate for the corresponding interest period. At January 31, 2011 , the prime rate was 3.25% , the LIBOR rate was 0.375% , and the margins added to the prime rate and the LIBOR rate, which are determined each quarter based on the applicable financial statement ratio, were 0.75 and 2.5 percentage points, respectively. The Company is scheduled to pay $107 thousand of principal on the first days of March, June, September, and December in each year, with the remaining unpaid principal payable on November 30, 2013. The weighted average interest rates based on this loan at January 31, 2011 and 2010 , were 2.92% and 2.52%, respectively
On December 30, 2005, Perma-Pipe, Inc. borrowed $0.9 million under an equipment loan secured by equipment. The loan bears interest at 6.23% with monthly payments of $13 thousand for both principal and interest, and matures in December 2012.
On April 8, 2003, the Company obtained a loan from a Danish bank to purchase equipment and office furniture for a building for its Filtration facility in Denmark, in the amount of 700,000 Euros, approximately $0.8 million U.S. dollars at the exchange rate prevailing at the time of the transaction. The loan bears interest at 6.1% with quarterly payments of $9 thousand for both principal and interest, and matures in April 2013.
Capital Leases. During 2010, the Company obtained several capital leases totaling $113 thousand to finance capital computer equipment. The interest rate for these capital leases range from 3.7935% to 5.763% per annum with monthly principal and interest payments of $6 thousand, and matures between February and October 2013.
On April 23, 2010, the filtration products business Denmark location obtained a capital lease in the amount of 952,600 DKK (approximately $170 thousand U.S. dollars at the prevailing exchange rate at the time of the transaction) from a Danish bank to finance capital expenditures. The loan bears interest at a fixed rate of 5.00% per annum with monthly principal payments of $2.5 thousand, and quarterly interest payments, and matures in April 2015.
On November 1, 2008, the filtration products business Bolingbrook location entered into a capital lease in the amount of $537 thousand. Proceeds were used to purchase improvements for the facility. The loan bears interest at 7.55% with a monthly payment of $16 thousand for both principal and interest, and matures in November 2011.
40
Note 6 - Lease Information
Property under capitalized leases | 2010 | 2009 |
|
Machinery and equipment | $635 | $459 | |
Furniture and office equipment | 478 | 478 |
|
Transportation equipment | 126 | 86 |
|
Computer equipment | 153 | 69 |
|
Subtotal | 1392 | 1,092 |
|
Less accumulated amortization | 716 | 580 |
|
Total | $676 | $512 | |
|
|
| |
Fixed assets acquired under capital leases | $300 | $69 | |
The piping systems business leases manufacturing and warehouse facilities, land, transportation equipment and office space under non-cancelable operating leases, which expire beginning 2011 through 2017. The filtration products business leases approximately 67,000 square feet of production and office space under an operating lease, which began in June 2004 and expires in 2012 and 2013.
At January 31, 2011 , future minimum annual rental commitments under non-cancelable lease obligations were as follows:
| Operating Leases | Capital Leases | ||
2011 | $1,534 | $254 | ||
2012 | 1,119 |
| 102 |
|
2013 | 555 |
| 45 |
|
2014 | 366 |
| 31 |
|
2015 | 247 |
| 28 |
|
Thereafter | 2,679 |
| - |
|
Subtotal | 6,500 |
| 460 |
|
Less Amount representing interest | - |
| 44 |
|
Future minimum lease payments | $6,500 | $416 | ||
Rental expense for operating leases in thousands was $2,198 , $1,966 and $2,037 in 2010, 2009, and 2008 , respectively.
41
Note 7 - Income Taxes
Income (loss) before income taxes | 2010 |
| 2009 |
| 2008 |
|
Domestic | $(9,805) | $(9,162) | $(1,272) | |||
Foreign | 12,425 |
| 14,468 |
| 9,334 |
|
Total | $2,620 | $5,306 | $8,062 | |||
|
|
|
| |||
Components of income tax expense (benefit) |
|
|
| |||
Current |
|
|
| |||
Federal | $(94) | $(132) | $456 | |||
Foreign | 1,880 |
| 2,906 |
| 1,324 |
|
State and other | 48 |
| 29 |
| 272 |
|
Subtotal | 1,834 |
| 2,803 |
| 2,052 |
|
Deferred |
|
|
| |||
Federal | (3,510 | ) | (1,517 | ) | (374 | ) |
Foreign | 155 |
| (723 | ) | (534 | ) |
State and other | (369 | ) | 72 |
| 229 |
|
Subtotal | (3,724 | ) | (2,168 | ) | (679 | ) |
Total | $(1,890) | $635 | $1,373 | |||
The excess tax benefit (expense) related to stock options recorded through equity was $29 thousand, $27 thousand and $(457) thousand in 2010, 2009, and 2008 , which did not affect net income in 2010, 2009, and 2008 . The amounts were recorded to additional paid-in capital on the consolidated balance sheet and in financing activities on the consolidated statement of cash flows. The expense in 2008 related to removing foreign employee stock option grants from the stock compensation expense and its associated deferred tax asset.
The determination of the consolidated provision for income taxes, deferred tax assets and liabilities, and the related valuation allowances requires management to make judgments and estimates. As a company with subsidiaries in foreign jurisdictions, the Company is required to calculate and provide for estimated income tax expense for each of the tax jurisdictions. The process of calculating income taxes involves estimating current tax obligations and exposures in each jurisdiction as well as making judgments regarding the future recoverability of deferred tax assets. Changes in the estimated level of annual pre-tax income, in tax laws, and resulting from tax audits can affect the overall effective income tax rate, which impacts the level of income tax expense and net income. Judgments and estimates related to the Company's projections and assumptions are inherently uncertain; therefore, actual results could differ materially from projections.
The 2010, 2009 and 2008 annual tax rates have been impacted by the mix of the U.A.E. earnings versus total earnings. The effective tax rate was less than the statutory U.S. federal income tax rate, mainly due to the large portion of income earned in the U.A.E. Income earned in the U.A.E. is not subject to any local country income tax.
Several valuation allowances impacted the effective tax rates. In 2010, the Company closed its operations in South Africa and released intercompany liabilities. Related income was offset by existing NOLs for which a prior valuation allowance had been previously provided. This release of liabilities increased the federal NOL. During 2009, the Company established a partial valuation allowance of $0.8 million for the $1.3 million research and development credits.
42
The difference between the provision for income taxes and the amount computed by applying the Federal effective rate of 34% was as follows:
| 2010 |
| 2009 |
| 2008 |
|
Tax expense at federal statutory rate | $890 | $1,804 | $2,741 | |||
Differences in foreign tax rate | (1,590 | ) | (2,915 | ) | (3,573 | ) |
Valuation allowance for foreign and state NOLs | (544 | ) | 287 |
| 404 |
|
State taxes, net of federal benefit | (436 | ) | 92 |
| 308 |
|
Nontaxable income from the Canadian joint venture | (334 | ) | (47 | ) | - |
|
Cash Surrender Value of deferred compensation plan | (128 | ) | (16 | ) | - |
|
All other, net expense | 252 |
| 684 |
| 665 |
|
Research tax credit, net of valuation allowance | - |
| 746 |
| (120 | ) |
Goodwill impairment | - |
| - |
| 948 |
|
Total | $(1,890) | $635 | $1,373 | |||
* Valuation allowances against foreign and state NOL benefits |
|
| ||||
For current year NOL | $(544) | $287 | $404 | |||
For prior year NOL carryovers | 1,274 |
| 987 |
| 583 |
|
Total | $730 | $1,274 | $987 | |||
The Company has a Federal operating loss carryforward of $16.8 million with a recognized tax benefit of $5.7 million that will begin to expire in 2029 or year ending January 31, 2030. At January 31, 2011 , no valuation allowance was deemed necessary on the federal NOL. The Company will continue to periodically review the adequacy of its valuation allowance in all of the tax jurisdictions in which it operates and may make further adjustments based on management's outlook for continued profits in each jurisdiction.
The deferred tax asset for state NOL carryforwards of $0.9 million relates to amounts that expire at various times from 2011 to 2030. The amount that expires in 2011 is approximately $20 thousand. A valuation allowance has been established for approximately $0.7 million of this tax asset based upon an assessment that it is more likely than not that realization cannot be assured in these tax jurisdictions. Included in 2010 tax expense was an adjustment relating to current and prior year's valuation allowances of $98 thousand related to state NOL carryovers.
The Company has a deferred tax asset for Denmark NOL carryforwards of $1.1 million that can be carried forward indefinitely and does not have a valuation allowance recorded against it. The ultimate realization of this tax benefit is dependent upon the generation of sufficient operating income in this tax jurisdiction.
As of January 31, 2011 , the Company had undistributed earnings of foreign subsidiaries for which deferred taxes have not been provided. The Company intends and has the opportunities to reinvest these earnings for the foreseeable future outside the U.S. If these amounts were distributed to the U.S., in the form of dividends or otherwise, the Company would be subject to additional U.S. income taxes. Determination of the amount of unrecognized deferred income tax liabilities on these earnings is not practicable because such liability, if any, is dependent on circumstances existing if and when remittance occurs. The most significant foreign entity where undistributed earnings would not be offset by foreign tax credits is Perma-Pipe Middle East, FZC in the U.A.E., where cumulative undistributed earnings as of January 31, 2011 were $21.8 million.
43
Components of the deferred income tax asset | 2010 |
| 2009 |
|
U.S. Federal NOL carryforward | $5,707 | $2,621 | ||
Non-qualified deferred compensation | 1,780 |
| 1,313 |
|
Research tax credit | 1,721 |
| 1,721 |
|
Other accruals not yet deducted | 1,373 |
| 1,263 |
|
Denmark NOL carryover | 1,120 |
| 965 |
|
Stock compensation | 1,050 |
| 754 |
|
State NOL carryover | 927 |
| 532 |
|
Accrued commissions and incentives | 776 |
| 1,214 |
|
Inventory valuation allowance | 401 |
| 448 |
|
Other | 159 |
| 149 |
|
Inventory uniform capitalization | 111 |
| 108 |
|
Goodwill | 6 |
| 13 |
|
South African NOL carryover | - |
| 776 |
|
Subtotal | 15,131 |
| 11,877 |
|
Valuation allowance for net operating losses | (730 | ) | (1,274 | ) |
Valuation allowance for research tax credit | (814 | ) | (814 | ) |
Total deferred tax assets, net of valuation allowances | $13,587 | $9,789 | ||
|
|
| ||
Components of the deferred income tax liability |
|
| ||
Depreciation | $2,029 | $2,106 | ||
Accrued pension | 566 |
| 463 |
|
Prepaid | 271 |
| 264 |
|
Total deferred tax liabilities | $2,866 | $2,833 | ||
|
|
| ||
Deferred income tax, net | $10,721 | $6,956 | ||
|
|
| ||
Balance sheet classification |
|
| ||
Current assets | $2,389 | $2,769 | ||
Long-term assets | 8,470 |
| 4,187 |
|
Total deferred tax assets, net of valuation allowances | $10,859 | $6,956 | ||
The following table summarizes unrecognized tax benefit activity, excluding the related accrual for interest and penalties:
| 2010 |
| 2009 |
|
Balance at beginning of the year | $829 | $775 | ||
(Decreases) increases in positions taken in a prior period | (53 | ) | 1 |
|
Increases in positions taken in a current period | 245 |
| 62 |
|
Decreases due to lapse of statute of limitations | (140 | ) | (9 | ) |
Balance at end of the year | $881 | $829 | ||
Included in the total unrecognized tax liability at January 31, 2011 were estimated accrued interest of $87 thousand and penalties of $48 thousand and at January 31, 2010 , accrued interest and penalties were $76 thousand and $59 thousand, respectively. These non-current income tax liabilities are recorded in other long-term liabilities in the consolidated balance sheet. The Company's policy is to include interest and penalties in income tax expense. At January 31, 2011 , the Company did not anticipate any significant adjustments to its unrecognized tax benefits caused by the settlement of the ongoing tax examinations detailed above, or other factors, within the next twelve
44
months. Included in the balance at January 31, 2011 were amounts offset by deferred taxes (i.e., temporary differences) or amounts that could be offset by refunds in other taxing jurisdictions (i.e., corollary adjustments). Thus, $0.9 million and $0.8 million of the amount accrued at January 31, 2011 and 2010 , respectively, would impact the effective tax rate, if reversed.
The Company is subject to income taxes in the U.S. federal jurisdiction, and various states and foreign jurisdictions. Tax regulations within each jurisdiction are subject to the interpretation of the related tax laws and regulations and require significant judgment to apply. Tax years back to January 31, 2008 are open for federal and state tax purposes. In addition, federal and state tax losses generated in years January 31, 2004 through January 31, 2007 are subject to adjustment on audit, up to the amount of loss claimed or r esearch tax credit generated in those years.
The Company's management periodically estimates the probable tax obligations of the Company using historical experience in tax jurisdictions and informed judgments. There are inherent uncertainties related to the interpretation of tax regulations in the jurisdictions in which the Company transacts business. The judgments and estimates made at a point in time may change based on the outcome of tax audits, as well as changes to or further interpretations of regulations. If such changes take place, there is a risk that the tax rate may increase or decrease in any period. Tax accruals for tax liabilities related to potential changes in judgments and estimates for federal, foreign and state tax issues are included in current liabilities on the consolidated balance sheet.
Note 8 - Retirement Plans
Pension Plan
The Winchester filtration facility has a defined benefit plan covering its hourly rated employees. The benefits are based on fixed amounts multiplied by years of service of retired participants. The Company engages outside actuaries to calculate its obligations and costs. The funding policy is to contribute such amounts as are necessary to provide for benefits attributed to service to date and those expected to be earned in the future. The amounts contributed to the plan are sufficient to meet the minimum funding requirements set forth in the Employee Retirement Income Security Act of 1974. The Company may contribute additional amounts at its discretion.
Asset Allocation
Plan assets | Market Value |
|
Vanguard Balanced Index Fund | $4,667 | |
Vanguard Inflation Protected Fund | 229 |
|
Fifth Third Banksafe Trust | 96 |
|
Vanguard REIT Index Fund | 97 |
|
Total at January 31, 2011 | $5,089 | |
At January 31, 2011 , 91.7% of plan assets were held in mutual funds, 4.5% were held in bond funds and the remaining 1.9% was in a money market fund. The plans hold no securities of MFRI, Inc. 100% of the assets are held for benefits under the plan. The fair value of the major categories of the pension plans' investments are presented below. The FASB has established a fair value hierarchy that distinguishes between (1) market participant assumptions developed based on market data obtained from independent sources (observable inputs) and (2) an entity's own assumptions about market participant assumptions developed based on the best information available in the circumstances (unobservable inputs). The fair value hierarchy consists of three broad levels, which gives the highest priority to unadjusted quoted prices in active markets for identical assets and liabilities (Level 1) and the lowest priority to unobservable inputs (Level 3). The three levels of the fair value hierarchy are described below:
Level 1 - Unadjusted quoted prices in active markets that are accessible at the measurement date for identical, unrestricted assets or liabilities.
45
Level 2 - Inputs other than quoted prices included within Level 1 that are observable for the asset or liability, either directly or indirectly, including quoted prices for similar assets or liabilities in active markets; quoted prices for identical or similar assets or liabilities in markets that are not active; inputs other than quoted prices that are observable for the asset or liability (e.g., interest rates); and inputs that are derived principally from or corroborated by observable market data by correlation or other means.
Level 3 - Inputs that are both significant to the fair value measurement and unobservable.
Level 1 market value of plan assets | 2010 | 2009 |
Equity securities | $2,830 | $2,297 |
U.S. bond market | 1,837 | 1,531 |
High-quality inflation-indexed bonds issued by the U.S. Treasury and government agencies as well as domestic corporations | 229 | 214 |
Real Estate securities | 97 | 67 |
Subtotal | 4,993 | 4,109 |
Level 2 significant other observable inputs |
|
|
Money market fund | 96 | 141 |
Total | $5,089 | $4,250 |
The target asset allocation was 95% to 100% mutual funds. The investment policy is to invest all funds not needed to pay benefits and investment expenses for the year, with target asset allocations of 60% equities (plus or minus 10%) and 40% fixed income (plus or minus 10%), diversified across a variety of sub-asset classes and investment styles, following a flexible asset allocation approach that will allow the plan to participate in market opportunities as they become available. The expected long-term rate of return on assets is based on historical long-term rates of equity and fixed income investments and the asset mix objective of the funds.
Investment market conditions in 2010 resulted in $684 thousands actual return on plan assets as presented below, which increased the fair value of plan assets at year end, as is also presented below. The Company did not change its 8% expected return on plan assets used in determining cost and benefit obligations, the return that the Company has assumed during every profitable and unprofitable investment year since 1991. The plan's investments are intended to earn long-term returns to fund long-term obligations, and investment portfolios with asset allocations similar to those of the plan's investment policy have attained such returns over several decades. Future contributions that may be necessary to maintain funding requirements are not expected to materially affect the Company's liquidity.
46
Reconciliation of benefit obligations, plan assets and funded status of plan | 2010 |
| 2009 |
|
Accumulated benefit obligations |
|
| ||
Vested benefits | $4,823 | $4,373 | ||
Accumulated benefits | $4,931 | $4,457 | ||
|
|
| ||
Change in benefit obligation |
|
| ||
Benefit obligation - beginning of year | $4,814 | $4,103 | ||
Service cost | 119 |
| 119 |
|
Interest cost | 280 |
| 259 |
|
Amendments | - |
| 247 |
|
Actuarial loss | 210 |
| 228 |
|
Benefits paid | (162 | ) | (142 | ) |
Benefit obligation - end of year | $5,261 | $4,814 | ||
|
|
| ||
Change in plan assets |
|
| ||
Fair value of plan assets - beginning of year | $4,250 | $3,048 | ||
Actual return on plan assets gain | 684 | 773 |
| |
Company contributions | 317 | 571 |
| |
Benefits paid | (162 | ) | (142 | ) |
Fair value of plan assets - end of year | $5,089 | $4,250 | ||
|
|
| ||
Unfunded status | $(172) | $(564) | ||
|
|
| ||
Balance sheet classification |
|
| ||
Prepaid expenses and other current assets | $315 | $256 | ||
Other assets | 1,209 |
| 1,145 |
|
Other long-term liabilities | (1,696 | ) | (1,964 | ) |
Net amount recognized | $(172) | $(563) | ||
|
|
| ||
Amounts recognized in accumulated other comprehensive income |
|
| ||
Net loss | $931 | $1,127 | ||
Unamortized prior service cost | 449 | 581 |
| |
Net amount recognized | $1,380 | $1,708 | ||
The amount of unamortized prior service cost and net loss to be amortized in the following year is $127 thousand .
Weighted-average assumptions used to determine net cost and benefit obligations | 2010 |
| 2009 |
|
End of year benefit obligation | 5.780 | % | 5.980 | % |
Service cost discount rate | 5.980 | % | 6.490 | % |
Expected return on plan assets | 8.000 | % | 8.000 | % |
Rate of compensation increase | N/A |
| N/A |
|
The discount rate was based on a Citigroup pension discount curve of high quality fixed income investments with cash flows matching the plans' expected benefit payments. The Company determines the expected long-term rate of return on plan assets by performing a detailed analysis of historical and expected returns based on the strategic asset allocation approved by the Board of Directors and the underlying return fundamentals of each asset class. The Company's historical experience with the pension fund asset performance is also considered.
47
Components of net periodic benefit cost | 2010 | 2009 |
Service cost | $119 | $119 |
Interest cost | 280 | 259 |
Expected return on plan assets | (342) | (244) |
Amortization of prior service cost | 132 | 107 |
Recognized actuarial loss | 64 | 102 |
Net periodic benefit cost | $253 | $343 |
Amounts recognized in other comprehensive income | 2010 | 2009 |
|
Actuarial loss on obligation | $(210) | $(228) | |
Amendments | 0 | (247 | ) |
Actual return on plan assets gain | 406 | 632 |
|
Reclassify prior service cost | 132 | 107 |
|
Total in other comprehensive income | $328 | $264 | |
|
|
| |
Cashflows |
|
| |
Expected employer contributions for fiscal year ending 1/31/2012 |
| 274 |
|
Expected employee contributions for fiscal year ending 1/31/2012 |
| - |
|
Estimated future benefit payments reflecting expected future service for the fiscal year(s) ending January 31,: |
|
| |
2012 |
| 316 |
|
2013 |
| 318 |
|
2014 |
| 328 |
|
2015 |
| 347 |
|
2016 |
| 361 |
|
2017 - 2020 |
| 1,911 |
|
401(k) Plan
The domestic employees of the Company participate in the MFRI, Inc. Employee Savings and Protection Plan, which is applicable to all employees except employees covered by collective bargaining agreement benefits. The plan allows employee pretax payroll contributions of up to 16% of total compensation. The Company matches 50% of each participant's contribution, up to a maximum of 3% of each participant's salary.
Contributions to the 401(k) Plan were $436 thousand , $487 thousand and $557 thousand for the years ended January 31, 2011, 2010 and 2009 , respectively.
Deferred Compensation Plans
The Company has deferred compensation agreements with key employees. Vesting is based on years of service. Life insurance contracts have been purchased which may be used to fund the Company's obligation under these agreements.
48
Note 9 - Stock Options
Under the 2004 Stock Option Plan ("Option Plan"), 250,000 shares of common stock are reserved for issuance to employees of the Company and its affiliates as well as advisors and consultants to the Company. In addition, under the Option Plan, the number of shares that may be issued shall be increased by an additional two percent of the aggregate number of shares of Common Stock outstanding as of the last day of the most recently completed fiscal year of the Company, beginning January 31, 2005. Option exercise prices will be no less than fair market value for the common stock on the date of grant. The options granted under the Option Plan may be either non-qualified options or incentive options.
Under the 2009 Independent Directors' Stock Option Plan, 100,000 shares of common stock are reserved for issuance to Directors of the Company. In addition, the number of shares that may be issued shall be increased May 1, 2010 and each May 1 thereafter until May 1, 2019, pursuant to the terms of this Plan shall be increased by the number equal to 0.35% of the aggregate number of shares of common stock outstanding as of the last day of the most recently ended fiscal year of the Company. Pursuant to the 2009 Independent Directors' Stock Option Plan, an option to purchase 10,000 shares of common stock is granted automatically to each director who is not an employee of the Company (an "Independent Director") on the date the individual is first elected as an Independent Director. An option to purchase 1,000 shares was granted to each Independent Director acting on June 23, 2009, and options to purchase 1,000 shares are granted to each Independent Director upon each date such Independent Director is re-elected as an Independent Director, commencing with the Company's annual meeting for the year 2009.
Pursuant to the 2001 Independent Directors' Stock Option Plan, an option to purchase 10,000 shares of common stock is granted automatically to each director who is not an employee of the Company on the date the individual is first elected as an Independent Director. An option to purchase 1,000 shares was granted to each Independent Director acting on December 31, 2001, and options to purchase 1,000 shares are granted to each Independent Director upon each date such Independent Director is re-elected as an Independent Director, commencing with the Company's annual meeting for the year 2002.
Such options vest ratably over four years and are exercisable for up to ten years from the date of grant. To cover the exercise of vested options, the Company issues new shares from its authorized but unissued share pool. The Company calculates all stock compensation expense based on the grant date fair value of the option and recognizes expense on a straight-line basis over the four-year vesting period of the option.
The fair value of each option award was estimated on the date of grant using the Black-Scholes Merton option-pricing model that used the assumptions noted in the following table. The principal variable assumptions utilized in valuing options and the methodology for estimating such model inputs include:
1. risk-free interest rate - an estimate based on the "Market yield on U.S. Treasury securities at the rate for the period described in assumption 3 below, quoted on investment basis" for the end of week closest to the stock option grant date, from the Federal Reserve web site;
2. expected volatility - an estimate based on the historical volatility of MFRI Common Stock's weekly closing stock price for the period 1/1/93 to the date of grant; and
3. expected life of the option - an estimate based on historical experience including the effect of employee terminations.
|
| 2010 |
| 2009 |
| 2008 |
| |
1 |
| Risk-free interest rate | 1.88%-5.16% |
| 1.88%-5.16% |
| 2.80% - 3.57% |
|
2 |
| Expected volatility | 51.72%-66.82% |
| 51.72%-66.82% |
| 60.34% - 63.64% |
|
3 |
| Expected life in years | 5.7 |
| 5.5 |
| 5.0 |
|
4 |
| Dividend yield | - |
| - |
| - |
|
49
The following summarizes the activity related to options outstanding under the plans for the three years ended January 31, 2009, 2010 and 2011:
| Options |
| Weighted Average Exercise Price |
| Weighted Average Remaining Contractual Term |
| Aggregate Intrinsic Value |
|
Outstanding at February 1, 2008 | 437 |
| $13.59 | 7.2 |
| $2,903 | ||
Granted | 161 |
| 17.30 |
|
|
| ||
Exercised | (28 | ) | 2.99 |
|
| 125 |
| |
Expired or forfeited | (20 | ) | 23.77 |
|
|
| ||
Outstanding at January 31, 2009 | 550 |
| 14.85 |
| 7.2 |
| 260 |
|
|
|
|
|
| ||||
Options exercisable at January 31, 2009 | 254 |
|
| 5.4 |
| 260 |
| |
|
|
|
|
| ||||
Granted | 178 |
| 6.81 |
|
|
| ||
Exercised | (21 | ) | 2.84 |
|
| 55 |
| |
Expired or forfeited | (27 | ) | 12.94 |
|
|
| ||
Outstanding at January 31, 2010 | 680 |
| 13.20 |
| 7.2 |
| 379 |
|
|
|
|
|
| ||||
Options exercisable at January 31, 2010 | 304 |
|
| 5.5 |
| 366 |
| |
|
|
|
|
| ||||
Granted | 162 |
| 6.10 |
|
|
| ||
Exercised | (15 | ) | 3.00 |
|
| 84 |
| |
Expired or forfeited | (50 | ) | 13.63 |
|
|
| ||
Outstanding at January 31, 2011 | 777 |
| 11.88 |
| 6.9 |
| 2,241 |
|
|
|
|
|
| ||||
Options exercisable at January 31, 2011 | 408 |
| $13.61 | 5.4 |
| $1,000 | ||
Range of Exercise Prices | Options Outstanding |
| Weighted Average Remaining Contractual Life |
| Weighted Average Exercise Price |
| Options Exercisable |
| Weighted Average Exercise Price |
|
$2.00-$2.99 | 28 |
| 1.9 |
| $2.1636 | 28 |
| $2.1636 | ||
3.00-3.99 | 47 |
| 0.9 |
| 3.1210 |
| 47 |
| 3.1210 |
|
6.00-6.99 | 318 |
| 8.9 |
| 6.4604 |
| 41 |
| 6.8005 |
|
7.00-7.99 | 48 |
| 4.4 |
| 7.6100 |
| 48 |
| 7.6100 |
|
10.00-10.99 | 76 |
| 5.4 |
| 10.0750 |
| 76 |
| 10.0750 |
|
12.00-12.99 | 2 |
| 7.3 |
| 12.6650 |
| 1 |
| 12.6650 |
|
13.00-13.99 | 10 |
| 7.4 |
| 13.6500 |
| 5 |
| 13.6500 |
|
16.00-16.99 | 1 |
| 7.1 |
| 16.1150 |
| 1 |
| 16.1150 |
|
17.00-17.99 | 132 |
| 7.4 |
| 17.6430 |
| 72 |
| 17.6465 |
|
26.00-26.99 | 2 |
| 6.5 |
| 26.0450 |
| 2 |
| 26.0450 |
|
$28.00-$28.99 | 113 |
| 6.4 |
| 28.9900 |
| 87 |
| 28.9900 |
|
Outstanding at January 31, 2011 | 777 |
| 6.9 |
| $11.8812 | 408 |
| $13.6053 | ||
The weighted average fair value of options granted, net of options surrendered, during 2010, 2009, and 2008 are estimated at $3.40 , $5.74 , and $16.41 per share, respectively, on the date of grant.
50
Unvested options outstanding | Options |
| Weighted-Average Grant Date Fair Value |
| Aggregate Intrinsic Value |
Outstanding at beginning of the year | 376 |
| $13.870 | $13 | |
Granted | 162 |
| 6.095 |
|
|
Vested | (139 | ) |
|
| |
Expired or forfeited | (30 | ) | 11.929 |
|
|
Outstanding at end of the year | 369 |
| $9.977 | $1,241 | |
Based on historical experience the Company expects 85% of these options to vest.
As of January 31, 2011 , there was $1.4 million of unrecognized compensation cost related to unvested stock options granted under the Plans. That cost is expected to be recognized over the weighted-average period of 2.4 years. The stock-based compensation expense for the years ended January 31, 2011, 2010 and 2009 was $0.9 million, $1.1 million, and $0.7 million, respectively.
Note 10 - Stock Rights
On September 15, 2009, the Company entered into the Amendment ("Amendment") to Rights Agreement dated as of September 15, 1999. Among other things, the Amendment extends the term of the Rights Agreement until September 15, 2019 and amends definitions to include positions in derivative instruments related to the Company's common stock as constituting beneficial ownership of such stock.
On September 15, 1999, the Company's Board of Directors declared a dividend of one common stock purchase right (a "Right") for each share of MFRI's common stock outstanding at the close of business on September 22, 1999. The stock issued after September 22, 1999 and before the redemption or expiration of the Rights is also entitled to one Right for each such additional share. Each Right entitles the registered holders, under certain circumstances, to purchase from the Company one share of MFRI's common stock at $25.00, subject to adjustment. At no time will the Rights have any voting power.
The Rights may not be exercised until 10 days after a person or group acquires 15% or more of the Company's common stock, or announces a tender offer that, if consummated, would result in 15% or more ownership of the Company's common stock. Separate Rights certificates will not be issued and the Rights will not be traded separately from the stock until then. Should an acquirer become the beneficial owner of 15% or more of the Company's common stock, Rights holders other than the acquirer would have the right to buy common stock in MFRI, or in the surviving enterprise if MFRI is acquired, having a value of two times the exercise price then in effect. Also, MFRI's Board of Directors may exchange the Rights (other than those of the acquirer which will have become void), in whole or in part, at an exchange ratio of one share of MFRI common stock (and/or other securities, cash or other assets having equal value) per Right subject to adjustment. The Rights described in this paragraph and the preceding paragraph shall not apply to an acquisition, merger or consolidation approved by the Company's Board of Directors.
The Rights will expire on September 15, 2019, unless exchanged or redeemed prior to that date. The redemption price is $0.01 per Right. MFRI's Board of Directors may redeem the Rights by a majority vote at any time prior to the 20th day following public announcement that a person or group has acquired 15% of MFRI's common stock. Under certain circumstances, the decision to redeem requires the concurrence of a majority of the independent directors.
Note 11 - Interest Expense, Net | 2010 |
| 2009 |
| 2008 |
|
Interest expense | $1,937 | $2,077 | $2,873 | |||
Interest income | (676 | ) | (165 | ) | (39 | ) |
Interest expense, net | $1,261 | $1,912 | $2,834 | |||
51
Note 12
-Fair Value of Financial Instruments
At January 31, 2011 , one interest rate swap agreement was in effect with a notional value of $9 million maturing in 2013. The swap agreement, which reduces the exposure to market risks from changing interest rates, exchanges the variable rate to fixed interest rate payments of 2.23% plus LIBOR margin.
Interest rate swap fair value |
| Level 2 significant other observable inputs |
| |
Other long-term liabilities |
| $334 |
| |
|
|
|
| |
Accumulated other comprehensive income |
| (334 | ) |
|
Note 13 - Quarterly Financial Data (Unaudited)
The following is a summary of the unaudited quarterly results of operations:
2010 | First Quarter | Second Quarter | Third Quarter | Fourth Quarter | ||||
Net sales | $49,850 | $61,887 | $58,837 | $48,024 | ||||
Gross profit | $10,752 | $13,743 | $13,555 | $6,408 | ||||
Net income (loss) | $(484) | $2,882 | $3,565 | $(1,453) | ||||
Weighted average number of common shares outstanding |
|
|
|
| ||||
Basic | 6,837 |
| 6,839 |
| 6,842 |
| 6,850 |
|
Diluted | 6,837 |
| 6,860 |
| 6,842 |
| 6,850 |
|
Earnings(loss) share data |
|
|
|
| ||||
Basic | $(0.07) | $0.42 | $0.52 | $(0.21) | ||||
Diluted | $(0.07) | $0.42 | $0.52 | $(0.21) | ||||
|
|
|
|
| ||||
2009 |
|
|
|
| ||||
Net sales | $67,579 | $61,106 | $52,586 | $49,110 | ||||
Gross profit | $18,727 | $14,629 | $12,490 | $6,100 | ||||
Net income (loss) | $6,006 | $3,751 | $695 | $(5,781) | ||||
Weighted average number of common shares outstanding |
|
|
|
| ||||
Basic | 6,816 |
| 6,819 |
| 6,826 |
| 6,835 |
|
Diluted | 6,852 |
| 6,846 |
| 6,856 |
| 6,835 |
|
Earnings(loss) share data |
|
|
|
| ||||
Basic | $0.88 | $0.55 | $0.10 | $(0.85) | ||||
Diluted | $0.88 | $0.55 | $0.10 | $(0.85) | ||||
The fourth quarter for 2010 and 2009 had net losses; therefore, the diluted loss per share for the quarters were identical to the basic loss per share rather than assuming conversion, exercise, or contingent issuance of securities that would have an anti-dilutive effect on earnings per share. The fourth quarter produced a net loss of $1.5 million significantly better than the net loss of $5.8 million in the comparable prior-year's quarter. The filtration products and industrial process cooling businesses and the piping systems joint venture drove this improvement. Another factor was the look-through rules of Subpart F passive income which expired December 31, 2009, and then were retroactively extended in December 2010. In the second quarter, the Company had recorded $0.3 million in tax expense related to passive income that was reversed in the fourth quarter. The net loss in the fourth quarter of 2009 was due to lower sales in all segments and compressed margins due to competitive factors.
52
Schedule II
MFRI, INC. AND SUBSIDIARIES
VALUATION AND QUALIFYING ACCOUNTS
For the Years Ended
January 31, 2011, 2010 and 2009
| Balance at Beginning of Period | Charged to | Deductions | Charged to | Balance at End of Period |
|
|
|
|
|
|
Year Ended January 31, 2011 |
|
|
|
|
|
Allowance for possible losses in collection of trade receivables | $379 | $86 | $212 | $93 | $346 |
|
|
|
|
|
|
Year Ended January 31, 2010 |
|
|
|
|
|
Allowance for possible losses in collection of trade receivables | 473 | 34 | 193 | 65 | 379 |
|
|
|
|
|
|
Year Ended January 31, 2009 |
|
|
|
|
|
Allowance for possible losses in collection of trade receivables | 384 | 197 | 138 | 30 | 473 |
(1)
Uncollectible accounts charged off(2)
Primarily related to recoveries from accounts previously charged off and currency translation
53
SIGNATURES
Pursuant to the requirements of Section 13 or 15(d) of the Securities Exchange Act of 1934, the Registrant has duly caused this report to be signed on its behalf by the undersigned thereunto duly authorized.
MFRI, INC.
Date: | April 14, 2011 | /s/ David Unger |
|
| David Unger |
|
| Chairman of the Board of Directors, and |
|
| Chief Executive Officer |
|
| (Principal Executive Officer) |
Pursuant to the requirements of the Securities Exchange Act of 1934, this report has been signed below by the following persons on behalf of the Registrant and in the capacities and on the date indicated.
DAVID UNGER* | Director, Chairman of the Board of Directors, and Chief Executive Officer (Principal Executive Officer) | ) ) |
| |
|
| ) |
| |
HENRY M. MAUTNER* | Director | ) |
| |
|
| ) |
| |
BRADLEY E. MAUTNER* | Director, President and Chief Operating Officer | ) |
| |
|
| ) |
| |
MICHAEL D. BENNETT* | Vice President, Chief Financial Officer, Secretary and Treasurer (Principal Financial and Accounting Officer) | ) ) | April 14, 2011 | |
|
| ) |
| |
DENNIS KESSLER* | Director | ) |
| |
|
| ) |
| |
ARNOLD F. BROOKSTONE* | Director | ) |
| |
|
| ) |
| |
EUGENE MILLER* | Director | ) |
| |
|
| ) |
| |
STEPHEN B. SCHWARTZ* | Director | ) |
| |
|
| ) |
| |
MICHAEL J. GADE* | Director | ) |
| |
|
| ) |
| |
MARK A. ZORKO* | Director | ) |
| |
|
|
|
| |
*By: | /s/ David Unger | Individually and as Attorney in Fact |
|
|
| David Unger |
|
|
|
54
EXHIBIT INDEX
Exhibit No. |
| Description | |
3(i) |
|
| Certificate of Incorporation of MFRI, Inc. [Incorporated by reference to Exhibit 3.3 to Registration Statement No. 33-70298] |
3(ii) |
|
| By-Laws of MFRI, Inc. amended and restated [Incorporated by reference to Exhibit 3.2 filed on July 27, 2009] |
4 |
|
| Specimen Common Stock Certificate [Incorporated by reference to Exhibit 4 to Registration Statement No. 33-70794] |
4(a) |
|
| 2010 Rights Agreement as amended [Incorporated by reference to Exhibit 4.1 of the Company's Schedule filed on September 17, 2009] |
10(a) |
|
| 1993 Stock Option Plan [Incorporated by reference to Exhibit 10.4 of Registration Statement No. 33-70794] |
10(b) |
|
| 1994 Stock Option Plan [Incorporated by reference to Exhibit 10(c) to the Company's Annual Report on Form 10-K for the fiscal year ended January 31, 1994] |
10(c) |
|
| 2001 Independent Directors Stock Option Plan, as amended [Incorporated by reference to Exhibit 10(d)(5) to the Company's Schedule filed on May 25, 2001] |
10(d) |
|
| Form of Directors Indemnification Agreement Certificate [Incorporated by reference to Exhibit 10.1 to the Company's Schedule filed on May 15, 2006] |
10(e) |
|
| MFRI 2004 Stock Incentive Plan [Incorporated by reference to Exhibit 10(e) to the Company's Annual Report on Form 10-K for the fiscal year ended January 31, 2006] |
10(f) |
|
| Loan and Security Agreement between the Company and Fleet Capital Corporation dated July 11, 2002 and the amendments thereto dated October 3, 2002, December 12, 2002, April 30, 2003, October 31, 2003, July 1, 2004 and March 28, 2005. [Incorporated by reference to Exhibit 10(f) to the Company's Annual Report on Form 10-K for the fiscal year ended January 31, 2006] |
10(g) |
|
| Amended and Restated Loan and Security Agreement between the Company and Bank of America dated December 15, 2006 and the amendments thereto dated [Incorporated by reference to Exhibit 10.1 to the Company's Schedule filed on December 20, 2006] |
10(h) |
|
| Code of Conduct [Incorporated by reference to Exhibit 14 of the Company's Annual Report on Form 10-K for the fiscal year ended January 31, 2004] |
10(i)* |
|
| Twelfth Amendment to Amended and Restated Loan and Security Agreement |
10(j) |
|
| Employment agreement with Fati Elgendy dated February 1, 2007 [Incorporated by reference to DEF14A Schedule filed on May 29, 2008] |
10(k) |
|
| 2009 Non-Employee Directors Stock Option Plan [Incorporated by reference to the Company's Annual Report on Form 10-K for the fiscal year ended January 31, 2010] |
21* |
|
| Subsidiaries of MFRI, Inc. |
23* |
|
| Consent of Independent Registered Public Accounting Firm - Grant Thornton LLP |
24* |
|
| Power of Attorney executed by directors and officers of the Company |
31* |
|
| Rule 13a - 14(a)/15d - 14(a) Certifications (1) Chief Executive Officer certification pursuant to Section 302 of the Sarbanes-Oxley Act of 2002 (2) Chief Financial Officer certification pursuant to Section 302 of the Sarbanes-Oxley Act of 2002 |
32* |
|
| Section 1350 Certifications (1) Chief Executive Officer certification pursuant to Section 906 of the Sarbanes-Oxley Act of 2002 (2) Chief Financial Officer certification pursuant to Section 906 of the Sarbanes-Oxley Act of 2002 |
*Filed herewith
55