UNITED STATES
SECURITIES AND EXCHANGE COMMISSION
Washington, D.C. 20549
FORM 10-K
ANNUAL REPORT PURSUANT TO SECTION 13 OR 15(d) OF THE SECURITIES EXCHANGE ACT OF 1934
For the fiscal year ended April 26, 2014
COMMISSION FILE NUMBER 1-9656
LA-Z-BOY INCORPORATED |
(Exact name of registrant as specified in its charter) |
MICHIGAN | 38-0751137 |
(State or other jurisdiction of incorporation or organization) | (I.R.S. Employer Identification No.) |
1284 North Telegraph Road, Monroe, Michigan | 48162-3390 |
(Address of principal executive offices) | (Zip Code) |
Registrant's telephone number, including area code (734) 242-1444
Securities registered pursuant to Section 12(b) of the Act:
Title of each class | Name of each exchange on which registered |
Common Shares, $1.00 Par Value | New York Stock Exchange |
Securities registered pursuant to Section 12(g) of the Act: None
Indicate by check mark if the Registrant is a well-known seasoned issuer, as defined in rule 405 of the Securities Act.
Yes x No o
Indicate by check mark if the Registrant is not required to file reports pursuant to Section 13 or 15(d) of the Exchange Act.
Yes o No x
Indicate by check mark whether the Registrant (1) has filed all reports required to be filed by Section 13 or 15(d) of the Securities Exchange Act of 1934 during the preceding 12 months (or for such shorter period that the Registrant was required to file such reports), and (2) has been subject to such filing requirements for the past 90 days.
Yes x No o
Indicate by check mark whether the Registrant has submitted electronically and posted on its corporate Web site, if any, every Interactive Data File required to be submitted and posted pursuant to Rule 405 of Regulation S-T during the preceding 12 months (or for such shorter period that the Registrant was required to submit and post such files).
Yes x No o
Indicate by check mark if disclosure of delinquent filers pursuant to Item 405 of Regulation S-K is not contained herein, and will not be contained, to the best of the Registrant's knowledge, in definitive proxy or information statements incorporated by reference in Part III of this Form 10-K or any amendment to this Form 10-K. x
Indicate by check mark whether the Registrant is a large accelerated filer, an accelerated filer, a non-accelerated filer or a smaller reporting company. See the definitions of "large accelerated filer," "accelerated filer," and "smaller reporting company" in Rule 12b-2 of the Exchange Act. (Check one):
Large accelerated filer x | Accelerated filer o | Non-accelerated filer o | Smaller reporting company o |
Indicate by check mark whether the Registrant is a shell company (as defined in Rule 12b-2 of the Exchange Act).
Yes o No x
Based on the closing price on the New York Stock Exchange on October 25, 2013, the aggregate market value of Registrant's common shares held by non-affiliates of the Registrant on that date was $1,227.4 million.
The number of common shares outstanding of the Registrant was 51,849,732 as of June 10, 2014.
DOCUMENTS INCORPORATED BY REFERENCE:
| (1) | Portions of the Registrant's Proxy Statement to be filed with the Securities and Exchange Commission pursuant to Regulation 14A for its 2014 Annual Meeting of Shareholders are incorporated by reference into Part III. |
LA-Z-BOY INCORPORATED
FORM 10-K ANNUAL REPORT FISCAL 2014
TABLE OF CONTENTS
Page Number(s) | ||
Cautionary Statement Concerning Forward-Looking Statements | 3 | |
|
| |
PART I | ||
Item 1. | Business | 3 |
Item 1A. | Risk Factors | 9 |
Item 1B. | Unresolved Staff Comments | 12 |
Item 2. | Properties | 13 |
Item 3. | Legal Proceedings | 13 |
Item 4. | Mine Safety Disclosures | 13 |
Executive Officers of the Registrant | 14 | |
|
| |
PART II | ||
Item 5. | Market for Registrant's Common Equity, Related Stockholder Matters and Issuer Purchases of Equity Securities | 15 |
Item 6. | Selected Financial Data | 19 |
Item 7. | Management's Discussion and Analysis of Financial Condition and Results of Operations | 23 |
Item 7A. | Quantitative and Qualitative Disclosures About Market Risk | 39 |
Item 8. | Financial Statements and Supplementary Data | 40 |
Item 9. | Changes in and Disagreements with Accountants on Accounting and Financial Disclosure | 78 |
Item 9A. | Controls and Procedures | 78 |
Item 9B. | Other Information | 79 |
|
|
|
PART III | ||
Item 10. | Directors, Executive Officers, and Corporate Governance | 79 |
Item 11. | Executive Compensation | 79 |
Item 12. | Security Ownership of Certain Beneficial Owners and Management and Related Stockholder Matters | 79 |
Item 13. | Certain Relationships and Related Transactions, and Director Independence | 79 |
Item 14. | Principal Accounting Fees and Services | 79 |
|
|
|
PART IV | ||
Item 15. | Exhibits, Financial Statement Schedules | 80 |
Note: The responses to Items 10 through 14 will be included in the Company's definitive proxy statement to be filed pursuant to Regulation 14A for the 2014 Annual Meeting of Shareholders. The required information is incorporated into this Form 10-K by reference to that document and is not repeated herein.
2
Table of Contents
Cautionary Statement Concerning Forward-Looking Statements
La-Z-Boy Incorporated and its subsidiaries (individually and collectively, "we," "our" or the "Company") make forward-looking statements in this report, and its representatives may make oral forward-looking statements from time to time. Generally, forward-looking statements include information concerning possible or assumed future actions, events or results of operations. More specifically, forward-looking statements may include information regarding:
¾ future income, margins and cash flows | ¾ future economic performance |
¾ future growth | ¾ industry and importing trends |
¾ adequacy and cost of financial resources | ¾ management plans |
Forward-looking statements also include those preceded or followed by the words "anticipates," "believes," "estimates," "hopes," "plans," "intends" and "expects" or similar expressions. With respect to all forward-looking statements, we claim the protection of the safe harbor for forward-looking statements contained in the Private Securities Litigation Reform Act of 1995.
Actual results could differ materially from those we anticipate or project due to a number of factors, including: (a) changes in consumer confidence and demographics; (b) speed of economic recovery or the possibility of another recession; (c) changes in the real estate and credit markets and their effects on our customers and suppliers; (d) international political unrest, terrorism or war; (e) volatility in energy and other commodities prices; (f) the impact of logistics on imports; (g) interest rate and currency exchange rate changes; (h) operating factors, such as supply, labor or distribution disruptions; (i) any court actions requiring us to return any of the Continued Dumping and Subsidy Offset Act distributions we have received; (j) changes in the domestic or international regulatory environment; (k) adoption of new accounting principles; (l) severe weather or other natural events such as hurricanes, earthquakes, flooding, tornadoes and tsunamis; (m) our ability to procure fabric rolls and leather hides or cut-and-sewn fabric and leather sets domestically or abroad; (n) information technology conversions or system failures; (o) effects of our brand awareness and marketing programs; (p) the discovery of defects in our products resulting in delays in manufacturing, recall campaigns, reputational damage, or increased warranty costs; (q) litigation arising out of alleged defects in our products; (r) our ability to locate new La-Z-Boy Furniture Galleries® stores (or store owners) and negotiate favorable lease terms for new or existing locations; (s) our ability to integrate acquired businesses and realize the benefit of anticipated synergies; (t) the results of our restructuring actions; and (u) those matters discussed in Item 1A of this Annual Report and other factors identified from time-to-time in our reports filed with the Securities and Exchange Commission. We undertake no obligation to update or revise any forward-looking statements, whether to reflect new information or new developments or for any other reason.
PART I
ITEM 1. BUSINESS.
Edward M. Knabusch and Edwin J. Shoemaker started Floral City Furniture in 1927, and in 1928 the newly formed company introduced its first recliner. In 1941, we were incorporated in the state of Michigan as La-Z-Boy Chair Company, and in 1996 we changed our name to La-Z-Boy Incorporated. Today, our La-Z-Boy brand is the most recognized brand in the furniture industry.
La-Z-Boy Incorporated and its subsidiaries manufacture, market, import, distribute and retail upholstery furniture products. In addition, we import, distribute and retail accessories and casegoods (wood) furniture products. We are the leading global producer of reclining chairs and the second largest manufacturer/distributor of residential furniture in the United States according to the May 2014 Key Sources for the U.S. Furniture Market in Furniture Today. The La-Z-Boy Furniture Galleries® stores retail network is the second largest retailer of single-branded furniture in the United States according to the May 2014 Top 100 ranking by Furniture Today . We have seven major North American manufacturing locations to support our speed to market and customization strategy.
3
Table of Contents
We sell our products, primarily in the United States and Canada, to furniture retailers and directly to consumers through stores that our subsidiaries own and operate. The centerpiece of our retail distribution strategy is our network of 315 La-Z-Boy Furniture Galleries® stores and 570 Comfort Studios® locations, each dedicated to marketing our La-Z-Boy branded products. We consider this dedicated space to be "branded outlets" or "proprietary." We own 101 of the La-Z-Boy Furniture Galleries® stores. The remainder of the La-Z-Boy Furniture Galleries® stores, as well as all 570 Comfort Studios® locations, are independently owned and operated. La-Z-Boy Furniture Galleries® stores help consumers furnish their homes by combining the style, comfort and quality of La-Z-Boy furniture with our available in-home design service. Comfort Studios® locations are defined spaces within larger independent retailers that are dedicated to displaying and selling La-Z-Boy branded products. In addition to the La-Z-Boy Comfort Studios® locations, our Kincaid and England operating units have their own dedicated proprietary in-store programs with 500 outlets and 3.8 million square feet of proprietary floor space. In total, our proprietary floor space includes approximately 11.3 million square feet.
During fiscal 2014, we sold substantially all of the assets of our Bauhaus U.S.A. business unit, and we committed to a restructuring of our casegoods business to transition to an all-import model for our wood furniture. As part of this restructuring, we will cease manufacturing casegoods in our Hudson, North Carolina facility during the second quarter of fiscal 2015, and transition our Kincaid and American Drew bedroom product lines to imported product. Also in connection with the restructuring, we are marketing for sale our youth furniture business, Lea Industries, as it does not align with our long-term strategic objectives.
Principal Products and Industry Segments
Our reportable segments are the Upholstery segment, the Casegoods segment and the Retail segment.
Upholstery Segment . Our Upholstery segment is our largest segment in revenue and consists of two operating units: La-Z-Boy, our largest operating unit, and our England subsidiary. Our Upholstery segment manufactures or imports upholstered furniture such as recliners and motion furniture, sofas, loveseats, chairs, sectionals, modulars, ottomans and sleeper sofas. This segment sells directly to La-Z-Boy Furniture Galleries® stores, operators of Comfort Studios® locations, major dealers and other independent retailers.
Casegoods Segment . Our Casegoods segment is an importer, marketer, manufacturer and distributor of casegoods (wood) furniture such as bedroom sets, dining room sets, entertainment centers and occasional pieces, and some coordinated upholstered furniture. The Casegoods segment consists of three brands: American Drew, Hammary, and Kincaid. The Casegoods segment sells primarily to major dealers and other independent retailers.
Retail Segment . Our Retail segment consists of 101 company-owned La-Z-Boy Furniture Galleries® stores located in 12 primary markets ranging from southern California to the Midwest to the East Coast. The Retail segment primarily sells upholstered furniture, in addition to some casegoods and other accessories, to the end consumer through our retail network.
We have provided additional detailed information regarding our segments and their products in Note 18 to our consolidated financial statements and our "Management's Discussion and Analysis" section, both of which are included in this report.
Raw Materials and Parts
The principal raw materials that we use in our Upholstery segment are purchased cover (primarily fabrics and leather), polyester batting and non-chlorofluorocarbonated polyurethane foam for cushioning and padding, lumber and plywood for frames and steel for motion mechanisms, which together account for approximately 81% of the segment's total material costs. Purchased cover is our largest raw material cost in this segment, and represents about 46% of the segment's material costs. We purchase cover from a variety of sources, but we rely on a limited number of major suppliers. We purchase about 82% of our polyurethane foam from one supplier, which has several facilities across the United States that deliver to our plants. If one of these major suppliers experienced financial or other difficulties we could experience temporary disruptions in our manufacturing process until we obtained alternate suppliers.
4
Table of Contents
We purchase approximately 60% (based on cost) of our cover in a raw state (fabric rolls or leather hides) and cut-and-sew it into cover, and 40% in covers that have already been cut-and-sewn by third-party offshore suppliers to our specifications. We buy from five primary suppliers of cut-and-sewn leather and fabric products. Of the products that we import from China, two suppliers manufacture over 90% of the leather cut-and-sewn sets, and four suppliers manufacture approximately 99% of the fabric products.
During fiscal 2014, materials we used in our upholstery manufacturing process increased in price by approximately 2% compared with fiscal 2013. We expect our raw material costs to rise in fiscal 2015 due to increased global demand for leather, polyurethane, and plywood.
As the Casegoods segment is primarily an importer, marketer, and distributor of wood furniture, with some manufacturing operations, raw materials represented only about 13% of the value of our inventory in this segment. At the end of fiscal 2014, the principal raw materials used by our Casegoods manufacturing facility were hardwoods, plywood and chip wood, veneers, liquid stains, paints and finishes, and decorative hardware. Hardwood lumber, plywood, and purchased hardwood components represented about 64% of our total material costs in this segment in fiscal 2014. In April 2014, we committed to a restructuring of our casegoods business to transition to an all-import model for our wood furniture. As a result of the restructuring, we will cease manufacturing casegoods products during the second quarter of fiscal 2015.
Casegoods Finished Goods Imports
We imported 70% of the finished wood furniture that we sold in fiscal 2014 (compared with 72% in fiscal 2013), primarily because of the low labor (both wages and benefits) and overhead costs associated with manufacturing casegoods product overseas. The prices we paid for these imported products in fiscal 2014 were essentially unchanged from fiscal 2013, but we currently expect these prices and associated transportation costs to increase slightly in fiscal 2015. Looking across our wholesale segments, imported finished goods represented only 7% of our consolidated sales in fiscal 2014, down from 9% the year before. As we discussed above, during the second quarter of fiscal 2015, we will begin importing 100% of the casegoods products we offer for sale.
Seasonal Business
We believe that the demand for furniture generally reflects sensitivity to overall economic conditions, including consumer confidence, housing market conditions and unemployment rates. Historically, all of our segments have normally experienced lower sales during our first fiscal quarter. Our Upholstery and Casegoods segments have typically experienced their highest sales during our fourth fiscal quarter while our Retail segment has usually experienced its highest sales during our third fiscal quarter.
During fiscal 2014, however, both our Upholstery segment and our Casegoods segment attained their highest sales during our second fiscal quarter while our Retail segment again experienced its highest level of sales during our third fiscal quarter. All of our segments experienced their lowest sales during our first fiscal quarter. We believe that the change in the seasonality of our sales during fiscal 2014 was the result of weather conditions and not a change in seasonal trends.
When possible, we schedule production to maintain consistent manufacturing activity throughout the year. We shut down our domestic plants for a week in July to perform routine maintenance on our equipment.
5
Table of Contents
Economic Cycle and Purchasing Cycle
Upholstered furniture has a shorter life cycle than casegoods furniture because upholstered furniture is typically more fashion- and design-oriented, and is often purchased one or two pieces at a time. Casegoods products, in contrast, are longer-lived and frequently purchased in groupings or "suites," resulting in a much larger cost to the consumer. As a result, casegoods sales are more sensitive to economic conditions, and upholstered furniture normally exhibits a less volatile sales pattern over an economic cycle.
Practices Regarding Working Capital Items
The following describes our significant practices regarding working capital items.
Inventory: For our upholstery segment, we maintain raw materials and work in process inventory at our manufacturing locations, and finished goods inventory at our six regional distribution centers. Our regional distribution centers allow us to streamline the warehousing and distribution processes for our La-Z-Boy Furniture Galleries® store network, including both company-owned stores and independently owned stores. Regional distribution centers also allow us to reduce the number of individual warehouses we need to supply our retail outlets and help us reduce our inventory levels at our manufacturing and retail locations. We also maintain some finished goods inventory at our manufacturing locations, which primarily supports efficient shipping of sold orders.
Rather than manufacture casegoods to fill custom orders, we generally build or import them to go into inventory to enable us to attain manufacturing efficiencies and meet our customers' delivery requirements. This practice results in higher levels of finished goods inventory, as a percentage of sales, of our casegoods products than our upholstery products. Our company-owned La-Z-Boy Furniture Galleries® stores maintain finished goods inventory at the stores for display purposes.
Our inventory increased $0.7 million during fiscal 2014 compared with fiscal 2013, and decreased 0.7 percentage point as a percentage of sales. We will continue to manage our inventory levels to ensure they are appropriate relative to our sales, while maintaining our focus on service to our customers.
Accounts Receivable: During fiscal 2014, our accounts receivable decreased $7.4 million compared with fiscal 2013, and decreased 1.4 percentage points as a percentage of sales. The improvement in our cash collections was the result of an improvement in the financial condition of our customer base, including our independent La-Z-Boy Furniture Galleries® dealers. We continue to monitor our customers' accounts and limit our credit exposure to certain independent dealers, and decrease our days sales outstanding where possible.
Accounts Payable: During fiscal 2014, our accounts payable increased $5.6 million compared with fiscal 2013, an increase of 0.1 percentage point as a percentage of sales. The increase was mainly due to higher sales volume (and therefore higher costs) in fiscal 2014, as well as amounts related to construction of our new world headquarters.
Customers
Our wholesale customers are furniture retailers located primarily throughout the United States and Canada. We did not have any single customer whose purchases amounted to more than 5% of our consolidated, Upholstery segment, or Casegoods segment sales in fiscal 2014. Sales in our Upholstery and Casegoods segments are almost entirely to furniture retailers, but we sell to consumers through our company-owned La-Z-Boy Furniture Galleries® stores that make up our Retail segment.
We have formal agreements with many furniture retailers for them to display and merchandise products from one or more of our operating units and sell them to consumers in dedicated retail space, either in stand-alone stores or dedicated proprietary galleries or studios within their stores. We consider this dedicated space to be "proprietary." For our Upholstery and Casegoods segments, our fiscal 2014 customer mix based on sales was about 48% proprietary, 8% major dealers (for example, Art Van Furniture, Berkshire Hathaway, Slumberland Furniture, and Raymour & Flanigan Furniture) and 44% other independent retailers.
6
Table of Contents
The success of our product distribution relies heavily on having retail floor space that is dedicated to displaying and marketing our products. Our La-Z-Boy Furniture Galleries® stores network has the largest number of proprietary stores and galleries among our operating units. According to the May 2014 Top 100 ranking by Furniture Today, an industry trade publication, the La-Z-Boy Furniture Galleries® stores retail network is the second largest retailer of single-brand furniture in the United States.
Maintaining, updating, and expanding, when appropriate, our proprietary distribution network is a key part of our overall sales and marketing strategy. Our 4-4-5 program, through which we expect to expand the La-Z-Boy Furniture Galleries® stores network to 400 stores averaging $4 million in sales per store over the five year period that began with fiscal 2014, is a key growth strategy for us. As we continue to maintain and update our current stores, the La-Z-Boy Furniture Galleries® store network plans to open, relocate or remodel 30 to 35 stores during fiscal 2015. All of these new stores will feature the new concept store design we developed and introduced in fiscal 2012.
We select independent dealers for our proprietary La-Z-Boy Furniture Galleries® store network based on factors such as their management and financial qualifications and the potential for distribution in specific geographical areas. This proprietary distribution benefits La-Z-Boy, our dealers and our consumers. It enables La-Z-Boy to concentrate our marketing with sales personnel dedicated to our entire product line, and only that line. It allows dealers who join this proprietary group to take advantage of practices that other proprietary dealers have succeeded with, and we facilitate forums for these dealers to share best practices. These La-Z-Boy Furniture Galleries® stores provide our consumers a full-service shopping experience with a large variety of product and knowledgeable sales associates and in-home design consultants.
Orders and Backlog
We typically build upholstery orders based on specific dealer orders, either for dealer stock or to fill a consumer's custom order, and normally do not allow customers to cancel orders once the orders have been selected for production. We have casegoods produced primarily to our internal order, rather than a customer or consumer order, resulting in higher finished goods inventory on hand as a percentage of sales. Because the size of our backlog at a given time may not be indicative of our future sales, we do not rely entirely on backlogs to predict future sales.
For our continuing operations, as of April 26, 2014, and April 27, 2013, our Upholstery segment backlogs were approximately $77.0 million and $76.0 million, respectively, and our Casegoods segment backlogs were approximately $15.4 million and $11.3 million, respectively.
Competitive Conditions
According to the May 2014 Key Sources for the U.S. Furniture Market in Furniture Today , we are currently the second largest manufacturer/distributor of residential (living and family room, bedroom, and dining room) furniture in the United States, as measured by annual sales volume.
In the Upholstery segment, our largest competitors are Ashley, Bassett Furniture, Bernhardt, Ethan Allen, Flexsteel, Heritage Home Group, Klaussner, and Natuzzi.
In the Casegoods segment, our main competitors are Ashley, Bernhardt, Ethan Allen, Heritage Home Group, Hooker Furniture, Stanley Furniture, and Lacquer Craft. The Casegoods segment faces additional market pressures from foreign manufacturers entering the United States market and increased direct purchases from foreign suppliers by large United States retailers.
The La-Z-Boy Furniture Galleries® stores operate in the retail furniture industry throughout North America, and different stores have different competitors based on their locations. Competitors include: Arhaus, Ashley, Bassett Furniture Direct, Crate and Barrel, Ethan Allen, Restoration Hardware, Thomasville Home Furnishings Stores, several other regional competitors (for example Art Van Furniture, Raymour & Flanigan Furniture, and Slumberland Furniture), and family-owned independent furniture stores.
7
Table of Contents
In addition to the larger competitors listed above, a substantial number of small and medium-sized companies operate within our business segments, all of which are highly competitive.
Over the past decade alternative distribution channels have increasingly affected our retail markets. Companies such as Costco, Home Depot, IKEA, Sam's Club, Target, Wal-Mart, Williams Sonoma, QVC, Wayfair and others now offer products that compete with some of our product lines. The increased ability of consumers to purchase furniture through various furniture manufacturers' and retailers' internet websites has also increased competition.
Players in the home furnishings industry compete primarily on the basis of product styling and quality, customer service (product availability and delivery), and price. We compete primarily by emphasizing our brand and the value, comfort, quality, and styling of our products. In addition, we remain committed to innovation while striving to provide outstanding customer service, exceptional dealer support, and efficient on-time delivery. Maintaining, updating and expanding our proprietary distribution system is a key strategic initiative for us in striving to remain competitive. We compete in the mid-to-upper-mid price point, and a shift in consumer taste and trends to lower priced products could negatively affect our competitive position.
Research and Development Activities
We provide information regarding our research and development activities in Note 1 to our consolidated financial statements, which is included in Item 8 of this report.
Trademarks, Licenses and Patents
We own several trademarks, including La-Z-Boy, our most valuable. The La-Z-Boy trademark is essential to the upholstery and retail segments of our business. To protect our trademarks, we have registered them in the United States and various other countries where our products are sold. These trademarks have a perpetual life, subject to renewal. We license the use of the La-Z-Boy trademark to our major international partners and dealers outside of North America. We also license the use of the La-Z-Boy trademark on contract office furniture, outdoor furniture and non-furniture products, and these arrangements enhance our brand awareness, broaden the perceptions of La-Z-Boy and create visibility of the La-Z-Boy brand in channels outside of the furniture industry. In addition, we license to our branded dealers the right to use our La-Z-Boy trademark in connection with the sale of our products and related services, on their signs, and in other ways, which we consider to be a key part of our marketing strategies. We provide more information about those dealers, under "Customers."
We hold a number of patents that we actively enforce, but we believe that the loss of any single patent or group of patents would not significantly affect our business.
Compliance with Environmental Regulations
Our manufacturing operations involve the use and disposal of certain substances regulated under environmental protection laws, and we are involved in a small number of remediation actions and site investigations concerning such substances. Based on a review of all currently known facts and our experience with previous environmental matters, we believe we have adequate reserves in respect of probable and reasonably estimable losses arising from environmental matters and currently do not anticipate any material loss.
Employees
We employed approximately 8,300 full-time equivalent employees as of April 26, 2014, compared with 8,185 employees at the end of fiscal 2013. We employed approximately 7,000 in our upholstery segment, 340 in our Casegoods segment, 750 in our Retail segment, and the remaining employees as corporate personnel. We employ the majority of our employees on a full-time basis except in our Retail segment, where we have approximately 630 part-time employees.
8
Table of Contents
Financial Information About Foreign and Domestic Operations and Export Sales
In fiscal 2014, our direct export sales, including sales in Canada, were approximately 14% of our total sales. We are a part of a manufacturing joint venture in Thailand, which distributes furniture in Australia, New Zealand, Thailand and other countries in Asia. In addition, we participate in a sales and marketing joint venture in Asia, which sells and distributes furniture in Korea, Taiwan, Japan, India, Malaysia, and other Asian countries.
We operate a facility in Mexico which produces cut-and-sewn fabric sets for our domestic upholstery manufacturing facilities. We provide information on sales in the United States, Canada, and other countries in Note 18 to our consolidated financial statements, which is included in Item 8 of this report. Our net property, plant, and equipment value in the United States was $120.7 million and $109.9 million at the end of fiscal 2014 and fiscal 2013, respectively. Our net property, plant, and equipment value in foreign countries was $6.8 million and $8.2 million in fiscal 2014 and fiscal 2013, respectively.
See Item 1A of this report for information about the risks related to our foreign operations.
Internet Availability
Our Forms 10-K, 10-Q, 8-K, and proxy statements on Schedule 14A and amendments to those reports are available free of charge through links on our internet website, www.la-z-boy.com, as soon as reasonably practicable after they are electronically filed with, or furnished to, the Securities and Exchange Commission (SEC). Copies of any materials we file with the SEC can also be obtained free of charge through the SEC's website at www.sec.gov. The information on our website is not part of this report.
ITEM 1A. RISK FACTORS.
Our business is subject to a variety of risks. Interest rates, consumer confidence, housing starts and the overall housing market, increased unemployment, tightening of the financial and consumer credit markets, downturns in the economy and other general economic factors that affect many other businesses are particularly significant to us because our principal products are consumer goods.
The risks and uncertainties described below are those that we currently believe may significantly affect our business. Additional risks and uncertainties that we are unaware of or that we do not currently deem significant may also become important factors that affect us at a later date. You should carefully consider the risks and uncertainties described below, together with the other information provided in this document and our subsequent filings with the Securities and Exchange Commission. Any of the following risks could significantly and adversely affect our business, results of operations, and financial condition.
Fluctuations in the price, availability and quality of raw materials could cause delays that could result in our inability to provide goods to our customers or could increase our costs, either of which could decrease our earnings.
In manufacturing furniture, we use various types of wood, fabrics, leathers, upholstered filling material, steel, and other raw materials. Because we are dependent on outside suppliers for our raw materials, fluctuations in their price, availability and quality could have a negative effect on our cost of sales and our ability to meet our customers' demands. Competitive and marketing pressures may prevent us from passing along price increases to our customers, and the inability to meet our customers' demands could cause us to lose sales. Since we have a higher concentration (70%) in upholstery sales, including motion furniture, than most of our competitors, the effects of steel, polyurethane foam, leather and fabric price increases or quantity shortages are more significant for our business than for most other publicly traded furniture companies. About 82% of our polyurethane foam comes from one supplier. This supplier has several facilities across the United States, but severe weather or natural disasters could result in delays in shipments of polyurethane foam to our plants.
9
Table of Contents
A change in the financial condition of some of our domestic and foreign fabric suppliers could impede their ability to provide their products to us in a timely manner. Upholstered furniture is fashion oriented, and if we are not able to acquire sufficient fabric variety, or if we are unable to predict or respond to changes in fashion trends, we may lose sales and have to sell excess inventory at reduced prices. Doing so would have a negative effect on our sales and earnings.
Availability of foreign sourcing and economic uncertainty in countries outside of the United States in which we operate or from which we purchase product could adversely affect our business and results of operations.
We have operations in countries outside the United States, some of which are located in emerging markets. Long-term economic and political uncertainty in some of the countries in which we operate, such as Mexico and Thailand, could result in the disruption of markets and negatively affect our business. Our Casegoods segment is primarily an importer of products manufactured by foreign sources, mainly in China and Vietnam, and our Upholstery segment purchases cut-and-sewn fabric and leather sets and some finished goods from Chinese and other foreign vendors. The majority of the cut-and-sewn leather kits that we purchase from China are from one supplier. Our sourcing partners may not be able to produce goods in a timely fashion or the quality of their product may lead us to reject it, causing disruptions in our domestic operations and delays in our shipments to our customers.
There are other risks that are inherent in our non-U.S. operations, including the potential for changes in socio-economic conditions, changes in laws and regulations, including import, export, labor and environmental laws, tariffs and trade barriers, monetary and fiscal policies, investments, taxation, and exchange controls. Additionally, unsettled political conditions, possible terrorist attacks, organized crime and public health concerns present a risk to our non-U.S. operations. All of these items could make servicing our customers more difficult or cause disruptions in our plants that could reduce our sales, earnings, or both in the future.
Inability to maintain and enhance our brand and respond to changes in our current and potential customers' tastes and trends in a timely manner could adversely affect our business and operating results.
The success of our business depends on our ability to maintain and enhance our brands to increase our business by retaining customers and attracting new ones. Because furniture product is fashion oriented, changes in consumers' tastes and trends and the resultant change in our product mix could adversely affect our business and operating results. We attempt to minimize these risks by maintaining a strong advertising and marketing campaign promoting both our brands and our current product designs, styles, quality and prices. If these efforts are unsuccessful or require us to incur substantial costs, our business, operating results and financial or competitive condition could be adversely affected.
Loss of market share and other financial or operational difficulties due to competition would likely result in a decrease in our sales, earnings, and liquidity.
The residential furniture industry is highly competitive and fragmented. We compete with many other manufacturers and retailers, including online retailers, some of which offer widely advertised products, and others of which are large retail furniture dealers offering their own store-branded products. Competition in the residential furniture industry is based on quality, style of products, perceived value, price, service to the customer, promotional activities, and advertising. The highly competitive nature of the industry means we are constantly subject to the risk of losing market share, which would likely decrease our future sales, earnings and liquidity. In addition, due to the large number of competitors and their wide range of product offerings, we may not be able to differentiate our products (through styling, finish, and other construction techniques) from those of our competitors. These and other competitive pressures could result in a decrease in our sales, earnings, and liquidity.
10
Table of Contents
Our current retail markets and other markets that we enter in the future may not achieve the growth and profitability we anticipate. We could incur charges for the impairment of long-lived assets if we cannot meet our earnings expectations for these markets.
From time to time we acquire retail locations and related assets, remodel and relocate existing stores, and close underperforming stores. Our assets include goodwill and other indefinite-lived intangible assets in connection with acquisitions. Profitability of acquired, remodeled, and relocated stores will depend on lease rates (for stores we lease) and retail sales and profitability justifying the costs of acquisition, remodeling, and relocation. If we cannot meet our sales or earnings expectations for these stores, we may incur charges for the impairment of long-lived assets, the impairment of goodwill, or the impairment of other indefinite-lived intangible assets.
Changes in regulation of our international operations could adversely affect our business and results of operations.
Because we have operations outside of the United States and sell product in various countries, we are subject to many laws governing international relations, including the Foreign Corrupt Practices Act and the U.S. Export Administration Act. These laws include prohibitions on improper payments to government officials and restrictions on where we can do business, what products we can supply to certain countries, and what information we can provide to certain governments. Violations of these laws, which are complex, may result in criminal penalties or sanctions that could have a significant adverse effect on our business and results of operations. Although we have implemented policies and procedures designed to ensure compliance with these laws, there can be no assurance that our employees, contractors, or agents will not violate our policies.
Changes in the economy could have a significant negative effect on our sales, results of operations and cash flows.
Our business is subject to international, national and regional economic conditions. The global economy experienced a major recession beginning in 2008. Although American and other economies have improved since then, the pace of improvement in housing, consumer confidence, unemployment and access to consumer credit has not returned to historic levels. In addition, repercussions from continuing issues with European debt and currency could further damage the U.S. economy. These factors are outside of our control but they directly affect our business. An economic downturn could cause our current and potential customers to delay their purchases or affect their ability to pay, which could reduce our future sales, results of operations and cash flows.
We rely extensively on computer systems to process transactions, summarize results and manage our business and that of certain independent dealers. Disruptions in both our primary and back-up systems could adversely affect our business and operating results.
Our primary and back-up computer systems are subject to damage or interruption from power outages, computer and telecommunications failures, computer viruses, security breaches, natural disasters and errors by employees. Though losses arising from some of these issues would be covered by insurance, interruptions of our critical business computer systems or failure of our back-up systems could reduce our sales or result in longer production times. If our critical business computer systems or back-up systems are damaged or cease to function properly, we may have to make a significant investment to repair or replace them.
In addition, we are implementing an enterprise resource planning or ERP system in our largest operating unit, which we expect to accomplish in phases over the next two years. ERP implementations are complex and time-consuming projects that involve substantial expenditures on system software and implementation activities. ERP implementations also require transformation of business and financial processes in order to reap the benefits of the ERP system; any such transformation involves risks inherent in the conversion to a new computer system, including loss of information and potential disruption to our normal operations. Our business and results of operations may be adversely affected if we experience operating problems and/or cost overruns during the ERP implementation process, or if the ERP system and the associated process changes do not give rise to the benefits that we expect. Additionally, if we do not effectively implement the ERP system as planned or if the system does not operate as intended, it could adversely affect the effectiveness of or cause delays in our ability to adequately assess our internal control over financial reporting. Significant delays in documenting, reviewing and testing our internal control could cause us to fail to comply with our SEC reporting obligations related to our management's assessment of our internal control over financial reporting.
11
Table of Contents
We may be subject to product liability claims or undertake to recall one or more products, with a negative impact on our financial results and reputation.
Millions of our products, sold over many years, are currently used by consumers. We may be named as a defendant in lawsuits instituted by persons allegedly injured while using one of our products. We have insurance that we believe is adequate to cover such claims, but we are self-insured for the first $1.5 million in liability and defense costs. Furthermore, such claims could damage our brands and reputation and negatively affect our operating results. In addition, regulation of consumer products has increased in recent years as the U.S. Consumer Product Safety Commission has acquired greater regulatory and enforcement power. Products that we have previously sold could be the subject of one or more recalls, resulting in related expenses and potential penalties, injury to our brands and reputation, and negative impact on our operating results.
Our business and our reputation could be adversely affected by the failure to protect sensitive employee and customer data or to comply with evolving regulations relating to our obligation to protect such data.
Cyber-attacks designed to gain access to sensitive information by breaching security systems of large organizations leading to unauthorized release of confidential information have occurred recently at a number of major U.S. companies despite widespread recognition of the cyber-attack threat and improved data protection methods. A breach in our systems that results in the unauthorized release of sensitive data could have a material adverse effect on our reputation, and lead to financial losses from remedial actions or potential liability, possibly including for punitive damages. An electronic security breach resulting in the unauthorized release of sensitive data from our information systems could also materially increase the costs we already incur to protect against such risks.
We are dependent upon suppliers for a portion of raw materials used in the manufacturing of our products and new regulations related to conflict-free minerals could require us to incur significant additional expenses in connection with procuring these raw materials.
Pursuant to the Dodd-Frank Wall Street Reform and Consumer Protection Act, the SEC requires companies to disclose the use of certain minerals, known as "conflict minerals," in their products. Companies that are subject to the rules must perform supply chain diligence and disclose whether or not such minerals originate from the Democratic Republic of Congo and adjoining countries. If the rules remain effective, these new requirements will require on-going due diligence efforts and compliance with annual disclosure requirements. There may be significant costs associated with complying with these disclosure requirements, including identifying the sources of any "conflict minerals" that may be used in our products. In addition, the implementation of these rules could adversely affect the sourcing, supply and pricing of materials used in our products.
ITEM 1B. UNRESOLVED STAFF COMMENTS.
None.
12
Table of Contents
ITEM 2. PROPERTIES.
We owned or leased approximately 10.8 million square feet of manufacturing, warehousing and distribution centers, office, showroom, and retail facilities, and had approximately 1.4 million square feet of idle facilities, at the end of fiscal 2014. Of the 10.8 million square feet occupied at the end of fiscal 2014, our Upholstery segment occupied approximately 6.5 million square feet, our Casegoods segment occupied approximately 2.0 million square feet, our Retail segment occupied approximately 1.9 million square feet and our Corporate and other operations occupied the balance.
Our active facilities and retail locations are located in Arkansas, California, Connecticut, Delaware, Florida, Illinois, Indiana, Kansas, Kentucky, Maryland, Massachusetts, Michigan, Mississippi, Missouri, Nevada, New Hampshire, New Jersey, New York, North Carolina, Ohio, Pennsylvania, Rhode Island, Tennessee, Utah, Virginia, Washington D.C., Wisconsin, Coahuila (Mexico) and Bangkok (Thailand). All of our plants and stores are well maintained and insured. We do not expect any major land or building additions will be needed to increase capacity in the foreseeable future for our manufacturing operations. We own all of our domestic plants and our joint venture owns our Thailand plant. We lease the majority of our retail stores and regional distribution centers, as well as our manufacturing facility in Mexico. For information on terms of operating leases for our properties, see Note 12 to our consolidated financial statements, which is included in Item 8 of this report.
ITEM 3. LEGAL PROCEEDINGS.
We are involved in various legal proceedings arising in the ordinary course of our business. Based on a review of all currently known facts and our experience with previous legal matters, we have recorded expense in respect of probable and reasonably estimable losses arising from legal matters and currently do not anticipate any material additional loss.
ITEM 4. MINE SAFETY DISCLOSURES.
Not applicable.
13
Table of Contents
EXECUTIVE OFFICERS OF THE REGISTRANT
Listed below are the names, ages and current positions of our executive officers and, if they have not held those positions for at least five years, their former positions during that period with us or other companies. All executive officers serve at the pleasure of the board of directors.
Kurt L. Darrow, age 59
• Chairman, President and Chief Executive Officer since August 2011
• President and Chief Executive Officer from September 2003 through August 2011
Louis M. Riccio, Jr., age 51
• Senior Vice President of La-Z-Boy and Chief Financial Officer since July 2006
• Treasurer from February 2010 through April 2010
Mark S. Bacon, Sr., age 51
• Senior Vice President of La-Z-Boy and President of La-Z-Boy Branded Business since July 2011
• Senior Vice President of La-Z-Boy and Chief Retail Officer from October 2008 through July 2011
Steven M. Kincaid, age 65
• Senior Vice President of La-Z-Boy and President of Casegoods since November 2003
• President, Kincaid Furniture Company, Incorporated since June 1983
Otis S. Sawyer, age 56
• Senior Vice President of La-Z-Boy and President of Non-Branded Upholstery since February 2008
• President, England, Inc. since February 2008
14
Table of Contents
PART II
ITEM 5. MARKET FOR REGISTRANT'S COMMON EQUITY, RELATED STOCKHOLDER MATTERS AND ISSUER PURCHASES OF EQUITY SECURITIES.
Dividend and Market Information
The New York Stock Exchange is the principal market on which our common stock is traded. The tables below show the high and low sale prices of our common stock on the New York Stock Exchange during each quarter of our last two fiscal years.
|
| Market Price | ||||||||||||||
Fiscal 2014 Quarter Ended | Dividends Paid | High | Low | Close | ||||||||||||
July 27 | $ | 0.04 | $ | 22.33 | $ | 17.48 | $ | 20.34 | ||||||||
October 26 | $ | 0.04 | $ | 24.42 | $ | 20.12 | $ | 23.35 | ||||||||
January 25 | $ | 0.06 | $ | 31.22 | $ | 22.79 | $ | 27.19 | ||||||||
April 26 | $ | 0.06 | $ | 28.48 | $ | 24.04 | $ | 24.55 | ||||||||
| $ | 0.20 | ||||||||||||||
|
| Market Price | ||||||||||||||
Fiscal 2013 Quarter Ended | Dividends Paid | High | Low | Close | ||||||||||||
July 28 | $ | - | $ | 16.43 | $ | 10.95 | $ | 12.09 | ||||||||
October 27 | $ | - | $ | 17.13 | $ | 11.46 | $ | 16.18 | ||||||||
January 26 | $ | 0.04 | $ | 17.06 | $ | 13.30 | $ | 15.74 | ||||||||
April 27 | $ | 0.04 | $ | 19.43 | $ | 15.00 | $ | 17.69 | ||||||||
| $ | 0.08 | ||||||||||||||
Our credit agreement would prohibit us from paying dividends or purchasing shares if excess availability, as defined in the agreement, fell below 12.5% of the revolving credit commitment or if we failed to maintain a fixed charge coverage ratio of at least 1.05 to 1.00 on a pro forma basis. The agreement would not currently prohibit us from paying dividends or repurchasing shares. Refer to Note 11 of the consolidated financial statements in Item 8 for further discussion of our credit agreement. The payment of future cash dividends is within the discretion of our board of directors and will depend, among other factors, on our earnings, capital requirements and operating and financial condition, as well as excess availability under the credit agreement.
Shareholders
We had approximately 13,900 shareholders of record at June 10, 2014.
15
Table of Contents
Equity Plans
The table below provides information concerning our compensation plans under which common shares may be issued.
Equity Compensation Plan Information as of April 26, 2014
Plan category | Number of securities to be issued upon exercise of outstanding options (i) | Weighted- average exercise price of outstanding options (ii) | Number of securities remaining available for future issuance under equity compensation plans (excluding securities reflected in column (i)) (iii) | |||||||||
Equity compensation plans approved by shareholders | 798,270 | (1) | $ | 11.79 | 6,828,381 | (2) | ||||||
Note 1: These options were issued under our 2010 Omnibus Incentive Plan and 2004 Long-Term Equity Award Plan. No additional options can be awarded under the 2004 plan, but as of April 26, 2014, 30,050 options were still outstanding under the 2004 plan.
Note 2: This amount is the aggregate number of shares available for future issuance under our 2010 Omnibus Incentive Plan. The omnibus incentive plan provides for awards of stock options, restricted stock, and performance awards (awards of our common stock based on achievement of pre-set goals over a performance period) to selected key employees and non-employee directors. We have performance awards outstanding under the plan that would reduce the number of shares remaining available for future issuance under the plan by 2,184,357 shares, assuming the maximum performance targets were achieved.
16
Table of Contents
Performance Graph
The graph below shows the cumulative total return for our last five fiscal years that would have been realized (assuming reinvestment of dividends) by an investor who invested $100 on April 25, 2009 in our common shares, in the S&P 500 Composite Index and in the Dow Jones U.S. Furnishings Index.
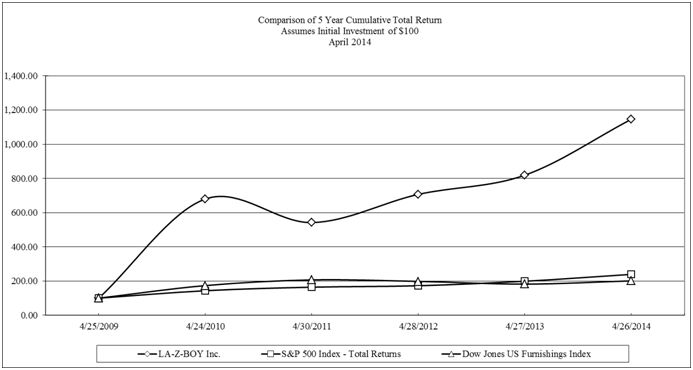
Company/Index/Market | 2009 | 2010 | 2011 | 2012 | 2013 | 2014 | ||||||||||||||||||
La-Z-Boy Incorporated | $ | 100 | $ | 679.72 | $ | 541.94 | $ | 706.91 | $ | 819.30 | $ | 1,146.54 | ||||||||||||
S&P 500 Composite Index | $ | 100 | $ | 143.50 | $ | 164.03 | $ | 172.49 | $ | 198.92 | $ | 239.23 | ||||||||||||
Dow Jones U.S. Furnishings Index | $ | 100 | $ | 173.53 | $ | 206.76 | $ | 197.97 | $ | 182.03 | $ | 200.96 | ||||||||||||
17
Table of Contents
Purchases of Equity Securities by the Issuer and Affiliated Purchasers
Our board of directors has authorized the purchase of company stock. As of April 26, 2014, 2.8 million shares remained available for purchase pursuant to this authorization. We spent $32.1 million in fiscal 2014 to purchase 1.3 million shares . During the fourth quarter of fiscal 2014, pursuant to the existing board authorization, we adopted a plan to purchase company stock pursuant to Rule 10b5-1 of the Securities Exchange Act of 1934. The plan was effective May 5, 2014. Under this plan, our broker has the authority to purchase company shares on our behalf, subject to SEC regulations and the price, market volume and timing constraints specified in the plan. The plan expires at the close of business on August 31, 2014. With the cash flows we anticipate generating in fiscal 2015, we expect to continue being opportunistic in purchasing company stock.
The following table summarizes our purchases of company stock during the fourth quarter of fiscal 2014:
(Shares in thousands) | Total number of shares purchased | Average price paid per share | Total number of shares purchased as part of publicly announced plan | Maximum number of shares that may yet be purchased under the plan | ||||||||||||
Fiscal February (January 26 – March 1, 2014) | 201 | $ | 26.52 | 201 | 3,080 | |||||||||||
Fiscal March (March 2 – March 29, 2014) | 230 | $ | 26.42 | 230 | 2,850 | |||||||||||
Fiscal April (March 30 – April 26, 2014) | 15 | $ | 26.78 | 15 | 2,835 | |||||||||||
Fiscal Fourth Quarter of 2014 | 446 | $ | 26.48 | 446 | 2,835 | |||||||||||
Recent Sales of Unregistered Securities
There were no sales of unregistered securities during fiscal year 2014.
18
Table of Contents
ITEM 6. SELECTED FINANCIAL DATA.
The following table presents our selected financial data. The table should be read in conjunction with Item 7, Management's Discussion and Analysis of Financial Condition and Results of Operations , and Item 8, Financial Statements and Supplementary Data , of this Annual Report on Form 10-K. This information is derived from our audited financial statements and should be read in conjunction with those statements, including the related notes.
Consolidated Five-Year Summary of Financial Data
(Dollar amounts in thousands, except per share data) | (52 weeks) | (52 weeks) | (52 weeks) | (53 weeks) | (52 weeks) | |||||||||||||||
Fiscal Year Ended | 4/26/2014 | 4/27/2013 | 4/28/2012 | 4/30/2011 | 4/24/2010 | |||||||||||||||
Sales | $ | 1,357,318 | $ | 1,273,877 | $ | 1,166,705 | $ | 1,115,489 | $ | 1,101,632 | ||||||||||
Cost of sales | ||||||||||||||||||||
Cost of goods sold | 888,025 | 854,542 | 795,957 | 773,256 | 738,625 | |||||||||||||||
Restructuring | 4,839 | 2,480 | 13 | (162 | ) | 2,141 | ||||||||||||||
Total cost of sales | 892,864 | 857,022 | 795,970 | 773,094 | 740,766 | |||||||||||||||
Gross profit | 464,454 | 416,855 | 370,735 | 342,395 | 360,866 | |||||||||||||||
Selling, general and administrative expense | 375,158 | 349,101 | 321,770 | 314,078 | 321,096 | |||||||||||||||
Restructuring | - | 151 | 268 | 650 | 1,293 | |||||||||||||||
Write-down of long-lived assets | - | - | - | 4,392 | - | |||||||||||||||
Operating income | 89,296 | 67,603 | 48,697 | 23,275 | 38,477 | |||||||||||||||
Interest expense | 548 | 746 | 1,384 | 2,346 | 2,972 | |||||||||||||||
Interest income | 761 | 620 | 609 | 943 | 723 | |||||||||||||||
Income from Continued Dumping and Subsidy Offset Act, net | - | - | 11,066 | 648 | 3,269 | |||||||||||||||
Other income (expense), net | 2,050 | 3,208 | (38 | ) | 402 | 482 | ||||||||||||||
Income from continuing operations before income taxes | 91,559 | 70,685 | 58,950 | 22,922 | 39,979 | |||||||||||||||
Income tax expense (benefit) | 31,383 | 23,520 | (25,052 | ) | 7,409 | 10,669 | ||||||||||||||
Income from continuing operations | 60,176 | 47,165 | 84,002 | 15,513 | 29,310 | |||||||||||||||
Income (loss) from discontinued operations, net of tax | (3,796 | ) | 17 | 4,906 | 1,860 | 2,049 | ||||||||||||||
Net income | 56,380 | 47,182 | 88,908 | 17,373 | 31,359 | |||||||||||||||
Net (income) loss attributable to noncontrolling interests | (1,324 | ) | (793 | ) | (942 | ) | 6,674 | 1,342 | ||||||||||||
Net income attributable to La-Z-Boy Incorporated | $ | 55,056 | $ | 46,389 | $ | 87,966 | $ | 24,047 | $ | 32,701 | ||||||||||
| ||||||||||||||||||||
Net income attributable to La-Z-Boy Incorporated: | ||||||||||||||||||||
Income from continuing operations attributable to La-Z-Boy Incorporated | $ | 58,852 | $ | 46,372 | $ | 83,060 | $ | 22,187 | $ | 30,652 | ||||||||||
Income (loss) from discontinued operations | (3,796 | ) | 17 | 4,906 | 1,860 | 2,049 | ||||||||||||||
Net income attributable to La-Z-Boy Incorporated | $ | 55,056 | $ | 46,389 | $ | 87,966 | $ | 24,047 | $ | 32,701 | ||||||||||
| ||||||||||||||||||||
Basic weighted average shares | 52,386 | 52,351 | 51,944 | 51,849 | 51,533 | |||||||||||||||
Basic net income attributable to La-Z-Boy Incorporated per share: | ||||||||||||||||||||
Income from continuing operations attributable to La-Z-Boy Incorporated | $ | 1.11 | $ | 0.87 | $ | 1.57 | $ | 0.42 | $ | 0.59 | ||||||||||
Income (loss) from discontinued operations | (0.07 | ) | - | 0.09 | 0.04 | 0.04 | ||||||||||||||
Basic net income attributable to La-Z-Boy Incorporated per share | $ | 1.04 | $ | 0.87 | $ | 1.66 | $ | 0.46 | $ | 0.63 | ||||||||||
| ||||||||||||||||||||
Diluted weighted average shares | 53,829 | 53,685 | 52,478 | 52,279 | 51,732 | |||||||||||||||
Diluted net income (loss) attributable to La-Z-Boy Incorporated per share: | ||||||||||||||||||||
Income from continuing operations attributable to La-Z-Boy Incorporated | $ | 1.09 | $ | 0.85 | $ | 1.55 | $ | 0.41 | $ | 0.58 | ||||||||||
Income (loss) from discontinued operations | (0.07 | ) | - | 0.09 | 0.04 | 0.04 | ||||||||||||||
Diluted net income attributable to La-Z-Boy Incorporated per share | $ | 1.02 | $ | 0.85 | $ | 1.64 | $ | 0.45 | $ | 0.62 | ||||||||||
| ||||||||||||||||||||
Dividends declared per share | $ | 0.20 | $ | 0.08 | $ | - | $ | - | $ | - | ||||||||||
Book value of year-end shares outstanding (1) | $ | 10.04 | $ | 9.25 | $ | 8.46 | $ | 6.96 | $ | 6.56 | ||||||||||
19
Table of Contents
Consolidated Five-Year Summary of Financial Data (continued)
(Dollar amounts in thousands) | (52 weeks) | (52 weeks) | (52 weeks) | (53 weeks) | (52 weeks) | |||||||||||||||
Fiscal Year Ended | 4/26/2014 | 4/27/2013 | 4/28/2012 | 4/30/2011 | 4/24/2010 | |||||||||||||||
Return on average total equity (2) | 11.8 | % | 10.0 | % | 20.7 | % | 4.4 | % | 9.1 | % | ||||||||||
Gross profit as a percent of sales | 34.2 | % | 32.7 | % | 31.8 | % | 30.7 | % | 32.8 | % | ||||||||||
Operating profit as a percent of sales | 6.6 | % | 5.3 | % | 4.2 | % | 2.1 | % | 3.5 | % | ||||||||||
Effective tax rate (2) | 34.3 | % | 33.3 | % | (42.5 | )% | 32.3 | % | 26.7 | % | ||||||||||
Return on sales (2) | 4.4 | % | 3.7 | % | 7.2 | % | 1.4 | % | 2.7 | % | ||||||||||
| ||||||||||||||||||||
Depreciation and amortization | $ | 23,182 | $ | 23,140 | $ | 23,486 | $ | 24,302 | $ | 25,246 | ||||||||||
Capital expenditures | $ | 33,730 | $ | 25,912 | $ | 15,663 | $ | 10,540 | $ | 10,986 | ||||||||||
Property, plant and equipment, net | $ | 127,535 | $ | 118,060 | $ | 114,366 | $ | 120,603 | $ | 138,857 | ||||||||||
| ||||||||||||||||||||
Working capital | $ | 355,290 | $ | 350,717 | $ | 350,241 | $ | 300,119 | $ | 279,768 | ||||||||||
Current ratio (3) | 3.1 to 1 | 3.3 to 1 | 3.3 to 1 | 3.3 to 1 | 2.9 to 1 | |||||||||||||||
Total assets | $ | 771,295 | $ | 720,371 | $ | 685,739 | $ | 593,455 | $ | 607,783 | ||||||||||
| ||||||||||||||||||||
Long-term debt, excluding current portion | $ | 277 | $ | 7,576 | $ | 7,931 | $ | 29,937 | $ | 46,917 | ||||||||||
Total debt | $ | 7,774 | $ | 8,089 | $ | 9,760 | $ | 35,057 | $ | 47,983 | ||||||||||
Total equity | $ | 529,718 | $ | 491,968 | $ | 447,815 | $ | 364,140 | $ | 343,114 | ||||||||||
Debt to equity ratio (4) | 1.5 | % | 1.6 | % | 2.2 | % | 9.6 | % | 14.0 | % | ||||||||||
Debt to capitalization ratio (5) | 1.4 | % | 1.6 | % | 2.1 | % | 8.8 | % | 12.3 | % | ||||||||||
| ||||||||||||||||||||
Shareholders | 13,900 | 12,400 | 13,900 | 13,900 | 17,400 | |||||||||||||||
Employees | 8,300 | 8,185 | 8,160 | 7,910 | 8,290 | |||||||||||||||
(1) Equal to total La-Z-Boy Incorporated shareholders' equity divided by the number of outstanding shares on the last day of the fiscal year
(2) Based on income from continuing operations
(3) Equal to total current assets divided by total current liabilities
(4) Equal to total debt divided by total equity
(5) Equal to total debt divided by total debt plus total equity
20
Table of Contents
Unaudited Quarterly Financial Information Fiscal 2014
(Dollar amounts in thousands, except per share data) | (13 weeks) | (13 weeks) | (13 weeks) | (13 weeks) | ||||||||||||
Fiscal Quarter Ended | 7/27/2013 | 10/26/2013 | 1/25/2014 | 4/26/2014 | ||||||||||||
Sales | $ | 305,502 | $ | 352,271 | $ | 346,525 | $ | 353,020 | ||||||||
Cost of sales | ||||||||||||||||
Cost of goods sold | 203,949 | 229,727 | 224,786 | 229,563 | ||||||||||||
Restructuring | 87 | (142 | ) | (60 | ) | 4,954 | ||||||||||
Total cost of sales | 204,036 | 229,585 | 224,726 | 234,517 | ||||||||||||
Gross profit | 101,466 | 122,686 | 121,799 | 118,503 | ||||||||||||
Selling, general and administrative expense | 86,701 | 96,568 |
95,915 |
95,974 | ||||||||||||
Operating income | 14,765 | 26,118 | 25,884 | 22,529 | ||||||||||||
Interest expense | 136 | 133 | 142 | 137 | ||||||||||||
Interest income | 180 | 176 | 183 | 222 | ||||||||||||
Other income (expense), net | 537 | (279 | ) | 849 | 943 | |||||||||||
Income from continuing operations before income taxes | 15,346 | 25,882 |
26,774 | 23,557 | ||||||||||||
Income tax expense | 5,445 | 8,425 | 8,916 | 8,597 | ||||||||||||
Income from continuing operations | 9,901 | 17,457 | 17,858 | 14,960 | ||||||||||||
Income (loss) from discontinued operations, net of tax | 34 | (440 | ) | (987 | ) | (2,403 | ) | |||||||||
Net income | 9,935 | 17,017 | 16,871 | 12,557 | ||||||||||||
Net income attributable to noncontrolling interests | (345 | ) | (273 | ) | (388 | ) | (318 | ) | ||||||||
Net income attributable to La-Z-Boy Incorporated | $ | 9,590 | $ | 16,744 | $ | 16,483 | $ | 12,239 | ||||||||
| ||||||||||||||||
Net income attributable to La-Z-Boy Incorporated: | ||||||||||||||||
Income from continuing operations attributable to La-Z-Boy Incorporated | $ | 9,556 | $ | 17,184 | $ | 17,470 | $ | 14,642 | ||||||||
Income (loss) from discontinued operations | 34 | (440 | ) | (987 | ) | (2,403 | ) | |||||||||
Net income attributable to La-Z-Boy Incorporated | $ | 9,590 | $ | 16,744 | $ | 16,483 | $ | 12,239 | ||||||||
| ||||||||||||||||
Diluted weighted average shares | 53,051 | 53,261 | 53,226 | 53,519 | ||||||||||||
| ||||||||||||||||
Diluted net income attributable to La-Z-Boy Incorporated per share: | ||||||||||||||||
Income from continuing operations attributable to La-Z-Boy Incorporated | $ | 0.18 | $ | 0.32 | $ | 0.33 | $ | 0.27 | ||||||||
Loss from discontinued operations | - | (0.01 | ) | (0.02 | ) | (0.04 | ) | |||||||||
Diluted net income attributable to La-Z-Boy Incorporated per share | $ | 0.18 | $ | 0.31 | $ | 0.31 | $ | 0.23 | ||||||||
| ||||||||||||||||
Dividends declared per share | $ | 0.04 | $ | 0.04 | $ | 0.06 | $ | 0.06 | ||||||||
21
Table of Contents
Unaudited Quarterly Financial Information Fiscal 2013
(Dollar amounts in thousands, except per share data) | (13 weeks) | (13 weeks) | (13 weeks) | (13 weeks) | ||||||||||||
Fiscal Quarter Ended | 7/28/2012 | 10/27/2012 | 1/26/2013 | 4/27/2013 | ||||||||||||
Sales | $ | 286,598 | $ | 306,523 | $ | 334,916 | $ | 345,840 | ||||||||
Cost of sales | ||||||||||||||||
Cost of goods sold | 199,156 | 206,252 | 223,680 | 225,454 | ||||||||||||
Restructuring | - | 2,509 | - | (29 | ) | |||||||||||
Total cost of sales | 199,156 | 208,761 | 223,680 | 225,425 | ||||||||||||
Gross profit | 87,442 | 97,762 | 111,236 | 120,415 | ||||||||||||
Selling, general and administrative expense | 79,950 | 87,437 |
88,448 |
93,266 | ||||||||||||
Restructuring | 31 | 62 | 30 | 28 | ||||||||||||
Operating income | 7,461 | 10,263 | 22,758 | 27,121 | ||||||||||||
Interest expense | 173 | 191 | 148 | 234 | ||||||||||||
Interest income | 121 | 116 | 197 | 186 | ||||||||||||
Other income (expense), net | (99 | ) | 212 | 2,403 | 692 | |||||||||||
Income from continuing operations before income taxes | 7,310 | 10,400 | 25,210 | 27,765 | ||||||||||||
Income tax expense | 2,704 | 3,755 | 8,371 | 8,690 | ||||||||||||
Income from continuing operations | 4,606 | 6,645 | 16,839 | 19,075 | ||||||||||||
Income (loss) from discontinued operations, net of tax | 89 | 187 | 324 | (583 | ) | |||||||||||
Net income | 4,695 | 6,832 | 17,163 | 18,492 | ||||||||||||
Net income attributable to noncontrolling interests | (297 | ) | (213 | ) | (99 | ) | (184 | ) | ||||||||
Net income attributable to La-Z-Boy Incorporated | $ | 4,398 | $ | 6,619 | $ | 17,064 | $ | 18,308 | ||||||||
| ||||||||||||||||
Net income attributable to La-Z-Boy Incorporated: | ||||||||||||||||
Income from continuing operations attributable to La-Z-Boy Incorporated | $ | 4,309 | $ | 6,432 | $ | 16,740 | $ | 18,891 | ||||||||
Income (loss) from discontinued operations | 89 | 187 | 324 | (583 | ) | |||||||||||
Net income attributable to La-Z-Boy Incorporated | $ | 4,398 | $ | 6,619 | $ | 17,064 | $ | 18,308 | ||||||||
| ||||||||||||||||
Diluted weighted average shares | 53,040 | 53,268 | 53,401 | 53,754 | ||||||||||||
| ||||||||||||||||
Diluted net income attributable to La-Z-Boy Incorporated per share: | ||||||||||||||||
Income from continuing operations attributable to La-Z-Boy Incorporated | $ | 0.08 | $ | 0.12 | $ | 0.31 | $ | 0.34 | ||||||||
Income (loss) from discontinued operations | - | - | 0.01 | (0.01 | ) | |||||||||||
Diluted net income attributable to La-Z-Boy Incorporated per share | $ | 0.08 | $ | 0.12 | $ | 0.32 | $ | 0.33 | ||||||||
| ||||||||||||||||
Dividends declared per share | $ | - | $ | - | $ | 0.04 | $ | 0.04 | ||||||||
22
Table of Contents
ITEM 7. MANAGEMENT'S DISCUSSION AND ANALYSIS OF FINANCIAL CONDITION AND RESULTS OF OPERATIONS.
We have prepared this Management's Discussion and Analysis as an aid to better understand our financial results . It should be read in conjunction with the accompanying Consolidated Financial Statements and related Notes to Consolidated Financial Statements. We begin with an introduction to our key businesses and significant operational events in fiscal 2014. We then provide discussions of our results of operations, liquidity and capital resources, and critical accounting policies.
As described below, during fiscal 2014, we sold substantially all of the assets of our Bauhaus U.S.A. business unit and marketed for sale our youth furniture business, Lea Industries, a division of La-Z-Boy Greensboro, Inc. As a result, the operating results of Bauhaus and Lea Industries are reported as discontinued operations for all periods presented in this report, and the assets and liabilities of Lea Industries are classified as held for sale as of April 26, 2014. As such, this Management's Discussion and Analysis reflects the results of continuing operations, unless otherwise noted. We previously reported results of Bauhaus as a component of our Upholstery segment and those of Lea Industries as a component of our Casegoods segment.
Introduction
Our Business
La-Z-Boy Incorporated and its subsidiaries manufacture, market, import, distribute and retail upholstery furniture products. In addition, we import, distribute and retail accessories and casegoods (wood) furniture products. We are the leading global producer of reclining chairs and the second largest manufacturer/distributor of residential furniture in the United States according to the May 2014 Key Sources for the U.S. Furniture Market in Furniture Today . The La-Z-Boy Furniture Galleries® stores retail network is the second largest retailer of single-branded furniture in the United States according to the May 2014 Top 100 ranking by Furniture Today . We have seven major North-American manufacturing locations to support our speed to market and customization strategy.
We sell our products, primarily in the United States and Canada, to furniture retailers and directly to consumers through stores that our subsidiaries own and operate. The centerpiece of our retail distribution strategy is our network of 315 La-Z-Boy Furniture Galleries® stores and 570 Comfort Studios® locations, each dedicated to marketing our La-Z-Boy branded products. We consider this dedicated space to be "branded outlets" or "proprietary." We own 101 of the La-Z-Boy Furniture Galleries® stores. The remainder of the La-Z-Boy Furniture Galleries® stores, as well as all 570 Comfort Studios® locations, are independently owned and operated. La-Z-Boy Furniture Galleries® stores help consumers furnish their homes by combining the style, comfort and quality of La-Z-Boy furniture with our available in-home design service. Comfort Studios® locations are defined spaces within larger independent retailers that are dedicated to displaying and selling La-Z-Boy branded products. In addition to the La-Z-Boy Comfort Studios® locations, our Kincaid and England operating units have their own dedicated proprietary in-store programs with 500 outlets and 3.8 million square feet of proprietary floor space. In total, our proprietary floor space includes approximately 11.3 million square feet.
Our reportable operating segments are the Upholstery segment, the Casegoods segment and the Retail segment.
| · | Upholstery Segment . Our Upholstery segment is our largest segment in revenue, and consists of two operating units: La-Z-Boy, our largest operating unit, and our England subsidiary. Our Upholstery segment manufactures or imports upholstered furniture such as recliners and motion furniture, sofas, loveseats, chairs, sectionals, modulars, ottomans and sleeper sofas. This segment sells directly to La-Z-Boy Furniture Galleries® stores, operators of Comfort Studios® locations, major dealers and other independent retailers. |
23
Table of Contents
| · | Casegoods Segment . Our Casegoods segment is an importer, marketer, manufacturer and distributor of casegoods (wood) furniture such as bedroom sets, dining room sets, entertainment centers, occasional pieces, and some coordinated upholstered furniture. The Casegoods segment consists of three brands: American Drew, Hammary, and Kincaid. The Casegoods segment sells primarily to major dealers and other independent retailers. |
| · | Retail Segment . Our Retail segment consists of 101 company-owned La-Z-Boy Furniture Galleries® stores located in 12 markets ranging from southern California to the Midwest to the East Coast. The Retail segment primarily sells upholstered furniture, in addition to some casegoods and other accessories, to the end consumer through our retail network. |
Significant Operational Events in Fiscal 2014
During fiscal 2014, we generated $90.8 million in cash from operating activities, due to stronger sales volume and improved profitability margins in our Upholstery and Retail segments. We used the cash generated from operating activities, combined with our existing cash on hand, to fund capital expenditures, purchase shares of our stock and to pay dividends to shareholders. In addition, we funded $15.0 million of investment purchases to enhance our returns on our cash.
Also during fiscal 2014, we sold substantially all of the assets of our Bauhaus U.S.A. business unit for $6.8 million in cash and the purchaser's assumption of specified liabilities. As a result of the sale, we recorded a pre-tax loss of $1.1 million related to discontinued operations. In addition, we committed to a restructuring of our casegoods business to transition to an all-import model for our wood furniture. As a part of this restructuring, we will cease production of casegoods products in our Hudson, North Carolina facility during the second quarter of fiscal 2015 and transition our Kincaid and American Drew bedroom product lines to imported product. Due to this plant closure, we will also be exiting the hospitality business as we manufactured those products in the Hudson facility. We are transitioning our warehousing and repair functions from two North Wilkesboro, North Carolina facilities to the Hudson facility. The two North Wilkesboro facilities are currently being marketed for sale, as will the wood-working equipment from our Hudson plant. Also in connection with the restructuring, we are marketing for sale our youth furniture business, Lea Industries, as it does not align with our long-term strategic objectives. As a result of our restructuring actions, we recorded pre-tax charges of $8.1 million ($5.3 million after tax) during fiscal 2014, with $4.8 million pre-tax ($3.2 million after tax) related to continuing operations and $3.3 million pre-tax ($2.1 million after tax) related to discontinued operations. We expect approximately $2 million additional restructuring charges during fiscal 2015 as a result of these restructuring actions. The total restructuring charges for these actions are lower than our previous estimate of $13 to $15 million, primarily because the LIFO basis of some of our inventory was already at a lower cost than the expected realizable value, as well as better than expected fair value appraisals on our idled assets.
These items are all discussed in more detail throughout this Management's Discussion and Analysis.
24
Table of Contents
Results of Operations
Fiscal Year 2014 Compared to Fiscal Year 2013
La-Z-Boy Incorporated
(Amounts in thousands, except percentages) | (52 weeks) 4/26/2014 | (52 weeks) 4/27/2013 | Percent Change | |||||||||
Consolidated sales | $ | 1,357,318 | $ | 1,273,877 | 6.6 | % | ||||||
Consolidated operating income | 89,296 | 67,603 | 32.1 | % | ||||||||
Consolidated operating margin | 6.6 | % | 5.3 | % | ||||||||
Sales
Our consolidated sales increased by $83.4 million in fiscal 2014 as compared to fiscal 2013. Our Upholstery and Retail segments both reported higher sales as compared to the prior year, driven by the combination of stronger volume, favorable changes in product mix, and selling price increases. Partly offsetting these sales increases was continued weakness in sales volume in our Casegoods segment.
These items are further explained in the discussion of each of our operating segment's results later in this Management's Discussion and Analysis.
Operating Margin
Our consolidated operating margin increased by 1.3 percentage points in fiscal 2014. Our Retail segment's operating margin continued to improve in fiscal 2014 as compared to the prior year and our Upholstery segment's operating margin also increased compared to the prior year. These improvements were partially offset by our Casegoods segment, whose operating margin declined in fiscal 2014 as compared to fiscal 2013.
| · | Our gross margin increased 1.5 percentage points in fiscal 2014 as compared to fiscal 2013. Our consolidated gross margin increased due in part to fiscal 2014's higher weighting of sales in our Retail segment, which carry a higher gross margin than our wholesale segments. Gross margin in our Upholstery segment benefited from favorable absorption of fixed costs resulting from sales volume increases. Our Retail segment's gross margin improved as a result of improved merchandising and a higher priced product mix. |
| · | Selling, General, and Administrative ("SG&A") expenses increased in absolute dollars in fiscal 2014 as compared to fiscal 2013, and increased as a percentage of sales by 0.2 percentage point in fiscal 2014 as compared to fiscal 2013. |
| o | Advertising costs were 0.2 percentage point higher in fiscal 2014 than fiscal 2013, due primarily to increased spending related to our Live Life Comfortably marketing campaign, and incentive compensation costs were 0.2 percentage point higher in fiscal 2014 as compared to fiscal 2013. The main drivers of the increase in incentive compensation costs during fiscal 2014 were the improvement in our consolidated financial performance and the increase in our share price during the period. Several of our share-based compensation awards are liability-based and/or performance-based awards, and their cumulative expense to date is adjusted at the end of each period based on the share price on the last day of the reporting period and the ultimate amount of awards expected to vest. These items were partly offset by a reduction in the provision for doubtful accounts of 0.3 percentage point, due to the continued improvement in the financial health of our customer base, especially our independent La-Z-Boy Furniture Galleries® dealers. |
25
Table of Contents
Upholstery Segment
(Amounts in thousands, except percentages) | (52 weeks) 4/26/2014 | (52 weeks) 4/27/2013 | Percent Change | |||||||||
Sales | $ | 1,099,050 | $ | 1,029,765 | 6.7 | % | ||||||
Operating income | 117,688 | 95,571 | 23.1 | % | ||||||||
Operating margin | 10.7 | % | 9.3 | % | ||||||||
Sales
Our Upholstery segment's sales increased $69.3 million in fiscal 2014 as compared to fiscal 2013, an increase of 6.7%. Increased volume drove 4.4% of the increase as compared to the prior year, higher selling prices accounted for 1.8% of the increase, with the remainder primarily attributable to favorable changes in product mix. Changes in product mix most notably included a shift to more stationary sofas and occasional chairs, as well as a higher number of recliners sold in fiscal 2014 as compared to fiscal 2013. During fiscal 2014, we sold more powered motion units as compared to fiscal 2013, which have higher average selling prices than motion units without power, contributing to the increase in sales. We believe the increase in unit volume was a result of our Live Life Comfortably marketing campaign, the strength of our stationary product introductions and our improved product value and styling. We also believe these factors continued to drive increased volume for our La-Z-Boy branded business and generated the improved performance of our retail store network, which includes both our company-owned and independent-licensed stores.
Operating Margin
Our Upholstery segment's operating margin increased by 1.4 percentage points in fiscal 2014 compared to fiscal 2013.
| · | The segment's gross margin increased 1.4 percentage points during fiscal 2014 compared to the fiscal 2013 due to a combination of factors. Higher unit volume, selling price, product mix changes, and operational efficiencies amounted to a 2.1 percentage points benefit. These items more than offset the impact of raw material cost increases of 0.8 percentage point. |
| · | The segment's SG&A expense as a percentage of sales was flat in fiscal 2014 as compared to fiscal 2013. Our sales increase led to improved absorption of fixed costs and we reduced the provision for doubtful accounts by $3.8 million, or 0.4 percentage point, due to the continued improvement in the financial condition of our customer base, especially our independent La-Z-Boy Furniture Galleries® dealers. These items, however, were offset by the impact of higher incentive compensation costs and advertising costs of 0.2 percentage point. |
Casegoods Segment
(Amounts in thousands, except percentages) | (52 weeks) 4/26/2014 | (52 weeks) 4/27/2013 | Percent Change | |||||||||
Sales | $ | 106,752 | $ | 112,527 | (5.1 | )% | ||||||
Operating income | 3,397 | 3,703 | (8.3 | )% | ||||||||
Operating margin | 3.2 | % | 3.3 | % | ||||||||
26
Table of Contents
Sales
Our Casegoods segment's sales showed continued weakness in fiscal 2014, decreasing by $5.8 million compared with fiscal 2013, due to lower sales volume of $5.6 million and higher discounts of $0.2 million. The replacement cycle is longer for casegoods furniture than for upholstered furniture, given that casegoods furniture is more durable and has a higher average ticket price, and we believe this has negatively impacted our sales in this segment. In addition, there has been a shift in consumer preference from formal and traditional product styling to more casual transitional and contemporary product. Previously, our product line did not shift quickly enough in response to this change in consumer preference, but we are now addressing this change by refreshing our casegoods product line.
Operating Margin
Our Casegoods segment's operating margin declined 0.1 percentage point in fiscal 2014 compared to fiscal 2013. The decline in operating income was driven by the decline in sales, as well as our inability to absorb costs.
Retail Segment
(Amounts in thousands, except percentages) | (52 weeks) 4/26/2014 | (52 weeks) 4/27/2013 | Percent Change | |||||||||
Sales | $ | 298,642 | $ | 264,723 | 12.8 | % | ||||||
Operating income | 11,128 | 4,099 | 171.5 | % | ||||||||
Operating margin | 3.7 | % | 1.5 | % | ||||||||
Sales
Our Retail segment's sales increased $33.9 million in fiscal 2014 as compared to fiscal 2013. Approximately $10.2 million of this increase resulted from our acquisition of nine stores in the southern Ohio market in October 2012. Stores we acquired in the Las Vegas market in October 2013 and in northeast Ohio in November 2013 produced an additional $9.1 million in sales. Our average sales ticket increased during the fiscal year even though our traffic was essentially flat on a same-store basis. We believe the remaining increase in our sales in fiscal 2014 resulted from our Live Life Comfortably marketing campaign, the strength of our stationary product introductions and our improved product value and styling.
Operating Margin
Our Retail segment's operating margin improved 2.2 percentage points in fiscal 2014 compared to fiscal 2013.
| · | The segment's gross margin improved 1.0 percentage point in fiscal 2014 compared to fiscal 2013, benefitting from better product merchandising. |
| · | The segment's SG&A costs as a percent of sales improved 1.2 percentage points in fiscal 2014. |
| o | Our sales increase allowed us to reduce our fixed SG&A expenses (primarily occupancy and administrative costs) as a percentage of sales. |
| o | We incurred additional costs during the year, however, in acquiring stores and building and opening new stores. Our 4-4-5 program, through which we expect to expand the La-Z-Boy Furniture Galleries® stores network to 400 stores averaging $4 million in sales per store over the five year period that began with fiscal 2014, is a key growth strategy for our company, which we expect will result in growth in our Retail segment through increased company-owned store count. As we execute this strategy over the next few years, we will incur SG&A expense for items such as pre-opening rent, staffing, and technology-related expenses. During fiscal 2014, we acquired five existing La-Z-Boy Furniture Galleries® stores, opened five new stores and remodeled one existing store to our new concept design format. The associated costs of these activities, as well as other new store construction and remodel projects that are in the pipeline for fiscal 2015, increased our SG&A costs as a percentage of sales. |
27
Table of Contents
Corporate and Other
(Amounts in thousands, except percentages) | (52 weeks) 4/26/2014 | (52 weeks) 4/27/2013 | Percent Change | |||||||||
Sales: |
|
|
| |||||||||
Corporate and Other | 2,463 | 2,313 | 6.5 | % | ||||||||
Eliminations | (149,589 | ) | (135,451 | ) | (10.4 | )% | ||||||
| ||||||||||||
Operating loss: | ||||||||||||
Restructuring | (4,839 | ) | (2,631 | ) | N/ | M | ||||||
Corporate and Other | (38,078 | ) | (33,139 | ) | (14.9 | )% | ||||||
N/M – Not Meaningful | ||||||||||||
Sales
Eliminations increased in fiscal 2014 as compared to fiscal 2013 due to higher sales from our Upholstery and Casegoods segments to our Retail segment as a result of the increased volume in the Retail segment.
Operating Loss
Our Corporate and Other operating loss increased $4.9 million in fiscal 2014 compared to fiscal 2013 due primarily to higher incentive compensation costs, as well as higher charges related to exiting owned real estate that we are not operating in the normal course of our business.
The $4.8 million restructuring charge recorded in fiscal 2014 mainly related to fixed asset and inventory write-downs associated with the restructuring of our casegoods business to cease domestic manufacturing and transition to an all-import model for our wood furniture. The $2.6 million restructuring charge recorded in fiscal 2013 mainly related to fixed asset and inventory write-downs associated with the closure of the lumber processing operation in our Casegoods segment.
Other Income
Other income was $1.2 million lower in fiscal 2014 as compared to fiscal 2013, primarily due to higher gains realized in fiscal 2013 on the sales of investments which fund our non-qualified defined benefit retirement plan.
Income Taxes
Our effective tax rate for continuing operations was 34.3% for fiscal 2014 compared with 33.3% for fiscal 2013. Our effective tax rate varies from the 35% U.S. federal statutory rate primarily due to state income taxes and the U.S. manufacturing deduction. Items impacting our effective tax rate for fiscal 2014 included a tax benefit of $1.2 million for the release of valuation allowances relating to certain U.S. state deferred tax assets and a net tax benefit of $0.5 million from other adjustments. Absent discrete adjustments, the effective tax rate for continuing operations in fiscal 2014 would have been 36.1%. In fiscal 2013, we recorded an income tax benefit of 1.6% as a result of non-taxable gain on the sale of marketable securities. Absent this benefit and discrete items, the effective rate for fiscal 2013 would have been 35.4%.
28
Table of Contents
Results of Operations
Fiscal Year 2013 Compared to Fiscal Year 2012
La-Z-Boy Incorporated
(Amounts in thousands, except percentages) | (52 weeks) 4/27/2013 | (52 weeks) 4/28/2012 | Percent Change | |||||||||
Consolidated sales | $ | 1,273,877 | $ | 1,166,705 | 9.2 | % | ||||||
Consolidated operating income | 67,603 | 48,697 | 38.8 | % | ||||||||
Consolidated operating margin | 5.3 | % | 4.2 | % | ||||||||
Sales
Our consolidated sales increased by $107.2 million due mainly to the combination of stronger volume, favorable changes in product mix, and the benefit of selling price increases and less promotional activity.
All of our operating segments experienced an increase in sales in fiscal 2013 as compared to fiscal 2012, and these items are further explained in the discussion of each of our operating segment's results later in this Management's Discussion and Analysis.
Operating Margin
Our consolidated operating margin increased by 1.1 percentage points in fiscal 2013. Our Retail segment's operating margin continued to improve in fiscal 2013 as compared to the prior year and our Upholstery segment's operating margin also increased compared to the prior year. These improvements were partially offset by our Casegoods segment, whose operating margin declined in fiscal 2013 as compared to fiscal 2012.
| · | Our gross margin increased 0.9 percentage point in fiscal 2013 as compared to fiscal 2012. |
| o | Our Retail segment increase in gross margin was a result of mix, merchandising, and price. |
| o | We also saw favorable absorption of fixed costs resulting from sales volume increases in our Upholstery segment. |
| o | These improvements were partially offset by 0.2 percentage point of restructuring charges recorded during fiscal 2013, which mainly related to fixed asset and inventory write-downs associated with the closure of our lumber processing operation for our Casegoods segment during the second quarter of fiscal 2013. |
| · | Selling, General, and Administrative ("SG&A") expenses increased in dollars in fiscal 2013 as compared to fiscal 2012, but have decreased 0.2 percentage point in fiscal 2013 as compared to fiscal 2012. |
| o | Increased sales resulted in favorable absorption of fixed costs. |
| o | Offsetting the favorable fixed cost absorption was $8.6 million of additional incentive compensation expense in fiscal 2013 across all segments, or an increase of 0.6 percentage point. This increase in incentive compensation was due to our continued improvements in sales and operating results for the full fiscal year. As a result, we had three outstanding performance-based stock awards, each with three-year performance measurement periods, for which we were recognizing expense during fiscal 2013. |
Upholstery Segment
(Amounts in thousands, except percentages) | (52 weeks) 4/27/2013 | (52 weeks) 4/28/2012 | Percent Change | |||||||||
Sales | $ | 1,029,765 | $ | 938,060 | 9.8 | % | ||||||
Operating income | 95,571 | 81,015 | 18.0 | % | ||||||||
Operating margin | 9.3 | % | 8.6 | % | ||||||||
29
Table of Contents
Sales
Our Upholstery segment's sales increased $91.7 million in fiscal 2013 as compared to fiscal 2012, an increase of 9.8%. Increased volume drove 6.1% of the increase as compared to the prior year and higher selling prices accounted for 2.6% of the increase. The remainder of the sales increase in fiscal 2013 as compared to fiscal 2012 was primarily attributable to favorable changes in product mix, which included a shift to more motion units, including sofas, as well as a higher number of stationary sofas and occasional chairs. We believe the increase in orders was a result of an effective marketing plan that led to greater customer awareness of our improved product value and styling, which drove increased volume for our La-Z-Boy branded business, as well as the improved performance of our network of retail stores, which includes our company-owned and independent-licensed stores.
Operating Margin
Our Upholstery segment's operating margin increased by 0.7 percentage point in fiscal 2013 compared to fiscal 2012.
| · | The segment's gross margin increased 0.9 percentage point during fiscal 2013 due to a combination of factors, the most significant of which were: |
| o | Selling price changes as well as changes in product mix resulted in a 1.6 percentage points increase in gross margin. |
| o | Raw material cost increases resulted in a 1.1 percentage points decrease in gross margin. |
| · | The segment's SG&A as a percentage of sales increased 0.2 percentage point, mainly due to higher incentive compensation expense in fiscal 2013, as well as increased costs related to our ERP implementation. These increased costs were partially offset by favorable absorption of fixed costs resulting from our sales volume increase. |
Casegoods Segment
(Amounts in thousands, except percentages) | (52 weeks) 4/27/2013 | (52 weeks) 4/28/2012 | Percent Change | |||||||||
Sales | $ | 112,527 | $ | 111,657 | 0.8 | % | ||||||
Operating income | 3,703 | 5,396 | (31.4 | )% | ||||||||
Operating margin | 3.3 | % | 4.8 | % | ||||||||
Sales
Our Casegoods segment's sales increased $0.9 million in fiscal 2013 as compared to fiscal 2012, mostly due to increases in selling price.
Operating Margin
Our Casegoods segment's operating margin declined 1.5 percentage points in fiscal 2013 compared to fiscal 2012.
| · | The segment's gross margin decreased 0.5 percentage point in fiscal 2013 compared to fiscal 2012. Gross margin was reduced by 1.3 percentage points due to a charge taken in the third quarter of fiscal 2013 for an adjustment to our import duties, combined with a decline in volume which resulted in an inability to absorb fixed costs. Partially offsetting these declines was an increase in gross margin due to a shift to a larger mix of sales of occasional furniture, which carry better margins. |
| · | The segment's SG&A as a percentage of sales increased 1.0 percentage point during fiscal 2013 compared to fiscal 2012, due mainly to higher incentive compensation costs, which were driven by equity-based awards and consolidated financial performance. |
30
Table of Contents
Retail Segment
(Amounts in thousands, except percentages) | (52 weeks) 4/27/2013 | (52 weeks) 4/28/2012 | Percent Change | |||||||||
Sales | $ | 264,723 | $ | 215,490 | 22.8 | % | ||||||
Operating income (loss) | 4,099 | (7,819 | ) | 152.4 | % | |||||||
Operating margin | 1.5 | % | (3.6 | )% | ||||||||
Sales
Our Retail segment's sales increased $49.2 million in fiscal 2013 as compared to fiscal 2012. Of this increase, $18.1 million was due to the acquisition of nine retail stores in the southern Ohio market on October 1, 2013. The remainder of the increase in sales was driven by increases in traffic and average ticket combined with an improved mix of merchandise.
Operating Margin
Our Retail segment's operating margin improved 5.1 percentage points in fiscal 2013 compared to fiscal 2012.
| · | The segment's gross margin benefitted from selling price increases, differentiated product merchandising, and lower promotional activity. |
| · | Increased sales volume contributed to a higher operating margin, through greater leverage of SG&A expenses as a percentage of sales. |
Corporate and Other
(Amounts in thousands, except percentages) | (52 weeks) 4/27/2013 | (52 weeks) 4/28/2012 | Percent Change | |||||||||
Sales |
|
|
| |||||||||
VIEs, net of intercompany sales eliminations | $ | - | $ | 8,840 | N/ | M | ||||||
Corporate and Other | 2,313 | 2,356 | (1.8 | )% | ||||||||
Eliminations | (135,451 | ) | (109,698 | ) | (23.5 | )% | ||||||
| ||||||||||||
Operating income (loss) | ||||||||||||
VIEs | - | 959 | N/ | M | ||||||||
Restructuring | (2,631 | ) | (281 | ) | N/ | M | ||||||
Corporate and Other | (33,139 | ) | (30,573 | ) | (8.4 | )% | ||||||
N/M – Not Meaningful | ||||||||||||
Sales
During the third quarter of fiscal 2012, we deconsolidated our last VIE due to the expiration of the operating agreement that previously caused us to be considered its primary beneficiary. Eliminations increased in fiscal 2013 as compared to fiscal 2012 due to higher sales from our Upholstery and Casegoods segments to our Retail segment as a result of the increased volume in the Retail segment, which included the acquisition of the southern Ohio market.
Operating Loss
Our Corporate and Other operating loss increased $2.6 million in fiscal 2013 compared to fiscal 2012 due primarily to higher incentive compensation costs in fiscal 2013 as compared to fiscal 2012.
The $2.6 million restructuring charge recorded in fiscal 2013 mainly related to fixed asset and inventory write-downs associated with the closure of our lumber processing operation for our Casegoods segment.
31
Table of Contents
Other Income
Other income totaled $3.2 million during fiscal 2013, compared to other expense of less than $0.1 million in fiscal 2012. The other income generated in fiscal 2013 primarily resulted from gains realized on the sales of investments which fund our non-qualified defined benefit retirement plan.
Income from Continued Dumping and Subsidy Offset Act
The Continued Dumping and Subsidy Offset Act of 2000 ("CDSOA") provides for distribution of duties collected by U.S. Customs and Border Protection from antidumping cases to domestic producers that supported the antidumping petition. We received $11.1 million related to continuing operations and $6.9 million related to discontinued operations during fiscal 2012 in CDSOA distributions related to the antidumping order on wooden bedroom furniture from China. Certain domestic producers who did not support the antidumping petition ("Non-Supporting Producers") filed actions in the U.S. Court of International Trade challenging the CDSOA's "support requirement" and seeking a share of the distributions. As a result, Customs withheld a portion of those distributions pending resolution of the Non-Supporting Producers' actions. Between October 2011 and February 2012, the Court of International Trade entered judgments against the Non-Supporting Producers and dismissed their actions. On January 1, 2012, Customs announced that it would distribute the withheld distributions. The Non-Supporting Producers then filed motions in the Court of International Trade and, later, in the U.S. Court of Appeals for the Federal Circuit to enjoin such distributions pending their appeal of the Court of International Trade's judgments. On March 5, 2012, the Federal Circuit denied the Non-Supporting Producers' motions for injunction "without prejudicing the ultimate disposition of these cases." In November 2012, Customs determined to withhold CDSOA distributions pending resolution of the Federal Circuit appeals. As a result, we did not receive any CDSOA distributions in fiscal 2013 or fiscal 2014. On August 19, 2013, a panel of the Federal Circuit affirmed dismissal of the actions of two of the Non-Supporting Producers, and the full Federal Circuit subsequently denied those Non-Supporting Producers' request for rehearing. On May 2, 2014, these Non-Supporting Producers filed a petition for writ of certiorari, seeking review by the United States Supreme Court. A motion to affirm dismissal of the action brought by a third Non-Supporting Producer is pending in the Federal Circuit. In view of the uncertainties associated with this program, we are unable to predict the amounts, if any, we may receive in the future under the CDSOA. Also, if the United States Supreme Court were to reverse the judgments of the Federal Circuit and determine that the Non-Supporting Producers are entitled to CDSOA distributions, it is possible that Customs might seek to have us return all or a portion of our company's share of the distributions. Based on what we know today, we do not expect this to occur.
Income Taxes
Our effective tax rate for fiscal 2013 was 33.3% compared to a net tax benefit of (42.5)% for fiscal 2012. Our effective tax rate varies from the 35% U.S. federal statutory rate primarily due to state income taxes and the U.S. manufacturing deduction. In fiscal 2013, we recorded an income tax benefit of 1.6% as a result of non-taxable gain on the sale of marketable securities. Absent this benefit and discrete items, the effective rate for fiscal 2013 would have been 35.4%. During fiscal 2012, we recorded a substantial tax benefit as a result of releasing a portion of the valuation allowance related to U.S. federal and state deferred tax assets and other discrete items. Absent this adjustment, our effective tax rate for fiscal 2012 would have been 37.7%.
Liquidity and Capital Resources
Our sources of cash liquidity include cash and equivalents, short-term and long-term investments, cash from operations and amounts available under our credit facility. We believe these sources remain adequate to meet our short-term and long-term liquidity requirements, finance our long-term growth plans, meet debt service, and fulfill other cash requirements for day-to-day operations, dividends to shareholders and capital expenditures including the construction of our new world headquarters. We had cash and equivalents of $149.7 million at April 26, 2014, compared to $131.1 million at April 27, 2013. The increase in cash and equivalents was primarily attributable to net income generated during the fiscal year, partially offset by cash used to fund increases in inventories, the acquisition of assets through capital expenditures, and cash transferred to investments to increase returns. We also used cash to purchase shares and to fund dividend payments to shareholders.
32
Table of Contents
We maintain a revolving credit facility secured primarily by all of our accounts receivable, inventory, and cash deposit and securities accounts. Availability under the agreement fluctuates according to a borrowing base calculated on eligible accounts receivable and inventory. The credit agreement includes affirmative and negative covenants that apply under certain circumstances, including a 1.05 to 1.00 fixed charge coverage ratio requirement that applies when excess availability under the line is less than 12.5% of the revolving credit commitment of $150 million. At April 26, 2014, we were not subject to the fixed charge coverage ratio requirement, had no borrowings outstanding under the agreement, and had excess availability of $140.0 million.
Capital expenditures for fiscal 2014 were $33.7 million compared with $25.9 million during fiscal 2013. We have no material contractual commitments outstanding for future capital expenditures, with the exception of our new world headquarters. We began construction on our new world headquarters during the first quarter of fiscal 2014, a project which is estimated at approximately $60 million. We expect this project will continue through the third quarter of fiscal 2015. We expect total capital expenditures to be in the range of $60.0 million to $70.0 million in fiscal 2015, including approximately $40 million on our new world headquarters.
In fiscal 2013, our board of directors reinstated payment of quarterly cash dividends to our shareholders. The board has sole authority to determine if and when future dividends will be declared and on what terms. We currently expect to continue declaring regular quarterly cash dividends for the foreseeable future but may discontinue doing so at any time.
We believe our cash flows from operations, present cash and equivalents balance of $149.7 million, short and long-term investments to enhance returns on cash of $44.7 million, and current excess availability under our credit facility of $140.0 million, will be sufficient to fund our business needs, including our fiscal 2015 contractual obligations of $160.4 million as presented in our contractual obligations table.
The following table illustrates the main components of our cash flows:
| Year Ended | |||||||
(Amounts in thousands) | 4/26/2014 | 4/27/2013 | ||||||
Cash Flows Provided By (Used For) |
|
| ||||||
Net cash provided by operating activities | $ | 90,832 | $ | 68,440 | ||||
Net cash used for investing activities | (45,016 | ) | (78,041 | ) | ||||
Net cash used for financing activities | (26,690 | ) | (11,616 | ) | ||||
Exchange rate changes | (550 | ) | (68 | ) | ||||
Change in cash and equivalents | $ | 18,576 | $ | (21,285 | ) | |||
Operating Activities
During fiscal 2014, net cash provided by operating activities was $90.8 million. Our cash provided by operating activities was mainly the result of net income generated during the fiscal year, and was partially offset by cash used to fund increases in inventories of $9.4 million. The increase in inventories was due partially to our increase in company-owned La-Z-Boy Furniture Galleries® stores during the year, as well as higher finished goods inventories in our regional distribution centers, which are servicing a higher number of La-Z-Boy Furniture Galleries® network stores.
33
Table of Contents
During fiscal 2013, net cash provided by operating activities was $68.4 million, mainly the result of net income generated during fiscal 2013. Cash from net income was partially reduced by pension plan contributions in fiscal 2013, which included a $20 million discretionary contribution made to improve the funded status of the plan and as part of our broader pension de-risking strategy.
Investing Activities
During fiscal 2014, net cash used for investing activities was $45.0 million, which consisted primarily of $33.7 million in capital expenditures and a net $19.7 million in investment purchases. These expenditures and investments were partially offset by $6.8 million in proceeds from the sale of our Bauhaus business unit. During fiscal 2013, net cash used for investing activities was $78.0 million, which consisted primarily of $25.9 million in capital expenditures, a $9.8 million increase in restricted cash, and a net $30.9 million in investment purchases. Also in fiscal 2013, we used $15.8 million to fund the acquisition of retail stores in the southern Ohio market. Our restricted cash relates to deposits serving as collateral for certain letters of credit, and our investment purchases were intended to enhance returns on our cash or to support our deferred compensation liabilities.
Financing Activities
We used $26.7 million of cash for financing activities in fiscal 2014 compared to $11.6 million during fiscal 2013, both primarily related to purchases of common stock and funding dividend payments to our shareholders.
Our board of directors has authorized the purchase of company stock. As of April 26, 2014, 2.8 million shares remained available for purchase pursuant to this authorization. We purchased 1.3 million shares during fiscal 2014 at a cost of $32.1 million . With the cash flows we anticipate generating in fiscal 2015 we expect to continue being opportunistic in purchasing company stock.
Other
The following table summarizes our contractual obligations of the types specified, for our continuing and discontinued operations:
|
| Payments Due by Period | ||||||||||||||||||
(Amounts in thousands) | Total | Less than 1 Year | 1-3 Years | 4-5 Years | More than 5 Years | |||||||||||||||
Debt obligations | $ | 7,100 | $ | 7,100 | $ | - | $ | - | $ | - | ||||||||||
Capital lease obligations | 674 | 397 | 277 | - | - | |||||||||||||||
Operating lease obligations | 339,379 | 51,972 | 94,279 | 81,264 | 111,864 | |||||||||||||||
Interest obligations | 1 | 1 | - | - | - | |||||||||||||||
Purchase obligations* | 100,898 | 100,898 | - | - | - | |||||||||||||||
Total contractual obligations | $ | 448,052 | $ | 160,368 | $ | 94,556 | $ | 81,264 | $ | 111,864 | ||||||||||
* We have purchase order commitments of $100.9 million related to open purchase orders, primarily with foreign and domestic casegoods, leather and fabric suppliers, which are generally cancellable if production has not begun.
Our consolidated balance sheet at the end of fiscal 2014 reflected a $3.0 million net liability for uncertain income tax positions. We do not expect any adjustments of this liability within the next 12 months. The remaining balance will be paid or released as tax audits are completed or settled, statutes of limitations expire or other new information becomes available.
34
Table of Contents
Our debt-to-capitalization ratio was 1.4% at April 26, 2014, and 1.6% at April 27, 2013. Capitalization is defined as total debt plus total equity.
Continuing compliance with existing federal, state and local statutes addressing protection of the environment is not expected to have a significant effect upon our capital expenditures, earnings, competitive position or liquidity.
Business Outlook
We remain optimistic about our strategic initiatives to deliver profitable growth against an uncertain economic backdrop, particularly as it relates to housing. We will execute against our plan to deliver improved performance by maximizing the strong foundation we have built across our business. As we build momentum with our store growth strategy, we will leverage the efficiencies at our manufacturing facilities, which we believe will highlight the value of our integrated retail model. In the immediate term, however, the furniture industry typically experiences weaker demand during the summer months and, as a result, our plants shut down for one week of vacation and maintenance during the first quarter, which ends in July. Accordingly, the first quarter is usually our weakest in terms of sales and earnings.
Critical Accounting Policies
Our consolidated financial statements have been prepared in conformity with U.S. generally accepted accounting principles. In some cases, these principles require management to make difficult and subjective judgments regarding uncertainties and, as a result, such estimates and assumptions may significantly impact our financial results and disclosures. Estimates are based on currently known facts and circumstances, prior experience and other assumptions believed to be reasonable. We use our best judgment in valuing these estimates and may, as warranted, use external advice. Actual results could differ from these estimates, assumptions, and judgments and these differences could be significant. We make frequent comparisons throughout the year of actual experience to our assumptions to reduce the likelihood of significant adjustments. Adjustments are recorded when the differences are known. The following critical accounting policies affect our consolidated financial statements.
Revenue Recognition and Related Allowances
Substantially all of our shipping agreements with third-party carriers transfer the risk of loss to our customers upon shipment. Accordingly, our shipments using third-party carriers are generally recognized as revenue upon shipment of the product. For product shipped on our company-owned trucks, we recognize revenue upon delivery. This revenue includes amounts billed to customers for shipping. Provisions are made at the time revenue is recognized for estimated product returns and warranties, as well as other incentives that may be offered to customers. We also recognize revenue for amounts received from our customers in connection with our shared advertising cost arrangement. We import certain products from foreign ports, and they are shipped directly to our domestic customers. In those cases, we do not recognize revenue until title passes to our customer, which normally occurs after the goods pass through U.S. Customs.
Incentives that we offer to our customers include cash discounts and other sales incentive programs. We record estimated cash discounts and other sales incentives as reductions of revenues when we recognize the revenue.
Trade accounts receivable arise from our sale of products on trade credit terms. Our management team reviews all significant accounts quarterly as to their past due balances and the collectability of the outstanding trade accounts receivable for possible write off. It is our policy to write off the accounts receivable against the allowance account when we deem the receivable to be uncollectible. Additionally, we review orders from dealers that are significantly past due, and we ship product only when our ability to collect payment for the new sales is reasonably assured.
35
Table of Contents
We have notes receivable balances due to us from various customers. These notes receivable generally relate to past due accounts receivable which were converted to a note receivable in order to secure further collateral and personal guarantees from the customer. The collateral from the customer is generally in the form of inventory or real estate. In cases where we do not have sufficient collateral (excluding personal guarantees, if any) to support the carrying value of the note receivable, we recognize an allowance for credit losses for this difference.
Our allowance for credit losses reflects our best estimate of probable incurred losses inherent in the accounts and notes receivable balances. We determine the allowance based on known troubled accounts, historical experience and other currently available evidence.
Investments
We periodically evaluate our available for sale investments for possible other-than-temporary impairments by reviewing factors such as the extent to which, and length of time, an investment's fair value has been below our cost basis, the issuer's financial condition, and our ability and intent to hold the investment for sufficient time for its market value to recover. If an impairment is determined to be other-than-temporary, we recognize it as part of our earnings. If the impairment is determined to be temporary, we record the subsequent change in market value as part of other comprehensive income/(loss) in our consolidated statement of changes in equity.
Long-lived Assets
We review long-lived assets for impairment whenever events or changes in circumstances indicate that we may not be able to recover the carrying amount of an asset or asset group. Using either quoted market prices or an analysis of undiscounted projected future cash flows by asset groups, we determine whether there is any evidence of impairment requiring us to further assess the fair value of our long-lived assets. Our asset groups consist of our operating units in our Upholstery segment (La-Z-Boy and England), components of our Casegoods segment that have identifiable cash flows (the first being American Drew and Kincaid, and the second being Hammary) and each of our retail stores.
Indefinite-lived Intangible Assets and Goodwill
We test indefinite-lived intangibles and goodwill for impairment on an annual basis in the fourth quarter of each fiscal year, and more frequently if events or changes in circumstances indicate that an asset might be impaired. Indefinite-lived intangible assets include certain of our trade names and the reacquired right to own and operate La-Z-Boy Furniture Galleries® stores in the southern Ohio and Las Vegas markets, and in northeast Ohio. We test goodwill for impairment by comparing the fair value of our reporting unit to its carrying value. Our goodwill relates to the acquisition of La-Z-Boy Furniture Galleries® stores in the southern Ohio market and in northeast Ohio. The reporting units for our goodwill are the southern Ohio retail market and the stores acquired in northeast Ohio, because the acquisition of the retail stores is where the goodwill was generated. We establish the fair value for the reporting unit based on the discounted cash flows to determine if the fair value of our goodwill exceeds its carrying value.
Other Loss Reserves
We have various other loss exposures arising from the ordinary course of business, including inventory obsolescence, health insurance, litigation, environmental claims, insured and self-insured workers' compensation, restructuring charges, and product liabilities. Establishing loss reserves requires us to use estimates and management's judgment with respect to risk and ultimate liability. We use legal counsel or other experts, including actuaries as appropriate, to assist us in developing estimates. Due to the uncertainties and potential changes in facts and circumstances, additional charges related to these reserves could be required in the future.
36
Table of Contents
We have various excess loss coverages for auto, product liability and workers' compensation liabilities. Our deductibles generally do not exceed $1.5 million.
Income Taxes
We use the asset and liability method to account for income taxes. We recognize deferred tax assets and liabilities based on the estimated future tax consequences attributable to differences between the financial statement carrying amounts of existing assets and liabilities and their respective tax bases and operating loss and tax credit carry-forwards. We measure deferred tax assets and liabilities using enacted tax rates in effect for the year in which we expect to recover or settle those temporary differences. When we record deferred tax assets, we are required to estimate, based on forecasts of taxable earnings in the relevant tax jurisdiction, whether we are more likely than not to recover on them. In making judgments about realizing the value of our deferred tax assets, we consider historic and projected future operating results, the eligible carry-forward period, tax law changes and other relevant considerations.
Pensions
We maintain a defined benefit pension plan for eligible factory hourly employees at one operating unit. The plan does not allow new participants, but active participants continue to earn service credits. Annual net periodic expense and benefit liabilities under the plan are determined on an actuarial basis using various assumptions and estimates including discount rates, long-term rates of return, estimated remaining years of service and estimated life expectancy. Each year, we compare the more significant assumptions used with our actual experience, and we adjust the assumptions if warranted.
We evaluate our pension plan discount rate assumption annually. The discount rate is based on a single rate developed after matching a pool of high quality bond payments to the plan's expected future benefit payments. We used a discount rate of 4.4% at April 26, 2014, compared with a rate of 4.0% at April 27, 2013, and 4.6% at April 28, 2012. We used the same methodology for determining the discount rate in fiscal 2014, fiscal 2013 and fiscal 2012.
We fund pension benefits through deposits with trustees and satisfy, at a minimum, the applicable funding regulations.
In addition to evaluating the discount rate we use to determine our pension obligation, each year we evaluate our assumption as to our expected return on plan assets, taking into account the trust's asset allocation, investment strategy, and returns expected to be earned over the life of the plan. The rate of return assumption as of April 26, 2014, was 4.7%, compared with 6.3% at April 27, 2013. The expected rate of return assumption as of April 26, 2014, will be used to determine pension expense for fiscal 2015.
In fiscal 2014, we moved to liability-driven investing to more closely match the profile of our assets to the pension plan liabilities. At the end of fiscal 2014, approximately 90% of the plan's assets were invested in fixed-rate investments with durations approximating the duration of its liabilities.
We are not required to contribute to our defined benefit pension plan in fiscal 2015. After considering all relevant assumptions, we expect that the plan's fiscal 2015 pension expense will be approximately $3.8 million, compared with $2.7 million in fiscal 2013. A 25 basis point change in our discount rate or expected return on plan assets would not have a material impact on our results of operations.
37
Table of Contents
Product Warranties
We account for product warranties by accruing an estimated liability when we recognize revenue on the sale of warranted product. We estimate future warranty claims based on claim experience and any additional anticipated future costs on previously sold product. We incorporate repair costs in our liability estimates, including materials, labor and overhead amounts necessary to perform repairs, and any costs associated with delivering repaired product to our customers. We use considerable judgment in making our estimates. We record differences between our estimated and actual costs when the differences are known.
Stock-Based Compensation
We measure stock-based compensation cost for equity-based awards on the grant date based on the awards' fair value and recognize expense over the vesting period. We measure stock-based compensation cost for liability-based awards on the last day of the reporting period based on the awards' fair value and recognize expense over the vesting period. We remeasure the liability for these awards and adjust their fair value at the end of each reporting period until paid. Determining the fair value of stock-based awards requires judgment, including estimating expected dividends, future stock-price volatility, expected option lives and the amount of share-based awards that are expected to be forfeited. While the assumptions we use to calculate and account for stock-based compensation awards represent management's best estimates, these estimates involve inherent uncertainties and the application of our management's best judgment. As a result, if we revise our assumptions and estimates, our stock-based compensation expense could be materially different in the future.
We recognize compensation cost for stock-based awards that vest based on performance conditions ratably over the vesting periods when the vesting of such awards becomes probable. Determining the probability of award vesting requires judgment, including assumptions about future operating performance.
We estimate the fair value of each option grant using a Black-Scholes option-pricing model. We estimate expected volatility based on the historic volatility of our common shares. We estimate the average expected life using the contractual term of the stock option and expected employee exercise and post-vesting employment termination trends. We base the risk-free rate on U.S. Treasury issues with a term equal to the expected life assumed at the date of grant. We estimate forfeitures at the date of grant based on historic experience.
We estimate the fair value of each performance award grant that vests based on a market condition using a Monte Carlo valuation model. The Monte Carlo model incorporates more complex variables than closed-form models such as the Black-Scholes option valuation model used for option grants. The Monte Carlo valuation model simulates a distribution of stock prices to yield an expected distribution of stock prices over the remaining performance period. The stock-paths are simulated using volatilities calculated with historical information using data from a look-back period that is equal to the vesting period. The model assumes a zero-coupon, risk-free interest rate with a term equal to the vesting period. The simulations are repeated many times (100,000 in this valuation) and the mean of the discounted values is calculated as the grant date fair value for the award. The final payout of the award as calculated by the model is then discounted back to the grant date using the risk-free interest rate.
Both the Monte Carlo and Black-Scholes methodologies are based, in part, on inputs for which there are little or no observable market data, requiring us to develop our own assumptions. Inherent in both of these models are assumptions related to expected stock-price volatility, expected life, risk-free interest rate and dividend yield.
38
Table of Contents
Regulatory Developments
In April 2014, the Financial Accounting Standards Board issued accounting guidance related to disclosures about discontinued operations. The guidance amends the definition of discontinued operations to limit the disposals that may be reported as discontinued operations. To be reported as discontinued operations, a disposal must be a result of a change in an entity's strategy and have a major effect on the entity's operations and financial results. The amendments also expand the disclosures required for discontinued operations to include additional information about the assets, liabilities, revenues, expenses, and cash flows of the discontinued operation. If a disposal does not qualify as discontinued operations under the amended guidance, the entity must disclose the disposal's pretax profit or loss. This guidance will be effective for fiscal 2016. In connection with the discontinued operations discussed throughout this Management's Discussion and Analysis, we have elected not to early adopt the provisions of this recently issued accounting standard. We do not believe the adoption of this guidance will have a material impact on our consolidated financial statements.
In May 2014, the Financial Accounting Standards Board issued accounting guidance on revenue recognition. The amended guidance will enhance the comparability of revenue recognition practices and will be applied to all contracts with customers. Improved disclosures related to the nature, amount, timing, and uncertainty of revenue that is recognized are requirements under the amended guidance. This guidance will be effective for fiscal 2018 and will be required to be applied retrospectively. We are currently assessing the impact that this guidance will have on our consolidated financial statements at this time.
ITEM 7A. QUANTITATIVE AND QUALITATIVE DISCLOSURES ABOUT MARKET RISK.
We are exposed to market risk from changes in interest rates because of variable rate debt, under which we had $7.1 million of borrowings at April 26, 2014. Based on our current and expected levels of exposed liabilities, management estimates that a one percentage point change in interest rates would not have a material impact on our results of operations for fiscal 2015.
We are exposed to market risk from changes in the value of foreign currencies primarily related to our plant in Mexico, as we pay wages and other local expenses in Mexican pesos. Nonetheless, gains and losses resulting from market changes in the value of foreign currencies have not had and are not expected to have a significant effect on our consolidated results of operations. A decrease in the value of foreign currencies in relation to the U.S. dollar could impact the profitability of some of our vendors, and translate into higher prices for our supplies, but we believe that in that event, our competitors would experience a similar impact.
We are exposed to market risk with respect to commodity and fuel price fluctuations, principally related to commodities we use in producing our products, including steel, wood and polyurethane. As commodity prices increase, we determine whether a price increase to our customers to offset these increases is warranted. We do not believe that an increase in these commodity costs would have a material impact on our results of operations.
39
Table of Contents
ITEM 8. FINANCIAL STATEMENTS AND SUPPLEMENTARY DATA.
Management's Report to our Shareholders
Management's Responsibility for Financial Information
La-Z-Boy Incorporated's management personnel are responsible for the preparation, integrity and objectivity of our consolidated financial statements and other financial information contained in this Annual Report on Form 10-K. Management prepared those consolidated financial statements in conformity with accounting principles generally accepted in the United States of America. In preparing those consolidated financial statements, management was required to make certain estimates and judgments, which were based on currently available information and management's view of current conditions and circumstances.
The Audit Committee of our board of directors, which consists solely of independent directors, oversees our process of reporting financial information and the audit of our consolidated financial statements. The Audit Committee is informed of La-Z-Boy Incorporated's financial condition and regularly reviews management's critical accounting policies, the independence of our independent auditors, our internal controls and the objectivity of our financial reporting. Both our independent auditors and our internal auditors have free access to the Audit Committee and meet with the Audit Committee periodically, both with and without members of management present.
Management's Report on Internal Control over Financial Reporting
Our management is responsible for establishing and maintaining adequate internal control over financial reporting, as that term is defined in Rule 13a-15(f) of the Exchange Act. Under the supervision and with the participation of our management, including our Chief Executive Officer and Chief Financial Officer, we conducted an evaluation of the effectiveness of our internal controls over financial reporting based upon the framework in "Internal Control – Integrated Framework" issued by the Committee of Sponsoring Organizations of the Treadway Commission in 1992. Based on that evaluation, our management concluded that our internal control over financial reporting was effective as of April 26, 2014. PricewaterhouseCoopers, LLP, an independent registered public accounting firm, audited the effectiveness of the Company's internal control over financial reporting as of April 26, 2014, as stated in its report which appears herein.
/s/ Kurt L. Darrow
Kurt L. Darrow
Chairman, President and Chief Executive Officer
/s/ Louis M. Riccio, Jr.
Louis M. Riccio, Jr.
Senior Vice President and Chief Financial Officer
40
Table of Contents
Report of Independent Registered Public Accounting Firm
To the Board of Directors and Shareholders of La-Z-Boy Incorporated:
In our opinion, the accompanying consolidated balance sheets and the related consolidated statements of income, of comprehensive income, of changes in equity and of cash flows present fairly, in all material respects, the financial position of La-Z-Boy Incorporated and its subsidiaries at April 26, 2014 and April 27, 2013, and the results of their operations and their cash flows for each of the three years in the period ended April 26, 2014 in conformity with accounting principles generally accepted in the United States of America. Also in our opinion, the Company maintained, in all material respects, effective internal control over financial reporting as of April 26, 2014, based on criteria established in Internal Control - Integrated Framework (1992) issued by the Committee of Sponsoring Organizations of the Treadway Commission (COSO). The Company's management is responsible for these financial statements, for maintaining effective internal control over financial reporting and for its assessment of the effectiveness of internal control over financial reporting, included in Management's Report on Internal Control over Financial Reporting on the preceding page. Our responsibility is to express opinions on these financial statements and on the Company's internal control over financial reporting based on our integrated audits. We conducted our audits in accordance with the standards of the Public Company Accounting Oversight Board (United States). Those standards require that we plan and perform the audits to obtain reasonable assurance about whether the financial statements are free of material misstatement and whether effective internal control over financial reporting was maintained in all material respects. Our audits of the financial statements included examining, on a test basis, evidence supporting the amounts and disclosures in the financial statements, assessing the accounting principles used and significant estimates made by management, and evaluating the overall financial statement presentation. Our audit of internal control over financial reporting included obtaining an understanding of internal control over financial reporting, assessing the risk that a material weakness exists, and testing and evaluating the design and operating effectiveness of internal control based on the assessed risk. Our audits also included performing such other procedures as we considered necessary in the circumstances. We believe that our audits provide a reasonable basis for our opinions.
A company's internal control over financial reporting is a process designed to provide reasonable assurance regarding the reliability of financial reporting and the preparation of financial statements for external purposes in accordance with generally accepted accounting principles. A company's internal control over financial reporting includes those policies and procedures that (i) pertain to the maintenance of records that, in reasonable detail, accurately and fairly reflect the transactions and dispositions of the assets of the company; (ii) provide reasonable assurance that transactions are recorded as necessary to permit preparation of financial statements in accordance with generally accepted accounting principles, and that receipts and expenditures of the company are being made only in accordance with authorizations of management and directors of the company; and (iii) provide reasonable assurance regarding prevention or timely detection of unauthorized acquisition, use, or disposition of the company's assets that could have a material effect on the financial statements.
Because of its inherent limitations, internal control over financial reporting may not prevent or detect misstatements. Also, projections of any evaluation of effectiveness to future periods are subject to the risk that controls may become inadequate because of changes in conditions, or that the degree of compliance with the policies or procedures may deteriorate.
/s/ PricewaterhouseCoopers LLP
Detroit, Michigan
June 17, 2014
41
Table of Contents
LA-Z-BOY INCORPORATED
CONSOLIDATED STATEMENT OF INCOME
| Fiscal Year Ended | |||||||||||
(Amounts in thousands, except per share data) | (52 weeks) 4/26/2014 | (52 weeks) 4/27/2013 | (52 weeks) 4/28/2012 | |||||||||
Sales | $ | 1,357,318 | $ | 1,273,877 | $ | 1,166,705 | ||||||
Cost of sales | ||||||||||||
Cost of goods sold | 888,025 | 854,542 | 795,957 | |||||||||
Restructuring | 4,839 | 2,480 | 13 | |||||||||
Total cost of sales | 892,864 | 857,022 | 795,970 | |||||||||
Gross profit | 464,454 | 416,855 | 370,735 | |||||||||
Selling, general and administrative expense | 375,158 | 349,101 | 321,770 | |||||||||
Restructuring | - | 151 | 268 | |||||||||
Operating income | 89,296 | 67,603 | 48,697 | |||||||||
Interest expense | 548 | 746 | 1,384 | |||||||||
Interest income | 761 | 620 | 609 | |||||||||
Income from Continued Dumping and Subsidy Offset Act, net | - | - | 11,066 | |||||||||
Other income (expense), net | 2,050 | 3,208 | (38 | ) | ||||||||
Income from continuing operations before income taxes | 91,559 | 70,685 | 58,950 | |||||||||
Income tax expense (benefit) | 31,383 | 23,520 | (25,052 | ) | ||||||||
Income from continuing operations | 60,176 | 47,165 | 84,002 | |||||||||
Income (loss) from discontinued operations, net of tax | (3,796 | ) | 17 | 4,906 | ||||||||
Net income | 56,380 | 47,182 | 88,908 | |||||||||
Net income attributable to noncontrolling interests | (1,324 | ) | (793 | ) | (942 | ) | ||||||
Net income attributable to La-Z-Boy Incorporated | $ | 55,056 | $ | 46,389 | $ | 87,966 | ||||||
The accompanying Notes to Consolidated Financial Statements are an integral part of these statements.
42
Table of Contents
LA-Z-BOY INCORPORATED
CONSOLIDATED STATEMENT OF INCOME (CONTINUED)
| Fiscal Year Ended | |||||||||||
(Amounts in thousands, except per share data) | (52 weeks) 4/26/2014 | (52 weeks) 4/27/2013 | (52 weeks) 4/28/2012 | |||||||||
Net income attributable to La-Z-Boy Incorporated: |
|
|
| |||||||||
Income from continuing operations attributable to La-Z-Boy Incorporated | $ | 58,852 | $ | 46,372 | $ | 83,060 | ||||||
Income (loss) from discontinued operations | (3,796 | ) | 17 | 4,906 | ||||||||
Net income attributable to La-Z-Boy Incorporated | $ | 55,056 | $ | 46,389 | $ | 87,966 | ||||||
| ||||||||||||
Basic average shares | 52,386 | 52,351 | 51,944 | |||||||||
| ||||||||||||
Basic net income attributable to La-Z-Boy Incorporated per share: | ||||||||||||
Income from continuing operations attributable to La-Z-Boy Incorporated | $ | 1.11 | $ | 0.87 | $ | 1.57 | ||||||
Income (loss) from discontinued operations, net of tax | (0.07 | ) | - | 0.09 | ||||||||
Basic net income attributable to La-Z-Boy Incorporated per share | $ | 1.04 | $ | 0.87 | $ | 1.66 | ||||||
| ||||||||||||
Diluted average shares | 53,829 | 53,685 | 52,478 | |||||||||
| ||||||||||||
Diluted net income attributable to La-Z-Boy Incorporated per share: | ||||||||||||
Income from continuing operations attributable to La-Z-Boy Incorporated | $ | 1.09 | $ | 0.85 | $ | 1.55 | ||||||
Income (loss) from discontinued operations, net of tax | (0.07 | ) | - | 0.09 | ||||||||
Diluted net income attributable to La-Z-Boy Incorporated per share | $ | 1.02 | $ | 0.85 | $ | 1.64 | ||||||
| ||||||||||||
Dividends declared per share | $ | 0.20 | $ | 0.08 | $ | - | ||||||
| ||||||||||||
The accompanying Notes to Consolidated Financial Statements are an integral part of these statements.
43
Table of Contents
LA-Z-BOY INCORPORATED
CONSOLIDATED STATEMENT OF COMPREHENSIVE INCOME
| Fiscal Year Ended | |||||||||||
(Amounts in thousands) | 4/26/2014 | 4/27/2013 | 4/28/2012 | |||||||||
Net income | $ | 56,380 | $ | 47,182 | $ | 88,908 | ||||||
Other comprehensive income (loss) | ||||||||||||
Currency translation adjustment | (3,054 | ) | 1,089 | (132 | ) | |||||||
Change in fair value of cash flow hedges, net of tax | (284 | ) |
231 | 28 | ||||||||
Net unrealized gains (losses) on marketable securities, net of tax | 624 | (2,543 | ) | (331 | ) | |||||||
Net pension amortization and actuarial gain (loss), net of tax | 6,100 | (2,653 | ) | (12,209 | ) | |||||||
Total other comprehensive income (loss) | 3,386 | (3,876 | ) | (12,644 | ) | |||||||
Total comprehensive income before allocation to noncontrolling interests | 59,766 | 43,306 | 76,264 | |||||||||
Comprehensive income attributable to noncontrolling interests | (594 | ) | (1,132 | ) | (775 | ) | ||||||
Comprehensive income attributable to La-Z-Boy Incorporated | $ | 59,172 | $ | 42,174 | $ | 75,489 | ||||||
The accompanying Notes to Consolidated Financial Statements are an integral part of these statements.
44
Table of Contents
LA-Z-BOY INCORPORATED
CONSOLIDATED BALANCE SHEET
| As of | |||||||
(Amounts in thousands, except par value) | 4/26/2014 | 4/27/2013 | ||||||
Current assets |
|
| ||||||
Cash and equivalents | $ | 149,661 | $ | 131,085 | ||||
Restricted cash | 12,572 | 12,686 | ||||||
Receivables, net of allowance of $12,368 at 4/26/14 and $21,607 at 4/27/13 | 152,614 | 160,005 | ||||||
Inventories, net | 147,009 | 146,343 | ||||||
Deferred income taxes – current | 15,037 | 20,640 | ||||||
Business held for sale | 4,290 | - | ||||||
Other current assets | 41,490 | 30,121 | ||||||
Total current assets | 522,673 | 500,880 | ||||||
Property, plant and equipment, net | 127,535 | 118,060 | ||||||
Goodwill | 13,923 | 12,837 | ||||||
Other intangible assets | 4,544 | 4,838 | ||||||
Deferred income taxes – long-term | 32,430 | 30,572 | ||||||
Other long-term assets, net | 70,190 | 53,184 | ||||||
Total assets | $ | 771,295 | $ | 720,371 | ||||
| ||||||||
Current liabilities | ||||||||
Current portion of long-term debt | $ | 7,497 | $ | 513 | ||||
Accounts payable | 56,177 | 50,542 | ||||||
Business held for sale | 832 | - | ||||||
Accrued expenses and other current liabilities | 102,876 | 99,108 | ||||||
Total current liabilities | 167,382 | 150,163 | ||||||
Long-term debt | 277 | 7,576 | ||||||
Other long-term liabilities | 73,918 | 70,664 | ||||||
Contingencies and commitments | - | - | ||||||
Shareholders' equity | ||||||||
Preferred shares – 5,000 authorized; none issued | - | - | ||||||
Common shares, $1 par value – 150,000 authorized; 51,981 outstanding at 4/26/14 and 52,392 outstanding at 4/27/13 | 51,981 | 52,392 | ||||||
Capital in excess of par value | 262,901 | 241,888 | ||||||
Retained earnings | 238,384 | 226,044 | ||||||
Accumulated other comprehensive loss | (31,380 | ) | (35,496 | ) | ||||
Total La-Z-Boy Incorporated shareholders' equity | 521,886 | 484,828 | ||||||
Noncontrolling interests | 7,832 | 7,140 | ||||||
Total equity | 529,718 | 491,968 | ||||||
Total liabilities and equity | $ | 771,295 | $ | 720,371 | ||||
The accompanying Notes to Consolidated Financial Statements are an integral part of these statements.
45
Table of Contents
LA-Z-BOY INCORPORATED
CONSOLIDATED STATEMENT OF CASH FLOWS
| Fiscal Year Ended | |||||||||||
(Amounts in thousands) | 4/26/2014 | 4/27/2013 | 4/28/2012 | |||||||||
Cash flows from operating activities |
|
|
| |||||||||
Net income | $ | 56,380 | $ | 47,182 | $ | 88,908 | ||||||
Adjustments to reconcile net income to cash provided by operating activities | ||||||||||||
(Gain) loss on disposal of assets | 616 | (659 | ) | 45 | ||||||||
Gain on sale of investments | (300 | ) | (3,170 | ) | (519 | ) | ||||||
Gain on deconsolidation of VIE | - | - | (1,125 | ) | ||||||||
Write-down of long-lived assets | 1,149 | - | - | |||||||||
Deferred income tax expense (benefit) | (216 | ) | 3,198 | (42,146 | ) | |||||||
Restructuring | 8,071 | 2,715 | 281 | |||||||||
Provision for doubtful accounts | (2,651 | ) | 1,005 | 4,196 | ||||||||
Depreciation and amortization | 23,182 | 23,140 | 23,486 | |||||||||
Stock-based compensation expense | 8,739 | 11,458 | 5,718 | |||||||||
Pension plan contributions | - | (23,480 | ) | (5,798 | ) | |||||||
Change in receivables | 3,337 | 7,139 | (6,182 | ) | ||||||||
Change in inventories | (9,444 | ) | 391 | (7,414 | ) | |||||||
Change in other assets | (2,958 | ) | (5,407 | ) | 3,318 | |||||||
Change in accounts payable | 1,704 | (6,088 | ) | 7,470 | ||||||||
Change in other liabilities | 3,223 | 11,016 | 12,610 | |||||||||
Net cash provided by operating activities | 90,832 | 68,440 | 82,848 | |||||||||
Cash flows from investing activities | ||||||||||||
Proceeds from disposals of assets | 2,233 | 4,455 | 372 | |||||||||
Proceeds from sale of business | 6,844 | - | - | |||||||||
Capital expenditures | (33,730 | ) | (25,912 | ) | (15,663 | ) | ||||||
Purchases of investments | (54,233 | ) | (49,589 | ) | (7,944 | ) | ||||||
Proceeds from sales of investments | 34,557 | 18,662 | 8,649 | |||||||||
Cash effects on deconsolidation of VIE | - | - | (971 | ) | ||||||||
Acquisitions, net of cash acquired | (801 | ) | (15,832 | ) | - | |||||||
Change in restricted cash | 114 | (9,825 | ) | (2,861 | ) | |||||||
Other | - | - | (676 | ) | ||||||||
Net cash used for investing activities | (45,016 | ) | (78,041 | ) | (19,094 | ) | ||||||
Cash flows from financing activities | ||||||||||||
Payments on debt | (579 | ) | (2,511 | ) | (25,936 | ) | ||||||
Payments for debt issuance costs | - | - | (568 | ) | ||||||||
Stock issued for stock and employee benefit plans | 3,565 | 2,901 | 4,943 | |||||||||
Excess tax benefit on stock option exercises | 12,935 | 2,563 | 223 | |||||||||
Purchases of common stock | (32,097 | ) | (10,333 | ) | (5,179 | ) | ||||||
Dividends paid | (10,514 | ) | (4,236 | ) | - | |||||||
Net cash used for financing activities | (26,690 | ) | (11,616 | ) | (26,517 | ) | ||||||
Effect of exchange rate changes on cash and equivalents | (550 | ) | (68 | ) | (129 | ) | ||||||
Change in cash and equivalents | 18,576 | (21,285 | ) | 37,108 | ||||||||
Cash and equivalents at beginning of period | 131,085 | 152,370 | 115,262 | |||||||||
Cash and equivalents at end of period | $ | 149,661 | $ | 131,085 | $ | 152,370 | ||||||
Supplemental disclosure of non-cash investing activities | ||||||||||||
Capital expenditures included in accounts payable | $ | 5,303 | $ | - | $ | - | ||||||
The accompanying Notes to Consolidated Financial Statements are an integral part of these statements.
46
Table of Contents
LA-Z-BOY INCORPORATED
CONSOLIDATED STATEMENT OF CHANGES IN EQUITY
(Amounts in thousands) | Common Shares | Capital in Excess of Par Value | Retained Earnings | Accumulated Other Comprehensive Income (Loss) | Non- Controlling Interests | Total | ||||||||||||||||||
At April 30, 2011 | $ | 51,909 | $ | 222,339 | $ | 105,872 | $ | (18,804 | ) | $ | 2,824 | $ | 364,140 | |||||||||||
Net income | 87,966 | 942 | 88,908 | |||||||||||||||||||||
Other comprehensive loss | (12,477 | ) | (167 | ) | (12,644 | ) | ||||||||||||||||||
Stock issued for stock and employee benefit plans, net of cancellations | 835 | 4,011 | (509 | ) | 4,337 | |||||||||||||||||||
Purchases of common stock | (500 | ) | (958 | ) | (3,721 | ) | (5,179 | ) | ||||||||||||||||
Stock option and restricted stock expense | 5,717 | 1 | 5,718 | |||||||||||||||||||||
Tax benefit from exercise of options | 223 | 223 | ||||||||||||||||||||||
Changes in noncontrolling interest upon deconsolidation of VIE and other changes in noncontrolling interests | 2,312 | 2,312 | ||||||||||||||||||||||
At April 28, 2012 | 52,244 | 231,332 | 189,609 | (31,281 | ) | 5,911 | 447,815 | |||||||||||||||||
Net income | 46,389 | 793 | 47,182 | |||||||||||||||||||||
Other comprehensive income (loss) | (4,215 | ) | 339 | (3,876 | ) | |||||||||||||||||||
Stock issued for stock and employee benefit plans, net of cancellations | 817 | 1,849 | (1,368 | ) | 1,298 | |||||||||||||||||||
Purchases of common stock | (669 | ) | (5,314 | ) | (4,350 | ) | (10,333 | ) | ||||||||||||||||
Stock option and restricted stock expense | 11,458 | 11,458 | ||||||||||||||||||||||
Tax benefit from exercise of options | 2,563 | 2,563 | ||||||||||||||||||||||
Dividends paid | (4,236 | ) | (4,236 | ) | ||||||||||||||||||||
Change in noncontrolling interests | 97 | 97 | ||||||||||||||||||||||
At April 27, 2013 | 52,392 | 241,888 | 226,044 | (35,496 | ) | 7,140 | 491,968 | |||||||||||||||||
Net income | 55,056 | 1,324 | 56,380 | |||||||||||||||||||||
Other comprehensive income (loss) | 4,116 | (730 | ) | 3,386 | ||||||||||||||||||||
Stock issued for stock and employee benefit plans, net of cancellations | 937 | 2,395 | (4,509 | ) | (1,177 | ) | ||||||||||||||||||
Purchases of common stock | (1,348 | ) | (3,056 | ) | (27,693 | ) | (32,097 | ) | ||||||||||||||||
Stock option and restricted stock expense | 8,739 | 8,739 | ||||||||||||||||||||||
Tax benefit from exercise of options |
12,935 | 12,935 | ||||||||||||||||||||||
Dividends paid | (10,514 | ) | (10,514 | ) | ||||||||||||||||||||
Change in noncontrolling interests | 98 | 98 | ||||||||||||||||||||||
At April 26, 2014 | $ | 51,981 | $ | 262,901 | $ | 238,384 | $ | (31,380 | ) | $ | 7,832 | $ | 529,718 | |||||||||||
The accompanying Notes to Consolidated Financial Statements are an integral part of these statements.
47
Table of Contents
NOTES TO CONSOLIDATED FINANCIAL STATEMENTS
Note 1: Accounting Policies
The following is a summary of significant accounting policies followed in the preparation of La-Z-Boy Incorporated and its subsidiaries' (individually and collectively, "we," "our" or the "Company") consolidated financial statements. Our fiscal year ends on the last Saturday of April. Our 2014, 2013 and 2012 fiscal years included 52 weeks.
Principles of Consolidation
The accompanying consolidated financial statements include the consolidated accounts of La-Z-Boy Incorporated and our majority-owned subsidiaries. The portion of less than wholly-owned subsidiaries is included as non-controlling interest. All intercompany transactions have been eliminated, including any related profit on intercompany sales. Additionally, our consolidated financial statements previously included the accounts of certain entities in which we held a controlling interest based on exposure to economic risks and potential rewards (variable interests) for the periods in which we were the primary beneficiary. As of April 28, 2012, we no longer had any such arrangements where we were the primary beneficiary.
Use of Estimates
The consolidated financial statements are prepared in conformity with accounting principles generally accepted in the United States of America. These principles require management to make estimates and assumptions that affect the reported amounts or disclosures of assets, liabilities (including contingent assets and liabilities), sales and expenses at the date of the financial statements. Actual results could differ from those estimates.
Cash and Equivalents
For purposes of the consolidated balance sheet and statement of cash flows, we consider all highly liquid debt instruments purchased with initial maturities of three months or less to be cash equivalents.
Restricted Cash
We have cash on deposit with a bank as collateral for certain letters of credit.
Inventories
Inventories are stated at the lower of cost or market. Cost is determined using the last-in, first-out ("LIFO") basis for approximately 67% of our inventories at both April 26, 2014, and April 27, 2013. Cost is determined for all other inventories on a first-in, first-out ("FIFO") basis. The FIFO method of accounting is mainly used for our Retail segment's inventory as well as our England operating unit and our majority owned foreign subsidiaries.
Property, Plant and Equipment
Items capitalized, including significant betterments to existing facilities, are recorded at cost. Capitalized computer software costs include internal and external costs incurred during the software's development stage. Internal costs relate primarily to employee activities related to coding and testing the software under development. Computer software costs are depreciated over three to ten years. All maintenance and repair costs are expensed when incurred. Depreciation is computed principally using straight-line methods over the estimated useful lives of the assets.
Disposal and Impairment of Long-Lived Assets
Retirement or dispositions of long-lived assets are recorded based on carrying value and proceeds received. Any resulting gains or losses are recorded as a component of selling, general and administrative expenses.
48
Table of Contents
We review the carrying value of our long-lived assets for impairment annually or whenever events or changes in circumstances indicate that their carrying amounts may not be recoverable. Our assessment of recoverability is based on our best estimates using either quoted market prices or an analysis of the undiscounted projected future cash flows by asset groups in order to determine if there is any evidence of impairment requiring us to further assess the fair value of our long-lived assets. Our asset groups consist of our operating units in our Upholstery segment (La-Z-Boy and England), components of our Casegoods segment that have identifiable cash flows (the first being American Drew and Kincaid, and the second being Hammary) and each of our retail stores.
Indefinite-lived intangible assets and goodwill
We test indefinite-lived intangibles for impairment on an annual basis in the fourth quarter of our fiscal year, or more frequently if events or changes in circumstances indicate that the asset might be impaired. Indefinite-lived intangible assets include certain of our trade names and the reacquired right to own and operate La-Z-Boy Furniture Galleries® stores in the southern Ohio and Las Vegas markets, and in northeast Ohio.
Goodwill is tested for impairment by comparing the fair value of our reporting unit to its carrying value. Our goodwill relates to the acquisition of La-Z-Boy Furniture Galleries® stores in the southern Ohio market and in northeast Ohio. The reporting units for our goodwill are the southern Ohio retail market and the stores acquired in northeast Ohio, because the acquisition of the retail stores is where the goodwill was generated. The estimated fair value for the reporting unit is determined based upon discounted cash flows. In situations where the fair value is less than the carrying value, indicating a potential impairment, a second comparison is performed using a calculation of implied fair value of goodwill to measure any such impairment. We did not have any goodwill impairment during fiscal 2013 or 2014.
Investments
Available-for-sale securities are recorded at fair value with the net unrealized gains and losses (that are deemed to be temporary) reported as a component of other comprehensive income/(loss). Realized gains and losses and charges for other-than-temporary impairments are included in determining net income, with related purchase costs based on the first-in, first-out method. For impairments that are other-than-temporary, an impairment loss is recognized in earnings equal to the difference between the investment's cost and its fair value at the balance sheet date of the reporting period for which the assessment is made. The fair value of the investment then becomes the new amortized cost basis of the investment and it is not adjusted for subsequent recoveries in fair value.
Life Insurance
Life insurance policies are recorded at the amount that could be realized under the insurance contract as of the date of our consolidated balance sheet. These assets are classified as other long-term assets on our consolidated balance sheet. The change in cash surrender or contract value is recorded as income or expense during each period.
Revenue Recognition and Related Allowances for Credit Losses
Substantially all of our shipping agreements with third-party carriers transfer the risk of loss to our customers upon shipment. Accordingly, our shipments using third-party carriers are generally recognized as revenue upon shipment of the product. In all cases, for product shipped on our company-owned trucks, revenue is recognized upon delivery. This revenue includes amounts billed to customers for shipping. Provisions are made at the time revenue is recognized for estimated product returns and warranties, as well as other incentives that may be offered to customers. We also recognize revenue for amounts received from our customers in connection with our shared advertising cost arrangement. We import certain products from foreign ports, which are shipped directly to our domestic customers. In this case, revenue is not recognized until title is assumed by our customer, which is normally after the goods pass through U.S. Customs.
Incentives offered to customers include cash discounts and other sales incentive programs. Estimated cash discounts and other sales incentives are recorded as a reduction of revenues when the revenue is recognized.
49
Table of Contents
Trade accounts receivable arise from the sale of products on trade credit terms. On a quarterly basis, our management team reviews all significant accounts as to their past due balances, as well as collectability of the outstanding trade accounts receivable for possible write off. It is our policy to write off the accounts receivable against the allowance account when we deem the receivable to be uncollectible. Additionally, for those dealers that are significantly past due, we review their sales orders and ship product when collectability of the incremental sale is reasonably assured.
We have notes receivable balances due to us from various customers. These notes receivable generally relate to past due accounts receivable which were converted to a note receivable in order to secure further collateral and personal guarantees from the customer. The collateral from the customer is generally in the form of inventory or real estate. In cases where we do not have sufficient collateral (excluding personal guarantees, if any) to support the carrying value of the note receivable, our policy is to recognize an allowance for credit losses for this difference.
These allowances for credit losses reflect our best estimate of probable losses inherent in the trade accounts and notes receivable balances. We determine the allowance based on known troubled accounts, historic experience and other currently available evidence.
Cost of Sales
Our cost of sales consists primarily of the cost to manufacture or purchase our merchandise, inspection costs, internal transfer costs, in-bound freight costs, outbound shipping costs, as well as warehousing costs, occupancy costs and depreciation expense related to our manufacturing facilities and equipment.
Selling, General and Administrative Expenses
SG&A expenses include the costs of selling our products and other general and administrative costs. Selling expenses are primarily composed of commissions, advertising, warranty, bad debt expense and compensation and benefits of employees performing various sales functions. Additionally, the occupancy costs of our retail facilities and the warehousing costs of our regional distribution centers are included as a component of SG&A. Other general and administrative expenses included in SG&A are composed primarily of compensation and benefit costs for administration employees and other administrative costs.
Research and Development Costs
Research and development costs are charged to expense in the periods incurred. Expenditures for research and development costs from continuing operations were $7.9 million, $7.2 million and $7.3 million for the fiscal years ended April 26, 2014, April 27, 2013, and April 28, 2012, respectively and are included as a component of SG&A.
Advertising Expenses
Production costs of commercials, programming and costs of other advertising, promotion and marketing programs are charged to expense in the period incurred. Gross advertising expenses were $59.6 million, $53.9 million and $47.7 million for the fiscal years ended April 26, 2014, April 27, 2013, and April 28, 2012, respectively.
A major portion of our advertising program is a national advertising campaign. This campaign is a shared advertising program with our La-Z-Boy Furniture Galleries® stores, which are reimbursing us for about 34.6% of the cost of the program (excluding company-owned stores). Because of this shared cost arrangement, the advertising expense is reported as a component of SG&A, while the dealers' reimbursement portion is reported as a component of sales.
Operating Leases
We record rent expense related to operating leases on a straight-line basis for minimum lease payments starting with the beginning of the lease term based on the date that we have the right to control the leased property. Our minimum lease payments may incorporate step rent provisions or rent escalations. We also record rental income from subleases on a straight-line basis for minimum lease payments.
50
Table of Contents
Income Taxes
Income taxes are accounted for under the asset and liability method. Deferred tax assets and liabilities are recognized for the estimated future tax consequences attributable to differences between the financial statement carrying amounts of existing assets and liabilities and their respective tax bases and operating loss and tax credit carry-forwards. Deferred tax assets and liabilities are measured using enacted tax rates in effect for the year in which those temporary differences are expected to be recovered or settled.
In periods when deferred tax assets are recorded, we are required to estimate whether recoverability is more likely than not, based on, among other things, forecasts of taxable earnings in the related tax jurisdiction. We consider historical and projected future operating results, the eligible carry-forward period, tax law changes, tax planning opportunities and other relevant considerations when making judgments about realizing the value of our deferred tax assets.
We recognize in our consolidated financial statements the benefit of a position taken or expected to be taken in a tax return when it is more likely than not (i.e. a likelihood of more than 50%) that the position would be sustained upon examination by tax authorities. A recognized tax position is then measured at the largest amount of benefit that is more likely than not to be realized upon settlement. Changes in judgment that result in subsequent recognition, derecognition or change in a measurement date of a tax position taken in a prior annual period (including any related interest and penalties) are recognized as a discrete item in the interim period in which the change occurs.
Foreign Currency Translation
The functional currency of our Mexico subsidiary is the U.S. dollar. Transaction gains and losses associated with translating our Mexico subsidiary's assets and liabilities, which are non-U.S. dollar denominated, are recorded in other income/(expense) in our consolidated statement of income. The functional currency of each of our other foreign subsidiaries is its respective local currency. Assets and liabilities of those subsidiaries whose functional currency is their local currency are translated at the year-end exchange rates, and revenues and expenses are translated at average exchange rates for the period, with the corresponding exchange effect included as a component of other comprehensive income. When the foreign subsidiary has substantially ended operations, the remaining translation adjustments are recognized in other income/(expense) in our consolidated statement of income.
Accounting for Stock-Based Compensation
We estimate the fair value of equity-based awards on the date of grant using option-pricing models. The value of the portion of the equity-based awards that are ultimately expected to vest is recognized as expense over the requisite service periods in our consolidated statement of income using a straight-line single-option method. We measure stock-based compensation cost for liability-based awards based on the fair value of the award on the last day of the reporting period and recognize it as expense over the vesting period. The liability for these awards is remeasured and adjusted to its fair value at the end of each reporting period until paid. We record compensation cost for stock-based awards that vest based on performance conditions ratably over the vesting periods when the vesting of such awards become probable.
Discontinued Operations
During fiscal 2014, we sold substantially all of the assets of our Bauhaus U.S.A. business unit and classified Lea Industries as held for sale. The assets and liabilities of Lea Industries are reported in business held for sale in our fiscal 2014 consolidated balance sheet, and the operating results of both Bauhaus and Lea Industries are reported as discontinued operations in our consolidated statement of income for all periods presented. Certain prior year information for Bauhaus and Lea Industries has been reclassified to present these businesses as discontinued operations as a result of these transactions. These items had no impact on the amounts of previously reported net income attributable to La-Z-Boy Incorporated or total equity.
51
Table of Contents
Insurance/Self-Insurance
We use a combination of insurance and self-insurance for a number of risks, including workers' compensation, general liability, vehicle liability and the company-funded portion of employee-related health care benefits. Liabilities associated with these risks are estimated in part by considering historic claims experience, demographic factors, severity factors and other assumptions. Our workers' compensation reserve is an undiscounted liability. We have various excess loss coverages for auto, product liability and workers' compensation liabilities. Our deductibles generally do not exceed $1.5 million.
Recent Accounting Pronouncements
In April 2014, the Financial Accounting Standards Board issued accounting guidance related to disclosures about discontinued operations. The guidance amends the definition of discontinued operations to limit the disposals that may be reported as discontinued operations. The disposal must be a result of a change in an entity's strategy and have a major effect on the entity's operations and financial results to be reported as discontinued operations under the new guidance. The amendments also expand the required disclosures for discontinued operations to include additional information about the assets, liabilities, revenues, expenses, and cash flows of the discontinued operation. If the disposal does not qualify as discontinued operations under the amended guidance, the entity must now disclose the pretax profit or loss of the disposal. This guidance will be effective for fiscal 2016. In connection with the discontinued operations discussed in Note 4, we have elected not to early adopt the provisions of this recently issued accounting standard. We do not believe the adoption of this guidance will have a material impact on our consolidated financial statements.
In May 2014, the Financial Accounting Standards Board issued accounting guidance on revenue recognition. The amended guidance will enhance the comparability of revenue recognition practices and will be applied to all contracts with customers. Improved disclosures related to the nature, amount, timing, and uncertainty of revenue that is recognized are requirements under the amended guidance. This guidance will be effective for fiscal 2018 and will be required to be applied retrospectively. We are currently assessing the impact that this guidance will have on our consolidated financial statements at this time.
Note 2: Acquisitions
During the second quarter of fiscal 2014, we acquired the assets of one independent La-Z-Boy Furniture Galleries® dealer in exchange for that dealer's net notes and accounts receivable, valued at $1.6 million. As a result of the acquisition we reacquired the right to own and operate La-Z-Boy Furniture Galleries® stores in that market. We recorded an indefinite-lived intangible asset of $0.6 million in our Retail segment related to this reacquired right, which will be amortized and deducted for federal income tax purposes over 15 years. These three stores were included in our Retail segment results upon acquisition.
During the third quarter of fiscal 2014, we acquired the assets of one independent La-Z-Boy Furniture Galleries® dealer in exchange for that dealer's net notes and accounts receivable, valued at $1.4 million, and a cash payment to the dealer of $0.8 million. As a result of the acquisition we reacquired the right to own and operate La-Z-Boy Furniture Galleries® stores in that market. We recorded an indefinite-lived intangible asset of $0.5 million in our Retail segment related to this reacquired right, and goodwill of $1.1 million, which will be amortized and deducted for federal income tax purposes over 15 years. These two stores were included in our Retail segment results upon acquisition.
The fiscal 2014 acquisitions were not material to our financial position or our results of operations, and therefore, pro forma financial information is not presented. The net notes and accounts receivable described above are considered non-cash investing activities as they relate to our consolidated statement of cash flows.
In the second quarter of fiscal 2013, we acquired the assets of La-Z Recliner Shops, Inc., an independent operator of nine La-Z-Boy Furniture Galleries® stores and one distribution center in the southern Ohio market, for $17.4 million composed of cash and the forgiveness of accounts payable. The nine stores were included in our Retail segment results upon acquisition.
52
Table of Contents
Prior to this acquisition, we had licensed the exclusive right to own and operate La-Z-Boy Furniture Galleries® stores in the southern Ohio market to La-Z Recliner Shops, Inc. The effective settlement of this arrangement resulted in no settlement gain or loss as the contractual terms were at market value. As a result of the acquisition we reacquired the right (a part of which relates to the use of associated trademarks and trade name in southern Ohio) to own and operate La-Z-Boy Furniture Galleries® stores in the southern Ohio market. We recorded an indefinite-lived intangible asset of $2.2 million related to this reacquired right. We also recognized $12.8 million of goodwill, which represents the purchase price in excess of the net assets acquired. The goodwill and other intangible assets were recorded in the Retail segment and will be amortized and deducted for federal income tax purposes over 15 years.
The purchase price allocations were based on fair values at the date of acquisition and are summarized in the following table:
| As of | |||
(Amounts in thousands) | 10/1/12 | |||
Current assets | $ | 4,260 | ||
Goodwill | 12,837 | |||
Other intangible assets | 2,145 | |||
Property, plant, and equipment, net | 336 | |||
Total assets acquired | 19,578 | |||
| ||||
Current liabilities | (2,199 | ) | ||
| ||||
Net assets acquired | $ | 17,379 | ||
The impact of this acquisition on our results of operations was not material, and therefore, pro forma financial information is not presented.
Note 3: Restructuring
During the fourth quarter of fiscal 2014, we committed to a restructuring of our casegoods business to transition to an all-import model for our wood furniture. As part of this restructuring, we will cease manufacturing casegoods in our Hudson, North Carolina facility during the second quarter of fiscal 2015, and transition our Kincaid and American Drew bedroom product lines to imported product. Due to this plant closure, we will also be exiting the hospitality business as we manufactured those products in our Hudson facility. We are transitioning our warehousing and repair functions from two North Wilkesboro, North Carolina facilities to Hudson. The two North Wilkesboro facilities are currently being marketed for sale, as will the wood-working equipment from our Hudson plant.
In addition, the restructuring of our Casegoods business includes marketing our youth furniture business, Lea Industries, for sale. The assets and liabilities of Lea Industries are classified as business held for sale as of the end of fiscal 2014, and the results of operations are reported as a component of discontinued operations. See Note 4 for further information related to our discontinued operations.
As a result of our restructuring actions, we recorded pre-tax charges of $8.1 million ($5.3 million after tax) during fiscal 2014, with $4.8 million pre-tax ($3.2 million after tax) related to continuing operations and $3.3 million pre-tax ($2.1 million after tax) related to discontinued operations. Fixed asset and inventory write-downs are based upon estimated net realizable value.
53
Table of Contents
The table below details the total pre-tax restructuring expense recorded by type:
(Amounts in thousands) | 4/26/14 | |||
Fixed asset write-downs | $ | 2,272 | ||
Inventory write-downs | 2,216 | |||
Other | 351 | |||
Total restructuring - continuing operations | 4,839 | |||
| ||||
Inventory write-downs | 1,804 | |||
Tradename write-down | 1,265 | |||
Other | 163 | |||
Total restructuring - discontinued operations | 3,232 | |||
| ||||
Total restructuring expense | $ | 8,071 | ||
The restructuring expenses from continuing operations were recorded as a component of cost of sales and restructuring expenses related to discontinued operations were included in our loss from discontinued operations in our consolidated statement of income. The charges were all recorded at the end of fiscal 2014.
During fiscal 2013, we recorded a restructuring charge of $2.6 million, mainly related to fixed asset and inventory write-downs related to the closure of our lumber processing operation in our Casegoods segment.
Note 4: Discontinued Operations
During the fourth quarter of fiscal 2014, we sold substantially all of the assets of our Bauhaus U.S.A. business unit to a group of investors and also classified Lea Industries, a division of La-Z-Boy Greensboro, Inc., as business held for sale as part of a larger restructuring initiative (see Note 3 for additional information).
As a result of the sale of Bauhaus, we recorded an impairment to the value of the assets to be sold of $1.1 million, because the consideration paid was less than the recorded amount of the net assets to be sold. The operating results of our Bauhaus business unit are reported as discontinued operations for all periods presented. We had historically reported the results of our Bauhaus business unit as a component of our Upholstery segment. The transaction closed in the fourth quarter of fiscal 2014, and continuing cash flows from the end of the third quarter of fiscal 2014 through the closing date of the sale were not significant.
54
Table of Contents
The results of the discontinued operations for Bauhaus for the fiscal years ended April 26, 2014, April 27, 2013, and April 28, 2012, were as follows:
|
Year Ended | |||||||||||
(Amounts in thousands) | 4/26/14 | 4/27/13 | 4/28/12 | |||||||||
Net sales | $ | 33,608 | $ | 37,282 | $ | 37,043 | ||||||
| ||||||||||||
Income (loss) from discontinued operations (including impairment of $1.1 million in fiscal 2014) | $ | (1,560 | ) | $ | 1,088 | 791 | ||||||
Income tax benefit/(expense) | 541 | (412 | ) | (303 | ) | |||||||
Income (loss) from discontinued operations, net of tax | $ | (1,019 | ) | $ | 676 | $ | 488 | |||||
The final working capital adjustment for the sale of Bauhaus of $0.2 million will be paid to the purchaser in the first quarter of fiscal 2015. The assets and liabilities of Bauhaus that were disposed of as part of the sale were as follows:
(Amounts in thousands) | 4/26/14 | |||
Assets |
| |||
Receivables, net | $ | 3,780 | ||
Inventories, net | 4,231 | |||
Other current assets | 85 | |||
Property, plant, and equipment, net | 518 | |||
Total assets | $ | 8,614 | ||
| ||||
Liabilities | ||||
Accounts payable | $ | 1,290 | ||
Accrued expenses and other current liabilities | 633 | |||
Total liabilities | $ | 1,923 | ||
The results of the discontinued operations for Lea Industries for the fiscal years ended April 26, 2014, April 27, 2013, and April 28, 2012, were as follows:
|
Year Ended | |||||||||||
(Amounts in thousands) | 4/26/14 | 4/27/13 | 4/28/12 | |||||||||
Net sales | $ | 16,979 | $ | 21,366 | $ | 27,928 | ||||||
| ||||||||||||
Income (loss) from discontinued operations (including restructuring of $3.3 million in fiscal 2014) | $ | (4,472 | ) | $ | (1,063 | ) | $ | 7,116 | ||||
Income tax benefit/(expense) | 1,695 | 404 | (2,698 | ) | ||||||||
Income (loss) from discontinued operations, net of tax | $ | (2,777 | ) | $ | (659 | ) | $ | 4,418 | ||||
55
Table of Contents
The assets and liabilities of Lea Industries that were classified as held for sale are as follows:
(Amounts in thousands) | 4/26/14 | |||
Assets |
| |||
Receivables, net | $ | 1,190 | ||
Inventories, net | 3,013 | |||
Other current assets | 87 | |||
Total assets | $ | 4,290 | ||
| ||||
Liabilities | ||||
Accounts payable | $ | 234 | ||
Accrued expenses and other current liabilities | 576 | |||
Other long-term liabilities | 22 | |||
Total liabilities | $ | 832 | ||
In the Consolidated Statement of Cash Flows, the activity of these operating units was included along with our activity from continuing operations.
Note 5: Allowance for Credit Losses
As of April 26, 2014, and April 27, 2013, we had gross notes receivable of $4.3 million from six customers and $8.3 million from nine customers, respectively, with a corresponding allowance for credit losses of $0.2 million and $2.0 million, respectively. We have collateral from these customers in the form of inventory and/or real estate to support the net carrying value of these notes. We do not accrue interest income on these notes receivable, but we record interest income when it is received. During the fiscal year ended April 26, 2014, $2.7 million of our notes receivable and a corresponding $1.9 million of allowance for credit losses were written off, primarily related to our acquisition of the assets of two independent La-Z-Boy Furniture Galleries® dealers during the year. Of the $4.3 million in notes receivable as of April 26, 2014, $0.7 million is expected to be repaid in the next twelve months, and was categorized as receivables in our consolidated balance sheet. As of April 27, 2013, $1.8 million of the $8.3 million in notes receivable were considered current and categorized as receivables in our consolidated balance sheet. The remainder of the notes receivable and the entire allowance for credit losses were categorized as other long-term assets.
The following is an analysis of the allowance for credit losses related to our notes receivable as of April 26, 2014, and April 27, 2013:
(Amounts in thousands) | 4/26/2014 | 4/27/2013 | ||||||
Beginning balance | $ | 1,986 | $ | 1,537 | ||||
Recoveries | - | (73 | ) | |||||
Write-offs | (1,888 | ) | - | |||||
Provision for credit losses | 60 | 522 | ||||||
Ending balance | $ | 158 | $ | 1,986 | ||||
Note 6: Inventories
(Amounts in thousands) | 4/26/2014 | 4/27/2013 | ||||||
Raw materials | $ | 71,247 | $ | 70,731 | ||||
Work in process | 13,722 | 12,182 | ||||||
Finished goods | 91,842 | 93,273 | ||||||
FIFO inventories | 176,811 | 176,186 | ||||||
Excess of FIFO over LIFO | (29,802 | ) | (29,843 | ) | ||||
Total inventories | $ | 147,009 | $ | 146,343 | ||||
56
Table of Contents
Note 7: Property, Plant and Equipment
(Amounts in thousands) | Estimated Useful Lives | 4/26/2014 | 4/27/2013 | |||||||||
Buildings and building fixtures | 3-40 years | $ | 161,490 | $ | 171,346 | |||||||
Machinery and equipment | 3-15 years | 140,561 | 141,924 | |||||||||
Information systems and software | 3-10 years | 64,208 | 62,005 | |||||||||
Land | - | 15,344 | 18,433 | |||||||||
Land improvements | 3-30 years | 10,820 | 10,772 | |||||||||
Transportation equipment | 3-10 years | 17,420 | 17,855 | |||||||||
Furniture and fixtures | 3-15 years | 14,104 | 14,204 | |||||||||
Construction in progress | 31,233 | 4,496 | ||||||||||
| 455,180 | 441,035 | ||||||||||
Accumulated depreciation | (327,645 | ) | (322,975 | ) | ||||||||
Net property, plant and equipment | $ | 127,535 | $ | 118,060 | ||||||||
Depreciation expense from continuing operations for the fiscal years ended April 26, 2014, April 27, 2013, and April 28, 2012, was $19.3 million, $19.7 million, and $21.2 million, respectively.
Note 8: Goodwill and Other Intangible Assets
During fiscal 2014, we acquired the assets of two independent La-Z-Boy Furniture Galleries® dealers in exchange for those dealers' net notes and accounts receivable. As a result of these acquisitions we reacquired the right to own and operate La-Z-Boy Furniture Galleries® stores in those markets. We recorded an indefinite-lived intangible asset of $1.1 million in our Retail segment related to these reacquired rights, and goodwill of $1.1 million. See Note 2 for additional information.
Key assumptions used in the assessment of our goodwill were a discount rate of 12.2% and a terminal growth rate of 2%. The relative fair value of our goodwill significantly exceeds the carrying value as of April 26, 2014. All of our goodwill relates to our Retail segment.
The following is a roll-forward of goodwill for the fiscal years ended April 26, 2014, and April 27, 2013:
(Amounts in thousands) | Goodwill | |||
Balance at April 28, 2012 | $ | - | ||
Acquisitions | 12,837 | |||
Balance at April 27, 2013 | 12,837 | |||
Acquisitions | 1,086 | |||
Balance at April 26, 2014 | $ | 13,923 | ||
57
Table of Contents
The following is a roll-forward of other intangible assets for the fiscal years ended April 26, 2014, and April 27, 2013:
(Amounts in thousands) | Tradenames | Reacquired Rights | Total Other Intangible Assets | |||||||||
Balance at April 28, 2012 | $ | 3,028 | $ | - | $ | 3,028 | ||||||
Acquisitions | - | 2,145 | 2,145 | |||||||||
Impairment charges | (335 | ) | - | (335 | ) | |||||||
Balance at April 27, 2013 | 2,693 | 2,145 | 4,838 | |||||||||
Acquisitions | - | 1,093 | 1,093 | |||||||||
Restructuring | (1,265 | ) | - | (1,265 | ) | |||||||
Impairment charges | (122 | ) | - | (122 | ) | |||||||
Balance at April 26, 2014 | $ | 1,306 | $ | 3,238 | $ | 4,544 | ||||||
Note 9: Investments
Our consolidated balance sheet at April 26, 2014, included $15.9 million of available-for-sale investments and $1.8 million of trading securities in other current assets and $43.2 million of available-for-sale investments in other long-term assets. Available-for-sale investments of $10.8 million and trading securities of $1.1 million were included in other current assets, and available-for-sale investments of $29.2 million were included in other long-term assets in our consolidated balance sheet at April 27, 2013. At April 26, 2014, and April 27, 2013, $44.7 million and $29.9 million, respectively, of these investments were to enhance returns on our cash. The remaining investments were designated to fund future obligations of our non-qualified defined benefit retirement plan and our executive deferred compensation plan. If there were a decline in the fair value of an investment below its cost and the decline was considered other-than-temporary, the amount of decline below cost would be charged against earnings.
The following is a summary of investments at April 26, 2014, and April 27, 2013:
Fiscal 2014 |
|
|
| |||||||||
(Amounts in thousands) | Gross Unrealized Gains | Gross Unrealized Losses |
Fair Value | |||||||||
Equity securities | $ | 1,246 | $ | (52 | ) | $ | 8,216 | |||||
Fixed income | 166 | (44 | ) | 50,510 | ||||||||
Mutual funds | - | - | 1,787 | |||||||||
Other | 1 | (10 | ) | 425 | ||||||||
Total securities | $ | 1,413 | $ | (106 | ) | $ | 60,938 | |||||
Fiscal 2013 |
|
|
| |||||||||
(Amounts in thousands) | Gross Unrealized Gains | Gross Unrealized Losses |
Fair Value | |||||||||
Equity securities | $ | 296 | $ | (152 | ) | $ | 6,668 | |||||
Fixed income | 159 | (1 | ) | 33,076 | ||||||||
Mutual funds | - | - | 1,126 | |||||||||
Other | 1 | (3 | ) | 220 | ||||||||
Total securities | $ | 456 | $ | (156 | ) | $ | 41,090 | |||||
The following table summarizes sales of available-for-sale securities (for the fiscal years ended):
(Amounts in thousands) | 4/26/2014 | 4/27/2013 | 4/28/2012 | |||||||||
Proceeds from sales | $ | 34,557 | $ | 18,662 | $ | 8,649 | ||||||
Gross realized gains | 857 | 4,486 | 573 | |||||||||
Gross realized losses | (559 | ) | (1,316 | ) | (54 | ) | ||||||
58
Table of Contents
The fair value of fixed income available-for-sale securities by contractual maturity was $15.9 million within one year, $32.7 million within two to five years, $1.4 million within six to ten years and $0.5 million thereafter.
Note 10: Accrued Expenses and Other Current Liabilities
(Amounts in thousands) | 4/26/2014 | 4/27/2013 | ||||||
Payroll and other compensation | $ | 42,667 | $ | 39,270 | ||||
Accrued product warranty, current portion | 9,815 | 9,532 | ||||||
Customer deposits | 20,903 | 15,852 | ||||||
Other current liabilities | 29,491 | 34,454 | ||||||
Accrued expenses and other current liabilities | $ | 102,876 | $ | 99,108 | ||||
Note 11: Debt
(Amounts in thousands) | 4/26/2014 | 4/27/2013 | ||||||
Industrial revenue bonds | $ | 7,100 | $ | 7,100 | ||||
Capital leases | 674 | 989 | ||||||
Total debt | 7,774 | 8,089 | ||||||
Less: current portion | (7,497 | ) | (513 | ) | ||||
Long-term debt | $ | 277 | $ | 7,576 | ||||
We maintain a revolving credit facility secured primarily by all of our accounts receivable, inventory, and cash deposit and securities accounts. Availability under the agreement fluctuates according to a borrowing base calculated on eligible accounts receivable and inventory. The credit agreement includes affirmative and negative covenants that apply under certain circumstances, including a 1.05 to 1.00 fixed charge coverage ratio requirement that applies when excess availability under the line is less than 12.5% of the revolving credit commitment of $150 million. At April 26, 2014, we were not subject to the fixed charge coverage ratio requirement, had no borrowings outstanding under the agreement, and had excess availability of $140.0 million.
Industrial revenue bonds were used to finance the construction of some of our manufacturing facilities. The facilities constructed from the bond proceeds are mortgaged as collateral for the bonds. Interest for our remaining bond is at a variable rate and at April 26, 2014, was approximately 0.1%. This bond matured and was paid in June 2014.
Fair value of our debt approximates the carrying value.
Capital leases consist primarily of long-term commitments for the purchase of information technology equipment and have maturities ranging from fiscal 2015 to fiscal 2017. Interest rates range from 7.6% to 9.1%.
Maturities of long-term capital leases, subsequent to April 26, 2014, are $0.2 million in fiscal 2016, and less than $0.1 million in fiscal 2017.
Cash paid for interest during fiscal years 2014, 2013 and 2012 was $0.5 million, $0.7 million, and $1.6 million, respectively.
59
Table of Contents
Note 12: Operating Leases
We have operating leases for one manufacturing facility, executive and sales offices, warehouses, showrooms and retail facilities, as well as for transportation equipment, information technology and other equipment. The operating leases expire at various dates through fiscal 2030. We have certain retail facilities which we sublease to outside parties. The total rent liability included in our consolidated balance sheet as of April 26, 2014, and April 27, 2013, was $12.8 million and $11.7 million, respectively.
The future minimum rentals for all non-cancelable operating leases and future rental income from subleases are as follows (for the fiscal years):
(Amounts in thousands) | Future Minimum Rentals | Future Minimum Income | ||||||
2015 | $ | 51,972 | $ | 4,077 | ||||
2016 | 48,464 | 4,123 | ||||||
2017 | 45,815 | 3,890 | ||||||
2018 | 42,720 | 3,830 | ||||||
2019 | 38,544 | 3,833 | ||||||
2020 and beyond | 111,864 | 11,283 | ||||||
Total | $ | 339,379 | $ | 31,036 | ||||
| ||||||||
Rental expense and rental income from continuing operations for operating leases were as follows (for the fiscal years ended):
(Amounts in thousands) | 4/26/2014 | 4/27/2013 | 4/28/2012 | |||||||||
Rental expense | $ | 51,132 | $ | 47,872 | $ | 48,168 | ||||||
Rental income | 5,138 | 5,095 | 4,655 | |||||||||
Note 13: Retirement and Welfare
Voluntary 401(k) retirement plans are offered to eligible employees within certain U.S. operating units. For most operating units, we make matching contributions based on specific formulas. We also make supplemental contributions to this plan for eligible employees based on achievement of operating performance targets.
A performance compensation retirement plan ("PCRP") is maintained for eligible highly compensated employees. The company contributions to this plan are based on achievement of performance targets. As of April 26, 2014, we had $2.5 million of obligations for this plan included in other long-term liabilities.
We also maintain an executive deferred compensation plan for eligible highly compensated employees. An element of this plan allows contributions for eligible highly compensated employees. As of April 26, 2014, and April 27, 2013, we had $12.3 million and $10.0 million, respectively, of obligations for this plan included in other long-term liabilities. We had life insurance contracts related to this plan at April 26, 2014, and at April 27, 2013, with cash surrender values of $10.9 million and $8.9 million, respectively, which are included in other long-term assets. Mutual funds related to this plan are considered trading securities and are included in other current assets at April 26, 2014, and at April 27, 2013, with market values of $1.8 million and $1.1 million, respectively.
60
Table of Contents
We maintain a non-qualified defined benefit retirement plan for certain former salaried employees. Included in other long-term liabilities were plan obligations of $16.2 million and $17.0 million at April 26, 2014, and April 27, 2013, respectively, which represented the unfunded projected benefit obligation of this plan. During fiscal 2014, the total cost recognized for this plan was $0.8 million, which primarily related to interest cost. The actuarial gain recognized in accumulated other comprehensive loss was $0.4 million and the benefit payments during the year were $1.1 million. Benefit payments are scheduled to be approximately $1.1 million annually for the next ten years. The discount rate used to determine the obligations under this plan was 4.3% as of the end of fiscal 2014. During fiscal 2013, the total cost recognized for this plan was $0.8 million, which primarily related to interest cost. The actuarial loss recognized in accumulated other comprehensive loss was $1.1 million and the benefit payments during the year were $1.1 million. The discount rate used to determine the obligations under this plan was 3.7% as of the end of fiscal 2013. This plan is not funded and is excluded from the obligation charts and disclosures that follow. We hold available-for-sale marketable securities to fund future obligations of this plan in a Rabbi trust (see Notes 9 and 21). We are not required to fund the non-qualified defined benefit retirement plan in fiscal year 2015; however, we have the discretion to make contributions to the Rabbi trust.
We also maintain a defined benefit pension plan for eligible factory hourly employees at one operating unit. Active participants continue to earn service cost. The measurement dates for the pension plan assets and benefit obligations were April 26, 2014, April 27, 2013, and April 28, 2012, in the years presented.
The changes in plan assets and benefit obligations were recognized in accumulated other comprehensive loss as follows (pre-tax) (for the fiscal years ended):
(Amounts in thousands) | 4/26/2014 | 4/27/2013 | ||||||
Beginning of year net actuarial loss | $ | 48,745 | $ | 45,270 | ||||
Net current year actuarial (gain) loss | (5,932 | ) | 6,499 | |||||
Amortization of actuarial loss | (3,388 | ) | (3,024 | ) | ||||
End of year net actuarial loss | $ | 39,425 | $ | 48,745 | ||||
In fiscal 2015, we expect to amortize $2.7 million of unrecognized actuarial losses as a component of pension expense.
The combined net periodic pension cost and retirement costs for retirement plans related to continuing operations were as follows (for the fiscal years ended):
(Amounts in thousands) | 4/26/2014 | 4/27/2013 | 4/28/2012 | |||||||||
Service cost | $ | 1,241 | $ | 1,231 | $ | 1,110 | ||||||
Interest cost | 4,822 | 5,325 | 5,565 | |||||||||
Expected return on plan assets | (6,800 | ) | (6,855 | ) | (6,820 | ) | ||||||
Net amortization and deferral | 3,388 | 3,024 | 1,635 | |||||||||
Net periodic pension cost (hourly plan) | 2,651 | 2,725 | 1,490 | |||||||||
401(k)* | 5,802 | 5,198 | 2,473 | |||||||||
PCRP* | 2,513 | - | - | |||||||||
Other* | 223 | 191 | 107 | |||||||||
Total retirement costs (excluding non-qualified defined benefit retirement plan) | $ | 11,189 | $ | 8,114 | $ | 4,070 | ||||||
*Not determined by an actuary
61
Table of Contents
The funded status of the defined benefit pension plan for eligible factory hourly employees was as follows:
(Amounts in thousands) | 4/26/2014 | 4/27/2013 | ||||||
Change in benefit obligation |
|
| ||||||
Benefit obligation at beginning of year | $ | 123,495 | $ | 118,347 | ||||
Service cost | 1,241 | 1,231 | ||||||
Interest cost | 4,822 | 5,325 | ||||||
Actuarial (gain) loss | (3,565 | ) | 8,178 | |||||
Benefits paid | (9,123 | ) | (9,586 | ) | ||||
Benefit obligation at end of year | 116,870 | 123,495 | ||||||
| ||||||||
Change in plan assets | ||||||||
Fair value of plan assets at beginning of year | 111,430 | 89,002 | ||||||
Actual return on plan assets | 9,494 | 9,060 | ||||||
Employer contributions | - | 23,480 | ||||||
Other expenses | (327 | ) | (526 | ) | ||||
Benefits paid | (9,123 | ) | (9,586 | ) | ||||
Fair value of plan assets at end of year | 111,474 | 111,430 | ||||||
| ||||||||
Funded status | $ | (5,396 | ) | $ | (12,065 | ) | ||
Amounts included in the consolidated balance sheet related to the defined benefit pension plan for eligible factory hourly employees consist of:
(Amounts in thousands) | 4/26/2014 | 4/27/2013 | ||||||
Other long-term liabilities | $ | (5,396 | ) | $ | (12,065 | ) | ||
The actuarial assumptions for the defined benefit pension plan for eligible factory hourly employees were as follows (for the fiscal years ended):
| 4/26/2014 | 4/27/2013 | 4/28/2012 | |||||||||
Discount rate used to determine benefit obligations | 4.4 | % | 4.0 | % | 4.6 | % | ||||||
Discount rate used to determine net benefit cost | 4.0 | % | 4.6 | % | 5.6 | % | ||||||
Long-term rate of return | 4.7 | % | 6.3 | % | 7.8 | % | ||||||
| ||||||||||||
Consistent with prior years, the discount rate is calculated by matching a pool of high quality bond payments to the plan's expected future benefit payments as determined by our actuary. The long-term rate of return was determined based on the average rate of earnings expected on the funds invested or to be invested to provide the benefits of these plans. This included considering the trust's asset allocation, investment strategy, and the expected returns likely to be earned over the life of the plans. This is based on our goal of earning the highest rate of return while maintaining acceptable levels of risk. We strive to have assets within the plan that are diversified so that unexpected or adverse results from one asset class will not have a significant negative impact on the entire portfolio.
Our investment objective is to minimize the volatility of the value of our pension assets relative to pension liabilities and to ensure assets are sufficient to pay plan benefits by matching the characteristics of our assets relative to our liabilities. At the end of fiscal 2014, approximately 90% of the plan's assets were invested in fixed rate investments with a duration that approximates the duration of its liabilities, and the remainder of the assets were invested in equity investments.
62
Table of Contents
The investment strategy and policy for the pension plan reflects a balance of risk-reducing and return-seeking considerations. The objective of minimizing the volatility of assets relative to liabilities is addressed primarily through asset-liability matching and asset diversification. The fixed income target asset allocation matches the bond-like and long-dated nature of the pension liabilities. Assets are broadly diversified within all asset classes to achieve adequate risk-adjusted returns while reducing the sensitivity of the pension plan funding status to market interest rates and equity return volatility, and maintaining liquidity sufficient to meet our defined benefit pension plan obligations.
Investments are reviewed at least quarterly and rebalanced as needed. The overall expected long-term rate of return is determined by using long-term historical returns for equity and debt securities in proportion to their weight in the investment portfolio.
The following table presents the fair value of the assets in our defined benefit pension plan for eligible factory hourly employees at April 26, 2014, and April 27, 2013. The various levels of the fair value hierarchy are described in Note 21.
Fiscal 2014 |
|
|
| |||||||||
(Amounts in thousands) | Level 1 (a) | Level 2 (a) | Level 3 | |||||||||
Cash and equivalents | $ | 207 | $ | 6,083 | $ | - | ||||||
Equity funds | 22,623 | 7,736 | - | |||||||||
Debt funds | - | 74,825 | - | |||||||||
Total | $ | 22,830 | $ | 88,644 | $ | - | ||||||
| (a) | There were no transfers between Level 1 and Level 2 during fiscal 2014. |
Fiscal 2013 |
|
|
| |||||||||
(Amounts in thousands) | Level 1 (b) | Level 2 (b) | Level 3 | |||||||||
Cash and equivalents | $ | 429 | $ | 15,767 | $ | - | ||||||
Equity funds | 47,047 | 16,140 | - | |||||||||
Debt funds | - | 32,047 | - | |||||||||
Total | $ | 47,476 | $ | 63,954 | $ | - | ||||||
| (b) | There were no transfers between Level 1 and Level 2 during fiscal 2013. |
Level 1 retirement plan assets include U.S. currency held by a designated trustee and equity funds of common and preferred securities issued by U.S. and non-U.S. corporations. These equity funds are traded actively on exchanges and price quotes for these shares are readily available.
Cash and equivalents of commingled funds generally valued using observable market data are categorized as Level 2 assets. Equity funds categorized as Level 2 include common trust funds which are composed of shares or units in open ended funds with active issuances and redemptions. The value of these funds is determined based on the net asset value of the funds, the underlying assets of which are publicly traded on exchanges. Price quotes for the assets held by these funds are readily available. Debt funds categorized as Level 2 consist of corporate fixed income securities issued by U.S. and non-U.S. corporations and fixed income securities issued directly by the U.S. Treasury or by government-sponsored enterprises which are valued using a bid evaluation process with bid data provided by independent pricing sources using observable market data.
Our funding policy is to contribute to our defined benefit pension plan amounts sufficient to meet the minimum funding requirement as defined by employee benefit and tax laws, plus additional amounts which we determine to be appropriate. During fiscal 2014, we made no contributions to our defined benefit pension plan and we currently do not expect to contribute funds to our defined benefit pension plan during fiscal 2015.
63
Table of Contents
The expected benefit payments by our defined benefit pension plan for eligible factory hourly employees for each of the next five fiscal years and for periods thereafter are presented in the following table:
(Amounts in thousands) | Benefit Payments | |||
2015 | $ | 5,574 | ||
2016 | 5,625 | |||
2017 | 5,772 | |||
2018 | 5,906 | |||
2019 | 6,077 | |||
2020 to 2024 | 33,253 | |||
| $ | 62,207 | ||
Note 14: Product Warranties
We accrue an estimated liability for product warranties at the time the revenue is recognized. We estimate future warranty claims based on claim experience and any additional anticipated future costs on previously sold products. Our liability estimates incorporate the cost of repairs including materials consumed, labor and overhead amounts necessary to perform the repair and any costs associated with delivery of the repaired product to the customer. Approximately 95% of our warranty liability relates to our Upholstery segment as we generally warrant our products against defects for one year on fabric and leather, from one to ten years on cushions and padding, and up to a lifetime on certain mechanisms and frames. Labor costs relating to our parts are warrantied for one year. Considerable judgment is used in making our estimates. Differences between actual and estimated costs are recorded when the differences are known.
A reconciliation of the changes in our product warranty liability is as follows:
(Amounts in thousands) | 4/26/2014 | 4/27/2013 | ||||||
Balance as of the beginning of the year | $ | 15,525 | $ | 14,327 | ||||
Accruals during the year | 15,785 | 15,370 | ||||||
Reclass to discontinued operations | (367 | ) | - | |||||
Settlements during the year | (14,930 | ) | (14,172 | ) | ||||
Balance as of the end of the year | $ | 16,013 | $ | 15,525 | ||||
As of April 26, 2014, and April 27, 2013, $9.8 million and $9.5 million, respectively, of our product warranty liability was included in accrued expenses and other current liabilities in our consolidated balance sheet, with the remainder included in other long-term liabilities. The accruals recorded during the periods presented primarily reflect charges related to warranties issued during the respective periods.
Note 15: Contingencies and Commitments
We have been named as a defendant in various lawsuits arising in the ordinary course of business and as a potentially responsible party at certain environmental clean-up sites, the effect of which are not considered significant. Based on a review of all currently known facts and our experience with previous legal and environmental matters, we have recorded expense in respect of probable and reasonably estimable losses arising from legal and environmental matters and currently do not anticipate any material additional loss for legal or environmental matters.
64
Table of Contents
Note 16: Stock-Based Compensation
In the second quarter of fiscal 2014, our shareholders amended the La-Z-Boy Incorporated 2010 Omnibus Incentive Plan which was approved in fiscal 2011. This plan provides for the grant of stock options, stock appreciation rights, restricted stock, stock units (including deferred stock units), unrestricted stock, dividend equivalent rights, and short-term cash incentive awards. Under this plan, as amended, the aggregate number of common shares that may be issued through awards of any form is 8.7 million shares. No grants may be issued under our previous plans.
The table below summarizes the grants made during fiscal 2014:
(Shares/units in thousands) | Shares/units granted | Liability/ Equity award | Settlement | |||||||||
Stock options | 175 | Equity | Common shares | |||||||||
Stock appreciation rights ("SARs") | 142 | Liability | Cash | |||||||||
Restricted stock units – employees | 125 | Liability | Cash | |||||||||
Restricted stock units – directors | 34 | Equity | Common shares | |||||||||
Performance-based units | 35 | Liability | Cash | |||||||||
Performance-based shares | 191 | Equity | Common shares | |||||||||
The table below summarizes the total stock-based compensation expense recognized in our consolidated statement of income:
(Amounts in thousands) | 4/26/2014 | 4/27/2013 | 4/28/2012 | |||||||||
Equity-based awards expense | $ | 8,739 | $ | 11,458 | $ | 5,718 | ||||||
Liability-based awards expense | 5,736 | 2,170 | 405 | |||||||||
Total stock-based compensation expense | $ | 14,475 | $ | 13,628 | $ | 6,123 | ||||||
Stock Options. The La-Z-Boy Incorporated 2010 Omnibus Incentive Plan authorizes grants to certain employees and directors to purchase common shares at a specified price, which may not be less than 100% of the current market price of the stock at the date of grant. Compensation expense for stock options is equal to the fair value on the date the award was approved and is recognized over the vesting period. The vesting period for our stock options ranges from one to four years. Options granted to retirement eligible employees are expensed immediately because they vest upon retirement. Granted options outstanding under the former long-term equity award plan remain in effect and have a term of five or ten years.
Stock option expense recognized in selling, general and administrative expense for fiscal years 2014, 2013, and 2012 was $ 2.1 million, $2.3 million, and $1.9 million, respectively. We received $3.6 million, $2.9 million, and $4.9 million in cash during fiscal 2014, fiscal 2013, and fiscal 2012, respectively, for exercises of stock options.
Plan activity for stock options under the above plans is as follows:
| Number of Shares (In Thousands) | Weighted Average Exercise Price | Weighted Average Remaining Contractual Term (Years) |
Aggregate Intrinsic Value | ||||||||||||
Outstanding at April 27, 2013 | 1,256 | $ | 9.78 | 4.7 | $ | 10,537 | ||||||||||
Granted | 175 | 19.06 | ||||||||||||||
Exercised | (589 | ) | 9.00 | $ | 8,335 | |||||||||||
Expired | (42 | ) | 20.44 | |||||||||||||
Canceled | (2 | ) | 21.68 | |||||||||||||
Outstanding at April 26, 2014 | 798 | $ | 11.79 | 7.5 | $ | 10,185 | ||||||||||
Exercisable at April 26, 2014 | 287 | $ | 8.78 | 6.3 | $ | 4,531 | ||||||||||
65
Table of Contents
The aggregate intrinsic value of options exercised was $6.0 million and $4.5 million in fiscal 2013 and 2012, respectively. As of April 26, 2014, there was $1.0 million of total unrecognized compensation cost related to non-vested stock option awards, which is expected to be recognized over a weighted-average remaining vesting term of all unvested awards of 2.3 years. During the year ended April 26, 2014, 0.5 million shares vested.
The fair value of each option grant was estimated at the date of the grant using a Black-Scholes option-pricing model, which requires management to make certain assumptions. Expected volatility was estimated based on the historical volatility of our common shares. The average expected life was based on the contractual term of the stock option and expected employee exercise and post-vesting employment termination trends. The risk-free rate was based on U.S. Treasury issues with a term equal to the expected life assumed at the date of grant. The turnover rate was estimated at the date of grant based on historical experience. The fair value of stock options granted during fiscal 2014, fiscal 2013, and fiscal 2012 were calculated using the following assumptions:
4/26/2014 | 4/27/2013 | 4/28/2012 | ||||||||||
Risk-free interest rate | 0.84 | % | 0.75 | % | 1.5 | % | ||||||
Dividend rate | 0.84 | % | 0 | % | 0 | % | ||||||
Expected life in years | 5.0 | 5.0 | 5.5 | |||||||||
Stock price volatility | 81.3 | % | 83.8 | % | 88.8 | % | ||||||
Turnover rate | 0 | % | 0 | % | 4.0 | % | ||||||
Fair value per share | $ | 11.63 | $ | 7.87 | $ | 6.68 | ||||||
Stock Appreciation Rights. Under the La-Z-Boy Incorporated 2010 Omnibus Incentive Plan, the Compensation Committee of the board of directors is authorized to award stock appreciation rights to certain employees. SARs will be paid in cash upon vesting and as such were accounted for as liability-based awards that will be remeasured to reflect the fair value at the end of each reporting period. These awards vest at 25% per year, beginning one year from the grant date for a term of four years. The fair value for the SARs is estimated at the end of each period using the Black-Scholes option-pricing model, which requires management to make certain assumptions. The average expected life was based on the contractual term of the SARs and expected employee exercise and post-vesting employment termination trends (which is consistent with the expected life of our option awards). The risk-free rate was based on U.S. Treasury issues with a term equal to the expected life assumed at the end of the reporting period. Compensation expense of $1.1 million and $0.6 million related to SARs was recognized in selling, general and administrative expense for the years ended April 26, 2014, and April 27, 2013, respectively. The unrecognized compensation cost at April 26, 2014, related to SARs was $1.4 million and is expected to be recognized over a weighted-average remaining contractual term of all unvested awards of 2.3 years.
The fair value of the SARs granted during fiscal 2014 was remeasured at April 26, 2014, using the following assumptions:
| 4/26/2014 | |||
Risk-free interest rate | 1.64 | % | ||
Dividend rate | 1.0 | % | ||
Expected life in years | 4.1 | |||
Stock price volatility | 49.5 | % | ||
Fair value per share | $ | 11.11 | ||
66
Table of Contents
The fair value of the SARs granted during fiscal 2013 was remeasured at April 26, 2014, using the following assumptions:
| 4/26/2014 | |||
Risk-free interest rate | 0.82 | % | ||
Dividend rate | 1.0 | % | ||
Expected life in years | 3.2 | |||
Stock price volatility | 44.4 | % | ||
Fair value per share | $ | 13.39 | ||
Restricted Shares. Under the La-Z-Boy Incorporated 2010 Omnibus Incentive Plan, the Compensation Committee of the board of directors is authorized to award restricted common shares to certain employees. The shares are offered at no cost to the employees, and the plan requires that all shares be held in an escrow account until the vesting period ends. In the event of an employee's termination during the escrow period, the shares are returned at no cost to the company. Compensation expense for restricted stock is equal to the market value of our common shares on the date the award is approved and is recognized over the service period. Expense relating to the restricted shares recorded in selling, general and administrative expense was $0.5 million, $1.0 million, and $1.6 million during fiscal 2014, fiscal 2013, and fiscal 2012, respectively. The unrecognized compensation cost at April 26, 2014, related to restricted shares was $0.4 million and is expected to be recognized over a weighted-average remaining contractual term of all unvested awards of 1.2 years.
The following table summarizes information about non-vested share awards as of and for the year ended April 26, 2014:
| Number of Shares (In Thousands) | Weighted Average Grant Date Fair Value | ||||||
Non-vested shares at April 27, 2013 | 530 | $ | 6.67 | |||||
Vested | (413 | ) | 21.32 | |||||
Canceled | (15 | ) | 8.05 | |||||
Non-vested shares at April 26, 2014 | 102 | $ | 7.77 | |||||
Awards granted during fiscal 2012 | $ | 6.58 | ||||||
Restricted Stock Units. Under the La-Z-Boy Incorporated 2010 Omnibus Incentive Plan, the Compensation Committee of the board of directors is authorized to award restricted stock units to certain employees and our non-employee directors.
The restricted stock units granted to employees are accounted for as liability-based awards because upon vesting these awards will be paid in cash. Compensation expense is initially measured and recognized based on the market value (intrinsic value) of our common stock on the grant date and amortized over the vesting period. The liability is remeasured and adjusted based on the market value (intrinsic value) of our common shares on the last day of the reporting period until paid with a corresponding adjustment to reflect the cumulative amount of compensation expense. The fair value of the restricted stock units at April 26, 2014, was $24.55. Each restricted stock unit is the equivalent of one common share. Restricted stock units vest at 25% per year, beginning one year from the grant date for a term of four years. Compensation expense of $1.6 million and $0.5 million related to restricted stock units granted to employees was recognized in selling, general and administrative expense for the years ended April 26, 2014, and April 27, 2013, respectively. The unrecognized compensation cost at April 26, 2014, related to employee restricted stock units was $4.2 million and is expected to be recognized over a weighted-average remaining contractual term of all unvested awards of 2.7 years.
67
Table of Contents
The following table summarizes information about non-vested stock units as of and for the year ended April 26, 2014:
| Number of Units (In Thousands) | Weighted Average Grant Date Fair Value | ||||||
Non-vested units at April 27, 2013 | 156 | $ | 11.91 | |||||
Granted | 125 | 19.28 | ||||||
Vested | (41 | ) | 11.54 | |||||
Canceled | (19 | ) | 14.75 | |||||
Non-vested units at April 26, 2014 | 221 | $ | 15.90 | |||||
Restricted stock units granted to directors are offered at no cost to the directors and vest upon the director's leaving the board. These awards will be paid in shares of our common stock and we therefore account for them as equity based awards. Compensation expense for these awards is measured and recognized on the grant date based on the market price of our common shares at the date the grant was awarded. During fiscal 2014, fiscal 2013, and fiscal 2012 we granted less than 0.1 million restricted stock units each year to our non-employee directors. Expense relating to the non-employee directors restricted stock units recorded in selling, general and administrative expense was $0.7 million in fiscal 2014, fiscal 2013, and fiscal 2012.
Performance Awards. Under the La-Z-Boy Incorporated 2010 Omnibus Incentive Plan, the Compensation Committee of the board of directors is authorized to award common shares and stock units to certain employees based on the attainment of certain financial goals over a given performance period. The awards are offered at no cost to the employees. In the event of an employee's termination during the vesting period, the potential right to earn shares/units under this program is generally forfeited.
Payout of these grants depends on our financial performance (80%) and a market-based condition based on the total return that our shareholders receive on their investment in our stock relative to returns earned through investments in other public companies (20%). The performance award opportunity ranges from 50% of the employee's target award if minimum performance requirements are met to a maximum of 200% of the target award based on the attainment of certain financial and shareholder-return goals over a specific performance period, which is generally three fiscal years. These performance awards are offered at no cost to the employees. The number of performance-based units/shares granted were as follows:
Performance-based awards granted (Shares/units in thousands) | Number of Units | Number of Shares | ||||||
Fiscal 2012 grant | 2 | 690 | ||||||
Fiscal 2013 grant | 146 | 133 | ||||||
Fiscal 2014 grant | 35 | 191 | ||||||
Based on our financial results for fiscal 2014, certain performance conditions were met for some of our outstanding performance-based awards. The number of awards earned based on performance conditions were as follows:
Performance-based awards earned (Shares/units in thousands) | Number of Shares/Units | |||
Fiscal 2012 performance-based shares | 1,175 | |||
Fiscal 2012 performance-based units | 5 | |||
Fiscal 2013 performance-based shares | 95 | |||
Fiscal 2013 performance-based units | 91 | |||
Fiscal 2014 performance-based shares | 67 | |||
Fiscal 2014 performance-based units | 11 | |||
68
Table of Contents
The fiscal 2013 and fiscal 2014 shares will be settled in shares and the fiscal 2013 and fiscal 2014 units will be settled in cash if service conditions are met, requiring employees to remain employed with the company through the end of the three year performance periods.
The performance-based units are accounted for as liability-based awards because upon vesting they will be paid in cash. For performance-based units that vest based on performance conditions, the fair value of each unit was $24.01 and $24.25 at April 26, 2014, for the awards granted in fiscal 2014 and in fiscal 2013, respectively, which was the market value of our common shares on the last day of the reporting period less expected dividends to be paid prior to vesting, and compensation cost is expensed based on the probability that the performance goals will be obtained. For performance-based units that vest based on market conditions, the fair value of the award was estimated using a Monte Carlo valuation model on the last day of the reporting period, and compensation cost is expensed over the vesting period. The liability for these units is remeasured and adjusted based on the Monte Carlo valuation at the end of each reporting period until paid. Based on the Monte Carlo valuation, the fair value of each performance-based unit that vests based on market conditions was $36.22 and $41.54 at April 26, 2014, for the awards granted in fiscal 2014 and in fiscal 2013, respectively. During fiscal 2014 and fiscal 2013 we recognized $2.2 million and $0.7 million, respectively, of expense related to performance-based units. The unrecognized compensation cost at April 26, 2014, related to performance-based units was $2.0 million based on the current share price and current estimates of the number of awards that will vest, and is expected to be recognized over a weighted-average remaining contractual term of all unvested awards of 1.1 years.
The performance-based shares are accounted for as equity-based awards because upon vesting they will be settled in common shares. The grant date fair value of performance-based shares is expensed over the service period. For performance-based shares that vest based on performance conditions, the fair value of the award was $18.58, $11.97, and $9.35 for fiscal 2014, fiscal 2013, and fiscal 2012, respectively, which was the market value of our common shares on the date of grant less expected dividends to be paid prior to vesting, and compensation cost is expensed based on the probability that the performance goals will be obtained. For performance-based shares that vest based on market conditions, the fair value of the award was estimated using a Monte Carlo valuation model on the date of grant, and compensation cost is expensed over the vesting period, regardless of the ultimate vesting of the award, similar to the expensing of a stock option award. The fair value for the performance-based shares that vest based on market conditions, as determined by the Monte Carlo valuation, at the grant date was $26.08, $15.41, and $15.12 for the fiscal 2014 grant, fiscal 2013 grant, and fiscal 2012 grant, respectively. The unrecognized compensation cost at April 26, 2014, related to performance-based shares was $3.0 million based on the current estimates of the number of awards that will vest, and is expected to be recognized over a weighted-average remaining contractual term of all unvested awards of 1.4 years.
Equity-based compensation expenses related to performance-based shares recognized in our consolidated statement of income were as follows (for the fiscal years ended):
(Amounts in thousands) | 4/26/2014 | 4/27/2013 | 4/28/2012 | |||||||||
Fiscal 2011 grant | $ | - | $ | 1,707 | $ | 200 | ||||||
Fiscal 2012 grant | 3,603 | 5,442 | 1,409 | |||||||||
Fiscal 2013 grant | 849 | 440 | - | |||||||||
Fiscal 2014 grant | 1,006 | - | - | |||||||||
Previously Granted Deferred Stock Units. Awards under our deferred stock unit plan for non-employee directors are accounted for as liability-based awards because upon exercise these awards will be paid in cash. Compensation expense is initially measured and recognized based on the market price of our common stock on the grant date. The liability is re-measured and adjusted at the end of each reporting period until paid. For purposes of dividends and for measuring the liability, each deferred stock unit is the equivalent of one common share. As of April 26, 2014, we had 0.1 million deferred stock units outstanding. Expense relating to the deferred stock units recorded in selling, general and administrative expense was $0.8 million, $0.3 million, and $0.4 million during fiscal 2014, fiscal 2013, and fiscal 2012, respectively. The liability related to these awards was $3.0 million and $2.2 million at April 26, 2014, and April 27, 2013, respectively, and is included as a component of other long-term liabilities on our consolidated balance sheet.
69
Table of Contents
Note 17: Accumulated Other Comprehensive Loss
The activity in accumulated other comprehensive loss for the fiscal years ended April 26, 2014, and April 27, 2013, were as follows:
(Amounts in thousands) | Unrealized gain on marketable securities | Translation adjustment | Change in fair value of cash flow hedge | Net pension amortization and net actuarial loss | Accumulated other comprehensive loss | |||||||||||||||
Balance at April 28, 2012 | $ | 3,017 | $ | 4,029 | $ | - | $ | (38,327 | ) | $ | (31,281 | ) | ||||||||
Changes before reclassifications | 651 | 750 | 373 | (7,645 | ) | (5,871 | ) | |||||||||||||
Amounts reclassified from accumulated other comprehensive loss | (3,170 | ) | - | - | 3,140 | (30 | ) | |||||||||||||
Tax effect | (24 | ) | - | (142 | ) | 1,852 | 1,686 | |||||||||||||
Other comprehensive income (loss) attributable to La-Z-Boy Incorporated | (2,543 | ) | 750 | 231 | (2,653 | ) | (4,215 | ) | ||||||||||||
Balance at April 27, 2013 | 474 | 4,779 | 231 | (40,980 | ) | (35,496 | ) | |||||||||||||
Changes before reclassifications | 1,308 | (2,324 | ) | (780 | ) | 6,286 | 4,490 | |||||||||||||
Amounts reclassified from accumulated other comprehensive loss | (300 | ) | - |
321 | 3,566 | 3,587 | ||||||||||||||
Tax effect | (384 | ) | - | 175 | (3,752 | ) | (3,961 | ) | ||||||||||||
Other comprehensive income (loss) attributable to La-Z-Boy Incorporated | 624 | (2,324 | ) | (284 | ) | 6,100 | 4,116 | |||||||||||||
Balance at April 26, 2014 | $ | 1,098 | $ | 2,455 | $ | (53 | ) | $ | (34,880 | ) | $ | (31,380 | ) | |||||||
The unrealized gain on marketable securities was reclassified from accumulated other comprehensive loss to net income through other income (expense) in our consolidated statement of income, and the change in fair value of cash flow hedge and the net pension amortization were reclassified to net income through selling, general and administrative expense.
The components of non-controlling interest at April 26, 2014, and April 27, 2013, were as follows:
(Amounts in thousands) | 4/26/2014 | 4/27/2013 | ||||||
Beginning balance | $ | 7,140 | $ | 5,911 | ||||
Net income | 1,324 | 793 | ||||||
Other comprehensive (income) loss | (730 | ) | 339 | |||||
Change in non-controlling interest | 98 | 97 | ||||||
Ending balance | $ | 7,832 | $ | 7,140 | ||||
70
Table of Contents
Note 18: Segment Information
Our reportable operating segments are the Upholstery segment, the Casegoods segment and the Retail segment. During fiscal 2014, we sold our Bauhaus business unit and classified Lea Industries as held for sale. These operating units are presented as discontinued operations and prior financial information was restated for the change in composition of our Upholstery and Casegoods segments. Income statement information presented below is restated accordingly.
Upholstery Segment . The Upholstery segment consists of two operating units, La-Z-Boy and England. This segment manufactures or imports upholstered furniture. Upholstered furniture includes recliners and motion furniture, sofas, loveseats, chairs, sectionals, modulars, ottomans and sleeper sofas. The Upholstery segment sells directly to La-Z-Boy Furniture Galleries® stores, operators of Comfort Studios® locations, major dealers and other independent retailers.
Casegoods Segment . The Casegoods segment consists of three brands: American Drew, Hammary, and Kincaid. This segment sells imported or manufactured wood furniture to furniture retailers. Casegoods product includes bedroom, dining room, entertainment centers, occasional pieces and some coordinated upholstered furniture. The Casegoods segment sells to major dealers and other independent retailers.
Retail Segment . The Retail segment consists of 101 company-owned La-Z-Boy Furniture Galleries® stores in 12 primary markets. During the second quarter of fiscal 2014, we acquired three La-Z-Boy Furniture Galleries® stores in the Las Vegas market that were previously independently owned and operated. During the third quarter of fiscal 2014 we acquired two La-Z-Boy Furniture Galleries® stores in northeast Ohio that were previously independently owned and operated. The Retail segment sells upholstered furniture, in addition to some casegoods and other accessories, to the end consumer through the retail network.
Restructuring. During the fourth quarter of fiscal 2014, we committed to a restructuring of our casegoods business to transition to an all-import model for our wood furniture, and recorded a restructuring charge of $4.8 million in continuing operations, primarily related to fixed asset and inventory write-downs. During fiscal 2013, we recorded a restructuring charge of $2.6 million in continuing operations, mainly related to fixed asset and inventory write-downs related to the closure of our lumber processing operation in our Casegoods segment. See Note 3 for further details of this restructuring. We do not include restructuring costs in the results of our reportable segments.
We have no customer that individually represents more than 3% of our consolidated or Upholstery segment's sales or more than 5% of our Casegoods segment's sales in fiscal 2014.
The accounting policies of the operating segments are the same as those described in Note 1. We account for intersegment revenue transactions between our segments consistent with independent third party transactions, that is, at current market prices. As a result, the manufacturing profit related to sales to our Retail segment is included within the appropriate Upholstery or Casegoods segment. Operating income realized on intersegment revenue transactions is therefore generally consistent with the operating income realized on our revenue from independent third party transactions. Segment operating income is based on profit or loss from operations before interest expense, interest income, income from continued dumping and subsidy offset act, other income (expense) and income taxes. Identifiable assets are cash and equivalents, notes and accounts receivable, net inventories, net property, plant and equipment, goodwill and other intangible assets. Our unallocated assets include deferred income taxes, corporate assets (including a portion of cash and equivalents), business held for sale, and various other assets. Sales are attributed to countries on the basis of the customer's location.
71
Table of Contents
(Amounts in thousands) | 4/26/2014 | 4/27/2013 | 4/28/2012 | |||||||||
Sales |
|
|
| |||||||||
Upholstery segment: |
|
|
| |||||||||
Sales to external customers | $ | 959,118 | $ | 902,454 | $ | 834,468 | ||||||
Intersegment sales | 139,932 | 127,311 | 103,592 | |||||||||
Upholstery segment sales | 1,099,050 | 1,029,765 | 938,060 | |||||||||
Casegoods segment: | ||||||||||||
Sales to external customers | 97,095 | 104,387 | 105,551 | |||||||||
Intersegment sales | 9,657 | 8,140 | 6,106 | |||||||||
Casegoods segment sales | 106,752 | 112,527 | 111,657 | |||||||||
Retail segment sales | 298,642 | 264,723 | 215,490 | |||||||||
VIEs, net of intercompany sales eliminations | - | - | 8,840 | |||||||||
Corporate and Other | 2,463 | 2,313 | 2,356 | |||||||||
Eliminations | (149,589 | ) | (135,451 | ) | (109,698 | ) | ||||||
Consolidated sales | $ | 1,357,318 | $ | 1,273,877 | $ | 1,166,705 | ||||||
Operating Income (Loss) |
|
|
| |||||||||
Upholstery segment | $ | 117,688 | $ | 95,571 | $ | 81,015 | ||||||
Casegoods segment | 3,397 | 3,703 | 5,396 | |||||||||
Retail segment | 11,128 | 4,099 | (7,819 | ) | ||||||||
VIEs | - | - | 959 | |||||||||
Restructuring | (4,839 | ) | (2,631 | ) | (281 | ) | ||||||
Corporate and Other | (38,078 | ) | (33,139 | ) | (30,573 | ) | ||||||
Consolidated operating income | $ | 89,296 | $ | 67,603 | $ | 48,697 | ||||||
| ||||||||||||
Depreciation and Amortization | ||||||||||||
Upholstery segment | $ | 13,778 | $ | 14,275 | $ | 12,519 | ||||||
Casegoods segment | 1,171 | 1,338 | 1,575 | |||||||||
Retail segment | 2,520 | 2,676 | 2,832 | |||||||||
VIEs | - | - | 149 | |||||||||
Corporate and Other | 5,566 | 4,674 | 6,234 | |||||||||
Consolidated depreciation and amortization | $ | 23,035 | $ | 22,963 | $ | 23,309 | ||||||
Capital Expenditures |
|
|
| |||||||||
Upholstery segment | $ | 6,579 | $ | 9,857 | $ | 7,261 | ||||||
Casegoods segment | 149 | 1,058 | 897 | |||||||||
Retail segment | 4,379 | 4,251 | 1,848 | |||||||||
VIEs | - | - | 543 | |||||||||
Corporate and Other | 22,623 | 10,218 | 4,969 | |||||||||
Consolidated capital expenditures | $ | 33,730 | $ | 25,384 | $ | 15,518 | ||||||
| ||||||||||||
Assets | ||||||||||||
Upholstery segment | $ | 305,814 | $ | 296,108 | $ | 303,537 | ||||||
Casegoods segment | 53,299 | 70,147 | 73,888 | |||||||||
Retail segment | 119,816 | 73,496 | 49,818 | |||||||||
Unallocated assets | 292,366 | 280,620 | 258,496 | |||||||||
Consolidated assets | $ | 771,295 | $ | 720,371 | $ | 685,739 | ||||||
72
Table of Contents
(Amounts in thousands) | 4/26/2014 | 4/27/2013 | 4/28/2012 | |||||||||
Long-Lived Assets by Geographic Location |
|
|
| |||||||||
Domestic | $ | 147,538 | $ | 133,208 | $ | 114,979 | ||||||
International | 6,805 | 8,168 | 8,345 | |||||||||
Consolidated long-lived assets | $ | 154,343 | $ | 141,376 | $ | 123,324 | ||||||
| ||||||||||||
Sales by Country | ||||||||||||
United States | 86 | % | 86 | % | 86 | % | ||||||
Canada | 8 | % | 9 | % | 9 | % | ||||||
Other | 6 | % | 5 | % | 5 | % | ||||||
Total | 100 | % | 100 | % | 100 | % | ||||||
Note 19: Income Taxes
Income before income taxes for continuing operations consists of the following (for the fiscal years ended):
(Amounts in thousands) | 4/26/2014 | 4/27/2013 | 4/28/2012 | |||||||||
United States | $ | 82,705 | $ | 63,193 | $ | 52,631 | ||||||
Foreign | 8,854 | 7,492 | 6,319 | |||||||||
Total | $ | 91,559 | $ | 70,685 | $ | 58,950 | ||||||
Income tax expense (benefit) applicable to continuing operations consists of the following components (for the fiscal years ended):
(Amounts in thousands) | 4/26/2014 | 4/27/2013 | 4/28/2012 | |||||||||
Federal: |
|
|
| |||||||||
– current | $ | 24,695 | $ | 17,049 | $ | 11,830 | ||||||
– deferred | 1,495 | 1,341 | (38,597 | ) | ||||||||
State: | ||||||||||||
– current | 5,345 | 2,746 | 3,446 | |||||||||
– deferred | ( 2,082 | ) | 464 | (1,864 | ) | |||||||
Foreign: | ||||||||||||
– current | 1,375 | 739 | 2,040 | |||||||||
– deferred | 555 | 1,181 | (1,907 | ) | ||||||||
Total income tax expense (benefit) | $ | 31,383 | $ | 23,520 | $ | (25,052 | ) | |||||
Our effective tax rate differs from the U.S. federal income tax rate for the following reasons:
(% of pre-tax income) | 4/26/2014 | 4/27/2013 | 4/28/2012 | |||||||||
Statutory tax rate | 35.0 | % | 35.0 | % | 35.0 | % | ||||||
Increase (reduction) in income taxes resulting from: | ||||||||||||
State income taxes, net of federal benefit | 3.1 | 3.0 | 5.0 | |||||||||
U.S. manufacturing benefit | (1.0 | ) | (2.0 | ) | (2.3 | ) | ||||||
Change in valuation allowance | (1.2 | ) | (0.3 | ) | (78.3 | ) | ||||||
Gain on sale of marketable securities | - | (1.6 | ) | - | ||||||||
Miscellaneous items | (1.6 | ) | (0.8 | ) | (1.9 | ) | ||||||
Effective tax rate | 34.3 | % | 33.3 | % | (42.5 | %) | ||||||
For our Asian operating units, we continue to permanently reinvest the earnings and consequently do not record a deferred tax liability relative to the undistributed earnings. We have reinvested approximately $8.5 million of the earnings. The potential deferred tax attributable to these earnings would be approximately $2.1 million.
73
Table of Contents
The primary components of our deferred tax assets and (liabilities) were as follows:
(Amounts in thousands) | 4/26/2014 | 4/27/2013 | ||||||
Assets |
|
| ||||||
Deferred and other compensation | $ | 19,774 | $ | 19,510 | ||||
Allowance for doubtful accounts | 5,456 | 9,567 | ||||||
State income tax – net operating losses, credits and other | 6,440 | 6,542 | ||||||
Pension | 2,097 | 4,632 | ||||||
Warranty | 6,247 | 5,937 | ||||||
Rent | 4,824 | 4,697 | ||||||
Workers' compensation | 4,068 | 3,804 | ||||||
Foreign net operating loss | - | 759 | ||||||
| ||||||||
Other | 6,598 | 5,128 | ||||||
Valuation allowance | (4,700 | ) | (6,619 | ) | ||||
Total deferred tax assets | 50,804 | 53,957 | ||||||
Liabilities | ||||||||
Property, plant and equipment | (3,337 | ) | (2,745 | ) | ||||
Net deferred tax assets | $ | 47,467 | $ | 51,212 | ||||
The deferred tax assets associated with loss carry forwards and the related expiration dates are as follows:
(Amounts in thousands) | Amount | Expiration | |||
Various U.S. state net operating losses (excluding federal tax effect) | $ | 9,215 | Fiscal 2015 – 2033 | ||
Foreign capital losses | 20 | Indefinite | |||
We evaluate our deferred taxes to determine if a valuation allowance is required. Accounting standards require that we assess whether a valuation allowance should be established based on the consideration of all available evidence using a "more likely than not" standard with significant weight being given to evidence that can be objectively verified.
During fiscal 2012 we concluded that certain valuation allowances totaling $46.2 million associated with certain U.S. federal, state and Canadian deferred tax assets should be reversed because we believed that it had become more likely than not that the value of those deferred tax assets would be realized. The reduction in the valuation allowance was primarily the result of the following factors at the point we reduced the allowance: (i) our cumulative three-year pre-tax income position, (ii) our most recent operating results, which had exceeded both our operating plan and prior year results, and (iii) our then-current forecasts, all of which caused us to temper our concerns at that time regarding the economic environment.
The evaluation of the amount of net deferred tax assets expected to be realized necessarily involves forecasting the amount of taxable income that will be generated in future years. We have forecasted future results using estimates management believes to be reasonable, which are based on objective evidence such as expected trends resulting from certain leading economic indicators. Based upon our net deferred tax asset position at April 26, 2014, we estimate that about $122 million of future taxable income would need to be generated to fully recover our net deferred tax assets. The realization of deferred income tax assets is dependent on future events. Actual results inevitably will vary from management's forecasts. Such variances could result in adjustments to the valuation allowance on deferred tax assets in future periods, and such adjustments could be material to the financial statements.
74
Table of Contents
During fiscal 2014, we recorded a $1.9 million decrease in our valuation allowance for deferred tax assets that are now considered more likely than not to be realized. This determination was primarily the result of our assessment of our cumulative pre-tax income in certain jurisdictions. A summary of the valuation allowance by jurisdiction is as follows:
Jurisdiction
(Amounts in thousands) | 4/27/2013 Valuation Allowance | Change | 4/26/2014 Valuation Allowance | |||||||||
U.S. state | 6,464 | (1,784 | ) | 4,680 | ||||||||
Foreign | 155 | (135 | ) | 20 | ||||||||
Total | $ | 6,619 | $ | (1,919 | ) | $ | 4,700 | |||||
The remaining valuation allowance of $4.7 million primarily related to certain U.S. state and foreign deferred tax assets. The U.S. state deferred taxes are primarily related to state net operating losses.
As of April 26, 2014, we had a gross unrecognized tax benefit of $3.0 million related to uncertain tax positions in various jurisdictions. A reconciliation of the beginning and ending balance of these unrecognized tax benefits is as follows:
( Amounts in thousands ) | 4/26/2014 | 4/27/2013 | 4/28/2012 | |||||||||
Balance at the beginning of the period | $ | 3,248 | $ | 3,909 | $ | 4,492 | ||||||
Additions: | ||||||||||||
Positions taken during the current year | 88 | 338 | 147 | |||||||||
Positions taken during the prior year | - | - | - | |||||||||
Reductions: | ||||||||||||
Positions taken during the current year | - | - | - | |||||||||
Positions taken during the prior year | (99 | ) | (28 | ) | (202 | ) | ||||||
Decreases related to settlements with taxing authorities | (98 | ) | - | (166 | ) | |||||||
Reductions resulting from the lapse of the statute of limitations | (167 | ) | (971 | ) | (362 | ) | ||||||
Balance at the end of the period | $ | 2,972 | $ | 3,248 | $ | 3,909 | ||||||
We recognize interest and penalties associated with uncertain tax positions in income tax expense. Accrued interest and penalties decreased by $0.1 million during fiscal 2014. We had approximately $0.3 million accrued for interest and penalties as of April 26, 2014, and $0.4 million accrued for interest and penalties as of April 27, 2013.
If recognized, $0.6 million of the total $3.0 million of unrecognized tax benefits would decrease our effective tax rate. We do not expect any adjustments within the next 12 months. The remaining balance will be settled or released as tax audits are effectively settled, statutes of limitation expire or other new information becomes available.
Our U.S. federal income tax returns for fiscal years 2011 and subsequent are still subject to audit. Our fiscal year 2012 U.S. federal tax return was recently selected for audit. In addition, we conduct business in various states. The major states in which we conduct business are subject to audit for fiscal years 2010 and subsequent. Our businesses in Canada and Thailand are subject to audit for fiscal years 2004 and subsequent, and in Mexico, calendar years 2008 and subsequent.
Cash paid for taxes (net of refunds received) during the fiscal years ended April 26, 2014, April 27, 2013, and April 28, 2012, were $25.0 million, $20.5 million and $15.2 million, respectively.
75
Table of Contents
Note 20: Earnings per Share
Certain share-based payment awards that entitle their holders to receive non-forfeitable dividends prior to vesting are considered participating securities. We grant restricted stock awards that contain non-forfeitable rights to dividends on unvested shares; as participating securities, the unvested shares are required to be included in the calculation of our basic earnings per common share, using the two-class method.
A reconciliation of the numerators and denominators used in the computations of basic and diluted earnings per share were as follows:
| Year Ended | |||||||||||
(Amounts in thousands) | 4/26/2014 | 4/27/2013 | 4/28/2012 | |||||||||
Numerator (basic and diluted): |
|
|
| |||||||||
Net income attributable to La-Z-Boy Incorporated | $ | 55,056 | $ | 46,389 | $ | 87,966 | ||||||
Income allocated to participating securities | (422 | ) | (639 | ) | (1,650 | ) | ||||||
Net income available to common shareholders | $ | 54,634 | $ | 45,750 | $ | 86,316 | ||||||
| Year Ended | |||||||||||
(Amounts in thousands) | 4/26/2014 | 4/27/2013 | 4/28/2012 | |||||||||
Denominator: |
|
|
| |||||||||
Basic weighted average common shares outstanding | 52,386 | 52,351 | 51,944 | |||||||||
Add: | ||||||||||||
Contingent common shares | 1,049 | 812 | - | |||||||||
Stock option dilution | 394 | 522 | 534 | |||||||||
Diluted weighted average common shares outstanding | 53,829 | 53,685 | 52,478 | |||||||||
Contingent common shares reflect the dilutive effect of common shares that would be issued under the terms of performance-based share grants made to employees, assuming the reporting period was the performance period.
We had outstanding options to purchase 0.2 million and 0.4 million shares for the years ended April 27, 2013, and April 28, 2012, respectively, with a weighted average exercise price of $20.74 and $19.97, respectively. We excluded the effect of these options from the diluted share calculation since, for each period presented, the weighted average exercise price of the options was higher than the average market price, and including the options' effect would have been anti-dilutive. There were no outstanding options to purchase shares that were excluded from the diluted share calculation because their effect would have been anti-dilutive for the fiscal year ended April 26, 2014.
Note 21: Fair Value Measurements
Accounting standards require the categorization of financial assets and liabilities, based on the inputs to the valuation technique, into a three-level fair value hierarchy. The various levels of the fair value hierarchy are described as follows:
| · | Level 1 - Financial assets and liabilities whose values are based on unadjusted quoted market prices for identical assets and liabilities in an active market that we have the ability to access. |
| · | Level 2 - Financial assets and liabilities whose values are based on quoted prices in markets that are not active or model inputs that are observable for substantially the full term of the asset or liability. |
| · | Level 3 - Financial assets and liabilities whose values are based on prices or valuation techniques that require inputs that are both unobservable and significant to the overall fair value measurement. |
76
Table of Contents
Accounting standards require the use of observable market data, when available, in making fair value measurements. When inputs used to measure fair value fall within different levels of the hierarchy, the level within which the fair value measurement is categorized is based on the lowest level input that is significant to the fair value measurement. Transfers between levels are recognized at the end of the reporting period in which they occur.
In addition to assets and liabilities that are recorded at fair value on a recurring basis, we are required to record assets and liabilities at fair value on a non-recurring basis. Non-financial assets such as trade names, goodwill, and other long-lived assets are measured at fair value when there is an indicator of impairment and recorded at fair value only when an impairment loss is recognized. During fiscal 2014 and fiscal 2013 we recorded trade names at fair value based upon the relief from royalty method. During the third quarter of fiscal 2014 we recorded the value of the assets of our Bauhaus business unit at fair value. See Note 4 for further discussion.
The following table presents the fair value hierarchy for those assets measured at fair value on a recurring basis as of April 26, 2014, and April 27, 2013:
Fiscal 2014 | Fair Value Measurements | |||||||||||
(Amounts in thousands) | Level 1 (a) | Level 2 (a) | Level 3 | |||||||||
Assets |
|
|
| |||||||||
Available-for-sale securities | $ | 1,521 | $ | 57,630 | $ | - | ||||||
Trading securities | - | 1,787 | - | |||||||||
Total | $ | 1,521 | $ | 59,417 | $ | - | ||||||
| (a) | There were no transfers between Level 1 and Level 2 during fiscal 2014. |
Fiscal 2013 | Fair Value Measurements | |||||||||||
(Amounts in thousands) | Level 1 (b) | Level 2 (b) | Level 3 | |||||||||
Assets |
|
|
| |||||||||
Available-for-sale securities | $ | 1,217 | $ | 38,747 | $ | - | ||||||
Trading securities | - | 1,126 | - | |||||||||
Total | $ | 1,217 | $ | 39,873 | $ | - | ||||||
| (b) | There were no transfers between Level 1 and Level 2 during fiscal 2013. |
At April 26, 2014, we held available-for-sale marketable securities intended to enhance returns on our cash and to fund future obligations of our non-qualified defined benefit retirement plan, as well as trading securities to fund future obligations of our executive deferred compensation plan. At April 27, 2013, we held available-for-sale marketable securities intended to enhance returns on our cash and to fund future obligations of our non-qualified defined benefit retirement plan, as well as trading securities to fund future obligations of our executive deferred compensation plan. The fair value measurements for our securities are based upon quoted prices in active markets, as well as through broker quotes and independent valuation providers, multiplied by the number of shares owned exclusive of any transaction costs.
77
Table of Contents
Note 22: Income from Continued Dumping and Subsidy Offset Act
The Continued Dumping and Subsidy Offset Act of 2000 ("CDSOA") provides for distribution of duties collected by U.S. Customs and Border Protection from antidumping cases to domestic producers that supported the antidumping petition. We received $11.1 million related to continuing operations and $6.9 million related to discontinued operations during fiscal 2012 in CDSOA distributions related to the antidumping order on wooden bedroom furniture from China. Certain domestic producers who did not support the antidumping petition ("Non-Supporting Producers") filed actions in the U.S. Court of International Trade challenging the CDSOA's "support requirement" and seeking a share of the distributions. As a result, Customs withheld a portion of those distributions pending resolution of the Non-Supporting Producers' actions. Between October 2011 and February 2012, the Court of International Trade entered judgments against the Non-Supporting Producers and dismissed their actions. On January 1, 2012, Customs announced that it would distribute the withheld distributions. The Non-Supporting Producers then filed motions in the Court of International Trade and, later, in the U.S. Court of Appeals for the Federal Circuit to enjoin such distributions pending their appeal of the Court of International Trade's judgments. On March 5, 2012, the Federal Circuit denied the Non-Supporting Producers' motions for injunction "without prejudicing the ultimate disposition of these cases." In November 2012, Customs determined to withhold CDSOA distributions pending resolution of the Federal Circuit appeals. As a result, we did not receive any CDSOA distributions in fiscal 2013 or fiscal 2014. On August 19, 2013, a panel of the Federal Circuit affirmed dismissal of the actions of two of the Non-Supporting Producers, and the full Federal Circuit subsequently denied those Non-Supporting Producers' request for rehearing. On May 2, 2014, these Non-Supporting Producers filed a petition for writ of certiorari, seeking review by the United States Supreme Court. A motion to affirm dismissal of the action brought by a third Non-Supporting Producer is pending in the Federal Circuit. In view of the uncertainties associated with this program, we are unable to predict the amounts, if any, we may receive in the future under the CDSOA. Also, if the United States Supreme Court were to reverse the judgments of the Federal Circuit and determine that the Non-Supporting Producers are entitled to CDSOA distributions, it is possible that Customs might seek to have us return all or a portion of our company's share of the distributions. Based on what we know today, we do not expect this to occur. The $11.1 million and $6.9 million we received in fiscal 2012 related to continuing operations and discontinued operations, respectively, included $10.0 million and $6.3 million, respectively, of previously withheld distributions received in the fourth quarter of fiscal 2012.
ITEM 9. CHANGES IN AND DISAGREEMENTS WITH ACCOUNTANTS ON ACCOUNTING AND FINANCIAL DISCLOSURE.
None.
ITEM 9A. CONTROLS AND PROCEDURES.
Disclosure Controls and Procedures. As of the end of the period covered by this report, we carried out an evaluation, under the supervision and with the participation of our management, including our Chief Executive Officer and Chief Financial Officer, of the effectiveness of the design and operation of our disclosure controls and procedures, as such term is defined in Rule 13a-15(e) of the Exchange Act. Based upon that evaluation, our Chief Executive Officer and Chief Financial Officer concluded that such disclosure controls and procedures are effective to ensure that information required to be disclosed in our periodic reports filed under the Exchange Act is recorded, processed, summarized and reported within the time periods specified by the Securities and Exchange Commission's rules and forms and is accumulated and communicated to our management, including our Chief Executive Officer and Chief Financial Officer, as appropriate to allow timely decisions regarding required disclosure.
Management's Annual Report on Internal Control over Financial Reporting. Our management's report on internal control over financial reporting is included in Item 8 of this report.
Attestation Report of the Registered Public Accounting Firm. Our registered public accounting firm's attestation report on our internal control over financial reporting is included in Item 8 of this report.
Changes in Internal Control over Financial Reporting. We are implementing an enterprise resource planning ("ERP") system in our largest operating unit. The implementation is expected to occur in phases over the next two years. The implementation of an ERP system will affect the processes that constitute our internal control over financial reporting and will require testing for effectiveness as the implementation progresses. There were no changes in our internal controls over financial reporting during our fourth quarter of fiscal 2014 that have materially affected, or are reasonably likely to materially affect, our internal control over financial reporting.
78
Table of Contents
ITEM 9B. OTHER INFORMATION.
None.
PART III
ITEM 10. DIRECTORS, EXECUTIVE OFFICERS, AND CORPORATE GOVERNANCE.
We have adopted a Code of Business Conduct, which applies to all of our officers, directors, and employees. A current copy of the code is posted at our website www.la-z-boy.com .
We provide some information about our executive officers in Part I of this report, under the heading "Executive Officers of Registrant." All other information required to be reported under this item will be included in our proxy statement for our 2014 annual meeting, and all of that information is incorporated in this item by reference.
ITEM 11. EXECUTIVE COMPENSATION.
All information required to be reported under this item will be included in our proxy statement for our 2014 annual meeting, and all of that information is incorporated in this item by reference.
ITEM 12. SECURITY OWNERSHIP OF CERTAIN BENEFICIAL OWNERS AND MANAGEMENT AND RELATED STOCKHOLDER MATTERS.
The information required to be reported under Item 201(d) of Regulation S-K is contained in Item 5 of this report. All other information required to be reported under this item will be included in our proxy statement for our 2014 annual meeting, and all of that information is incorporated in this item by reference.
ITEM 13. CERTAIN RELATIONSHIPS AND RELATED TRANSACTIONS, AND DIRECTOR INDEPENDENCE.
All information required to be reported under this item will be included in our proxy statement for our 2014 annual meeting, and all of that information is incorporated in this item by reference.
ITEM 14. PRINCIPAL ACCOUNTING FEES AND SERVICES.
All information required to be reported under this item will be included in our proxy statement for our 2014 annual meeting, and all of that information is incorporated in this item by reference.
79
Table of Contents
PART IV
ITEM 15. EXHIBITS, FINANCIAL STATEMENT SCHEDULES.
(a) The following documents are filed as part of this report:
(1) | Financial Statements: | |
|
| Management's Report to Our Shareholders |
Report of Independent Registered Public Accounting Firm | ||
|
| Consolidated Statement of Income for each of the three fiscal years ended April 26, 2014, April 27, 2013, and April 28, 2012 |
|
| Consolidated Statement of Comprehensive Income for each of the three fiscal years ended April 26, 2014, April 27, 2013, and April 28, 2012 |
|
| Consolidated Balance Sheet at April 26, 2014, and April 27, 2013 |
|
| Consolidated Statement of Cash Flows for the fiscal years ended April 26, 2014, April 27, 2013, and April 28, 2012 |
|
| Consolidated Statement of Changes in Equity for the fiscal years ended April 26, 2014, April 27, 2013, and April 28, 2012 |
|
| Notes to Consolidated Financial Statements |
|
|
|
(2) | Financial Statement Schedules: | |
|
| Report of Independent Registered Public Accounting Firm on Financial Statement Schedule |
|
| Schedule II - Valuation and Qualifying Accounts for the fiscal years ended April 26, 2014, April 27, 2013, and April 28, 2012 |
|
|
|
|
| The Report of Independent Registered Public Accounting Firm and Schedule II immediately follow this item. |
|
|
|
|
| All other schedules are omitted because they are not applicable or not required because the required information is included in the financial statements or notes thereto. |
Note: For all exhibits incorporated by reference, the SEC file number is 1-9656. Exhibits not incorporated by reference are being filed or furnished with this report.
(3) | Exhibits: | |
|
| T he following exhibits are filed or furnished as part of this report: |
Exhibit Number | Description |
(2) | Not applicable |
(3.1) | La-Z-Boy Incorporated Restated Articles of Incorporation ( Incorporated by reference to an exhibit to Form 10-Q for the quarter ended October 26, 1996) |
(3.2) | La-Z-Boy Incorporated Amendment to Restated Articles of Incorporation effective August 21, 1998 ( Incorporated by reference to an exhibit to Form 10-Q for the quarter ended October 27, 2012) |
(3.3) | La-Z-Boy Incorporated Amendment to Restated Articles of Incorporation effective August 22, 2008 (Incorporated by reference to an exhibit to Form 10-Q for the quarter ended October 27, 2012) |
(3.4) | La-Z-Boy Incorporated Amendment to Restated Articles of Incorporation effective August 24, 2012 (Incorporated by reference to an exhibit to Form 10-Q for the quarter ended October 27, 2012) |
80
Table of Contents
(3.5) | La-Z-Boy Incorporated Amended and Restated Bylaws (as of May 3, 2011) (Incorporated by reference to an exhibit to Form 8-K filed May 6, 2011) |
(4.1) | Amended and Restated Credit Agreement dated as of October 19, 2011, among La-Z-Boy Incorporated, certain of its subsidiaries, the lenders named therein, and Wells Fargo Capital Finance, LLC, as administrative agent for the lenders (Incorporated by reference to an exhibit to Form 8-K filed October 21, 2011) |
(9) | Not applicable |
(10.1)* | La-Z-Boy Incorporated Restricted Stock Plan for Non-Employee Directors, amended and restated through August 12, 2003 (Incorporated by reference to an exhibit to definitive proxy statement dated July 9, 2003) |
(10.2)* | La-Z-Boy Incorporated Deferred Stock Unit Plan for Non-Employee Directors (Incorporated by reference to an exhibit to Form 10-Q for the quarter ended October 25, 2008) |
(10.3)* | Form of Change in Control Agreement in effect for: Kurt L. Darrow. Similar agreements are in effect for Steven M. Kincaid, Louis M. Riccio, Jr., Otis Sawyer and Mark S. Bacon, Sr., except the provisions related to the periods for protection and benefits are twenty-four months (Incorporated by reference to an exhibit to Form 10-K for the fiscal year ended April 24, 2010) |
(10.4)* | Form of Indemnification Agreement (covering all directors, including employee-directors) (Incorporated by reference to an exhibit to Form 8-K, filed January 22, 2009) |
(10.5)* | 2005 La-Z-Boy Incorporated Executive Deferred Compensation Plan, amended and restated as of November 18, 2008 (Incorporated by reference to an exhibit to Form 10-Q for the quarter ended October 24, 2009) |
(10.6)* | La-Z-Boy Incorporated 2004 Long-Term Equity Award Plan as amended through June 13, 2008 (Incorporated by reference to an exhibit to Form 10-K for the fiscal year ended April 26, 2008) |
(10.7)* | First 2009 Amendment to La-Z-Boy Incorporated 2004 Long-Term Equity Award Plan effective June 11, 2009 (Incorporated by reference to an exhibit to Form 10-K for the fiscal year ended April 25, 2009) |
(10.8)* | Second 2009 Amendment to La-Z-Boy Incorporated 2004 Long-Term Equity Award Plan effective June 15, 2009 (Incorporated by reference to an exhibit to Form 10-K for the fiscal year ended April 25, 2009) |
(10.9)* | Sample award agreement under the 2004 Long-Term Equity Award Plan ( Incorporated by reference to an exhibit to Form 10-K for the fiscal year ended April 29, 2006 ) |
(10.10)* | Amended and Restated La-Z-Boy Incorporated 2010 Omnibus Incentive Plan (Incorporated by reference to Annex A to definitive proxy statement for annual meeting of shareholders held August 21, 2013) |
(10.11)* | La-Z-Boy Incorporated 2010 Omnibus Incentive Plan Sample Award Agreement (Incorporated by reference to an exhibit to Form 10-Q for the quarter ended October 23, 2010) |
(10.12)* | La-Z-Boy Incorporated 2010 Omnibus Incentive Plan Revised Sample Award Agreement effective July 9, 2012 (Incorporated by reference to an exhibit to Form 8-K filed July 9, 2012) |
(10.13)* | First 2010 Amendment to La-Z-Boy Incorporated 2004 Long-Term Equity Award Plan effective June 11, 2010 (Incorporated by reference to an exhibit to Form 10-K for the fiscal year ended April 24, 2010) |
(10.14)* | La-Z-Boy Incorporated Severance Plan for Named Executive Officers (Incorporated by reference to an exhibit to Form 10-K for the fiscal year ended April 24, 2010) |
(10.15)* | La-Z-Boy Incorporated Performance Compensation Retirement Plan effective April 27, 2013 (Incorporated by reference to an exhibit to Form 10-K for the fiscal year ended April 27, 2013) |
(10.16)* | 2014 Amendment to La-Z-Boy Incorporated Performance Compensation Retirement Plan |
(11) | Statement regarding computation of per share earnings (See Note 20 to the Consolidated Financial Statements included in Item 8) |
(12) | Not applicable |
(13) | Not applicable |
(14) | Not applicable |
(16) | Not applicable |
81
Table of Contents
(18) | Not applicable |
(21) | List of subsidiaries of La-Z-Boy Incorporated |
(22) | Not applicable |
(23) | Consent of PricewaterhouseCoopers LLP (EDGAR filing only) |
(24) | Not applicable |
(31.1) | Certifications of Chief Executive Officer pursuant to Rule 13a-14(a) |
(31.2) | Certifications of Chief Financial Officer pursuant to Rule 13a-14(a) |
(32) | Certifications pursuant to 18 U.S.C. Section 1350 |
(33) | Not applicable |
(34) | Not applicable |
(35) | Not applicable |
(95) | Not applicable |
(99) | Not applicable |
(100) | Not applicable |
(101.INS) | XBRL Instance Document |
(101.SCH) | XBRL Taxonomy Extension Schema Document |
(101.CAL) | XBRL Taxonomy Extension Calculation Linkbase Document |
(101.LAB) | XBRL Taxonomy Extension Label Linkbase Document |
(101.PRE) | XBRL Taxonomy Extension Presentation Linkbase Document |
(101.DEF) | XBRL Taxonomy Extension Definition Linkbase Document |
* | Indicates a management contract or compensatory plan or arrangement under which a director or executive officer may receive benefits. |
82
Table of Contents
Report of Independent Registered Public Accounting Firm on Financial Statement Schedule
To the Board of Directors and Shareholders of La-Z-Boy Incorporated:
Our audits of the consolidated financial statements and of the effectiveness of internal control over financial reporting referred to in our report dated June 17, 2014 appearing in this Form 10-K also included an audit of the financial statement schedule listed in Item 15(a)(2) of this Form 10-K. In our opinion, this financial statement schedule presents fairly, in all material respects, the information set forth therein when read in conjunction with the related consolidated financial statements.
/s/ PricewaterhouseCoopers LLP
Detroit, Michigan
June 17, 2014
83
Table of Contents
LA-Z-BOY INCORPORATED
SCHEDULE II VALUATION AND QUALIFYING ACCOUNTS
(Dollars in thousands)
|
| Additions |
|
| ||||||||||||||||
Description | Balance at Beginning of Year | Charged to Costs and Expenses | Charged to Other Accounts | Deductions | Balance at End of Year | |||||||||||||||
Allowance for doubtful accounts, deducted from accounts receivable: |
|
|
|
|
| |||||||||||||||
April 26, 2014 | $ | 21,607 | $ | (2,926 | ) | $ | - | $ | (6,313 | )(a) | $ | 12,368 | ||||||||
April 27, 2013 | 22,254 | 495 | - | (1,142 | )(a) | 21,607 | ||||||||||||||
April 28, 2012 | 23,435 | 3,508 | - | (4,689 | )(a) | 22,254 | ||||||||||||||
| ||||||||||||||||||||
Allowance for deferred tax assets: | ||||||||||||||||||||
April 26, 2014 | $ | 6,619 | $ | (135 | ) | $ | - | $ | (1,784 | )(b) | $ | 4,700 | ||||||||
April 27, 2013 | 8,258 | 131 | (1,572 | )(c) | (198 | )(b) | 6,619 | |||||||||||||
April 28, 2012 | 52,613 | 160 | 1,687 | (c) | (46,202 | )(d) | 8,258 | |||||||||||||
(a) Deductions represented uncollectible accounts written off less recoveries of accounts receivable written off in prior years.
(b) Valuation allowance release.
(c) Represents impact of adjusting gross deferred tax assets.
(d) Represents utilization of loss carryovers.
84
Table of Contents
SIGNATURES
Pursuant to the requirements of Section 13 or 15(d) of the Securities Exchange Act of 1934, the Registrant has duly caused this Form 10-K to be signed on its behalf by the undersigned, thereunto duly authorized.
DATE: June 17, 2014 |
| LA-Z-BOY INCORPORATED |
|
|
|
| BY | /s/ Kurt L. Darrow |
|
| Chairman, President and Chief Executive Officer |
Pursuant to the requirements of the Securities Exchange Act of 1934, this report has been signed below, as of June 17, 2014, by the following persons on behalf of the Registrant and in the capacities indicated.
/s/K.L. Darrow |
| /s/J.H. Foss |
K.L. Darrow |
| J.H. Foss |
Chairman, President and Chief Executive Officer |
| Director |
|
|
|
/s/R.M. Gabrys |
| /s/J.L. Gurwitch |
R.M. Gabrys |
| J.L. Gurwitch |
Director |
| Director |
|
|
|
/s/D.K. Hehl |
| /s/E.J. Holman |
D.K. Hehl |
| E.J. Holman |
Director |
| Director |
|
|
|
/s/J.E. Kerr |
| /s/M.T. Lawton |
J.E. Kerr |
| M.T. Lawton |
Director |
| Director |
|
|
|
/s/H.G. Levy |
| /s/W.A. McCollough |
H.G. Levy |
| W.A. McCollough |
Director |
| Director |
|
|
|
/s/N.R. Qubein |
| /s/L.M. Riccio, Jr. |
N.R. Qubein |
| L.M. Riccio, Jr. |
Director |
| Senior Vice President, Chief Financial Officer |
|
|
|
/s/M.L. Mueller |
|
|
M.L. Mueller |
|
|
Vice President, Corporate Controller and Chief Accounting Officer |
|
|
85