UNITED STATES
SECURITIES AND EXCHANGE COMMISSION
Washington, D.C. 20549

OF THE SECURITIES EXCHANGE ACT OF 1934 For the fiscal year ended April 25, 2009 COMMISSION FILE NUMBER 1-9656
(Exact name of registrant as specified in its charter)
| MICHIGAN | 38-0751137 | |
| (State or other jurisdiction of incorporation or organization) | (I.R.S. Employer Identification No.) |
| 1284 North Telegraph Road, Monroe, Michigan | 48162-3390 | |
| (Address of principal executive offices) | (Zip Code) |
Registrant's telephone number, including area code (734) 242-1444
Securities registered pursuant to Section 12(b) of the Act:
| Title of each class | Name of each exchange on which registered | |
| Common Shares, $1.00 Par Value | New York Stock Exchange |
Securities registered pursuant to Section 12(g) of the Act: None
Indicate by check mark if the Registrant is a well-known seasoned issuer, as defined in rule 405 of the Securities Act. Yes o No x
Indicate by check mark if the Registrant is not required to file reports pursuant to Section 13 or 15(d) of the Exchange Act. Yes o No x
Indicate by check mark whether the Registrant (1) has filed all reports required to be filed by Section 13 or 15(d) of the Securities Exchange Act of 1934 during the preceding 12 months (or for such shorter period that the registrant was required to file such reports), and (2) has been subject to such filing requirements for the past 90 days. Yes x No o
Indicate by check mark whether the Registrant has submitted electronically and posted on its corporate Web site, if any, every Interactive Data File required to be submitted and posted pursuant to Rule 405 of Regulation S-T during the preceding 12 months (or for such shorter period that the registrant was required to submit and post such files). Yes o No o
Indicate by check mark if disclosure of delinquent filers pursuant to Item 405 of Regulation S-K is not contained herein, and will not be contained, to the best of the Registrant's knowledge, in definitive proxy or information statements incorporated by reference in Part III of this Form 10-K or any amendment to this Form 10-K. x
Indicate by check mark whether the Registrant is a large accelerated filer, an accelerated filer, a non-accelerated filer or a smaller reporting company. See the definitions of "large accelerated filer," "accelerated filer,"and "smaller reporting company" in Rule 12b-2 of the Exchange Act. (Check one):
| Large accelerated filer o | Accelerated filer x | Non-accelerated filer o | Smaller reporting company o |
Indicate by check mark whether the Registrant is a shell company (as defined in Rule 12b-2 of the Exchange Act). Yes o No x
Based on the closing price on the New York Stock Exchange on October 24, 2008, the aggregate market value of Registrant's common shares held by non-affiliates of the Registrant on that date was $237.3 million.
The number of common shares outstanding of the Registrant was 52,172,505 as of May 30, 2009.
DOCUMENTS INCORPORATED BY REFERENCE:| (1) | Portions of the Registrant's Proxy Statement to be filed with the Securities and Exchange Commission pursuant to Regulation 14A for its 2009 Annual Meeting of Shareholders are incorporated by reference into Part III. |
TABLE OF CONTENTS
LA-Z-BOY INCORPORATEDFORM 10-K ANNUAL REPORT FISCAL 2009
TABLE OF CONTENTS
| Page Number(s) | ||||
| Cautionary Statement Concerning Forward-Looking Statements | 2 | |||
| PART I | ||||
Item 1. Business | 3 | |||
Item 1A. Risk Factors | 9 | |||
Item 1B. Unresolved Staff Comments | 10 | |||
Item 2. Properties | 10 | |||
Item 3. Legal Proceedings | 11 | |||
Item 4. Submission of Matters to a Vote of Security Holders | 11 | |||
| Executive Officers of the Registrant | 12 | |||
| PART II | ||||
Item 5. Market for Registrant's Common Equity, Related Stockholder Matters and Issuer Purchases of Equity Securities | 13 | |||
Item 6. Selected Financial Data | 16 | |||
Item 7. Management's Discussion and Analysis of Financial Condition and Results of Operation | 19 | |||
Item 7A. Quantitative and Qualitative Disclosures About Market Risk | 38 | |||
Item 8. Financial Statements and Supplementary Data | 39 | |||
Item 9. Changes in and Disagreements with Accountants on Accounting and Financial Disclosure | 75 | |||
Item 9A. Controls and Procedures | 75 | |||
Item 9B. Other Information | 75 | |||
| PART III | ||||
Item 10. Directors, Executive Officers, and Corporate Governance | 76 | |||
Item 11. Executive Compensation | 76 | |||
Item 12. Security Ownership of Certain Beneficial Owners and Management and Related Stockholder Matters | 76 | |||
Item 13. Certain Relationships and Related Transactions, and Director Independence | 76 | |||
Item 14. Principal Accountant Fees and Services | 76 | |||
| PART IV | ||||
Item 15. Exhibits and Financial Statement Schedules | 77 | |||
Note: The responses to Items 10 through 14 will be included in the Company's definitive proxy statement to be filed pursuant to Regulation 14A for the 2009 Annual Meeting of Shareholders. The required information is incorporated into this Form 10-K by reference to that document and is not repeated herein.
1
TABLE OF CONTENTS
Cautionary Statement Concerning Forward-Looking StatementsWe are making forward-looking statements in this report. Generally, forward-looking statements include information concerning possible or assumed future actions, events or results of operations. More specifically, forward-looking statements include the information in this document regarding:
| future income, margins and cash flows | future economic performance | |
| future growth | industry and importing trends | |
| adequacy and cost of financial resources | management plans |
Forward-looking statements also include those preceded or followed by the words "anticipates," "believes," "estimates," "hopes," "plans," "intends" and "expects" or similar expressions. With respect to all forward-looking statements, we claim the protection of the safe harbor for forward-looking statements contained in the Private Securities Litigation Reform Act of 1995.
Actual results could differ materially from those anticipated or projected due to a number of factors. These factors include, but are not limited to: (a) changes in consumer confidence; (b) continued economic recession and decline in our stock price; (c) changes in demographics; (d) further changes in residential housing and commercial real estate market; (e) the impact of terrorism or war; (f) continued energy and other commodity price changes; (g) the impact of logistics on imports; (h) the impact of interest rate changes; (i) changes in currency exchange rates; (j) competitive factors; (k) operating factors, such as supply, labor or distribution disruptions including changes in operating conditions or costs; (l) effects of restructuring actions; (m) changes in the domestic or international regulatory environment; (n) ability to implement global sourcing organization strategies; (o) the impact of adopting new accounting principles; (p) the impact from natural events such as hurricanes, earthquakes and tornadoes; (q) the ability to procure fabric rolls and leather hides or cut and sewn fabric and leather sets domestically or abroad; (r) continued decline in the credit market and potential impacts on our customers and suppliers; (s) unanticipated labor/industrial actions; (t) those matters discussed in Item 1A of this Annual Report and factors relating to acquisitions and other factors identified from time-to-time in our reports filed with the Securities and Exchange Commission. We undertake no obligation to update or revise any forward-looking statements, either to reflect new developments or for any other reason.
2
TABLE OF CONTENTS
PART I ITEM 1. BUSINESS .Edward M. Knabusch and Edwin J. Shoemaker started Floral City Furniture in 1927, and in 1928 the newly formed company introduced its first recliner. In 1941, we were incorporated in the state of Michigan, and in 1996 the name was changed to La-Z-Boy Incorporated. The La-Z-Boy name is the most recognized brand in the furniture industry. La-Z-Boy Incorporated operates in three segments - the Upholstery Group, the Casegoods Group and the Retail Group.
La-Z-Boy is the largest reclining-chair manufacturer in the world and one of North America's largest manufacturers of upholstered furniture. We also manufacture and import casegoods (wood) furniture products for resale in North America. In addition, we have 68 company owned and operated retail stores located in eight markets in the United States. La-Z-Boy Incorporated markets furniture for every room of the home. According to the May, 2009 Top 100 ranking by Furniture Today , which is an industry trade publication, the third largest retailer of single-brand upholstered furniture in the U.S. is the La-Z-Boy Furniture Galleries® stores retail network.
The following significant changes in our business occurred during fiscal 2009:
In the fourth quarter of fiscal 2008, we committed to a restructuring plan to consolidate all of our North American cutting and sewing operations in Mexico and transfer production from our Tremonton, Utah plant to our five remaining La-Z-Boy branded upholstery manufacturing facilities. Our Utah facility, which employed 630 people, ceased operations during the first quarter of fiscal 2009. We began start up production at our Mexican facility in January 2009. As of the end of fiscal 2009, about 272 employees have completed training and about 144 employees are currently in training at our Mexican facility. At the end of fiscal 2009, approximately 8% of our domestic cutting and sewing operations were coming from our Mexican facility. By the end of fiscal 2010 we expect 75% to 80% of our domestic cutting and sewing operations to be shifted to our Mexican facility, with the remainder in fiscal 2011. The decision to shift our domestic cutting and sewing operations to our Mexican facility will strengthen our ability to competitively produce custom orders and improve speed to market. We expect to see the full benefit of these cost saving moves beginning in fiscal 2011.
In the first quarter of fiscal 2009, we committed to a restructuring plan to close the operations of our La-Z-Boy U.K. subsidiary. The closure of this operation occurred in the second quarter of fiscal 2009 and impacted about 17 employees. This decision was made due to the change in our strategic direction for this operation.
During the third quarter of fiscal 2009 we committed to a restructuring plan to close our plant in Sherman, Mississippi related to our Bauhaus operations. The closure of this plant was completed in the fourth quarter of fiscal 2009. During the third quarter of fiscal 2009, we also announced a plan to reduce our company-wide employment to be more in line with our sales volume and the current economic environment. As a result of this plan, our employment was reduced by approximately 850 people company-wide.
In the fourth quarter of fiscal 2009, we committed to a restructuring plan to consolidate our casegoods manufacturing plants in North Carolina related to our Kincaid and American Drew/Lea operations. The production at our American Drew/Lea plant will be consolidated with one of our Kincaid plants and the American Drew/Lea plant will convert to a distribution center. The consolidation of these plants is expected to be completed in the first quarter of fiscal 2010, but the conversion of the distribution center will not be completed until the fourth quarter of fiscal 2010. The decision to consolidate these operations was made in order to reduce costs associated with having excess capacity at our casegoods manufacturing plants in North Carolina.
Principal Products and Industry SegmentsOur reportable operating segments are the Upholstery Group, the Casegoods Group and the Retail Group.
Upholstery Group . The operating units in the Upholstery Group are Bauhaus, England, and La-Z-Boy. This group primarily manufactures and sells upholstered furniture to furniture retailers and proprietary stores. Upholstered furniture includes recliners and motion furniture, sofas, loveseats, chairs, ottomans, sleeper sofas, sectionals and modulars.
3
TABLE OF CONTENTS
Casegoods Group . The operating units in the Casegoods Group are American Drew/Lea, Hammary and Kincaid. This group primarily sells manufactured or imported wood furniture to furniture retailers. Casegoods product includes tables, chairs, entertainment centers, headboards, dressers, accent pieces and some coordinated upholstered furniture.
Retail Group . The Retail Group consists of 68 company-owned La-Z-Boy Furniture Galleries® stores located in eight markets ranging from the Midwest to the East Coast of the United States and also including Southeastern Florida. The Retail Group sells mostly upholstered furniture to end consumers through the retail network.
Additional detailed information regarding our segments and the products which comprise the segments is contained in Note 15 to our consolidated financial statements and our "Management's Discussion and Analysis" section, both of which are included in this report.
Raw Materials and PartsThe principal raw materials for the Upholstery Group are purchased cover (primarily fabrics and leather), polyester batting and non-chlorofluorocarbonated polyurethane foam for cushioning and padding, lumber and plywood for frames and steel for motion mechanisms. Purchased cover is the largest raw material cost for this segment, representing about 33% of the Upholstery Group's total material costs. We purchase cover from numerous sources, but we do rely on a limited number of major suppliers. If one of these sources experienced financial or other difficulties we could experience temporary disruptions in our manufacturing process until another source could be found. Our cover is purchased either in a raw state (a roll or hide), then cut and sewn into parts in our plants or as cut and sewn parts from third party offshore suppliers. The cover material costs are 48% fabric rolls and hides and 52% for cut and sewn parts. There are five primary suppliers of cut and sewn leather and fabric products, and the majority of our cut and sewn sets come from China. One supplier manufactures the majority of the cut and sewn parts we receive from China. During the third quarter of fiscal 2009, we began shifting our domestic cutting and sewing operations to our facility in Mexico. We expect all of our cut and sewn parts to be supplied from our Mexican facility or from suppliers in China given the lower labor costs in these areas and because there are few sources of these products domestically and none at these labor costs. By importing cut and sewn leather and fabric sets, we are able to recognize savings compared to domestic purchases and fabrication of these parts.
By the end of fiscal 2010 we expect that 80% to 90% of our La-Z-Boy division's cover to be received at our manufacturing facilities as cut and sewn sets. We also expect to have transferred roughly 75% to 80% of our La-Z-Boy division's domestic cut and sew operations to our Mexican facility by the end of fiscal 2010, with the remainder of our La-Z-Boy division's domestic cut and sew operations to be transferred during fiscal 2011. Addtionally, we will continue to receive cut and sewn sets from China.
Given the current economic situation, we expect raw material pricing to remain somewhat stable through the first half of fiscal 2010. Raw material pricing for the remainder of fiscal 2010 will depend somewhat on the timing of the economic turnaround. Specifically, the pricing on steel will be influenced by consumption in other markets and world scrap prices. Pricing on polyurethane foam will be influenced by demand from other industries, chemical prices and capacity which is normally adjusted based on demand.
Our Casegoods Group today is primarily an importer, marketer and distributor of casegoods furniture. In fiscal 2009, it also operated two manufacturing facilities in North Carolina. As previously mentioned, these manufacturing facilities are being consolidated in fiscal 2010. Over the last few years the amount of raw materials purchased by the Casegoods Group has been declining. The principal raw materials used in the Casegoods Group are hardwoods, plywood and chip wood, veneers and liquid stains, paints and finishes and decorative hardware. Hardwood lumber and purchased hardwood components are the Casegoods Group's largest raw material costs, representing about 59% of the segment's total raw material costs, on domestically manufactured product.
Finished Goods ImportsThe rapid growth of manufacturing capabilities in Asia has increased production capacities overseas. Due to the low labor and overhead costs in those areas, the landed manufactured cost of product coming out of those overseas manufacturing facilities is much lower than equivalent furniture produced domestically.
4
TABLE OF CONTENTS
During fiscal 2009 and 2008, about 73% and 72%, respectively of our casegoods finished goods sales were imported. Imported finished goods represented approximately 13% of our consolidated fiscal 2009 sales.
During the second half of fiscal 2009 prices on imported casegoods began to stabilize. Prior to this we were experiencing higher prices on our imported casegoods due to increases related to higher labor, raw materials, currency valuations and transportation costs. We will continue to monitor our costs of imported casegoods and review our sourcing of products.
The importing of furniture is also changing how some large retailers and dealers are purchasing goods for their stores. Some retailers are sourcing direct from overseas and bypassing domestic distribution altogether; thereby eliminating the middleman. As a result of these changes we have transitioned to an import model for our casegoods business. The resulting significant reductions in our cost structure have allowed us to become more competitive. At the same time we have improved our service performance levels, purchasing, logistics and warehousing capabilities for these imports across our different operating units as our importing continues to grow. Specifically, we have negotiated contracts with freight forwarders that allow us to utilize consolidated purchasing power, across all segments, for shipping to obtain favorable rates based on volume.
Seasonal BusinessHistorically we have experienced our lowest level of sales during our first fiscal quarter for our Upholstery Group and during our first and third fiscal quarters for the Casegoods Group. During the past fiscal year, we found our sales to be more evenly distributed across our four fiscal quarters with the third and fourth quarters having our lowest level of sales. We believe this is a result of economic conditions during those quarters and not a change in our historical patterns. When possible, we schedule production to maintain uniform manufacturing activity throughout the year. We do, however, shut down our plants in July to perform routine maintenance on our equipment. A majority of our manufacturing facilities will shut down their production for at least one week in July, 2009.
Economic Cycle and Purchasing CycleThe success of our business depends to a significant extent upon the level of consumer spending. A number of economic conditions affect the level of consumer spending on the products that we offer, including, among other things, the general state of the economy, general business conditions, uncertainty in the housing and credit markets, level of consumer debt, interest rates, taxation, unemployment levels and consumer confidence in future economic conditions.
Our Retail division is continuing to feel the impact of these conditions, which has created an unprecedented weakness in the retail environment. We continue to modify our cost structure in our Retail division to reduce our operating expenses while attempting to reduce our losses and become profitable on smaller volumes within this division.
In terms of our product segments, upholstered furniture has a shorter life cycle and exhibits a less volatile sales pattern over an economic cycle than does casegoods. This is because upholstery is typically more fashion and design oriented, and is often purchased one or two pieces at a time. In contrast, casegoods products are longer-lived, less fashion-oriented, and frequently purchased in groupings or "suites," resulting in a much larger dollar outlay by the consumer.
Practices Regarding Working Capital ItemsWith the exception of company-owned stores, we do not carry significant amounts of upholstered finished goods in inventory as these goods are usually built to order. However, we generally build or import casegoods inventory to stock, in order to attain manufacturing efficiencies and/or to meet delivery requirements of customers. This results in higher levels of finished casegoods inventories than upholstery products. Our company-owned La-Z-Boy Furniture Galleries® stores maintain finished goods inventory at the stores.
During fiscal 2009 and 2008, we made a concerted effort to reduce our inventory balances. These efforts have led to the consolidation of some of our Casegoods Group warehousing and more effective management of our inventory. Our overall inventory levels have declined 28% over the past two years, with the majority of the decline in inventory coming from our Upholstery Group.
5
TABLE OF CONTENTS
Over the past two years we have created four regional distribution centers in order to streamline our warehousing and distribution processes for our La-Z-Boy Furniture Galleries® store network. In the third quarter of fiscal 2009, ownership and management of these distribution centers were transferred from our Retail Group to our La-Z-Boy division, within our Upholstery Group. The management of these distribution centers is better suited in our La-Z-Boy division because these distribution centers also supply inventory to some independent La-Z-Boy Furniture Galleries® dealers. This change also allows our Retail Group to focus on the retail side of the business. Our move to distribution centers allowed us to reduce the number of individual warehouses needed to supply our retail outlets and helped us to manage our inventory levels.
Dealer terms generally range between net 30-120 days. We offer some extended payment terms as part of sales promotion programs.
CustomersWe sell to a significant number of furniture retailers primarily throughout the United States and Canada. We also sell to consumers through our company-owned La-Z-Boy Furniture Galleries® stores. We did not have any customers whose purchases amounted to more than 5% of our fiscal year 2009 sales for either the Upholstery Group or the Casegoods Group. Sales in our Upholstery and Casegoods Groups are almost entirely to furniture retailers. The Retail Group sales are to end-consumers.
We have formal agreements with many of our retailers for them to display and merchandise products from one or more of our operating units and sell them to consumers in dedicated retail space, either in stand-alone stores or in dedicated galleries or studios within their stores. We consider these stores, as well as our own retail stores, to be "proprietary." For our Upholstery and Casegoods Groups, our 2009 customer mix was about 54% proprietary, 14% major dealers (for example, Art Van, Berkshire Hathaway, Havertys, Raymour & Flanigan) and 32% other independent retail customers.
(representing 70% of the total number of stores), which generally has more space and a more updated appearance. Having dedicated retail floor space is important to the success of product distribution. This distribution system originated with our La-Z-Boy Furniture Galleries® stores network, which continues to have the largest number of proprietary stores and galleries among our other operating units. According to the May 25, 2009 Furniture Today, viewed by itself, the La-Z-Boy Furniture Galleries® stores network would be the tenth largest conventional furniture retailer in the U.S. In addition to the stand-alone stores we also have 466 ComfortStudios all dedicated to our upholstery furniture products. ComfortStudios are defined space that is completely dedicated to showcasing our products within a larger retailer. Our proprietary distribution also includes in-store galleries for England, Kincaid and Lea's La-Z-Boy Kidz TM . Total "proprietary" floor space is approximately 8.8 million square feet.
It is a key part of our marketing strategy to continue to expand proprietary distribution. We expect that throughout the La-Z-Boy Furniture Galleries® store network we will remodel another 5-10 stores into our New Generation format during fiscal 2010. Given the current economic climate, the La-Z-Boy Furniture Galleries® store network plans to be opportunistic in opening any new stores during fiscal 2010. We select dealers for this proprietary distribution based on the management and financial qualifications of those dealers. The location of these proprietary stores is based on the potential for distribution in a specific geographical area. This proprietary method of distribution is beneficial to La-Z-Boy, our dealers and the consumer. For La-Z-Boy, it allows us to have a concentration of marketing of our product by sales personnel dedicated to our entire product line, and only that line. For our dealers who join this proprietary group, it allows them to take advantage of practices that have been proven successful based on past experiences of other proprietary dealers. As a part of this, we facilitate forums and communications for these dealers to share best practices among their peers. For our consumers, these stores provide a full-service shopping experience with knowledgeable sales associates and in-home design consultants to support their purchasing process.
6
TABLE OF CONTENTS
Sales RepresentativesSimilar to most of the U.S. furniture industry, independent sales representatives sell our products to our dealer-customers. Independent sales representatives are usually compensated based on a percentage of their actual sales for their territory plus other performance criteria. In general, we sign one-year contracts with our independent sales representatives.
Orders and BacklogUpholstery orders are primarily built to a specific dealer order (stock order) or a special order with a down payment from a consumer (sold orders). These orders are typically shipped within two to six weeks following receipt of the order. Casegoods are primarily produced to our internal order (not a customer or consumer order), which results in higher finished goods inventory on hand but quicker availability to ship to customers. Additionally, increased importing of finished product over the last few years in our Casegoods Group has increased our imported finished goods inventories due to longer order lead times necessary for imported product. Our Casegoods Group typically ships product to consumers within 14 days.
As of April 25, 2009 and April 26, 2008, Upholstery Group backlogs were approximately $57.4 million and $80.0 million, respectively. Casegoods backlogs as of April 25, 2009 and April 26, 2008 were approximately $10.1 million and $19.9 million, respectively. The measure of backlog at a point in time may not be indicative of future sales performance. Due to manufacturing efficiencies gained over the past several years and our casegoods inventory position, we do not rely entirely on backlogs to predict future sales. For most operating units, an order cannot be canceled after it has been selected for production. The decline in backlog from fiscal 2008 was due to efficiencies gained from cellular manufacturing in addition to the overall decline in sales volume.
Competitive ConditionsWe are currently the third largest manufacturer/distributor of residential (bedroom, dining room, living and family room) furniture in the United States, as measured by annual sales volume, according to industry trade publication Furniture Today . Competitors include (in alphabetical order) Ashley, Bassett Furniture, Berkline, Bernhardt, Ethan Allen, Flexsteel, Furniture Brands International, Hooker Furniture, Klaussner, Natuzzi, Palliser, Stanley Furniture and Universal.
In the Upholstery Group, the largest competitors are Ashley, Bassett Furniture, Berkline, Bernhardt, Ethan Allen, Flexsteel, Furniture Brands International, Klaussner, Natuzzi, and Palliser.
In the Casegoods Group, our main competitors are Ashley, Bernhardt, Ethan Allen, Furniture Brands International, Hooker, Stanley, and Universal. Additionally, there are market pressures related to foreign manufacturers entering the United States market, as well as by increased direct purchasing from overseas by some of the larger United States retailers.
The La-Z-Boy Furniture Galleries® stores operate in the retail furniture industry throughout North America; consequently, they have different competitors. La-Z-Boy Furniture Galleries® stores competitors include but are not limited to: Ashley, Bassett Furniture Direct, Ethan Allen, Thomasville Home Furnishings Stores, several other regional competitors, and family-owned independent furniture stores.
In addition to the larger competitors listed above, a substantial number of small and medium-sized firms operate within our business segments, all of which are highly competitive.
During the past couple of years there has been an increase in alternative distribution affecting our retail markets. Companies such as Costco, Home Depot, IKEA, Sam's Club, Target, Wal-Mart, as well as the Internet, and others are now offering products that compete with some of our product lines.
We compete primarily by emphasizing our brand names and the comfort, quality and styling of our products. In addition, we strive to offer good product value, strong dealer support and above average customer service and delivery. Our proprietary stores, discussed above under "Customers," also are a key initiative for us in striving to remain competitive with others in the furniture industry.
7
TABLE OF CONTENTS
Research and Development ActivitiesWe provide information regarding our research and development activities in Note 1 to our consolidated financial statements, which is included in Item 8 of this report.
Trademarks, Licenses and PatentsWe own several trademarks including La-Z-Boy, our most valuable. The La-Z-Boy trademark is essential to the upholstery and retail segments of our business. To protect our trademarks we have registered them in the United States and various other countries where our products are sold. The trademarks remain valid for as long as they are used properly for identification purposes, and we actively monitor the correct use of our trademarks. We license the use of the La-Z-Boy trademark on furniture sold outside the United States. We also license the use of the La-Z-Boy trademark on contract office furniture, outdoor furniture and on non-furniture products in the United States for the purpose of enhancing brand awareness. In addition, we license our proprietary dealers to use our La-Z-Boy trademark in connection with the sale of our products and related services, on their signs, and in other ways, which we consider to be a key part of our marketing strategies. We provide more information about those dealers above, under "Customers."
We hold a number of patents that we actively enforce but we believe that the loss of any single patent or group of patents would not materially impact our business.
Compliance with Environmental RegulationsWe have been named as a defendant in various lawsuits arising in the ordinary course of business and as a potentially responsible party at certain environmental clean-up sites. Based on a review of all currently known facts and our experience with previous legal and environmental matters, we have recorded expense in respect of probable and reasonably estimable losses arising from legal and environmental matters and currently do not anticipate any material additional loss for legal or environmental matters.
EmployeesWe employed about 7,730 full-time equivalent persons as of April 25, 2009. The Upholstery Group employed 6,175, the Casegoods Group employed 654, the Retail Group employed 479, with the remainder being non-segment personnel, which includes our VIEs. The majority of our employees are employed on a full-time basis. As of April 26, 2008 we had 10,060 full-time equivalent employees.
Financial Information About Foreign and Domestic Operations and Export SalesIn fiscal 2009, our direct export sales, including sales in Canada, were approximately 12% of our total sales. In addition to our Canadian customers, we also had European customers who received product from our United Kingdom subsidiary. As previously mentioned this subsidiary was closed during the second quarter of fiscal 2009. We have a manufacturing joint venture in Thailand, which distributes furniture in Australia, New Zealand, England, Thailand and other countries in Asia. In addition, we have a sales and marketing joint venture in Asia, which sells and distributes furniture in China, Japan and Korea among other Asian countries. In the third quarter of fiscal 2009 we opened a facility in Mexico. Our facility in Mexico will be providing cut and sewn sets for our domestic upholstery manufacturing facilities. Information about sales in the United States and in Canada and other countries is contained in Note 15 to our consolidated financial statements, which is included in Item 8 of this report. Our property, plant, and equipment in the U.S. were $134.9 million and $166.0 million at the end of fiscal 2009 and fiscal 2008, respectively. The property, plant, and equipment in foreign countries were $15.3 million and $5.0 million in fiscal 2009 and fiscal 2008, respectively. Of the $15.3 million of property, plant and equipment in foreign countries, $6.1 million relates to our plant in Mexico. Additionally, $3.4 million of the increase was the result of the change in our Toronto market VIE.
See Item 1A of this report for information about the risks attendant to our foreign operations.
Internet Availability
Available free of charge through our internet website are links to our forms 10-K, 10-Q, 8-K and amendments to those reports. These reports can be found on our internet website www.la-z-boy.com as soon as reasonably practicable after being electronically filed with, or furnished to, the Securities and Exchange Commission ( www.sec.gov ). The information on our website is not part of this report.
8
TABLE OF CONTENTS
ITEM 1A. RISK FACTORS .Our business is subject to a variety of risks. You should carefully consider the risk factors detailed below in conjunction with the other information contained in this document. These risks are not the only ones we face. Interest rates, consumer confidence, housing starts and the overall housing market, increased unemployment, tightening of the financial and consumer credit markets, downturns in the economy and other general economic factors that affect many other businesses are particularly significant to us because our principal products are consumer goods. Additional factors that are presently unknown to us or that we currently believe to be immaterial also could affect our business.
Our current retail markets and others we may acquire in the future may not achieve the growth and profitability we anticipated when we acquired or acquire them. We could incur charges for impairment of long-lived assets if we cannot meet our earnings expectations for these markets.We may remodel and relocate existing stores, as well as close underperforming stores. Profitability will depend on increased retail sales justifying the cost of remodeling and relocating these stores to support the lease carrying costs and our ability to reduce support costs as a percent of sales in advertising, selling and administration. In addition, while we are not currently planning on acquiring any new retail markets, we may acquire additional retail markets in the future, and if we do, they may be subject to many of the same risks.
Increased reliance on foreign sourcing of our products makes us more reliant on the capabilities of our foreign vendors and more vulnerable to potentially adverse actions by foreign governments.We have been increasing our offshore capabilities to provide flexibility in product offerings and pricing to meet competitive pressures. Our Casegoods Group is primarily an importer of products manufactured from a foreign source. In addition, our Upholstery Group purchases cut and sewn fabric and leather sets from foreign sourced vendors. Our sourcing partners may not be able to produce these goods in a timely fashion, or the quality of their product may be rejected by us, causing delays in shipping to our customers for Casegoods and manufacturing disruptions in our Upholstery plants due to not receiving rolled fabric, leather hides and fabric and leather cut and sewn sets. The majority of our cut and sewn leather sets are purchased from one supplier in China. In the third quarter of fiscal 2009, we began operations at our cutting and sewing center in Mexico. By the end of fiscal 2010, we expect 75% to 80% of our domestic cut and sewn sets will come from our Mexican facility. All of our cut and sewn sets will be supplied from Mexico and China after this move.
Governments in the foreign countries where we do business may change their laws, regulations and policies, including those related to tariffs and trade barriers, investments, taxation, and exchange controls. These countries may also experience periodic political, social and economic unrest, resulting in the disruption of supplies to our U.S. based facilities. All these items could make it more difficult to service our customers or cause disruptions in our plants that could reduce our sales, earnings, or both in the future.
Fluctuations in the price, availability and quality of raw materials could cause delays that could result in our inability to provide goods to our customers and could increase our costs, either of which could decrease our earnings.We use various types of wood, fabrics, leathers, upholstered filling material, steel, and other raw materials in manufacturing furniture. Because we are dependent on outside suppliers for our raw material needs, fluctuations in the price, availability and quality of the raw materials we use could have a negative effect on our cost of sales and our ability to meet our customers' demands. Inability to meet our customers' demands could result in the loss of future sales, and we may not always be able to pass along price increases to our customers due to competitive and marketing pressures. Since we have a higher concentration in upholstery sales (73%) than most of our competitors, the effects of steel, polyurethane foam and fabric price increases or quantity shortages are more significant for our business than for most other furniture companies. About 70% of our polyurethane foam comes from one supplier. A natural disaster that affects this supplier could result in delays in shipments of polyurethane foam to our plants. We have attempted to minimize this risk by requiring a minimum of 60 days worth of production to be stored at an off-site facility.
Specifically, the financial condition of some of our domestic and foreign fabric suppliers could impede their ability to provide these products to us in a timely manner. We have seen the number of domestic suppliers declining, and a majority of those suppliers that remain are experiencing financial difficulties. In addition,
9
TABLE OF CONTENTS
upholstered furniture is highly fashion oriented, and if we are not able to acquire sufficient fabric variety, or if we are unable to predict or respond to changes in fashion trends, we may lose sales and have to sell excess inventory at reduced prices. This would lower our earnings as well as reduce our sales.
Credit risk may adversely affect our earnings through collection losses and/or consolidating variable interest entities into our financial statements.Applicable accounting rules categorize some of our independent dealers that do not have sufficient equity to carry out their businesses without our financial support as "variable interest entities." If we are considered the primary beneficiary of a variable interest entity's business activities, we are required to consolidate its assets, liabilities, and results of operations into our consolidated financial statements. Once consolidated, we recognize a dealer's net losses in excess of its equity and a dealer's net earnings to the extent we have previously recognized losses. Consolidating variable interest entities' results into our financial statements tends to reduce our net income because these dealers often incur losses, and even if one of them does achieve net earnings, we can only recognize its earnings to the extent we previously recognized its losses.
Although we have been working to reduce the number of these dealers, generally by acquiring their businesses, closing the operation or arranging for better capitalized operators to take over their territories, we are still consolidating three of them. Despite our efforts, we may not be able to eliminate the necessity to consolidate these dealers as quickly as we would like, and we may be required to consolidate additional dealers in the future if warranted by changes in their financial condition. In addition, we continue to increase our allowance for doubtful accounts due to the deteriorating financial condition of some of our customers resulting from the current state of the economy.
Manufacturing realignments could result in a decrease in our near-term earnings.We continually review our domestic manufacturing operations and offshore (import) sourcing capabilities. As a result, we sometimes realign those operations and capabilities and institute cost savings programs. These programs can include the consolidation and integration of facilities, functions, systems and procedures. We also may shift certain products from domestic manufacturing to foreign sourcing and manufacturing. These realignments and cost savings programs generally involve some initial cost and can result in decreases in our near-term earnings until we achieve the expected cost reductions. We may not always accomplish these actions as quickly as anticipated, and we may not fully achieve the expected cost reductions.
Business failures of large dealers or customers could result in a decrease in our future sales and earnings.Although we have no customers who individually represent 5% or more of the annual sales of any of our segments, business failures or consolidation of large dealers or customers could result in a decrease in our future sales and earnings. Also, we are either lessee on or guarantor of some leases of proprietary stores operated by independent furniture dealers. Defaults by any of these dealers could result in our becoming responsible for payments under these leases thereby reducing our future earnings.
ITEM 1B. UNRESOLVED STAFF COMMENTS .None.
ITEM 2. PROPERTIES .We owned or leased approximately 11.3 million square feet of manufacturing, warehousing distribution centers, office, showroom, and retail facilities, and had approximately 2.4 million square feet of idle facilities at the end of fiscal 2009. Of the 11.3 million square feet occupied at the end of fiscal 2009, our Upholstery Group occupied approximately 5.6 million square feet, our Casegoods Group occupied approximately 2.9 million square feet, our Retail Group occupied approximately 1.8 million square feet and our corporate and other operations occupied the balance.
We sold several idle facilities during fiscal years 2009 and 2008, and we also sold a significant amount of equipment that had been idled in connection with our restructurings over the last few years. Our active facilities are located in Arkansas, California, Connecticut, Delaware, Florida, Georgia, Illinois, Indiana, Kansas,
10
TABLE OF CONTENTS
Maryland, Massachusetts, Michigan, Mississippi, Missouri, New Hampshire, New Jersey, New York, North Carolina, Pennsylvania, Rhode Island, Tennessee, Utah, Virginia, Washington D.C., Toronto (Canada), Coahuila (Mexico) and Bangkok (Thailand). Most of them are less than 50 years old, and all of them are well maintained and insured. We do not expect any major land or building additions will be needed to increase capacity in the foreseeable future for our manufacturing operations. We own all of our domestic plants, some of which have been financed under long-term industrial revenue bonds, and we lease the majority of our retail stores, as well as our manufacturing facility in Mexico. For information on terms of operating leases for our properties, see Note 9 to our consolidated financial statements, which is included in Item 8 of this report.
ITEM 3. LEGAL PROCEEDINGS .We have been named as a defendant in various lawsuits arising in the ordinary course of business and as a potentially responsible party at certain environmental clean-up sites. Based on a review of all currently known facts and our experience with previous legal and environmental matters, we have recorded expense in respect of probable and reasonably estimable losses arising from legal and environmental matters and currently do not anticipate any material additional loss for legal or environmental matters.
ITEM 4. SUBMISSION OF MATTERS TO A VOTE OF SECURITY HOLDERS .Nothing was submitted for a vote by our shareholders during the fourth quarter of fiscal 2009.
11
TABLE OF CONTENTS
EXECUTIVE OFFICERS OF REGISTRANTListed below are the names, ages and current positions of our executive officers and, if they have not held those positions for at least five years, their former positions during that period with us or other companies.
Kurt L. Darrow, age 54
| • | President and Chief Executive Officer since September 2003 |
Steven M. Kincaid, age 60
| • | Senior Vice President of La-Z-Boy and President of Casegoods since November 2003 |
| • | President, Kincaid Furniture Company, Incorporated since June 1983 |
Louis M. Riccio, Jr., age 46
| • | Senior Vice President and Chief Financial Officer since July 2006 |
| • | Treasurer from April 2007 through August 2007 |
| • | Vice President and Corporate Controller from February 2002 through June 2006 |
Otis S. Sawyer, age 51
| • | Senior Vice President of La-Z-Boy and President of Non-Branded Upholstery since February 2008 |
| • | President, England, Incorporated since February 2008 |
| • | Senior Vice President Corporate Operations from May 2006 through February 2008 |
| • | Vice President and Chief Information Officer from August 2004 through April 2006 |
| • | Senior Vice President of Finance, England, Incorporated from December 2001 through August 2004 |
Mark S. Bacon, Sr., age 46
| • | Chief Retail Officer since October 2008 |
| • | Executive Vice President of Sales, Commercial and Operations of The Pep Boys - Manny, Moe & Jack from March 2004 through September 2007 |
12
TABLE OF CONTENTS
PART IIITEM 5. MARKET FOR REGISTRANT'S COMMON EQUITY, RELATED STOCKHOLDER
MATTERS AND ISSUER PURCHASES OF EQUITY SECURITIES . Purchases of Equity Securities by the Issuer and Affiliated Purchasers
We did not purchase any of our common shares during the fourth quarter of fiscal year 2009.
Recent Sales of Unregistered SecuritiesThere were no sales of unregistered securities during the fourth quarter of fiscal year 2009.
Equity PlansThe table below provides information concerning our compensation plans under which common shares may be issued.
Equity Compensation Plan Information as of April 25, 2009
| Plan category | Number of securities to be issued upon exercise of outstanding options (a) | Weighted-average exercise prices of outstanding options (b) | Number of securities remaining available for future issuance under equity compensation plans (excluding securities reflected in column (a)) (c) | |||||||||
| Equity compensation plans approved by shareholders | 2,426,530 | (1) | $ | 15.48 | 2,484,080 | (2) | ||||||
| Equity compensation plans not approved by shareholders (Note 3) | 4,130 | $ | 16.42 | None | ||||||||
Note 1: These options were issued under our 2004 Long-Term Equity Award Plan and our 1997 Incentive Stock Option Plan. No additional options can be awarded under the 1997 plan, but 632,605 are still outstanding under the 1997 plan.
Note 2: This amount is the aggregate number of shares available for future issuance under our 2004 Long-Term Equity Award Plan, which has a stock option component, a restricted stock component and a performance award component, and our Restricted Stock Plan for Non-Employee Directors. The long-term equity award plan provides for awards of stock options, restricted stock, and performance awards (awards of our common stock based on achievement of pre-set goals over a performance period) to selected key employees. The non-employee directors' plan provides for grants of 30-day options on our common shares. The total shown above consists of: (a) a maximum of 1,875,168 shares that may be issued under the long-term equity award plan under previously granted performance awards for the performance periods ending in April 2009, 2010 and 2011; (b) 608,912 shares that may be issued under awards granted in the future under the long-term equity award plan; and (c) 150,800 shares available for future issuance under the non-employee directors' plan. This portion of the plan was discontinued in fiscal 2009.
Note 3: This line of the table relates only to an option plan that we adopted without shareholder approval at the time we acquired LADD Furniture Inc. solely in order to replace options on LADD Furniture Inc. common shares with options on our common shares. No additional options or other awards may be made under that plan. Subsequent to April 25, 2009, the 4,130 options under this plan expired.
13
TABLE OF CONTENTS
Performance GraphThe graph below shows the return for our last five fiscal years that would have been realized (assuming reinvestment of dividends) by an investor who invested $100 on April 30, 2004 in our common shares, in the S&P 500 Composite Index, Dow Jones U.S. Furnishings and in a peer group comprised of the following publicly traded furniture industry companies: Bassett Furniture, Chromcraft Revington, Inc., Ethan Allen Interiors, Flexsteel Industries, Furniture Brands International, Hooker Furniture Company, and Stanley Furniture. The stock performance of each company in the peer group has been weighted according to its relative stock market capitalization for purposes of arriving at group averages.
COMPARISON OF 5 YEAR CUMULATIVE TOTAL RETURN*Among La-Z-Boy Incorporated, The S&P 500 Index,
The Dow Jones US Furnishings Index And A Peer Group
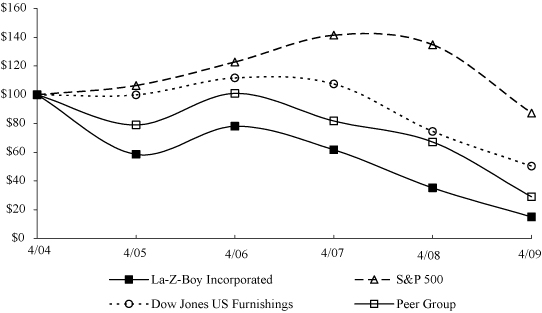
| Company/Index/Market | 2004 | 2005 | 2006 | 2007 | 2008 | 2009 | ||||||||||||||||||
| La-Z-Boy Incorporated | $ | 100 | $ | 58.42 | $ | 78.02 | $ | 61.60 | $ | 35.10 | $ | 14.92 | ||||||||||||
| S&P 500 Composite Index | $ | 100 | $ | 106.34 | $ | 122.73 | $ | 141.43 | $ | 134.82 | $ | 87.21 | ||||||||||||
| Dow Jones U.S. Furnishings | $ | 100 | $ | 99.80 | $ | 111.69 | $ | 107.46 | $ | 74.41 | $ | 50.28 | ||||||||||||
| Peer Group | $ | 100 | $ | 78.90 | $ | 100.86 | $ | 81.69 | $ | 67.03 | $ | 28.91 | ||||||||||||
*$100 invested on 4/30/04 in stock or index, including reinvestment of dividends. Fiscal year ending April 30.
14
TABLE OF CONTENTS
Dividend and Market Information
The New York Stock Exchange is the principal market in which our common stock is traded. The tables below show the high and low sale prices of our common stock on the New York Stock Exchange during each quarter of our last two fiscal years, as well as the dividends we paid during each quarter.
| Dividends Paid | Market Price | |||||||||||||||
| Fiscal 2009 Quarter End | High | Low | Close | |||||||||||||
| July 26 | $ | 0.04 | $ | 7.93 | $ | 5.84 | $ | 7.60 | ||||||||
| October 25 | $ | 0.04 | $ | 11.76 | $ | 4.50 | $ | 4.61 | ||||||||
| January 24 | $ | 0.02 | $ | 5.78 | $ | 1.20 | $ | 1.21 | ||||||||
| April 25 | $ | 0.00 | $ | 2.23 | $ | 0.53 | $ | 2.17 | ||||||||
| $ | 0.10 | |||||||||||||||
| Dividends Paid | Market Price | |||||||||||||||
| Fiscal 2008 Quarter End | High | Low | Close | |||||||||||||
| July 28 | $ | 0.12 | $ | 12.30 | $ | 10.29 | $ | 10.29 | ||||||||
| October 27 | $ | 0.12 | $ | 10.47 | $ | 6.94 | $ | 7.04 | ||||||||
| January 26 | $ | 0.12 | $ | 8.99 | $ | 5.46 | $ | 7.32 | ||||||||
| April 26 | $ | 0.04 | $ | 9.27 | $ | 6.91 | $ | 6.91 | ||||||||
| $ | 0.40 | |||||||||||||||
Our credit agreement would prohibit us from paying dividends if our "excess availability," as defined in the credit agreement, falls below $30 million. As of April 25, 2009 we had $65.0 million of excess availability under the credit agreement. Refer to Note 8 of the consolidated financial statements in Item 8 for further discussion of our credit agreement. As a result of the continued recessionary economic climate and the uncertainity with respect to when the economy will improve, we made the decision in the fourth quarter of fiscal 2009 to suspend our quarterly dividend to shareholders in order to conserve cash and increase our financial flexibility. On a quarterly basis, we will continue to review our decision on whether or not to pay a dividend.
ShareholdersWe had about 16,700 shareholders of record at June 12, 2009.
15
TABLE OF CONTENTS
ITEM 6. SELECTED FINANCIAL DATA .The following table presents our selected financial data. The table should be read in conjunction with Item 7, Management's Discussion and Analysis of Financial Condition and Results of Operations , and Item 8, Financial Statements and Supplementary Data , of this Annual Report on Form 10-K. This information is derived from our audited financial statements and should be read in conjunction with those statements, including the related notes.
Consolidated Five-Year Summary of Financial Data
| (Dollar amounts in thousands, except per share data) Fiscal Year Ended | (52 weeks) 4/25/2009 | (52 weeks) 4/26/2008 | (52 weeks) 4/28/2007 | (52 weeks) 4/29/2006 | (53 weeks) 4/30/2005 | |||||||||||||||
| Sales | $ | 1,226,674 | $ | 1,450,941 | $ | 1,621,460 | $ | 1,699,806 | $ | 1,820,408 | ||||||||||
| Cost of sales | ||||||||||||||||||||
| Cost of goods sold | 878,089 | 1,051,656 | 1,189,734 | 1,275,053 | 1,373,046 | |||||||||||||||
| Restructuring | 9,818 | 5,057 | 3,371 | 8,479 | 2,931 | |||||||||||||||
| Total cost of sales | 887,907 | 1,056,713 | 1,193,105 | 1,283,532 | 1,375,977 | |||||||||||||||
| Gross profit | 338,767 | 394,228 | 428,355 | 416,274 | 444,431 | |||||||||||||||
| Selling, general and administrative | 375,011 | 399,470 | 388,738 | 379,039 | 366,370 | |||||||||||||||
| Restructuring | 2,642 | 3,078 | 7,662 | - | - | |||||||||||||||
| Write-down of long-lived assets | 7,503 | - | - | - | - | |||||||||||||||
| Write-down of intangibles | 47,677 | 8,426 | - | 22,695 | - | |||||||||||||||
| Operating income (loss) | (94,066 | ) | (16,746 | ) | 31,955 | 14,540 | 78,061 | |||||||||||||
| Interest expense | 5,581 | 13,899 | 10,206 | 11,540 | 10,442 | |||||||||||||||
| Income from Continued Dumping and Subsidy Offset Act, net | 8,124 | 7,147 | 3,430 | - | - | |||||||||||||||
| Interest income | 2,504 | 3,614 | 3,952 | 3,101 | 3,744 | |||||||||||||||
| Other income (expense), net | (7,998 | ) | 5,393 | 727 | (933 | ) | (3,571 | ) | ||||||||||||
| Income (loss) from continuing operations before income taxes | (97,017 | ) | (14,491 | ) | 29,858 | 5,168 | 67,792 | |||||||||||||
| Income tax expense (benefit) | 24,330 | (6,954 | ) | 10,090 | 10,758 | 25,363 | ||||||||||||||
| Income (loss) from continuing operations | (121,347 | ) | (7,537 | ) | 19,768 | (5,590 | ) | 42,429 | ||||||||||||
| Income (loss) from discontinued operations (net of tax) | - | (6,000 | ) | (15,629 | ) | 2,549 | (7,338 | ) | ||||||||||||
| Extraordinary gains (net of tax) | - | - | - | - | 2,094 | |||||||||||||||
| Net income (loss) | $ | (121,347 | ) | $ | (13,537 | ) | $ | 4,139 | $ | (3,041 | ) | $ | 37,185 | |||||||
| Diluted weighted average shares outstanding | 51,460 | 51,408 | 51,606 | 51,801 | 52,138 | |||||||||||||||
| Diluted income (loss) from continuing operations per share | $ | (2.36 | ) | $ | (0.15 | ) | $ | 0.38 | $ | (0.11 | ) | $ | 0.81 | |||||||
| Diluted net income (loss) per share | $ | (2.36 | ) | $ | (0.26 | ) | $ | 0.08 | $ | (0.06 | ) | $ | 0.71 | |||||||
| Dividends declared per share | $ | 0.10 | $ | 0.40 | $ | 0.48 | $ | 0.44 | $ | 0.44 | ||||||||||
| Book value on year-end shares outstanding | $ | 5.94 | $ | 8.76 | $ | 9.45 | $ | 9.86 | $ | 10.10 | ||||||||||
| Return on average shareholders' equity* | (32.1 | )% | (1.6 | )% | 4.0 | % | (1.1 | )% | 8.1 | % | ||||||||||
| Gross profit as a percent of sales | 27.6 | % | 27.2 | % | 26.4 | % | 24.5 | % | 24.4 | % | ||||||||||
| Operating profit (loss) as a percent of sales | (7.7 | )% | (1.2 | )% | 2.0 | % | 0.9 | % | 4.3 | % | ||||||||||
| Effective tax rate* | (25.1 | )% | 48.0 | % | 33.8 | % | 208.2 | % | 37.4 | % | ||||||||||
| Return on sales* | (9.9 | )% | (0.5 | )% | 1.2 | % | (0.3 | )% | 2.3 | % | ||||||||||
| Depreciation and amortization | $ | 23,479 | $ | 24,696 | $ | 27,204 | $ | 29,234 | $ | 28,329 | ||||||||||
| Capital expenditures | $ | 15,625 | $ | 27,386 | $ | 25,811 | $ | 27,991 | $ | 34,771 | ||||||||||
| Property, plant and equipment, net | $ | 150,234 | $ | 171,001 | $ | 183,218 | $ | 209,986 | $ | 210,565 | ||||||||||
| Working capital | $ | 221,752 | $ | 263,575 | $ | 314,046 | $ | 346,667 | $ | 409,641 | ||||||||||
| Current ratio | 2.8 to 1 | 2.6 to 1 | 2.4 to 1 | 2.5 to 1 | 2.8 to 1 | |||||||||||||||
| Total assets | $ | 552,545 | $ | 768,870 | $ | 878,691 | $ | 956,752 | $ | 1,026,357 | ||||||||||
| Long-term debt | $ | 52,148 | $ | 99,578 | $ | 113,172 | $ | 174,680 | $ | 213,549 | ||||||||||
| Total debt | $ | 60,872 | $ | 104,370 | $ | 151,248 | $ | 185,682 | $ | 226,309 | ||||||||||
| Shareholders' equity | $ | 305,733 | $ | 450,596 | $ | 485,348 | $ | 510,345 | $ | 527,286 | ||||||||||
| Ratio of total debt-to-equity | 19.9 | % | 23.2 | % | 31.2 | % | 36.4 | % | 42.9 | % | ||||||||||
| Ratio of total debt-to-capital | 16.6 | % | 18.8 | % | 23.8 | % | 26.7 | % | 30.0 | % | ||||||||||
| Shareholders | 16,700 | 20,200 | 23,900 | 31,900 | 26,500 | |||||||||||||||
| Employees | 7,730 | 10,060 | 11,700 | 13,400 | 14,820 | |||||||||||||||
| * | Based on income (loss) from continuing operations |
16
TABLE OF CONTENTS
Unaudited Quarterly Financial Information Fiscal 2009
| (Dollar amounts in thousands, except per share data) Fiscal Quarter Ended | (13 weeks) 7/26/2008 | (13 weeks) 10/25/2008 | (13 weeks) 1/24/2009 | (13 weeks) 4/25/2009 | ||||||||||||
| Sales | $ | 321,652 | $ | 331,948 | $ | 288,576 | $ | 284,498 | ||||||||
| Cost of sales | ||||||||||||||||
| Cost of goods sold | 235,115 | 242,681 | 207,356 | 192,937 | ||||||||||||
| Restructuring | 5,795 | 2,236 | 1,664 | 123 | ||||||||||||
| Total cost of sales | 240,910 | 244,917 | 209,020 | 193,060 | ||||||||||||
| Gross profit | 80,742 | 87,031 | 79,556 | 91,438 | ||||||||||||
| Selling, general and administrative | 91,837 | 101,942 | 94,092 | 87,140 | ||||||||||||
| Restructuring | 781 | 687 | 741 | 433 | ||||||||||||
| Write-down of long-lived assets | - | - | 7,036 | 467 | ||||||||||||
| Write-down of intangibles | 1,292 | 408 | 45,977 | - | ||||||||||||
| Operating income (loss) | (13,168 | ) | (16,006 | ) | (68,290 | ) | 3,398 | |||||||||
| Interest expense | 1,495 | 1,651 | 1,386 | 1,049 | ||||||||||||
| Income from Continued Dumping and Subsidy Offset Act, net | - | - | 8,124 | - | ||||||||||||
| Interest income | 932 | 630 | 323 | 619 | ||||||||||||
| Other income (expense), net | 143 | (685 | ) | (7,433 | ) | (23 | ) | |||||||||
| Pretax income (loss) | (13,588 | ) | (17,712 | ) | (68,662 | ) | 2,945 | |||||||||
| Income tax expense (benefit) | (5,044 | ) | 36,032 | (4,280 | ) | (2,378 | ) | |||||||||
| Net income (loss) | $ | (8,544 | ) | $ | (53,744 | ) | $ | (64,382 | ) | $ | 5,323 | |||||
| Diluted weighted average shares outstanding | 51,428 | 51,458 | 51,475 | 52,035 | ||||||||||||
| Diluted net income (loss) per share | $ | (0.17 | ) | $ | (1.04 | ) | $ | (1.25 | ) | $ | 0.10 | |||||
17
TABLE OF CONTENTS
Unaudited Quarterly Financial Information Fiscal 2008
| (Dollar amounts in thousands, except per share data) Fiscal Quarter Ended | (13 weeks) 7/28/2007 | (13 weeks) 10/27/2007 | (13 weeks) 1/26/2008 | (13 weeks) 4/26/2008 | ||||||||||||
| Sales | $ | 344,396 | $ | 365,434 | $ | 373,081 | $ | 368,030 | ||||||||
| Cost of sales | ||||||||||||||||
| Cost of goods sold | 259,143 | 266,658 | 265,078 | 260,777 | ||||||||||||
| Restructuring | 2,561 | 518 | (632 | ) | 2,610 | |||||||||||
| Total cost of sales | 261,704 | 267,176 | 264,446 | 263,387 | ||||||||||||
| Gross profit | 82,692 | 98,258 | 108,635 | 104,643 | ||||||||||||
| Selling, general and administrative | 94,508 | 98,098 | 104,672 | 102,192 | ||||||||||||
| Restructuring | 1,120 | 449 | 877 | 632 | ||||||||||||
| Write-down of intangibles | - | 5,809 | - | 2,617 | ||||||||||||
| Operating income (loss) | (12,936 | ) | (6,098 | ) | 3,086 | (798 | ) | |||||||||
| Interest expense | 2,097 | 2,120 | 2,148 | 7,534 | ||||||||||||
| Income from Continued Dumping and Subsidy Offset Act, net | - | - | 7,147 | - | ||||||||||||
| Interest income | 882 | 1,023 | 1,134 | 575 | ||||||||||||
| Other income, net | 566 | 351 | 3,785 | 691 | ||||||||||||
| Income (loss) from continuing operations before income taxes | (13,585 | ) | (6,844 | ) | 13,004 | (7,066 | ) | |||||||||
| Income tax expense (benefit) | (5,043 | ) | (3,192 | ) | 3,876 | (2,595 | ) | |||||||||
| Income (loss) from continuing operations | (8,542 | ) | (3,652 | ) | 9,128 | (4,471 | ) | |||||||||
| Income (loss) from discontinued operations (net of tax) | (152 | ) | (6,282 | ) | 384 | 50 | ||||||||||
| Net income (loss) | $ | (8,694 | ) | $ | (9,934 | ) | $ | 9,512 | $ | (4,421 | ) | |||||
| Diluted weighted average shares outstanding | 51,380 | 51,410 | 51,590 | 51,425 | ||||||||||||
| Diluted income (loss) from continuing operations per share | $ | (0.17 | ) | $ | (0.07 | ) | $ | 0.18 | $ | (0.09 | ) | |||||
| Diluted net income (loss) per share | $ | (0.17 | ) | $ | (0.19 | ) | $ | 0.18 | $ | (0.09 | ) | |||||
18
TABLE OF CONTENTS
ITEM 7. MANAGEMENT'S DISCUSSION AND ANALYSIS OF FINANCIAL CONDITION AND RESULTS OF OPERATIONS.Our Management's Discussion and Analysis is an integral part of understanding our financial results . This Management's Discussion and Analysis should be read in conjunction with the accompanying Consolidated Financial Statements and related Notes to Consolidated Financial Statements. We begin the Management's Discussion and Analysis with an introduction to La-Z-Boy Incorporated's key businesses, strategies and significant operational events in fiscal 2009. We then provide a discussion of our results of operations, liquidity and capital resources, critical accounting policies and other matters.
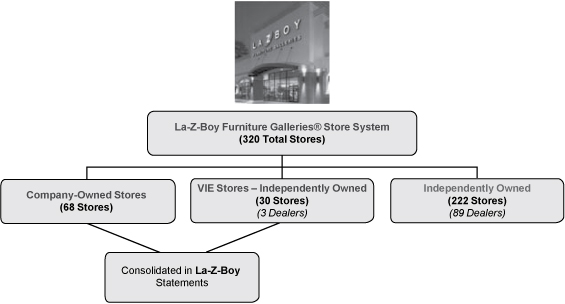
IntroductionLa-Z-Boy Incorporated manufactures, markets, imports, distributes and retails upholstery products and casegoods (wood) furniture products. Our La-Z-Boy brand is the most recognized brand in the furniture industry, and we are the leading global producer of reclining chairs. We own 68 La-Z-Boy Furniture Galleries® stores, which are retail locations dedicated to marketing our La-Z-Boy branded product. These 68 stores are part of the larger network of La-Z-Boy Furniture Galleries® stores, which includes a total of 320 stores, the balance of which are independently owned and operated. The network constitutes the industry's largest single-branded upholstered furniture retailer in North America. These stores combine the style, comfort and quality of La-Z-Boy furniture with our in-home design service to help consumers furnish their homes.
In addition to our company-owned stores, we consolidate certain of our independent dealers who did not have sufficient equity to carry out their principal business activities without our financial support. These dealers are referred to as Variable Interest Entities ("VIEs"). During the third quarter of fiscal 2009, we terminated our relationship with our Toronto VIE. However, four of the stores operated by the former dealer were assumed by another dealer in the Toronto market and one was closed. As a result this dealer became a VIE. Additionally, in the fourth quarter of fiscal 2009 it was determined that we were no longer the primary beneficiary of our Cleveland dealer, that was previously consolidated as a VIE, and therefore this dealer is no longer consolidated. This dealer was included in our Consolidated Statement of Operations for the first 11 months of fiscal 2009. At the end of fiscal 2009, we had three VIEs, operating 30 stores, in our Consolidated Statement of Operations. At the end of fiscal 2008, we had four VIEs, operating 34 stores, in our Consolidated Statement of Operations.
Our reportable operating segments are the Upholstery Group, the Casegoods Group and the Retail Group.
Upholstery Group . In terms of revenue, our largest segment is the Upholstery Group, which includes La-Z-Boy, our largest operating unit. Also included in the Upholstery Group are the operating units Bauhaus and England. This group primarily manufactures and sells upholstered furniture to furniture retailers and proprietary stores. We import cut and sewn fabric and leather kits that allow us to take full advantage of both the cost-saving opportunities presented in Asia and the speed to market advantages of a North American manufacturing base. The Upholstery Group sells furniture mainly to La-Z-Boy Furniture Galleries® stores, general dealers and department stores. Upholstered furniture includes recliners and motion furniture, sofas, loveseats, chairs, ottomans and sleeper sofas.
Casegoods Group . Our Casegoods Group today is primarily an importer, marketer and distributor of casegoods (wood) furniture. It also operated two manufacturing facilities in North Carolina in fiscal 2009. As previously mentioned these two facilities are being consolidated in fiscal 2010. The operating units in the Casegoods Group are American Drew/Lea, Hammary and Kincaid. Casegoods product includes tables, chairs, entertainment centers, headboards, dressers, accent pieces and some coordinated upholstered furniture.
Retail Group . The Retail Group consists of 68 company-owned La-Z-Boy Furniture Galleries® stores located in eight markets ranging from the Midwest to the East Coast of the United States and also including Southeastern Florida. The Retail Group sells mostly upholstered furniture to end consumers through the retail network.
19
TABLE OF CONTENTS
The chart below shows the current structure of the La-Z-Boy Furniture Galleries® store network.
During the first quarter of fiscal 2008, we began rolling out a new proprietary distribution model referred to as ComfortStudios. ComfortStudios are defined spaces within a larger retailer that are dedicated to showcasing La-Z-Boy branded furniture. At the end of fiscal 2009, we had 466 ComfortStudios, of which some were new studios and the rest were conversions of former in-store galleries and general dealers. We expect to open approximately 30 more ComfortStudios during fiscal 2010. Kincaid, England and Lea also have in-store gallery programs.
Significant Operational Events in Fiscal 2009All of our segments experienced a decline in sales during fiscal 2009 when compared with fiscal 2008. Towards the end of the fiscal 2009 second quarter, we realized significant declines in consumer demand brought on by a weak job market, declining home prices and tightening consumer credit which were factors in the failure of several prominent financial institutions. These events intensified concerns about credit and liquidity risks in the financial markets and had a major impact on the economy as a whole and our business in particular. The collapse of the credit markets, the related tightening of access to capital and the ensuing write-downs of troubled loans by financial institutions had a significant impact on the decline in consumer confidence and the discretionary spending on home furnishing purchases.
As a result of these events and the recessionary economic climate and its impact on the furniture industry, we made several changes to our business in order to align our operating structure with the current level of business. We have reduced employment by about 23% across all levels of the company since the year ended April 26, 2008, we reduced capital expenditures to $15.6 million from a plan of about $27 million, we suspended our bonus, profit sharing, company match portion of our 401(k) plan and our quarterly dividend to shareholders, and we reduced our exposure to the tightening financial markets by withdrawing credit support from certain independent dealers. We reduced inventories by 21% or $38.2 million compared to fiscal 2008 and reduced debt by $43.5 million in fiscal 2009. In addition, we plan to continue focusing on reducing our overall operating expenses and keeping our inventories in alignment with today's volumes. We believe the reduction in employment alone will result in savings of $25 million to $30 million annually. We are continuing to focus on cash flow and liquidity to ensure that our balance sheet remains strong enough to withstand any further changes or declines in the economic climate.
During the fourth quarter of fiscal 2008, we committed to a restructuring plan to consolidate all of our North American cutting and sewing operations in Mexico and transfer production from our Tremonton, Utah plant, to our five remaining La-Z-Boy branded upholstery manufacturing facilities. We began start up production at
20
TABLE OF CONTENTS
our Mexican facility in January 2009. As of the end of fiscal 2009, about 272 employees completed training and about 144 employees were in training at our Mexican facility. At the end of fiscal 2009, approximately 8% of our domestic cutting and sewing operations were coming from our Mexican facility. The cut and sewn sets that we receive from our domestic cutting and sewing operations represent approximately half of our total cut and sewn sets. The remainder of our cut and sewn sets come from our China suppliers. By the end of fiscal 2010 we expect 75% to 80% of our domestic cutting and sewing operations to be shifted to our Mexican facility, with the remainder in fiscal 2011. In connection with these activities, we have incurred $10.3 million in charges since the inception of this plan for severance and benefits, write-down of certain fixed assets, and other restructuring costs. We expect to incur additional pre-tax restructuring charges of $2 to $3 million. As a result of these moves, we expect to realize in excess of $25.0 million in annual cost savings, with the full benefit beginning in fiscal 2011.
During fiscal 2009 we committed to restructuring plans relating to the closure of our La-Z-Boy U.K. subsidiary, the closure of our plant in Sherman, Mississippi related to our Bauhaus operations, reduction in our company-wide employment to be more in line with today's sales volume and the consolidation of our casegoods manufacturing plants in North Carolina. In connection with these plans, we recorded $3.7 million in restructuring charges in fiscal 2009, covering the write-down of inventory and fixed assets and severance and benefits. Additionally, as a result of these plans, we recorded a non-cash impairment charge of $1.3 million which represented the entire goodwill amount of our La-Z-Boy U.K. subsidiary.
During the fiscal 2009 year, our stock price declined approximately 69%, bringing our market capitalization significantly below our company's book value. As a result, we had to analyze the overall valuation of the company, our fixed assets and our intangible assets. Although we tested the valuation of our Retail segment's goodwill during the second quarter, the major decline in the stock market and the freezing of money in the capital markets resulted in an increase in our weighted average cost of capital from 11% at the end of the second quarter of fiscal 2009 to 16% at the end of the third quarter of fiscal 2009. This increase in the weighted average cost of capital had the effect of reducing our fair value estimates and resulted in significant write-downs in our intangible assets. We recorded a non-cash impairment charge of $40.4 million relating to the goodwill in our Retail and Upholstery segments and a non-cash impairment charge of $5.5 million relating to the trade names of operating units in our Casegoods segment in the third quarter of fiscal 2009. We evaluated the recoverability of our long-lived assets of our asset groups. Due to our operating losses and a deterioration of economic conditions, which reduced our estimated future cash flows for certain asset groups, in fiscal 2009 we recognized a $7.5 million non-cash impairment charge relating to the long-lived assets of our Retail Group.
As a result of our fiscal 2009 losses, the impact of the restructuring actions we have taken over the past two years, the significant decline in current and projected demand for consumer domestic furniture purchases and resulting uncertainty in the economic climate, we reassessed the likelihood that we will be able to realize the benefit of our deferred tax assets. As a result, we recorded a valuation allowance of $38.2 million against our deferred taxes assets in the second quarter of fiscal 2009. As of the end of fiscal 2009, our total valuation allowance was $64.7 million.
21
TABLE OF CONTENTS
Results of OperationsAnalysis of Operations: Year Ended April 25, 2009
(Fiscal 2009 compared with 2008)
| (Amounts in thousands, except per share amounts and percentages) | (52 weeks) 4/25/2009 | (52 weeks) 4/26/2008 | Percent change | |||||||||
| Upholstery sales | $ | 899,204 | $ | 1,084,418 | (17.1 | )% | ||||||
| Casegoods sales | 178,000 | 213,896 | (16.8 | )% | ||||||||
| Retail sales | 160,838 | 190,180 | (15.4 | )% | ||||||||
| Other/eliminations | (11,368 | ) | (37,553 | ) | 69.7 | % | ||||||
| Consolidated sales | ||||||||||||