SECURITIES AND EXCHANGE COMMISSION
WASHINGTON, D.C. 20549
______________________
FORM 10-K
[x] | ANNUAL REPORT PURSUANT TO SECTION 13 OR 15(d) OF THE SECURITIES EXCHANGE ACT OF 1934 |
| For the fiscal year ended December 31, 2013 |
or
[_] | TRANSITION REPORT PURSUANT TO SECTION 13 OR 15(d) OF THE SECURITIES EXCHANGE ACT OF 1934 |
| For the transition period from ___________ to ___________ |
Commission file number: 1-5721
LEUCADIA NATIONAL CORPORATION
(Exact Name of Registrant as Specified in its Charter)
New York | 13-2615557 |
(State or Other Jurisdiction of Incorporation or Organization) | (I.R.S. Employer Identification No.) |
520 Madison Avenue
New York, New York 10022
(212) 460-1900
(Address, Including Zip Code, and Telephone Number, Including Area Code, of Registrant's Principal Executive Offices)
Securities registered pursuant to Section 12(b) of the Act:
Title of Each Class | Name of Each Exchange on Which Registered |
Common Shares, par value $1 per share | New York Stock Exchange |
Securities registered pursuant to Section 12(g) of the Act:
None.
(Title of Class)
Indicate by check mark if the registrant is a well-known seasoned issuer, as defined in Rule 405 of the Securities Act. Yes [x] No [ ]
Indicate by check mark if the registrant is not required to file reports pursuant to Section 13 or Section 15(d) of the Act. Yes [ ] No [x]
Indicate by check mark whether the registrant: (1) has filed all reports required to be filed by Section 13 or 15(d) of the Securities Exchange Act of 1934 during the preceding 12 months (or for such shorter period that the registrant was required to file such reports), and (2) has been subject to such filing requirements for the past 90 days. Yes [x] No [ ]
Indicate by check mark whether the registrant has submitted electronically and posted on its corporate Web site, if any, every Interactive Data File required to be submitted and posted pursuant to Rule 405 of Regulation S-T (§ 232.405 of this chapter) during the preceding 12 months (or for such shorter period that the registrant was required to submit and post such files).Yes [x] No [ ]
Indicate by check mark if disclosure of delinquent filers pursuant to Item 405 of Regulation S-K is not contained herein, and will not be contained, to the best of registrant's knowledge, in definitive proxy or information statement incorporated by reference in Part III of this Form 10-K or any amendment to this Form 10-K. [x]
Indicate by check mark whether the registrant is a large accelerated filer, an accelerated filer, a non-accelerated filer, or a smaller reporting company. See definitions of "large accelerated filer," "accelerated filer," and "smaller reporting company" in Rule 12b-2 of the Exchange Act. (Check one):
Large accelerated filer [x] | Accelerated filer [ ] |
Non-accelerated filer [ ] | Smaller reporting company [ ] |
Indicate by check mark whether the registrant is a shell company (as defined in Rule 12b-2 of the Exchange Act). Yes [ ] No [x]
Aggregate market value of the voting stock of the registrant held by non-affiliates of the registrant at June 30, 2013 (computed by reference to the last reported closing sale price of the Common Shares on the New York Stock Exchange on such date): $8,808,895,000.
On February 14, 2014, the registrant had outstanding 364,132,464 Common Shares.
DOCUMENTS INCORPORATED BY REFERENCE:
Certain portions of the registrant's Definitive Proxy Statement pursuant to Regulation 14A of the Securities Exchange Act of 1934 in connection with the 2014 Annual Meeting of Shareholders are incorporated by reference into Part III of this Form 10-K.
LOCATION OF EXHIBIT INDEX
The index of exhibits is contained in Part IV on page 63.
1
PART I
Item 1 . Business .
Leucadia National Corporation is a diversified holding company engaged through its consolidated subsidiaries in a variety of businesses, including investment banking and capital markets, beef processing, manufacturing, energy projects, asset management and real estate. We also own equity interests in operating businesses which are accounted for under the equity method of accounting, including a commercial mortgage banking and servicing business, automobile dealerships and a fixed wireless broadband services provider in Italy. We focus on long-term value creation and return on investment to maximize long-term shareholder value. We continuously investigate possible acquisitions of new businesses, securities and assets, and evaluate the retention and disposition of our existing operations and holdings. Changes in the mix of our businesses and investments should be expected.
On March 1, 2013, Jefferies Group LLC ("Jefferies") became one of our wholly-owned subsidiaries. Jefferies is a global full-service, integrated securities and investment banking firm. Jefferies shareholders received 0.81 of a share of our common shares for each share of Jefferies common stock they held. Prior to the closing, we owned 58,006,024 common shares of Jefferies, representing approximately 28% of the outstanding common shares of Jefferies. Richard Handler, Chairman and Chief Executive Officer of Jefferies, was appointed the Chief Executive Officer and a Director of Leucadia and Brian Friedman, the Chairman of the Executive Committee of Jefferies, was appointed President and a Director of Leucadia.
At December 31, 2013, our holding company had $3.1 billion in available liquidity. For more information, see Item 7, Management's Discussion and Analysis of Financial Condition and Results of Operations.
At December 31, 2013, we and our consolidated subsidiaries had 14,647 full-time employees. Our global headquarters and executive offices are located at 520 Madison Avenue, New York, NY 10022. Our primary telephone number is (212) 460-1900 and our website address is Leucadia.com.
The following documents and reports are available on or through our website:
• Code of Business Practice;
• Reportable waivers, if any, from our Code of Business Practice by our executive officers;
• Board of Directors Corporate Governance Guidelines;
• Charter of the Audit Committee of the Board of Directors;
• Charter of the Nominating and Corporate Governance Committee of the Board of Directors;
• Charter of the Compensation Committee of the Board of Directors;
• Annual reports on Form 10-K;
• Quarterly reports on Form 10-Q;
• Current reports on Form 8-K;
• Beneficial ownership reports on Forms 3, 4 and 5; and
• Any amendments to the above-mentioned documents and reports.
Shareholders may also obtain a printed copy of any of these documents or reports free of charge by sending a request to Leucadia National Corporation, Investor Relations, 520 Madison Avenue, New York, NY 10022 or by calling 212-460-1900.
As used herein, the term "Company", "Leucadia", "we", "our" or similar expressions refer to Leucadia National Corporation, a New York corporation organized in 1968, and its subsidiaries, except as the context otherwise may require.
Our Businesses
The following provides more information about each of our businesses, including:
· | Investment Banking & Capital Markets; |
· | Beef Processing; |
· | Other Operations, which include Manufacturing, Energy Projects, Asset Management and Real Estate; and |
· | Other Investments, which include Berkadia, Linkem and Garcadia. |
2
Investment Banking & Capital Markets
Business Description
Our investment banking and capital markets segment consists of Jefferies, a global full-service, integrated securities and investment banking firm. Jefferies principal operating subsidiary, Jefferies LLC, was founded in the U.S. in 1962 and our first international operating subsidiary, Jefferies International Limited ("Jefferies Europe"), was established in the U.K. in 1986. On March 1, 2013, Jefferies Group, Inc. converted into a limited liability company (renamed Jefferies Group LLC) and became an indirect wholly-owned subsidiary of Leucadia National Corporation pursuant to a merger agreement. Jefferies continues to operate as a full-service investment banking firm and as the holding company to its various regulated and unregulated operating subsidiaries. Following the merger, Jefferies Group LLC retains a credit rating separate from Leucadia and remains an SEC reporting company, filing annual, quarterly and periodic financial reports. As of November 30, 2013, Jefferies had 3,797 employees in the Americas, Europe, Asia and the Middle East. The net book value of our investment in Jefferies was $5.3 billion at December 31, 2013.
Equities
Equities Research, Sales & Trading
Jefferies provides their clients full-service equities research, sales and trading capabilities across global securities markets. Jefferies earns commissions or spread revenue by executing transactions for clients across these markets in equity and equity-related products, including common stock, American depository receipts, global depository receipts, exchange-traded funds, exchange-traded equity options, convertible and other equity-linked products and closed-end funds. Jefferies primary competitors are U.S. and non-U.S. bank holding companies. Jefferies acts as agent or principal (including as a market-maker) when executing client transactions via traditional "high-touch" and electronic "low-touch" channels. In order to facilitate client transactions, Jefferies may act as principal to provide liquidity which requires the commitment of our capital and maintenance of dealer inventory.
Jefferies equity research, sales and trading efforts are organized across three geographical regions: the Americas; Europe, the Middle East, and Africa; and Asia Pacific. Jefferies main product lines within the regions are cash equities, electronic trading, derivatives and convertibles. Jefferies clients are primarily institutional market participants such as mutual funds, hedge funds, investment advisors, pension and profit sharing plans, and insurance companies. Through Jefferies global research team and sales force, Jefferies maintains relationships with their clients, distributes investment research and strategy, trading ideas, market information and analyses across a range of industries and receives and executes client orders. Jefferies research covers over 1,700 companies around the world and approximately a further 300 companies are covered by five firms in Asia with whom Jefferies maintains alliances.
Equity Finance
Jefferies equity finance business provides financing, securities lending and other prime brokerage services. Jefferies offers prime brokerage services in the U.S. that provide hedge funds, money managers and registered investment advisors with execution, financing, clearing, reporting and administrative services. Jefferies finances their clients' securities positions through margin loans that are collateralized by securities, cash or other acceptable liquid collateral. Jefferies earns an interest spread equal to the difference between the amount it pays for funds and the amount received from clients. Jefferies also operates a matched book in equity and corporate bond securities, whereby Jefferies borrows and lends securities versus cash or liquid collateral and earns a net interest spread.
Customer assets (securities and funds) held by Jefferies are segregated in accordance with regulatorily mandated customer protection rules. Jefferies offers selected prime brokerage clients with the option of custodying their assets at an unaffiliated U.S. broker-dealer that is a subsidiary of a bank holding company. Under this arrangement, Jefferies provides their clients directly all customary prime brokerage services other than custody.
Wealth Management
Jefferies provides tailored wealth management services designed to meet the needs of high net worth individuals, their families and their businesses, private equity and venture funds and small institutions. Jefferies advisors provide access to all of their institutional execution capabilities and deliver other financial services. Jefferies open architecture platform affords clients with access to products and services from both Jefferies and from a variety of other major financial services institutions.
3
Fixed Income
Fixed Income Sales and Trading
Jefferies provides clients sales and trading of investment grade and high yield corporate bonds, U.S. and European government and agency securities, municipal bonds, mortgage- and asset-backed securities, whole loans, leveraged loans, distressed securities and emerging markets debt. Jefferies is designated as a Primary Dealer by the Federal Reserve Bank of New York and Jefferies Europe is designated in similar capacities for several government bond issuers in Europe and trades a broad spectrum of other European government bonds. Additionally, through the use of repurchase agreements, Jefferies acts as an intermediary between borrowers and lenders of short-term funds and obtains funding for various inventory positions.
Jefferies strategists and economists provide ongoing commentary and analysis of the global fixed income markets. In addition, its fixed income research professionals, including research and desk analysts, provide investment ideas and analysis across a variety of fixed income products.
Futures, Foreign Exchange and Commodities
Jefferies Bache (also referred to as Jefferies Global Commodities Group) provides clients 24-hour global coverage, with direct access to major commodity and financial futures exchanges including the CME, CBOT, NYMEX, ICE, NYSE Euronext, LME and Eurex and provides 24-hour global coverage, execution, clearing and market making in futures, options and derivatives on industrial metals including aluminum, copper, nickel, zinc, tin and lead. Products provided to clients include LME and CME futures and over-the-counter metals swaps and options.
Jefferies operates a full-service trading desk in all precious metals, cash, futures and exchange-for-physicals markets, and is a market-maker providing execution and clearing services as well as market analysis. Jefferies Bache also provides prime brokerage services and is an authorized coin distributor of the U.S. Mint.
In addition, Jefferies Bache is a market-maker in foreign exchange spot, forward, swap and option contracts across major currencies and emerging markets globally.
Investment Banking
Jefferies provides clients around the world with a full range of equity capital markets, debt capital markets and financial advisory services. Jefferies services are enhanced by its industry sector expertise, global distribution capabilities and its senior management level commitment to clients.
Over 650 investment banking professionals operate in the Americas, Europe and Asia, and are organized into industry, product and geographic coverage groups. Jefferies sector coverage groups include consumer and retail, energy, financial institutions, financial sponsors, general industrials, healthcare, media and telecommunications, public finance, REGAL (real estate, gaming, lodging) and technology. Jefferies product coverage groups include equity capital markets, debt capital markets and financial advisory, which includes both mergers and acquisitions and restructuring and recapitalization. Jefferies geographic coverage groups include coverage teams based in major cities in the United States, Canada, Brazil, United Kingdom (including Jefferies UK corporate broking team), Germany, Russia, India and China.
Equity Capital Markets
Jefferies provides a broad range of equity financing capabilities to companies and financial sponsors. These capabilities include private equity placements, initial public offerings, follow-on offerings, block trades and equity-linked convertible securities.
Debt Capital Markets
Jefferies provides a wide range of debt financing capabilities for companies, financial sponsors and governmental entities. Jefferies focuses on structuring, underwriting and distributing public and private debt, including investment grade and non-investment grade corporate debt, leveraged loans, mortgage- and other asset-backed securities, and liability management solutions.
4
Advisory Services
Jefferies provides mergers and acquisition and restructuring and recapitalization services to companies, financial sponsors and governmental entities. In the mergers and acquisition area, Jefferies advises sellers and buyers on corporate sales and divestitures, acquisitions, mergers, tender offers, spinoffs, joint ventures, strategic alliances and takeover and proxy fight defense. Jefferies also provides a broad range of acquisition financing capabilities to assist clients. In the restructuring and recapitalization area, Jefferies provides to companies, bondholders and lenders with a full range of restructuring advisory capabilities as well as expertise in the structuring, valuation and placement of securities issued in recapitalizations.
Competition
All aspects of Jefferies business are intensely competitive. Jefferies competes primarily with the large global bank holding companies that engage in capital markets activities, but also with firms listed in the AMEX Securities Broker/Dealer Index, other brokers and dealers, and boutique investment banking firms. The large global bank holding companies have substantially greater capital and resources than Jefferies does. Jefferies believes that the principal factors affecting its competitive standing include the quality, experience and skills of its professionals, the depth of Jefferies relationships, the breadth of Jefferies service offerings, its ability to deliver consistently the integrated capabilities of Jefferies and Jefferies tenacity and commitment to serve clients.
Regulation
Regulation in the United States. The financial services industry in which Jefferies operates is subject to extensive regulation. In the U.S., the SEC is the federal agency responsible for the administration of federal securities laws, and the Commodity Futures Trading Commission ("CFTC") is the federal agency responsible for the administration of laws relating to commodity interests (including futures and swaps). In addition, self-regulatory organizations, principally Financial Industry Regulatory Authority ("FINRA") and the National Futures Association ("NFA"), are actively involved in the regulation of financial service businesses. The SEC, CFTC and self-regulatory organizations conduct periodic examinations of broker-dealers investment advisers, futures commission merchants ("FCMs") and swap dealers. Financial service businesses are also subject to regulation by state securities commissions and attorneys general in those states in which they do business.
Broker-dealers are subject to regulations that cover all aspects of the securities business, including sales and trading methods, trade practices among broker-dealers, use and safekeeping of customers' funds and securities, capital structure of securities firms, anti-money laundering efforts, recordkeeping and the conduct of directors, officers and employees. Registered advisors are subject to, among other requirements, regulations concerning marketing, transactions with affiliates, disclosure to clients, and recordkeeping; and advisors that are also registered as commodity trading advisors or commodity pool operators are also subject to regulation by the CFTC and the NFA. FCMs, introducing brokers and swap dealers that engage in commodities, futures or swap transactions are subject to regulation by the CFTC and the NFA. Additional legislation, changes in rules promulgated by the SEC, CFTC and self-regulatory organizations, or changes in the interpretation or enforcement of existing laws and rules may directly affect the operations and profitability of broker-dealers, investment advisers, FCMs and swap dealers. The SEC, CFTC and self-regulatory organizations, state securities commissions and state attorneys general may conduct administrative proceedings or initiate civil litigation that can result in censure, fine, suspension, expulsion of a firm, its officers or employees, or revocation of a firm's licenses.
On July 21, 2010, the Dodd-Frank Wall Street Reform and Consumer Protection Act ("Dodd-Frank Act") was enacted in the United States. The Dodd-Frank Act is being implemented through extensive rulemaking by the SEC, CFTC and other governmental agencies. The Dodd-Frank Act also mandates the preparation of studies on a wide range of issues. These studies could lead to additional regulatory changes. For additional information see Item 1A. Risk Factors – "Recent legislation and new and pending regulation may significantly affect Jefferies business."
Net Capital Requirements. U.S. registered broker-dealers are subject to the SEC's Uniform Net Capital Rule (the "Net Capital Rule"), which specifies minimum net capital requirements. Jefferies U.S. broker-dealer subsidiaries, Jefferies LLC and Jefferies Execution Services, Inc. ("Jefferies Execution"), are registered broker-dealers and are subject to the Net Capital Rule. Jefferies LLC and Jefferies Execution have elected to compute their minimum net capital requirement in accordance with the "Alternative Net Capital Requirement" as permitted by the Net Capital Rule, which provides that a broker-dealer shall not permit its net capital, as defined, to be less than the greater of 2% of its aggregate debit balances (primarily customer-related receivables) or $250,000 ($1.5 million for prime brokers). Furthermore, Jefferies LLC is a registered Introducing Broker with the CFTC and is subject to the CFTC's minimum financial requirements. Under the CFTC's minimum financial requirements, an Introducing Broker must maintain adjusted net capital equal to or in excess of the greater of (A) $45,000 or (B) since Jefferies LLC is also a registered broker-dealer, the amount of net capital required by the Net Capital Rule. Compliance with the Net Capital Rule could limit operations of Jefferies broker-dealers, such as underwriting and trading activities, that require the use of significant amounts of capital, and may also restrict their ability to make loans, advances, dividends and other payments. In addition, Jefferies LLC is subject to the rules and regulations of various exchanges, clearing organizations and other regulatory agencies applicable to Introducing Brokers, which may affect its ability as an Introducing Broker to make capital and certain other distributions.
5
U.S. registered FCMs are subject to the CFTC's minimum financial requirements for futures commission merchants and introducing brokers. Jefferies Bache, LLC, a U.S. FCM subsidiary, is registered and subject to the minimum financial requirements. Under the minimum financial requirements, an FCM must maintain adjusted net capital equal to or in excess of the greater of (A) $1,000,000 or (B) the FCM's risk-based capital requirements totaling (1) eight percent of the total risk margin requirement for positions carried by the FCM in customer accounts, plus (2) eight percent of the total risk margin requirement for positions carried by the FCM in noncustomer accounts. An FCM's ability to make capital and certain other distributions is subject to the rules and regulations of various exchanges, clearing organizations and other regulatory agencies which may have capital requirements that are greater than the CFTC's.
Jefferies subsidiaries that are registered swap dealers will become subject to capital requirements under the Dodd-Frank Act once they become final. For additional information see Item 1A. Risk Factors – "Recent legislation and new and pending regulation may significantly affect Jefferies business."
See Item 7, Management's Discussion and Analysis of Financial Condition and Results of Operations, and Note 28 to consolidated financial statements for additional information on net capital calculations.
Regulation outside the United States. Jefferies is an active participant in the international capital markets, engage in commodity futures brokerage and provide investment banking services throughout the world, but primarily in Europe and Asia. As is true in the U.S., Jefferies subsidiaries are subject to extensive regulations promulgated and enforced by, among other regulatory bodies, the U.K. Financial Conduct Authority, the Hong Kong Securities and Futures Commission, the Japan Financial Services Agency and the Monetary Authority of Singapore. Every country in which Jefferies does business imposes laws, rules and regulations similar to those in the U.S., including with respect to some form of capital adequacy rules, customer protection rules, anti-money laundering and anti-bribery rules, compliance with other applicable trading and investment banking regulations and similar regulatory reform packages in response to the credit and liquidity crisis of 2007 and 2008. For additional information see Item 1A. Risk Factors – "Extensive international regulation of Jefferies business limits its activities, and, if Jefferies violates these regulations, it may be subject to significant penalties."
Beef Processing
Business Description
Our beef processing operations are conducted through our 78.9% ownership of National Beef Packing Company, LLC, one of the largest beef processing companies in the U.S., accounting for approximately 14.5% of the 2013 federally inspected steer and heifer slaughter as reported by the United States Department of Agriculture ("USDA"). National Beef, headquartered in Kansas City, Missouri, processes, packages and delivers fresh and frozen beef and beef by-products for sale to customers in the U.S. and international markets. National Beef's products include boxed beef, ground beef, hides, tallow, and other beef and beef by-products with approximately 87% of National Beef's revenues being generated from the sale of fresh beef. The net book value of our investment in National Beef was $793.7 million at December 31, 2013.
National Beef operates a wet blue tanning facility that sells processed hides to tanners that produce finished leather for the automotive, luxury goods, apparel and furniture industries. Wet blue tanning refers to the first step in processing raw and brine-cured hides into tanned leather. National Beef recently spent approximately $40.0 million to rebuild the tannery, while significantly expanding its capacity and capabilities; the plant is outfitted with automated production and packaging technology and is expected to be fully operational in 2014. The tannery is capable of producing 60,000 hides per week making it the largest in the world.
National Beef owns Kansas City Steak Company, LLC, which sells portioned beef and other products to customers in the food service and retail channels as well as direct to consumers through the internet and direct mail. National Beef also owns a refrigerated and livestock transportation company that provides transportation services for National Beef and third parties.
Sales and Marketing
National Beef markets its products to national and regional retailers, including supermarket chains, independent grocers, club stores, wholesalers and distributors, food service providers and distributors, further processors and the United States military. In addition, National Beef sells beef by-products to the variety meat, feed processing, fertilizer and pet food industries. National Beef exports products to more than 25 countries; export sales currently represent approximately 13% of annual revenues. In 2013, Walmart represented approximately 5% of National Beef's revenues, and its top 10 customers accounted for approximately 26% of revenues.
6
National Beef emphasizes the sale of higher-margin, value-added products, which include branded boxed beef, consumer-ready beef, portion control beef and further processed hides. National Beef believes its value-added products can command higher prices than commodity products because of National Beef's ability to consistently meet product specifications, based on quality, trim, weight, size, breed or other factors, tailored to the needs of its customers. In addition to the value-added brands that National Beef owns, National Beef licenses the use of Certified Angus Beef ® , a registered trademark of Certified Angus Beef LLC, and Certified Hereford Beef ® , a registered trademark of Certified Hereford Beef LLC.
During 2013, Walmart discontinued using National Beef as a provider of its consumer-ready beef products. National Beef has two consumer-ready processing facilities, one of which was completely dedicated to Walmart's business and the other substantially so dedicated. Total consumer-ready revenues were approximately 7% of National Beef consolidated revenues during 2012, but as a value-added product, consumer-ready products have historically constituted a higher percentage of National Beef's gross margin. Since 2008, consumer-ready products have represented from 10% to 26% of National Beef's total gross margin, and were at the higher end of that range in 2012 due, in part, to reduced gross margin from other National Beef products. National Beef continues to pursue replacement business for its consumer-ready facilities; however, it may not be able to fully replace the operating cash flow generated by these facilities in the near future, if at all. During 2013, the two consumer-ready facilities operated at reduced levels, and continue to do so.
The demand for beef products is generally strongest in the spring and summer months.
Raw Materials and Procurement
The primary raw material for the processing plants is live cattle. The domestic beef industry is characterized by cattle prices that change daily based on seasonal consumption patterns, overall supply and demand for beef and other proteins, cattle inventory levels, weather and other factors.
National Beef has entered into a cattle supply agreement with U.S. Premium Beef, LLC ("USPB"), the current owner of a 15.1% interest in National Beef that sold a substantial portion of its ownership interest to us. USPB has agreed to supply, and National Beef has agreed to purchase through USPB from the members of USPB, 735,385 head of cattle per year (subject to adjustment), based on pricing grids furnished by National Beef to the members of USPB. National Beef believes the pricing grids are based on terms that could be obtained from an unaffiliated party. The cattle supply agreement extends through December 31, 2017, with automatic, but optional one year extensions. During 2013, National Beef purchased approximately 20% of the total cattle it processed from USPB members pursuant to the cattle supply agreement. National Beef also purchased additional cattle from certain USPB members outside of the cattle supply agreement as well as from hundreds of other cattle producing suppliers.
Processing Facilities
National Beef owns three beef processing facilities located in Liberal, Kansas, Dodge City, Kansas, and Brawley, California. The Liberal and Dodge City facilities can each process approximately 6,000 cattle per day. During 2013, after exhausting all opportunities to improve the operating performance of the Brawley beef processing facility, National Beef decided that it will close the facility on or around April 4, 2014. Subsequent to closing the plant, National Beef plans to hold the plant in "mothballed" status indefinitely. See Item 7, Management's Discussion and Analysis of Financial Condition and Results of Operations, for more information.
National Beef owns consumer-ready facilities in Hummels Wharf, Pennsylvania (approximately 79,000 square feet) and Moultrie, Georgia (approximately 114,000 square feet), and the wet blue tanning facility in St. Joseph, Missouri (approximately 221,000 square feet). The Kansas City Steak processing facility is located in Kansas City, Kansas (approximately 63,000 square feet).
Competition
Competitive conditions exist both in the purchase of live cattle, as well as in the sale of beef products. Beef products compete with other protein sources, including pork and poultry, but National Beef's principal competition comes from other beef processors. National Beef believes the principal competitive factors in the beef processing industry are price, quality, food safety, customer service, product distribution, technological innovations (such as food safety interventions and packaging technologies) and brand loyalty. Some of National Beef's competitors have substantially larger beef operations, greater financial and other resources and wider brand recognition for their products.
7
Regulation and Environmental
National Beef's operations are subject to extensive regulation by the USDA including its Food Safety and Inspection Service ("FSIS") and its Grain Inspection, Packers and Stockyards Administration ("GIPSA"), the Food and Drug Administration ("FDA"), the U.S. Environmental Protection Agency ("EPA") and other federal, state, local and foreign authorities regarding the processing, packaging, storage, safety, distribution, advertising and labeling of its products.
National Beef is subject to the Packers and Stockyards Act of 1921 ("PSA"). Among other things, this statute generally requires National Beef to make full payment for livestock purchases not later than the close of business the day after the purchase and transfer of possession or determination of the purchase price. Under the PSA, National Beef must hold in trust for the benefit of unpaid livestock suppliers all livestock purchased until the sellers have received full payment. At December 31, 2013, National Beef has obtained from an insurance company a surety bond in the amount of $49.4 million to satisfy these requirements.
The Dodge City and Liberal facilities are subject to Title V permitting pursuant to the Federal Clean Air Act and the Kansas Air Quality Act. The Liberal facility permit expired on January 25, 2010, but has been administratively extended pending renewal by the Kansas Department of Health and Environment. The Brawley and St. Joseph facilities are subject to secondary air permits which are in place. The Dodge City, Liberal, Brawley, Hummels Wharf and Moultrie facilities are subject to Clean Air Act Risk Management Plan requirements relating to the use of ammonia as a refrigerant.
All of National Beef's plants are indirect dischargers of wastewater to publicly owned treatment works and are subject to requirements under the federal Clean Water Act, state and municipal laws, as well as agreements or permits with municipal or county authorities. Upon renewal of these agreements and permits, National Beef is from time to time required to make capital expenditures to upgrade or expand wastewater treatment facilities to address new and more stringent discharge requirements imposed at the time of renewal. Storm water discharges from National Beef's plants are also regulated by state and local authorities.
All of National Beef's facilities generate solid wastestreams including small quantities of hazardous wastes. National Beef is subject to laws that provide for strict, and in certain circumstances joint and several, liability for remediation of hazardous substances at contaminated sites; however, National Beef has not received any demands that it has any liability at sites under the Comprehensive Environmental Response, Compensation and Liability Act ("Superfund") or state counterparts. All plants are subject to community right to know reporting requirements under the Superfund Amendments and Reauthorization Act of 1986, which requires yearly filings as to the substances used on facility premises.
Employees
National Beef has approximately 9,200 employees, of which approximately 6,700 are currently represented by collective bargaining agreements. Approximately 2,700 employees at the Liberal plant are represented by the United Food and Commercial Workers International Union under a collective bargaining agreement scheduled to expire in December 2017. Approximately 2,700 employees at the Dodge City plant are represented by the United Food and Commercial Workers International Union under a collective bargaining agreement scheduled to expire in December 2016. Approximately 1,100 employees at the Brawley plant are jointly represented by the United Food and Commercial Workers International Union and the Teamsters International Union under a collective bargaining agreement that was scheduled to expire in December 2013 but was extended indefinitely prior to the expiration. Approximately 150 employees at the St. Joseph plant are represented by the United Cereal Workers of the United Food and Commercial Workers International Union under a collective bargaining agreement scheduled to expire in May 2014.
8
Other Operations
Manufacturing
The Company's manufacturing operations are conducted through Idaho Timber, LLC and Conwed Plastics, LLC.
Idaho Timber is engaged in the manufacture and/or distribution of various wood products, including the following principal product lines: remanufacturing dimension lumber; remanufacturing, bundling and bar coding of home center boards for large retailers; and production of pine dimension lumber and 5/4" radius-edge, pine decking. These products are produced at plants located in Arkansas, Florida, Idaho, Louisiana, New Mexico, North Carolina and Texas. For the year ended December 31, 2013, Idaho Timber had revenues of $205.4 million and pre-tax income of $9.6 million. The net book value of our investment in Idaho Timber was $68.1 million at December 31, 2013.
Idaho Timber owns and operates seven plants, two sawmills that principally produce dimension lumber and decking products and one sawmill that produces split-rail fencing. These ten facilities in the aggregate have approximately 922,000 square feet of manufacturing and office space, covering approximately 214 acres. One plant is principally dedicated to home center board products and the remaining plants principally produce remanufactured dimension lumber products.
Conwed Plastics manufactures and markets lightweight plastic netting used for building and construction, erosion control, packaging, agricultural purposes, carpet padding, filtration, consumer products and other purposes. These products are primarily used for containment purposes, reinforcement of other products, packaging for produce and meats, various types of filtration and erosion prevention. For the year ended December 31, 2013, Conwed Plastics had revenues of $105.4 million and pre-tax income of $15.3 million. The net book value of our investment in Conwed Plastics was $64.4 million at December 31, 2013.
Our plastic products are marketed both domestically and internationally, with approximately 20% of 2013 revenues generated by customers from Europe, Latin America, Japan and Australia. Manufacturing facilities are located in Minnesota, Georgia, Illinois, Virginia and Genk, Belgium (totaling approximately 677,000 square feet). The cost of the principal raw material used in its products, polypropylene, has increased by approximately 63% over the last four years, a continuing trend that started in 2002. The price of polypropylene has historically fluctuated with the price of oil and natural gas but growing economies in China and India have resulted in increased demand for raw materials and raised prices globally.
Energy Projects
During the past few years, we have been seeking to develop a number of large scale domestic energy projects. These projects plan to use gasification technology to convert different types of low grade fossil fuels into clean energy products. We have also invested in an onshore liquefied natural gas ("LNG") project. We have expensed costs to investigate, evaluate and obtain various permits and approvals for our energy projects of $91.7 million, $33.6 million and $34.0 million during the years ended December 31, 2013, 2012 and 2011, respectively.
Although there are a number of large scale projects we are currently investigating, we are not obligated to develop any of the projects, and no assurance can be given that we will be successful in fully developing any of these projects. Any project that we might develop would likely require a significant equity investment, which we presently do not intend to fund by ourselves, the acquisition of substantial non-recourse borrowings to build the projects (total development costs for these types of projects range from $2.5 billion to $3.5 billion), the procurement of purchase commitments for long-term supplies of feedstock, long-term commitments from purchasers of the output, various permits and regulatory approvals and significant technological and engineering expertise to implement. The investigation, evaluation and financing of these large scale projects will take years to complete.
We are currently evaluating the development of a gasification project which would be built in Louisiana by the Company's wholly-owned subsidiary, Lake Charles Clean Energy, LLC ("LCCE"), for an estimated total cost of between $2.3 billion and $2.6 billion. LCCE has been awarded $1.561 billion in tax exempt bonds to support the development of the project, which would be issued by the Lake Charles Harbor and Terminal District of Lake Charles, Louisiana, $128.0 million of investment tax credits and received a $238.0 million federal government grant for carbon capture and sequestration. Receipt of these awards and grants are contingent upon satisfaction of numerous regulatory and other conditions. We are not obligated to make equity contributions to LCCE until it completes its investigation, the project is approved by our Board of Directors and significant financing has been obtained from third parties, which has not yet been arranged. The Lake Charles project is a new chemical manufacturing facility that plans to use proven quench gasification technology to produce various products from petroleum coke, a low grade solid fuel source. The primary products to be produced by the Lake Charles project include methanol and hydrogen. LCCE has entered into offtake agreements for the majority of its production, and has also entered into a 20-year contract for the sale of its entire carbon dioxide by-product stream which would be used for enhanced oil recovery.
9
In July 2009, two of our other prospective gasification projects, one in Indiana and the other in Mississippi, were selected by the U.S. Department of Energy ("DOE") to proceed to detailed due diligence and negotiations of terms and conditions necessary for the DOE to issue conditional commitments for loan guarantees aggregating up to $3.6 billion. While these commitments represent important milestones in the selection process, the guarantees are subject to detailed and extensive due diligence by the DOE and no assurance can be given that a loan guaranty for either project will ultimately be given.
One of our subsidiaries has acquired a leasehold interest and certain permits to construct and operate an onshore LNG export terminal and associated facilities in Warrenton, Oregon. The project would include construction of an offshore dock and berth and onshore facilities to store up to 480,000 cubic meters of LNG. The current plan includes construction of an approximate 86 mile long natural gas pipeline to connect to the U.S. natural gas transmission grid. A pre-filing request for an LNG export terminal was submitted to the Federal Energy Regulatory Commission in 2012. We have applied for and received from the DOE a license to export natural gas to Free Trade Agreement countries. Numerous regulatory permits and approvals and acquisitions of rights of way for the terminal and the pipeline have been submitted to and are under review by various government agencies. Construction of the project cannot begin until all required permits are received and significant financing from third parties has been secured, which has not yet been arranged.
Asset Management
During 2013, we formed Leucadia Asset Management ("LAM"), a registered investment advisor, and have thus far formed two divisions. The Global Macro division was formed upon the transfer of certain employees from Jefferies to LAM, and a second division was created upon the acquisition of Topwater Capital, a first-loss managed account platform. As the advisor and/or general partner to various private investment funds or other types of investment vehicles, LAM will provide advisory, portfolio management and operational services to accredited investors and/or qualified purchasers. Once an investment vehicle is formed, it is expected that one of our subsidiaries will be an initial or major investor. LAM will receive compensation in the form of management fees and/or a performance fee based on investment returns generated for the investors.
Real Estate
We own approximately 31.4% of the outstanding common stock of HomeFed Corporation. In addition, as a result of a 1998 distribution to all of our shareholders, approximately 9.4% of HomeFed is owned by our Chairman. HomeFed is currently engaged, directly and through subsidiaries, in the investment in and development of residential real estate projects in California. We account for our investment in HomeFed under the equity method of accounting. At December 31, 2013, our investment had a carrying value of $52.9 million, which is included in Loans to and investments in associated companies. HomeFed is a public company traded on the NASD OTC Bulletin Board (Symbol: HOFD). Detailed financial and other information about HomeFed may be found on its website ( www.homefedcorporation.com ). See recent events below for a description of an agreement signed in February 2014 to sell certain assets to HomeFed.
10
Other Investments
Berkadia
Berkadia Commercial Mortgage LLC is a commercial mortgage banking and servicing joint venture formed in 2009 with Berkshire Hathaway. We and Berkshire Hathaway each contributed $217.2 million of equity capital to the joint venture and each have a 50% equity interest in Berkadia. At December 31, 2013, the net book value of our investment in Berkadia was $182.6 million. Through December 31, 2013, cumulative cash distributions received from this investment aggregated $229.7 million.
Berkadia originates commercial real estate loans for Fannie Mae, Freddie Mac, Ginnie Mae and the FHA using their underwriting guidelines, and will typically sell the loan to such entities shortly after it is funded. Provided Berkadia adheres to their guidelines, these government-related entities must purchase the loan at the face amount plus accrued interest with Berkadia retaining the mortgage servicing rights. In addition, as a condition to Fannie Mae's delegation of responsibility for underwriting, originating and servicing of loans, Berkadia assumes a shared loss position throughout the term of each loan sold to Fannie Mae, with a maximum loss percentage of approximately one-third of the original principal balance.
Berkadia also originates and brokers commercial mortgage loans which are not part of the government agency programs. Berkadia has a portfolio of loans that provide interim financing to borrowers who intend to refinance the loan with longer-term loans from an eligible government agency or other third party ("Bridge loans"). Berkadia may also from time to time originate and broker loans intended to be conveyed into CMBS transactions sponsored by third parties ("CMBS loans"). Bridge loans are typically floating rate loans with 1 to 3 year maturities; CMBS loans are typically 10 year fixed rate loans that Berkadia may broker to another CMBS lender or may originate and hold for 3 to 6 months pending sale to a securitization vehicle. At December 31, 2013, $625.0 million of such loans were outstanding, substantially all of which were Bridge loans.
At the end of 2012, Berkadia acquired Hendricks & Partners, a multifamily investment sales business, and renamed the business Hendricks-Berkadia. This business provides services related to the acquisition and disposition of multifamily real estate projects, including brokerage services, asset review, market research, financial analysis and due diligence support.
Berkadia is a servicer of commercial real estate loans in the U.S., performing primary, master and special servicing functions for U.S. government agency programs, commercial mortgage-backed securities transactions ("CMBS"), banks, insurance companies and other financial institutions. Berkadia is an approved servicer of loans for Fannie Mae, Freddie Mac, Ginnie Mae and the FHA. As of December 31, 2013, Berkadia serviced approximately 28,000 loans with an unpaid principal balance of $238.0 billion.
As a servicer, Berkadia is frequently responsible for managing, on behalf of its investors and borrowers, the balances that are maintained in custodial accounts for the purposes of collecting and distributing principal and interest, and for managing and disbursing various reserve accounts related to the mortgaged properties among other things. Berkadia derives certain economic benefits from administering these custodial accounts. Such balances totaled in excess of $6.0 billion as of December 31, 2013.
Berkadia is required under its servicing agreements to maintain certain minimum servicer ratings or qualifications from the rating agencies. A downgrade below a certain level may give rise to the right of a customer or trustee of a securitized transaction to terminate Berkadia as servicer. Berkadia currently maintains approvals or ratings from Moody's Investors Service, Fitch Ratings, Standard & Poor's, Morningstar Credit Ratings and Dominion Bond Rating Services. These ratings currently exceed the minimum ratings required by the related servicing agreements. Ratings issued by the rating agencies can be withdrawn or lowered at any time. In addition, Fannie Mae and Freddie Mac retain broad discretion to terminate Berkadia as a seller/servicer without cause.
Garcadia
Garcadia is a joint venture between us and Garff Enterprises, Inc. that owns and operates 21 automobile dealerships comprised of domestic and foreign automobile makers. The Garcadia joint venture agreement specifies that we and Garff shall have equal board representation and equal votes on all matters affecting Garcadia, and that all cash flows from Garcadia will be allocated 65% to us and 35% to Garff, with the exception of one dealership from which we receive 83% of all cash flows and four other dealerships from which we receive 71% of all cash flows. Garcadia's strategy is to acquire automobile dealerships in primary or secondary market locations meeting its specified return criteria. We have received cash distributions of fees and earnings aggregating $33.1 million, $24.4 million and $10.4 million for the years ended December 31, 2013, 2012 and 2011, respectively. In addition, we own the land for certain dealerships and lease it to the dealerships for rent aggregating $7.1 million, $6.0 million and $5.7 million for the years ended December 31, 2013, 2012 and 2011, respectively. At December 31, 2013, our investment in Garcadia was classified as an investment in associated company with a carrying value of $120.0 million, and our investment in the land leased to the dealerships was classified as other assets with a carrying value of $77.2 million.
11
Linkem
We own approximately 40% of the common shares of Linkem S.p.A., a fixed wireless broadband services provider in Italy, and €58.9 million principal amount of a 5% convertible note due in 2018 (interest can be paid in cash or in kind), for an aggregate cash investment of $219.6 million. On an if-converted basis, we would own 53% of the common shares of Linkem.
Linkem was established in 2001 to deploy and operate WiFi hotspots in airports and other locations in Italy. In 2008, Linkem acquired wireless spectrum licenses in the 3.5GHz band and launched Italy's first commercial 4G wireless service. Unlike the U.S. and most of Western Europe, Italy does not have a national cable television system; as a result, Italy's broadband penetration rate is among the lowest in Europe, and the vast majority of residential broadband service is DSL, which relies on legacy copper telephone lines. Linkem offers fixed wireless broadband services at speeds comparable to DSL but priced at a discount.
Linkem owns or has exclusive rights to spectrum holdings of 84MHz covering approximately 80% of the population and 42MHz covering all of Italy. Linkem has signed agreements with several large telecommunication companies for the use of their infrastructure, providing Linkem access to over 30,000 wireless towers throughout Italy. At December 31, 2013, Linkem's network includes base stations deployed on over 1,090 wireless towers that can reach over 35% of the population. Linkem has over 164,000 subscribers for its services. Linkem plans to increase its network coverage across Italy over the coming years as it adds subscribers; expansion and customer acquisition costs are expected to result in operating losses over the next few years. We account for Linkem under the equity method of accounting and at December 31, 2013, the net book value of our investment including the convertible note was $173.6 million.
Recent Events
In December 2013, we entered into an agreement to sell Premier Entertainment Biloxi LLC ("Premier"), the owner of the Hard Rock Hotel & Casino Biloxi ("Hard Rock Biloxi"), through which we had conducted our gaming entertainment operations, for cash consideration of $250.0 million. Closing of the transaction is subject to regulatory approval and customary closing conditions, and is not expected to occur until the second quarter of 2014. As a result, our gaming entertainment segment has been classified as a discontinued operation.
In February 2014, we entered into an agreement to sell to HomeFed substantially all of our real estate properties and operations, an investment in an associated company and cash of approximately $18.0 million (subject to adjustment), in exchange for 7.5 million newly issued HomeFed common shares. The transaction is expected to close during the first quarter of 2014. The additional shares will increase our economic ownership interest in HomeFed to 65%; however, we have agreed to limit our voting rights such that we will not be able to vote more than 45% of HomeFed's total voting securities voting on any matter. We have also entered into a stockholders agreement that will limit our ability to increase our interest in HomeFed or dispose of our interest in HomeFed, as well as a registration rights agreement with respect to our HomeFed shares.
Financial Information about Segments
Our reportable segments consist of the consolidated operating units identified above, which offer different products and services and are managed separately. Other operations primarily consist of manufacturing, energy projects, asset management, real estate and, for periods prior to their spin-off to shareholders in February 2013, our wineries. Associated companies include equity interests in other entities that we account for under the equity method of accounting. Financial information regarding our reportable segments is contained in Note 32, Segment Information, in our consolidated financial statements.
Item 1A . Risk Factors .
Our business is subject to a number of risks. You should carefully consider the following risk factors, together with all of the other information included or incorporated by reference in this report, before you decide whether to purchase our common shares. The risks set out below are not the only risks we face. If any of the following risks occur, our business, financial condition and results of operations could be materially adversely affected. In such case, the trading price of our common shares could decline, and you may lose all or part of your investment.
12
Future acquisitions and dispositions of our operations and investments are possible, changing the components of our assets and liabilities, and if unsuccessful could reduce the value of our common shares. Any future acquisitions or dispositions may result in significant changes in the composition of our assets and liabilities. Consequently, our financial condition, results of operations and the trading price of our common shares may be affected by factors different from those affecting our financial condition, results of operations and trading price at the present time.
The change of principal executive officers of Leucadia may cause Leucadia's investment results to be less successful than in the past. Prior to the acquisition of Jefferies, our principal executive officers held their positions for thirty-five years. After the Jefferies acquisition, Richard Handler became our Chief Executive Officer and Brian Friedman became our President, while continuing their current positions as the principal executive officers of Jefferies. There can be no assurance that our new principal executive officers will be have the same degree of success in the future, and if they do not our financial condition, results of operations and the trading price of our common shares may be adversely affected.
We face numerous risks and uncertainties as we expand our business. We expect the growth of our business to come primarily from internal expansion and through acquisitions and strategic partnering. As we expand our business, there can be no assurance that financial controls, the level and knowledge of personnel, operational abilities, legal and compliance controls and other corporate support systems will be adequate to manage our business and growth. The ineffectiveness of any of these controls or systems could adversely affect our business and prospects. In addition, if we acquire new businesses and introduce new products, we face numerous risks and uncertainties integrating their controls and systems, including financial controls, accounting and data processing systems, management controls and other operations. A failure to integrate these systems and controls, and even an inefficient integration of these systems and controls, could adversely affect our business and prospects.
Recent legislation and new and pending regulation may significantly affect Jefferies business. In the last five years, there has been significant legislation and increased regulation affecting the financial services industry. These legislative and regulatory initiatives affect not only Jefferies, but also its competitors and certain of its clients. These changes could have an effect on Jefferies revenue and profitability, limit Jefferies ability to pursue certain business opportunities, impact the value of assets that it holds, require Jefferies to change certain business practices, impose additional costs on Jefferies and otherwise adversely affect its business. Accordingly, we cannot provide assurance that legislation and regulation will not eventually have an adverse effect on Jefferies business, results of operations, cash flows and financial condition.
The Dodd-Frank Act was signed into law on July 21, 2010. Title VII of the Dodd-Frank Act and the rules and regulations adopted and to be adopted by the SEC and CFTC introduce a comprehensive regulatory regime for swaps and security-based swaps (both of which are defined terms) and parties that deal in derivatives. Jefferies registered two of its subsidiaries as swap dealers with the CFTC and the NFA and may register one or more subsidiaries as security-based swap dealers with the SEC. The new laws and regulations will subject certain swaps and security-based swaps to clearing and exchange trading requirements and will subject swap dealers and security-based swap dealers to significant new burdens, including (i) capital and margin requirements, (ii) reporting, recordkeeping and internal business conduct requirements, (iii) external business conduct requirements in dealings with swap counterparties (which are particularly onerous when the counterparty is a special entity such as a federal, state, or municipal entity, an ERISA plan, a government employee benefit plan or an endowment), and (iv) large trader position reporting and certain position limit requirements. The final rules under Title VII, including those rules that have already been adopted, for both cleared and uncleared swap transactions will impose increased capital and margin requirements on Jefferies registered entities and require additional operational and compliance costs and resources that will likely affect Jefferies business.
Section 619 of the Dodd-Frank Act (Volcker Rule) and section 716 of the Dodd-Frank Act (swaps push-out rule) limit proprietary trading of certain securities and swaps by banking entities such as banks, bank holding companies and similar institutions. Although Jefferies is not a banking entity and is not otherwise subject to these rules, some of Jefferies clients and many of Jefferies counterparties are banks or entities affiliated with banks and will be subject to these restrictions. These sections of the Dodd-Frank Act and the regulations that are adopted to implement them could negatively affect the swaps and securities markets by reducing their depth and liquidity and thereby affect pricing in these markets. Other negative effects could result from an expansive extraterritorial application of the Dodd-Frank Act in general or the Volcker Rule in particular and/or insufficient international coordination with respect to adoption of rules for derivatives and other financial reforms in other jurisdictions. We will not know the exact impact that these changes in the markets will have on Jefferies business until after the final rules are implemented.
13
The Dodd-Frank Act, in addressing systemic risks to the financial system, charges the Federal Reserve with drafting enhanced regulatory requirements for systemically important bank holding companies and certain other nonbank financial companies designated as systemically important by the Financial Stability Oversight Council. The enhanced requirements proposed by the Federal Reserve include capital requirements, liquidity requirements, limits on credit exposure concentrations and risk management requirements. We do not believe that Jefferies will be deemed to be a systemically important nonbank financial company under the new legislation and therefore will not be directly impacted. However, there will be an indirect impact to Jefferies to the extent that the new regulations apply to its competitors, counterparties and certain of its clients.
Extensive international regulation of Jefferies business limits its activities, and, if Jefferies violates these regulations, it may be subject to significant penalties. The financial services industry is subject to extensive laws, rules and regulations in every country in which Jefferies operates. Firms that engage in securities and derivatives trading, commodity futures brokerage, wealth and asset management and investment banking must comply with the laws, rules and regulations imposed by national and state governments and regulatory and self-regulatory bodies with jurisdiction over such activities. Such laws, rules and regulations cover all aspects of the financial services business, including, but not limited to, sales and trading methods, trade practices, use and safekeeping of customers' funds and securities, capital structure, anti-money laundering and anti-bribery and corruption efforts, recordkeeping and the conduct of directors, officers and employees.
Each of Jefferies regulators supervises its business activities to monitor compliance with such laws, rules and regulations in the relevant jurisdiction. In addition, if there are instances in which Jefferies regulators question its compliance with laws, rules, and regulations, they may investigate the facts and circumstances to determine whether Jefferies has complied. At any moment in time, Jefferies may be subject to one or more such investigation or similar reviews. At this time, all such investigations and similar reviews are insignificant in scope and immaterial to Jefferies. However, there can be no assurance that, in the future, the operations of Jefferies businesses will not violate such laws, rules, and regulations and that related investigations and similar reviews could result in adverse regulatory requirements, regulatory enforcement actions and/or fines.
Additional legislation, changes in rules, changes in the interpretation or enforcement of existing laws and rules, or the entering into businesses that subject Jefferies to new rules and regulations may directly affect its business, results of operations and financial condition.
Jefferies continues to monitor the impact that the Basel Accords will have on Jefferies UK regulated entities. The update issued by the Basel Committee on Banking Supervision in December 2010, known as Basel III, recommended strengthening capital and liquidity rules. In response, the European Commission is in the process of implementing amendments to its Capital Requirements Directive ("CRD") putting into law CRD IV and the Capital Requirements Regulation ("CRR"). Changes under CRD IV and CRR became effective January 1, 2014. Jefferies UK subsidiaries impacted by these changes are in compliance with the new regulations.
The European Market Infrastructure Regulation ("EMIR") was enacted in August 2012 and, in common with the Dodd-Frank Act in the U.S., is intended, among other things, to reduce counterparty risk by requiring standardized over-the-counter derivatives be cleared through a central counterparty and reported to regulator appointed trade repositories. EMIR is being introduced in phases in the U.K. and, based on current published dates, will be substantively implemented by the end of 2014.
Changing conditions in financial markets and the economy could result in decreased revenues, losses or other adverse consequences. As a global securities and investment banking firm, global or regional changes in the financial markets or economic conditions could adversely affect Jefferies business in many ways, including the following:
· | A market downturn could lead to a decline in the volume of transactions executed for customers and, therefore, to a decline in the revenues Jefferies receives from commissions and spreads. |
· | Unfavorable financial or economic conditions could reduce the number and size of transactions in which Jefferies provides underwriting, financial advisory and other services. Jefferies investment banking revenues, in the form of financial advisory and underwriting or placement fees, are directly related to the number and size of the transactions in which Jefferies participates and could therefore be adversely affected by unfavorable financial or economic conditions. |
· | Adverse changes in the market could lead to losses from principal transactions on Jefferies inventory positions. |
· | Adverse changes in the market could also lead to a reduction in revenues from asset management fees and investment income from managed funds and losses on Jefferies own capital invested in managed funds. Even in the absence of a market downturn, below-market investment performance by Jefferies funds and portfolio managers could reduce asset management revenues and assets under management and result in reputational damage that might make it more difficult to attract new investors. |
· | Limitations on the availability of credit, such as occurred during 2008, can affect Jefferies ability to borrow on a secured or unsecured basis, which may adversely affect Jefferies liquidity and results of operations. |
· | New or increased taxes on compensation payments such as bonuses or on balance sheet items may adversely affect Jefferies profits. |
· | Should one of Jefferies competitors fail, Jefferies security prices and revenue could be negatively impacted based upon negative market sentiment causing customers to cease doing business with Jefferies and Jefferies lenders to cease loaning Jefferies money, which could adversely affect its business, funding and liquidity. |
14
Unfounded allegations about Jefferies could result in extreme price volatility and price declines in its debt securities and loss of revenue, clients, and employees. In November 2011, Jefferies became the subject of unfounded allegations and false rumors, including among others those relating to its exposure to European sovereign debt. Despite the fact that Jefferies was able to dispel such rumors, both its stock and bond prices were significantly impacted. Its common stock suffered a 20% sell-off in minutes and, consequently, its trading was temporarily suspended, and Jefferies debt-securities prices suffered not only extreme volatility but also record high yields. In addition, Jefferies operations were impacted as some clients either ceased doing business or temporarily slowed down the level of business they do, thereby decreasing Jefferies revenue stream. Although Jefferies was able to reverse the negative impact of such unfounded allegations and false rumors, there is no assurance that Jefferies will be able to do so successfully in the future and the potential failure to do so could have a material adverse effect on Jefferies business, financial condition and liquidity.
The downgrade of the U.S. credit rating and Europe's debt crisis could have a material adverse effect on our business, financial condition and liquidity. Standard & Poor's lowered its long term sovereign credit rating on the United States of America from AAA to AA+ on August 5, 2011. A further downgrade or a downgrade by other rating agencies, including a Nationally Recognized Statistical Rating Organization, could have a material adverse impact on financial markets and economic conditions in the United States and worldwide. Any such adverse impact could have a material adverse effect on our business, financial condition and liquidity.
In addition, during 2011 and 2012, the possibility that certain European Union ("EU") member states could have defaulted on their debt obligations negatively impacted economic conditions and global markets. The continued uncertainty over the outcome of international and the European Union's financial support programs and the possibility that EU member states may experience similar financial troubles could disrupt global markets. The negative impact on economic conditions and global markets could also have a material adverse effect on our business, financial condition and liquidity.
A credit-rating agency downgrade could significantly impact Jefferies business. Maintaining an investment grade credit rating is important to Jefferies business and financial condition. Jefferies intends to access the capital markets and issue debt securities from time to time; and a decrease in Jefferies credit rating would not only increase its borrowing costs, but could also decrease demand for its debt securities and make a successful financing more difficult. In addition, in connection with certain over-the-counter derivative contract arrangements and certain other trading arrangements, Jefferies may be required to provide additional collateral to counterparties, exchanges and clearing organizations in the event of a credit rating downgrade. Such a downgrade could also negatively impact Jefferies bond prices and our stock price. There can be no assurance that Jefferies credit ratings will not be downgraded by credit-rating agencies.
Jefferies principal trading and investments expose us to risk of loss. A considerable portion of Jefferies revenues is derived from trading in which Jefferies acts as principal. Jefferies may incur trading losses relating to the purchase, sale or short sale of fixed income, high yield, international, convertible, and equity securities and futures and commodities for its own account. In any period, Jefferies may experience losses on its inventory positions as a result of price fluctuations, lack of trading volume, and illiquidity. From time to time, Jefferies may engage in a large block trade in a single security or maintain large position concentrations in a single security, securities of a single issuer, securities of issuers engaged in a specific industry, or securities from issuers located in a particular country or region. In general, because Jefferies inventory is marked to market on a daily basis, any adverse price movement in these securities could result in a reduction of Jefferies revenues and profits. In addition, Jefferies may engage in hedging transactions that if not successful, could result in losses.
Increased competition may adversely affect Jefferies revenues, profitability and staffing. All aspects of Jefferies business are intensely competitive. Jefferies competes directly with a number of bank holding companies and commercial banks, other brokers and dealers, investment banking firms and other financial institutions. In addition to competition from firms currently in the securities business, there has been increasing competition from others offering financial services, including automated trading and other services based on technological innovations. Jefferies believes that the principal factors affecting competition involve market focus, reputation, the abilities of professional personnel, the ability to execute the transaction, relative price of the service and products being offered, bundling of products and services and the quality of service. Increased competition or an adverse change in Jefferies competitive position could lead to a reduction of business and therefore a reduction of revenues and profits.
15
Competition also extends to the hiring and retention of highly skilled employees. A competitor may be successful in hiring away an employee or group of employees, which may result in Jefferies losing business formerly serviced by such employee or employees. Competition can also raise Jefferies costs of hiring and retaining the employees Jefferies needs to effectively operate its business.
Operational risks may disrupt Jefferies business, result in regulatory action or limit growth. Jefferies businesses are highly dependent on its ability to process, on a daily basis, a large number of transactions across numerous and diverse markets in many currencies, and the transactions Jefferies processes have become increasingly complex. If any of Jefferies financial, accounting or other data processing systems do not operate properly or are disabled or if there are other shortcomings or failures in Jefferies internal processes, people or systems, Jefferies could suffer an impairment to our liquidity, financial loss, a disruption of our businesses, liability to clients, regulatory intervention or reputational damage. These systems may fail to operate properly or become disabled as a result of events that are wholly or partially beyond Jefferies control, including a disruption of electrical or communications services or Jefferies inability to occupy one or more of our buildings. The inability of Jefferies systems to accommodate an increasing volume of transactions could also constrain its ability to expand its businesses.
Jefferies also faces the risk of operational failure or termination of any of the clearing agents, exchanges, clearing houses or other financial intermediaries Jefferies uses to facilitate its securities transactions. Any such failure or termination could adversely affect Jefferies ability to effect transactions and manage its exposure to risk.
In addition, despite the contingency plans Jefferies has in place, Jefferies ability to conduct business may be adversely impacted by a disruption in the infrastructure that supports its businesses and the communities in which they are located. This may include a disruption involving electrical, communications, transportation or other services used by Jefferies or third parties with which Jefferies conducts business.
Jefferies operations rely on the secure processing, storage and transmission of confidential and other information in its computer systems and networks. Although Jefferies take protective measures and endeavor to modify them as circumstances warrant, its computer systems, software and networks may be vulnerable to unauthorized access, computer viruses or other malicious code, and other events that could have a security impact. If one or more of such events occur, this potentially could jeopardize Jefferies or its clients' or counterparties' confidential and other information processed and stored in, and transmitted through, Jefferies computer systems and networks, or otherwise cause interruptions or malfunctions in Jefferies, its clients', its counterparties' or third parties' operations. Jefferies may be required to expend significant additional resources to modify its protective measures or to investigate and remediate vulnerabilities or other exposures, and Jefferies may be subject to litigation and financial losses that are either not insured against or not fully covered through any insurance.
Jefferies international operations are subject to numerous risks which could adversely impact Jefferies business in many ways. Jefferies business and operations are expanding globally. Wherever Jefferies operates, it is subject to legal, regulatory, political, economic and other inherent risks. The laws and regulations applicable to the securities and investment banking industries differ in each country. Jefferies inability to remain in compliance with applicable laws and regulations in a particular country could have a significant and negative effect on its business and prospects in that country as well as in other countries. A political, economic or financial disruption in a country or region could adversely impact Jefferies business and increase volatility in financial markets generally.
Legal liability may harm Jefferies business. Many aspects of Jefferies business involve substantial risks of liability, and in the normal course of business, Jefferies has been named as a defendant or codefendant in lawsuits involving primarily claims for damages. The risks associated with potential legal liabilities often may be difficult to assess or quantify and their existence and magnitude often remain unknown for substantial periods of time. The expansion of Jefferies business, including increases in the number and size of investment banking transactions and Jefferies expansion into new areas impose greater risks of liability. In addition, unauthorized or illegal acts of Jefferies employees could result in substantial liability. Substantial legal liability could have a material adverse financial effect or cause Jefferies significant reputational harm, which in turn could seriously harm Jefferies business and prospects.
Jefferies business is subject to significant credit risk. In the normal course of Jefferies businesses, Jefferies is involved in the execution, settlement and financing of various customer and principal securities and derivative transactions. These activities are transacted on a cash, margin or delivery-versus-payment basis and are subject to the risk of counterparty or customer nonperformance. Although transactions are generally collateralized by the underlying security or other securities, Jefferies still faces the risks associated with changes in the market value of the collateral through settlement date or during the time when margin is extended and the risk of counterparty nonperformance to the extent collateral has not been secured or the counterparty defaults before collateral or margin can be adjusted. Jefferies may also incur credit risk in its derivative transactions to the extent such transactions result in uncollateralized credit exposure to counterparties.
16
Jefferies seeks to control the risk associated with these transactions by establishing and monitoring credit limits and by monitoring collateral and transaction levels daily. Jefferies may require counterparties to deposit additional collateral or return collateral pledged. In the case of aged securities failed to receive, Jefferies may, under industry regulations, purchase the underlying securities in the market and seek reimbursement for any losses from the counterparty. However, there can be no assurances that Jefferies risk controls will be successful.
Derivative transactions may expose Jefferies to unexpected risk and potential losses. Jefferies is party to a number of derivative transactions that require it to deliver to the counterparty the underlying security, loan or other obligation in order to receive payment. In a number of cases, Jefferies does not hold the underlying security, loan or other obligation and may have difficulty obtaining, or be unable to obtain, the underlying security, loan or other obligation through the physical settlement of other transactions. As a result, Jefferies is subject to the risk that it may not be able to obtain the security, loan or other obligation within the required contractual time frame for delivery. This could cause Jefferies to forfeit the payments due to it under these contracts or result in settlement delays with the attendant credit and operational risk as well as increased costs to the firm.
The prices and availability of key raw materials affects the profitability of our beef processing and manufacturing operations. The supply and market price of cattle purchased by National Beef are dependent upon a variety of factors over which National Beef has no control, including fluctuations in the size of herds maintained by producers, the relative cost of feed and energy, weather and livestock diseases. A decline in the supply of fed cattle available for National Beef's Brawley facility was a key factor in the decision to close the plant. The cost of raw materials used by our manufacturing businesses has increased as a result of a variety of factors, including increased foreign demand. Although our manufacturing subsidiaries are not currently experiencing any shortage of raw materials, if the subsidiaries experience shortages, revenues and profitability could decline.
Outbreaks of disease affecting livestock can adversely affect the supply of cattle and the demand for National Beef's products. National Beef is subject to risks relating to animal health and disease control. An outbreak of disease affecting livestock (such as foot-and-mouth disease or bovine spongiform encephalopathy ("BSE"), commonly referred to as mad cow disease) could result in restrictions on sales of products, restrictions on purchases of livestock from suppliers or widespread destruction of cattle. The discovery of BSE in the past caused certain countries to restrict or prohibit the importation of beef products. Outbreaks of diseases, or the perception by the public that an outbreak has occurred, or other concerns regarding diseases, can lead to inadequate supply, cancellation of orders by customers and create adverse publicity, any of which can have a significant negative impact on consumer demand and, as a result, on our consolidated financial position, cash flows and results of operations.
If National Beef's products or products made by others using its products become contaminated or are alleged to be contaminated, National Beef may be subject to product liability claims that could adversely affect its business. National Beef may be subject to significant liability in excess of insurance policy limits if its products or products made by others using its products causes injury, illness or death. In addition, National Beef could recall or be required to recall products that are, or are alleged to be, contaminated, spoiled or inappropriately labeled. Organisms producing food borne illnesses (such as E. coli ) could be present in National Beef's products and result in illness or death if they are not eliminated through further processing or cooking. Contamination of National Beef's or its competitors' products may create adverse publicity or cause consumers to lose confidence in the safety and quality of beef products. Allegations of product contamination may also be harmful even if they are untrue or result from third-party tampering. Any of these events may increase costs or decrease demand for beef products, any of which could have a significant adverse effect on our consolidated financial condition, cash flows and results of operations.
National Beef generally does not enter into long-term contracts with customers; as a result the volumes and prices at which beef products are sold are subject to market forces. National Beef's customers generally place orders for products on an as-needed basis and, as a result, their order levels have varied from period to period in the past and may vary significantly in the future. The loss of one or more significant customers, a significant decline in the volume of orders from customers or a significant decrease in beef product prices for a sustained period of time could negatively impact cash flows and results of operations.
17
National Beef's international operations expose it to political and economic risks in foreign countries, as well as to risks related to currency fluctuations. Approximately 13% of National Beef's annual sales are export sales, primarily to Mexico, Japan, South Korea, Canada, China (for hides), Hong Kong, and Taiwan, and on average these sales have a higher margin than domestic sales of similar products. A reduction in international sales could adversely affect revenues and margins. Risks associated with international activities include inflation or deflation and changes in foreign currency exchange rates, including changes in currency exchange rates of other countries that may export beef products in competition with National Beef; the closing of borders by foreign countries to product imports due to disease or other perceived health or food safety issues; exchange controls; changes in tariffs; changes in political or economic conditions; trade restrictions and changes in regulatory requirements. The occurrence of any of these events could increase costs, lower demand for products or limit operations, which could have a significant adverse effect on cash flows, results of operations and future prospects.
National Beef incurs substantial costs to comply with environmental regulations and could incur additional costs as a result of new regulations or compliance failures that result in civil or criminal penalties, liability for damages and negative publicity. National Beef's operations are subject to extensive and increasingly stringent environmental regulations administered by the EPA and state, local and other authorities with regards to water usage, wastewater and storm water discharge, air emissions and odor, and waste management and disposal. Failure to comply with these laws and regulations could have serious consequences, including criminal, civil and administrative penalties and negative publicity. In addition, National Beef incurs and will continue to incur significant capital and operating expenditures to comply with existing and new or more stringent regulations and requirements. All of National Beef's processing facilities procure wastewater treatment services from municipal or other regional governmental agencies that are in turn subject to environmental laws and permit limits regarding their water discharges. As permit limits are becoming more stringent, upgrades and capital improvements to these municipal treatment facilities are likely. In locations where National Beef is a significant volume discharger, it could be asked to contribute toward the costs of such upgrades or to pay significantly increased water or sewer charges to recoup such upgrade costs. National Beef may also be required to undertake upgrades and make capital improvements to its own wastewater pretreatment facilities, the cost of which could be significant. Compliance with environmental regulations has had and will continue to have a significant impact on National Beef's cash flows and profitability. In addition, under most environmental laws, most notably the Comprehensive Environmental Response, Compensation and Liability Act ("CERCLA") and analogous state laws, National Beef could be held liable for the cost to investigate or remediate any contamination at properties it owns or operates, or as to which it arranges for the disposal or treatment of hazardous substances, as such liability is imposed without regard to fault.
Failure to replace Walmart's consumer-ready business would have a significant adverse effect on National Beef's sales and profitability. Sales to Walmart represented approximately 10% of National Beef's total net sales during 2012. Walmart discontinued using National Beef as a provider of its consumer-ready products in 2013. Total consumer-ready revenues were approximately 7% of National Beef consolidated revenues during 2012, but as a value-added product, consumer-ready products have historically constituted a higher percentage of National Beef's gross margin. Since 2008, consumer-ready products have represented from 10% to 26% of National Beef's total gross margin, and were at the higher end of that range in 2012 due, in part, to reduced gross margin from other National Beef products. National Beef is currently pursuing replacement business for its consumer-ready facilities; however, it may not be able to fully replace the operating cash flow generated by these facilities.
National Beef is subject to extensive governmental regulation and noncompliance with or changes in applicable requirements could adversely affect its business, financial condition, cash flows and results of operations. National Beef's operations are subject to extensive regulation and oversight by the USDA, including its FSIS and GIPSA agencies, the FDA, and other federal, state, local and foreign authorities regarding the processing, packaging, storage, safety, distribution, advertising and labeling of its products. Recently, food safety practices and procedures in the meat processing industry have been subject to more intense scrutiny and oversight by the USDA. National Beef is also subject to a variety of immigration, labor and worker safety laws and regulations, including those relating to the hiring and retention of employees. Failure to comply with existing or new laws and regulations could result in administrative penalties and injunctive relief, civil remedies, fines, interruption of operations, recalls of products or seizures of properties, potential criminal sanctions and personal injury or other damage claims. These remedies, changes in the applicable laws and regulations or discovery of currently unknown conditions could increase costs, limit business operations and reduce profitability.
18
National Beef's performance depends on favorable labor relations with its employees, in particular employees represented by collective bargaining agreements . A substantial number of National Beef's employees are covered by collective bargaining agreements. A labor-related work stoppage by unionized employees, or employees who become unionized in the future, could limit National Beef's ability to process and ship products or could increase costs. Any significant increase in labor costs, deterioration of employee relations, slowdowns or work stoppages at any of National Beef's locations, whether due to union activities, employee turnover or otherwise, could have a material adverse effect on our financial condition, cash flows and results of operations.
Declines in the U.S. housing market have reduced revenues and profitability of our manufacturing businesses and may continue to do so. Our manufacturing operations have generated significant revenues when the U.S. housing market was strong. The weak U.S. housing market during the last few years has resulted in fewer new housing starts, which has adversely impacted revenues and profitability of our manufacturing businesses. Our manufacturing operations do not expect to return to prior levels of profitability until the U.S. housing market recovers.
The Hard Rock Biloxi is dependent upon patronage of persons living in the Gulf Coast region. The Hard Rock Biloxi primarily seeks to attract patrons from its local geographic area. Downturns in local and regional economic conditions, an increase in competition in the surrounding area and interruptions caused by hurricanes could negatively impact operating results.
We may not be able to insure certain risks economically. We cannot be certain that we will be able to insure all risks that we desire to insure economically or that all of our insurers or reinsurers will be financially viable if we make a claim. If an uninsured loss or a loss in excess of insured limits should occur, or if we are required to pay a deductible for an insured loss, results of operations could be adversely affected. Our gaming entertainment facility has been severely damaged by hurricanes in the past, and it is possible that storms could cause significant damage in the future. Damages from storms could result in the closing of our facilities to make repairs, resulting in lost business and adversely affecting results of operations.
Increases in mortgage interest rate levels, the lack of available consumer credit and the depressed real estate market have reduced and may continue to reduce consumer demand for certain of our real estate development projects and result in impairment charges. Due to current depressed economic conditions in the national real estate market, most of our real estate development projects are not being marketed for sale. If we begin to market our development projects in the future, the ability to successfully attract customers will be highly dependent upon consumers' ability to finance real estate purchases with affordable loans. If our estimates of future cash flows for our development projects are less than the carrying amounts, impairment charges would have to be recorded.
We have incurred costs to investigate and evaluate the development of a number of large scale energy projects; however, development of these projects is subject to obtaining significant third-party debt and equity financing, regulatory approvals, the procurement of purchase commitments for long-term supplies of feedstock and securing long-term commitments from purchasers of the output. Although we have spent significant amounts investigating large scale energy projects, we will not be able to develop these projects without financing from other sources, various regulatory approvals and commitments from third-parties. The timing of the commencement of construction of any project is also dependent upon the receipt of financing and regulatory approvals. If we are unable to obtain such financing, approvals or commitments, or alternatively we are unable to monetize a partly or fully permitted project, we will not be able to recover our investment.
If Berkadia does not maintain certain specified ratings from the credit rating agencies it could lose its mortgage servicing rights. Berkadia is required to maintain specified servicer ratings from the credit rating agencies, and failure to do so would give its customers the right to terminate their mortgage servicing agreements. If mortgage servicing agreements were terminated as a result of a servicer ratings downgrade, we could lose our entire equity investment.
When Berkadia originates loans for Fannie Mae, it is often required to share in the losses on such loans, which could be in excess of reserved amounts. Berkadia carries a reserve on its balance sheet for contingent losses on loans originated for Fannie Mae that have loss sharing requirements. If actual losses exceed amounts reserved, Berkadia's profitability and cash flows will be reduced.
19
The loss of or changes in Berkadia's relationships with U.S. Government-Sponsored Enterprises and federal agencies would have an adverse effect on Berkadia's business. Berkadia's failure to comply with U.S. Government-Sponsored Enterprise or agency requirements may result in its termination as an approved seller/servicer, mortgagee or issuer. The loss of any such status could have a significant adverse impact on Berkadia's results of operations, could result in a loss of similar approvals from other U.S. Government-Sponsored Enterprises or federal agencies and could have other adverse consequences to the business. Fannie Mae and Freddie Mac retain broad discretion to terminate Berkadia as a seller/servicer without cause upon notice.
Changes in existing government-sponsored and federal mortgage programs could negatively affect Berkadia's business. Berkadia's ability to generate income through mortgage sales to institutional investors depends in part on programs sponsored by Fannie Mae, Freddie Mac and the FHA, which purchase such loans from Berkadia and/or facilitate the issuance of mortgage-backed securities in the secondary market. The federal government has announced that the continuation of these programs is under review, and that any or all of the government agency programs could be substantially modified or eliminated in the future. Any discontinuation of, or significant reduction or change in, the operation of those programs would have an adverse effect on Berkadia's loan origination and servicing business and results of operations.
Berkadia's special servicing and fee-for-service businesses may be terminated on short notice. Special servicing for each CMBS transaction is usually controlled by the subordinated bond holder class of the securitization. The owners of the subordinated bonds may change from time to time, and subordinated bond holders may replace Berkadia with a different special servicer. Fee-for-service customers are permitted to terminate Berkadia on short notice, usually 30 days. If Berkadia loses special servicing rights or is terminated by fee-for-service customers, it would negatively impact Berkadia's results of operations and cash flows.
CMBS loan and Bridge loan programs will expose Berkadia to credit and interest rate risk that it is not subject to with its government agency lending programs. Unlike its government agency lending programs, Berkadia cannot be assured it will be able to sell CMBS and Bridge loans at par value to a third-party without any exposure to credit or interest rate risk. If for any reason Berkadia is unable to sell a CMBS loan into the securitization market or if a borrower is unable to refinance a Bridge loan, Berkadia will retain all risks associated with such loan for as long as it owns the loan. Berkadia may be forced to foreclose on defaulted loans and suffer a loss, or to sell loans to a third party at a discount, either of which would reduce Berkadia's profitability and cash flows.
If Berkadia suffered significant losses and was unable to repay its commercial paper borrowings, we would be exposed to loss pursuant to a reimbursement obligation to Berkshire Hathaway. Berkadia obtains funds generated by commercial paper sales of an affiliate of Berkadia. All of the proceeds from the commercial paper sales are used by Berkadia to fund new mortgage loans, servicer advances, investments and other working capital requirements. Repayment of the commercial paper is supported by a $2.5 billion surety policy issued by a Berkshire Hathaway insurance subsidiary and corporate guaranty, and we have agreed to reimburse Berkshire Hathaway for one-half of any losses incurred thereunder. If Berkadia suffers significant losses and is unable to repay its commercial paper borrowings, we would suffer losses to the extent of its reimbursement obligation to Berkshire Hathaway. As of December 31, 2013, the aggregate amount of commercial paper outstanding was $2.47 billion.
Berkadia's business is significantly affected by general economic conditions, particularly in the commercial real estate industry, and could be harmed in the event of a continued economic slowdown, prolonged recession or other market downturn or disruption. Berkadia's business and earnings are sensitive to changes in government policies and regulations, changes in interest rates, inflation, deflation, oversupply of real estate properties, fluctuations in the real estate and debt capital markets and developments in national and local economies. Unfavorable economic conditions could have an adverse effect on Berkadia's business, including decreasing the demand for new loans and the servicing of loans originated by third parties.
Garcadia's business is dependent, in part, upon revenue from new and used car sales at its dealerships, and declines in revenues due to industry or other factors could result in reduced profitability, reduced cash flows and/or impairment charges. Garcadia has recorded impairment charges in the past, principally for goodwill and other intangible assets, and if the automobile industry experiences a downturn in the future additional impairment charges are likely, reducing our profitability.
20
From time to time we may invest in illiquid securities that are subject to standstill agreements or are otherwise restricted. From time to time we may invest in securities that are subject to restrictions which prohibit us from selling the subject securities for a period of time. Although we are not a party to any such agreement currently should we enter into these agreements in the future and need to generate liquidity quickly, such agreements would limit our ability to dispose of the underlying investment while the agreement is effective.
We operate in a variety of industries and market sectors, all of which are very competitive and susceptible to economic downturns and have been adversely affected by recent economic conditions. We operate in industries that sell commodity products and services, including beef processing and manufacturing, which are very competitive with product pricing often being the most significant factor to customers. Certain industries have seen a consolidation of the customer base, which tends to increase competition and pricing pressure. In addition, starting in 2008, the recession and general economic conditions have adversely affected operating results in all of our businesses, which is likely to continue until the economy fully recovers. The performance of our business units during this period has resulted in lower valuations for our business units, and a worsening of general economic or market conditions could result in a further deterioration in the values of our businesses or investments.
Recent economic conditions have adversely affected most of our operations and investments. A worsening of current economic conditions could cause a decline in estimated future cash flows expected to be generated by certain of our operations and investments, potentially resulting in impairment charges for long-lived assets. Certain of our operating businesses and investments have significant investments in long-lived assets, in particular beef processing, manufacturing and gaming entertainment. Recent economic conditions have resulted in declining revenues for certain of these operations and their property and equipment is not being fully utilized. As required, we review certain of these assets and investments for potential impairment, and except as otherwise disclosed have not concluded that the book values of these long-lived assets are not recoverable. If the operating revenues of these businesses deteriorate in the future, and/or we lower our estimates of future cash flows, impairment charges might have to be recorded.
We could experience significant increases in operating costs and reduced profitability due to competition for skilled management and staff employees in our operating businesses. We compete with many other entities for skilled management and staff employees, including entities that operate in different market sectors than us. Costs to recruit and retain adequate personnel could adversely affect results of operations.
Extreme weather, loss of electrical power or other forces beyond our control could negatively impact our business. Natural disasters, fire, terrorism, pandemic or extreme weather, including droughts, floods, excessive cold or heat, hurricanes or other storms, could interfere with our operating businesses due to power outages, fuel shortages, water shortages, damage to facilities or disruption of transportation channels, among other things. Any of these factors, as well as disruptions to information systems, could have an adverse effect on financial results.
We rely on the security of our information technology systems and those of our third party providers to protect our proprietary information and information of our customers. Some of our businesses involve the storage and transmission of customers' personal information, consumer preferences and credit card information. While we believe that we have implemented protective measures to effectively secure information and prevent security breaches, our information technology systems may be vulnerable to unauthorized access, computer hacking, computer viruses or other unauthorized attempts by third parties to access the proprietary information of our customers. Information technology breaches and failures could disrupt our ability to function in the normal course of business resulting in lost revenue, the disclosure or modification of sensitive or confidential information and the incurrence of remediation costs, resulting in legal and financial exposure. Moreover, loss of confidential customer identification information could harm our reputation and subject us to liability under laws that protect confidential personal data, resulting in increased costs or loss of revenues.
From time to time we are subject to litigation, for which we may be unable to accurately assess our level of exposure and which if adversely determined, may have a significant adverse effect on our consolidated financial condition or results of operations. We and our subsidiaries are or may become parties to legal proceedings that are considered to be either ordinary, routine litigation incidental to our business or not significant to our consolidated financial position or liquidity. Although our current assessment is that, other than as disclosed in this report, there is no pending litigation that could have a significant adverse impact, if our assessment proves to be in error, then the outcome of litigation could have a significant impact on our financial statements.
21
We may not be able to generate sufficient taxable income to fully realize our deferred tax asset, which would also have to be reduced if U.S. federal income tax rates are lowered. At December 31, 2013, we have recognized a net deferred tax asset of $1.8 billion. If we are unable to generate sufficient taxable income, we will not be able to fully realize the recorded amount of the net deferred tax asset. If we are unable to generate sufficient taxable income prior to the expiration of our federal income tax net operating loss carryforwards ("NOLs"), the NOLs would expire unused. Our projections of future taxable income required to fully realize the recorded amount of the net deferred tax asset reflect numerous assumptions about our operating businesses and investments, and are subject to change as conditions change specific to our business units, investments or general economic conditions. Changes that are adverse to us could result in the need to increase the deferred tax asset valuation allowance resulting in a charge to results of operations and a decrease to total stockholders' equity. In addition, if U.S. federal income tax rates are lowered, we would be required to reduce our net deferred tax asset with a corresponding reduction to earnings during the period.
If our tax filing positions were to be challenged by federal, state and local or foreign tax jurisdictions, we may not be wholly successful in defending our tax filing positions. We record reserves for unrecognized tax benefits based on our assessment of the probability of successfully sustaining tax filing positions. Management exercises significant judgment when assessing the probability of successfully sustaining tax filing positions, and in determining whether a contingent tax liability should be recorded and if so estimating the amount. If our tax filing positions are successfully challenged, payments could be required that are in excess of reserved amounts or we may be required to reduce the carrying amount of our net deferred tax asset, either of which result could be significant to our Consolidated Statement of Financial Condition or results of operations.
We have indicated our intention to pay dividends at the annual rate of $0.25 per common share, on a quarterly basis. The payment of dividends in the future is subject to the discretion of the Board of Directors and will depend upon general business conditions, legal and contractual restrictions on the payment of dividends and other factors that the Board of Directors may deem to be relevant.
Our common shares are subject to transfer restrictions. We and certain of our subsidiaries have significant NOLs and other tax attributes, the amount and availability of which are subject to certain qualifications, limitations and uncertainties. In order to reduce the possibility that certain changes in ownership could result in limitations on the use of the tax attributes, our certificate of incorporation contains provisions that generally restrict the ability of a person or entity from acquiring ownership (including through attribution under the tax law) of 5% or more of our common shares and the ability of persons or entities now owning 5% or more of our common shares from acquiring additional common shares. The restriction will remain until the earliest of (a) December 31, 2024, (b) the repeal of Section 382 of the Internal Revenue Code (or any comparable successor provision) and (c) the beginning of a taxable year to which these tax benefits may no longer be carried forward. The restriction may be waived by our Board of Directors on a case by case basis. Shareholders are advised to carefully monitor their ownership of our common shares and consult their own legal advisors and/or us to determine whether their ownership of our common shares approaches the proscribed level.
Item 1B . | Unresolved Staff Comments . |
Not applicable.
Item 2 . Properties .
Our and Jefferies global executive offices and principal administrative offices are located at 520 Madison Avenue, New York, New York under an operating lease arrangement. Jefferies maintains additional offices in over 30 cities throughout the world including, in the United States, Charlotte, Chicago, Boston, Houston, Los Angeles, San Francisco, Stamford, and Jersey City, and internationally, London, Frankfurt, Milan, Paris, Zurich, Hong Kong, Singapore, Tokyo and Mumbai. In addition, Jefferies maintains backup data center facilities with redundant technologies for each of its three main data center hubs in Jersey City, London and Hong Kong. Jefferies leases all of its office space, or contract via service arrangement, which management believes is adequate for its business.
National Beef's processing facilities, which are the principal properties used in its business, are described in Item 1 of this report. National Beef also leases corporate office space in Kansas City, Missouri (26,400 square feet) for its headquarters facility.
22
Conwed Plastics manufacturing facilities and Idaho Timber's plants and sawmills, which are the principal properties used in their businesses, are described in Item 1 of this report.
We lease numerous other manufacturing, warehousing, office and headquarters facilities. The facilities vary in size and have leases expiring at various times, subject, in certain instances, to renewal options. See Note 27 to our consolidated financial statements.
Item 3 . Legal Proceedings .
The information set forth in response to this Item 3 is incorporated by reference from the "Contingencies" section in Note 27, Commitments, Contingencies and Guarantees, in the notes to consolidated financial statements in Item 8 of Part II of this report, which is incorporated herein by reference.
Item 4 . Mine Safety Disclosures .
Not applicable.
23
PART II
Item 5 . | Market for Registrant's Common Equity, Related Stockholder Matters and Issuer Purchases of Equity Securities . |
Our common shares are traded on the NYSE under the symbol LUK. The following table sets forth, for the calendar periods indicated, the high and low sales price per common share on the consolidated transaction reporting system, as reported by the Bloomberg Professional Service provided by Bloomberg L.P.
Common Share | ||||||||
High | Low | |||||||
2012 | ||||||||
First Quarter | $ | 28.98 | $ | 22.66 | ||||
Second Quarter | 25.61 | 19.05 | ||||||
Third Quarter | 23.48 | 19.87 | ||||||
Fourth Quarter | 23.69 | 19.45 | ||||||
2013 | ||||||||
First Quarter | $ | 27.57 | $ | 22.98 | ||||
Second Quarter | 32.43 | 24.70 | ||||||
Third Quarter | 28.75 | 24.80 | ||||||
Fourth Quarter | 29.56 | 26.82 | ||||||
2014 | ||||||||
First Quarter (through February 14, 2014) | $ | 28.72 | $ | 26.04 | ||||
As of February 14, 2014, there were approximately 2,084 record holders of the common shares.
We paid cash dividends of $.0625 per share each quarter during 2013 and $0.25 per common share annually in 2012 and 2011. We have indicated our intention to pay dividends at the annual rate of $0.25 per common share on a quarterly basis. The payment of dividends in the future is subject to the discretion of the Board of Directors and will depend upon general business conditions, legal and contractual restrictions on the payment of dividends and other factors that the Board of Directors may deem to be relevant.
Certain of our subsidiaries have significant NOLs and other tax attributes, the amount and availability of which are subject to certain qualifications, limitations and uncertainties. In order to reduce the possibility that certain changes in ownership could result in limitations on the use of our tax attributes, our certificate of incorporation contains provisions which generally restrict the ability of a person or entity from acquiring ownership (including through attribution under the tax law) of five percent or more of the common shares and the ability of persons or entities now owning five percent or more of the common shares from acquiring additional common shares. The restrictions will remain in effect until the earliest of (a) December 31, 2024, (b) the repeal of Section 382 of the Internal Revenue Code (or any comparable successor provision) or (c) the beginning of a taxable year to which these tax benefits may no longer be carried forward.
24
The following table presents information on our purchases of our common shares during the three months ended December 31, 2013:
Total Number of Shares Purchased (1) | Average Price Paid per Share | Total Number of Shares Purchased as Part of Publicly Announced Plans or Programs (2) | Maximum Number of Shares that May Yet Be Purchased Under the Plans or Programs | |||||||||||||
October 2013 | 89,083 | $ | 28.29 | – | 25,000,000 | |||||||||||
November 2013 | 3,057 | $ | 28.14 | – | 25,000,000 | |||||||||||
December 2013 | 220,587 | $ | 27.92 | – | 25,000,000 | |||||||||||
Total | 312,727 | – | ||||||||||||||
(1) | Represents an aggregate of 312,727 shares repurchased other than as part of our publicly announced Board authorized repurchase program. We repurchased these securities in connection with our share compensation plans which allow participants to use shares to satisfy certain tax liabilities arising from the vesting of restricted shares and the distribution of restricted share units. The total number of shares purchased does not include unvested shares forfeited back to us pursuant to the terms of our share compensation plans. |
(2) | In November 2012, our Board of Directors authorized the repurchase, from time to time, of up to an aggregate of 25,000,000 of our common shares, inclusive of prior authorizations. |
There were no unregistered sales of equity securities during the period covered by this report.
Stockholder Return Performance Graph
Set forth below is a graph comparing the cumulative total stockholder return on our common shares against the cumulative total return of the Standard & Poor's 500 Stock Index and the Standard & Poor's 1500 Industrial Conglomerates Index for the period commencing December 31, 2008 to December 31, 2013. Index data was furnished by Standard & Poor's Capital IQ. The graph assumes that $100 was invested on December 31, 2008 in each of our common stock, the S&P 500 Index, and the S&P 1500 Industrial Conglomerates Index and that all dividends were reinvested.
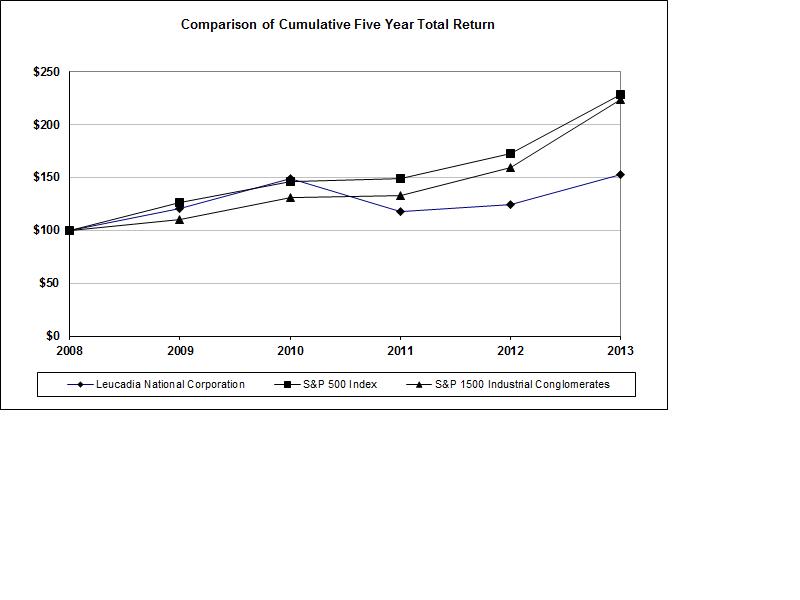
25
Item 6 . | Selected Financial Data . |
The following selected financial data have been summarized from our consolidated financial statements and are qualified in their entirety by reference to, and should be read in conjunction with, such consolidated financial statements and Item 7, Management's Discussion and Analysis of Financial Condition and Results of Operations of this report.
Year Ended December 31, | ||||||||||||||||||||
2013 | 2012 | 2011 | 2010 | 2009 | ||||||||||||||||
(In thousands, except per share amounts) | ||||||||||||||||||||
SELECTED INCOME STATEMENT DATA: (a) | ||||||||||||||||||||
Net revenues (b) | $ | 10,429,491 | $ | 9,405,332 | $ | 642,631 | $ | 1,429,957 | $ | 1,252,329 | ||||||||||
Expenses | 10,076,489 | 8,075,699 | 609,321 | 678,120 | 672,472 | |||||||||||||||
Income from continuing operations before income taxes | 472,043 | 1,418,282 | 95,323 | 785,413 | 539,350 | |||||||||||||||
Income tax provision (benefit) (c) | 110,741 | 531,153 | 62,398 | (1,142,943 | ) | 32,592 | ||||||||||||||
Income from continuing operations (c) | 361,302 | 887,129 | 32,925 | 1,928,356 | 506,758 | |||||||||||||||
Income (loss) from discontinued operations, including gain (loss) on disposal, net of taxes | 891 | (22,488 | ) | (7,969 | ) | 11,880 | 41,837 | |||||||||||||
Net income attributable to Leucadia National | ||||||||||||||||||||
Corporation common shareholders | 369,240 | 854,466 | 25,231 | 1,939,312 | 550,280 | |||||||||||||||
Per share: | ||||||||||||||||||||
Basic earnings (loss) per common share attributable | ||||||||||||||||||||
to Leucadia National Corporation common shareholders: | ||||||||||||||||||||
Income from continuing operations | $ | 1.06 | $ | 3.58 | $ | .13 | $ | 7.92 | $ | 2.10 | ||||||||||
Income (loss) from discontinued operations, including gain (loss) on disposal | .01 | (.09 | ) | (.03 | ) | .05 | .18 | |||||||||||||
Net income | $ | 1.07 | $ | 3.49 | $ | .10 | $ | 7.97 | $ | 2.28 | ||||||||||
Diluted earnings (loss) per common share attributable | ||||||||||||||||||||
to Leucadia National Corporation common shareholders: | ||||||||||||||||||||
Income from continuing operations | $ | 1.06 | $ | 3.53 | $ | .13 | $ | 7.80 | $ | 2.07 | ||||||||||
Income (loss) from discontinued operations, including gain (loss) on disposal | – | (.09 | ) | (.03 | ) | .05 | .18 | |||||||||||||
Net income | $ | 1.06 | $ | 3.44 | $ | .10 | $ | 7.85 | $ | 2.25 | ||||||||||
At December 31, | ||||||||||||||||||||
2013 | 2012 | 2011 | 2010 | 2009 | ||||||||||||||||
(In thousands, except per share amounts) | ||||||||||||||||||||
SELECTED BALANCE SHEET DATA: (a) | ||||||||||||||||||||
Total assets | $ | 47,866,781 | $ | 9,349,118 | $ | 9,263,189 | $ | 9,350,298 | $ | 6,762,364 | ||||||||||
Long-term debt – parent company | 1,541,014 | 954,941 | 1,470,174 | 1,546,629 | 1,622,398 | |||||||||||||||
Long-term debt – subsidiaries | 6,639,851 | 403,754 | 433,479 | 133,477 | 146,020 | |||||||||||||||
Mezzanine equity | 366,075 | 241,649 | 235,909 | – | – | |||||||||||||||
Shareholders' equity | 10,102,462 | 6,767,268 | 6,174,396 | 6,956,758 | 4,361,647 | |||||||||||||||
Book value per common share | $ | 27.71 | $ | 27.67 | $ | 25.24 | $ | 28.53 | $ | 17.93 | ||||||||||
Cash dividends per common share | $ | .25 | $ | .25 | $ | .25 | $ | .25 | $ | – | ||||||||||
(a) | Subsidiaries are reflected above as consolidated entities from the date of acquisition. Jefferies was acquired on March 1, 2013. National Beef was acquired on December 30, 2011; however, since its operating activities subsequent to the acquisition during 2011 were not significant they were not included in the 2011 Consolidated Statement of Operations. For additional information, see Note 4 to our consolidated financial statements. |
(b) | Includes net securities gains (losses) of $244.0 million, $590.6 million, $641.5 million, $179.5 million and $(21.1) million for the years ended December 31, 2013, 2012, 2011, 2010 and 2009, respectively. |
(c) | At December 31, 2010, we concluded that it was more likely than not that we would be able to realize a portion of the net deferred tax asset; accordingly, $1.157 million of the deferred tax valuation allowance was reversed as a credit to income tax expense. |
26
Item 7 . | Management's Discussion and Analysis of Financial Condition and Results of Operations . |
The purpose of this section is to discuss and analyze our consolidated financial condition, liquidity and capital resources and results of operations. This analysis should be read in conjunction with the consolidated financial statements and related footnote disclosures contained in this report and the following "Cautionary Statement for Forward-Looking Information."
Cautionary Statement for Forward-Looking Information
Statements included in this report may contain forward-looking statements. Such statements may relate, but are not limited, to projections of revenues, income or loss, development expenditures, plans for growth and future operations, competition and regulation, as well as assumptions relating to the foregoing. Such forward-looking statements are made pursuant to the safe-harbor provisions of the Private Securities Litigation Reform Act of 1995.
Forward-looking statements are inherently subject to risks and uncertainties, many of which cannot be predicted or quantified. When used in this report, the words "will," "could," "estimates," "expects," "anticipates," "believes," "plans," "intends" and variations of such words and similar expressions are intended to identify forward-looking statements that involve risks and uncertainties. Future events and actual results could differ materially from those set forth in, contemplated by or underlying the forward-looking statements.
Factors that could cause actual results to differ materially from any results projected, forecasted, estimated or budgeted or may materially and adversely affect our actual results include, but are not limited to, those set forth in Item 1A. Risk Factors and elsewhere in this report and in our other public filings with the SEC.
Undue reliance should not be placed on these forward-looking statements, which are applicable only as of the date hereof. We undertake no obligation to revise or update these forward-looking statements to reflect events or circumstances that arise after the date of this report or to reflect the occurrence of unanticipated events.
Liquidity and Capital Resources
Jefferies Acquisition
On March 1, 2013, Jefferies became one of our wholly-owned subsidiaries. Jefferies shareholders received 0.81 of a share of our common shares for each share of Jefferies common stock they held (the "Exchange Ratio"), an aggregate of approximately 119,363,000 of our common shares, and we issued a new series of our 3.25% Cumulative Convertible Preferred Shares ($125.0 million at mandatory redemption value) in exchange for Jefferies outstanding 3.25% Series A-1 Cumulative Convertible Preferred Stock. In addition, each restricted share of Jefferies common stock and each restricted stock unit of Jefferies common stock was converted at the Exchange Ratio into an award of restricted shares or restricted stock units of Leucadia, with all such awards subject to the same terms and conditions, including, without limitation, vesting and, in the case of performance-based restricted stock units, performance being measured at existing targets. We did not assume or guarantee any of Jefferies outstanding debt securities, but Jefferies 3.875% Convertible Senior Debentures due 2029 ($345.0 million principal amount outstanding) now will convert into our common shares. As specified in the indenture governing such debentures, the debentures are not currently convertible; if the debentures were currently convertible, the conversion price would be $45.51 per common share.
The Jefferies acquisition was accounted for using the acquisition method of accounting. The aggregate purchase price ($4,770.6 million) equaled the sum of the fair value of our common shares issued at closing, the fair value of employee stock based awards attributable to periods prior to closing, the fair value of the Jefferies common stock owned by us and the redemption value of the new series of preferred shares issued at closing, which represents its fair value. The fair values of the Jefferies common stock owned by us and the common shares and employee stock based awards issued were determined by using market prices at closing.
Jefferies has historically reported its Statement of Financial Condition on an unclassified basis, while we have historically reported a classified Statement of Financial Condition, with assets and liabilities separated between current and non-current. However, after giving consideration to the nature of Jefferies business and its impact on our Consolidated Statement of Financial Condition, upon completion of the acquisition we believe it is preferable to report our Consolidated Statement of Financial Condition on an unclassified basis. Accordingly, certain amounts for prior periods have been reclassified to be consistent with the 2013 presentation. We have also reclassified certain amounts on our Consolidated Statements of Operations, resulting from the reduced significance of certain businesses, to reclassify amounts accounted for at fair value from Income related to associated companies to Principal transactions, and have revised the classification of Income related to associated companies to show such amounts before income taxes. In addition, Jefferies has a fiscal year ended November 30 th , which it will retain for standalone reporting purposes. Accordingly, we reflect Jefferies in our consolidated financial statements and throughout this report utilizing a one month lag.
27
Corporate Liquidity
We are a holding company whose assets principally consist of the stock of direct subsidiaries, cash and cash equivalents and other non-controlling investments in debt and equity securities. We continuously evaluate the retention and disposition of our existing operations and investments and investigate possible acquisitions of new businesses in order to maximize shareholder value. Accordingly, further acquisitions, divestitures, investments and changes in capital structure are possible. Our principal sources of funds are available cash resources, liquid investments, public and private capital market transactions, repayment of subsidiary advances, funds distributed from subsidiaries as tax sharing payments, management and other fees, and borrowings and dividends from subsidiaries, as well as dispositions of existing businesses and investments.
In addition to cash and cash equivalents, we consider investments classified as available for sale securities as being generally available to meet our liquidity needs. Securities classified as available for sale securities are not as liquid as cash and cash equivalents, but they are generally easily convertible into cash within a relatively short period of time. As of December 31, 2013, the sum of these amounts aggregated $6.8 billion. However, since $3.7 billion of this amount is pledged as collateral pursuant to various agreements, is held by subsidiaries with outstanding debt (including Jefferies), or by subsidiaries that are party to agreements that restrict our ability to use the funds for other purposes, we do not consider those amounts to be available to meet corporate liquidity needs. The $3.1 billion that is available is comprised of cash and short-term bonds and notes of the U.S. Government and its agencies, and other publicly traded debt and equity securities. Our available liquidity, and the investment income realized from cash, cash equivalents and marketable securities is used to meet our short-term recurring cash requirements, which are principally the payment of interest on our debt and corporate overhead expenses. In addition, maintaining significant structural liquidity and a stable source of reliable secured financing is a critical component of Jefferies operations. Jefferies maintains its own liquidity and access to funding in the capital markets, has its own credit rating and issues debt securities. See below for more information and analysis on Jefferies liquidity.
The holding company's only long-term cash requirement is to make principal payments on its long-term debt ($1,541.0 million principal outstanding as of December 31, 2013), of which $97.6 million is due in 2014, $458.6 million is due in 2015, $750.0 million in 2023 and $250.0 million in 2043. Historically, we have used our available liquidity to make acquisitions of new businesses and other investments, but, except as disclosed in this report, the timing of any future investments and the cost cannot be predicted.
From time to time in the past, we have accessed public and private credit markets and raised capital in underwritten bond financings. The funds raised have been used by us for general corporate purposes, including for our existing businesses and new investment opportunities. Our senior debt obligations are rated investment grade by Fitch Ratings and Standard & Poor's and two levels below investment grade by Moody's Investors Services. Ratings issued by bond rating agencies are subject to change at any time.
In March 2013, pursuant to a tender and exchange offer by First Quantum Minerals Ltd., we exchanged our investment in Inmet Mining Corporation for 18,202,313 shares of First Quantum, valued at $340.4 million on the date received, and $391.2 million in cash. During the period ended December 31, 2013, we sold 9,952,313 First Quantum shares for aggregate net cash proceeds of $184.7 million.
On February 25, 2013, we distributed to our shareholders the common shares of Crimson Wine Group Ltd., a holding company through which we historically conducted our winery operations. The distribution was structured to qualify as a tax-free spin-off for U.S. federal income tax purposes. Our common shareholders on the record date received one share of Crimson common stock for every ten common shares of Leucadia, with cash in lieu of fractional shares. The distribution was a condition to the Jefferies acquisition. As a result, we recorded a dividend of $197.0 million.
During 2013, we paid four quarterly dividends of $0.0625 per share which aggregated $91.3 million for the year. The payment of dividends in the future is subject to the discretion of the Board of Directors and will depend upon general business conditions, legal and contractual restrictions on the payment of dividends and other factors that the Board of Directors may deem to be relevant.
In February 2009, the Board of Directors authorized, from time to time, the purchase of our outstanding debt securities through cash purchases in open market transactions, privately negotiated transactions or otherwise. Such repurchases, if any, depend upon prevailing market conditions, our liquidity requirements and other factors; such purchases may be commenced or suspended at any time without notice.
28
At December 31, 2013, we had outstanding 364,541,333 common shares and 14,216,884 share based awards that do not require the holder to pay any exercise price (potentially an aggregate of 378,758,217 outstanding common shares if all awards become outstanding common shares). In November 2012, the Board of Directors increased the number of our common shares that we are authorized to purchase. Such purchases may be made from time to time in the open market, through block trades or otherwise. Depending on market conditions and other factors, such purchases may be commenced or suspended at any time without notice. As of February 14, 2014, we are authorized to repurchase 25,000,000 common shares.
In September 2013, National Beef's credit facility was amended and restated to increase the term loan to $375.0 million, increase the revolving credit facility to $300.0 million, extend the maturity to October 2018 and reduce the term loan's required quarterly principal payments. The amended credit facility contains a minimum tangible net worth covenant, but does not contain the numerical covenants requiring certain leverage and fixed charge ratios that were in the previous agreement.
In October 2013, the Company sold $750.0 million principal amount of its newly authorized 5 ½% Senior Notes due 2023 at an issue price of 98.641% and $250.0 million principal amount of its newly authorized 6.625% Senior Notes due 2043 at an issue price of 98.781%; gross proceeds aggregated $986.8 million.
In the fourth quarter of 2013, we purchased 5% convertible notes issued by Linkem for $81.2 million (€58.9 million principal amount). If converted, we would own approximately 53% of Linkem's common equity.
We and certain of our subsidiaries have federal income tax net operating loss carryforwards ("NOLs") of approximately $3.4 billion at December 31, 2013 and other tax attributes. The amount and availability of the NOLs and other tax attributes are subject to certain qualifications, limitations and uncertainties. In order to reduce the possibility that certain changes in ownership could impose limitations on the use of the NOLs, our certificate of incorporation contains provisions which generally restrict the ability of a person or entity from acquiring ownership (including through attribution under the tax law) of five percent or more of the common shares and the ability of persons or entities now owning five percent or more of the common shares from acquiring additional common shares. The restrictions will remain in effect until the earliest of (a) December 31, 2024, (b) the repeal of Section 382 of the Internal Revenue Code (or any comparable successor provision) or (c) the beginning of a taxable year to which certain tax benefits may no longer be carried forward. For more information about the NOLs and other tax attributes, see Note 23 to our consolidated financial statements.
In connection with presentations made to credit rating agencies with respect to the Jefferies acquisition, we advised the agencies that we would target specific concentration, leverage and liquidity principles in the future, expressed in the form of certain ratios and percentages, although there is no legal requirement to do so. These thresholds and calculations of the actual ratios and percentages are detailed below at December 31, 2013 (dollars in thousands):
29
Total equity | $ | 10,102,462 | ||
Less, investment in Jefferies | (5,305,300 | ) | ||
Equity excluding Jefferies | 4,797,162 | |||
Less, our two largest investments: | ||||
National Beef | (793,656 | ) | ||
Premier Entertainment | (234,732 | ) | ||
Equity in a stressed scenario | 3,768,774 | |||
Less, net deferred tax asset excluding Jefferies amount | (1,285,160 | ) | ||
Equity in a stressed scenario less net deferred tax asset | $ | 2,483,614 | ||
Balance sheet amounts: | ||||
Available liquidity, per above | $ | 3,061,103 | ||
Parent company debt (see Note 18 to our | ||||
Consolidated financial statements) | $ | 1,541,014 | ||
Ratio of parent company debt to stressed equity: | ||||
Maximum | .50 | x | ||
Actual, equity in a stressed scenario | .41 | x | ||
Actual, equity in a stressed scenario excluding net deferred tax asset | .62 | x | ||
Ratio of available liquidity to parent company debt: | ||||
Minimum | 1.0 | x | ||
Actual | 2.0 | x |
In addition, management has indicated that our largest single investment will be not more than 20% of equity excluding Jefferies (currently National Beef), and that the next largest investment will be no more than 10% of equity excluding Jefferies, in each case measured at the time such investment was made. The ratio of parent company debt to stressed equity excluding the net deferred tax asset exceeded the maximum due to the Senior Notes sold in October 2013. However, as these notes were issued, in part, to provide funds for notes maturing over the next two years it is considered to be a temporary situation that will not impact our credit ratings.
Jefferies Liquidity
General
The Chief Financial Officer and Global Treasurer of Jefferies are responsible for developing and implementing liquidity, funding and capital management strategies for the Jefferies businesses. These policies are determined by the nature and needs of day to day business operations, business opportunities, regulatory obligations, and liquidity requirements.
The actual levels of capital, total assets, and financial leverage are a function of a number of factors, including asset composition, business initiatives and opportunities, regulatory requirements and cost and availability of both long term and short term funding. Jefferies has historically maintained a balance sheet consisting of a large portion of total assets in cash and liquid marketable securities, arising principally from traditional securities brokerage activity. The liquid nature of these assets provides flexibility in financing and managing Jefferies business.
A business unit level balance sheet and cash capital analysis is prepared and reviewed with senior management on a weekly basis. As a part of this balance sheet review process, capital is allocated to all assets and gross and adjusted balance sheet limits are established. This process ensures that the allocation of capital and costs of capital are incorporated into business decisions. The goals of this process are to protect the Jefferies platform, enable the businesses to remain competitive, maintain the ability to manage capital proactively and hold businesses accountable for both balance sheet and capital usage.
Jefferies Bache, LLC (Jefferies U.S. futures commission merchant) and Jefferies Bache Limited (Jefferies U.K. commodities and financial futures broker-dealer), receive cash or securities as margin to secure customer futures trades. Jefferies LLC (a U.S. broker-dealer), under SEC Rule 15c3-3, and Jefferies Bache, LLC, under CFTC Regulation 1.25, are required to maintain customer cash or qualified securities in a segregated reserve account for the exclusive benefit of our clients. Jefferies is required to conduct customer segregation calculations to ensure the appropriate amounts of funds are segregated and that no customer funds are used to finance firm activity. Similar requirements exist with respect to Jefferies U.K.-based activities conducted through Jefferies Bache Limited and Jefferies Europe (a U.K. broker-dealer). Customer funds received are separately segregated and "locked-up" apart from Jefferies funds. If Jefferies rehypothecates customer securities, that activity is conducted only to finance customer activity. Additionally, Jefferies does not lend customer cash to counterparties to conduct securities financing activity (i.e., Jefferies does not lend customer cash to reverse in securities). Further, Jefferies has no customer loan activity in Jefferies Europe and does not have any European prime securities operations. In Jefferies Bache Limited, any funds received from a customer are placed on deposit and not used as part of operations. Jefferies does not transfer U.S. customer assets to its U.K. entities.
30
Substantially all trading assets and trading liabilities are valued on a daily basis and balance sheet limits for the various businesses are monitored and employed. The overall securities inventory is continually monitored, including the inventory turnover rate, which confirms the liquidity of overall assets. As a Primary Dealer in the U.S. and with a similar role in several European jurisdictions, Jefferies carries inventory and makes an active market for its clients in securities issued by the various governments. These inventory positions are substantially comprised of the most liquid securities in the asset class, with a significant portion in holdings of securities of G-7 countries. For further detail on Jefferies outstanding sovereign exposure to Greece, Ireland, Italy, Portugal and Spain, refer to Quantitative and Qualitative Disclosures about Market Risk below.
Of Jefferies total trading assets, approximately 73% are readily and consistently financeable at haircuts of 10% or less. In addition, as a matter of Jefferies policy, a portion of these assets have internal capital assessed, which is in addition to the funding haircuts provided in the securities finance markets. Additionally, trading assets consisting of bank loans and investments are predominantly funded by Jefferies long term capital. Under Jefferies cash capital policy, capital allocation levels are modeled that are more stringent than the haircuts used in the market for secured funding; and surplus capital is maintained at these maximum levels. At December 31, 2013, our Consolidated Statement of Financial Condition includes Jefferies Level 3 trading assets that are 3% of total trading assets.
Securities financing assets and liabilities include both financing for financial instruments trading activity and matched book transactions. Matched book transactions accommodate customers, as well as obtain securities for the settlement and financing of inventory positions. By executing repurchase agreements with central clearing corporations, Jefferies reduces the credit risk associated with these arrangements and decreases net outstanding balances.
The following table presents Jefferies period end balance, average balance and maximum balance at any month end since acquisition for Securities purchased under agreements to resell and Securities sold under agreements to repurchase (in millions):
Securities purchased under agreements to resell | ||||
Period end | $ | 3,747 | ||
Month end average | 4,936 | |||
Maximum month end | 6,007 | |||
Securities sold under agreements to repurchase | ||||
Period end | $ | 10,780 | ||
Month end average | 13,308 | |||
Maximum month end | 16,502 | |||
Fluctuations in the balance of Jefferies repurchase agreements from period to period and intraperiod are dependent on business activity in those periods. Additionally, the fluctuations in the balances of Jefferies securities purchased under agreements to resell are influenced in any given period by its clients' balances and desires to execute collateralized financing arrangements via the repurchase market or via other financing products. Average balances and period end balances will fluctuate based on market and liquidity conditions and Jefferies considers the fluctuations intraperiod to be typical for the repurchase market.
Liquidity Management
The key objectives of Jefferies liquidity management framework are to support the successful execution of business strategies while ensuring sufficient liquidity through the business cycle and during periods of financial distress. The liquidity management policies are designed to mitigate the potential risk that adequate financing may not be accessible to service financial obligations without material franchise or business impact.
The principal elements of Jefferies liquidity management framework are the Contingency Funding Plan, the Cash Capital Policy and the assessment of Maximum Liquidity Outflow.
Contingency Funding Plan . The Jefferies Contingency Funding Plan is based on a model of a potential liquidity contraction over a one year time period. This incorporates potential cash outflows during a liquidity stress event, including, but not limited to, the following: (a) repayment of all unsecured debt maturing within one year and no incremental unsecured debt issuance; (b) maturity rolloff of outstanding letters of credit with no further issuance and replacement with cash collateral; (c) higher margin requirements than currently exist on assets on securities financing activity, including repurchase agreements; (d) liquidity outflows related to possible credit downgrade; (e) lower availability of secured funding; (f) client cash withdrawals; (g) the anticipated funding of outstanding investment and loan commitments; and (h) certain accrued expenses and other liabilities and fixed costs.
31
Cash Capital Policy . A cash capital model is maintained that measures long-term funding sources against requirements. Sources of cash capital include equity and the noncurrent portion of long-term borrowings. Uses of cash capital include the following: (a) illiquid assets such as equipment, goodwill, net intangible assets, exchange memberships, deferred tax assets and certain investments; (b) a portion of securities inventory that is not expected to be financed on a secured basis in a credit stressed environment (i.e., margin requirements); and (c) drawdowns of unfunded commitments. To ensure that Jefferies does not need to liquidate inventory in the event of a funding crises, Jefferies seeks to maintain surplus cash capital, which is reflected in the leverage ratios Jefferies maintains.
Maximum Liquidity Outflow. Jefferies businesses are diverse, and liquidity needs are determined by many factors, including market movements, collateral requirements and client commitments, all of which can change dramatically in a difficult funding environment. During a liquidity crisis, credit-sensitive funding, including unsecured debt and some types of secured financing agreements, may be unavailable, and the terms (e.g., interest rates, collateral provisions and tenor) or availability of other types of secured financing may change. As a result of Jefferies policy to ensure it has sufficient funds to cover estimates of what may be needed in a liquidity crisis, Jefferies holds more cash and unencumbered securities and has greater long-term debt balances than the businesses would otherwise require. As part of this estimation process, Jefferies calculates a Maximum Liquidity Outflow that could be experienced in a liquidity crisis. Maximum Liquidity Outflow is based on a scenario that includes both market-wide stress and firm-specific stress.
Based on the sources and uses of liquidity calculated under the Maximum Liquidity Outflow scenarios Jefferies determines, based on its calculated surplus or deficit, additional long-term funding that may be needed versus funding through the repurchase financing market and considers any adjustments that may be necessary to Jefferies inventory balances and cash holdings. Jefferies has sufficient excess liquidity to meet all contingent cash outflows detailed in the Maximum Liquidity Outflow.
Sources of Liquidity
Within Jefferies, the following are financial instruments that are cash and cash equivalents or are deemed by Jefferies management to be generally readily convertible into cash, marginable or accessible for liquidity purposes within a relatively short period of time, as reflected in our Consolidated Statement of Financial Condition at December 31, 2013 (in thousands):
Average Balance | ||||||||
Fourth Quarter | ||||||||
Actual | 2013 (1) | |||||||
Cash and cash equivalents: | ||||||||
Cash in banks | $ | 880,443 | $ | 713,627 | ||||
Money market investments | 2,680,676 | 2,062,773 | ||||||
Total cash and cash equivalents | 3,561,119 | 2,776,400 | ||||||
Other sources of liquidity: | ||||||||
Debt securities owned and securities purchased under agreements to resell (2) | 1,316,867 | 1,044,222 | ||||||
Other (3) | 403,738 | 647,078 | ||||||
Total other sources | 1,720,605 | 1,691,300 | ||||||
Total cash and cash equivalents and other liquidity sources | $ | 5,281,724 | $ | 4,467,700 | ||||
(1) | Average balances are calculated based on weekly balances. |
(2) | Consists of high quality sovereign government securities and reverse repurchase agreements collateralized by U.S. government securities and other high quality sovereign government securities; deposits with a central bank within the European Economic Area, Canada, Australia, Japan, Switzerland or the USA; and securities issued by a designated multilateral development bank and reverse repurchase agreements with underlying collateral comprised of these securities. |
(3) | Other includes unencumbered inventory representing an estimate of the amount of additional secured financing that could be reasonably expected to be obtained from financial instruments owned that are currently not pledged after considering reasonable financing haircuts and additional funds available under the committed senior secured revolving credit facility available for working capital needs of Jefferies Bache. |
32
In addition to the cash balances and liquidity pool presented above, the majority of trading assets and liabilities are actively traded and readily marketable. Repurchase financing can be readily obtained for 73% of inventory at haircuts of 10% or less, which reflects the liquidity of the inventory. Jefferies continually assesses the liquidity of its inventory based on the level at which Jefferies could obtain financing in the marketplace for a given asset. Assets are considered to be liquid if financing can be obtained in the repurchase market or the securities lending market at collateral haircut levels of 10% or less. The following summarizes Jefferies trading assets by asset class that are considered to be of a liquid nature and the amount of such assets that have not been pledged as collateral as reflected in the Consolidated Statement of Financial Condition at December 31, 2013 (in thousands):
Liquid Financial Instruments | Unencumbered Liquid Financial Instruments (2) | |||||||
Corporate equity securities | $ | 1,982,877 | $ | 137,721 | ||||
Corporate debt securities | 2,250,512 | 26,983 | ||||||
U.S. Government, agency and municipal securities | 2,513,388 | 400,821 | ||||||
Other sovereign obligations | 2,346,485 | 991,774 | ||||||
Agency mortgage-backed securities (1) | 2,976,133 | – | ||||||
Physical commodities | 37,888 | – | ||||||
| $ | 12,107,283 | $ | 1,557,299 | |||||
(1) | Consists solely of agency mortgage-backed securities issued by Freddie Mac, Fannie Mae and Ginnie Mae. These securities include pass-through securities, securities backed by adjustable rate mortgages, collateralized mortgage obligations, commercial mortgage-backed securities and interest- and principal-only securities. |
(2) | Unencumbered liquid balances represent assets that can be sold or used as collateral for a loan, but have not been. |
In addition to being able to be readily financed at modest haircut levels, it is estimated that each of the individual securities within each asset class above could be sold into the market and converted into cash within three business days under normal market conditions, assuming that the entire portfolio of a given asset class was not simultaneously liquidated. There are no restrictions on the unencumbered liquid securities, nor have they been pledged as collateral.
Sources of Funding
Secured Financing
Readily available secured funding is used to finance Jefferies financial instruments inventory. The ability of Jefferies to support increases in total assets is largely a function of the ability to obtain short and intermediate term secured funding, primarily through securities financing transactions. Repurchase or reverse repurchase agreements (collectively "repos"), respectively, are used to finance a portion of long inventory and cover a portion of short inventory through pledging and borrowing securities. Approximately 84% of Jefferies repurchase financing activities use collateral that is considered eligible collateral by central clearing corporations. Central clearing corporations are situated between participating members who borrow cash and lend securities (or vice versa); accordingly repo participants contract with the central clearing corporation and not one another individually. Therefore, counterparty credit risk is borne by the central clearing corporation which mitigates the risk through initial margin demands and variation margin calls from repo participants. The comparatively large proportion of Jefferies total repo activity that is eligible for central clearing reflects the high quality and liquid composition of its trading inventory. The tenor of repurchase and reverse repurchase agreements generally exceeds the expected holding period of the financed assets.
A significant portion of the financing of European Sovereign inventory is executed using central clearinghouse financing arrangements rather than via bi-lateral arrangements repo agreements. For those asset classes not eligible for central clearinghouse financing, bi-lateral financings are sought on an extended term basis.
33
In addition to the above financing arrangements, Jefferies issues notes backed by eligible collateral under a master repurchase agreement. The outstanding amount of the notes issued under the program was $195.0 million in aggregate, which is presented within Other secured financings in the Consolidated Statement of Financial Condition at December 31, 2013. Of the $195.0 million aggregate notes, $135.0 million matures prior to December 2014 and $60.0 million matures in February 2015, bearing interest at a spread over one month LIBOR.
Weighted average maturity of repurchase agreements for non-clearing corporation eligible funded inventory is approximately four months. Jefferies ability to finance inventory via central clearinghouses and bi-lateral arrangements is augmented by Jefferies ability to draw bank loans on an uncommitted basis under various banking arrangements. As of December 31, 2013, short-term borrowings as bank loans totaled $12.0 million. Interest under the bank lines is generally at a spread over the federal funds rate . Letters of credit are used in the normal course of business mostly to satisfy various collateral requirements in favor of exchanges in lieu of depositing cash or securities. Average daily bank loans since the Jefferies acquisition were $43.3 million.
Long-Term Debt
Jefferies long-term debt reflected in the Consolidated Statement of Financial Condition at December 31, 2013 is $6.0 billion, which excludes $200.0 million of outstanding borrowings under a long-term revolving Credit Facility. Jefferies long-term debt has an average maturity exceeding 8 years, excluding the Jefferies Credit Facility. Jefferies next scheduled maturity is the $250.0 million 5.875% Senior Notes that mature in June 2014.
The Jefferies Credit Facility is a committed senior secured revolving credit facility with a group of commercial banks in Dollars, Euros and Sterling, for an aggregate committed amount of $950.0 million, with availability subject to one or more borrowing bases and of which $250.0 million can be borrowed by Jefferies Bache Limited without a borrowing base requirement. The borrowers under the facility are Jefferies Bache Financial Services, Inc., Jefferies Bache, LLC and Jefferies Bache Limited. The facility terminates on August 26, 2014. Interest is based on the Federal funds rate or, in the case of Euro and Sterling borrowings, the Euro Interbank Offered Rate and the London Interbank Offered Rate, respectively. The facility is guaranteed by Jefferies Group LLC and contains financial covenants that, among other things, imposes restrictions on future indebtedness, requires Jefferies Group LLC to maintain specified levels of tangible net worth and liquidity amounts, and requires certain subsidiaries to maintain specified levels of regulated capital. Jefferies is currently in compliance with the facility and expects to remain in compliance in both the near term and long term given current liquidity, anticipated additional funding requirements and profitability expectations.
Jefferies long-term debt ratings are as follows:
Rating | Outlook | |
Moody's Investors Service | Baa3 | Stable |
Standard and Poor's | BBB | Stable |
Fitch Ratings | BBB- | Stable |
Jefferies relies upon its cash holdings and external sources to finance a significant portion of its day to day operations. Jefferies access to these external sources, as well as the cost of that financing, is dependent upon various factors, including its credit ratings. Jefferies current ratings are dependent upon many factors, including industry dynamics, operating and economic environment, operating results, operating margins, earnings trend and volatility, balance sheet composition, liquidity and liquidity management, capital structure, overall risk management, business diversification and market share and competitive position in the markets in which it operates. Deteriorations in any of these factors could impact Jefferies credit ratings. While certain aspects of a credit rating downgrade are quantifiable pursuant to contractual provisions, the impact on its business and trading results in future periods is inherently uncertain and depends on a number of factors, including the magnitude of the downgrade, the behavior of individual clients and future mitigating action taken by Jefferies.
34
In connection with certain over-the-counter derivative contract arrangements and certain other trading arrangements, Jefferies may be required to provide additional collateral to counterparties, exchanges and clearing organizations in the event of a credit rating downgrade. The amount of additional collateral that could be called by counterparties, exchanges and clearing organizations under the terms of such agreements in the event of a downgrade of Jefferies long-term credit rating below investment grade was $89.2 million. For certain foreign clearing organizations credit rating is only one of several factors employed in determining collateral that could be called. The above represents management's best estimate for additional collateral to be called in the event of credit rating downgrade. The impact of additional collateral requirements is considered in Jefferies Contingency Funding Plan and calculation of Maximum Liquidity Outflow, as described above.
Ratings issued by credit rating agencies are subject to change at any time.
Net Capital
Jefferies operates broker-dealers registered with the SEC and member firms of the Financial Industry Regulatory Authority ("FINRA"). Jefferies LLC and Jefferies Execution are subject to the Securities and Exchange Commission Uniform Net Capital Rule ("Rule 15c3-1"), which requires the maintenance of minimum net capital and which may limit distributions from the broker-dealers. Additionally, Jefferies Bache, LLC is registered as a Futures Commission Merchant and is subject to Rule 1.17 of the Commodities Futures Trading Commission ("CFTC"). FINRA is the designated self-regulatory organization for the U.S. broker-dealers and the Chicago Mercantile Exchange is the designee for Jefferies Bache, LLC.
Jefferies LLC, Jefferies Execution and Jefferies Bache, LLC's net capital, adjusted net capital, and excess net capital were as follows (in thousands):
Net Capital | Excess Net Capital | |||||||
Jefferies LLC | $ | 891,487 | $ | 841,539 | ||||
Jefferies Execution | 4,487 | 4,237 | ||||||
Adjusted Net Capital | Excess Net Capital | |||||||
Jefferies Bache, LLC | $ | 197,957 | $ | 86,293 | ||||
Certain other U.S. and non-U.S. subsidiaries of Jefferies are subject to capital adequacy requirements as prescribed by the regulatory authorities in their respective jurisdictions, including Jefferies Europe and Jefferies Bache Limited which are subject to the regulatory supervision and requirements of the Financial Services Authority in the United Kingdom. The Dodd-Frank Wall Street Reform and Consumer Protection Act (the "Dodd-Frank Act") was signed into law on July 21, 2010. The Dodd-Frank Act contains provisions that require the registration of all swap dealers, major swap participants, security-based swap dealers, and/or major security-based swap participants. While entities that register under these provisions will be subject to regulatory capital requirements, these regulatory capital requirements have not yet been finalized. These provisions will result in modifications to the regulatory capital requirements of some entities, and will result in some entities becoming subject to regulatory capital requirements for the first time, including Jefferies Derivative Products, LLC and Jefferies Bache Financial Services, Inc., which registered as swap dealers with the CFTC during January 2013.
The regulatory capital requirements referred to above may restrict our ability to withdraw capital from our subsidiaries.
Consolidated Statements of Cash Flows
As discussed above, we have historically relied on our available liquidity to meet short-term and long-term needs, and to make acquisitions of new businesses and investments. Except as otherwise disclosed herein, our operating businesses do not generally require significant funds to support their operating activities, and we do not depend on positive cash flow from our operating segments to meet our liquidity needs. The mix of our operating businesses and investments can change frequently as a result of acquisitions or divestitures, the timing of which is impossible to predict but which often have a significant impact on our Consolidated Statements of Cash Flows in any one period. Further, the timing and amounts of distributions from investments in associated companies may be outside our control. As a result, reported cash flows from operating, investing and financing activities do not generally follow any particular pattern or trend, and reported results in the most recent period should not be expected to recur in any subsequent period.
35
Net cash of $702.3 million and $645.4 million was provided by operating activities in 2013 and 2012, respectively, and net cash of $556.8 million was used for operating activities in 2011. The change in operating cash flows reflects interest payments received from Chichester Metals Pty Ltd, a subsidiary of Fortescue Metals Group Ltd ($202.2 million in 2012 and $171.7 million in 2011; the note (the "FMG Note") was redeemed in the fourth quarter of 2012), premiums paid to redeem debt ($17.1 million in 2012 and $6.4 million in 2011) and lower interest payments and greater income tax payments in 2012 as compared to 2011. In 2013, operating cash flows reflect funds generated by Jefferies of $750.1 million. National Beef generated funds of $85.4 million and $141.4 million during 2013 and 2012, respectively; manufacturing generated funds of $30.0 million, $27.4 million and $12.8 million during 2013, 2012 and 2011, respectively; and discontinued operations used funds of $9.7 million in 2013 and generated funds of $4.7 million and $15.3 million during 2012 and 2011, respectively. During 2013, distributions from associated companies principally were received from Berkadia ($69.0 million), Garcadia ($26.0 million) and Jefferies related entities ($37.7 million). During 2012, distributions from associated companies principally were received from Berkadia ($37.6 million), Jefferies High Yield Holdings, LLC ("JHYH") ($5.2 million) and Garcadia ($18.4 million). During 2011, distributions from associated companies principally were received from Berkadia ($23.6 million) and Garcadia ($5.7 million). Net losses related to real estate, property and equipment, and other assets in 2013 include National Beef's impairment loss of $63.3 million with respect to its Brawley facility. Net gains related to real estate, property and equipment, and other assets in 2012 include $526.2 million from the redemption of the FMG Note, and in 2011 include a gain of $81.8 million on forgiveness of debt related to the Myrtle Beach real estate project.
Net cash of $3,323.6 million and $390.7 million was provided by investing activities in 2013 and 2011, respectively, as compared to net cash used for investing activities of $16.6 million in 2012. During 2012, cash used for investing activities reflects the proceeds received from the redemption of the FMG Note. Increases to acquisitions of property, equipment and leasehold improvements principally reflect Jefferies in 2013 and National Beef in 2012. Loans to and investments in associated companies include Garcadia ($38.4 million), Linkem ($107.4 million) and Jefferies related entities ($2,241.2 million) in 2013; Linkem ($23.7 million) in 2012; and Linkem ($88.6 million) and Garcadia ($32.4 million) in 2011. Capital distributions and loan repayment from associated companies include Garcadia ($14.2 million) and Jefferies related entities ($2,360.7 million) in 2013; Berkadia ($35.0 million) and Garcadia ($12.0 million) in 2012; and Berkadia ($283.5 million), JHYH ($8.7 million), and Garcadia ($10.4 million) in 2011.
Net cash of $270.5 million, $651.7 million and $106.6 million was used for financing activities in 2013, 2012 and 2011, respectively. Issuance of long-term debt during 2013 primarily reflects $750.0 million principal amount of our 5.50% Senior Notes due 2023, $250.0 million principal amount of our 6.625% Senior Notes due 2043, borrowings by National Beef under its bank credit facility ($106.8 million) and increases in Jefferies debt ($1,034.7 million). Issuance of long-term debt during 2011 primarily reflects $75.9 million borrowed by National Beef under its revolving credit facility.
Reduction of debt for 2013 includes $94.5 million and $307.4 million, respectively, on the maturity of our 7.75% Senior Notes and 7% Senior Notes, $120.6 million related to National Beef's debt, $980.0 million related to Jefferies debt and the decrease in repurchase agreements (exclusive of Jefferies) of $391.7 million. Reduction of debt for 2012 includes redemptions of debt of the parent company ($516.2 million principal amount), a decrease in repurchase agreements and repayments under National Beef's term loans and bank credit facility. Reduction of debt for 2011 includes buybacks or maturity of parent company debt ($115.4 million principal amount) and satisfaction of the Myrtle Beach real estate project's non-recourse indebtedness. Distributions to noncontrolling interests in 2013 principally represent the redemption of third-party investors in JHYH. Issuance of common shares primarily reflects the exercise of employee stock options. Purchases of common shares for treasury relate to shares received from participants in our stock compensation plans.
Our senior note indentures contain covenants that restrict our ability to incur more Indebtedness or issue Preferred Stock of Subsidiaries unless, at the time of such incurrence or issuance, we meet a specified ratio of Consolidated Debt to Consolidated Tangible Net Worth, limit the ability of the Company and Material Subsidiaries to incur, in certain circumstances, Liens, limit the ability of Material Subsidiaries to incur Funded Debt in certain circumstances, and contain other terms and restrictions all as defined in the senior note indentures. We have the ability to incur substantial additional indebtedness or make distributions to its shareholders and still remain in compliance with these restrictions. If we are unable to meet the specified ratio, we would not be able to issue additional Indebtedness or Preferred Stock, but our inability to meet the applicable ratio would not result in a default under its senior note indentures. The senior note indentures do not restrict the payment of dividends. Certain of the debt instruments of our subsidiaries require that collateral be provided to the lender; principally as a result of such requirements, the assets of subsidiaries which are subject to limitations on transfer of funds to us was $2.1 billion at December 31, 2013.
36
As shown below, at December 31, 2013, our contractual cash obligations totaled $12,737.6 million.
Expected Maturity Date (in millions) | ||||||||||||||||||||||||
Contractual Cash Obligations |
Total |
2014 |
2015 | 2016 and 2017 | 2018 and 2019 | After 2019 | ||||||||||||||||||
Indebtedness | $ | 7,723.1 | $ | 601.9 | $ | 987.1 | $ | 406.8 | $ | 1,775.0 | $ | 3,952.3 | ||||||||||||
Estimated interest expense on debt | 4,071.6 | 425.8 | 406.5 | 688.0 | 557.7 | 1,993.6 | ||||||||||||||||||
Cattle commitments | 110.1 | 110.1 | – | – | – | – | ||||||||||||||||||
Operating leases, net of sublease income | 790.1 | 86.2 | 67.3 | 128.6 | 108.3 | 399.7 | ||||||||||||||||||
Other | 42.7 | 21.9 | 4.7 | 9.4 | 3.4 | 3.3 | ||||||||||||||||||
Total Contractual Cash Obligations | $ | 12,737.6 | $ | 1,245.9 | $ | 1,465.6 | $ | 1,232.8 | $ | 2,444.4 | $ | 6,348.9 | ||||||||||||
Amounts related to our U.S. pension obligations ($56.0 million) are not included in the above table as the timing of payments is uncertain; however, we do not expect to make any contributions to these plans in 2014. For futher information, see Note 22 in our consolidated financial statements. In addition, the above amounts do not include liabilities for unrecognized tax benefits as the timing of payments, if any, is uncertain. Such amounts aggregated $173.7 million at December 31, 2013; for more information, see Note 23 in our consolidated financial statements.
Our U.S. pension obligations relate to frozen defined benefit pension plans, principally the defined benefit plan of WilTel Communications Group, LLC, our former telecommunications subsidiary. When we sold WilTel in 2005, its defined benefit pension plan was not transferred in connection with the sale. At December 31, 2013, we had recorded a liability of $55.1 million in our Consolidated Statement of Financial Condition for WilTel's unfunded defined benefit pension plan obligation. This amount represents the difference between the present value of amounts owed to former employees of WilTel (referred to as the projected benefit obligation) and the market value of plan assets set aside in segregated trust accounts. Since the benefits in this plan have been frozen, future changes to the unfunded benefit obligation are expected to principally result from benefit payments, changes in the market value of plan assets, differences between actuarial assumptions and actual experience and interest rates.
Calculations of pension expense and projected benefit obligations are prepared by actuaries based on assumptions provided by management. These assumptions are reviewed on an annual basis, including assumptions about discount rates, interest credit rates and expected long-term rates of return on plan assets. The timing of expected future benefit payments was used in conjunction with the Citigroup Pension Discount Curve to develop a discount rate for the WilTel plan that is representative of the high quality corporate bond market. Holding all other assumptions constant, a 0.25% change in the discount rate would affect pension expense in 2014 by $0.5 million and the benefit obligation by $9.3 million, of which $8.1 million relates to the WilTel plan.
The deferred losses in accumulated other comprehensive income (loss) have not yet been recognized as components of net periodic pension cost in the Consolidated Statements of Operations ($78.8 million at December 31, 2013). These deferred amounts primarily result from differences between the actual and assumed return on plan assets and changes in actuarial assumptions, including changes in discount rates and changes in interest credit rates. They are amortized to expense if they exceed 10% of the greater of the projected benefit obligation or the market value of plan assets as of the beginning of the year. The estimated net loss that will be amortized from accumulated other comprehensive income (loss) into pension expense in 2014 is $4.3 million.
The assumed long-term rates of return on plan assets are based on the investment objectives of the plans, which are more fully discussed in Note 22 in our consolidated financial statements.
37
Off-Balance Sheet Arrangements
As shown below, at December 31, 2013, our commitments and guarantees, substantially all of which related to Jefferies, totaled $852,566.6 million.
Expected Maturity Date (in millions) | ||||||||||||||||||||||||
Commitments and Guarantees |
Total |
2014 |
2015 | 2016 and 2017 | 2018 and 2019 | After 2019 | ||||||||||||||||||
Equity commitments | $ | 428.2 | $ | 1.8 | $ | 7.4 | $ | .8 | $ | – | $ | 418.2 | ||||||||||||
Loan commitments | 467.6 | 33.2 | 19.0 | 322.6 | 92.8 | – | ||||||||||||||||||
Mortgage-related commitments | 1,515.6 | 819.9 | 492.9 | 202.8 | – | – | ||||||||||||||||||
Forward starting reverse repos and repos | 702.3 | 702.3 | – | – | – | – | ||||||||||||||||||
Derivative contracts (1): | ||||||||||||||||||||||||
Non credit related | 846,683.4 | 841,439.9 | 4,695.2 | 14.7 | 1.2 | 532.4 | ||||||||||||||||||
Credit related | 2,708.1 | – | – | – | 2,708.1 | – | ||||||||||||||||||
Standby letters of credit | 61.4 | 54.2 | 2.2 | 5.0 | – | – | ||||||||||||||||||
Total Commitments and Guarantees | $ | 852,566.6 | $ | 843,051.3 | $ | 5,216.7 | $ | 545.9 | $ | 2,802.1 | $ | 950.6 | ||||||||||||
(1) | Certain of Jefferies derivative contracts meet the definition of a guarantee and are therefore included in the above table. For additional information on commitments, see Note 27, Commitments, Contingencies and Guarantees, in our consolidated financial statements. |
We have agreed to reimburse Berkshire Hathaway for up to one-half of any losses incurred under a $2.5 billion surety policy securing outstanding commercial paper issued by an affiliate of Berkadia. As of December 31, 2013, the aggregate amount of commercial paper outstanding was $2.47 billion. This commitment is not included in the table above as the timing of payments, if any, is uncertain.
In the normal course of business Jefferies engages in other off-balance sheet arrangements, including derivative contracts. Neither derivatives' notional amounts nor underlying instrument values are reflected as assets or liabilities in our Consolidated Statements of Financial Condition. Rather, the fair value of derivative contracts are reported in the Consolidated Statements of Financial Condition as Trading assets – Derivative contracts or Trading Liabilities – Derivative contracts as applicable. Derivative contracts are reflected net of cash paid or received pursuant to credit support agreements and are reported on a net by counterparty basis when a legal right of offset exists under an enforceable master netting agreement. For additional information about our accounting policies and our derivative activities see Note 2, Significant Accounting Policies, Note 6, Fair Value Disclosures, and Note 7, Derivative Financial Instruments, in our consolidated financial statements.
Jefferies is routinely involved with variable interest entities ("VIEs") in connection with mortgage-backed securities securitization activities. VIEs are entities in which equity investors lack the characteristics of a controlling financial interest or do not have sufficient equity at risk for the entity to finance its activities without additional subordinated financial support. VIEs are consolidated by the primary beneficiary. The primary beneficiary is the party who has the power to direct the activities of a variable interest entity that most significantly impact the entity's economic performance and who has an obligation to absorb losses of the entity or a right to receive benefits from the entity that could potentially be significant to the entity. We do not generally consolidate the various VIEs related to Jefferies mortgage-backed securities securitization activities because we are not the primary beneficiary.
At December 31, 2013, Jefferies did not have any commitments to purchase assets from its securitization vehicles. Jefferies held $387.1 million of mortgage-backed securities issued by VIEs for which it was initially involved as transferor and placement agent, which are accounted for at fair value and recorded within Trading assets on our Consolidated Statement of Financial Condition at December 31, 2013. For additional information regarding VIEs, see Note 9, Securitization Activities and Note 11, Variable Interest Entities, in our consolidated financial statements.
38
Critical Accounting Estimates
Our discussion and analysis of financial condition and results of operations is based upon our consolidated financial statements, which have been prepared in accordance with accounting principles generally accepted in the United States of America ("GAAP"). The preparation of these financial statements requires us to make estimates and assumptions that affect the reported amounts in the financial statements and disclosures of contingent assets and liabilities. On an on-going basis, we evaluate all of these estimates and assumptions. The following areas have been identified as critical accounting estimates because they have the potential to have a significant impact on our financial statements, and because they are based on assumptions which are used in the accounting records to reflect, at a specific point in time, events whose ultimate outcome won't be known until a later date. Actual results could differ from these estimates.
Income Taxes – We record a valuation allowance to reduce our net deferred tax asset to the net amount that is more likely than not to be realized. If in the future we determine that it is more likely than not that we will be able to realize our net deferred tax asset in excess of our net recorded amount, an adjustment to increase the net deferred tax asset would increase income in such period. If in the future we were to determine that we would not be able to realize all or part of its recorded net deferred tax asset, an adjustment to decrease the net deferred tax asset would be charged to income in such period. We are required to consider all available evidence, both positive and negative, and to weight the evidence when determining whether a valuation allowance is required and the amount of such valuation allowance. Generally, greater weight is required to be placed on objectively verifiable evidence when making this assessment, in particular on recent historical operating results.
Our estimate of future taxable income considers all available evidence, both positive and negative, about our operating businesses and investments, includes an aggregation of individual projections for each significant operating business and investment, estimated apportionment factors for state and local taxing jurisdictions and includes all future years that we estimate we will have available NOLs (until 2029). We believe that our estimate of future taxable income is reasonable but inherently uncertain, and if our current or future operations and investments generate taxable income different than the projected amounts, further adjustments to the valuation allowance are possible. The current balance of the deferred tax valuation allowance principally reserves for NOLs of certain subsidiaries that are not available to offset income generated by other members of the consolidated tax return group.
We also record reserves for unrecognized tax benefits based on our assessment of the probability of successfully sustaining tax filing positions. Management exercises significant judgment when assessing the probability of successfully sustaining tax filing positions, and in determining whether a contingent tax liability should be recorded and if so estimating the amount. If our tax filing positions are successfully challenged, payments could be required that are in excess of reserved amounts or we may be required to reduce the carrying amount of our net deferred tax asset, either of which could be significant to our Consolidated Statement of Financial Condition or results of operations.
Fair Value of Financial Instruments – Trading assets and trading liabilities are recorded at fair value, either as required by accounting pronouncements or through the fair value option election. Trading assets and trading liabilities include Jefferies trading activities, financial instruments of other consolidated entities that are accounted for through the fair value option election and, prior to the Jefferies acquisition, trading assets include our investment in Jefferies common shares. Gains and losses on trading assets and trading liabilities are recognized in our Consolidated Statements of Operations. Available for sale securities are reflected at fair value, with unrealized gains and losses reflected as a separate component of equity, net of taxes. When sold, realized gains and losses on available for sale securities are reflected in the caption Net realized securities gains. Fair value is the amount that would be received to sell an asset or paid to transfer a liability in an orderly transaction between market participants at the measurement date (the exit price).
In determining fair value, we maximize the use of observable inputs and minimize the use of unobservable inputs by requiring that observable inputs be used when available. Observable inputs are inputs that market participants would use in pricing the asset or liability based on market data obtained from independent sources. Unobservable inputs reflect our assumptions that market participants would use in pricing the asset or liability developed based on the best information available in the circumstances. We apply a hierarchy to categorize our fair value measurements broken down into three levels based on the transparency of inputs as follows:
39
Level 1: Quoted prices are available in active markets for identical assets or liabilities as of the reported date.
Level 2: Pricing inputs are other than quoted prices in active markets, which are either directly or indirectly observable as of the reported date. The nature of these financial instruments include cash instruments for which quoted prices are available but traded less frequently, derivative instruments whose fair value have been derived using a model where inputs to the model are directly observable in the market, or can be derived principally from or corroborated by observable market data, and instruments that are fair valued using other financial instruments, the parameters of which can be directly observed.
Level 3: Instruments that have little to no pricing observability as of the reported date. These financial instruments are measured using management's best estimate of fair value, where the inputs into the determination of fair value require significant management judgment or estimation.
Fair value is a market based measure; therefore, when market observable inputs are not available, our judgment is applied to reflect those judgments that a market participant would use in valuing the same asset or liability. The availability of observable inputs can vary for different products. We use prices and inputs that are current as of the measurement date even in periods of market disruption or illiquidity. The valuation of financial instruments classified in Level 3 of the fair value hierarchy involves the greatest amount of management judgment.
Jefferies Independent Price Verification Group, independent of its trading function, plays an important role in determining that financial instruments are appropriately valued and that fair value measurements are reliable. This is particularly important where prices or valuations that require inputs are less observable. In the event that observable inputs are not available, the control processes are designed to assure that the valuation approach utilized is appropriate and consistently applied and that the assumptions are reasonable. Where a pricing model is used to determine fair value, these control processes include reviews of the pricing model's theoretical soundness and appropriateness by risk management personnel with relevant expertise who are independent from the trading desks. In addition, recently executed comparable transactions and other observable market data are considered for purposes of validating assumptions underlying the model.
For further information on the fair value definition, Level 1, Level 2, Level 3 and related valuation techniques, see Note 2, Significant Accounting Policies and Note 6, Fair Value Disclosures, in our consolidated financial statements.
Impairment of Long-Lived Assets – We evaluate our long-lived assets for impairment whenever events or changes in circumstances indicate, in management's judgment, that the carrying value of such assets may not be recoverable. When testing for impairment, we group our long-lived assets with other assets and liabilities at the lowest level for which identifiable cash flows are largely independent of the cash flows of other assets and liabilities (or asset group). The determination of whether an asset group is recoverable is based on management's estimate of undiscounted future cash flows directly attributable to the asset group as compared to its carrying value. If the carrying amount of the asset group is greater than the undiscounted cash flows, an impairment loss would be recognized for the amount by which the carrying amount of the asset group exceeds its estimated fair value.
National Beef's beef processing facility located in Brawley, California was originally acquired by National Beef in May 2006. When National Beef was acquired by us in December 2011, the Brawley facility was recorded at its then fair value, which was based in part on market studies and appraisals prepared by an independent valuation and appraisal firm. The facility was profitable for periods through 2011 during a period of favorable industry margins and when the plant had access to a sufficient supply of cattle. However, more recently National Beef has struggled to achieve acceptable gross margins and to overcome the declining supply of fed cattle available to the plant and the fixed cost inefficiencies inherent in a single shift plant. There is not an adequate supply of fed cattle to operate the plant efficiently and our outlook is for the supply to continue to decline.
After exhausting all opportunities to improve the operating performance of the Brawley beef processing facility, during the fourth quarter of 2013 National Beef concluded that the facility would continue to generate losses for the foreseeable future, resulting in a decision in December 2013 to close the facility in April 2014. Subsequent to closing the plant, National Beef plans to hold the plant in "mothballed" status indefinitely. National Beef evaluated the recoverability of the long-lived assets at Brawley, which had an aggregate carrying amount of $93.2 million at December 31, 2013, and based on its estimate of future undiscounted cash flows concluded that the carrying value was not recoverable and the facility was impaired. In performing this evaluation, National Beef determined that the Brawley facility is the asset group that represents the lowest level of cash flows that are largely independent of the cash flows of other assets and liabilities.
40
The management of National Beef engaged an independent valuation and appraisal firm to assist in estimating the fair value of the long-lived assets at Brawley. National Beef's estimate of fair value was based on an orderly liquidation technique, which represents the amount that can be realized in a liquidation sale, given a reasonable period of time to find a purchaser, assuming an as-is where-is condition. In preparing its analysis, National Beef considered current market conditions, replacement cost, as well as the age, physical and functional characteristics of the long-lived assets.
As a result, National Beef concluded that the fair value of the long-lived assets at the Brawley facility is $29.9 million at December 31, 2013, and recorded an impairment loss of $63.3 million, which is reflected in Selling, general and other expenses in the Consolidated Statement of Operations for the year ended December 31, 2013. As with any estimate of fair value, future market, regulatory and general economic conditions as well as the obsolescence, future deterioration of, or inability to locate a purchaser should National Beef decide to sell the facility could have a significant effect on their future value.
In addition to the long-lived asset impairment charge, National Beef expects to incur additional costs relating to the closing of the facility during 2014. These costs include costs for fulfilling certain contractual obligations, employee separation and retention, systems decommissioning and various other expenses. National Beef currently estimates that these costs could be up to $20.0 million in the aggregate. Under GAAP, these costs may not be accrued until they are actually incurred.
Excluding the National Beef impairment, we recorded impairment charges in Selling, general and other expenses of $20.0 million in 2013 and $4.2 million in 2012; all related to various real estate development projects. Prior to the impairment charges in 2013, these projects had a book value of $32.3 million; after recognizing the impairment charges the carrying value of the real estate projects was reduced to their estimated fair value of $12.3 million. Estimates of fair value were principally determined using discounted cash flow analyses and/or current and expected market conditions for the specific geographic area. For the year ended December 31, 2013, impairment charges related to real estate include an out of period adjustment of $15.4 million to record charges related to prior periods.
Poor economic conditions have adversely affected most of our operations and investments. A worsening of current economic conditions could cause a decline in estimated future cash flows expected to be generated by our operations and investments. If future undiscounted cash flows are estimated to be less than the carrying amounts of the asset groups used to generate those cash flows in subsequent reporting periods, particularly for those with large investments in amortizable intangible assets and property and equipment (for example, investment banking, beef processing, manufacturing, real estate and certain associated company investments), impairment charges would have to be recorded.
Impairment of Equity Method Investments – We evaluate equity method investments for impairment when operating losses or other factors may indicate a decrease in value which is other than temporary. For investments in investment partnerships that are accounted for under the equity method, we obtain from the investment partnership financial statements, net asset values and other information on a quarterly basis and annual audited financial statements. On a quarterly basis, we also make inquiries and discuss with investment managers whether there were significant procedural, valuation, composition and other changes at the investee. Since these investment partnerships record their underlying investments at fair value, after application of the equity method the carrying value of our investment is equal to our share of the investees' underlying net assets at their fair values. Absent any unusual circumstances or restrictions concerning these investments, which would be separately evaluated, it is unlikely that any additional impairment charge would be required.
For equity method investments in operating businesses, we consider a variety of factors including economic conditions nationally and in their geographic areas of operation, adverse changes in the industry in which they operate, declines in business prospects, deterioration in earnings, increasing costs of operations and other relevant factors specific to the investee. Whenever we believe conditions or events indicate that one of these investments might be significantly impaired, we obtain from such investee updated cash flow projections and impairment analyses of the investee assets. We use this information and, together with discussions with the investee's management, evaluate if the book value of its investment exceeds its fair value, and if so and the situation is deemed other than temporary, record an impairment charge.
Goodwill – At acquisition, we allocate the cost of a business acquisition to the specific tangible and intangible assets acquired and liabilities assumed based upon their fair values. Significant judgments and estimates are often made by management to determine these values, and may include the use of appraisals, consideration of market quotes for similar transactions, use of discounted cash flow techniques or consideration of other information we believe to be relevant. Any excess of the cost of a business acquisition over the fair values of the net assets and liabilities acquired is recorded as goodwill, which is not amortized to expense. Substantially all of our goodwill was recognized in connection with the Jefferies acquisition.
41
At least annually, and more frequently if warranted, we will assess whether goodwill has been impaired. If the estimated fair value exceeds the carrying value, goodwill at the reporting unit level is not impaired. If the estimated fair value is less than carrying value, further analysis is necessary to determine the amount of impairment, if any. The fair values will be based on valuation techniques that we believe market participants would use, although the valuation process requires significant judgment and often involves the use of significant estimates and assumptions. The methodologies we utilize in estimating fair value include market capitalization, price-to-book multiples of comparable exchange traded companies, multiples of mergers and acquisitions of similar businesses and/or projected cash flows. The estimates and assumptions used in determining fair value could have a significant effect on whether or not an impairment charge is recorded and the magnitude of such a charge. Adverse market or economic events could result in impairment charges in future periods. Our annual goodwill impairment testing date related to Jefferies as of August 1 did not indicate any goodwill impairment in any of Jefferies reporting units; see Note 14, Intangible Assets, Net and Goodwill in our consolidated financial statements for more information.
Intangible Assets – Intangible assets deemed to have finite lives are amortized on a straight line basis over their estimated useful lives, where the useful life is the period over which the asset is expected to contribute directly, or indirectly, to our future cash flows. Intangible assets are reviewed for impairment on an interim basis when certain events or circumstances exist. If future undiscounted cash flows are estimated to be less than the carrying amounts of the asset groups used to generate those cash flows in subsequent reporting periods, particularly for those with large investments in amortizable intangible assets, impairment charges would have to be recorded.
An intangible asset with an indefinite useful life is not amortized but assessed for impairment annually, or more frequently, when certain events or circumstances exist indicating an assessment for impairment is necessary. Impairment exists when the carrying amount exceeds its fair value. Fair value will be determined using valuation techniques consistent with what a market participant would use. All of our annual indefinite-lived intangible assets were recognized in connection with the Jefferies acquisition, and our impairment testing date is as of August 1. When tested, there was no significant impairment recognized for intangible assets.
Compensation and Benefits – A portion of Jefferies compensation and benefits represents discretionary bonuses, which are finalized at year end. In addition to the level of net revenues, Jefferies overall compensation expense in any given year is influenced by prevailing labor markets, revenue mix, profitability, individual and business performance metrics, and use of share-based compensation programs. We believe the most appropriate way to allocate Jefferies estimated annual total compensation among interim periods is in proportion to projected net revenues earned. Consequently, during the year we accrue Jefferies compensation and benefits based on annual targeted compensation ratios, taking into account the mix of its revenues and the timing of expense recognition.
Contingencies – In the normal course of business, we have been named, from time to time, as a defendant in legal and regulatory proceedings. We are also involved, from time to time, in other exams, investigations and similar reviews (both formal and informal) by governmental and self-regulatory agencies regarding our businesses, certain of which may result in judgments, settlements, fines, penalties or other injunctions.
We recognize a liability for a contingency when it is probable that a liability has been incurred and the amount of loss can be reasonably estimated. If the reasonable estimate of a probable loss is a range, we accrue the most likely amount of such loss, and if such amount is not determinable, then we accrue the minimum in the range as the loss accrual. The determination of the outcome and loss estimates requires significant judgment on the part of management, can be highly subjective and is subject to significant change with the passage of time as more information becomes available. Estimating the ultimate impact of litigation matters is inherently uncertain, in particular because the ultimate outcome will rest on events and decisions of others that may not be within our power to control. We do not believe that any of our current litigation will have a significant adverse effect on our consolidated financial position, results of operations or liquidity; however, if amounts paid at the resolution of litigation are in excess of recorded reserve amounts, the excess could be significant in relation to results of operations for that period. For further information, see Note 27, Commitments, Contingencies and Guarantees in our consolidated financial statements.
42
Results of Operations
Substantially all of our operating businesses sell products or services that are impacted by general economic conditions in the U.S. and to a lesser extent internationally. In recent years general economic conditions reduced the demand for products or services sold by our operating subsidiaries and/or resulted in reduced pricing for products or services. The discussions below concerning revenue and profitability by segment consider current economic conditions and the impact such conditions have had and may continue to have on each segment; however, should general economic conditions worsen we believe that all of our businesses would be adversely impacted.
Historically, our pre-tax operating results have not been predictable from period to period, principally as a result of significant gains or losses from strategic transactions that will not recur in future periods, or from investments that are accounted for under the fair value option. The income or loss recorded on these transactions or investments are typically reflected as part of the corporate segment, and as discussed below we had significant gains from certain investments during 2012 and one during 2013. Jefferies results are being reflected since its acquisition on March 1, 2013. The nature of Jefferies business does not produce predictable or necessarily recurring earnings. We also are expensing all costs related to our investigation and evaluation of our energy industry projects, included in the other operations segment, and these costs increased during 2013 for a specific project nearing the end of its evaluation period. While our beef processing segment and manufacturing businesses (part of our other operations segment) tend to have more predictable or regular earnings, on a consolidated basis the results of these businesses are often less significant and apparent due to the impact of these other transactions and fair value accounting.
A summary of results of continuing operations for the three years ended December 31, 2013 is as follows (in thousands):
2013 | 2012 | 2011 | ||||||||||
Income (loss) from continuing operations before | ||||||||||||
income taxes and income related to | ||||||||||||
associated companies: | ||||||||||||
Investment Banking & Capital Markets | $ | 260,984 | $ | – | $ | – | ||||||
Beef Processing Services | (42,358 | ) | 59,048 | – | ||||||||
Other Operations | (108,395 | ) | (38,859 | ) | 58,674 | |||||||
Corporate | 242,771 | 1,309,444 | (25,364 | ) | ||||||||
Total consolidated income from | ||||||||||||
continuing operations before income | ||||||||||||
taxes and income related to | ||||||||||||
associated companies | $ | 353,002 | $ | 1,329,633 | $ | 33,310 | ||||||
Investment Banking & Capital Markets
The investment banking and capital markets segment is comprised of Jefferies, which was acquired on March 1, 2013 and is reflected in our consolidated financial statements utilizing a one month lag; Jefferies fiscal year ends on November 30 th and its fiscal quarters end one month prior to our reporting periods. A summary of results of operations for Jefferies included in the period from the Jefferies acquisition through December 31, 2013 is as follows (in thousands):
Net revenues | $ | 2,134,002 | ||
Expenses: | ||||
Compensation and benefits | 1,213,908 | |||
Floor brokerage and clearing fees | 150,774 | |||
Depreciation and amortization | 59,631 | |||
Selling, general and other expenses | 448,705 | |||
| 1,873,018 | ||||
Income before income taxes | $ | 260,984 |
The segment comprises many business units, with many interactions and much integration among them. Business activities include the sales, trading, origination and advisory effort for various equity, fixed income, commodities, foreign exchange and advisory services. Jefferies business, by its nature, does not produce predictable or necessarily recurring revenues or earnings. Jefferies results in any given period can be materially affected by conditions in global financial markets, economic conditions generally, and its own activities and positions.
43
The discussion below is presented on a detailed product and expense basis. Net revenues presented for equity and fixed income businesses include allocations of interest income and interest expense as Jefferies assesses the profitability of these businesses inclusive of the net interest revenue or expense associated with the respective sales and trading activities, which is a function of the mix of each business's associated assets and liabilities and the related funding costs.
The following provides a summary of net revenues by source for the period from the Jefferies acquisition through December 31, 2013 (amounts in thousands):
Sales and trading: | ||||
Equities | $ | 578,045 | ||
Fixed income | 507,285 | |||
Total sales and trading | 1,085,330 | |||
Investment banking: | ||||
Capital markets: | ||||
Equities | 228,394 | |||
Debt | 410,370 | |||
Advisory | 369,191 | |||
Total investment banking | 1,007,955 | |||
Other | 40,717 | |||
Total net revenues | $ | 2,134,002 | ||
Net Revenues
Net revenues for the period from the Jefferies acquisition through December 31, 2013 reflect solid performance in Jefferies equity sales and trading business and continued strength in its investment banking platform. Jefferies fixed income businesses experienced difficult trading conditions for a portion of the period as a result of a change in expectations for interest rates surrounding the Federal Reserve's plans for tapering its asset purchase program; though fixed income performance significantly improved during the fourth quarter of 2013. Results include gains of $89.3 million in aggregate within Equities Principal transaction revenues from Jefferies investments in KCG Holdings, Inc. ("Knight Capital") and Harbinger Group Inc. ("Harbinger").
Equities Revenue
Equities revenue is comprised of equity commissions, principal transactions and net interest revenue relating to cash equities, electronic trading, equity derivatives, convertible securities, prime brokerage, securities finance and alternative investment strategies. Equities revenue also includes our share of the net earnings from our joint venture investments in Jefferies Finance, LLC and Jefferies LoanCore, LLC, which are accounted for under the equity method, as well as any changes in the value of our investments in Knight Capital and Harbinger, which are accounted for at fair value.
Equities revenue includes within Principal transaction revenues a gain of $19.5 million on Jefferies investment in Knight Capital and a gain of $69.8 million from Jefferies investment in Harbinger. In addition, included within Interest expense is positive income of $33.7 million from the allocation to Jefferies equities business of a portion of the amortization of premiums arising from the adjustment of Jefferies long-term debt to fair value as part of acquisition accounting.
U.S. equity market conditions during the period were characterized by continually increasing stock prices as the U.S. government maintained its monetary stimulus program. In the equity markets, the NASDAQ Composite Index, the S&P 500 Index and the Dow Jones Industrial Average increased by 28%, 19% and 14%, respectively, with the S&P Index registering a series of record closing highs. However, economic data in the U.S. continued to indicate a slow recovery and geopolitical concerns regarding the Middle East and a U.S. federal government shutdown added volatility in the U.S. and international markets. Despite the rally in the equity markets in 2013, overall market volumes were subdued moderating customer flow in Jefferies U.S. cash equity business, although Jefferies benefited from certain block trading opportunities during the period.
44
In Europe, liquidity returned to the market as the European Central Bank convinced investors that it would not allow the Eurozone to breakup aiding results to both our cash and option desks, although the results are still impacted by relatively low trading volumes given the region's fragile economy. Additionally, Asian equity commissions are stronger, particularly in Japan with new monetary policies increasing trading volumes on the Nikkei Exchange.
Jefferies Securities Finance desk also contributed solidly to Equities revenue for the period and the performance of certain strategic investment strategies were strong. Revenue from Jefferies sales and trading of convertible securities is reflective of increased market share as we have expanded our team in this business. Net earnings from Jefferies Finance and LoanCore joint ventures reflect a solid level of securitization deals and loan closings during the 2013 period.
Fixed Income Revenue
Fixed income revenue includes commissions, principal transactions and net interest revenue from investment grade corporate bonds, mortgage- and asset-backed securities, government and agency securities, municipal bonds, emerging markets debt, high yield and distressed securities, bank loans, foreign exchange and commodities trading activities.
Included within Interest expense for the period is positive income of $40.1 million from the allocation to Jefferies fixed income business of a portion of the amortization of premiums arising from adjusting Jefferies long-term debt to fair value as part of acquisition accounting.
Jefferies second quarter of fiscal 2013 was characterized by improving U.S. macroeconomic conditions, and, through the first half of May 2013, the U.S. Federal Reserve's policies resulted in historically low yields for fixed income securities motivating investors to take on more risk in search for yield. In May 2013, however, the Treasury market experienced a steep sell-off and credit spreads widened across the U.S. fixed income markets in reaction to an anticipated decrease in Federal Reserve treasury issuances and mortgage debt security purchases in future periods. These market conditions negatively impacted Jefferies U.S. rates, corporates and U.S. mortgages revenues through August as the volatility made it difficult to realize net revenue from Jefferies customer flow. In the latter part of the 2013 year, the fixed income markets stabilized with lower volatility and tightening spreads increasing overall customer flows across the various fixed income product classes.
While revenues rebounded towards the end of Jefferies fiscal year for its mortgage-backed securities business, the mid-year sell-off in U.S. Treasuries and the widening of credit spreads for mortgage products negatively impacted the overall results for 2013 by reducing trading volumes and increasing market volatility. Corporate bond revenues were also negatively impacted by the widening of credit spreads in the third quarter though there was significant improvement during the fourth quarter of 2013 with more robust trading volumes and narrowing credit spreads. Municipal securities underperformed as an asset class for a large part of the period as investors discounted greater risk than they had previously although investors began to return to the municipal market at the end of the period increasing Jefferies trading volumes. Components of Jefferies futures business experienced varying degrees of fluctuations in customer trading volume but trading volume was relatively constant when considered overall and across the full period.
While Jefferies U.S. rates, corporates and U.S. mortgages desks underpeformed, its leveraged credit business produced solid results as investors sought investment yields in this fixed income class and issuers of bank debt were active with the supply level creating a positive effect on liquidity in the secondary market. Further, the low interest rate environment in the U.S. caused investors to seek higher yields in emerging market debt. In addition, suppressed long-term interest rates in the U.S. encouraged investment in international mortgage-backed securities resulting in increased trading volumes, improved market liquidity and ultimately increased revenues on Jefferies international mortgage desk, despite experiencing reduced market liquidity and consequently lower levels of secondary market activity during the summer months of 2013.
45
Investment Banking Revenue
Jefferies provides a full range of capital markets and financial advisory services to its clients across most industry sectors primarily in the U.S. and Europe and, to a lesser extent, in Asia, Latin America and Canada. Capital markets revenue includes underwriting and placement revenue related to corporate debt, municipal bonds, mortgage- and asset-backed securities and equity and equity-linked securities. Advisory revenue consists primarily of advisory and transaction fees generated in connection with merger, acquisition and restructuring transactions.
Despite uneven U.S. economic growth and uncertainty surrounding the U.S. Federal Reserve's decision on quantitative easing, capital market conditions continued to improve due to the availability of low-priced credit and a general rise in the stock market during 2013. Mergers and acquisition activity gained momentum through the later part of the 2013 period.
Investment banking revenue during Jefferies fourth quarter of 2013 was Jefferies highest quarter ever. From equity and debt capital raising activities, Jefferies generated $228.4 million and $410.4 million in revenues, respectively. Since the acquisition, Jefferies completed 412 public and private debt financings that raised $162.3 billion in aggregate, as companies took advantage of low borrowing costs and Jefferies completed 130 public equity financings that raised $32.9 billion (111 of which Jefferies acted as sole or joint bookrunner). Jefferies financial advisory revenues totaled $369.2 million during this period, including revenues from 108 merger and acquisition transactions where Jefferies served as financial advisor.
Compensation and Benefits
Compensation and benefits expense consists of salaries, benefits, cash bonuses, commissions, annual cash compensation awards, historical annual share-based compensation awards and the amortization of certain non-annual share-based and cash compensation awards to employees. Cash and historical share-based awards granted to employees as part of year end compensation generally contain provisions such that employees who terminate their employment or are terminated without cause may continue to vest in their awards, so long as those awards are not forfeited as a result of other forfeiture provisions (primarily non-compete clauses) of those awards. Accordingly, the compensation expense for a substantial portion of awards granted at year end as part of annual compensation is fully recorded in the year of the award.
Included within Compensation and benefits expense are share-based amortization expense for senior executive awards granted in January 2010 and September 2012, non-annual share-based and cash-based awards to other employees and certain year end awards that contain future service requirements for vesting. Such awards are being amortized over their respective future service periods and amounted to compensation expense of $197.1 million for the period from the Jefferies acquisition through December 31, 2013. In addition, compensation and benefits expense includes $11.0 million of additional amortization expense related to the write-up of the cost of outstanding share-based awards which had future service requirements at the acquisition date. Compensation and benefits as a percentage of Net revenues was 56.9% for the period from the Jefferies acquisition through December 31, 2013.
Non-Compensation Expenses
Non-compensation expenses include floor brokerage and clearing fees, technology and communications expense, occupancy and equipment rental expense, business development, professional services, depreciation and amortization expense and other costs. All of these expenses, other than floor brokerage and clearing fees and depreciation and amortization expense, are included within Selling, general and other expenses in the Consolidated Statements of Operations. Floor brokerage and clearing expenses for the periods are reflective of the trading volumes in Jefferies fixed income and equities trading businesses, including a meaningful volume of trading by its foreign exchange business. Technology and communications expense includes costs associated with development of the various trading systems and various projects associated with corporate support infrastructure, including technology initiatives to support Dodd-Frank reporting requirements. Professional services expense for the periods includes the merger related expenses discussed above as well as legal and consulting fees incurred as part of implementing various regulatory requirements.
46
Non-compensation expenses include approximately $21.1 million in incremental amortization expense associated with fair value adjustments to identifiable tangible and intangible assets recognized as part of acquisition accounting, $6.3 million in additional lease expense related to recognizing existing leases at their current market value and $11.6 million in merger-related investment banking filing fees. Additionally, during 2013 an $8.7 million charge was recognized due to vacating certain office space in London. Other expenses for 2013 include $38.4 million in litigation expenses, which includes litigation costs related to the final judgment on Jefferies last outstanding auction rate securities legal matter and to agreements reached with the relevant authorities pertaining to an investigation of purchases and sales of mortgage-backed securities.
Beef Processing Services
As more fully discussed above, National Beef was acquired in December 2011. A summary of results of operations for National Beef for the years ended December 31, 2013 and 2012 is as follows (in thousands):
2013 | 2012 | |||||||
Net revenues | $ | 7,487,724 | $ | 7,480,934 | ||||
Expenses: | ||||||||
Cost of sales | 7,308,580 | 7,269,912 | ||||||
Compensation and benefits | 33,447 | 31,638 | ||||||
Interest | 12,272 | 12,431 | ||||||
Depreciation and amortization | 88,483 | 83,063 | ||||||
Selling, general and other expenses | 87,300 | 24,842 | ||||||
| 7,530,082 | 7,421,886 | |||||||
Income (loss) before income taxes | $ | (42,358 | ) | $ | 59,048 | |||
National Beef's profitability is dependent, in large part, on the spread between its cost for live cattle, the primary raw material for its business, and the value received from selling boxed beef and other products. Because National Beef operates in a large and liquid commodity market, it does not have much influence over the price it pays for cattle or the selling price it receives for the products it produces. National Beef's profitability typically fluctuates seasonally as well as cyclically, with relatively higher margins in the spring and summer months and during times of cattle herd expansion.
The USDA reports market values for cattle, beef, offal and other products produced by ranchers, farmers and beef processors. Generally, National Beef expects its profitability to improve as the ratio of the USDA comprehensive boxed beef cutout (a weekly reported measure of the total value of all USDA inspected beef primal cuts, grind and trim produced from fed cattle) to the USDA 5-area weekly average slaughter cattle price increases and for profitability to decline as the ratio decreases. The ratio during 2012 was the lowest ratio for the corresponding periods during the past ten years and was largely unchanged during 2013.
Revenues were largely unchanged during 2013 as compared to 2012 due primarily to slightly higher selling prices but fewer cattle processed. Cost of sales increased during 2013 as compared to 2012 as cattle prices rose to record high levels, due in part to the declining U.S. cattle herd, which was exacerbated by drought conditions across key cattle raising areas in 2012. As a result, gross margins were compressed during 2013. In addition, National Beef's profitability during 2013 declined as compared to 2012 due to the reduction in gross margin generated by the consumer-ready facilities, as discussed below.
During 2013, Walmart discontinued using National Beef as a provider of its consumer-ready products. National Beef has two consumer-ready processing facilities, one of which was completely dedicated to Walmart's business and the other substantially so dedicated. Total consumer-ready revenues were approximately 7% of National Beef consolidated revenues during 2012, but as a value-added product, consumer-ready products have historically constituted a higher percentage of National Beef's gross margin. Since 2008, consumer-ready products have represented from 10% to 26% of National Beef's total gross margin, and were at the higher end of that range in 2012 due, in part, to reduced gross margin from other National Beef products. National Beef continues to pursue replacement business for its consumer-ready facilities; however, it may not be able to fully replace the operating cash flow generated by these facilities in the near future, if at all. If National Beef concludes its best course of action is to close one or both consumer-ready facilities, impairment charges may be recorded if the fair value of those facilities on a held for sale basis is less than the book value.
47
During 2013, the two consumer-ready facilities operated at reduced levels, resulting in an approximate 50% reduction in the number of personnel employed at the facilities. In connection with the reduction in the labor force, National Beef recorded charges of approximately $1.9 million during 2013.
As discussed above, during the fourth quarter of 2013 National Beef decided to close its beef processing facility located in Brawley, California; the facility is expected to close in April 2014. Closing the facility is expected to result in improved cash flows from National Beef's operations. National Beef evaluated the recoverability of the long-lived assets at Brawley, which had an aggregate carrying amount of $93.2 million at December 31, 2013, and based on its estimate of future undiscounted cash flows concluded that the carrying value was not recoverable and the facility was impaired. As a result, National Beef concluded that the fair value of the long-lived assets at the Brawley facility is $29.9 million at December 31, 2013, and recorded an impairment loss of $63.3 million, which is reflected in Selling, general and other expenses in the Consolidated Statement of Operations for the year ended December 31, 2013. As with any estimate of fair value, future market, regulatory and general economic conditions as well as the obsolescence, future deterioration of, or inability to locate a purchaser should National Beef decide to sell the facility could have a significant effect on their future value.
In addition to the long-lived asset impairment charge, National Beef expects to incur additional costs relating to the closing of the facility during 2014. These costs include costs for fulfilling certain contractual obligations, employee separation and retention, systems decommissioning and various other expenses. National Beef currently estimates that these costs could be up to $20.0 million in the aggregate. Under GAAP, these costs may not be accrued until they are actually incurred.
Other Operations
A summary of results of operations for other operations for the three years in the period ended December 31, 2013 is as follows (in thousands):
2013 | 2012 | 2011 | ||||||||||
Net revenues | $ | 347,275 | $ | 333,415 | $ | 410,526 | ||||||
Expenses: | ||||||||||||
Cost of sales | 259,127 | 209,834 | 215,963 | |||||||||
Compensation and benefits | 22,300 | 26,759 | 25,679 | |||||||||
Depreciation and amortization | 9,386 | 13,598 | 13,503 | |||||||||
Selling, general and other expenses | 164,857 | 122,083 | 96,707 | |||||||||
| 455,670 | 372,274 | 351,852 | ||||||||||
Income (loss) before income taxes | $ | (108,395 | ) | $ | (38,859 | ) | $ | 58,674 | ||||
Other operations include manufacturing, real estate, energy projects and, until it was distributed to shareholders in February 2013, winery operations conducted by Crimson. Other operations for 2013 also include our newly formed asset management business. Amounts for Crimson for the years ended December 31, 2013, 2012 and 2011 include revenues of $9.0 million, $48.2 million and $38.6 million, respectively, and pre-tax profits of $1.5 million and $5.4 million for 2013 and 2012, respectively, and were not significant for 2011. Net revenues in 2011 include a gain of $81.8 million on forgiveness of debt related to the Myrtle Beach real estate project.
For the years ended December 31, 2013, 2012 and 2011, revenues for manufacturing were $310.8 million, $252.9 million and $245.0 million, respectively, revenues for real estate were $16.7 million, $10.9 million and $96.5 million, respectively. Revenues with respect to government grants to reimburse us for certain expenditures related to energy projects were $3.7 million and $5.4 million for 2013 and 2011, respectively, and were not significant for 2012.
For the years ended December 31, 2013, 2012 and 2011, depreciation and amortization expenses for manufacturing were $13.0 million, $12.0 million and $11.8 million, respectively, and depreciation and amortization expenses for real estate were $3.7 million, $3.6 million and $3.5 million, respectively. Certain of these amounts are classified within Cost of sales and Selling, general and other expenses.
48
For the years ended December 31, 2013, 2012 and 2011, selling, general and other expenses for manufacturing were $5.8 million, $5.9 million and $8.2 million, respectively. Selling, general and other expenses for real estate were $34.1 million, $17.4 million and $10.3 million for 2013, 2012 and 2011, respectively; included in these amounts were impairment charges for various real estate projects of $20.0 million and $4.2 million for 2013 and 2012, respectively. For the year ended December 31, 2013, impairment charges related to real estate include an out of period adjustment of $15.4 million to record charges related to prior periods. For the years ended December 31, 2013, 2012 and 2011, selling, general and other expenses also include $91.3 million, $33.2 million and $33.6 million, respectively, related to the investigation and evaluation of our energy projects (principally professional fees and other costs). Selling, general and other expenses for 2012 include a charge of $20.0 million for estimated potential losses related to a legal proceeding, which is discussed in Note 27, Commitments, Contingencies and Guarantees in our consolidated financial statements. The change in selling, general and other expenses during 2013 as compared to 2012 also reflects greater legal fees and costs related to certain litigation and lower costs for the winery operations.
For the years ended December 31, 2013, 2012 and 2011, pre-tax profits for manufacturing were $24.9 million, $17.9 million and $2.1 million, respectively. Real estate generated pre-tax losses of $23.0 million and $11.9 million for 2013 and 2012, respectively, and pre-tax income, inclusive of the gain on debt forgiveness, of $80.9 million in 2011.
Corporate
A summary of results of operations for corporate for the three years in the period ended December 31, 2013 is as follows (in thousands):
2013 | 2012 | 2011 | ||||||||||
Net revenues | $ | 460,490 | $ | 1,590,983 | $ | 232,105 | ||||||
Expenses: | ||||||||||||
Compensation and benefits | 83,005 | 107,748 | 54,800 | |||||||||
Interest | 72,217 | 80,150 | 111,672 | |||||||||
Depreciation and amortization | 9,924 | 19,727 | 23,296 | |||||||||
Selling, general and other expenses | 52,573 | 73,914 | 67,701 | |||||||||
| 217,719 | 281,539 | 257,469 | ||||||||||
Income (loss) before income taxes | $ | 242,771 | $ | 1,309,444 | $ | (25,364 | ) | |||||
Net revenues for corporate include unrealized gains (losses) on corporate securities classified as trading assets for which the fair value option was elected. Unrealized gains (losses) were $182.7 million, $331.4 million and $(674.4) million for the years ended December 31, 2013, 2012 and 2011, respectively. Net realized securities gains for corporate aggregated $243.5 million, $590.6 million and $641.5 million for the years ended December 31, 2013, 2012 and 2011, respectively. In 2013, security gains include $227.6 million related to the sale of Inmet. In 2012 and 2011, security gains included gains of $543.7 million and $628.2 million, respectively, from the sale of our common shares of Fortescue.
Corporate other income was $14.1 million, $649.7 million and $234.5 million for the years ended December 31, 2013, 2012 and 2011, respectively. Other income includes $116.8 million and $214.5 million for 2012 and 2011, respectively, related to interest income on the FMG Note. Corporate other income also includes a gain on the redemption of the FMG Note of $526.2 million in 2012. Depreciation and amortization expenses include prepaid mining interest amortization related to the FMG Note of $6.9 million and $11.8 million for 2012 and 2011, respectively, which was being amortized over time in proportion to the amount of ore produced.
The decrease in interest expense primarily reflects the maturity of certain of our debt securities during 2013 and repurchases of certain of our debt securities during the prior two years. Interest expense also reflects the issuance of $750.0 million principal amount of 5 ½% Senior Notes due 2023 and $250.0 million principal amount of 6.625% Senior Notes due 2043 in October 2013.
49
For the years ended December 31, 2013, 2012 and 2011, compensation and benefits includes accrued incentive bonus expense of $22.1 million, $71.2 million and $8.4 million, respectively, of which $6.5 million, $37.0 million and $(2.1) million, respectively, related to our Senior Executive Annual Incentive Bonus Plan. Bonus accruals under the Senior Executive Annual Incentive Bonus Plan are based on a percentage of pre-tax profits as defined in the plan. Other corporate incentive bonuses are discretionary and not determined based on any mathematical formula. In addition, compensation and benefits for 2013 includes an accrual of $8.3 million related to retention agreements with certain executive officers.
Share-based compensation expense relating to grants made under our senior executive warrant plan and the fixed stock option plan was $9.6 million, $14.3 million and $23.0 million in 2013, 2012 and 2011, respectively. The change in share-based compensation expense in 2012 as compared to the prior year was principally due to the warrants granted under our senior executive warrant plan in the second quarter of 2011, which were issued and vested 20% upon shareholder approval in the second quarter of 2011. Share-based compensation expense related to restricted stock awards was $13.2 million for 2013.
Selling, general and other expenses for 2013 include costs related to the acquisition of Jefferies of $7.0 million and consent fees of $2.3 million paid to amend a covenant in our senior note indenture to permit additional borrowings by Material Subsidiaries, as defined. Selling, general and other expenses include expenses related to the repurchase of certain of our debt securities of $24.2 million and $6.4 million in 2012 and 2011, respectively. Selling, general and other expenses include costs for the investigation of investment opportunities and fees due for consummated transactions of $5.5 million and $18.8 million in 2012 and 2011, respectively, including $14.8 million related to the acquisition of National Beef in 2011.
Income Taxes
For year ended December 31, 2013, the provision for income taxes includes a charge of $12.3 million to reserve for a portion of our net deferred tax asset for state income taxes, resulting from the change in our expected state tax filings as a result of the Jefferies acquisition. The tax provision for 2013, 2012 and 2011 includes state and foreign income taxes of $39.1 million, $48.0 million and $33.8 million, respectively.
We elected the fair value option for our investment in Jefferies for periods prior to the Jefferies acquisition in March 2013. As of December 31, 2012, we had recorded a deferred tax liability related to our investment in Jefferies of $34.0 million. For the year ended December 31, 2013, the income tax provision includes the reversal of that deferred tax liability. In addition, since there was no net income tax provision recorded for income related to the fair value option for Jefferies for the year ended December 31, 2013, our effective tax rate was lower as a result of the acquisition, and the impact on the tax provision was a benefit of $64.0 million.
Associated Companies
Income (losses) related to associated companies includes the following for the three years ended December 31, 2013 (in thousands):
2013 | 2012 | 2011 | ||||||||||
Berkadia | $ | 84,678 | $ | 38,026 | $ | 29,033 | ||||||
Garcadia companies | 39,399 | 31,738 | 19,996 | |||||||||
Linkem | (22,719 | ) | (18,890 | ) | (2,243 | ) | ||||||
HomeFed | 3,539 | 1,891 | 1,410 | |||||||||
JHYH | 7,178 | 33,938 | 11,211 | |||||||||
Other | 6,966 | 1,946 | 2,606 | |||||||||
Total | $ | 119,041 | $ | 88,649 | $ | 62,013 | ||||||
For the year ended December 31, 2013, our share of Berkadia's income includes an out of period adjustment of $16.4 million to record income related to prior periods.
In partnership with Jefferies, we had an equity investment in JHYH, a broker-dealer engaged in making markets and trading of high yield and special situation securities. Our interest in JHYH was contributed to Jefferies after the acquisition.
50
Discontinued Operations
Sangart
In October 2013, we concluded that we would no longer continue to fund Sangart's research and development operations, through which we had conducted our medical product development operations. We commenced and completed an orderly shut-down of Sangart's operations during 2013; as a result, our medical product development operations have been classified as a discontinued operation. Pre-tax losses of Sangart were $36.5 million, $45.0 million and $42.7 million for the years ended December 31, 2013, 2012 and 2011, respectively.
Gaming Entertainment
In December 2013, we entered into an agreement to sell Premier, through which we had conducted our gaming entertainment operations, for aggregate cash consideration of $250.0 million. Closing of the transaction is subject to regulatory approval and customary closing conditions, and is not expected to occur until the second quarter of 2014. As a result, our gaming entertainment segment has been classified as a discontinued operation. Revenues for Premier were $115.4 million, $119.3 million and $117.2 million for the years ended December 31, 2013, 2012 and 2011, respectively. Pre-tax income for Premier was $18.1 million, $13.2 million and $12.5 million for 2013, 2012 and 2011, respectively.
Oil and Gas Drilling Services
In October 2012, we sold Keen, recorded a pre-tax loss on sale of discontinued operations of $18.0 million and classified its historical operating results as a discontinued operation. Pre-tax income (losses) of Keen were $(5.3) million in 2012 and $3.5 million in 2011.
Telecommunications
During 2011, additional final payments were received from the buyer of STi Prepaid and we recognized a gain from discontinued operations of $9.7 million.
Other Operations
During the third quarter of 2013, we sold a small power production business and recorded a pre-tax gain on sale of discontinued operations of $6.4 million.
During 2012, we sold our small Caribbean-based telecommunications provider for aggregate consideration of $27.5 million, net of working capital adjustments, and recognized a pre-tax gain on sale of discontinued operations of $11.7 million. We did not classify this business' historical results of operations or its assets and liabilities as discontinued operations because such amounts were not significant.
Other
Income from discontinued operations also reflects distributions of $5.7 million and $4.7 million for 2012 and 2011, respectively, from Empire, which has been undergoing a voluntary liquidation, was classified as a discontinued operation in 2001 and was written-off based on its expected future cash flows at that time. During 2013, we sold Empire for cash consideration of $3.2 million, subject to certain post-closing working capital adjustments, and the sale resulted in the recognition of a tax benefit of $5.4 million. Gain on disposal of discontinued operations reflects an after tax gain of $8.6 million for this sale.
51
Item 7A . Quantitative and Qualitative Disclosures About Market Risk .
The following includes "forward-looking statements" that involve risk and uncertainties. Actual results could differ materially from those projected in the forward-looking statements. The discussion of risk is presented separately for Jefferies and the balance of our company.
The potential for changes in the value of financial instruments is referred to as market risk. Jefferies market risk generally represents the risk of loss that may result from a change in the value of a financial instrument as a result of fluctuations in interest rates, credit spreads, equity prices, commodity prices and foreign exchange rates, along with the level of volatility. Interest rate risks result primarily from exposure to changes in the yield curve, the volatility of interest rates, and credit spreads. Equity price risks result from exposure to changes in prices and volatilities of individual equities, equity baskets and equity indices. Commodity price risks result from exposure to the changes in prices and volatilities of individual commodities, commodity baskets and commodity indices. Market risk arises from market making, proprietary trading, underwriting, specialist and investing activities. Jefferies seeks to manage its exposure to market risk by diversifying exposures, controlling position sizes, and establishing economic hedges in related securities or derivatives. Due to imperfections in correlations, gains and losses can occur even for positions that are hedged. Position limits in trading and inventory accounts are established and monitored on an ongoing basis. Each day, consolidated position and exposure reports are prepared and distributed to various levels of management, which enable management to monitor inventory levels and results of the trading groups.
Value-at-Risk
Within Jefferies, Value-at-Risk (VaR) is used as a measurement of market risk using a model that simulates revenue and loss distributions on substantially all financial instruments by applying historical market changes to the current portfolio. Using the results of this simulation, VaR measures the potential loss in value of our financial instruments over a specified time horizon at a given confidence level. Jefferies calculates a one-day VaR using a one year look-back period measured at a 95% confidence level. This implies that, on average, Jefferies expects to realize a loss of daily trading net revenue at least as large as the VaR amount on one out of every twenty trading days.
As with all measures of VaR, the estimate has inherent limitations due to the assumption that historical changes in market conditions are representative of the future. Furthermore, the VaR model measures the risk of a current static position over a one-day horizon and might not capture the market risk of positions that cannot be liquidated or offset with hedges in a one-day period. Published VaR results reflect past trading positions while future risk depends on future positions.
While Jefferies believes the assumptions and inputs in its risk model are reasonable, Jefferies could incur losses greater than the reported VaR because the historical market prices and rates changes may not be an accurate measure of future market events and conditions. Consequently, this VaR estimate is only one of a number of tools Jefferies uses in its daily risk management activities. When comparing the VaR numbers to those of other firms, it is important to remember that different methodologies and assumptions could produce significantly different results.
The VaR numbers below are shown separately for interest rate, equity, currency and commodity products, as well as for Jefferies overall trading positions using the past 365 days of historical data. The aggregated VaR presented here is less than the sum of the individual components (i.e., interest rate risk, foreign exchange rate risk, equity risk and commodity price risk) due to the benefit of diversification among the four risk categories. Diversification benefit equals the difference between aggregated VaR and the sum of VaRs for the four risk categories and arises because the market risk categories are not perfectly correlated. The following table illustrates the VaR for each component of market risk (in millions).
Daily VaR (1) | ||||||||||||||||
Value-at-Risk In Trading Portfolios | ||||||||||||||||
VaR as of | Daily VaR for the Year Ended | |||||||||||||||
November 30, 2013 | November 30, 2013 | |||||||||||||||
Risk Categories | ||||||||||||||||
Average | High | Low | ||||||||||||||
Interest Rates | $ | 7.33 | $ | 5.38 | $ | 9.46 | $ | 3.68 | ||||||||
Equity Prices | 12.22 | 6.57 | 12.37 | 3.85 | ||||||||||||
Currency Rates | 0.56 | 0.83 | 2.07 | 0.11 | ||||||||||||
Commodity Prices | 0.74 | 0.94 | 1.70 | 0.37 | ||||||||||||
Diversification Effect (2) | (4.60 | ) | (3.29 | ) | N/A | N/A | ||||||||||
Firmwide | $ | 16.25 | $ | 10.43 | $ | 16.25 | $ | 6.00 | ||||||||
(1) | VaR is the potential loss in value of Jefferies trading positions due to adverse market movements over a defined time horizon with a specific confidence level. For the VaR numbers reported above, a one-day time horizon, with a one year look-back period, and a 95% confidence level were used. |
(2) | The diversification effect is not applicable for the maximum and minimum VaR values as the Jefferies VaR and VaR values for the four risk categories might have occurred on different days during the period |
52
The primary method used to test the efficacy of the VaR model is to compare actual daily net revenue for those positions included in the VaR calculation with the daily VaR estimate. This evaluation is performed at various levels of the trading portfolio, from the holding company level down to specific business lines. For the VaR model, trading related revenue is defined as principal transaction revenue, trading related commissions, revenue from securitization activities and net interest income. For a 95% confidence one day VaR model (i.e., no intra-day trading), assuming current changes in market value are consistent with the historical changes used in the calculation, net trading losses would not be expected to exceed the VaR estimates more than twelve times on an annual basis (i.e., once in every 20 days). During the three months ended November 30, 2013, results of the evaluation at the aggregate level demonstrated no days when the net trading loss exceeded the 95% one day VaR. For the full fiscal year 2013, there were two days when the net trading loss exceeded the 95% one day VaR. Exclusive of the Knight Capital position, there were no days during the fiscal year when the net trading loss exceeded the 95% one day VaR.
Certain individual positions within financial instruments are not included in the VaR model because VaR is not the most appropriate measure of risk. Accordingly, Risk Management has additional procedures in place to assure that the level of potential loss that would arise from market movements are within acceptable levels. Such procedures include performing stress tests, monitoring concentration risk and tracking price target/stop loss levels. The table below presents the potential reduction in net income associated with a 10% stress of or the sensitivity to a 10% stress of the fair value of the positions that are not included in the VaR model at November 30, 2013 (in thousands):
10% Sensitivity | ||||
Private investments | $ | 17,518 | ||
Corporate debt securities in default | 7,231 | |||
Trade claims | 5,034 | |||
Scenario Analysis and Stress Tests
While VaR measures potential losses due to adverse changes in historical market prices and rates, Jefferies uses stress testing to analyze the potential impact of specific events or moderate or extreme market moves on its current portfolio both firm wide and within business segments. Stress scenarios comprise both historical market price and rate changes and hypothetical market environments, and generally involve simultaneous changes of many risk factors. Indicative market changes in Jefferies scenarios include, but are not limited to, a large widening of credit spreads, a substantial decline in equities markets, significant moves in selected emerging markets, large moves in interest rates, changes in the shape of the yield curve and large moves in European markets. In addition, Jefferies also performs ad hoc stress tests and add new scenarios as market conditions dictate. Because Jefferies stress scenarios are meant to reflect market moves that occur over a period of time, its estimates of potential loss assume some level of position reduction for liquid positions. Unlike Jefferies VaR, which measures potential losses within a given confidence interval, stress scenarios do not have an associated implied probability; rather, stress testing is used to estimate the potential loss from market moves that tend to be larger than those embedded in the VaR calculation.
Stress testing is performed and reported regularly as part of the risk management process. Stress testing is used to assess Jefferies aggregate risk position as well as for limit setting and risk/reward analysis.
Counterparty Credit Risk and Issuer Country Exposure
Counterparty Credit Risk
Credit risk is the risk of loss due to adverse changes in a counterparty's credit worthiness or its ability or willingness to meet its financial obligations in accordance with the terms and conditions of a financial contract. Jefferies is exposed to credit risk as trading counterparty to other broker-dealers and customers, as a direct lender and through extending loan commitments, as a holder of securities and as a member of exchanges and clearing organizations.
It is critical to Jefferies financial soundness and profitability that Jefferies properly and effectively identify, assess, monitor and manage the various credit and counterparty risks inherent in its businesses. Credit is extended to counterparties in a controlled manner in order to generate acceptable returns, whether such credit is granted directly or is incidental to a transaction. All extensions of credit are monitored and managed on a Jefferies enterprise level in order to limit exposure to loss related to credit risk.
53
Jefferies employs a Credit Risk Framework, which is responsible for identifying credit risks throughout its operating businesses, establishing counterparty limits and managing and monitoring those credit limits. Jefferies framework includes:
· | defining credit limit guidelines and credit limit approval processes; |
· | providing a consistent and integrated credit risk framework across the enterprise; |
· | approving counterparties and counterparty limits with parameters set by its Risk Management Committee; |
· | negotiating, approving and monitoring credit terms in legal and master documentation; |
· | delivering credit limits to all relevant sales and trading desks; |
· | maintaining credit reviews for all active and new counterparties; |
· | operating a control function for exposure analytics and exception management and reporting; |
· | determining the analytical standards and risk parameters for on-going management and monitoring of global credit risk books; |
· | actively managing daily exposure, exceptions, and breaches; |
· | monitoring daily margin call activity and counterparty performance (in concert with the Margin Department); and |
· | setting the minimum global requirements for systems, reports, and technology. |
Jefferies Credit Exposures
Credit exposure exists across a wide-range of products including cash and cash equivalents, loans, securities finance transactions and over-the-counter derivative contracts.
· | Loans and lending arise in connection with our capital markets activities and represents the notional value of loans that have been drawn by the borrower and lending commitments outstanding. |
· | Securities and margin finance includes credit exposure arising on securities financing transactions (reverse repurchase agreements, repurchase agreements and securities lending agreements) to the extent the fair value of the underlying collateral differs from the contractual agreement amount and from margin provided to customers. |
· | Derivatives represent over-the-counter ("OTC") derivatives, which are reported net by counterparty when a legal right of setoff exists under an enforceable master netting agreement. Derivatives are accounted for at fair value net of cash collateral received or posted under credit support agreements. In addition, credit exposures on forward settling trades are included within Jefferies derivative credit exposures. |
· | Cash and cash equivalents include both interest-bearing and non-interest bearing deposits at banks. |
Current counterparty credit exposures are summarized in the table below and provided by credit quality, region and industry. Credit exposures presented take netting and collateral into consideration by counterparty and master agreement. Collateral taken into consideration includes both collateral received as cash as well as collateral received in the form of securities or other arrangements. Current exposure is the loss that would be incurred on a particular set of positions in the event of default by the counterparty, assuming no recovery. Current exposure equals the fair value of the positions less collateral. Issuer risk is the credit risk arising from inventory positions (for example, corporate debt securities and secondary bank loans). Issuer risk is included in Jefferies country risk exposure tables below. The amounts in the tables below are for amounts included in our Consolidated Statement of Financial Condition at December 31, 2013 (in millions).
54
Counterparty Credit Exposure by Credit Rating
Loans and Lending | Securities and Margin Finance | OTC Derivatives |
Total | Cash and Cash Equivalents | Total with Cash and Cash Equivalents | |||||||||||||||||||
AAA Range | $ | – | $ | 0.2 | $ | – | $ | 0.2 | $ | 2,680.6 | $ | 2,680.8 | ||||||||||||
AA Range | – | 104.8 | 14.7 | 119.5 | 144.1 | 263.6 | ||||||||||||||||||
A Range | – | 374.4 | 56.7 | 431.1 | 734.7 | 1,165.8 | ||||||||||||||||||
BBB Range | 71.0 | 39.9 | 16.2 | 127.1 | 1.7 | 128.8 | ||||||||||||||||||
BB or Lower | 120.3 | 115.4 | 9.5 | 245.2 | – | 245.2 | ||||||||||||||||||
Unrated | 86.6 | – | 18.6 | 105.2 | – | 105.2 | ||||||||||||||||||
Total | $ | 277.9 | $ | 634.7 | $ | 115.7 | $ | 1,028.3 | $ | 3,561.1 | $ | 4,589.4 | ||||||||||||
Counterparty Credit Exposure by Region
Loans and Lending | Securities and Margin Finance | OTC Derivatives |
Total | Cash and Cash Equivalents | Total with Cash and Cash Equivalents | |||||||||||||||||||
Asia/Latin America/Other | $ | – | $ | 30.9 | $ | 11.6 | $ | 42.5 | $ | 183.3 | $ | 225.8 | ||||||||||||
Europe | – | 180.3 | 47.6 | 227.9 | 269.3 | 497.2 | ||||||||||||||||||
North America | 277.9 | 423.5 | 56.5 | 757.9 | 3,108.5 | 3,866.4 | ||||||||||||||||||
Total | $ | 277.9 | $ | 634.7 | $ | 115.7 | $ | 1,028.3 | $ | 3,561.1 | $ | 4,589.4 | ||||||||||||
Counterparty Credit Exposure by Industry
Loans and Lending | Securities and Margin Finance | OTC Derivatives | Total | Cash and Cash Equivalents | Total with Cash and Cash Equivalents | |||||||||||||||||||
Asset Managers | $ | – | $ | 7.1 | $ | 0.5 | $ | 7.6 | $ | 2,680.7 | $ | 2,688.3 | ||||||||||||
Banks, Broker-dealers | – | 354.9 | 73.8 | 428.7 | 880.4 | 1,309.1 | ||||||||||||||||||
Commodities | – | 35.6 | 9.4 | 45.0 | – | 45.0 | ||||||||||||||||||
Other | 277.9 | 237.1 | 32.0 | 547.0 | – | 547.0 | ||||||||||||||||||
Total | $ | 277.9 | $ | 634.7 | $ | 115.7 | $ | 1,028.3 | $ | 3,561.1 | $ | 4,589.4 | ||||||||||||
For additional information regarding credit exposure to OTC derivative contracts, see Note 7, Derivative Financial Instruments, in our consolidated financial statements.
Jefferies Country Risk Exposure
Country risk is the risk that events or developments that occur in the general environment of a country or countries due to economic, political, social, regulatory, legal or other factors, will affect the ability of obligors of the country to honor their obligations. Jefferies defines country risk as the country of jurisdiction or domicile of the obligor. The following tables reflect Jefferies top exposures to the sovereign governments, corporations and financial institutions in those non-U.S. countries in which there is net long issuer and counterparty exposure, as reflected in our Consolidated Statement of Financial Condition at December 31, 2013 (in millions):
Issuer Risk | Counterparty Risk | Issuer and Counterparty Risk | ||||||||||||||||||||||||||||||||||
Fair Value of Long Debt Securities | Fair Value of Short Debt Securities | Net Derivative Notional Exposure | Loans and Lending | Securities and Margin Finance | OTC Derivatives | Cash and Cash Equivalents | Excluding Cash and Cash Equivalents | Including Cash and Cash Equivalents | ||||||||||||||||||||||||||||
Great Britain | $ | 418.8 | $ | (181.5 | ) | $ | (27.2 | ) | $ | – | $ | 42.5 | $ | 20.7 | $ | 113.1 | $ | 273.3 | $ | 386.4 | ||||||||||||||||
Germany | 462.0 | (226.1 | ) | (70.5 | ) | – | 93.2 | 10.9 | 3.3 | 269.5 | 272.8 | |||||||||||||||||||||||||
Netherlands | 445.7 | (198.8 | ) | (2.3 | ) | – | 5.2 | 1.5 | 0.3 | 251.3 | 251.6 | |||||||||||||||||||||||||
Italy | 1,181.4 | (1,017.6 | ) | 74.2 | – | 1.8 | 0.1 | – | 239.9 | 239.9 | ||||||||||||||||||||||||||
Canada | 140.6 | (59.0 | ) | 18.8 | – | 99.5 | 0.2 | 2.2 | 200.1 | 202.3 | ||||||||||||||||||||||||||
Spain | 352.3 | (159.8 | ) | 0.3 | – | 3.0 | 0.2 | 0.1 | 196.0 | 196.1 | ||||||||||||||||||||||||||
Puerto Rico | 130.1 | – | – | – | – | – | – | 130.1 | 130.1 | |||||||||||||||||||||||||||
Luxembourg | 75.0 | (15.1 | ) | – | – | 0.1 | – | 68.0 | 60.0 | 128.0 | ||||||||||||||||||||||||||
Hong Kong | 33.9 | (18.3 | ) | (0.9 | ) | – | 0.3 | – | 104.3 | 15.0 | 119.3 | |||||||||||||||||||||||||
Austria | 130.2 | (32.8 | ) | – | – | 5.0 | – | 0.1 | 102.4 | 102.5 | ||||||||||||||||||||||||||
Total | $ | 3,370.0 | $ | (1,909.0 | ) | $ | (7.6 | ) | $ | – | $ | 250.6 | $ | 33.6 | $ | 291.4 | $ | 1,737.6 | $ | 2,029.0 | ||||||||||||||||
55
Exposure to the Sovereign Debt, Corporate and Financial Securities of Greece, Ireland, Italy, Portugal and Spain
As detailed below, Jefferies exposure to the sovereign debt of Greece, Ireland, Italy, Portugal, and Spain (before economic derivative hedges) was a net long of $194.0 million.
The table below reflects not only Jefferies exposure to the sovereign debt of Greece, Ireland, Italy, Portugal, and Spain but also includes its exposure to the securities of corporations, financial institutions and mortgage-backed securities collateralized by assets domiciled in these countries, as reflected in our Consolidated Statement of Financial Condition at December 31, 2013. This table is presented in a manner consistent with how Jefferies management views and monitors these exposures as part of its risk management framework. Issuer exposure to these European countries arises primarily in the context of Jefferies market making activities and its role as a major dealer in the debt securities of these countries. Accordingly, issuer risk arises due to holding securities as long and short inventory, which does not carry counterparty credit exposure. While the economic derivative hedges are presented on a notional basis, Jefferies believes this best reflects the reduction in the underlying market risk due to interest rates or the issuer's credit as a result of the hedges. Long and short financial instruments are offset against each other for determining net exposure although they do not represent identical offsetting positions of the same debt security. Components of risk embedded in the securities will generally offset, however, basis risk due to duration and the specific issuer may still exist. Economic hedges as represented by the notional amounts of the derivative contracts may not be perfect offsets for the risk represented by the net fair value of the debt securities. Additional information relating to the derivative contracts, including the fair value of the derivative positions, is included in the following pages.
(In millions) | Sovereigns | Corporations | Financial Institutions | Structured Products | Total | |||||||||||||||
Financial instruments owned - Debt securities | ||||||||||||||||||||
Greece | $ | – | (4) | $ | 9.4 | $ | 0.9 | (4) | $ | 3.0 | $ | 13.3 | ||||||||
Ireland | 2.1 | (4) | 18.4 | 17.9 | (4) | – | 38.4 | |||||||||||||
Italy | 1,088.0 | (4) | 40.0 | 49.4 | (4) | 4.0 | 1,181.4 | |||||||||||||
Portugal | 1.2 | (4) | .6 | 11.3 | (4) | 6.0 | 19.1 | |||||||||||||
Spain | 224.0 | (4) | 17.5 | 25.7 | (4) | 85.0 | 352.2 | |||||||||||||
Total fair value of long debt securities (1) | 1,315.3 | (4) | 85.9 | 105.2 | (4) | 98.0 | 1,604.4 | |||||||||||||
Financial instruments sold - Debt securities | ||||||||||||||||||||
Greece | – | (4) | 3.6 | 0.8 | – | 4.4 | ||||||||||||||
Ireland | 4.6 | (4) | 11.6 | 0.2 | – | 16.4 | ||||||||||||||
Italy | 989.7 | (4) | 12.7 | 15.2 | – | 1,017.6 | ||||||||||||||
Portugal | – | (4) | 0.4 | – | – | 0.4 | ||||||||||||||
Spain | 127.0 | (4) | 15.9 | 16.9 | – | 159.8 | ||||||||||||||
Total fair value of short debt securities (2) | 1,121.3 | (4) | 44.2 | 33.1 | – | 1,198.6 | ||||||||||||||
Total net fair value of debt securities | 194.0 | 41.7 | 72.1 | 98.0 | 405.8 | |||||||||||||||
Derivative contracts - long notional exposure | ||||||||||||||||||||
Greece | – | 1.0 | 2.8 | – | 3.8 | |||||||||||||||
Ireland | – | 17.8 | – | – | 17.8 | |||||||||||||||
Italy | 371.0 | (5) | – | – | – | 371.0 | ||||||||||||||
Portugal | – | – | – | – | – | |||||||||||||||
Spain | – | – | 0.3 | – | 0.3 | |||||||||||||||
Total notional amount - long (6) | 371.0 | 18.8 | 3.1 | – | 392.9 | |||||||||||||||
Derivative contracts - short notional exposure | ||||||||||||||||||||
Greece | – | 2.0 | – | – | 2.0 | |||||||||||||||
Ireland | – | 9.8 | 6.6 | – | 16.4 | |||||||||||||||
Italy | 276.4 | (5) | – | 20.4 | – | 296.8 | ||||||||||||||
Portugal | – | – | – | – | – | |||||||||||||||
Spain | – | – | – | – | – | |||||||||||||||
Total notional amount - short (6) | 276.4 | 11.8 | 27.0 | – | 315.2 | |||||||||||||||
Total net derivative notional exposure (3) | 94.6 | 7.0 | (23.9 | ) | – | 77.7 | ||||||||||||||
Total net exposure to select European countries | $ | 288.6 | $ | 48.7 | $ | 48.2 | $ | 98.0 | $ | 483.5 | ||||||||||
56
(1) | Long securities represent the fair value of debt securities and are presented within Trading assets on the face of the Consolidated Statement of Financial Condition and are accounted for at fair value with changes in fair value recognized in Principal transactions revenue. |
(2) | Short securities represent the fair value of debt securities sold short and are presented within Trading liabilities on the face of the Consolidated Statement of Financial Condition and are accounted for at fair value with changes in fair value recognized in Principal transactions revenue. |
(3) | Net derivative contracts reflect the notional amount of the derivative contracts and include credit default swaps, bond futures and listed equity options. |
(4) | Classification of securities by country and by issuer type is presented based on the view of Jefferies Risk Management Department. Jefferies Risk Management takes into account whether a particular security or issuer of a security is guaranteed or otherwise backed by a sovereign government and also takes into account whether a corporate or financial institution that issues a particular security is owned by a sovereign government when determining domicile and whether a particular security should be classified for risk purposes as a sovereign obligation. The classification of debt securities within the table above will differ from the financial statement presentation in the Consolidated Statement of Financial Condition because the classification used for financial statement presentation in the Consolidated Statement of Financial Condition classifies a debt security solely by the direct issuer and the domicile of the direct issuer. |
(5) | These positions are comprised of bond futures executed on exchanges outside Italy. |
(6) | See further information regarding derivatives on the tables following. |
(In millions) | Greece | Ireland | Italy | Portugal | Spain | Total | ||||||||||||||||||
Financial instruments owned: | ||||||||||||||||||||||||
Long sovereign debt securities (1) | $ | – | $ | 2.1 | $ | 1,088.0 | $ | 1.2 | $ | 224.0 | $ | 1,315.3 | ||||||||||||
Long non-sovereign debt securities (1) | 13.3 | 36.3 | 93.4 | 17.9 | 128.2 | 289.1 | ||||||||||||||||||
Total long debt securities | 13.3 | 38.4 | 1,181.4 | 19.1 | 352.2 | 1,604.4 | ||||||||||||||||||
Trading liabilities, financial instruments sold, not yet purchased: | ||||||||||||||||||||||||
Short sovereign debt securities (1) | – | 4.6 | 989.7 | – | 127.0 | 1,121.3 | ||||||||||||||||||
Short non-sovereign debt securities (1) | 4.4 | 11.8 | 27.9 | 0.4 | 32.8 | 77.3 | ||||||||||||||||||
Total short debt securities | 4.4 | 16.4 | 1,017.6 | 0.4 | 159.8 | 1,198.6 | ||||||||||||||||||
Net fair value - debt securities | 8.9 | 22.0 | 163.8 | 18.7 | 192.4 | 405.8 | ||||||||||||||||||
Net derivatives notional amount | 1.8 | 1.4 | 74.2 | – | 0.3 | 77.7 | ||||||||||||||||||
Total net exposure to select European countries | $ | 10.7 | $ | 23.4 | $ | 238.0 | $ | 18.7 | $ | 192.7 | $ | 483.5 | ||||||||||||
(1) | Classification of securities by country and by issuer type is presented based on the view of Jefferies Risk Management Department. Risk Management takes into account whether a particular security or issuer of a security is guaranteed or otherwise backed by a sovereign government and also takes into account whether a corporate or financial institution that issues a particular security is owned by a sovereign government when determining domicile and whether a particular security should be classified for risk purposes as a sovereign obligation. The classification of debt securities within the table above will differ from the financial statement presentation in the Consolidated Statement of Financial Condition because the classification used for financial statement presentation in the Consolidated Statement of Financial Condition classifies a debt security solely by the direct issuer and the domicile of the direct issuer |
57
The table below provides further information regarding the type of derivative contracts executed as economic hedges of issuer exposure to the countries of Greece, Ireland, Italy, Portugal, and Spain, as reflected in our Consolidated Statement of Financial Condition at December 31, 2013. The information is presented based on the notional amount of the contracts and the domicile of the issuer. For credit default swaps, there is immaterial issuer risk to counterparties domiciled in Greece, Ireland, Italy, Portugal and Spain.
(In millions) | Greece | Ireland | Italy | Portugal | Spain | Total | ||||||||||||||||||
Derivative contracts - long notional exposure | ||||||||||||||||||||||||
Credit default swaps | $ | – | $ | – | $ | – | $ | – | $ | – | $ | – | ||||||||||||
Bond future contracts | – | – | 371.0 | – | – | 371.0 | ||||||||||||||||||
Listed equity options | 3.8 | 17.8 | – | – | 0.3 | 21.9 | ||||||||||||||||||
Total notional amount - long | 3.8 | 17.8 | 371.0 | – | 0.3 | 392.9 | ||||||||||||||||||
Derivative contracts - short notional exposure | ||||||||||||||||||||||||
Credit default swaps | – | – | 20.4 | – | – | 20.4 | ||||||||||||||||||
Bond future contracts | – | – | 276.4 | – | – | 276.4 | ||||||||||||||||||
Listed equity options | 2.0 | 16.4 | – | – | – | 18.4 | ||||||||||||||||||
Total notional amount - short | 2.0 | 16.4 | 296.8 | – | – | 315.2 | ||||||||||||||||||
Net derivatives notional amount | $ | 1.8 | $ | 1.4 | $ | 74.2 | $ | – | $ | 0.3 | $ | 77.7 | ||||||||||||
The following table provides the fair value of the above derivative contracts (in millions):
Greece | Ireland | Italy | Portugal | Spain | Total | |||||||||||||||||||
Derivative contracts - long fair value | ||||||||||||||||||||||||
Credit default swaps | $ | – | $ | – | $ | – | $ | – | $ | – | $ | – | ||||||||||||
Bond future contracts | – | – | – | – | – | – | ||||||||||||||||||
Listed equity options | 2.7 | 1.2 | – | – | – | 3.9 | ||||||||||||||||||
Total fair value - long | 2.7 | 1.2 | – | – | – | 3.9 | ||||||||||||||||||
Derivative contracts - short fair value | ||||||||||||||||||||||||
Credit default swaps | – | – | 0.2 | – | – | 0.2 | ||||||||||||||||||
Bond future contracts | – | – | – | – | – | – | ||||||||||||||||||
Listed equity options | 0.1 | 1.8 | – | – | – | 1.9 | ||||||||||||||||||
Total fair value - short | 0.1 | 1.8 | 0.2 | – | – | 2.1 | ||||||||||||||||||
Net derivatives fair value | $ | 2.6 | $ | (0.6 | ) | $ | (0.2 | ) | $ | – | $ | – | $ | 1.8 | ||||||||||
In addition, non-U.S. sovereign obligations recorded in trading assets and trading liabilities are routinely financed through reverse repurchase agreements and repurchase agreements, of which a significant portion is executed with central clearing organizations. Accordingly, foreign sovereign obligations are utilized as underlying collateral for our repurchase financing arrangements. Repurchase financing arrangements that are used to finance the debt securities presented above had underlying collateral of issuers domiciled in Greece, Ireland, Italy, Portugal and Spain as follows (in millions):
Reverse Repurchase Agreements (1) | Repurchase Agreements (1) | Net | ||||||||||
Greece | $ | – | $ | – | $ | – | ||||||
Ireland | 5.5 | 65.7 | (60.2 | ) | ||||||||
Italy | 899.2 | 1,162.5 | (263.3 | ) | ||||||||
Portugal | – | 2.8 | (2.8 | ) | ||||||||
Spain | 89.3 | 218.5 | (129.2 | ) | ||||||||
Total | $ | 994.0 | $ | 1,449.5 | $ | (455.5 | ) | |||||
(1) | Amounts represent the contract amount of the repurchase financing arrangements. |
58
For the fourth quarter of 2013, Jefferies exposure to the sovereign debt of Greece, Ireland, Italy, Portugal and Spain calculated on an average daily basis was as follows (in millions):
Remaining Maturity Less Than One Year | Remaining Maturity Greater Than or Equal to One Year | Total Average Balance | ||||||||||
Financial instruments owned - Debt securities | ||||||||||||
Greece | $ | – | $ | – | $ | – | ||||||
Ireland | 1.1 | 5.3 | 6.4 | |||||||||
Italy | 1,123.1 | 1,193.5 | 2,316.6 | |||||||||
Portugal | 0.1 | 1.0 | 1.1 | |||||||||
Spain | 93.2 | 195.0 | 288.2 | |||||||||
Total average fair value of long debt securities (1) | 1,217.5 | 1,394.8 | 2,612.3 | |||||||||
Financial instruments sold - Debt securities | ||||||||||||
Greece | – | – | – | |||||||||
Ireland | – | 5.1 | 5.1 | |||||||||
Italy | 377.3 | 1,383.6 | 1,760.9 | |||||||||
Portugal | – | 1.3 | 1.3 | |||||||||
Spain | 0.1 | 131.8 | 131.9 | |||||||||
Total average fair value of short debt securities | 377.4 | 1,521.8 | 1,899.2 | |||||||||
Total average net fair value of debt securities | 840.1 | (127.0 | ) | 713.1 | ||||||||
Derivative contracts - long notional exposure | ||||||||||||
Greece | – | – | – | |||||||||
Ireland | – | – | – | |||||||||
Italy | – | 116.2 | (2) | 116.2 | (2) | |||||||
Portugal | – | – | – | |||||||||
Spain | – | – | – | |||||||||
Total average notional amount – long | – | 116.2 | 116.2 | |||||||||
Derivative contracts - short notional exposure | ||||||||||||
Greece | – | – | – | |||||||||
Ireland | – | – | – | |||||||||
Italy | – | 350.4 | 350.4 | |||||||||
Portugal | – | – | – | |||||||||
Spain | – | – | – | |||||||||
Total average notional amount - short | – | 350.4 | 350.4 | |||||||||
Total average net derivative notional exposure (3) | – | (234.2 | ) | (234.2 | ) | |||||||
Total average net exposure to select European countries | $ | 840.1 | $ | (361.2 | ) | $ | 478.9 | |||||
(1) | Classification of securities by country and by issuer type is presented based on the view of Jefferies Risk Management Department. Risk Management takes into account whether a particular security or issuer of a security is guaranteed or otherwise backed by a sovereign government and also takes into account whether a corporate or financial institution that issues a particular security is owned by a sovereign government when determining domicile and whether a particular security should be classified for risk purposes as a sovereign obligation. The classification of debt securities within the table above will differ from the financial statement presentation in the Consolidated Statement of Financial Condition because the classification used for financial statement presentation in the Consolidated Statement of Financial Condition classifies a debt security solely by the direct issuer and the domicile of the direct issuer. |
(2) | These positions are comprised of bond futures executed on exchanges outside Italy. |
(3) | Net derivative contracts reflect the notional amount of the derivative contracts and include credit default swaps and bond futures. |
59
Collateral management of the risk due to exposure from these sovereign obligations is subject to Jefferies overall collateral and cash management risk framework.
Exclusive of Jefferies, our market risk arises principally from interest rate risk related to our financial instruments owned and equity price risk.
Our financial instrument portfolio is primarily classified as available for sale, and consequently, is recorded at fair value with unrealized gains and losses reflected in equity. Included in our available for sale portfolio are fixed income securities, which comprised approximately 91% of the total available for sale portfolio at December 31, 2013. These fixed income securities are primarily rated "investment grade" or are U.S. governmental agency issued or U.S. Government-Sponsored Enterprises. The estimated weighted average remaining life of these fixed income securities was approximately 1.6 years at December 31, 2013. Our fixed income securities, like all fixed income instruments, are subject to interest rate risk and will fall in value if market interest rates increase. At December 31, 2012 fixed income securities comprised approximately 71% of the total portfolio and had an estimated weighted average remaining life of 1.6 years.
Also included in the available for sale portfolio are equity securities, which are recorded at an aggregate fair value of $252.5 million (aggregate cost of $198.3 million) and which comprised approximately 9% of our total available for sale portfolio at December 31, 2013. The majority of this amount consists of the investment in First Quantum common shares, which is carried at fair value of $148.7 million. We evaluate our portfolio for impairment on a quarterly basis.
The following table provides information about our financial instruments used for purposes other than trading that are primarily sensitive to changes in interest rates.
For additional information see Note 10 to our consolidated financial statements.
| Expected Maturity Date | |||||||||||||||||||||||||||||||
2014 | 2015 | 2016 | 2017 | 2018 | Thereafter | Total | Fair Value | |||||||||||||||||||||||||
(Dollars in thousands) | ||||||||||||||||||||||||||||||||
Rate Sensitive Assets: | ||||||||||||||||||||||||||||||||
Available for Sale Fixed Income Securities: | ||||||||||||||||||||||||||||||||
U.S. Government | $ | 1,781,266 | $ | - | $ | - | $ | - | $ | - | $ | - | $ | 1,781,266 | $ | 1,781,266 | ||||||||||||||||
Weighted-Average Interest Rate | .21 | % | ||||||||||||||||||||||||||||||
Residential mortgage-backed: Rated Investment Grade | $ | 92,525 | $ | 83,541 | $ | 62,383 | $ | 48,388 | $ | 38,131 | $ | 202,004 | $ | 526,972 | $ | 526,972 | ||||||||||||||||
Weighted-Average Interest Rate | 2.82 | % | 2.78 | % | 2.76 | % | 2.72 | % | 2.69 | % | 2.63 | % | ||||||||||||||||||||
Rated Less Than Investment Grade/Not Rated | $ | 19,833 | $ | 14,823 | $ | 7,069 | $ | 2,668 | $ | 2,089 | $ | 5,708 | $ | 52,190 | $ | 52,190 | ||||||||||||||||
Weighted-Average Interest Rate | 4.11 | % | 4.20 | % | 4.27 | % | 4.84 | % | 4.79 | % | 4.40 | % | ||||||||||||||||||||
Commercial mortgage-backed: | ||||||||||||||||||||||||||||||||
Rated Investment Grade | $ | - | $ | - | $ | - | $ | 1,493 | $ | - | $ | - | $ | 1,493 | $ | 1,493 | ||||||||||||||||
Weighted-Average Interest Rate | 3.16 | % | ||||||||||||||||||||||||||||||
Rated Less Than Investment Grade/Not Rated | $ | 2,914 | $ | 4,891 | $ | 1,558 | $ | 3,809 | $ | 103 | $ | 3,217 | $ | 16,492 | $ | 16,492 | ||||||||||||||||
Weighted-Average Interest Rate | .79 | % | 1.68 | % | 5.88 | % | 5.57 | % | 5.41 | % | 5.48 | % | ||||||||||||||||||||
Other asset-backed: | ||||||||||||||||||||||||||||||||
Rated Investment Grade | $ | 63,188 | $ | 68,551 | $ | 22,120 | $ | 14,055 | $ | - | $ | - | $ | 167,914 | $ | 167,914 | ||||||||||||||||
Weighted-Average Interest Rate | 3.04 | % | 4.25 | % | 3.54 | % | 3.50 | % | ||||||||||||||||||||||||
Rated Less Than Investment Grade/Not Rated | $ | 4,334 | $ | 11,187 | $ | 601 | $ | - | $ | - | $ | - | $ | 16,122 | $ | 16,122 | ||||||||||||||||
Weighted-Average Interest Rate | 4.50 | % | 4.19 | % | 4.50 | % | ||||||||||||||||||||||||||
All other corporates: | ||||||||||||||||||||||||||||||||
Rated Investment Grade | $ | - | $ | 1,032 | $ | 946 | $ | - | $ | - | $ | - | $ | 1,978 | $ | 1,978 | ||||||||||||||||
Weighted-Average Interest Rate | 3.88 | % | 6.75 | % | ||||||||||||||||||||||||||||
Rated Less Than Investment Grade/Not Rated | $ | 6,381 | $ | 16,128 | $ | 18,557 | $ | 2,493 | $ | 5,087 | $ | 539 | $ | 49,185 | $ | 49,185 | ||||||||||||||||
Weighted-Average Interest Rate | 7.16 | % | 3.52 | % | 6.49 | % | 7.25 | % | 5.75 | % | 6.75 | % | ||||||||||||||||||||
60
Item 8 . Financial Statements and Supplementary Data .
Financial Statements and supplementary data required by this Item 8 are set forth at the pages indicated in Item 15(a) below.
Item 9 . Changes in and Disagreements with Accountants on Accounting and Financial Disclosure .
None.
Item 9A . Controls and Procedures .
Evaluation of disclosure controls and procedures
The Company's management evaluated, with the participation of the Company's principal executive and principal financial officers, the effectiveness of the Company's disclosure controls and procedures (as defined in Rules 13a-15(e) and 15d-15(e) under the Securities Exchange Act of 1934, as amended (the "Exchange Act")), as of December 31, 2013. Based on their evaluation, the Company's principal executive and principal financial officers concluded that the Company's disclosure controls and procedures were effective as of December 31, 2013.
Changes in internal control over financial reporting
There has been no change in the Company's internal control over financial reporting (as defined in Rules 13a-15(f) and 15d-15(f) under the Exchange Act) that occurred during the Company's fiscal quarter ended December 31, 2013, that has materially affected, or is reasonably likely to materially affect, the Company's internal control over financial reporting.
Management's Report on Internal Control Over Financial Reporting
Management of the Company is responsible for establishing and maintaining adequate internal control over financial reporting as defined in Rules 13a-15(f) or 15d-15(f) promulgated under the Securities Exchange Act of 1934. Internal control over financial reporting is a process designed to provide reasonable assurance regarding the reliability of financial reporting and the preparation of financial statements for external purposes in accordance with generally accepted accounting principles and includes those policies and procedures that:
· | Pertain to the maintenance of records that, in reasonable detail, accurately and fairly reflect the transactions and disposition of the assets of the Company; |
· | Provide reasonable assurance that transactions are recorded as necessary to permit preparation of financial statements in accordance with generally accepted accounting principles, and that receipts and expenditures of the Company are being made only in accordance with authorizations of management and directors of the Company; and |
· | Provide reasonable assurance regarding prevention or timely detection of unauthorized acquisition, use or disposition of the Company's assets that could have a material effect on the consolidated financial statements. |
Because of its inherent limitations, internal control over financial reporting may not prevent or detect misstatements. Also, projections of any evaluation of effectiveness to future periods are subject to the risk that controls may become inadequate because of changes in conditions, or that the degree of compliance with the policies or procedures may deteriorate.
The Company's management assessed the effectiveness of the Company's internal control over financial reporting as of December 31, 2013. In making this assessment, the Company's management used the criteria established in Internal Control-Integrated Framework (1992) issued by the Committee of Sponsoring Organizations of the Treadway Commission (COSO).
Based on our assessment and those criteria, management concluded that, as of December 31, 2013, the Company's internal control over financial reporting was effective.
The effectiveness of the Company's internal control over financial reporting as of December 31, 2013 has been audited by PricewaterhouseCoopers LLP, an independent registered public accounting firm, as stated in their report which appears herein in Item 8.
Item 9B . Other Information .
Not applicable.
61
PART III
Item 10 . Directors, Executive Officers of the Registrant and Corporate Governance .
Information with respect to this item will be contained in the Proxy Statement for the 2014 Annual Meeting of Shareholders, which is incorporated herein by reference.
We have a code of Business Practices, which is applicable to all directors, officers and employees, and includes a Code of Practice applicable to our principal executive officer and senior financial officers. Both of the Code of Business Practice and Code of Practice are available on our website. We intend to post amendments to or waivers from our Code of Practice on our website as required by applicable law.
Item 11 . Executive Compensation .
Information with respect to this item will be contained in the Proxy Statement for the 2014 Annual Meeting of Shareholders, which is incorporated herein by reference.
Item 12 . Security Ownership of Certain Beneficial Owners and Management and Related Shareholder Matters .
Information with respect to this item will be contained in the Proxy Statement for the 2014 Annual Meeting of Shareholders, which is incorporated herein by reference.
Item 13 . Certain Relationships and Related Transactions, and Director Independence .
Information with respect to this item will be contained in the Proxy Statement for the 2014 Annual Meeting of Shareholders, which is incorporated herein by reference.
Item 14 . Principal Accountant Fees and Services .
Information with respect to this item will be contained in the Proxy Statement for the 2014 Annual Meeting of Shareholders, which is incorporated herein by reference.
PART IV
Item 15. Exhibits and Financial Statement Schedules.
(a)(1) Financial Statements.
Report of Independent Registered Public Accounting Firm | F-1 |
Financial Statements: | |
Consolidated Statements of Financial Condition at December 31, 2013 and 2012 | F-2 |
Consolidated Statements of Operations for the years ended December 31, 2013, | |
2012 and 2011 | F-3 |
Consolidated Statements of Comprehensive Income (Loss) for the years ended | |
December 31, 2013, 2012 and 2011 | F-5 |
Consolidated Statements of Cash Flows for the years ended December 31, 2013, | |
2012 and 2011 | F-6 |
Consolidated Statements of Changes in Equity for the years ended | |
December 31, 2013, 2012 and 2011 | F-8 |
Notes to Consolidated Financial Statements | F-9 |
|
| (2) | Financial Statement Schedules. |
| Schedules are omitted because they are not required or are not applicable or the required information is shown in the financial statements or notes thereto. |
| (3) | See Item 15(b) below for a complete list of Exhibits to this report, including Executive Compensation Plans and Arrangements. |
62
(b) Exhibits.
We will furnish any exhibit upon request made to our Corporate Secretary, 520 Madison Avenue, New York, NY 10022. We charge $.50 per page to cover expenses of copying and mailing.
All documents referenced below were filed pursuant to the Securities Exchange Act of 1934 by the Company, file number 1-5721, unless otherwise indicated.
| 2.1 | Agreement and Plan of Merger, dated as of November 11, 2012, by and among Leucadia National Corporation, Limestone Merger Sub, LLC, Jefferies Group, Inc., JSP Holdings, Inc. and Jasper Merger Sub, Inc. (filed as Exhibit 2.1 of the Current Report on Form 8-K filed by Jefferies Group, Inc. on November 13, 2012).* |
| 2.2 | Agreement and Plan of Merger, dated as of November 11, 2012, by and among Leucadia National Corporation, Limestone Merger Sub, LLC, Jefferies Group, Inc., JSP Holdings, Inc. and Jasper Merger Sub, Inc. (filed as Exhibit 2.2 of the Current Report on Form 8-K filed by Jefferies Group, Inc. on November 13, 2012).* |
| 3.1 | Restated Certificate of Incorporation (filed as Exhibit 5.1 to the Company's Current Report on Form 8-K dated July 14, 1993).* |
| 3.2 | Certificate of Amendment of the Certificate of Incorporation dated as of May 14, 2002 (filed as Exhibit 3.2 to the Company's Annual Report on Form 10-K for the fiscal year ended December 31, 2003 (the "2003 10-K")).* |
| 3.3 | Certificate of Amendment of the Certificate of Incorporation dated as of December 23, 2002 (filed as Exhibit 3.2 to the Company's Annual Report on Form 10-K for the fiscal year ended December 31, 2002).* |
| 3.4 | Certificate of Amendment of the Certificate of Incorporation dated as of May 13, 2004 (filed as Exhibit 3.5 to the Company's Annual Report on Form 10-K for the fiscal year ended December 31, 2004).* |
| 3.5 | Certificate of Amendment of the Certificate of Incorporation dated as of May 17, 2005 (filed as Exhibit 3.6 to the Company's Annual Report on Form 10-K for the fiscal year ended December 31, 2005 (the "2005 10-K")).* |
| 3.6 | Certificate of Amendment of the Certificate of Incorporation dated as of May 23, 2007 (filed as Exhibit 4.7 to the Company's Registration Statement on Form S-8 (No. 333-143770)).* |
| 3.7 | Certificate of Amendment to the Certificate of Incorporation dated as of February 26, 2013 (filed as Exhibit 3.7 to the Company's Current Report on Form 8-K on March 1, 2013 (the "March 1, 2013 Form 8-K").* |
| 3.8 | Certificate of Amendment to the Certificate of Incorporation dated as of February 26, 2013 (filed as Exhibit 3.8 to the March 1, 2013 Form 8-K).* |
| 3.9 | Amended and Restated By-laws of Leucadia National Corporation (filed as Exhibit 3.9 to the March 1, 2013 Form 8-K).* |
| 4.1 | The Company undertakes to furnish the Securities and Exchange Commission, upon written request, a copy of all instruments with respect to long-term debt not filed herewith. |
63
10.31 | 1999 Stock Option Plan as Amended and Restated (filed as Exhibit 99.1 to the Company's Registration Statement on Form S-8 (No. 333-169377)).* + |
10.32 | Form of Grant Letter for the 1999 Stock Option Plan (filed as Exhibit 10.3 to the Company's Current Report on Form 8-K filed on February 24, 2012 (the "February 24, 2012 8-K")).* + |
10.33 | Leucadia National Corporation 2003 Incentive Compensation Plan (filed as Appendix II to the Company's Proxy Statement dated June 27, 2013 (the "2013 Proxy Statement")).* + |
10.34 | Form of Restricted Stock Units Agreement (filed as Exhibit 10.1 to the Company's Current Report on Form 8-K dated July 31, 2013).* + |
10.35 | Form of Restricted Stock Agreement (filed as Exhibit 10.2 to the Company's Current Report on Form 8-K dated July 31, 2013).* + |
10.36 | Leucadia National Corporation 1999 Directors' Stock Compensation Plan (filed as Appendix II to the 2013 Proxy Statement).* + |
10.37 | Leucadia National Corporation 2011 Senior Executive Warrant Plan (filed as Annex A to the Company's Proxy Statement dated April 13, 2011).* + |
10.38 | Form of Common Share Purchase Warrant (filed as Exhibit 10.3 to the Company's Quarterly Report on Form 10-Q for the quarterly period ended June 30, 2011 (the "2nd Quarter 2011 10-Q")).* + |
10.39 | Amended and Restated Shareholders Agreement dated as of June 30, 2003 among the Company, Ian M. Cumming and Joseph S. Steinberg (filed as Exhibit 10.5 to the 2003 10-K).* + |
10.40 | Amendment No. 1, dated as of May 16, 2006, to the Amended and Restated Shareholders Agreement dated as of June 30, 2003, by and among Ian M. Cumming, Joseph S. Steinberg and the Company (filed as Exhibit 10.6 to the Company's Quarterly Report on Form 10-Q for the quarterly period ended June 30, 2006). * + |
10.41 | Services Agreement, dated as of January 1, 2004, between the Company and Joseph S. Steinberg (filed as Exhibit 10.38 to the 2005 10-K).* + |
10.42 | Leucadia National Corporation 2003 Senior Executive Annual Incentive Bonus Plan, as amended May 16, 2006 (filed as Annex A to the Company's Proxy Statement dated April 17, 2006).* + |
10.43 | Employment Agreement made as of June 30, 2005 by and between the Company and Joseph S. Steinberg (filed as Exhibit 99.2 to the Company's Current Report on Form 8-K dated July 13, 2005 8-K).* + |
10.44 | Exhibit 1 to the Agreement and Plan of Reorganization between the Company and TLC Associates, dated February 23, 1989 (filed as Exhibit 3 to Amendment No. 12 to the Schedule 13D dated December 29, 2004 of Ian M. Cumming and Joseph S. Steinberg with respect to the Company).* |
10.45 | Compensation Information Concerning Non-Employee Directors (incorporated by reference to page 31 of the Company's Proxy Statement dated April 13, 2012).* + |
10.46 | Credit Agreement dated as of December 10, 2009 among Berkadia Commercial Mortgage LLC and BH Finance LLC (filed as Exhibit 10.1 to the 2nd Quarter 2011 10-Q).* |
64
10.47 | Amendment No. 1 to Credit Agreement dated as of October 29, 2010 among Berkadia Commercial Mortgage LLC, BH Finance LLC and Baldwin Enterprises, Inc. (filed as Exhibit 10.1 to the Company's Current Report on Form 8-K filed November 5, 2010).* |
10.48 | Guaranty, dated as of December 10, 2009, by Leucadia National Corporation in favor of BH Finance LLC, in its own capacity as the lender under the Credit Agreement, dated as of December 10, 2009, among Berkadia Commercial Mortgage LLC and BH Finance LLC, and on behalf of each of the other Secured Parties under (and as defined in) the Credit Agreement (filed as Exhibit 10.1 to the Company's Current Report on Form 8-K filed on December 14, 2009).* |
10.49 | Retention Agreement, dated March 1, 2010, between Leucadia National Corporation and Justin R. Wheeler (filed as Exhibit 10.1 to the Company's Current Report on Form 8-K filed March 5, 2010).* + |
10.50 | Form of Retention Agreement, dated June 22, 2010, between Leucadia National Corporation and Thomas E. Mara/Joseph A. Orlando (filed as Exhibit 10.1 to the Company's Current Report on Form 8-K filed June 22, 2010).* + |
10.51 | Form of Amended Retention Agreement for Thomas E. Mara, Joseph A. Orlando, and Justin R. Wheeler (filed as Exhibit 10.1 to the Company's Current Report on Form 8-K dated August 23, 2012).* + |
10.52 | Employment Agreement, dated as of June 24, 2013, between Leucadia National Corporation and Justin R. Wheeler (filed as Exhibit 10.1 to the Company's Current Report on Form 8-K dated June 26, 2013.)* + |
10.53 | Participation Agreement dated as of October 29, 2010 between Baldwin Enterprises, Inc. and BH Finance LLC (filed as Exhibit 10.2 to the Company's Current Report on Form 8-K filed November 5, 2010).* |
10.54 | Amendment No. 1 to Guaranty dated as of October 29, 2010 made by Leucadia National Corporation in favor of BH Finance LLC in its own capacity as a lender under the Credit Agreement referred to therein and on behalf of each of the other Secured Parties under the Credit Agreement (filed as Exhibit 10.3 to the Company's Current Report on Form 8-K filed November 5, 2010).* |
10.55 | Membership Interest Purchase Agreement among Leucadia National Corporation, National Beef Packing Company, LLC, U.S. Premium Beef, LLC, NBPCo Holdings, LLC, TKK Investments, LLC, TMKCo, LLC and TMK Holdings, LLC (filed as Exhibit 2.1 to the Company's Current Report on Form 8-K filed December 30, 2011 (the "December 30, 2011 8-K")).* |
10.56 | First Amended and Restated Limited Liability Company Agreement of National Beef Packing Company, dated as of December 30, 2011 (filed as Exhibit 10.1 to the December 30, 2011 8-K).* |
10.57 | Cattle Purchase and Sale Agreement by and between National Beef Packing Company, LLC and U.S. Premium Beef, LLC, dated as of December 30, 2011 (filed as Exhibit 10.6 to the December 30, 2011 8-K).* |
10.58 | Summary of executive compensation (filed as Exhibit 10 to the Company's Current Report on Form 8-K filed January 29, 2014 (the "January 29, 2014 Form 8-K")).* + |
10.59 | Summary of executive compensation for Michael J. Sharp (filed as Exhibit 10 to the January 29, 2014 Form 8-K).* + |
10.60 | Summary of executive compensation for Richard B. Handler and Brian P. Friedman (filed as Exhibit 10 to the January 29, 2014 Form 8-K).* + |
65
10.61 | General Termination and Release dated as of December 31, 2011 by and among Berkadia Commercial Mortgage LLC, BH Finance LLC, Baldwin Enterprises, Inc., Berkadia Commercial Mortgage Inc. and Leucadia National Corporation (filed as Exhibit 10.2 to the February 24, 2012 8-K* |
10.62 | Agreement of Terms dated as of December 31, 2011 between Leucadia National Corporation and Berkshire Hathaway Inc. (filed as Exhibit 10.1 to the February 24, 2012 8-K).* |
10.63 | Deed of Release, Termination and Settlement dated as of September 19, 2012 between Fortescue Metals Group Ltd and Chichester Metals Pty Ltd and John Andrew Henry Forrest and Leucadia National Corporation and Baldwin Enterprises, Inc. (filed as Exhibit 10.1 to the Company's Current Report on Form 8-K dated September 19, 2012).* |
10.64 | Voting Agreement, dated as of November 11, 2012, by and among the Company, BEI Jeffvest, LLC and Jefferies Group, Inc. (incorporated by reference to Exhibit 10.1 of the Current Report on Form 8-K filed by Jefferies Group, Inc. |
on November 13, 2012).*
10.65 | Memo of Terms (filed as Exhibit 99.2 to the Company's Current Report on Form 8-K dated November 11, 2012).* + |
10.66 | Membership Interest Purchase Agreement by and among GAR, LLC, Premier Entertainment Biloxi LLC, Leucadia National Corporation and Twin River Management Group, Inc., dated as of December 14, 2013 (filed as Exhibit 10 to the Company's Current Report on Form 8-K on December 16, 2013).* |
10.67 | Letter Agreement, dated as of February 15, 2013, among Jefferies Group, Inc., JSP Holdings, Inc., Leucadia National Corporation, Massachusetts Mutual Life Insurance Company and C.M. Life Insurance Company (filed as Exhibit 10.1 to the Company's Current Report on Form 8-K on February 26, 2013).* |
| 21 | Subsidiaries of the registrant. |
| 23.1 | Consent of PricewaterhouseCoopers LLP, with respect to the incorporation by reference into the Company's Registration Statements on Form S-8 (No. 333-169377), Form S-8 (No. 333-51494), Form S-8 (No. 333-143770), Form S-8 (No. 333-185318), Form S-3 (No. 333-191533), and Form S-4 (No. 333-185318). |
| 23.2 | Consent of PricewaterhouseCoopers LLP, with respect to the inclusion in this Annual Report on Form 10-K of the financial statements of Jefferies Group, Inc. and with respect to the incorporation by reference in the Company's Registration Statements on Form S-8 (No. 333-169377), Form S-8 (No. 333-51494), Form S-8 (No. 333-143770), Form S-8 (No. 333-185318), Form S-3 (No. 333-191533), and Form S-4 (No. 333-185318). |
| 23.3 | Consent of independent auditors from Deloitte & Touche LLP, with respect to the inclusion in this Annual Report on Form 10-K of the financial statements of Jefferies Group, Inc. and with respect to the incorporation by reference in the Company's Registration Statements on Form S-8 (No. 333-169377), Form S-8 (No. 333-51494), Form S-8 (No. 333-143770), Form S-8 (No. 333-185318), Form S-3 (No. 333-191533), and Form S-4 (No. 333-185318). |
| 31.1 | Certification of Chief Executive Officer pursuant to Section 302 of the Sarbanes-Oxley Act of 2002. |
| 31.2 | Certification of Chief Financial Officer pursuant to Section 302 of the Sarbanes-Oxley Act of 2002. |
| 32.1 | Certification of Chief Executive Officer pursuant to Section 906 of the Sarbanes-Oxley Act of 2002.** |
66
|
| 32.2 | Certification of Chief Financial Officer pursuant to Section 906 of the Sarbanes-Oxley Act of 2002.** |
| 101 | Financial statements from the Annual Report on Form 10-K of Leucadia National Corporation for the year ended December 31, 2013, formatted in Extensible Business Reporting Language (XBRL): (i) the Consolidated Statements of Financial Condition, (ii) the Consolidated Statements of Operations, (iii) the Consolidated Statements of Comprehensive Income (Loss), (iv) the Consolidated Statements of Cash Flows, (v) the Consolidated Statements of Changes in Equity and (vi) the Notes to Consolidated Financial Statements. |
| (c) | Financial statement schedules. |
| (1) | Jefferies Group, Inc. financial statements for the three months ended February 28, 2013, and Jefferies Group, Inc. financial statements as of November 30, 2012 and 2011, and for the years ended November 30, 2012 and 2011. |
____________________________
+ | Management/Employment Contract or Compensatory Plan or Arrangement. |
* | Incorporated by reference. |
** | Furnished herewith pursuant to item 601(b) (32) of Regulation S-K. |
67
SIGNATURES
Pursuant to the requirements of Section 13 or 15(d) of the Securities Exchange Act of 1934, the registrant has duly caused this report to be signed on its behalf by the undersigned, thereunto duly authorized.
| LEUCADIA NATIONAL CORPORATION | |||
Date: February 28, 2014 | By: | /s/ Barbara L. Lowenthal | |
| Name: Barbara L. Lowenthal | |||
| Title: Vice President and Comptroller | |||
Pursuant to the requirements of the Securities Exchange Act of 1934, this report has been signed below by the following persons on behalf of the registrant and in the capacities indicated, on the date set forth below.
Date | Signature | Title | |
February 28, 2014 | By: | /s/ Joseph S. Steinberg | Chairman of the Board |
Joseph S. Steinberg | |||
February 28, 2014 | By: | /s/ Richard B. Handler | Chief Executive Officer and Director |
Richard B. Handler | (Principal Executive Officer) | ||
February 28, 2014 | By: | /s/ Brian P. Friedman | President and Director |
Brian P. Friedman | |||
February 28, 2014 | By: | /s/ Joseph A. Orlando | Vice President and Chief Financial Officer |
Joseph A. Orlando | (Principal Financial Officer) | ||
February 28, 2014 | By: | /s/ Barbara L. Lowenthal | Vice President and Comptroller |
Barbara L. Lowenthal | (Principal Accounting Officer) | ||
February 28, 2014 | By: | /s/ Robert D. Beyer | Director |
Robert D. Beyer | |||
February 28, 2014 | By: | /s/ Francisco L. Borges | Director |
Francisco L. Borges | |||
February 28, 2014 | By: | /s/ W. Patrick Campbell | Director |
W. Patrick Campbell | |||
February 28, 2014 | By: | /s/ Robert E. Joyal | Director |
Robert E. Joyal | |||
February 28, 2014 | By: | /s/ Jeffrey C. Keil | Director |
Jeffrey C. Keil | |||
February 28, 2014 | By: | /s/ Michael T. O'Kane | Director |
Michael T. O'Kane | |||
February 28, 2014 | By: | /s/ Stuart H. Reese | Director |
Stuart H. Reese |
68
Report of Independent Registered Public Accounting Firm
To the Board of Directors and
Shareholders of Leucadia National Corporation:
In our opinion, the consolidated financial statements listed in the index appearing under Item 15(a)(1) present fairly, in all material respects, the financial position of Leucadia National Corporation and its subsidiaries (the "Company") at December 31, 2013 and 2012, and the results of their operations and their cash flows for each of the three years in the period ended December 31, 2013 in conformity with accounting principles generally accepted in the United States of America. Also in our opinion, the Company maintained, in all material respects, effective internal control over financial reporting as of December 31, 2013, based on criteria established in Internal Control - Integrated Framework (1992) issued by the Committee of Sponsoring Organizations of the Treadway Commission (COSO). The Company's management is responsible for these financial statements, for maintaining effective internal control over financial reporting and for its assessment of the effectiveness of internal control over financial reporting, included in "Management's Report on Internal Control over Financial Reporting" appearing under Item 9A. Our responsibility is to express opinions on these financial statements and on the Company's internal control over financial reporting based on our integrated audits. We conducted our audits in accordance with the standards of the Public Company Accounting Oversight Board (United States). Those standards require that we plan and perform the audits to obtain reasonable assurance about whether the financial statements are free of material misstatement and whether effective internal control over financial reporting was maintained in all material respects. Our audits of the financial statements included examining, on a test basis, evidence supporting the amounts and disclosures in the financial statements, assessing the accounting principles used and significant estimates made by management, and evaluating the overall financial statement presentation. Our audit of internal control over financial reporting included obtaining an understanding of internal control over financial reporting, assessing the risk that a material weakness exists, and testing and evaluating the design and operating effectiveness of internal control based on the assessed risk. Our audits also included performing such other procedures as we considered necessary in the circumstances. We believe that our audits provide a reasonable basis for our opinion.
A company's internal control over financial reporting is a process designed to provide reasonable assurance regarding the reliability of financial reporting and the preparation of financial statements for external purposes in accordance with generally accepted accounting principles. A company's internal control over financial reporting includes those policies and procedures that (i) pertain to the maintenance of records that, in reasonable detail, accurately and fairly reflect the transactions and dispositions of the assets of the company; (ii) provide reasonable assurance that transactions are recorded as necessary to permit preparation of financial statements in accordance with generally accepted accounting principles, and that receipts and expenditures of the company are being made only in accordance with authorizations of management and directors of the company; and (iii) provide reasonable assurance regarding prevention or timely detection of unauthorized acquisition, use, or disposition of the company's assets that could have a material effect on the financial statements.
Because of its inherent limitations, internal control over financial reporting may not prevent or detect misstatements. Also, projections of any evaluation of effectiveness to future periods are subject to the risk that controls may become inadequate because of changes in conditions, or that the degree of compliance with the policies or procedures may deteriorate.
/s/ PricewaterhouseCoopers LLP
PricewaterhouseCoopers LLP
New York, New York
February 28, 2014
LEUCADIA NATIONAL CORPORATION AND SUBSIDIARIES
Consolidated Statements of Financial Condition
December 31, 2013 and 2012
(Dollars in thousands, except par value)
2013 | 2012 | |||||||
ASSETS | ||||||||
Cash and cash equivalents | $ | 3,907,595 | $ | 145,960 | ||||
Cash and securities segregated and on deposit for regulatory purposes | ||||||||
or deposited with clearing and depository organizations | 3,616,602 | – | ||||||
Financial instruments owned, including securities pledged of $13,253,537 and $406,828: | ||||||||
Trading assets, at fair value | 16,699,542 | 1,077,172 | ||||||
Available for sale securities | 2,866,143 | 3,356,992 | ||||||
Total financial instruments owned | 19,565,685 | 4,434,164 | ||||||
Investments in managed funds | 57,285 | – | ||||||
Loans to and investments in associated companies | 1,258,341 | 807,474 | ||||||
Securities borrowed | 5,359,846 | – | ||||||
Securities purchased under agreements to resell | 3,746,920 | – | ||||||
Securities received as collateral | 11,063 | – | ||||||
Receivables from brokers, dealers and clearing organizations | 2,180,996 | 6,824 | ||||||
Receivables from customers of securities operations | 1,046,945 | – | ||||||
Property, equipment and leasehold improvements, net | 885,859 | 857,360 | ||||||
Intangible assets, net | 1,020,529 | 829,831 | ||||||
Goodwill | 1,748,099 | 24,195 | ||||||
Deferred tax asset, net | 1,809,943 | 1,214,615 | ||||||
Other assets | 1,651,073 | 1,028,695 | ||||||
Total | $ | 47,866,781 | $ | 9,349,118 | ||||
LIABILITIES | ||||||||
Short-term borrowings | $ | 12,000 | $ | – | ||||
Trading liabilities, at fair value | 7,293,102 | – | ||||||
Securities loaned | 2,506,122 | – | ||||||
Securities sold under agreements to repurchase | 10,779,845 | 391,705 | ||||||
Other secured financings | 234,711 | – | ||||||
Obligation to return securities received as collateral | 11,063 | – | ||||||
Payables to brokers, dealers and clearing organizations | 1,379,243 | 854 | ||||||
Payables to customers of securities operations | 5,208,768 | – | ||||||
Trade payables, expense accruals and other liabilities | 1,721,934 | 588,580 | ||||||
Long-term debt – parent company | 1,541,014 | 954,941 | ||||||
Long-term debt – subsidiaries | 6,639,851 | 403,754 | ||||||
Total liabilities | 37,327,653 | 2,339,834 | ||||||
Commitments and contingencies | ||||||||
MEZZANINE EQUITY | ||||||||
Redeemable noncontrolling interests in subsidiary | 241,075 | 241,649 | ||||||
Mandatorily redeemable convertible preferred shares | 125,000 | – | ||||||
EQUITY | ||||||||
Common shares, par value $1 per share, authorized 600,000,000 shares; | ||||||||
364,541,333 and 244,582,588 shares issued and outstanding, after deducting | ||||||||
46,695,470 and 47,006,711 shares held in treasury | 364,541 | 244,583 | ||||||
Additional paid-in capital | 4,881,031 | 1,577,528 | ||||||
Accumulated other comprehensive income | 538,050 | 705,129 | ||||||
Retained earnings | 4,318,840 | 4,240,028 | ||||||
Total Leucadia National Corporation shareholders' equity | 10,102,462 | 6,767,268 | ||||||
Noncontrolling interest | 70,591 | 367 | ||||||
Total equity | 10,173,053 | 6,767,635 | ||||||
Total | $ | 47,866,781 | $ | 9,349,118 | ||||
The accompanying notes are an integral part of these consolidated financial statements.
F-2
LEUCADIA NATIONAL CORPORATION AND SUBSIDIARIES
Consolidated Statements of Operations
For the years ended December 31, 2013, 2012 and 2011
(In thousands, except per share amounts)
2013 | 2012 | 2011 | |||||||||
Revenues: | |||||||||||
Beef processing services | $ | 7,486,332 | $ | 7,479,251 | $ | – | |||||
Commissions | 472,596 | – | – | ||||||||
Principal transactions | 574,895 | 331,359 | (674,375 | ) | |||||||
Investment banking | 997,955 | – | – | ||||||||
Interest income | 737,780 | 20,492 | 31,533 | ||||||||
Net realized securities gains | 243,957 | 590,581 | 641,476 | ||||||||
Other | 489,237 | 983,649 | 643,997 | ||||||||
Total revenues | 11,002,752 | 9,405,332 | 642,631 | ||||||||
Interest expense | 573,261 | – | – | ||||||||
Net revenues | 10,429,491 | 9,405,332 | 642,631 | ||||||||
Expenses: | |||||||||||
Cost of sales | 7,567,707 | 7,479,746 | 215,963 | ||||||||
Compensation and benefits | 1,352,660 | 166,145 | 77,903 | ||||||||
Floor brokerage and clearing fees | 150,774 | – | – | ||||||||
Interest | 84,964 | 92,581 | 111,707 | ||||||||
Depreciation and amortization | 167,425 | 116,388 | 36,799 | ||||||||
Selling, general and other expenses | 752,959 | 220,839 | 166,949 | ||||||||
| 10,076,489 | 8,075,699 | 609,321 | |||||||||
Income from continuing operations before income | |||||||||||
taxes and income related to associated companies | 353,002 | 1,329,633 | 33,310 | ||||||||
Income related to associated companies | 119,041 | 88,649 | 62,013 | ||||||||
Income from continuing operations before income taxes | 472,043 | 1,418,282 | 95,323 | ||||||||
Income tax provision | 110,741 | 531,153 | 62,398 | ||||||||
Income from continuing operations | 361,302 | 887,129 | 32,925 | ||||||||
Loss from discontinued operations, net of income tax | |||||||||||
(benefit) of $(6,563), $(12,660) and $(11,475) | (12,224 | ) | (18,361 | (14,254 | ) | ||||||
Gain (loss) on disposal of discontinued operations, net of income tax | |||||||||||
provision (benefit) of $(3,009), $(2,222) and $3,384 | 13,115 | (4,127 | 6,285 | ||||||||
Net income | 362,193 | 864,641 | 24,956 | ||||||||
Net loss attributable to the noncontrolling interest | 1,162 | 2,060 | 275 | ||||||||
Net (income) loss attributable to the redeemable noncontrolling | |||||||||||
interests | 9,282 | (12,235 | – | ||||||||
Preferred stock dividends | (3,397 | ) | – | – | |||||||
Net income attributable to Leucadia National | |||||||||||
Corporation common shareholders | $ | 369,240 | $ | 854,466 | $ | 25,231 | |||||
(continued)
The accompanying notes are an integral part of these consolidated financial statements.
F-3
LEUCADIA NATIONAL CORPORATION AND SUBSIDIARIES
Consolidated Statements of Operations, continued
For the years ended December 31, 2013, 2012 and 2011
(In thousands, except per share amounts)
2013 | 2012 | 2011 | ||||||||||
Basic earnings (loss) per common share attributable | ||||||||||||
to Leucadia National Corporation common shareholders: | ||||||||||||
Income from continuing operations | $ | 1.06 | $ | 3.58 | $ | .13 | ||||||
Loss from discontinued operations | (.03 | ) | (.07 | ) | (.05 | ) | ||||||
Gain (loss) on disposal of discontinued operations | .04 | (.02 | ) | .02 | ||||||||
Net income | $ | 1.07 | $ | 3.49 | $ | .10 | ||||||
Diluted earnings (loss) per common share attributable | ||||||||||||
to Leucadia National Corporation common shareholders: | ||||||||||||
Income from continuing operations | $ | 1.06 | $ | 3.53 | $ | .13 | ||||||
Loss from discontinued operations | (.03 | ) | (.07 | ) | (.05 | ) | ||||||
Gain (loss) on disposal of discontinued operations | .03 | (.02 | ) | .02 | ||||||||
Net income | $ | 1.06 | $ | 3.44 | $ | .10 | ||||||
Amounts attributable to Leucadia National Corporation | ||||||||||||
common shareholders: | ||||||||||||
Income from continuing operations, net of taxes | $ | 367,291 | $ | 875,505 | $ | 31,373 | ||||||
Loss from discontinued operations, net of taxes | (11,166 | ) | (16,912 | ) | (12,427 | ) | ||||||
Gain (loss) on disposal of discontinued operations, net of taxes | 13,115 | (4,127 | ) | 6,285 | ||||||||
Net income | $ | 369,240 | $ | 854,466 | $ | 25,231 | ||||||
The accompanying notes are an integral part of these consolidated financial statements.
F-4
LEUCADIA NATIONAL CORPORATION AND SUBSIDIARIES
Consolidated Statements of Comprehensive Income (Loss)
For the years ended December 31, 2013, 2012 and 2011
(In thousands)
2013 | 2012 | 2011 | ||||||||||
Net income | $ | 362,193 | $ | 864,641 | $ | 24,956 | ||||||
Other comprehensive income (loss): | ||||||||||||
Net unrealized holding gains (losses) on investments arising | ||||||||||||
during the period, net of income tax provision (benefit) of | ||||||||||||
$(543), $53,903 and $(171,702) | (979 | ) | 97,086 | (309,256 | ) | |||||||
Less: reclassification adjustment for net (gains) losses included | ||||||||||||
in net income (loss), net of income tax provision (benefit) of | ||||||||||||
$118,292, $162,014 and $245,597 | (213,058 | ) | (291,807 | ) | (442,350 | ) | ||||||
Net change in unrealized holding gains (losses) on investments, net of | ||||||||||||
income tax provision (benefit) of $(118,835),$(108,111) and $(417,299) | (214,037 | ) | (194,721 | ) | (751,606 | ) | ||||||
Net unrealized foreign exchange gains (losses) arising during | ||||||||||||
the period, net of income tax provision (benefit) of $865, $(1,626) | ||||||||||||
and $372 | 22,900 | (2,929 | ) | 670 | ||||||||
Less: reclassification adjustment for foreign exchange (gains) | ||||||||||||
losses included in net income (loss), net of income tax provision | ||||||||||||
(benefit) of $0, $0 and $0 | – | – | – | |||||||||
Net change in unrealized foreign exchange gains (losses), | ||||||||||||
net of income tax provision (benefit) of $865, $(1,626) and $372 | 22,900 | (2,929 | ) | 670 | ||||||||
Net unrealized gains (losses) on derivatives arising during the | ||||||||||||
period, net of income tax provision (benefit) of $(9), $(86) and $0 | (15 | ) | (154 | ) | – | |||||||
Less: reclassification adjustment for derivative (gains) losses | ||||||||||||
included in net income (loss), net of income tax provision (benefit) | ||||||||||||
of $0, $0 and $0 | – | – | – | |||||||||
Net change in unrealized derivative gains (losses), net of income | ||||||||||||
tax provision (benefit) of $(9), $(86) and $0 | (15 | ) | (154 | ) | – | |||||||
Net pension and postretirement gains (losses) arising during the | ||||||||||||
period, net of income tax provision (benefit) of $11,685, $(6,998) | ||||||||||||
and $(13,919) | 19,274 | (12,606 | ) | (25,070 | ) | |||||||
Less: reclassification adjustment for pension and postretirement (gains) | ||||||||||||
losses included in net income (loss), net of income tax provision | ||||||||||||
(benefit) of $(2,665), $(1,731) and $(590) | 4,799 | 3,118 | 1,064 | |||||||||
Net change in pension liability and postretirement benefits, | ||||||||||||
net of income tax provision (benefit) of $14,350, $(5,267) and $(13,329) | 24,073 | (9,488 | ) | (24,006 | ) | |||||||
Other comprehensive loss, net of income taxes | (167,079 | ) | (207,292 | ) | (774,942 | ) | ||||||
Comprehensive income (loss) | 195,114 | 657,349 | (749,986 | ) | ||||||||
Comprehensive loss attributable to the noncontrolling interest | 1,162 | 2,060 | 275 | |||||||||
Comprehensive (income) loss attributable to the redeemable | ||||||||||||
noncontrolling interests | 9,282 | (12,235 | ) | – | ||||||||
Preferred stock dividends | (3,397 | ) | – | – | ||||||||
Comprehensive income (loss) attributable to Leucadia National | ||||||||||||
Corporation common shareholders | $ | 202,161 | $ | 647,174 | $ | (749,711 | ) | |||||
The accompanying notes are an integral part of these consolidated financial statements.
F-5
LEUCADIA NATIONAL CORPORATION AND SUBSIDIARIES
Consolidated Statements of Cash Flows
For the years ended December 31, 2013, 2012 and 2011
(In thousands)
2013 | 2012 | 2011 | ||||||||||
Net cash flows from operating activities: | ||||||||||||
Net income | $ | 362,193 | $ | 864,641 | $ | 24,956 | ||||||
Adjustments to reconcile net income to net cash provided by (used for) operations: | ||||||||||||
Deferred income tax provision | 70,047 | 484,974 | 22,424 | |||||||||
Depreciation and amortization of property, equipment and leasehold improvements | 111,175 | 96,507 | 68,059 | |||||||||
Other amortization | 27,789 | 73,606 | 28,564 | |||||||||
Share-based compensation | 87,309 | 14,459 | 23,264 | |||||||||
Provision for doubtful accounts | 13,945 | 10,707 | 750 | |||||||||
Net securities gains | (243,957 | ) | (590,581 | ) | (641,476 | ) | ||||||
Income related to associated companies | (211,221 | ) | (88,649 | ) | (62,013 | ) | ||||||
Distributions from associated companies | 137,098 | 65,461 | 31,927 | |||||||||
Net (gains) losses related to real estate, property and equipment, and other assets | 94,074 | (528,188 | ) | (95,687 | ) | |||||||
Income related to Fortescue's Pilbara project, net of proceeds received | – | 107,881 | (24,222 | ) | ||||||||
(Gain) loss on disposal of discontinued operations | (10,106 | ) | 6,349 | (9,669 | ) | |||||||
Change in estimated litigation reserve | – | 20,000 | (2,241 | ) | ||||||||
Net change in: | ||||||||||||
Cash and securities segregated and on deposit for regulatory purposes or deposited | ||||||||||||
with clearing and depository organizations | 113,754 | – | – | |||||||||
Trading assets | (383,682 | ) | 120,857 | 116,198 | ||||||||
Investments in managed funds | 2,674 | – | – | |||||||||
Securities borrowed | (41,678 | ) | – | – | ||||||||
Securities purchased under agreements to resell | (156,197 | ) | – | – | ||||||||
Receivables from brokers, dealers and clearing organizations | 336,263 | – | – | |||||||||
Receivables from customers of securities operations | 225 | – | – | |||||||||
Other assets | (70,202 | ) | (42,436 | ) | (5,555 | ) | ||||||
Trading liabilities | (2,511,777 | ) | – | – | ||||||||
Securities loaned | 600,539 | – | – | |||||||||
Securities sold under agreements to repurchase | 2,794,412 | – | – | |||||||||
Payables to brokers, dealers and clearing organizations | (507,722 | ) | – | – | ||||||||
Payables to customers of securities operations | (249,305 | ) | – | – | ||||||||
Trade payables, expense accruals and other liabilities | 345,345 | 30,348 | (36,262 | ) | ||||||||
Other | (8,655 | ) | (497 | ) | 4,212 | |||||||
Net cash provided by (used for) operating activities | 702,340 | 645,439 | (556,771 | ) | ||||||||
Net cash flows from investing activities: | ||||||||||||
Acquisitions of property, equipment and leasehold improvements | (137,130 | ) | (71,325 | ) | (38,586 | ) | ||||||
Acquisitions of and capital expenditures for real estate investments | (28,999 | ) | (7,689 | ) | (8,032 | ) | ||||||
Proceeds from disposals of real estate, property and equipment, and other assets | 24,400 | 10,728 | 26,434 | |||||||||
Net change in restricted cash | 86 | 4,816 | 10,519 | |||||||||
Proceeds from disposal of discontinued operations, net of expenses and cash | ||||||||||||
of operations sold | 20,997 | 130,753 | 10,922 | |||||||||
Proceeds from redemption of FMG Note | – | 715,000 | – | |||||||||
Cash acquired upon acquisition of Jefferies Group LLC | 3,017,958 | – | – | |||||||||
Acquisitions, net of cash acquired | – | (25,232 | ) | (1,019,041 | ) | |||||||
Advances on notes and other receivables | (1,934 | ) | (4,818 | ) | (4,511 | ) | ||||||
Collections on notes, loans and other receivables | 18,852 | 31,021 | 19,392 | |||||||||
Loans to and investments in associated companies | (2,388,540 | ) | (35,964 | ) | (124,313 | ) | ||||||
Capital distributions and loan repayment from associated companies | 2,381,145 | 51,196 | 313,591 | |||||||||
Purchases of investments (other than short-term) | (3,789,166 | ) | (2,689,715 | ) | (3,532,925 | ) | ||||||
Proceeds from maturities of investments | 2,368,734 | 397,886 | 506,061 | |||||||||
Proceeds from sales of investments | 1,838,029 | 1,475,327 | 4,227,660 | |||||||||
Other | (810 | ) | 1,397 | 3,498 | ||||||||
Net cash provided by (used for) investing activities | 3,323,622 | (16,619 | ) | 390,669 | ||||||||
(continued)
The accompanying notes are an integral part of these consolidated financial statements.
F-6
LEUCADIA NATIONAL CORPORATION AND SUBSIDIARIES
Consolidated Statements of Cash Flows, continued
For the years ended December 31, 2013, 2012 and 2011
(In thousands)
2013 | 2012 | 2011 | ||||||||||
Net cash flows from financing activities: | ||||||||||||
Issuance of debt, net of issuance costs | $ | 2,152,937 | $ | 1,022 | $ | 93,116 | ||||||
Change in short-term borrowings | (88,000 | ) | – | – | ||||||||
Reduction of debt | (1,894,301 | ) | (572,924 | ) | (144,558 | ) | ||||||
Purchase of interest in subsidiary by noncontrolling interest | – | – | 7,500 | |||||||||
Issuance of common shares | 5,557 | – | 7,126 | |||||||||
Cash and cash equivalents of Crimson Wine Group, Ltd., which was spun off | (21,042 | ) | – | – | ||||||||
Net distributions to redeemable noncontrolling interests | (8,073 | ) | (12,722 | ) | – | |||||||
Distributions to noncontrolling interests | (355,086 | ) | (3,909 | ) | (5,843 | ) | ||||||
Contributions from noncontrolling interests | 65,870 | 1,083 | 660 | |||||||||
Purchase of common shares for treasury | (40,024 | ) | – | (155 | ) | |||||||
Dividends paid | (91,335 | ) | (61,146 | ) | (61,146 | ) | ||||||
Other | 2,990 | (3,112 | ) | (3,337 | ) | |||||||
Net cash used for financing activities | (270,507 | ) | (651,708 | ) | (106,637 | ) | ||||||
Effect of foreign exchange rate changes on cash | 6,180 | 358 | (111 | ) | ||||||||
Net increase (decrease) in cash and cash equivalents | 3,761,635 | (22,530 | ) | (272,850 | ) | |||||||
Cash and cash equivalents at January 1, including cash classified as assets of | ||||||||||||
discontinued operations | 145,960 | 168,490 | 441,340 | |||||||||
Cash and cash equivalents at December 31, including cash classified as assets of | ||||||||||||
discontinued operations | $ | 3,907,595 | $ | 145,960 | $ | 168,490 | ||||||
Supplemental disclosures of cash flow information: | ||||||||||||
Cash paid during the year for : | ||||||||||||
Interest | $ | 722,695 | $ | 103,999 | $ | 112,771 | ||||||
Income tax payments, net | $ | 75,925 | $ | 37,355 | $ | 26,175 | ||||||
Non-cash investing activities : | ||||||||||||
Common stock issued for acquisition of Jefferies Group LLC | $ | 3,385,699 | $ | – | $ | – | ||||||
Issuance of mandatorily redeemable convertible preferred shares for | ||||||||||||
acquisition of Jefferies Group LLC | $ | 125,000 | $ | – | $ | – | ||||||
Non-cash financing activities : | ||||||||||||
Net assets excluding cash and cash equivalents of Crimson Wine Group, Ltd., | ||||||||||||
which was spun off | $ | 175,958 | $ | – | $ | – | ||||||
The accompanying notes are an integral part of these consolidated financial statements.
F-7
LEUCADIA NATIONAL CORPORATION AND SUBSIDIARIES
Consolidated Statements of Changes in Equity
For the years ended December 31, 2013, 2012 and 2011
(In thousands, except par value and per share amounts)
Leucadia National Corporation Common Shareholders | ||||||||||||||||||||||||||||
Common | Accumulated | |||||||||||||||||||||||||||
Shares | Additional | Other | ||||||||||||||||||||||||||
$1 Par | Paid-In | Comprehensive | Retained | Noncontrolling | ||||||||||||||||||||||||
Value | Capital | Income (Loss) | Earnings | Subtotal | Interest | Total | ||||||||||||||||||||||
Balance, January 1, 2011 | $ | 243,808 | $ | 1,542,964 | $ | 1,687,363 | $ | 3,482,623 | $ | 6,956,758 | $ | 6,623 | $ | 6,963,381 | ||||||||||||||
Net income | 25,231 | 25,231 | (275 | ) | 24,956 | |||||||||||||||||||||||
Other comprehensive loss, net of taxes | (774,942 | ) | (774,942 | ) | (774,942 | ) | ||||||||||||||||||||||
Contributions from noncontrolling interests | – | 660 | 660 | |||||||||||||||||||||||||
Distributions to noncontrolling interests | – | (5,843 | ) | (5,843 | ) | |||||||||||||||||||||||
Change in interest in consolidated subsidiary | (1,982 | ) | (1,982 | ) | 2,700 | 718 | ||||||||||||||||||||||
Share-based compensation expense | 23,264 | 23,264 | 23,264 | |||||||||||||||||||||||||
Exercise of warrants to purchase common | ||||||||||||||||||||||||||||
s hares | 523 | (523 | ) | – | – | |||||||||||||||||||||||
Exercise of options to purchase common | ||||||||||||||||||||||||||||
s hares, including excess tax benefit | 256 | 7,112 | 7,368 | 7,368 | ||||||||||||||||||||||||
Purchase of common shares for treasury | (4 | ) | (151 | ) | (155 | ) | (155 | ) | ||||||||||||||||||||
Dividends ($.25 per common share) | (61,146 | ) | (61,146 | ) | (61,146 | ) | ||||||||||||||||||||||
Balance, December 31, 2011 | 244,583 | 1,570,684 | 912,421 | 3,446,708 | 6,174,396 | 3,865 | 6,178,261 | |||||||||||||||||||||
Net income | 854,466 | 854,466 | (2,060 | ) | 852,406 | |||||||||||||||||||||||
Other comprehensive loss, net of taxes | (207,292 | ) | (207,292 | ) | (207,292 | ) | ||||||||||||||||||||||
Contributions from noncontrolling interests | – | 1,083 | 1,083 | |||||||||||||||||||||||||
Distributions to noncontrolling interests | – | (3,909 | ) | (3,909 | ) | |||||||||||||||||||||||
Change in interest in consolidated subsidiary | (1,388 | ) | (1,388 | ) | 1,388 | – | ||||||||||||||||||||||
Share-based compensation expense | 14,459 | 14,459 | 14,459 | |||||||||||||||||||||||||
Change in fair value of redeemable | ||||||||||||||||||||||||||||
noncontrolling interests | (6,227 | ) | (6,227 | ) | (6,227 | ) | ||||||||||||||||||||||
Dividends ($.25 per common share) | (61,146 | ) | (61,146 | ) | (61,146 | ) | ||||||||||||||||||||||
Balance, December 31, 2012 | 244,583 | 1,577,528 | 705,129 | 4,240,028 | 6,767,268 | 367 | 6,767,635 | |||||||||||||||||||||
Net income | 369,240 | 369,240 | (1,162 | ) | 368,078 | |||||||||||||||||||||||
Other comprehensive loss, net of taxes | (167,079 | ) | (167,079 | ) | (167,079 | ) | ||||||||||||||||||||||
Acquisition of Jefferies Group LLC | 119,363 | 3,266,336 | 3,385,699 | 356,180 | 3,741,879 | |||||||||||||||||||||||
Distribution of common shares of Crimson | ||||||||||||||||||||||||||||
Wine Group, Ltd. to shareholders | (197,000 | ) | (197,000 | ) | (197,000 | ) | ||||||||||||||||||||||
Contributions from noncontrolling interests | – | 65,870 | 65,870 | |||||||||||||||||||||||||
Distributions to noncontrolling interests | – | (355,086 | ) | (355,086 | ) | |||||||||||||||||||||||
Change in interest in consolidated subsidiary | (4,422 | ) | (4,422 | ) | 4,422 | – | ||||||||||||||||||||||
Change in fair value of redeemable | ||||||||||||||||||||||||||||
noncontrolling interests | (16,781 | ) | (16,781 | ) | (16,781 | ) | ||||||||||||||||||||||
Exercise of options to purchase common | ||||||||||||||||||||||||||||
shares, including excess tax benefit | 184 | 4,361 | 4,545 | 4,545 | ||||||||||||||||||||||||
Purchase of common shares for treasury | (1,423 | ) | (38,601 | ) | (40,024 | ) | (40,024 | ) | ||||||||||||||||||||
Share-based compensation expense | 87,309 | 87,309 | 87,309 | |||||||||||||||||||||||||
Dividends ($.25 per common share) | (93,428 | ) | (93,428 | ) | (93,428 | ) | ||||||||||||||||||||||
Other | 1,834 | 5,301 | 7,135 | 7,135 | ||||||||||||||||||||||||
Balance, December 31, 2013 | $ | 364,541 | $ | 4,881,031 | $ | 538,050 | $ | 4,318,840 | $ | 10,102,462 | $ | 70,591 | $ | 10,173,053 | ||||||||||||||
The accompanying notes are an integral part of these consolidated financial statements.
F-8
LEUCADIA NATIONAL CORPORATION AND SUBSIDIARIES
Notes to Consolidated Financial Statements
1. Nature of Operations:
Leucadia National Corporation ("Leucadia" or the "Company") is a diversified holding company engaged through its consolidated subsidiaries in a variety of businesses, including investment banking and capital markets, beef processing, manufacturing, energy projects, asset management and real estate. We also own equity interests in operating businesses which are accounted for under the equity method of accounting, including Berkadia Commercial Mortgage LLC, a commercial mortgage banking and servicing business, the Garcadia companies, entities that own and manage automobile dealerships, and Linkem S.p.A., a fixed wireless broadband services provider in Italy. We continuously investigate possible acquisitions of new businesses, securities and assets, and evaluate the retention and disposition of our existing operations and holdings. Changes in the mix of our businesses and investments should be expected.
On March 1, 2013, Jefferies Group LLC ("Jefferies") became one of our wholly-owned subsidiaries. Jefferies is a global full-service, integrated securities and investment banking firm. Jefferies shareholders received 0.81 of a share of our common shares for each share of Jefferies common stock they held (the "Exchange Ratio"). Prior to the closing, we owned 58,006,024 common shares of Jefferies, representing approximately 28% of the outstanding common shares of Jefferies. Richard Handler, Chairman and Chief Executive Officer of Jefferies, was appointed the Chief Executive Officer and a Director of Leucadia, and Brian Friedman, the Chairman of the Executive Committee of Jefferies, was appointed President and a Director of Leucadia.
Jefferies has historically reported its Statement of Financial Condition on an unclassified basis, while we have historically reported a classified Statement of Financial Condition, with assets and liabilities separated between current and non-current. However, after giving consideration to the nature of Jefferies business and its impact on our Consolidated Statement of Financial Condition, upon completion of the acquisition, we believe it is preferable to report our Consolidated Statement of Financial Condition on an unclassified basis, and have reclassified certain amounts to be consistent with the 2013 presentation. We have also reclassified certain amounts on our consolidated financial statements, resulting from the reduced significance of certain businesses, revised the presentation of associated companies accounted for at fair value from Income related to associated companies to Principal transactions, and have revised the classification of the remaining Income related to associated companies to show such amounts before income taxes. In addition, Jefferies has a fiscal year ended November 30 th , which it will retain for standalone reporting purposes. Accordingly, we reflect Jefferies in our consolidated financial statements utilizing a one month lag. We have reviewed Jefferies business and internal operating results for the month of December 2013 for the purpose of evaluating whether additional financial statement disclosure or adjustments are required to this Annual Report on Form 10-K, and we have concluded that no additional disclosures or adjustments are warranted.
Our beef processing operations are conducted through our 78.9% ownership of National Beef Packing Company, LLC, which was acquired on December 30, 2011. Since National Beef's operating activities subsequent to the acquisition during 2011 were not significant they have not been included our 2011 Consolidated Statement of Operations. National Beef processes, packages and delivers fresh and frozen beef and beef by-products for sale to customers in the U.S. and international markets. National Beef's products include boxed beef, ground beef, hides, tallow, and other beef and beef by-products. National Beef operates the largest wet blue tanning facility in the world that sells processed hides to tanners that produce finished leather for the automotive, luxury goods, apparel and furniture industries. National Beef owns Kansas City Steak Company, LLC, which sells portioned beef and other products to customers in the food service and retail channels as well as direct to consumers through the internet and direct mail. National Beef also owns a refrigerated and livestock transportation company that provides transportation services for National Beef and third parties. National Beef operates three beef processing facilities, two consumer-ready facilities and a wet blue tanning facility, all located in the U.S.
Manufacturing operations are conducted through Idaho Timber, LLC and Conwed Plastics, LLC. Idaho Timber is engaged in the manufacture and/or distribution of various wood products, including the following principal product lines: remanufacturing dimension lumber; remanufacturing, bundling and bar coding of home center boards for large retailers; and production of 5/4" radius-edge, pine decking. Idaho Timber operates ten facilities located in the U.S.
Conwed Plastics manufactures and markets lightweight plastic netting used for building and construction, erosion control, packaging, agricultural purposes, carpet padding, filtration and consumer products and other purposes. Conwed Plastics has four domestic manufacturing facilities, and it owns and operates a manufacturing and sales facility in Belgium.
F-9
On February 25, 2013, we distributed to our shareholders the common shares of the Crimson Wine Group, Ltd., a holding company through which we historically conducted our winery operations. The distribution was structured to qualify as a tax-free spin-off for U.S. federal income tax purposes. Our common shareholders on the record date received one share of Crimson common stock for every ten common shares of Leucadia, with cash in lieu of fractional shares. The distribution was a condition to the Jefferies acquisition. As a result, we recorded a dividend of $197.0 million. Crimson was not reflected as a discontinued operation in our consolidated financial statements as amounts were not significant. Crimson's historical results of operations are included in the other operations segment.
Our medical product development operations were formerly conducted through Sangart, Inc.; however, we ceased funding Sangart and completed an orderly shut-down of its operations during 2013. As a result, our medical product development operations have been classified as a discontinued operation. See Note 31 for more information.
In December 2013, we entered into an agreement to sell Premier Entertainment Biloxi LLC ("Premier"), through which we had conducted our gaming entertainment operations. As a result, our gaming entertainment segment has been classified as a discontinued operation. See Note 31 for more information.
In February 2014, we entered into an agreement to sell substantially all of our real estate operations to HomeFed Corporation; see Notes 12 and 31 for more information.
Certain amounts have been reclassified to be consistent with the 2013 presentation.
Note 2. Significant Accounting Policies
The preparation of these financial statements in accordance with accounting principles generally accepted in the United States of America ("GAAP") requires us to make estimates and assumptions that affect the reported amounts in the financial statements and disclosures of contingent assets and liabilities. On an on-going basis, we evaluate all of these estimates and assumptions. The most important of these estimates and assumptions relate to fair value measurements, compensation and benefits, asset impairment, the ability to realize deferred tax assets, the recognition and measurement of uncertain tax positions and contingencies. Although these and other estimates and assumptions are based on the best available information, actual results could be different from these estimates.
Consolidation
Our policy is to consolidate all entities in which we control by ownership a majority of the outstanding voting stock. In addition, we consolidate entities which meet the definition of a variable interest entity for which we are the primary beneficiary. The primary beneficiary is the party who has the power to direct the activities of a variable interest entity that most significantly impact the entity's economic performance and who has an obligation to absorb losses of the entity or a right to receive benefits from the entity that could potentially be significant to the entity. We consider special allocations of cash flows and preferences, if any, to determine amounts allocable to noncontrolling interests. All intercompany transactions and balances are eliminated in consolidation.
In situations where we have significant influence, but not control, of an entity that does not qualify as a variable interest entity, we apply either the equity method of accounting or fair value accounting pursuant to the fair value option election under GAAP. We have also formed nonconsolidated investment vehicles with third-party investors that are typically organized as partnerships or limited liability companies and are carried at fair value. Our subsidiaries may act as general partner or managing member for these investment vehicles and have generally provided the third-party investors with termination or "kick-out" rights.
Revenue Recognition Policies
Beef Processing and Other Operations
Revenues are recognized when the following conditions are met: (1) collectibility is reasonably assured; (2) title to the product has passed or the service has been rendered and earned; (3) persuasive evidence of an arrangement exists; and (4) there is a fixed or determinable price. National Beef's revenues are recognized based on the terms of the sale, which for beef processing operations is typically upon delivery to customers. Manufacturing revenues are recognized when title passes.
F-10
Investment Banking Activities
Commissions. All customer securities transactions are reported in the Consolidated Statements of Financial Condition on a settlement date basis with related income reported on a trade date basis. We permit institutional customers to allocate a portion of their gross commissions to pay for research products and other services provided by third parties. The amounts allocated for those purposes are commonly referred to as soft dollar arrangements. These arrangements are accounted for on an accrual basis and, as we are not the primary obligor for these arrangements, netted against commission revenues in the Consolidated Statements of Operations. The commissions and related expenses on client transactions executed by Jefferies Bache, LLC, a futures commission merchant, are recorded on a half-turn basis.
Principal Transactions. Trading assets and trading liabilities are carried at fair value with gains and losses reflected in Principal transactions in the Consolidated Statements of Operations on a trade date basis. Fees received on loans carried at fair value are also recorded within Principal transactions.
Investment Banking. Underwriting revenues and fees from mergers and acquisitions, restructuring and other investment banking advisory assignments or engagements are recorded when the services related to the underlying transactions are completed under the terms of the assignment or engagement. Expenses associated with such assignments are deferred until reimbursed by the client, the related revenue is recognized or the engagement is otherwise concluded. Expenses are recorded net of client reimbursements and netted against revenues. Unreimbursed expenses with no related revenues are included in Selling, general and administrative expenses in the Consolidated Statements of Operations.
Interest Revenue and Expense. Interest expense that is deducted from Revenues to arrive at Net revenues is related to Jefferies operations. Contractual interest on Trading assets and Trading liabilities is recognized on an accrual basis as a component of Interest revenue and Interest expense. Interest flows on derivative trading transactions and dividends are included as part of the fair valuation of these contracts and recognized in Principal transactions in the Consolidated Statements of Operations rather than as a component of interest revenue or expense. Discounts/premiums arising on long-term debt are accreted/amortized to Interest expense using the effective yield method over the remaining lives of the underlying debt obligations.
Cash Equivalents
Cash equivalents include highly liquid investments, including money market funds, not held for resale with original maturities of three months or less.
Cash and Securities Segregated and on Deposit for Regulatory Purposes or Deposited With Clearing and Depository Organizations
In accordance with Rule 15c3-3 of the Securities Exchange Act of 1934, Jefferies LLC as a broker-dealer carrying client accounts, is subject to requirements related to maintaining cash or qualified securities in a segregated reserve account for the exclusive benefit of its clients. In addition, certain financial instruments used for initial and variation margin purposes with clearing and depository organizations are recorded in this caption. Jefferies Bache, LLC, as a futures commission merchant, is obligated by rules mandated by the Commodities Futures Trading Commission under the Commodities Exchange Act, to segregate or set aside cash or qualified securities to satisfy such regulations, which regulations have been promulgated to protect customer assets. Certain other entities are also obligated by rules mandated by their primary regulators to segregate or set aside cash or equivalent securities to satisfy regulations, promulgated to protect customer assets.
Financial Instruments
Trading assets and trading liabilities are recorded at fair value, either as required by accounting pronouncements or through the fair value option election. Trading assets and trading liabilities include Jefferies trading activities, financial instruments of other consolidated entities that are accounted for through the fair value option election and, prior to the Jefferies acquisition, trading assets include our investment in Jefferies common shares. Gains and losses on trading assets and trading liabilities are recognized in our Consolidated Statements of Operations in Principal transactions. Available for sales securities are reflected at fair value, with unrealized gains and losses reflected as a separate component of equity, net of taxes. When sold, realized gains and losses on available for sale securities are reflected in the caption Net realized securities gains. The cost of securities sold is based on average cost. Fair value is the amount that would be received to sell an asset or paid to transfer a liability in an orderly transaction between market participants at the measurement date (the exit price).
F-11
Fair Value Hierarchy
In determining fair value, we maximize the use of observable inputs and minimize the use of unobservable inputs by requiring that observable inputs be used when available. Observable inputs are inputs that market participants would use in pricing the asset or liability based on market data obtained from independent sources. Unobservable inputs reflect our assumptions that market participants would use in pricing the asset or liability developed based on the best information available in the circumstances. We apply a hierarchy to categorize our fair value measurements broken down into three levels based on the transparency of inputs as follows:
Level 1: | Quoted prices are available in active markets for identical assets or liabilities as of the reported date. |
Level 2: | Pricing inputs are other than quoted prices in active markets, which are either directly or indirectly observable as of the reported date. The nature of these financial instruments include cash instruments for which quoted prices are available but traded less frequently, derivative instruments whose fair value have been derived using a model where inputs to the model are directly observable in the market, or can be derived principally from or corroborated by observable market data, and instruments that are fair valued using other financial instruments, the parameters of which can be directly observed. |
Level 3: | Instruments that have little to no pricing observability as of the reported date. These financial instruments are measured using management's best estimate of fair value, where the inputs into the determination of fair value require significant management judgment or estimation. |
Financial instruments are valued at quoted market prices, if available. Certain financial instruments have bid and ask prices that can be observed in the marketplace. For financial instruments whose inputs are based on bid-ask prices, the financial instrument is valued at the point within the bid-ask range that meets our best estimate of fair value. We use prices and inputs that are current as of the measurement date. For financial instruments that do not have readily determinable fair values using quoted market prices, the determination of fair value is based upon consideration of available information, including types of financial instruments, current financial information, restrictions on dispositions, fair values of underlying financial instruments and quotations for similar instruments.
The valuation of financial instruments may include the use of valuation models and other techniques. Adjustments to valuations derived from valuation models may be made when, in management's judgment, features of the financial instrument such as its complexity, the market in which the financial instrument is traded and risk uncertainties about market conditions require that an adjustment be made to the value derived from the models. Adjustments from the price derived from a valuation model reflect management's judgment that other participants in the market for the financial instrument being measured at fair value would also consider in valuing that same financial instrument. To the extent that valuation is based on models or inputs that are less observable or unobservable in the market, the determination of fair value requires more judgment.
The availability of observable inputs can vary and is affected by a wide variety of factors, including, for example, the type of financial instrument and market conditions. As the observability of prices and inputs may change for a financial instrument from period to period, this condition may cause a transfer of an instrument among the fair value hierarchy levels. Transfers among the levels are recognized at the beginning of each period. The degree of judgment exercised in determining fair value is greatest for instruments categorized in Level 3.
Jefferies Valuation Process for Financial Instruments
The Jefferies Independent Price Verification ("IPV") Group, which is part of the Jefferies finance department, in partnership with Jefferies Risk Management, is responsible for establishing Jefferies valuation policies and procedures. The IPV Group and Risk Management, which are independent of business functions, play an important role and serve as a control function in determining that Jefferies financial instruments are appropriately valued and that fair value measurements are reliable. This is particularly important where prices or valuations that require inputs are less observable. In the event that observable inputs are not available, the control processes are designed to assure that the valuation approach utilized is appropriate and consistently applied and that the assumptions are reasonable. The IPV Group reports to the Jefferies Global Controller and is subject to the oversight of the IPV Committee, which includes senior members of Jefferies finance department and other personnel. Jefferies independent price verification policies and procedures are reviewed, at a minimum, annually and changes to the policies require the approval of the IPV Committee.
Price Testing Process . The business units are responsible for determining the fair value of Jefferies financial instruments using approved valuation models and methodologies. In order to ensure that the business unit valuations represent a fair value exit price, the IPV Group tests and validates the fair value of the financial instruments inventory. In the testing process, the IPV Group obtains prices and valuation inputs from sources independent of Jefferies, consistently adheres to established procedures set forth in the valuation policies for sourcing prices and valuation inputs and utilizing valuation methodologies. Sources used to validate fair value prices and inputs include, but are not limited to, exchange data, recently executed transactions, pricing data obtained from third party vendors, pricing and valuation services, broker quotes and observed comparable transactions.
F-12
To the extent discrepancies between the business unit valuations and the pricing or valuations resulting from the price testing process are identified, such discrepancies are investigated by the IPV Group and fair values are adjusted, as appropriate. The IPV Group maintains documentation of its testing, results, rationale and recommendations and prepares a monthly summary of its valuation results. This process also forms the basis for the classification of fair values within the fair value hierarchy (i.e., Level 1, Level 2 or Level 3). The IPV Group utilizes the additional expertise of Risk Management personnel in valuing more complex financial instruments and financial instruments with less or limited pricing observability. The results of the valuation testing are reported to the IPV Committee on a monthly basis, which discusses the results and is charged with the final conclusions as to the financial instrument fair values in the consolidated financial statements. This process specifically assists management in asserting as to the fair presentation of our financial condition and results of operations as included within our Quarterly Reports on Form 10-Q and Annual Report on Form 10-K. At each quarter end, the overall valuation results, as concluded upon by the IPV Committee, are presented to the Jefferies Audit Committee.
Judgment exercised in determining Level 3 fair value measurements is supplemented by daily analysis of profit and loss performed by the Product Control functions. Gains and losses, which result from changes in fair value, are evaluated and corroborated daily based on an understanding of each of the trading desks' overall risk positions and developments in a particular market on the given day. Valuation techniques generally rely on recent transactions of suitably comparable financial instruments and use the observable inputs from those comparable transactions as a validation basis for Level 3 inputs. Level 3 fair value measurements are further validated through subsequent sales testing and market comparable sales, if such information is available. Level 3 fair value measurements require documentation of the valuation rationale applied, which is reviewed for consistency in application from period to period; and the documentation includes benchmarking the assumptions underlying the valuation rationale against relevant analytic data.
Third Party Pricing Information . Pricing information obtained from external data providers (including independent pricing services and brokers) may incorporate a range of market quotes from dealers, recent market transactions and benchmarking model derived prices to quoted market prices and trade data for comparable securities. External pricing data is subject to evaluation for reasonableness by the IPV Group using a variety of means including comparisons of prices to those of similar product types, quality and maturities, consideration of the narrowness or wideness of the range of prices obtained, knowledge of recent market transactions and an assessment of the similarity in prices to comparable dealer offerings in a recent time period. Jefferies has a process whereby it challenges the appropriateness of pricing information obtained from external data providers (including independent pricing services and brokers) in order to validate the data for consistency with the definition of a fair value exit price. Jefferies process includes understanding and evaluating the external data providers' valuation methodologies. For corporate, U.S. government and agency, and municipal debt securities, and loans, to the extent independent pricing services or broker quotes are utilized in our valuation process, the vendor service providers are collecting and aggregating observable market information as to recent trade activity and active bid-ask submissions. The composite pricing information received from the independent pricing service is not based on unobservable inputs or proprietary models. For mortgage- and other asset-backed securities and collateralized debt obligations, the independent pricing service uses a matrix evaluation approach incorporating both observable yield curves and market yields on comparable securities as well as implied inputs from observed trades for comparable securities in order to determine prepayment speeds, cumulative default rates and loss severity. Further, Jefferies considers pricing data from multiple service providers as available as well as compares pricing data to prices observed for recent transactions, if any, in order to corroborate valuation inputs.
Model Review Process . Where a pricing model is to be used to determine fair value, the pricing model is reviewed for theoretical soundness and appropriateness by Risk Management, independent from the trading desks, and then approved by Risk Management to be used in the valuation process. Review and approval of a model for use may include benchmarking the model against relevant third party valuations, testing sample trades in the model, backtesting the results of the model against actual trades and stress-testing the sensitivity of the pricing model using varying inputs and assumptions. In addition, recently executed comparable transactions and other observable market data are considered for purposes of validating assumptions underlying the model. Models are independently reviewed and validated by Risk Management annually or more frequently if market conditions or use of the valuation model changes.
Investments in Managed Funds
Investments in managed funds include our investments in funds managed by us and our investments in related party managed funds in which we are entitled to a portion of the management and/or performance fees. Investments in nonconsolidated managed funds are accounted for at fair value with gains or losses included in the Consolidated Statements of Operations.
Asset management fees and investment income from managed funds include revenues we earn from management, administrative and performance fees from funds and accounts managed by us, revenues from management and performance fees we earn from related-party managed funds and investment income from our investments in these funds. We earn fees in connection with management and investment advisory services performed for various funds and managed accounts. These fees are based on assets under management or an agreed upon notional amount and may include performance fees based upon the performance of the funds. Management and administrative fees are generally recognized over the period that the related service is provided. Generally, performance fees are earned when the return on assets under management exceeds certain benchmark returns, "high-water marks" or other performance targets. Performance fees are accrued (or reversed) on a monthly basis based on measuring performance to date versus any relevant benchmark return hurdles stated in the investment management agreement. Performance fees are not subject to adjustment once the measurement period ends (generally annual periods) and the performance fees have been realized.
F-13
Loans to and Investments in Associated Companies
Loans to and investments in associated companies include investments in private equity and other operating entities in which we exercise significant influence over operating and capital decisions and loans issued in connection with such investments. Loans to and investments in associated companies are accounted for using the equity method. See Notes 12 and 30 for additional information regarding certain of these investments.
Under the equity method of accounting, our share of the investee's underlying net income or loss is recorded as Income (loss) related to associated companies, or as part of Other revenues if such investees are considered to be an extension of our business. Income (loss) for investees for which the fair value option was elected are reported as Principal transactions revenues.
Receivables from and Payables to Customers of Securities Operations
Receivables from and payables to customers of securities operations include amounts receivable and payable on cash and margin transactions. Securities owned by customers and held as collateral for these receivables are not reflected in the accompanying consolidated financial statements. Receivables from officers and directors included within this financial statement line item represent balances arising from their individual security transactions. These transactions are subject to the same regulations as customer transactions and are provided on substantially the same terms.
Securities Borrowed and Securities Loaned
Securities borrowed and securities loaned are carried at the amounts of cash collateral advanced and received in connection with the transactions and accounted for as collateralized financing transactions. In connection with both trading and brokerage activities, Jefferies borrows securities to cover short sales and to complete transactions in which customers have failed to deliver securities by the required settlement date, and lend securities to other brokers and dealers for similar purposes. Jefferies has an active securities borrowed and lending matched book business in which it borrows securities from one party and lends them to another party. When Jefferies borrows securities, it generally provides cash to the lender as collateral, which is reflected in the Consolidated Statements of Financial Condition as Securities borrowed. Jefferies earns interest revenues on this cash collateral. Similarly, when Jefferies lends securities to another party, that party provides cash to Jefferies as collateral, which is reflected in the Consolidated Statements of Financial Condition as Securities loaned. Jefferies pays interest expense on the cash collateral received from the party borrowing the securities. The initial collateral advanced or received approximates or is greater than the fair value of the securities borrowed or loaned. Jefferies monitors the fair value of the securities borrowed and loaned on a daily basis and requests additional collateral or returns excess collateral, as appropriate.
Securities Purchased Under Agreements to Resell and Securities Sold Under Agreements to Repurchase
Securities purchased under agreements to resell and Securities sold under agreements to repurchase (collectively "repos") are accounted for as collateralized financing transactions and are recorded at their contracted resale or repurchase amount plus accrued interest. Repos are presented in the Consolidated Statements of Financial Condition on a net-basis-by counterparty, where permitted by GAAP. The fair value of the underlying securities is monitored daily versus the related receivable or payable balances. Should the fair value of the underlying securities decline or increase, additional collateral is requested or excess collateral is returned, as appropriate.
Property, Equipment and Leasehold Improvements
Property, equipment and leasehold improvements are stated at cost, net of accumulated depreciation and amortization. Depreciation and amortization are provided principally on the straight-line method over the estimated useful lives of the assets or, if less, the term of the underlying lease.
Impairment of Long-Lived Assets
We evaluate our long-lived assets for impairment whenever events or changes in circumstances indicate, in management's judgment, that the carrying value of such assets may not be recoverable. When testing for impairment, we group our long-lived assets with other assets and liabilities at the lowest level for which identifiable cash flows are largely independent of the cash flows of other assets and liabilities (or asset group). The determination of whether an asset group is recoverable is based on management's estimate of undiscounted future cash flows directly attributable to the asset group as compared to its carrying value. If the carrying amount of the asset group is greater than the undiscounted cash flows, an impairment loss would be recognized for the amount by which the carrying amount of the asset group exceeds its estimated fair value.
F-14
National Beef's beef processing facility located in Brawley, California was originally acquired by National Beef in May 2006. When National Beef was acquired by us in December 2011, the Brawley facility was recorded at its then fair value, which was based in part on market studies and appraisals prepared by an independent valuation and appraisal firm. The facility was profitable for periods through 2011 during a period of favorable industry margins and when the plant had access to a sufficient supply of cattle. However, more recently National Beef has struggled to achieve acceptable gross margins and to overcome the declining supply of fed cattle available to the plant and fixed cost inefficiencies inherent in a single shift plant. There is not an adequate supply of fed cattle to operate the plant efficiently and our outlook is for the supply to continue to decline.
After exhausting all opportunities to improve the operating performance of the Brawley beef processing facility, during the fourth quarter of 2013 National Beef concluded that the facility would continue to generate losses for the foreseeable future, resulting in a decision in December 2013 to close the facility in April 2014. Subsequent to closing the plant, National Beef plans to hold the plant in "mothballed" status indefinitely. National Beef evaluated the recoverability of the long-lived assets at Brawley, which had an aggregate carrying amount of $93.2 million at December 31, 2013, and based on its estimate of future undiscounted cash flows concluded that the carrying value was not recoverable and the facility was impaired. In performing this evaluation, National Beef determined that the Brawley facility is the asset group that represents the lowest level of cash flows that are largely independent of the cash flows of other assets and liabilities.
The management of National Beef engaged an independent valuation and appraisal firm to assist in estimating the fair value of the long-lived assets at Brawley. National Beef's estimate of fair value was based on an orderly liquidation technique, which represents the amount that can be realized in a liquidation sale, given a reasonable period of time to find a purchaser, assuming an as-is where-is condition. In preparing its analysis, National Beef considered current market conditions, replacement cost, as well as the age, physical and functional characteristics of the long-lived assets.
As a result, National Beef concluded that the fair value of the long-lived assets at the Brawley facility is $29.9 million at December 31, 2013, and recorded an impairment loss of $63.3 million, which is reflected in Selling, general and other expenses in the Consolidated Statement of Operations for the year ended December 31, 2013. As with any estimate of fair value, future market, regulatory and general economic conditions as well as the obsolescence, future deterioration of, or inability to locate a purchaser should National Beef decide to sell the facility could have a significant effect on their future value.
In addition to the long-lived asset impairment charge, National Beef expects to incur additional costs relating to the closing of the facility during 2014. These costs include costs for fulfilling certain contractual obligations, employee separation and retention, systems decommissioning and various other expenses. National Beef currently estimates that these costs could be up to $20.0 million in the aggregate. Under GAAP, these costs may not be accrued until they are actually incurred.
Excluding the National Beef impairment, we recorded impairment charges in Selling, general and other expenses of $20.0 million in 2013 and $4.2 million in 2012; all related to various real estate development projects. Prior to the impairment charges in 2013, these projects had a book value of $32.3 million; after recognizing the impairment charges the carrying value of the real estate projects was reduced to their estimated fair value of $12.3 million. Estimates of fair value were principally determined using discounted cash flow analyses and/or current and expected market conditions for the specific geographic area. For the year ended December 31, 2013, impairment charges related to real estate include an out of period adjustment of $15.4 million to record charges related to prior periods.
Substantially all of our operating businesses sell products or services that are impacted by general economic conditions in the U.S. and to a lesser extent internationally. In recent years general economic conditions reduced the demand for products or services sold by our operating subsidiaries and/or resulted in reduced pricing for products or services. A worsening of current economic conditions could cause a decline in estimated future cash flows expected to be generated by our operations and investments. If future undiscounted cash flows are estimated to be less than the carrying amounts of the asset groups used to generate those cash flows in subsequent reporting periods, particularly for those with large investments in intangible assets and property and equipment (for example, investment banking & capital markets, beef processing, manufacturing, real estate and certain associated company investments), impairment charges would have to be recorded.
Intangible Assets, Net and Goodwill
Intangible Assets . Intangible assets deemed to have finite lives are amortized on a straight line basis over their estimated useful lives, where the useful life is the period over which the asset is expected to contribute directly, or indirectly, to our future cash flows. Intangible assets are reviewed for impairment on an interim basis when certain events or circumstances exist. If future undiscounted cash flows are estimated to be less than the carrying amounts of the asset groups used to generate those cash flows in subsequent reporting periods, particularly for those with large investments in amortizable intangible assets, impairment charges would have to be recorded.
F-15
An intangible asset with an indefinite useful life is not amortized but assessed for impairment annually, or more frequently, when certain events or circumstances exist indicating an assessment for impairment is necessary. Impairment exists when the carrying amount exceeds its fair value. Fair value will be determined using valuation techniques consistent with what a market participant would use. All of our annual indefinite-lived intangible assets were recognized in connection with the Jefferies acquisition, and our impairment testing date is as of August 1 . When tested, there was no significant impairment recognized for intangible assets.
Goodwill. At acquisition, we allocate the cost of a business acquisition to the specific tangible and intangible assets acquired and liabilities assumed based upon their fair values. Significant judgments and estimates are often made by management to determine these values, and may include the use of appraisals, consideration of market quotes for similar transactions, use of discounted cash flow techniques or consideration of other information we believe to be relevant. Any excess of the cost of a business acquisition over the fair values of the net assets and liabilities acquired is recorded as goodwill, which is not amortized to expense. Substantially all of our goodwill was recognized in connection with the Jefferies acquisition.
At least annually, and more frequently if warranted, we will assess whether goodwill has been impaired . If the estimated fair value exceeds the carrying value, goodwill at the reporting unit level is not impaired. If the estimated fair value is less than carrying value, further analysis is necessary to determine the amount of impairment, if any. The fair values will be based on widely accepted valuation techniques that we believe market participants would use, although the valuation process requires significant judgment and often involves the use of significant estimates and assumptions. The methodologies we utilize in estimating fair value include market capitalization, price-to-book multiples of comparable exchange traded companies, multiples of merger and acquisitions of similar businesses and/or projected cash flows. The estimates and assumptions used in determining fair value could have a significant effect on whether or not an impairment charge is recorded and the magnitude of such a charge. Adverse market or economic events could result in impairment charges in future periods. Our annual goodwill impairment testing date related to Jefferies as of August 1 did not indicate any goodwill impairment in any of Jefferies reporting units; see Note 14 for more information .
Inventories and Cost of Sales
National Beef's inventories consist primarily of meat products and supplies, and are stated at the lower of cost or market, with cost principally determined under the first-in-first-out method for meat products and average cost for supplies.
Manufacturing inventories are stated at the lower of cost or market, with cost principally determined under the first-in-first-out method. Manufacturing cost of sales principally includes product and manufacturing costs, inbound and outbound shipping costs and handling costs.
Income Taxes
We record a valuation allowance to reduce our net deferred tax asset to the net amount that is more likely than not to be realized. If in the future we determine that it is more likely than not that we will be able to realize our net deferred tax asset in excess of our net recorded amount, an adjustment to increase the net deferred tax asset would increase income in such period. If in the future we were to determine that we would not be able to realize all or part of its recorded net deferred tax asset, an adjustment to decrease the net deferred tax asset would be charged to income in such period. We are required to consider all available evidence, both positive and negative, and to weight the evidence when determining whether a valuation allowance is required and the amount of such valuation allowance. Generally, greater weight is required to be placed on objectively verifiable evidence when making this assessment, in particular on recent historical operating results.
Our estimate of future taxable income considers all available evidence, both positive and negative, about our operating businesses and investments, includes an aggregation of individual projections for each significant operating business and investment, estimated apportionment factors for state and local taxing jurisdictions and included all future years that we estimate we will have available net operating loss carryforwards ("NOLs") (until 2029). We believe that our estimate of future taxable income is reasonable but inherently uncertain, and if our current or future operations and investments generate taxable income different than the projected amounts, further adjustments to the valuation allowance are possible. The current balance of the deferred tax valuation allowance principally reserves for NOLs of certain subsidiaries that are not available to offset income generated by other members of the consolidated tax return group.
We also record reserves for unrecognized tax benefits based on our assessment of the probability of successfully sustaining tax filing positions. Interest and penalties, if any, are recorded as components of income tax expense. Management exercises significant judgment when assessing the probability of successfully sustaining tax filing positions, and in determining whether a contingent tax liability should be recorded and if so estimating the amount. If our tax filing positions are successfully challenged, payments could be required that are in excess of reserved amounts or we may be required to reduce the carrying amount of our net deferred tax asset, either of which could be significant to our Consolidated Statement of Financial Condition or results of operations.
F-16
Share-based Compensation
Share-based awards are measured based on the fair value of the award as determined in accordance with GAAP and recognized over the required service or vesting period. The fair value of options and warrants are estimated at the date of grant using the Black-Scholes option pricing model. Expected forfeitures are included in determining share-based compensation expense.
Foreign Currency Translation
Assets and liabilities of foreign subsidiaries having non-U.S. dollar functional currencies are translated at exchange rates at the end of a period. Revenues and expenses are translated at average exchange rates during the period. The gains or losses resulting from translating foreign currency financial statements into U.S. dollars, net of hedging gains or losses and taxes, if any, are included in other comprehensive income. Gains or losses resulting from foreign currency transactions are included in the Consolidated Statements of Operations.
Earnings per Common Share
Basic earnings per share ("EPS") is computed by dividing net earnings available to common shareholders by the weighted average number of common shares outstanding and certain other shares committed to be, but not yet issued. Net earnings available to common shareholders represent net earnings to common shareholders reduced by the allocation of earnings to participating securities. Losses are not allocated to participating securities. Common shares outstanding and certain other shares committed to be, but not yet issued, include restricted stock and restricted stock units ("RSUs") for which no future service is required. Diluted EPS is computed by dividing net earnings available to common shareholders plus dividends on dilutive mandatorily redeemable convertible preferred shares and interest on convertible notes by the weighted average number of common shares outstanding and certain other shares committed to be, but not yet issued, plus all dilutive common stock equivalents outstanding during the period.
Unvested share-based payment awards that contain nonforfeitable rights to dividends or dividend equivalents (whether paid or unpaid) are participating securities and, therefore, are included in the earnings allocation in computing earnings per share under the two-class method of earnings per share. Restricted stock and RSUs granted as part of share-based compensation contain nonforfeitable rights to dividends and dividend equivalents, respectively, and therefore, prior to the requisite service being rendered for the right to retain the award, restricted stock and RSUs meet the definition of a participating security. As such, we calculate basic and diluted earnings per share under the two-class method.
Securitization Activities
Jefferies engages in securitization activities related to corporate loans, commercial mortgage loans and mortgage-backed and other asset-backed securities. Such transfers of financial assets are accounted for as sales when we have relinquished control over the transferred assets. The gain or loss on sale of such financial assets depends, in part, on the previous carrying amount of the assets involved in the transfer allocated between the assets sold and the retained interests, if any, based upon their respective fair values at the date of sale. We may retain interests in the securitized financial assets as one or more tranches of the securitization. These retained interests are included within Trading assets in the Consolidated Statements of Financial Condition at fair value. Any changes in the fair value of such retained interests are recognized in the Consolidated Statements of Operations.
When a transfer of assets does not meet the criteria of a sale, the transfer is accounted for as a secured borrowing and we continue to recognize the assets of a secured borrowing in Trading assets and recognize the associated financing in Other secured financings.
Contingencies
In the normal course of business, we have been named, from time to time, as a defendant in legal and regulatory proceedings. We are also involved, from time to time, in other exams, investigations and similar reviews (both formal and informal) by governmental and self-regulatory agencies regarding our businesses, certain of which may result in judgments, settlements, fines, penalties or other injunctions.
We recognize a liability for a contingency when it is probable that a liability has been incurred and the amount of loss can be reasonably estimated. If the reasonable estimate of a probable loss is a range, we accrue the most likely amount of such loss, and if such amount is not determinable, then we accrue the minimum in the range as the loss accrual. The determination of the outcome and loss estimates requires significant judgment on the part of management, can be highly subjective and is subject to significant change with the passage of time as more information becomes available. Estimating the ultimate impact of litigation matters is inherently uncertain, in particular because the ultimate outcome will rest on events and decisions of others that may not be within our power to control. We do not believe that any of our current litigation will have a significant adverse effect on our consolidated financial position, results of operations or liquidity; however, if amounts paid at the resolution of litigation are in excess of recorded reserve amounts, the excess could be significant in relation to results of operations for that period. For further information, see Note 27.
F-17
Note 3. Accounting Developments
Accumulated Other Comprehensive Income. Effective January 2013, we adopted new Financial Accounting Standards Board ("FASB") Accounting Standards guidance with respect to the reporting of reclassifications out of accumulated other comprehensive income. The new guidance requires an entity to report the effect of significant reclassifications out of accumulated other comprehensive income on the respective line items in net income if the amount being reclassified is required under GAAP to be reclassified in its entirety to net income. For other amounts that are not required under GAAP to be reclassified in their entirety from accumulated other comprehensive income to net income in the same reporting period, an entity is required to cross-reference other disclosures required under GAAP that provide additional detail about those amounts. Adoption of this guidance had no impact on our consolidated financial statements but did require additional disclosures.
Balance Sheet Offsetting Disclosures. In January 2013, we adopted new FASB guidance that required new disclosures regarding balance sheet offsetting and related arrangements for derivatives, repurchase agreements and reverse repurchase agreements, and securities borrowing and securities lending transactions that are offset in the balance sheet or subject to an enforceable master netting arrangement or similar agreement regardless of whether they are offset in the balance sheet. The amendments require disclosure of gross and net asset and liability information and are to be applied retrospectively. This guidance does not amend the existing guidance on when it is appropriate to offset; as a result, this guidance did not affect our consolidated financial statements but did require additional disclosures.
Indefinite-Lived Intangible Asset Impairment. In January 2013, we adopted new FASB guidance that permits an entity to first assess qualitative factors to determine whether it is more likely than not that an indefinite-lived intangible asset, other than goodwill, is impaired as a basis for determining whether it is necessary to perform the quantitative impairment test. The guidance did not revise the requirement to test indefinite-lived intangible assets annually for impairment, or more frequently if deemed appropriate. The adoption of this guidance had no impact on our consolidated financial statements.
Goodwill Testing. In January 2013, we adopted new FASB guidance that outlines amendments to the two step goodwill impairment test permitting an entity to first assess qualitative factors in determining whether it is more likely than not that the fair value of a reporting unit is less than its carrying amount as a basis for determining whether it is necessary to perform the two step quantitative goodwill impairment test. The adoption of this guidance had no impact on our consolidated financial statements.
Income Taxes. In July 2013, the FASB issued new guidance that requires an entity to present an unrecognized tax benefit, or a portion of an unrecognized tax benefit, in the financial statements as a reduction to a deferred tax asset for a net operating loss carryforward, a similar tax loss or tax credit carryforward, unless such net operating loss carryforward, similar tax loss or tax credit carryforward is not available at the reporting date under the tax law of the applicable jurisdiction to settle any additional income taxes resulting from the disallowance of a tax position. In the event that the tax position is disallowed or the tax law of the applicable jurisdiction does not require the entity to use, and the entity does not intend to use, the deferred tax asset for such purpose, the unrecognized tax benefit shall be presented in the financial statements as a liability and shall not be combined with deferred tax assets. The guidance is effective for annual reporting periods beginning after December 15, 2013, and interim periods within those annual periods and is to be applied prospectively. We are currently evaluating the impact of this new guidance on our consolidated financial statements.
Note 4. Acquisitions
Jefferies became a wholly-owned subsidiary on March 1, 2013. Each share of Jefferies common stock was converted at the Exchange Ratio into our common shares, an aggregate of approximately 119,363,000 common shares, and we issued a new series of our 3.25% Cumulative Convertible Preferred Shares ($125.0 million at mandatory redemption value) in exchange for Jefferies outstanding 3.25% Series A-1 Cumulative Convertible Preferred Stock. In addition, each restricted share of Jefferies common stock and each RSU of Jefferies common stock was converted at the Exchange Ratio into an award of restricted shares or RSUs of Leucadia, with all such awards subject to the same terms and conditions, including, without limitation, vesting and, in the case of performance-based RSUs, performance being measured at existing targets. We did not assume or guarantee any of Jefferies outstanding debt securities, but Jefferies 3.875% Convertible Senior Debentures due 2029 ($345.0 million principal amount outstanding) are now convertible into our common shares. As specified in the indenture governing such debentures, the debentures are not currently convertible; if the debentures were currently convertible, the conversion price would be $45.51 per common share.
The Jefferies acquisition was accounted for using the acquisition method of accounting. The aggregate purchase price ($4,770.6 million) equaled the sum of the fair value of our common shares issued at closing, the fair value of employee stock based awards attributable to periods prior to closing, the fair value of the Jefferies common stock owned by us ($1.3 billion) and the redemption value of the new series of preferred shares issued at closing, which represents its fair value. The fair values of the Jefferies common stock owned by us and the common shares and employee stock based awards issued were determined by using market prices at closing. Including our investment in Jefferies High Yield Holdings, LLC ("JHYH"), which was contributed to Jefferies capital after the acquisition, our aggregate investment in Jefferies is $5.3 billion at December 31, 2013.
F-18
The following table reflects the allocation of the purchase price to the assets acquired and liabilities assumed at the acquisition date (in thousands):
Assets | ||||
Cash and cash equivalents | $ | 3,017,958 | ||
Cash and securities segregated and on deposit for regulatory purposes or | ||||
deposited with clearing and depository organizations | 3,728,742 | |||
Trading assets | 16,413,535 | |||
Loans to and investments in associated companies | 766,893 | |||
Securities borrowed | 5,315,488 | |||
Securities purchased under agreements to resell | 3,578,366 | |||
Intangible assets, net | 282,852 | |||
Goodwill | 1,722,591 | |||
Deferred tax asset, net | 539,384 | |||
Other assets | 4,386,419 | |||
Total assets | 39,752,228 | |||
Liabilities | ||||
Short-term borrowings | 100,000 | |||
Trading liabilities | 9,766,876 | |||
Securities loaned | 1,902,687 | |||
Securities sold under agreements to repurchase | 7,976,492 | |||
Payables to customers of securities operations | 5,450,781 | |||
Trade payables, expense accruals and other liabilities | 2,724,136 | |||
Mandatorily redeemable preferred interest in JHYH held by Leucadia | 358,951 | |||
Long-term debt | 6,345,536 | |||
Total liabilities | 34,625,459 | |||
Noncontrolling interests | 356,180 | |||
Net assets acquired | $ | 4,770,589 | ||
The fair value of Jefferies customer relationships and tradename were estimated using an income approach which calculates the present value of the estimated future net economic benefits of the assets over their estimated remaining life. Replacement cost was used to estimate the fair value of internally developed software and exchange and clearing organization memberships based on the premise that a prudent investor would not pay more for an asset than its replacement cost. The fair values of trading assets and trading liabilities were determined based upon the methodologies disclosed in Note 6 below. The fair value of long-term debt was principally based on prices observed for recently executed market transactions or based on valuations received from third party brokers. The fair value of noncontrolling interests, which principally represented third-party investors in JHYH, and the fair value of mandatorily redeemable preferred interests in JHYH held by us, was the estimated redemption value of those interests, which was based on their share of the underlying net assets in JHYH. JHYH net assets were valued using the methodologies disclosed in Note 6 below. The third-party interests in JHYH have been redeemed and our interest contributed to Jefferies capital. Approximately $111.5 million of the goodwill recorded at acquisition is deductible for income tax purposes.
F-19
Amounts allocated to intangible assets, the amortization period and goodwill were as follows (dollars in thousands):
Amortization | |||||
Amount | Years | ||||
Customer relationships | $ | 136,002 | 9 to 18 years | ||
Tradenames and related trademarks | 131,299 | 35 years | |||
Exchange and clearing organization | |||||
membership interests and registrations | 15,551 | Indefinite | |||
Subtotal, intangible assets | 282,852 | ||||
Goodwill | 1,722,591 | ||||
Total | $ | 2,005,443 | |||
For the year ended December 31, 2013, we expensed costs related to the acquisition of Jefferies of $18.5 million.
In December 2011, we acquired a controlling interest in National Beef for aggregate net cash consideration of $867.9 million. Pursuant to a membership interest purchase agreement among us, National Beef, U.S. Premium Beef, LLC ("USPB"), NBPCo Holdings, LLC ("NBPCo Holdings"), TKK Investments, LLC ("TKK"), TMKCo, LLC ("TMKCo") and TMK Holdings ("TMK"), the following transactions occurred in sequence on the closing date. TKK, TMKCo and TMK are entities controlled by the chief executive officer of National Beef.
(a) | We purchased 76.1% of National Beef from USPB and NBPCo Holdings for aggregate cash consideration of $875.4 million. |
(b) | TKK and TMKCo exercised their put rights with respect to their aggregate 5.1% interest in National Beef and National Beef redeemed their interest for aggregate cash payments of $75.9 million. National Beef borrowed funds under its revolving credit facility to finance the redemption. Upon completion of this redemption our interest in National Beef increased to 79.6%. |
(c) | TMK purchased a .7% interest in National Beef from us for a cash payment of $7.5 million, reducing our interest to 78.9%. |
Upon consummation of the transactions on the closing date, USPB owned 15.1% and NBPCo Holdings owned 5.3% of National Beef. Since transactions (b) and (c) above occurred after we acquired a controlling interest in National Beef, those transactions are reflected in our consolidated financial statements.
For the year ended December 31, 2011, we expensed $14.8 million of costs related to the acquisition of National Beef.
Presented below for the years ended December 31, 2013 and 2012, are unaudited pro forma operating results assuming the acquisition of Jefferies had occurred on January 1, 2012. Unaudited pro forma operating results for the year ended December 31, 2011 assume the acquisition of National Beef had occurred on January 1, 2010 (in thousands, except per share amounts):
2013 | 2012 | 2011 | ||||||||||
Net revenues | $ | 11,087,668 | $ | 12,253,259 | $ | 7,681,167 | ||||||
Net income attributable to Leucadia National Corporation | ||||||||||||
common shareholders | $ | 267,160 | $ | 900,044 | $ | 112,754 | ||||||
Basic income per common share attributable to Leucadia | ||||||||||||
National Corporation common shareholders | $ | .70 | $ | 2.37 | $ | .46 | ||||||
Diluted income per common share attributable to Leucadia | ||||||||||||
National Corporation common shareholders | $ | .70 | $ | 2.33 | $ | .46 | ||||||
Pro forma adjustments for National Beef principally reflect an increase to depreciation and amortization expenses related to the fair value of property and equipment and amortizable intangible assets. Pro forma adjustments for Jefferies principally reflect an increase to amortization expenses related to the fair value of amortizable intangible assets, a reduction to interest expense for the amortization of the premium recorded to reflect long-term debt at fair value and to reflect the costs related to the acquisition as if they had occurred in the period beginning January 1, 2012. In addition, the pro forma adjustments reflect the elimination from Net revenues amounts recognized from the application of the fair value option to our investment in Jefferies for periods prior to March 1, 2013, as more fully described in Note 6. For the year ended December 31, 2013, pro forma adjustments include the removal of the deferred tax liability reversal related to our investment in Jefferies for periods prior to March 1, 2013 ($34.0 million). For the year ended December 31, 2012, pro forma adjustments include the write-off of the deferred tax asset related to our investment in Jefferies that was reflected in our Consolidated Statement of Financial Condition as of December 31, 2011 ($64.8 million), and the write-off of a portion of our net deferred tax asset for state income taxes resulting from a change in our expected state filing positions ($12.3 million). The unaudited pro forma data is not indicative of future results of operations or what would have resulted if the acquisitions had actually occurred as of the dates indicated above.
F-20
Note 5. Cash and Cash Equivalents
Cash and cash equivalents include the following at December 31, 2013 and 2012 (in thousands):
2013 | 2012 | |||||||
Cash in banks | $ | 1,174,480 | $ | 143,517 | ||||
Money market and other short-term investments | 2,733,115 | 2,443 | ||||||
Total cash and cash equivalents | $ | 3,907,595 | $ | 145,960 | ||||
Note 6. Fair Value Disclosures
The following is a summary of our financial instruments, trading liabilities and investments in managed funds that are accounted for at fair value on a recurring basis by level within the fair value hierarchy at December 31, 2013 and 2012 (in thousands):
December 31, 2013 | ||||||||||||||||||||
Level 1 (1) | Level 2 (1) | Level 3 | Counterparty and Cash Collateral Netting (2) | Total | ||||||||||||||||
Assets: | ||||||||||||||||||||
Trading assets, at fair value: | ||||||||||||||||||||
Corporate equity securities | $ | 1,957,963 | $ | 175,493 | $ | 9,884 | $ | – | $ | 2,143,340 | ||||||||||
Corporate debt securities | – | 2,961,857 | 25,666 | – | 2,987,523 | |||||||||||||||
Collateralized debt obligations | – | 182,095 | 37,216 | – | 219,311 | |||||||||||||||
U.S. government and federal agency securities | 2,293,221 | 40,389 | – | – | 2,333,610 | |||||||||||||||
Municipal securities | – | 664,054 | – | – | 664,054 | |||||||||||||||
Sovereign obligations | 1,458,803 | 889,685 | – | – | 2,348,488 | |||||||||||||||
Residential mortgage-backed securities | – | 2,932,268 | 105,492 | – | 3,037,760 | |||||||||||||||
Commercial mortgage-backed securities | – | 1,130,410 | 17,568 | – | 1,147,978 | |||||||||||||||
Other asset-backed securities | – | 55,475 | 12,611 | – | 68,086 | |||||||||||||||
Loans and other receivables | – | 1,203,238 | 145,890 | – | 1,349,128 | |||||||||||||||
Derivatives | 40,952 | 2,472,238 | 1,493 | (2,253,589 | ) | 261,094 | ||||||||||||||
Investments at fair value | – | 40 | 101,242 | – | 101,282 | |||||||||||||||
Physical commodities | – | 37,888 | – | – | 37,888 | |||||||||||||||
Total trading assets | $ | 5,750,939 | $ | 12,745,130 | $ | 457,062 | $ | (2,253,589 | ) | $ | 16,699,542 | |||||||||
Available for sale securities: | ||||||||||||||||||||
Corporate equity securities | $ | 252,531 | $ | – | $ | – | $ | – | $ | 252,531 | ||||||||||
Corporate debt securities | – | 51,163 | – | – | 51,163 | |||||||||||||||
U.S. government securities | 1,781,266 | – | – | – | 1,781,266 | |||||||||||||||
Residential mortgage-backed securities | – | 579,162 | – | – | 579,162 | |||||||||||||||
Commercial mortgage-backed securities | – | 17,985 | – | – | 17,985 | |||||||||||||||
Other asset-backed securities | – | 184,036 | – | – | 184,036 | |||||||||||||||
Total available for sale securities | $ | 2,033,797 | $ | 832,346 | $ | – | $ | – | $ | 2,866,143 | ||||||||||
Cash and cash equivalents | $ | 3,907,595 | $ | – | $ | – | $ | – | $ | 3,907,595 | ||||||||||
Investments in managed funds | $ | – | $ | – | $ | 57,285 | $ | – | $ | 57,285 | ||||||||||
Cash and securities segregated and on deposit for regulatory | ||||||||||||||||||||
purposes or deposited with clearing and depository | ||||||||||||||||||||
organizations (3) | $ | 3,616,602 | $ | – | $ | – | $ | – | $ | 3,616,602 | ||||||||||
Securities received as collateral | $ | 11,063 | $ | – | $ | – | $ | – | $ | 11,063 | ||||||||||
Liabilities: | ||||||||||||||||||||
Trading liabilities: | ||||||||||||||||||||
Corporate equity securities | $ | 1,804,392 | $ | 40,358 | $ | 38 | $ | – | $ | 1,844,788 | ||||||||||
Corporate debt securities | – | 1,346,078 | – | – | 1,346,078 | |||||||||||||||
U.S. government and federal agency securities | 1,324,326 | – | – | – | 1,324,326 | |||||||||||||||
Sovereign obligations | 1,360,269 | 471,088 | – | – | 1,831,357 | |||||||||||||||
Residential mortgage-backed securities | – | 34,691 | – | – | 34,691 | |||||||||||||||
Loans | – | 672,838 | 22,462 | – | 695,300 | |||||||||||||||
Derivatives | 43,829 | 2,480,463 | 8,398 | (2,352,611 | ) | 180,079 | ||||||||||||||
Physical commodities | – | 36,483 | – | – | 36,483 | |||||||||||||||
Total trading liabilities | $ | 4,532,816 | $ | 5,081,999 | $ | 30,898 | $ | (2,352,611 | ) | $ | 7,293,102 | |||||||||
Other secured financings | $ | – | $ | 31,000 | $ | 8,711 | $ | – | $ | 39,711 | ||||||||||
Obligation to return securities received as collateral | $ | 11,063 | $ | – | $ | – | $ | – | $ | 11,063 | ||||||||||
F-21
December 31, 2012 | ||||||||||||||||||||
Level 1 | Level 2 | Level 3 | Counterparty and Cash Collateral Netting | Total | ||||||||||||||||
Assets: | ||||||||||||||||||||
Trading assets, at fair value: | ||||||||||||||||||||
Investment in Jefferies common shares | $ | 1,077,172 | $ | – | $ | – | $ | – | $ | 1,077,172 | ||||||||||
Available for sale securities: | ||||||||||||||||||||
Corporate equity securities | $ | 934,823 | $ | – | $ | – | $ | – | $ | 934,823 | ||||||||||
Corporate debt securities | – | 16,648 | – | – | 16,648 | |||||||||||||||
U.S. government and federal agency securities | 1,657,022 | 6,490 | – | – | 1,663,512 | |||||||||||||||
Residential mortgage-backed securities | – | 601,456 | – | – | 601,456 | |||||||||||||||
Commercial mortgage-backed securities | – | 59,113 | – | – | 59,113 | |||||||||||||||
Other asset-backed securities | – | 80,556 | – | – | 80,556 | |||||||||||||||
Other | – | 884 | – | – | 884 | |||||||||||||||
Total available for sale securities | $ | 2,591,845 | $ | 765,147 | $ | – | $ | – | $ | 3,356,992 | ||||||||||
Cash and cash equivalents | $ | 145,960 | $ | – | $ | – | $ | – | $ | 145,960 | ||||||||||
|
|
(1) | During 2013, listed equity options with a fair value of $403.0 million within Trading assets and $423.0 million within Trading liabilities were transferred from Level 1 to Level 2 as adjustments to the exchange closing price are necessary to best reflect the fair value of the population at its exit price. |
(2) | Represents counterparty and cash collateral netting across the levels of the fair value hierarchy for positions with the same counterparty. |
(3) | Securities comprise U.S. government securities segregated for regulatory purposes with a fair value of $304.2 million. |
|
The following is a description of the valuation basis, including valuation techniques and inputs, used in measuring our financial assets and liabilities that are accounted for at fair value on a recurring basis:
Corporate Equity Securities
· | Exchange Traded Equity Securities: Exchange traded equity securities are measured based on quoted closing exchange prices, which are generally obtained from external pricing services, and are categorized within Level 1 of the fair value hierarchy, otherwise they are categorized within Level 2 or Level 3 of the fair value hierarchy. |
· | Non-exchange Traded Equity Securities : Non-exchange traded equity securities are measured primarily using broker quotations, pricing data from external pricing services and prices observed for recently executed market transactions and are categorized within Level 2 of the fair value hierarchy. Where such information is not available, non-exchange traded equity securities are categorized within Level 3 of the fair value hierarchy and measured using valuation techniques involving quoted prices of or market data for comparable companies, similar company ratios and multiples (e.g., price/EBITDA, price/book value), discounted cash flow analyses and transaction prices observed for subsequent financing or capital issuance by the company. When using pricing data of comparable companies, judgment must be applied to adjust the pricing data to account for differences between the measured security and the comparable security (e.g., issuer market capitalization, yield, dividend rate, geographical concentration). |
· | Equity warrants: Non-exchange traded equity warrants are generally categorized within Level 3 of the fair value hierarchy and are measured using the Black-Scholes model with key inputs impacting the valuation including the underlying security price, implied volatility, dividend yield, interest rate curve, strike price and maturity date. |
Corporate Debt Securities
· | Corporate Bonds: Corporate bonds are measured primarily using pricing data from external pricing services and broker quotations, where available, prices observed for recently executed market transactions of comparable size, and bond spreads or credit default swap spreads of the issuer adjusted for basis differences between the swap curve and the bond curve. Corporate bonds measured using these valuation methods are categorized within Level 2 of the fair value hierarchy. If broker quotes, pricing data or spread data is not available, alternative valuation techniques are used including cash flow models incorporating interest rate curves, single name or index credit default swap curves for comparable issuers and recovery rate assumptions. Corporate bonds measured using alternative valuation techniques are categorized within Level 3 of the fair value hierarchy and comprise a limited portion of our corporate bonds. |
· | High Yield Corporate and Convertible Bonds: A significant portion of our high yield corporate and convertible bonds are categorized within Level 2 of the fair value hierarchy and are measured primarily using broker quotations and pricing data from external pricing services, where available, and prices observed for recently executed market transactions of comparable size. Where pricing data is less observable, valuations are categorized within Level 3 and are based on pending transactions involving the issuer or comparable issuers, prices implied from an issuer's subsequent financings or recapitalizations, models incorporating financial ratios and projected cash flows of the issuer and market prices for comparable issuers. |
F-22
Collateralized Debt Obligations
Collateralized debt obligations are measured based on prices observed for recently executed market transactions or based on valuations received from third party brokers and are categorized within Level 2 or Level 3 of the fair value hierarchy depending on the observability and significance of the pricing inputs.
U.S. Government and Federal Agency Securities
· | U.S. Treasury Securities: U.S. Treasury securities are measured based on quoted market prices and categorized within Level 1 of the fair value hierarchy. |
· | U.S. Agency Issued Debt Securities: Callable and non-callable U.S. agency issued debt securities are measured primarily based on quoted market prices obtained from external pricing services. Non-callable U.S. agency securities are generally categorized within Level 1 and callable U.S. agency securities are categorized within Level 2 of the fair value hierarchy. |
Municipal Securities
Municipal securities are measured based on quoted prices obtained from external pricing services and are generally categorized within Level 2 of the fair value hierarchy.
Sovereign Obligations
Foreign sovereign government obligations are measured based on quoted market prices obtained from external pricing services, where available, or recently executed independent transactions of comparable size. To the extent external price quotations are not available or recent transactions have not been observed, valuation techniques incorporating interest rate yield curves and country spreads for bonds of similar issuers, seniority and maturity are used to determine fair value of sovereign bonds or obligations. Foreign sovereign government obligations are classified in Level 1, Level 2 or Level 3 of the fair value hierarchy, primarily based on the country of issuance.
Residential Mortgage-Backed Securities
· | Agency Residential Mortgage-Backed Securities: Agency residential mortgage-backed securities include mortgage pass-through securities (fixed and adjustable rate), collateralized mortgage obligations and interest-only and principal-only securities and are generally measured using market price quotations from external pricing services and categorized within Level 2 of the fair value hierarchy. |
· | Agency Residential Inverse Interest-Only Securities ("Agency Inverse IOs"): The fair value of agency inverse IOs is estimated using expected future cash flow techniques that incorporate prepayment models and other prepayment assumptions to amortize the underlying mortgage loan collateral. We use prices observed for recently executed transactions to develop market-clearing spread and yield curve assumptions. Valuation inputs with regard to the underlying collateral incorporate weighted average coupon, loan-to-value, credit scores, geographic location, maximum and average loan size, originator, servicer, and weighted average loan age. Agency inverse IOs are categorized within Level 2 or Level 3 of the fair value hierarchy. We also use vendor data in developing our assumptions, as appropriate. |
· | Non-Agency Residential Mortgage-Backed Securities: Fair values are determined primarily using discounted cash flow methodologies and securities are categorized within Level 2 or Level 3 of the fair value hierarchy based on the observability and significance of the pricing inputs used. Performance attributes of the underlying mortgage loans are evaluated to estimate pricing inputs, such as prepayment rates, default rates and the severity of credit losses. Attributes of the underlying mortgage loans that affect the pricing inputs include, but are not limited to, weighted average coupon; average and maximum loan size; loan-to-value; credit scores; documentation type; geographic location; weighted average loan age; originator; servicer; historical prepayment, default and loss severity experience of the mortgage loan pool; and delinquency rate. Yield curves used in the discounted cash flow models are based on observed market prices for comparable securities and published interest rate data to estimate market yields. |
Commercial Mortgage-Backed Securities
· | Agency Commercial Mortgage-Backed Securities: GNMA project loan bonds and FNMA Delegated Underwriting and Servicing ( " DUS " ) mortgage-backed securities are generally measured by using prices observed for recently executed market transactions to estimate market-clearing spread levels for purposes of estimating fair value. GNMA project loan bonds and FNMA DUS mortgage-backed securities are categorized within Level 2 of the fair value hierarchy. |
· | Non-Agency Commercial Mortgage-Backed Securities: Non-agency commercial mortgage-backed securities are measured using pricing data obtained from external pricing services and prices observed for recently executed market transactions and are categorized within Level 2 and Level 3 of the fair value hierarchy. |
F-23
Other Asset-Backed Securities
Other asset-backed securities include, but are not limited to, securities backed by auto loans, credit card receivables and student loans and are categorized within Level 2 and Level 3 of the fair value hierarchy. Valuations are determined using pricing data obtained from external pricing services and prices observed for recently executed market transactions.
Loans and Other Receivables
· | Corporate Loans: Corporate loans categorized within Level 2 of the fair value hierarchy are measured based on market price quotations where market price quotations from external pricing services are supported by market transaction data. Corporate loans categorized within Level 3 of the fair value hierarchy are measured based on market price quotations that are considered to be less transparent, market prices for debt securities of the same creditor, and estimates of future cash flow incorporating assumptions regarding creditor default and recovery rates and consideration of the issuer's capital structure. |
· | Participation Certificates in GNMA Project and Construction Loans: Valuations of participation certificates in GNMA project and construction loans are based on observed market prices of recently executed purchases of similar loans which are then used to derive a market implied spread, which in turn is used as the primary input in estimating the fair value of loans at the measurement date. The loan participation certificates are categorized within Level 2 of the fair value hierarchy given the observability and volume of recently executed transactions. |
· | Project Loans: Valuation of project loans are based on benchmarks of prices for recently executed transactions of related realized collateralized securities and are categorized within Level 2 of the fair value hierarchy. |
· | Escrow and Trade Claim Receivables: Escrow and trade claim receivables are categorized within Level 3 of the fair value hierarchy where fair value is estimated based on reference to market prices and implied yields of debt securities of the same or similar issuers. Escrow and trade claim receivables are categorized within Level 2 of the fair value hierarchy where fair value is based on recent trade activity in the same security. |
Derivatives
· | Listed Derivative Contracts: Listed derivative contracts that are actively traded are measured based on quoted exchange prices, which are generally obtained from external pricing services, and are categorized within Level 1 of the fair value hierarchy. Listed derivatives for which there is limited trading activity are measured based on incorporating the closing auction price of the underlying equity security, use similar valuation approaches as those applied to over-the-counter derivative contracts and are categorized within Level 2 of the fair value hierarchy. |
· | OTC Derivative Contracts: Over-the-counter ("OTC") derivative contracts are generally valued using models, whose inputs reflect assumptions that we believe market participants would use in valuing the derivative in a current period transaction. Inputs to valuation models are appropriately calibrated to market data. For many OTC derivative contracts, the valuation models do not involve material subjectivity as the methodologies do not entail significant judgment and the inputs to valuation models do not involve a high degree of subjectivity as the valuation model inputs are readily observable or can be derived from actively quoted markets. OTC derivative contracts are primarily categorized within Level 2 of the fair value hierarchy given the observability and significance of the inputs to the valuation models. Where significant inputs to the valuation are unobservable, derivative instruments are categorized within Level 3 of the fair value hierarchy. |
OTC options include OTC equity, foreign exchange and commodity options measured using various valuation models, such as the Black-Scholes, with key inputs impacting the valuation including the underlying security, foreign exchange spot rate or commodity price, implied volatility, dividend yield, interest rate curve, strike price and maturity date. Discounted cash flow models are utilized to measure certain OTC derivative contracts including the valuations of our interest rate swaps, which incorporate observable inputs related to interest rate curves, valuations of our foreign exchange forwards and swaps, which incorporate observable inputs related to foreign currency spot rates and forward curves and valuations of our commodity swaps, which incorporate observable inputs related to commodity spot prices and forward curves. Credit default swaps include both index and single-name credit default swaps. External prices are available as inputs in measuring index credit default swaps and single-name credit default swaps. For commodity and equity total return swaps, market prices are observable for the underlying asset and used as the basis for measuring the fair value of the derivative contracts. Total return swaps executed on other underlyings are measured based on valuations received from external pricing services.
F-24
Physical Commodities
Physical commodities include base and precious metals and are measured using observable inputs including spot prices and published indices. Physical commodities are categorized within Level 2 of the fair value hierarchy. To facilitate the trading in precious metals we undertake leasing of such precious metals. The fees earned or paid for such leases are recorded as revenues in the Consolidated Statements of Operations.
Investments at Fair Value and Investments in Managed Funds
Investments at fair value and Investments in managed funds include investments in hedge funds, fund of funds, private equity funds, convertible bond funds and commodity funds, which are measured at fair value based on the net asset value of the funds provided by the fund managers and are categorized within Level 2 or Level 3 of the fair value hierarchy. Investments at fair value also include direct equity investments in private companies, which are measured at fair value using valuation techniques involving quoted prices of or market data for comparable companies, similar company ratios and multiples (e.g., price/EBITDA, price/book value), discounted cash flow analyses and transaction prices observed for subsequent financing or capital issuance by the company. Direct equity investments in private companies are categorized within Level 2 or Level 3 of the fair value hierarchy. Additionally, investments at fair value include investments in insurance contracts relating to our defined benefit plan in Germany. Fair value for the insurance contracts is determined using a third party and is categorized within Level 3 of the fair value hierarchy. Fair value for the shares in non-U.S. exchanges and clearing houses is determined based on recent transactions or third party model valuations and is categorized within Level 2 or Level 3 of the fair value hierarchy. The following tables present information about our investments in entities that have the characteristics of an investment company (in thousands). Amounts were not significant in 2012.
December 31, 2013 | ||||||||||||
Fair Value (6) | Unfunded Commitments | Redemption Frequency (if currently eligible) | ||||||||||
Equity Long/Short Hedge Funds (1) | $ | 20,927 | $ | – | Monthly/Quarterly | |||||||
High Yield Hedge Funds (2) | 244 | – | – | |||||||||
Fund of Funds (3) | 494 | 94 | – | |||||||||
Equity Funds (4) | 66,495 | 40,816 | – | |||||||||
Convertible Bond Funds (5) | 3,473 | – | At Will | |||||||||
Total (7) | $ | 91,633 | $ | 40,910 | ||||||||
(1) | This category includes investments in hedge funds that invest, long and short, in equity securities in domestic and international markets in both the public and private sectors. Investments representing approximately 98% of the fair value of investments in this category are redeemable with 30 to 65 days prior written notice. The remaining investments in this category cannot be redeemed as they are in liquidation and distributions will be received through the liquidation of the underlying assets of the funds. We are unable to estimate when the underlying assets will be liquidated. |
(2) | Includes investments in funds that invest in domestic and international public high yield debt, private high yield investments, senior bank loans, public leveraged equities, distressed debt, and private equity investments. There are no redemption provisions. The underlying assets of the funds are being liquidated and we are unable to estimate when the underlying assets will be fully liquidated. |
(3) | Includes investments in fund of funds that invest in various private equity funds. Approximately 98% of the fair value of investments in this category is managed by us and has no redemption provisions, instead distributions are received through the liquidation of the underlying assets of the fund of funds, which are estimated to be liquidated in one to two years. For the remaining investments, we have requested redemption; however, we are unable to estimate when these funds will be received. |
(4) | Investments representing approximately 99% of the fair value of investments in this category include investments in equity funds that invest in the equity of various U.S. and foreign private companies in the energy, technology, internet service and telecommunication service industries. These investments cannot be redeemed, instead distributions are received through the liquidation of the underlying assets of the funds which are expected to liquidate in one to eight years. The remaining investments are in liquidation and we are unable to estimate when the underlying assets will be fully liquidated. This category includes investments in equity funds managed by us with a fair value of $54.4 million and unfunded commitments of $39.2 million. |
(5) | Investment in the Jefferies Umbrella Fund, an open-ended investment company managed by us that invests primarily in convertible bonds. The investment is redeemable with 5 days prior written notice. |
(6) | Fair value has been estimated using the net asset value derived from each of the funds' capital statements. |
(7) | Investments at fair value in the Consolidated Statements of Financial Condition include $66.9 million of direct investments which do not have the characteristics of investment companies and therefore not included within this table. We have unfunded commitments to such investments of $3.3 million in aggregate at December 31, 2013. |
F-25
Other Secured Financings
Other secured financings includes the notes issued by consolidated VIEs, which are classified as Level 2 within the fair value hierarchy. Fair value is based on recent transaction prices. In addition, at December 31, 2013, Other secured financings includes $8.7 million related to transfers of loans accounted for as secured financings rather than as sales. Other secured financings also includes mortgage-backed securities issued by a VIE for which we are deemed the primary beneficiary, categorized within Level 3 of the fair value hierarchy and measured using a discounted cash flow model with discount yield being a significant input.
Pricing Information
Our trading assets and trading liabilities are measured using different valuation bases as follows:
December 31, 2013 | ||||||||
Trading Assets | Trading Liabilities | |||||||
Exchange closing prices | 12 | % | 25 | % | ||||
Recently observed transaction prices | 5 | % | 4 | % | ||||
External pricing services | 68 | % | 66 | % | ||||
Broker quotes | 3 | % | 3 | % | ||||
Valuation techniques | 12 | % | 2 | % | ||||
| 100 | % | 100 | % | |||||
The following is a summary of changes in fair value of our financial assets and liabilities that have been categorized within Level 3 of the fair value hierarchy for the period from the Jefferies acquisition through December 31, 2013 (in thousands):
Period from the Jefferies Acquisition through December 31, 2013 (3) | ||||||||||||||||||||||||||||||||
Beginning Balance | Total gains (losses) (realized and unrealized) (1) | Purchases | Sales | Settlements | Net transfers into (out of) Level 3 | Ending Balance | Changes in unrealized gains (losses) relating to instruments still held at December 31, 2013 (1) | |||||||||||||||||||||||||
Assets: | ||||||||||||||||||||||||||||||||
Trading assets: | ||||||||||||||||||||||||||||||||
Corporate equity securities | $ | 13,234 | $ | 1,551 | $ | 3,583 | $ | (7,141 | ) | $ | – | $ | (1,343 | ) | $ | 9,884 | $ | (419 | ) | |||||||||||||
Corporate debt securities | 31,820 | (2,454 | ) | 31,014 | (34,125 | ) | – | (589 | ) | 25,666 | (2,749 | ) | ||||||||||||||||||||
Collateralized debt obligations | 24,736 | (2,309 | ) | 45,437 | (32,874 | ) | – | 2,226 | 37,216 | (8,384 | ) | |||||||||||||||||||||
Residential mortgage-backed | ||||||||||||||||||||||||||||||||
securities | 169,426 | (4,897 | ) | 89,792 | (150,807 | ) | (11,007 | ) | 12,985 | 105,492 | (6,932 | ) | ||||||||||||||||||||
Commercial mortgage-backed | ||||||||||||||||||||||||||||||||
securities | 17,794 | (4,469 | ) | 20,130 | (13,538 | ) | (100 | ) | (2,249 | ) | 17,568 | (3,794 | ) | |||||||||||||||||||
Other asset-backed securities | 1,292 | (4,535 | ) | 105,291 | (104,711 | ) | – | 15,274 | 12,611 | (3,497 | ) | |||||||||||||||||||||
Loans and other receivables | 170,986 | 15,008 | 287,757 | (115,231 | ) | (211,805 | ) | (825 | ) | 145,890 | 13,402 | |||||||||||||||||||||
Investments, at fair value | 75,067 | 1,678 | 28,594 | (102 | ) | (5,012 | ) | 1,017 | 101,242 | 1,705 | ||||||||||||||||||||||
Investments in managed funds | 59,976 | 9,863 | 15,651 | (17 | ) | (28,188 | ) | – | 57,285 | 9,863 | ||||||||||||||||||||||
Liabilities: | ||||||||||||||||||||||||||||||||
Trading liabilities: | ||||||||||||||||||||||||||||||||
Corporate equity securities | $ | 38 | $ | – | $ | – | $ | – | $ | – | $ | – | $ | 38 | $ | – | ||||||||||||||||
Residential mortgage-backed | ||||||||||||||||||||||||||||||||
securities | 1,542 | (1,542 | ) | – | – | – | – | – | – | |||||||||||||||||||||||
Net derivatives (2) | 11,185 | 4,408 | – | (300 | ) | (8,515 | ) | 127 | 6,905 | 1,609 | ||||||||||||||||||||||
Loans | 7,398 | 2,959 | (16,027 | ) | 28,065 | 67 | – | 22,462 | (2,970 | ) | ||||||||||||||||||||||
| (1) | Realized and unrealized gains (losses) are reported in Principal transactions in the Consolidated Statements of Operations. |
| (2) | Net derivatives represent Trading assets - Derivatives and Trading liabilities - Derivatives. |
| (3) | In addition to the above changes in the fair value of our financial assets and liabilities that have been categorized within Level 3 of the fair value hierarchy, during the period from the Jefferies acquisition through December 31, 2013, secured financings of $8.7 million were issued. |
F-26
Analysis of Level 3 Assets and Liabilities for the Period from the Jefferies Acquisition through December 31, 2013
During the period from the Jefferies acquisition through December 31, 2013, transfers of assets of $82.4 million from Level 2 to Level 3 of the fair value hierarchy are attributed to:
· | Non-agency residential mortgage-backed securities of $58.8 million and other asset-backed securities of $16.4 million for which no recent trade activity was observed for purposes of determining observable inputs; |
· | Loans and other receivables of $0.8 million due to a lower number of contributors comprising vendor quotes to support classification within Level 2; |
· | Corporate equity securities of $2.3 million, corporate debt securities of $0.2 million and investments at fair value of $1.0 million due to lack of observable market transactions; |
· | Collateralized debt obligations of $2.8 million which have little to no transparency in trade activity. |
During the period from the Jefferies acquisition through December 31, 2013, transfers of assets of $55.9 million from Level 3 to Level 2 are attributed to:
· | Non-agency residential mortgage-backed securities of $45.9 million, commercial mortgage-backed securities of $2.2 million and other asset-backed securities of $1.1 million for which market trades were observed in the period for either identical or similar securities; |
· | Collateralized debt obligations of $0.6 million and loans and other receivables of $1.7 million due to a greater number of contributors for certain vendor quotes supporting classification into Level 2; |
· | Corporate equity securities of $3.6 million and corporate debt securities of $0.8 million due to an increase in observable market transactions. |
During the period from the Jefferies acquisition through December 31, 2013, there were no transfers of liabilities from Level 2 to Level 3 and there were $0.1 million transfers of net derivative liabilities from Level 3 to Level 2 due to an increase in observable inputs used in the valuing of derivative contracts.
Net gains on Level 3 assets were $9.4 million and net losses on Level 3 liabilities were $5.8 million for the period from the Jefferies acquisition through December 31, 2013. Net gains on Level 3 assets were primarily due to increased valuations of certain corporate equity securities, loans and other receivables, investments at fair value and investments in managed funds, partially offset by a decrease in valuation of certain corporate debt securities, collateralized debt obligations, residential and commercial mortgage-backed securities and other asset-backed securities. Net losses on Level 3 liabilities were primarily due to increased valuations of certain derivative instruments and loan positions.
Quantitative Information about Significant Unobservable Inputs used in Level 3 Fair Value Measurements
Prior to the acquisition of Jefferies, we did not use any Level 3 inputs to measure the fair value of financial instruments and trading liabilities. The tables below present information on the valuation techniques, significant unobservable inputs and their ranges for our financial assets and liabilities, subject to threshold levels related to the market value of the positions held, measured at fair value on a recurring basis with a significant Level 3 balance. The range of unobservable inputs could differ significantly across different firms given the range of products across different firms in the financial services sector. The inputs are not representative of the inputs that could have been used in the valuation of any one financial instrument; i.e., the input used for valuing one financial instrument within a particular class of financial instruments may not be appropriate for valuing other financial instruments within that given class. Additionally, the ranges of inputs presented below should not be construed to represent uncertainty regarding the fair values of our financial instruments; rather the range of inputs is reflective of the differences in the underlying characteristics of the financial instruments in each category.
For certain categories, we have provided a weighted average of the inputs allocated based on the fair values of the financial instruments comprising the category. We do not believe that the range or weighted average of the inputs is indicative of the reasonableness of uncertainty of our Level 3 fair values. The range and weighted average are driven by the individual financial instruments within each category and their relative distribution in the population. The disclosed inputs when compared with the inputs as disclosed in other quarters should not be expected to necessarily be indicative of changes in our estimates of unobservable inputs for a particular financial instrument as the population of financial instruments comprising the category will vary from period to period based on purchases and sales of financial instruments during the period as well as transfers into and out of Level 3 each period.
F-27
Financial Instruments Owned | Fair Value (in thousands) | Valuation Technique | Significant Unobservable Input(s) | Input/Range | Weighted Average | |||||||||
Corporate equity securities | $ | 8,034 | ||||||||||||
Non-exchange traded securities | Market approach | EBITDA (a) multiple | 4.0 to 5.5 | 4.53 | ||||||||||
Warrants | Option model | Volatility | 36 | % | – | |||||||||
Corporate debt securities | $ | 17,699 | ||||||||||||
Scenario analysis | Estimated recovery percentage | 24 | % | – | ||||||||||
Comparable pricing | Comparable bond or loan price | $ | 69.10 to $70.50 | $ | 69.91 | |||||||||
Market approach | Yield | 13 | % | – | ||||||||||
Collateralized debt obligations | $ | 34,316 | ||||||||||||
Discounted cash flows | Constant prepayment rate | 0% to 20% | 13 | % | ||||||||||
Constant default rate | 2% to 3% | 2 | % | |||||||||||
Loss severity | 30% to 85% | 38 | % | |||||||||||
Yield | 3% to 91% | 28 | % | |||||||||||
Residential mortgage-backed | $ | 105,492 | ||||||||||||
Discounted cash flows | Constant prepayment rate | 2% to 50% | 11 | % | ||||||||||
Constant default rate | 1% to 100% | 17 | % | |||||||||||
Loss severity | 30% to 90% | 48 | % | |||||||||||
Yield | 0% to 20% | 7 | % | |||||||||||
Commercial mortgage-backed | $ | 17,568 | ||||||||||||
Discounted cash flows | Yield | 12% to 20% | 14 | % | ||||||||||
Cumulative loss rate | 5% to 28.2% | 11 | % | |||||||||||
Other asset-backed securities | $ | 12,611 | ||||||||||||
Discounted cash flows | Constant prepayment rate | 4% to 30% | 17 | % | ||||||||||
Constant default rate | 2% to 11% | 7 | % | |||||||||||
Loss severity | 40% to 92% | 64 | % | |||||||||||
Yield | 3% to 29% | 18 | % | |||||||||||
Loans and other receivables | $ | 101,931 | ||||||||||||
Comparable pricing | Comparable bond or loan price | $ | 91 to $101 | $ | 98.90 | |||||||||
Market approach | Yield | 8.75% to 13.5% | 10 | % | ||||||||||
EBITDA (a) multiple | 6.9 | – | ||||||||||||
Scenario analysis | Estimated recovery percentage | 16.9% to 92% | 74 | % | ||||||||||
Derivatives | $ | 1,493 | ||||||||||||
Loan commitments | Comparable pricing | Comparable bond or loan price | $ | 100.875 | – | |||||||||
Investments at fair value | $ | 30,203 | ||||||||||||
Private equity securities | Comparable pricing | Comparable share price | $ | 414 | – | |||||||||
Market approach | Discount rate | 15% to 30% | 23 | % | ||||||||||
Trading Liabilities | Fair Value (in thousands) | Valuation Technique | Significant Unobservable Input(s) | Input/Range | Weighted Average | |||||||||
Derivatives | $ | 8,398 | ||||||||||||
Equity options | Option model | Volatility | 36.25% to 41% | 39 | % | |||||||||
Loans | $ | 8,106 | Comparable pricing | Comparable bond or loan price | $ | 101.88 | – | |||||||
(a) | Earnings before interest, taxes, depreciation and amortization ("EBITDA"). |
The fair values of certain Level 3 assets and liabilities that were determined based on third-party pricing information, unadjusted past transaction prices, reported net asset value or a percentage of the reported enterprise fair value are excluded from the above table. The exclusions consisted of $127.7 million, primarily comprised of investments in private equity securities, investments in reinsurance contracts, certain collateralized debt obligations and corporate loans.
F-28
Sensitivity of Fair Values to Changes in Significant Unobservable Inputs
For recurring fair value measurements categorized within Level 3 of the fair value hierarchy, the sensitivity of the fair value measurement to changes in significant unobservable inputs and interrelationships between those unobservable inputs (if any) are described below:
· | Private equity securities, corporate debt securities, commercial mortgage-backed securities, loans and other receivables and loan commitments using comparable pricing valuation techniques. A significant increase (decrease) in the comparable share, bond or loan price in isolation would result in a significant higher (lower) fair value measurement. |
· | Non-exchange traded securities, corporate debt securities, private equity securities and loans and other receivables using a market approach valuation technique. A significant increase (decrease) in the EBITDA or other multiples in isolation would result in a significantly higher (lower) fair value measurement. A significant increase (decrease) in the yield of a corporate debt security, private equity securities, loan and other receivable would result in a significantly lower (higher) fair value measurement. |
· | Corporate debt securities, and loans and other receivables using scenario analysis. A significant increase (decrease) in the possible recovery rates of the cash flow outcomes underlying the investment would result in a significantly higher (lower) fair value measurement for the financial instrument. |
· | Collateralized debt obligations, residential and commercial mortgage-backed securities and other asset-backed securities using a discounted cash flow valuation technique. A significant increase (decrease) in isolation in the constant default rate, loss severities or cumulative loss rate and discount rate would result in a significantly lower (higher) fair value measurement. The impact of changes in the constant prepayment rate would have differing impacts depending on the capital structure of the security. A significant increase (decrease) in the loan or bond yield would result in a significant lower (higher) fair value measurement. |
· | Derivative equity options and equity warrants using an option model. A significant increase (decrease) in volatility would result in a significant higher (lower) fair value measurement. |
Fair Value Option Election
We have elected the fair value option for all loans and loan commitments made by Jefferies capital markets businesses. These loans and loan commitments include loans entered into by Jefferies investment banking division in connection with client bridge financing and loan syndications, loans purchased by Jefferies leveraged credit trading desk as part of its bank loan trading activities and mortgage loan commitments and fundings in connection with mortgage-backed securitization activities. Loans and loan commitments originated or purchased by Jefferies leveraged credit and mortgage-backed businesses are managed on a fair value basis. Loans are included in Trading assets and loan commitments are included in Trading assets - Derivatives and Trading liabilities – Derivatives. The fair value option election is not applied to loans made to affiliate entities as such loans are entered into as part of ongoing, strategic business ventures. Loans to affiliate entities are included within Loans to and investments in associated companies and are accounted for on an amortized cost basis. We have also elected the fair value option for certain financial instruments held by Jefferies subsidiaries as the investments are risk managed on a fair value basis. The fair value option has also been elected for certain secured financings that arise in connection with Jefferies securitization activities and other structured financings.
The following is a summary of gains (losses) due to changes in instrument specific credit risk on loans and other receivables and loan commitments measured at fair value under the fair value option for the period from the Jefferies acquisition through December 31, 2013 (in thousands):
Financial Instruments Owned: | ||||
Loans and other receivables | $ | 15,327 | ||
Financial Instruments Sold: | ||||
Loans | $ | (32 | ) | |
Loan commitments | $ | (1,007 | ) | |
The following is a summary of the amount by which contractual principal exceeds fair value for loans and other receivables measured at fair value under the fair value option (in thousands):
Loans and other receivables (2) | $ | 264,896 | ||
Loans greater than 90 days past due (1) (2) | $ | – |
(1) | The aggregate fair value of loans that were 90 or more days past due was $0. |
(2) | Interest income is recognized separately from other changes in fair value and is included within Interest income in the Consolidated Statements of Operations. |
There were no loan receivables on nonaccrual status at December 31, 2013.
F-29
We have elected the fair value option for Jefferies investment in Knight Capital Group, Inc., acquired by Jefferies during 2012. We also elected the fair value option for our investment in Mueller Industries, Inc., which was sold in September 2012, and, prior to the completion of the Jefferies acquisition, we elected the fair value option for our investment in Jefferies, which is included in Trading assets. We elected the fair value option for these investments commencing on the date the investments became subject to the equity method of accounting. We believe accounting for these investments at fair value better reflected the economics of these investments, and quoted market prices for these investments provided an objectively determined fair value at each balance sheet date. Our investment in HomeFed is the only other investment accounted for under the equity method of accounting that is also a publicly traded company for which we did not elect the fair value option. HomeFed's common stock is not listed on any stock exchange, and price information for the common stock is not regularly quoted on any automated quotation system. It is traded in the over-the-counter market with high and low bid prices published by the National Association of Securities Dealers OTC Bulletin Board Service; however, trading volume is minimal. For these reasons we did not elect the fair value option for HomeFed.
On July 1, 2013, Knight Capital completed its previously announced merger with GETCO Holding Company, LLC; as a result KCG Holdings, Inc. became the new public parent of both entities. In connection with the consummation of the merger, Jefferies received cash consideration of $3.75 per share, or approximately $192.0 million, with respect to approximately 63% of its holdings in Knight Capital and stock consideration of one third of a share of KCG Holdings common stock for each share of Knight Capital common stock for the remainder of its holdings. Changes in the fair value of Knight Capital, inclusive of changes in the fair value of KCG Holdings after the merger were $19.5 million.
The increase in the fair value of our investment in Jefferies prior to the acquisition was $182.7 million during 2013. Increases (decreases) in the fair value of our investments in Jefferies and Mueller are reflected as Principal transactions in the Consolidated Statements of Operations as follows (in thousands):
2012 | 2011 | |||||||
Mueller | $ | 30,018 | $ | (6,093 | ) | |||
Jefferies | 301,341 | (668,282 | ) | |||||
| ||||||||
Total | $ | 331,359 | $ | (674,375 | ) | |||
Note 7. Derivative Financial Instruments
Off-Balance Sheet Risk
Jefferies has contractual commitments arising in the ordinary course of business for securities loaned or purchased under agreements to resell, repurchase agreements, future purchases and sales of foreign currencies, securities transactions on a when-issued basis and underwriting. Each of these financial instruments and activities contains varying degrees of off-balance sheet risk whereby the fair values of the securities underlying the financial instruments may be in excess of, or less than, the contract amount. The settlement of these transactions is not expected to have a significant effect upon our consolidated financial statements.
Derivative Financial Instruments
Derivative activities are recorded at fair value in the Consolidated Statements of Financial Condition in Trading assets – Derivatives and Trading liabilities – Derivatives, net of cash paid or received under credit support agreements and on a net counterparty basis when a legal right to offset exists under a master netting agreement. Net realized and unrealized gains and losses are recognized in the Consolidated Statements of Operations on a trade date basis and as a component of cash flows from operating activities in the Consolidated Statements of Cash Flows. Acting in a trading capacity, Jefferies may enter into derivative transactions to satisfy the needs of its clients and to manage their own exposure to market and credit risks resulting from trading activities. (See Notes 6 and 27 for additional disclosures about derivative instruments.)
Derivatives are subject to various risks similar to other financial instruments, including market, credit and operational risk. The risks of derivatives should not be viewed in isolation, but rather should be considered on an aggregate basis along with our other trading-related activities. Jefferies manages the risks associated with derivatives on an aggregate basis along with the risks associated with proprietary trading as part of its firm wide risk management policies. In connection with Jefferies derivative activities, they may enter into master netting agreements and collateral arrangements with counterparties. These agreements provide Jefferies with the ability to offset a counterparty's rights and obligations, request additional collateral when necessary or liquidate the collateral in the event of counterparty default.
F-30
The following table presents the fair value and related number of derivative contracts categorized by type of derivative contract as reflected in the Consolidated Statement of Financial Condition at December 31, 2013. Amounts were not significant at December 31, 2012. The fair value of assets/liabilities related to derivative contracts represents our receivable/payable for derivative financial instruments, gross of counterparty netting and cash collateral received and pledged (in thousands, except contract amounts):
December 31, 2013 | ||||||||||||||||
Assets | Liabilities | |||||||||||||||
Fair Value | Number of Contracts | Fair Value | Number of Contracts | |||||||||||||
Interest rate contracts | $ | 1,165,977 | 63,967 | $ | 1,131,166 | 77,338 | ||||||||||
Foreign exchange contracts | 653,772 | 118,707 | 693,658 | 112,417 | ||||||||||||
Equity contracts | 501,784 | 1,742,343 | 474,985 | 1,800,603 | ||||||||||||
Commodity contracts | 141,280 | 797,529 | 173,119 | 788,717 | ||||||||||||
Credit contracts: centrally cleared swaps | 49,531 | 49 | 51,632 | 46 | ||||||||||||
Credit contracts: other credit derivatives | 2,339 | 16 | 8,130 | 19 | ||||||||||||
Total | 2,514,683 | 2,532,690 | ||||||||||||||
Counterparty/cash-collateral netting | (2,253,589 | ) | (2,352,611 | ) | ||||||||||||
Total per Consolidated Statement of Financial Condition | $ | 261,094 | $ | 180,079 | ||||||||||||
The following table presents unrealized and realized gains (losses) on derivative contracts for the period from the Jefferies acquisition through December 31, 2013; amounts for other periods were not significant (in thousands):
Interest rate contracts | $ | 132,661 | ||
Foreign exchange contracts | 4,937 | |||
Equity contracts | 3,783 | |||
Commodity contracts | 45,546 | |||
Credit contracts | (12,850 | ) | ||
Total | $ | 174,077 |
OTC Derivatives. The following tables set forth by remaining contract maturity the fair value of OTC derivative assets and liabilities as reflected in the Consolidated Statement of Financial Condition at December 31, 2013 (in thousands):
OTC Derivative Assets (1) (2) (4) | ||||||||||||||||||||
0-12 Months | 1-5 Years | Greater Than 5 Years | Cross- Maturity Netting (3) | Total | ||||||||||||||||
Commodity swaps, options and forwards | $ | 43,519 | $ | 699 | $ | – | $ | (198 | ) | $ | 44,020 | |||||||||
Credit default swaps | – | – | 413 | – | 413 | |||||||||||||||
Equity swaps and options | 4,394 | – | – | – | 4,394 | |||||||||||||||
Total return swaps | 948 | – | – | – | 948 | |||||||||||||||
Foreign currency forwards, swaps and options | 89,072 | 37,798 | 52 | (11,192 | ) | 115,730 | ||||||||||||||
Interest rate swaps, options and forwards | 96,983 | 89,255 | 128,983 | (51,990 | ) | 263,231 | ||||||||||||||
Total | $ | 234,916 | $ | 127,752 | $ | 129,448 | $ | (63,380 | ) | 428,736 | ||||||||||
Cross product counterparty netting | (2,086 | ) | ||||||||||||||||||
Total OTC derivative assets included in | ||||||||||||||||||||
Trading assets | $ | 426,650 | ||||||||||||||||||
(1) | At December 31, 2013, we held exchange traded derivative assets and other credit agreements with a fair value of $43.1 million, which are not included in this table. |
(2) | OTC derivative assets in the table above are gross of collateral received. OTC derivative assets are recorded net of collateral received in the Consolidated Statements of Financial Condition. At December 31, 2013 cash collateral received was $208.6 million. |
(3) | Amounts represent the netting of receivable balances with payable balances for the same counterparty within product category across maturity categories. |
(4) | Derivative fair values include counterparty netting within product category. |
F-31
OTC Derivative Liabilities (1) (2) (4) | ||||||||||||||||||||
0-12 Months | 1-5 Years | Greater Than 5 Years | Cross-Maturity Netting (3) | Total | ||||||||||||||||
Commodity swaps, options and forwards | $ | 69,380 | $ | 203 | $ | – | $ | (198 | ) | $ | 69,385 | |||||||||
Credit default swaps | 174 | 3,539 | 1,263 | – | 4,976 | |||||||||||||||
Equity swaps and options | – | – | 3,332 | – | 3,332 | |||||||||||||||
Total return swaps | 5,002 | – | – | – | 5,002 | |||||||||||||||
Foreign currency forwards, swaps and options | 117,044 | 47,258 | – | (8,608 | ) | 155,694 | ||||||||||||||
Interest rate swaps, options and forwards | 24,142 | 124,352 | 136,683 | (51,990 | ) | 233,187 | ||||||||||||||
Total | $ | 215,742 | $ | 175,352 | $ | 141,278 | $ | (60,796 | ) | 471,576 | ||||||||||
Cross product counterparty netting | (2,086 | ) | ||||||||||||||||||
Total OTC derivative liabilities included in | ||||||||||||||||||||
Trading liabilities | $ | 469,490 | ||||||||||||||||||
(1) | At December 31, 2013, we held exchange traded derivative liabilities and other credit agreements with a fair value of $18.2 million, which are not included in this table. |
(2) | OTC derivative liabilities in the table above are gross of collateral pledged. OTC derivative liabilities are recorded net of collateral pledged in the Consolidated Statements of Financial Condition. At December 31, 2013, cash collateral pledged was $307.7 million. |
(3) | Amounts represent the netting of receivable balances with payable balances for the same counterparty within product category across maturity categories. |
(4) | Derivative fair values include counterparty netting within product category. |
At December 31, 2013, the counterparty credit quality with respect to the fair value of our OTC derivative assets was as follows (in thousands):
Counterparty credit quality (1): | ||||
A- or higher | $ | 251,967 | ||
BBB- to BBB+ | 18,541 | |||
BB+ or lower | 95,072 | |||
Unrated | 61,070 | |||
Total | $ | 426,650 | ||
(1) | We utilize internal credit ratings determined by Jefferies Risk Management. Credit ratings determined by Risk Management use methodologies that produce ratings generally consistent with those produced by external rating agencies. |
Contingent Features
Certain of Jefferies derivative instruments contain provisions that require their debt to maintain an investment grade credit rating from each of the major credit rating agencies. If Jefferies debt were to fall below investment grade, it would be in violation of these provisions and the counterparties to the derivative instruments could request immediate payment or demand immediate and ongoing full overnight collateralization on Jefferies derivative instruments in liability positions. The aggregate fair value of all derivative instruments with such credit-risk-related contingent features that are in a liability position at December 31, 2013 is $170.2 million, for which Jefferies has posted collateral of $127.7 million in the normal course of business. If the credit-risk-related contingent features underlying these agreements were triggered, Jefferies would have been required to post an additional $49.4 million of collateral to its counterparties.
Note 8. Collateralized Transactions
Jefferies enters into secured borrowing and lending arrangements to obtain collateral necessary to effect settlement, finance trading asset inventory positions, meet customer needs or re-lend as part of dealer operations. Jefferies manages exposure to credit risk associated with these transactions by entering into master netting agreements. Jefferies also monitors the fair value of the securities loaned and borrowed on a daily basis as compared with the related payable or receivable, and request additional collateral or return excess collateral, as appropriate. Jefferies pledges financial instruments as collateral under repurchase agreements, securities lending agreements and other secured arrangements, including clearing arrangements. Jefferies agreements with counterparties generally contain contractual provisions allowing the counterparty the right to sell or repledge the collateral. Pledged securities owned that can be sold or repledged by the counterparty are included within Financial instruments owned and noted parenthetically as Securities pledged on our Consolidated Statements of Financial Condition.
F-32
Jefferies receives securities as collateral under resale agreements, securities borrowing transactions and customer margin loans. Jefferies also receives securities as collateral in connection with securities-for-securities transactions in which it is the lender of securities. In many instances, Jefferies is permitted by contract or custom to rehypothecate the securities received as collateral. These securities may be used to secure repurchase agreements, enter into securities lending transactions, satisfy margin requirements on derivative transactions or cover short positions. At December 31, 2013, the approximate fair value of securities received as collateral by Jefferies that may be sold or repledged was $21.9 billion. A substantial portion of these securities have been sold or repledged.
In instances where Jefferies receives securities as collateral in connection with securities-for-securities transactions in which Jefferies is the lender of securities and is permitted to sell or repledge the securities received as collateral, it reports the fair value of the collateral received and the related obligation to return the collateral in the Consolidated Statements of Financial Condition. At December 31, 2013, $11.1 million was reported as Securities received as collateral and as Obligation to return securities received as collateral.
Note 9. Securitization Activities
Jefferies engages in securitization activities related to corporate loans, commercial mortgage loans and mortgage-backed and other asset-backed securities. In securitization transactions, Jefferies transfers assets to special purpose entities ("SPEs") and acts as the placement or structuring agent for the beneficial interests sold to investors by the SPE. A significant portion of the securitization transactions are securitization of assets issued or guaranteed by U.S. government agencies. These SPEs generally meet the criteria of variable interest entities; however the SPEs are generally not consolidated as Jefferies is not considered the primary beneficiary for these SPEs. See Note 11 for further information on variable interest entities.
Jefferies accounts for securitization transactions as sales provided it has relinquished control over the transferred assets. Transferred assets are carried at fair value with unrealized gains and losses reflected in the Consolidated Statements of Operations prior to the identification and isolation for securitization. Revenues subsequent to such identification and isolation, including revenues recognized from the sales of the beneficial interests to investors, are reflected as net underwriting revenues. If Jefferies has not relinquished control over the transferred assets, the assets continue to be recognized in Trading assets and a corresponding secured borrowing is recognized in Other secured financings.
Jefferies generally receives cash proceeds in connection with the transfer of assets to an SPE. Jefferies may, however, have continuing involvement with the transferred assets, which is limited to retaining one or more tranches of the securitization (primarily senior and subordinated debt securities), which are included within Trading assets. We apply fair value accounting to the securities.
The following table presents activity related to our securitizations that were accounted for as sales in which we had continuing involvement during the period from the Jefferies acquisition through December 31, 2013; there was no activity during 2012 (in millions):
Transferred assets | $ | 4,592.5 | ||
Proceeds on new securitizations | 4,609.0 | |||
Net revenues | 10.7 | |||
Cash flows received on retained interests | $ | 35.6 |
Assets received as proceeds in the form of mortgage-backed securities or collateralized loan obligations issued by the SPEs have been initially categorized as Level 2 within the fair value hierarchy. For further information on fair value measurements and the fair value hierarchy, see Notes 2 and 6. Jefferies has no explicit or implicit arrangements to provide additional financial support to these SPEs and has no liabilities related to these SPEs at December 31, 2013. Although not obligated, in connection with secondary market-making activities Jefferies may make a market in the securities issued by these SPEs. In these market-making transactions, Jefferies buys these securities from and sells these securities to investors. Securities purchased through these market-making activities are not considered to be continuing involvement in these SPEs, although the securities are included in Trading assets. To the extent the securities purchased through these market-making activities meet specific thresholds and Jefferies is not deemed to be the primary beneficiary of the variable interest entity, these securities are included in agency and non-agency mortgage- and asset-backed securitizations in the nonconsolidated variable interest entities table presented in Note 11.
F-33
The following table summarizes our retained interests in SPEs where Jefferies transferred assets and has continuing involvement and received sale accounting treatment (in millions):
December 31, 2013 | ||||||||
Securitization Type | Total Assets | Retained Interests | ||||||
U.S. government agency residential mortgage-backed securities | $ | 11,518.4 | $ | 281.3 | ||||
U.S. government agency commercial mortgage-backed securities | 5,385.6 | 96.8 | ||||||
Collateralized loan obligations | 728.5 | 9.0 | ||||||
Jefferies does not have any derivative contracts executed in connection with these securitization activities. Total assets represent the unpaid principal amount of assets in the vehicles in which Jefferies has continuing involvement and are presented solely to provide information regarding the size of the transaction and the size of the underlying assets supporting its retained interests, and are not considered representative of the risk of potential loss. Assets retained in connection with a transaction represent the fair value of the securities of one or more tranches issued by an SPE, including senior and subordinated tranches. Jefferies risk of loss is limited to this fair value amount which is included within total Trading assets in our Consolidated Statements of Financial Condition.
Note 10. Available for Sale Securities
The amortized cost, gross unrealized gains and losses and estimated fair value of investments classified as available for sale at December 31, 2013 and 2012 are as follows (in thousands):
Gross | Gross | Estimated | ||||||||||||||
Amortized | Unrealized | Unrealized | Fair | |||||||||||||
Cost | Gains | Losses | Value | |||||||||||||
2013 | ||||||||||||||||
Bonds and notes: | ||||||||||||||||
U.S. Government securities | $ | 1,781,052 | $ | 226 | $ | 12 | $ | 1,781,266 | ||||||||
Residential mortgage-backed securities | 570,642 | 9,946 | 1,426 | 579,162 | ||||||||||||
Commercial mortgage-backed securities | 18,271 | 13 | 299 | 17,985 | ||||||||||||
Other asset-backed securities | 183,593 | 627 | 184 | 184,036 | ||||||||||||
All other corporates | 50,933 | 267 | 37 | 51,163 | ||||||||||||
Total fixed maturities | 2,604,491 | 11,079 | 1,958 | 2,613,612 | ||||||||||||
Equity securities: | ||||||||||||||||
Common stocks: | ||||||||||||||||
First Quantum Minerals Ltd. | 154,281 | – | 5,616 | 148,665 | ||||||||||||
Banks, trusts and insurance companies | 22,980 | 27,562 | – | 50,542 | ||||||||||||
Industrial, miscellaneous and all other | 21,012 | 32,312 | – | 53,324 | ||||||||||||
Total equity securities | 198,273 | 59,874 | 5,616 | 252,531 | ||||||||||||
| $ | 2,802,764 | $ | 70,953 | $ | 7,574 | $ | 2,866,143 | |||||||||
2012 | ||||||||||||||||
Bonds and notes: | ||||||||||||||||
U.S. Government and federal agency securities | $ | 1,663,225 | $ | 327 | $ | 40 | $ | 1,663,512 | ||||||||
Residential mortgage-backed securities | 585,772 | 16,506 | 822 | 601,456 | ||||||||||||
Commercial mortgage-backed securities | 58,683 | 583 | 153 | 59,113 | ||||||||||||
Other asset-backed securities | 80,866 | 78 | 388 | 80,556 | ||||||||||||
All other corporates | 16,377 | 275 | 4 | 16,648 | ||||||||||||
Total fixed maturities | 2,404,923 | 17,769 | 1,407 | 2,421,285 | ||||||||||||
Equity securities: | ||||||||||||||||
Common stocks: | ||||||||||||||||
Inmet Mining Corporation | 504,006 | 319,751 | – | 823,757 | ||||||||||||
Banks, trusts and insurance companies | 32,811 | 33,129 | 331 | 65,609 | ||||||||||||
Industrial, miscellaneous and all other | 23,195 | 22,562 | 300 | 45,457 | ||||||||||||
Total equity securities | 560,012 | 375,442 | 631 | 934,823 | ||||||||||||
Other investments | 1,054 | – | 170 | 884 | ||||||||||||
| $ | 2,965,989 | $ | 393,211 | $ | 2,208 | $ | 3,356,992 | |||||||||
F-34
The amortized cost and estimated fair value of investments classified as available for sale at December 31, 2013, by contractual maturity, are shown below. Expected maturities are likely to differ from contractual maturities because borrowers may have the right to call or prepay obligations with or without call or prepayment penalties.
Amortized | Estimated | |||||||
Cost | Fair Value | |||||||
(In thousands) | ||||||||
Due within one year | $ | 1,787,428 | $ | 1,787,647 | ||||
Due after one year through five years | 44,018 | 44,243 | ||||||
Due after five years through ten years | 539 | 539 | ||||||
Due after ten years | – | – | ||||||
| 1,831,985 | 1,832,429 | |||||||
Mortgage-backed and asset-backed securities | 772,506 | 781,183 | ||||||
| $ | 2,604,491 | $ | 2,613,612 | |||||
At December 31, 2013, the unrealized losses on investments which have been in a continuous unrealized loss position for less than 12 months and 12 months or longer were not significant.
At December 31, 2012, we owned 11,042,413 common shares of Inmet, which represented approximately 15.9% of Inmet's outstanding shares. Pursuant to a tender and exchange offer by First Quantum, we exchanged our Inmet shares for 18,202,313 shares of First Quantum, valued at $340.4 million on the date received, and $391.2 million in cash. We recorded a gain on the transaction of $227.6 million during the first quarter of 2013. First Quantum is a Canadian-based global mining company traded on the Toronto Stock Exchange (Symbol: FM). During the year ended December 31, 2013, we sold 9,952,313 First Quantum shares for aggregate net cash proceeds of $184.7 million.
Note 11. Variable Interest Entities
Variable interest entities ("VIEs") are entities in which equity investors lack the characteristics of a controlling financial interest or do not have sufficient equity at risk for the entity to finance its activities without additional subordinated financial support. VIEs are consolidated by the primary beneficiary. The primary beneficiary is the party who has the power to direct the activities of a variable interest entity that most significantly impact the entity's economic performance and who has an obligation to absorb losses of the entity or a right to receive benefits from the entity that could potentially be significant to the entity.
We determine whether we are the primary beneficiary of a VIE upon our initial involvement with the VIE and we reassess whether we are the primary beneficiary of a VIE on an ongoing basis. Our determination of whether we are the primary beneficiary of a VIE is based upon the facts and circumstances for each VIE and requires significant judgment. In determining whether we are the party with the power to direct the VIE's most significant activities, we first identify the activities of the VIE that most significantly impact its economic performance. Our considerations in determining the VIE's most significant activities primarily include, but are not limited to, the VIE's purpose and design and the risks passed through to investors. We then assess whether we have the power to direct those significant activities. Our considerations in determining whether we have the power to direct the VIE's most significant activities include, but are not limited to, voting interests of the VIE, management, service and/or other agreements of the VIE, involvement in the VIE's initial design and the existence of explicit or implicit financial guarantees. In situations where we have determined that the power over the VIE's most significant activities is shared, we assess whether we are the party with the power over the majority of the significant activities. If we are the party with the power over the majority of the significant activities, we meet the "power" criteria of the primary beneficiary. If we do not have the power over a majority of the significant activities or we determine that decisions require consent of each sharing party, we do not meet the "power" criteria of the primary beneficiary.
We assess our variable interests in a VIE both individually and in aggregate to determine whether we have an obligation to absorb losses of or a right to receive benefits from the VIE that could potentially be significant to the VIE. The determination of whether our variable interest is significant to the VIE requires significant judgment. In determining the significance of our variable interest, we consider the terms, characteristics and size of the variable interests, the design and characteristics of the VIE, our involvement in the VIE and our market-making activities related to the variable interests. Our variable interests in VIEs include debt and equity interests, commitments and certain fees. Our involvement with VIEs arises primarily from the following activities of Jefferies:
· | Purchases of mortgage-backed securities and collateralized debt and loan obligations in connection with our trading and secondary market making activities, |
· | Retained interests held as a result of securitization activities as part of primary market making activities, including the resecuritizations of mortgage-backed securities and the securitization of corporate loans, |
· | Financing of agency and non-agency mortgage-securities through financing vehicles utilizing master repurchase agreements, |
· | Management and performance fees in the Jefferies Umbrella Fund, and |
· | Loans to and investments in investment fund vehicles. |
F-35
Consolidated VIEs
The following tables present information about the assets and liabilities of our consolidated VIEs, which are presented within our Consolidated Statements of Financial Condition in the respective asset and liability categories, as of December 31, 2013. There were no consolidated VIEs at December 31, 2012.
(In millions) | Securitization Vehicles | |||
Cash | $ | – | ||
Financial instruments owned | 97.5 | |||
Securities purchased under agreement to resell (2) | 195.1 | |||
Other | 2.3 | |||
Total assets | $ | 294.9 | ||
Other secured financings (1) | $ | 292.5 | ||
Other | 2.1 | |||
Total liabilities | $ | 294.6 | ||
|
|
(1) | Approximately $66.5 million of the secured financing represents an amount held by Jefferies in inventory and eliminated in consolidation at December 31, 2013. |
(2) | Securities purchased under agreement to resell represent an amount due under a collateralized transaction on a related consolidated entity, which is eliminated in consolidation. |
|
Securitization vehicles. Jefferies is the primary beneficiary of a securitization vehicle to which it transferred a corporate loan and retained a portion of the securities issued by the securitization vehicle. Its variable interests in this vehicle consist of the securities retained. The assets of the VIE consist of a corporate loan, which is available for the benefit of the vehicle's beneficial interest holders. The creditors of the VIE do not have recourse to Jefferies general credit. During 2013, securities held in a securitization vehicle for which Jefferies was the primary beneficiary were redeemed. Upon redemption, Jefferies determined that it was no longer the primary beneficiary and deconsolidated the securitization vehicle. The assets of this VIE consisted of a project loan, and Jefferies variable interests in this vehicle consisted of the securities and a contractual servicing fee.
Jefferies is also the primary beneficiary of mortgage-backed financing vehicles to which we sell agency and non-agency residential and commercial mortgage-backed securities pursuant to the terms of a master repurchase agreement. Jefferies manages the assets within these vehicles. Jefferies variable interests in these vehicles consist of its collateral margin maintenance obligations under the master repurchase agreement. The assets of these VIEs consist of reverse repurchase agreements, which are available for the benefit of the vehicle's debt holders. The creditors of these VIEs do not have recourse to our general credit.
Nonconsolidated VIEs
Jefferies also holds variable interests in VIEs in which it is not the primary beneficiary and does not have the power to direct the activities that most significantly impact their economic performance and, accordingly, do not consolidate. Jefferies has not provided financial or other support to these VIEs and has no explicit or implicit arrangements to provide additional financial support to these VIEs and, other than as discussed below, has no liabilities related to these VIEs at December 31, 2013.
The following table presents information about nonconsolidated VIEs in which Jefferies has variable interests aggregated by principal business activity. The tables include VIEs where Jefferies has determined that the maximum exposure to loss is greater than specific thresholds or meets certain other criteria.
F-36
December 31, 2013 | ||||||||||||
Variable Interests | ||||||||||||
(In millions) | Financial Statement Carrying Amount | Maximum Exposure to loss | VIE Assets | |||||||||
Collateralized loan obligations | $ | 11.9 | (2) | $ | 11.9 | (4) | $ | 1,122.3 | ||||
Agency mortgage- and asset-backed securitizations (1) | 1,226.0 | (2) | 1,226.0 | (4) | 5,857.3 | |||||||
Non-agency mortgage- and asset-backed securitizations (1) | 840.1 | (2) | 840.1 | (4) | 78,070.8 | |||||||
Asset management vehicle | 3.5 | (3) | 3.5 | (4) | 454.2 | |||||||
Private equity vehicles | 40.8 | (3) | 68.8 | 89.4 | ||||||||
Total | $ | 2,122.3 | $ | 2,150.3 | $ | 85,594.0 | ||||||
(1) | VIE assets represent the unpaid principal balance of the assets in these vehicles at December 31, 2013 and represent the underlying assets that provide the cash flows supporting our variable interests. |
(2) | Consists of debt securities accounted for at fair value, which are included within Trading assets. |
(3) | Consists of equity interests and loans, which are included within Investments in managed funds and Loans to and investments in associated companies. |
(4) | Our maximum exposure to loss in these non-consolidated VIEs is limited to our investment, which is represented by the financial statement carrying amount of our purchased or retained interests. |
Collateralized Loan Obligations. Jefferies had acted as transferor and underwriter in several collateralized loan obligations ("CLOs") transactions in the past and retained securities representing variable interests in the CLOs. Assets collateralizing the CLOs include bank loans, participation interests and sub-investment grade and senior secured U.S. loans. In addition, Jefferies owns variable interests in CLOs previously managed by Jefferies. These CLOs represent interests in assets consisting primarily of senior secured loans, unsecured loans and high yield bonds. Jefferies exposure to loss from these entities is limited to its investments in the debt securities held. Regarding the CLOs previously managed by Jefferies, its variable interests consist of debt securities (with a fair value of $2.9 million at December 31, 2013) and a right to a portion of the CLOs' management and incentive fees. Management and incentives fees are accrued as the amounts become realizable.
Mortgage- and Asset-Backed Vehicles. In connection with Jefferies trading and market making activities, Jefferies buys and sells mortgage- and asset-backed securities. Mortgage- and asset-backed securities issued by securitization entities are generally considered variable interests in VIEs. A substantial portion of Jefferies variable interests in mortgage- and asset-backed VIEs are sponsored by unrelated third parties. The variable interests consist entirely of mortgage- and asset-backed securities and are accounted for at fair value and included in Trading assets in our Consolidated Statements of Financial Condition. In addition to the agency mortgage- and asset-backed securities, non-agency mortgage- and asset-backed securities and collateralized loan obligations at December 31, 2013 presented in the above table, Jefferies owned additional securities issued by securitization SPEs for which the maximum exposure to loss is less than specific thresholds. These additional securities were acquired in connection with Jefferies secondary market making activities and securitization activities. Total securities issued by securitization SPEs reflected in the Consolidated Statement of Financial Condition at December 31, 2013 consist of the following (in millions):
Non-agency | Agency | Total | ||||||||||
Variable interests in collateralized loan obligations | $ | 11.9 | $ | – | $ | 11.9 | ||||||
Variable interests in agency mortgage- and asset-backed securitizations | – | 1,226.0 | 1,226.0 | |||||||||
Variable interests in non-agency mortgage- and asset-backed securitizations | 840.1 | – | 840.1 | |||||||||
Additional securities in connection with trading and market making activities: | ||||||||||||
Residential mortgage-backed securities | 55.1 | 1,668.2 | 1,723.3 | |||||||||
Commercial mortgage-backed securities | 27.9 | 581.9 | 609.8 | |||||||||
Collateralized debt obligations | 27.9 | – | 27.9 | |||||||||
Other asset-backed securities | 34.1 | – | 34.1 | |||||||||
Total mortgage- and asset-backed securities in the Consolidated Statement | ||||||||||||
of Financial Condition | $ | 997.0 | $ | 3,476.1 | $ | 4,473.1 | ||||||
F-37
In addition, Jefferies entered into an agreement to sell at a fixed price corporate loans and the ownership interest in an entity holding such corporate loans to a CLO, which it determined represents a variable interest in the CLO. At December 31, 2013, the carrying value of Jefferies variable interest in the CLO was a liability of $167,000, which was recorded in Trading liabilities in the Consolidated Statement of Financial Condition, and Jefferies maximum exposure to loss under the forward sale agreement was approximately $76.9 million.
We also purchase mortgage- and asset-backed securities in the secondary market in connection with investing Leucadia's available liquidity, which are classified as Available for sale securities in the Consolidated Statements of Financial Condition. These securities are generally issued by securitizations vehicles that may be VIEs, all are sponsored by unrelated third-parties (a substantial majority by government-sponsored enterprises), all are carried at fair value and our maximum exposure to loss is equal to the carrying amount of the securities. Information on the assets of these vehicles is generally not available to us, and given the nature of this investment activity we do not believe such information would be helpful to readers of our financial statements.
Asset Management Vehicle. Jefferies manages the Jefferies Umbrella Fund, an "umbrella structure" company that enables investors to choose between one or more investment objectives by investing in one or more sub-funds within the same structure. The assets of the Jefferies Umbrella Fund primarily consist of convertible bonds. Accounting changes to consolidation standards under GAAP have been deferred for entities that are considered to be investment companies; accordingly, consolidation continues to be determined under a risk and reward model. The Jefferies Umbrella Fund is subject to the deferral guidance and Jefferies is not the primary beneficiary under the risk and reward model. Jefferies variable interests in the Jefferies Umbrella Fund consist of equity interests, management fees and performance fees.
Private Equity Vehicles. On July 26, 2010, Jefferies committed to invest equity of up to $75.0 million in Jefferies SBI USA Fund L.P. (the "SBI USA Fund"). As of December 31, 2013, Jefferies funded approximately $47.0 million of its commitment. The carrying amount of Jefferies equity investment was $39.2 million at December 31, 2013. Jefferies exposure to loss is limited to its equity commitment. The SBI USA Fund has assets consisting primarily of private equity and equity related investments.
Jefferies has variable interests in Jefferies Employees Partners IV, LLC ("JEP IV") consisting of an equity investment. The carrying amount of Jefferies equity investment was $1.6 million at December 31, 2013. As of December 31, 2013, Jefferies exposure to loss is limited to its equity investment. JEP IV has assets consisting primarily of private equity and equity related investments.
Note 12. Loans to and Investments in Associated Companies
A summary of loans to and investments in associated companies at December 31, 2013 and 2012 accounted for under the equity method of accounting is as follows (in thousands):
2013 | 2012 | |||||||
Jefferies Finance, LLC | $ | 470,537 | $ | – | ||||
Jefferies LoanCore LLC | 224,037 | – | ||||||
Berkadia | 182,573 | 172,942 | ||||||
Garcadia companies | 120,017 | 82,425 | ||||||
HomeFed | 52,923 | 49,384 | ||||||
Brooklyn Renaissance Plaza ("BRP") | – | 30,332 | ||||||
Linkem S.p.A. | 173,577 | 86,424 | ||||||
JHYH | – | 351,835 | ||||||
Other | 34,677 | 34,132 | ||||||
Total | $ | 1,258,341 | $ | 807,474 | ||||
Income (losses) related to associated companies includes the following for the years ended December 31, 2013, 2012 and 2011 (in thousands):
2013 | 2012 | 2011 | ||||||||||
Berkadia | $ | 84,678 | $ | 38,026 | $ | 29,033 | ||||||
Garcadia companies | 39,399 | 31,738 | 19,996 | |||||||||
Linkem | (22,719 | ) | (18,890 | ) | (2,243 | ) | ||||||
HomeFed | 3,539 | 1,891 | 1,410 | |||||||||
JHYH | 7,178 | 33,938 | 11,211 | |||||||||
Other | 6,966 | 1,946 | 2,606 | |||||||||
Total | $ | 119,041 | $ | 88,649 | $ | 62,013 | ||||||
F-38
For the year ended December 31, 2013, our share of Berkadia's income includes an out of period adjustment of $16.4 million to record income related to prior periods.
Income (losses) related to associated companies classified as Other revenues includes the following for the year ended December 31, 2013 (in thousands):
Jefferies Finance | $ | 57,795 | ||
Jefferies LoanCore | 35,300 | |||
Other | (915 | ) | ||
Total | $ | 92,180 |
Jefferies Finance
In October 2004, Jefferies entered into an agreement with Babson Capital Management LLC ("Babson Capital") and Massachusetts Mutual Life Insurance Company ("MassMutual") to form Jefferies Finance, a joint venture entity. Jefferies Finance is a commercial finance company whose primary focus is the origination and syndication of senior secured debt to middle market and growth companies in the form of term and revolving loans. Loans are originated primarily through the investment banking efforts of Jefferies, with Babson Capital providing primary credit analytics and portfolio management services. Jefferies Finance can also originate other debt products such as second lien term, bridge and mezzanine loans, as well as related equity co-investments. Jefferies Finance also purchases syndicated loans in the secondary market, including loans that are performing, stressed and distressed loan obligations.
Jefferies and MassMutual each have equity commitments to Jefferies Finance of $600.0 million. At December 31, 2013, approximately $337.3 million of Jefferies commitment was funded. The investment commitment is scheduled to mature on March 1, 2016 with automatic one year extensions subject to a 60 day termination notice by either party.
In addition, Jefferies and MassMutual have entered into a Secured Revolving Credit Facility, to be funded equally, to support loan underwritings by Jefferies Finance. The Secured Revolving Credit Facility bears interest based on the interest rates of the related Jefferies Finance underwritten loans and is secured by the underlying loans funded by the proceeds of the facility. The total committed Secured Revolving Credit Facility is $700.0 million and is scheduled to mature on March 1, 2016 with automatic one year extensions subject to a 60 day termination notice by either party. At December 31, 2013, $123.8 million of Jefferies $350.0 million commitment was funded.
Jefferies engages in debt capital markets transactions with Jefferies Finance related to the originations of loans by Jefferies Finance. In connection with such transactions, Jefferies earned net underwriting fees of $125.8 million during 2013, recognized in Investment banking revenues in the Consolidated Statement of Operations. In addition, Jefferies paid fees to Jefferies Finance regarding certain loans originated by Jefferies Finance of $12.0 million during 2013, which are recognized within Selling, general and other expenses in the Consolidated Statements of Operations. Under a service agreement, Jefferies charged Jefferies Finance $14.2 million for certain administrative services during 2013. Receivables from Jefferies Finance, included within Other assets in the Consolidated Statements of Financial Condition, were $31.1 million at December 31, 2013.
Jefferies LoanCore
In February 2011, Jefferies entered into a joint venture agreement with the Government of Singapore Investment Corporation and LoanCore, LLC and formed Jefferies LoanCore, a commercial real estate finance company. Jefferies LoanCore originates and purchases commercial real estate loans throughout the United States with the support of the investment banking and securitization capabilities of Jefferies and the real estate and mortgage investment expertise of the Government of Singapore Investment Corporation and LoanCore, LLC. Jefferies LoanCore has aggregate equity commitments of $600.0 million. Jefferies has funded $175.5 million of its $291.0 million equity commitment and has a 48.5% voting interest in Jefferies LoanCore.
Berkadia
Berkadia Commercial Mortgage LLC is a commercial mortgage banking and servicing joint venture formed in 2009 with Berkshire Hathaway. We and Berkshire Hathaway each contributed $217.2 million of equity capital to the joint venture and each have a 50% equity interest in Berkadia. Through December 31, 2013, cumulative cash distributions received from this investment aggregated $229.7 million. Berkadia originates commercial real estate loans that are sold to U.S. government agencies, and originates and brokers commercial mortgage loans which are not part of government agency programs. Berkadia is a servicer of commercial real estate loans in the U.S., performing primary, master and special servicing functions for U.S. government agency programs, commercial mortgage-backed securities transactions, banks, insurance companies and other financial institutions.
Berkadia uses all of the proceeds from the commercial paper sales of an affiliate of Berkadia to fund new mortgage loans, servicer advances, investments and other working capital requirements. Repayment of the commercial paper is supported by a $2.5 billion surety policy issued by a Berkshire Hathaway insurance subsidiary and corporate guaranty, and we have agreed to reimburse Berkshire Hathaway for one-half of any losses incurred thereunder. As of December 31, 2013, the aggregate amount of commercial paper outstanding was $2.47 billion.
F-39
Linkem
We have acquired 40.2% of the common shares of Linkem, a fixed wireless broadband services provider in Italy, for aggregate cash consideration of $138.4 million. In addition, we have purchased 5% convertible notes issued by Linkem for $81.2 million (€58.9 million principal amount); if converted, we would own approximately 53% of Linkem's common equity. The excess of our investment in Linkem's common shares over our share of underlying book value is being amortized to expense over 12 years.
HomeFed
At December 31, 2013, we own 2,474,226 shares of HomeFed's common stock, representing approximately 31.4% of HomeFed's outstanding common shares. HomeFed is engaged, directly and through subsidiaries, in the investment in and development of residential real estate projects. HomeFed is a public company traded on the NASD OTC Bulletin Board (Symbol: HOFD). As a result of a 1998 distribution to all of our shareholders, approximately 9.4% of HomeFed is owned by our Chairman at December 31, 2013. Our Chairman also serves as HomeFed's Chairman.
In February 2014, we entered into an agreement to sell to HomeFed substantially all of our real estate properties and operations, BRP and cash of approximately $18.0 million (subject to adjustment), in exchange for 7.5 million newly issued HomeFed common shares. The transaction is expected to close during the first quarter of 2014. The additional shares will increase our economic ownership interest in HomeFed to 65%; however, we have agreed to limit our voting rights such that we will not be able to vote more than 45% of HomeFed's total voting securities voting on any matter. Since the transaction will not result in our obtaining control of HomeFed, our investment in HomeFed will continue to be accounted for as an Investment in an associated company. We have also entered into a stockholders agreement that will limit our ability to increase our interest in HomeFed or dispose of our interest in HomeFed, as well as a registration rights agreement with respect to our HomeFed shares. See Note 31 for more information about the assets sold to HomeFed.
JHYH
Under GAAP, JHYH was considered a variable interest entity that was consolidated by Jefferies, since Jefferies was the primary beneficiary. In connection with the Jefferies acquisition, we contributed our investment in JHYH to Jefferies, other third-party investors were redeemed and JHYH was effectively dissolved.
The following table provides summarized data for associated companies as of December 31, 2013 and 2012 and for the three years ended December 31, 2013 (in thousands):
2013 | 2012 | |||||||||||
Assets | $ | 8,852,807 | $ | 6,848,157 | ||||||||
Liabilities | 6,292,252 | 4,602,240 | ||||||||||
Mandatorily redeemable interests | – | 1,089,506 | ||||||||||
Noncontrolling interest | 11,491 | 10,423 | ||||||||||
| 2013 | 2012 | 2011 | ||||||||||
Revenues | $ | 2,710,205 | $ | 1,995,858 | $ | 1,403,352 | ||||||
Income from continuing operations before | ||||||||||||
extraordinary items | $ | 428,509 | $ | 255,038 | $ | 62,340 | ||||||
Net income | $ | 434,969 | $ | 255,038 | $ | 62,340 | ||||||
The Company's income related to | ||||||||||||
associated companies | $ | 211,221 | $ | 88,649 | $ | 62,013 | ||||||
Except for our investment in Berkadia, we have not provided any guarantees, nor are we contingently liable for any of the liabilities reflected in the above table. All such liabilities are non-recourse to us. Our exposure to adverse events at the investee companies is limited to the book value of our investment.
Included in consolidated retained earnings at December 31, 2013 is approximately $118.3 million of undistributed earnings of the associated companies accounted for under the equity method of accounting.
F-40
Note 13. Financial Statement Offsetting
In connection with Jefferies derivative activities and securities financing activities, Jefferies may enter into master netting agreements and collateral arrangements with counterparties. Generally, transactions are executed under standard industry agreements, including, but not limited to: derivative transactions – International Swaps and Derivative Agreements, Inc. ("ISDA") master netting agreements; securities lending transactions – master securities lending agreements; and repurchase transactions – master repurchase agreements. A master agreement creates a single contract under which all transactions between two counterparties are executed allowing for trade aggregation and a single net payment obligation. Master agreements provide protection in bankruptcy in certain circumstances and, where legally enforceable, enable receivables and payables with the same counterparty to be settled or otherwise eliminated by applying amounts due to a counterparty against all or a portion of an amount due from the counterparty or a third party. In addition, Jefferies may enter into customized bilateral trading agreements and other customer agreements that provide for the netting of receivables and payables with a given counterparty as a single net obligation.
Under Jefferies derivative ISDA agreements Jefferies typically will also execute credit support annexes, which provide for collateral, either in the form of cash or securities, to be posted by or paid to a counterparty based on the fair value of the derivative receivable or payable based on the rates and parameters established in the credit support annex. Further, under master securities lending agreements and master repurchase agreements, collateral is received or paid in the form of securities and/or subject to margining based on the fair value of the collateral. In the event of the counterparty's default, provisions of the master agreement permit acceleration and termination of all outstanding transactions covered by the agreement such that a single amount is owed by, or to, the non-defaulting party. In addition, any collateral posted can be applied to the net obligations, with any excess returned; and the collateralized party has a right to liquidate the collateral. Any residual claim after netting is treated along with other unsecured claims in bankruptcy court.
The conditions supporting the legal right of offset may vary from one legal jurisdiction to another and the enforceability of master netting agreements and bankruptcy laws in certain countries or in certain industries is not free from doubt. The right of offset is dependent both on contract law under the governing arrangement and consistency with the bankruptcy laws of the jurisdiction where the counterparty is located. Industry legal opinions with respect to the enforceability of certain standard provisions in respective jurisdictions are relied upon as a part of managing credit risk. Master netting agreements are a critical component of Jefferies risk management processes as part of reducing counterparty credit risk and managing liquidity risk.
Jefferies is also a party to clearing agreements with various clearing organizations as well as with central clearing parties. Under these arrangements, the clearing organization or central clearing counterparty facilitates settlement between counterparties based on the net payable owed or receivable due and, with respect to daily settlement, cash is generally only required to be deposited to the extent of the net amount. In the event of default, a net termination amount is determined based on the market values of all outstanding positions and the clearing organization or clearing member provides for the liquidation and settlement of the net termination amount among all counterparties to the open derivative contracts, repurchase and/or securities lending transactions.
The following table provides information regarding derivative contracts, repurchase agreements and securities borrowing and lending arrangements that are recognized in the Consolidated Statement of Financial Condition and 1) the extent to which, under enforceable master netting arrangements, such balances are presented net in the Consolidated Statement of Financial Condition as appropriate under GAAP and 2) the extent to which other rights of setoff associated with these arrangements exist and could have an effect on our consolidated financial position.
(In thousands) | Gross Amounts | Netting in Consolidated Statement of Financial Condition (1) | Net Amounts in Consolidated Statement of Financial Condition | Additional Amounts Available for Setoff (2) | Available Collateral (3) | Net Amount | ||||||||||||||||||
Assets at December 31, 2013 | ||||||||||||||||||||||||
Derivative contracts | $ | 2,514,682 | $ | (2,253,589 | ) | $ | 261,093 | $ | – | $ | – | $ | 261,093 | |||||||||||
Securities borrowing arrangements | $ | 5,359,846 | $ | – | $ | 5,359,846 | $ | (530,293 | ) | $ | (957,140 | ) | $ | 3,872,413 | ||||||||||
Reverse repurchase agreements | $ | 12,715,449 | $ | (8,968,529 | ) | $ | 3,746,920 | $ | (590,754 | ) | $ | (3,074,540 | ) | $ | 81,626 | |||||||||
Liabilities at December 31, 2013 | ||||||||||||||||||||||||
Derivative contracts | $ | 2,532,690 | $ | (2,352,611 | ) | $ | 180,079 | $ | – | $ | – | $ | 180,079 | |||||||||||
Securities lending arrangements | $ | 2,506,122 | $ | – | $ | 2,506,122 | $ | (530,293 | ) | $ | (1,942,271 | ) | $ | 33,558 | ||||||||||
Repurchase agreements | $ | 19,748,374 | $ | (8,968,529 | ) | $ | 10,779,845 | $ | (590,754 | ) | $ | (8,748,641 | ) | $ | 1,440,450 | |||||||||
(1) | Netting is applied by counterparty when a legal right of offset exists under an enforceable master netting agreement, as permitted under GAAP. Further, for derivative assets and liabilities, netting is inclusive of cash paid or received as collateral under credit support agreements pursuant to the master netting agreement. |
(2) | Under enforceable master netting agreements with our counterparties, Jefferies has the legal right of offset with a counterparty, which incorporates all of the counterparty's outstanding rights and obligations under the arrangement. These balances reflect additional credit risk mitigation that is available by counterparty in the event of a counterparty's default, but which are not netted in the balance sheet under the provisions of GAAP. |
(3) | Includes securities received or paid under collateral arrangements with counterparties that could be liquidated in the event of a counterparty default and thus offset against a counterparty's rights and obligations under the respective derivative contracts, resale and repurchase agreements or securities borrowing or lending arrangements. |
At December 31, 2012, we had $391.7 million gross amount of repurchase agreements, none of which were offset in the Consolidated Statement of Financial Condition.
F-41
Note 14. Intangible Assets, Net and Goodwill
A summary of intangible assets, net at December 31, 2013 and 2012 is as follows (in thousands): |
2013 | 2012 | |||||||
Indefinite lived intangibles: | ||||||||
Exchange and clearing organization membership interests and registrations | $ | 14,916 | $ | – | ||||
Amortizable intangibles: | ||||||||
Customer and other relationships, net of accumulated amortization of | ||||||||
$117,139 and $70,823 | 502,409 | 416,304 | ||||||
Trademarks and tradename, net of accumulated amortization of $30,213 | ||||||||
and $15,731 | 364,779 | 263,839 | ||||||
Supply contracts, net of accumulated amortization of $20,162 and $9,874 | 129,833 | 140,121 | ||||||
Licenses, net of accumulated amortization of $4,100 and $3,508 | 7,928 | 8,520 | ||||||
Other, net of accumulated amortization of $4,500 and $4,467 | 664 | 1,047 | ||||||
Total intangibles | $ | 1,020,529 | $ | 829,831 | ||||
Amortization expense on intangible assets was $74.8 million, $53.7 million and $7.1 million for the years ended December 31, 2013, 2012 and 2011, respectively. The estimated aggregate future amortization expense for the intangible assets for each of the next five years is as follows: 2014 - $66.0 million; 2015 - $63.1 million; 2016 - $61.1 million; 2017 - $61.0 million; and 2018 - $60.8 million.
A summary of goodwill at December 31, 2013 and 2012 is as follows (in thousands):
2013 | 2012 | |||||||
National Beef | $ | 14,991 | $ | 14,991 | ||||
Jefferies | 1,724,557 | – | ||||||
Other operations | 8,551 | 9,204 | ||||||
| $ | 1,748,099 | $ | 24,195 | |||||
The increase in intangible assets and goodwill during 2013 was due to the acquisition of Jefferies, as more fully discussed in Note 4.
Goodwill Impairment Testing
Goodwill associated with the acquisition of Jefferies is allocated to the related reporting units, which are determined based on financial information provided to management in connection with its management of the businesses. A reporting unit is an operating segment or one level below an operating segment. The quantitative goodwill impairment test is performed at the level of the reporting unit and consists of two steps. In the first step, the fair value of each reporting unit is compared with its carrying value, including goodwill and allocated intangible assets. If the fair value is in excess of the carrying value, the goodwill for the reporting unit is considered not to be impaired. If the fair value is less than the carrying value, then a second step is performed in order to measure the amount of the impairment loss, if any, which is based on comparing the implied fair value of the reporting unit's goodwill to the fair value of the net assets of the reporting unit.
Allocated equity plus goodwill and allocated intangible assets are used as a proxy for the carrying amount of each Jefferies reporting unit. The amount of equity allocated to a Jefferies reporting unit is based on Jefferies cash capital model deployed in managing these businesses, which seeks to approximate the capital a business would require if it were operating independently. Intangible assets are allocated to a reporting unit based on either specifically identifying a particular intangible asset as pertaining to a reporting unit or, if shared among reporting units, based on an assessment of the reporting unit's benefit from the intangible asset in order to generate results.
Estimating the fair value of a reporting unit requires management judgment. Estimated fair values for Jefferies reporting units were determined using a market valuation method that incorporate price-to-earnings and price-to-book multiples of comparable public companies and, for certain reporting units, a net asset value method. In addition, as the fair values determined under the market approach represent a noncontrolling interest, we applied a control premium to arrive at the estimated fair value of each reporting unit on a controlling basis. Jefferies engaged an independent valuation specialist to assist management's valuation process as of August 1, 2013.
Our annual goodwill impairment testing related to Jefferies as of August 1, 2013 did not indicate any goodwill impairment in any of Jefferies reporting units. Substantially all of the goodwill is allocated to Jefferies Investment Banking, Equities and Fixed Income reporting units for which the results of our assessment indicated that these reporting units had a fair value substantially in excess of their carrying amounts based on current projections. Goodwill allocated to these reporting units is $1,665.3 million of the total goodwill associated with the acquisition of Jefferies at December 31, 2013. For Jefferies remaining less significant reporting units, we have used a net asset approach for valuation and the fair value of each of the reporting units is equal to its book value.
F-42
Goodwill related to National Beef and other operations was not impaired when tested.
Intangible Assets
We performed our annual impairment testing of Jefferies intangible assets with an indefinite useful life, which consists of exchange and clearing organization membership interests and registrations, as of August 1. We elected to perform a quantitative assessment of membership interests and registrations that have available quoted sales prices, and a qualitative assessment of the remainder of Jefferies intangible assets. Our quantitative assessment resulted in an insignificant impairment loss on certain exchange memberships based on quoted sales prices. With regard to our qualitative assessment of the remaining indefinite-life intangible assets, based on our assessment of market conditions, the utilization of the assets and the replacement costs associated with the assets since the most recent valuation date of March 1, 2013 as part of acquisition accounting, we concluded that the intangible assets were not impaired.
Note 15. Inventory
A summary of inventory at December 31, 2013 and 2012 which is classified as Other assets is as follows (in thousands):
2013 | 2012 | |||||||
Finished goods | $ | 273,291 | $ | 271,221 | ||||
Work in process | 34,701 | 61,069 | ||||||
Raw materials, supplies and other | 56,334 | 51,202 | ||||||
| $ | 364,326 | $ | 383,492 | |||||
Note 16. Property, Equipment and Leasehold Improvements, Net:
A summary of property, equipment and leasehold improvements, net at December 31, 2013 and 2012 is as follows (in thousands):
Depreciable | ||||||||||||
Lives | ||||||||||||
(in years) | 2013 | 2012 | ||||||||||
Land, buildings and leasehold improvements | 5-45 | $ | 510,717 | $ | 622,040 | |||||||
Beef processing machinery and equipment | 2-15 | 243,026 | 240,412 | |||||||||
Other machinery and equipment | 3-15 | 157,164 | 174,044 | |||||||||
Corporate aircraft | 10 | 104,780 | 112,071 | |||||||||
Furniture, fixtures and office equipment | 2-10 | 210,916 | 37,021 | |||||||||
Construction in progress | N/A | 69,717 | 53,302 | |||||||||
Other | 3-10 | 3,316 | 4,096 | |||||||||
| 1,299,636 | 1,242,986 | |||||||||||
Accumulated depreciation and amortization | (413,777 | ) | (385,626 | ) | ||||||||
| $ | 885,859 | $ | 857,360 | |||||||||
Property, equipment and leasehold improvements, net related to Premier were $229.0 million and $208.5 million at December 31, 2013 and 2012, respectively. We have entered into an agreement to sell Premier, and Premier's results of operations have been classified as a discontinued operation.
Note 17. Short-Term Borrowings
Short-term borrowings represent Jefferies bank loans that are payable on demand and generally bear interest at a spread over the federal funds rate. Unsecured bank loans are typically overnight loans used to finance trading assets or clearing related balances, but are not part of Jefferies systemic funding model. At December 31, 2013, $12.0 million was outstanding, all of which was secured financing.
F-43
Note 18. Long-Term Debt
The principal amount (net of unamortized discounts and premiums), stated interest rate and maturity date of outstanding debt at December 31, 2013 and 2012 are as follows (dollars in thousands):
2013 | 2012 | |||||||
Parent Company Debt: | ||||||||
Senior Notes: | ||||||||
7.75% Senior Notes due August 15, 2013, $94,500 principal | $ | – | $ | 94,461 | ||||
7% Senior Notes due August 15, 2013, $307,409 principal | – | 307,494 | ||||||
8.125% Senior Notes due September 15, 2015, $458,641 principal | 456,515 | 455,405 | ||||||
5.50% Senior Notes due October 18, 2023, $750,000 principal | 739,960 | – | ||||||
6.625% Senior Notes due October 23, 2043, $250,000 principal | 246,958 | – | ||||||
Subordinated Notes: | ||||||||
3.75% Convertible Senior Subordinated Notes due April 15, 2014, | ||||||||
$97,581 principal | 97,581 | 97,581 | ||||||
Total long-term debt – parent company | 1,541,014 | 954,941 | ||||||
Subsidiary Debt (non-recourse to Parent Company): | ||||||||
Jefferies: | ||||||||
5.875% Senior Notes, due June 8, 2014, $250,000 principal | 255,676 | – | ||||||
3.875% Senior Notes, due November 9, 2015, $500,000 principal | 516,204 | – | ||||||
5.5% Senior Notes, due March 15, 2016, $350,000 principal | 373,178 | – | ||||||
5.125% Senior Notes, due April 13, 2018, $800,000 principal | 854,011 | – | ||||||
8.5% Senior Notes, due July 15, 2019, $700,000 principal | 858,425 | – | ||||||
6.875% Senior Notes, due April 15, 2021, $750,000 principal | 866,801 | – | ||||||
2.25% Euro Medium Term Notes, due July 13, 2022, $5,283 principal | 4,792 | – | ||||||
5.125% Senior Notes, due January 20, 2023, $600,000 principal | 625,626 | – | ||||||
6.45% Senior Debentures, due June 8, 2027, $350,000 principal | 383,224 | – | ||||||
3.875% Convertible Senior Debentures, due November 1, 2029, | ||||||||
$345,000 principal | 349,707 | – | ||||||
6.25% Senior Debentures, due January 15, 2036, $500,000 principal | 513,343 | – | ||||||
6.50% Senior Notes, due January 20, 2043, $400,000 principal | 422,245 | – | ||||||
Secured credit facility, due August 26, 2014 | 200,000 | – | ||||||
National Beef Term Loans | 375,000 | 296,000 | ||||||
National Beef Revolving Credit Facility | – | 91,403 | ||||||
Other | 41,619 | 16,351 | ||||||
Total long-term debt – subsidiaries | 6,639,851 | 403,754 | ||||||
Long-term debt | $ | 8,180,865 | $ | 1,358,695 | ||||
At December 31, 2013, $2.1 billion of consolidated assets (primarily inventory, receivables, property and equipment and intangibles) are pledged for indebtedness aggregating $616.6 million, principally for amounts due under National Beef's credit facility and Jefferies secured credit facility.
The aggregate annual mandatory redemptions of all long-term debt during the five year period ending December 31, 2018 are as follows: 2014 - $601.9 million; 2015 - $987.1 million; 2016 - $381.8 million; 2017 - $25.0 million; and 2018 - $1,075.0 million.
F-44
Parent Company Debt :
In October 2013, we sold $750.0 million principal amount of our newly authorized 5 ½% Senior Notes due 2023 at an issue price of 98.641% and $250.0 million principal amount of our newly authorized 6.625% Senior Notes due 2043 at an issue price of 98.781%.
From time to time we have purchased our outstanding debt securities depending upon prevailing market conditions, our liquidity requirements and other factors; such purchases may be commenced or suspended at any time without notice. No such purchases were made during 2013; principal amounts of parent company debt purchased during the prior two years are as follows (dollars in thousands):
2012 | 2011 | |||||||
7% Senior Notes | $ | 4,836 | $ | – | ||||
8.125% Senior Notes | – | 21,359 | ||||||
7.125% Senior Notes | 423,140 | 54,860 | ||||||
8.65% Junior Subordinated Deferrable Interest Debentures | 88,204 | 1,350 | ||||||
Total | $ | 516,180 | $ | 77,569 | ||||
As a result of the purchases, we recognized pre-tax losses of $24.2 million and $6.4 million for the years ended December 31, 2012 and 2011, respectively, which are reflected in Selling, general and other expenses.
Our 3¾% Convertible Senior Subordinated Notes due 2014 are convertible into our common shares at $21.24 per share at any time before their maturity, subject to certain restrictions contained in the notes, at a conversion rate of 47.081 shares per each $1,000 principal amount of notes subject to adjustment. Future dividends will reduce the conversion price per share by the amount charged to shareholders' equity on a per share basis. At December 31, 2013, the notes are convertible into an aggregate of 4,594,209 shares.
Our senior note indentures contain covenants that restrict our ability to incur more Indebtedness or issue Preferred Stock of Subsidiaries unless, at the time of such incurrence or issuance, the Company meets a specified ratio of Consolidated Debt to Consolidated Tangible Net Worth, limit the ability of the Company and Material Subsidiaries to incur, in certain circumstances, Liens, limit the ability of Material Subsidiaries to incur Funded Debt in certain circumstances, and contain other terms and restrictions all as defined in the senior note indentures. We have the ability to incur substantial additional indebtedness or make distributions to our shareholders and still remain in compliance with these restrictions. If we are unable to meet the specified ratio, we would not be able to issue additional Indebtedness or Preferred Stock, but our inability to meet the applicable ratio would not result in a default under our senior note indentures. The senior note indentures do not restrict the payment of dividends.
Subsidiary Debt :
Jefferies 3.875% Convertible Senior Debentures due 2029 are convertible into our common shares; each $1,000 are convertible into 21.9727 common shares (equivalent to a conversion price of approximately $45.51). The debentures are convertible at the holders' option any time beginning on August 1, 2029 and convertible at any time if: 1) our common stock price is greater than or equal to 130% of the conversion price for at least 20 trading days in a period of 30 consecutive trading days; 2) if the trading price per debenture is less than 95% of the price of our common stock times the conversion ratio for any 10 consecutive trading days; 3) if the debentures are called for redemption; or 4) upon the occurrence of specific corporate actions. The debentures may be redeemed for par, plus accrued interest, on or after November 1, 2012 if the price of our common stock is greater than 130% of the conversion price for at least 20 days in a period of 30 consecutive trading days and we may redeem the debentures for par, plus accrued interest, at our election any time on or after November 1, 2017. Holders may require us to repurchase the debentures for par, plus accrued interest, on November 1, 2017, 2019 and 2024. In addition to ordinary interest, commencing November 1, 2017, contingent interest will accrue at 0.375% if the average trading price of a debenture for 5 trading days ending on and including the third trading day immediately preceding a six-month interest period equals or exceeds $1,200 per $1,000 debenture.
On August 26, 2011, Jefferies entered into a committed senior secured revolving credit facility ("Jefferies Credit Facility") with a group of commercial banks in U.S. dollars, Euros and Sterling, in an aggregate committed amount of $950.0 million with availability subject to one or more borrowing bases and of which $250.0 million can be borrowed by Jefferies Bache Limited without a borrowing base requirement. The borrowers under the Jefferies Credit Facility are Jefferies Bache Financial Services, Inc., Jefferies Bache, LLC and Jefferies Bache Limited. The Jefferies Credit Facility is guaranteed by Jefferies Group LLC and contains certain financial covenants, including, but not limited to, restrictions on future indebtedness of Jefferies subsidiaries, requires Jefferies Group LLC and certain of Jefferies subsidiaries to maintain specified level of tangible net worth and liquidity amounts and to maintain specified levels of regulated capital. The Jefferies Credit Facility terminates on August 26, 2014. Interest is based on, in the case of U.S. dollar borrowings, the Federal funds rate or the London Interbank Offered Rate or, in the case of Euro and Sterling borrowings, the Euro Interbank Offered Rate and the London Interbank Offered Rate, respectively. At December 31, 2013, borrowings under the Jefferies Credit Facility were denominated in U.S. dollars and Jefferies is in compliance with debt covenants under the Jefferies Credit Facility.
F-45
During 2013, National Beef's credit facility was amended and restated to increase the term loan to $375.0 million, increase the revolving credit facility to $300.0 million, extend the maturity to October 2018 and reduce the term loan's required quarterly principal payments to $6.25 million. At December 31, 2012, National Beef's credit facility consisted of a $296.0 million outstanding term loan and a revolving line of credit of up to $250.0 million. The term loan and the revolving credit facility bear interest at the Base Rate or the LIBOR Rate (as defined in the credit facility), plus a margin ranging from .75% to 2.50% depending upon certain financial ratios and the rate selected. At December 31, 2013, the interest rate on the outstanding term loan was 2.41%. The amended credit facility contains a minimum tangible net worth covenant, but does not contain the numerical covenants requiring certain leverage and fixed charge ratios that were in the previous agreement. At December 31, 2013, National Beef met the tangible net worth covenant. The credit facility is secured by a first priority lien on substantially all of the assets of National Beef and its subsidiaries.
Borrowings under the revolving credit facility are available for National Beef's working capital requirements, capital expenditures and other general corporate purposes. Unused capacity under the facility can also be used to issue letters of credit; letters of credit aggregating $21.8 million were outstanding at December 31, 2013. Amounts available under the revolver are subject to a borrowing base calculation primarily comprised of receivable and inventory balances. At December 31, 2013, after deducting outstanding amounts and issued letters of credit $240.0 million of the unused revolver was available to National Beef.
Note 19. Mezzanine Equity
Redeemable Noncontrolling Interests in Subsidiary
Redeemable noncontrolling interests in subsidiary are held by minority owners of National Beef, principally USPB, NBPCo Holdings and the chief executive officer of National Beef. The holders of these interests share in the profits and losses of National Beef on a pro rata basis with us. However, the minority owners have the right to require us to purchase their interests under certain specified circumstances at fair value (put rights), and we also have the right to purchase their interests under certain specified circumstances at fair value (call rights). Each of the holders of the put rights has the right to make an election that requires us to purchase up to one-third of their interests on December 30, 2016, one-third on December 30, 2018, and the remainder on December 30, 2021. In addition, USPB may elect to exercise their put rights following the termination of the cattle supply agreement, and the chief executive officer following the termination of his employment.
Our call rights with respect to USPB may be exercised following the termination of the cattle supply agreement or after USPB's ownership interest is less than 20% of their interest held at the time we acquired National Beef. Our call rights with respect to other members may be exercised after the ten year anniversary of our acquisition of National Beef if such member's ownership interest is less than 50% of the interest held at the time we acquired National Beef. Additionally, we may acquire the chief executive officer's interest following the termination of his employment.
Redeemable noncontrolling interests in National Beef are reflected in the Consolidated Statements of Financial Condition at fair value. The following table reconciles National Beef's redeemable noncontrolling interests activity during the years ended December 31, 2013 and 2012 (in thousands):
2013 | 2012 | |||||||
As of January 1, | $ | 241,649 | $ | 235,909 | ||||
Income (loss) allocated to redeemable noncontrolling | ||||||||
interests | (9,282 | ) | 12,235 | |||||
Net distributions to redeemable noncontrolling interests | (8,073 | ) | (12,722 | ) | ||||
Increase in fair value of redeemable noncontrolling | ||||||||
interests charged to additional paid-in capital | 16,781 | 6,227 | ||||||
Balance, December 31, | $ | 241,075 | $ | 241,649 | ||||
At acquisition, we prepared a projection of future cash flows of National Beef, which was used along with other information to allocate the purchase price to National Beef's individual assets and liabilities. At December 31, 2013, we calculated the fair value of the redeemable noncontrolling interests by updating its estimate of future cash flows, as well as considering other market comparable information deemed appropriate. The projected future cash flows consider estimated revenue growth, cost of sales changes, capital expenditures and other unobservable inputs. However, the most significant unobservable inputs affecting the estimate of fair value are the discount rate (12.23%) and the terminal growth rate (2%) used to calculate the capitalization rate of the terminal value.
F-46
The table below is a sensitivity analysis which shows the fair value of the redeemable noncontrolling interests using the assumed discount and the terminal growth rates and fair values under different rate assumptions as of December 31, 2013 (dollars in millions):
Discount Rates | ||||||||||||
Terminal Growth Rates | 11.98 | % | 12.23 | % | 12.48 | % | ||||||
1.75% | $ | 245.7 | $ | 238.1 | $ | 230.8 | ||||||
2.00% | $ | 249.0 | $ | 241.1 | $ | 233.6 | ||||||
2.25% | $ | 252.3 | $ | 244.2 | $ | 236.5 | ||||||
The projection of future cash flows is updated with input from National Beef personnel. The estimate is reviewed by personnel at our corporate office as part of the normal process for the preparation of our quarterly and annual financial statements.
Mandatorily Redeemable Convertible Preferred Shares
As mentioned above, in connection with the Jefferies acquisition we issued a new series of 3.25% Cumulative Convertible Preferred Shares ("Preferred Shares") ($125.0 million at mandatory redemption value) in exchange for Jefferies outstanding 3.25% Series A-1 Cumulative Convertible Preferred Stock. The Preferred Shares have a 3.25% annual, cumulative cash dividend and are currently convertible into 4,162,200 common shares an effective conversion price of $30.03 per share. The Preferred Shares are callable beginning in 2023 at a price of $1,000 per share plus accrued interest and are mandatorily redeemable in 2038.
Note 20. Common Shares, Compensation Plans and Preferred Shares |
The Board of Directors from time to time has authorized acquisitions of our common shares. At December 31, 2013, we are authorized to repurchase 25,000,000 common shares.
Prior to the acquisition of Jefferies, we had two share-based compensation plans: a fixed stock option plan and a senior executive warrant plan. The fixed stock option plan provides for the issuance of stock options and stock appreciation rights to non-employee directors and certain employees at not less than the fair market value of the underlying stock at the date of grant. Options granted to employees under this plan are intended to qualify as incentive stock options to the extent permitted under the Internal Revenue Code and become exercisable in five equal annual instalments starting one year from date of grant. Options granted to non-employee directors become exercisable in four equal annual instalments starting one year from date of grant. No stock appreciation rights have been granted. At December 31, 2013 and 2012, 7,124,429 and 7,308,705, respectively, of our common shares were reserved for stock options and warrants.
In connection with the Jefferies acquisition, each restricted share of Jefferies common stock and each RSU of Jefferies common stock was converted at the Exchange Ratio into an award of restricted shares or RSUs of Leucadia, with all such awards subject to the same terms and conditions, including, without limitation, vesting and, in the case of performance-based RSUs, performance being measured at existing targets. In addition, Jefferies share-based compensation plans were assumed by us and awards are now issued in our common shares. At our annual shareholder meeting in July 2013, shareholders approved our 2003 Incentive Compensation Plan, as amended and restated (the "Incentive Plan") and the 1999 Directors' Stock Compensation Plan ("Directors' Plan"), as amended and restated that, among other things, permits the grant of awards to our employees and directors who were not previously employees or directors of Jefferies.
Compensation and benefits expense included $87.2 million, $14.3 million and $23.0 million for the years ended December 31, 2013, 2012 and 2011, respectively, for share-based compensation expense relating to grants made under our share-based compensation plan. Total compensation cost includes the amortization of sign-on, retention and senior executive awards, less forfeitures and clawbacks. The total tax benefit recognized in results of operations related to share-based compensation expenses was $33.2 million, $4.9 million and $7.8 million for the years ended December 31, 2013, 2012 and 2011, respectively. As of December 31, 2013, total unrecognized compensation cost related to nonvested share-based compensation plans was $178.3 million; this cost is expected to be recognized over a weighted-average period of 2.4 years.
The net tax benefit related to share-based compensation plans recognized in additional paid-in capital was $2.9 million during the year ended December 31, 2013, and was not significant during the years ended December 31, 2012 and 2011. Cash flows resulting from tax deductions in excess of the grant date fair value of share-based awards are included in cash flows from financing activities; accordingly, we reflected the excess tax benefit related to share-based compensation in cash flows from financing activities of $3.1 million for the year ended December 31, 2013; amounts for the years ended December 31, 2012 and 2011 were not significant.
F-47
At December 31, 2013, there were 5,242,000 shares of restricted stock outstanding with future service required, 4,793,000 RSUs outstanding with future service required, 8,316,000 RSUs outstanding with no future service required and 1,108,000 shares issuable under other plans. Excluding shares issuable pursuant to outstanding stock options and warrants, the maximum potential increase to common shares outstanding resulting from these outstanding awards is 14,217,000.
Senior Executive Warrant Plan. On March 6, 2006, our Board of Directors, upon the recommendation of the Compensation Committee of the Board, approved, subject to shareholder approval, the grant of warrants to purchase 2,000,000 common shares to each of our then Chairman and President at an exercise price equal to $28.515 per share (105% of the closing price per share of a common share on that date). In May 2006, shareholder approval was received and the warrants were issued; the warrants vested over a four year period and were scheduled by their terms to expire on March 5, 2011. In February 2011, each of our then Chairman and President exercised these warrants, on a cashless exercise basis, pursuant to which they each received 261,599 common shares (determined using a value per share of $32.806 as set forth in the warrant). All of the common shares obtained upon exercise of the warrants were immediately sold in a private transaction.
On March 7, 2011, the Compensation Committee of our Board of Directors granted warrants to purchase 2,000,000 common shares to each of our then Chairman and President at an exercise price of $33.33 per share (105% of the closing price per share of a common share on the grant date), subject to shareholder approval. In May 2011, the required shareholder approval was received and the warrants were issued. The warrants expire in 2016 and vest in five equal tranches with 20% vesting on the date shareholder approval was received and an additional 20% vesting in each subsequent year. Compensation cost was determined as of the approval date and will be recognized in the financial statements over the vesting period of the warrants. The assumptions detailed below used to value options in 2011 were also used to value the warrants granted during 2011, resulting in a fair value per warrant granted of $13.35. We have recorded share-based compensation expense related to this grant of warrants of $4.9 million, $11.2 million and $18.9 million for the years ended December 31, 2013, 2012 and 2011, respectively.
Fixed Stock Option Plan. A summary of activity with respect to our stock options for the three years ended December 31, 2013 is as follows:
Weighted- | |||||||||||||
Common | Weighted- | Average | |||||||||||
Shares | Average | Remaining | Aggregate | ||||||||||
Subject | Exercise | Contractual | Intrinsic | ||||||||||
to Option | Prices | Term | Value | ||||||||||
Balance at December 31, 2010 | 2,622,500 | $ | 27.61 | ||||||||||
Granted | 12,000 | $ | 35.78 | ||||||||||
Exercised | (255,445 | ) | $ | 27.89 | $ | 2,412,000 | |||||||
Cancelled | (127,600 | ) | $ | 27.63 | |||||||||
Balance at December 31, 2011 | 2,251,455 | $ | 27.62 | ||||||||||
Granted | 919,500 | $ | 23.20 | ||||||||||
Exercised | – | – | $ | – | |||||||||
Cancelled | (593,455 | ) | $ | 27.42 | |||||||||
Balance at December 31, 2012 | 2,577,500 | $ | 26.10 | ||||||||||
Granted | 51,432 | $ | 26.06 | ||||||||||
Exercised | (184,276 | ) | $ | 24.65 | $ | 603,000 | |||||||
Cancelled | (27,408 | ) | $ | 38.68 | |||||||||
Balance at December 31, 2013 | 2,417,248 | $ | 25.64 | 3.0 years | $ | 6,600,000 | |||||||
Exercisable at December 31, 2013 | 1,100,064 | $ | 27.13 | 1.5 years | $ | 1,412,000 | |||||||
F-48
The following summary presents the weighted-average assumptions used for grants made during each of the three years in the period ended December 31, 2013:
2013 | 2012 | 2011 | ||||||||||
Options | Options | Options | ||||||||||
Risk free interest rate | 1.26 | % | .53 | % | 1.58 | % | ||||||
Expected volatility | 39.17 | % | 37.66 | % | 45.25 | % | ||||||
Expected dividend yield | .85 | % | 1.08 | % | .70 | % | ||||||
Expected life | 4.0 years | 4.0 years | 4.3 years | |||||||||
Weighted-average fair value per grant | $ | 7.67 | $ | 5.97 | $ | 13.18 | ||||||
The expected life assumptions were based on historical behavior and incorporated post-vesting forfeitures for each type of award and population identified. The expected volatility was based on the historical behavior of our stock price.
Incentive Plan. The Incentive Plan allows awards in the form of incentive stock options (within the meaning of Section 422 of the Internal Revenue Code), nonqualified stock options, stock appreciation rights, restricted stock, unrestricted stock, performance awards, RSUs, dividend equivalents or other share-based awards to employees and service providers.
The Incentive Plan allows for grants of restricted stock awards, whereby employees are granted restricted shares of common stock subject to forfeiture. The Incentive Plan also allows for grants of RSUs. RSUs give a participant the right to receive fully vested shares at the end of a specified deferral period allowing a participant to hold an interest tied to common stock on a tax deferred basis. Prior to settlement, RSUs carry no voting or dividend rights associated with the stock ownership, but dividend equivalents are accrued to the extent there are dividends declared on our common stock.
We may grant restricted stock and RSUs to new employees as "sign-on" awards, to existing employees as "retention" awards and to certain executive officers as awards for multiple years. Sign-on and retention awards are generally subject to annual ratable vesting over a four year service period and are amortized as compensation expense on a straight line basis over the related four years. Jefferies has granted restricted stock and RSUs to certain senior executives with both performance and service conditions. The awards granted to senior executives are amortized over the service period if we have determined it is probable that the performance condition will be achieved.
The Deferred Compensation Plan (the "DCP") has been implemented under the Incentive Plan. The DCP permits eligible executive officers and other employees to defer cash compensation, some or all of which may be deemed invested in stock units. A portion of the deferrals may also be directed to notional investments in a money market fund or certain of the employee investment opportunities. Stock units generally have been acquired at a discounted price, which encourages employee participation in the DCP and enhances long-term retention of equity interests by participants and aligns executive interests with those of shareholders. Amounts recognized as compensation cost have not been significant. The shares to be delivered in connection with DCP stock units and options are drawn from the Incentive Plan.
The Incentive Plan contains two separate reservations of our common shares for awards. The plan's "evergreen" share reservation provides that an equity award can be granted if the shares subject to the award, plus the number of shares subject to other outstanding awards under the evergreen reservation, do not exceed 12.15% of our common shares outstanding immediately before the grant but in no event more than 49,922,459. For purposes of the evergreen reservation, an award of an option or stock appreciation right is considered to be outstanding until it is exercised, and other awards are considered to be outstanding until the end of the quarter preceding the quarter in which all service-based vesting requirements have been met, except that in any event an award is considered outstanding for the remainder of the calendar year in which it is granted. At December 31, 2013, 34,257,000 common shares were available for new grants under the evergreen reservation, although shares in excess of that number would become available thereafter. Of this amount, no more than 8,100,000 may be used for incentive stock options. The Incentive Plan separately reserves common shares for options and deferred shares granted upon the elective deferral of cash compensation by employees under the DCP; at December 31, 2013, 5,307,000 common shares remain available for new grants under the DCP.
Because the Incentive Plan makes shares available for equity awards under an evergreen formula, the number of shares available under the Incentive Plan will vary over time. The number of shares outstanding, and thus the shares available under the Incentive Plan, may vary due to our repurchases of shares and issuances of shares in acquisitions, to raise capital, and under the Incentive Plan and other compensatory plans, and as a result of other possible transactions.
F-49
The following table details the activity in restricted stock during the year ended December 31, 2013 (in thousands, except per share amounts):
Weighted Average | ||||||||
Grant Date | ||||||||
2013 | Fair Value | |||||||
Balance at January 1, 2013 | – | $ | – | |||||
Converted in connection with the Jefferies acquisition | 6,895 | $ | 26.90 | |||||
Grants | 462 | $ | 27.38 | |||||
Forfeited | (144 | ) | $ | 26.90 | ||||
Fulfillment of service requirement | (1,971 | ) | $ | 26.90 | ||||
Balance at December 31, 2013 | 5,242 | $ | 26.94 | |||||
The following table details the activity in restricted stock units during the year ended December 31, 2013 (in thousands, except per share amounts):
Future | No Future | Future | No Future | |||||||||||||
Service | Service | Service | Service | |||||||||||||
Required | Required | Required | Required | |||||||||||||
Balance at January 1, 2013 | – | – | $ | – | $ | – | ||||||||||
Converted in connection with the Jefferies acquisition | 5,167 | 9,527 | $ | 26.90 | $ | 26.90 | ||||||||||
Grants | – | 145 | $ | – | $ | 24.32 | ||||||||||
Distributions of underlying shares | – | (1,603 | ) | $ | – | $ | 26.90 | |||||||||
Forfeited | (106 | ) | (21 | ) | $ | 26.90 | $ | 26.83 | ||||||||
Fulfillment of service requirement | (268 | ) | 268 | $ | 26.90 | $ | 26.90 | |||||||||
Balance at December 31, 2013 | 4,793 | 8,316 | $ | 26.90 | $ | 26.86 | ||||||||||
At December 31, 2013, grants includes approximately 82,000 dividend equivalents declared on RSUs with no future service requirement; the weighted average grant date fair value of the dividend equivalents was approximately $22.34.
Directors' Plan. Under our Directors' Plan, we will issue each nonemployee director of Leucadia $120,000 of restricted stock. These grants will be made on the date directors are elected or reelected at our annual shareholders' meeting. These shares vest three years after the date of grant and are expensed over the requisite service period. At December 31, 2013, 256,000 common shares are issuable upon settlement of deferred shares granted in previous years and 484,000 shares are available for future grants.
Additionally, the Directors' Plan permits each nonemployee director to elect to be paid annual retainer fees, meeting fees and fees for service as chairman of a Board committee in the form of cash, deferred cash or deferred shares. If deferred cash is elected, interest is credited to such deferred cash at the prime interest rate in effect at the date of each annual meeting of stockholders. If deferred shares are elected, dividend equivalents equal to dividends declared and paid on our common stock are credited to a director's account and reinvested as additional deferred shares.
Other Stock-Based Plans. Historically, Jefferies also sponsored an Employee Stock Purchase Plan and an Employee Stock Ownership Plan, both of which were assumed by us in connection with the Jefferies acquisition. Amounts related to these plans have not been significant.
Restricted Cash Awards. Jefferies provides compensation to new and existing employees in the form of loans and/or other cash awards which are subject to ratable vesting terms with service requirements ranging from one to eight years, with an approximate average term of three years. These awards are amortized to compensation expense over the relevant service period. At December 31, 2013, the remaining unamortized amount of these awards was $185.0 million and is included within Other assets in the Consolidated Statements of Financial Condition.
Preferred Shares. At December 31, 2013 and 2012, 6,000,000 of preferred shares (redeemable and non-redeemable), par value $1 per share, were authorized and not issued.
F-50
Note 21. Accumulated Other Comprehensive Income |
Activity in accumulated other comprehensive income is reflected in the Consolidated Statements of Comprehensive Income (Loss) and Consolidated Statements of Changes in Equity but not in the Consolidated Statements of Operations. A summary of accumulated other comprehensive income, net of taxes at December 31, 2013, 2012 and 2011 is as follows (in thousands):
2013 | 2012 | 2011 | ||||||||||
Net unrealized gains on available for sale securities | $ | 589,393 | $ | 803,430 | $ | 998,151 | ||||||
Net unrealized foreign exchange gains (losses) | 16,803 | (6,097 | ) | (3,168 | ) | |||||||
Net unrealized losses on derivative instruments | (169 | ) | (154 | ) | – | |||||||
Net minimum pension liability | (67,977 | ) | (92,050 | ) | (83,537 | ) | ||||||
Net postretirement benefit | – | – | 975 | |||||||||
| $ | 538,050 | $ | 705,129 | $ | 912,421 | |||||||
For the year ended December 31, 2013, significant amounts reclassified out of accumulated other comprehensive income to net income (loss) are as follows (in thousands):
Details about Accumulated Other Comprehensive Income Components | Amount Reclassified from Accumulated Other Comprehensive Income | Affected Line Item in the Consolidated Statement of Operations | |||
Net unrealized gains (losses) on | Net realized securities gains | ||||
available for sale securities, net of | |||||
income tax provision (benefit) of $118,292 | $ | 213,058 | |||
Amortization of defined benefit | Compensation and benefits, which | ||||
pension plan actuarial gains (losses), | includes pension expense. See the | ||||
net of income tax provision (benefit) | pension footnote for information on | ||||
of $(2,665) | (4,799 | ) | this component. | ||
Total reclassifications for the period, | |||||
net of tax | $ | 208,259 | |||
Note 22. Pension Plans and Postretirement Benefits
U.S. Pension Plans
Pursuant to the agreement to sell one of our former subsidiaries, WilTel Communications Group, Inc. the responsibility for WilTel's defined benefit pension plan was retained by us. All benefits under this plan were frozen as of the date of sale. Prior to the acquisition of Jefferies, Jefferies sponsored a defined benefit pension plan covering certain employees; benefits under that plan were frozen as of December 31, 2005.
A summary of activity with respect to both plans is as follows (in thousands):
F-51
2013 | 2012 | |||||||
Change in projected benefit obligation: | ||||||||
Projected benefit obligation, beginning of year | $ | 275,858 | $ | 251,949 | ||||
Projected benefit obligation of Jefferies plan at March 1, 2013 | 51,599 | – | ||||||
Interest cost | 12,286 | 10,886 | ||||||
Actuarial (gains) losses | (36,197 | ) | 19,315 | |||||
Benefits paid | (8,502 | ) | (6,292 | ) | ||||
Projected benefit obligation, end of year | $ | 295,044 | $ | 275,858 | ||||
Change in plan assets: | ||||||||
Fair value of plan assets, beginning of year | $ | 194,314 | $ | 188,876 | ||||
Jefferies plan assets at March 1, 2013 | 41,290 | – | ||||||
Actual return on plan assets | 6,454 | 8,726 | ||||||
Employer contributions | 6,475 | 3,728 | ||||||
Benefits paid | (8,502 | ) | (6,292 | ) | ||||
Administrative expenses | (951 | ) | (724 | ) | ||||
Fair value of plan assets, end of year | $ | 239,080 | $ | 194,314 | ||||
Funded status at end of year | $ | (55,964 | ) | $ | (81,544 | ) | ||
As of December 31, 2013 and 2012, $78.8 million and $118.2 million, respectively, of the net amount recognized in the consolidated balance sheet was reflected as a charge to accumulated other comprehensive income (loss) (substantially all of which were cumulative losses) and $56.0 million and $81.5 million, respectively, was reflected as accrued pension cost.
The following table summarizes the components of net periodic pension cost and other amounts recognized in other comprehensive income (loss) excluding taxes (in thousands):
2013 | 2012 | 2011 | ||||||||||
Components of net periodic pension cost: | ||||||||||||
Interest cost | $ | 12,286 | $ | 10,886 | $ | 11,233 | ||||||
Expected return on plan assets | (9,746 | ) | (8,292 | ) | (6,091 | ) | ||||||
Actuarial losses | 7,464 | 5,852 | 2,659 | |||||||||
Net periodic pension cost | $ | 10,004 | $ | 8,446 | $ | 7,801 | ||||||
Amounts recognized in other comprehensive income (loss): | ||||||||||||
Net (gain) loss arising during the period | $ | (31,952 | ) | $ | 19,604 | $ | 38,989 | |||||
Amortization of net loss | (7,464 | ) | (5,852 | ) | (2,659 | ) | ||||||
Total recognized in other comprehensive income (loss) | $ | (39,416 | ) | $ | 13,752 | $ | 36,330 | |||||
Net amount recognized in net periodic benefit cost and other | ||||||||||||
comprehensive income (loss) | $ | (29,412 | ) | $ | 22,198 | $ | 44,131 | |||||
The amounts in accumulated other comprehensive income (loss) at the end of each year have not yet been recognized as components of net periodic pension cost in the Consolidated Statements of Operations. The estimated net loss that will be amortized from accumulated other comprehensive income (loss) into net periodic benefit cost in 2014 is $4.3 million.
No employer contributions are expected to be paid in 2014.
We use a December 31 measurement date for the WilTel plan and a November 30 date for the Jefferies plan. The assumptions used are as follows:
F-52
2013 | 2012 | |||||||
WilTel Plan | ||||||||
Discount rate used to determine benefit obligation | 4.71 | % | 3.85 | % | ||||
Weighted-average assumptions used to determine | ||||||||
net pension cost: | ||||||||
Discount rate | 3.85 | % | 4.40 | % | ||||
Expected long-term return on plan assets | 4.00 | % | 4.25 | % | ||||
Jefferies Plan | ||||||||
Discount rate used to determine benefit obligation | 5.10 | % | – | |||||
Weighted-average assumptions used to determine | ||||||||
net pension cost: | ||||||||
Discount rate | 5.10 | % | – | |||||
Expected long-term return on plan assets | 6.75 | % | – | |||||
The following pension benefit payments are expected to be paid (in thousands):
2014 | $ | 6,329 | ||
2015 | 7,952 | |||
2016 | 11,072 | |||
2017 | 11,149 | |||
2018 | 10,888 | |||
2019 – 2023 | 90,590 |
U.S. Plan Assets
The information below on the plan assets for the WilTel plan and the Jefferies plan is presented separately for the plans as the investments are managed independently. Cash equivalents are valued at cost, which approximates fair value and are categorized in Level 1 of the fair value hierarchy. The estimated fair values for securities measured using Level 1 inputs are determined using publicly quoted market prices in active markets for identical assets. Certain fixed income securities are measured using Level 2 inputs. Although these securities trade in brokered markets, the market for certain securities is sometimes inactive. Valuation inputs include benchmark yields, reported trades, broker dealer quotes, issuer spreads, two sided markets, benchmark securities, bids, offers, reference data, and industry and economic events. Neither plan had any assets classified within Level 3 of the fair value hierarchy.
WilTel Plan Assets. At December 31, 2013, the WilTel plan assets at fair value consisted of the following (all of which were classified as Level 1) (in thousands):
Total | ||||
Cash and cash equivalents | $ | 20,075 | ||
Fixed income securities: | ||||
U.S. Government and agencies | 4,860 | |||
Public utilities | 13,243 | |||
All other corporates | 153,486 | |||
Total | $ | 191,664 | ||
At December 31, 2012, the WilTel plan assets at fair value consisted of the following (in thousands):
Fair Value Measurements Using | ||||||||||||
Total | Level 1 | Level 2 | ||||||||||
Cash and cash equivalents | $ | 21,493 | $ | 21,493 | $ | – | ||||||
Fixed income securities: | ||||||||||||
U.S. Government and agencies | 4,522 | 4,522 | – | |||||||||
Public utilities | 7,490 | 7,490 | – | |||||||||
Foreign governments | 2,253 | 2,253 | – | |||||||||
All other corporates | 158,556 | 157,492 | 1,064 | |||||||||
Total | $ | 194,314 | $ | 193,250 | $ | 1,064 | ||||||
F-53
The current investment objectives are designed to minimize investment losses due to rising interest rates while providing a stable and predictable stream of investment income. To further mitigate investment losses, we have placed certain investment restrictions and limitations over plan assets. The restrictions and limitations include the following:
· | Plan assets are split into three separate portfolios, each with different duration and asset mixes. The Investment Grade ("IG") portfolio consists of investment grade fixed income corporate bonds with a maximum portfolio duration of 5 years. The Fixed Income ("FI") portfolio consists of short and medium term investment grade bonds, government instruments, and cash and cash equivalents with a maximum portfolio duration of 2 years. The High Yield ("HY") portfolio consists of below investment grade corporate bonds with a maximum portfolio duration of 5 years. |
· | Fixed income securities held within the IG and FI portfolios will all be rated BBB- or better at the time of purchase, there will be no more than 5% at market in any one security (U.S. government and agency positions excluded), no more than a 30-year maturity in any one security and investments in standard collateralized mortgage obligations are limited to securities that are currently paying interest, receiving principal, do not contain leverage and are limited to 10% of the market value of the portfolio. Securities purchased or held within the HY portfolio will all be rated B- or higher. However, the portfolio can hold up to 10% in CCC rated bonds that may result from credit downgrades. |
The FI portfolio is managed to maximize the value of plan assets by minimizing exposure to changes in market interest rates while the IG and HY portfolios are managed to enhance investment income with a focus on minimizing credit losses and changes in market interest rates. This investment strategy provides us with more flexibility in managing the plan should interest rates rise and result in a decrease in the discounted value of benefit obligations.
To develop the assumption for the expected long-term rate of return on plan assets, we considered the following underlying assumptions: 2.25% current expected inflation, 1.5% to 2.5% real rate of return for short duration risk-free investments, 0.2% inflation risk premium and 0.75% default risk premium for the portion of the portfolio invested in corporate bonds. We then weighted these assumptions based on invested assets and assumed that investment expenses were offset by expected returns in excess of benchmarks, which resulted in the selection of the 4.0% expected long-term rate of return assumption for 2013.
Jefferies Plan Assets. At December 31, 2013, the Jefferies plan assets at fair value consisted of the following (in thousands):
Fair Value Measurements Using | ||||||||||||
Total | Level 1 | Level 2 | ||||||||||
Cash and cash equivalents | $ | 931 | $ | 931 | $ | – | ||||||
Listed equity securities | 27,663 | 27,663 | – | |||||||||
Fixed income securities: | ||||||||||||
Corporate debt securities | 7,743 | – | 7,743 | |||||||||
Foreign corporate debt securities | 1,140 | – | 1,140 | |||||||||
U.S. Government securities | 4,055 | 4,055 | – | |||||||||
Agency mortgage-backed securities | 3,949 | – | 3,949 | |||||||||
Commercial mortgage-backed securities | 1,280 | – | 1,280 | |||||||||
Asset-backed securities | 461 | – | 461 | |||||||||
Other | 194 | – | 194 | |||||||||
Total | $ | 47,416 | $ | 32,649 | $ | 14,767 | ||||||
Assets in the plan are invested under guidelines adopted by the plan's administrative committee. Because the plan exists to provide a vehicle for funding future benefit obligations, the investment objectives of the portfolio take into account the nature and timing of future plan liabilities. The policy recognizes that the portfolio's long-term investment performance and its ability to meet the plan's overall objectives are dependent on the strategic asset allocation which includes adequate diversification among assets classes.
The target allocation of plan assets for 2014 is approximately 50% equities and 50% fixed income securities. The target asset allocation was determined based on the risk tolerance characteristics of the plan and, at times, may be adjusted to achieve the plan's investment objective and to minimize any concentration of investment risk. The plan's administrative committee evaluates the asset allocation strategy and adjusts the allocation if warranted based upon market conditions and the impact of the investment strategy on future contribution requirements. The expected long-term rate of return assumption is based on an analysis of historical experience of the portfolio and the summation of prospective returns for each asset class in proportion to the fund's current asset allocation.
F-54
The equity portfolio may invest up to 5% of the market value of the portfolio in any one company and may invest up to 10% of the market value of the portfolio in any one sector or up to two times the percentage weighting of any one sector as defined by the S&P 500 or the Russell 1000 Value indices, whichever is higher. Permissible investments specified under the equity portfolio of the plan include equity securities of U.S. and non-U.S. incorporated entities and private placement securities issued pursuant to Rule 144A. At least 75% of the market value of the fixed income portfolio must be invested in investment grade securities rated BBB-/Baa3, including cash and cash equivalents. Permissible investments specified under the fixed income portfolio of the plan include: public or private debt obligations issued or guaranteed by U.S. or foreign issuers; preferred, hybrid, mortgage or asset-backed securities; senior loans; and derivatives and foreign currency exchange contracts.
German Pension Plan
In connection with the acquisition of Jefferies Bache from Prudential in 2011, Jefferies acquired a defined benefits pension plan located in Germany for the benefit of eligible employees of Jefferies Bache in that territory. The German pension plan has no plan assets and is therefore unfunded; however, Jefferies has purchased insurance contracts from multi-national insurers held in the name of Jefferies Bache Limited to provide for the plan's future obligations. The investments in these insurance contracts are included in Financial Instruments owned - Trading assets in the Consolidated Statement of Financial Condition in the amount of $19.7 million at December 31, 2013. Jefferies expects to pay the pension liability from the cash flows available to it under the insurance contracts. All costs relating to the plan (including insurance premiums and other costs as computed by the insurers) are paid by Jefferies. In connection with the acquisition, Prudential agreed that any insurance premiums and funding obligations related to pre-acquisition date service will be reimbursed to Jefferies by Prudential.
The provisions and assumptions used in the German pension plan are based on local conditions in Germany. Jefferies did not contribute to the plan during the year ended December 31, 2013.
The following tables summarize the changes in the projected benefit obligation and the components of net periodic pension cost for the period from the acquisition of Jefferies to December 31, 2013 (in thousands):
2013 | ||||
Change in projected benefit obligation: | ||||
Projected benefit obligation at March 1, 2013 | $ | 24,494 | ||
Service cost | 51 | |||
Interest cost | 685 | |||
Actuarial losses | 1,002 | |||
Currency adjustment | 1,053 | |||
Benefits paid | (917 | ) | ||
Projected benefit obligation, end of year | $ | 26,368 | ||
Components of net periodic pension cost: | ||||
Service cost | $ | 51 | ||
Interest cost | 685 | |||
Net amortization | 179 | |||
Net periodic pension cost | $ | 915 | ||
The amount in accumulated other comprehensive income at December 31, 2013 is a charge of $1.0 million. The following are assumptions used to determine the actuarial present value of the projected benefit obligation and net periodic pension benefit cost for the period from the acquisition of Jefferies to December 31, 2013:
2013 | ||||
Projected benefit obligation | ||||
Discount rate | 3.40 | % | ||
Rate of compensation increase | 3.00 | % | ||
Net periodic pension benefit cost | ||||
Discount rate | 3.60 | % | ||
Rate of compensation increase | 3.00 | % | ||
F-55
The following pension benefit payments are expected to be paid (in thousands):
2014 | $ | 1,374 | ||
2015 | 1,399 | |||
2016 | 1,417 | |||
2017 | 1,395 | |||
2018 | 1,391 | |||
2019 – 2023 | 7,908 |
Other
We have defined contribution pension plans covering certain employees. Contributions and costs are a percent of each covered employee's salary. Amounts charged to expense related to such plans were $6.3 million, $2.8 million and $2.2 million for the years ended December 31, 2013, 2012 and 2011, respectively.
We provide certain health care and other benefits to certain retired employees under plans which are currently unfunded. We pay the cost of postretirement benefits as they are incurred. Accumulated postretirement benefit obligations and amounts recognized in the consolidated statements of operations and in accumulated other comprehensive income (loss) were not significant.
Note 23. Income Taxes
The principal components of deferred taxes at December 31, 2013 and 2012 are as follows (in thousands):
2013 | 2012 | |||||||
Deferred Tax Asset: | ||||||||
NOL carryover | $ | 1,283,947 | $ | 1,332,510 | ||||
Compensation | 400,002 | – | ||||||
Long-term debt | 184,669 | – | ||||||
Other assets | 118,914 | 60,687 | ||||||
Securities valuation reserves | 51,597 | 43,613 | ||||||
Intangible assets, net and goodwill | 17,349 | 18,062 | ||||||
Other liabilities | 49,074 | 58,067 | ||||||
| 2,105,552 | 1,512,939 | |||||||
Valuation allowance | (132,607 | ) | (109,181 | ) | ||||
| 1,972,945 | 1,403,758 | |||||||
Deferred Tax Liability: | ||||||||
Unrealized gains on investments | (23,851 | ) | (175,801 | ) | ||||
Amortization of intangible assets | (98,798 | ) | – | |||||
Property and equipment | (3,822 | ) | (10,770 | ) | ||||
Other | (36,531 | ) | (2,572 | ) | ||||
| (163,002 | ) | (189,143 | ) | |||||
Net deferred tax asset | $ | 1,809,943 | $ | 1,214,615 | ||||
As of December 31, 2013, we have consolidated U.S. federal NOLs of $1.2 billion that may be used to offset the taxable income of any member of our consolidated tax group. In addition, we have $2.2 billion of U.S. federal NOLs that are only available to offset the taxable income of certain subsidiaries. Unused federal NOLs do not begin to expire until 2021, except for certain NOLs that begin to expire sooner but are fully reserved for in the valuation allowance. Approximately $640.0 million of our NOLs can be used to fully offset federal minimum taxable income, and no federal regular or minimum income tax would be payable on such income. We have various state NOLs that expire at different times, which are reflected in the above table to the extent our estimate of future taxable income will be apportioned to those states. We have gross foreign net operating loss carryforwards of approximately $89.1 million. There is a full valuation allowance on all foreign net operating loss carryforwards except for those in the United Kingdom, which can be carried forward indefinitely. Uncertainties that may affect the utilization of our tax attributes include future operating results, tax law changes, rulings by taxing authorities regarding whether certain transactions are taxable or deductible and expiration of carryforward periods.
Under certain circumstances, the ability to use the NOLs and future deductions could be substantially reduced if certain changes in ownership were to occur. In order to reduce this possibility, our certificate of incorporation includes a charter restriction that prohibits transfers of our common stock under certain circumstances.
F-56
At December 31, 2013, we had approximately $134.0 million of earnings attributable to foreign subsidiaries for which no U.S. federal income tax provision has been recorded because these earnings are permanently invested abroad. Accordingly, a deferred tax liability of approximately $35.0 million has not been recorded with respect to these earnings.
The provision for income taxes for continuing operations for each of the three years in the period ended December 31, 2013 was as follows (in thousands):
2013 | 2012 | 2011 | ||||||||||
State income taxes | $ | 32,917 | $ | 35,489 | $ | 10,653 | ||||||
Federal income taxes: | ||||||||||||
Current | 2,900 | 1,001 | - | |||||||||
Deferred | 56,433 | 482,163 | 28,598 | |||||||||
Increase in valuation allowance | 12,287 | - | - | |||||||||
Foreign income taxes | 6,204 | 12,500 | 23,147 | |||||||||
| $ | 110,741 | $ | 531,153 | $ | 62,398 | |||||||
For the year ended December 31, 2013, we increased our valuation allowance to reserve for a portion of our net deferred tax asset for state income taxes, resulting from the change in our expected state tax filings as a result of the Jefferies acquisition. In addition, the valuation allowance increased by $11.1 million as a result of the valuation allowance required for Jefferies net deferred tax assets at the date of acquisition.
The table below reconciles the expected statutory federal income tax to the actual income tax provision (benefit) (in thousands):
2013 | 2012 | 2011 | ||||||||||
Expected federal income tax | $ | 165,215 | $ | 496,399 | $ | 33,363 | ||||||
State income taxes, net of federal income tax benefit | 21,396 | 24,120 | 7,781 | |||||||||
Increase in valuation allowance | 12,287 | - | - | |||||||||
Tax expense not provided on income recorded on the Jefferies | ||||||||||||
investment prior to the acquisition | (63,952 | ) | - | - | ||||||||
Reversal of prior years' deferred tax liability related to Jefferies investment | (33,972 | ) | - | - | ||||||||
Accounting expense for warrants in excess of tax deduction | - | - | 7,141 | |||||||||
Foreign rate differential | (4,750 | ) | - | - | ||||||||
Permanent differences | 12,832 | 2,921 | (2,593 | ) | ||||||||
Foreign taxes | 4,033 | 8,125 | 15,044 | |||||||||
Other | (2,348 | ) | (412 | ) | 1,662 | |||||||
Actual income tax provision | $ | 110,741 | $ | 531,153 | $ | 62,398 | ||||||
As discussed above, we elected the fair value option for our investment in Jefferies for periods prior to the Jefferies acquisition in March 2013. As of December 31, 2012, we had recorded a deferred tax liability related to our investment in Jefferies; as reflected in the table above, the income tax provision includes the reversal of that deferred tax liability for the year ended December 31, 2013. Since there was no net income tax provision recorded for income related to the fair value option for Jefferies for the year ended December 31, 2013, our effective tax rate was lower as a result of the acquisition, and the impact on the tax provision is reflected in the table above.
F-57
The following table reconciles the total amount of unrecognized tax benefits as of the beginning and end of the periods presented (in thousands):
Unrecognized | ||||||||||||
Tax Benefits | Interest | Total | ||||||||||
As of January 1, 2011 | $ | 6,340 | $ | 2,980 | $ | 9,320 | ||||||
Interest expense recognized | - | 500 | 500 | |||||||||
Audit payments | - | - | - | |||||||||
Reductions as a result of the lapse of the statute of | ||||||||||||
limitations | - | - | - | |||||||||
Balance, December 31, 2011 | 6,340 | 3,480 | 9,820 | |||||||||
Increases based on tax positions related to current period | 5,250 | - | 5,250 | |||||||||
Interest expense recognized | - | 700 | 700 | |||||||||
Audit payments | - | - | - | |||||||||
Reductions as a result of the lapse of the statute of | ||||||||||||
limitations | - | - | - | |||||||||
Balance, December 31, 2012 | 11,590 | 4,180 | 15,770 | |||||||||
Jefferies amounts at date of acquisition | 129,010 | 17,100 | 146,110 | |||||||||
Increases based on tax positions related to current period | 8,750 | - | 8,750 | |||||||||
Increases based on tax positions related to prior periods | 14,780 | - | 14,780 | |||||||||
Decreases based on tax positions related to prior periods | (18,300 | ) | - | (18,300 | ) | |||||||
Interest expense recognized | - | 7,000 | 7,000 | |||||||||
Audit payments | (310 | ) | (110 | ) | (420 | ) | ||||||
Reductions as a result of the lapse of the statute of | ||||||||||||
limitations | - | - | - | |||||||||
Balance, December 31, 2013 | $ | 145,520 | $ | 28,170 | $ | 173,690 | ||||||
The statute of limitations with respect to our federal income tax returns has expired for all years through 2009. Our New York State and New York City income tax returns are currently being audited for the 2009 to 2011 period. Prior to becoming a wholly-owned subsidiary, Jefferies filed a consolidated U.S. federal income tax return with its qualifying subsidiaries and was subject to income tax in various states, municipalities and foreign jurisdictions. Jefferies is currently under examination by the Internal Revenue Service and other major tax jurisdictions. The statute of limitations with respect to Jefferies federal income tax returns has expired for all years through 2005.
We do not expect that resolution of these examinations will have a significant effect on our consolidated financial position, but could have a significant impact on the consolidated results of operations for the period in which resolution occurs. Over the next twelve months, we believe it is reasonably possible that various tax examinations will be concluded and statutes of limitation will expire which would have the effect of reducing the balance of unrecognized tax benefits by $3.6 million. If recognized, the total amount of unrecognized tax benefits reflected in the table above would lower our effective income tax rate.
Note 24. Net Realized Securities Gains (Losses)
The following summarizes net realized securities gains (losses) for each of the three years in the period ended December 31, 2013 (in thousands):
2013 | 2012 | 2011 | ||||||||||
Net realized gains on securities | $ | 245,262 | $ | 592,978 | $ | 644,777 | ||||||
Write-down of investments (a) | (1,621 | ) | (2,461 | ) | (3,586 | ) | ||||||
Net unrealized gains (losses) on trading securities | 316 | 64 | 285 | |||||||||
| $ | 243,957 | $ | 590,581 | $ | 641,476 | |||||||
(a) | Consists of provisions to write down investments resulting from declines in fair values believed to be other than temporary. |
F-58
During 2006 and 2007, we invested an aggregate of $452.2 million in Fortescue Metals Group Ltd's Pilbara iron ore and infrastructure project in Western Australia. In exchange for our cash investment, we received 278 million common shares of Fortescue and a $100.0 million unsecured note issued by Fortescue's subsidiary, Chichester Metals Pty Ltd, that accrued interest at 4% of the revenue, net of government royalties, invoiced from the iron ore produced from certain project areas (the "FMG Note"). We sold our Fortescue common shares during 2010 to 2012, recognizing net realized security gains on the sales of $543.7 million and $628.2 million for the years ended December 31, 2012 and 2011, respectively.
During the fourth quarter of 2012, Chichester redeemed the FMG Note for aggregate cash consideration of $715.0 million, resulting in the recognition in investment and other income of a pre-tax gain of $526.2 million, and the parties agreed to settle all pending litigation and disputes without any additional payment. As a result, we no longer receive interest payments on the FMG Note.
We have received aggregate cash proceeds in excess of its Fortescue investment of $2.313 billion, which reflects all sales of Fortescue common shares, interest collected on the FMG Note (net of withholding taxes), the redemption of the FMG Note, expenses and the cost of its investment.
Net realized gains on securities during 2013 include a gain of $227.6 million related to our exchange of Inmet shares for First Quantum shares and cash as discussed above.
Proceeds from sales of investments classified as available for sale were $1.8 billion, $1.4 billion and $4.2 billion during 2013, 2012 and 2011, respectively. Gross gains of $240.4 million, $546.4 million and $638.9 million and gross losses of $1.7 million, $.7 million and $5.2 million were realized on these sales during 2013, 2012 and 2011, respectively.
Note 25. Other Results of Operations Information
Other income for each of the three years in the period ended December 31, 2013 consists of the following (in thousands):
2013 | 2012 | 2011 | ||||||||||
Manufacturing revenues | $ | 310,624 | $ | 252,752 | $ | 244,918 | ||||||
Dividend income | 5,553 | 5,954 | 18,359 | |||||||||
Income from associated companies classified as other revenues | 92,180 | – | – | |||||||||
Income from FMG Note including gain recognized on redemption | – | 642,993 | 214,455 | |||||||||
Gain on forgiveness of debt | – | – | 81,848 | |||||||||
Government grants reimbursement | 3,745 | 747 | 5,366 | |||||||||
Rental income | 13,158 | 11,725 | 11,126 | |||||||||
Winery revenues | 8,301 | 47,801 | 38,161 | |||||||||
Other | 55,676 | 21,677 | 29,764 | |||||||||
| $ | 489,237 | $ | 983,649 | $ | 643,997 | |||||||
Other income for the other operations segment includes government grants that reimbursed us for certain of our prior expenditures related to energy projects, which were fully expensed as incurred.
Taxes, other than income or payroll, amounted to $17.0 million, $10.7 million and $4.2 million for the years ended December 31, 2013, 2012 and 2011, respectively.
Advertising costs amounted to $14.6 million, $12.4 million and $0.7 million for the years ended December 31, 2013, 2012 and 2011, respectively.
F-59
Note 26. Earnings (Loss) Per Common Share
Basic and diluted earnings (loss) per share amounts were calculated by dividing net income (loss) by the weighted average number of common shares outstanding. The numerators and denominators used to calculate basic and diluted earnings (loss) per share are as follows for the years ended December 31, 2013, 2012 and 2011 (in thousands):
2013 | 2012 | 2011 | ||||||||||
Numerator for earnings (loss) per share: | ||||||||||||
Net income attributable to Leucadia | ||||||||||||
National Corporation common shareholders | $ | 369,240 | $ | 854,466 | $ | 25,231 | ||||||
Less: Allocation of earnings to participating securities (1) | (4,919 | ) | – | – | ||||||||
Net income attributable to Leucadia | ||||||||||||
National Corporation common shareholders for | ||||||||||||
basic earnings (loss) per share | 364,321 | 854,466 | 25,231 | |||||||||
Less: Adjustment to allocation of earnings to participating securities related to diluted shares (1) | (110 | ) | – | – | ||||||||
Mandatorily redeemable convertible preferred share | ||||||||||||
dividends | 3,397 | – | – | |||||||||
Interest on 3.75% Convertible Notes | 2,635 | 2,626 | – | |||||||||
Net income attributable to Leucadia | ||||||||||||
National Corporation common shareholders for | ||||||||||||
diluted earnings (loss) per share | $ | 370,243 | $ | 857,092 | $ | 25,231 | ||||||
Denominator for earnings (loss) per share: | ||||||||||||
Denominator for basic earnings (loss) per share – | ||||||||||||
weighted average shares | 339,673 | 244,583 | 244,425 | |||||||||
Stock options | 55 | – | 73 | |||||||||
Warrants | – | – | 75 | |||||||||
Mandatorily redeemable convertible preferred shares | 3,468 | – | – | |||||||||
3.875% Convertible Senior Debentures | – | – | – | |||||||||
3.75% Convertible Notes | 4,538 | 4,331 | – | |||||||||
Denominator for diluted earnings (loss) per share | 347,734 | 248,914 | 244,573 | |||||||||
(1) | Represents dividends declared during the period on participating securities plus an allocation of undistributed earnings to participating securities. Net losses are not allocated to participating securities. Participating securities represent restricted stock and RSUs for which requisite service has not yet been rendered and amounted to weighted average shares of 9,353,400 for the year ended December 31, 2013. Dividends declared on participating securities during the year ended December 31, 2013 were $2.8 million. Undistributed earnings are allocated to participating securities based upon their right to share in earnings if all earnings for the period had been distributed. |
Options to purchase 1,711,096, 2,280,711 and 1,639,375 weighted-average shares of common stock were outstanding during the years ended December 31, 2013, 2012 and 2011, respectively, but were not included in the computation of diluted per share amounts as the effect was antidilutive.
For each year in the table above, the denominator for diluted earnings (loss) per share does not include weighted-average common shares of 4,000,000 related to outstanding warrants to purchase common shares at $33.33 per share, as the effect was antidilutive.
For the year ended December 31, 2013, shares related to the 3.875% Convertible Senior Debentures were not included in the computation of diluted per share amounts as the conversion price exceeded the average market price. For the year ended December 31, 2011, 4,283,518 shares related to the 3.75% Convertible Notes were not included in the computation of diluted per share amounts as the effect was antidilutive.
Note 27. Commitments, Contingencies and Guarantees
Commitments
We and our subsidiaries rent office space and office equipment under noncancellable operating leases with terms varying principally from one to thirty years. Rental expense (net of sublease rental income) was $64.6 million, $19.7 million and $6.3 million for the years ended December 31, 2013, 2012 and 2011, respectively. Future minimum annual rentals (exclusive of month-to-month leases, real estate taxes, maintenance and certain other charges) under these leases at December 31, 2013 are as follows (in thousands):
F-60
2014 | $ | 100,401 | ||
2015 | 78,271 | |||
2016 | 76,532 | |||
2017 | 70,639 | |||
2018 | 62,518 | |||
Thereafter | 451,756 | |||
| 840,117 | ||||
Less: sublease income | (50,042 | ) | ||
| $ | 790,075 |
Effective December 30, 2004, National Beef finalized an agreement with the City of Dodge City, Kansas, whereby in consideration of certain improvements made to the city water and wastewater systems, National Beef committed to make a series of service charge payments totaling $19.3 million over a 20 year period, of which $8.3 million remains as of December 31, 2013. Payments under the commitment will be approximately $0.8 million in each of the years 2014 through 2017, with the remaining balance of $5.1 million to be paid in subsequent years.
National Beef makes verbal commitments to cattle producers to purchase cattle approximately one week in advance of delivery of those cattle to its plants. The actual value paid for these cattle is determined after the cattle are delivered, weighed and inspected at National Beef's facilities. The total value of verbal commitments to purchase cattle as of December 31, 2013 was $110.1 million.
All of Linkem's outstanding shares, including the shares owned by us, are pledged as collateral for its bank credit line, which was fully drawn at December 31, 2013.
The following table summarizes Jefferies commitments associated with certain business activities (in millions):
Expected Maturity Date | ||||||||||||||||||||||||
2014 | 2015 | 2016 and 2017 | 2018 and 2019 | 2020 and Later | Maximum Payout | |||||||||||||||||||
Equity commitments (1) | $ | 1.8 | $ | 7.4 | $ | 0.8 | $ | – | $ | 418.2 | $ | 428.2 | ||||||||||||
Loan commitments (1) | 33.2 | 19.0 | 322.6 | 92.8 | – | 467.6 | ||||||||||||||||||
Mortgage-related commitments | 819.9 | 492.9 | 202.8 | – | – | 1,515.6 | ||||||||||||||||||
Forward starting reverse repos and repos | 702.3 | – | – | – | – | 702.3 | ||||||||||||||||||
| $ | 1,557.2 | $ | 519.3 | $ | 526.2 | $ | 92.8 | $ | 418.2 | $ | 3,113.7 | |||||||||||||
(1) | Equity and loan commitments are presented by contractual maturity date. The amounts are however available on demand. |
The table below presents Jefferies credit exposure from loan commitments, including funded amounts, summarized by period of expiration. Credit exposure is based on the external credit ratings of the underlying or referenced assets of the loan commitments. Since commitments associated with these business activities may expire unused, they do not necessarily reflect the actual future cash funding requirements (in millions):
Credit Ratings | 0 - 12 Months | 1 - 5 Years | Greater Than 5 Years | Total Corporate Lending Exposure (1) | Corporate Lending Exposure at Fair Value (2) | Corporate Lending Commitments (3) | ||||||||||||||||||
Non-investment grade | $ | – | $ | 79.1 | $ | – | $ | 79.1 | $ | 9.5 | $ | 69.6 | ||||||||||||
Unrated | 35.6 | 669.1 | – | 704.7 | 306.7 | 398.0 | ||||||||||||||||||
Total | $ | 35.6 | $ | 748.2 | $ | – | $ | 783.8 | $ | 316.2 | $ | 467.6 | ||||||||||||
(1) | Total corporate lending exposure represents the potential loss assuming the fair value of funded loans and lending commitments were zero. |
(2) | The corporate lending exposure at fair value includes $321.1 million of funded loans included in Trading assets and a $4.9 million net liability related to lending commitments recorded in Trading liabilities in the Consolidated Statement of Financial Condition. |
(3) | Amounts represent the notional amount of unfunded lending commitments. |
F-61
Equity Commitments. Jefferies has commitments to invest $600.0 million and $291.0 million in Jefferies Finance and Jefferies LoanCore, and has funded $337.3 million and $175.5 million, respectively. See Note 12 for additional information regarding these investments.
Jefferies has committed to invest $5.9 million in Jefferies Capital Partners LLC, the manager of Jefferies Capital Partners IV L.P., Jefferies Capital Partners V L.P. and a related parallel fund, the SBI USA Fund (Jefferies Capital Partners V L.P. and the SBI USA Fund are collectively "Fund V"), of which Jefferies has funded approximately $1.0 million of its commitment.
Jefferies has committed to invest in aggregate up to $85.0 million in Fund V, private equity funds managed by a team led by Brian Friedman, our President and a Director, comprised of up to $75.0 million in the SBI USA Fund and $10.0 million in Jefferies Capital Partners V L.P, of which Jefferies has funded approximately $47.0 million and $6.3 million of its commitments to the SBI USA Fund and Jefferies Capital Partners V L.P., respectively, leaving approximately $31.7 million unfunded in aggregate.
Jefferies has committed to invest up to $45.9 million in Jefferies Capital Partners IV L.P. and $3.1 million in JCP IV LLC, the General Partner of Jefferies Capital Partners IV L.P. and has funded approximately $38.7 million and $2.3 million of its commitments to Jefferies Capital Partners IV L.P. and JCP IV LLC, respectively, leaving approximately $8.0 million unfunded in aggregate.
Jefferies had other equity commitments to invest up to $30.8 million in various other investments of which $5.4 million remained unfunded.
Loan Commitments. From time to time Jefferies makes commitments to extend credit to investment banking and other clients in loan syndication, acquisition finance and securities transactions. These commitments and any related drawdowns of these facilities typically have fixed maturity dates and are contingent on certain representations, warranties and contractual conditions applicable to the borrower. Jefferies has $241.4 million of outstanding loan commitments to clients.
Jefferies and MassMutual have entered into a Secured Revolving Credit Facility, to be funded equally, to support loan underwritings by Jefferies Finance. At December 31, 2013, the Secured Revolving Credit Facility of $700.0 million is scheduled to mature March 1, 2016 with automatic one year extensions subject to a 60 day termination notice by either party. As of December 31, 2013, Jefferies has funded $123.8 million of its $350.0 million commitment to LoanCore.
The unfunded loan commitments to Jefferies Finance of $226.2 million is unrated and included in the total unrated lending commitments of $398.0 million presented in the table above.
Mortgage-Related Commitments. Jefferies enters into forward contracts to purchase mortgage participation certificates and mortgage-backed securities. The mortgage participation certificates evidence interests in mortgage loans insured by the Federal Housing Administration and the mortgage-backed securities are insured or guaranteed by the Federal National Mortgage Association (Fannie Mae), the Federal Home Loan Mortgage Corporation (Freddie Mac) or the Government National Mortgage Association (Ginnie Mae). Jefferies frequently securitizes the mortgage participation certificates and mortgage-backed securities. The fair value of mortgage-related commitments recorded in the Consolidated Statement of Financial Condition was $54.2 million.
Forward Starting Reverse Repos and Repos. Jefferies enters into commitments to take possession of securities with agreements to resell on a forward starting basis and to sell securities with agreements to repurchase on a forward starting basis that are primarily secured by U.S. government and agency securities.
Contingencies
Seven putative class action lawsuits have been filed on behalf of a putative class consisting of Jefferies stockholders in New York and Delaware concerning the merger transaction whereby Jefferies became our wholly-owned subsidiary. Three were filed in the Supreme Court of the State of New York: (1) Howard Lasker IRA v. Jefferies Group, Inc. et al. (Index No. 653924/2012), filed on November 14, 2012 in New York County; (2) Lowinger v. Leucadia National Corp. et al. (Index No. 653958/2012), filed on November 15, 2012 in New York County; and (3) Jiannaras v. Jefferies Group, Inc., et al. (Index No. 702866/2012), filed on November 16, 2012 in Queens County. Four were filed in the Court of Chancery of the State of Delaware: (1) Oklahoma Firefighters Pension & Retirement System v. Handler et al. (C.A. No. 8054-CS), filed on November 21, 2012; (2) Laborers' District Council Pension and Disability Trust Fund No. 2 et al. v. Campbell et al. (C.A. No. 8059-CS), filed on November 26, 2012; (3) Genesee County Employees' Retirement System v. Handler et al. (C.A. No. 8096-CS), filed on December 11, 2012; and (4) Gelfand v. Handler et al. (C.A. No. 8228-CS), filed on January 17, 2013 (collectively, the "Actions"). The class actions, filed on behalf of Jefferies shareholders prior to the merger, name as defendants Jefferies, the members of the board of directors of Jefferies, the members of our board of directors and, in certain of the actions, certain merger-related subsidiaries. The Actions seek, among other things, equitable relief and unspecified monetary damages.
F-62
The New York actions were consolidated and have been stayed through pretrial discovery in deference to the Delaware actions, which also have been consolidated. The consolidated Delaware action alleges that the members of Jefferies board of directors breached their fiduciary duties in connection with the merger transactions by engaging in a flawed process, agreeing to sell Jefferies for inadequate consideration pursuant to an agreement that contains improper deal protection terms, and failing to disclose material information concerning the merger transactions, and further that we aided and abetted the directors' breaches of fiduciary duties (the Court has since dismissed the former Jefferies independent directors from the action). The action also alleges breaches of fiduciary duty against Messrs. Handler and Friedman in their capacities as officers of Jefferies, and against Messrs. Handler, Friedman, Cumming and Steinberg, collectively, as purported controlling shareholders of Jefferies. The plaintiffs have moved for class certification. We are unable to predict the outcome of this litigation or to estimate the amount of or range of any reasonably possible loss.
We and certain of our subsidiaries and officers are named as defendants in a consumer class action captioned Sykes v. Mel Harris & Associates, LLC, et al., 09 Civ. 8486 (DC), in the United States District Court for the Southern District of New York. The named defendants also include the Mel Harris law firm, certain individuals and members associated with the law firm, and a process server, Samserv, Inc. and certain of its employees. The action arises out of the law firm's obtaining default judgments against approximately 124,000 individuals in New York City Civil Court with respect to consumer debt purchased by our subsidiaries. We asserted that we were an investor with respect to the subject purchased consumer debt and were regularly informed of the amounts received from debt collections, but otherwise had no involvement in any alleged illegal debt collection activities.
The complaint alleges that the defendants fraudulently obtained the default judgments in violation of the Fair Debt Collection Practices Act, the Racketeer Influenced and Corrupt Organizations Act, the New York General Business Law and the New York Judiciary Law (alleged only as to the law firm) and seeks injunctive relief, declaratory relief and damages on behalf of the named plaintiffs and others similarly situated. Defendants' motions to dismiss were denied in part (including as to the claims made against us and our subsidiaries) and granted in part (including as to certain of the claims made against our officers) (the "Dismissal Decision"). In September 2012, the Court issued a decision granting plaintiffs' motion to certify a Rule 23(b)(2) class and a Rule 23(b)(3) class (the "Certification Decision"). Neither the Dismissal Decision nor the Certification Decision addresses the ultimate merits of the case.
At a November 2012 status conference, the parties advised the Court of their intention to attempt to resolve the dispute through mediation. Those efforts were not successful and the parties advised the Court. On March 28, 2013, the Court entered its certification order, certifying a Rule 23(b)(2) class of "all persons who have been or will be sued by the Mel Harris defendants as counsel for the Leucadia defendants in actions commenced in New York City Civil Court and where a default judgment has or will be sought" and a Rule 23(b)(3) class of "all persons who have been sued by the Mel Harris defendants as counsel for the Leucadia defendants in actions commenced in New York City Civil Court and where a default judgment has been obtained." (the "Certification Order").
On July 19, 2013, the United States Court of Appeals for the Second Circuit granted our leave to appeal the District Court's March Certification Order. In connection with the appeal, the District Court has granted a stay of the proceedings pending the Court of Appeals' decision. The appeal was heard on February 7, 2014.
Determinations of both the probability and the estimated amount of loss or potential loss are judgments made in the context of developments in the litigation. We review these developments regularly with our outside counsel. Because we determined that we would be willing to resolve this matter with plaintiffs for $20.0 million, we accrued a litigation reserve for this contingency in that amount. In arriving at this reserve amount, we considered a number of factors, including that (i) while the damages sought are indeterminate, payment of this reserved amount would not resolve the case at this time, (ii) there is uncertainty as to the outcome of pending proceedings (including motions and appeals respecting class certification), (iii) there are significant factual issues to be determined or resolved, (vi) relevant law is unsettled and untested legal theories are presented, (v) we have numerous defenses to the plaintiffs' claims, (vi) there are no adverse rulings by the Court on the merits of plaintiffs' claims and (vii) several important litigation milestones, such as the completion of discovery and the filing of summary judgment motions, have not yet occurred.
We also note that the plaintiffs in the action – the class members certified under Federal Rule of Civil Procedure 23(b)(3) – have alleged certain categories of damages under each of the statutes underlying their claims. These damages include (i) statutory damages, which are capped under the Fair Debt Collection Practices Act at $0.5 million for the class, and (ii) actual damages. While not fully described in the complaint, it appears that plaintiffs' claim for actual damages includes not only incidental costs incurred in connection with the default judgments (including, for example, subway fares to the courthouse and bank fees), costs relating to emotional distress and costs related to reputational damage allegedly arising as a result of the long-term effects of the default judgments, but also the full amount of the debt that class members paid (whether owed or not) following entry of the default judgments. The amount of debt collected to date totals approximately $90.0 million. If the plaintiffs are successful in proving their claims and in proving actual damages, plaintiffs' damages may be subject to prejudgment interest and trebling under the Racketeer Influenced and Corrupt Organizations Act.
F-63
Jefferies has reached a non-prosecution agreement with the United States Attorney for the District of Connecticut and a settlement agreement in principle with the SEC, which remains subject to review and approval by the SEC Commissioners, relating to an investigation of the purchases and sales of mortgage-backed securities. That investigation arose from a matter that came to light in late 2011, at which time Jefferies terminated a mortgage-backed-securities trader who was then indicted by the United States Attorney for the District of Connecticut in January 2013 and separately charged in a civil complaint by the SEC. Those agreements include an aggregate $25.0 million payment, of which approximately $11.0 million are payments to trading counterparties impacted by those activities, approximately $10.0 million of which is a fine payable to the U.S. Attorney's Office, and approximately $4.0 million of which is a fine payable to the SEC. Jefferies has reserved $22.4 million relating to remaining amounts we estimate to be paid related to this matter.
We and our subsidiaries are parties to other legal and regulatory proceedings that are considered to be either ordinary, routine litigation incidental to their business or not significant to our consolidated financial position. We and our subsidiaries are also involved, from time to time, in other exams, investigations and similar reviews (both formal and informal) by governmental and self-regulatory agencies regarding our businesses, certain of which may result in judgments, settlements, fines, penalties or other injunctions. We do not believe that any of these actions will have a significant adverse effect on our consolidated financial position or liquidity, but any amounts paid could be significant to results of operations for the period.
Guarantees
Derivative Contracts. Jefferies dealer activities cause it to make markets and trade in a variety of derivative instruments. Certain derivative contracts that Jefferies has entered into meet the accounting definition of a guarantee under GAAP, including credit default swaps, written foreign currency options and written equity put options. On certain of these contracts, such as written interest rate caps and foreign currency options, the maximum payout cannot be quantified since the increase in interest or foreign exchange rates are not contractually limited by the terms of the contract. As such, we have disclosed notional values as a measure of Jefferies maximum potential payout under these contracts.
The following table summarizes the notional amounts associated with our derivative contracts meeting the definition of a guarantee under GAAP (in millions):
Expected Maturity Date | ||||||||||||||||||||||||
Guarantee Type | 2014 | 2015 | 2016 and 2017 | 2018 and 2019 | 2020 and Later | Notional/ Maximum Payout | ||||||||||||||||||
Derivative contracts – non-credit related | $ | 841,439.9 | $ | 4,695.2 | $ | 14.7 | $ | 1.2 | $ | 532.4 | $ | 846,683.4 | ||||||||||||
Written derivative contracts – credit related | – | – | – | 2,708.1 | – | 2,708.1 | ||||||||||||||||||
Total derivative contracts | $ | 841,439.9 | $ | 4,695.2 | $ | 14.7 | $ | 2,709.3 | $ | 532.4 | $ | 849,391.5 | ||||||||||||
The external credit ratings of the underlying or referenced assets for our credit related derivatives contracts (in millions):
External Credit Rating | ||||||||||||||||||||||||||||
AAA/ Aaa | AA/ Aa | A | BBB/Baa | Below Investment Grade | Unrated | Notional/ Maximum Payout | ||||||||||||||||||||||
Credit related derivative contracts: | ||||||||||||||||||||||||||||
Index credit default swaps | $ | 2,678.6 | $ | – | $ | – | $ | – | $ | – | $ | – | $ | 2,678.6 | ||||||||||||||
Single name credit default swaps | – | 3.0 | 2.5 | 24.0 | – | – | 29.5 | |||||||||||||||||||||
The derivative contracts deemed to meet the definition of a guarantee under GAAP are before consideration of hedging transactions and only reflect a partial or "one-sided" component of any risk exposure. Written equity options and written credit default swaps are often executed in a strategy that is in tandem with long cash instruments (e.g., equity and debt securities). Jefferies substantially mitigates its exposure to market risk on these contracts through hedges, such as other derivative contracts and/or cash instruments and we manage the risk associated with these contracts in the context of our overall risk management framework. Jefferies believes notional amounts overstate its expected payout and that fair value of these contracts is a more relevant measure of its obligations. The fair value of derivative contracts meeting the definition of a guarantee is approximately $229.5 million.
F-64
Berkadia. We have agreed to reimburse Berkshire Hathaway for up to one-half of any losses incurred under a $2.5 billion surety policy securing outstanding commercial paper issued by an affiliate of Berkadia. As of December 31, 2013, the aggregate amount of commercial paper outstanding was $2.47 billion.
Other Guarantees. Jefferies is a member of various exchanges and clearing houses. In the normal course of business Jefferies provides guarantees to securities clearinghouses and exchanges. These guarantees generally are required under the standard membership agreements, such that members are required to guarantee the performance of other members. Additionally, if a member becomes unable to satisfy its obligations to the clearinghouse, other members would be required to meet these shortfalls. To mitigate these performance risks, the exchanges and clearinghouses often require members to post collateral. Jefferies obligations under such guarantees could exceed the collateral amounts posted. Jefferies maximum potential liability under these arrangements cannot be quantified; however, the potential for Jefferies to be required to make payments under such guarantees is deemed remote. Accordingly no liability has been recognized for these arrangements.
Standby Letters of Credit. At December 31, 2013, Jefferies provided guarantees to certain counterparties in the form of standby letters of credit in the amount of $32.0 million, which expire within one year. Standby letters of credit commit Jefferies to make payment to the beneficiary if the guaranteed party fails to fulfill its obligation under a contractual arrangement with that beneficiary. Since commitments associated with these collateral instruments may expire unused, the amount shown does not necessarily reflect the actual future cash funding requirement.
Other subsidiaries of ours have outstanding letters of credit aggregating $29.5 million at December 31, 2013.
Note 28. Net Capital Requirements
As broker-dealers registered with the SEC and member firms of the Financial Industry Regulatory Authority ("FINRA"), Jefferies LLC and Jefferies Execution Services, Inc. ("Jefferies Execution"), are subject to the SEC Net Capital Rule ("Rule 15c3-1"), which requires the maintenance of minimum net capital and which may limit distributions from the broker-dealers. Jefferies LLC and Jefferies Execution have elected to calculate minimum capital requirements under the alternative method as permitted by Rule 15c3-1. Jefferies Bache, LLC is also registered as a Futures Commission Merchant and is subject to Rule 1.17 of the Commodities Futures Trading Commission. Jefferies designated self-regulatory organization is FINRA for our U.S. broker-dealers and the Chicago Mercantile Exchange for Jefferies Bache, LLC.
Jefferies LLC, Jefferies Execution and Jefferies Bache, LLC's net capital, adjusted net capital, and excess net capital are as follows (in thousands):
Net Capital | Excess Net Capital | |||||||
Jefferies LLC | $ | 891,487 | $ | 841,539 | ||||
Jefferies Execution | 4,487 | 4,237 | ||||||
Adjusted Net Capital | Excess Net Capital | |||||||
Jefferies Bache, LLC | $ | 197,957 | $ | 86,293 | ||||
Certain other U.S. and non-U.S. subsidiaries of Jefferies are subject to capital adequacy requirements as prescribed by the regulatory authorities in their respective jurisdictions, including Jefferies International Limited and Jefferies Bache Limited which are subject to the regulatory supervision and requirements of the Financial Conduct Authority in the United Kingdom.
The regulatory capital requirements referred to above may restrict our ability to withdraw capital from our subsidiaries.
|
Note 29. Other Fair Value Information |
Our principal financial instruments that are not recognized at fair value on a recurring basis are notes receivable from sales of assets, short-term borrowings and long-term debt. The carrying amounts and estimated fair values of these financial instruments are as follows (in thousands):
F-65
December 31, 2013 | December 31, 2012 | |||||||||||||||
Carrying | Fair | Carrying | Fair | |||||||||||||
Amount | Value | Amount | Value | |||||||||||||
Other Assets: | ||||||||||||||||
Notes receivable (a) | $ | 95,042 | $ | 95,606 | $ | 46,541 | $ | 46,770 | ||||||||
Financial Liabilities: | ||||||||||||||||
Short-term borrowings (b) | 12,000 | 12,000 | – | – | ||||||||||||
Long-term debt (b) | 8,180,865 | 8,230,191 | 1,358,695 | 1,449,576 | ||||||||||||
| (a) | Notes receivable: The fair values of notes receivable are primarily measured using Level 2 and 3 inputs principally based on discounted future cash flows using market interest rates for similar instruments. |
| (b) | Short-term borrowings and long-term debt: The fair values of short term borrowings are estimated to be the carrying amount. The fair values of non-variable rate debt are estimated using quoted prices and estimated rates that would be available for debt with similar terms. The fair value of variable rate debt is estimated to be the carrying amount. |
Note 30. Related Party Transactions
Jefferies Capital Partners and JEP IV Related Funds. Jefferies has loans to and/or equity investments in private equity funds and in Jefferies Capital Partners, LLC, the manager to the Jefferies Capital Partners funds, which are managed by a team led by Brian Friedman ("Private Equity Related Funds"). Reflected in our Consolidated Statement of Financial Condition at December 31, 2013 are loans to and/or equity investments in Private Equity Related Funds of $61.7 million. For the period from the acquisition of Jefferies through December 31, 2013, revenues aggregating $10.1 million were recorded related to the Private Equity Related Funds. For further information regarding our commitments and funded amounts to Private Equity Related Funds, see Note 27 .
Berkadia Commercial Mortgage, LLC. At December 31, 2013, Jefferies has commitments to purchase $300.0 million in agency commercial mortgage-backed securities from Berkadia.
Officers, Directors and Employees. We have $13.9 million of loans outstanding to certain employees (none of whom are an executive officer or director of the Company) that are included in Other assets in the Consolidated Statements of Financial Condition at December 31, 2013.
National Beef. National Beef enters into transactions with an affiliate of NBPCo Holdings and USPB, owners of redeemable noncontrolling interests in National Beef. For the year ended December 31, 2013, sales to and purchases from the affiliate of NBPCo Holdings were $25.6 million and $9.4 million, respectively. For the year ended December 31, 2012, sales to and purchases from the affiliate of NBPCo Holdings were $74.2 million and $17.5 million, respectively. We believe these transactions are based upon prevailing market prices on terms that could be obtained from an unaffiliated party. National Beef has entered into a cattle supply agreement with USPB pursuant to which National Beef has agreed to purchase through USPB from the members of USPB 735,385 head of cattle per year (subject to adjustment), based on pricing grids furnished by National Beef to the members of USPB. National Beef believes the pricing grids are based on terms that could be obtained from an unaffiliated party. National Beef obtained approximately 20% of its cattle requirements through USPB during 2013 and 2012. At December 31, 2013, amounts due from and payable to these related parties were not significant.
Note 31. Discontinued Operations and Assets Held for Sale
In October 2013, we concluded that we would no longer continue to fund Sangart's research and development operations, through which we had conducted our medical product development operations. We commenced and completed an orderly shut-down of Sangart's operations during 2013; as a result, our medical product development operations have been classified as a discontinued operation.
In December 2013, we entered into an agreement to sell Premier, through which we had conducted our gaming entertainment operations, for aggregate cash consideration of $250.0 million. Closing of the transaction is subject to regulatory approval and customary closing conditions, and is not expected to occur until the second quarter of 2014. As a result, our gaming entertainment segment has been classified as a discontinued operation.
In October 2012, we sold Keen Energy Services, LLC for cash consideration of $100.0 million and a four-year interest bearing promissory note issued by the purchaser which was valued at $37.5 million. We also retained Keen's net working capital, principally customer receivables and trade payables. We recorded a pre-tax loss on sale of discontinued operations of $18.0 million for the year ended December 31, 2012. As a result, our oil and gas drilling services segment has been classified as a discontinued operation.
F-66
During the third quarter of 2013, we sold a small power production business and recorded a pre-tax gain on sale of discontinued operations of $6.4 million.
A summary of the results of discontinued operations for Sangart, Premier, Keen and the power production business is as follows for the three years ended December 31, 2013 (in thousands):
2013 | 2012 | 2011 | ||||||||||
Revenues and other income: | ||||||||||||
Oil and gas drilling services | $ | – | $ | 95,674 | $ | 133,782 | ||||||
Gaming entertainment | 114,844 | 119,330 | 117,217 | |||||||||
Investment and other income | 946 | 4,968 | 3,715 | |||||||||
| 115,790 | 219,972 | 254,714 | ||||||||||
Expenses: | ||||||||||||
Direct operating expenses: | ||||||||||||
Oil and gas drilling services | – | 79,143 | 100,639 | |||||||||
Gaming entertainment | 85,233 | 88,127 | 84,795 | |||||||||
Compensation and benefits | 19,528 | 24,402 | 23,402 | |||||||||
Depreciation and amortization | 8,919 | 28,475 | 38,681 | |||||||||
Selling, general and other expenses | 20,897 | 36,509 | 37,616 | |||||||||
| 134,577 | 256,656 | 285,133 | ||||||||||
Loss from discontinued | ||||||||||||
operations before income taxes | (18,787 | ) | (36,684 | ) | (30,419 | ) | ||||||
Income tax (benefit) | (6,563 | ) | (12,660 | ) | (11,475 | ) | ||||||
Loss from discontinued | ||||||||||||
operations after income taxes | $ | (12,224 | ) | $ | (24,024 | ) | $ | (18,944 | ) | |||
Income from discontinued operations also reflects distributions of $5.7 million and $4.7 million for 2012 and 2011, respectively, from our subsidiary, Empire Insurance Company, which has been undergoing a voluntary liquidation, was classified as a discontinued operation in 2001 and was written-off based on its expected future cash flows at that time. During 2013, we sold Empire for cash consideration of $3.2 million, subject to certain post-closing working capital adjustments, and the sale resulted in the recognition of a tax benefit of $5.4 million. Gain on disposal of discontinued operations reflects an after tax gain of $8.6 million for this sale.
During 2012, we sold our small Caribbean-based telecommunications provider for aggregate consideration of $27.5 million, net of working capital adjustments, and recognized a pre-tax gain on sale of discontinued operations of $11.7 million. We have not classified this business' historical results of operations or its assets and liabilities as discontinued operations because such amounts were not significant.
During 2011, additional final payments were received from the buyer of our telecommunications segment and we recognized a pre-tax gain from discontinued operations of $9.7 million.
In February 2014 we entered into an agreement to sell substantially all of our real estate properties and operations and BRP to HomeFed for HomeFed common shares. Results of operations for our real estate properties and operations are reflected in the other operations segment. Assets included in the transaction with HomeFed have been included with Other assets as Assets held for sale in the Consolidated Statement of Financial Condition at December 31, 2013 and include the following components (in thousands):
2013 | ||||
Real estate | $ | 112,016 | ||
Investment in associated company | 30,793 | |||
Other, net | 17,310 | |||
| $ | 160,119 | |||
F-67
Note 32. Segment Information
Our reportable segments consist of our consolidated operating units, which offer different products and services and are managed separately. Jefferies is a global full-service, integrated securities and investment banking firm. National Beef processes, packages and delivers fresh and frozen beef and beef by-products for sale to customers in the U.S. and international markets. Other operations primarily consist of manufacturing, energy projects, asset management, real estate and, for periods prior to their spin-off to shareholders in February 2013, Crimson.
Corporate assets primarily consist of financial instruments owned, the deferred tax asset (exclusive of Jefferies deferred tax asset), cash and cash equivalents and corporate revenues primarily consist of principal transactions, interest and other income and net realized securities gains and losses. Corporate assets also included our minority investment in Jefferies, prior to our acquisition of all of Jefferies, and our former investment in Mueller, both of which were accounted for at fair value rather than under the equity method of accounting. Corporate assets include our investment in the First Quantum, Inmet and Fortescue common shares for the periods they were owned. Corporate assets, revenues, overhead expenses and interest expense are not allocated to the operating units.
Certain information concerning our segments is presented in the following table. Consolidated subsidiaries are reflected as of the date a majority controlling interest was acquired, which was March 1, 2013 for Jefferies and December 30, 2011 for National Beef. Since National Beef's operating activities subsequent to the acquisition during 2011 were not significant they have not been included in our 2011 Consolidated Statement of Operations.
2013 | 2012 | 2011 | ||||||||||
(In thousands) | ||||||||||||
Net Revenues: | ||||||||||||
Investment Banking & Capital Markets | $ | 2,134,002 | $ | – | $ | – | ||||||
Beef Processing Services | 7,487,724 | 7,480,934 | – | |||||||||
Other Operations (1) | 347,275 | 333,415 | 410,526 | |||||||||
Corporate | 460,490 | 1,590,983 | 232,105 | |||||||||
Total consolidated net revenues | $ | 10,429,491 | $ | 9,405,332 | $ | 642,631 | ||||||
| ||||||||||||
Income (loss) from continuing operations before | ||||||||||||
income taxes and income related to | ||||||||||||
associated companies: | ||||||||||||
Investment Banking & Capital Markets | $ | 260,984 | $ | – | $ | – | ||||||
Beef Processing Services | (42,358 | ) | 59,048 | – | ||||||||
Other Operations (1) | (108,395 | ) | (38,859 | ) | 58,674 | |||||||
Corporate | 242,771 | 1,309,444 | (25,364 | ) | ||||||||
Total consolidated income from | ||||||||||||
continuing operations before income | ||||||||||||
taxes and income related to | ||||||||||||
associated companies | $ | 353,002 | $ | 1,329,633 | $ | 33,310 | ||||||
Depreciation and amortization expenses: | ||||||||||||
Investment Banking & Capital Markets | $ | 59,631 | $ | – | $ | – | ||||||
Beef Processing Services | 88,483 | 83,063 | – | |||||||||
Other Operations | 18,628 | 25,786 | 25,191 | |||||||||
Corporate | 9,924 | 19,727 | 23,296 | |||||||||
Total consolidated depreciation and | ||||||||||||
amortization expenses | $ | 176,666 | $ | 128,576 | $ | 48,487 | ||||||
Identifiable assets employed: | ||||||||||||
Investment Banking & Capital Markets (2) | $ | 40,168,572 | $ | – | $ | – | ||||||
Beef Processing | 1,703,662 | 1,797,152 | 1,786,855 | |||||||||
Other Operations | 942,260 | 885,236 | 881,115 | |||||||||
Loans to and investments in associated | ||||||||||||
companies | 556,468 | 807,474 | 793,766 | |||||||||
Corporate | 4,495,819 | 5,859,256 | 5,586,990 | |||||||||
Assets of discontinued operations | – | – | 214,463 | |||||||||
Total consolidated assets | $ | 47,866,781 | $ | 9,349,118 | $ | 9,263,189 | ||||||
F-68
Net revenues for the investment banking and capital markets segment are recorded in the geographic region in which the position was risk-managed, in the case of investment banking, in which the senior coverage banker is located, or for asset management, according to the location of the investment advisor. Net revenues by geographic region for the period from the Jefferies acquisition through December 31, 2013 were as follows (in thousands):
Americas (3) | $ | 1,639,495 | ||
Europe (4) | 448,181 | |||
Asia | 46,326 | |||
| $ | 2,134,002 |
(1) | For the year ended December 31, 2011, includes $81.8 million gain on forgiveness of bank indebtedness related to a real estate property. |
(2) | At December 31, 2013, includes $701.9 million of Jefferies loans to and investments in associated companies and $524.8 million of Jefferies deferred tax asset, net. |
(3) | Substantially all relates to U.S. results. |
(4) | Substantially all relates to U.K. results. |
Other operations includes pre-tax losses of $87.9 million, $32.8 million and $28.6 million for the years ended December 31, 2013, 2012 and 2011, respectively, for the investigation and evaluation of various energy related projects. There were no significant operating revenues or identifiable assets associated with these activities in any period; however, other income includes $5.4 million in 2011 with respect to government grants to reimburse us for certain of its prior expenditures, which were fully expensed as incurred. Such amounts were not significant in 2013 and 2012.
Net realized securities gains for corporate aggregated $243.5 million, $590.6 million and $641.5 million during 2013, 2012 and 2011, respectively. In 2013, realized security gains include $227.6 million related to the sale of Inmet. In 2012 and 2011, realized securities gains included gains of $543.7 million and $628.2 million, respectively, from the sale of our common shares of Fortescue. Corporate other income includes a gain on the redemption of the FMG Note of $526.2 million in 2012.
Depreciation and amortization expenses for other operations include amounts classified within Cost of sales and Selling, general and other expenses in the Consolidated Statements of Operations.
Interest expense classified as a component of Net revenues relates to the investment banking & capital markets segment. For the years ended December 31, 2013 and 2012, interest expense classified as a component of Expenses was primarily comprised of beef processing services ($12.3 million and $12.4 million, respectively) and corporate ($72.2 million and $80.2 million, respectively). For the year ended December 31, 2011 interest expense was primarily comprised of corporate; interest expense for other segments was not significant.
F-69
Note 33. Selected Quarterly Financial Data (Unaudited): |
First | Second | Third | Fourth | |||||||||||||
Quarter | Quarter | Quarter | Quarter | |||||||||||||
(In thousands, except per share amounts) | ||||||||||||||||
2013 | ||||||||||||||||
Net revenues | $ | 2,297,613 | $ | 2,675,725 | $ | 2,534,235 | $ | 2,921,918 | ||||||||
Income (loss) from continuing operations | $ | 304,156 | $ | 60,574 | $ | 11,662 | $ | (15,090 | ) | |||||||
Loss from discontinued operations, net of taxes | $ | (3,542 | ) | $ | (2,423 | ) | $ | (1,439 | ) | $ | (4,820 | ) | ||||
Gain (loss) on disposal of discontinued operations, net of taxes | $ | (325 | ) | $ | 385 | $ | 4,160 | $ | 8,895 | |||||||
Net (income) loss attributable to the noncontrolling interest | $ | 622 | $ | 729 | $ | (253 | ) | $ | 64 | |||||||
Net (income) loss attributable to the redeemable noncontrolling | ||||||||||||||||
interests | $ | 4,531 | $ | (5,638 | ) | $ | (10,132 | ) | $ | 20,521 | ||||||
Preferred stock dividends | $ | (339 | ) | $ | (1,015 | ) | $ | (1,027 | ) | $ | (1,016 | ) | ||||
Net income | $ | 305,103 | $ | 52,612 | $ | 2,971 | $ | 8,554 | ||||||||
Basic earnings (loss) per common share attributable to | ||||||||||||||||
Leucadia National Corporation common shareholders: | ||||||||||||||||
Income (loss) from continuing operations | $ | 1.11 | $ | .14 | $ | - | $ | .01 | ||||||||
Loss from discontinued operations | (.01 | ) | - | - | (.01 | ) | ||||||||||
Gain (loss) on disposal of discontinued operations | - | - | .01 | .02 | ||||||||||||
Net income | $ | 1.10 | $ | .14 | $ | .01 | $ | .02 | ||||||||
Number of shares used in calculation | 275,735 | 367,752 | 367,641 | 368,146 | ||||||||||||
Diluted earnings (loss) per common share attributable to | ||||||||||||||||
Leucadia National Corporation common shareholders: | ||||||||||||||||
Income (loss) from continuing operations | $ | 1.09 | $ | .14 | $ | - | $ | .01 | ||||||||
Loss from discontinued operations | (.01 | ) | - | - | (.01 | ) | ||||||||||
Gain (loss) on disposal of discontinued operations | - | - | .01 | .02 | ||||||||||||
Net income | $ | 1.08 | $ | .14 | $ | .01 | $ | .02 | ||||||||
Number of shares used in calculation | 281,587 | 367,837 | 367,687 | 368,262 | ||||||||||||
2012 | ||||||||||||||||
Net revenues | $ | 2,727,030 | $ | 1,716,274 | $ | 2,186,582 | $ | 2,775,446 | ||||||||
Income (loss) from continuing operations | $ | 489,322 | $ | (180,426 | ) | $ | 122,132 | $ | 456,101 | |||||||
Loss from discontinued operations, net of taxes | $ | (2,087 | ) | $ | (7,342 | ) | $ | (3,172 | ) | $ | (5,760 | ) | ||||
Gain (loss) on disposal of discontinued operations, net of taxes | $ | - | $ | - | $ | (4,626 | ) | $ | 499 | |||||||
Net (income) loss attributable to the noncontrolling interest | $ | (202 | ) | $ | 297 | $ | 972 | $ | 993 | |||||||
Net (income) loss attributable to the redeemable noncontrolling | ||||||||||||||||
interests | $ | 3,844 | $ | (9,780 | ) | $ | (8,632 | ) | $ | 2,333 | ||||||
Net income (loss) | $ | 490,877 | $ | (197,251 | ) | $ | 106,674 | $ | 454,166 | |||||||
Basic earnings (loss) per common share attributable to | ||||||||||||||||
Leucadia National Corporation common shareholders: | ||||||||||||||||
Income (loss) from continuing operations | $ | 2.02 | $ | (.78 | ) | $ | .47 | $ | 1.88 | |||||||
Loss from discontinued operations | (.01 | ) | (.03 | ) | (.01 | ) | (.02 | ) | ||||||||
Gain (loss) on disposal of discontinued operations | - | - | (.02 | ) | - | |||||||||||
Net income (loss) | $ | 2.01 | $ | (.81 | ) | $ | .44 | $ | 1.86 | |||||||
Number of shares used in calculation | 244,583 | 244,583 | 244,583 | 244,583 | ||||||||||||
Diluted earnings (loss) per common share attributable to | ||||||||||||||||
Leucadia National Corporation common shareholders: | ||||||||||||||||
Income (loss) from continuing operations | $ | 1.98 | $ | (.78 | ) | $ | .46 | $ | 1.85 | |||||||
Loss from discontinued operations | (.01 | ) | (.03 | ) | (.01 | ) | (.02 | ) | ||||||||
Gain (loss) on disposal of discontinued operations | - | - | (.02 | ) | - | |||||||||||
Net income (loss) | $ | 1.97 | $ | (.81 | ) | $ | .43 | $ | 1.83 | |||||||
Number of shares used in calculation | 248,945 | 244,583 | 248,910 | 248,922 | ||||||||||||
Commission revenues and Floor brokerage and clearing fees for the second and third quarter of 2013 have been revised to reflect certain exchange fees charged to customers in Jefferies futures business on a gross rather than net basis. Net revenues and Expenses were each increased by $12.0 million in the second quarter of 2013 and $18.6 million in the third quarter of 2013 from amounts previously reported. There was no impact on Net income.
The second quarter of 2013 includes an out of period adjustment of $16.4 million to record Berkadia income related to prior periods. The fourth quarter of 2013 includes an out of period adjustment of $15.4 million to record real estate impairment charges related to prior periods.
Revenues and other income for the fourth quarter of 2012 include a gain on the redemption of the FMG Note of $526.2 million.
In 2013 and 2012, the totals of quarterly per share amounts do not equal annual per share amounts because of changes in outstanding shares during the year.
F-70
Report of Independent Registered Public Accounting Firm
To the Board of Directors and Member of Jefferies Group LLC
In our opinion, the accompanying consolidated statement of financial condition as of November 30, 2013 and the related consolidated statements of earnings, of comprehensive income, of changes in equity, and of cash flows for the period March 1, 2013 through November 30, 2013 present fairly, in all material respects, the financial position of Jefferies Group LLC and its subsidiaries (the "Successor" company) at November 30, 2013, and the results of their operations and their cash flows for the period March 1, 2013 through November 30, 2013 in conformity with accounting principles generally accepted in the United States of America. Also in our opinion, the Company maintained, in all material respects, effective internal control over financial reporting as of November 30, 2013, based on criteria established in accordance with the criteria established in Internal Control - Integrated Framework issued by the Committee of Sponsoring Organizations of the Treadway Commission (COSO). The Company's management is responsible for these financial statements, for maintaining effective internal control over financial reporting and for its assessment of internal control over financial reporting, included in the accompanying Management's Report on Internal Control over Financial Reporting. Our responsibility is to express opinions on these financial statements and on the Company's internal control over financial reporting based on our integrated audit. We conducted our audit in accordance with the standards of the Public Company Accounting Oversight Board (United States). Those standards require that we plan and perform the audit to obtain reasonable assurance about whether the financial statements are free of material misstatement and whether effective internal control over financial reporting was maintained in all material respects. Our audit of the financial statements included examining, on a test basis, evidence supporting the amounts and disclosures in the financial statements, assessing the accounting principles used and significant estimates made by management, and evaluating the overall financial statement presentation. Our audit of internal control over financial reporting included obtaining an understanding of internal control over financial reporting, assessing the risk that a material weakness exists, and testing and evaluating the design and operating effectiveness of internal control based on the assessed risk. Our audits also included performing such other procedures as we considered necessary in the circumstances. We believe our audit provides a reasonable basis for our opinions.
A company's internal control over financial reporting is a process designed to provide reasonable assurance regarding the reliability of financial reporting and the preparation of financial statements for external purposes in accordance with generally accepted accounting principles. A company's internal control over financial reporting includes those policies and procedures that (i) pertain to the maintenance of records that, in reasonable detail, accurately and fairly reflect the transactions and dispositions of the assets of the company; (ii) provide reasonable assurance that transactions are recorded as necessary to permit preparation of financial statements in accordance with generally accepted accounting principles, and that receipts and expenditures of the company are being made only in accordance with authorizations of management and directors of the company; and (iii) provide reasonable assurance regarding prevention or timely detection of unauthorized acquisition, use, or disposition of the company's assets that could have a material effect on the financial statements.
Because of its inherent limitations, internal control over financial reporting may not prevent or detect misstatements. Also, projections of any evaluation of effectiveness to future periods are subject to the risk that controls may become inadequate because of changes in conditions, or that the degree of compliance with the policies or procedures may deteriorate.
/s/ PricewaterhouseCoopers LLP
New York, New York
January 28, 2014
Jef-1
Report of Independent Registered Public Accounting Firm
To Board of Directors and Shareholders of Jefferies Group, Inc.
In our opinion, the consolidated statements of earnings, of comprehensive income, of changes in equity and of cash flows for the period from December 1, 2012 through February 28, 2013 (the "Predecessor" company) present fairly, in all material respects, the results of operations and cash flows of Jefferies Group, Inc. and its subsidiaries for the period December 1, 2012 through February 28, 2013, in conformity with accounting principles generally accepted in the United States of America. These financial statements are the responsibility of the Company's management. Our responsibility is to express an opinion on these financial statements based on our audit. We conducted our audit of these statements in accordance with the standards of the Public Company Accounting Oversight Board (United States). Those standards require that we plan and perform the audit to obtain reasonable assurance about whether the financial statements are free of material misstatement. An audit includes examining, on a test basis, evidence supporting the amounts and disclosures in the financial statements, assessing the accounting principles used and significant estimates made by management, and evaluating the overall financial statement presentation. We believe that our audit provides a reasonable basis for our opinion.
/s/ PricewaterhouseCoopers LLP
New York, New York
January 28, 2014
Jef-2
REPORT OF INDEPENDENT REGISTERED PUBLIC ACCOUNTING FIRM
To the Board of Directors and Member of Jefferies Group LLC
We have audited the consolidated statement of financial condition of Jefferies Group LLC (formerly Jefferies Group, Inc.) and subsidiaries (the "Company") as of November 30, 2012, and the related consolidated statements of earnings, comprehensive income, stockholders' equity, and cash flows for the years ended November 30, 2012 and 2011. These financial statements are the responsibility of the Company's management. Our responsibility is to express an opinion on these financial statements based on our audits.
We conducted our audits in accordance with the standards of the Public Company Accounting Oversight Board (United States). Those standards require that we plan and perform the audit to obtain reasonable assurance about whether the financial statements are free of material misstatement. An audit includes examining, on a test basis, evidence supporting the amounts and disclosures in the financial statements. An audit also includes assessing the accounting principles used and significant estimates made by management, as well as evaluating the overall financial statement presentation. We believe that our audits provide a reasonable basis for our opinion.
In our opinion, such consolidated financial statements present fairly, in all material respects, the financial position of Jefferies Group LLC and subsidiaries as of November 30, 2012, and the results of their operations and their cash flows for the years ended November 30, 2012 and 2011, in conformity with accounting principles generally accepted in the United States of America.
/s/ DELOITTE & TOUCHE LLP
New York, New York
January 28, 2013 (January 28, 2014 as to the effects discussed in Note 1–Immaterial Prior Year Adjustments)
Jef-3
JEFFERIES GROUP LLC AND SUBSIDIARIES
CONSOLIDATED STATEMENTS OF FINANCIAL CONDITION
(In thousands)
Successor | Predecessor | |||||||
November 30, 2013 | November 30, 2012 | |||||||
ASSETS | ||||||||
Cash and cash equivalents | $ | 3,561,119 | $ | 2,692,595 | ||||
Cash and securities segregated and on deposit for regulatory purposes or deposited with clearing and depository organizations | 3,616,602 | 4,082,595 | ||||||
Financial instruments owned, at fair value, including securities pledged of $13,253,537 and $12,334,745 at November 30, 2013 and November 30, 2012, respectively. | ||||||||
Corporate equity securities | 2,098,597 | 1,762,775 | ||||||
Corporate debt securities | 2,982,768 | 3,038,146 | ||||||
Government, federal agency and other sovereign obligations | 5,346,152 | 5,153,750 | ||||||
Mortgage- and asset-backed securities | 4,473,135 | 5,398,078 | ||||||
Loans and other receivables | 1,349,128 | 678,311 | ||||||
Derivatives | 261,093 | 368,292 | ||||||
Investments, at fair value | 101,282 | 127,023 | ||||||
Physical commodities | 37,888 | 144,016 | ||||||
Total financial instruments owned, at fair value | 16,650,043 | 16,670,391 | ||||||
Investments in managed funds | 57,285 | 57,763 | ||||||
Loans to and investments in related parties | 701,873 | 586,420 | ||||||
Securities borrowed | 5,359,846 | 5,094,679 | ||||||
Securities purchased under agreements to resell | 3,746,920 | 3,357,602 | ||||||
Securities received as collateral | 11,063 | - | ||||||
Receivables: | ||||||||
Brokers, dealers and clearing organizations | 2,119,279 | 1,424,027 | ||||||
Customers | 1,046,945 | 916,284 | ||||||
Fees, interest and other | 251,072 | 196,811 | ||||||
Premises and equipment | 202,467 | 185,991 | ||||||
Goodwill | 1,722,346 | 365,670 | ||||||
Other assets | 1,130,136 | 662,713 | ||||||
Total assets | $ | 40,176,996 | $ | 36,293,541 | ||||
Continued on next page.
Jef-4
JEFFERIES GROUP LLC AND SUBSIDIARIES
CONSOLIDATED STATEMENTS OF FINANCIAL CONDITION – CONTINUED
(In thousands, except share amounts)
Successor | Predecessor | |||||||
November 30, 2013 | November 30, 2012 | |||||||
LIABILITIES AND EQUITY | ||||||||
Short-term borrowing | $ | 12,000 | $ | 150,000 | ||||
Financial instruments sold, not yet purchased, at fair value: | ||||||||
Corporate equity securities | 1,823,299 | 1,539,332 | ||||||
Corporate debt securities | 1,346,078 | 1,389,312 | ||||||
Government, federal agency and other sovereign obligations | 3,155,683 | 3,666,112 | ||||||
Mortgage- and asset-backed securities | 34,691 | 228,251 | ||||||
Loans | 695,300 | 207,227 | ||||||
Derivatives | 180,079 | 242,087 | ||||||
Physical commodities | 36,483 | 183,142 | ||||||
Total financial instruments sold, not yet purchased, at fair value | 7,271,613 | 7,455,463 | ||||||
Collateralized financings: | ||||||||
Securities loaned | 2,506,122 | 1,934,355 | ||||||
Securities sold under agreements to repurchase | 10,779,845 | 8,181,250 | ||||||
Other secured financings | 234,711 | 62,300 | ||||||
Obligation to return securities received as collateral | 11,063 | - | ||||||
Payables: | ||||||||
Brokers, dealers and clearing organizations | 1,281,253 | 2,819,677 | ||||||
Customers | 5,208,768 | 5,568,017 | ||||||
Accrued expenses and other liabilities | 1,217,141 | 1,062,068 | ||||||
Long-term debt | 6,232,806 | 4,804,607 | ||||||
Mandatorily redeemable convertible preferred stock | - | 125,000 | ||||||
Mandatorily redeemable preferred interests of consolidated subsidiaries | - | 348,051 | ||||||
Total liabilities | 34,755,322 | 32,510,788 | ||||||
EQUITY | ||||||||
Common stock, $0.0001 par value. Authorized 500,000,000 shares; issued 204,147,007 shares at November 30, 2012 | - | 20 | ||||||
Member's paid-in capital/ Additional paid-in capital | 5,280,420 | 2,219,959 | ||||||
Retained earnings | - | 1,281,855 | ||||||
Treasury stock, at cost, 835,033 shares at November 30, 2012 | - | (12,682 | ) | |||||
Accumulated other comprehensive income (loss): | ||||||||
Currency translation adjustments | 21,341 | (38,009 | ) | |||||
Additional minimum pension liability | 2,759 | (15,128 | ) | |||||
Total accumulated other comprehensive income (loss) | 24,100 | (53,137 | ) | |||||
Total member's / common stockholders' equity | 5,304,520 | 3,436,015 | ||||||
Noncontrolling interests | 117,154 | 346,738 | ||||||
Total equity | 5,421,674 | 3,782,753 | ||||||
Total liabilities and equity | $ | 40,176,996 | $ | 36,293,541 | ||||
Continued on next page.
Jef-5
JEFFERIES GROUP LLC AND SUBSIDIARIES
CONSOLIDATED STATEMENTS OF FINANCIAL CONDITION – CONTINUED
(In thousands)
The table below presents the carrying amount and classification of assets of consolidated variable interest entities ("VIEs") that can be used only to settle obligations of the consolidated VIEs and the liabilities of consolidated VIEs for which creditors (or beneficial interest holders) do not have recourse to our general credit. The assets and liabilities of these consolidated VIEs are included in the Consolidated Statements of Financial Condition and are presented net of intercompany eliminations.
Successor | Predecessor | |||||||
November 30, 2013 | November 30, 2012 | |||||||
Assets | ||||||||
Cash and cash equivalents | $ | 176 | $ | 388,279 | ||||
Financial instruments owned, at fair value | ||||||||
Corporate equity securities | - | 105,271 | ||||||
Corporate debt securities | - | 394,043 | ||||||
Mortgage- and asset-backed securities | - | 15,589 | ||||||
Loans and other receivables | 97,500 | 383,667 | ||||||
Investments, at fair value | 412 | 5,836 | ||||||
Total financial instruments owned, at fair value | 97,912 | 904,406 | ||||||
Receivables: | ||||||||
Brokers, dealers and clearing organizations | - | 236,594 | ||||||
Fees, interest and other | - | 10,931 | ||||||
Other assets | 2,275 | 348 | ||||||
Total assets | $ | 100,363 | $ | 1,540,558 | ||||
Liabilities | ||||||||
Financial instruments sold, not yet purchased, at fair value: | ||||||||
Corporate debt securities | - | 325,979 | ||||||
Loans | - | 199,610 | ||||||
Derivatives | - | 505 | ||||||
Total financial instruments sold, not yet purchased, at fair value | - | 526,094 | ||||||
Collateralized financings: | ||||||||
Other secured financings | 226,000 | 62,300 | ||||||
Payables: | ||||||||
Brokers, dealers and clearing organizations | - | 201,237 | ||||||
Accrued expenses and other liabilities | 706 | 10,656 | ||||||
Mandatorily redeemable preferred interests of consolidated subsidiaries | - | 348,051 | ||||||
Total liabilities | $ | 226,706 | $ | 1,148,338 | ||||
See accompanying notes to consolidated financial statements.
Jef-6
JEFFERIES GROUP LLC AND SUBSIDIARIES
CONSOLIDATED STATEMENTS OF EARNINGS
(In thousands, except per share amounts)
Successor | Predecessor | |||||||||||||||
Nine Months Ended | Three Months Ended | Year Ended | Year Ended | |||||||||||||
November 30, 2013 | February 28, 2013 | November 30, 2012 | November 30, 2011 | |||||||||||||
Revenues: | ||||||||||||||||
Commissions | $ | 472,596 | $ | 146,240 | $ | 548,437 | $ | 562,858 | ||||||||
Principal transactions | 399,091 | 300,278 | 1,035,974 | 428,035 | ||||||||||||
Investment banking | 1,003,517 | 288,278 | 1,125,883 | 1,122,528 | ||||||||||||
Asset management fees and investment income from managed funds | 36,093 | 10,883 | 26,966 | 44,125 | ||||||||||||
Interest | 714,248 | 249,277 | 1,031,839 | 1,248,132 | ||||||||||||
Other | 94,195 | 27,004 | 164,974 | 152,092 | ||||||||||||
Total revenues | 2,719,740 | 1,021,960 | 3,934,073 | 3,557,770 | ||||||||||||
Interest expense | 579,059 | 203,416 | 872,421 | 980,825 | ||||||||||||
Net revenues | 2,140,681 | 818,544 | 3,061,652 | 2,576,945 | ||||||||||||
Interest on mandatorily redeemable preferred interests of consolidated subsidiaries | 3,368 | 10,961 | 42,883 | 3,622 | ||||||||||||
Net revenues, less interest on mandatorily redeemable preferred interests of consolidated subsidiaries | 2,137,313 | 807,583 | 3,018,769 | 2,573,323 | ||||||||||||
Non-interest expenses: | ||||||||||||||||
Compensation and benefits | 1,213,908 | 474,217 | 1,770,798 | 1,482,604 | ||||||||||||
Non-compensation expenses: | ||||||||||||||||
Floor brokerage and clearing fees | 150,774 | 46,155 | 183,013 | 154,445 | ||||||||||||
Technology and communications | 193,683 | 59,878 | 244,511 | 215,940 | ||||||||||||
Occupancy and equipment rental | 86,701 | 24,309 | 97,397 | 84,951 | ||||||||||||
Business development | 63,115 | 24,927 | 95,330 | 93,645 | ||||||||||||
Professional services | 72,802 | 24,135 | 73,427 | 66,305 | ||||||||||||
Other | 92,035 | 14,475 | 62,498 | 56,099 | ||||||||||||
Total non-compensation expenses | 659,110 | 193,879 | 756,176 | 671,385 | ||||||||||||
Total non-interest expenses | 1,873,018 | 668,096 | 2,526,974 | 2,153,989 | ||||||||||||
Earnings before income taxes | 264,295 | 139,487 | 491,795 | 419,334 | ||||||||||||
Income tax expense | 94,686 | 48,645 | 168,646 | 132,966 | ||||||||||||
Net earnings | 169,609 | 90,842 | 323,149 | 286,368 | ||||||||||||
Net earnings attributable to noncontrolling interests | 8,418 | 10,704 | 40,740 | 1,750 | ||||||||||||
Net earnings attributable to Jefferies Group LLC | $ | 161,191 | $ | 80,138 | $ | 282,409 | $ | 284,618 | ||||||||
Earnings per common share: | ||||||||||||||||
Basic | N/A | $ | 0.35 | $ | 1.23 | $ | 1.28 | |||||||||
Diluted | N/A | $ | 0.35 | $ | 1.22 | $ | 1.28 | |||||||||
Dividends declared per common share | N/A | $ | 0.075 | $ | 0.300 | $ | 0.300 | |||||||||
Weighted average common shares: | ||||||||||||||||
Basic | N/A | 213,732 | 215,989 | 211,056 | ||||||||||||
Diluted | N/A | 217,844 | 220,101 | 215,171 | ||||||||||||
See accompanying notes to consolidated financial statements.
Jef-7
JEFFERIES GROUP LLC AND SUBSIDIARIES
CONSOLIDATED STATEMENTS OF COMPREHENSIVE INCOME
(In thousands)
Successor | Predecessor | |||||||||||||||
Nine Months Ended November 30, 2013 | Three Months Ended February 28, 2013 | Year Ended November 30, 2012 | Year Ended November 30, 2011 | |||||||||||||
Net earnings | $ | 169,609 | $ | 90,842 | $ | 323,149 | $ | 286,368 | ||||||||
Other comprehensive income, net of tax: | ||||||||||||||||
Currency translation adjustments | 21,341 | (10,018 | ) | 1,511 | 3,339 | |||||||||||
Minimum pension liability adjustments, net of tax (1) | 2,759 | - | (4,158 | ) | (2,551 | ) | ||||||||||
Total other comprehensive income, net of tax (2) | 24,100 | (10,018 | ) | (2,647 | ) | 788 | ||||||||||
Comprehensive income | 193,709 | 80,824 | 320,502 | 287,156 | ||||||||||||
Net earnings attributable to noncontrolling interests | 8,418 | 10,704 | 40,740 | 1,750 | ||||||||||||
Comprehensive income attributable to Jefferies Group LLC | $ | 185,291 | $ | 70,120 | $ | 279,762 | $ | 285,406 | ||||||||
(1) | Includes income tax benefit of $2.5 million, $-0-, $0.2 million and $1.8 million for the nine months ended November 30, 2013, three months ended February 28, 2013, and the years ended November 30, 2012 and 2011, respectively. |
(2) | No Other comprehensive income (loss) is attributable to noncontrolling interests. |
See accompanying notes to consolidated financial statements.
Jef-8
JEFFERIES GROUP LLC AND SUBSIDIARIES
CONSOLIDATED STATEMENTS OF CHANGES IN EQUITY
(In thousands, except per share amounts)
Successor | Predecessor | |||||||||||||||
Nine Months Ended November 30, 2013 | Three Months Ended February 28, 2013 | Year Ended November 30, 2012 | Year Ended November 30, 2011 | |||||||||||||
Common stock, par value $0.0001 per share | ||||||||||||||||
Balance, beginning of period | $ | - | $ | 20 | $ | 20 | $ | 20 | ||||||||
Issued | - | 1 | 1 | 2 | ||||||||||||
Retired | - | - | (1 | ) | (2 | ) | ||||||||||
Balance, end of period | $ | - | $ | 21 | $ | 20 | $ | 20 | ||||||||
Member's paid-in capital | ||||||||||||||||
Balance, beginning of period | $ | 4,754,101 | $ | - | $ | - | $ | - | ||||||||
Contributions | 362,255 | - | - | - | ||||||||||||
Net earnings to Jefferies Group LLC | 161,191 | - | - | - | ||||||||||||
Tax benefit for issuance of share-based awards | 2,873 | - | - | - | ||||||||||||
Balance, end of period | $ | 5,280,420 | $ | - | $ | - | $ | - | ||||||||
Additional paid-in capital | ||||||||||||||||
Balance, beginning of period | $ | - | $ | 2,219,959 | $ | 2,207,410 | $ | 2,218,123 | ||||||||
Benefit plan share activity (3) | - | 3,138 | 12,076 | 31,176 | ||||||||||||
Share-based expense, net of forfeitures and clawbacks | - | 22,288 | 83,769 | 134,076 | ||||||||||||
Proceeds from exercise of stock options | - | 57 | 104 | 95 | ||||||||||||
Acquisitions and contingent consideration | - | 2,535 | - | 419 | ||||||||||||
Tax (deficiency) benefit for issuance of share-based awards | - | (17,965 | ) | 19,789 | 32,200 | |||||||||||
Equity component of convertible debt, net of tax | - | - | (427 | ) | (217 | ) | ||||||||||
Dividend equivalents on share-based plans | - | 1,418 | 6,531 | 8,883 | ||||||||||||
Issuance of treasury stock | - | - | 97,770 | |||||||||||||
Retirement of treasury stock | - | - | (109,293 | ) | (315,115 | ) | ||||||||||
Balance, end of period | $ | - | $ | 2,231,430 | $ | 2,219,959 | $ | 2,207,410 | ||||||||
Retained earnings | ||||||||||||||||
Balance, beginning of period | $ | - | $ | 1,281,855 | $ | 1,067,858 | $ | 850,654 | ||||||||
Net earnings to common shareholders | - | 80,138 | 282,409 | 284,618 | ||||||||||||
Dividends | - | (17,217 | ) | (68,412 | ) | (67,414 | ) | |||||||||
Balance, end of period | $ | - | $ | 1,344,776 | $ | 1,281,855 | $ | 1,067,858 | ||||||||
Accumulated other comprehensive income (loss) (1) (2) | ||||||||||||||||
Balance, beginning of period | $ | - | $ | (53,137 | ) | $ | (50,490 | ) | $ | (51,278 | ) | |||||
Currency adjustment | 21,341 | (10,018 | ) | 1,511 | 3,339 | |||||||||||
Pension adjustment, net of tax | 2,759 | - | (4,158 | ) | (2,551 | ) | ||||||||||
Balance, end of period | $ | 24,100 | $ | (63,155 | ) | $ | (53,137 | ) | $ | (50,490 | ) | |||||
Treasury stock, at cost | ||||||||||||||||
Balance, beginning of period | $ | - | $ | (12,682 | ) | $ | (486 | ) | $ | (539,530 | ) | |||||
Purchases | - | (166,541 | ) | (113,562 | ) | (152,827 | ) | |||||||||
Returns / forfeitures | - | (1,922 | ) | (7,928 | ) | (20,368 | ) | |||||||||
Issues | - | - | 397,122 | |||||||||||||
Retirement of treasury stock | - | - | 109,294 | 315,117 | ||||||||||||
Balance, end of period | $ | - | $ | (181,145 | ) | $ | (12,682 | ) | $ | (486 | ) | |||||
Total member's / common stockholders' equity | $ | 5,304,520 | $ | 3,331,927 | $ | 3,436,015 | $ | 3,224,312 | ||||||||
Noncontrolling interests | ||||||||||||||||
Balance, beginning of period | $ | 356,180 | $ | 346,738 | $ | 312,663 | $ | 332,976 | ||||||||
Net earnings attributable to noncontrolling interests | 8,418 | 10,704 | 40,740 | 1,750 | ||||||||||||
Contributions | 100,210 | - | - | 1,713 | ||||||||||||
Distributions | (25 | ) | (1,262 | ) | (13,570 | ) | (22,056 | ) | ||||||||
Redemptions | (347,629 | ) | - | - | - | |||||||||||
Consolidation (deconsolidation) of asset management entity | - | - | 6,905 | (1,720 | ) | |||||||||||
Balance, end of period | $ | 117,154 | $ | 356,180 | $ | 346,738 | $ | 312,663 | ||||||||
Total equity | $ | 5,421,674 | $ | 3,688,107 | $ | 3,782,753 | $ | 3,536,975 | ||||||||
(1) | The components of other comprehensive loss are attributable to Jefferies Group LLC (formerly Jefferies Group, Inc.). None of the components of other comprehensive loss are attributable to noncontrolling interests. |
(2) | There were no reclassifications out of Accumulated other comprehensive loss during the nine months ended November 30, 2013. |
(3) | Includes grants related to the Incentive Plan, Deferred Compensation Plan, and Directors' Plan. |
See accompanying notes to consolidated financial statements.
Jef-9
JEFFERIES GROUP LLC AND SUBSIDIARIES
CONSOLIDATED STATEMENTS OF CASH FLOWS
(In thousands)
Successor | Predecessor | |||||||||||||||
Nine Months Ended November 30, 2013 | Three Months Ended February 28, 2013 | Year Ended November 30, 2012 | Year Ended November 30, 2011 | |||||||||||||
Cash flows from operating activities: | ||||||||||||||||
Net earnings | $ | 169,609 | $ | 90,842 | $ | 323,149 | $ | 286,368 | ||||||||
Adjustments to reconcile net earnings to net cash provided by (used in) operating activities: | ||||||||||||||||
Depreciation and amortization | (2,509 | ) | 17,393 | 72,692 | 68,522 | |||||||||||
Gain on conversion option | (6,914 | ) | - | - | - | |||||||||||
Bargain purchase gain | - | - | (3,368 | ) | (52,509 | ) | ||||||||||
Gain on repurchase of long-term debt | - | - | (9,898 | ) | (21,107 | ) | ||||||||||
Gain on sale of mortgage servicing rights | - | - | (23,826 | ) | - | |||||||||||
Interest on mandatorily redeemable preferred interests of consolidated subsidiaries | 3,368 | 10,961 | 42,883 | 3,622 | ||||||||||||
Accruals related to various benefit plans and stock issuances, net of forfeitures | - | 23,505 | 87,918 | 144,886 | ||||||||||||
Deferred income taxes | 31,284 | 30,835 | 84,643 | 30,177 | ||||||||||||
Income on loans to and investments in related parties | (92,181 | ) | - | - | - | |||||||||||
Distributions received on investments in related parties | 37,742 | - | - | - | ||||||||||||
Other adjustments | (7,826 | ) | (1,154 | ) | (4,094 | ) | (3,724 | ) | ||||||||
Net change in assets and liabilities: | ||||||||||||||||
Cash and securities segregated and on deposit for regulatory purposes or deposited with clearing and depository organizations | 113,754 | 352,891 | (738,117 | ) | 1,417,107 | |||||||||||
Receivables: | ||||||||||||||||
Brokers, dealers and clearing organizations | 336,263 | (1,027,671 | ) | (101,903 | ) | 1,652,426 | ||||||||||
Customers | 225 | (130,543 | ) | 200,679 | 385,686 | |||||||||||
Fees, interest and other | (29,388 | ) | (29,149 | ) | (33,694 | ) | 3,856 | |||||||||
Securities borrowed | (41,678 | ) | (224,557 | ) | 75,379 | 3,014,442 | ||||||||||
Financial instruments owned | (200,974 | ) | 229,394 | 52,737 | 299,558 | |||||||||||
Loans to and investments in related parties | - | (197,166 | ) | 7,302 | (375,031 | ) | ||||||||||
Investments in managed funds | 2,674 | (2,213 | ) | 12,977 | 60,855 | |||||||||||
Securities purchased under agreements to resell | (156,197 | ) | (224,418 | ) | (463,829 | ) | 372,470 | |||||||||
Other assets | 47,296 | (5,346 | ) | (22,178 | ) | (122,568 | ) | |||||||||
Payables: | ||||||||||||||||
Brokers, dealers and clearing organizations | (507,722 | ) | (1,031,335 | ) | (82,031 | ) | 880,998 | |||||||||
Customers | (249,305 | ) | (111,139 | ) | 804,539 | (2,324,839 | ) | |||||||||
Securities loaned | 600,539 | (28,138 | ) | 227,737 | (1,428,852 | ) | ||||||||||
Financial instruments sold, not yet purchased | (2,511,777 | ) | 2,327,667 | 801,971 | (2,892,462 | ) | ||||||||||
Securities sold under agreements to repurchase | 2,794,412 | (197,493 | ) | (1,439,130 | ) | (1,083,191 | ) | |||||||||
Accrued expenses and other liabilities | 414,515 | (267,336 | ) | 316,367 | (599,677 | ) | ||||||||||
Net cash provided by (used in) operating activities | 745,210 | (394,170 | ) | 188,905 | (282,987 | ) | ||||||||||
Cash flows from investing activities: | ||||||||||||||||
Contributions to loans to and investments in related parties | (2,241,232 | ) | - | - | - | |||||||||||
Distributions from loans to and investments in related parties | 2,360,691 | - | - | - | ||||||||||||
Net payments on premises and equipment | (48,534 | ) | (10,706 | ) | (63,236 | ) | (77,330 | ) | ||||||||
Cash received (paid) in connection with acquisition during the period, net of cash acquired | - | - | 2,257 | (320,697 | ) | |||||||||||
Cash disposed in connection with disposal of reporting units, net of cash received | (4,939 | ) | - | - | - | |||||||||||
Cash received from sales of mortgage servicing rights | - | - | 30,851 | - | ||||||||||||
Consolidation of asset management entity | - | - | 9,711 | - | ||||||||||||
Cash received from contingent consideration | 3,796 | 1,203 | 4,104 | 3,733 | ||||||||||||
Cash paid from contingent consideration | - | - | (1,172 | ) | (754 | ) | ||||||||||
Net cash provided by (used in) investing activities | 69,782 | (9,503 | ) | (17,485 | ) | (395,048 | ) | |||||||||
Continued on next page.
Jef-10
JEFFERIES GROUP LLC AND SUBSIDIARIES
CONSOLIDATED STATEMENTS OF CASH FLOWS – CONTINUED
(In thousands)
Successor | Predecessor | |||||||||||||||
Nine Months Ended November 30, 2013 | Three Months Ended February 28, 2013 | Year Ended November 30, 2012 | Year Ended November 30, 2011 | |||||||||||||
Cash flows from financing activities: | ||||||||||||||||
Excess tax benefits from the issuance of share-based awards | $ | 3,054 | $ | 5,682 | $ | 31,413 | $ | 34,552 | ||||||||
Proceeds from short-term borrowings | 13,623,650 | 6,744,000 | 12,912,063 | 3,032,010 | ||||||||||||
Payments on short-term borrowings | (13,711,650 | ) | (6,794,000 | ) | (12,819,557 | ) | (3,283,231 | ) | ||||||||
Proceeds from secured credit facility | 920,000 | 900,000 | 1,325,000 | 260,000 | ||||||||||||
Payments on secured credit facility | (980,000 | ) | (990,007 | ) | (1,075,000 | ) | (160,000 | ) | ||||||||
Repayment of long-term debt | - | - | (253,232 | ) | - | |||||||||||
Proceeds from other secured financings | 114,711 | 60,000 | - | - | ||||||||||||
Payments on repurchase of long-term debt | - | - | (1,435 | ) | (49,692 | ) | ||||||||||
Payments on mandatorily redeemable preferred interest of consolidated subsidiaries | (64 | ) | (61 | ) | (5,366 | ) | (8,973 | ) | ||||||||
Payments on repurchase of common stock | - | (166,541 | ) | (113,562 | ) | (152,827 | ) | |||||||||
Payments on dividends | - | (15,799 | ) | (61,881 | ) | (58,531 | ) | |||||||||
Proceeds from exercise of stock options, not including tax benefits | - | 57 | 104 | 95 | ||||||||||||
Net proceeds from issuance of common shares | - | - | - | 494,892 | ||||||||||||
Net proceeds from issuance of senior notes, net of issuance costs | - | 991,469 | 201,010 | 794,587 | ||||||||||||
Proceeds from contributions of noncontrolling interests | 100,210 | - | - | 1,713 | ||||||||||||
Payments on distributions to noncontrolling interests | (347,654 | ) | (1,262 | ) | (13,570 | ) | (22,056 | ) | ||||||||
Net cash (used in) provided by financing activities | (277,743 | ) | 733,538 | 125,987 | 882,539 | |||||||||||
Effect of exchange rate changes on cash and cash equivalents | 5,912 | (4,502 | ) | 1,391 | 295 | |||||||||||
Net increase in cash and cash equivalents | 543,161 | 325,363 | 298,798 | 204,799 | ||||||||||||
Cash and cash equivalents at beginning of period | 3,017,958 | 2,692,595 | 2,393,797 | 2,188,998 | ||||||||||||
Cash and cash equivalents at end of period | $ | 3,561,119 | $ | 3,017,958 | $ | 2,692,595 | $ | 2,393,797 | ||||||||
Supplemental disclosures of cash flow information: | ||||||||||||||||
Cash paid (received) during the period for: | ||||||||||||||||
Interest | $ | 638,657 | $ | 178,836 | $ | 869,354 | $ | 943,031 | ||||||||
Income taxes, net of refunds | 55,251 | (34,054 | ) | 43,113 | 153,416 | |||||||||||
Noncash financing activities: | ||||||||||||||||
In connection with the merger with Leucadia National Corporation, Jefferies Group LLC recorded acquisition accounting adjustments which resulted in changes to equity. Refer to Note 4, Leucadia Merger and Related Transactions, for further details. | ||||||||||||||||
On March 31, 2013, Leucadia contributed its mandatorily redeemable preferred interests in JHYH to Jefferies Group, LLC. The contribution was recorded as a capital contribution and increased member's equity by $362.3 million. Refer to Note 4, Leucadia Merger and Related Transactions, for further details. | ||||||||||||||||
See accompanying notes to consolidated financial statements.
Jef-11
JEFFERIES GROUP LLC AND SUBSIDIARIES
NOTES TO CONSOLIDATED FINANCIAL STATEMENTS
Index
Note | Page | |||
Note 1. Organization and Basis of Presentation | 74 | |||
Note 2. Summary of Significant Accounting Policies | 76 | |||
Note 3. Accounting Developments | 83 | |||
Note 4. Leucadia Merger and Related Transactions | 85 | |||
Note 5. Acquisitions | 87 | |||
Note 6. Cash, Cash Equivalents and Short-Term Investments | 88 | |||
Note 7. Fair Value Disclosures | 89 | |||
Note 8. Derivative Financial Instruments | 103 | |||
Note 9. Collateralized Transactions | 107 | |||
Note 10. Securitization Activities | 108 | |||
Note 11. Variable Interest Entities | 109 | |||
Note 12. Investments | 114 | |||
Note 13. Goodwill and Other Intangible Assets | 116 | |||
Note 14. Short-Term Borrowings | 119 | |||
Note 15. Long-Term Debt | 120 | |||
Note 16. Mandatorily Redeemable Convertible Preferred Stock | 121 | |||
Note 17. Noncontrolling Interests and Mandatorily Redeemable Preferred Interests of Consolidated Subsidiaries | 122 | |||
Note 18. Benefit Plans | 122 | |||
Note 19. Compensation Plans | 127 | |||
Note 20. Earnings per Share | 130 | |||
Note 21. Income Taxes | 131 | |||
Note 22. Commitments, Contingencies and Guarantees | 134 | |||
Note 23. Net Capital Requirements | 138 | |||
Note 24. Segment Reporting | 138 | |||
Note 25. Related Party Transactions | 140 | |||
Note 26. Selected Quarterly Financial Data (Unaudited) | 141 | |||
Jef-12
JEFFERIES GROUP LLC AND SUBSIDIARIES
November 30, 2013 and 2012
NOTES TO CONSOLIDATED FINANCIAL STATEMENTS
Note 1. Organization and Basis of Presentation
Organization
Jefferies Group LLC, and its subsidiaries operate as a global full service, integrated securities and investment banking firm. Jefferies Group LLC was previously known as Jefferies Group, Inc., which on March 1, 2013 was converted into a limited liability company and renamed Jefferies Group LLC. In addition, certain subsidiaries of Jefferies Group, Inc. also converted into limited liability companies. The accompanying Consolidated Financial Statements therefore refer to Jefferies Group LLC and represent the accounts of Jefferies Group, Inc., as it was formerly known, and all our subsidiaries (together "we" or "us"). The subsidiaries of Jefferies Group LLC include Jefferies LLC ("Jefferies"), Jefferies Execution Services, Inc. ("Jefferies Execution"), Jefferies Bache, LLC, Jefferies International Limited, Jefferies Bache Limited, Jefferies Hong Kong Limited, Jefferies Bache Financial Services, Inc., Jefferies Mortgage Funding, LLC and Jefferies Leveraged Credit Products, LLC and all other entities in which we have a controlling financial interest or are the primary beneficiary.
On March 1, 2013, Jefferies Group LLC through a series of merger transactions, became an indirect wholly owned subsidiary of Leucadia National Corporation ("Leucadia") (referred to herein as the "Merger"). Each outstanding share of Jefferies Group LLC was converted into 0.81 of a share of Leucadia common stock (the "Exchange Ratio"). Leucadia did not assume nor guarantee any of our outstanding debt securities. Our 3.875% Convertible Senior Debentures due 2029 are now convertible into Leucadia common shares at a price that reflects the Exchange Ratio and the 3.25% Series A Convertible Cumulative Preferred Stock of Jefferies Group, Inc. was exchanged for a comparable series of convertible preferred shares of Leucadia. Jefferies Group LLC continues to operate as a full-service investment banking firm and as the holding company of its various regulated and unregulated operating subsidiaries. Richard Handler, our Chief Executive Officer and Chairman, was also appointed the Chief Executive Officer of Leucadia, as well as a Director of Leucadia. Brian Friedman, our Chairman of the Executive Committee, was also appointed Leucadia's President and a Director of Leucadia. Following the merger, we continue to operate as a full-service global investment banking firm, retain a credit rating separate from Leucadia and remain an SEC reporting company, filing annual, quarterly and periodic financial reports.
We operate in two business segments, Capital Markets and Asset Management. Capital Markets, which represents principally our entire business, includes our securities, commodities, futures and foreign exchange trading and investment banking activities, which provides the research, sales, trading, origination and advisory effort for various equity, fixed income and advisory products and services. Asset Management provides investment management services to various private investment funds, separate accounts and mutual funds. Our parent, Leucadia is establishing an asset management business and we expect to transition our limited asset management business to Leucadia during 2014.
In addition, on April 1, 2013, we merged Jefferies High Yield Trading, LLC (our high yield trading broker-dealer) with Jefferies (a U.S. broker-dealer) and our high yield activities are now all conducted by Jefferies. In addition, during the three months ended May 31, 2013, we redeemed the third party interests in our high yield joint venture.
On July 1, 2011, we acquired Prudential Bache's Global Commodities Group ("Global Commodities Group" or "Jefferies Bache") from Prudential Financial Inc. ("Prudential"). The Global Commodities Group provided execution and clearing services (including sales and trading activities) covering a wide variety of commodity, financial and foreign exchange futures, swaps and forward contracts to an institutional client base. The acquisition allowed us to offer clients globally an increased range of products, including exchange-traded futures and over-the-counter trading in energy, metals and agricultural markets. On February 1, 2012, we acquired the corporate broking business of Hoare Govett from The Royal Bank of Scotland Group plc ("RBS"). The acquired business represented the corporate broking business carried on under the name RBS Hoare Govett in the United Kingdom and comprised corporate broking advice and services. The acquisition of Hoare Govett provided us with the opportunity to continue our growth in corporate broking in the U.K. and significantly expand the capabilities and reach of our established European Investment Banking and Equities business units. See Note 5, Acquisitions for further details.
Jef-13
Basis of Presentation
The accompanying Consolidated Financial Statements have been prepared in accordance with U.S. generally accepted accounting principles ("U.S. GAAP") for financial information and with the instructions to Form 10-K.
As more fully described in Note 4, Leucadia Merger and Related Transactions, the Merger is accounted for using the acquisition method of accounting, which requires that the assets, including identifiable intangible assets, and liabilities of Jefferies Group LLC be recorded at their fair values at the date of the Merger. The application of the acquisition method of accounting has been pushed down and reflected in the financial statements of Jefferies Group LLC as a wholly-owned subsidiary of Leucadia. The application of push down accounting represents the termination of the prior reporting entity and the creation of a new reporting entity, which do not have the same bases of accounting. As a result, our consolidated financial statements for 2013 are presented for the period from March 1, 2013 through November 30, 2013 for the new reporting entity (the "Successor"), and before March 1, 2013 for the prior reporting entity (the "Predecessor.") The Predecessor and Successor periods are separated by a vertical line to highlight the fact that the financial information for such periods have been prepared under two different cost bases of accounting.
We have made a number of estimates and assumptions relating to the reporting of assets and liabilities and the disclosure of contingent assets and liabilities to prepare these financial statements in conformity with U.S. GAAP. The most important of these estimates and assumptions relate to fair value measurements, compensation and benefits, goodwill and intangible assets, the ability to realize deferred tax assets and the recognition and measurement of uncertain tax positions. Although these and other estimates and assumptions are based on the best available information, actual results could be materially different from these estimates.
Cash Flow Statement Presentation
For the nine months ended November 30, 2013, certain amounts relating to loans and investments in related parties are classified as components of investing activities on the Consolidated Statements of Cash Flows to conform to the presentation of our Parent company in connection with the establishment of a new accounting entity through the application of push down accounting. These amounts were classified by the Predecessor entity as operating activities for reporting periods prior to the merger.
Consolidation
Our policy is to consolidate all entities in which we control by ownership a majority of the outstanding voting stock. In addition, we consolidate entities which meet the definition of a variable interest entity for which we are the primary beneficiary. The primary beneficiary is the party who has the power to direct the activities of a variable interest entity that most significantly impact the entity's economic performance and who has an obligation to absorb losses of the entity or a right to receive benefits from the entity that could potentially be significant to the entity. For consolidated entities that are less than wholly owned, the third-party's holding of equity interest is presented as Noncontrolling interests in the Consolidated Statements of Financial Condition and Consolidated Statements of Changes in Equity. The portion of net earnings attributable to the noncontrolling interests are presented as Net earnings to noncontrolling interests in the Consolidated Statements of Earnings.
In situations where we have significant influence, but not control, of an entity that does not qualify as a variable interest entity, we apply either the equity method of accounting or fair value accounting pursuant to the fair value option election under U.S. GAAP, with our portion of net earnings or gains and losses recorded within Other revenues or Principal transaction revenues, respectively. We also have formed nonconsolidated investment vehicles with third-party investors that are typically organized as partnerships or limited liability companies and are carried at fair value. We act as general partner or managing member for these investment vehicles and have generally provided the third-party investors with termination or "kick-out" rights.
Intercompany accounts and transactions are eliminated in consolidation.
Immaterial 2013 Adjustments
We have made correcting adjustments (referred to as "adjustments") to our historical financial statements for the quarters of 2013 and for the year ended November 30, 2013, the results of which are included within our financial statements for the nine months ended November 30, 2013. We do not believe these adjustments are material to our financial statements for any previously reported period.
The first adjustment relates to a revised estimate of our litigation reserve resulting in an additional $17.0 million on a pre-tax basis recognized in Other expenses in the fourth quarter of 2013. We have adjusted our estimate of the reserve relating to an investigation of the purchases and sales of mortgage-backed securities based on an agreement reached in principle subsequent to our report on Form 8-K, dated December 17, 2013 in which we announced our financial results for our fiscal fourth quarter of 2013. Additionally, we have reduced our estimate for bad debt provision on certain investment banking receivables on a pre-tax basis by $1.3 million in the fourth quarter of 2013 resulting in a reduction in Other expenses by such amount in this Annual Report on Form 10-K for the year ended November 30, 2013. The impact of these adjustments is a reduction in Income tax expense of $1.2 million and a reduction in Net earnings of $14.5 million during the fourth quarter of 2013.
In addition to and unrelated to the adjustments described above, we have reduced Income tax expense by $4.4 million to correct for income tax expense recognized during the fourth quarter of 2013. It was determined that such income tax expense properly related to each of the years from fiscal 2009 to fiscal 2012. This had the effect of understating goodwill in the purchase price allocation by $4.4 million as the additional income tax liability in existence at the merger date reduces the fair value of the net assets acquired. We have evaluated the effects of this correction and concluded that it is not material to the previously issued Annual Reports on Form 10-K for the previously reported periods or to the previously issued Quarterly Reports on Form 10-Q for the three months ended May 31, 2013 and August 31, 2013. Nevertheless, we have revised our consolidated net earnings for the nine months ended November 30, 2013 as reflected in this Form 10-K for the year ended November 30, 2013 to correct for the effect of this item and appropriately reflected the increase of $4.4 million in goodwill within our Consolidated Statement of Financial Condition.
Further, we are adjusting Commissions revenues and Floor brokerage and clearing fees in the respective financial statement line items to reflect certain exchange fees charged to customers in our futures business on a gross rather than net basis for $60.6 million in 2013. Although Floor brokerage and clearing fees were recorded on a net basis to Commissions revenue, thereby resulting in an understatement in Commissions revenues, Total revenues, Net revenues, Floor brokerage and clearing fees and Total non-interest expenses for various periods, there was no impact on Net earnings. We do not believe these adjustments are material to our consolidated financial statements for any reported period.
Jef-14
Immaterial Prior Year Adjustments
Similar to the 2013 adjustments to Commissions revenues and Floor brokerage and clearing fees discussed above, we are also revising our prior period consolidated financial statements for these items. The impact of these adjustments is an increase of $62.9 million and $28.1 million, in both the Commissions revenue and Floor brokerage and clearing fees, for the years ended November 30, 2012 and 2011, respectively. We do not believe these adjustments are material to our consolidated financial statements for any reported period.
The following sets forth the effects of the adjustments on affected line items within our previously reported Consolidated Statements of Earnings for 2012 and 2011. There is no effect on our Consolidated Statement of Financial Condition as of November 30, 2012, Consolidated Statements of Changes in Stockholders' Equity for the years 2012 and 2011 and Consolidated Statements of Cash Flows for the years 2012 and 2011.
Consolidated Statement of Earnings
Year Ended November 30, | ||||||||||||||||
2012 | 2011 | |||||||||||||||
(in thousands) | As Previously Reported | Adjusted | As Previously Reported | Adjusted | ||||||||||||
Commissions revenues | $ | 485,569 | $ | 548,437 | $ | 534,726 | $ | 562,858 | ||||||||
Total revenues | 3,871,205 | 3,934,073 | 3,529,638 | 3,557,770 | ||||||||||||
Net revenues | 2,998,784 | 3,061,652 | 2,548,813 | 2,576,945 | ||||||||||||
Net revenues, less mandatorily redeemable preferred interest | 2,955,901 | 3,018,769 | 2,545,191 | 2,573,323 | ||||||||||||
Floor brokerage and clearing fees | 120,145 | 183,013 | 126,313 | 154,445 | ||||||||||||
Total non-compensation expenses | 693,308 | 756,176 | 643,253 | 671,385 | ||||||||||||
Total non-interest expenses | 2,464,106 | 2,526,974 | 2,125,857 | 2,153,989 | ||||||||||||
Note 2. Summary of Significant Accounting Policies
Revenue Recognition Policies
Commissions. All customer securities transactions are reported on the Consolidated Statements of Financial Condition on a settlement date basis with related income reported on a trade-date basis. We permit institutional customers to allocate a portion of their gross commissions to pay for research products and other services provided by third parties. The amounts allocated for those purposes are commonly referred to as soft dollar arrangements. These arrangements are accounted for on an accrual basis and, as we are not the primary obligor for these arrangements, netted against commission revenues in the Consolidated Statements of Earnings. The commissions and related expenses on client transactions executed by Jefferies Bache, LLC, a futures commission merchant, are recorded on a half-turn basis.
Principal Transactions. Financial instruments owned and Financial instruments sold, but not yet purchased (all of which are recorded on a trade-date basis) are carried at fair value with gains and losses reflected in Principal transactions in the Consolidated Statements of Earnings on a trade date basis. Fees received on loans carried at fair value are also recorded within Principal transactions.
Investment Banking . Underwriting revenues and fees from mergers and acquisitions, restructuring and other investment banking advisory assignments or engagements are recorded when the services related to the underlying transactions are completed under the terms of the assignment or engagement. Expenses associated with such assignments are deferred until reimbursed by the client, the related revenue is recognized or the engagement is otherwise concluded. Expenses are recorded net of client reimbursements and netted against revenues. Unreimbursed expenses with no related revenues are included in Business development and Professional services expenses in the Consolidated Statements of Earnings.
Asset Management Fees and Investment Income From Managed Funds . Asset management fees and investment income from managed funds include revenues we earn from management, administrative and performance fees from funds and accounts managed by us, revenues from management and performance fees we earn from related-party managed funds and investment income from our investments in these funds. We earn fees in connection with management and investment advisory services performed for various funds and managed accounts. These fees are based on assets under management or an agreed upon notional amount and may include performance fees based upon the performance of the funds. Management and administrative fees are generally recognized over the period that the related service is provided. Generally, performance fees are earned when the return on assets under management exceeds certain benchmark returns, "high-water marks" or other performance targets. Performance fees are accrued (or reversed) on a monthly basis based on measuring performance to date versus any relevant benchmark return hurdles stated in the investment management agreement. Performance fees are not subject to adjustment once the measurement period ends (generally annual periods) and the performance fees have been realized.
Interest Revenue and Expense. We recognize contractual interest on Financial instruments owned and Financial instruments sold, but not yet purchased, on an accrual basis as a component of interest revenue and expense. Interest flows on derivative trading transactions and dividends are included as part of the fair valuation of these contracts and recognized in Principal transactions in the Consolidated Statements of Earnings rather than as a component of interest revenue or expense. We account for our short-term borrowings, long-term borrowings and our mandatorily redeemable convertible preferred stock on an accrual basis with related interest recorded as Interest expense. Discounts/premiums arising on our long-term debt are accreted / amortized to Interest expense using the effective yield method over the remaining lives of the underlying debt obligations. In addition, we recognize interest revenue related to our securities borrowed and securities purchased under agreements to resell activities and interest expense related to our securities loaned and securities sold under agreements to repurchase activities on an accrual basis.
Jef-15
Cash Equivalents
Cash equivalents include highly liquid investments, including money market funds, not held for resale with original maturities of three months or less.
Cash and Securities Segregated and on Deposit for Regulatory Purposes or Deposited With Clearing and Depository Organizations
In accordance with Rule 15c3-3 of the Securities Exchange Act of 1934, Jefferies as a broker-dealer carrying client accounts, is subject to requirements related to maintaining cash or qualified securities in a segregated reserve account for the exclusive benefit of its clients. In addition, certain financial instruments used for initial and variation margin purposes with clearing and depository organizations are recorded in this caption. Jefferies Bache, LLC, as a futures commission merchant, is obligated by rules mandated by the Commodities Futures Trading Commission under the Commodities Exchange Act, to segregate or set aside cash or qualified securities to satisfy such regulations, which regulations have been promulgated to protect customer assets. Certain other entities are also obligated by rules mandated by their primary regulators to segregate or set aside cash or equivalent securities to satisfy regulations, promulgated to protect customer assets.
Financial Instruments
Financial instruments owned and Financial instruments sold, not yet purchased are recorded at fair value, either as required by accounting pronouncements or through the fair value option election. These instruments primarily represent our trading activities and include both cash and derivative products. Gains and losses are recognized in Principal transactions in our Consolidated Statements of Earnings. The fair value of a financial instrument is the amount that would be received to sell an asset or paid to transfer a liability in an orderly transaction between market participants at the measurement date (the exit price).
Fair Value Hierarchy
In determining fair value, we maximize the use of observable inputs and minimize the use of unobservable inputs by requiring that observable inputs be used when available. Observable inputs are inputs that market participants would use in pricing the asset or liability based on market data obtained from independent sources. Unobservable inputs reflect our assumptions that market participants would use in pricing the asset or liability developed based on the best information available in the circumstances. We apply a hierarchy to categorize our fair value measurements broken down into three levels based on the transparency of inputs as follows:
Level 1: | Quoted prices are available in active markets for identical assets or liabilities as of the reported date. |
Level 2: | Pricing inputs are other than quoted prices in active markets, which are either directly or indirectly observable as of the reported date. The nature of these financial instruments include cash instruments for which quoted prices are available but traded less frequently, derivative instruments whose fair value have been derived using a model where inputs to the model are directly observable in the market, or can be derived principally from or corroborated by observable market data, and instruments that are fair valued using other financial instruments, the parameters of which can be directly observed. |
Level 3: | Instruments that have little to no pricing observability as of the reported date. These financial instruments are measured using management's best estimate of fair value, where the inputs into the determination of fair value require significant management judgment or estimation. |
Financial instruments are valued at quoted market prices, if available. Certain financial instruments have bid and ask prices that can be observed in the marketplace. For financial instruments whose inputs are based on bid-ask prices, the financial instrument is valued at the point within the bid-ask range that meets our best estimate of fair value. We use prices and inputs that are current as of the measurement date. For financial instruments that do not have readily determinable fair values using quoted market prices, the determination of fair value is based upon consideration of available information, including types of financial instruments, current financial information, restrictions on dispositions, fair values of underlying financial instruments and quotations for similar instruments.
The valuation of financial instruments may include the use of valuation models and other techniques. Adjustments to valuations derived from valuation models may be made when, in management's judgment, features of the financial instrument such as its complexity, the market in which the financial instrument is traded and risk uncertainties about market conditions require that an adjustment be made to the value derived from the models. Adjustments from the price derived from a valuation model reflect management's judgment that other participants in the market for the financial instrument being measured at fair value would also consider in valuing that same financial instrument. To the extent that valuation is based on models or inputs that are less observable or unobservable in the market, the determination of fair value requires more judgment.
The availability of observable inputs can vary and is affected by a wide variety of factors, including, for example, the type of financial instrument and market conditions. As the observability of prices and inputs may change for a financial instrument from period to period, this condition may cause a transfer of an instrument among the fair value hierarchy levels. Transfers among the levels are recognized at the beginning of each period. The degree of judgment exercised in determining fair value is greatest for instruments categorized in Level 3.
Valuation Process for Financial Instruments
Our Independent Price Verification ("IPV") Group, which is part of our Finance department, in partnership with Risk Management, is responsible for establishing our valuation policies and procedures. The IPV Group and Risk Management, which are independent of our business functions, play an important role and serve as a control function in determining that our financial instruments are appropriately valued and that fair value measurements are reliable. This is particularly important where prices or valuations that require inputs are less observable. In the event that observable inputs are not available, the control processes are designed to assure that the valuation approach utilized is appropriate and consistently applied and that the assumptions are reasonable. The IPV Group reports to the Global Controller and is subject to the oversight of the IPV Committee, which is comprised of our Chief Financial Officer, Global Controller, Global Head of Product Control, Chief Risk Officer and Principal Accounting Officer, among other personnel. Our independent price verification policies and procedures are reviewed, at a minimum, annually and changes to the policies require the approval of the IPV Committee.
Jef-16
Price Testing Process. The business units are responsible for determining the fair value of our financial instruments using approved valuation models and methodologies. In order to ensure that the business unit valuations represent a fair value exit price, the IPV Group tests and validates the fair value of our financial instruments inventory. In the testing process, the IPV Group obtains prices and valuation inputs from sources independent of Jefferies, consistently adheres to established procedures set forth in our valuation policies for sourcing prices and valuation inputs and utilizing valuation methodologies. Sources used to validate fair value prices and inputs include, but are not limited to, exchange data, recently executed transactions, pricing data obtained from third party vendors, pricing and valuation services, broker quotes and observed comparable transactions.
To the extent discrepancies between the business unit valuations and the pricing or valuations resulting from the price testing process are identified, such discrepancies are investigated by the IPV Group and fair values are adjusted, as appropriate. The IPV Group maintains documentation of its testing, results, rationale and recommendations and prepares a monthly summary of its valuation results. This process also forms the basis for our classification of fair values within the fair value hierarchy (i.e., Level 1, Level 2 or Level 3). The IPV Group utilizes the additional expertise of Risk Management personnel in valuing more complex financial instruments and financial instruments with less or limited pricing observability. The results of the valuation testing are reported to the IPV Committee on a monthly basis, which discusses the results and is charged with the final conclusions as to the financial instrument fair values in the consolidated financial statements. This process specifically assists the Chief Financial Officer in asserting as to the fair presentation of our financial condition and results of operations as included within our Quarterly Reports on Form 10-Q and Annual Report on Form 10-K. At each quarter end, the overall valuation results, as concluded upon by the IPV Committee, are presented to the Audit Committee.
Judgment exercised in determining Level 3 fair value measurements is supplemented by daily analysis of profit and loss performed by the Product Control functions. Gains and losses, which result from changes in fair value, are evaluated and corroborated daily based on an understanding of each of the trading desks' overall risk positions and developments in a particular market on the given day. Valuation techniques generally rely on recent transactions of suitably comparable financial instruments and use the observable inputs from those comparable transactions as a validation basis for Level 3 inputs. Level 3 fair value measurements are further validated through subsequent sales testing and market comparable sales, if such information is available. Level 3 fair value measurements require documentation of the valuation rationale applied, which is reviewed for consistency in application from period to period; and the documentation includes benchmarking the assumptions underlying the valuation rationale against relevant analytic data.
Third Party Pricing Information. Pricing information obtained from external data providers (including independent pricing services and brokers) may incorporate a range of market quotes from dealers, recent market transactions and benchmarking model derived prices to quoted market prices and trade data for comparable securities. External pricing data is subject to evaluation for reasonableness by the IPV Group using a variety of means including comparisons of prices to those of similar product types, quality and maturities, consideration of the narrowness or wideness of the range of prices obtained, knowledge of recent market transactions and an assessment of the similarity in prices to comparable dealer offerings in a recent time period. We have a process whereby we challenge the appropriateness of pricing information obtained from external data providers (including independent pricing services and brokers) in order to validate the data for consistency with the definition of a fair value exit price. Our process includes understanding and evaluating the external data providers' valuation methodologies. For corporate, U.S. government and agency, and municipal debt securities, and loans, to the extent independent pricing services or broker quotes are utilized in our valuation process, the vendor service providers are collecting and aggregating observable market information as to recent trade activity and active bid-ask submissions. The composite pricing information received from the independent pricing service is not based on unobservable inputs or proprietary models. For mortgage- and other asset-backed securities and collateralized debt obligations, our independent pricing service uses a matrix evaluation approach incorporating both observable yield curves and market yields on comparable securities as well as implied inputs from observed trades for comparable securities in order to determine prepayment speeds, cumulative default rates and loss severity. Further, we consider pricing data from multiple service providers as available as well as compare pricing data to prices we have observed for recent transactions, if any, in order to corroborate our valuation inputs.
Model Review Process. Where a pricing model is to be used to determine fair value, the pricing model is reviewed for theoretical soundness and appropriateness by Risk Management, independent from the trading desks, and then approved by Risk Management to be used in the valuation process. Review and approval of a model for use may include benchmarking the model against relevant third party valuations, testing sample trades in the model, backtesting the results of the model against actual trades and stress-testing the sensitivity of the pricing model using varying inputs and assumptions. In addition, recently executed comparable transactions and other observable market data are considered for purposes of validating assumptions underlying the model. Models are independently reviewed and validated by Risk Management annually or more frequently if market conditions or use of the valuation model changes.
Jef-17
Investments in Managed Funds
Investments in managed funds include our investments in funds managed by us and our investments in related-party managed funds in which we are entitled to a portion of the management and/or performance fees. Investments in nonconsolidated managed funds are accounted for at fair value with gains or losses included in Asset management fees and investment income from managed funds in the Consolidated Statements of Earnings.
Loans to and Investments in Related Parties
Loans to and investments in related parties include investments in private equity and other operating entities made in connection with our capital markets activities in which we exercise significant influence over operating and capital decisions and loans issued in connection with such activities. Loans to and investments in related parties are accounted for using the equity method or at cost, as appropriate. Revenues on Loans to and investments in related parties are included in Other revenues in the Consolidated Statements of Earnings. See Note 12, Investments, and Note 25, Related Party Transactions, for additional information regarding certain of these investments.
Receivable from and Payable to Customers
Receivable from and payable to customers includes amounts receivable and payable on cash and margin transactions. Securities owned by customers and held as collateral for these receivables are not reflected in the accompanying consolidated financial statements. Receivable from officers and directors included within this financial statement line item represents balances arising from their individual security transactions. These transactions are subject to the same regulations as customer transactions and are provided on substantially the same terms.
Securities Borrowed and Securities Loaned
Securities borrowed and securities loaned are carried at the amounts of cash collateral advanced and received in connection with the transactions and accounted for as collateralized financing transactions. In connection with both trading and brokerage activities, we borrow securities to cover short sales and to complete transactions in which customers have failed to deliver securities by the required settlement date, and lend securities to other brokers and dealers for similar purposes. We have an active securities borrowed and lending matched book business in which we borrow securities from one party and lend them to another party. When we borrow securities, we generally provide cash to the lender as collateral, which is reflected in our Consolidated Statements of Financial Condition as Securities borrowed. We earn interest revenues on this cash collateral. Similarly, when we lend securities to another party, that party provides cash to us as collateral, which is reflected in our Consolidated Statements of Financial Condition as Securities loaned. We pay interest expense on the cash collateral received from the party borrowing the securities. The initial collateral advanced or received approximates or is greater than the fair value of the securities borrowed or loaned. We monitor the fair value of the securities borrowed and loaned on a daily basis and request additional collateral or return excess collateral, as appropriate.
Securities Purchased Under Agreements to Resell and Securities Sold Under Agreements to Repurchase
Securities purchased under agreements to resell and Securities sold under agreements to repurchase (collectively "repos") are accounted for as collateralized financing transactions and are recorded at their contracted resale or repurchase amount plus accrued interest. We earn and incur interest over the term of the repo, which is reflected in Interest income and Interest expense on our Consolidated Statements of Earnings on an accrual basis. Repos are presented in the Consolidated Statements of Financial Condition on a net-basis-by counterparty, where permitted by generally accepted accounting principles. We monitor the fair value of the underlying securities daily versus the related receivable or payable balances. Should the fair value of the underlying securities decline or increase, additional collateral is requested or excess collateral is returned, as appropriate.
Premises and Equipment
Premises and equipment are depreciated using the straight-line method over the estimated useful lives of the related assets (generally three to ten years). Leasehold improvements are amortized using the straight-line method over the term of the related leases or the estimated useful lives of the assets, whichever is shorter. Premises and equipment includes internally developed software, which was increased to its fair market value in the allocation of the purchase price on March 1, 2013. The revised carrying values of internally developed software ready for its intended use are depreciated over the remaining useful life. See Note 4, Leucadia Merger and Related Transactions for more information regarding the allocation of the purchase price.
As of November 30, 2013 and 2012, furniture, fixtures and equipment amounted to $278.5 million and $266.2 million, respectively, and leasehold improvements amounted to $134.1 million and $133.1 million, respectively. Accumulated depreciation and amortization was $210.1 million and $213.3 million as of November 30, 2013 and 2012, respectively. Included within furniture, fixtures and equipment is equipment recorded under capital leases with a cost of $ $19.5 million at November 30, 2013 and 2012, which is being amortized over the lease term.
Depreciation and amortization expense amounted to $38.8 million for the nine months ended November 30, 2013, $12.9 million for the three months ended February 28, 2013 and $50.5 million and $43.7 million for the years ended November 30, 2012 and 2011, respectively.
Jef-18
Goodwill and Intangible Assets
Goodwill . Goodwill represents the excess acquisition cost over the fair value of net tangible and intangible assets acquired. Goodwill is not amortized and is subject to annual impairment testing on August 1 or between annual tests if an event or change in circumstance occurs that would more likely than not reduce the fair value of a reporting unit below its carrying value. In testing for goodwill impairment, we have the option to first assess qualitative factors to determine whether the existence of events or circumstances lead to a determination that it is more likely than not that the fair value of a reporting unit is less than its carrying amount. If, after assessing the totality of events and circumstances, we conclude that it is not more likely than not that the fair value of a reporting unit is less than its carrying amount, then performing the two-step impairment test is not required. If we conclude otherwise, we are required to perform the two-step impairment test. The goodwill impairment test is performed at the reporting unit level by comparing the estimated fair value of a reporting unit with its respective carrying value. If the estimated fair value exceeds the carrying value, goodwill at the reporting unit level is not impaired. If the estimated fair value is less than carrying value, further analysis is necessary to determine the amount of impairment, if any.
The fair value of reporting units are based on widely accepted valuation techniques that we believe market participants would use, although the valuation process requires significant judgment and often involves the use of significant estimates and assumptions. The methodologies we utilize in estimating the fair value of reporting units include market capitalization, price-to-book multiples of comparable exchange traded companies and multiples of merger and acquisitions of similar businesses. The estimates and assumptions used in determining fair value could have a significant effect on whether or not an impairment charge is recorded and the magnitude of such a charge. Adverse market or economic events could result in impairment charges in future periods. Refer to Note 13, Goodwill and Other Intangible Assets, for further information on our assessment of goodwill.
Intangible Assets . Intangible assets deemed to have finite lives are amortized on a straight line basis over their estimated useful lives, where the useful life is the period over which the asset is expected to contribute directly, or indirectly, to our future cash flows. Intangible assets are reviewed for impairment on an interim basis when certain events or circumstances exist. For amortizable intangible assets, impairment exists when the carrying amount of the intangible asset exceeds its fair value. At least annually, the remaining useful life is evaluated.
An intangible asset with an indefinite useful life is not amortized but assessed for impairment annually, or more frequently, when events or changes in circumstances occur indicating that it is more likely than not that the indefinite-lived asset is impaired. Impairment exists when the carrying amount exceeds its fair value. In testing for impairment, we have the option to first perform a qualitative assessment to determine whether it is more likely than not that an impairment exists. If it is determined that it is not more likely than not that an impairment exists, a quantitative impairment test is not necessary. If we conclude otherwise, we are required to perform a quantitative impairment test. Subsequent reversal of impairment losses is not permitted. Our annual indefinite-lived intangible asset impairment testing date is August 1.
To the extent an impairment loss is recognized, the loss establishes the new cost basis of the asset that is amortized over the remaining useful life of that asset, if any. Subsequent reversal of impairment losses is not permitted.
Income Taxes
Prior to the Merger we filed a consolidated U.S. federal income tax return, which included all of our qualifying subsidiaries. Post Merger, our results of operations are included in the consolidated federal and applicable state income tax returns filed by Leucadia. In states that neither accept nor require combined or unitary tax returns, certain subsidiaries file separate state income tax returns. We also are subject to income tax in various foreign jurisdictions in which we operate. For the Successor period, we account for our provision for income taxes using a "separate return" method. Amounts provided for income taxes are based on income reported for financial statement purposes and do not necessarily represent amounts currently payable.
Deferred tax assets and liabilities are recognized for the future tax consequences attributable to differences between the financial statement carrying amounts of existing assets and liabilities and their respective tax bases and for tax loss carry-forwards. Deferred tax assets and liabilities are measured using enacted tax rates expected to apply to taxable income in the years in which those temporary differences are expected to be recovered or settled. The effect of a change in tax rates on deferred tax assets and liabilities is recognized in income in the period that includes the enactment date. Under acquisition accounting for the Merger, the recognition of certain assets and liabilities at fair value created a change in the financial reporting basis for our assets and liabilities, while the tax basis of our assets and liabilities remained the same. As a result, deferred tax assets and liabilities were recognized for the change in the basis differences. In the Successor period, Jefferies provides deferred taxes on its temporary differences and on any carryforwards that it could claim on its hypothetical tax return. The realization of deferred tax assets is assessed and a valuation allowance is recorded to the extent that it is more likely than not that any portion of the deferred tax asset will not be realized on the basis of its projected separate return results. The tax benefit related to Leucadia dividends and dividend equivalents paid on nonvested share-based payment awards are recognized as an increase to Additional paid-in capital. These amounts are included in tax benefits for issuance of share-based awards on the Consolidated Statements of Changes in Equity.
We record uncertain tax positions using a two-step process: (i) we determine whether it is more likely than not that the tax positions will be sustained on the basis of the technical merits of the position; and (ii) for those tax positions that meet the more-likely-than-not recognition threshold, we recognize the largest amount of tax benefit that is more than 50 percent likely to be realized upon ultimate settlement with the related tax authority.
Jef-19
Legal Reserves
In the normal course of business, we have been named, from time to time, as a defendant in legal and regulatory proceedings. We are also involved, from time to time, in other exams, investigations and similar reviews (both formal and informal) by governmental and self-regulatory agencies regarding our businesses, certain of which may result in judgments, settlements, fines, penalties or other injunctions.
We recognize a liability for a contingency in Accrued expenses and other liabilities when it is probable that a liability has been incurred and the amount of loss can be reasonably estimated. If the reasonable estimate of a probable loss is a range, we accrue the most likely amount of such loss, and if such amount is not determinable, then we accrue the minimum in the range as the loss accrual. The determination of the outcome and loss estimates requires significant judgment on the part of management. At November 30, 2013, we have reserved approximately $22.4 million relating to an investigation of the purchases and sales of mortgage-backed securities that in January 2014 resulted in a non-prosecution agreement reached in principle with the United States Attorney for the District of Connecticut and a settlement agreement in principle with the Securities and Exchange Commission, which remains subject to review and approval by the SEC Commissioners. We believe that any other matters for which we have determined a loss to be probable and reasonably estimable are not material to the consolidated financial statements.
In many instances, it is not possible to determine whether any loss is probable or even possible or to estimate the amount of any loss or the size of any range of loss. We believe that, in the aggregate, the pending legal actions or regulatory proceedings and any other exams, investigations or similar reviews (both formal and informal) should not have a material adverse effect on our consolidated results of operations, cash flows or financial condition. In addition, we believe that any amount that could be reasonably estimated of potential loss or range of potential loss in excess of what has been provided in the consolidated financial statements is not material.
Share-based Compensation
Share-based awards are measured based on the grant-date fair value of the award and recognized over the period from the service inception date through the date the employee is no longer required to provide service to earn the award. Expected forfeitures are included in determining share-based compensation expense.
Foreign Currency Translation
Assets and liabilities of foreign subsidiaries having non-U.S. dollar functional currencies are translated at exchange rates at the end of a period. Revenues and expenses are translated at average exchange rates during the period. The gains or losses resulting from translating foreign currency financial statements into U.S. dollars, net of hedging gains or losses and taxes, if any, are included in Other comprehensive income. Gains or losses resulting from foreign currency transactions are included in Principal transactions in the Consolidated Statements of Earnings.
Earnings per Common Share
As a single member limited liability company, earnings per share is not calculated for Jefferies Group LLC (the Successor company).
Prior to the Merger, Jefferies Group, Inc. (the Predecessor company) had common shares and other common share equivalents outstanding. For the Predecessor periods, basic earnings per share ("EPS") is computed by dividing net earnings available to common shareholders by the weighted average number of common shares outstanding and certain other shares committed to be, but not yet issued. Net earnings available to common shareholders represent net earnings to common shareholders reduced by the allocation of earnings to participating securities. Losses are not allocated to participating securities. Common shares outstanding and certain other shares committed to be, but not yet issued, include restricted stock and restricted stock units ("RSUs") for which no future service is required. For Predecessor periods, diluted EPS is computed by dividing net earnings available to common shareholders plus dividends on dilutive mandatorily redeemable convertible preferred stock by the weighted average number of common shares outstanding and certain other shares committed to be, but not yet issued, plus all dilutive common stock equivalents outstanding during the period. Unvested share-based payment awards that contain nonforfeitable rights to dividends or dividend equivalents (whether paid or unpaid) are participating securities and, therefore, are included in the earnings allocation in computing earnings per share under the two-class method of earning per share. Restricted stock and RSUs granted as part of our share-based compensation contain nonforfeitable rights to dividends and dividend equivalents, respectively, and therefore, prior to the requisite service being rendered for the right to retain the award, restricted stock and RSUs meet the definition of a participating security. As such, Basic and Diluted earnings per share are calculated under the two-class method.
Securitization Activities
We engage in securitization activities related to corporate loans, commercial mortgage loans and mortgage-backed and other asset-backed securities. Such transfers of financial assets are accounted for as sales when we have relinquished control over the transferred assets. The gain or loss on sale of such financial assets depends, in part, on the previous carrying amount of the assets involved in the transfer allocated between the assets sold and the retained interests, if any, based upon their respective fair values at the date of sale. We may retain interests in the securitized financial assets as one or more tranches of the securitization. These retained interests are included within Financial instruments owned in the Consolidated Statements of Financial Condition at fair value. Any changes in the fair value of such retained interests are recognized within Principal transactions revenues in the Consolidated Statements of Earnings.
When a transfer of assets does not meet the criteria of a sale, we account for the transfer as a secured borrowing and continue to recognize the assets of a secured borrowing in Financial instruments owned and recognize the associated financing in Other secured financings in the Consolidated Statements of Financial Condition.
Jef-20
Note 3. Accounting Developments
Accounting Standards to be Adopted in Future Periods
Income Taxes. In July 2013, the Financial Accounting Standards Board ("FASB") issued Accounting Standards Update ("ASU") No. 2013-11, Presentation of an Unrecognized Tax Benefit When a Net Operating Loss Carryforward, a Similar Tax Loss, or a Tax Credit Carryforward Exists to eliminate diversity in practice. The guidance requires an entity to net their unrecognized tax benefit, or a portion of an unrecognized tax benefit, in the financial statements against a deferred tax asset for a net operating loss carryforward, a similar tax loss or tax credit carryforward, unless such tax loss or credit carryforward is not available at the reporting date under the tax law of the applicable jurisdiction to settle any additional income taxes resulting from the disallowance of a tax position. In the event that the tax position is disallowed or the tax law of the applicable jurisdiction does not require the entity to use, and the entity does not intend to use, the deferred tax asset for such purpose, the unrecognized tax benefit shall be presented in the financial statements as a liability and shall not be combined with deferred tax assets. The guidance is effective for annual reporting periods beginning after December 15, 2013, and interim periods therein and is to be applied prospectively. We do not expect that the adoption of this ASU will have a material effect on our consolidated financial statements.
Balance Sheet Offsetting Disclosures. In December 2011, the FASB issued ASU No. 2011-11, Disclosures about Offsetting Assets and Liabilities and in January 2013 the FASB issued ASU 2013-01, Clarifying the Scope of Disclosures about Offsetting Assets and Liabilities. The updates require new disclosures regarding balance sheet offsetting and related arrangements. For derivatives, repurchase agreements and reverse repurchase agreements, and securities borrowing and securities lending transactions, the updates require disclosure of gross asset and liability amounts, amounts offset on the balance sheet, and amounts subject to the offsetting requirements but not offset on the balance sheet. The guidance is effective for annual reporting periods beginning on or after January 1, 2013, and interim periods within those annual periods (fiscal quarter ended February 28, 2014), and is to be applied retrospectively. This guidance does not amend the existing guidance on when it is appropriate to offset; as a result, this guidance will not affect our financial condition, results of operations or cash flows.
Adopted Accounting Standards
Accumulated Other Comprehensive Income. In February 2013, the FASB issued ASU No. 2013-02, Reporting of Amounts Reclassified Out of Accumulated Other Comprehensive Income. The guidance requires an entity to report the effect of significant reclassifications out of accumulated other comprehensive income on the respective line items in net income if the amount being reclassified is required under U.S. GAAP to be reclassified in its entirety to net income. For other amounts that are not required under U.S. GAAP to be reclassified in their entirety from accumulated other comprehensive income to net income in the same reporting period, an entity is required to cross-reference to other disclosures required under U.S. GAAP that provide additional detail about those amounts. We adopted the guidance effective March 1, 2013, presenting the additional disclosures within our Consolidated Statements of Changes in Equity. Adoption did not affect our results of operation, financial condition or cash flows.
Indefinite-Lived Intangible Asset Impairment. In July 2012, the FASB issued ASU No. 2012-02, Testing Indefinite-Lived Intangible Assets for Impairment. The guidance permits an entity to first assess qualitative factors to determine whether it is more likely than not that an indefinite-lived intangible asset, other than goodwill, is impaired as a basis for determining whether it is necessary to perform the quantitative impairment test. The update does not revise the requirement to test indefinite-lived intangible assets annually for impairment, or more frequently if deemed appropriate. The adoption of this guidance on December 1, 2012 did not affect our financial condition, results of operations or cash flows as it did not affect how impairment is calculated.
Goodwill Testing . In September 2011, the FASB issued ASU No. 2011-08, Testing Goodwill for Impairment. The update outlines amendments to the two step goodwill impairment test permitting an entity to first assess qualitative factors in determining whether it is more likely than not that the fair value of a reporting unit is less than its carrying amount as a basis for determining whether it is necessary to perform the two-step quantitative goodwill impairment test. We adopted this guidance on December 1, 2012, which did not change how goodwill impairment is calculated nor assigned to reporting units and therefore had no effect on our financial condition, results of operations or cash flows.
Comprehensive Income . In June 2011, the FASB issued ASU No. 2011-05, Presentation of Comprehensive Income. The update requires entities to report comprehensive income either (1) in a single continuous statement of comprehensive income or (2) in two separate but consecutive statements. We adopted the guidance on March 1, 2012, and elected the two separate but consecutive statements approach. Accordingly, we now present our Consolidated Statements of Comprehensive Income immediately following our Consolidated Statements of Earnings within our consolidated financial statements.
Fair Value Measurements and Disclosures. In May 2011, the FASB issued ASU No. 2011-04, Amendments to Achieve Common Fair Value Measurement and Disclosure Requirements in U.S. GAAP and IFRS. The amendments prohibit the use of blockage factors at all levels of the fair value hierarchy and provide guidance on measuring financial instruments that are managed on a net portfolio basis. Additional disclosure requirements include transfers between Levels 1 and 2; and for Level 3 fair value measurements, a description of our valuation processes and additional information about unobservable inputs impacting Level 3 measurements. We adopted this guidance on March 1, 2012 and have reflected the new disclosures in our consolidated financial statements. The adoption of this guidance did not have an impact on our financial condition, results of operations or cash flows.
Reconsideration of Effective Control for Repurchase Agreements. In April 2011, the FASB issued ASU No. 2011-03, Reconsideration of Effective Control for Repurchase Agreements. In assessing whether to account for repurchase and other agreements that both entitle and obligate the transferor to repurchase or redeem financial assets before their maturity as sales or as secured financing, this guidance removes from the assessment of effective control 1) the criterion requiring the transferor to have the ability to repurchase or redeem the financial assets on substantially the agreed terms and 2) the collateral maintenance implementation guidance related to that criterion. The adoption of this guidance for transactions beginning on or after January 1, 2012 did not have an impact on our financial condition, results of operations or cash flows.
Jef-21
Note 4. Leucadia Merger and Related Transactions
Merger Transaction
On March 1, 2013, Jefferies Group LLC completed a merger transaction with Leucadia and became a wholly-owned subsidiary of Leucadia as described in Note 1 Organization and Basis of Presentation. Each share of Jefferies Group Inc.'s common stock outstanding was converted into common shares of Leucadia at an Exchange Ratio of 0.81 of a Leucadia common share for each share of Jefferies Group, Inc. (the "Exchange Ratio"). Leucadia exchanged Jefferies Group, Inc.'s $125.0 million 3.25% Series A-1 Convertible Cumulative Preferred Stock for a new series of Leucadia $125.0 million 3.25% Cumulative Convertible Preferred Shares. In addition, each restricted share and restricted stock unit of Jefferies Group, Inc. common stock was converted at the Exchange Ratio, into an equivalent award of shares of Leucadia, with all such awards for Leucadia shares subject to the same terms and conditions, including, without limitation, vesting and, in the case of performance-based restricted stock units, performance being measured at existing targets.
Leucadia did not assume or guarantee any of our outstanding debt securities, but our 3.875% Convertible senior Debentures due 2029 with an aggregate principal amount of $345.0 million are now convertible into common shares of Leucadia.
Other than the conversion into Leucadia common shares, the terms of the debenture remain the same.
The merger resulted in a change in our ownership and was recorded under the acquisition method of accounting by Leucadia and pushed-down to us by allocating the total purchase consideration of $4.8 billion to the cost of the assets acquired, including intangible assets, and liabilities assumed based on their estimated fair values at the date of the merger. The excess of the total purchase price over the fair value of assets acquired and the liabilities assumed is recorded as goodwill. The goodwill arising from the merger consists largely of our commercial potential and the value of our assembled workforce.
In connection with the merger, we recognized $11.5 million, $2.1 million and $4.7 million in transaction costs during the nine months ended November 30, 2013, three months ended February 28, 2013 and the year ended November 30, 2012, respectively.
The summary computation of the purchase price and the fair values assigned to the assets and liabilities are presented as follows (in thousands except share amounts):
Purchase Price | ||||
Jefferies common stock outstanding | 205,368,031 | |||
Less: Jefferies common stock owned by Leucadia | (58,006,024 | ) | ||
Jefferies common stock acquired by Leucadia | 147,362,007 | |||
Exchange ratio | 0.81 | |||
Leucadia's shares issued (excluding for Jefferies shares held by Leucadia) | 119,363,226 | |||
Less: restricted shares issued for share-based payment awards (1) | (6,894,856 | ) | ||
Leucadia's shares issued, excluding share-based payment awards | 112,468,370 | |||
Closing price of Leucadia's common stock (2) | $ | 26.90 | ||
Fair value of common shares acquired by Leucadia | 3,025,399 | |||
Fair value of 3.25% cumulative convertible preferred shares (3) | 125,000 | |||
Fair value of shares-based payment awards (4) | 343,811 | |||
Fair value of Jefferies shares owned by Leucadia (5) | 1,259,891 | |||
Total purchase price | $ | 4,754,101 | ||
(1) | Represents shares of restricted stock included in Jefferies common stock outstanding that contained a future service requirement as of March 1, 2013. |
(2) | The value of the shares of common stock exchanged with Jefferies shareholders was based upon the closing price of Leucadia's common stock at February 28, 2013, the last trading day prior to the date of acquisition. |
(3) | Represents Leucadia's 3.25% Cumulative Convertible Preferred Shares issued in exchange for Jefferies Group, Inc.'s 3.25% Series A-1 Convertible Cumulative Preferred Stock. |
(4) | The fair value of share-based payment awards is calculated in accordance with ASC 718, Compensation – Stock Compensation. Share-based payment awards attributable to pre-combination service are included as part of the total purchase price. Share-based payment awards attributable to pre-combination service is estimated based on the ratio of the pre-combination service performed to the original service period of the award. |
(5) | The fair value of Jefferies shares owned by Leucadia was based upon a price of $21.72, the closing price of Jefferies common stock at February 28, 2013. |
Jef-22
Assets acquired (1): | ||||
Cash and cash equivalents | $ | 3,017,958 | ||
Cash and securities segregated | 3,728,742 | |||
Financial instruments owned, at fair value | 16,413,535 | |||
Investments in managed funds | 59,976 | |||
Loans to and investments in related parties | 766,893 | |||
Securities borrowed | 5,315,488 | |||
Securities purchased under agreements to resell | 3,578,366 | |||
Securities received as collateral | 25,338 | |||
Receivables: | ||||
Brokers, dealers and clearing organizations | 2,444,085 | |||
Customers | 1,045,251 | |||
Fees, interest and other | 225,555 | |||
Premises and equipment | 192,603 | |||
Indefinite-lived intangible exchange memberships and licenses (2) | 15,551 | |||
Finite-lived intangible customer relationships (2)(3) | 136,002 | |||
Finite-lived trade name (2)(4) | 131,299 | |||
Other assets | 939,600 | |||
Total assets | $ | 38,036,242 | ||
Liabilities assumed (1): | ||||
Short-term borrowings | $ | 100,000 | ||
Financial instruments sold, not yet purchased, at fair value | 9,766,876 | |||
Securities loaned | 1,902,687 | |||
Securities sold under agreements to repurchase | 7,976,492 | |||
Other secured financings | 122,294 | |||
Obligation to return securities received as collateral | 25,338 | |||
Payables: | ||||
Brokers, dealers and clearing organizations | 1,787,055 | |||
Customers | 5,450,781 | |||
Accrued expenses and other liabilities | 793,843 | |||
Long-term debt | 6,362,024 | |||
Mandatorily redeemable preferred interests | 358,951 | |||
Total liabilities | $ | 34,646,341 | ||
Noncontrolling interests | 356,180 | |||
Fair value of net assets acquired, excluding goodwill (1) | $ | 3,033,721 | ||
Goodwill (1) | $ | 1,720,380 | ||
(1) | Modifications to the purchase price allocation have been made since the initial presentation included in our Quarterly Report on Form 10-Q for the three months ended May 31, 2013, which reflect additional information obtained about the fair value of the assets acquired and liabilities assumed. These modifications include adjustments of $4.8 million to reduce the fair value of the total assets acquired and $14.0 million to increase the total liabilities assumed at March 1, 2013. The impact of the adjustments resulted in an increase of goodwill of $18.8 million from the previously presented balance of $1,701.6 million in our Quarterly Report on Form 10-Q for the three months ended May 31, 2013 to $1,720.4 million as reflected in this table. |
(2) | Intangible assets are recorded within Other assets on the Consolidated Statement of Financial Condition. |
(3) | The fair value of the finite-lived customer relationships will be amortized on a straight line basis over a weighted average useful life of approximately 14.4 years. |
(4) | The fair value of the finite-lived trade name will be amortized on a straight line basis over a useful life of 35 years. |
Intangible assets, not including goodwill, totaling approximately $282.9 million were identified and recognized as part of the acquisition accounting. The goodwill of $1.7 billion resulting from the Merger is not deductible for tax purposes.
Jef-23
Reorganization of Jefferies High Yield Holdings, LLC
On March 1, 2013, we commenced a reorganization of our high yield joint venture with Leucadia, conducted through Jefferies High Yield Holdings, LLC ("JHYH") (the parent of Jefferies High Yield Trading, LLC (our high yield trading broker-dealer)). On March 1, 2013, we redeemed the outstanding third party noncontrolling interests in JHYH of $347.6 million. On March 31, 2013, Leucadia contributed its mandatorily redeemable preferred interests in JHYH of $362.3 million to Jefferies Group LLC as member's equity. On April 1, 2013, we redeemed the mandatorily redeemable preferred interests in JHYH received from Leucadia. In addition, on April 1, 2013, our high yield trading broker-dealer was merged into Jefferies LLC (our U.S. securities broker-dealer).
Note 5. Acquisitions
Hoare Govett
On February 1, 2012, we acquired the corporate broking business of Hoare Govett from RBS. Total cash consideration paid by us to RBS for the acquisition was £1. In addition, under the terms of the purchase agreement RBS agreed to pay us approximately £1.9 million towards retention payments made to certain employees, which constituted a reduction of the final purchase price. The business acquired represents the corporate broking business carried on under the name RBS Hoare Govett in the United Kingdom and comprised corporate broking advice and services, as well as certain equity sales and trading activities. The acquisition included the Hoare Govett trade name, domain name, client agreements and the exclusive right to carry on the business in succession to RBS.
We accounted for the acquisition under the acquisition method of accounting . Accordingly, the assets acquired, including identifiable intangible assets, and liabilities assumed were recorded at their respective fair values as of the date of acquisition. The fair values of the net assets acquired, including identifiable intangible assets, specifically the Hoare Govett trademark/trade name, was approximately $0.3 million, which exceeded the negative purchase price of $3.1 million (cash consideration paid of £1 less remittance from RBS of £1.9 million), resulting in a bargain purchase gain of approximately $3.4 million. The bargain purchase gain is included within Other revenues in the Consolidated Statement of Earnings for the year ended November 30, 2012 and is reported within the Capital Markets business segment. Approximately $0.4 million was recognized at the date of acquisition as the fair value of the Hoare Govett trade name. See Note 13, Goodwill and Other Intangible Assets for further details. Additionally, on February 1, 2012, we recognized a deferred tax liability of approximately $0.1 million, recorded within Accrued expenses and other liabilities on the Consolidated Statement of Financial Condition.
Our results of operations for the year ended November 30, 2012 include the results of operations of Hoare Govett for ten months for the period from February 1, 2012 to November 30, 2012. The acquisition closed on February 29, 2012.
Global Commodities Group
On July 1, 2011, we acquired Prudential Bache's Global Commodities Group from Prudential. Total cash payments made as consideration for the acquisition were $422.0 million. The acquisition included 100% of the equity interests in Prudential Bache Commodities LLC, a U.S.-based full-service futures commission merchant; Prudential Bache Securities LLC, a US-based registered broker-dealer, which has since merged with Jefferies; Bache Commodities Limited, a UK-based global commodities and financial derivatives broker; Prudential Bache Financial Services, Inc., a global over-the-counter commodities dealer; and Bache Commodities (Hong Kong) Ltd., a Hong Kong-based licensed futures dealer. In addition, we acquired related information technology assets and contracts used by the Global Commodities Group. We refer to this business collectively as "Jefferies Bache." The business of Jefferies Bache is included within the Capital Markets business segment.
We accounted for the acquisition under the acquisition method of accounting, resulting in a bargain purchase gain of $52.5 million which is included in Other revenues in the Consolidated Statement of Earnings for the year ended November 30, 2011, is not taxable and is reported within the Capital Markets business segment .
Jef-24
Note 6. Cash, Cash Equivalents and Short-Term Investments
We generally invest our excess cash in money market funds and other short-term instruments. Cash equivalents include highly liquid investments not held for resale and with original maturities of three months or less. The following are financial instruments classified as cash and cash equivalents that are deemed by us to be generally readily convertible into cash as of November 30, 2013 and November 30, 2012 (in thousands):
Successor | Predecessor | |||||||
November 30, | November 30, | |||||||
2013 | 2012 | |||||||
Cash and cash equivalents: | ||||||||
Cash in banks | $ | 880,443 | $ | 1,038,664 | ||||
Money market investments | 2,680,676 | 1,653,931 | ||||||
Total cash and cash equivalents | $ | 3,561,119 | $ | 2,692,595 | ||||
Cash and securities segregated (1) | $ | 3,616,602 | $ | 4,082,595 | ||||
(1) | Consists of deposits at exchanges and clearing organizations, as well as deposits in accordance with Rule 15c3-3 of the Securities Exchange Act of 1934, which subjects Jefferies as a broker-dealer carrying client accounts to requirements related to maintaining cash or qualified securities in a segregated reserve account for the exclusive benefit of its clients, and Jefferies Bache, LLC which, as a futures commission merchant, is subject to the segregation requirements pursuant to the Commodity Exchange Act. |
Jef-25
Note 7. Fair Value Disclosures
The following is a summary of our financial assets and liabilities that are accounted for at fair value on a recurring basis as of November 30, 2013 and 2012 by level within the fair value hierarchy (in thousands):
Successor | ||||||||||||||||||||
November 30, 2013 | ||||||||||||||||||||
Level 1 (1) | Level 2 (1) | Level 3 | Counterparty and Cash Collateral Netting (2) | Total | ||||||||||||||||
Assets: | ||||||||||||||||||||
Financial instruments owned: | ||||||||||||||||||||
Corporate equity securities | $ | 1,913,220 | $ | 175,493 | $ | 9,884 | $ | - | $ | 2,098,597 | ||||||||||
Corporate debt securities | - | 2,957,102 | 25,666 | - | 2,982,768 | |||||||||||||||
Collateralized debt obligations | - | 182,095 | 37,216 | - | 219,311 | |||||||||||||||
U.S. government and federal agency securities | 2,293,221 | 40,389 | - | - | 2,333,610 | |||||||||||||||
Municipal securities | - | 664,054 | - | - | 664,054 | |||||||||||||||
Sovereign obligations | 1,458,803 | 889,685 | - | - | 2,348,488 | |||||||||||||||
Residential mortgage-backed securities | - | 2,932,268 | 105,492 | - | 3,037,760 | |||||||||||||||
Commercial mortgage-backed securities | - | 1,130,410 | 17,568 | - | 1,147,978 | |||||||||||||||
Other asset-backed securities | - | 55,475 | 12,611 | - | 68,086 | |||||||||||||||
Loans and other receivables | - | 1,203,238 | 145,890 | - | 1,349,128 | |||||||||||||||
Derivatives | 40,952 | 2,472,237 | 1,493 | (2,253,589 | ) | 261,093 | ||||||||||||||
Investments at fair value | - | 40 | 101,242 | - | 101,282 | |||||||||||||||
Physical commodities | - | 37,888 | - | - | 37,888 | |||||||||||||||
Total financial instruments owned | $ | 5,706,196 | $ | 12,740,374 | $ | 457,062 | $ | (2,253,589 | ) | $ | 16,650,043 | |||||||||
Cash and cash equivalents | $ | 3,561,119 | $ | - | $ | - | $ | - | $ | 3,561,119 | ||||||||||
Investments in managed funds | $ | - | $ | - | $ | 57,285 | $ | - | $ | 57,285 | ||||||||||
Cash and securities segregated and on deposit for regulatory purposes (3) | $ | 3,612,602 | $ | - | $ | - | $ | - | $ | 3,612,602 | ||||||||||
Securities received as collateral | $ | 11,063 | $ | - | $ | - | $ | - | $ | 11,063 | ||||||||||
Total Level 3 assets | $ | 514,347 | ||||||||||||||||||
Liabilities: | ||||||||||||||||||||
Financial instruments sold, not yet purchased: | ||||||||||||||||||||
Corporate equity securities | $ | 1,782,903 | $ | 40,358 | $ | 38 | $ | - | $ | 1,823,299 | ||||||||||
Corporate debt securities | - | 1,346,078 | - | - | 1,346,078 | |||||||||||||||
U.S. government and federal agency securities | 1,324,326 | - | - | - | 1,324,326 | |||||||||||||||
Sovereign obligations | 1,360,269 | 471,088 | - | - | 1,831,357 | |||||||||||||||
Residential mortgage-backed securities | - | 34,691 | - | - | 34,691 | |||||||||||||||
Loans | - | 672,838 | 22,462 | - | 695,300 | |||||||||||||||
Derivatives | 43,829 | 2,480,463 | 8,398 | (2,352,611 | ) | 180,079 | ||||||||||||||
Physical commodities | - | 36,483 | - | - | 36,483 | |||||||||||||||
Total financial instruments sold, not yet purchased | $ | 4,511,327 | $ | 5,081,999 | $ | 30,898 | $ | (2,352,611 | ) | $ | 7,271,613 | |||||||||
Obligation to return securities received as collateral | $ | 11,063 | $ | - | $ | - | $ | - | $ | 11,063 | ||||||||||
Other secured financings | $ | - | $ | 31,000 | $ | 8,711 | $ | - | $ | 39,711 | ||||||||||
Embedded conversion option | $ | - | $ | 9,574 | $ | - | $ | - | $ | 9,574 | ||||||||||
(1) | During the nine months ended November 30, 2013, we transferred listed equity options with a fair value of $403.0 million within Financial instruments owned and $423.0 million within Financial instruments sold, not yet purchased from Level 1 to Level 2 as adjustments to the exchange closing price are necessary to best reflect the fair value of the population at its exit price. |
(2) | Represents counterparty and cash collateral netting across the levels of the fair value hierarchy for positions with the same counterparty. |
(3) | Cash and securities segregated and on deposit for regulatory purposes include U.S. government securities with a fair value of $304.2 million.
|
Jef-26
Predecessor | ||||||||||||||||||||
November 30, 2012 | ||||||||||||||||||||
Level 1 (1) | Level 2 (1) | Level 3 | Counterparty and Cash Collateral Netting (2) | Total | ||||||||||||||||
Assets: | ||||||||||||||||||||
Financial instruments owned: | ||||||||||||||||||||
Corporate equity securities | $ | 1,608,715 | $ | 137,245 | $ | 16,815 | $ | - | $ | 1,762,775 | ||||||||||
Corporate debt securities | - | 3,034,515 | 3,631 | - | 3,038,146 | |||||||||||||||
Collateralized debt obligations | - | 87,239 | 31,255 | - | 118,494 | |||||||||||||||
U.S. government and federal agency securities | 1,720,617 | 115,310 | - | - | 1,835,927 | |||||||||||||||
Municipal securities | - | 619,969 | - | - | 619,969 | |||||||||||||||
Sovereign obligations | 1,722,044 | 975,810 | - | - | 2,697,854 | |||||||||||||||
Residential mortgage-backed securities (5) | - | 3,997,390 | 156,069 | - | 4,153,459 | |||||||||||||||
Commercial mortgage-backed securities (5) | - | 1,001,581 | 30,202 | - | 1,031,783 | |||||||||||||||
Other asset-backed securities | - | 93,228 | 1,114 | - | 94,342 | |||||||||||||||
Loans and other receivables | - | 497,918 | 180,393 | - | 678,311 | |||||||||||||||
Derivatives (5) | 615,024 | 1,674,062 | 328 | (1,921,122 | ) | 368,292 | ||||||||||||||
Investments at fair value | - | 43,126 | 83,897 | - | 127,023 | |||||||||||||||
Physical commodities | - | 144,016 | - | - | 144,016 | |||||||||||||||
Total financial instruments owned | $ | 5,666,400 | $ | 12,421,409 | $ | 503,704 | $ | (1,921,122 | ) | $ | 16,670,391 | |||||||||
Level 3 financial instruments for which the firm does not bear economic exposure (3) | (53,289 | ) | ||||||||||||||||||
Level 3 financial instruments for which the firm bears economic exposure | $ | 450,415 | ||||||||||||||||||
Cash and cash equivalents | $ | 2,692,595 | $ | - | $ | - | $ | - | $ | 2,692,595 | ||||||||||
Investments in managed funds | $ | - | $ | - | $ | 57,763 | $ | - | $ | 57,763 | ||||||||||
Cash and securities segregated and on deposit for regulatory purposes (4) | $ | 4,082,595 | $ | - | $ | - | $ | - | $ | 4,082,595 | ||||||||||
Total Level 3 assets for which the firm bears economic exposure | $ | 508,178 | ||||||||||||||||||
Liabilities: | ||||||||||||||||||||
Financial instruments sold, not yet purchased: | ||||||||||||||||||||
Corporate equity securities | $ | 1,442,347 | $ | 96,947 | $ | 38 | $ | - | $ | 1,539,332 | ||||||||||
Corporate debt securities | - | 1,389,312 | - | - | 1,389,312 | |||||||||||||||
U.S. government and federal agency securities | 1,428,746 | 250,387 | - | - | 1,679,133 | |||||||||||||||
Sovereign obligations | 1,395,355 | 591,624 | - | - | 1,986,979 | |||||||||||||||
Residential mortgage-backed securities (5) | - | 228,251 | - | - | 228,251 | |||||||||||||||
Loans | - | 205,516 | 1,711 | - | 207,227 | |||||||||||||||
Derivatives (5) | 547,605 | 1,753,716 | 9,516 | (2,068,750 | ) | 242,087 | ||||||||||||||
Physical commodities | - | 183,142 | - | - | 183,142 | |||||||||||||||
Total financial instruments sold, not yet purchased | $ | 4,814,053 | $ | 4,698,895 | $ | 11,265 | $ | (2,068,750 | ) | $ | 7,455,463 | |||||||||
| (1) | There were no transfers between Level 1 and Level 2 for the year ended November 30, 2012. |
| (2) | Represents counterparty and cash collateral netting across the levels of the fair value hierarchy for positions with the same counterparty. |
| (3) | Consists of Level 3 assets attributable to third party or employee noncontrolling interests in certain consolidated entities. |
| (4) | Cash and securities segregated and on deposit for regulatory purposes include U.S. government securities with a fair value of $404.3 million. |
| (5) | To-be-announced securities previously classified within Financial instruments owned - mortgage-backed securities and Financial instruments sold, not yet purchased – mortgage-backed securities, have been reclassified to Derivatives (assets) and Derivatives (liabilities), respectively. |
Jef-27
The following is a description of the valuation basis, including valuation techniques and inputs, used in measuring our financial assets and liabilities that are accounted for at fair value on a recurring basis:
Corporate Equity Securities
| - | Exchange Traded Equity Securities: Exchange-traded equity securities are measured based on quoted closing exchange prices, which are generally obtained from external pricing services, and are categorized within Level 1 of the fair value hierarchy, otherwise they are categorized within Level 2 or Level 3 of the fair value hierarchy. |
| - | Non-exchange Traded Equity Securities : Non-exchange traded equity securities are measured primarily using broker quotations, pricing data from external pricing services and prices observed for recently executed market transactions and are categorized within Level 2 of the fair value hierarchy. Where such information is not available, non-exchange traded equity securities are categorized within Level 3 of the fair value hierarchy and measured using valuation techniques involving quoted prices of or market data for comparable companies, similar company ratios and multiples (e.g., price/EBITDA, price/book value), discounted cash flow analyses and transaction prices observed for subsequent financing or capital issuance by the company. When using pricing data of comparable companies, judgment must be applied to adjust the pricing data to account for differences between the measured security and the comparable security (e.g., issuer market capitalization, yield, dividend rate, geographical concentration). |
| - | Equity warrants: Non-exchange traded equity warrants are generally categorized within Level 3 of the fair value hierarchy and are measured using the Black-Scholes model with key inputs impacting the valuation including the underlying security price, implied volatility, dividend yield, interest rate curve, strike price and maturity date. |
Corporate Debt Securities
| - | Corporate Bonds: Corporate bonds are measured primarily using pricing data from external pricing services and broker quotations, where available, prices observed for recently executed market transactions of comparable size, and bond spreads or credit default swap spreads of the issuer adjusted for basis differences between the swap curve and the bond curve. Corporate bonds measured using these valuation methods are categorized within Level 2 of the fair value hierarchy. If broker quotes, pricing data or spread data is not available, alternative valuation techniques are used including cash flow models incorporating interest rate curves, single name or index credit default swap curves for comparable issuers and recovery rate assumptions. Corporate bonds measured using alternative valuation techniques are categorized within Level 3 of the fair value hierarchy and comprise a limited portion of our corporate bonds. |
| - | High Yield Corporate and Convertible Bonds: A significant portion of our high yield corporate and convertible bonds are categorized within Level 2 of the fair value hierarchy and are measured primarily using broker quotations and pricing data from external pricing services, where available, and prices observed for recently executed market transactions of comparable size. Where pricing data is less observable, valuations are categorized within Level 3 and are based on pending transactions involving the issuer or comparable issuers, prices implied from an issuer's subsequent financings or recapitalizations, models incorporating financial ratios and projected cash flows of the issuer and market prices for comparable issuers. |
Collateralized Debt Obligations
Collateralized debt obligations are measured based on prices observed for recently executed market transactions or based on valuations received from third party brokers and are categorized within Level 2 or Level 3 of the fair value hierarchy depending on the observability and significance of the pricing inputs.
U.S. Government and Federal Agency Securities
| - | U.S. Treasury Securities: U.S. Treasury securities are measured based on quoted market prices and categorized within Level 1 of the fair value hierarchy. |
| - | U.S. Agency Issued Debt Securities: Callable and non-callable U.S. agency issued debt securities are measured primarily based on quoted market prices obtained from external pricing services. Non-callable U.S. agency securities are generally categorized within Level 1 and callable U.S. agency securities are categorized within Level 2 of the fair value hierarchy. |
Jef-28
Municipal Securities
Municipal securities are measured based on quoted prices obtained from external pricing services and are generally categorized within Level 2 of the fair value hierarchy.
Sovereign Obligations
Foreign sovereign government obligations are measured based on quoted market prices obtained from external pricing services, where available, or recently executed independent transactions of comparable size. To the extent external price quotations are not available or recent transactions have not been observed, valuation techniques incorporating interest rate yield curves and country spreads for bonds of similar issuers, seniority and maturity are used to determine fair value of sovereign bonds or obligations. Foreign sovereign government obligations are classified in Level 1, 2 or Level 3 of the fair value hierarchy, primarily based on the country of issuance.
Residential Mortgage-Backed Securities
| - | Agency Residential Mortgage-Backed Securities: Agency residential mortgage-backed securities include mortgage pass-through securities (fixed and adjustable rate), collateralized mortgage obligations and interest-only and principal-only securities and are generally measured using market price quotations from external pricing services and categorized within Level 2 of the fair value hierarchy. |
| - | Agency Residential Inverse Interest-Only Securities ("Agency Inverse IOs"): The fair value of agency inverse IOs is estimated using expected future cash flow techniques that incorporate prepayment models and other prepayment assumptions to amortize the underlying mortgage loan collateral. We use prices observed for recently executed transactions to develop market-clearing spread and yield curve assumptions. Valuation inputs with regard to the underlying collateral incorporate weighted average coupon, loan-to-value, credit scores, geographic location, maximum and average loan size, originator, servicer, and weighted average loan age. Agency inverse IOs are categorized within Level 2 or Level 3 of the fair value hierarchy. We also use vendor data in developing our assumptions, as appropriate. |
| - | Non-Agency Residential Mortgage-Backed Securities: Fair values are determined primarily using discounted cash flow methodologies and securities are categorized within Level 2 or Level 3 of the fair value hierarchy based on the observability and significance of the pricing inputs used. Performance attributes of the underlying mortgage loans are evaluated to estimate pricing inputs, such as prepayment rates, default rates and the severity of credit losses. Attributes of the underlying mortgage loans that affect the pricing inputs include, but are not limited to, weighted average coupon; average and maximum loan size; loan-to-value; credit scores; documentation type; geographic location; weighted average loan age; originator; servicer; historical prepayment, default and loss severity experience of the mortgage loan pool; and delinquency rate. Yield curves used in the discounted cash flow models are based on observed market prices for comparable securities and published interest rate data to estimate market yields. |
Commercial Mortgage-Backed Securities
| - | Agency Commercial Mortgage-Backed Securities: GNMA project loan bonds and FNMA Delegated Underwriting and Servicing ("DUS") mortgage-backed securities are generally measured by using prices observed for recently executed market transactions to estimate market-clearing spread levels for purposes of estimating fair value. GNMA project loan bonds and FNMA DUS mortgage-backed securities are categorized within Level 2 of the fair value hierarchy. |
| - | Non-Agency Commercial Mortgage-Backed Securities: Non-agency commercial mortgage-backed securities are measured using pricing data obtained from external pricing services and prices observed for recently executed market transactions and are categorized within Level 2 and Level 3 of the fair value hierarchy. |
Other Asset-Backed Securities
Other asset-backed securities include, but are not limited to, securities backed by auto loans, credit card receivables and student loans and are categorized within Level 2 and Level 3 of the fair value hierarchy. Valuations are determined using pricing data obtained from external pricing services and prices observed for recently executed market transactions.
Loans and Other Receivables
| - | Corporate Loans: Corporate loans categorized within Level 2 of the fair value hierarchy are measured based on market price quotations where market price quotations from external pricing services are supported by market transaction data. Corporate loans categorized within Level 3 of the fair value hierarchy are measured based on market price quotations that are considered to be less transparent, market prices for debt securities of the same creditor, and estimates of future cash flow incorporating assumptions regarding creditor default and recovery rates and consideration of the issuer's capital structure. |
Jef-29
| - | Participation Certificates in GNMA Project and Construction Loans: Valuations of participation certificates in GNMA project and construction loans are based on observed market prices of recently executed purchases of similar loans which are then used to derive a market implied spread, which in turn is used as the primary input in estimating the fair value of loans at the measurement date. The loan participation certificates are categorized within Level 2 of the fair value hierarchy given the observability and volume of recently executed transactions. |
| - | Project Loans: Valuation of project loans are based on benchmarks of prices for recently executed transactions of related realized collateralized securities and are categorized within Level 2 of the fair value hierarchy. |
| - | Escrow and Trade Claim Receivables: Escrow and trade claim receivables are categorized within Level 3 of the fair value hierarchy where fair value is estimated based on reference to market prices and implied yields of debt securities of the same or similar issuers. Escrow and trade claim receivables are categorized within Level 2 of the fair value hierarchy where fair value is based on recent trade activity in the same security. |
Derivatives
| - | Listed Derivative Contracts: Listed derivative contracts that are actively traded are measured based on quoted exchange prices, which are generally obtained from external pricing services, and are categorized within Level 1 of the fair value hierarchy. Listed derivatives for which there is limited trading activity are measured based on incorporating the closing auction price of the underlying equity security, use similar valuation approaches as those applied to over-the-counter derivative contracts and are categorized within Level 2 of the fair value hierarchy. |
| - | OTC Derivative Contracts: Over-the-counter ("OTC") derivative contracts are generally valued using models, whose inputs reflect assumptions that we believe market participants would use in valuing the derivative in a current period transaction. Inputs to valuation models are appropriately calibrated to market data. For many OTC derivative contracts, the valuation models do not involve material subjectivity as the methodologies do not entail significant judgment and the inputs to valuation models do not involve a high degree of subjectivity as the valuation model inputs are readily observable or can be derived from actively quoted markets. OTC derivative contracts are primarily categorized within Level 2 of the fair value hierarchy given the observability and significance of the inputs to the valuation models. Where significant inputs to the valuation are unobservable, derivative instruments are categorized within Level 3 of the fair value hierarchy. |
OTC options include OTC equity, foreign exchange and commodity options measured using various valuation models, such as the Black-Scholes, with key inputs impacting the valuation including the underlying security, foreign exchange spot rate or commodity price, implied volatility, dividend yield, interest rate curve, strike price and maturity date. Discounted cash flow models are utilized to measure certain OTC derivative contracts including the valuations of our interest rate swaps, which incorporate observable inputs related to interest rate curves, valuations of our foreign exchange forwards and swaps, which incorporate observable inputs related to foreign currency spot rates and forward curves and valuations of our commodity swaps, which incorporate observable inputs related to commodity spot prices and forward curves. Credit default swaps include both index and single-name credit default swaps. External prices are available as inputs in measuring index credit default swaps and single-name credit default swaps. For commodity and equity total return swaps, market prices are observable for the underlying asset and used as the basis for measuring the fair value of the derivative contracts. Total return swaps executed on other underlyings are measured based on valuations received from external pricing services.
Physical Commodities
Physical commodities include base and precious metals and are measured using observable inputs including spot prices and published indices. Physical commodities are categorized within Level 2 of the fair value hierarchy. To facilitate the trading in precious metals we undertake leasing of such precious metals. The fees earned or paid for such leases are recorded as Principal transaction revenues on the Consolidated Statements of Earnings.
Investments at Fair Value and Investments in Managed Funds
Investments at fair value and Investments in managed funds include investments in hedge funds, fund of funds, private equity funds, convertible bond funds and commodity funds, which are measured at fair value based on the net asset value of the funds provided by the fund managers and are categorized within Level 2 or Level 3 of the fair value hierarchy. Investments at fair value also include direct equity investments in private companies, which are measured at fair value using valuation techniques involving quoted prices of or market data for comparable companies, similar company ratios and multiples (e.g., price/EBITDA, price/book value), discounted cash flow analyses and transaction prices observed for subsequent financing or capital issuance by the company. Direct equity investments in private companies are categorized within Level 2 or Level 3 of the fair value hierarchy. Additionally, investments at fair value include investments in insurance contracts relating to our defined benefit plan in Germany and at November 30, 2012, shares in non-U.S. exchanges and clearing houses. Fair value for the insurance contracts is determined using a third party and is categorized within Level 3 of the fair value hierarchy. Fair value for the shares in non-U.S. exchanges and clearing houses is determined based on recent transactions or third party model valuations and is categorized within Level 2 or Level 3 of the fair value hierarchy. The following tables present information about our investments in entities that have the characteristics of an investment company at November 30, 2013 and 2012 (in thousands):
Jef-30
Successor | ||||||||||||
November 30, 2013 | ||||||||||||
Fair Value (7) | Unfunded Commitments | Redemption Frequency (if currently eligible) | ||||||||||
Equity Long/Short Hedge Funds (1) | $ | 20,927 | $ | - | Monthly, Quarterly | |||||||
High Yield Hedge Funds (2) | 244 | - | - | |||||||||
Fund of Funds (3) | 494 | 94 | - | |||||||||
Equity Funds (4) | 66,495 | 40,816 | - | |||||||||
Convertible Bond Funds (5) | 3,473 | - | At Will | |||||||||
Other Investments (6) | - | - | Bi-Monthly | |||||||||
Total (8) | $ | 91,633 | $ | 40,910 | ||||||||
Predecessor | ||||||||||||
November 30, 2012 | ||||||||||||
Fair Value (7) | Unfunded Commitments | Redemption Frequency (if currently eligible) | ||||||||||
Equity Long/Short Hedge Funds (1) | $ | 19,554 | $ | - | Monthly, Quarterly | |||||||
High Yield Hedge Funds (2) | 612 | - | - | |||||||||
Fund of Funds (3) | 604 | 106 | - | |||||||||
Equity Funds (4) | 69,223 | 59,272 | - | |||||||||
Convertible Bond Funds (5) | 3,002 | - | At Will | |||||||||
Other Investments (6) | 19 | - | Bi-Monthly | |||||||||
Total (8) | $ | 93,014 | $ | 59,378 | ||||||||
(1) |
This category includes investments in hedge funds that invest, long and short, in equity securities in domestic and international markets in both the public and private sectors. At November 30, 2013 and 2012, investments representing approximately 98% and 96%, respectively, of the fair value of investments in this category are redeemable with 30 - 65 days prior written notice, and includes an investment in a private asset management fund managed by us with a fair value of $0.5 million at November 30, 2012. The remaining investments in this category cannot be redeemed as they are in liquidation and distributions will be received through the liquidation of the underlying assets of the funds. We are unable to estimate when the underlying assets will be liquidated. |
(2) | Includes investments in funds that invest in domestic and international public high yield debt, private high yield investments, senior bank loans, public leveraged equities, distressed debt, and private equity investments. There are no redemption provisions. The underlying assets of the funds are being liquidated and we are unable to estimate when the underlying assets will be fully liquidated. |
(3) | Includes investments in fund of funds that invest in various private equity funds. At November 30, 2013 and 2012, approximately 98% and 94%, respectively, of the fair value of investments in this category are managed by us and have no redemption provisions, instead distributions are received through the liquidation of the underlying assets of the fund of funds, which are estimated to be liquidated in approximately two years. For the remaining investments we have requested redemption; however, we are unable to estimate when these funds will be received. |
(4) | At November 30, 2013 and 2012, investments representing approximately 99% and 98%, respectively of the fair value of investments in this category include investments in equity funds that invest in the equity of various U.S. and foreign private companies in the energy, technology, internet service and telecommunication service industries. These investments cannot be redeemed, instead distributions are received through the liquidation of the underlying assets of the funds which are expected to liquidate in one to eight years. The remaining investments are in liquidation and we are unable to estimate when the underlying assets will be fully liquidated. At November 30, 2013 and 2012, this category includes investments in equity funds managed by us with a fair value of $54.4 million and $55.6 million and unfunded commitments of $39.2 million and $56.9 million, respectively. |
(5) | Investment in the Jefferies Umbrella Fund, an open-ended investment company managed by us that invests primarily in convertible bonds. The investment is redeemable with 5 days prior written notice. |
(6) | Other investments at November 30, 2012 included investments in funds that invest in commodity futures and options contracts, which were sold in fiscal 2013 as a result of the spin-off of CoreCommodity Management, LLC. |
(7) | Fair value has been estimated using the net asset value derived from each of the funds' capital statements. |
(8) | Investments at fair value in the Consolidated Statements of Financial Condition at November 30, 2013 and 2012 include $66.9 million and $91.8 million, respectively, of direct investments which do not have the characteristics of investment companies and therefore not included within this table. We have unfunded commitments to such investments of $3.3 million in aggregate at November 30, 2013. |
Jef-31
Other Secured Financings
Other secured financings include the notes issued by consolidated VIEs, which are classified as Level 2 within the fair value hierarchy. Fair value is based on recent transaction prices. In addition, at November 30. 2013, Other secured financings includes $8.7 million related to transfers of loans accounted for as secured financings rather than as sales. At November 30, 2012, Other secured financings includes mortgage-backed securities issued by a VIE for which we are deemed the primary beneficiary, categorized within Level 3 of the fair value hierarchy and measured using a discounted cashflow model with discount yield being a significant input.
Embedded Conversion Option
The embedded conversion option presented within long-term debt represents the fair value of the conversion option on Leucadia shares within our 3.875% Convertible Senior Debentures, due November 1, 2029 and categorized as Level 2 within the fair value hierarchy. The conversion option was valued using a convertible bond model using as inputs the price of Leucadia's common stock, the conversion strike price, 252-day historical volatility, a maturity date of November 1, 2017 (the first put date), dividend yield and the risk-free interest rate curve.
Pricing Information
At November 30, 2013 and 2012, our Financial instruments owned and Financial instruments sold, not yet purchased are measured using different valuation bases as follows:
Successor | Predecessor | |||||||||||||||
November 30, 2013 | November 30, 2012 | |||||||||||||||
Financial Instruments Owned | Financial Instruments Sold, Not Yet Purchased | Financial Instruments Owned | Financial Instruments Sold, Not Yet Purchased | |||||||||||||
Exchange closing prices | 12 | % | 25 | % | 11 | % | 19 | % | ||||||||
Recently observed transaction prices | 5 | % | 4 | % | 5 | % | 6 | % | ||||||||
External pricing services | 68 | % | 66 | % | 70 | % | 71 | % | ||||||||
Broker quotes | 3 | % | 3 | % | 1 | % | 0 | % | ||||||||
Valuation techniques | 12 | % | 2 | % | 13 | % | 4 | % | ||||||||
| 100 | % | 100 | % | 100 | % | 100 | % | |||||||||
Jef-32
The following is a summary of changes in fair value of our financial assets and liabilities that have been categorized within Level 3 of the fair value hierarchy for the nine months ended November 30, 2013 (in thousands):
Successor | ||||||||||||||||||||||||||||||||
Nine Months Ended November 30, 2013 | ||||||||||||||||||||||||||||||||
Balance, February 28, 2013 | Total gains/ losses (realized and unrealized) (1) | Purchases | Sales | Settlements | Net transfers into/ (out of) Level 3 | Balance, November 30, 2013 |
Change in unrealized gains/ (losses) relating to instruments still held at November 30, 2013 (1) | |||||||||||||||||||||||||
Assets: | ||||||||||||||||||||||||||||||||
Financial instruments owned: | ||||||||||||||||||||||||||||||||
Corporate equity securities | $ | 13,234 | $ | 1,551 | $ | 3,583 | $ | (7,141 | ) | $ | - | $ | (1,343 | ) | $ | 9,884 | $ | (419 | ) | |||||||||||||
Corporate debt securities | 31,820 | (2,454 | ) | 31,014 | (34,125 | ) | - | (589 | ) | 25,666 | (2,749 | ) | ||||||||||||||||||||
Collateralized debt obligations | 24,736 | (2,309 | ) | 45,437 | (32,874 | ) | - | 2,226 | 37,216 | (8,384 | ) | |||||||||||||||||||||
Residential mortgage-backed securities | 169,426 | (4,897 | ) | 89,792 | (150,807 | ) | (11,007 | ) | 12,985 | 105,492 | (6,932 | ) | ||||||||||||||||||||
Commercial mortgage-backed securities | 17,794 | (4,469 | ) | 20,130 | (13,538 | ) | (100 | ) | (2,249 | ) | 17,568 | (3,794 | ) | |||||||||||||||||||
Other asset-backed securities | 1,292 | (4,535 | ) | 105,291 | (104,711 | ) | - | 15,274 | 12,611 | (3,497 | ) | |||||||||||||||||||||
Loans and other receivables | 170,986 | 15,008 | 287,757 | (115,231 | ) | (211,805 | ) | (825 | ) | 145,890 | 13,402 | |||||||||||||||||||||
Investments, at fair value | 75,067 | 1,678 | 28,594 | (102 | ) | (5,012 | ) | 1,017 | 101,242 | 1,705 | ||||||||||||||||||||||
Investments in managed funds | 59,976 | 9,863 | 15,651 | (17 | ) | (28,188 | ) | - | 57,285 | 9,863 | ||||||||||||||||||||||
Liabilities: | ||||||||||||||||||||||||||||||||
Financial instruments sold, not yet purchased: | ||||||||||||||||||||||||||||||||
Corporate equity securities | $ | 38 | $ | - | $ | - | $ | - | $ | - | $ | - | $ | 38 | $ | - | ||||||||||||||||
Residential mortgage-backed securities | 1,542 | (1,542 | ) | - | - | - | - | - | - | |||||||||||||||||||||||
Net derivatives (2) | 11,185 | 4,408 | - | (300 | ) | (8,515 | ) | 127 | 6,905 | 1,609 | ||||||||||||||||||||||
Loans | 7,398 | 2,959 | (16,027 | ) | 28,065 | 67 | - | 22,462 | (2,970 | ) | ||||||||||||||||||||||
(1) |
Realized and unrealized gains/losses are reported in Principal transactions in the Consolidated Statements of Earnings. |
(2) | Net derivatives represent Financial instruments owned – Derivatives and Financial instruments sold, not yet purchased – Derivatives. |
In addition to the above changes in the fair value of our financial assets and liabilities that have been categorized within Level 3 of the fair value hierarchy, during the nine months ended November 30, 2013, secured financings of $8.7 million were issued.
Analysis of Level 3 Assets and Liabilities for the Nine Months Ended November 30, 2013
During the nine months ended November 30, 2013, transfers of assets of $82.4 million from Level 2 to Level 3 of the fair value hierarchy are attributed to:
| - | Non-agency residential mortgage-backed securities of $58.8 million and other asset-backed securities of $16.4 million for which no recent trade activity was observed for purposes of determining observable inputs; |
| - | Loans and other receivables of $0.8 million due to a lower number of contributors comprising vendor quotes to support classification within Level 2. |
| - | Corporate equity securities of $2.3 million, corporate debt securities of $0.2 million and investments at fair value of $1.0 million due to lack of observable market transactions; |
| - | Collateralized debt obligations of $2.8 million which have little to no transparency in trade activity; |
During the nine months ended November 30, 2013, transfers of assets of $55.9 million from Level 3 to Level 2 are attributed to:
| - | Non-agency residential mortgage-backed securities of $45.9 million, commercial mortgage-backed securities of $2.2 million and other asset-backed securities of $1.1 million for which market trades were observed in the period for either identical or similar securities; |
| - | Collateralized debt obligations of $0.6 million and loans and other receivables of $1.7 million due to a greater number of contributors for certain vendor quotes supporting classification into Level 2; |
| - | Corporate equity securities of $3.6 million and corporate debt securities of $0.8 million due to an increase in observable market transactions. |
During the nine months ended November 30, 2013, there were no transfers of liabilities from Level 2 to Level 3 and there were $0.1 million transfers of net derivative liabilities from Level 3 to Level 2 due to an increase in observable inputs used in the valuing of derivative contracts.
Net gains on Level 3 assets were $9.4 million and net losses on Level 3 liabilities were $5.8 million for the nine months ended November 30, 2013, respectively. Net gains on Level 3 assets were primarily due to increased valuations of certain corporate equity securities, loans and other receivables, investments at fair value and investments in managed funds, partially offset by a decrease in valuation of certain corporate debt securities, collateralized debt obligations, residential and commercial mortgage-backed securities and other asset-backed securities. Net losses on Level 3 liabilities were primarily due to increased valuations of certain derivative instruments and loan positions.
Jef-33
The following is a summary of changes in fair value of our financial assets and liabilities that have been categorized within Level 3 of the fair value hierarchy for the three months ended February 28, 2013 (in thousands):
Predecessor | ||||||||||||||||||||||||||||||||
Three Months Ended February 28, 2013 (3) | ||||||||||||||||||||||||||||||||
Balance, November 30, 2012 | Total gains/ losses (realized and unrealized) (1) | Purchases | Sales | Settlements | Net transfers into/ (out of) Level 3 | Balance, February 28, 2013 | Change in unrealized gains/ (losses) relating to instruments still held at February 28, 2013 (1) | |||||||||||||||||||||||||
Assets: | ||||||||||||||||||||||||||||||||
Financial instruments owned: | ||||||||||||||||||||||||||||||||
Corporate equity securities | $ | 16,815 | $ | 200 | $ | 707 | $ | 109 | $ | - | $ | (4,597 | ) | $ | 13,234 | $ | 172 | |||||||||||||||
Corporate debt securities | 3,631 | 7,836 | 11,510 | (1,918 | ) | - | 10,761 | 31,820 | 7,833 | |||||||||||||||||||||||
Collateralized debt obligations | 31,255 | 3,584 | 4,406 | (17,374 | ) | - | 2,865 | 24,736 | (1,165 | ) | ||||||||||||||||||||||
Residential mortgage-backed securities | 156,069 | 11,906 | 132,773 | (130,143 | ) | (6,057 | ) | 4,878 | 169,426 | 4,511 | ||||||||||||||||||||||
Commercial mortgage-backed securities | 30,202 | (995 | ) | 2,280 | (2,866 | ) | (1,188 | ) | (9,639 | ) | 17,794 | (2,059 | ) | |||||||||||||||||||
Other asset-backed securities | 1,114 | 90 | 1,627 | (1,342 | ) | (19 | ) | (178 | ) | 1,292 | 39 | |||||||||||||||||||||
Loans and other receivables | 180,393 | (8,682 | ) | 105,650 | (29,828 | ) | (61,407 | ) | (15,140 | ) | 170,986 | (12,374 | ) | |||||||||||||||||||
Investments, at fair value | 83,897 | 961 | 5,952 | (4,923 | ) | (9,721 | ) | (1,099 | ) | 75,067 | 1,171 | |||||||||||||||||||||
Investments in managed funds | 57,763 | (363 | ) | 11,068 | - | (8,492 | ) | - | 59,976 | (363 | ) | |||||||||||||||||||||
Liabilities: | ||||||||||||||||||||||||||||||||
Financial instruments sold, not yet purchased: | ||||||||||||||||||||||||||||||||
Corporate equity securities | $ | 38 | $ | - | $ | - | $ | - | $ | - | $ | - | $ | 38 | $ | - | ||||||||||||||||
Residential mortgage-backed securities | - | 25 | (73,846 | ) | 75,363 | - | - | 1,542 | (19 | ) | ||||||||||||||||||||||
Net derivatives (2) | 9,188 | 2,648 | - | - | - | (651 | ) | 11,185 | 2,648 | |||||||||||||||||||||||
Loans | 1,711 | - | (1,711 | ) | 7,398 | - | - | 7,398 | - | |||||||||||||||||||||||
(1) | Realized and unrealized gains/losses are reported in Principal transactions in the Consolidated Statements of Earnings. |
(2) | Net derivatives represent Financial instruments owned – Derivatives and Financial instruments sold, not yet purchased – Derivatives. |
(3) | There were no issuances during the three months ended February 28, 2013. |
Analysis of Level 3 Assets and Liabilities for the Three Months Ended February 28, 2013
During the three months ended February 28, 2013, transfers of assets of $100.5 million from Level 2 to Level 3 of the fair value hierarchy are attributed to:
| - | Non-agency residential mortgage-backed securities of $78.4 million and commercial mortgage-backed securities of $1.3 million for which no recent trade activity was observed for purposes of determining observable inputs; |
| - | Corporate debt securities of $10.8 million and corporate equity securities of $0.1 million due to lack of observable market transactions; |
| - | Collateralized debt obligations of $5.3 million which have little to no transparency in trade activity; |
| - | Loans and other receivables of $4.8 million due to a lower number of contributors comprising vendor quotes to support classification within Level 2. |
During the three months ended February 28, 2013, transfers of assets of $112.7 million from Level 3 to Level 2 are attributed to:
| - | Non-agency residential mortgage-backed securities of $73.5 million, commercial mortgage-backed securities of $10.9 million and $0.2 million of other asset-backed securities for which market trades were observed in the period for either identical or similar securities; |
| - | Loans and other receivables of $19.9 million and collateralized debt obligations of $2.4 million due to a greater number of contributors for certain vendor quotes supporting classification into Level 2; |
| - | Corporate equity securities of $4.7 million due to an increase in observable market transactions. |
Jef-34
During the three months ended February 28, 2013, there were no transfers of liabilities from Level 2 to Level 3 and there were $0.7 million transfers of net derivative liabilities from Level 3 to Level 2 due to an increase in observable significant inputs used in valuing the derivative contracts.
Net gains on Level 3 assets were $14.5 million and net losses on Level 3 liabilities were $2.7 million for the three months ended February 28, 2013. Net gains on Level 3 assets were primarily due to increased valuations of certain residential mortgage-backed securities, corporate debt securities, collateralized debt obligations and investments at fair value partially offset by a decrease in valuation of certain loans and other receivables, commercial mortgage backed securities and investments in managed funds. Net losses on Level 3 liabilities were primarily due to increased valuations of certain derivative instruments.
The following is a summary of changes in fair value of our financial assets and liabilities that have been categorized within Level 3 of the fair value hierarchy for the year ended November 30, 2012 (in thousands):
Predecessor | ||||||||||||||||||||||||||||||||
Year Ended November 30, 2012 (3) | ||||||||||||||||||||||||||||||||
Balance, November 30, 2011 | Total gains/ losses (realized and unrealized) (1) | Purchases | Sales | Settlements | Net transfers into/ (out of) Level 3 | Balance, November 30, 2012 |
Change in unrealized gains/ (losses) relating to instruments still held at November 30, 2012 (1) | |||||||||||||||||||||||||
Assets: | ||||||||||||||||||||||||||||||||
Financial instruments owned: | ||||||||||||||||||||||||||||||||
Corporate equity securities | $ | 13,489 | $ | (4,167 | ) | $ | 14,760 | $ | (7,878 | ) | $ | - | $ | 611 | $ | 16,815 | $ | (6,199 | ) | |||||||||||||
Corporate debt securities | 48,140 | (1,651 | ) | 34,814 | (69,969 | ) | (1,276 | ) | (6,427 | ) | 3,631 | (1,286 | ) | |||||||||||||||||||
Collateralized debt obligations | 47,988 | 4,882 | 4,369 | (64,915 | ) | (3,892 | ) | 42,823 | 31,255 | (1,524 | ) | |||||||||||||||||||||
Municipal securities | 6,904 | (74 | ) | - | (1,449 | ) | - | (5,381 | ) | - | - | |||||||||||||||||||||
Sovereign obligations | 140 | - | - | - | - | (140 | ) | - | - | |||||||||||||||||||||||
Residential mortgage-backed securities | 149,965 | 36,183 | 266,692 | (278,068 | ) | (58,005 | ) | 39,302 | 156,069 | (6,445 | ) | |||||||||||||||||||||
Commercial mortgage-backed securities | 52,407 | (7,715 | ) | 14,058 | (23,797 | ) | (1,241 | ) | (3,510 | ) | 30,202 | (6,042 | ) | |||||||||||||||||||
Other asset-backed securities | 3,284 | (20 | ) | 8,749 | (8,627 | ) | (52 | ) | (2,220 | ) | 1,114 | (32 | ) | |||||||||||||||||||
Loans and other receivables | 97,291 | (2,475 | ) | 299,929 | (104,155 | ) | (143,960 | ) | 33,763 | 180,393 | (4,335 | ) | ||||||||||||||||||||
Investments, at fair value | 78,326 | 14,965 | 4,060 | (6 | ) | (13,448 | ) | - | 83,897 | 13,642 | ||||||||||||||||||||||
Investments in managed funds | 70,740 | (11,102 | ) | 12,683 | - | (14,558 | ) | - | 57,763 | (11,101 | ) | |||||||||||||||||||||
Liabilities: | ||||||||||||||||||||||||||||||||
Financial instruments sold, not yet purchased: | ||||||||||||||||||||||||||||||||
Corporate equity securities | $ | - | $ | 38 | $ | - | $ | - | $ | - | $ | - | $ | 38 | $ | 38 | ||||||||||||||||
Corporate debt securities | 74 | (15 | ) | (59 | ) | - | - | - | - | - | ||||||||||||||||||||||
Net derivatives (2) | 9,285 | 2,505 | (389 | ) | - | - | (2,213 | ) | 9,188 | 3,728 | ||||||||||||||||||||||
Loans | 10,157 | - | (10,157 | ) | 1,711 | - | - | 1,711 | - | |||||||||||||||||||||||
(1) | Realized and unrealized gains/losses are reported in Principal transactions in the Consolidated Statements of Earnings. |
(2) | Net derivatives represent Financial instruments owned – Derivatives and Financial instruments sold, not yet purchased – Derivatives. |
(3) | There were no issuances during the year ended November 30, 2012. |
Analysis of Level 3 Assets and Liabilities for the Year Ended November 30, 2012
During the year ended November 30, 2012, transfers of assets of $180.6 million from Level 2 to Level 3 are attributed to:
| - | Non-agency residential mortgage-backed securities of $53.4 million and commercial mortgage-backed securities of $11.7 million for which no recent trade activity was observed for purposes of determining observable inputs; |
| - | Loans and other receivables of $62.2 million due to a lower number of contributors comprising vendor quotes to support classification within Level 2 as less market interest likely existed for the specific loans during the period; |
| - | Collateralized debt obligations of $51.0 million which have little to no transparency in trade activity; and |
| - | Corporate debt securities of $1.3 million and corporate equity securities of $0.9 million due to lack of observable market transactions. |
During the year ended November 30, 2012, transfers of assets of $81.8 million from Level 3 to Level 2 are attributed to:
| - | Loans and other receivables of $28.4 million and collateralized debt obligations of $8.2 million due to a greater number of contributors for certain vendor quotes supporting classification into Level 2; |
| - | Commercial mortgage-backed securities of $15.2 million, non-agency residential mortgage-backed securities of $14.1 million and $2.4 million of other asset-backed securities for which market trades were observed in the period for either identical or similar securities or for which vendor prices were corroborated to actual market transactions; and |
| - | Corporate debt securities of $7.8 million and municipal securities of $5.4 million due to increased observability of trades in certain debt and municipal securities. |
Jef-35
During the year ended November 30, 2012 there were no transfers of liabilities from Level 2 to Level 3 and there were $2.2 million transfers of net derivative liabilities from Level 3 to Level 2 due to an increase in observable significant inputs used in valuing the derivative contracts.
Net gains on Level 3 assets were $28.8 million and net losses on Level 3 liabilities were $2.5 million for the year ended November 30, 2012. Net gains on Level 3 assets were primarily due to increased valuations of certain residential mortgage-backed securities, investments at fair value and collateralized debt obligations, partially offset by a decreased in valuation of certain investments in managed funds, commercial mortgage backed securities, loans and other receivables, and corporate debt securities. Net losses on Level 3 liabilities were primarily due to increased valuations of certain derivative instruments.
Components or portions of interest rate and credit risk related to mortgage-backed securities categorized within Level 3 of the fair value hierarchy are frequently economically hedged with U.S. Treasury and Eurodollar futures and short U.S. Treasury securities, which are categorized within Level 1 liabilities, and with interest rate swaps and, to a lesser extent, index credit default swaps categorized within Level 2 assets or liabilities. Accordingly, a portion of the gains and losses on mortgage-backed securities reported in Level 3 are offset by gains and losses from the economic hedges attributed to instruments categorized within Level 1 and Level 2. Economic hedging is often executed on a macro-basis for a given asset class rather than an instrument-specific basis. Valuation inputs and prices for hedging instruments categorized within Level 1 and Level 2 provide a level of observability used in valuing Level 3 mortgage-backed securities; however, other inputs, such as prepayment, default rates and other credit specific factors are significant to the valuation and are not derived from the prices of the hedging instruments. Basis risk differences may also arise between the Level 3 mortgage-backed securities and the Level 1 and Level 2 hedging instruments due to the underlying interest rates and the underlying credits comprising the referenced credit index. Hedge effectiveness is limited by factors that include idiosyncratic collateral performance and basis risk as well as the sizing of the macro-hedge.
Quantitative Information about Significant Unobservable Inputs used in Level 3 Fair Value Measurements at November 30, 2013 and 2012
The tables below present information on the valuation techniques, significant unobservable inputs and their ranges for our financial assets and liabilities, subject to threshold levels related to the market value of the positions held, measured at fair value on a recurring basis with a significant Level 3 balance. The range of unobservable inputs could differ significantly across different firms given the range of products across different firms in the financial services sector. The inputs are not representative of the inputs that could have been used in the valuation of any one financial instrument; i.e., the input used for valuing one financial instrument within a particular class of financial instruments may not be appropriate for valuing other financial instruments within that given class. Additionally, the ranges of inputs presented below should not be construed to represent uncertainty regarding the fair values of our financial instruments; rather the range of inputs is reflective of the differences in the underlying characteristics of the financial instruments in each category.
For certain categories, we have provided a weighted average of the inputs allocated based on the fair values of the financial instruments comprising the category. We do not believe that the range or weighted average of the inputs is indicative of the reasonableness of uncertainty of our Level 3 fair values. The range and weighted average are driven by the individual financial instruments within each category and their relative distribution in the population. The disclosed inputs when compared with the inputs as disclosed in other quarters should not be expected to necessarily be indicative of changes in our estimates of unobservable inputs for a particular financial instrument as the population of financial instruments comprising the category will vary from period to period based on purchases and sales of financial instruments during the period as well as transfers into and out of Level 3 each period.
Jef-36
Successor | ||||||||||||
November 30, 2013 | ||||||||||||
Financial Instruments Owned | Fair Value (in thousands) | Valuation Technique | Significant Unobservable Input(s) | Input / Range | Weighted Average | |||||||
Corporate equity securities | $ | 8,034 | ||||||||||
Non-exchange traded securities | Market approach | EBITDA (a) multiple | 4.0 to 5.5 | 4.53 | ||||||||
Warrants | Option model | Volatility | 36 | % | ||||||||
Corporate debt securities | $ | 17,699 | ||||||||||
Scenario analysis | Estimated recovery percentage | 24 | % | |||||||||
Comparable pricing | Comparable bond or loan price | $ | 69.10 to $70.50 | $ | 69.91 | |||||||
Market approach | Yield | 13 | % | |||||||||
Collateralized debt obligations | $ | 34,316 | ||||||||||
Discounted cash flows | Constant prepayment rate | 0% to 20% | 13 | % | ||||||||
Constant default rate | 2% to 3% | 2 | % | |||||||||
Loss severity | 30% to 85% | 38 | % | |||||||||
Yield | 3% to 91% | 28 | % | |||||||||
Residential mortgage-backed securities | $ | 105,492 | ||||||||||
Discounted cash flows | Constant prepayment rate | 2% to 50% | 11 | % | ||||||||
Constant default rate | 1% to 100% | 17 | % | |||||||||
Loss severity | 30% to 90% | 48 | % | |||||||||
Yield | 0% to 20% | 7 | % | |||||||||
Commercial mortgage-backed securities | $ | 17,568 | ||||||||||
Discounted cash flows | Yield | 12% to 20% | 14 | % | ||||||||
Cumulative loss rate | 5% to 28.2% | 11 | % | |||||||||
Other asset-backed securities | $ | 12,611 | ||||||||||
Discounted cash flows | Constant prepayment rate | 4% to 30% | 17 | % | ||||||||
Constant default rate | 2% to 11% | 7 | % | |||||||||
Loss severity | 40% to 92% | 64 | % | |||||||||
Yield | 3% to 29% | 18 | % | |||||||||
Loans and other receivables | $ | 101,931 | ||||||||||
Comparable pricing | Comparable bond or loan price | $ | 91 to $101 | $ | 98.90 | |||||||
Market approach | Yield | 8.75% to 13.5% | 10 | % | ||||||||
EBITDA (a) multiple | 6.9 | |||||||||||
Scenario analysis | Estimated recovery percentage | 16.9% to 92% | 74 | % | ||||||||
Derivatives | $ | 1,493 | ||||||||||
Loan commitments | Comparable pricing | Comparable bond or loan price | $ | 100.875 | ||||||||
Investments at fair value | $ | 30,203 | ||||||||||
Private equity securities | Comparable pricing | Comparable share price | $ | 414 | ||||||||
Market approach | Discount rate | 15% to 30% | 23 | % | ||||||||
Financial Instruments Sold, Not Yet Purchased | Fair Value (in thousands) | Valuation Technique | Significant Unobservable Input(s) | Input / Range | Weighted Average | |||||||
Derivatives | $ | 8,398 | ||||||||||
Equity options | Option model | Volatility | 36.25% to 41% | 39 | % | |||||||
Loans | 8,106 | |||||||||||
Comparable pricing | Comparable bond or loan price | $ | 101.88 | |||||||||
(a) Earnings before interest, taxes, depreciation and amortization ("EBITDA").
Jef-37
Predecessor | ||||||||
November 30, 2012 | ||||||||
Financial Instruments Owned | Fair Value (in thousands) | Valuation Technique |
Significant Unobservable Input(s) | Range | ||||
Corporate equity securities | $ | 16,815 | ||||||
Non-exchange traded securities | Market approach | EBITDA (a) multiple | 4.0 to 16.3 | |||||
Scenario analysis | Estimated recovery percentage | 35 | % | |||||
Warrants | Option model | Volatility | 39 | % | ||||
Collateralized debt obligations | $ | 26,705 | ||||||
Discounted cash flows | Constant prepayment rate | 0% to 5% | ||||||
Constant default rate | 0% to 10% | |||||||
Loss severity | 13% to 75% | |||||||
Yield | 10% to 35% | |||||||
Residential mortgage-backed securities | $ | 156,069 | ||||||
Discounted cash flows | Constant prepayment rate | 0% to 25% | ||||||
Constant default rate | 0% to 50% | |||||||
Loss severity | 0% to 80% | |||||||
Yield | 1% to 50% | |||||||
Commercial mortgage-backed securities | $ | 30,202 | ||||||
Discounted cash flows | Yield | 22% to 57% | ||||||
Cumulative loss rate | 2% to 20% | |||||||
Loans and other receivables | $ | 153,365 | ||||||
Comparable pricing | Comparable bond or loan price | $ | 81.88 to $101.25 | |||||
Discounted cash flows | Yield | 19 | % | |||||
Cumulative loss rate | 0 | % | ||||||
Market approach | Yield | 5% to 54% | ||||||
EBITDA (a) multiple | 8.3 | |||||||
Scenario analysis | Estimated recovery percentage | 15 | % | |||||
Investments at fair value | $ | 32,751 | ||||||
Private equity securities | Market approach | EBITDA (a) multiple | 6.6 | |||||
Comparable pricing | Comparable share price | $ | 400.00 | |||||
Scenario analysis | Estimated recovery percentage | 50 | % | |||||
Financial Instruments Sold, Not Yet Purchased | Fair Value (in thousands) | Valuation Technique | Significant Unobservable Input(s) | Range | ||||
Derivatives | $ | (9,516 | ) | |||||
Equity options | Option model | Volatility | 39 | % | ||||
Loan commitments | Comparable pricing | Comparable bond or loan price | $ | 101.13 | ||||
(a) Earnings before interest, taxes, depreciation and amortization ("EBITDA").
Jef-38
The fair values of certain Level 3 assets and liabilities that were determined based on third-party pricing information, unadjusted past transaction prices, reported net asset value or a percentage of the reported enterprise fair value are excluded from the above table. At November 30, 2013 and 2012, asset exclusions consisted of $127.7 million and $82.7 million, respectively, primarily comprised of investments in private equity securities, investments in reinsurance contracts, certain collateralized debt obligations and corporate loans. At November 30, 2013 and 2012, liability exclusions consisted of $14.4 million and $14.4 million, respectively of corporate loan commitments.
Sensitivity of Fair Values to Changes in Significant Unobservable Inputs
For recurring fair value measurements categorized within Level 3 of the fair value hierarchy, the sensitivity of the fair value measurement to changes in significant unobservable inputs and interrelationships between those unobservable inputs (if any) are described below:
| - | Private equity securities, corporate debt securities, loans and other receivables and loan commitments using comparable pricing valuation techniques. A significant increase (decrease) in the comparable share, bond or loan price in isolation would result in a significant higher (lower) fair value measurement. |
| - | Non-exchange traded securities, corporate debt securities and loans and other receivables using a market approach valuation technique. A significant increase (decrease) in the EBITDA or other multiples in isolation would result in a significantly higher (lower) fair value measurement. A significant increase (decrease) in the yield of a corporate debt security, loan and other receivable would result in a significantly lower (higher) fair value measurement. A significant increase (decrease) in the discount rate of a private equity security would result in a significantly lower (higher) fair value measurement. |
| - | Corporate debt securities and loans and other receivables using scenario analysis. A significant increase (decrease) in the possible recovery rates of the cash flow outcomes underlying the investment would result in a significantly higher (lower) fair value measurement for the financial instrument. |
| - | Collateralized debt obligations, residential and commercial mortgage-backed securities and other asset-backed securities using a discounted cash flow valuation technique. A significant increase (decrease) in isolation in the constant default rate, loss severities or cumulative loss rate and discount rate would result in a significantly lower (higher) fair value measurement. The impact of changes in the constant prepayment rate would have differing impacts depending on the capital structure of the security. A significant increase (decrease) in the loan or bond yield would result in a significant lower (higher) fair value measurement. |
| - | Derivative equity options and equity warrants using an option model. A significant increase (decrease) in volatility would result in a significant higher (lower) fair value measurement. |
Fair Value Option Election
We have elected the fair value option for all loans and loan commitments made by our capital markets businesses. These loans and loan commitments include loans entered into by our investment banking division in connection with client bridge financing and loan syndications, loans purchased by our leveraged credit trading desk as part of its bank loan trading activities and mortgage loan commitments and fundings in connection with mortgage-backed securitization activities. Loans and loan commitments originated or purchased by our leveraged credit and mortgage-backed businesses are managed on a fair value basis. Loans are included in Financial instruments owned and loan commitments are included in Financial instruments owned-derivatives and Financial instruments sold, not yet purchased – derivatives on the Consolidated Statements of Financial Condition. The fair value option election is not applied to loans made to affiliate entities as such loans are entered into as part of ongoing, strategic business ventures. Loans to affiliate entities are included within Loans to and investments in related parties on the Consolidated Statements of Financial Condition and are accounted for on an amortized cost basis. We have elected the fair value option for our investment in Knight Capital Group, Inc., which is included in Financial Instruments owned – Corporate equity securities on the Consolidated Statement of Financial Condition. See Note 12, Investments for further details regarding our investment in Knight Capital Group, Inc. We have also elected the fair value option for certain financial instruments held by subsidiaries as the investments are risk managed by us on a fair value basis. The fair value option has also been elected for certain secured financings that arise in connection with our securitization activities and other structural financings. Other secured financings, Receivables – Brokers, dealers and clearing organizations, Receivables – Customers, Receivables – Fees, interest and other, Payables – Brokers, dealers and clearing organizations and Payables – Customers, are not accounted for at fair value; however, the recorded amounts approximate fair value due to their liquid or short-term nature.
Jef-39
The following is a summary of gains (losses) due to changes in instrument specific credit risk on loans and other receivables and loan commitments measured at fair value under the fair value option (in thousands):
Successor | Predecessor | |||||||||||
Nine Months Ended November 30, 2013 |
Three Months Ended February 28, 2013 |
Year Ended November 30, 2012 | ||||||||||
Financial Instruments Owned: | ||||||||||||
Loans and other receivables | $ | 15,327 | $ | 3,924 | $ | 24,547 | ||||||
Financial Instruments Sold: | ||||||||||||
Loans | $ | (32 | ) | $ | - | $ | (55 | ) | ||||
Loan commitments | (1,007 | ) | (2,746 | ) | (7,155 | ) | ||||||
The following is a summary of the amount by which contractual principal exceeds fair value for loans and other receivables measured at fair value under the fair value option (in thousands):
Successor | Predecessor | |||||||
November 30, 2013 | November 30, 2012 | |||||||
Financial Instruments Owned: | ||||||||
Loans and other receivables (2) | $ | 264,896 | $ | 256,271 | ||||
Loans greater than 90 days past due (1) (2) | - | 10,433 | ||||||
(1) | The aggregate fair value of loans that were 90 or more days past due was $0 and $34.7 million at November 30, 2013 and 2012. |
(2) | Interest income is recognized separately from other changes in fair value and is included within Interest revenues on the Consolidated Statements of Earnings. |
There were no loan receivables on nonaccrual status at November 30, 2013 and 2012.
Note 8. Derivative Financial Instruments
Off-Balance Sheet Risk
We have contractual commitments arising in the ordinary course of business for securities loaned or purchased under agreements to resell, repurchase agreements, future purchases and sales of foreign currencies, securities transactions on a when-issued basis and underwriting. Each of these financial instruments and activities contains varying degrees of off-balance sheet risk whereby the fair values of the securities underlying the financial instruments may be in excess of, or less than, the contract amount. The settlement of these transactions is not expected to have a material effect upon our consolidated financial statements.
Derivative Financial Instruments
Our derivative activities are recorded at fair value in the Consolidated Statements of Financial Condition in Financial instruments owned – derivatives and Financial instruments sold, not yet purchased – derivatives net of cash paid or received under credit support agreements and on a net counterparty basis when a legal right to offset exists under a master netting agreement. Net realized and unrealized gains and losses are recognized in Principal transactions in the Consolidated Statements of Earnings on a trade date basis and as a component of cash flows from operating activities in the Consolidated Statements of Cash Flows. Acting in a trading capacity, we may enter into derivative transactions to satisfy the needs of our clients and to manage our own exposure to market and credit risks resulting from our trading activities. (See Note 7, Fair Value Disclosures and Note 22, Commitments, Contingencies and Guarantees for additional disclosures about derivative instruments.)
Derivatives are subject to various risks similar to other financial instruments, including market, credit and operational risk. The risks of derivatives should not be viewed in isolation, but rather should be considered on an aggregate basis along with our other trading-related activities. We manage the risks associated with derivatives on an aggregate basis along with the risks associated with proprietary trading as part of our firm wide risk management policies. In connection with our derivative activities, we may enter into master netting agreements and collateral arrangements with counterparties. These agreements provide us with the ability to offset a counterparty's rights and obligations, request additional collateral when necessary or liquidate the collateral in the event of counterparty default.
The following tables present the fair value and related number of derivative contracts at November 30, 2013 and 2012 categorized by type of derivative contract. Prior to November 30, 2013, the fair value of forward purchase and sale contracts of to-be-announced securities were presented within Financial instruments owned – Mortgage- and asset-backed securities and Financial instruments sold, not yet purchased – Mortgage- and asset-backed securities. As of November 30, 2013, such contracts are presented within Financial instruments owned – Derivatives and Financial instruments sold, not yet purchased – Derivatives as interest rate contracts and Interest rate swaps, forwards and options with the impact of counterparty netting reflected as applicable under generally accepted accounting principles. Financial information presented as of November 30, 2012 has been conformed to this presentation. The fair value of assets/liabilities related to derivative contracts represents our receivable/payable for derivative financial instruments, gross of counterparty netting and cash collateral received and pledged (in thousands, except contract amounts):
Jef-40
Successor | ||||||||||||||||
November 30, 2013 | ||||||||||||||||
Assets | Liabilities | |||||||||||||||
Fair Value | Number of Contracts | Fair Value | Number of Contracts | |||||||||||||
Interest rate contracts | $ | 1,165,976 | 63,967 | $ | 1,131,166 | 77,338 | ||||||||||
Foreign exchange contracts | 653,772 | 118,707 | 693,658 | 112,417 | ||||||||||||
Equity contracts | 501,784 | 1,742,343 | 474,985 | 1,800,603 | ||||||||||||
Commodity contracts | 141,280 | 797,529 | 173,119 | 788,717 | ||||||||||||
Credit contracts: centrally cleared swaps | 49,531 | 49 | 51,632 | 46 | ||||||||||||
Credit contracts: other credit derivatives | 2,339 | 16 | 8,130 | 19 | ||||||||||||
Total | 2,514,682 | 2,532,690 | ||||||||||||||
Counterparty/cash-collateral netting | (2,253,589 | ) | (2,352,611 | ) | ||||||||||||
Total per Consolidated Statement of Financial Condition | $ | 261,093 | $ | 180,079 | ||||||||||||
Predecessor | ||||||||||||||||
November 30, 2012 | ||||||||||||||||
Assets | Liabilities | |||||||||||||||
Fair Value | Number of Contracts | Fair Value | Number of Contracts | |||||||||||||
Interest rate contracts | $ | 1,053,974 | 69,966 | $ | 1,134,620 | 92,586 | ||||||||||
Foreign exchange contracts | 387,325 | 118,958 | 357,277 | 116,758 | ||||||||||||
Equity contracts | 577,964 | 1,526,127 | 528,979 | 1,396,213 | ||||||||||||
Commodity contracts | 265,703 | 754,987 | 278,660 | 728,696 | ||||||||||||
Credit contracts | 4,448 | 13 | 11,301 | 40 | ||||||||||||
Total | 2,289,414 | 2,310,837 | ||||||||||||||
Counterparty/cash-collateral netting | (1,921,122 | ) | (2,068,750 | ) | ||||||||||||
Total per Consolidated Statement of Financial Condition | $ | 368,292 | $ | 242,087 | ||||||||||||
Jef-41
The following table presents unrealized and realized gains (losses) on derivative contracts for the nine months ended November 30, 2013, three months ended February 28, 2013 and for the years ended November 30, 2012 and 2011 (in thousands):
Successor | Predecessor | |||||||||||||||
Gains (Losses) | Nine Months Ended November 30, 2013 | Three Months Ended February 28, 2013 | Year Ended November 30, 2012 | Year Ended November 30, 2011 | ||||||||||||
Interest rate contracts | $ | 132,661 | $ | 38,936 | $ | (35,524 | ) | $ | (204,403 | ) | ||||||
Foreign exchange contracts | 4,937 | 11,895 | 9,076 | 2,243 | ||||||||||||
Equity contracts | 3,783 | (22,021 | ) | (83,817 | ) | (279,488 | ) | |||||||||
Commodity contracts | 45,546 | 19,585 | 77,285 | 74,282 | ||||||||||||
Credit contracts | (12,850 | ) | (3,742 | ) | (20,059 | ) | 17,621 | |||||||||
Total | $ | 174,077 | $ | 44,653 | $ | (53,039 | ) | $ | (389,745 | ) | ||||||
OTC Derivatives. The following tables set forth by remaining contract maturity the fair value of OTC derivative assets and liabilities as of November 30, 2013 (in thousands):
| ||||||||||||||||||||
Successor OTC Derivative Assets (1) (2) (4) | ||||||||||||||||||||
0 – 12 Months | 1 – 5 Years | Greater Than 5 Years | Cross-Maturity Netting (3) | Total | ||||||||||||||||
Commodity swaps, options and forwards | $ | 43,519 | $ | 699 | $ | - | $ | (198 | ) | $ | 44,020 | |||||||||
Credit default swaps | - | - | 413 | 413 | ||||||||||||||||
Equity swaps and options | 4,394 | - | - | - | 4,394 | |||||||||||||||
Total return swaps | 948 | - | - | - | 948 | |||||||||||||||
Foreign currency forwards, swaps and options | 89,072 | 37,798 | 52 | (11,192 | ) | 115,730 | ||||||||||||||
Interest rate swaps, options and forwards | 96,983 | 89,255 | 128,983 | (51,990 | ) | 263,231 | ||||||||||||||
Total | $ | 234,916 | $ | 127,752 | $ | 129,448 | $ | (63,380 | ) | 428,736 | ||||||||||
Cross product counterparty netting | (2,086 | ) | ||||||||||||||||||
Total OTC derivative assets included in Financial instruments owned | $ | 426,650 | ||||||||||||||||||
| (1) | At November 30, 2013, we held exchange traded derivative assets and other credit agreements with a fair value of $43.1 million, which are not included in this table. |
| (2) | OTC derivative assets in the table above are gross of collateral received. OTC derivative assets are recorded net of collateral received on the Consolidated Statements of Financial Condition. At November 30, 2013, cash collateral received was $208.6 million. |
| (3) | Amounts represent the netting of receivable balances with payable balances for the same counterparty within product category across maturity categories. |
| (4) | Derivative fair values include counterparty netting within product category. |
Jef-42
Successor OTC Derivative Liabilities (1) (2) (4) | ||||||||||||||||||||
0 – 12 Months | 1 – 5 Years | Greater Than 5 Years | Cross-Maturity Netting (3) | Total | ||||||||||||||||
Commodity swaps, options and forwards | $ | 69,380 | $ | 203 | $ | - | $ | (198 | ) | $ | 69,385 | |||||||||
Credit default swaps | 174 | 3,539 | 1,263 | - | 4,976 | |||||||||||||||
Equity swaps and options | - | - | 3,332 | - | 3,332 | |||||||||||||||
Total return swaps | 5,002 | - | - | - | 5,002 | |||||||||||||||
Foreign currency forwards, swaps and options | 117,044 | 47,258 | - | (8,608 | ) | 155,694 | ||||||||||||||
Interest rate swaps, options and forwards | 24,142 | 124,352 | 136,683 | (51,990 | ) | 233,187 | ||||||||||||||
Total | $ | 215,742 | $ | 175,352 | $ | 141,278 | $ | (60,796 | ) | 471,576 | ||||||||||
Cross product counterparty netting | (2,086 | ) | ||||||||||||||||||
Total OTC derivative liabilities included in Financial instruments sold, not yet purchased | $ | 469,490 | ||||||||||||||||||
| (1) | At November 30, 2013, we held exchange traded derivative liabilities and other credit agreements with a fair value of $18.2 million, which are not included in this table. |
| (2) | OTC derivative liabilities in the table above are gross of collateral pledged. OTC derivative liabilities are recorded net of collateral pledged on the Consolidated Statements of Financial Condition. At November 30, 2013, cash collateral pledged was $307.7 million. |
| (3) | Amounts represent the netting of receivable balances with payable balances for the same counterparty within product category across maturity categories. |
| (4) | Derivative fair values include counterparty netting within product category. |
At November 30, 2013, the counterparty credit quality with respect to the fair value of our OTC derivatives assets was as follows (in thousands):
Counterparty credit quality (1): | |||||
A- or higher | $ | 251,967 | |||
BBB- to BBB+ | 18,541 | ||||
BB+ or lower | 95,072 | ||||
Unrated | 61,070 | ||||
Total | $ | 426,650 | |||
| (1) | We utilize internal credit ratings determined by our Risk Management. Credit ratings determined by Risk Management use methodologies that produce ratings generally consistent with those produced by external rating agencies. |
Contingent Features
Certain of our derivative instruments contain provisions that require our debt to maintain an investment grade credit rating from each of the major credit rating agencies. If our debt were to fall below investment grade, it would be in violation of these provisions and the counterparties to the derivative instruments could request immediate payment or demand immediate and ongoing full overnight collateralization on our derivative instruments in liability positions. The aggregate fair value of all derivative instruments with such credit-risk-related contingent features that are in a liability position at November 30, 2013 and 2012 is $170.2 million and $164.8 million, respectively, for which we have posted collateral of $127.7 million and $129.2 million, respectively, in the normal course of business. If the credit-risk-related contingent features underlying these agreements were triggered on November 30, 2013 and 2012, we would have been required to post an additional $49.4 million and $38.1 million, respectively, of collateral to our counterparties.
Jef-43
Note 9. Collateralized Transactions
We enter into secured borrowing and lending arrangements to obtain collateral necessary to effect settlement, finance inventory positions, meet customer needs or re-lend as part of our dealer operations. We manage our exposure to credit risk associated with these transactions by entering into master netting agreements. We also monitor the fair value of the securities loaned and borrowed on a daily basis as compared with the related payable or receivable, and request additional collateral or return excess collateral, as appropriate. We pledge financial instruments as collateral under repurchase agreements, securities lending agreements and other secured arrangements, including clearing arrangements. Our agreements with counterparties generally contain contractual provisions allowing the counterparty the right to sell or repledge the collateral. Pledged securities owned that can be sold or repledged by the counterparty are included within Financial instruments owned and noted parenthetically as Securities pledged on our Consolidated Statements of Financial Condition.
We receive securities as collateral under resale agreements, securities borrowing transactions and customer margin loans. We also receive securities as collateral in connection with securities-for-securities transactions in which we are the lender of securities. In many instances, we are permitted by contract or custom to rehypothecate the securities received as collateral. These securities may be used to secure repurchase agreements, enter into securities lending transactions, satisfy margin requirements on derivative transactions or cover short positions. At November 30, 2013 and 2012, the approximate fair value of securities received as collateral by us that may be sold or repledged was $21.9 billion and $21.1 billion, respectively. The fair value of securities received as collateral at November 30, 2013 and 2012 that pertains to our securities financing activities at November 30, 2013 and 2012 are as follows (in thousands):
Successor | Predecessor | |||||||
November 30, 2013 | November 30, 2012 | |||||||
Carrying amount: | ||||||||
Securities purchased under agreements to resell | $ | 3,746,920 | $ | 3,357,602 | ||||
Securities borrowed | 5,359,846 | 5,094,679 | ||||||
Securities received as collateral | 11,063 | - | ||||||
Total assets on Consolidated Statement of Financial Condition | 9,117,829 | 8,452,281 | ||||||
Netting of securities purchased under agreements to resell (1) | 8,968,529 | 9,982,752 | ||||||
| 18,086,358 | 18,435,033 | |||||||
Fair value of additional collateral received (2) | 3,866,577 | 2,683,767 | ||||||
Fair value of securities received as collateral | $ | 21,952,935 | $ | 21,118,800 | ||||
(1) | Represents the netting of securities purchased under agreements to resell with securities sold under agreements to repurchase balances for the same counterparty under legally enforceable netting agreements. |
(2) | Includes 1) collateral received from customers for margin balances unrelated to arrangements for securities purchased under agreements to resell or securities borrowed with a fair value of $1,182.1 million and $1,252.6 million at November 30, 2013 and 2012, respectively, of which $596.2 million and $727.7 million had been rehypothecated, 2) collateral received on securities for securities transactions of $2,656.9 million and $1,378.8 million at November 30, 2013 and 2012, respectively and 3) collateral received in excess of the reverse repurchase and securities borrowed contract amounts. |
At November 30, 2013 and 2012, a substantial portion of the securities received by us had been sold or repledged.
In instances where we receive securities as collateral in connection with securities-for-securities transactions in which we are the lender of securities and are permitted to sell or repledge the securities received as collateral, we report the fair value of the collateral received and the related obligation to return the collateral in the Consolidated Statements of Financial Condition. At November 30, 2013 and 2012, $11.1 million and $-0-, respectively, were reported as Securities received as collateral and as Obligation to return securities received as collateral.
Jef-44
Note 10. Securitization Activities
We engage in securitization activities related to corporate loans, commercial mortgage loans and mortgage-backed and other asset-backed securities. In our securitization transactions, we transfer these assets to special purpose entities ("SPEs") and act as the placement or structuring agent for the beneficial interests sold to investors by the SPE. A significant portion of our securitization transactions are securitization of assets issued or guaranteed by U.S. government agencies. These SPEs generally meet the criteria of variable interest entities; however we generally do not consolidate the SPEs as we are not considered the primary beneficiary for these SPEs. See Note 11, Variable Interest Entities for further discussion on variable interest entities and our determination of the primary beneficiary.
We account for our securitization transactions as sales provided we have relinquished control over the transferred assets. Transferred assets are carried at fair value with unrealized gains and losses reflected in Principal transactions revenues in the Consolidated Statement of Earnings prior to the identification and isolation for securitization. Revenues subsequent to such identification and isolation, including revenues recognized from the sales of the beneficial interests to investors, are reflected as net underwriting revenues. If we have not relinquished control over the transferred assets, the assets continue to be recognized in Financial instruments owned and a corresponding secured borrowing is recognized in Other secured financings. The carrying value of assets and liabilities resulting from transfers made as part of our securitization activities for which we have not relinquished control over the related assets was $8.7 million and $8.7 million, respectively, at November 30, 2013. The related liabilities do not have recourse to our general credit. As of November 30, 2012, there were no outstanding transfers made as part of our securitization activities for which we have not relinquished control over the related assets.
We generally receive cash proceeds in connection with the transfer of assets to an SPE. We may, however, have continuing involvement with the transferred assets, which is limited to retaining one or more tranches of the securitization (primarily senior and subordinated debt securities), which are included within Financial instruments owned. We apply fair value accounting to the securities.
The following table presents activity related to our securitizations that were accounted for as sales in which we had continuing involvement (in millions):
Successor | Predecessor | |||||||||||||||
Nine Months Ended November 30, 2013 | Three Months Ended February 28, 2013 | Year Ended November 30, 2012 | Year Ended November 30, 2011 | |||||||||||||
Transferred assets | $ | 4,592.5 | $ | 2,735.2 | $ | 10,869.8 | $ | 12,539.6 | ||||||||
Proceeds on new securitizations | 4,609.0 | 2,751.3 | 10,910.8 | 12,611.0 | ||||||||||||
Net revenues | 10.7 | 12.9 | 35.4 | 82.7 | ||||||||||||
Cash flows received on retained interests
| $ | 35.6 | $ | 32.3 | $ | 64.3 | $ | 103.6 | ||||||||
Assets received as proceeds in the form of mortgage-backed-securities or collateralized loan obligations issued by the SPEs have been initially categorized as Level 2 within the fair value hierarchy. For further information on fair value measurements and the fair value hierarchy, refer to Note 2, Summary of Significant Accounting Policies and Note 7, Fair Value Disclosures. We have no explicit or implicit arrangements to provide additional financial support to these SPEs and have no liabilities related to these SPEs at November 30, 2013 and 2012. Although not obligated, in connection with secondary market-making activities we may make a market in the securities issued by these SPEs. In these market-making transactions, we buy these securities from and sell these securities to investors. Securities purchased through these market-making activities are not considered to be continuing involvement in these SPEs, although the securities are included in Financial instruments owned – Mortgage- and asset-backed securities. To the extent the securities purchased through these market-marking activities meet specific thresholds and we are not deemed to be the primary beneficiary of the variable interest entity, these securities are included in agency and non-agency mortgage- and asset-backed securitizations in the nonconsolidated variable interest entities table presented in Note 11, Variable Interest Entities.
Jef-45
The following tables summarize our retained interests in SPEs where we transferred assets and have continuing involvement and received sale accounting treatment (in millions):
Successor | ||||||||
As of November 30, 2013 | ||||||||
Securitization Type | Total Assets | Retained Interests | ||||||
U.S. government agency residential mortgage-backed securities | $ | 11,518.4 | $ | 281.3 | ||||
U.S. government agency commercial mortgage-backed securities | 5,385.6 | 96.8 | ||||||
Collateralized loan obligations | 728.5 | 9.0 | ||||||
Predecessor | ||||||||
As of November 30, 2012 | ||||||||
Securitization Type | Total Assets | Retained Interests | ||||||
U.S. government agency residential mortgage-backed securities | $ | 3,791.5 | $ | 335.2 | ||||
U.S. government agency commercial mortgage-backed securities | 2,193.4 | 28.9 | ||||||
We do not have any derivative contracts executed in connection with these securitization activities. Total assets represent the unpaid principal amount of assets in the SPEs in which we have continuing involvement and are presented solely to provide information regarding the size of the transaction and the size of the underlying assets supporting our retained interests, and are not considered representative of the risk of potential loss. Assets retained in connection with a securitization transaction represent the fair value of the securities of one or more tranches issued by an SPE, including senior and subordinated tranches. Our risk of loss is limited to this fair value amount which is included within total Financial instruments owned - Mortgage- and asset-backed securities on our Consolidated Statements of Financial Condition.
Note 11. Variable Interest Entities
Variable interest entities ("VIEs") are entities in which equity investors lack the characteristics of a controlling financial interest or do not have sufficient equity at risk for the entity to finance its activities without additional subordinated financial support. VIEs are consolidated by the primary beneficiary. The primary beneficiary is the party who has the power to direct the activities of a variable interest entity that most significantly impact the entity's economic performance and who has an obligation to absorb losses of the entity or a right to receive benefits from the entity that could potentially be significant to the entity.
We determine whether we are the primary beneficiary of a VIE upon our initial involvement with the VIE and we reassess whether we are the primary beneficiary of a VIE on an ongoing basis. Our determination of whether we are the primary beneficiary of a VIE is based upon the facts and circumstances for each VIE and requires significant judgment. In determining whether we are the party with the power to direct the VIE's most significant activities, we first identify the activities of the VIE that most significantly impact its economic performance. Our considerations in determining the VIE's most significant activities primarily include, but are not limited to, the VIE's purpose and design and the risks passed through to investors. We then assess whether we have the power to direct those significant activities. Our considerations in determining whether we have the power to direct the VIE's most significant activities include, but are not limited to, voting interests of the VIE, management, service and/or other agreements of the VIE, involvement in the VIE's initial design and the existence of explicit or implicit financial guarantees. In situations where we have determined that the power over the VIE's most significant activities is shared, we assess whether we are the party with the power over the majority of the significant activities. If we are the party with the power over the majority of the significant activities, we meet the "power" criteria of the primary beneficiary. If we do not have the power over a majority of the significant activities or we determine that decisions require consent of each sharing party, we do not meet the "power" criteria of the primary beneficiary.
Jef-46
We assess our variable interests in a VIE both individually and in aggregate to determine whether we have an obligation to absorb losses of or a right to receive benefits from the VIE that could potentially be significant to the VIE. The determination of whether our variable interest is significant to the VIE requires significant judgment. In determining the significance of our variable interest, we consider the terms, characteristics and size of the variable interests, the design and characteristics of the VIE, our involvement in the VIE and our market-making activities related to the variable interests. Our variable interests in VIEs include debt and equity interests, commitments and certain fees. Our involvement with VIEs arises primarily from:
| - | Purchases of mortgage-backed securities and collateralized debt and loan obligations in connection with our trading and secondary market making activities, |
| - | Retained interests held as a result of securitization activities as part of primary market making activities, including the resecuritizations of mortgage-backed securities and the securitization of corporate loans, |
| - | Financing of agency and non-agency mortgage-securities through financing vehicles utilizing master repurchase agreements, |
| - | Prior to the merger of Jefferies High Yield Holdings, LLC with Jefferies on April 1, 2013, ownership of debt, equity and partnership interests in Jefferies High Yield Holdings, LLC and related entities, |
| - | Management and performance fees in the Jefferies Umbrella Fund, and |
| - | Loans to and investments in investment fund vehicles. |
Consolidated VIEs
The following table presents information about the assets and liabilities of our consolidated VIEs, which are presented within our Consolidated Statements of Financial Condition in the respective asset and liability categories, as of November 30, 2013 and 2012. The assets and liabilities in the tables below are presented prior to consolidation and thus a portion of these assets and liabilities are eliminated in consolidation. We have aggregated our consolidated VIEs based upon principal business activity.
Successor | Predecessor | |||||||||||||||||||
(in millions) | November 30, 2013 | November 30, 2012 | ||||||||||||||||||
Securitization Vehicles | Other | High Yield | Securitization Vehicles | Other | ||||||||||||||||
Cash | $ | - | $ | 0.2 | $ | 388.1 | $ | - | $ | 0.2 | ||||||||||
Financial instruments owned | 97.5 | 0.4 | 894.2 | 10.0 | 0.5 | |||||||||||||||
Securities borrowed | - | - | 372.1 | - | - | |||||||||||||||
Securities purchased under agreement to resell (3) | 195.1 | - | - | 60.0 | - | |||||||||||||||
Receivable from brokers and dealers | - | - | 264.5 | - | - | |||||||||||||||
Other | 2.3 | - | 11.4 | - | - | |||||||||||||||
| $ | 294.9 | $ | 0.6 | $ | 1,930.3 | $ | 70.0 | $ | 0.7 | |||||||||||
Financial instruments sold, not yet purchased | $ | - | $ | - | $ | 526.1 | $ | - | $ | - | ||||||||||
Securities loaned | - | - | 112.0 | - | - | |||||||||||||||
Payable to brokers and dealers | - | - | 201.2 | - | - | |||||||||||||||
Mandatorily redeemable interests (1) | - | - | 1,076.0 | - | - | |||||||||||||||
Other secured financings (2) | 292.5 | - | - | 70.0 | - | |||||||||||||||
Other | 2.1 | 0.2 | 15.0 | - | 0.2 | |||||||||||||||
| $ | 294.6 | $ | 0.2 | $ | 1,930.3 | $ | 70.0 | $ | 0.2 | |||||||||||
(1) | After consolidation, which eliminates our interests and the interests of our consolidated subsidiaries, JSOP and JESOP, the carrying amount of the mandatorily redeemable financial interests pertaining to the above VIEs included within Mandatorily redeemable preferred interests of consolidated subsidiaries was approximately $348.1 million at November 30, 2012. These amounts represent the portion of the mandatorily redeemable preferred interests held by our joint venture partner. |
(2) | Approximately $66.5 million and $7.7 million of the secured financing represents an amount held by us in inventory and is eliminated in consolidation at November 30, 2013 and 2012, respectively. |
(3) | Securities purchased under agreement to resell represent an amount due under a collateralized transaction on a related consolidated entity, which is eliminated in consolidation. |
Jef-47
High Yield. We have historically conducted our high yield secondary market trading activities through Jefferies High Yield Trading, LLC ("JHYT") and Jefferies Leveraged Credit Products, LLC ("JLCP"). JHYT was a registered broker-dealer engaged in the secondary sales and trading of high yield and special situation securities, including bank debt, post-reorganization equity, public and private equity, equity derivatives and other financial instruments. JHYT made markets in high yield and distressed securities and provided research coverage on these types of securities. JLCP was engaged in the trading of bank debt, credit default swaps and trade claims. JHYT and JLCP were wholly owned subsidiaries of JHYH. As of November 30, 2012, we owned voting and non-voting interests in JHYH and had entered into management, clearing, and other services agreements with JHYH. We and Leucadia each had the right to nominate two of a total of four directors to JHYH's board of directors. Further, two funds managed by us, JSOP and JESOP, were also investors in JHYH. We determined that JHYH, JSOP and JESOP met the definition of a variable interest entity and, as the primary beneficiary of JHYH, JSOP and JESOP, consolidated JHYH (and the assets, liabilities and results of operations of its wholly owned subsidiaries JHYT and JLCP), JSOP and JESOP. At November 30, 2012, the carrying amount of our variable interest was $389.4 million, which consists of our debt, equity and partnership interests in JHYH, JSOP and JESOP, which were eliminated in consolidation.
On April 1, 2013, we merged JHYH and JHYT into Jefferies with Jefferies as the surviving entity. In addition, JLCP became a wholly-owned subsidiary of Jefferies Group LLC. Accordingly, the high yield entities that were consolidated VIEs no longer exist at November 30, 2013. See Note 17, Noncontrolling Interests and Mandatorily Redeemable Preferred Interests of Consolidated Subsidiaries for further discussion of JSOP, JESOP and the mandatorily redeemable interests in JHYH.
Effective March 1, 2013, we deconsolidated JSOP and JESOP following their liquidation and dissolution and we redeemed third party interest in JSOP and JESOP for cash of $347.6 million after giving effect to redemption of their respective interests in JHYH for cash, equal to the valuation of JHYH as of February 28, 2013. There was no gain or loss recognized on the deconsolidation of JSOP and JESOP.
Securitization Vehicles . We are the primary beneficiary of a securitization vehicle to which we transferred a corporate loan and retained a portion of the securities issued by the securitization vehicle. Our variable interests in this vehicle consists of the securities retained. The assets of the VIE consist of a corporate loan, which is available for the benefit of the vehicle's beneficial interest holders. The creditors of the VIE do not have recourse to our general credit. During the nine months ended November 30, 2013, securities held in a securitization vehicle for which we were the primary beneficiary were redeemed. Upon redemption, we determined that we are no longer the primary beneficiary and we deconsolidated the securitization vehicle during the period. The assets of this VIE consisted of a project loan, and our variable interests in this vehicle consisted of the securities and a contractual servicing fee.
We are also the primary beneficiary of mortgage-backed financing vehicles to which we sell agency and non-agency residential and commercial mortgage-backed securities pursuant to the terms of a master repurchase agreement. We manage the assets within these vehicles. Our variable interests in these vehicles consist of our collateral margin maintenance obligations under the master repurchase agreement. The assets of these VIEs consist of reverse repurchase agreements, which are available for the benefit of the vehicle's debt holders. The creditors of these VIEs do not have recourse to our general credit.
Other. We are the primary beneficiary of certain investment vehicles set up for the benefit of our employees. We manage and invest alongside our employees in these vehicles. The assets of these VIEs consist of private equity securities, and are available for the benefit of the entities' equity holders. Our variable interests in these vehicles consist of equity securities. The creditors of these VIEs do not have recourse to our general credit.
Jef-48
Nonconsolidated VIEs
We also hold variable interests in VIEs in which we are not the primary beneficiary and do not have the power to direct the activities that most significantly impact their economic performance and, accordingly, do not consolidate. We have not provided financial or other support to these VIEs during the Successor period nine months ended November 30, 2013, and Predecessor periods three months ended February 28, 2013 and year ended November 30, 2012. We have no explicit or implicit arrangements to provide additional financial support to these VIEs and, other than as discussed below, have no liabilities related to these VIEs at November 30, 2013 and November 30, 2012.
The following tables present information about nonconsolidated VIEs in which we had variable interests aggregated by principal business activity. The tables include VIEs where we have determined that the maximum exposure to loss is greater than specific thresholds or meets certain other criteria.
Successor | ||||||||||||||
November 30, 2013 | ||||||||||||||
Variable Interests | ||||||||||||||
(in millions) | Financial Statement Carrying Amount | Maximum exposure to loss | VIE Assets | |||||||||||
Collateralized loan obligations | $ | 11.9 | (2 | ) | $ | 11.9 | (4 | ) | $ | 1,122.3 | ||||
Agency mortgage- and asset-backed securitizations (1) | 1,226.0 | (2 | ) | 1,226.0 | (4 | ) | 5,857.3 | |||||||
Non-agency mortgage- and asset-backed securitizations (1) | 840.1 | (2 | ) | 840.1 | (4 | ) | 78,070.8 | |||||||
Asset management vehicle | 3.5 | (3 | ) | 3.5 | (4 | ) | 454.2 | |||||||
Private equity vehicles | 40.8 | (3 | ) | 68.8 | 89.4 | |||||||||
Total | $ | 2,122.3 | $ | 2,150.3 | $ | 85,594.0 | ||||||||
(1) | VIE assets represent the unpaid principal balance of the assets in these vehicles at November 30, 2013 and represent the underlying assets that provide the cash flows supporting our variable interests. |
(2) | Consists of debt securities accounted for at fair value, which are included within Financial instruments owned. |
(3) | Consists of equity interests and loans, which are included within Investments in managed funds and Loans to and investments in related parties. |
(4) | Our maximum exposure to loss in these non-consolidated VIEs is limited to our investment, which is represented by the financial statement carrying amount of our purchased or retained interests. |
| ||||||||||||||
Predecessor | ||||||||||||||
November 30, 2012 | ||||||||||||||
Variable Interests | ||||||||||||||
(in millions) | Financial Statement Carrying Amount | Maximum exposure to loss | VIE Assets | |||||||||||
Collateralized loan obligations | $ | 5.3 | (2 | ) | $ | 5.3 | (4 | ) | $ | 499.7 | ||||
Agency mortgage- and asset-backed securitizations (1) | 1,579.1 | (2 | ) | 1,579.1 | (4 | ) | 6,396.6 | |||||||
Non-agency mortgage- and asset-backed securitizations (1) | 814.1 | (2 | ) | 814.1 | (4 | ) | 54,436.2 | |||||||
Asset management vehicle | 3.0 | (3 | ) | 3.0 | (4 | ) | 505.3 | |||||||
Private equity vehicles | 55.0 | (3 | ) | 107.7 | 82.1 | |||||||||
Total | $ | 2,456.5 | $ | 2,509.2 | $ | 61,919.9 | ||||||||
(1) | VIE assets represent the unpaid principal balance of the assets in these vehicles at November 30, 2012 and represent the underlying assets that provide the cash flows supporting our variable interests. |
(2) | Consists of debt securities accounted for at fair value, which are included within Financial instruments owned. |
(3) | Consists of equity interests and loans, which are included within Investments in managed funds and Loans to and investments in related parties. |
(4) | Our maximum exposure to loss in these non-consolidated VIEs is limited to our investment, which is represented by the financial statement carrying amount of our purchased or retained interests. |
Collateralized Loan Obligations. We acted as transferor and underwriter in several collateralized loan obligation ("CLOs") transactions during the periods presented and retained securities representing variable interests in the CLOs. Assets collateralizing the CLOs include bank loans, participation interests and sub-investment grade and senior secured U.S. loans. In addition, we own variable interests in CLOs previously managed by us. These CLOs represent interests in assets consisting primarily of senior secured loans, unsecured loans and high yield bonds. Our exposure to loss from these entities is limited to our investments in the debt securities held. Regarding the CLOs previously managed by us, our variable interests consists of debt securities (with a fair value of $2.9 million and $5.3 million at November 30, 2013 and 2012, respectively) and a right to a portion of the CLOs' management and incentive fees. Management and incentives fees are accrued as the amounts become realizable.
Jef-49
During the year ended November 30, 2012, we sold our variable interests in Babson Loan Opportunity CLO, Ltd., a third party managed CLO, with assets consisting primarily of senior secured loans, unsecured loans and high yield bonds. Prior to the sale our variable interests in this VIE consisted of a direct interest and an indirect interest via Jefferies Finance, LLC in the debt securities of this CLO. Our exposure to loss was limited to our investments in the debt securities. We had no exposure to loss related to this VIE as of November 30, 2012.
Mortgage- and Asset-Backed Vehicles. In connection with our trading and market making activities, we buy and sell mortgage- and asset-backed securities. Mortgage- and asset-backed securities issued by securitization entities are generally considered variable interests in VIEs. A substantial portion of our variable interests in mortgage- and asset-backed VIEs are sponsored by unrelated third parties. The variable interests consist entirely of mortgage- and asset-backed securities and are accounted for at fair value and included in Financial instruments owned on our Consolidated Statements of Financial Condition. In addition to the agency mortgage- and asset-backed securities, non-agency mortgage- and asset-backed securities and collateralized loan obligations presented in the above table, we owned additional securities issued by securitization SPEs for which the maximum exposure to loss is less than specific thresholds. These additional securities were acquired in connection with our secondary market making activities and our securitization activities. Total securities issued by securitization SPEs at November 30, 2013 consist of the following (in millions):
Nonagency | Agency | Total | ||||||||||
Variable interests in collateralized loan obligations | $ | 11.9 | $ | - | $ | 11.9 | ||||||
Variable interests in agency mortgage- and asset-backed securitizations | - | 1,226.0 | 1,226.0 | |||||||||
Variable interests in nonagency mortgage- and asset-backed securitizations | 840.1 | - | 840.1 | |||||||||
Additional securities in connection with trading and market making activities: | ||||||||||||
Residential mortgage-backed securities | 55.1 | 1,668.2 | 1,723.3 | |||||||||
Commercial mortgage-backed securities | 27.9 | 581.9 | 609.8 | |||||||||
Collateralized debt obligations | 27.9 | - | 27.9 | |||||||||
Other asset-backed securities | 34.1 | - | 34.1 | |||||||||
Total mortgage- and asset-backed securities on the Consolidated Statement of Financial Condition | $ | 997.0 | $ | 3,476.1 | $ | 4,473.1 | ||||||
In addition, we entered into an agreement to sell at a fixed price corporate loans and the ownership interest in an entity holding such corporate loans to a CLO, which we have determined represents a variable interest in the CLO. At November 30, 2013, the carrying value of our variable interest in the CLO was a liability of $167,000, which was recorded to Financial instruments sold, not yet purchased, at fair value – Derivatives on the Consolidated Statement of Financial Condition, and our maximum exposure to loss under the forward sale agreement was approximately $76.9 million.
Asset Management Vehicle. We manage the Jefferies Umbrella Fund, an "umbrella structure" company that enables investors to choose between one or more investment objectives by investing in one or more sub-funds within the same structure. The assets of the Jefferies Umbrella Fund primarily consist of convertible bonds. Accounting changes to consolidation standards under generally accepted accounting principles have been deferred for entities that are considered to be investment companies; accordingly, consolidation continues to be determined under a risk and reward model. The Jefferies Umbrella Fund is subject to the deferral guidance and we are not the primary beneficiary as of November 30, 2013 and 2012 under the risk and reward model. Our variable interests in the Jefferies Umbrella Fund consist of equity interests, management fees and performance fees.
Private Equity Vehicles. On July 26, 2010, we committed to invest equity of up to $75.0 million in Jefferies SBI USA Fund L.P. (the "SBI USA Fund"). As of November 30, 2013 and 2012, we funded approximately $47.0 million and $27.1 million, respectively, of our commitment. The carrying amount of our equity investment was $39.2 million and $20.8 million at November 30, 2013 and 2012, respectively. Our exposure to loss is limited to our equity commitment. The SBI USA Fund has assets consisting primarily of private equity and equity related investments.
We have variable interests in Jefferies Employees Partners IV, LLC ("JEP IV") consisting of an equity investment and, at November 30, 2012, an equity investment and a $37.5 million loan commitment. The carrying amount of our equity investment was $1.6 million and $1.5 million at November 30, 2013 and 2012, respectively. As of November 30, 2012, we had funded approximately $32.7 million of the principal balance, which is included in Loans to and investments in related parties on our Consolidated Statement of Financial Condition. During the year ended November 30, 2013, our loan was repaid and we no longer have a loan commitment to JEP IV at November 30, 2013. Our exposure to loss is limited to, in aggregate, our equity investment and, in 2012, the aggregate amount of our loan commitment. JEP IV has assets consisting primarily of private equity and equity related investments.
Jef-50
Note 12. Investments
We have investments in Jefferies Finance, LLC ("Jefferies Finance"), Jefferies LoanCore LLC ("Jefferies LoanCore") and KCG Holdings, Inc. ("Knight Capital"). Our investment in Knight Capital is accounted for at fair value by electing the fair value option available under U.S. GAAP and is included in Financial instruments owned, at fair value – Corporate equity securities on the Consolidated Statement of Financial Condition with changes in fair value recognized in Principal transaction revenues on the Consolidated Statement of Earnings. Our investments in Jefferies Finance and Jefferies LoanCore are accounted for under the equity method and are included in Loans to and investments in related parties on the Consolidated Statements of Financial Condition with our share of the investees' earnings recognized in Other revenues in the Consolidated Statements of Earnings.
Jefferies Finance
On October 7, 2004, we entered into an agreement with Babson Capital Management LLC ("Babson Capital") and Massachusetts Mutual Life Insurance Company ("MassMutual") to form Jefferies Finance, a joint venture entity. Jefferies Finance is a commercial finance company whose primary focus is the origination and syndication of senior secured debt to middle market and growth companies in the form of term and revolving loans. Loans are originated primarily through the investment banking efforts of Jefferies, with Babson Capital providing primary credit analytics and portfolio management services. Jefferies Finance can also originate other debt products such as second lien term, bridge and mezzanine loans, as well as related equity co-investments. Jefferies Finance also purchases syndicated loans in the secondary market, including loans that are performing, stressed and distressed loan obligations.
As of November 30, 2013, we and MassMutual each have equity commitments to Jefferies Finance of $600.0 million for a total commitment of $1.2 billion, reflecting a $100.0 million increase in the commitment by each partner in March 2013. As of November 30, 2013, we have funded $337.3 million of our $600.0 million commitment, leaving $262.7 million unfunded. The investment commitment is scheduled to mature on March 1, 2016 with automatic one year extensions subject to a 60 day termination notice by either party. As of November 30, 2012, we had funded $107.5 million of our $500.0 million commitment, leaving $392.5 million unfunded.
Jefferies Finance has executed a Secured Revolving Credit Facility with us and MassMutual, to be funded equally, to support loan underwritings by Jefferies Finance. The Secured Revolving Credit Facility bears interest based on the interest rates of the related Jefferies Finance underwritten loans and is secured by the underlying loans funded by the proceeds of the facility. The total committed Secured Revolving Credit Facility is $700.0 million at November 30, 2013, having been reduced by $300.0 million in March 2013. The facility is scheduled to mature on March 1, 2016 with automatic one year extensions subject to a 60 day termination notice by either party. At November 30, 2013, we have funded $123.8 million of our $350.0 million commitment. At November 30, 2012, we had funded $125.0 million of our $500.0 million commitment. During the nine months ended November 30, 2013 and three months ended February 28, 2013, $1.5 million and $4.1 million of interest income and $1.2 million and $0.3 million of unfunded commitment fees, respectively, are included in the Consolidated Statement of Earnings related to the Secured Revolving Credit Facility. During the year ended November 30, 2012, we earned interest income of $8.4 million and unfunded commitment fees of $1.8 million, respectively.
The following is a summary of selected financial information for Jefferies Finance as of November 30, 2013 and 2012 (in millions):
November 30, 2013 | November 30, 2012 | |||||||
Total assets | $ | 3,269.5 | $ | 1,730.4 | ||||
Total liabilities | 2,594.3 | 1,188.2 | ||||||
Total equity | 675.2 | 542.2 | ||||||
Our total equity balance | 337.6 | 271.1 | ||||||
The net earnings of Jefferies Finance were $133.0 million, $128.6 million and $88.4 million for the years ended November 30, 2013, 2012 and 2011, respectively.
We engage in debt capital markets transactions with Jefferies Finance related to the originations of loans by Jefferies Finance. In connection with such transactions, we earned net underwriting fees of $125.8 million during the nine months ended November 30, 2013, $39.9 million during the three months ended February 28, 2013 and $123.1 million and $60.8 million during the years ended November 30, 2012 and 2011, respectively, recognized in Investment banking revenues on the Consolidated Statements of Earnings. In addition, we paid fees to Jefferies Finance regarding certain loans originated by Jefferies Finance of $12.0 million during the nine months ended November 30, 2013, $0.8 million during the three months ended February 28, 2013, and $8.7 million and $21.5 million during the years ended November 30, 2012 and 2012, respectively, which are recognized within Business development expenses on the Consolidated Statements of Earnings.
During the years ended November 30, 2012 and 2011, we purchased participation certificates in loans originated by Jefferies Finance of $900.0 million and $477.2 million, respectively, which were redeemed in full during the same periods.
Under a service agreement, we charged Jefferies Finance $14.2 million for certain administrative services for the nine months ended November 30, 2013, $15.7 million during the three months ended February 28, 2013, and $26.8 million and $20.9 million for the years ended November 30, 2012 and 2011, respectively. Receivables from Jefferies Finance, included within Other assets on the Consolidated Statements of Financial Condition, were $31.1 million and $32.1 million at November 30, 2013 and 2012, respectively.
Jef-51
Jefferies LoanCore
On February 23, 2011, we entered into a joint venture agreement with the Government of Singapore Investment Corporation and LoanCore, LLC and formed Jefferies LoanCore, a commercial real estate finance company. Jefferies LoanCore originates and purchases commercial real estate loans throughout the United States with the support of the investment banking and securitization capabilities of Jefferies and the real estate and mortgage investment expertise of the Government of Singapore Investment Corporation and LoanCore, LLC. Jefferies LoanCore has aggregate equity commitments of $600.0 million. As of November 30, 2013 and 2012, we have funded $175.5 million and $110.0 million, respectively, of our $291.0 million equity commitment and have a 48.5% voting interest in Jefferies LoanCore.
The following is a summary of selected financial information for Jefferies LoanCore as of November 30, 2013 and 2012 (in millions):
November 30, 2013 | November 30, 2012 | |||||||
Total assets | $ | 974.9 | $ | 372.0 | ||||
Total liabilities | 507.9 | 98.4 | ||||||
Total equity | 467.0 | 273.6 | ||||||
Our total equity balance | 226.5 | 132.7 | ||||||
The net earnings of Jefferies LoanCore were $85.2 million and $84.2 million for the years ended November 30, 2013 and 2012, respectively, and a loss of $2.6 million for the period from February 23, 2011 through November 30, 2011.
Under a service agreement, we charged Jefferies LoanCore $0.5 for administrative services for the nine months ended November 30, 2013, $0.6 million for the three months ended February 28, 2013 and $0.5 million and $0.3 million for the year ended November 30, 2012 and the period from February 23, 2011 through November 30, 2011, respectively. Receivables from Jefferies LoanCore, included within Other assets on the Consolidated Statements of Financial Condition, were $230,000 and $37,000, at November 30, 2013 and 2012, respectively.
Jefferies LoanCore enters into derivative transactions with us to hedge its loan portfolio. As of November 30, 2013 and 2012, the aggregate net fair value of derivative transactions outstanding with Jefferies LoanCore was $-0- million and $0.7 million, respectively, and is included within Financial instruments owned on the Consolidated Statement of Financial Condition. On derivative transactions with Jefferies LoanCore, we recognized a net gain of $3.6 million for the nine months ended November 30, 2013, a net gain of $0.2 million during the three months ended February 28, 2013 and a net gain of $25.6 million during the year ended November 30, 2012, which are included in Principal transactions revenue on the Consolidated Statements of Earnings.
Knight Capital
On August 6, 2012, we entered into a Securities Purchase Agreement with Knight Capital, a publicly-traded global financial services firm, ("the Agreement"). Under the Agreement, we purchased preferred stock in exchange for cash consideration of $125.0 million. The preferred stock consisted of 24,876 shares of Series A-1 Cumulative Perpetual Convertible Preferred Stock ("Series A-1 Shares") and 100,124 shares of Series A-2 Non-voting Cumulative Perpetual Convertible Preferred Stock ("Series A-2 Shares") (collectively the "Series A Securities"). Each Series A-1 Share is convertible into shares of common stock at the conversion rate of 666.667 shares of common stock. Each Series A-2 Share is convertible into one Series A-1 Share. On August 29, 2012, we exercised our conversion options and converted our holding of Series A Securities to common stock of Knight Capital. On July 1, 2013, Knight Capital Group, Inc. merged with GETCO Holding Company, LLC (the merged company referred to as "KCG Holdings, Inc."). In connection with the consummation of the merger, we received cash consideration of $3.75 per share, or approximately $192.0 million, with respect to approximately 63% of our holdings in Knight Capital Group, Inc. and stock consideration of one third of a share of KCG Holdings, Inc. common stock for each share of Knight Capital common stock for the remainder of our holdings. As of November 30, 2013, we owned approximately 13% of the outstanding common stock of KCG Holdings, Inc.
We elected to record our investment in Knight Capital at fair value under the fair value option as the investment was acquired as part of our capital markets activities. The valuation of our investment at November 30, 2013 is based on the closing exchange price of Knight Capital's common stock and included within Level 1 of the fair value hierarchy. Changes in the fair value of our investment of $19.5 million for the nine months ended November 30, 2013, $26.5 million for three months ended February 28, 2013, and $151.9 million for the year ended November 30, 2012, are recognized in Revenues - Principal transactions on the Consolidated Statement of Earnings.
Jef-52
The following is a summary of selected financial information for Knight Capital as of September 30, 2013 and December 31, 2012, the most recently available public financial information for the company (in millions):
September 30, 2013 | December 31, 2012 | |||||||
Total assets | $ | 13,293.3 | $ | 1,687.5 | ||||
Total liabilities | 11,780.3 | 1,032.8 | ||||||
Total equity and convertible preferred stock | 1,513.0 | 654.7 | ||||||
For the three and nine months ended September 30, 2013 and for the year ended December 31, 2012, Knight Capital reported net income of 226.8 million, $137.5 million and a net loss of $347.1 million, respectively.
We have separately entered into securities lending transactions with Knight Capital in the normal course of our capital markets activities. At November 30, 2013, the balances of securities borrowed and securities loaned were $11.0 million and $22.7 million, respectively and at November 30, 2012, $9.3 million and $20.9 million, respectively. During the nine months ended November 30, 2013, we earned a fee of $10.0 million in connection with a $535.0 million senior secured credit agreement provided by Jefferies Finance in connection with financing the merger of Knight Capital and GETCO Holding Company, LLC. In connection with Knight Capital's capital raising transaction in the third quarter of fiscal 2012, we recognized an advisory fee of $20.0 million which is included within Investment banking revenues on the Consolidated Statement of Earnings.
Note 13. Goodwill and Other Intangible Assets
In connection with the Merger, goodwill of $1.7 billion was recorded on March 1, 2013. In addition, as of March 1, 2013, certain existing intangible assets and new intangible assets were identified and recorded at their fair values. See Note 4, Leucadia Merger and Related Transactions for further information.
Goodwill
The following table presents goodwill resulting from the Merger attributed to our reportable segments:
November 30, 2013 | November 30, 2012 | |||||||
Capital Markets | $ | 1,717,246 | $ | 365,670 | ||||
Asset Management | 5,100 | - | ||||||
Total goodwill | $ | 1,722,346 | $ | 365,670 | ||||
The following table is a summary of the changes to goodwill for the nine months ended November 30, 2013, three months ended February 28, 2013 and year ended November 30, 2012 (in thousands):
Successor | Predecessor | ||||||||||||
Nine Months Ended November 30, 2013 | Three Months Ended February 28, 2013 | Year Ended November 30, 2012 | |||||||||||
Balance, at beginning of period | $ | 1,720,380 | $ | 365,670 | $ | 365,574 | |||||||
Less: Disposal | (5,700 | ) | (2) | ||||||||||
Add: Contingent consideration | - | 2,394 | - | ||||||||||
Add: Translation adjustments | 7,666 | (1,287 | ) | 96 | |||||||||
Balance, at end of period | $ | 1,722,346 | $ | 366,777 | (1) | $ | 365,670 | ||||||
(1) Predecessor Company goodwill as of February 28, 2013 was reduced to $-0- as of March 1, 2013, as a result of purchase accounting adjustments.
(2) During the nine months ended November 2013, we restructured our commodity asset management business and no longer have a controlling financial interest and accordingly do not consolidate. In addition, we sold Jefferies International Management Limited to Leucadia. Accordingly, goodwill associated with these entities was included in the net assets disposed of in the transactions.
Contingent consideration recorded during the three months ended February 28, 2013 relates to the lapse of certain conditions as specified in the purchase agreements associated with an acquisition in 2007.
Jef-53
Goodwill Impairment Testing
Goodwill associated with the merger is allocated to related reporting units, which are determined based on financial information provided to management in connection with its management of the businesses. A reporting unit is an operating segment or one level below an operating segment. As part of the push down of the acquisition method of accounting for the Merger and the resulting creation of a new Successor reporting entity, our annual goodwill impairment testing date is designated as August 1. Prior to the merger, our annual goodwill impairment test date was June 1.
The quantitative goodwill impairment test is performed at the level of the reporting unit and consists of two steps. In the first step, the fair value of each reporting unit is compared with its carrying value, including goodwill and allocated intangible assets. If the fair value is in excess of the carrying value, the goodwill for the reporting unit is considered not to be impaired. If the fair value is less than the carrying value, then a second step is performed in order to measure the amount of the impairment loss, if any, which is based on comparing the implied fair value of the reporting unit's goodwill to the fair value of the net assets of the reporting unit.
Allocated equity plus goodwill and allocated intangible assets are used as a proxy for the carrying amount of each reporting unit. The amount of equity allocated to a reporting unit is based on our cash capital model deployed in managing our businesses, which seeks to approximate the capital a business would require if it were operating independently. Intangible assets are allocated to a reporting unit based on either specifically identifying a particular intangible asset as pertaining to a reporting unit or, if shared among reporting units, based on an assessment of the reporting unit's benefit from the intangible asset in order to generate results.
Estimating the fair value of a reporting unit requires management judgment. Estimated fair values for our reporting units were determined using a market valuation method that incorporate price-to-earnings and price-to-book multiples of comparable public companies and, for certain reporting units, a net asset value method. In addition, as the fair values determined under the market approach represent a noncontrolling interest, we applied a control premium to arrive at the estimated fair value of each reporting unit on a controlling basis. We engaged an independent valuation specialist to assist us in our valuation process as of August 1, 2013.
Our annual goodwill impairment testing as of August 1, 2013 did not indicate any goodwill impairment in any of our reporting units. Substantially all of our goodwill is allocated to our Investment Banking, Equities and Fixed Income reporting units for which the results of our assessment indicated that these reporting units had a fair value substantially in excess of their carrying amounts based on current projections. Goodwill allocated to these reporting units is $1,665.3 million of total goodwill of $1,722.3 million at November 30, 2013. For the remaining less significant reporting units, which contain approximately 3.3% of our total goodwill, we have used a net asset approach for valuation and the fair value of each of the reporting units is equal to its book value.
Intangible Assets
The following tables present the gross carrying amount, accumulated amortization, net carrying amount and weighted average amortization period of identifiable intangible assets as of November 30, 2013 and 2012 (in thousands):
Successor | ||||||||||||||||||||
November 30, 2013 | ||||||||||||||||||||
Gross cost | Impairment losses | Accumulated amortization | Net carrying amount | Weighted average remaining lives (years) | ||||||||||||||||
Customer relationships (1) | $ | 136,740 | $ | - | $ | (17,567 | ) | $ | 119,173 | 14.8 | ||||||||||
Trade name | 132,967 | - | (2,966 | ) | 130,001 | 34.3 | ||||||||||||||
Exchange and clearing organization membership interests and registrations (2) | 15,294 | (378 | ) | - | 14,916 | N/A | ||||||||||||||
| $ | 285,001 | $ | (378 | ) | $ | (20,533 | ) | $ | 264,090 | |||||||||||
Predecessor | ||||||||||||||||||||
November 30, 2012 | ||||||||||||||||||||
Gross cost | Impairment losses | Accumulated amortization | Net carrying amount | Weighted average remaining lives (years) | ||||||||||||||||
Customer relationships | $ | 10,542 | $ | - | $ | (4,107 | ) | 6,435 | 7.9 | |||||||||||
Trade name | 1,680 | - | (1,287 | ) | 393 | 3.5 | ||||||||||||||
Other | 100 | - | (15 | ) | 85 | 12.8 | ||||||||||||||
Exchange and clearing organization membership interests and registrations | 11,219 | (2,873 | ) | - | $ | 8,346 | N/A | |||||||||||||
| $ | 23,541 | $ | (2,873 | ) | $ | (5,409 | ) | $ | 15,259 | |||||||||||
(1) The gross cost and accumulated amortization of customer relationships has been reduced by $132,000 and $5,500 respectively, as these customer relationships related to our commodity asset management business, which we restructured in September 2013 and for which we no longer own a controlling financial interest and do not consolidate at November 30, 2013.
(2) The gross cost of exchange and clearing organization membership interests and registrations has been reduced by $255,000 as these registrations relate to asset management businesses which we restructured or sold during the nine months ended November 30, 2013.
Jef-54
We performed our annual impairment testing of intangible assets with an indefinite useful life, which consists of exchange and clearing organization membership interests and registrations, as of August 1. We elected to perform a quantitative assessment of membership interests and registrations that have available quoted sales prices, and a qualitative assessment of the remainder of our intangible assets. In applying our quantitative assessment, we recognized an impairment loss of $378,000 on certain exchange memberships based on a decline in fair value at August 1, 2013 as observed based on quoted sales prices. With regard to our qualitative assessment of the remaining indefinite-life intangible assets, based on our assessment of market conditions, the utilization of the assets and the replacement costs associated with the assets since the most recent valuation date of March 1, 2013 as part of acquisition accounting, we have concluded that it is not more likely than not that the intangible assets are impaired. Prior to our merger with Leucadia, our annual impairment testing date was June 1.
During the second fiscal quarter of 2012, as a result of a significant decline in the fair value of our exchange and clearing organization membership interests and registrations we recognized an impairment loss of $2.9 million. Fair values were based on prices of public sales which had declined over the past year.
For intangible assets with a finite life, aggregate amortization expense amounted to $20.5 million for the nine months ended November 30, 2013, $0.4 million for the three months ended February 28, 2013 and $2.3 million and $1.4 million for the years ended November 30, 2012 and 2011, respectively, which is included in Other expenses on the Consolidated Statements of Earnings.
Estimated future amortization expense for the next five fiscal years are as follows (in thousands):
Fiscal year | Estimated future amortization expense | ||||
2014 | $ | 12,668 | |||
2015 | 12,668 | ||||
2016 | 12,668 | ||||
2017 | 12,668 | ||||
2018 | 12,668 | ||||
Jef-55
Mortgage Servicing Rights
On November 30, 2012, we sold substantially all of our mortgage servicing rights for military housing for approximately $30.9 million; and on May 20, 2013, we sold the remaining servicing rights for $2.0 million.
Mortgage servicing rights for military housing mortgage loans were accounted for as an intangible asset and included within Other assets in the Consolidated Statements of Financial Condition. The mortgage servicing rights were amortized over the period of the estimated net servicing income, which is reported in Other revenues in the Consolidated Statements of Earnings. We provided no credit support in connection with the servicing of these loans and were not required to make servicing advances on the loans in the underlying portfolios. We determined that the servicing rights represented one class of servicing rights based on the availability of market inputs to measure the fair value of the asset and our treatment of the asset as one aggregate pool for risk management purposes. We earned no fees related to these servicing rights during the nine months ended November 30, 2013, $114,000 during the three months ended February 28, 2013 and $3.7 million and $4.1 million during the years ended November 30, 2012 and 2011, respectively.
The following presents the activity in the balance of these servicing rights for the nine months ended November 30, 2013, three months ended February 28, 2013 and year ended November 30, 2012 (in thousands):
Successor | Predecessor | |||||||||||
Nine Months Ended November 30, 2013 | Three Months Ended February 28, 2013 | Twelve Months Ended November 30, 2012 | ||||||||||
Balance, beginning of period | $ | 2,000 | $ | 805 | $ | 8,202 | ||||||
Add: Acquisition | - | - | 162 | |||||||||
Less: Sales, net | (2,000 | ) | - | (6,959 | ) | |||||||
Less: Pay down | - | - | (211 | ) | ||||||||
Less: Amortization | - | (10 | ) | (389 | ) | |||||||
Balance, end of period | $ | - | $ | 795 | $ | 805 | ||||||
| ||||||||||||
Note 14. Short-Term Borrowings
Bank loans represent short-term borrowings that are payable on demand and generally bear interest at a spread over the federal funds rate. Unsecured bank loans are typically overnight loans used to finance financial instruments owned or clearing related balances, but are not part of our systemic funding model. Bank loans at November 30, 2013 and November 30, 2012 totaled $12.0 million and $150.0 million, respectively, of which $12.0 million and $100.0 million at November 30, 2013 and 2012 is secured financing. At November 30, 2013, the interest rate on short-term borrowings outstanding is 0.66%. Average daily bank loans outstanding for the nine months ended November 30, 2013, the three months ended February 28, 2013 and the year ended November 30, 2012 are $43.3 million, $110.0 million and $66.4 million, respectively.
Jef-56
Note 15. Long-Term Debt
In conjunction with pushdown accounting for the Merger with Leucadia on March 1, 2013, we recorded our long-term debt at its then current fair value of $6.1 billion, which included $536.5 million of excess of the fair value over the total principal amount of our debt at March 1, 2013, in aggregate. The premium is being amortized to interest expense using the effective yield method over the remaining lives of the underlying debt obligations. See Note 4, Leucadia Merger and Related Transactions for further information.
The following summarizes our long-term debt carrying values (including unamortized discounts and premiums and valuation adjustment, where applicable) at November 30, 2013 and 2012 (in thousands):
Successor | Predecessor | |||||||
Unsecured Long-Term Debt | November 30, 2013 | November 30, 2012 | ||||||
5.875% Senior Notes, due June 8, 2014 (effective interest rate of 1.51%) | $ | 255,676 | $ | 249,564 | ||||
3.875% Senior Notes, due November 9, 2015 (effective interest rate of 2.17%) | 516,204 | 499,382 | ||||||
5.5% Senior Notes, due March 15, 2016 (effective interest rate of 2.52%) | 373,178 | 349,248 | ||||||
5.125% Senior Notes, due April 13, 2018 (effective interest rate of 3.46%) | 854,011 | 771,450 | ||||||
8.5% Senior Notes, due July 15, 2019 (effective interest rate of 4.00%) | 858,425 | 706,990 | ||||||
6.875% Senior Notes, due April 15, 2021 (effective interest rate of 4.40%) | 866,801 | 743,945 | ||||||
2.25% Euro Medium Term Notes, due July 13, 2022 (effective rate of 3.82%) | 4,792 | 3,708 | ||||||
5.125% Senior Notes, due January 20, 2023 (effective interest rate of 4.55%) | 625,626 | - | ||||||
6.45% Senior Debentures, due June 8, 2027 (effective interest rate of 5.46%) | 383,224 | 346,792 | ||||||
3.875% Convertible Senior Debentures, due November 1, 2029 (effective interest rate of 3.50%) (1) | 359,281 | 290,617 | ||||||
6.25% Senior Debentures, due January 15, 2036 (effective interest rate of 6.03%) | 513,343 | 492,904 | ||||||
6.50% Senior Notes, due January 20, 2043 (effective interest rate of 6.09%) | 422,245 | - | ||||||
| $ | 6,032,806 | $ | 4,454,600 | |||||
Secured Long-Term Debt | ||||||||
Credit facility, due August 26, 2014 | 200,000 | 350,007 | ||||||
| $ | 6,232,806 | $ | 4,804,607 | |||||
(1) | As a result of the Merger with Leucadia on March 1, 2013, the value of the 3.875% Convertible Senior debentures at November 30, 2013 includes the fair value of the conversion feature of $9.6 million. The change in fair value of the conversion feature is included within Revenues – Principal transactions in the Consolidated Statement of Earnings and amounted to a gain of $6.9 million for the nine months ended November 30, 2013. |
On January 15, 2013, we issued $1.0 billion in senior unsecured long-term debt, comprising 5.125% Senior Notes, due 2023 and 6.5% Senior Notes, due 2043. The 5.125% Senior Notes were issued with a principal amount of $600.0 million and we received proceeds of $595.6 million. The 6.5% Senior Notes were issued with a principal amount of $400.0 million and we received proceeds of $391.7 million.
On July 13, 2012, under our Euro Medium Term Note Program ("EMTN Program") we issued senior unsecured notes with a principal amount of €4.0 million which bear interest at 2.25% per annum and mature on July 13, 2022. Proceeds net of original issue discount amounted to €2.8 million.
On April 19, 2012, we issued an additional $200.0 million aggregate principal amount of our 6.875% Senior Notes due April 15, 2021. Proceeds before underwriting discount and expenses amounted to $197.7 million. The total aggregate principal amount issued under this series of notes is $750.0 million.
Jef-57
Our U.S. broker-dealer, from time to time, makes a market in our long-term debt securities (i.e., purchases and sells our long-term debt securities). During November and December 2011, there was extreme volatility in the price of our debt and a significant amount of secondary trading volume through our market-making desk. Given the volume of activity and significant price volatility, purchases and sales of our Senior Notes due 2018 and Convertible Senior Debentures due 2029 were treated as debt extinguishments and reissuances of debt, respectively. We recognized a gain of $9.9 million and $20.2 million on debt extinguishment which is reported in Other revenues for the year ended November 30, 2012 and 2011, respectively. Discounts arose as a result of the repurchase and subsequent reissuance of our debt below par during November and December 2011 which was being amortized over the remaining life of the debt using the effective yield method. The unamortized balance at November 30, 2012 amounted to $32.2 million and the residual unamortized balance of $30.9 million at February 28, 2013, was reduced to $-0- on March 1, 2013 by application of the acquisition method of accounting.
In October 2009, we issued 3.875% convertible senior debentures due 2029 (the "debentures") with an aggregate principal amount of $345.0 million. Upon completion of the Merger with Leucadia, the debentures remain issued and outstanding but are now convertible into common shares of Leucadia. Other than the conversion into Leucadia common shares, the terms of the debenture remain the same. As of December 12, 2013, each $1,000 debenture is currently convertible into 21.9727 shares of Leucadia's common stock (equivalent to a conversion price of approximately $45.51 per share of Leucadia's common stock). The debentures are convertible at the holders' option any time beginning on August 1, 2029 and convertible at any time if: 1) Leucadia's common stock price is greater than or equal to 130% of the conversion price for at least 20 trading days in a period of 30 consecutive trading days; 2) if the trading price per debenture is less than 95% of the price of the common stock times the conversion ratio for any 10 consecutive trading days; 3) if the debentures are called for redemption; or 4) upon the occurrence of specific corporate actions. The debentures may be redeemed for par, plus accrued interest, on or after November 1, 2012 if the price of Leucadia's common stock is greater than 130% of the conversion price for at least 20 days in a period of 30 consecutive trading days and we may redeem the debentures for par, plus accrued interest, at our election any time on or after November 1, 2017. Holders may require us to repurchase the debentures for par, plus accrued interest, on November 1, 2017, 2019 and 2024. In addition to ordinary interest, commencing November 1, 2017, contingent interest will accrue at 0.375% if the average trading price of a debenture for 5 trading days ending on and including the third trading day immediately preceding a six-month interest period equals or exceed $1,200 per $1,000 debenture. As of the merger, the conversion option to Leucadia common shares embedded within the debentures meets the definition of a derivative contract, does not qualify to be accounted for within member's equity and is not clearly and closely related to the economic interest rate or credit risk characteristics of our debt. Accordingly, as of March 1, 2013, the conversion option is accounted for on a standalone basis at fair value with changes in fair value recognized in Principal transaction revenues and is presented within Long-term debt on the Consolidated Statement of Financial Condition.
Secured Long-Term Debt - On August 26, 2011, we entered into a committed senior secured revolving credit facility ("Credit Facility") with a group of commercial banks in U.S. dollars, Euros and Sterling, for an aggregate committed amount of $950.0 million with availability subject to one or more borrowing bases and of which $250.0 million can be borrowed by Jefferies Bache Limited without a borrowing base requirement. The borrowers under the Credit Facility are Jefferies Bache Financial Services, Inc., Jefferies Bache, LLC and Jefferies Bache Limited. The Credit Facility is guaranteed by Jefferies Group LLC and contains certain financial covenants, including, but not limited to, restrictions on future indebtedness of our subsidiaries, requires Jefferies Group LLC and certain of our subsidiaries to maintain specified level of tangible net worth and liquidity amounts and to maintain specified levels of regulated capital. The Credit Facility terminates on August 26, 2014. Interest is based on, in the case of U.S. dollar borrowings, the Federal funds rate or the London Interbank Offered Rate or, in the case of Euro and Sterling borrowings, the Euro Interbank Offered Rate and the London Interbank Offered Rate, respectively. At November 30, 2013 and 2012, borrowings under the Credit Facility were denominated in U.S. dollar and we were in compliance with debt covenants under the Credit Facility.
Note 16. Mandatorily Redeemable Convertible Preferred Stock
As of February 28, 2013 and November 30, 2012, we had issued and outstanding 125,000 shares of 3.25% Series A Convertible Cumulative Preferred Stock, all of which were held by controlled affiliates of MassMutual. The preferred stock was callable beginning in 2016 at a price of $1,000 per share plus accrued interest and matured in 2036. Dividends paid on the Series A Convertible Cumulative Preferred Stock were recorded as a component of Interest expense as the preferred stock is treated as debt for accounting purposes. For tax purposes, the dividend is not tax-deductible because the Series A Convertible Cumulative Preferred Stock are considered "equity".
On March 1, 2013, pursuant to the merger with Leucadia, the Series A Convertible Cumulative Preferred Stock was exchanged for a comparable series of convertible preferred shares of Leucadia. The assumption by Leucadia of our convertible cumulative preferred stock is considered part of the purchase price and resulted in an increase in member's equity. See Note 4. Leucadia Merger and Related Transactions for further details.
Note 17. Noncontrolling Interests and Mandatorily Redeemable Preferred Interests of Consolidated Subsidiaries
Noncontrolling Interests
Noncontrolling interests represent equity interests in consolidated subsidiaries that are not attributable, either directly or indirectly, to us (i.e., minority interests). The following table presents noncontrolling interests at November 30, 2013 and 2012 (in thousands):
Successor | Predecessor | |||||||
November 30, 2013 | November 30, 2012 | |||||||
JSOP | $ | - | $ | 303,178 | ||||
JESOP | - | 35,239 | ||||||
Other (1) | 117,154 | 8,321 | ||||||
Noncontrolling interests | $ | 117,154 | $ | 346,738 | ||||
(1) |
Other includes asset management entities and investment vehicles set up for the benefit of our employees, and at November 30, 2013 includes an investment of $75.0 million by Leucadia in a consolidated asset management entity. |
Jef-58
Noncontrolling ownership interests in consolidated subsidiaries are presented in the accompanying Consolidated Statement of Financial Condition within Equity as a component separate from Member's equity. Net Earnings in the accompanying Consolidated Statements of Earnings includes earnings attributable to both our equity investor and the noncontrolling interests. There has been no other comprehensive income or loss attributed to noncontrolling interests for the nine months ended November 30, 2013, three months ended February 28, 2013 and year ended November 30, 2012 because all other comprehensive income or loss is attributed to us. On March 1, 2013, ownership interests in JSOP and JESOP were redeemed at the carrying value of the interests as of February 28, 2013 and the entities dissolved at no gain or loss to us. Residual cash redemption payments were made in the fourth quarter of 2013.
Mandatorily Redeemable Preferred Interests of Consolidated Subsidiaries
Interests in consolidated subsidiaries that meet the definition of mandatorily redeemable financial instruments require liability classification and remeasurement at the estimated amount of cash that would be due and payable to settle such interests under the applicable entity's organization agreement. On April 1, 2013, mandatorily redeemable financial instruments, representing Leucadia's member's equity interests held in Jefferies High Yield Holdings, LLC ("JHYH"), were redeemed and subsequently contributed back to us by Leucadia as additional equity in Jefferies Group LLC.
Prior to redemption, the mandatorily redeemable financial instruments, representing equity interests in JHYH and entitled to a pro rata share of the profits and losses of JHYH, were reported within liabilities as Mandatorily redeemable preferred interests of consolidated subsidiaries on the Consolidated Statement of Financial Condition. Changes to these mandatorily redeemable financial instruments were reflected as Interest on mandatorily redeemable preferred interests of consolidated subsidiaries within Net revenues on our Consolidated Statements of Earnings. The carrying amount of the Mandatorily redeemable preferred interests of consolidated subsidiaries was approximately $348.1 million at November 30, 2012.
Note 18. Benefit Plans
U.S. Pension Plan
We maintain a defined benefit pension plan, Jefferies Group LLC Employees' Pension Plan (the "U.S. Pension Plan"), which is subject to the provisions of the Employee Retirement Income Security Act of 1974, as amended, and covers certain of our employees. Under the U.S. Pension Plan, benefits to participants are based on years of service and the employee's career average pay. As a minimum, amortization of unrecognized net gain or loss included in Accumulated other comprehensive income (excluding asset gains and losses not yet reflected in market-related value) are included as a component of net pension cost for a year if, as of the beginning of the year, that unrecognized net gain or loss exceeds 10% of the greater of the projected benefit obligation or the market-related value of plan assets. Effective December 31, 2005, benefits under the U.S. Pension Plan were frozen with no further benefit accruing to participants for future service after December 31, 2005.
Employer Contributions – Our funding policy is to contribute to the U.S. Pension Plan at least the minimum amount required for funding purposes under applicable employee benefit and tax laws. We contributed $3.0 million to the plan during the year ended November 30, 2013. We do not expect to make any contributions to the plan in the year ended November 30, 2014.
The following tables summarize the changes in the projected benefit obligation, the fair value of the assets and the funded status of the plan (in thousands):
Year Ended November 30, | ||||||||
Change in projected benefit obligation | 2013 | 2012 | ||||||
Projected benefit obligation, beginning of period | $ | 53,433 | $ | 50,487 | ||||
Service cost | 225 | 175 | ||||||
Interest cost | 2,201 | 2,342 | ||||||
Actuarial (gains) losses | (5,046 | ) | 4,424 | |||||
Administrative expenses paid | (296 | ) | (236 | ) | ||||
Benefits paid | (2,262 | ) | (596 | ) | ||||
Settlements | - | (3,163 | ) | |||||
Projected benefit obligation, end of period | $ | 48,255 | $ | 53,433 | ||||
Change in plan assets | ||||||||
Fair value of assets, beginning of period | $ | 39,902 | $ | 36,457 | ||||
Employer contributions | 3,000 | 2,000 | ||||||
Benefit payments made | (2,262 | ) | (596 | ) | ||||
Administrative expenses paid | (296 | ) | (236 | ) | ||||
Actual return on plan assets | 7,072 | 5,440 | ||||||
Settlements | - | (3,163 | ) | |||||
Fair value of assets, end of period | $ | 47,416 | $ | 39,902 | ||||
Deficit at end of period | $ | (839 | ) | $ | (13,531 | ) | ||
Jef-59
The amounts recognized in our Consolidated Statements of Financial Condition are as follows (in thousands):
November 30, | ||||||||
2013 | 2012 | |||||||
Accumulated benefit obligation | $ | 48,255 | $ | 53,433 | ||||
Projected benefit obligation for service rendered to date | 48,255 | 53,433 | ||||||
Plan assets, at fair value | 47,416 | 39,902 | ||||||
Deficit | (839 | ) | (13,531 | ) | ||||
Unrecognized net (gain) loss | (6,268 | ) | 17,761 | |||||
Prepaid benefit cost | (7,107 | ) | 4,230 | |||||
Accumulated other comprehensive income (loss), before taxes | 6,268 | (17,761 | ) | |||||
Pension liability | $ | (839 | ) | $ | (13,531 | ) | ||
The following tables summarizes the components of net periodic pension cost and other amounts recognized in other comprehensive income excluding taxes (in thousands):
Year Ended November 30, | ||||||||||||
2013 | 2012 | 2011 | ||||||||||
Components of net periodic pension cost: | ||||||||||||
Service cost | $ | 225 | $ | 175 | $ | 175 | ||||||
Interest cost on projected benefit obligation | 2,201 | 2,342 | 2,366 | |||||||||
Expected return on plan assets | (2,698 | ) | (2,513 | ) | (2,578 | ) | ||||||
Net amortization | 326 | 1,334 | 894 | |||||||||
Settlement losses (1) | - | 1,051 | - | |||||||||
Net periodic pension cost | $ | 54 | $ | 2,389 | $ | 857 | ||||||
(1) | Of the $2.4 million in net periodic pension cost for the year ended November 30, 2012, $1.1 million is due to previously unrecognized losses associated with the projected pension obligation as the cost of all settlements in fiscal 2012 for terminated employees exceeded current year interest and service costs. |
| ||||||||||||
Year Ended November 30, | ||||||||||||
2013 | 2012 | 2011 | ||||||||||
Amounts recognized in other comprehensive income | ||||||||||||
Net (gain) loss arising during the period | $ | (9,419 | ) | $ | 1,498 | $ | 5,618 | |||||
Amortization of net loss | (326 | ) | (1,334 | ) | (894 | ) | ||||||
Settlements during the period | - | (1,051 | ) | - | ||||||||
Total recognized in Other comprehensive income | $ | (9,745 | ) | $ | (887 | ) | $ | 4,724 | ||||
Net amount recognized in net periodic benefit cost and Other comprehensive income | $ | (9,691 | ) | $ | 1,502 | $ | 5,581 | |||||
The amounts in accumulated other comprehensive income that have not yet been recognized as components of net periodic benefit cost include $(6.3) million, $17.8 million and $18.6 million as of November 30, 2013, 2012 and 2011, respectively.
On a weighted average basis, the following are assumptions used to determine the actuarial present value of the projected benefit obligation and net periodic pension benefit cost:
Year Ended November 30, | ||||||||||||
2013 | 2012 | 2011 | ||||||||||
Discount rate | 5.10 | % | 4.00 | % | 4.75 | % | ||||||
Expected long-term rate of return on plan assets | 6.75 | % | 6.75 | % | 7.00 | % | ||||||
Jef-60
Expected Benefit Payments - Expected benefit payments for each of the next five fiscal years and in the aggregate for the five fiscal years thereafter are as follows (in thousands):
2014 | $ | 1,383 | ||
2015 | 1,806 | |||
2016 | 3,685 | |||
2017 | 2,518 | |||
2018 | 2,230 | |||
2019 through 2023 | 17,705 | |||
Plan Assets - The following table presents the fair value of plan assets as of November 30, 2013 and 2012 by level within the fair value hierarchy (in thousands):
As of November 30, 2013 | ||||||||||||
Level 1 | Level 2 | Total | ||||||||||
Plan assets (1): | ||||||||||||
Cash and cash equivalents | $ | 931 | $ | - | $ | 931 | ||||||
Listed equity securities (2) | 27,663 | - | 27,663 | |||||||||
Fixed income securities: | ||||||||||||
Corporate debt securities | - | 7,743 | 7,743 | |||||||||
Foreign corporate debt securities | - | 1,140 | 1,140 | |||||||||
U.S. government securities | 4,055 | - | 4,055 | |||||||||
Agency mortgage-backed securities | - | 3,949 | 3,949 | |||||||||
Commercial mortgage-backed securities | - | 1,280 | 1,280 | |||||||||
Asset-backed securities | - | 461 | 461 | |||||||||
Other | - | 194 | 194 | |||||||||
| $ | 32,649 | $ | 14,767 | $ | 47,416 | |||||||
(1) There are no plan assets classified within Level 3 of the fair value hierarchy.
(2) Listed equity securities are diversified across a spectrum of primarily U.S. large-cap companies.
As of November 30, 2012 | ||||||||||||
Level 1 | Level 2 | Total | ||||||||||
Plan assets (1): | ||||||||||||
Cash and cash equivalents | $ | 849 | $ | - | $ | 849 | ||||||
Listed equity securities (2) | 20,321 | - | 20,321 | |||||||||
Fixed income securities: | ||||||||||||
Corporate debt securities | - | 8,037 | 8,037 | |||||||||
Foreign corporate debt securities | - | 345 | 345 | |||||||||
U.S. government securities | 4,618 | - | 4,618 | |||||||||
Agency mortgage-backed securities | - | 3,774 | 3,774 | |||||||||
Commercial mortgage-backed securities | - | 1,419 | 1,419 | |||||||||
Asset-backed securities | - | 524 | 524 | |||||||||
Other | - | 15 | 15 | |||||||||
| $ | 25,788 | $ | 14,114 | $ | 39,902 | |||||||
(1) There are no plan assets classified within Level 3 of the fair value hierarchy.
(2) Listed equity securities are diversified across a spectrum of primarily U.S. large-cap companies.
Valuation technique and inputs - The following is a description of the valuation techniques and inputs used in measuring plan assets accounted for at fair value on a recurring basis:
| - | Cash equivalents are valued at cost, which approximates fair value and are categorized in Level 1 of the fair value hierarchy; |
| - | Listed equity securities are valued using the quoted prices in active markets for identical assets; |
| - | Fixed income securities: |
| ¡ | Corporate debt, mortgage- and asset-backed securities and other securities valuations use data readily available to all market participants and use inputs available for substantially the full term of the security. Valuation inputs include benchmark yields, reported trades, broker dealer quotes, issuer spreads, two sided markets, benchmark securities, bids, offers, reference data, and industry and economic events; |
| ¡ | U.S. government and agency securities valuations generally include quoted bid prices in active markets for identical or similar assets. |
Jef-61
Investment Policies and Strategies - Assets in the plan are invested under guidelines adopted by the Administrative Committee of the Plan. Because the Plan exists to provide a vehicle for funding future benefit obligations, the investment objectives of the portfolio take into account the nature and timing of future plan liabilities. The policy recognizes that the portfolio's long-term investment performance and its ability to meet the plan's overall objectives are dependent on the strategic asset allocation which includes adequate diversification among assets classes.
The target allocation of plan assets for 2014 is approximately 50% equities and 50% fixed income securities. The target asset allocation was determined based on the risk tolerance characteristics of the plan and, at times, may be adjusted to achieve the plan's investment objective and to minimize any concentration of investment risk. The Administrative Committee evaluates the asset allocation strategy and adjusts the allocation if warranted based upon market conditions and the impact of the investment strategy on future contribution requirements. The expected long-term rate of return assumption is based on an analysis of historical experience of the portfolio and the summation of prospective returns for each asset class in proportion to the fund's current asset allocation.
The equity portfolio may invest up to 5% of the market value of the portfolio in any one company and may invest up to 10% of the market value of the portfolio in any one sector or up to two times the percentage weighting of any one sector as defined by the S&P 500 or the Russell 1000 Value indices, whichever is higher. Permissible investments specified under the equity portfolio of the plan include equity securities of U.S. and non-U.S. incorporated entities and private placement securities issued pursuant to Rule 144A. At least 75% of the market value of the fixed income portfolio must be invested in investment grade securities rated BBB-/Baa3, including cash and cash equivalents. Permissible investments specified under the fixed income portfolio of the plan include: public or private debt obligations issued or guaranteed by U.S. or foreign issuers; preferred, hybrid, mortgage or asset-backed securities; senior loans; and derivatives and foreign currency exchange contracts.
German Pension Plan
In connection with the acquisition of Jefferies Bache from Prudential on July 1, 2011, we acquired a defined benefits pension plan located in Germany (the "German Pension Plan") for the benefit of eligible employees of Jefferies Bache in that territory. As part of purchase accounting, a liability of $21.8 million was recognized on July 1, 2011 as a pension obligation within Accrued expenses and other liabilities. The German Pension Plan has no plan assets and is therefore unfunded. We have purchased insurance contracts from multi-national insurers held in the name of Jefferies Bache Limited to provide for the plan's future obligations. The investment in these insurance contracts are included in Financial Instruments owned – Investments at fair value in the Consolidated Statements of Financial Condition and has a fair value of $19.7 million and $18.6 million at November 30, 2013 and 2012, respectively. We expect to pay the pension obligation from the cash flows available to us under the insurance contracts. All costs relating to the plan (including insurance premiums and other costs as computed by the insurers) are paid by us. In connection with the acquisition, it was agreed with Prudential that any insurance premiums and funding obligations related to pre-acquisition date service will be reimbursed to us by Prudential.
The provisions and assumptions used in the German Pension Plan are based on local conditions in Germany. We did not contribute to the plan during the years ended November 30, 2013 and 2012.
The following tables summarize the changes in the projected benefit obligation and the components of net periodic pension cost (in thousands):
Year Ended November 30, | ||||||||
2013 | 2012 | |||||||
Change in projected benefit obligation | ||||||||
Projected benefit obligation, beginning of period | $ | 24,509 | $ | 19,799 | ||||
Service cost | 67 | 36 | ||||||
Interest cost | 902 | 1,027 | ||||||
Actuarial losses | 1,033 | 5,413 | ||||||
Benefits paid | (1,245 | ) | (1,121 | ) | ||||
Currency adjustment | 1,102 | (645 | ) | |||||
Projected benefit obligation, end of period | $ | 26,368 | $ | 24,509 | ||||
Year Ended November 30, | Five Months Ended November 30, | |||||||||||
Components of net periodic pension cost | 2013 | 2012 | 2011 | |||||||||
Service cost | $ | 67 | $ | 36 | $ | 15 | ||||||
Interest cost on projected benefit obligation | 902 | 1,027 | 434 | |||||||||
Net amortization | 179 | - | - | |||||||||
Net periodic pension cost | $ | 1,148 | $ | 1,063 | $ | 449 | ||||||
Jef-62
The accumulated benefit obligation at November 30, 2013 and November 30, 2012 is $26.4 million and $24.5 million, respectively. The amount in accumulated Other comprehensive income at November 30, 2013 and 2012 is a debit of $1.0 million and a debit of $4.4 million, respectively. The following are assumptions used to determine the actuarial present value of the projected benefit obligation and net periodic pension benefit cost for the year ended November 30, 2013 and 2012:
Year Ended November 30, | ||||||||
2013 | 2012 | |||||||
Projected benefit obligation | ||||||||
Discount rate | 3.40 | % | 3.60 | % | ||||
Rate of compensation increase | 3.00 | % | 3.00 | % | ||||
Net periodic pension benefit cost | ||||||||
Discount rate | 3.60 | % | 5.60 | % | ||||
Rate of compensation increase | 3.00 | % | 3.00 | % | ||||
Expected Benefit Payments - Expected benefit payments for each of the next five fiscal years and in the aggregate for the five fiscal years thereafter are as follows (in thousands):
2014 | 1,374 | |||
2015 | 1,399 | |||
2016 | 1,417 | |||
2017 | 1,395 | |||
2018 | 1,391 | |||
2019 through 2023 | 7,908 | |||
Note 19. Compensation Plans
Prior to the Merger, we sponsored the following share-based compensation plans: incentive compensation plan, employee stock purchase plan and the deferred compensation plan. Subsequent to the merger with Leucadia, sponsorship of share-based compensation plans was transferred to Leucadia, with outstanding share-based awards relating to Leucadia common shares and future awards to relate to Leucadia common shares. The fair value of share-based awards is estimated on the date of grant based on the market price of the underlying common stock less the impact of selling restrictions subsequent to vesting, if any, and is amortized as compensation expense over the related requisite service periods. We are allocated costs associated with awards granted to our employees under such plans.
In addition, we sponsor non-share-based compensation plans. Non-share-based compensation plans sponsored by us include a profit sharing plan and other forms of restricted cash awards.
The following are descriptions of the compensation plans and the activity of such plans for the nine months ended November 30, 2013 (Successor Period), three months ended February 28, 2013 (Predecessor period) and the years ended November 30, 2012 and 2011 (Predecessor period):
Incentive Compensation Plan. The Incentive Compensation Plan ("Incentive Plan") allows awards in the form of incentive stock options (within the meaning of Section 422 of the Internal Revenue Code), nonqualified stock options, stock appreciation rights, restricted stock, unrestricted stock, performance awards, RSUs, dividend equivalents or other share-based awards. In connection with the merger with Leucadia, the Incentive Plan was amended to provide for awards to be issued relating to shares of Leucadia, our parent company as of March 1, 2013. Share-based awards outstanding at March 1, 2013 were converted into awards for shares of Leucadia at the Exchange Ratio, with all such awards subject to the same terms and conditions that existed prior to the merger (except for the elimination of fractional shares).
The Incentive Plan allows for grants of restricted stock awards, whereby employees are granted restricted common shares subject to a risk of forfeiture. The Incentive Plan also allows for grants of restricted stock units. RSUs give a participant the right to receive fully vested common shares at the end of a specified deferral period allowing a participant to hold an interest tied to common stock on a tax deferred basis. Prior to settlement, RSUs carry no voting or dividend rights associated with the stock ownership, but dividend equivalents are accrued to the extent there are dividends declared on the underlying common shares as cash amounts or as deemed reinvestments in additional RSUs.
Restricted stock and RSUs may be granted to new employees as "sign-on" awards, to existing employees as "retention" awards and to certain executive officers as awards for multiple years. Sign-on and retention awards are generally subject to annual ratable vesting over a four-year service period and are amortized as compensation expense on a straight line basis over the related four years. Restricted stock and RSUs are granted to certain senior executives with both performance and service conditions. These awards granted to senior executives are amortized over the service period as we have determined that it is probable that the performance condition will be achieved.
During the year ended November 30, 2011, we granted restricted stock and RSUs as part of year-end compensation. Restricted stock and RSUs granted as part of year-end compensation were not subject to service requirements that employees must fulfill in exchange for the right to those awards. As such, employees who terminate their employment or are terminated without cause may continue to vest in year-end compensation awards, so long as the awards are not forfeited as a result of the other forfeiture provisions of those awards (e.g. competition). We determined that the service inception date preceded the grant date for restricted stock and RSUs granted as part of year-end compensation, and, as such, the compensation expense associated with these awards was accrued over the one-year period prior to the grant date. For the year ended November 30, 2011, we recognized compensation expense of $64.0 million related to restricted stock and restricted stock units granted as part of our 2011 year end compensation.
Jef-63
In 2011, we offered our employees the option to receive the stock portion of their year-end compensation in the form of either shares or cash, with the cash amount being equal to 75% of the grant-date amount of the stock that an employee would otherwise receive. The election resulted in a decrease to share-based compensation expense of approximately $23.3 million, as certain employees elected to receive reduced cash awards in lieu of the full grant-date amount of the shares. This offset increased cash compensation expense by approximately $17.5 million. The net effect of this election on total compensation and benefits expense was a reduction of approximately $5.8 million. While these cash awards were fully expensed in 2011, they legally vest in future periods.
The total compensation cost associated with restricted stock and RSUs amounted to $64.4 million for the nine months ended November 30, 2013 (Successor period), $22.3 million for the three months ended February 28, 2013 (Predecessor period) and $83.8 million and $134.1 million for the years ended November 30, 2012 and 2011 (Predecessor period), respectively. Total compensation cost includes the amortization of sign-on, retention and senior executive awards, less forfeitures and clawbacks. In 2011, total compensation cost includes year-end compensation awards.
The net tax benefit (deficiency) related to share-based compensation plans recognized in additional paid-in capital was $2.9 million for the nine months ended November 30, 2013 (Successor period), ($18.0) million for the three months ended February 28, 2013 (Predecessor period) and $19.8 million and $32.2 million for the years ended November 30, 2012 and 2011 (Predecessor period), respectively.
The fair values of outstanding restricted stock and RSUs with future service requirements were remeasured as part of the acquisition accounting, resulting in an increase of approximately $45.1 million to the unrecognized compensation cost allocated to us at March 1, 2013. As of November 30, 2013, we had $165.2 million of total unrecognized compensation cost allocated to us related to nonvested share-based awards, which is expected to be recognized over a remaining weighted average vesting period of approximately 2.5 years.
Employee Stock Purchase Plan. There is also an Employee Stock Purchase Plan ("ESPP") which we consider noncompensatory effective January 1, 2007. The ESPP permits all regular full-time employees and employees who work part time over 20 hours per week to purchase, at a discount, Leucadia common shares (since the merger) and permitted purchase of Jefferies Group, Inc. common stock (prior to the merger). Annual employee contributions are limited to $21,250, are voluntary and made through payroll deduction. The stock purchase price is equal to 95% of the closing price of common stock on the last day of the applicable session (monthly).
Deferred Compensation Plan. There is also a Deferred Compensation Plan, which was established in 2001. Eligible employees are able to defer compensation on a pre-tax basis, with deferred amounts deemed invested at a discount in Leucadia common shares (since the merger) and in Jefferies Group, Inc. common stock (prior to the merger) ("DCP shares"), or by allocating among any combination of other investment funds available under the Deferred Compensation Plan. In connection with the merger with Leucadia on March 1, 2013, the Deferred Compensation Plan was amended and deferrals denominated as DCP shares became settleable by delivery of Leucadia common shares. We often invest directly, as a principal, in investments corresponding to the other investment funds, relating to our obligations to perform under the Deferred Compensation Plan. The compensation deferred by our employees is expensed in the period earned. The change in fair value of our investments in assets corresponding to the specified other investment funds are recognized in Principal transactions and changes in the corresponding deferral compensation liability are reflected as Compensation and benefits expense in our Consolidated Statements of Earnings.
Additionally, we recognize compensation cost related to the discount provided to employees in electing to defer compensation in DCP shares. This compensation cost was approximately $111,000 for the nine months ended November 30, 2013 (Successor period), $72,000 for the three months ended February 28, 2013 (Predecessor period) and $197,000 and $297,000 for the years ended November 30, 2012 and 2011 (Predecessor period), respectively.
Profit Sharing Plan . We have a profit sharing plan, covering substantially all employees, which includes a salary reduction feature designed to qualify under Section 401(k) of the Internal Revenue Code. The compensation cost related to this plan was $3.2 million for the nine months ended November 30, 2013, $2.6 million for the three months ended February 28, 2013 and $5.7 million and $6.0 million for the years ended November 30, 2012 and 2011, respectively.
Restricted Cash Awards. We provide compensation to new and existing employees in the form of loans and/or other cash awards which are subject to ratable vesting terms with service requirements ranging from one to eight years, with an approximate average term of three years. We amortize these awards to compensation expense over the relevant service period. The compensation cost associated with these awards amounted to $132.6 million for the nine months ended November 30, 2013, and for the Predecessor periods $44.7 million for the three months ended February 28, 2013 and $194.4 million and $119.2 million for the years ended November 30, 2012 and 2011, respectively. At November 30, 2013 and November 30, 2012, the remaining unamortized amount of these awards was $185.0 million and $198.9 million, respectively and is included within Other assets on the Consolidated Statements of Financial Condition.
Jef-64
Note 20. Earnings per Share
Earnings per share data is not provided for the nine months ended November 30, 2013 (Successor period) as we are now a limited liability company and wholly-owned subsidiary of Leucadia. The following is a reconciliation of the numerators and denominators of the Basic and Diluted earnings per common share computations for the three months ended February 28, 2013 and the years ended November 30, 2012 and 2011 (in thousands, except per share amounts):
Predecessor | ||||||||||||
Three Months Ended February 28, 2013 | Year Ended November 30, 2012 | Year Ended November 30, 2011 | ||||||||||
Earnings for basic earnings per common share: | ||||||||||||
Net earnings | $ | 90,842 | $ | 323,149 | $ | 286,368 | ||||||
Net earnings to noncontrolling interests | 10,704 | 40,740 | 1,750 | |||||||||
Net earnings to common shareholders | 80,138 | 282,409 | 284,618 | |||||||||
Less: Allocation of earnings to participating securities (1) | 5,890 | 17,392 | 13,822 | |||||||||
Net earnings available to common shareholders | $ | 74,248 | $ | 265,017 | $ | 270,796 | ||||||
Earnings for diluted earnings per common share: | ||||||||||||
Net earnings | $ | 90,842 | $ | 323,149 | $ | 286,368 | ||||||
Net earnings to noncontrolling interests | 10,704 | 40,740 | 1,750 | |||||||||
Net earnings to common shareholders | 80,138 | 282,409 | 284,618 | |||||||||
Add: Mandatorily redeemable convertible preferred stock dividends | 1,016 | 4,063 | 4,063 | |||||||||
Less: Allocation of earnings to participating securities (1) | 5,882 | 17,407 | 13,823 | |||||||||
Net earnings available to common shareholders | $ | 75,272 | $ | 269,065 | $ | 274,858 | ||||||
Shares: | ||||||||||||
Average common shares used in basic computation | 213,732 | 215,989 | 211,056 | |||||||||
Stock options | 2 | 2 | 7 | |||||||||
Mandatorily redeemable convertible preferred stock | 4,110 | 4,110 | 4,108 | |||||||||
Convertible debt | - | - | - | |||||||||
Average common shares used in diluted computation | 217,844 | 220,101 | 215,171 | |||||||||
Earnings per common share: | ||||||||||||
Basic | $ | 0.35 | $ | 1.23 | $ | 1.28 | ||||||
Diluted | $ | 0.35 | $ | 1.22 | $ | 1.28 | ||||||
| ||
(1) | Represents dividends declared during the period on participating securities plus an allocation of undistributed earnings to participating securities. Net losses are not allocated to participating securities. Participating securities represent restricted stock and restricted stock units for which requisite service has not yet been rendered and amounted to weighted average shares of 16,756,000, 14,123,000 and 10,667,000 for the three months ended February 28, 2013 and the years ended November 30, 2012 and 2011, respectively. Dividends declared on participating securities during the three months ended February 28, 2013 and the years ended November 30, 2012 and 2011 amounted to approximately $1.3 million, $4.3 million and $3.4 million, respectively. Undistributed earnings are allocated to participating securities based upon their right to share in earnings if all earnings for the period had been distributed. |
Our ability to pay distributions to Leucadia is subject to the restrictions set forth in certain financial covenants associated with the $950.0 million Credit Facility as described in Note 15, Long-Term Debt and the governing provisions of the Delaware Limited Liability Company Act. Prior to the Merger restrictions on our ability to pay dividends on our common stock were subject to the dividend preference terms of our Series A convertible preferred stock, certain financial covenants associated with the $950.0 million Credit Facility as described in Note 15, Long-Term Debt and the governing provisions of the Delaware General Corporation Law.
Dividends per share of common stock declared during the quarter are reflected below:
1 st Quarter | 2 nd Quarter | 3 rd Quarter | 4 th Quarter | |||||||||||||
2013 | $ | 0.075 | N/a | N/a | N/a | |||||||||||
2012 | $ | 0.075 | $ | 0.075 | $ | 0.075 | $ | 0.075 | ||||||||
Jef-65
Note 21. Income Taxes
Total income taxes for the nine months ended November 30, 2013, the three month ended February 28, 2013 and the years ended November 30, 2012 and 2011 were allocated as follows (in thousands):
Successor | Predecessor | |||||||||||||||
Nine Months Ended November 30, 2013 | Three Months Ended February 28, 2013 | Year Ended November 30, 2012 | Year Ended November 30, 2011 | |||||||||||||
Income tax expense | $ | 94,686 | $ | 48,645 | $ | 168,646 | $ | 132,966 | ||||||||
Stockholders' equity, for compensation expense for tax purposes (in excess of) / less than amounts recognized for financial reporting purposes | $ | (2,873 | ) | $ | 17,965 | $ | (19,789 | ) | $ | (32,200 | ) | |||||
The provision for income tax expense consists of the following components (in thousands):
Successor | Predecessor | |||||||||||||||
Nine Months Ended November 30, | Three Months Ended February 28, | Year Ended November 30, | Year Ended November 30, | |||||||||||||
2013 | 2013 | 2012 | 2011 | |||||||||||||
Current: | ||||||||||||||||
U.S. Federal | $ | 50,089 | $ | 22,936 | $ | 62,710 | $ | 65,702 | ||||||||
U.S. state and local | 6,263 | (3,176 | ) | 18,520 | 28,644 | |||||||||||
Foreign | 7,050 | (1,950 | ) | 2,773 | 8,443 | |||||||||||
| 63,402 | 17,810 | 84,003 | 102,789 | |||||||||||||
Deferred: | ||||||||||||||||
U.S. Federal | 25,262 | 17,392 | 79,224 | 7,637 | ||||||||||||
U.S. state and local | 8,868 | 9,761 | 13,006 | (694 | ) | |||||||||||
Foreign | (2,846 | ) | 3,682 | (7,587 | ) | 23,234 | ||||||||||
| 31,284 | 30,835 | 84,643 | 30,177 | |||||||||||||
| $ | 94,686 | $ | 48,645 | $ | 168,646 | $ | 132,966 | |||||||||
Jef-66
Income tax expense differed from the amounts computed by applying the U.S. Federal statutory income tax rate of 35% to earnings before income taxes as a result of the following (in thousands):
Successor | Predecessor | |||||||||||||||||||||||||||||||
Nine Months Ended November 30, | Three Months Ended February 28, | Year Ended November 30, | Year Ended November 30, | |||||||||||||||||||||||||||||
2013 | 2013 | 2012 | 2011 | |||||||||||||||||||||||||||||
Amount | Percent | Amount | Percent | Amount | Percent | Amount | Percent | |||||||||||||||||||||||||
Computed expected income taxes | $ | 92,504 | 35.0 | % | $ | 48,820 | 35.0 | % | $ | 172,128 | 35.0 | % | $ | 146,767 | 35.0 | % | ||||||||||||||||
Increase (decrease) in income taxes resulting from: | ||||||||||||||||||||||||||||||||
State and city income taxes, net of Federal income tax benefit | 9,835 | 3.7 | 4,280 | 3.1 | 20,492 | 4.2 | 18,168 | 4.3 | ||||||||||||||||||||||||
Bargain purchase gain on the acquisition of the Global Commodities Group | - | - | - | - | - | - | (18,363 | ) | (4.4 | ) | ||||||||||||||||||||||
Income allocated to Noncontrolling interest, not subject to tax | (2,946 | ) | (1.1 | ) | (3,553 | ) | (2.5 | ) | (14,161 | ) | (2.9 | ) | (613 | ) | (0.1 | ) | ||||||||||||||||
Foreign rate differential | (4,750 | ) | (1.8 | ) | (2,993 | ) | (2.2 | ) | (7,528 | ) | (1.5 | ) | (11,736 | ) | (2.8 | ) | ||||||||||||||||
Fines and penalties | 4,900 | 1.9 | - | - | - | - | - | - | ||||||||||||||||||||||||
Other, net | (4,857 | ) | (1.9 | ) | 2,091 | 1.5 | (2,285 | ) | (0.5 | ) | (1,257 | ) | (0.3 | ) | ||||||||||||||||||
Total income taxes | $ | 94,686 | 35.8 | % | $ | 48,645 | 34.9 | % | $ | 168,646 | 34.3 | % | $ | 132,966 | 31.7 | % | ||||||||||||||||
The following table presents a reconciliation of gross unrecognized tax benefits (in thousands):
Successor | Predecessor | |||||||||||||||
Nine Months Ended November 30, 2013 | Three Months Ended February 28, 2013 | Year Ended November 30, 2012 | Year Ended November 30, 2011 | |||||||||||||
Balance at beginning of period | $ | 129,010 | $ | 110,539 | $ | 79,779 | $ | 52,852 | ||||||||
Increases based on tax positions related to the current period | 8,748 | 7,185 | 30,671 | 14,159 | ||||||||||||
Increases based on tax positions related to prior periods | 7,383 | 15,356 | 7,549 | 14,696 | ||||||||||||
Decreases based on tax positions related to prior periods | (18,297 | ) | (4,070 | ) | (5,893 | ) | (1,808 | ) | ||||||||
Decreases related to settlements with taxing authorities | - | - | (487 | ) | (120 | ) | ||||||||||
Decreases related to a lapse of applicable statutes of limitation | - | - | (1,080 | ) | - | |||||||||||
Balance at end of period | $ | 126,844 | $ | 129,010 | $ | 110,539 | $ | 79,779 | ||||||||
The total amount of unrecognized benefit that, if recognized, would favorably affect the effective tax rate was $85.5 million and $72.4 million (net of federal benefits of taxes) at November 30, 2013 and 2012, respectively.
We recognize interest accrued related to unrecognized tax benefits in Interest expense. Penalties, if any, are recognized in Other expenses in the Consolidated Statements of Earnings. Net interest expense related to income tax liabilities was $5.8 million for the nine months ended November 30, 2013. For the three months ended February 28, 2013 and the years ended November 30, 2012 and November 30, 2011, interest expense was $1.8 million, $4.5 million and $4.4 million, respectively. As of November 30, 2013 and November 30, 2012, we had interest accrued of approximately $22.9 million and $15.3 million, respectively, included in Accrued expenses and other liabilities. No material penalties were accrued for the periods ended November 30, 2013 and November 30, 2012.
Jef-67
The cumulative tax effects of temporary differences that give rise to significant portions of the deferred tax assets and liabilities at November 30, 2013 and 2012 are presented below (in thousands):
Successor | Predecessor | |||||||
November 30, 2013 | November 30, 2012 | |||||||
Deferred tax assets: | ||||||||
Compensation and benefits | $ | 373,964 | $ | 333,318 | ||||
Net operating loss | 24,147 | 22,447 | ||||||
Long-term debt | 191,274 | - | ||||||
Other | 86,336 | 30,932 | ||||||
Sub-total | 675,721 | 386,697 | ||||||
Valuation allowance | (11,140 | ) | (11,754 | ) | ||||
Total deferred tax assets | 664,581 | 374,943 | ||||||
Deferred tax liabilities: | ||||||||
Long-term debt | - | 37,370 | ||||||
Amortization of intangibles | 98,798 | 62,617 | ||||||
Other | 30,842 | 47,811 | ||||||
Total deferred tax liabilities | 129,640 | 147,798 | ||||||
Net deferred tax asset, included in Other assets | $ | 534,941 | $ | 227,145 | ||||
The valuation allowance represents the portion of our deferred tax assets for which it is more likely than not that the benefit of such items will not be realized. We believe that the realization of the net deferred tax asset of $534.9 million is more likely than not based on expectations of future taxable income in the jurisdictions in which we operate.
At November 30, 2013, we had gross net operating loss carryforwards in Asia, primarily Japan, and in Europe, primarily the United Kingdom, of approximately $89.1 million, in aggregate. The Japanese losses begin to expire in the year 2017 while the United Kingdom losses have an unlimited carryforward period. A deferred tax asset of $4.6 million related to net operating losses in Asia has been fully offset by a valuation allowance. The remaining valuation allowance relates to deferred tax assets resulting from operating losses in various jurisdictions as well as compensation, capital losses, and tax credits in the United Kingdom.
At November 30, 2013, there is a net current tax payable of $28.5 million, which includes a gross payable to our Parent of $61.2 million. The offsetting balance reflects receivables from various taxing authorities. At November 30, 2012, there was a net current tax receivable of $69.8 million from various taxing authorities.
At November 30, 2013, we had approximately $134.0 million of earnings attributable to foreign subsidiaries for which no U.S. Federal income tax provision has been recorded because these earnings are permanently invested abroad. Accordingly, a deferred tax liability of approximately $35.0 million has not been recorded with respect to these earnings.
We are currently under examination by the Internal Revenue Service and other major tax jurisdictions. We do not expect that resolution of these examinations will have a material effect on our consolidated financial position, but could have a material impact on the consolidated results of operations for the period in which resolution occurs. It is reasonably possible that, within the next twelve months, statutes of limitation will expire which would have the effect of reducing the balance of unrecognized tax benefits by $3.3 million.
The table below summarizes the earliest tax years that remain subject to examination in the major tax jurisdictions in which we operate:
Jurisdiction | Tax Year |
United States | 2006 |
United Kingdom | 2012 |
California | 2006 |
Connecticut | 2006 |
Massachusetts | 2006 |
New Jersey | 2007 |
New York State | 2001 |
New York City | 2003 |
Jef-68
Note 22. Commitments, Contingencies and Guarantees
Commitments
The following table summarizes our commitments associated with our capital market and asset management business activities at November 30, 2013 (in millions):
Expected Maturity Date | ||||||||||||||||||||||||
2014 | 2015 | 2016 and 2017 | 2018 and 2019 | 2020 and Later | Maximum Payout | |||||||||||||||||||
Equity commitments (1) | $ | 1.8 | $ | 7.4 | $ | 0.8 | $ | - | $ | 418.2 | $ | 428.2 | ||||||||||||
Loan commitments (1) | 33.2 | 19.0 | 322.6 | 92.8 | - | 467.6 | ||||||||||||||||||
Mortgage-related commitments | 819.9 | 492.9 | 202.8 | - | - | 1,515.6 | ||||||||||||||||||
Forward starting reverse repos and repos | 702.3 | - | - | - | - | 702.3 | ||||||||||||||||||
| $ | 1,557.2 | $ | 519.3 | $ | 526.2 | $ | 92.8 | $ | 418.2 | $ | 3,113.7 | |||||||||||||
(1) |
Equity and loan commitments are presented by contractual maturity date. The amounts are however available on demand. |
The table below presents our credit exposure from our loan commitments, including funded amounts, summarized by period of expiration as of November 30, 2013. Credit exposure is based on the external credit ratings of the underlyings or referenced assets of our loan commitments. Since commitments associated with these business activities may expire unused, they do not necessarily reflect the actual future cash funding requirements (in millions):
Credit Ratings | 0 – 12 Months | 1 – 5 Years | Greater Than 5 Years | Total Corporate Lending Exposure (1) | Corporate Lending Exposure at Fair Value (2) | Corporate Lending Commitments (3) | ||||||||||||||||||
Non-investment grade | $ | - | $ | 79.1 | $ | - | $ | 79.1 | $ | 9.5 | $ | 69.6 | ||||||||||||
Unrated | 35.6 | 669.1 | - | 704.7 | 306.7 | 398.0 | ||||||||||||||||||
Total | $ | 35.6 | $ | 748.2 | $ | - | $ | 783.8 | $ | 316.2 | $ | 467.6 | ||||||||||||
(1) |
Total corporate lending exposure represents the potential loss assuming the fair value of funded loans and lending commitments were zero. |
(2) | The corporate lending exposure at fair value includes $321.1 million of funded loans included in Financial instruments owned – Loans and Loans to and investments in related parties, and a $4.9 million net liability related to lending commitments recorded in Financial instruments sold – Derivatives and Financial instruments owned – Derivatives in the Consolidated Statement of Financial Condition as of November 30, 2013. |
(3) | Represents the notional amount of unfunded lending commitments. |
Jef-69
Equity Commitments. We have commitments to invest $600.0 million and $291.0 million in Jefferies Finance and Jefferies LoanCore as of November 30, 2013, and have funded $337.3 million and $175.5 million, respectively. See Note 12, Investments for additional information regarding these investments.
As of November 30, 2013, we have committed to invest $5.9 million in Jefferies Capital Partners LLC, the manager of Jefferies Capital Partners IV L.P., Jefferies Capital Partners V L.P. and a related parallel fund, the SBI USA Fund (Jefferies Capital Partners V L.P. and the SBI USA Fund are collectively "Fund V"). As of November 30, 2013, we have funded approximately $1.0 million of our commitment to Jefferies Capital Partners LLC, leaving $4.9 million unfunded.
We have committed to invest in aggregate up to $85.0 million in Fund V, private equity funds managed by a team led by Brian P. Friedman, one of our directors and Chairman of the Executive Committee, comprised of up to $75.0 million in the SBI USA Fund and $10.0 million in Jefferies Capital Partners V L.P. As of November 30, 2013, we have funded approximately $47.0 million and $6.3 million of our commitments to the SBI USA Fund and Jefferies Capital Partners V L.P., respectively, leaving approximately $31.7 million unfunded in aggregate.
We have committed to invest up to $45.9 million in Jefferies Capital Partners IV L.P. and $3.1 million in JCP IV LLC, the General Partner of Jefferies Capital Partners IV L.P. As of November 30, 2013, we have funded approximately $38.7 million and $2.3 million of our commitments to Jefferies Capital Partners IV L.P. and JCP IV LLC, respectively, leaving approximately $8.0 million unfunded in aggregate.
As of November 30, 2013, we had other equity commitments to invest up to $30.8 million in various other investments of which $5.4 million remained unfunded.
Loan Commitments. From time to time we make commitments to extend credit to investment banking and other clients in loan syndication, acquisition finance and securities transactions. These commitments and any related drawdowns of these facilities typically have fixed maturity dates and are contingent on certain representations, warranties and contractual conditions applicable to the borrower. As of November 30, 2013, we had $241.4 million of outstanding loan commitments to clients.
On March 1, 2011, we and MassMutual entered into a secured revolving credit facility with Jefferies Finance, to be funded equally, to support loan underwritings by Jefferies Finance. At November 30, 2013, the facility of $700.0 million, is scheduled to mature on March 1, 2016 with automatic one year extensions subject to a 60 day termination notice by either party. As of November 30, 2013, we have funded $123.8 million of our $350.0 million commitment to LoanCore.
The unfunded loan commitments to Jefferies Finance of $226.2 million is unrated and included in the total unrated lending commitments of $398.0 million presented in the table above.
Mortgage-Related Commitments. We enter into forward contracts to purchase mortgage participation certificates and mortgage-backed securities. The mortgage participation certificates evidence interests in mortgage loans insured by the Federal Housing Administration and the mortgage-backed securities are insured or guaranteed by the Federal National Mortgage Association (Fannie Mae), the Federal Home Loan Mortgage Corporation (Freddie Mac) or the Government National Mortgage Association (Ginnie Mae). We frequently securitize the mortgage participation certificates and mortgage-backed securities. The fair value of mortgage-related commitments recorded in the Consolidated Statement of Financial Condition was $54.2 million at November 30, 2013.
Forward Starting Reverse Repos and Repos. We enter into commitments to take possession of securities with agreements to resell on a forward starting basis and to sell securities with agreements to repurchase on a forward starting basis that are primarily secured by U.S. government and agency securities.
Jef-70
Leases. As lessee, we lease certain premises and equipment under noncancelable agreements expiring at various dates through 2029 which are operating leases. In January 2013, we amended our lease agreement for our global executive offices and principal administrative offices in New York to extend the term through 2029. At November 30, 2013, future minimum aggregate lease payments for all noncancelable operating leases for fiscal years ended November 30, 2014 through 2018 and the aggregate amount thereafter, are as follows (in thousands):
Fiscal Year | Gross | Sub-Leases | Net | |||||||||
2014 | $ | 69,823 | $ | 5,283 | $ | 64,540 | ||||||
2015 | 53,774 | 2,639 | 51,135 | |||||||||
2016 | 58,273 | 2,493 | 55,780 | |||||||||
2017 | 56,505 | 577 | 55,928 | |||||||||
2018 | 54,004 | 23 | 53,981 | |||||||||
Thereafter | 446,106 | - | 446,106 | |||||||||
Total | $ | 738,485 | $ | 11,015 | $ | 727,470 | ||||||
Rental expense, net of subleases, amounted to $43.2 million, $12.1 million, $48.4 million and $44.3 million for the nine months ended November 30, 2013, three months ended February 28, 2013, and the years ended November 30, 2012 and 2011, respectively.
During 2012, we entered into a master sale and leaseback agreement under which we sold and have leased back existing and additional new equipment supplied by the lessor. The transaction resulted in a gain of $2.0 million, which is being amortized into earnings in proportion to and is reflected net against the leased equipment. The lease may be terminated on September 30, 2017 for a termination cost of the present value of the remaining lease payments plus a residual value. If not terminated early, the lease term is approximately five years from the start of the supply of new and additional equipment, which commenced on various dates in 2013 and continues into 2014. At November 30, 2013, minimum future lease payments are as follows (in thousands):
Fiscal Year | ||||
2014 | $ | 3,887 | ||
2015 | 3,887 | |||
2016 | 3,887 | |||
2017 | 3,887 | |||
2018 | 1,583 | |||
2019 | 167 | |||
Net minimum lease payments | 17,298 | |||
Less amount representing interest | 1,508 | |||
Present value of net minimum lease payments | $ | 15,790 | ||
Contingencies
Seven putative class action lawsuits have been filed in New York and Delaware concerning the merger transactions whereby Jefferies Group LLC became a wholly owned subsidiary of Leucadia. The class actions, filed on behalf of our shareholders prior to the merger transaction, name as defendants Jefferies Group, Inc., the members of the board of directors of Jefferies Group, Inc., Leucadia and, in certain of the actions, certain merger-related subsidiaries. The actions allege that the directors breached their fiduciary duties in connection with the merger transaction by engaging in a flawed process and agreeing to sell Jefferies Group, Inc. for inadequate consideration pursuant to an agreement that contains improper deal protection terms. The actions allege that Jefferies Group, Inc. and Leucadia aided and abetted the directors' breach of fiduciary duties. The actions filed in New York have been stayed, the actions filed in Delaware are proceeding and the claims against certain of the directors have been dismissed. We are unable to predict the outcome of this litigation or to estimate the amount of or range of any reasonably possible loss.
Jefferies has reached a non-prosecution agreement in principle with the United States Attorney for the District of Connecticut and a settlement agreement in principle with the Securities and Exchange Commission ("SEC"), which remains subject to review and approval by the SEC Commissioners, relating to an investigation of the purchases and sales of mortgage-backed securities. That investigation arose from a matter that came to light in late 2011, at which time the Company terminated a mortgage-backed-securities trader who was then indicted by the United States Attorney for the District of Connecticut in January 2013 and separately charged in a civil complaint by the SEC. Those agreements in principle include an aggregate $25.0 million payment, of which approximately $11.0 million are payments to trading counterparties impacted by those activities, approximately $10 million of which is a fine payable to the U.S. Attorney's Office, and approximately $4.0 million of which is a fine payable to the SEC. At November 30, 2013, we have reserved approximately $22.4 million relating to remaining amounts we estimate to be paid related to this matter.
Jef-71
Guarantees
Derivative Contracts. Our dealer activities cause us to make markets and trade in a variety of derivative instruments. Certain derivative contracts that we have entered into meet the accounting definition of a guarantee under U.S. GAAP, including credit default swaps, written foreign currency options and written equity put options. On certain of these contracts, such as written interest rate caps and foreign currency options, the maximum payout cannot be quantified since the increase in interest or foreign exchange rates are not contractually limited by the terms of the contract. As such, we have disclosed notional values as a measure of our maximum potential payout under these contracts.
The following table summarizes the notional amounts associated with our derivative contracts meeting the definition of a guarantee under U.S. GAAP at November 30, 2013 (in millions):
Expected Maturity Date | ||||||||||||||||||||||||
Guarantee Type | 2014 | 2015 | 2016 and 2017 | 2018 and 2019 | 2020 and Later | Notional/ Maximum Payout | ||||||||||||||||||
Derivative contracts - non-credit related | $ | 841,439.9 | $ | 4,695.2 | $ | 14.7 | $ | 1.2 | $ | 532.4 | $ | 846,683.4 | ||||||||||||
Written derivative contracts - credit related | - | - | - | 2,708.1 | - | 2,708.1 | ||||||||||||||||||
Total derivative contracts | $ | 841,439.9 | $ | 4,695.2 | $ | 14.7 | $ | 2,709.3 | $ | 532.4 | $ | 849,391.5 | ||||||||||||
At November 30, 2013 the external credit ratings of the underlyings or referenced assets for our credit related derivatives contracts (in millions):
External Credit Rating | ||||||||||||||||||||||||||||
AAA/ Aaa | AA/Aa | A | BBB/Baa | Below Investment Grade | Unrated | Notional/ Maximum Payout | ||||||||||||||||||||||
Credit related derivative contracts: | ||||||||||||||||||||||||||||
Index credit default swaps | $ | 2,678.6 | $ | - | $ | - | $ | - | $ | - | $ | - | $ | 2,678.6 | ||||||||||||||
Single name credit default swaps | - | 3.0 | 2.5 | 24.0 | - | - | 29.5 | |||||||||||||||||||||
The derivative contracts deemed to meet the definition of a guarantee under U.S. GAAP are before consideration of hedging transactions and only reflect a partial or "one-sided" component of any risk exposure. Written equity options and written credit default swaps are often executed in a strategy that is in tandem with long cash instruments (e.g., equity and debt securities). We substantially mitigate our exposure to market risk on these contracts through hedges, such as other derivative contracts and/or cash instruments, and we manage the risk associated with these contracts in the context of our overall risk management framework. We believe notional amounts overstate our expected payout and that fair value of these contracts is a more relevant measure of our obligations. At November 30, 2013, the fair value of derivative contracts meeting the definition of a guarantee is approximately $229.5 million.
Stand by Letters of Credit. At November 30, 2013, we provided guarantees to certain counterparties in the form of standby letters of credit in the amount of $32.0 million, which expire within one year. Stand by letters of credit commit us to make payment to the beneficiary if the guaranteed party fails to fulfill its obligation under a contractual arrangement with that beneficiary. Since commitments associated with these collateral instruments may expire unused, the amount shown does not necessarily reflect the actual future cash funding requirement.
Other Guarantees. We are members of various exchanges and clearing houses. In the normal course of business we provide guarantees to securities clearinghouses and exchanges. These guarantees generally are required under the standard membership agreements, such that members are required to guarantee the performance of other members. Additionally, if a member becomes unable to satisfy its obligations to the clearinghouse, other members would be required to meet these shortfalls. To mitigate these performance risks, the exchanges and clearinghouses often require members to post collateral. Our obligations under such guarantees could exceed the collateral amounts posted. Our maximum potential liability under these arrangements cannot be quantified; however, the potential for us to be required to make payments under such guarantees is deemed remote. Accordingly no liability has been recognized for these arrangements.
Jef-72
Note 23. Net Capital Requirements
As broker-dealers registered with the SEC and member firms of the Financial Industry Regulatory Authority ("FINRA"), Jefferies and Jefferies Execution are subject to the SEC Net Capital Rule ("Rule 15c3-1"), which requires the maintenance of minimum net capital and which may limit distributions from the broker-dealers. Jefferies and Jefferies Execution have elected to calculate minimum capital requirements under the alternative method as permitted by Rule 15c3-1. Jefferies Bache, LLC is registered as a Futures Commission Merchant and is subject to Rule 1.17 of the Commodities Futures Trading Commission ("CFTC"). Our designated self-regulatory organization is FINRA for our U.S. broker-dealers and the Chicago Mercantile Exchange for Jefferies Bache, LLC. Subsequent to the closing of the merger with Leucadia, Jefferies High Yield Trading merged with Jefferies and voluntarily withdrew its registration with the SEC as a broker-dealer on April 2, 2013 and resigned as a member of FINRA.
As of November 30, 2013, Jefferies and Jefferies Execution and Jefferies Bache, LLC's net capital, adjusted net capital, and excess net capital were as follows (in thousands):
Net Capital | Excess Net Capital | |||||||
Jefferies | $ | 891,487 | $ | 841,539 | ||||
Jefferies Execution | 4,487 | 4,237 | ||||||
Adjusted Net Capital | Excess Net Capital | |||||||
Jefferies Bache, LLC | $ | 197,957 | $ | 86,293 | ||||
Certain other U.S. and non-U.S. subsidiaries are subject to capital adequacy requirements as prescribed by the regulatory authorities in their respective jurisdictions, including Jefferies International Limited and Jefferies Bache Limited which are subject to the regulatory supervision and requirements of the Financial Conduct Authority in the United Kingdom ("U.K.").
The regulatory capital requirements referred to above may restrict our ability to withdraw capital from our subsidiaries.
Note 24. Segment Reporting
We operate in two principal segments – Capital Markets and Asset Management. The Capital Markets segment includes our securities, commodities, futures and foreign exchange brokerage trading activities and investment banking, which is comprised of underwriting and financial advisory activities. The Capital Markets reportable segment provides the sales, trading, origination and advisory effort for various fixed income, equity and advisory products and services. The Asset Management segment provides investment management services to investors in the U.S. and overseas.
Our reportable business segment information is prepared using the following methodologies:
| - | Net revenues and expenses directly associated with each reportable business segment are included in determining earnings before taxes. |
| - | Net revenues and expenses not directly associated with specific reportable business segments are allocated based on the most relevant measures applicable, including each reportable business segment's net revenues, headcount and other factors. |
| - | Reportable business segment assets include an allocation of indirect corporate assets that have been fully allocated to our reportable business segments, generally based on each reportable business segment's capital utilization. |
Our net revenues and expenses by segment are summarized below for the nine months ended November 30, 2013, and three months ended February 28, 2013 and the years ended November 30, 2012 and 2011 (in millions):
Successor | Predecessor | |||||||||||||||
Nine Months Ended November 30, 2013 | Three Months Ended February 28, 2013 (1) | Year Ended November 30, 2012 | Year Ended November 30, 2011 | |||||||||||||
Capital Markets: | ||||||||||||||||
Net revenues | $ | 2,074.1 | $ | 807.6 | $ | 3,034.7 | $ | 2,530.7 | ||||||||
Expenses | $ | 1,840.4 | $ | 660.6 | $ | 2,496.4 | $ | 2,123.1 | ||||||||
Asset Management: | ||||||||||||||||
Net revenues | $ | 66.6 | $ | 10.9 | $ | 27.0 | $ | 46.2 | ||||||||
Expenses | $ | 32.6 | $ | 7.5 | $ | 30.6 | $ | 30.9 | ||||||||
Total: | ||||||||||||||||
Net revenues | $ | 2,140.7 | $ | 818.5 | $ | 3,061.7 | $ | 2,576.9 | ||||||||
Expenses | $ | 1,873.0 | $ | 668.1 | $ | 2,527.0 | $ | 2,154.0 | ||||||||
(1) |
Our consolidated net earnings for the three months ended February 28, 2013 reflects an adjustment of $5.3 million, after tax, from that reported in the Form 10-Q for the three months ended February 28, 2013, to correct for the effect of an overstatement of professional service fees of $8.5 million relating to the Merger with Leucadia. We evaluated the effects of this error and concluded that it is not material to the previously issued Quarterly Report on Form 10-Q for the three month period ended February 28, 2013. Nevertheless, in the table above we have revised our consolidated expenses for the three month period ended February 28, 2013 to correct for the effect of this error and appropriately reflected the $8.5 million of professional service fees as an expense in the nine months ended November 30, 2013. |
Jef-73
The following table summarizes our total assets by segment as of November 30, 2013 and 2012 (in millions):
Successor | Predecessor | |||||||
November 30, 2013 | November 30, 2012 | |||||||
Segment Assets: | ||||||||
Capital Markets | $ | 39,276.8 | $ | 35,588.6 | ||||
Asset Management | 900.2 | 704.9 | ||||||
Total assets | $ | 40,177.0 | $ | 36,293.5 | ||||
Net Revenues by Geographic Region
Net revenues for the Capital Market segment are recorded in the geographic region in which the position was risk-managed or, in the case of investment banking, in which the senior coverage banker is located. For Asset Management, net revenues are allocated according to the location of the investment advisor. Net revenues by geographic region for the Successor period nine months ended November 30, 2013 and the Predecessor periods three months ended February 28, 2013 and the years ended November 30, 2012 and 2011, were as follows (in thousands):
Successor | Predecessor | |||||||||||||||
Nine Months Ended November 30, 2013 | Three Months Ended February 28, 2013 | Year Ended November 30, 2012 | Year Ended November 30, 2011 | |||||||||||||
Americas (1) | $ | 1,646,174 | $ | 661,600 | $ | 2,507,839 | $ | 2,046,644 | ||||||||
Europe (2) | 448,181 | 135,135 | 450,823 | 504,292 | ||||||||||||
Asia | 46,326 | 21,809 | 102,990 | 26,009 | ||||||||||||
Net revenues | $ | 2,140,681 | $ | 818,544 | $ | 3,061,652 | $ | 2,576,945 | ||||||||
(1) | Substantially all relates to U.S. results. | |||||||||||||||
(2) | Substantially all relates to U.K. results. | |||||||||||||||
Note 25. Related Party Transactions
Jefferies Capital Partners and JEP IV Related Funds. We have loans to and/or equity investments in private equity funds and in Jefferies Capital Partners, LLC, the manager of the Jefferies Capital Partners funds, which are managed by a team led by Brian P. Friedman, one of our directors and our Chairman of the Executive Committee ("Private Equity Related Funds"). At November 30, 2013 (Successor period) and November 30, 2012 (Predecessor period), loans to and/or equity investments in Private Equity Related Funds were in aggregate $61.7 million and $104.2 million, respectively. The following table presents interest income earned on loans to Private Equity Related Funds and other revenues and investment income related to net gains and losses on our investment in Private Equity Related Funds (in thousands):
Successor | Predecessor | |||||||||||||||
Nine Months Ended November 30, 2013 | Three Months Ended February 28, 2013 | Year Ended November 30, 2012 | Year Ended November 30, 2011 | |||||||||||||
Interest income | $ | 852 | $ | 516 | $ | 3,100 | $ | 3,100 | ||||||||
Other revenues and investment income (loss) | 9,294 | 947 | (8,500 | ) | 9,200 | |||||||||||
For further information regarding our commitments and funded amounts to Private Equity Related Funds, see Note 22, Commitments, Contingencies and Guarantees .
Berkadia Commercial Mortgage, LLC. At November 30, 2013 and November 30, 2012, we have commitments to purchase $300.0 million and $411.6 million, respectively, in agency commercial mortgage-backed securities from Berkadia Commercial Mortgage, LLC, which is partially owned by Leucadia.
Officers, Directors and Employees. At November 30, 2013 (Successor period) and November 30, 2012 (Predecessor period), we had $13.9 million and $16.3 million, respectively, of loans outstanding to certain of our employees (none of whom are executive officers or directors) that are included in Other assets on the Consolidated Statements of Financial Condition.
Leucadia. During the three months ended February 28, 2013, and the years ended November 30, 2012 and 2011, we received commissions and commission equivalents for providing brokerage services to Leucadia and its affiliates of $5,000, $9.8 million and $7.2 million, respectively, which is recorded in Commission income on the Consolidated Statements of Earnings. Further, under a service agreement, we charge Leucadia for certain administrative services which, for the nine months ended November 30, 2013 amounted to $16.7 million. As of November 30, 2013, we had a payable to Leucadia of $6.7 million, which is included within Other liabilities on the Consolidated Statement of Financial Condition.
Jef-74
During 2013, we sold 100% of our interests in Jefferies International Management Limited ("JIML"), our special situations asset management business, to Leucadia for consideration of $2.3 million in the form of an intercompany loan receivable from Leucadia. The net assets of JIML that were transferred were $2.3 million, including goodwill of $400,000. No gain or loss was recognized on the sale.
During the nine months ended November 30, 2013 and the three months ended February 28, 2013, we distributed to Leucadia approximately $0 and $61,000, respectively, and $5.4 million and $9.0 million for the year ended November 30, 2012 and 2011, respectively. During the nine months ended November 30, 2013, Leucadia invested $75.0 million in an asset management entity that is consolidated by us. See Note 17, Noncontrolling Interests and Mandatorily Redeemable Preferred Interests of Consolidated Subsidiaries.
In addition, see Note 4, Leucadia Merger and Related Transactions for information regarding the merger on March 1, 2013.
For information on transactions with our equity method investees, see Note 12, Investments.
Note 26. Selected Quarterly Financial Data (Unaudited)
The following is a summary of unaudited quarterly statements of earnings for the Successor period nine months ended November 30, 2013, and the Predecessor periods three months ended February 28, 2013 and year ended November 30, 2012 (in thousands, except per share amounts):
Successor | Predecessor | |||||||||||||||
Three Months Ended (1) | ||||||||||||||||
November 30, 2013 | August 31, 2013 | May 31, 2013 | February 28, 2013 | |||||||||||||
Total revenues | $ | 1,139,157 | $ | 710,682 | $ | 869,901 | $ | 1,021,960 | ||||||||
Net revenues | 950,548 | 531,695 | 658,438 | 818,544 | ||||||||||||
Earnings before income taxes | 175,660 | 23,382 | 65,253 | 139,487 | ||||||||||||
Earnings attributable to Jefferies Group LLC | 109,943 | 11,740 | 39,508 | 80,138 | ||||||||||||
Earnings per common share: | ||||||||||||||||
Basic | N/a | N/a | N/a | $ | 0.35 | |||||||||||
Diluted | $ | N/a | N/a | N/a | $ | 0.35 | ||||||||||
Three Months Ended (1) | ||||||||||||||||
November 30, 2012 | August 31, 2012 | May 31, 2012 | February 29, 2012 | |||||||||||||
Total revenues | $ | 989,009 | $ | 961,293 | $ | 962,531 | $ | 1,021,240 | ||||||||
Net revenues | 784,588 | 755,179 | 727,490 | 794,395 | ||||||||||||
Earnings before income taxes | 113,975 | 122,369 | 106,582 | 148,869 | ||||||||||||
Earnings to common shareholders | 71,604 | 70,171 | 63,498 | 77,136 | ||||||||||||
Earnings per common share: | ||||||||||||||||
Basic | $ | 0.31 | $ | 0.31 | $ | 0.28 | $ | 0.33 | ||||||||
Diluted | $ | 0.31 | $ | 0.31 | $ | 0.28 | $ | 0.33 | ||||||||
| (1) | Adjustments have been made to amounts presented in previous filings. For further information refer to Note 1 in the Notes to the Consolidated Financial Statements. |
Jef-75
The following tables set forth the effects of the adjustments on major captions within our Consolidated Statement of Earnings for the quarters in 2013 and 2012.
Successor | Predecessor | |||||||||||||||||||||||
Three Months Ended | ||||||||||||||||||||||||
August 31, 2013 | May 31, 2013 |
February 28, 2013 | ||||||||||||||||||||||
(in thousands) | As Previously Reported | Adjusted | As Previously Reported | Adjusted | As Previously Reported | Adjusted | ||||||||||||||||||
Commissions revenues | $ | 138,736 | $ | 153,402 | $ | 146,848 | $ | 162,759 | $ | 131,083 | $ | 146,240 | ||||||||||||
Total revenues | 696,016 | 710,682 | 853,990 | 869,901 | 1,006,803 | 1,021,960 | ||||||||||||||||||
Net revenues | 517,029 | 531,695 | 642,527 | 658,438 | 803,387 | 818,544 | ||||||||||||||||||
Net revenues, less mandatorily redeemable preferred interest | 517,029 | 531,695 | 639,159 | 655,070 | 792,426 | 807,583 | ||||||||||||||||||
Floor brokerage and clearing fees | 34,500 | 49,166 | 32,991 | 48,902 | 30,998 | 46,155 | ||||||||||||||||||
Other expenses | 34,012 | 34,012 | 18,720 | 18,720 | 14,475 | 14,475 | ||||||||||||||||||
Total non-compensation expenses | 199,876 | 214,542 | 200,026 | 215,937 | 178,722 | 193,879 | ||||||||||||||||||
Total non-interest expenses | 493,647 | 508,313 | 573,906 | 589,817 | 652,939 | 668,096 | ||||||||||||||||||
Earnings before income taxes | 23,382 | 23,382 | 65,253 | 65,253 | 139,487 | 139,487 | ||||||||||||||||||
Income tax expense | 8,493 | 8,493 | 25,007 | 25,007 | 48,645 | 48,645 | ||||||||||||||||||
Net earnings | 14,889 | 14,889 | 40,246 | 40,246 | 90,842 | 90,842 | ||||||||||||||||||
Net earnings attributable to Jefferies Group LLC | 11,740 | 11,740 | 39,508 | 39,508 | 80,138 | 80,138 | ||||||||||||||||||
Predecessor | ||||||||||||||||||||||||||||||||
Three Months Ended | ||||||||||||||||||||||||||||||||
November 30, 2012 | August 31, 2012 | May 31, 2012 |
February 28, 2012 | |||||||||||||||||||||||||||||
(in thousands) | As Previously Reported | Adjusted | As Previously Reported | Adjusted | As Previously Reported | Adjusted | As Previously Reported | Adjusted | ||||||||||||||||||||||||
Commissions revenues | $ | 127,074 | $ | 142,813 | $ | 119,200 | $ | 135,441 | $ | 121,796 | $ | 138,255 | $ | 117,499 | $ | 131,928 | ||||||||||||||||
Total revenues | 973,270 | 989,009 | 945,052 | 961,293 | 946,072 | 962,531 | 1,006,811 | 1,021,240 | ||||||||||||||||||||||||
Net revenues | 768,849 | 784,588 | 738,938 | 755,179 | 711,031 | 727,490 | 779,966 | 794,395 | ||||||||||||||||||||||||
Net revenues, less mandatorily redeemable preferred interest | 760,570 | 776,309 | 730,634 | 746,875 | 706,575 | 723,034 | 758,122 | 772,551 | ||||||||||||||||||||||||
Floor brokerage and clearing fees | 29,106 | 44,845 | 30,280 | 46,521 | 32,921 | 49,380 | 27,838 | 42,267 | ||||||||||||||||||||||||
Other expenses | 16,480 | 16,480 | 12,433 | 12,433 | 18,587 | 18,587 | 14,998 | 14,998 | ||||||||||||||||||||||||
Total non-compensation expenses | 186,191 | 201,930 | 167,874 | 184,115 | 176,452 | 192,911 | 162,792 | 177,221 | ||||||||||||||||||||||||
Total non-interest expenses | 646,595 | 662,334 | 608,265 | 624,506 | 599,993 | 616,452 | 609,253 | 623,682 | ||||||||||||||||||||||||
Earnings before income taxes | 113,975 | 113,975 | 122,369 | 122,369 | 106,582 | 106,582 | 148,869 | 148,869 | ||||||||||||||||||||||||
Income tax expense | 34,243 | 34,243 | 44,048 | 44,048 | 38,203 | 38,203 | 52,152 | 52,152 | ||||||||||||||||||||||||
Net earnings | 79,732 | 79,732 | 78,321 | 78,321 | 68,379 | 68,379 | 96,717 | 96,717 | ||||||||||||||||||||||||
Net earnings attributable to common shareholders | 71,604 | 71,604 | 70,171 | 70,171 | 63,498 | 63,498 | 77,136 | 77,136 | ||||||||||||||||||||||||
Jef-76