Table of Contents
UNITED STATES SECURITIES AND EXCHANGE COMMISSION
Washington, D.C. 20549
FORM 10-K
(Mark One)
x
ANNUAL REPORT UNDER SECTION 13 OR 15(d) OF THE SECURITIES EXCHANGE ACT OF 1934
For the fiscal year ended June 30, 2011
OR
o
TRANSITION REPORT UNDER SECTION 13 OR 15(d) OF THE SECURITIES EXCHANGE ACT OF 1934
For the transition period from to
Commission File No. 001-31298
LANNETT COMPANY, INC.
(Exact name of registrant as specified in its charter)
State of Delaware |
| 23-0787699 |
State of Incorporation |
| I.R.S. Employer I.D. No. |
9000 State Road
Philadelphia, Pennsylvania 19136
Registrant's telephone number, including area code: (215) 333-9000
(Address of principal executive offices and telephone number)
Securities registered under Section 12(b) of the Exchange Act: None
Securities registered under Section 12(g) of the Exchange Act:
Common Stock, $.001 Par Value
(Title of class)
Indicate by check mark if the registrant is a well-known seasoned issuer, as defined in Rule 405 of the Securities Act Yes o No x
Indicate by check mark if the registrant is not required to file reports pursuant to Section 13 or Section 15(d) of the Act. Yes o No x
Indicate by check mark whether the registrant (1) has filed all reports required to be filed by Section 13 or 15(d) of the Securities Exchange Act of 1934 during the preceding 12 months (or for such shorter period that the registrant was required to file such reports), and (2) has been subject to such filing requirements for the past 90 days. Yes x No o
Indicate by check mark if disclosure of delinquent filers pursuant to Item 405 of Regulation S-K is not contained herein, and will not be contained, to the best of registrant's knowledge, in definitive proxy or information statements incorporated by reference in Part III of this Form 10-K or any amendment to this Form 10-K. o
Indicate by check mark whether the registrant is a large accelerated filer, an accelerated filer, a non-accelerated filer, or a smaller reporting company. See definitions of "large accelerated filer," "accelerated filer," and "smaller reporting company" in Rule 12b-2 of the Exchange Act. (Check one):
Large accelerated filer o |
| Accelerated filer x |
|
|
|
Non-accelerated filer o |
| Smaller reporting company o |
(Do not check if a smaller reporting company) |
|
|
Indicate by check mark whether the registrant has submitted electronically and posted on its corporate Web site, if any, every Interactive Data File required to be submitted and posted pursuant to Rule 405 of Regulation S-T (§232.405 of this chapter) during the preceding 12 months (or for such shorter period that the registrant was required to submit and post such files). Yes o No o
Indicate by check mark whether the registrant is a shell company (as defined in Rule 12B-12 of the Exchange Act). Yes o No x
Aggregate market value of common stock held by non-affiliates of the registrant, as of December 31, 2010 was $90,607,745 based on the closing price of the stock on the NYSE - AMEX.
As of September 2, 2011, there were 28,338,037 shares of the registrant's common stock, $.001 par value, outstanding.
Table of Contents
TABLE OF CONTENTS
PART I |
|
|
| ITEM 1. DESCRIPTION OF BUSINESS | 3 |
| ITEM 1A. RISK FACTORS | 18 |
| ITEM 2. DESCRIPTION OF PROPERTY | 25 |
| ITEM 3. LEGAL PROCEEDINGS | 25 |
PART II |
|
|
| ITEM 5. MARKET FOR COMMON EQUITY AND RELATED STOCKHOLDER MATTERS | 26 |
| ITEM 6. SELECTED FINANCIAL DATA | 28 |
| ITEM 7. MANAGEMENT'S DISCUSSION AND ANALYSIS OF FINANCIAL CONDITION AND RESULTS OF OPERATIONS | 29 |
| ITEM 7A. QUANTITATIVE AND QUALITATIVE DISCLOSURES ABOUT MARKET RISK | 42 |
| ITEM 8. FINANCIAL STATEMENTS AND SUPPLEMENTARY DATA | 42 |
| ITEM 9. CHANGES IN AND DISAGREEMENTS WITH ACCOUNTANTS ON ACCOUNTING AND FINANCIAL DISCLOSURE | 42 |
| ITEM 9A. CONTROLS AND PROCEDURES | 42 |
| ITEM 9B. OTHER INFORMATION | 44 |
PART III |
|
|
| ITEM 10. DIRECTORS AND EXECUTIVE OFFICERS OF THE REGISTRANT | 45 |
| ITEM 11. EXECUTIVE COMPENSATION | 49 |
| ITEM 12. SECURITY OWNERSHIP OF CERTAIN BENEFICIAL OWNERS AND MANAGEMENT AND RELATED STOCKHOLDER MATTERS | 61 |
| ITEM 13. CERTAIN RELATIONSHIPS AND RELATED TRANSACTIONS | 64 |
| ITEM 14. PRINCIPAL ACCOUNTANT FEES AND SERVICES | 65 |
PART IV |
|
|
| ITEM 15. EXHIBITS, FINANCIAL STATEMENT SCHEDULES, | 65 |
SIGNATURES | 66 | |
2
Table of Contents
CAUTIONARY NOTE REGARDING FORWARD-LOOKING STATEMENTS
This Annual Report on Form 10-K contains forward-looking statements in "Item 1A - Risk Factors", "Item 7 - Management's Discussion and Analysis of Financial Condition and Results of Operations" and in other statements located elsewhere in this Annual Report. Any statements made in this Annual Report that are not statements of historical fact or that refer to estimated or anticipated future events are forward-looking statements. We have based our forward-looking statements on our management's beliefs and assumptions based on information available to them at this time. Such forward-looking statements reflect our current perspective of our business, future performance, existing trends and information as of the date of this filing. These include, but are not limited to, our beliefs about future revenue and expense levels and growth rates, prospects related to our strategic initiatives and business strategies, express or implied assumptions about government regulatory action or inaction, anticipated product approvals and launches, business initiatives and product development activities, assessments related to clinical trial results, product performance and competitive environment, and anticipated financial performance. Without limiting the generality of the foregoing, words such as "may," "will," "expect," "believe," "anticipate," "intend," "could," "would," "estimate," "continue," or "pursue," or the negative other variations thereof or comparable terminology, are intended to identify forward-looking statements. The statements are not guarantees of future performance and involve certain risks, uncertainties and assumptions that are difficult to predict. We caution the reader that certain important factors may affect our actual operating results and could cause such results to differ materially from those expressed or implied by forward-looking statements. We believe the risks and uncertainties discussed under the "Item 1A - Risk Factors" and other risks and uncertainties detailed herein and from time to time in our SEC filings, may affect our actual results.
We disclaim any obligation to publicly update any forward-looking statements, whether as a result of new information, future events or otherwise. We also may make additional disclosures in our Quarterly Reports on Form 10-Q, Current Reports on Form 8-K and in other filings that we may make from time to time with the SEC. Other factors besides those listed here could also adversely affect us. This discussion is provided as permitted by the Private Securities Litigation Reform Act of 1995, as amended.
PART I
ITEM 1. DESCRIPTION OF BUSINESS
Business Overview
Lannett Company, Inc. (the "Company," "Lannett," "we," or "us") was incorporated in 1942 under the laws of the Commonwealth of Pennsylvania, and reincorporated in 1991 as a Delaware corporation. We develop, manufacture, market and distribute generic versions of branded pharmaceutical products. We report financial information on a quarterly and fiscal year basis with the most recent being the fiscal year ended June 30, 2011. All references herein to a "fiscal year" or "Fiscal" refer to the applicable fiscal year ending June 30.
According to data reported by IMS Health in August 2011, we are currently among the top 20 companies, based on number of prescription transactions, for unbranded generic products in the United States. We intend to grow our business organically as well as through strategic partnerships. Additionally, our Levothyroxine Sodium tablets ("Levo") were recognized by IMS Health as the 15 th most prescribed pharmaceutical product, including both branded and generic products, in the U.S. over the past year, reaching approximately 25 million prescriptions for the twelve months ended June 2011. This product line represents approximately 0.6% of the domestic prescription market. Over the last year, we have experienced a 1% growth in prescriptions for our products while Levo has experienced a 7% annual growth during that period.
Over the past five years, we have experienced a 29% growth in our revenues from approximately $83 million in fiscal year 2007 to approximately $107 million in fiscal year 2011. This growth has been achieved primarily through strategic partnerships and launches of additional manufactured drugs as well as opportunities resulting from our exceptional compliance with regulatory issues.
Competitive Strengths
Proven Ability to Develop Successful Products and Achieve Scale in Production . We believe that our ability to select viable products for development, efficiently develop such products, including obtaining any applicable regulatory approvals, vertically integrate ourselves into certain markets and achieve economies in production are all critical for our success in the generic pharmaceutical industry in which we operate. We intend to focus on long-term profitability while seeking to secure market positions with fewer challenges from competitors. Two key examples are Morphine Sulfate Oral Solution and Hydromorphone HCl tablets.
Efficient Development Systems and Manufacturing Expertise for New Products . We believe that our manufacturing expertise, low overhead expenses and efficient product development, manufacturing and marketing capabilities can help us remain competitive in the
3
Table of Contents
general pharmaceutical market. We intend to dedicate significant capital toward developing new products because we believe our success is linked to our ability to continually introduce new generic products into the marketplace. Competition from new and other market participants for the manufacture and distribution of certain products would likely harm our market share with respect to such products as well as force us to reduce our selling price for such products due to their increased availability. As a result, we believe that our success depends on our ability to properly assess the competitive effect of new products, including market share, the number of competitors and the generic unit price erosion. We intend to reduce our exposure to competitive influences that may negatively affect our sales and profits, including the potential saturation of the market for certain products, by continuing to emphasize maintenance of a strong research and development ("R&D") pipeline. We believe that it is in our best interest to avoid becoming materially dependent on the sale of a single product.
Mutually Beneficial Supply and Distribution Arrangements . In 2004, we entered into an exclusive distribution agreement with Jerome Stevens Pharmaceuticals ("JSP") covering four different product lines. Two of these product lines, Levo and Digoxin, collectively accounted for approximately 55% of our net sales in fiscal year 2011 and both products have experienced significant market growth in sales over the past few years. Distribution agreements with other manufacturers have also increased our net sales in recent years.
Dependable Supplier to our Customers . We believe we are viewed within the generic pharmaceutical industry as a strong, dependable supplier to our customer base. We have cultivated strong and dependable customer relationships by maintaining adequate inventory levels, employing a responsive order filling system and prioritizing timely fulfillment of those orders. A majority of our orders are filled and shipped either on the day of, or the day following, the date that we receive the order.
Strong Track Record of Obtaining Regulatory Approvals for New Products . During the past two fiscal years, we have received five approved Abbreviated New Drug Applications (each, an "ANDA") and one NDA from the Food and Drug Administration (the "FDA"). We expect to receive several more during the next fiscal year. These regulatory approvals will enable us to manufacture and supply a broader portfolio of generic pharmaceutical products.
Reputation for Regulatory Compliance . We have a strong track record of regulatory compliance and we believe that we have strong effective regulatory compliance capabilities and practices through hiring qualified individuals and implementing strong current Good Manufacturing Practices ("cGMP"). Two of our competitive strengths, our agility in responding quickly to market events and a strong reputation for regulatory compliance, positioned us to avail ourselves of these market opportunities.
In addition, narcotics or "controlled drugs" are subject to a rigorous regulatory compliance regimen. We are one of seven companies in the U.S. that have been granted a license from the U.S. Drug Enforcement Administration ("DEA") to import raw poppy straw for conversion into active pharmaceutical ingredients ("API"). Such licenses are renewed annually, but non-compliance could result in a license not being renewed. As a result, we believe that our strong reputation for regulatory compliance allows us to have a competitive edge in managing the production and distribution of narcotics and controlled drugs.
Business Strategies
Continue to Broaden our Product Lines Through Internal Development and Strategic Partnerships . We are focused on increasing our market share in the generic pharmaceutical industry while concentrating additional resources on the development of new products, including narcotics and controlled drugs. We can continue our efforts to improve our financial performance by expanding our line of generic products, increasing unit sales to current customers and reducing overhead and administrative costs.
We have targeted four strategies for expanding our product offerings: (1) deploying our experienced R&D staff to develop products in-house, (2) entering into additional product development agreements or strategic partnerships with third-party product developers and formulators, (3) purchasing ANDAs from other generic manufacturers that no longer seek to manufacture a specific product and (4) marketing drugs under brand names where we see no generic opportunity. We expect that each method will facilitate our identification, selection and development of additional generic pharmaceutical products that we may distribute through our existing network of customers.
We have several existing supply and development agreements with both international and domestic companies, and are currently in negotiations on similar agreements with additional international companies, through which we can market and distribute future products. We intend to capitalize on our strong customer relationships to build our market share for such products.
4
Table of Contents
Improve our Operating Profile in Certain Targeted Specialty Markets . In certain situations, we may increase our focus on certain specialty markets within the generic pharmaceutical industry. By narrowing our focus to specialty markets, we can provide increased product alternatives in categories with relatively few other market participants. We plan to strengthen our relationships with strategic partners, including providers of product development research, raw materials, API and finished products. We believe that mutually beneficial strategic relationships in such areas, including potential financing arrangements, partnerships, joint ventures or acquisitions, could enhance our competitive advantages in the generic pharmaceutical market.
Leverage Ability to Vertically Integrate as a Manufacturer, Supplier and Distributor of Narcotics and Controlled Substances . We view our April 2007 acquisition of Cody Laboratories, Inc. ("Cody Labs" or "Cody") as an important step in becoming a vertically integrated narcotics manufacturer and distributor by allowing us to concentrate on developing and completing our dosage form manufacturing in order to reduce our narcotic API costs. In July 2008, the DEA granted Cody Labs a license to directly import raw poppy straw for conversion into API and/or various pharmaceutical products. Only six other companies in the U.S. have been granted this license to date. This license will allow us to avoid increased costs associated with buying narcotic API from other manufacturers. We anticipate that we can use this license to become a vertically integrated manufacturer of narcotic products, as well as a supplier of API to the pharmaceutical industry. Market indicators have shown us that the aging domestic population will likely result in a higher demand for pain management pharmaceutical products.
Cody Labs' manufacturing expertise in narcotic APIs will allow us to build a market with limited domestic competition. We anticipate that the demand for narcotics and controlled drugs will continue to grow with the "Baby Boomer" generation demographics and that we are well-positioned to take advantage of these opportunities by concentrating additional resources in the narcotic area.
Key Products
All of our products currently manufactured and/or sold are prescription products. Of the products listed in the table entitled "Current Products" below, those containing Levo, Digoxin, Butalbital, Cocaine and Morphine Sulfate were our key products, collectively accounting for approximately 69%, 75% and 71% of our net sales in fiscal years 2011, 2010 and 2009, respectively. In fiscal year 2009, we began selling our prenatal vitamin, OB Natal One, which was the generic version to a brand name prenatal vitamin. During the launch year of 2009, we sold approximately $12.6 million in net sales of the product. During our fiscal year 2009, the brand equivalent was withdrawn from the marketplace. Due to the brand company withdrawing their detailing sales force from the marketplace, we saw a significant drop in sales of our OB Natal One product during fiscal years 2010 and 2011. As part of our lawsuit settlement with the brand company in March 2009, Lannett withdrew this product from the marketplace by December 2010.
Our products containing Levo are produced and marketed with 12 varying potencies. In addition to generic Levo tablets, we also market and distribute Unithroid tablets, a branded version of Levo, which is produced and marketed with 11 varying potencies. Both generic Levo tablets and Unithroid tablets are manufactured by JSP. We began buying generic Levo from JSP and selling it to our customers in April 2003. In September 2003, we began buying the branded Unithroid tablets from JSP and selling them to our customers. Levo tablets are used to treat hypothyroidism and other thyroid disorders. Levo remains one of the most prescribed drugs in the U.S. and is used by patients of various ages and demographic backgrounds. We signed a distribution agreement with JSP in March 2004 that granted us exclusive distribution rights to Levo tablets through March 2014 (the "JSP Distribution Agreement"). In June 2004, JSP received a letter from the FDA approving its supplemental application for generic bioequivalence to Levoxyl ® . In December 2004, JSP received a letter from the FDA approving its supplemental application for generic bioequivalence to Synthroid ® . Net sales of Levo have grown rapidly in recent years from approximately $35 million in 2007 to almost $46.2 million in 2011. In our distribution of these products, we compete with two branded Levo products-Abbott Laboratories' Synthroid ® and Monarch Pharmaceutical's Levoxyl ® - as well as generic products from Mylan and Sandoz.
Digoxin tablets are produced and marketed with two different potencies (0.125 and 0.25 milligrams ("mg") per tablet). This product is manufactured by JSP and we distribute it under the JSP Distribution Agreement. We began buying this product from JSP and selling it to our customers in September 2002. Digoxin tablets are used to treat congestive heart failure in patients of various ages and demographic backgrounds. Net sales of this product have increased from approximately $4.7 million in 2007 to $12.4 million in 2011. In our distribution of these products, we compete with three similar generic products from GlaxoSmithKline, Impax, and Westward.
We distribute two products containing Butalbital. We have manufactured and sold one of the products, Butalbital with Aspirin and Caffeine capsules, for more than nineteen years. The other Butalbital product, Butalbital with Aspirin, Caffeine and Codeine Phosphate capsules, is manufactured by JSP. We began buying this product from JSP and selling it to our customers in December 2002. Both Butalbital products, which are in orally administered capsule dosage forms, are prescribed to treat tension headaches caused by contractions of the muscles in the neck and shoulder area and migraine. The drug is prescribed primarily for adults of various demographic backgrounds. Migraine headache is an increasingly prevalent condition in the United States. As conditions continue to grow, the demand for effective medical treatments will continue to grow. Although new innovator drugs to
5
Table of Contents
treat migraine headaches have been introduced by brand name drug companies, we believe that there is still a loyal following of doctors and consumers who prefer to use Butalbital products for treatment. As the brand name companies continue to promote products containing Butalbital, like Fiorinal ® , we expect to continue to produce and sell our generic Butalbital products.
Morphine Sulfate liquid oral solution is produced and marketed in three different size containers (20 mgs per mL in 30, 120 and 240 mL bottles). We manufacture these liquid dosage forms at our Cody Labs subsidiary and we are currently finishing the manufacturing methods and capabilities to make the API form also at Cody. This drug is prescribed primarily for the management of pain in adults where other products or delivery methods are not tolerable to the patient. As recently as March of 2009, seven different companies, including Lannett, were manufacturing and/or distributing this product. As a result of actions by the FDA during fiscal years 2009 and 2010 (see Item 1. Government Regulation), six of those companies, including Lannett, left the market by July 2010. From July 2010 through June 2011, only one company had an approved NDA for this product and enjoyed market exclusivity selling it. In June 2011, Lannett became the second approved manufacturer of this product. Lannett expects to resume sales of this product during the first fiscal quarter of 2012.
Cocaine Topical Solution ("C-Topical") is produced and marketed under a preliminary new drug application ("PIND") in two different strengths and two different size containers. (4% per 4 and 10 ml bottles, and 10% per 4 and 10 ml bottles). We manufacture these liquid dosage forms at our Cody Labs subsidiary and we expect to complete finishing the manufacturing methods and capabilities to make the API form also at Cody within the next fiscal year. Sales of C-Topical approximated 5% of Lannett's Net Sales during Fiscal 2011. This drug is utilized primarily for the anesthetization of the patient during ear, nose or throat surgery. It also works as a vasoconstrictor during the surgery.
Validated Pharmaceutical Capabilities
Our manufacturing facility consists of 31,000 square feet on an approximately 3.5-acre parcel of land that we own. In addition, we own a 63,000 square foot building on approximately 3.0 acres located within one mile of our manufacturing facility that houses packaging, research and development and possibly additional manufacturing space in the future. In June 2006, we leased a third building located several miles from our manufacturing facility, consisting of 66,000 square feet on approximately 7.3 acres. We purchased this building in October 2009 for approximately $3.8 million, plus the cost of fit out of approximately $2.0 million. A significant portion of the purchase price and fit out costs were financed through a series of loans with Wells Fargo N.A. bank and a Pennsylvania state run development agency. These loans could not be put in place until all construction had been completed and a proper certificate of occupancy had been obtained, due to a requirement by the state run development agency. Construction was substantially complete by June 30, 2010 and the configuration of the warehouse was substantially completed by September 2010. A certificate of occupancy was obtained in September 2010. The series of financings were completed and funded as of May 31, 2011. This new facility is being used for certain administrative functions, warehouse space, shipping and possibly additional manufacturing space in the future.
The manufacturing facility of our wholly-owned subsidiary, Cody Labs, consists of an approximately 73,000 square foot structure located on approximately 15 acres in Cody, Wyoming. Cody Labs leases the facility from Cody LCI Realty, LLC, Wyoming, which is 50% owned by us and 50% by an officer of Cody Labs and his former spouse. Cody Labs' manufacturing facility currently has capacity for further expansion, both inside the existing structure, as well as by building outside the current structure.
We have adopted many new aspects in support of regulations relating to cGMPs in the last several years, and we believe we are operating our facilities in material compliance with the FDA's cGMP regulations. In designing our facilities, full attention was given to material flow, equipment and automation, quality control and inspection. A granulator, an automatic film coating machine, high-speed tablet presses, blenders, encapsulators, fluid bed dryers, high shear mixers and high-speed bottle filling are a few examples of the sophisticated product development, manufacturing and packaging equipment we use. In addition, our Quality Control laboratory facilities are equipped with high precision instruments, such as automated high-pressure liquid chromatographs, gas chromatographs, robots and laser particle size analyzers.
We continue to pursue our comprehensive plan entitled Quality by Design for improving and maintaining quality control and quality assurance programs for our pharmaceutical development and manufacturing facilities. The FDA periodically inspects our production facilities to determine our compliance with the FDA's manufacturing standards. Typically, after completing its inspection, the FDA will issue us a report, entitled a Form 483, containing observations of any possible violations of cGMPs. The FDA's observations may be minor or severe in nature and the degree of severity is generally determined by the time necessary to remediate the cGMP violation, any consequences to the consumer of the products, and whether the observation is subject to a Warning Letter from the FDA. By strictly complying with cGMPs and the various FDA guidelines, and Good Laboratory Practices ("GLPs"), as well as adherence to our Standard Operating Procedures, we have successfully minimized the number of observations in our FDA inspections in recent years.
6
Table of Contents
Research and Development Process
Over the past several years, we have heavily invested our resources to R&D projects, including new generic product offerings. The costs of these R&D efforts are expensed during the periods incurred. We believe that such costs may be recovered in future years when we receive marketing approval from the FDA to distribute such products. In addition to using cash generated from our operations, we have entered into financing agreements with third parties to provide additional cash when needed. These financing agreements are more fully described in the section entitled " Liquidity and Capital Resources " in Item 7 of this Form 10-K. We have embarked on a plan to grow in future years. In addition to organic growth to be achieved through our own R&D efforts, our Specialty Pharma unit also initiated marketing projects with other companies in order to expand future revenue. We expect that our growing list of generic products under development will drive future growth. Over the past several years, we have hired additional personnel in product development, production, formulation and the R&D laboratory. We also intend to use our R&D infrastructure to continually devote resources to additional R&D projects. The following steps outline the numerous stages in the generic drug development process:
1.) Formulation and Analytical Method Development . After a drug candidate is selected for future sale, product development scientists perform various experiments on the incorporation of active ingredients into a dosage form. These experiments will result in the creation of a number of product formulations to determine which formula will be most suitable for our subsequent development process. Various formulations are tested in the laboratory to measure results against the innovator drug. During this time, we may use reverse engineering methods on samples of the innovator drug to determine the type and quantity of inactive ingredients. During the formulation phase, our R&D chemists begin to develop an analytical, laboratory testing method. The successful development of this test method will allow us to test developmental and commercial batches of the product in the future. All of the information used in the final formulation, including the analytical test methods adopted for the generic drug candidate, will be included as part of the Chemistry, Manufacturing and Controls section of the ANDA submitted to the FDA in the generic drug application.
2.) Scale-up . After the product development scientists and the R&D chemists agree on a final formulation to use in moving the drug candidate forward in the developmental process, we will attempt to increase the batch size of the product. The batch size represents the standard magnitude to be used in manufacturing a batch of the product. The determination of batch size will affect the amount of raw material that is input into the manufacturing process and the number of expected dosages to be created during the production cycle. We attempt to determine batch size based on the amount of active ingredient in each dosage, the available production equipment and unit sales projections. The scaled-up batch is then generally produced in our commercial manufacturing facilities. During this manufacturing process, we will document the equipment used, the amount of time in each major processing step and any other steps needed to consistently produce a batch of that product. This information, generally referred to as the validated manufacturing process, will be included in our ANDA submitted to the FDA.
3.) Clinical testing . After a successful scale-up of the generic drug batch, we schedule and perform bioequivalency and in some cases clinical testing procedures on the product if required by the FDA. These procedures, which are generally outsourced to third parties, include testing the absorption of the generic product in the human bloodstream compared to the absorption of the innovator drug. The results of this testing are then documented and reported to us to determine the "success" of the generic drug product. Success, in this context, means that we are able to demonstrate that our product is comparable to the innovator product in dosage form, strength, route of administration, quality, performance characteristics and intended use. Since bioequivalence (meaning that the product performs in the same manner and in the same amount of time as the innovator drug) and a stable formula are the primary requirements for a generic drug approval (assuming the manufacturing plant is in compliance with the FDA's cGMPs), lengthy and costly clinical trials proving safety and efficacy, which are required by the FDA for innovator drug approvals, are typically unnecessary for generic companies. If the results are successful, we will continue the collection of documentation and information for assembly of the drug application.
4.) Submission of the ANDA for FDA review and approval . The ANDA process became formalized under The Drug Price Competition and Patent Term Restoration Act of 1984, also known as the Hatch-Waxman Act ("Hatch-Waxman Act"). The Hatch-Waxman Act amended the Federal Food, Drug and Cosmetic Act ("FDCA") to permit the FDA to review and approve an ANDA for a generic copy of a drug product, which previously received FDA approval through its new drug approval process, without having the generic drug company conduct costly clinical trials. An ANDA is a comprehensive submission that contains, among other things, data and information pertaining to the active pharmaceutical ingredient, drug product formulation, specifications and stability of the generic drug, as well as analytical methods, manufacturing process validation data, and quality control procedures.
According to information obtained from the FDA, the current FDA average review time for ANDAs exceeds 26 months. While we have received approval for some of our ANDAs in 14 months, we have also waited longer than 36 months before receiving approval.
7
Table of Contents
Subsequently, the FDA advised that electronic submissions of applications may shorten the approval process. We currently file our ANDAs and NDAs electronically. ANDAs and NDAs submitted for our products may not receive FDA approval on a timely basis, if at all.
When a generic drug company files an ANDA with the FDA, it must certify that no patents are listed in the Orange Book, the FDA's reference listing of approved drugs and listed patents. An ANDA filer must certify, with respect to each application whether the filer is challenging a patent, either (i) that no patent was filed for the listed drug (a "paragraph I" certification), (ii) that the patent has expired (a "paragraph II" certification), (iii) that the patent will expire on a specified date and the ANDA filer will not market the drug until that date (a "paragraph III" certification), or (iv) that the patent is invalid or would not be infringed by the manufacture, use, or sale of the new drug (a "paragraph IV" certification). A paragraph IV certification must be provided to each owner of the patent that is the subject of the certification and to the holder of the approved ANDA to which the ANDA refers. A paragraph IV certification can trigger an automatic 30 month stay of the ANDA if the innovator company files a claim which would delay the approval of the generic company's ANDA. Currently, we have filed no paragraph IV certifications with our ANDAs.
Sales and Customer Relationships
We sell our pharmaceutical products to generic pharmaceutical distributors, drug wholesalers, chain drug retailers, private label distributors, mail-order pharmacies, other pharmaceutical manufacturers, managed care organizations, hospital buying groups, governmental entities and health maintenance organizations. We promote our products through direct sales, trade shows, trade publications and bids.
We continue to expand our sales to major chain drug stores. Our policies of maintaining an adequate inventory, employing a responsive order filling system and prioritizing timely fulfillment of those orders have contributed to a strong reputation among our customers as a dependable supplier of high quality generic pharmaceuticals. In addition, our subsidiary Cody Labs sells APIs to dosage form manufacturers.
Some of our new generic products were developed and are manufactured by us while other products were developed and manufactured by other companies. The products currently manufactured by us and those manufactured by others are identified in the section entitled " Current Products " in Item 1 of this Form 10-K.
Management
We have been focused on increasing the size and quality of our management team in anticipation of continuing our growth. We have hired experienced personnel from large, established, brand pharmaceutical companies as well as competing generic companies to complement the skills and knowledge of the existing management team. As we continue to grow, additional personnel may need to be added to our management team. We intend to hire the best people available to expand the knowledge base and expertise within our personnel ranks.
Current Products
As of the date of this filing, we manufactured and/or distributed the following products:
Name of Product |
| Medical Indication |
| Equivalent Brand | ||
1 |
| Acetazolamide Tablets |
| Glaucoma |
| Diamox® |
2 |
| Amantadine SoftGel Capsules |
| Parkinson's Disease |
| Symmetrel ® |
3 |
| Bethanechol Chloride Tablets |
| Urinary Retention |
| Urecholine® |
4 |
| Butalbital, Aspirin and Caffeine Capsules |
| Migraine Headache |
| Fiorinal® |
5 |
| Butalbital, Aspirin, Caffeine with Codeine Phosphate Capsules |
| Migraine Headache |
| Fiorinal w/ Codeine #3® |
6 |
| Clindamycin HCl Capsules |
| Antibiotic |
| Cleocin® |
7 |
| C-Topical ™ Solution |
| Anesthetic |
| N/A |
8 |
| Codeine Sulfate Tablets |
| Pain Management |
| N/A |
9 |
| Danazol Capsules |
| Endometriosis |
| Danocrine® |
10 |
| Dicyclomine Tablets |
| Irritable Bowels |
| Bentyl® |
11 |
| Dicyclomine Capsules |
| Irritable Bowels |
| Bentyl® |
12 |
| Digoxin Tablets |
| Congestive Heart Failure |
| Lanoxin® |
13 |
| Dipyridamole Tablets |
| Anticoagulant |
| Persantine ® |
14 |
| Doxycycline Tablets |
| Antibiotic |
| Adoxa® |
15 |
| Doxycycline Hyclate Tablets |
| Antibiotic |
| Periostat® |
8
Table of Contents
16 |
| Fluphenazine Tablets |
| Antipsychotic |
| Prolixin® |
17 |
| Hydrochlorothiazide Tablet |
| Diuretic |
| Hydrodiuril® |
18 |
| Hydromorphone HCl Tablets |
| Pain Management |
| Dilaudid® |
19 |
| Levothyroxine Sodium Tablets |
| Thyroid Deficiency |
| Levoxyl®/ Synthroid® |
20 |
| Morphine Sulfate Oral Solution |
| Pain Management |
| Roxanol® |
21 |
| Oxycodone HCl Oral Solution |
| Pain Management |
| Roxicodone® |
22 |
| Phentermine HCl Tablets |
| Obesity |
| Adipex-P® |
23 |
| Phentermine HCl Capsules |
| Obesity |
| Fastin® |
24 |
| Pilocarpine HCl Tablets |
| Dryness of the Mouth |
| Salagen® |
25 |
| Primidone Tablets |
| Epilepsy |
| Mysoline® |
26 |
| Probenecid Tablets |
| Gout |
| Benemid® |
27 |
| Rifampin Capsules |
| Antibiotic |
| Rifadin® |
28 |
| Terbutaline Sulfate Tablets |
| Bronchospasms |
| Brethine® |
29 |
| Unithroid® Tablet |
| Thyroid Deficiency |
| N/A |
30 |
| Ursodiol Capsules |
| Gallstone |
| Actigall ® |
Unlike the branded, innovator companies, we do not develop new molecules. However, we have filed and received two patents for APIs at our Cody, Wyoming manufacturing facility, with an additional patent pending.
In fiscal years 2011 and 2010, we received two and three ANDA approvals from the FDA, respectively. The following summary contains more specific details regarding our latest ANDA approvals. Market data is obtained from Wolters Kluwer.
In December 2009, we received a letter from the FDA with approval to market and launch Hydromorphone Hydrochloride Tablets USP, 2 mg, 4 mg and 8 mg, the generic equivalent of Purdue Pharmaceuticals' (formerly Abbott's) Dilaudid® Tablets 2 mg, 4 mg and 8 mg. According to Wolters Kluwer, U.S. sales in 2008 of both generic and brand Hydromorphone Hcl Tablets, 2 mg, 4 mg and 8 mg were $170 million at Average Wholesale Price. Hydromorphone Hcl tablets are indicated for the management of pain in patients where an opioid analgesic is appropriate.
In April 2010, we received a letter from the FDA with approval to market and launch Ondansetron Injection USP, 2 mg/mL, Multi-Dose Vials. Ondansetron Injection USP, 2 mg/mL is the generic equivalent of GlaxoSmithKline's Zofran® Injection, 2 mg/mL. Ondansetron Injection, USP 2 mg/mL is indicated for the prevention of postoperative nausea and vomiting and for the prevention of chemotherapy-induced nausea and vomiting. For the 12 months ended December 2009 U.S. sales of Ondansetron Injection USP, 2 mg/mL, were approximately $58 million at Average Wholesale Price (AWP). A launch date for the product has not yet been set.
In July 2010, we received a letter from the FDA with approval to market and launch Phentermine Hydrochloride Blue/White Seed Capsules USP, 30 mg, the generic equivalent of Sandoz, Inc.'s Reference Listed Drug (RLD) Phentermine Hcl Capsules USP, 30 mg. According to Wolters Kluwer, U.S. sales of Phentermine Hcl Capsules USP, 30 mg in 2009 were approximately $36.5 million at Average Wholesale Price (AWP). This does not include sales of Phentermine made directly to consumers through clinics. Phentermine Hcl is indicated as a short-term adjunct in a regimen of weight reduction based on exercise, behavioral modification and caloric restriction in the management of exogenous obesity for patients with an initial body mass index > 30 kg/m2, or > 27 kg/m2 in the presence of other risk factors (e.g., hypertension, diabetes, and hyperlipidemia).
In August 2010, we received a letter from the FDA with approval to market and launch Ondansetron Injection USP, 2 mg/mL, Single-Dose Vials. Ondansetron Injection USP, 2 mg/mL is the generic version of GlaxoSmithKline's Zofran Injection, 2 mg/mL. Ondansetron Injection, USP 2 mg/mL is indicated for the prevention of postoperative nausea and vomiting and for the prevention of chemotherapy-induced nausea and vomiting. For the 12 months ended December 2009, Ondansetron Injection USP, 2 mg/mL had U.S. sales of approximately $58 million at Average Wholesale Price. A launch date for the product has not been set.
We have additional products currently under development. These products are either orally administered, solid-dosage products (i.e. tablet/capsule) or oral solutions, topicals or parentarels designed to be generic equivalents to brand named innovator drugs. Our developmental drug products are intended to treat a diverse range of indications. The products under development are at various stages in the development cycle-formulation, scale-up, clinical testing and FDA review.
The cost associated with each product that we are currently developing is dependent on numerous factors, including but not limited to, the complexity of the active ingredient's chemical characteristics, the price of the raw materials and the FDA-mandated requirement of bioequivalence studies (depending on the FDA's Orange Book classification). The estimated cost to develop a new generic product ranges from approximately $100,000 to $1.7 million.
9
Table of Contents
In addition, we currently own several ANDAs that are dormant for products which we currently do not manufacture and market. Occasionally, we review such ANDAs to determine if the market potential for any of these older drugs has recently changed to make it attractive for us to reconsider manufacturing and selling. If we decide to introduce one of these products into the consumer market, we must review the original ANDA and related documentation to ensure that the approved product specifications, formulation and other factors meet current FDA requirements for the marketing of the applicable drug. Generally, in these situations, we file a supplement to the FDA for the applicable ANDA, informing the FDA of any significant changes in the manufacturing process, the formulation, the raw material supplier or another major feature of the previously approved ANDA. We would then redevelop the product and submit it to the FDA for supplemental approval. The FDA's approval process for an ANDA supplement is similar to that of a new ANDA.
In addition to the efforts of our internal product development group, we have contracted with several outside firms for the formulation and development of several new generic drug products. These outsourced R&D products are at various stages in the development cycle-formulation, analytical method development and testing and manufacturing scale-up. These products include orally administered solid dosage products, injectables and nasal delivery products that are intended to treat a diverse range of medical indications. We intend to ultimately transfer the formulation technology and manufacturing process for some of these R&D products to our own commercial manufacturing sites. We initiated these outsourced R&D efforts to complement the progress of our own internal R&D efforts.
The majority of our R&D projects are being developed in-house under our direct supervision and with our own personnel. Accordingly, we do not believe that our outside contracts for product development or manufacturing supply are material in nature, nor are we substantially dependent on the services rendered by such outside firms. Since we have no control over the FDA review process, our management is unable to anticipate whether or when it will be able to begin producing and shipping such additional products.
The following table summarizes key information related to our R&D products. The column headings are defined as follows:
1.) Stage of R&D - defines the current stage of the R&D product in the development process, as of the date of this Form 10-K.
2.) Regulatory Requirement - defines whether the R&D product is or is expected to be a new ANDA submission, an ANDA supplement, or a grand-fathered product not requiring specific FDA approval.
3.) Number of Products - defines the number of products in R&D at the stage noted. In this context, a product means any finished dosage form, including all potencies, containing the same API or combination of APIs and which represents a generic version of the same Reference Listed Drug ("RLD") or innovator drug, identified in the FDA's Orange Book.
Stage of R&D |
| Regulatory Requirement |
| Number of Products |
|
FDA Review |
| ANDA |
| 16 |
|
FDA Review |
| ANDA supplement |
| 2 |
|
Clinical Testing |
| ANDA |
| 4 |
|
Scale-Up |
| ANDA |
| 20 |
|
Scale-Up |
| ANDA supplement |
| 2 |
|
Formulation/Method Development |
| ANDA |
| 16 |
|
We incurred R&D expenses of approximately $8,587,000 in fiscal year 2011, $11,251,000 in fiscal year 2010, and $8,427,000 in fiscal year 2009. The R&D spending includes spending on bioequivalence studies, internal development resources as well as outsourced development. While we manage all R&D from our principal executive office in Philadelphia, we have also been taking advantage of favorable development costs in other countries. We have strategic partnerships with various companies that either act as contract research organizations or API suppliers as well as dosage form manufacturers. In addition, U.S.-based research organizations have been engaged for product development to enhance our internal development. Fixed payment arrangements are established with Lannett and these development partners, and can range up to almost $900,000 to develop a drug, and in some cases include a royalty provision. Development payments are normally scheduled in advance, based on attaining development milestones.
Raw Materials and Finished Goods Inventory Suppliers
Our use of raw materials in the production process consists of using pharmaceutical chemicals in various forms that are generally available from several sources. FDA approval is required in connection with the process of using most active ingredient suppliers. In addition to the raw materials we purchase for the production process, we purchase certain finished dosage inventories, including capsule, tablet and oral liquid products. We sell these finished dosage products directly to our customers along with the finished
10
Table of Contents
dosage products manufactured in-house. If suppliers of a certain material or finished product are limited, we will generally take certain precautionary steps to avoid a disruption in supply, such as finding a secondary supplier or ordering larger quantities.
Our primary finished product inventory supplier is JSP in Bohemia, New York. Purchases of finished goods inventory from JSP accounted for approximately 64% of our inventory purchases in fiscal year 2011, 77% in fiscal year 2010 and 71% in fiscal year 2009. On March 23, 2004, we entered into the JSP Distribution Agreement for the exclusive distribution rights in the United States to the current line of JSP products in exchange for four million (4,000,000) shares of our common stock. The products covered under the JSP Distribution Agreement include Butalbital, Aspirin, Caffeine with Codeine Phosphate Capsules, Digoxin Tablets and Levo Tablets, sold generically and under the brand name Unithroid ® . The initial term of the JSP Distribution Agreement is ten years, beginning on March 23, 2004 and continuing through March 22, 2014. See note 18 to our consolidated financial statements for more information on the terms, conditions and financial impact of the JSP Distribution Agreement.
During the term of the JSP Distribution Agreement, we are required to use commercially reasonable efforts to purchase minimum dollar quantities of JSP's products that we distribute. The minimum quantity to be purchased in the first year of the JSP Distribution Agreement was $15 million. Thereafter, the minimum purchase quantity increases by $1 million per year up to $24 million for the last year of the JSP Distribution Agreement. We have met each applicable minimum purchase requirement to date, but there is no guarantee that we will be able to continue to do so in the future. If we do not meet the minimum purchase requirements, JSP's sole remedy is to terminate the JSP Distribution Agreement.
We have entered into definitive supply and development agreements with certain international companies, including Wintac of India, Orion Pharma of Finland, Azad Pharma AG, Swiss Caps of Switzerland and Pharma 2B (formerly Pharmaseed) and The GC Group of Israel, as well as certain domestic companies, including JSP, Banner Pharmacaps, Cerovene, and Summit Bioscience LLC. We are currently in negotiations on similar agreements with other international companies, through which we will market and distribute future products manufactured in-house or by third parties. We intend to capitalize on our strong customer relationships to build our market share for such products, and increase future revenues and income.
Customers and Marketing
We sell our products primarily to wholesale distributors, generic drug distributors, mail-order pharmacies, group purchasing organizations, chain drug stores and other pharmaceutical companies. The pharmaceutical industry's largest wholesale distributors, McKesson, Cardinal Health and Amerisource Bergen, accounted for 9%, 6%, and 10%, respectively, of our net sales in fiscal year 2011 and 9%, 7% and 11%, respectively, of our net sales in fiscal year 2010. Our largest chain drug store customer, Walgreens, accounted for 17% and 26% of net sales in fiscal year 2011 and fiscal year 2010, respectively. We perform ongoing credit evaluations of our customers' financial condition, and have experienced no significant collection problems to date. Generally, we require no collateral from our customers.
Sales to wholesale customers include "indirect sales," which represent sales to third-party entities, such as independent pharmacies, managed care organizations, hospitals, nursing homes, and group purchasing organizations, collectively referred to as "indirect customers." We enter into definitive agreements with our indirect customers to establish pricing for certain covered products. Under such agreements, the indirect customers independently select a wholesaler from which to purchase the products at these agreed-upon prices. We will provide credit to the wholesaler for the difference between the agreed-upon price with the indirect customer and the wholesaler's invoice price. This credit is called a "chargeback." For more information on chargebacks, see the section entitled "Chargebacks" in Item 7, "Management's Discussion and Analysis of Financial Condition and Results of Operations" of this Form 10-K. These indirect sale transactions are recorded on our books as sales to the wholesale customers.
We believe that retail-level consumer demand dictates the total volume of sales for various products. In the event that wholesale and retail customers adjust their purchasing volumes, we believe that consumer demand will be fulfilled by other wholesale or retail sources of supply. As a result, we attempt to develop and maintain strong relationships with most of the major retail chains, wholesale distributors and mail-order pharmacies in order to facilitate the supply of our products through whatever channel the consumer prefers. Although we have agreements with customers governing the transaction terms of our sales, there are no minimum purchase quantities applicable to these agreements.
We promote our products through direct sales, trade shows and bids. We also market our products through private label arrangements, under which we manufacture our products with a label containing the name and logo of a customer. This practice is commonly referred to as "private label business." Private label business allows us to leverage our internal sales efforts by using the marketing services from other well-respected pharmaceutical dosage suppliers. The focus of our sales efforts is the relationships we create with our customer accounts. Strong and dependable customer relationships have created a positive platform for us to increase our sales volumes. Advertising in the generic pharmaceutical industry is generally limited to trade publications, read by retail pharmacists, wholesale purchasing agents and other pharmaceutical decision-makers. Historically and in fiscal years 2011, 2010 and 2009, our
11
Table of Contents
advertising expenses were immaterial. When our sales representatives make contact with a customer, we will generally offer to supply the customer our products at fixed prices. If accepted, the customer's purchasing department will coordinate the purchase, receipt and distribution of the products throughout its distribution centers and retail outlets. Once a customer accepts our supply of a product, the customer typically expects a high standard of service, including timely receipt of products ordered, availability of convenient, user-friendly and effective customer service functions and maintaining open lines of communication.
Competition
The manufacturing and distribution of generic pharmaceutical products is a highly competitive industry. Competition is based primarily on price, service and quality. Our competitive advantage is based on our ability to provide strong and dependable customer service by maintaining adequate inventory levels, employing a responsive order filling system and prioritizing timely fulfillment of those orders. We ensure that our products are available from national suppliers as well as our own warehouse. The modernization of our facilities, hiring of experienced staff and implementation of inventory and quality control programs have improved our competitive cost position over the past five years.
We compete with other manufacturers and marketers of generic and brand drugs. Each product manufactured and/or sold by us has a different set of competitors. The list below identifies the companies with which we primarily compete with respect to each of our major products.
Product |
| Primary Competitors |
|
|
|
Butalbital with Aspirin and Caffeine, with and without Codeine Phosphate Capsules |
| Watson and Breckenridge |
|
|
|
C_Topical™ Solution |
| None |
|
|
|
Digoxin Tablets |
| GlaxoSmithKline, Impax, and Westward |
|
|
|
Doxycycline Hyclate and Monohydrate Tablets |
| Par, Mylan, Sandoz and Ranbaxy |
|
|
|
Hydromorphone HCl Tablets |
| Mallinckrodt, Roxane and Purdue |
|
|
|
Levothyroxine Sodium Tablets |
| Abbott, Monarch, Mylan, Sandoz and Forest |
|
|
|
Morphine Sulfate Liquid Oral Solution |
| Roxane |
|
|
|
Primidone Tablets |
| Watson, Qualitest, URL, Westward, Amneal and Impax |
|
|
|
Rifampin Capsules |
| Sandoz and Versapharm |
|
|
|
Unithroid® Tablets |
| Abbott, Monarch, Mylan and Sandoz |
|
|
|
Ursodiol Capsules |
| Corepharma, Epic, Mylan, Teva and Watson |
Government Regulation
Pharmaceutical manufacturers are subject to extensive regulation by the federal government, principally by the FDA, and, in cases of controlled drugs the DEA, and to a lesser extent by other federal regulatory bodies and state governments. The FDCA, the Controlled Substance Act (the "CSA") and other federal statutes and regulations govern or influence the testing, manufacture, safety, labeling, storage, record keeping, approval, pricing, advertising, and promotion of our generic drug products. Noncompliance with applicable regulations can result in fines, recall and seizure of products, total or partial suspension of production, personal and/or corporate prosecution and debarment, and refusal of the government to approve new drug applications. The FDA also has the authority to revoke previously approved drug products.
Generally, FDA approval is required before a prescription drug can be marketed. A new drug is one not generally recognized by qualified experts as safe and effective for its intended use. New drugs are typically developed and submitted to the FDA by companies expecting to brand the product and sell it as a medical treatment. The FDA review process for new drugs is very extensive and requires a substantial investment to research and test the drug candidate. However, less burdensome approval procedures may be used for generic equivalents. Typically, the investment required to develop a generic drug is less costly than the brand innovator drug.
12
Table of Contents
There are currently three ways to obtain FDA approval of a drug:
· New Drug Applications (NDA) : Unless one of the two procedures discussed in the following paragraphs is available, a manufacturer must conduct and submit to the FDA complete clinical studies to establish a drug's safety and efficacy. The new drug approval process generally involves:
· completion of preclinical laboratory and animal testing in compliance with the FDA's GLP regulations;
· submission to the FDA of an Investigational New Drug ("IND") application for human clinical testing, which must become effective before human clinical trials may begin;
· performance of adequate and well-controlled human clinical trials to establish the safety and efficacy of the proposed drug product for each intended use;
· satisfactory completion of an FDA pre-approval inspection of the facility or facilities at which the product is produced to assess compliance with the FDA's cGMP regulations; and
· submission to and approval by the FDA of an NDA.
The results of preclinical tests, together with manufacturing information and analytical data, are submitted to the FDA as part of an IND, which must become effective before human clinical trials may begin. Further, each clinical trial must be reviewed and approved by an independent Institutional Review Board. Human clinical trials are typically conducted in three sequential phases that may overlap. These phases generally include:
· Phase I, during which the drug is introduced into healthy human subjects or, on occasion, patients and is tested for safety, stability, dose tolerance, and metabolism;
· Phase II, during which the drug is introduced into a limited patient population to determine the efficacy of the product in specific targeted indications, to determine dosage tolerance and optimal dosage, and to identify possible adverse effects and safety risks; and
· Phase III, during which the clinical trial is expanded to a larger and more diverse patient group at geographically dispersed clinical trial sites to further evaluate clinical efficacy, optimal dosage, and safety.
The drug sponsor, the FDA, or the independent Institutional Review Board at each institution at which a clinical trial is being performed may suspend a clinical trial at any time for various reasons, including a belief that the subjects are being exposed to an unacceptable health risk.
The results of preclinical animal studies and human clinical studies, together with other detailed information, are submitted to the FDA as part of the NDA. The NDA also must contain extensive manufacturing information. The FDA may approve or disapprove the NDA if applicable FDA regulatory criteria are not satisfied or it may require additional clinical data. Once approved, the FDA may withdraw the product approval if compliance with pre- and post-market regulatory standards is not maintained or if problems occur or are identified after the product reaches the marketplace. In addition, the FDA may require post-marketing studies to monitor the effect of approved products and may limit further marketing of the product based on the results of these post-marketing studies. The FDA has broad post-market regulatory and enforcement powers, including the ability to levy fines and civil penalties, suspend or delay issuance of approvals, seize or recall products, and withdraw approvals.
Satisfaction of FDA new drug approval requirements typically takes several years, and the actual time required may vary substantially based upon the type, complexity, and novelty of the product or disease. Government regulation may delay or prevent marketing of potential products for a considerable period of time and impose costly procedures upon a manufacturer's activities. Success in early stage clinical trials does not assure success in later stage clinical trials. Data obtained from clinical activities is not always conclusive and may be subject to varying interpretations that could delay, limit, or prevent regulatory approval. Even if a product receives regulatory approval, later discovery of previously unknown problems with a product may result in restrictions on the product or even complete withdrawal of the product from the market.
· Abbreviated New Drug Applications (ANDA) : An ANDA is similar to an NDA except that the FDA generally waives the requirement of complete clinical studies of safety and efficacy. However, it may require bioavailability and bioequivalence studies. Bioavailability indicates the rate of absorption and levels of concentration of a drug in the bloodstream needed to
13
Table of Contents
produce a therapeutic effect. Bioequivalence compares one drug product with another and indicates if the rate of absorption and the levels of concentration of a generic drug in the body are within prescribed statistical limits to those of a previously approved drug. Under the Hatch-Waxman Act, an ANDA may be submitted for a drug on the basis that it is the equivalent of an approved drug regardless of when such other drug was approved. The FDA will approve the generic product as suitable for an ANDA application if it finds that the generic product does not raise new questions of safety and effectiveness as compared to the innovator product. A product is not eligible for ANDA approval if the FDA determines that it is not equivalent to the referenced innovator drug, if it is intended for a different use, or if it is not subject to an approved Suitability Petition. However, such a product might be approved under an NDA, with supportive data from clinical trials.
In addition to establishing a new ANDA procedure, the Hatch-Waxman Act created statutory protections for approved brand name drugs. Under the Hatch-Waxman Act, an ANDA for a generic drug may not be made effective until all relevant product and use patents for the brand name drug have expired or have been determined to be invalid. Prior to this act, the FDA gave no consideration to the patent status of a previously approved drug. Upon NDA approval, the FDA lists in its Orange Book the approved drug product and any patents identified by the NDA applicant that relate to the drug product. Any applicant who files an ANDA seeking approval of a generic equivalent version of a drug listed in the FDA's Orange Book before expiration of the referenced patent(s), must certify to the FDA that (1) no patent information on the drug product that is the subject of the ANDA has been submitted to the FDA; (2) such patent has expired; (3) the date on which such patent expires; or (4) such patent is invalid or will not be infringed upon by the manufacture, use, or sale of the drug product for which the ANDA is submitted. This last certification is known as a Paragraph IV certification. A notice of the Paragraph IV certification must be provided to each owner of the patent that is the subject of the certification and to the holder of the approved NDA to which the ANDA refers. Before the enactment of the Medicare Prescription Drug Improvement and Modernization Act of 2003 (the "MMA"), which amended the Hatch-Waxman Act, if the NDA holder or patent owner(s) asserted a patent challenge within 45 days of its receipt of the certification notice, the FDA was prevented from approving that ANDA until the earlier of 30 months from the receipt of the notice of the paragraph IV certification, the expiration of the patent, when the infringement case concerning each such patent was favorably decided in an ANDA applicant's favor, or such shorter or longer period as may be ordered by a court. This prohibition is generally referred to as the 30-month stay. In some cases, NDA owners and patent holders have obtained additional patents for their products after an ANDA had been filed but before that ANDA received final marketing approval, and then initiated a new patent challenge, which resulted in more than one 30-month stay.
The MMA amended the Hatch-Waxman Act to eliminate certain unfair advantages of patent holders in the implementation of the Hatch-Waxman Act. As a result, the NDA owner remains entitled to an automatic 30-month stay if it initiates a patent infringement lawsuit within 45 days of its receipt of notice of a paragraph IV certification, but only if the patent infringement lawsuit is directed to patents that were listed in the FDA's Orange Book before the ANDA was filed. An ANDA applicant is now permitted to take legal action to enjoin or prohibit the listing of certain of these patents as a counterclaim in response to a claim by the NDA owner that its patent covers its approved drug product.
If an ANDA applicant is the first-to-file a substantially complete ANDA with a paragraph IV certification and provides appropriate notice to the FDA, the NDA holder, and all patent owner(s) for a particular generic product, the applicant may be awarded a 180-day period of marketing exclusivity against other companies that subsequently file ANDAs for that same product. A substantially complete ANDA is one that contains all the information required by the Hatch-Waxman Act and the FDA's regulations, including the results of any required bioequivalence studies. The FDA may refuse to accept the filing of an ANDA that is not substantially complete or may determine during substantive review of the ANDA that additional information, such as an additional bioequivalence study, is required to support approval. Such a determination may affect an applicant's first to file status and eligibility for a 180-day period of marketing exclusivity for the generic product. The MMA also modified the rules governing when the 180-day marketing exclusivity period is triggered or forfeited and shared exclusivity. Prior to the legislation, the 180-day marketing exclusivity period was triggered upon the first commercial marketing of the ANDA or a court decision holding the patent invalid, unenforceable, or not infringed. For ANDAs accepted for filing before March 2000, that court decision had to be final and non-appealable (other than a petition to the U.S. Supreme Court for a writ of certiorari). In March 2000, the FDA changed its position in response to two court cases that challenged the FDA's original interpretation of what constituted a court decision under the Hatch-Waxman Act. Under the changed policy, the 180-day marketing exclusivity period began running immediately upon a district court decision holding the patent at issue invalid, unenforceable, or not infringed, regardless of whether the ANDA had been approved and the generic product had been marketed. In codifying the FDA's original policy, the MMA retroactively applies a final and non-appealable court decision trigger for all ANDAs filed before December 8, 2003 leaving intact the first commercial marketing trigger. As for ANDAs filed after December 8, 2003, the marketing exclusivity period is only triggered upon the first commercial marketing of the ANDA product, but that exclusivity may be forfeited under certain circumstances, including, if the ANDA is not marketed within 75 days after a final and non-appealable court decision by the first-to-file or other ANDA applicant, or if the FDA does not tentatively approve the first-to-file applicant's ANDA within 30 months.
14
Table of Contents
In addition to patent exclusivity, the holder of the NDA for the listed drug may be entitled to a period of non-patent market exclusivity, during which the FDA cannot approve an ANDA. If the listed drug is a new chemical entity, the FDA may not accept an ANDA for a bioequivalent product for up to five years following approval of the NDA for the new chemical entity. If the listed drug is not a new chemical entity but the holder of the NDA conducted clinical trials essential to approval of the NDA or a supplement thereto, the FDA may not approve an ANDA for a bioequivalent product before expiration of three years. Certain other periods of exclusivity may be available if the listed drug is indicated for treatment of a rare disease or is studied for pediatric indications.
· Section 505(b)(2) New Drug Applications: For a drug that is identical to a drug first approved after 1962, a prospective manufacturer need not go through the full NDA procedure. Instead, it may demonstrate safety and efficacy by relying on published literature and reports where at least some of information required for approval comes from studies not conducted by or for the applicant and for which the applicant has not obtained a right of reference. The Hatch-Waxman Act permits the applicant to rely upon certain preclinical or clinical studies conducted for an approved product. The manufacturer must also submit, if the FDA so requires, bioavailability or bioequivalence data illustrating that the generic drug formulation produces the same effects, within an acceptable range, as the previously approved innovator drug. Because published literature to support the safety and efficacy of post-1962 drugs may not be available, this procedure is of limited utility to generic drug manufacturers and the resulting approved product will not be interchangeable with the innovator drug as an ANDA drug would be unless bioeqivalency testing were undertaken and approved by FDA. Moreover, the utility of Section 505(b)(2) applications have with the exception of "Grandfathered drugs" been diminished by the availability of the ANDA process, as described above.
Additionally, certain products, marketed prior to the Federal Food, Drug and Cosmetic Act may be considered GRASE ("Generally Recognized As Safe and Effective") or Grandfathered. GRASE products are those "old drugs that do not require prior approval from FDA in order to be marketed because they are generally recognized as safe and effective based on published scientific literature." Similarly, Grandfathered products are those which "entered the market before the passage of the 1938 act or the 1962 amendments to the act." Under the grandfather clause, such a product is exempted from the "effectiveness requirements [of the act] if its composition and labeling have not changed since 1962 and if, on the day before the 1962 amendments became effective, it was (1) used or sold commercially in the United States, (2) not a new drug as defined by the act at that time, and (3) not covered by an effective application." Recently, the FDA has increased its efforts to force companies to file and seek FDA approval for these GRASE products. Efforts have included granting market exclusivity to approved GRASE products and issuing notices to companies currently producing these products. One such current FDA effort includes our currently marketed product, Morphine Sulfate Oral Solution. Please see additional discussion regarding our Morphine Sulfate Oral Solution product in Item 1A. Risk Factors, Item 3 Legal Proceedings and Item 7 Management's Discussion and Analysis of Financial Condition and Results of Operations.
Manufacturing cGMP Requirements
Among the requirements for new drug approval is the requirement that the prospective manufacturer's methods conform to the FDA's cGMP regulations to the satisfaction of the FDA pursuant to a pre-approval inspection before the facility may be used to manufacture the product. The cGMP regulations must be followed at all times during which the approved drug is manufactured and the manufacturing facilities are subject to periodic inspections by the FDA and other authorities, including procedures and operations used in the testing and manufacture of our products to assess our compliance with application regulations. FDA's cGMP regulations require among other things, quality control and quality assurance as well as the corresponding maintenance of records and documentation. In complying with the standards set forth in the cGMP regulations, we must continue to expend time, money, and effort in the areas of production and quality control to ensure full technical compliance. In March 2011, the FDA completed its inspection of the Company's manufacturing facilities in both Philadelphia and Cody, Wyoming. The inspections concluded with only minor observations, seven at the Philadelphia location and five at the Cody facility.
Failure to comply with statutory and regulatory requirements subjects a manufacturer to possible legal or regulatory action, including but not limited to, the seizure or recall of non-complying drug products injunctions, consent decrees placing significant restrictions on or suspending manufacturing operations, and/or civil and criminal penalties. Adverse experiences with the product must be reported to the FDA and could result in the imposition of market restriction through labeling changes or in product removal. Product approvals may be withdrawn if compliance with regulatory requirements is not maintained or if problems concerning safety or efficacy of the product occur following approval.
Other Regulatory Requirements
With respect to post-market product advertising and promotion, the FDA imposes a number of complex regulations on entities that advertise and promote pharmaceuticals, which include, among others, standards for direct-to-consumer advertising, off-label
15
Table of Contents
promotion, industry-sponsored scientific and educational activities, and promotional activities involving the internet. The FDA has very broad enforcement authority under the FDCA, and failure to abide by these regulations can result in penalties, including the issuance of a warning letter directing entities to correct deviations from FDA standards, a requirement that future advertising and promotional materials be pre-cleared by the FDA, and state and/or federal civil and criminal investigations and prosecutions.
We are also subject to various laws and regulations regarding laboratory practices, the experimental use of animals, and the use and disposal of hazardous or potentially hazardous substances in connection with our research. In each of these areas, as above, the FDA has broad regulatory and enforcement powers, including the ability to levy fines and civil penalties, suspend or delay issuance of approvals, seize or recall products, and withdraw approvals, any one or more of which could have a material adverse effect on us.
Outside of the United States, our ability to market a product is contingent upon receiving marketing authorization from the appropriate regulatory authorities. The requirements governing marketing authorization, pricing, and reimbursement vary widely from country to country. At present, foreign marketing authorizations are applied for at a national level, although within the European Union registration procedures are available to companies wishing to market a product in more than one European Union member state. The regulatory authority generally will grant marketing authorization if it is satisfied that we have presented it with adequate evidence of safety, quality and efficacy.
DEA Regulation
We maintain registrations with the DEA that enable us to receive, manufacture, store, and distribute controlled substances in connection with our operations. Controlled substances are those drugs that appear on one of five schedules promulgated and administered by the DEA under the CSA. The CSA governs, among other things, the distribution, recordkeeping, handling, security, and disposal of controlled substances. We are subject to periodic and ongoing inspections by the DEA and similar state drug enforcement authorities to assess our ongoing compliance with DEA's regulations. Any failure to comply with these regulations could lead to a variety of sanctions, including the revocation or a denial of renewal of our DEA registration, injunctions, or civil or criminal penalties.
Fraud and Abuse Laws
Because of the significant federal funding involved in Medicare and Medicaid, Congress and the states have enacted, and actively enforce, a number of laws whose purpose is to eliminate fraud and abuse in federal health care programs. Our business is subject to compliance with these laws.
Anti-Kickback Statutes and Federal False Claims Act
The federal health care programs' Anti-Kickback Statute prohibits persons from knowingly and willfully soliciting, offering, receiving, or providing remuneration, directly or indirectly, in exchange for or to induce either the referral of an individual, or the furnishing or arranging for a good or service, for which payment may be made under a federal health care program such as Medicare or Medicaid. The definition of "remuneration" has been broadly interpreted to include anything of value, including for example gifts, certain discounts, the furnishing of free supplies, equipment or services, credit arrangements, payment of cash and waivers of payments. Several courts have interpreted the statute's intent requirement to mean that if any one purpose of an arrangement involving remuneration is to induce referrals of federal health care covered business, the statute has been violated. Penalties for violations include criminal penalties and civil sanctions such as fines, imprisonment, and possible exclusion from Medicare, Medicaid, and other federal health care programs. In addition some kickback allegations have been claimed to violate the Federal False Claims Act, discussed in more detail below.
The Anti-Kickback Statute is broad and prohibits many arrangements and practices that are lawful in businesses outside of the health care industry. Recognizing that the Anti-Kickback Statute is broad and may technically prohibit many innocuous or beneficial arrangements, Congress authorized the Office of Inspector General of the U.S. Department of Health and Human Services ("OIG") to issue a series of regulations, known as "safe harbors." These safe harbors, issued by the OIG beginning in July 1991, set forth provisions that, if all their applicable requirements are met, will assure health care providers and other parties that they will not be prosecuted under the Anti-Kickback Statute. The failure of a transaction or arrangement to fit precisely within one or more safe harbors does not necessarily mean that it is illegal or that prosecution will be pursued. However, conduct and business arrangements that do not fully satisfy each applicable safe harbor may result in increased scrutiny by government enforcement authorities such as OIG.
Many states have adopted laws similar to the Anti-Kickback Statute. Some of these state prohibitions apply to referral of patients for health care items or services reimbursed by any source, not only the Medicare and Medicaid programs.
16
Table of Contents
Government officials have focused their enforcement efforts on marketing of health care services and products, among other activities, and recently have brought cases against companies, and certain sales, marketing, and executive personnel, for allegedly offering unlawful inducements to potential or existing customers in an attempt to procure their business.
Another development affecting the health care industry is the increased use of the federal Civil False Claims Act, and in particular, action brought pursuant to the False Claims Act's "whistleblower" or "qui tam" provisions. The False Claims Act imposes liability on any person or entity who, among other things, knowingly presents, or causes to be presented, a false or fraudulent claim for payment by a federal health care program. The qui tam provisions of the False Claims Act allow a private individual to bring actions on behalf of the federal government alleging that the defendant has submitted a false claim to the federal government, and to share in any monetary recovery. In recent years, the number of suits brought against health care providers by private individuals has increased dramatically. In addition, various states have enacted false claims law analogous to the Civil False Claims Act, although many of these state laws apply where a claim is submitted to any third-party payor and not merely a federal health care program.
When an entity is determined to have violated the False Claims Act, it may be required to pay up to three times the actual damages sustained by the government, plus civil penalties of between $5,500 to $11,000 for each separate false claim. There are many potential bases for liability under the False Claims Act. Liability arises, primarily, when an entity knowingly submits or causes another to submit a false claim for reimbursement to the federal government. The federal government has used the False Claims Act to assert liability on the basis of inadequate care, kickbacks, and other improper referrals, and improper use of Medicare numbers when detailing the provider of services, in addition to the more predictable allegations as to misrepresentations with respect to the services rendered. In addition, the federal government has prosecuted companies under the False Claims Act in connection with off-label promotion of products. Our future activities relating to the reporting of wholesale or estimated retail prices of our products, the reporting of discount and rebate information and other information affecting federal, state, and third-party reimbursement of our products, and the sale and marketing of our products may be subject to scrutiny under these laws. We are unable to predict whether we will be subject to actions under the False Claims Act or a similar state law, or the impact of such actions. However, the costs of defending such claims, as well as any sanctions imposed, could significantly affect our financial performance.
Foreign Corrupt Practices Act
The Foreign Corrupt Practices Act of 1977, as amended ("FCPA"), was enacted for the purpose of making it unlawful for certain classes of persons and entities to make payments to foreign government officials to assist in obtaining or retaining business. Specifically, the anti-bribery provisions of the FCPA prohibit the bribery of government officials. Lannett believes it is in compliance with the FCPA.
HIPAA and Other Fraud and Privacy Regulations
Among other things, the Health Insurance Portability and Accountability Act of 1996 ("HIPAA") created two new federal crimes: health care fraud and false statements relating to health care matters. The HIPAA health care fraud statute prohibits, among other things, knowing and willfully executing, or attempting to execute, a scheme to defraud any health care benefit program, including private payors. A violation of this statute is a felony and may result in fines, imprisonment, and/or exclusion from government-sponsored programs. The HIPAA false statements statute prohibits, among other things, knowingly and willfully falsifying, concealing, or covering up a material fact or making any materially false, fictitious, or fraudulent statement or representation in connection with the delivery of or payment for health care benefits, items, or services. A violation of this statute is a felony and may result in fines and/or imprisonment.
Pricing
In the United States, our sales are dependent upon the availability of coverage and reimbursement for our products from third-party payers, including federal and state programs such as Medicare and Medicaid, and private organizations such as commercial health insurance and managed care companies. Such third-party payers are increasingly challenging the price of medical products and services and instituting cost containment measures to control or significantly influence the purchase of medical products and services. This includes the placement of our pharmaceutical products on drug formularies or lists of medications.
Over the past several years, the rising costs of providing health care services has triggered legislation to make certain changes to the way in which pharmaceuticals, including our products, are covered and reimbursed, particularly by governmental programs. For instance, recent federal legislation and regulations have created a voluntary prescription drug benefit, Medicare Part D, revised the formula used to reimburse health care providers and physicians under Part B and have imposed significant revisions to the Medicaid Drug Rebate Program. These changes have resulted in, and may continue to result in, coverage and reimbursement restrictions and increased rebate obligations by manufacturers. In addition, there continue to be legislative and regulatory proposals at the federal and
17
Table of Contents
state levels directed at containing or lowering the cost of health care. Examples of how limits on drug coverage and reimbursement in the United States may cause reduced payments for drugs in the future include:
· changing Medicare reimbursement methodologies;
· revising drug rebate calculations under the Medicaid program;
· reforming drug importation laws;
· fluctuating decisions on which drugs to include in formularies; and
· requiring pre-approval of coverage for new or innovative drug therapies.
We cannot predict the likelihood or pace of such additional changes or whether there will be significant legislative or regulatory reform impacting our products. Nor can we predict with precision what effect such governmental measures would have if they were ultimately enacted into law. However, in general, we believe that legislative and regulatory reform activity likely will continue.
We are also subject to federal, state and local laws of general applicability, including laws regulating working conditions and the storage, transportation, or discharge of items that may be considered hazardous substances, hazardous waste, or environmental contaminants. We monitor our compliance with all environmental laws. We are in substantial compliance with all regulatory bodies.
As a publicly-traded company, we are also subject to significant regulations and laws, including the Sarbanes-Oxley Act of 2002. Since its enactment, we have developed and instituted a corporate compliance program based on what we believe are the current best practices and we continue to update the program in response to newly implemented or changing regulatory requirements.
We operate in a highly regulated environment and are responsible for maintaining compliance with many regulatory requirements. The U.S. Department of Justice, acting on behalf of the DEA, issued us a letter in August 2008 requesting additional information on certain record keeping matters regarding a DEA inspection of our facilities. We fully complied with their request and intend to fully comply with all requests for information that occur from time to time as a normal course of business.
Employees
As of June 30, 2011, we had 310 employees, comprised of 221 employees at Lannett and 89 employees at Cody Labs.
Securities and Exchange Act Reports
We maintain a website at www.lannett.com . We make available on or through our website our current and periodic reports, including any amendments to those reports, that are filed with the Securities and Exchange Commission (the "SEC") in accordance with the Securities Exchange Act of 1934, as amended (the "Exchange Act"). These reports include annual reports on Form 10-K, quarterly reports on Form 10-Q and current reports on Form 8-K. This information is available on our website free of charge as soon as reasonably practicable after we electronically file the information with, or furnish it to, the SEC. The contents of our website are not incorporated by reference in this Form 10-K and shall not be deemed "filed" under the Exchange Act.
ITEM 1A. RISK FACTORS
We materially rely on an uninterrupted supply of finished products from Jerome Stevens Pharmaceutical ("JSP") for a majority of our sales. If we were to experience an interruption of that supply, our operating results would suffer.
Approximately 63% of our fiscal year 2011 sales are of distributed products, primarily manufactured by JSP. Two of theses products are Levo and Digoxin, which accounted for 43% and 12%, respectively, of our Fiscal 2011 net sales, and 41% and 17%, respectively, of our net sales for Fiscal 2010. If the supply of these products is interrupted in any way by any form of temporary or permanent business interruption to JSP, including but not limited to fire or other naturally-occurring, damaging event to their physical plant and/or equipment, condemnation of their facility, legislative or regulatory cease and desist declaration regarding their operations, FDA action, and any interruption in their source of API for their products, our operating results could be materially adversely affected. We do not have, at this time, a second source for these products.
The generic pharmaceutical industry is highly competitive.
We face strong competition in our generic product business. Revenues and gross profit derived from the sales of generic pharmaceutical products tend to follow a pattern based on certain regulatory and competitive factors. As patents for brand name
18
Table of Contents
products and related exclusivity periods expire, the first generic manufacturer to receive regulatory approval for generic equivalents of such products is generally able to achieve significant market penetration. As competing off-patent manufacturers receive regulatory approvals on similar products or as brand manufacturers launch generic versions of such products (for which no separate regulatory approval is required), market share, revenues and gross profit typically decline, in some cases dramatically. Accordingly, the level of market share, revenue and gross profit attributable to a particular generic product is normally related to the number of competitors in that product's market and the timing of that product's regulatory approval and launch, in relation to competing approvals and launches. Consequently, we must continue to develop and introduce new products in a timely and cost-effective manner to maintain our revenues and gross margins.
During the 2011 Fiscal Year, and especially the First Quarter of Fiscal 2011, Lannett faced significant pricing challenges on its top two selling products. In order to keep the volume of business with the specific customer involved, Lannett chose to reduce its selling price on both of the products. This price reduction has had and will continue to have a significant impact to the gross profit margins and profitability of Lannett in the future.
Extensive industry regulation has had, and will continue to have, a significant impact on our business, especially our product development, manufacturing and distribution capabilities.
All pharmaceutical companies, including Lannett, are subject to extensive, complex, costly and evolving regulation by the federal government, including the FDA and in the case of controlled drugs, the DEA, and state government agencies. The FDCA, the CSA and other federal statutes and regulations govern or influence the development, testing, manufacturing, packing, labeling, storing, record keeping, safety, approval, advertising, promotion, sale and distribution of our products.
The process for obtaining governmental approval to manufacture and market pharmaceutical products is rigorous, time-consuming and costly, and we cannot predict the extent to which we may be affected by legislative and regulatory developments. We are dependent on receiving FDA and other governmental or third-party approvals prior to manufacturing, marketing and shipping our products. The FDA approval process for a particular product candidate can take several years and requires us to dedicate substantial resources to securing approvals, and we may not be able to obtain regulatory approval for our product candidates in a timely manner, or at all. In order to obtain approval for our generic product candidates, we must demonstrate that our drug product is bioequivalent to a drug previously approved by the FDA through the new drug approval process, known as an innovator drug. Bioequivalency may be demonstrated in vivo or in vitro by comparing the generic product candidate to the innovator drug product in dosage form, strength, route of administration, quality, dissolution performance characteristics, and intended use. The FDA may not agree that the bioequivalence studies we submit in the ANDA applications for our generic drug products are adequate to support approval. If it determines that an ANDA application is not adequate to support approval, the FDA could deny our application or request additional information, including clinical trials, which could delay approval of the product and impair our ability to compete with other versions of the generic drug product.
Consequently, there is always the chance that we will not obtain FDA or other necessary approvals, or that the rate, timing and cost of such approvals, will adversely affect our product introduction plans or results of operations. We carry inventories of certain product(s) in anticipation of launch, and if such product(s) are not subsequently launched, we may be required to write-off the related inventory. Furthermore, the FDA also has the authority to revoke drug approvals previously granted and remove these products from the market for a variety of reasons, including a failure to comply with applicable regulations, the discovery of previously unknown problems with the product, or because the ingredients in the drug are no longer approved by the FDA.
Additionally, certain products, marketed prior to the Federal Food, Drug and Cosmetic Act may be considered GRASE or Grandfathered. GRASE products are those "old drugs that do not require prior approval from FDA in order to be marketed because they are generally recognized as safe and effective based on published scientific literature." Similarly, Grandfathered products are those which "entered the market before the passage of the 1906 act, 1938 act or the 1962 amendments to the act." Under the Grandfathered drug clause, such a product is exempted from the "effectiveness requirements [of the act] if its composition and labeling have not changed since 1962 and if, on the day before the 1962 amendments became effective, it was (1) used or sold commercially in the United States, (2) not a new drug as defined by the act at that time, and (3) not covered by an effective application." Recently, the FDA has increased its efforts to force companies to file and seek FDA approval for GRASE or Grandfathered products. Efforts have included granting market exclusivity to approved GRASE products and issuing notices to companies currently producing these products to cease its distribution of said products. Lannett currently manufactures and markets several products that are considered GRASE or Grandfathered products, including C-Topical Solution and Oxycodone Solution. The Company is currently litigating the issue of Grandfathered drugs with the FDA. The FDA is currently undertaking activities to force all companies who manufacture certain GRASE products to file applications and seek approval for these products or remove their products from the market. As of July 24, 2010, Lannett stopped manufacturing and distributing Morphine Sulfate Oral Solution as part of one the FDA's enforcement actions. Lannett filed a 505(b)(2) New Drug Application ("MS NDA") in February 2010 and was granted FDA approval on the submission in June 2011. The Company estimates its date for re-launch of its Morphine Sulfate Oral
19
Table of Contents
Solution product during the first quarter of Fiscal Year 2012. Due to the length of time it took to receive approval on this application, the Company has fully reserved its MS inventory as of June 30, 2011.
The Company submitted, as part of the MS application, a $1.4 million Application Fee at the time of submission. Lannett is currently working with the FDA to get part of this fee returned to the Company. An estimate of the un-returned amount will be reclassified from other long-term assets on the Company's balance sheet as of June 30, 2011 into intangible assets upon shipment of the product which commenced in August 2011. Amortization will begin upon shipment of the product in August 2011 over the products estimated useful life. Amortization will be adjusted prospectively once the un-returned amount is finalized. Lannett also has approximately $321,000 of net inventory value at June 30, 2011 of other Grandfathered products which would also be at risk if the FDA were to pursue enforcement actions on these products similar to their actions on Morphine Sulfate Oral Solution.
In addition, Lannett, as well as many of our significant suppliers of distributed product and raw materials, are subject to periodic inspection of facilities, procedures and operations and/or the testing of the finished products by the FDA, the DEA and other authorities, which conduct periodic inspections to confirm that pharmaceutical companies are in compliance with all applicable regulations. The FDA conducts pre-approval and post-approval reviews and plant inspections to determine whether systems and processes are in compliance with cGMP, and other FDA regulations. Following such inspections, the FDA may issue notices on Form 483 that could cause us or our suppliers to modify certain activities identified during the inspection. A Form 483 notice is generally issued at the conclusion of a FDA inspection and lists conditions the FDA inspectors believe may violate cGMP or other FDA regulations. The DEA and comparable state-level agencies also heavily regulate the manufacturing, holding, processing, security, record-keeping, and distribution of drugs that are considered controlled substances. Some of the pain management products we manufacture contain controlled substances. The DEA periodically inspects facilities for compliance with its rules and regulations. If our manufacturing facilities or those of our suppliers fail to comply with applicable regulatory requirements, it could result in regulatory action and additional costs to us.
Our inability or the inability of our suppliers to comply with applicable FDA and other regulatory requirements can result in, among other things, delays in or denials of new product approvals, warning letters, fines, consent decrees restricting or suspending manufacturing operations, injunctions, civil penalties, recall or seizure of products, total or partial suspension of sales, and/or criminal prosecution., Any of these or other regulatory actions could materially harm our operating results and financial condition. Although we have instituted internal compliance programs, if these programs do not meet regulatory agency standards or if compliance is deemed deficient in any significant way, it could materially harm our business . Additionally, if the FDA were to undertake additional enforcement activities with any of Lannett's GRASE products, their actions could result in, among other things, removal of some of our products from the market, seizure of products and total or partial suspension of sales. Any of these regulatory actions could materially harm our operating results and financial condition.
Our manufacturing operations as well as our suppliers manufacturing are subject to licensing by the FDA and/or DEA. If we or our suppliers were unable to maintain the proper agency licensing arrangements, our operating results would be materially negatively impacted.
All of our manufacturing operations as well as those of our suppliers rely on maintaining active licenses to produce and develop generic drugs. Specifically, our Cody Labs operations rely on a DEA license to directly import and convert raw opium into several APIs or dosage forms. This license is granted for a one year period and must be renewed successfully each year in order for us to maintain Cody's current operations and allow the Company to continue to work towards becoming a fully integrated narcotics supplier. If the Company were unable to successfully renew its FDA and/or DEA licenses, the financial results of Lannett would be negatively impacted.
If we are unable to successfully develop or commercialize new products, our operating results will suffer.
Our future results of operations will depend to a significant extent upon our ability to successfully commercialize new generic products in a timely manner. There are numerous difficulties in developing and commercializing new products, including:
· developing, testing and manufacturing products in compliance with regulatory standards in a timely manner;
· receiving requisite regulatory approvals for such products in a timely manner;
· the availability, on commercially reasonable terms, of raw materials, including APIs and other key ingredients;
· developing and commercializing a new product is time consuming, costly and subject to numerous factors that may delay or prevent the successful commercialization of new products; and
20
Table of Contents
· commercializing generic products may be substantially delayed by the listing with the FDA of patents that have the effect of potentially delaying approval of the off-patent product by up to 30 months, and in some cases, such patents have been issued and listed with the FDA after the key chemical patent on the branded drug product has expired or been litigated, causing additional delays in obtaining approval.
As a result of these and other difficulties, products currently in development by Lannett may or may not receive the regulatory approvals necessary for marketing. If any of our products, when developed and approved, cannot be successfully or timely commercialized, our operating results could be adversely affected. We cannot guarantee that any investment we make in developing products will be recouped, even if we are successful in commercializing those products.
The loss of key personnel could cause our business to suffer.
The success of our present and future operations will depend, to a significant extent, upon the experience, abilities and continued services of our key personnel. If we lose the services of our key personnel, or if they are unable to devote sufficient attention to our operations for any other reason, our business may be significantly impaired. If the employment of any of our current key personnel is terminated, we cannot assure you that we will be able to attract and replace the employee with the same caliber of key personnel. As such, we have entered into employment agreements with all of our senior executive officers to help prevent the loss of our key personnel.
Our gross profit may fluctuate from period to period depending upon our product sales mix, our product pricing and our costs to manufacture or purchase products.
Our future results of operations, financial condition and cash flows depend to a significant extent upon our product sales mix. Our sales of certain products that we manufacture tend to create higher gross margins than do the products we purchase and resell. As a result, our sales mix will significantly impact our gross profit from period to period.
Factors that may cause our sales mix to vary include:
· the amount of new product introductions;
· marketing exclusivity, if any, which may be obtained on certain new products;
· the level of competition in the marketplace for certain products;
· the availability of raw materials and finished products from our suppliers; and
· the scope and outcome of governmental regulatory action that may involve us.
The profitability of our product sales is also dependent upon the prices we are able to charge for our products, the costs to purchase products from third parties, and our ability to manufacture our products in a cost effective manner.
If branded pharmaceutical companies are successful in limiting the use of generics through their legislative and regulatory efforts, our sales of generic products may suffer.
Many branded pharmaceutical companies increasingly have used state and federal legislative and regulatory means to delay generic competition. These efforts have included:
· pursuing new patents for existing products which may be granted just before the expiration of one patent which could extend patent protection for additional years or otherwise delay the launch of generics;
· using the Citizen Petition process to request amendments to FDA standards;
· seeking changes to U.S. Pharmacopoeia, an organization which publishes industry recognized compendia of drug standards;
· attaching patent extension amendments to non-related federal legislation; and
21
Table of Contents
· engaging in state-by-state initiatives to enact legislation that restricts the substitution of some generic drugs, which could have an impact on products that we are developing.
If branded pharmaceutical companies are successful in limiting the use of generic products through these or other means, our sales may decline. If we experience a material decline in product sales, our results of operations, financial condition and cash flows will suffer.
Third parties may claim that we infringe their proprietary rights and may prevent us from manufacturing and selling some of our products.
The manufacture, use and sale of new products that are the subject of conflicting patent rights have been the subject of substantial litigation in the pharmaceutical industry. These lawsuits relate to the validity and infringement of patents or proprietary rights of third parties. We may have to defend against charges that we violated patents or proprietary rights of third parties. This is especially true in the case of generic products on which the patent covering the branded product is expiring, an area where infringement litigation is prevalent, and in the case of new branded products where a competitor has obtained patents for similar products. Litigation may be costly and time-consuming, and could divert the attention of our management and technical personnel. In addition, if we infringe on the rights of others, we could lose our right to develop or manufacture products or could be required to pay monetary damages or royalties to license proprietary rights from third parties. Although the parties to patent and intellectual property disputes in the pharmaceutical industry have often settled their disputes through licensing or similar arrangements, the costs associated with these arrangements may be substantial and could include ongoing royalties. Furthermore, we cannot be certain that the necessary licenses would be available to us on terms we believe to be acceptable. As a result, an adverse determination in a judicial or administrative proceeding or failure to obtain necessary licenses could prevent us from manufacturing and selling a number of our products, which could harm our business, financial condition, results of operations and cash flows.
If we are unable to obtain sufficient supplies from key suppliers that in some cases may be the only source of finished products or raw materials, our ability to deliver our products to the market may be impeded.
We are required to identify the supplier(s) of all the raw materials for our products in our applications with the FDA. To the extent practicable, we attempt to identify more than one supplier in each drug application. However, some products and raw materials are available only from a single source and, in some of our drug applications, only one supplier of products and raw materials has been identified, even in instances where multiple sources exist. To the extent any difficulties experienced by our suppliers cannot be resolved within a reasonable time, and at reasonable cost, or if raw materials for a particular product become unavailable from an approved supplier and we are required to qualify a new supplier with the FDA, our profit margins and market share for the affected product could decrease, and our development and sales and marketing efforts could be delayed.
Our policies regarding returns, allowances and chargebacks, and marketing programs adopted by wholesalers may reduce our revenues in future fiscal periods.
Based on industry practice, generic drug manufacturers have liberal return policies and have been willing to give customers post-sale inventory allowances. Under these arrangements, from time to time, we give our customers credits on our generic products that our customers hold in inventory after we have decreased the market prices of the same generic products due to competitive pricing. Therefore, if new competitors enter the marketplace and significantly lower the prices of any of their competing products, we would likely reduce the price of our product. As a result, we would be obligated to provide credits to our customers who are then holding inventories of such products, which could reduce sales revenue and gross margin for the period the credit is provided. Like our competitors, we also give credits for chargebacks to wholesalers that have contracts with us for their sales to hospitals, group purchasing organizations, pharmacies or other customers. A chargeback is the difference between the price the wholesaler pays and the price that the wholesaler's end-customer pays for a product. Although we establish reserves based on our prior experience and our best estimates of the impact that these policies may have in subsequent periods, we cannot ensure that our reserves are adequate or that actual product returns, allowances and chargebacks will not exceed our estimates.
Health care initiatives and other third-party payor cost-containment pressures could cause us to sell our products at lower prices, resulting in decreased revenues.
Some of our products are purchased or reimbursed by state and federal government authorities, private health insurers and other organizations, such as health maintenance organizations, or HMOs, and managed care organizations, or MCOs. Third-party payors increasingly challenge pharmaceutical product pricing. There also continues to be a trend toward managed health care in the United States. Pricing pressures by third-party payors and the growth of organizations such as HMOs and MCOs could result in lower prices and a reduction in demand for our products.
22
Table of Contents
In addition, legislative and regulatory proposals and enactments to reform health care and government insurance programs could significantly influence the manner in which pharmaceutical products and medical devices are prescribed and purchased. We expect there will continue to be federal and state laws and/or regulations, proposed and implemented, that could limit the amounts that federal and state governments will pay for health care products and services. The extent to which future legislation or regulations, if any, relating to the health care industry or third-party coverage and reimbursement may be enacted or what effect such legislation or regulation would have on our business remains uncertain. For example, the American Recovery and Reinstatement Act of 2009, also known as the stimulus package, includes $1.1 billion in funding to study the comparative effectiveness of health care treatments and strategies. The stimulus package funding is expected to be used for, among other things, to conduct, support or synthesize research that compares and evaluates the risk and benefits, clinical outcomes, effectiveness and appropriateness of products. Although Congress has indicated that this funding is intended for improvement in quality of health care, it remains unclear how the research will impact coverage, reimbursement or other third-party payor policies. Such measures or other health care system reforms that are adopted could have a material adverse effect on our industry generally and our ability to successfully commercialize our products or could limit or eliminate our spending on development projects and affect our ultimate profitability.
We may need to change our business practices to comply with changes to fraud and abuse laws.
We are subject to various federal and state laws pertaining to health care fraud and abuse, including the federal fraud and abuse law (sometimes referred to as the "Anti-Kickback Statute") which apply to our sales and marketing practices and our relationships with physicians. At the federal level, the Anti-Kickback Statute prohibits any person or entity from knowingly and willfully soliciting, receiving, offering, or paying any remuneration, including a bribe, kickback, or rebate, directly or indirectly, in return for or to induce the referral of patients for items or services covered by federal health care programs, or the furnishing, recommending, or arranging for products or services covered by federal health care programs. Federal health care programs have been defined to include plans and programs that provide health benefits funded by the federal government, including Medicare and Medicaid, among others. The definition of "remuneration" has been broadly interpreted to include anything of value, including, for example, gifts, discounts, the furnishing of supplies or equipment, credit arrangements, payments of cash, and waivers of payments. Several courts have interpreted the federal Anti-Kickback Statute's intent requirement to mean that if even one purpose in an arrangement involving remuneration is to induce referrals or otherwise generate business involving goods or services reimbursed in whole or in part under federal health care programs, the statute has been violated. The federal government has issued regulations, commonly known as safe harbors that set forth certain provisions which, if fully met, will assure parties that they will not be prosecuted under the federal Anti-Kickback Statute. The failure of a transaction or arrangement to fit within a specific safe harbor does not necessarily mean that the transaction or arrangement will be illegal or that prosecution under the federal Anti-Kickback Statute will be pursued, but such transactions or arrangements face an increased risk of scrutiny by government enforcement authorities and an ongoing risk of prosecution. If our sales and marketing practices or our relationships with physicians (such as physicians serving on our Scientific Advisory Board) are considered by federal or state enforcement authorities to be knowingly and willfully soliciting, receiving, offering, or providing any remuneration in exchange for arranging for or recommending our products and services, and such activities do not fit within a safe harbor, then these arrangements could be challenged under the federal Anti-Kickback Statute. If our operations are found to be in violation of the federal Anti-Kickback Statute we may be subject to civil and criminal penalties including fines of up to $25,000 per violation, civil monetary penalties of up to $50,000 per violation, assessments of up to three times the amount of the prohibited remuneration, imprisonment, and exclusion from participating in the federal health care programs. In addition, HIPAA and its implementing regulations created two new federal crimes: health care fraud and false statements relating to health care matters. The HIPAA health care fraud statute prohibits, among other things, knowingly and willfully executing, or attempting to execute, a scheme to defraud any health care benefit program, including private payors. A violation of this statue is a felony and may result in fines, imprisonment and/or exclusion from government-sponsored programs. The HIPAA false statements statute prohibits, among other things, knowingly and willfully falsifying, concealing or covering up a material fact or making any materially false, fictitious or fraudulent statement or representation in connection with the delivery of or payment for health care benefits, items, or services. A violation of this statute is a felony and may result in fines and/or imprisonment. A number of states also have anti-fraud and anti-kickback laws similar to the federal Anti-Kickback Statute that prohibit certain direct or indirect payments if such arrangements are designed to induce or encourage the referral of patients or the furnishing of goods or services. Some states' anti-fraud and anti-kickback laws apply only to goods and services covered by Medicaid. Other states' anti-fraud and anti-kickback laws apply to all health care goods and services, regardless of whether the source of payment is governmental or private. Due to the breadth of these laws and the potential for changes in laws, regulations, or administrative or judicial interpretations, we may have to change our business practices or our existing business practices could be challenged as unlawful, which could materially adversely affect our business.
Certain federal and state governmental agencies, including the U.S. Department of Justice and the U.S. Department of Health and Human Services, have been investigating issues surrounding pricing information reported by drug manufacturers and used in the calculation of reimbursements as well as sales and marketing practices. For example, many government and third-party payors, including Medicare and Medicaid, reimburse doctors and others for the purchase of certain pharmaceutical products based on the product's average wholesale price ("AWP") reported by pharmaceutical companies. While Lannett has only used Suggested
23
Table of Contents
Wholesale Prices since 2000, the federal government, certain state agencies, and private payors are investigating and have begun to file court actions related to pharmaceutical companies' reporting practices with respect to AWP, alleging that the practice of reporting prices for pharmaceutical products has resulted in a false and overstated AWP, which in turn is alleged to have improperly inflated the reimbursement paid by Medicare beneficiaries, insurers, state Medicaid programs, medical plans, and others to health care providers who prescribed and administered those products. In addition, some of these same payors are also alleging that companies are not reporting their "best price" to the states under the Medicaid program. We are not currently subject to any such investigations or actions and having not used AWP pricing since 2000 would not likely become subject to these investigations.
We may become subject to federal and state false claims litigation brought by private individuals and the government.
We are subject to state and federal laws that govern the submission of claims for reimbursement. The federal False Claims Act imposes civil liability and criminal fines on individuals or entities that knowingly submit, or cause to be submitted, false or fraudulent claims for payment to the government. Violations of the False Claims Act and other similar laws may result in criminal fines, imprisonment, and civil penalties for each false claim submitted and exclusion from federally funded health care programs, including Medicare and Medicaid. The False Claims Act also allows private individuals to bring a suit on behalf of the government against an individual or entity for violations of the False Claims Act. These suits, known as qui tam actions, may be brought by, with only a few exceptions, any private citizen who has material information of a false claim that has not yet been previously disclosed. These suits have increased significantly in recent years because the False Claims Act allows an individual to share in any amounts paid to the federal government in fines or settlement as a result of a successful qui tam action. If our past or present operations are found to be in violation of any of such laws or any other governmental regulations that may apply to us, we may be subject to penalties, including civil and criminal penalties, damages, fines, exclusion from federal health care programs, and/or the curtailment or restructuring of our operations. Any penalties, damages, fines, curtailment, or restructuring of our operations could adversely affect our ability to operate our business and our financial results, action against us for violation of these laws, even if we successfully defend against them, could cause us to incur significant legal expenses and divert our management's attention from the operation of our business.
Sales of our products may continue to be adversely affected by the continuing consolidation of our distribution network and the concentration of our customer base.
Our principal customers are wholesale drug distributors and major retail drug store chains. These customers comprise a significant part of the distribution network for pharmaceutical products in the U.S. This distribution network is continuing to undergo significant consolidation marked by mergers and acquisitions among wholesale distributors and the growth of large retail drug store chains. As a result, a small number of large wholesale distributors control a significant share of the market, and the number of independent drug stores and small drug store chains has decreased. We expect that consolidation of drug wholesalers and retailers will increase pricing and other competitive pressures on drug manufacturers, including Lannett.
Our three largest customers accounted for 17%, 10% and 9%, respectively, of our net sales for the fiscal year ended June 30, 2011, and 26%, 11% and 9%, respectively, of our net sales for the fiscal year ended June 30, 2010. The loss of any of these customers could materially adversely affect our business, results of operations and financial condition and our cash flows. In addition, the Company has no long-term supply agreements with its customers that would require them to purchase our products.
The design, development, manufacture and sale of our products involves the risk of product liability claims by consumers and other third parties, and insurance against such potential claims is expensive and may be difficult to obtain.
The design, development, manufacture and sale of our products involve an inherent risk of product liability claims and the associated adverse publicity. Insurance coverage is expensive and may be difficult to obtain, and may not be available in the future on acceptable terms, or at all. Although we currently maintain product liability insurance for our products in amounts we believe to be commercially reasonable, if the coverage limits of these insurance policies are not adequate, a claim brought against Lannett, whether covered by insurance or not, could have a material adverse effect on our business, results of operations, financial condition and cash flows.
Rising insurance costs, as well as the inability to obtain certain insurance coverage for risks faced by Lannett, could negatively impact profitability.
The cost of insurance, including workers compensation, product liability and general liability insurance, have risen in prior years and may increase in the future. In response, we may increase deductibles and/or decrease certain coverage to mitigate these costs. These increases, and our increased risk due to increased deductibles and reduced coverage, could have a negative impact on our results of operations, financial condition and cash flows.
24
Table of Contents
Additionally, certain insurance coverages may not be available to Lannett for risks faced by Lannett. Sometimes the coverages obtained by Lannett for certain risks may not be adequate to fully reimburse the amount of damage that Lannett could possibly sustain. Should either of these events occur, the lack of insurance to cover the entire cost to the Company would adversely affect our results of operations and financial condition.
Significant balances of intangible assets, including product rights acquired, are subject to impairment testing and may result in impairment charges, which will adversely affect our results of operations and financial condition.
Our acquired contractual rights to market and distribute products are stated at cost, less accumulated amortization and related impairment charges identified to date. We determined the initial cost by referring to the original fair value of the assets exchanged. Future amortization periods for product rights are based on our assessment of various factors impacting estimated useful lives and cash flows of the acquired products. Such factors include the product's position in its life cycle, the existence or absence of like products in the market, various other competitive and regulatory issues and contractual terms. Significant changes to any of these factors would require us to perform an additional impairment test on the affected asset and, if evidence of impairment exists, we would be required to take an impairment charge with respect to the asset. Such a charge would adversely affect our results of operations and financial condition.
Federal regulation of arrangements between manufacturers of branded and generic products could adversely affect our business.
As part of the Medicare Prescription Drug, Improvement, and Modernization Act of 2003, companies are now required to file with the Federal Trade Commission ("FTC") and the Department of Justice certain types of agreements entered into between brand and generic pharmaceutical companies related to the manufacture, marketing and sale of generic versions of branded drugs. This new requirement could affect the manner in which generic drug manufacturers resolve intellectual property litigation and other disputes with branded pharmaceutical companies and could result generally in an increase in private-party litigation against pharmaceutical companies or additional investigations or proceedings by the FTC or other governmental authorities. The impact of this new requirement and the potential private-party lawsuits associated with arrangements between brand name and generic drug manufacturers is uncertain, and could adversely affect our business.
ITEM 2. DESCRIPTION OF PROPERTY
Lannett owns three facilities in Philadelphia, Pennsylvania. Certain administrative functions, manufacturing and production facilities and our quality control laboratory are located in a 31,000 square foot facility at 9000 State Road in Philadelphia. The second facility consists of 63,000 square feet, and is located within one mile of the State Road location at 9001 Torresdale Avenue in Philadelphia. Our research laboratory and packaging functions are located in the second building, which may be used for additional manufacturing space in the future.
In June 2006, we leased a third building located several miles from our manufacturing facility in Philadelphia, consisting of 66,000 square feet on approximately 7.3 acres. We purchased this building in October 2009 for approximately $3.8 million, plus the cost of fit out of approximately $2.0 million. A significant portion of the purchase price and fit out costs were financed through a series of loans with Wells Fargo N.A. bank and a Pennsylvania state run development agency. These loans could not be put in place until all construction had been completed and a proper certificate of occupancy had been obtained, due to a requirement by the state run development agency. Construction was substantially complete by June 30, 2010. A certificate of occupancy was obtained by September 2010. The financing was competed and funded as of May 31, 2011. This new facility is being used for certain administrative functions, warehouse space, shipping and possibly additional manufacturing space in the future.
The manufacturing facility of our wholly-owned subsidiary, Cody Labs, consists of an approximately 73,000 square foot structure located on approximately 15 acres in Cody, Wyoming. Cody Labs leases the facility from Cody LCI Realty, LLC, Wyoming, which is 50% owned by us and 50% by an officer of Cody Labs and his former spouse. Cody Labs' manufacturing facility currently has capacity for further expansion, both inside the existing structure, as well as by building outside the current structure.
ITEM 3. LEGAL PROCEEDINGS
In January 2010, the Company initiated an arbitration proceeding against Olive Healthcare ("Olive") for damages arising out of Olive's delivery of defective soft-gel prenatal vitamin capsules. The Company seeks damages in excess of $3.5 million. Olive has denied liability and filed a counterclaim in February 2010 for breach of contract. The arbitration proceeding is still in its initial stages. A mediation meeting was scheduled to take place in mid-December 2010, but Olive did not appear. The Company is now moving forward with the arbitration proceeding. Olive also filed a lawsuit against the Company in December 2010 in Daman, India
25
Table of Contents
seeking to enjoin the United States arbitration and claiming damages of approximately $6.8 million for compensatory damages and an additional approximately $6.8 million for loss of business. The Company has engaged Indian counsel and is actively defending that suit.
In June 2008, the Company filed a declaratory judgment suit in the Federal District Court of Delaware (Civil Action No. 08-338 (JJF)) against KV Pharmaceuticals, DrugTech Corp. and Ther-Rx Corp (collectively, "KV"). The complaint sought declaratory judgment for non-infringement and invalidity of certain patents owned by KV. The complaint further sought declaratory judgment of anti-trust violations and federal and state unfair competition violations for actions taken by KV in securing and enforcing these patents. KV also countered with claims of infringement by the Company of KV's patents seeking the Company's profits for sales of MMCs or other monetary relief, preliminary and permanent injunctive relief, attorney's fees and a finding of willful infringement. In March 2009, the Company and KV settled the litigation. In May 2010, the Company filed an action for declaratory relief in the Delaware Superior Court against KV seeking a declaration that KV breached its obligations under a settlement agreement entered into with the Company (the "Binding Agreement"). In June 2010, KV filed a counterclaim to the complaint and asserted claims for breach of contract, declaratory judgment, negligent misrepresentation and fraud in connection with the Binding Agreement, alleging among other things that the Company has improperly withheld royalties from KV arising out of its sales of a pre-natal vitamin product. On December 15, 2010, the Company executed a settlement agreement with KV in which the Company paid KV $850,000 to satisfy all royalties earned through December 31, 2010. In addition, effective January 1, 2011, the license granted to Lannett in the Binding Agreement was terminated, and the Company and its affiliates were required to cease making, using or offering to sell products covered by the licensed patents.
On July 21, 2010, Lannett Company, Inc. and its subsidiary, Cody Laboratories Inc., filed suit against the Department of Health and Human Services and the FDA challenging the FDA's determination that Cody's concentrated Morphine Sulfate Solution was a "new drug" for purposes of the Food, Drug, and Cosmetic Act. Cody and the Company were therefore required to obtain FDA approval before the companies could continue manufacturing, marketing, and selling the drug. The Company and Cody sought a preliminary injunction to prevent the FDA from forcing them to remove the drug from the market as of July 24, 2010. After a hearing, the request for preliminary injunction was denied. On November 16, 2010, the Court dismissed the case, citing a lack of subject matter jurisdiction. The Company and Cody appealed the District Court ruling to the Tenth Circuit Court of Appeals, where briefing is complete and argument is scheduled for September 12, 2011. However, on June 23, 2011, the FDA granted the Company and Cody's New Drug Application (NDA), and thus concentrated Morphine Sulfate Solution may be sold under that approved NDA while questions of the validity of the FDA's "new drug" determination are litigated on appeal.
PART II
ITEM 5. MARKET FOR COMMON EQUITY AND RELATED STOCKHOLDER MATTERS
Market Information
On April 15, 2002, the Company's common stock began trading on the American Stock Exchange (now the NYSE - AMEX). Prior to this, the Company's common stock traded in the over-the-counter market through the use of the inter-dealer "pink-sheets" published by Pink Sheets LLC. The following table sets forth certain information with respect to the high and low daily closing prices of the Company's common stock during Fiscal 2011 and 2010, as quoted by the NYSE - AMEX. Such quotations reflect inter-dealer prices without retail mark-up, markdown, or commission and may not represent actual transactions.
Fiscal Year Ended June 30, 2011
|
| High |
| Low |
| ||
|
|
|
|
|
| ||
First quarter |
| $ | 4.92 |
| $ | 4.06 |
|
|
|
|
|
|
| ||
Second quarter |
| $ | 6.75 |
| $ | 4.61 |
|
|
|
|
|
|
| ||
Third quarter |
| $ | 5.75 |
| $ | 5.08 |
|
|
|
|
|
|
| ||
Fourth quarter |
| $ | 5.77 |
| $ | 4.98 |
|
26
Table of Contents
Fiscal Year Ended June 30, 2010
|
| High |
| Low |
| ||
|
|
|
|
|
| ||
First quarter |
| $ | 9.67 |
| $ | 6.70 |
|
|
|
|
|
|
| ||
Second quarter |
| $ | 8.19 |
| $ | 4.95 |
|
|
|
|
|
|
| ||
Third quarter |
| $ | 6.45 |
| $ | 4.17 |
|
|
|
|
|
|
| ||
Fourth quarter |
| $ | 5.12 |
| $ | 4.23 |
|
Holders
As of September 2, 2011, there were approximately 230 holders of record of the Company's common stock.
Dividends
The Company did not pay cash dividends in Fiscal 2011 or Fiscal 2010. The Company intends to use available funds for working capital, plant and equipment additions, and various product extension ventures. The Company does not expect to pay, nor should shareholders expect to receive, cash dividends in the foreseeable future.
Share Repurchase Program
On January 27, 2005, the Company's Board of Directors approved a stock repurchase program which was reauthorized by the Board of Directors on November 20, 2009. Under the program, the Company is authorized to repurchase up to $5 million of its outstanding common stock. As of June 30, 2011, the Company has repurchased 156,611 shares of its common stock under the program at an aggregate purchase price of $872,303.
The following table sets forth certain information with respect to the Company's Share Repurchase Program.
ISSUER PURCHASES OF EQUITY SECURITIES |
| ||||||||||
Period |
| (a) Total |
| (b) Average |
| (c) Total |
| (d) Maximum |
| ||
|
|
|
|
|
|
|
|
|
| ||
April 1 to April 30, 2011 |
| - |
| $ | - |
| - |
| $ | 4,127,697 |
|
May 1 to May 31, 2011 |
| - |
| - |
| - |
|
|
| ||
June 1 to June 30, 2011 |
| - |
| - |
| - |
|
|
| ||
|
|
|
|
|
|
|
|
|
| ||
|
| - |
|
|
| - |
|
|
| ||
Stock Performance Chart
The following graph presents a comparison of the cumulative total stockholder return on the Company's stock with the cumulative total return of the NYSE AMEX Composite Index and the Morningstar Drug Manufacturers - Specialty and Generic Index for the period of five years commencing July 1, 2006 and ending June 30, 2011. The graph assumes that $100 was invested on July 1, 2006 in each of Lannett Company, Inc. common stock, NYSE AMEX Composite Index and the Morningstar Drug Manufacturers - Specialty and Generic Index.
27
Table of Contents
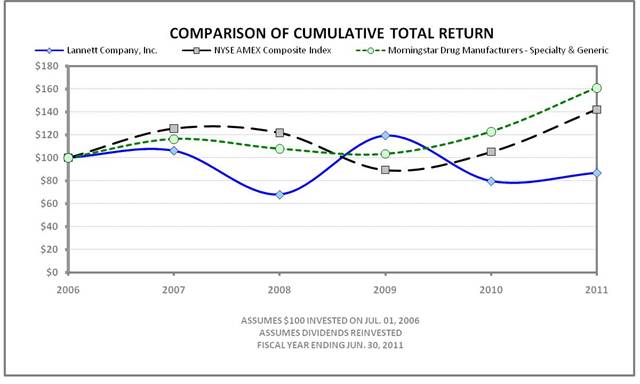
ITEM 6. SELECTED FINANCIAL DATA
The following financial information as of and for the five years ended June 30, 2011, has been derived from our consolidated financial statements. This information should be read in conjunction with our consolidated financial statements and related notes thereto included elsewhere herein. The comparability of information is affected by the items described below.
In Fiscal 2008, we increased our returns reserve by $10.5 million, reflecting our expectation that 100% of the shipments of Prenatal Multivitamin made in the fourth quarter of Fiscal 2008 would be returned. Our expectation that all of the product would be returned was based on our inability to have the product specified as a brand equivalent, product complaints and information from our customers regarding their intentions to return the product.
In Fiscal 2007, the Company wrote-off of a portion of a note receivable due from Cody Labs, and subsequently acquired Cody Labs (a provider of API). Approximately $7.8 million of notes were written-off prior to the Cody Labs acquisition, representing the excess of the note receivable over the fair value of assets received of approximately $4.4 million.
Lannett Company, Inc. and Subsidiaries
Financial Highlights
As of and for the Fiscal Year Ended June 30, |
| 2011 |
| 2010 |
| 2009 |
| 2008 |
| 2007 |
| |||||
Operating Highlights |
|
|
|
|
|
|
|
|
|
|
| |||||
|
|
|
|
|
|
|
|
|
|
|
| |||||
Net Sales |
| $ | 106,835,132 |
| $ | 125,177,949 |
| $ | 119,002,215 |
| $ | 72,403,283 |
| $ | 82,577,591 |
|
Gross Profit |
| $ | 23,319,713 |
| $ | 41,339,807 |
| $ | 45,244,469 |
| $ | 16,301,071 |
| $ | 21,424,987 |
|
Operating (Loss) / Income |
| $ | (994,949 | ) | $ | 13,030,019 |
| $ | 10,780,869 |
| $ | (5,430,534 | ) | $ | (5,964,409 | ) |
Net (Loss) / Income - Lannett Company, Inc. |
| $ | (276,900 | ) | $ | 7,821,067 |
| $ | 6,534,245 |
| $ | (2,318,059 | ) | $ | (6,929,008 | ) |
Basic (Loss) / Earnings Per Share - Lannett Company, Inc. |
| $ | (0.01 | ) | $ | 0.32 |
| $ | 0.27 |
| $ | (0.10 | ) | $ | (0.29 | ) |
Diluted (Loss) / Earnings Per Share - Lannett Company, Inc. |
| $ | (0.01 | ) | $ | 0.31 |
| $ | 0.27 |
| $ | (0.10 | ) | $ | (0.29 | ) |
|
|
|
|
|
|
|
|
|
|
|
| |||||
Balance Sheet Highlights |
|
|
|
|
|
|
|
|
|
|
| |||||
|
|
|
|
|
|
|
|
|
|
|
| |||||
Total Assets |
| $ | 147,744,298 |
| $ | 139,963,797 |
| $ | 124,577,121 |
| $ | 113,679,264 |
| $ | 104,656,100 |
|
Total Debt |
| $ | 7,821,931 |
| $ | 7,719,827 |
| $ | 8,138,768 |
| $ | 8,978,834 |
| $ | 9,679,965 |
|
Long Term Debt, less Current Portion |
| $ | 7,192,496 |
| $ | 2,868,549 |
| $ | 7,703,382 |
| $ | 8,186,922 |
| $ | 8,987,846 |
|
Total Stockholders' Equity |
| $ | 105,689,174 |
| $ | 88,957,715 |
| $ | 77,647,623 |
| $ | 69,321,789 |
| $ | 70,183,175 |
|
28
Table of Contents
ITEM 7. MANAGEMENT'S DISCUSSION AND ANALYSIS OF FINANCIAL CONDITION AND RESULTS OF OPERATIONS
In addition to historical information, this Form 10-K contains forward-looking information. The forward-looking information is subject to certain risks and uncertainties that could cause actual results to differ materially from those projected in the forward-looking statements. Important factors that might cause such a difference include, but are not limited to, those discussed in the following section, entitled "Management's Discussion and Analysis of Financial Condition and Results of Operations." Readers are cautioned not to place undue reliance on these forward-looking statements, which reflect management's analysis only as of the date of this Form 10-K. The Company undertakes no obligation to publicly revise or update these forward-looking statements to reflect events or circumstances that may occur. Readers should carefully review the risk factors described in other documents the Company files from time to time with the SEC, including the Quarterly Reports on Form 10-Q to be filed by the Company in Fiscal 2012, and any Current Reports on Form 8-K filed by the Company.
Critical Accounting Policies
The discussion and analysis of our financial condition and results of operations are based upon our consolidated financial statements, which have been prepared in accordance with accounting principles generally accepted in the United States of America. The preparation of these financial statements requires us to make estimates and judgments that affect the reported amount of assets and liabilities, revenues and expenses, and related disclosure of contingent assets and liabilities at the date of our financial statements. Actual results may differ from these estimates under different assumptions or conditions.
Critical accounting policies are defined as those that are reflective of significant judgments and uncertainties and potentially result in materially different results under different assumptions and conditions. We believe that our critical accounting policies include those described below. For a detailed discussion on the application of these and other accounting policies, refer to Note 1 in the Notes to the Consolidated Financial Statements included herein.
Revenue Recognition - The Company recognizes revenue when its products are shipped. At this point, title and risk of loss have transferred to the customer and provisions for estimates, including rebates, promotional adjustments, price adjustments, returns, chargebacks, and other potential adjustments are reasonably determinable. Accruals for these provisions are presented in the consolidated financial statements as rebates and chargebacks payable and reductions to net sales. The change in the reserves for various sales adjustments may not be proportionally equal to the change in sales because of changes in both the product and the customer mix. Increased sales to wholesalers will generally require additional accruals as they are the primary recipient of chargebacks and rebates. Incentives offered to secure sales vary from product to product. Provisions for estimated rebates and promotional credits are estimated based upon contractual terms. Provisions for other customer credits, such as price adjustments, returns, and chargebacks, require management to make subjective judgments on customer mix. Unlike branded innovator drug companies, Lannett does not use information about product levels in distribution channels from third-party sources, such as IMS Health and Wolters Kluwer, in estimating future returns and other credits. Lannett calculates a chargeback/rebate rate based on contractual terms with its customers and applies this rate to customer sales. The only variable is customer mix, and this assumption is based on historical data and sales expectations. The chargeback/rebate reserve is reviewed on a monthly basis by management using several ratios and calculated metrics. As we continue to obtain additional information about our historical experience for chargebacks, rebates and returns, we also update our estimates of the required reserves.
Chargebacks - The provision for chargebacks is the most significant and complex estimate used in the recognition of revenue. The Company sells its products directly to wholesale distributors, generic distributors, retail pharmacy chains, and mail-order pharmacies. The Company also sells its products indirectly to independent pharmacies, managed care organizations, hospitals, nursing homes, and group purchasing organizations, collectively referred to as "indirect customers." Lannett enters into agreements with its indirect customers to establish pricing for certain products. The indirect customers then independently select a wholesaler from which to actually purchase the products at these agreed-upon prices. Lannett will provide credit to the wholesaler for the difference between the agreed-upon price with the indirect customer and the wholesaler's invoice price if the price sold to the indirect customer is lower than the direct price to the wholesaler. This credit is called a chargeback. The provision for chargebacks is based on expected sell-through levels by the Company's wholesale customers to the indirect customers and estimated wholesaler inventory levels. As sales by the Company to the large wholesale customers, such as Cardinal Health, AmerisourceBergen, and McKesson, increase, the reserve
29
Table of Contents
for chargebacks will also generally increase. However, the size of the increase depends on the expected mix of product sales to the indirect customers. The Company continually monitors the reserve for chargebacks and makes adjustments when management believes that expected chargebacks on actual sales may differ from the amounts that were assumed in the establishment of the chargeback reserves.
Rebates - Rebates are offered to the Company's key chain drug store and wholesaler customers to promote customer loyalty and increase product sales. These rebate programs provide customers with rebate credits upon attainment of pre-established volumes or attainment of net sales milestones for a specified period. Other promotional programs are incentive programs offered to the customers. At the time of shipment, the Company estimates reserves for rebates and other promotional credit programs based on the specific terms in each agreement. The reserve for rebates increases as sales to rebate-eligible customers are recognized and decreases when actual rebate payments are made. However, since rebate programs are not identical for all customers, the size of the reserve will depend on the mix of sales to customers that are eligible to receive rebates.
Returns - Consistent with industry practice, the Company has a product returns policy that allows certain customers to return product within a specified period prior to and subsequent to the product's lot expiration date in exchange for a credit to be applied to future purchases. The Company's policy requires that the customer obtain pre-approval from the Company for any qualifying return. The Company estimates its provision for returns based on historical experience, adjusted for any changes in business practices or conditions that would cause management to believe that future product returns may differ from those returns assumed in the establishment of reserves. Generally, the reserve for returns increases as sales increase and decrease when credits are issued or payments are made for actual returns received. The reserve for returns is included in the rebates, chargebacks and returns payable account on the balance sheet.
Other Adjustments - Other adjustments consist primarily of price adjustments, also known as "shelf stock adjustments," which are credits issued to reflect decreases in the selling prices of the Company's products that customers have remaining in their inventories at the time of a price reduction. Decreases in selling prices are discretionary decisions made by management to reflect competitive market conditions. Amounts recorded for estimated shelf stock adjustments are based upon specified terms with direct customers, estimated declines in market prices, and estimates of inventory held by customers. The Company regularly monitors these and other factors and evaluates the reserve as additional information becomes available. Other adjustments are included in the rebates, chargebacks and returns payable account on the balance sheet. When competitors enter the market for existing products, shelf stock adjustments may be issued to maintain price competitiveness.
The following tables identify the reserves for each major category of revenue allowance and a summary of the activity for fiscal years 2011, 2010 and 2009. Unless we have specific information to indicate otherwise, actual credits issued in a given year are assumed to be related to sales recorded in prior years based on the Company's returns policy.
For the Year Ended June 30, 2011
Reserve Category |
| Chargebacks |
| Rebates |
| Returns |
| Other |
| Total |
| |||||
Reserve Balance as of June 30, 2010 |
| $ | 6,282,127 |
| $ | 3,566,031 |
| $ | 5,401,254 |
| $ | - |
| $ | 15,249,412 |
|
|
|
|
|
|
|
|
|
|
|
|
| |||||
Actual credits issued related to sales recorded in prior fiscal years |
| (6,100,391 | ) | (3,946,924 | ) | (4,592,322 | ) | - |
| (14,639,637 | ) | |||||
|
|
|
|
|
|
|
|
|
|
|
| |||||
Reserves or (reversals) charged during Fiscal 2011 related to sales in prior fiscal years |
| - |
| 380,894 |
| - |
| - |
| 380,894 |
| |||||
|
|
|
|
|
|
|
|
|
|
|
| |||||
Reserves charged to net sales during Fiscal 2011 related to sales recorded in Fiscal 2011 |
| 53,686,637 |
| 16,587,393 |
| 6,741,748 |
| 3,502,492 |
| 80,491,270 |
| |||||
|
|
|
|
|
|
|
|
|
|
|
| |||||
Actual credits issued related to sales recorded in Fiscal 2011 |
| (48,371,462 | ) | (13,661,917 | ) | (2,381,673 | ) | (3,502,492 | ) | (67,917,544 | ) | |||||
|
|
|
|
|
|
|
|
|
|
|
| |||||
Reserve Balance as of June 30, 2011 |
| $ | 5,496,911 |
| $ | 2,925,477 |
| $ | 5,142,007 |
| $ | - |
| $ | 13,564,395 |
|
30
Table of Contents
For the Year Ended June 30, 2010
Reserve Category |
| Chargebacks |
| Rebates |
| Returns |
| Other |
| Total |
| |||||
Reserve Balance as of June 30, 2009 |
| $ | 6,089,802 |
| $ | 2,537,746 |
| $ | 5,106,992 |
| $ | - |
| $ | 13,734,540 |
|
|
|
|
|
|
|
|
|
|
|
|
| |||||
Actual credits issued related to sales recorded in prior fiscal years |
| (6,068,639 | ) | (2,537,746 | ) | (3,832,652 | ) | - |
| (12,439,037 | ) | |||||
|
|
|
|
|
|
|
|
|
|
|
| |||||
Reserves or (reversals) charged during Fiscal 2010 related to sales in prior fiscal years |
| - |
| - |
| (401,203 | ) | - |
| (401,203 | ) | |||||
|
|
|
|
|
|
|
|
|
|
|
| |||||
Reserves charged to net sales during Fiscal 2010 related to sales recorded in Fiscal 2010 |
| 48,539,403 |
| 16,353,467 |
| 4,528,118 |
| 1,226,614 |
| 70,647,601 |
| |||||
|
|
|
|
|
|
|
|
|
|
|
| |||||
Actual credits issued related to sales recorded in Fiscal 2010 |
| (42,278,440 | ) | (12,787,436 | ) | - |
| (1,226,614 | ) | (56,292,489 | ) | |||||
|
|
|
|
|
|
|
|
|
|
|
| |||||
Reserve Balance as of June 30, 2010 |
| $ | 6,282,127 |
| $ | 3,566,031 |
| $ | 5,401,254 |
| $ | - |
| $ | 15,249,412 |
|
For the Year Ended June 30, 2009
Reserve Category |
| Chargebacks |
| Rebates |
| Returns |
| Other |
| Total |
| |||||
Reserve Balance as of June 30, 2008 |
| $ | 4,049,407 |
| $ | 632,314 |
| $ | 13,642,589 |
| $ | 2,107 |
| $ | 18,326,417 |
|
|
|
|
|
|
|
|
|
|
|
|
| |||||
Actual credits issued related to sales recorded in prior fiscal years |
| (3,954,794 | ) | (632,314 | ) | (12,853,342 | ) | - |
| (17,440,450 | ) | |||||
|
|
|
|
|
|
|
|
|
|
|
| |||||
Reserves or (reversals) charged during Fiscal 2009 related to sales in prior fiscal years |
| - |
| - |
| 2,107 |
| (2,107 | ) | - |
| |||||
|
|
|
|
|
|
|
|
|
|
|
| |||||
Reserves charged to net sales during Fiscal 2009 related to sales recorded in Fiscal 2009 |
| 35,391,475 |
| 12,141,204 |
| 4,315,638 |
| 204,119 |
| 52,052,436 |
| |||||
|
|
|
|
|
|
|
|
|
|
|
| |||||
Actual credits issued related to sales recorded in Fiscal 2009 |
| (29,396,286 | ) | (9,603,458 | ) | - |
| (204,119 | ) | (39,203,863 | ) | |||||
|
|
|
|
|
|
|
|
|
|
|
| |||||
Reserve Balance as of June 30, 2009 |
| $ | 6,089,802 |
| $ | 2,537,746 |
| $ | 5,106,992 |
| $ | - |
| $ | 13,734,540 |
|
Reserve Activity 2011 vs. 2010
The total reserve for chargebacks, rebates, returns and other adjustments decreased from $15,249,412 at June 30, 2010 to $13,564,395 at June 30, 2011. The decrease in total reserves was due to a decrease in the rebates reserve as a result of reduced gross sales to customers who participate in rebate programs as well as timing of actual rebate credits issued. The $380,894 of rebates reserves charged during Fiscal 2011 related to sales in prior fiscal years resulted from a change in estimate based on new information obtained from an audit of customers' accounts. Although gross sales to wholesalers increased in Fiscal 2011 compared to Fiscal 2010, the decrease in chargeback reserves is due primarily to a decrease in inventory levels at wholesaler distribution centers as of June 30, 2011. The activity in the Other category for the year ended June 30, 2011 includes shelf-stock adjustments totaling $2,670,406 primarily related to products for the treatment of thyroid deficiency and heart failure.
31
Table of Contents
The following tables compare the year-end reserve balances in fiscal years 2011 and 2010 and the gross sales mix in Fiscal 2011 and Fiscal 2010.
|
| Fiscal Year Ended June 30, |
| ||||||||
|
| 2011 |
| % |
| 2010 |
| % |
| ||
Chargeback reserve |
| $ | 5,496,911 |
| 40 | % | $ | 6,282,127 |
| 41 | % |
Rebate reserve |
| 2,925,477 |
| 22 | % | 3,566,031 |
| 23 | % | ||
Return reserve |
| 5,142,007 |
| 38 | % | 5,401,254 |
| 36 | % | ||
Other reserve |
| - |
| - | % | - |
| - | % | ||
|
| $ | 13,564,395 |
| 100 | % | $ | 15,249,412 |
| 100 | % |
|
| Fiscal Year ended June 30, |
| Fiscal Fourth Quarter |
| ||||
|
| 2011 |
| 2010 |
| 2011 |
| 2010 |
|
Chain drug stores |
| 28 | % | 32 | % | 28 | % | 31 | % |
Mail Order |
| 2 | % | 4 | % | 2 | % | 4 | % |
Wholesalers |
| 70 | % | 64 | % | 70 | % | 65 | % |
|
| 100 | % | 100 | % | 100 | % | 100 | % |
Reserve Activity 2010 vs. 2009
The total reserve for chargebacks, rebates, returns and other adjustments increased from $13,734,540 at June 30, 2009 to $15,249,412 at June 30, 2010. The increase in total reserves was due to an increase in the rebates reserve as a result of the timing of credits being processed by the customers and by the Company, an increase in chargeback reserves due primarily to an increase in inventory levels at wholesaler distribution centers, and an increase in the return reserves due to an increase in overall sales.
During Fiscal 2010 approximately $424,000 of the original $10,545,000 return reserve recorded in the fourth quarter of Fiscal 2008 for the Prenatal Multivitamin product was applied to accounts receivable for customers who had returned the Prenatal Multivitamin product during 2010. In addition, the Company reversed approximately $387,000 to net sales in the fourth quarter of Fiscal 2010 as a result of new information that the Company had received regarding the amount of Multivitamin product that remained to be returned to the Company. This adjustment left a balance of approximately $17,000 of Multivitamin returns reserve on the consolidated balance sheet at June 30, 2010.
The following tables compare the year-end reserve balances in fiscal years 2010 and 2009 and the gross sales mix in Fiscal 2010 and Fiscal 2009.
|
| Fiscal Year Ended June 30, |
| ||||||||
|
| 2010 |
| % |
| 2009 |
| % |
| ||
Chargeback reserve |
| $ | 6,282,127 |
| 41 | % | $ | 6,089,802 |
| 44 | % |
Rebate reserve |
| 3,566,031 |
| 23 | % | 2,537,746 |
| 19 | % | ||
Return reserve |
| 5,401,254 |
| 36 | % | 5,106,992 |
| 37 | % | ||
Other reserve |
| - |
| - | % | - |
| - | % | ||
|
| $ | 15,249,412 |
| 100 | % | $ | 13,734,540 |
| 100 | % |
|
| Fiscal Year ended June 30, |
| Fiscal Fourth Quarter |
| ||||
|
| 2010 |
| 2009 |
| 2010 |
| 2009 |
|
Chain drug stores |
| 32 | % | 37 | % | 31 | % | 33 | % |
Mail Order |
| 4 | % | 4 | % | 4 | % | 3 | % |
Wholesalers |
| 64 | % | 59 | % | 65 | % | 64 | % |
|
| 100 | % | 100 | % | 100 | % | 100 | % |
Accounts Receivable - The Company performs ongoing credit evaluations of its customers and adjusts credit limits based upon payment history and the customer's current credit worthiness, as determined by a review of current credit information. The Company continuously monitors collections and payments from its customers and maintains a provision for estimated credit losses based upon historical experience and any specific customer collection issues that have been identified. While such credit losses have historically been within both the Company's expectations and the provisions established, the Company cannot guarantee that it will continue to experience the same credit loss rates that it has in the past.
32
Table of Contents
The Company also regularly monitors accounts receivable ("AR") balances by reviewing day's sales outstanding ("DSO"). DSO is calculated by dividing gross accounts receivable by the average daily gross sales for the fiscal quarter. The Company monitors DSO as an overall check on collections and to assess the reasonableness of the reserves. DSO provides management with an understanding of the frequency of customer payments, and the ability to process customer payments and deductions. Standard payment terms offered to customers are consistent with industry practice at 60 days.
The following table shows the results of these calculations for the fiscal years ended June 30, 2011, 2010 and 2009:
Fiscal Year Ended June 30, |
| 2011 |
| 2010 |
| 2009 |
|
Gross DSO (in days) |
| 64 |
| 69 |
| 53 |
|
The level of DSO at June 30, 2011 is comparable to the Company's expectation that DSO will be in the 60 to 70 day range based on 60 day payment terms for most customers.
Inventories - The Company values its inventory at the lower of cost (determined by the first-in, first-out method) or market, regularly reviews inventory quantities on hand, and records a provision for excess and obsolete inventory based primarily on estimated forecasts of product demand and production requirements. The Company's estimates of future product demand may prove to be inaccurate, in which case it may have understated or overstated the provision required for excess and obsolete inventory. In the future, if the Company's inventory is determined to be overvalued, the Company would be required to recognize such costs in cost of goods sold at the time of such determination. Likewise, if inventory is determined to be undervalued, the Company may have recognized excess cost of goods sold in previous periods and would be required to recognize such additional operating income at the time of sale.
Consolidation of Variable Interest Entity - The Company consolidates any Variable Interest Entity ("VIE") of which we are the primary beneficiary. The liabilities recognized as a result of consolidating a VIE do not represent additional claims on our general assets; rather, they represent claims against the specific assets of the consolidated VIE. Conversely, assets recognized as a result of consolidating a VIE do not represent additional assets that could be used to satisfy claims against our general assets. Reflected in the June 30, 2011 and 2010 balance sheets are consolidated VIE assets of $1.8 million and $1.9 million, respectively, which is comprised mainly of land and a building. VIE liabilities primarily consist of a mortgage on that property in the amount of $1.5 million and $1.6 million at June 30, 2011 and 2010, respectively. This VIE was initially consolidated by Cody, as Cody has been the primary beneficiary. Cody has then been consolidated within Lannett's financial statements since its acquisition in April 2007.
New Accounting Pronouncements -
In June 2009, the FASB issued authoritative guidance for determining whether an entity is a variable interest entity and modifies the methods allowed for determining the primary beneficiary of a variable interest entity. This guidance requires an enterprise to perform an analysis to determine whether the enterprise's variable interest or interests give it a controlling financial interest in a variable interest entity. It also requires ongoing reassessments of whether an enterprise is the primary beneficiary of a variable interest entity. The authoritative guidance is effective for the annual reporting period that begins after November 15, 2009. We adopted this authoritative guidance effective in our first quarter of Fiscal 2011 and it had no significant impact on our consolidated financial statements.
In January 2010, the FASB issued authoritative guidance which requires reporting entities to make new disclosures about recurring or nonrecurring fair value measurements including significant transfers into and out of Level 1 and Level 2 fair value measurements and information on purchases, sales, issuances, and settlements on a gross basis in the reconciliation of Level 3 fair value measurements. The authoritative guidance is effective for interim and annual reporting periods beginning after December 15, 2009, except for Level 3 reconciliation disclosures which are effective for fiscal years beginning after December 15, 2010 and for interim periods within those fiscal years. We do not anticipate that this update will have a material impact on our consolidated financial statements.
In June 2011, the FASB issued authoritative guidance which allows an entity the option to present the total of comprehensive income, the components of net income, and the components of other comprehensive income either in a single continuous statement of comprehensive income or in two separate but consecutive statements. In both options, an entity is required to present each component of net income along with total net income, each component of other comprehensive income along with a total for other comprehensive income, and a total amount for comprehensive income. This guidance eliminates the option to present the components of other comprehensive income as part of the statement of changes in stockholders' equity. This guidance does not change the items that must be reported in other comprehensive income or when an item of other comprehensive income must be reclassified to net income. This authoritative guidance must be applied retrospectively, and is effective for fiscal years and interim periods within those years, beginning after December 15, 2011.
33
Table of Contents
Results of Operations - Fiscal 2011 compared to Fiscal 2010
Net sales decreased 15% from $125,177,949 in Fiscal 2010 to $106,835,132 in Fiscal 2011. The following factors contributed to the $18,342,817 decrease in sales:
Medical indication |
| Sales volume |
| Sales price |
|
Migraine Headache |
| (1 | )% | (11 | )% |
Antibiotics |
| (10 | )% | 5 | % |
Prescription Vitamin |
| (73 | )% | 22 | % |
Pain Management |
| (22 | )% | 33 | % |
Epilepsy |
| 26 | % | (35 | )% |
Heart Failure |
| (31 | )% | (14 | )% |
Thyroid Deficiency |
| 7 | % | (16 | )% |
Sales of drugs used in the treatment of thyroid deficiency decreased by approximately $5,173,000 for Fiscal 2011 compared to Fiscal 2010 primarily as a result of a competitive price reduction in order to retain one of our major customers. Included in this amount is a one-time shelf stock adjustment totaling approximately $1,500,000. The overall decrease in sales was also affected by a decrease in sales of drugs for the treatment of congestive heart failure by approximately $8,551,000 for Fiscal 2011 compared to Fiscal 2010 mainly due to a decrease in the volume of bottles shipped, as well as a result of a competitive price reduction in order to retain one of our major customers. Included in this amount is a one-time shelf stock adjustment totaling approximately $638,000. Net sales of our prescription vitamins also decreased by approximately $3,802,000 due to the settlement agreement reached with KV on December 15, 2010 which requires the Company to cease selling products covered by the licensed patents. Sales of drugs used for the treatment of migraine headaches decreased by approximately $1,201,000 for Fiscal 2011 compared to Fiscal 2010 primarily as a result of a price reduction. The overall decrease in sales was partially offset by an increase in sales of drugs used for pain management which increased by approximately $620,000 for Fiscal 2011 compared to Fiscal 2010. This increase is primarily the result of an increase in demand for pain management products including Hydromorphone HCl and Oxycodone HCl which increased $4,044,000 and $3,205,000, respectively for Fiscal 2011 compared to Fiscal 2010. Partially offsetting this increase were Fiscal 2010 revenues of Morphine Sulfate Oral Solution totaling $6,337,000 which were not recognized in Fiscal 2011 as a result of the FDA's action to force Lannett and all but one competitor to cease manufacturing and/or distributing Morphine Sulfate Oral Solution effective July 24, 2010.
The Company sells its products to customers in various categories. The table below presents the Company's net sales to each category.
Customer Category |
| Fiscal 2011 Net Sales |
| Fiscal 2010 Net Sales |
| ||
|
|
|
|
|
| ||
Wholesaler/Distributor |
| $ | 56.6 million |
| $ | 58.2 million |
|
|
|
|
|
|
| ||
Retail Chain |
| $ | 46.3 million |
| $ | 60.3 million |
|
|
|
|
|
|
| ||
Mail-Order Pharmacy |
| $ | 3.9 million |
| $ | 6.7 million |
|
|
|
|
|
|
| ||
Total |
| $ | 106.8 million |
| $ | 125.2 million |
|
The sales to wholesaler/distributor decreased as a result of the decrease in sales of Morphine Oral Solution discussed above, partially offset by an increase in demand for products for which the Company is a major supplier such as drugs used for the treatment of gallstones. The sales to retail chains decreased primarily as a result of the competitive price reductions on two products in order to retain one of our major customers as discussed above. Sales to retail chains also declined as a result of the settlement agreement reached with KV which requires the Company to cease selling products covered by the licensed patents as discussed above.
Cost of sales decreased slightly to $83,515,419 in Fiscal 2011 from $83,838,142 in Fiscal 2010. The decrease reflected the impact of the 15% decrease in sales as well as a change in the mix of products sold. Cost of sales includes the additional inventory reserves totaling approximately $1,738,000 related to Morphine Sulfate Oral Solution. The Company increased its reserves related to Morphine Sulfate Oral Solution as a result of new information obtained during the January 2011 meeting with the FDA in that the FDA now requires a PAI as part of the MS NDA approval process. The Company received FDA approval in June 2011 to begin selling Morphine Sulfate Oral Solution although existing inventories totaling $2,063,000 are fully reserved as of June 30, 2011 based
34
Table of Contents
on their expiration dates. Cost of sales also included the reversal of royalty expense in Fiscal 2011 totaling approximately $618,000 as a result of the settlement agreement reached with KV (see note 9) whereas Fiscal 2010 includes additional royalties of approximately $455,180 primarily related to the sale of the prescription vitamins, our Amantadine product and the final payments under the Provell termination agreement.
Amortization expense primarily relates to the JSP Distribution Agreement. For the remaining term of the JSP Distribution Agreement, the Company will incur annual amortization expense of approximately $1,785,000.
Gross profit margins for Fiscal 2011 and Fiscal 2010 were 22% and 33%, respectively. Gross profit percentage decreased due to the overall decline in sales described above. Gross profit margins were also reduced by the additional inventory reserves recorded during Fiscal 2011 totaling $1,738,000 related to Morphine Sulfate Oral Solution as discussed above. Partially offsetting the decrease was an increase due to the reversal of royalty expense totaling approximately $618,000 as a result of the settlement agreement reached with KV. While the Company is continuously striving to keep product costs low, there can be no guarantee that profit margins will not fluctuate in future periods. Pricing pressure from competitors and costs of producing or purchasing new drugs may also fluctuate in the future. Changes in the future sales product mix may also occur. These changes may affect the gross profit percentage in future periods.
Research and development ("R&D") expenses decreased 24% to $8,587,046 in Fiscal 2011 from $11,251,421 in Fiscal 2010. The decrease is primarily due to the timing of milestone achievements for costs of products in development and completed phases for several biostudies. The Company expenses all production costs as R&D until the drug is approved by the FDA. R&D expenses may fluctuate from period to period, based on R&D plans for submission to the FDA.
Selling, general and administrative ("S, G & A") expenses decreased 8% to $15,911,702 in Fiscal 2011 from $17,375,320 in Fiscal 2010. The decrease is primarily due to incentive compensation costs incurred in Fiscal 2010, but not incurred in Fiscal 2011, as well as the reversal of the remaining Fiscal 2010 accrued bonuses totaling approximately $1,391,000 in the second quarter of Fiscal 2011 (see Note 10), of which approximately $1,010,000 was included in S,G &A. Partially offsetting the overall decrease are increased legal costs of approximately $784,000 related to the litigation with the FDA regarding the status of Grandfathered products, including our Morphine Sulfate Oral Solution. While the Company is focused on controlling costs, increases in personnel costs may have an ongoing and longer lasting impact on the administrative cost structure. Other costs are being incurred to facilitate improvements in the Company's infrastructure. These costs are expected to be temporary investments in the future of the Company and may not continue at the same level.
Grant income of $410,000 recognized in Fiscal 2011 is related to the grant funding received in July 2004 totaling $500,000 from the Commonwealth of Pennsylvania (the "Commonwealth"), acting through the Department of Community and Economic Development. The grant funding program required the Company to use the funds for machinery and equipment located at their Pennsylvania locations, hire additional full-time employees, operate its Pennsylvania locations a minimum of five years and meet certain matching investment requirements. If the Company failed to comply with any of the requirements above, the Company would be liable to repay the full amount of the grant funding ($500,000). In June 2011, the Company reached a formal agreement with the Commonwealth as to whether it complied with all of the requirements of the grant funding program. Based on the terms of the agreement, the Company is required to repay $90,000 to the Commonwealth, which resulted in the recognition of the remaining $410,000 of the funding as grant income (see Note 7).
Interest expense decreased to $214,519 in Fiscal 2011 from $275,870 in Fiscal 2010, due to lower levels of long-term debt outstanding during Fiscal 2011. Interest and dividend income increased to $90,986 in Fiscal 2011 from $62,328 in Fiscal 2010 due to higher interest earned on larger investment securities balances.
The Company recorded an income tax benefit totaling $461,568 in Fiscal 2011 compared to income tax expense totaling $4,813,044 in Fiscal 2010. The effective tax rate for Fiscal 2011 was 65.8% compared to 37.5% for Fiscal 2010. The effective tax rate for Fiscal 2011 was higher compared to Fiscal 2010 due primarily to the impact of income tax credits and the reversal of a portion of our liability for unrecognized tax benefits totaling $263,793 related to a settlement with the IRS. These increases were partially offset by the effect of nondeductible incentive stock option compensation expenses relative to the pretax income for Fiscal 2011. The effective tax rate for Fiscal 2010 includes the impact of a change in Pennsylvania tax law which lowered the Company's apportionment factor within this state. The impact of this change caused the Company to reduce its deferred tax assets by approximately $650,000, and therefore increased the effective tax rate by approximately 5% for Fiscal 2010. The increase in effective tax rate related to this change in Pennsylvania tax law was essentially offset by the impact of the settlement reached with the IRS related to its review of the federal income tax return for Fiscal 2008. As a result of the settlement, the Company recorded a refund receivable totaling approximately $421,000 and reduced its liability for unrecognized tax benefits by approximately $216,000. In addition, the Company amended its Fiscal 2005 income tax return during Fiscal 2010 to claim additional federal income tax credits, which was accepted as timely filed by
35
Table of Contents
the IRS. As a result, the Company reduced its income taxes payable for Fiscal 2010 by approximately $528,000 related to this amended income tax return.
At June 30, 2011, the Company has recognized a net deferred tax asset of $14,984,381. The net deferred tax asset is net of a valuation allowance of $1,997,365 that is related to the Cody notes receivable impairment incurred in conjunction with the acquisition of Cody Labs. The Company has provided for the valuation allowance related to the notes receivable impairment as this benefit will be realized only upon the disposition of Cody Labs. As the Company has no current plans to dispose of its holdings in Cody, a full valuation allowance has been established. The Company expects the remaining net deferred tax assets to be fully realizable based on the Company's history and future expectations of generating sufficient taxable income.
The Company reported a net loss attributable to Lannett of $276,900 for Fiscal 2011, or $0.01 basic and diluted loss per share, compared to net income attributable to Lannett of $7,821,067 for Fiscal 2010, or $0.32 basic and $0.31 diluted earnings per share.
Results of Operations - Fiscal 2010 compared to Fiscal 2009
Net sales increased 5% from $119,002,215 in Fiscal 2009 to $125,177,949 in Fiscal 2010. The following factors contributed to the $6,175,734 increase in sales:
Medical indication |
| Sales volume |
| Sales price |
|
Migraine Headache |
| (6 | )% | 9 | % |
Antibiotics |
| 5 | % | (5 | )% |
Prescription Vitamin |
| (47 | )% | (15 | )% |
Pain Management |
| 138 | % | 44 | % |
Epilepsy |
| (10 | )% | 26 | % |
Heart Failure |
| (19 | )% | (1 | )% |
Thyroid Deficiency |
| 9 | % | 0 | % |
Sales of drugs used for pain management increased by approximately $9,974,000 for Fiscal 2010 compared to Fiscal 2009. This increase is due to an increased number of products offered as well as a market withdrawal by one of our major competitors. Sales of drugs used in the treatment of thyroid deficiency increased by approximately $4,485,000 as a result of a continued shift away from branded drugs towards generic prescriptions. Partially offsetting these increases was a decrease in sales of our prescription vitamins of approximately $6,929,000 due to a lack of selling activities by the branded drug company. The overall increase in sales was also affected by a decrease in sales of drugs for the treatment of congestive heart failure by approximately $5,425,000 in Fiscal 2010 compared to Fiscal 2009. This decrease was due to a prior year product recall by several of our major competitors which increased our Fiscal 2009 revenues. Additional sales can also be attributed to new drugs used for the treatment of gallstones totaling approximately $2,190,000.
The Company expects to continue increasing the number of products available for sale to its customers, which will require additional FDA approvals. The Company's receipt of several approvals by the FDA to offer new products has resulted in more sales of new products in Fiscal 2010 compared to Fiscal 2009.The Company sells its products to customers in various categories. The table below presents the Company's net sales to each category.
Customer Category |
| Fiscal 2010 Net Sales |
| Fiscal 2009 Net Sales |
| ||
|
|
|
|
|
| ||
Wholesaler/Distributor |
| $ | 58.2 million |
| $ | 53.8 million |
|
|
|
|
|
|
| ||
Retail Chain |
| $ | 60.3 million |
| $ | 59.0 million |
|
|
|
|
|
|
| ||
Mail-Order Pharmacy |
| $ | 6.7 million |
| $ | 5.8 million |
|
|
|
|
|
|
| ||
Private Label |
| $ | - |
| $ | 0.4 million |
|
|
|
|
|
|
| ||
Total |
| $ | 125.2 million |
| $ | 119.0 million |
|
The sales to wholesaler/distributor and retail chain customer categories increased significantly as a result of an increase in the demand for products for which the Company is the major supplier and also an increase in the number of products available for sale.
36
Table of Contents
Cost of sales increased 14% to $83,838,142 in Fiscal 2010 from $73,757,746 in Fiscal 2009. The increase reflected the impact of the 5% increase in sales as well as additional royalties of approximately $455,180 primarily related to the sale of the prescription vitamins, our Amantadine product and the final payments under the Provell termination agreement. Additionally, the increase in cost of sales is attributable to two months of idle capacity costs at our Cody Labs subsidiary being directly expensed to the income statement during the second quarter of fiscal 2010. In March of 2009, the FDA issued a warning letter to nine companies including Lannett to remove Morphine Sulfate Oral Solution from the market until someone could submit an application and receive approval on such application. In April 2009, due to shortages of this fairly necessary drug in the marketplace, the FDA reversed their position and allowed all seven companies to continue manufacturing and/or marketing Morphine Sulfate up until 180 days after someone received approval on a Morphine Sulfate application. These actions by the FDA caused the DEA to withhold purchasing and manufacturing quota from some or all of these nine companies, including Lannett. Although the Company had quota at the time and quota issues were resolved by December 2009, the Cody Labs facility was left idle for the months of October and November 2009 due to the lack of Morphine Sulfate quota.
Amortization expense primarily relates to the JSP Distribution Agreement. For the remaining term of the JSP Distribution Agreement, the Company will incur annual amortization expense of approximately $1,785,000.
Gross profit margins for Fiscal 2010 and Fiscal 2009 were 33% and 38%, respectively. Gross profit percentage decreased due to the decline in sales of the prescription vitamin, the commencement of the related royalty and the Cody Labs idle capacity costs discussed above. While the Company is continuously striving to keep product costs low, there can be no guarantee that profit margins will not fluctuate in future periods. Pricing pressure from competitors and costs of producing or purchasing new drugs may also fluctuate in the future. Changes in the future sales product mix may also occur. These changes may affect the gross profit percentage in future periods.
Research and development ("R&D") expenses increased 34% to $11,251,421 in Fiscal 2010 from $8,427,135 in Fiscal 2009. The increase was primarily due to an increase in the number of drugs in development and preparation for submission to the FDA as well as increased costs for biostudies. The Company expenses all production costs as R&D until the drug is approved by the FDA. R&D expenses may fluctuate from period to period, based on R&D plans for submission to the FDA.
Selling, general and administrative ("S, G & A") expenses decreased 33% to $17,375,320 in Fiscal 2010 from $26,059,104 in Fiscal 2009. The decrease is primarily due to litigation expenses in Fiscal 2009 related to the patent challenge with KV Pharmaceuticals of approximately $6,537,000 which were not incurred in Fiscal 2010 as the litigation was settled in March 2009. In the third quarter of Fiscal 2009, the Company also incurred severance costs related to the departure of the Company's former chief financial officer of approximately $452,000 which were not incurred in Fiscal 2010. Most of the remaining decrease in S, G &A expense is due to the reallocation of personnel at Cody Labs during 2010 to production due to their transition during this fiscal year into a more fully functional manufacturing facility. The costs incurred during fiscal 2009 of getting the Cody facility compliant with FDA cGMP requirements, as well as the personnel and related expenses incurred to set up laboratories and manufacturing space, and writing and establishing all policies and procedures were expensed to S, G &A. While the Company is focused on controlling costs, increases in personnel costs may have an ongoing and longer lasting impact on the administrative cost structure. Other costs are being incurred to facilitate improvements in the Company's infrastructure. These costs are expected to be temporary investments in the future of the Company and may not continue at the same level.
Interest expense decreased to $275,870 in Fiscal 2010 from $321,751 in Fiscal 2009, due to lower levels of long term debt. Interest and dividend income decreased to $62,328 in Fiscal 2010 from $209,188 in Fiscal 2009 due to lower interest earned on smaller investment securities balances.
The Company recorded income tax expense totaling $4,813,044 in Fiscal 2010 compared to $4,090,716 in Fiscal 2009. The effective tax rate for Fiscal 2010 was 37.5% compared to 38.3% for Fiscal 2009. The effective tax rate for Fiscal 2010 includes the impact of a change in Pennsylvania tax law which lowered the Company's apportionment factor within this state. The impact of this change caused the Company to reduce its deferred tax assets by approximately $650,000, and therefore increased the effective tax rate by approximately 5% for Fiscal 2010. The increase in effective tax rate related to this change in Pennsylvania tax law was essentially offset by the impact of the settlement reached with the IRS related to its review of the federal income tax return for Fiscal 2008. As a result of the settlement, the Company recorded a refund receivable totaling approximately $421,000 and reduced its liability for unrecognized tax benefits by approximately $216,000. In addition, the Company amended its Fiscal 2005 income tax return to claim additional federal income tax credits, which was accepted as timely filed by the IRS. As a result, the Company reduced its income taxes payable by approximately $528,000 related to this amended income tax return.
At June 30, 2010, the Company has recognized a net deferred tax asset of $17,881,721. The net deferred tax asset is net of a valuation allowance of $2,016,620 that is related to the Cody notes receivable impairment incurred in conjunction with the acquisition of Cody Labs. The Company has provided for the valuation allowance related to the notes receivable impairment as this benefit will be
37
Table of Contents
realized only upon the disposition of Cody Labs. As the Company has no current plans to dispose of its holdings in Cody, a full valuation allowance has been established. The Company expects the remaining net deferred tax assets to be fully realizable based on the Company's history and future expectations of generating sufficient taxable income.
The Company reported net income attributable to Lannett of $7,821,067 for Fiscal 2010, or $0.32 basic and $0.31 diluted earnings per share, compared to net income attributable to Lannett of $6,534,245 for Fiscal 2009, or $0.27 basic and diluted earnings per share.
Liquidity and Capital Resources
The Company has historically financed its operations with cash flow generated from operations, supplemented with borrowings from various government agencies and financial institutions. During Fiscal 2011, the Company completed a secondary stock offering of 3,250,000 shares which generated net proceeds of approximately $14,950,000. At June 30, 2011, working capital was $59,281,653 as compared to $40,104,705 at June 30, 2010, an increase of $19,176,948.
Net cash used in operating activities of $6,202,178 for the fiscal year ended June 30, 2011 reflected net loss of $239,800 after adjustments for non-cash items of $9,129,035, as well as cash used by changes in operating assets and liabilities of $15,091,413. Significant changes in operating assets and liabilities are comprised of:
· A decrease in trade accounts receivable of $4,860,000 primarily as a result of decreased sales in the fourth quarter of Fiscal 2011 compared to the fourth quarter of Fiscal 2010.
· An increase in inventories of $7,846,000 primarily due to an increase in raw material stocking levels for certain products as of June 30, 2011 which are being carried to fulfill customer back orders as well as products currently under development.
· An increase in income taxes receivable of $3,636,000 from an income taxes payable balance of $1,480,000 due to a Fiscal 2011 taxable net operating loss which the Company plans to carryback to apply against Fiscal 2009 taxable income, in addition to estimated tax payments made in September 2010 related to Fiscal 2010.
· An increase in accounts payable of $2,007,000 due to the timing of payments at the end of the month.
· A decrease in accrued expenses of $2,110,000 primarily due to the settlement agreement with KV, which resulted in a payment of $850,000 to KV and a $618,000 reversal of accrued royalty expense, as well as due to the timing of biostudy and product development milestone achievements.
· A decrease in rebates, chargebacks and returns payable of $1,685,000 primarily due to a decrease in chargeback reserves mainly due to a decrease in inventory levels at wholesaler distribution centers, and a decrease in the rebates reserve as a result of reduced gross sales to customers who participate in rebate programs as well as timing of actual rebate credits issued.
· A decrease in accrued payroll and payroll related costs of $5,370,000 primarily related to the payment in the first quarter of Fiscal 2011 of the Fiscal 2010 accrued incentive compensation costs totaling approximately $3,421,000 , as well as the reversal of the remaining Fiscal 2010 accrued bonuses totaling approximately $1,391,000 in the second quarter of Fiscal 2011.
Net cash used in investing activities of $25,648,000 for the year ended June 30, 2011 is mainly the result of purchases of property, plant and equipment of $7,254,000 and purchases of investment securities of $28,153,000 partially offset by proceeds of $9,750,000 from the sale of investment securities.
Net cash provided by financing activities of $15,243,000 for Fiscal 2011 was primarily due to the net proceeds received from the Company's secondary public stock offering totaling $14,950,000. We intend to use the net proceeds we received from these offerings for general corporate purposes, including, without limitation, research and development expenses, general and administrative expenses, manufacturing expenses, potential acquisitions of companies, technologies and properties that complement our business (although we are not currently party to any binding agreements or commitments with respect to any such acquisitions) and working capital. Pending these uses described above, we expect to invest our net proceeds in investment-grade, interest-bearing instruments. Proceeds from the issuance of debt totaling $5,056,000 include a set of mortgages on the Company's new Townsend Road facility with both Wells Fargo N.A. and the Pennsylvania Industrial Development Authority ("PIDA"). The Wells Fargo portion of the loan is for $3,056,000 and the PIDA portion of the loan is for $2,000,000. Partially offsetting these proceeds were scheduled debt repayments of $4,954,000, which included the repayment of the $4,500,000 PIDC Regional Center, LP III loan which was repaid on December 13, 2010. Additional financing activities included proceeds from the issuance of stock related to employee stock plans of $501,000 partially offset by the purchase of shares of treasury stock totaling $221,000.
The Company has entered into agreements with various government agencies and financial institutions to provide additional cash to help finance the Company's operations. These borrowing arrangements as of June 30, 2011 are as follows:
38
Table of Contents
The Company had a $3,000,000 line of credit from Wells Fargo, N. A., formerly Wachovia Bank, N.A. ("Wells Fargo") that bears interest at the prime interest rate less 0.25% (3.0% at June 30, 2011 and June 30, 2010, respectively). Availability under the line of credit is reduced by outstanding letters of credit. As of June 30, 2011 and 2010, the Company had $2,995,000 and $3,000,000, respectively, of availability under this line of credit. The line of credit was collateralized by substantially all of the Company's assets. The agreement contained covenants with respect to working capital, net worth and certain ratios, as well as other covenants.
Effective as of March 31, 2011, the Company renegotiated this line of credit as part of establishing a mortgage on its new Townsend Road property (see Note 8 - Long Term-Debt). As part of this renegotiation, the line which expires on March 31, 2012, is now only collateralized by the working capital assets of the Company. As of June 30, 2011, the Company was in compliance with the new financial covenants under the agreement. The availability fee on the unused balance of the line of credit is 0.375%.
In December 2005, the Company financed $4,500,000 through the Philadelphia Industrial Development Corporation (PIDC). The outstanding principal balance, which was due and payable on December 13, 2010, was repaid on that date. The Company paid a bi-annual interest payment at a rate equal to two and one-half percent per annum.
The Company borrowed $1,250,000 through the PIDA. The Company is required to make equal payments each month for 180 months starting February 1, 2006 with interest of two and three-quarter percent per annum. The PIDA Loan has $856,549 outstanding as of June 30, 2011 with $79,228 currently due.
The Company borrowed $500,000 from the Pennsylvania Department of Community and Economic Development Machinery and Equipment Loan Fund. The Company is required to make equal payments for 60 months starting May 1, 2006 with interest of two and three quarter percent per annum. As of June 30, 2011, this loan was repaid in full.
In April 1999, the Company entered into a loan agreement with the Philadelphia Authority for Industrial Development (the "Authority" or "PAID"), to finance future construction and growth projects of the Company. The Authority issued $3,700,000 in tax-exempt variable rate demand and fixed rate revenue bonds to provide the funds to finance such growth projects pursuant to a trust indenture ("the Trust Indenture"). A portion of the Company's proceeds from the bonds was used to pay for bond issuance costs of approximately $170,000. The Trust Indenture requires that the Company repay the Authority loan through installment payments beginning in May 2003 and continuing through May 2014, the year the bonds mature. The bonds bear interest at the floating variable rate determined by the organization responsible for selling the bonds (the "remarketing agent"). The interest rate fluctuates on a weekly basis. The effective interest rate at June 30, 2011 was 0.40%. At June 30, 2011, the Company has $425,000 outstanding on the Authority loan, of which $135,000 is classified as currently due. The remainder is classified as a long-term liability. In April 1999, an irrevocable letter of credit of $3,770,000 was issued by Wachovia to secure payment of the Authority Loan and a portion of the related accrued interest. At June 30, 2011, no portion of the letter of credit has been utilized.
The Company has negotiated a set of mortgages on its new Townsend Road facility with both Wells Fargo N.A. and PIDA. The Wells Fargo portion of the loan is for $3,056,000, bears a floating interest rate of the One Month LIBOR rate plus 2.95%, amortizes the loan over a 15 year term and has an eight year maturity date. The effective interest rate at June 30, 2011 was 3.14%. The PIDA portion of the loan is for $2,000,000, bears an interest rate 3.75% and matures in 15 years. Both loans closed and were funded in May 2011.
The Company has executed Security Agreements with Wells Fargo, PIDA and PIDC in which the Company has agreed to pledge its working capital, some equipment and its Townsend Road property to collateralize the amounts due.
The Company consolidates Cody LCI Realty, LLC, a variable interest entity ("VIE"), for which Cody Labs is the primary beneficiary. See note 13 to our Consolidated Financial Statements for "Consolidation of Variable Interest Entities." A mortgage loan with First National Bank of Cody related to the purchase of land and building by the VIE has also been consolidated in the Company's consolidated balance sheets. The mortgage requires monthly principal and interest payments of $14,782. Effective February 2011, the interest rate was modified from a fixed rate of 7.5% to a floating rate with a floor of 4.5% and a ceiling of 9.0%, with payments to be made through April 2022. As of June 30, 2011, $1,518,336 is outstanding under the mortgage loan, of which $110,212 is classified as currently due with a rate of 4.5%. The mortgage is collateralized by the land and building.
39
Table of Contents
The following table represents annual contractual obligations as of June 30, 2011:
|
|
|
| Less than 1 |
|
|
|
|
| More than 5 |
| |||||
|
| Total |
| year |
| 1-3 years |
| 3-5 years |
| Years |
| |||||
|
|
|
|
|
|
|
|
|
|
|
| |||||
Long-Term Debt |
| $ | 7,821,931 |
| $ | 629,435 |
| $ | 1,315,015 |
| $ | 1,073,386 |
| $ | 4,804,095 |
|
Operating Leases |
| 61,075 |
| 40,600 |
| 20,475 |
| - |
| - |
| |||||
Purchase Obligations |
| 63,607,500 |
| 22,357,500 |
| 41,250,000 |
| - |
| - |
| |||||
Interest on Obligations |
| 1,859,876 |
| 259,514 |
| 459,501 |
| 381,090 |
| 759,771 |
| |||||
Total |
| $ | 73,350,382 |
| $ | 23,287,049 |
| $ | 43,044,991 |
| $ | 1,454,476 |
| $ | 5,563,866 |
|
Purchase obligations primarily relate to the JSP Distribution Agreement. See note 18 to our Consolidated Financial Statements for more information on the terms, conditions and financial impact of the JSP Distribution Agreement.
Prospects for the Future
Generic pharmaceutical manufacturers and distributors are constantly faced by pricing pressure in the marketplace as competitors attempt to lure business from distributors, wholesalers and chain retailers by offering lower prices than the incumbent supplier. Lannett tries to differentiate itself in the marketplace by complementing its lower cost offerings with higher levels of customer service and quality of the products. But as Lannett enters Fiscal Year 2012, there in an increasing number of competitors on our key products that are attempting to supplant Lannett as the preferred vendor. Lannett will continue to evaluate each event as it arises, but any reductions in either volumes or pricing will have a negative impact on the gross profit margins of the Company.
Beginning in the first quarter of Fiscal 2011, Lannett faced significant pricing challenges on its top two selling products. In order to keep the volume of business with the specific customers involved, Lannett chose to reduce its selling price on both of the products. These price reductions will have a significant impact to the gross profit margins and profitability of Lannett expected in the future.
Starting in the third quarter of Fiscal 2011, Lannett is no longer marketing its OB Natal One product as the terms of the March 2009 settlement with KV Pharmaceuticals required, and was confirmed in our December 2010 settlement with KV, that Lannett suspend sales of this product by December 31, 2010. Additionally, the Company has had difficulty marketing its Oxycodone HCL Solution product starting in the third quarter of Fiscal 2011 due to the current limitations by the DEA to grant additional manufacturing quota to Cody Labs for its production. Both of these products combined contributed approximately $7.0 million in revenue in Fiscal 2010 and $6.4 million in Fiscal 2011. The loss of these products will have a significant impact to the gross profit margins and profitability of Lannett expected in the future.
The Company has several generic products under development. These products are all orally-administered, topical, injectable and parenteral products designed to be generic equivalents to brand named innovator drugs. The Company's developmental drug products are intended to treat a diverse range of indications. As one of the oldest generic drug manufacturers in the country, formed in 1942, Lannett currently owns several ANDAs for products which it does not manufacture and market. These ANDAs are dormant on the Company's records. Occasionally, the Company reviews such ANDAs to determine if the market potential for any of these older drugs has recently changed, so as to make it attractive for Lannett to reconsider manufacturing and selling it. If the Company makes the determination to introduce one of these products into the consumer marketplace, it must review the ANDA and related documentation to ensure that the approved product specifications, formulation and other factors meet current FDA requirements for the marketing of that drug. The Company would then redevelop the product and submit it to the FDA for supplemental approval. The FDA's approval process for ANDA supplements is similar to that of a new ANDA. Generally, in these situations, the Company must file a supplement to the FDA for the applicable ANDA, informing the FDA of any significant changes in the manufacturing process, the formulation, or the raw material supplier of the previously-approved ANDA. Recently, the FDA has announced that it will prioritize its review of 3,800 Chemistry Manufacturing and Control ("CMC") supplements in order to make progress on reviewing a backlog of over 2,200 ANDAs. This could negatively impact the sales of existing products.
The products under development are at various stages in the development cycle-formulation, scale-up, and/or clinical testing. Depending on the complexity of the active ingredient's chemical characteristics, the cost of the raw material, the FDA-mandated requirement of bioequivalence studies, the cost of such studies and other developmental factors, the cost to develop a new generic product varies and can range from $100,000 to $1.7 million. Some of Lannett's developmental products will require bioequivalence studies, while others will not-depending on the FDA's Orange Book classification. Since the Company has no control over the FDA review process, management is unable to anticipate whether or when it will be able to begin producing and shipping additional products.
40
Table of Contents
The Company views its April 2007 acquisition of Cody Laboratories, Inc. ("Cody Labs" or "Cody") as an important step in becoming a vertically integrated narcotics manufacturer and distributor by allowing it to concentrate on developing and completing its dosage form manufacturing in order to reduce narcotic API costs. In July 2008, the DEA granted Cody Labs a license to directly import raw poppy straw for conversion into API and/or various pharmaceutical products. Only six other companies in the U.S. have been granted this license to date. This license allows the Company to avoid increased costs associated with buying narcotic API from other manufacturers. The Company anticipates that it can use this license to become a vertically integrated manufacturer of narcotic products, as well as a supplier of API to the pharmaceutical industry. The Company believes that the aging domestic population may result in a higher demand for pain management pharmaceutical products and that it will be well-positioned to take advantage of this increased demand.
Cody Labs' manufacturing expertise in narcotic APIs will allow Lannett to build a market with limited domestic competition. The Company anticipates that the demand for narcotics and controlled drugs will continue to grow with the "Baby Boomer" generation demographics and that it is well-positioned to take advantage of these opportunities by concentrating additional resources in the narcotic area. The sale of pain management products approximated 11% of Net Sales for the year Fiscal 2010 and 14% of Net Sales for the Fiscal 2011. Additionally, the API and dosage form production of these products were performed at our Cody Labs operations and, due to the increased volumes of sales on these products, allowed Cody to be profitable for the entire 2010 fiscal year. Due to the FDA's actions against Morphine Sulfate Oral Solution and a slow down in the demand for one other product that is manufactured at Cody, Lannett incurred a decrease in the percentage of sales related to pain management products during Fiscal 2011. Therefore, Cody was unprofitable during Fiscal 2011. Since the Company received the FDA approval for its 505(b)(2) New Drug Application for Morphine Sulfate Oral Solution in June 2011, the Company expects the portion of net sales related to pain management products to increase again.
In addition to the efforts of its internal product development group, Lannett has contracted with several outside firms for the formulation and development of several new generic drug products. These outsourced R&D products are at various stages in the development cycle - formulation, analytical method development and testing and manufacturing scale-up. These products are orally-administered solid dosage products, topical, injectable or parenterals intended to treat a diverse range of medical indications. We intend to ultimately transfer the formulation technology and manufacturing process for most of these R&D products to our own commercial manufacturing sites. The Company initiated these outsourced R&D efforts to complement the progress of its own internal R&D efforts.
Occasionally, the Company will work on developing a drug product that does not require FDA approval. Certain prescription drugs do not require prior FDA approval before marketing. They include, for instance, drugs listed as DESI drugs (Drug Efficacy Study implementation) which are under evaluation by FDA, Grandfathered Drugs, and prescription multivitamin drugs. A generic manufacturer may sell products which are chemically equivalent to innovator drugs, under FDA rules by simply performing and internally documenting the normal research and development involved in bringing a new product to market. Under this scenario, a generic company can forego the time required for FDA approval.
More specifically, certain products, marketed prior to the Federal Food, Drug and Cosmetic Act may be considered GRASE or Grandfathered. GRASE products are those "old drugs that do not require prior approval from FDA in order to be marketed because they are generally recognized as safe and effective based on published scientific literature." Similarly, Grandfathered products are those which "entered the market before the passage of the 1938 act or the 1962 amendments to the act." Under the grandfather clause, such a product is exempted from the "effectiveness requirements [of the act] if its composition and labeling have not changed since 1962 and if, on the day before the 1962 amendments became effective, it was (1) used or sold commercially in the United States, (2) not a new drug as defined by the act at that time, and (3) not covered by an effective application." Recently, the FDA has increased its efforts to force companies to file and seek FDA approval for these GRASE products. Efforts have included granting market exclusivity to approved GRASE products and issuing notices to companies currently producing these products.
The Company has entered supply and development agreements with certain international companies, including Wintac of India, Orion Pharma of Finland, Azad Pharma AG and Swiss Caps of Switzerland, Pharma 2B (formerly Pharmaseed) of Israel and the GC Group, as well as certain domestic companies, including JSP, Banner Pharmacaps, Cerovene and Summit Bioscience LLC. The Company is currently in negotiations on similar agreements with other international companies, through which Lannett will market and distribute products manufactured by Lannett or by third parties. Lannett intends to use its strong customer relationships to build its market share for such products, and increase future revenues and income.
The majority of the Company's R&D projects are being developed in-house under Lannett's direct supervision and with Company personnel. Hence, the Company does not believe that its outside contracts for product development and manufacturing supply are material in nature, nor is the Company substantially dependent on the services rendered by such outside firms.
41
Table of Contents
Lannett may increase its focus on certain specialty markets in the generic pharmaceutical industry. Such a focus is intended to provide Lannett customers with increased product alternatives in categories with relatively few market participants. While there is no guarantee that Lannett has the market expertise or financial resources necessary to succeed in such a market specialty, management is confident that such future focus will be well received by Lannett customers and increase shareholder value in the long run.
The Company plans to enhance relationships with strategic business partners, including providers of product development research, raw materials, active pharmaceutical ingredients as well as finished goods. Management believes that mutually beneficial strategic relationships in such areas, including potential financing arrangements, partnerships, joint ventures or acquisitions, could allow for potential competitive advantages in the generic pharmaceutical market. The Company plans to continue to explore such areas for potential opportunities to enhance shareholder value.
ITEM 7A. QUANTITATIVE AND QUALITATIVE DISCLOSURES ABOUT MARKET RISK
The Company has debt instruments with variable interest rates. The Company had a $3,000,000 line of credit from Wells Fargo that bears interest at the prime interest rate less 0.25% (3.0% at June 30, 2011 and 2010, respectively). Availability under the line of credit is reduced by outstanding letters of credit. As of June 30, 2011 and June 30, 2010, the Company had $2,995,000 and $3,000,000, respectively, of availability under this line of credit. The line of credit was collateralized by substantially all of the Company's assets. The agreement contained covenants with respect to working capital, net worth and certain ratios, as well as other covenants. Effective as of March 31, 2011, the Company renegotiated this line of credit as part of establishing a mortgage on its new Townsend Road property. As part of this renegotiation, the line which expires on March 31, 2012, is now only collateralized by the working capital assets of the Company. As of June 30, 2011, the Company was in compliance with the new financial covenants under the agreement. Under the previous agreement with Wells Fargo, the existing line of credit would have expired on November 30, 2011.
The Company has negotiated a set of mortgages on its new Townsend Road facility with both Wells Fargo and PIDA. The Wells Fargo portion of the loan is for $3,056,000, bears a floating interest rate of the One Month LIBOR rate plus 2.95%, amortizes the loan over a 15 year term and has an eight year maturity date. The effective interest rate at June 30, 2011 was 3.14%.
A mortgage loan with First National Bank of Cody related to the purchase of land and building by Cody LCI Realty, LLC, a variable interest entity, has also been consolidated in the Company's consolidated balance sheets. The mortgage requires monthly principal and interest payments of $14,782. Effective February 2011, the interest rate was modified from a fixed rate of 7.5% to a floating rate with a floor of 4.5% and a ceiling of 9.0%, with payments to be made through April 2022. As of June 30, 2011, $1,518,336 is outstanding under the mortgage loan with a rate of 4.5%. The mortgage is collateralized by the land and building.
The Company invests in equity securities, U.S. government agency securities and corporate bonds, which are exposed to market and interest rate fluctuations. The interest and dividends earned on these investments may vary based on fluctuations in interest rate and market conditions.
ITEM 8. FINANCIAL STATEMENTS AND SUPPLEMENTARY DATA
The Consolidated Financial Statements and Report of the Independent Registered Public Accounting Firm filed as a part of this Form 10-K are listed in the Exhibit Index filed herewith.
ITEM 9. CHANGES IN AND DISAGREEMENTS WITH ACCOUNTANTS ON ACCOUNTING AND FINANCIAL DISCLOSURE
None.
ITEM 9A. CONTROLS AND PROCEDURES
Disclosure Controls and Procedures
We carried out an evaluation under the supervision and with the participation of our management, including our chief executive officer and chief financial officer, of the effectiveness of the design and operation of our disclosure controls and procedures, as such term is defined under Rule 13a-15(e) promulgated under the Securities Exchange Act of 1934 (the "Exchange Act"), as amended for financial reporting as of June 30, 2011. Based on that evaluation, our chief executive officer and chief financial officer concluded that these controls and procedures are effective to ensure that information required to be disclosed by the Company in reports that it files or submits under the Exchange Act is recorded, processed, summarized, and reported as specified in Securities and Exchange Commission rules and forms. There were no changes in these controls or procedures identified in connection with the evaluation of
42
Table of Contents
such controls or procedures that occurred during our last fiscal quarter, or in other factors that have materially affected, or are reasonably likely to materially affect these controls or procedures.
Our disclosure controls and procedures are designed to ensure that information required to be disclosed by us in the reports that we file or submit under the Exchange Act is recorded, processed, summarized, and reported, within the time periods specified in the rules and forms of the Securities and Exchange Commission. These disclosure controls and procedures include, among other things, controls and procedures designed to ensure that information required to be disclosed by us in the reports that we file under the Exchange Act is accumulated and communicated to our management, including our chief executive officer and chief financial officer, as appropriate to allow timely decisions regarding required disclosure.
Management's Report on Internal Control over Financial Reporting
Our management is responsible for establishing and maintaining adequate internal control over financial reporting. Internal control over financial reporting is defined in Rule 13a-15(f) and 15d-15(f) under the Exchange Act as a process designed by, or under the supervision of, the chief executive officer and chief financial officer and effected by the board of directors and management to provide reasonable assurance regarding the reliability of financial reporting and the preparation of financial statements for external purposes in accordance with generally accepted accounting principles and includes those policies and procedures that:
· Pertain to the maintenance of records that in reasonable detail accurately and fairly reflect the transactions and dispositions of our assets;
· Provide reasonable assurance that transactions are recorded as necessary to permit preparation of financial statements in accordance with generally accepted accounting principles, and that receipts and expenditures of the company are being made only in accordance with authorizations of our management and board of directors;
· Provide reasonable assurance regarding prevention or timely detection of unauthorized acquisition, use or disposition of our assets that could have a material effect on the financial statements.
Because of its inherent limitations, internal control over financial reporting may not prevent or detect misstatements. Projections of any evaluation of effectiveness to future periods are subject to the risks that controls may become inadequate because of changes in conditions, or that the degree of compliance with the policies or procedures may deteriorate.
Our management assessed the effectiveness of our internal control over financial reporting as of June 30, 2011. In making this assessment, our management used the criteria set forth by the Committee of Sponsoring Organizations of the Treadway Commission (COSO) in Internal Control-Integrated Framework.
Based on our assessment, our management believes that, as of June 30, 2011, our internal control over financial reporting is effective.
The effectiveness of our internal control over financial reporting as of June 30, 2011 has been audited by Grant Thornton LLP, an independent registered public accounting firm, as stated in their report included in this Annual Report on Form 10-K below.
Changes in Internal Control over Financial Reporting
During the quarter ended June 30, 2011, there were no changes in the Company's internal control over financial reporting (as defined in Rule 13a-15(f) of the Exchange Act) that materially affected, or are reasonably likely to materially affect, the Company's internal control over financial reporting.
43
Table of Contents
Report of Independent Registered Public Accounting Firm
Board of Directors and Shareholders
Lannett Company, Inc. and Subsidiaries
We have audited Lannett Company Inc. and Subsidiaries (a Delaware corporation) internal control over financial reporting as of June 30, 2011, based on criteria established in Internal Control-Integrated Framework issued by the Committee of Sponsoring Organizations of the Treadway Commission (COSO). Lannett Company, Inc. and Subsidiaries' management is responsible for maintaining effective internal control over financial reporting and for its assessment of the effectiveness of internal control over financial reporting, included in the accompanying Management's Report on Internal Control over Financial Reporting. Our responsibility is to express an opinion on Lannett Company, Inc and Subsidiaries internal control over financial reporting based on our audit.
We conducted our audit in accordance with the standards of the Public Company Accounting Oversight Board (United States). Those standards require that we plan and perform the audit to obtain reasonable assurance about whether effective internal control over financial reporting was maintained in all material respects. Our audit included obtaining an understanding of internal control over financial reporting, assessing the risk that a material weakness exists, testing and evaluating the design and operating effectiveness of internal control based on the assessed risk, and performing such other procedures as we considered necessary in the circumstances. We believe that our audit provides a reasonable basis for our opinion.
A company's internal control over financial reporting is a process designed to provide reasonable assurance regarding the reliability of financial reporting and the preparation of financial statements for external purposes in accordance with generally accepted accounting principles. A company's internal control over financial reporting includes those policies and procedures that (1) pertain to the maintenance of records that, in reasonable detail, accurately and fairly reflect the transactions and dispositions of the assets of the company; (2) provide reasonable assurance that transactions are recorded as necessary to permit preparation of financial statements in accordance with generally accepted accounting principles, and that receipts and expenditures of the company are being made only in accordance with authorizations of management and directors of the company; and (3) provide reasonable assurance regarding prevention or timely detection of unauthorized acquisition, use, or disposition of the company's assets that could have a material effect on the financial statements.
Because of its inherent limitations, internal control over financial reporting may not prevent or detect misstatements. Also, projections of any evaluation of effectiveness to future periods are subject to the risk that controls may become inadequate because of changes in conditions, or that the degree of compliance with the policies or procedures may deteriorate.
In our opinion, Lannett Company, Inc. and Subsidiaries maintained, in all material respects, effective internal control over financial reporting as of June 30, 2011, based on criteria established in Internal Control-Integrated Framework issued by COSO.
We also have audited, in accordance with the standards of the Public Company Accounting Oversight Board (United States), the consolidated financial statements of Lannett Company, Inc. and Subsidiaries and our report dated September 9, 2011 expressed an unqualified opinion.
/s/ GRANT THORNTON LLP
Philadelphia, Pennsylvania
September 9, 2011
ITEM 9B. OTHER INFORMATION
None.
44
Table of Contents
PART III
ITEM 10. DIRECTORS AND EXECUTIVE OFFICERS AND CORPORATE GOVERNANCE
Directors and Executive Officers
The directors and executive officers of the Company are set forth below:
|
| Age |
| Position |
Directors: |
|
|
|
|
|
|
|
|
|
William Farber |
| 79 |
| Chairman Emeritus |
|
|
|
|
|
Ronald A. West |
| 77 |
| Chairman of the Board |
|
|
|
|
|
Jeffrey Farber |
| 51 |
| Vice Chairman of the Board |
|
|
|
|
|
Arthur P. Bedrosian |
| 65 |
| Director |
|
|
|
|
|
Kenneth Sinclair Ph.D. |
| 64 |
| Director |
|
|
|
|
|
Albert I. Wertheimer, Ph.D. |
| 68 |
| Director |
|
|
|
|
|
Myron Winkelman |
| 73 |
| Director |
|
|
|
|
|
David Drabik |
| 43 |
| Director |
|
|
|
|
|
Officers: |
|
|
|
|
|
|
|
|
|
Arthur P. Bedrosian |
| 65 |
| President and Chief Executive Officer |
|
|
|
|
|
Martin P. Galvan |
| 59 |
| Vice President of Finance and Chief Financial Officer |
|
|
|
|
|
William F. Schreck |
| 62 |
| Chief Operating Officer |
|
|
|
|
|
Kevin R. Smith |
| 51 |
| Vice President of Sales and Marketing |
|
|
|
|
|
Ernest J. Sabo |
| 63 |
| Vice President of Regulatory Affairs and Chief Compliance Officer |
|
|
|
|
|
Robert Ehlinger |
| 53 |
| Vice President of Logistics and Chief Information Officer |
William Farber was elected as Chairman of the Board of Directors in August 1991. From April 1993 to the end of 1993, Mr. Farber was the President and a director of Auburn Pharmaceutical Company. From 1990 through March 1993, Mr. Farber served as Director of Purchasing for Major Pharmaceutical Corporation. From 1965 through 1990, Mr. Farber was the Chief Executive Officer of Michigan Pharmacal Corporation. Mr. Farber was previously a registered pharmacist in the State of Michigan for more than 40 years until his retirement from active employment in the pharmaceutical industry. On June 1, 2011, Mr. Farber retired from his position as Chairman of the Board and was appointed Chairman Emeritus.
Ronald A. West was elected a Director of the Company in January 2002. In September 2004, Mr. West was elected Vice Chairman of the Board of Directors and on June 1, 2011 was elected to serve as Chairman of the Board. Mr. West is currently a Director of Beecher Associates, an industrial real estate investment company. Prior to this, from 1983 to 1987, Mr. West, member of the Audit and Compensation committees at Lannett, served as Chairman and Chief Executive Officer of Dura Corporation, an original equipment manufacturer of automotive products and other engineered equipment components. In 1987, Mr. West sold his ownership position in Dura Corporation, at which time he retired from active management positions. Mr. West was employed at Dura Corporation since 1969. Prior to this, he served in various financial management positions with TRW, Inc., Marlin Rockwell
45
Table of Contents
Corporation and National Machine Products Group, a division of Standard Pressed Steel Company. Mr. West studied Business Administration at Michigan State University and the University of Detroit.
The Nominating and Governance Committee concluded that Mr. West is qualified and should continue to serve, due, in part, because of his long and successful career in the manufacturing sector, both as a senior executive and as a financial manager. In addition to his financial analytic skills, he is a natural leader with solid experience in corporate governance.
Jeffrey Farber was elected a Director of the Company in May 2006 and was appointed to Vice Chairman of the Board of Directors in July 2011. Jeffrey Farber joined the Company in August 2003 as Secretary. Since 1994, Mr. Farber has been President and the owner of Auburn Pharmaceutical ("Auburn"), a national generic pharmaceutical distributor. Prior to starting Auburn, Mr. Farber served in various positions at Major Pharmaceutical ("Major"), where he was employed for over 15 years. At Major, Mr. Farber was involved in sales, purchasing and eventually served as President of the mid-west division. Mr. Farber also spent time working at Major's manufacturing division - Vitarine Pharmaceuticals - where he served on its Board of Directors. Mr. Farber graduated from Western Michigan University with a Bachelors of Science Degree in Business Administration and participated in the Pharmacy Management Graduate Program at Long Island University. Mr. Farber is the son of William Farber, the Chairman Emeritus of the Board of Directors of the Company.
The Nominating and Governance Committee concluded that Mr. Farber is qualified and should continue to serve, due, in part, to his significant experience in the generic drug industry and his ongoing role as the owner of a highly regarded and successful generic drug distributor. His skills include a thorough knowledge of the generic drug marketplace and drug supply chain management.
Kenneth Sinclair, Ph.D. , was elected a Director of the Company in September 2005. Dr. Sinclair is currently Professor of Accounting and Senior Advisor to the College of Business and Economics Dean at Lehigh University, where he began his academic career in 1972. Dr. Sinclair had served as Chair of Lehigh's Accounting Department from 1988 to 1994 and 1998 to 2007. He has taught a variety of accounting courses, including financial and managerial accounting at both the undergraduate and graduate level. He has been recognized for his teaching innovation, held leadership positions with professional accounting organizations and served on numerous academic and advisory committees. He has received a number of awards and honors for teaching and service, and has researched and written on a myriad of subjects related to accounting. He has also been heavily involved with strategic planning at both the College and Department level at Lehigh. Dr. Sinclair earned a Bachelor of Business Administration degree in Accounting, a Master of Science degree in Accounting and a Doctorate Degree in Business Administration with a concentration in Accounting from the University of Massachusetts.
The Nominating and Governance Committee concluded that Dr. Sinclair is qualified and should continue to serve, due, in part to his long and distinguished career as an accounting academic and his deep understanding of accounting and financial reporting. His skills also include organizational planning and interpersonal relations.
Albert I. Wertheimer, Ph.D., was elected a Director of the Company in September 2004. Dr. Wertheimer has a long and distinguished career in various aspects of pharmacy, health care, education and pharmaceutical research. Since 2000, Dr. Wertheimer has been a professor at the School of Pharmacy at Temple University, and director of its Center for Pharmaceutical Health Services Research. From 1997 to 2000, Dr. Wertheimer was Director of Outcomes Research and Management at Merck & Co., Inc. In addition to his academic responsibilities, he is the author of 28 books and more than 380 journal articles. Dr. Wertheimer also provides consulting services to institutions in the pharmaceutical industry. Dr. Wertheimer's academic experience includes professorships and other faculty and administrative positions at several educational institutions, including the Medical College of Virginia, St. Joseph's University, Philadelphia College of Pharmacy and Science and the University of Minnesota. Dr. Wertheimer's previous professional experience includes pharmacy services in commercial and non-profit environments. Professor Wertheimer is a licensed pharmacist in five states, and is a member of several health associations, including the American Pharmacists Association and the American Public Health Association. Dr. Wertheimer is the editor of the Journal of Pharmaceutical Health Services Research ; and he has been on the editorial board of the Journal of Managed Pharmaceutical Care, Medical Care , and other healthcare journals. Dr. Wertheimer has a Bachelor of Science Degree in Pharmacy from the University of Buffalo, a Master of Business Administration from the State University of New York at Buffalo, a Doctorate from Purdue University and a Post Doctoral Fellowship from the University of London, St. Thomas' Medical School.
The Nominating and Governance Committee concluded that Dr. Wertheimer is qualified and should continue to serve, due, in part to his deep understanding of all aspects of pharmacy practice, including retail and manufacturing. His skills include business planning and a sound knowledge of drug regulation and distribution.
Myron Winkelman, R.Ph., was elected a Director of the Company in June 2003. Mr. Winkelman has significant career experience in various aspects of pharmacy and health care. He is currently President of Winkelman Management Consulting ("WMC"), which
46
Table of Contents
provides consulting and audit services to both commercial and governmental clients. He has served in this position since 1994. Prior to creating WMC, he was a senior executive with ValueRx, a large pharmacy benefits manager, and served for many years as a senior executive for the Revco, Rite Aid and Perry Drug chains. While at ValueRx, Mr. Winkelman served on the Board of Directors of the Pharmaceutical Care Management Association. He belongs to a number of pharmacy organizations, including the Academy of Managed Care Pharmacy and the Michigan Pharmacy Association. Mr. Winkelman is a registered pharmacist and holds a Bachelor of Science Degree in Pharmacy from Wayne State University.
The Nominating and Governance Committee concluded that Mr. Winkelman is qualified and should continue to serve, due, in part to his experiences with and knowledge of Pharmacy Benefit Administration and Mail Order Pharmacy. His skills include a deep understanding of government pharmacy benefits and the drug supply chain.
David Drabik, was elected a Director of the Company in January 2011. Since 2002, Mr. Drabik has been President of Cranbrook & Co., LLC ("Cranbrook"), an advisory firm primarily serving the private equity and venture capital community. At Cranbrook, Mr. Drabik assists and advises its clientele on originating, structuring, and executing private equity and venture capital transactions. From 1995 to 2002, Mr. Drabik served in various roles and positions with UBS Capital Americas (and its predecessor UBS Capital LLC), a New York City based, private equity and venture capital firm that managed $1.5 billion of capital. From 1992 to 1995, Mr. Drabik was a banker with Union Bank of Switzerland's Corporate and Institutional Banking division in New York City. Mr. Drabik graduated from the University of Michigan with a Bachelors of Business Administration degree.
The Nominating and Governance Committee concluded that Mr. Drabik is well qualified and should be nominated to serve as a Director due, in part to his understanding and involvement in investment banking. As a global investment bank professional with extensive experience advising senior management, his skills include business analytics, financing and a strong familiarity with SEC documentation.
Arthur P. Bedrosian, J.D. was promoted to President of the Company in May 2002 and CEO in January of 2006. Prior to this, he served as the Company's Vice President of Business Development from January 2002 to April 2002. Mr. Bedrosian was elected as a Director in February 2000 and served to January 2002. Mr. Bedrosian was re-elected a Director in January 2006. Mr. Bedrosian has operated generic drug manufacturing, sales, and marketing businesses in the healthcare industry for many years. Prior to joining the Company, from 1999 to 2001, Mr. Bedrosian served as President and Chief Executive Officer of Trinity Laboratories, Inc., a medical device and drug manufacturer. Mr. Bedrosian also operated Pharmaceutical Ventures Ltd, a healthcare consultancy, Pharmeral, Inc. a drug representation company selling generic drugs and Interal Corporation, a computer consultancy to Fortune 100 companies. Mr. Bedrosian holds a Bachelor of Arts Degree in Political Science from Queens College of the City University of New York and a Juris Doctorate from Newport University in California.
The Nominating and Governance Committee concluded that Mr. Bedrosian is qualified to serve as a director, in part, because his experience as our President and Chief Executive Officer has been instrumental in the company's growth and provides the board with a compelling understanding of our operations, challenges and opportunities. In addition, his background includes over 40 years in the generic pharmaceutical industry that encompasses a broad background and knowledge in the underlying scientific, sales, marketing and supply chain management which brings special expertise to the board in developing our business strategies. His recent qualification to FINRA's list of arbitrators recognizes his expertise and experience.
Martin P. Galvan, CPA was appointed as the Company's Vice President of Finance and Chief Financial Officer in August 2011. Most recently, he was Chief Financial Officer of CardioNet, Inc., a medical technology and service company. From 2001 to 2007, Mr. Galvan was employed by Viasys Healthcare Inc., a healthcare technology company that was acquired by Cardinal Health, Inc. in June 2007. Prior to the acquisition, he served as Executive Vice President, Chief Financial Officer and Director Investor Relations. From 1999 to 2001, Mr. Galvan served as Chief Financial Officer of Rodel, Inc., a precision surface technologies company in the semiconductor industry. From 1979 to 1998, Mr. Galvan held several positions with Rhone-Poulenc Rorer Inc., a pharmaceutical company, including Vice President, Finance - The Americas; President & General Manager, RPR Mexico & Central America; Vice President, Finance, Europe/Asia Pacific; and Chief Financial Officer, United Kingdom & Ireland. Mr. Galvan began his career with the international accounting firm Ernst & Young LLP. He earned a Bachelor of Arts degree in economics from Rutgers University and is a member of the American Institute of Certified Public Accountants.
William F. Schreck joined the Company in January 2003 as Materials Manager. In May 2004, he was promoted to Vice President of Logistics. In August 2009, Mr. Schreck has been promoted to Senior Vice President and General Manager. In January 2011, Mr. Schreck was promoted to Chief Operating Officer. Prior to this, from 1999 to 2001, he served as Vice President of Operations at Nature's Products, Inc., an international nutritional and over-the-counter drug product manufacturing and distribution company. From 2001 to 2002 he served as an independent consultant for various companies. Mr. Schreck's prior experience also includes executive management positions at Ivax Pharmaceuticals, Inc., a division of Ivax Corporation, Zenith-Goldline Laboratories and Rugby-Darby Group Companies, Inc. Mr. Schreck has a Bachelor of Arts Degree from Hofstra University.
47
Table of Contents
Kevin R. Smith joined the Company in January 2002 as Vice President of Sales and Marketing. Prior to this, from 2000 to 2001, he served as Director of National Accounts for Bi-Coastal Pharmaceutical, Inc., a pharmaceutical sales representation company. Prior to this, from 1999 to 2000, he served as National Accounts Manager for Mova Laboratories Inc., a pharmaceutical manufacturer. Prior to this, from 1991 to 1999, Mr. Smith served as National Sales Manager at Sidmak Laboratories, a pharmaceutical manufacturer. Mr. Smith has extensive experience in the generic sales market, and brings to the Company a vast network of customers, including retail chain pharmacies, wholesale distributors, mail-order wholesalers and generic distributors. Mr. Smith has a Bachelor of Science Degree in Business Administration from Gettysburg College.
Ernest J. Sabo joined the Company in March 2005 as Director of Quality Assurance. In May 2008, Mr. Sabo was promoted to Vice President of Regulatory Affairs and Chief Compliance Officer. Prior to this, he served at Wyeth Pharmaceuticals as Manager of QA Compliance from 2001 to 2003 and as Associate Director of QA Compliance from 2003 to 2005. Mr. Sabo held former positions as Director of Validation, Quality Assurance, Quality Control and R&D at Delavau/Accucorp, Inc. from 1993 thru 2001. He has over 30 years experience in the pharmaceutical industry, his background spans from Quality Assurance, Quality Control, Cleaning/Process Validation and Manufacturing turn-key operations. Mr. Sabo holds a Bachelor of Arts in Biology from Trenton State College (now known as The College of New Jersey).
Robert Ehlinger , joined the Company in July 2006 as their Chief Information Officer. In June 2011, Mr. Ehlinger was promoted to Vice President of Logistics and Chief Information Officer. Prior to joining Lannett, Mr. Ehlinger was the Vice President of Information Technology at MedQuist, Inc., a healthcare services provider, where his career spanned 10 years in progressive operational and technology roles. Prior to MedQuist, Mr. Ehlinger was with Kennedy Health Systems as their Corporate Director of Information Technology supporting acute care and ambulatory care health information systems and biomedical support services. Earlier on, Mr. Ehlinger was with Dowty Communications where he held various technical and operational support roles prior to assuming the role of International Distribution Sales Executive managing the Latin America sales distribution channels. Mr. Ehlinger received a Bachelor's of Arts degree in Physics from Gettysburg College in Gettysburg, PA.
To the best of the Company's knowledge, there have been no events under any bankruptcy act, no criminal proceedings and no judgments or injunctions that are material to the evaluation of the ability or integrity of any director, executive officer, or significant employee during the past five years.
Section 16(a) Beneficial Ownership Reporting Compliance
Section 16(a) of the Securities Exchange Act of 1934 requires the Company's directors, officers, and persons who own more than 10% of a registered class of the Company's equity securities to file with the SEC reports of ownership and changes in ownership of common stock and other equity securities of the Company. Officers, directors and greater-than-10% stockholders are required by SEC regulations to furnish the Company with copies of all Section 16(a) forms they file.
Based solely on review of the copies of such reports furnished to the Company or written representations that no other reports were required, the Company believes that during Fiscal 2011, all filing requirements applicable to its officers, directors and greater-than-10% beneficial owners under Section 16(a) of the Exchange Act were complied with, except for one Form 3 for Mr. Drabik and certain Form 4s that were filed late related to certain restricted share grants made to the Directors of Lannett in the current and prior years, and except for certain Form 4s related to Mr. William Farber's sale of approximately 2,500,000 shares in December 2010 in a secondary public offering that were filed late.
Code of Ethics and Financial Expert
The Company has adopted the Code of Professional Conduct (the "code of ethics"), a code of ethics that applies to the Company's Chief Executive Officer, Chief Financial Officer, and Corporate Controller, and other finance organization employees. The code of ethics is publicly available on our website at www.lannett.com. If the Company makes any substantive amendments to the finance code of ethics or grant any waiver, including any implicit waiver, from a provision of the code to our Chief Executive Officer, Chief Financial Officer, or Corporate Controller, we will disclose the nature of such amendment or waiver on our website or in a report on Form 8-K.
The Board of Directors has determined that Mr. Sinclair, current director of Lannett, is the audit committee financial expert as defined in section 3(a)(58) of the Exchange Act and the related rules of the Commission.
48
Table of Contents
ITEM 11. EXECUTIVE COMPENSATION
The following table summarizes all compensation paid to or earned by the named executive officers of the Company for Fiscal 2011, Fiscal 2010 and Fiscal 2009.
|
|
|
|
|
|
|
|
|
| Non-equity |
|
|
|
|
| ||||||
Name and Principal |
| Fiscal |
|
|
| Stock |
| Options |
| incentive plan |
| All Other |
|
|
| ||||||
Position |
| Year |
| Salary |
| Awards |
| Awards |
| compensation |
| Compensation |
| Total |
| ||||||
(a) |
| (b) |
| (c) |
| (e) |
| (f) |
| (g) |
| (i) |
| (j) |
| ||||||
|
|
|
|
|
|
|
|
|
|
|
|
|
|
|
| ||||||
Arthur P. Bedrosian |
| 2011 |
| $ | 416,763 |
| $ | - |
| $ | - |
| $ | - |
| $ | 22,556 |
| $ | 439,319 |
|
President and Chief Executive |
| 2010 |
| 407,410 |
| 359,384 |
| 297,390 |
| 244,365 |
| 22,367 |
| 1,356,301 |
| ||||||
Officer |
| 2009 |
| 367,202 |
| - |
| 42,381 |
| 244,365 |
| 43,796 |
| 697,744 |
| ||||||
|
|
|
|
|
|
|
|
|
|
|
|
|
|
|
| ||||||
Keith R. Ruck (1) |
| 2011 |
| 190,000 |
| - |
| - |
| - |
| 15,617 |
| 205,617 |
| ||||||
Vice President of Finance and |
| 2010 |
| 189,293 |
| 89,550 |
| 243,090 |
| 123,500 |
| 11,257 |
| 656,690 |
| ||||||
Chief Financial Officer |
| 2009 |
| 128,854 |
| - |
| 22,163 |
| 60,617 |
| 1,234 |
| 212,868 |
| ||||||
|
|
|
|
|
|
|
|
|
|
|
|
|
|
|
| ||||||
Ernest Sabo |
| 2011 |
| 153,616 |
| - |
| - |
| - |
| 22,548 |
| 171,693 |
| ||||||
Vice President of Regulatory Affairs |
| 2010 |
| 142,575 |
| 161,092 |
| 198,260 |
| 93,195 |
| 18,802 |
| 613,924 |
| ||||||
and Chief Compliance Officer |
| 2009 |
| 139,200 |
| - |
| 22,603 |
| 91,693 |
| 16,764 |
| 270,260 |
| ||||||
|
|
|
|
|
|
|
|
|
|
|
|
|
|
|
| ||||||
William Schreck |
| 2011 |
| 219,231 |
| - |
| - |
| - |
| 19,592 |
| 238,823 |
| ||||||
Chief Operating Officer |
| 2010 |
| 196,681 |
| 177,791 |
| 302,729 |
| 130,000 |
| 28,159 |
| 835,360 |
| ||||||
|
| 2009 |
| 180,722 |
| - |
| 22,603 |
| 118,947 |
| 18,341 |
| 340,613 |
| ||||||
|
|
|
|
|
|
|
|
|
|
|
|
|
|
|
| ||||||
Kevin Smith |
| 2011 |
| 207,722 |
| - |
| - |
| - |
| 21,888 |
| 229,610 |
| ||||||
Vice President of Sales and |
| 2010 |
| 206,564 |
| 179,455 |
| 198,260 |
| 135,019 |
| 21,985 |
| 741,283 |
| ||||||
Marketing |
| 2009 |
| 200,180 |
| - |
| 22,603 |
| 130,825 |
| 21,502 |
| 375,110 |
| ||||||
* Note - Effective February 28, 2010 for fiscal years ending on or after December 20, 2009, the SEC amended its rules related to the Summary Compensation and Director Compensation Tables. The new rules require issuers to report as compensation the aggregate grant date fair-value of stock and option awards issued during the fiscal year to NEOs, rather than the dollar amount recognized for financial statement purposes for that fiscal year under the previous rules. Amounts are computed in accordance with Financial Accounting Standards Board Accounting Standards Codification Topic 718. Prior year amounts have been restated.
(1) Mr. Ruck separated his employment as the Company's Vice President of Finance and Chief Financial Officer effective August 1, 2011.
49
Table of Contents
(i) Supplemental All Other Compensation Table
The following table summarizes the components of column (i) of the Summary Compensation Table:
|
|
|
| Company |
|
|
|
|
|
|
|
|
| |||||
|
|
|
| Match |
|
|
| Pay in |
|
|
|
|
| |||||
Name and Principal |
| Fiscal |
| Contributions |
| Auto |
| Lieu of |
| Excess Life |
|
|
| |||||
Position |
| Year |
| 401(k) Plan |
| Allowance |
| Vacation |
| Insurances |
| Total |
| |||||
|
|
|
|
|
|
|
|
|
|
|
|
|
| |||||
Arthur P. Bedrosian |
| 2011 |
| $ | 8,294 |
| $ | 13,500 |
| $ | - |
| $ | 762 |
| $ | 22,556 |
|
President and Chief Executive Officer |
| 2010 |
| 8,219 |
| 13,500 |
| - |
| 648 |
| 22,367 |
| |||||
|
| 2009 |
| 8,823 |
| 13,500 |
| 20,993 |
| 480 |
| 43,796 |
| |||||
|
|
|
|
|
|
|
|
|
|
|
|
|
| |||||
Keith R. Ruck |
| 2011 |
| 4,703 |
| 10,800 |
| - |
| 114 |
| 15,617 |
| |||||
Vice President of Finance and Chief Financial Officer |
| 2010 |
| 2,499 |
| 8,668 |
| - |
| 90 |
| 11,257 |
| |||||
|
| 2009 |
| 1,182 |
| - |
| - |
| 52 |
| 1,234 |
| |||||
|
|
|
|
|
|
|
|
|
|
|
|
|
| |||||
Ernest Sabo |
| 2011 |
| 6,812 |
| 10,800 |
| - |
| 465 |
| 18,077 |
| |||||
Vice President of Regulatory Affairs and Chief Compliance Officer |
| 2010 |
| 7,606 |
| 10,800 |
| - |
| 396 |
| 18,802 |
| |||||
|
| 2009 |
| 5,568 |
| 10,800 |
| - |
| 396 |
| 16,764 |
| |||||
|
|
|
|
|
|
|
|
|
|
|
|
|
| |||||
William Schreck |
| 2011 |
| 8,327 |
| 10,800 |
| - |
| 465 |
| 19,592 |
| |||||
Chief Operating Officer |
| 2010 |
| 7,918 |
| 10,800 |
| 9,030 |
| 411 |
| 28,159 |
| |||||
|
| 2009 |
| 7,114 |
| 10,800 |
| - |
| 427 |
| 18,341 |
| |||||
|
|
|
|
|
|
|
|
|
|
|
|
|
| |||||
Kevin Smith |
| 2011 |
| 8,250 |
| 13,500 |
| - |
| 138 |
| 21,888 |
| |||||
Vice President of Sales and |
| 2010 |
| 8,371 |
| 13,500 |
| - |
| 114 |
| 21,985 |
| |||||
Marketing |
| 2009 |
| 7,905 |
| 13,500 |
| - |
| 97 |
| 21,502 |
| |||||
Aggregated Options/SAR Exercises and Fiscal Year-end Options/SAR Values
GRANTS OF PLAN-BASED AWARDS
|
|
|
| Estimated Future Payouts |
| Estimated Future Payouts Under |
| All Other |
| All Other |
| Exercise |
| Grant Date |
| ||||||||||
Name |
| Grant Date |
| Threshold |
| Target |
| Maximum |
| Threshold |
| Target |
| Maximum |
| Stocks or |
| Underlying |
| Awards |
| Options |
| ||
(a) |
| (b) |
| (c) |
| (d) |
| (e) |
| (f) |
| (g) |
| (h) |
| (i) |
| (j) |
| (k) |
| (i) |
| ||
|
|
|
|
|
|
|
|
|
|
|
|
|
|
|
|
|
|
|
|
|
|
|
| ||
Arthur P. Bedrosian |
| N/A |
|
|
|
|
|
|
|
|
|
|
|
|
| - |
| - |
| $ | - |
| $ | - |
|
President and Chief Executive Officer |
|
|
|
|
|
|
|
|
|
|
|
|
|
|
|
|
|
|
|
|
|
|
| ||
|
|
|
|
|
|
|
|
|
|
|
|
|
|
|
|
|
|
|
|
|
|
|
| ||
Keith R. Ruck |
| N/A |
|
|
|
|
|
|
|
|
|
|
|
|
| - |
| - |
| $ | - |
| $ | - |
|
Vice President of Finance and Chief Financial Officer |
|
|
|
|
|
|
|
|
|
|
|
|
|
|
|
|
|
|
|
|
|
|
| ||
|
|
|
|
|
|
|
|
|
|
|
|
|
|
|
|
|
|
|
|
|
|
|
| ||
Ernest Sabo |
| N/A |
|
|
|
|
|
|
|
|
|
|
|
|
| - |
| - |
| $ | - |
| $ | - |
|
Vice President of Regulatory Affairs and Chief Compliance Officer |
|
|
|
|
|
|
|
|
|
|
|
|
|
|
|
|
|
|
|
|
|
|
| ||
|
|
|
|
|
|
|
|
|
|
|
|
|
|
|
|
|
|
|
|
|
|
|
| ||
William Schreck |
| N/A |
|
|
|
|
|
|
|
|
|
|
|
|
| - |
| - |
| $ | - |
| $ | - |
|
Chief Operating Officer |
|
|
|
|
|
|
|
|
|
|
|
|
|
|
|
|
|
|
|
|
|
|
| ||
|
|
|
|
|
|
|
|
|
|
|
|
|
|
|
|
|
|
|
|
|
|
|
| ||
Kevin Smith |
| N/A |
|
|
|
|
|
|
|
|
|
|
|
|
| - |
| - |
| $ | - |
| $ | - |
|
Vice President of Sales and Marketing |
|
|
|
|
|
|
|
|
|
|
|
|
|
|
|
|
|
|
|
|
|
|
| ||
50
Table of Contents
OUTSTANDING EQUITY AWARDS AT JUNE 30, 2011
Option Awards |
| Stock Awards |
| ||||||||||||||||||
Name |
| Number of |
| Number of |
| Equity |
| Option |
| Option |
| Number of |
| Market |
| Equity |
| Equity |
| ||
(a) |
| (b) |
| (c) |
| (d) |
| (e) |
| (f) |
| (g) |
| (h) |
| (i) |
| (j) |
| ||
|
|
|
|
|
|
|
|
|
|
|
|
|
|
|
|
|
|
|
| ||
Arthur P. Bedrosian President and Chief Executive Officer |
| 18,000 |
| - |
| - |
| $ | 4.63 |
| 7/23/2012 |
|
|
|
|
|
|
|
|
| |
| 96,900 |
| - |
| - |
| $ | 7.97 |
| 10/28/2012 |
|
|
|
|
|
|
|
|
| ||
| 33,000 |
| - |
| - |
| $ | 17.36 |
| 10/24/2013 |
|
|
|
|
|
|
|
|
| ||
| 30,000 |
| - |
| - |
| $ | 16.04 |
| 5/11/2014 |
|
|
|
|
|
|
|
|
| ||
| 25,000 |
| - |
| - |
| $ | 8.00 |
| 1/18/2016 |
|
|
|
|
|
|
|
|
| ||
| 30,000 |
| - |
| - |
| $ | 6.89 |
| 11/28/2016 |
|
|
|
|
|
|
|
|
| ||
| 75,000 |
| - |
| - |
| $ | 4.03 |
| 9/18/2017 |
|
|
|
|
|
|
|
|
| ||
| 20,000 |
| 10,000 |
| - |
| $ | 2.80 |
| 9/18/2018 |
|
|
|
|
|
|
|
|
| ||
| 25,000 |
| 50,000 |
| - |
| $ | 6.94 |
| 10/29/2019 |
|
|
|
|
|
|
|
|
| ||
|
|
|
|
|
|
|
|
|
|
|
| 20,000 |
| $ | 99,600 |
|
|
|
|
| |
|
|
|
|
|
|
|
|
|
|
|
|
|
|
|
|
|
|
|
| ||
Keith R. Ruck Vice President of Finance and Chief Financial Officer |
| - |
| 5,000 |
| - |
| $ | 2.79 |
| 10/29/2011 |
|
|
|
|
|
|
|
|
| |
| 13,334 |
| 26,666 |
| - |
| $ | 7.98 |
| 10/29/2011 |
|
|
|
|
|
|
|
|
| ||
| 5,000 |
| 10,000 |
| - |
| $ | 6.94 |
| 10/29/2011 |
|
|
|
|
|
|
|
|
| ||
|
|
|
|
|
|
|
|
|
|
|
| 6,667 |
| $ | 33,202 |
|
|
|
|
| |
|
|
|
|
|
|
|
|
|
|
|
|
|
|
|
|
|
|
|
| ||
William Schreck |
| 17,745 |
| - |
| - |
| $ | 11.27 |
| 2/18/2013 |
|
|
|
|
|
|
|
|
| |
Chief Operating Officer |
| 12,000 |
| - |
| - |
| $ | 5.18 |
| 10/25/2015 |
|
|
|
|
|
|
|
|
| |
|
| 15,000 |
| - |
| - |
| $ | 6.89 |
| 11/28/2016 |
|
|
|
|
|
|
|
|
| |
|
| 50,000 |
| - |
| - |
| $ | 4.03 |
| 9/18/2017 |
|
|
|
|
|
|
|
|
| |
|
| 10,667 |
| 5,333 |
| - |
| $ | 2.80 |
| 9/18/2018 |
|
|
|
|
|
|
|
|
| |
|
| 5,000 |
| 10,000 |
| - |
| $ | 7.53 |
| 10/27/2019 |
|
|
|
|
|
|
|
|
| |
|
| 20,000 |
| 40,000 |
| - |
| $ | 6.94 |
| 10/29/2019 |
|
|
|
|
|
|
|
|
| |
|
|
|
|
|
|
|
|
|
|
|
| 10,000 |
| $ | 49,800 |
|
|
|
|
| |
|
|
|
|
|
|
|
|
|
|
|
|
|
|
|
|
|
|
|
| ||
Kevin Smith Vice President of Sales and Marketing |
| 38,760 |
| - |
| - |
| $ | 7.97 |
| 10/28/2012 |
|
|
|
|
|
|
|
|
| |
| 13,000 |
| - |
| - |
| $ | 17.36 |
| 10/24/2013 |
|
|
|
|
|
|
|
|
| ||
| 20,000 |
| - |
| - |
| $ | 16.04 |
| 5/11/2014 |
|
|
|
|
|
|
|
|
| ||
| 12,000 |
| - |
| - |
| $ | 5.18 |
| 10/25/2015 |
|
|
|
|
|
|
|
|
| ||
| 15,000 |
| - |
| - |
| $ | 6.89 |
| 11/28/2016 |
|
|
|
|
|
|
|
|
| ||
| 50,000 |
| - |
| - |
| $ | 4.03 |
| 9/18/2017 |
|
|
|
|
|
|
|
|
| ||
| 10,667 |
| 5,333 |
| - |
| $ | 2.80 |
| 9/18/2018 |
|
|
|
|
|
|
|
|
| ||
| 16,667 |
| 33,333 |
| - |
| $ | 6.94 |
| 10/29/2019 |
|
|
|
|
|
|
|
|
| ||
|
|
|
|
|
|
|
|
|
|
|
| 10,000 |
| $ | 49,800 |
|
|
|
|
| |
|
|
|
|
|
|
|
|
|
|
|
|
|
|
|
|
|
|
|
| ||
Ernest Sabo Vice President of Regulatory Affairs and Chief Compliance Officer |
| 3,250 |
| - |
| - |
| $ | 7.48 |
| 3/1/2015 |
|
|
|
|
|
|
|
|
| |
| 4,000 |
| - |
| - |
| $ | 5.18 |
| 10/25/2015 |
|
|
|
|
|
|
|
|
| ||
| 7,500 |
| - |
| - |
| $ | 6.89 |
| 11/28/2016 |
|
|
|
|
|
|
|
|
| ||
| 15,000 |
| - |
| - |
| $ | 4.03 |
| 9/18/2017 |
|
|
|
|
|
|
|
|
| ||
| 10,668 |
| 5,332 |
| - |
| $ | 2.80 |
| 9/18/2018 |
|
|
|
|
|
|
|
|
| ||
| 16,667 |
| 33,333 |
| - |
| $ | 6.94 |
| 10/29/2019 |
|
|
|
|
|
|
|
|
| ||
|
|
|
|
|
|
|
|
|
|
|
| 10,000 |
| $ | 49,800 |
|
|
|
|
| |
The options above were granted ten years prior to the option expiration date and vest over three years from that grant date.
51
Table of Contents
Employment Agreements
The Company has entered into employment agreements with Arthur P. Bedrosian, President and Chief Executive Officer, Martin P. Galvan, Vice President of Finance and Chief Financial Officer, Kevin Smith, Vice President of Sales and Marketing, William Schreck, Chief Operating Officer, Ernest Sabo, Vice President of Regulatory Affairs and Chief Compliance Officer and Robert Ehlinger, Vice President of Logistics and Chief Information Officer. Each of the agreements provide for an annual base salary and eligibility to receive a bonus. The salary and bonus amounts of these executives are determined by the Board of Directors. Additionally, these executives are eligible to receive stock options and restricted stock awards, which are granted at the discretion of the Board of Directors, and in accordance with the Company's policies regarding stock option and restricted stock grants. Under the agreements, these executive employees may be terminated at any time with or without cause, or by reason of death or disability. In certain termination situations, the Company is liable to pay severance compensation to these executives of between 18 months and three years.
Effective August 1, 2011, Keith R. Ruck, the former Vice President of Finance and Chief Financial Officer of the Company, separated his employment from the Company. Mr. Ruck entered into a Separation Agreement and Release with the Company dated August 1, 2011, pursuant to which he will receive seven months base salary totaling $110,833, medical benefits and vesting of outstanding options and previously awarded restricted stock grants.
During the third quarter of Fiscal Year 2009, the Company's then current Vice President of Finance, Treasurer, Secretary and Chief Financial Officer resigned. As part of his separation agreement, the Company was obligated to pay to him approximately $670,000 to settle any outstanding obligations from his employment agreement, including any salary, bonus, vacation, stock options and medical benefits. Of this amount, $300,440 was paid in Fiscal 2009 with $165,000 designated for the payment of pro rated bonus, and $11,440 was designated for the payment of accrued but unused paid time off. As part of the settlement, $124,000 was designated as the portion of the settlement related to the repurchase of his outstanding stock options. The Company therefore charged this amount to Additional Paid in Capital, as it represents the fair value of the options repurchased on the repurchase date. Additional payments totaling $369,000 for severance and benefits were paid in Fiscal 2011 pursuant to the separation agreement.
Compensation of Directors
DIRECTOR COMPENSATION
|
| Fees |
| Stock |
| Options |
| Non-Equity |
| Change in |
| All Other |
| Total |
| |||||||
Name |
| ($) |
| ($) |
| ($) |
| ($) |
| ($) |
| ($) |
| ($) |
| |||||||
(a) |
| (b) |
| (c) |
| (d) |
| (e) |
| (f) |
| (g) |
| (h) |
| |||||||
|
|
|
|
|
|
|
|
|
|
|
|
|
|
|
| |||||||
William Farber |
| $ | 46,000 |
| $ | 28,100 |
| $ | - |
| $ | - |
| $ | - |
| $ | - |
| $ | 74,100 |
|
|
|
|
|
|
|
|
|
|
|
|
|
|
|
|
| |||||||
Ronald A. West |
| 69,000 |
| 28,100 |
| - |
| - |
| - |
| - |
| 97,100 |
| |||||||
|
|
|
|
|
|
|
|
|
|
|
|
|
|
|
| |||||||
Jeffrey Farber |
| 48,000 |
| 28,100 |
| - |
| - |
| - |
| - |
| 76,100 |
| |||||||
|
|
|
|
|
|
|
|
|
|
|
|
|
|
|
| |||||||
Kenneth Sinclair |
| 70,000 |
| 28,100 |
| - |
| - |
| - |
| - |
| 98,100 |
| |||||||
|
|
|
|
|
|
|
|
|
|
|
|
|
|
|
| |||||||
Albert Wertheimer |
| 71,000 |
| 28,100 |
| - |
| - |
| - |
| - |
| 99,100 |
| |||||||
|
|
|
|
|
|
|
|
|
|
|
|
|
|
|
| |||||||
Myron Winkelman |
| 67,500 |
| 28,100 |
| - |
| - |
| - |
| - |
| 95,600 |
| |||||||
|
|
|
|
|
|
|
|
|
|
|
|
|
|
|
| |||||||
David Drabik |
| 25,500 |
| 13,575 |
| - |
| - |
| - |
| - |
| 39,075 |
| |||||||
52
Table of Contents
COMPENSATION DISCUSSION AND ANALYSIS
Overview of Our Compensation Program
A fundamental goal of our compensation program is to maximize stockholder value. In order to accomplish this goal, we must attract and retain talented and capable executives, and we must provide those executives with incentives that motivate and reward them for achieving Lannett's short and longer-term goals. To this end, our executive compensation is guided by the following key principles:
· that executive compensation should depend upon group and individual performance factors;
· that the interests of executives should be closely aligned with those of stockholders through equity-based compensation; and
· that compensation should be appropriate and fair in comparison to the compensation provided to similarly situated executives within the pharmaceutical industry and within other publicly-traded companies similar in market capitalization to Lannett.
Important to our compensation program are the decisions of, and guidance from, the Compensation Committee of our Board of Directors. The Compensation Committee (which we refer to, for purposes of this analysis, as "the Committee") is composed entirely of directors who are independent of Lannett under the independence standards established by the NYSE-AMEX Exchange, the securities exchange where our common stock is traded. The Committee operates pursuant to a written charter adopted by the Board. If you would like to review the Committee's charter, it is available to any stockholder who requests a copy from our Chief Financial Officer, at 13200 Townsend Road, Philadelphia, Pennsylvania 19154.
The Committee has the authority and responsibility to establish and periodically review our executive compensation principles, described above. Importantly, the Committee also has sole responsibility for approving the corporate goals and objectives upon which the compensation of the chief executive officer (the "CEO") is based, for evaluating the CEO's performance in light of these goals and objectives, and for determining the CEO's compensation, including his equity-based compensation.
The Committee also reviews and approves the recommendations of the CEO with regard to the compensation and benefits of other executive officers. In accomplishing this responsibility, the Committee meets regularly with the CEO, approves cash and equity incentive objectives of the executive officers, reviews with the CEO the accomplishment of these objectives and approves the base salary and other elements of compensation for the executive officers. The Committee has full discretion to modify the recommendations of the CEO in the course of its approval of executive officer compensation.
The Committee consults as needed with an outside compensation consulting firm retained by the Committee. As it makes decisions about executive compensation, the Committee obtains data from its consultant regarding current compensation practices and trends among United States companies in general and pharmaceutical companies in particular, and reviews this information with its consultant. In addition, the Chairman of the Committee is in contact with management outside of Committee meetings regarding matters being considered or expected to be considered by the Committee. The Committee annually reviews recommendations from their outside consultant, and makes recommendations to the Board about the compensation of non-employee directors. During Fiscal Year 2011, Lannett used Radford, an Aon Hewitt Company, as its consultant.
During Fiscal 2007, the Committee recommended the adoption of a new Incentive Plan to supplement our existing stock option plans. The Incentive Plan was approved by our stockholders in January 2007. The Incentive Plan provides for the grant of various equity awards, including stock options and restricted stock, to Lannett employees and directors. The Committee is responsible for administering this Plan and it has sole authority to make grants to the CEO or any other executive officer.
In Fiscal 2011 the Committee recommended, and the Board of Directors determined there was a need for a greater variety of performance based executive compensation incentive alternatives. Accordingly the Board of Directors recommended, and the stockholders approved, the Lannett 2011 Long-Term Incentive Plan. The Plan authorizes the Committee to grant both stock and/or cash-based awards through (i) incentive and non-qualified stock options and/or (ii) restricted stock, and/or long-term performance awards to participants. With respect to the stock options and stock grants, 1,500,000 shares are set aside under the plan for stock option grants and/or restricted stock awards. At the time of an award grant, the Committee will determine the type of award to be made and the specific conditions upon which an award will be granted (i.e. term, vesting, performance criteria, etc.). The terms of the awards will be based on what the Committee determines is the most effective performance compensation approach to meet the Company's strategic needs. In conjunction with its responsibilities related to executive compensation, the Committee also oversees the management development process, reviews plans for executive officer succession and performs various other functions.
The individuals who served as Chief Executive Officer and Chief Financial Officer during Fiscal 2011, as well as the other individuals included in the Summary Compensation Table on page 49, are referred to as the "named executive officers."
53
Table of Contents
Risk Assessment
The criteria used for the bonus program of operating performance, research and development inclusive of ANDA/NDA submissions, acceptances of ANDA/NDAs, launches of approved ANDA/NDAs, individual performance goals, along with the weighting of each element, were assembled by the Company for our industry and were found to be reasonable for the nature of our business. The Compensation Committee reviews this criteria and gives final approval to the senior management. It is then presented to the Board of Directors for final approval.
Operating performance ties in directly with shareholder value. There is no bonus opportunity for management if they do not create value, so management interests and shareholder value are aligned. The risk of diluting the Company's operating cash positions through the awarding of excessive bonus awards is controlled by the imposition of a bonus cash award limit equal to 20% of adjusted operating income as calculated from its fiscal year-end financial statements.
The R&D component of the criteria looks to the sustainability and growth of the organization. While it could be argued that there is risk associated with the choice of which products to submit for approval, there is no indication that those risks would be outside what would be considered normal and reasonable in the course of doing business. The ultimate goal is to be able to sell a product that positively impacts operating performance, which cannot occur unless the process of submission, approval, and launch is followed. If submissions do not make it to the approval stage, and if the approved products are not successfully launched, they cannot positively affect operating performance. Since there is a minimum operating performance (operating profit) level that must be attained before any payments are made through the bonus plan, there is a check and balance to prevent what could be viewed as a portfolio of "risky" submittals. The impact on operating performance is created over a period of time based on the total sales, so there needs to be sustainability with any new launch.
The achievement of individual goals as part of the bonus is subject to review and approval by senior management with the CEO being the final review and approval. This multi-level process reduces the risk of having goals that are not linked to the overall objectives of the Company and its success. The awarding of a CEO discretionary portion, currently at 5% of the total of the bonus, also requires the same oversight. The total impact on bonus payout of these parts of the bonus program is significantly less than the operating performance and R&D parts. Again, there is no bonus payout unless the operating performance (operating profit) minimum goals are attained.
We believe our bonus program, along with the other elements of our executive compensation program, provides appropriate rewards and incentives to our executives to achieve our financial, business, and strategic goals. We also believe the structure and oversight of these programs provides a setting that does not encourage them to take excessive risks in their business decisions.
Our Fiscal 2011 Compensation Program
In Fiscal 2011, the Committee's approach to compensation was intended to focus our executives on accomplishing our short and longer-term objectives, and it had as its ultimate objective sustained growth in stockholder value. This approach was intended to compensate executives at levels at or near the median levels of compensation offered by other pharmaceutical companies similar in size to Lannett and with whom we compete.
In making decisions about the elements of Fiscal 2011 compensation, the Committee not only considered available market information about each element but also considered aggregate compensation for each executive. Base salary provided core compensation to executives, but it was accompanied by:
· the potential for incentive-based cash compensation based upon our attainment of Fiscal 2011 operating income, other targeted corporate goals and individual or departmental objectives,
· various forms of equity compensation, including some grants based upon Fiscal 2011 sales growth results and upon our return on invested capital results,
· various benefits and perquisites, and
· the potential for post-termination compensation under certain circumstances.
54
Table of Contents
Summary of Fiscal 2011 Compensation Elements
The table below provides detailed information regarding each element of the Fiscal 2011 compensation program.
|
| Compensation Element Overview |
| Purpose of the Compensation Element |
|
|
|
|
|
Base Salary |
| Base salary pays for competence in the executive role. An executive's salary level depends on the decision making responsibilities, experience, work performance, achievement of key goals and team building skills of each position, and the relationship to amounts paid to other executives at peer companies. |
| To provide competitive fixed compensation based on sustained performance in the executive's role and competitive market practice. |
|
|
|
|
|
Short-Term Incentives |
| Lannett Annual Discretionary Income Plan (LADIP) The LADIP program rewards with cash awards for annual achievement of overall corporate objectives, and specific individual or departmental operational objectives. In Fiscal 2011, objectives for the Officers were tied to Lannett's achievement of operating income targets, other targeted corporate goals and individual objectives. |
| To motivate and focus our executive team on the achievement of our annual performance goals. |
|
|
|
|
|
Long-Term Incentives |
| Stock Options Stock options reward sustained stock price appreciation and encourage executive retention during a three-year vesting term and a ten-year option life.
Restricted Stock Restricted stock rewards sustained stock price appreciation and encourages executive retention during its three-year vesting term.
The value of participants' restricted stock increases and decreases according to Lannett's stock price performance during the vesting period and thereafter. |
| We strive to deliver a balanced long-term incentive portfolio to executives, focusing on (a) share price appreciation, (b) retention, and (c) internal financial objectives.
The primary objectives of the overall design are: to align management interests with those of stockholders,
to increase management's potential for stock ownership opportunities (all awards are earned in shares),
to attract and retain excellent management talent, and
to reward growth of the business, increased profitability, and sustained stockholder value. |
|
|
|
|
|
Benefits |
| In General Executives participate in employee benefit plans available to all employees of Lannett, including health, life insurance and disability plans. The cost of these benefits is partially borne by the employee, but mostly paid by the Company. |
| These benefits are designed to attract and retain employees and provide security for their health and welfare needs. We believe that these benefits are reasonable, competitive and consistent with Lannett's overall executive compensation program. |
|
|
|
|
|
|
| 401(k) Plan Executives may participate in Lannett's 401(k) retirement savings plan, which is available to all employees. Lannett matches contributions to the Plan, at a rate of $.50 on the dollar up to 8% of base salary. |
|
|
55
Table of Contents
|
| Life Insurance Lannett provides life insurance benefits to all employees. The coverage amount for executives is one times base compensation up to a limit of $115,000 and premiums paid for coverage above $50,000 are treated as imputed income to the executive.
Disability Insurance Lannett provides short-term and long-term disability insurance to employees which would, in the event of disability, pay an employee 60% of his or her base salary with limits. |
|
|
|
| Compensation Element Overview |
| Purpose of the Compensation |
|
|
|
|
|
Perquisites |
| Lannett does not utilize perquisites or personal benefits extensively. The few perquisites that are provided complement other compensation vehicles and enable the Company to attract and retain key executives. These perquisites include: automobile allowances in various amounts to key executives. |
| We believe these benefits better allow us to attract and retain superior employees for key positions. |
|
|
|
|
|
Post-Termination Pay |
| Severance Plan Lannett's Severance Pay Plan is designed to pay severance benefits to an executive for a qualifying separation. For the Chief Executive Officer, the Severance Pay Plan provides for a payment of three times the sum of base salary plus a pro rated annual cash bonus for the current year calculated as if all targets and goals are achieved. |
| The Severance Pay Plan is intended (1) to allow executives to concentrate on making decisions in the best interests of Lannett (or any successor organization in the event that a change of control is to occur), and (2) generally alleviate an executive's concerns about the loss of his or her position without cause. |
|
|
|
|
|
|
| For the other named executive officers, the Severance Pay Plan provides for a payment of eighteen months of base salary plus a pro rated annual cash bonus for the current year calculated as if all targets and goals are achieved. |
|
|
The use of the above compensation tools enables Lannett to reinforce its pay for performance philosophy as well as to strengthen its ability to attract and retain high-performing executive officers. The Committee believes that this combination of programs provides an appropriate mix of fixed and variable pay, balances short-term operational performance with long-term stockholder value creation, and encourages executive recruitment and retention in a high-performance culture.
Market Data and Our Peer Group
In determining FY2011 compensation for the named executive officers, the Committee relied on market data provided by its consultants. This data was gathered from two sources. The Named Peer Group is comprised of 16 public life sciences companies that exhibit a comparable business and financial profile to Lannett, as defined by annual revenue, employee size and market value. The consultants also gathered published survey data from the Radford 2010 Global Survey Suite targeting life science companies with between 200 and 450 employees. To determine competitive market compensation, Survey and Named Peer data were combined (weighted equally) to form a market consensus (where possible).
56
Table of Contents
Named Peer Group |
|
Akorn Inc. |
Caraco Pharmaceutical Labs |
Cornerstone Therapeutics |
Cumberland Pharmaceuticals |
Derma Sciences |
Hi Tech Pharmacal |
Impax Laboratories Inc. |
Inspire Pharmaceuticals Inc. |
ISTA Pharmaceuticals Inc. |
Jazz Pharmaceuticals |
Momenta Pharmaceuticals |
Obagi Medical |
Par Pharmaceutical |
Salix Pharmaceuticals Ltd. |
Santarus Inc. |
SciClone Pharmaceuticals |
The Committee plans to evaluate the Peer Group periodically and revise it as necessary to ensure that it continues to be appropriate for benchmarking our executive compensation program.
Base Salary
Base salaries for the named executive officers are intended, in general, to approach median salaries for similarly situated executives among Peer Group companies. A number of additional factors are considered, however, in determining base salary, such as the executive's individual performance, his or her experience, competencies, skills, abilities, contribution and tenure, internal compensation consistency, the need to attract new, talented executives, and the Company's overall annual budget. Base salaries are generally reviewed on an annual basis.
Base salary increases were granted as of January 31, 2011 to Mr. Schreck for $50,000 effective as a result of his promotion to Chief Operating Officer and to Mr. Sabo for $26,624 based on the significant expansion of his job responsibilities. Mr. Bedrosian, Mr. Smith, and Mr. Ruck did not receive base salary increases during Fiscal 2011 as a result of a company wide salary freeze.
Fiscal 2011 Annual Incentive Bonus Plan
Design
In November 2010, the Committee approved the Fiscal 2011 Lannett Annual Discretionary Income Plan (or "LADIP"). This program allowed executive officers the opportunity to earn cash awards upon the accomplishment of the Fiscal 2011 operating income goal, other targeted corporate goals and a number of individual objectives. The relative weighting of these objectives for each executive was fifty percent (50%) for operating profit, thirty-five percent (35%) for individual and/or department goals, ten percent (10%) for achieving R&D goals and five percent (5%) based on CEO and Committee discretion. For the CEO, the five percent (5%) discretionary portion will be determined by the Committee.
Based on market data provided by its consultant, and considering the relatively low base salaries of the named executive officers, the Committee formulated potential LADIP awards which exceeded the 50th percentile among Peer Group companies, expressed as percentages of base salary. Actual payouts depended upon the degree to which objectives were accomplished as well as the weight accorded to each objective, as described above. The table below shows the potential payout amounts for each of the named executive officers, expressed as percentages of base salary.
Performance |
| Arthur |
| Keith |
| Ernest |
| William |
| Kevin |
|
Goal 3 Level |
| 100 | % | 100 | % | 100 | % | 100 | % | 100 | % |
Goal 2 Level |
| 75 | % | 75 | % | 75 | % | 75 | % | 75 | % |
Goal 1 Level |
| 50 | % | 50 | % | 50 | % | 50 | % | 50 | % |
There are three participation levels: Goal 1, Goal 2, and Goal 3. Specific business objectives are defined for each "Goal" category. All business objectives for the particular "Goal" level must be met in order to be eligible for the potential payout for that "Goal" level. In
57
Table of Contents
the case of "Goal 1" all the objectives must be met for the plan to have any payout. In the event that Goal Level 3 is exceeded, additional bonus compensation may be provided as approved by the Compensation Committee.
As discussed above, each named executive officer's objectives for Fiscal 2011 included Company operating income targets and other targeted corporate goals. The Committee reviewed and approved these targets following discussions with management, a review of our historical results, consideration of the various circumstances facing the Company during Fiscal 2011 and taking into account the expectations of our annual plan. The Fiscal 2011 operating income and other corporate goals LADIP targets approved by the Committee are detailed in the table below.
Objective |
| Goal 3 |
| Goal 2 |
| Goal 1 |
Operating Profit* |
| 130% of budgeted operating profit |
| 115% of budgeted operating profit |
| 100% of budgeted operating profit |
· Operating Profit is defined as Operating Income plus adding back Bonus Expense. For purposes of determining achievement of the LADIP targets, these measures can exclude certain categories of non-recurring items that the Committee believes do not reflect the performance of Lannett's core continuing operations. There were no adjustments made in Fiscal 2011 for non-recurring items.
In addition, the Company has targets related to R&D submissions and FDA acceptance letters as key objective areas.
All payouts to the named executive officers under the 2011 LADIP were contingent upon the Committee's review and certification of the degree to which Lannett achieved the 2011 LADIP objectives, and upon the Committee's certification of the degree to which individual objectives had been achieved. The program provides that payout for any objective would be limited to 20% of the actual operating income (as defined by the LADIP) attained by Lannett.
The 2011 LADIP program provided that the Committee could, in its discretion: modify, amend, suspend or terminate the Plan at any time.
Results
In August 2011, the Committee reviewed and certified Lannett's Fiscal 2011 results for purposes of the LADIP program, determining that the objectives were not met for operating income and other corporate objectives to achieve any payments under the plan.
Mr. Bedrosian's objectives were to increase gross margin, increase the sales to employee ratio, achieve cash and cash equivalent balance sheet totals, and increase gross profit on Cody products.
Mr. Schreck's objectives were to improve purchasing operations by securing second source, raw material supply agreements for critical materials, and reduction of costs; to use technology to improve inventory control, inventory accuracy, and shipping and receiving efficiencies; and to effect cost reduction in major expense areas.
Mr. Ruck's objectives were to deliver accurate and timely financial reports on a required monthly, quarterly, and annual basis to senior management and the Board of Directors; enhance financial performance through the management of receivables, controlling of service and professional fees, and budget management; and to use automation to improve the efficiency of financial transactions and reporting.
Mr. Sabo's objectives were to review and enhance policies and procedures to ensure regulatory compliance; provide for technical and research capabilities required to ensure a flow of new products; and ensure compliance with DEA and FDA requirements.
Mr. Smith's objectives were to exceed the company sales goals; meet and exceed the operating income goal; and gain forecasted market share on all new launches; decrease obsolete finished goods; and increase gross profit percentage.
Due to the FDA's actions against Lannett's marketed "grandfather" drugs, revenue, income, and financial goals were generally not achieved while operational goals were generally achieved. As a result, there were no payments made to any of the named executives.
58
Table of Contents
2011 Long Term Incentive Awards (LTIA)
Design
The Committee believes that long-term equity incentives are an important part of a complete compensation package because they focus executives on increasing the value of the assets that are entrusted to them by the stockholders, achieving Lannett's long-term goals, aligning the interests of executives with those of stockholders, encouraging sustained stock performance and helping to retain executives.
Prior to the approval of the Incentive Plan by stockholders in 2007, Lannett's equity grants consisted only of stock options. The Incentive Plan expanded the types of equity vehicles which the Committee could grant to executives by including restricted stock. Equity grants are designed to emphasize particular elements of the Company's immediate and long-term objectives and to retain key executives. We will refer to these grants collectively as Long Term Incentive Awards (LTIA). The types of grants available are:
· stock options, becoming exercisable over three years (approximately one-third increments on each anniversary) from the date of the grant and having a total term of ten years, and
· shares of restricted stock, vesting over three years (approximately one-third increments on each anniversary) from the date of grant.
The Committee assesses the appropriate overall value of these equity grants to executives by reviewing survey results and other market data provided by its consultant. This information includes the value of equity grants made to similarly situated executives among the Peer Group. The overall value of LTIA grants for each executive is determined by the Committee with assistance from their consultant.
In determining the overall value of LTIA grants, the Committee also considers the potential value of equity compensation relative to other elements of compensation for each named executive officer. It likewise assesses the appropriate distribution of equity value among the grant types, as well as the corporate objectives each type of grant is intended to encourage.
There were no Long Term Incentive Awards granted during FY2011.
Stock Options and Restricted Stock
Stock options and restricted stock granted as part of the LTIA are designed to reward sustained stock price appreciation and to encourage executive retention during a three-year vesting term and, in the case of stock options, a ten-year option life. Stock option and restricted stock awards are intended to align executives' motivation with stockholders' best interests. Grants of stock options will not contingent upon any conditions. They are to be granted independent of organizational performance. Stock options become exercisable approximately in one-third increments on the first three anniversaries of the date of grant. Restricted stock will be contingent upon Lannett achieving annual sales growth and return on invested capital goals. Restricted stock will vest in approximately one-third increments on the first three anniversaries of the date of the grant.
Perquisites and Other Benefits
We provide named executive officers with perquisites and other personal benefits that we believe are reasonable and consistent with our overall compensation program to better enable us to attract and retain superior employees for key positions. The Committee periodically reviews the levels of perquisites and other personal benefits provided to named executive officers.
Lannett matches contributions to the 401(k) plan on a fifty cents on the dollar basis up to 8% of the contributing employee's base salary, subject to limitations of the Plan and applicable law. The named executive officers are also provided with car allowances, for which the taxes are also paid by the Company.
Lannett provides life insurance for executive officers which would, in the event of death, pay $115,000 to designated beneficiaries. Premiums paid for coverage above $50,000 are treated as imputed income to the executive. Lannett also provides short-term and long-term disability insurance which would, in the event of disability, pay the executive officer sixty percent (60%) of his base salary up to the plan limits of $2,000/week for short term disability and $15,000/month for long term disability. Executive officers participate in other qualified benefit plans, such as medical insurance plans, in the same manner as all other employees.
Attributed costs of the personal benefits available to the named executive officers for the fiscal year ended June 30, 2011, are included in column (i) of the Summary Compensation Table on page 49.
59
Table of Contents
Severance and Change of Control Benefits
We believe that reasonable severance and change in control benefits are necessary in order to recruit and retain qualified senior executives and are generally required by the competitive recruiting environment within our industry and the marketplace in general. These severance benefits reflect the fact that it may be difficult for such executives to find comparable employment within a short period of time, and are designed to alleviate an executive's concerns about the loss of his or her position without cause. We also believe that a change in control arrangement will provide an executive security that will likely reduce the reluctance of an executive to pursue a change in control transaction that could be in the best interests of our stockholders. Lannett's Severance Pay Plan is designed to pay severance benefits to an executive for a qualifying separation. For the Chief Executive Officer, the Severance Pay Plan provides for a payment of three times the sum of base salary plus a pro rated annual cash bonus for the current year calculated as if all targets and goals are achieved. For the other named executive officers, the Severance Pay Plan provides for a payment of eighteen months of base salary plus a pro rated annual cash bonus for the current year calculated as if all targets and goals are achieved.
Timing of Committee Meetings and Grants; Option and Share Pricing
The Committee typically holds four regular meetings each year, and the timing of these meetings is generally established during the year. The Committee holds special meetings from time to time as its workload requires. Historically, annual grants of equity awards have typically been accomplished at a meeting of the Committee in September of each year. Individual grants (for example, associated with the hiring of a new executive officer or promotion to an executive officer position) may occur at any time of year. We expect to coordinate the timing of equity award grants for Fiscal 2010 to be made within thirty (30) days of Lannett's earnings release announcement following the completion of the fiscal year. The exercise price of each stock option and restricted share awarded to our executive officers is the closing price of our common stock on the date of grant.
Tax and Accounting Implications
Deductibility of Executive Compensation
Section 162(m) of the Internal Revenue Code of 1986, as amended, precludes the deductibility of an executive officer's compensation that exceeds $1.0 million per year unless the compensation is paid under a performance-based plan that has been approved by stockholders. The Committee believes that it is generally preferable to comply with the requirements of Section 162(m) through, for example, the use of our Incentive Plan. However, to maintain flexibility in compensating executive officers in a manner that attracts, rewards and retains high quality individuals, the Committee may elect to provide compensation outside of those requirements when it deems appropriate. The Committee believes that stockholder interests are best served by not restricting the Committee's discretion in this regard, even though such compensation may result in non-deductible compensation expenses to the Company.
REPORT OF THE COMPENSATION COMMITTEE
The Compensation Committee has reviewed and discussed the Compensation Discussion and Analysis set forth above with management. Taking this review and discussion into account, the undersigned Committee members recommended to the Board of Directors that the Compensation Discussion and Analysis be included in this annual report on Form 10-K.
| The Compensation Committee | |
|
|
|
|
| Myron Winkelman (Chair) |
|
| Albert Wertheimer |
|
| Ronald West |
60
Table of Contents
ITEM 12. SECURITY OWNERSHIP OF CERTAIN BENEFICIAL OWNERS AND MANAGEMENT AND RELATED STOCKHOLDER MATTERS
The following table sets forth, as of July 31, 2011, information regarding the security ownership of the directors and certain executive officers of the Company and persons known to the Company to be beneficial owners of more than five (5%) percent of the Company's common stock. Although grants of restricted stock under the Company's 2006 Long Term Incentive Plan ("2006 LTIP") generally vest equally over a three year period from the grant date, the restricted shares are included below because the voting rights with respect to such restricted stock are acquired immediately upon grant.
|
|
|
| Excluding Options |
| Including Options (*) |
| ||||
Name and Address of |
| Office |
| Number of |
| Percent of |
| Number of |
| Percent of |
|
Directors/Executive Officers : |
|
|
|
|
|
|
|
|
|
|
|
|
|
|
|
|
|
|
|
|
|
|
|
William Farber 13200 Townsend Road Philadelphia, PA 19154 |
| Chairman Emeritus |
| 5,667,488 | (1) | 19.78 | % | 5,759,988 | (1),(2) | 20.04 | % |
|
|
|
|
|
|
|
|
|
|
|
|
Ronald A. West 13200 Townsend Road Philadelphia, PA 19154 |
| Chairman of the Board, Director |
| 12,810 | (3) | 0.04 | % | 67,758 | (3),(4) | 0.24 | % |
|
|
|
|
|
|
|
|
|
|
|
|
Jeffrey Farber 13200 Townsend Road Philadelphia, PA 19154 |
| Director |
| 5,708,562 | (5) | 19.93 | % | 5,756,062 | (5),(6) | 20.06 | % |
|
|
|
|
|
|
|
|
|
|
|
|
Kenneth Sinclair 13200 Townsend Road Philadelphia, PA 19154 |
| Director |
| 20,000 | (7) | 0.07 | % | 45,000 | (7),(8) | 0.16 | % |
|
|
|
|
|
|
|
|
|
|
|
|
Albert Wertheimer 13200 Townsend Road Philadelphia, PA 19154 |
| Director |
| 23,500 | (9) | 0.08 | % | 45,500 | (9),(10) | 0.17 | % |
|
|
|
|
|
|
|
|
|
|
|
|
Myron Winkelman 13200 Townsend Road Philadelphia, PA 19154 |
| Director |
| 23,500 | (11) | 0.08 | % | 63,500 | (11),(12) | 0.22 | % |
|
|
|
|
|
|
|
|
|
|
|
|
David Drabik 13200 Townsend Road Philadelphia PA 19154 |
| Director |
| 2,500 | (30) | 0.01 | % | 2,500 |
| 0.01 | % |
|
|
|
|
|
|
|
|
|
|
|
|
Arthur P. Bedrosian 13200 Townsend Road Philadelphia, PA 19154 |
| President and Chief Executive Officer |
| 591,211 | (13) | 2.06 | % | 954,111 | (13),(14) | 3.29 | % |
|
|
|
|
|
|
|
|
|
|
|
|
William Schreck 13200 Townsend Road Philadelphia, PA 19154 |
| Chief Operating Officer |
| 35,493 | (15) | 0.12 | % | 171,238 | (15),(16) | 0.59 | % |
|
|
|
|
|
|
|
|
|
|
|
|
Kevin Smith 13200 Townsend Road Philadelphia, PA 19154 |
| Vice President of Sales and Marketing |
| 29,364 | (17) | 0.10 | % | 210,791 | (17),(18) | 0.73 | % |
|
|
|
|
|
|
|
|
|
|
|
|
Ernest Sabo 13200 Townsend Road Philadelphia, PA 19154 |
| Vice President of Regulatory Affairs and Chief Compliance Officer |
| 20,953 | (19) | 0.07 | % | 83,380 | (19),(20) | 0.29 | % |
|
|
|
|
|
|
|
|
|
|
|
|
David Farber 6884 Brook Hollow Ct West Bloomfield, MI 48322 |
|
|
| 5,705,050 | (21) | 19.91 | % | 5,727,550 | (21),(22) | 19.98 | % |
61
Table of Contents
|
|
|
| Excluding Options |
| Including Options (*) |
| ||||
Name and Address of |
| Office |
| Number of |
| Percent of |
| Number of |
| Percent of |
|
|
|
|
|
|
|
|
|
|
|
|
|
Keith R. Ruck 13200 Townsend Road Philadelphia, PA 19154 |
| Vice President of Finance and Chief Financial Officer |
| 6,667 | (23) | 0.02 | % | 18,334 | (23),(24) | 0.09 | % |
|
|
|
|
|
|
|
|
|
|
|
|
Farber Properties 1775 John R Road Troy, MI 48083 |
|
|
| 5,000,000 | (25) | 17.45 | % | 5,000,000 |
| 17.45 | % |
|
|
|
|
|
|
|
|
|
|
|
|
Farber Family LLC 1775 John R Road Troy, MI 48083 |
|
|
| 528,142 | (26) | 1.84 | % | 528,142 |
| 1.84 | % |
|
|
|
|
|
|
|
|
|
|
|
|
Farber Investment LLC 1775 John R Road Troy, MI 48083 |
|
|
| 38,000 | (27) | 0.13 | % | 38,000 |
| 0.13 | % |
|
|
|
|
|
|
|
|
|
|
|
|
Robert Ehlinger 13200 Townsend Road Philadelphia, PA 19154 |
| Vice President of Logistics and Chief Information Officer |
| 18,881 | (28) | 0.07 | % | 56,806 | (28),(29) | 0.20 | % |
|
|
|
|
|
|
|
|
|
|
|
|
All directors and executive officers as a group (12 persons) |
|
|
| 12,160,930 |
| 42.45 | % | 13,244,636 |
| 44.54 | % |
(1) Includes 197,825 shares owned by William Farber's spouse, Audrey Farber; 14,000 shares owned by William Farber's brother, Gerald G. Farber, and 132,212 shares held by William Farber as custodian for his seven grandchildren. Includes 26,250 shares held in William Farber's IRA account. Includes 5,000 shares received pursuant to a restricted stock award granted in January 2011 that vested immediately upon grant.
(2) Includes 37,500 vested options to purchase common stock at an exercise price of $7.97 per share, 25,000 vested options to purchase common stock at an exercise price of $17.36 per share, 25,000 vested options to purchase common stock at an exercise price of $16.04 per share, and 5,000 vested options to purchase common stock at an exercise price of $6.89 per share.
(3) Includes 5,000 shares received pursuant to a restricted stock award granted in January 2011 that vested immediately upon grant.
(4) Includes 9,948 vested options to purchase common stock at an exercise price of $7.97 per share, 15,000 vested options to purchase common stock at an exercise price of $17.36 per share, 25,000 vested options to purchase common stock at an exercise price of $16.04 and 5,000 vested options to purchase common stock at an exercise price of $6.89.
(5) Includes 5,000,000 shares held by Farber Properties Group LLC ("FPG"). FPG is managed and jointly owned by Jeffrey Farber and David Farber. David Farber and Jeffrey Farber each disclaim beneficial ownership of 2,500,000 shares held by FPG. Includes 528,142 shares held by Farber Family LLC ("FFLLC") which is managed by Jeffrey and David Farber. David Farber and Jeffrey Farber each disclaim beneficial ownership of these shares. Includes 150 shares held by Jeffrey Farber as custodian for his son and 10,800 shares held by William Farber as custodian for his children. Also includes 9,500 shares held by Farber Investment Company ("FIC"), which holds 38,000 shares of common stock. Jeffrey Farber and David Farber each beneficially owns 25% of FIC and each disclaims beneficial ownership of all but 9,500 shares held by FIC. Also includes 5,000 shares received pursuant to a restricted stock award granted in January 2011 that vested immediately upon grant.
(6) Includes 10,000 vested options to purchase common stock at an exercise price of $17.36 per share, 12,500 vested options to purchase common stock at an exercise price of $16.04, 20,000 vested options to purchase common stock at an exercise price of $4.55, and 5,000 vested options to purchase common stock at an exercise price of $6.89.
(7) Includes 5,000 shares received pursuant to a restricted stock award granted in January 2011 that vested immediately upon grant.
62
Table of Contents
(8) Includes 20,000 vested options to purchase common stock at an exercise price of $4.55 per share and 5,000 vested options to purchase common stock at an exercise price of $6.89 per share.
(9) Includes 5,000 shares received pursuant to a restricted stock award granted in January 2011 that vested immediately upon grant.
(10) Includes 20,000 vested options to purchase common stock at an exercise price of $9.02 per share and 5,000 vested options to purchase common stock at an exercise price of $6.89 per share.
(11) Includes 5,000 shares received pursuant to a restricted stock award granted in January 2011 that vested immediately upon grant.
(12) Includes 15,000 vested options to purchase common stock at an exercise price of $17.36, 20,000 vested options to purchase common stock at an exercise price of $16.04 and 5,000 vested options to purchase common stock at an exercise price of $6.89 per share.
(13) Includes 35,950 shares owned by Arthur Bedrosian's wife and 3,000 shares owned by his daughter. Mr. Bedrosian disclaims beneficial ownership of these shares. Includes 20,000 shares received pursuant to a restricted stock award granted in October 2009. Also includes 34,660 shares of common stock held through employee stock purchase plan.
(14) Includes 18,000 vested options to purchase common stock at an exercise price of $4.63 per share, 96,900 vested options to purchase common stock at an exercise price of $7.97 per share, 33,000 vested options to purchase common stock at an exercise price of $17.36 per share, 30,000 vested options to purchase common stock at an exercise price of $16.04 per share, 25,000 vested options to purchase common stock at an exercise price of $8.00 per share, 30,000 vested options to purchase common stock at an exercise price of $6.89 per share, 75,000 vested options to purchase common stock at an exercise price of $4.03 per share, 30,000 vested options to purchase common stock at an exercise price of $2.80, and 20,000 vested options to purchase common stock at an exercise price of $6.94 per share.
(15) Includes 10,000 shares received pursuant to a restricted stock award granted in October 2009.
(16) Includes 17,745 vested options to purchase common stock at an exercise price of $11.27 per share, 12,000 vested options to purchase common stock at an exercise price of $5.18 per share and 15,000 vested options to purchase common stock at an exercise price of $6.89 per share, 50,000 vested options to purchase common stock at an exercise price of $4.03 per share, and 16,000 vested options to purchase common stock at an exercise price of $2.80 per share, 25,000 vested options to purchase common stock at an exercise price of $7.53 per share, and 20,000 vested options to purchase common stock at an exercise price of $6.94 per share.
(17) Includes 10,000 shares received pursuant to a restricted stock award granted in October 2009.
(18) Includes 38,760 vested options to purchase common stock at an exercise price of $7.97 per share, 13,000 vested options to purchase common stock at an exercise price of $17.36 per share, 20,000 vested options to purchase common stock at an exercise price of $16.04 per share, 12,000 vested options to purchase common stock at an exercise price of $5.18 per share, 15,000 vested options to purchase common stock at an exercise price of $6.89 per share, 50,000 vested options to purchase common stock at an exercise price of $4.03 per share, 16,000 vested options to purchase common stock at an exercise price of $2.80 and 16,667 vested options to purchase common stock at an exercise price of $6.94 per share.
(19) Includes 10,000 shares received pursuant to a restricted stock award granted in October 2009.
(20) Includes 3,260 vested options to purchase common stock at an exercise price of $7.48 per share, 4,000 vested options to purchase common stock at an exercise price of $5.18 per share, 7,500 vested options to purchase common stock at an exercise price of $6.89 per share, 15,000 vested options to purchase common stock at an exercise price of $4.03 per share, 16,000 vested options to purchase common stock at an exercise price of $2.80 per share, and 16,667 vested options to purchase common stock at an exercise price of $6.94 per share.
(21) Includes 5,000,000 shares held by FPG. FPG is managed and jointly owned by Jeffrey Farber and David Farber. David Farber and Jeffrey Farber each disclaim beneficial ownership of 2,500,000 shares held by FPG. Includes 528,142 shares held by FFLLC which is managed by Jeffrey and David Farber. David Farber and Jeffrey Farber each disclaim beneficial ownership of these shares. Indirect shares include 7,488 shares held by David Farber as custodian for his children, 16,200 shares held by William Farber as custodian for his children and 2,850 shares held by David Farber's spouse. Also includes 9,500 shares held by FIC, which holds
63
Table of Contents
38,000 shares of common stock. Jeffrey Farber and David Farber each beneficially owns 25% of FIC and each disclaims beneficial ownership of all but 9,500 shares held by FIC.
(22) Includes 10,000 vested options to purchase common stock at an exercise price of $17.36 per share and 12,500 vested options to purchase common stock at an exercise price of $16.04 per share.
(23) Includes 6,667 shares received pursuant to a restricted stock award granted in October 2009.
(24) Includes 13,334 vested options to purchase common stock at an exercise price of $7.98 per share and 5,000 vested options to purchase common stock at an exercise price of $6.94 per share.
(25) Farber Properties Group, LLC is managed and jointly owned by Jeffrey Farber and David Farber.
(26) Farber Family LLC is managed by Jeffrey Farber and David Farber as trustees.
(27) Farber Investment LLC is beneficially owned 25% each by Jeffrey and David Farber and 50% by Larry Farber.
(28) 6,667 shares received pursuant to a restricted stock award granted in October 2009.
(29) Includes 10,425 vested options to purchase common stock at an exercise price of $5.05 per share, 7,525 vested options to purchase common stock at an exercise price of $6.89 per share, 15,000 vested options to purchase common stock at an exercise price of $4.03 per share, and 5,000 vested options to purchase common stock at an exercise price of $6.94 per share.
(30) Includes 2,500 shares received pursuant to a restricted stock award granted in January 2011 that vested immediately upon grant.
* Assumes that all options exercisable within sixty days have been exercised which results in 24,538,328 shares outstanding.
Equity Compensation Plan Information
The following table summarizes the equity compensation plans as of June 30, 2011:
Plan Category |
| Number of securities to |
| Weighted average |
| Number of securities |
| |
Equity Compensation plans approved by security holders |
| 1,945,313 |
| $ | 7.57 |
| 3,381,512 |
|
|
|
|
|
|
|
|
| |
Equity Compensation plans not approved by security holders |
| - |
| - |
| - |
| |
|
|
|
|
|
|
|
| |
Total |
| 1,945,313 |
| $ | 7.57 |
| 3,381,512 |
|
ITEM 13. CERTAIN RELATIONSHIPS AND RELATED TRANSACTIONS AND DIRECTOR INDEPENDENCE
The Company had sales of approximately $876,000, $679,000, and $786,000 during the fiscal years ended June 30, 2011, 2010 and 2009, respectively, to a generic distributor, Auburn Pharmaceutical Company ("Auburn"). Jeffrey Farber (the "related party"), a board member and the son of the Chairman Emeritus of the Board of Directors and principal shareholder of the Company, William Farber, is the owner of Auburn. Accounts receivable includes amounts due from the related party of approximately $259,000 and $161,000 at June 30, 2011 and 2010, respectively. In the Company's opinion, the terms of these transactions were not more favorable to the related party than would have been to a non-related party.
In January 2005, Lannett Holdings, Inc. entered into an agreement in which the Company purchased for $100,000 and future royalty payments the proprietary rights to manufacture and distribute a product for which Pharmeral, Inc. ("Pharmeral") owned the ANDA. In Fiscal 2008, the Company obtained FDA approval to use the proprietary rights. Accordingly, the Company originally capitalized this purchased product right as an indefinite lived intangible asset and tested this asset for impairment on a quarterly basis. During the fourth quarter of Fiscal 2009, it was determined that this intangible asset no longer had an indefinite life. No impairment existed
64
Table of Contents
because the estimated fair value exceeded the carrying amount on that date. Accordingly, the $100,000 carrying amount of this intangible asset will be amortized on a straight line basis prospectively over its 10 year remaining estimated useful life. Arthur Bedrosian, President and Chief Executive Officer of the Company, Inc. currently owns 100% of Pharmeral. This transaction was approved by the Board of Directors of the Company and in their opinion the terms were not more favorable to the related party than they would have been to a non-related party. In May 2008, Mr. Bedrosian and Pharmeral waived their rights to any royalty payments on the sales of the drug by Lannett under Lannett's current ownership structure. Should Lannett undergo a change in control where a third party is involved, this royalty would be reinstated. Additionally, the registered trademark OB-Natal® was transferred to Lannett for one dollar from Mr. Bedrosian during 2009.
Lannett Company, Inc. paid a management consultant, who is related to Mr. Bedrosian, $134,914 in fees and $18,905 in reimbursable expenses during Fiscal 2011 and $115,700 in fees and $16,803 in reimbursable expenses during Fiscal 2010. This consultant provided management, construction planning, laboratory set up and administrative services in regards to the Company's initial set up of its Bio-study laboratory in a foreign country. It is expected that this consultant will continue to be utilized into Fiscal 2012. In the Company's opinion, the fee rates paid to this consultant and the expenses reimbursed to him were not more favorable than what would have been paid to a non-related party.
ITEM 14. PRINCIPAL ACCOUNTANT FEES AND SERVICES
Grant Thornton LLP served as the independent auditors of the Company during Fiscal 2011, 2010 and 2009. No relationship exists other than the usual relationship between independent public accountant and client. The following table identifies the fees incurred for services rendered by Grant Thornton LLP in Fiscal 2011, 2010 and 2009.
|
| Audit Fees |
| Audit-Related |
| Tax Fees (1) |
| All Other Fees (2) |
| Total Fees |
| |||||
|
|
|
|
|
|
|
|
|
|
|
| |||||
Fiscal 2011: |
| $ | 323,755 |
| $ | - |
| $ | 144,222 |
| $ | - |
| $ | 467,977 |
|
Fiscal 2010: |
| $ | 352,760 |
| $ | - |
| $ | 190,401 |
| $ | 7,574 |
| $ | 550,735 |
|
Fiscal 2009: |
| $ | 295,084 |
| $ | - |
| $ | 179,677 |
| $ | 10,932 |
| $ | 485,693 |
|
(1) Tax fees include fees paid for preparation of annual federal, state and local income tax returns, quarterly estimated income tax payments, and various tax planning services.
(2) Other fees include fees paid for review of various SEC correspondences.
The non-audit services provided to the Company by Grant Thornton LLP were pre-approved by the Company's audit committee. Prior to engaging its auditor to perform non-audit services, the Company's audit committee reviews the particular service to be provided and the fee to be paid by the Company for such service and assesses the impact of the service on the auditor's independence.
PART IV
ITEM 15. EXHIBITS, FINANCIAL STATEMENT SCHEDULES
(a) Consolidated Financial Statements and Supplementary Data
(1) The following financial statements are included herein:
Consolidated Balance Sheets as of June 30, 2011 and 2010 | 68 |
Consolidated Statements of Operations for each of the three fiscal years ended June 30, 2011 | 69 |
Consolidated Statements of Changes in Shareholders' Equity for each of the three fiscal years ended June 30, 2011 | 70 |
Consolidated Statements of Cash Flows for each of the three fiscal years ended June 30, 2011 | 71 |
Notes to Consolidated Financial Statements for the three fiscal years ended June 30, 2011 | 72 |
Supplementary Data |
|
(2) The following financial statement schedule is included herein
Schedule II - Valuation and Qualifying Accounts | 96 |
(b) A list of the exhibits required by Item 601 of Regulation S-K to be filed as of this Form 10-K is shown on the Exhibit Index filed herewith
65
Table of Contents
SIGNATURES
Pursuant to the requirements of Section 13 or 15(d) of the Securities Exchange Act of 1934, the registrant has duly caused this report to be signed on its behalf by the undersigned, thereunto duly authorized.
|
|
| LANNETT COMPANY, INC. | |
|
|
|
|
|
Date: | September 9, 2011 |
| By: | / s / Arthur P. Bedrosian |
|
|
|
| Arthur P. Bedrosian, |
|
|
|
| President and Chief Executive Officer |
|
|
|
|
|
Date: | September 9, 2011 |
| By: | / s / Martin P. Galvan |
|
|
|
| Martin P. Galvan |
|
|
|
| Vice President of Finance and |
|
|
|
| Chief Financial Officer |
Pursuant to the requirements of the Securities Exchange Act of 1934, this report has been signed by the following persons on behalf of the registrant and in the capacities and on the dates indicated.
Date: | September 9, 2011 |
| By: | / s / Ronald West |
|
|
|
| Ronald West, |
|
|
|
| Chairman of the Board of Directors, |
|
|
|
| Lead Outside Director |
|
|
|
|
|
Date: | September 9, 2011 |
| By: | / s / Jeffrey Farber |
|
|
|
| Jeffrey Farber, |
|
|
|
| Vice Chairman of the Board of Directors |
|
|
|
|
|
Date: | September 9, 2011 |
| By: | / s / Arthur P Bedrosian |
|
|
|
| Arthur P. Bedrosian, |
|
|
|
| Director, President and Chief Executive Officer |
|
|
|
|
|
Date: | September 9, 2011 |
| By: | / s / Kenneth Sinclair |
|
|
|
| Kenneth Sinclair, |
|
|
|
| Director, Chairman of Audit Committee |
|
|
|
|
|
Date: | September 9, 2011 |
| By: | / s / Albert Wertheimer |
|
|
|
| Albert Wertheimer, |
|
|
|
| Director, Chairman of Strategic Planning Committee |
|
|
|
|
|
Date: | September 9, 2011 |
| By: | / s / Myron Winkelman |
|
|
|
| Myron Winkelman, |
|
|
|
| Director, Chairman of Compensation Committee |
|
|
|
|
|
Date: | September 9, 2011 |
| By: | / s / David Drabik |
|
|
|
| David Drabik, |
|
|
|
| Director |
66
Table of Contents
Report of Independent Registered Public Accounting Firm
Board of Directors and Shareholders
Lannett Company, Inc. and Subsidiaries
We have audited the accompanying consolidated balance sheets of Lannett Company, Inc. (a Delaware corporation) and Subsidiaries (collectively, the Company) as of June 30, 2011 and 2010, and the related consolidated statements of operations, changes in shareholders' equity, and cash flows for each of three fiscal years in the period ended June 30, 2011. Our audits of the basic consolidated financial statements included the financial statement schedule listed in the index appearing under Item 15. These financial statements and financial statement schedule are the responsibility of the Company's management. Our responsibility is to express an opinion on these financial statements and financial statement schedule based on our audits.
We conducted our audits in accordance with the standards of the Public Company Accounting Oversight Board (United States). Those standards require that we plan and perform the audit to obtain reasonable assurance about whether the financial statements are free of material misstatement. An audit includes examining, on a test basis, evidence supporting the amounts and disclosures in the financial statements, assessing the accounting principles used and significant estimates made by management, as well as evaluating the overall financial statement presentation. We believe that our audits provide a reasonable basis for our opinion.
In our opinion, the consolidated financial statements referred to above present fairly, in all material respects, the financial position of Lannett Company, Inc. and Subsidiaries as of June 30, 2011 and 2010 and the results of its operations and its cash flows for each of the three fiscal years in the period ended June 30, 2011 in conformity with accounting principles generally accepted in the United States of America. Also, in our opinion, the related financial statement schedule, when considered in relation to the basic consolidated financial statements taken as a whole, presents fairly, in all material respects, the information set forth therein.
We have also audited, in accordance with the standards of the Public Company Accounting Oversight Board (United States), the Company's internal control over financial reporting as of June 30, 2011, based on criteria established in Internal Control - Integrated Framework issued by the Committee of Sponsoring Organizations of the Treadway Commission (COSO) and our report dated September 9, 2011 expressed an unqualified opinion.
/s/ GRANT THORNTON LLP
Philadelphia, Pennsylvania
September 9, 2011
67
Table of Contents
LANNETT COMPANY, INC. AND SUBSIDIARIES
CONSOLIDATED BALANCE SHEETS
|
| June 30, 2011 |
| June 30, 2010 |
| ||
ASSETS |
|
|
|
|
| ||
Current Assets |
|
|
|
|
| ||
Cash and cash equivalents |
| $ | 5,276,735 |
| $ | 21,895,648 |
|
Investment securities |
| 19,382,079 |
| 604,464 |
| ||
Trade accounts receivable (net of allowance of $123,573 and $123,192, respectively) |
| 33,464,440 |
| 38,324,258 |
| ||
Inventories, net |
| 26,902,521 |
| 19,056,868 |
| ||
Income taxes receivable |
| 3,636,306 |
| - |
| ||
Deferred tax assets |
| 4,537,881 |
| 5,337,391 |
| ||
Other current assets |
| 941,902 |
| 2,515,745 |
| ||
Total Current Assets |
| 94,141,864 |
| 87,734,374 |
| ||
|
|
|
|
|
| ||
Property, plant and equipment |
| 54,516,229 |
| 50,160,114 |
| ||
Less accumulated depreciation |
| (24,586,448 | ) | (21,531,845 | ) | ||
|
| 29,929,781 |
| 28,628,269 |
| ||
|
|
|
|
|
| ||
Construction in progress |
| 5,760,686 |
| 2,939,898 |
| ||
Investment securities |
| - |
| 183,742 |
| ||
Intangible assets (product rights) - net of accumulated amortization |
| 5,909,636 |
| 7,785,298 |
| ||
Deferred tax assets |
| 10,446,500 |
| 12,544,330 |
| ||
Other assets |
| 1,555,831 |
| 147,886 |
| ||
Total Assets |
| $ | 147,744,298 |
| $ | 139,963,797 |
|
|
|
|
|
|
| ||
LIABILITIES AND SHAREHOLDERS' EQUITY |
|
|
|
|
| ||
LIABILITIES |
|
|
|
|
| ||
Current Liabilities |
|
|
|
|
| ||
Accounts payable |
| $ | 18,377,782 |
| $ | 16,280,675 |
|
Accrued expenses |
| 1,354,095 |
| 3,464,181 |
| ||
Accrued payroll and payroll related |
| 934,504 |
| 6,304,465 |
| ||
Income taxes payable |
| - |
| 1,479,658 |
| ||
Current portion of long-term debt |
| 629,435 |
| 4,851,278 |
| ||
Rebates, chargebacks and returns payable |
| 13,564,395 |
| 15,249,412 |
| ||
Total Current Liabilities |
| 34,860,211 |
| 47,629,669 |
| ||
|
|
|
|
|
| ||
Long-term debt, less current portion |
| 7,192,496 |
| 2,868,549 |
| ||
Unearned grant funds |
| - |
| 500,000 |
| ||
Other long-term liabilities |
| 2,417 |
| 7,864 |
| ||
Total Liabilities |
| 42,055,124 |
| 51,006,082 |
| ||
Commitment and Contingencies, See notes 9 and 10 |
|
|
|
|
| ||
|
|
|
|
|
| ||
SHAREHOLDERS' EQUITY |
|
|
|
|
| ||
Common stock - authorized 50,000,000 shares, par value $0.001; issued and outstanding, 28,403,946 and 24,882,123 shares, respectively |
| 28,404 |
| 24,882 |
| ||
Additional paid in capital |
| 97,082,360 |
| 79,862,940 |
| ||
Retained earnings |
| 9,287,732 |
| 9,564,632 |
| ||
Noncontrolling interest |
| 139,082 |
| 111,982 |
| ||
Accumulated other comprehensive income |
| 23,899 |
| 44,692 |
| ||
|
| 106,561,477 |
| 89,609,128 |
| ||
Less: Treasury stock at cost - 156,611 and 110,108 shares, respectively |
| (872,303 | ) | (651,413 | ) | ||
TOTAL SHAREHOLDERS' EQUITY |
| 105,689,174 |
| 88,957,715 |
| ||
|
|
|
|
|
| ||
TOTAL LIABILITIES AND SHAREHOLDERS' EQUITY |
| $ | 147,744,298 |
| $ | 139,963,797 |
|
The accompanying notes to consolidated financial statements are an integral part of these statements .
68
Table of Contents
LANNETT COMPANY, INC. AND SUBSIDIARIES
CONSOLIDATED STATEMENTS OF OPERATIONS
|
| Fiscal Year Ended June 30, |
| |||||||
|
| 2011 |
| 2010 |
| 2009 |
| |||
|
|
|
|
|
|
|
| |||
Net sales |
| $ | 106,835,132 |
| $ | 125,177,949 |
| $ | 119,002,215 |
|
Cost of sales |
| 81,898,997 |
| 80,890,575 |
| 71,272,859 |
| |||
Amortization of intangible assets |
| 1,875,662 |
| 1,794,667 |
| 1,787,167 |
| |||
Product royalties |
| (259,240 | ) | 1,152,900 |
| 697,720 |
| |||
|
|
|
|
|
|
|
| |||
Gross profit |
| 23,319,713 |
| 41,339,807 |
| 45,244,469 |
| |||
|
|
|
|
|
|
|
| |||
Research and development expenses |
| 8,587,046 |
| 11,251,421 |
| 8,427,135 |
| |||
Selling, general, and administrative expenses |
| 15,911,702 |
| 17,375,320 |
| 26,059,104 |
| |||
Gain on investments |
| (205,781 | ) | (1,623 | ) | (53,524 | ) | |||
Loss (gain) on sale of assets |
| 21,695 |
| (315,330 | ) | 30,885 |
| |||
|
|
|
|
|
|
|
| |||
Operating (loss) income |
| (994,949 | ) | 13,030,019 |
| 10,780,869 |
| |||
|
|
|
|
|
|
|
| |||
Other income (expense): |
|
|
|
|
|
|
| |||
Grant income |
| 410,000 |
| - |
| - |
| |||
Foreign currency gain |
| 7,114 |
| 4,595 |
| - |
| |||
Interest and dividend income |
| 90,986 |
| 62,328 |
| 209,188 |
| |||
Interest expense |
| (214,519 | ) | (275,870 | ) | (321,751 | ) | |||
|
| 293,581 |
| (208,947 | ) | (112,563 | ) | |||
|
|
|
|
|
|
|
| |||
(Loss) income before income tax (benefit) expense |
| (701,368 | ) | 12,821,072 |
| 10,668,306 |
| |||
Income tax (benefit) expense |
| (461,568 | ) | 4,813,044 |
| 4,090,716 |
| |||
Net (loss) income |
| (239,800 | ) | 8,008,028 |
| 6,577,590 |
| |||
Less net income attributable to noncontrolling interest |
| (37,100 | ) | (186,961 | ) | (43,345 | ) | |||
|
|
|
|
|
|
|
| |||
Net (loss) income attributable to Lannett Company, Inc. |
| $ | (276,900 | ) | $ | 7,821,067 |
| $ | 6,534,245 |
|
|
|
|
|
|
|
|
| |||
Basic (loss) earnings per common share - Lannett Company, Inc. |
| $ | (0.01 | ) | $ | 0.32 |
| $ | 0.27 |
|
Diluted (loss) earnings per common share - Lannett Company, Inc. |
| $ | (0.01 | ) | $ | 0.31 |
| $ | 0.27 |
|
|
|
|
|
|
|
|
| |||
Basic weighted average number of shares outstanding |
| 26,758,552 |
| 24,743,902 |
| 24,447,016 |
| |||
Diluted weighted average number of shares outstanding |
| 26,758,552 |
| 25,199,373 |
| 24,587,378 |
| |||
The accompanying notes to consolidated financial statements are an integral part of these statements.
69
Table of Contents
LANNETT COMPANY, INC. AND SUBSIDIARIES
CONSOLIDATED STATEMENTS OF CHANGES IN SHAREHOLDERS' EQUITY
|
|
|
|
|
|
|
| Retained |
|
|
|
|
|
|
|
|
| |||||||
|
| Common Stock |
| Additional |
| Earnings / |
|
|
|
|
| Accum. |
|
|
| |||||||||
|
| Shares |
|
|
| Paid-in |
| (accumulated |
| Treasury |
| Noncontrolling |
| Other Comp. |
| Shareholders' |
| |||||||
|
| Issued |
| Amount |
| Capital |
| deficit) |
| Stock |
| Interests |
| Income (loss) |
| Equity |
| |||||||
|
|
|
|
|
|
|
|
|
|
|
|
|
|
|
|
|
| |||||||
Balance, June 30, 2008 |
| 24,283,963 |
| $ | 24,284 |
| $ | 74,497,100 |
| $ | (4,790,680 | ) | $ | (468,946 | ) | $ | 50,309 |
| $ | 9,722 |
| $ | 69,321,789 |
|
|
|
|
|
|
|
|
|
|
|
|
|
|
|
|
|
|
| |||||||
Exercise of stock options |
| 10,800 |
| 11 |
| 45,801 |
| - |
| - |
| - |
| - |
| 45,812 |
| |||||||
Shares issued in connection with employee stock purchase plan |
| 49,331 |
| 49 |
| 114,905 |
| - |
| - |
| - |
| - |
| 114,954 |
| |||||||
Share based compensation |
|
|
|
|
|
|
|
|
|
|
|
|
|
|
|
|
| |||||||
Restricted stock |
| - |
| - |
| 172,028 |
| - |
| - |
| - |
| - |
| 172,028 |
| |||||||
Stock options |
| - |
| - |
| 930,878 |
| - |
| - |
| - |
| - |
| 930,878 |
| |||||||
Employee stock purchase plan |
| - |
| - |
| 81,871 |
| - |
| - |
| - |
| - |
| 81,871 |
| |||||||
Shares issued in connection with restricted stock grant |
| 68,602 |
| 69 |
| 101,331 |
| - |
| - |
| - |
| - |
| 101,400 |
| |||||||
Shares issued for Contingent Consideration for Cody Labs Acquisition |
| 105,000 |
| 105 |
| 430,395 |
| - |
| - |
| - |
| - |
| 430,500 |
| |||||||
Stock options repurchased |
| - |
| - |
| (124,000 | ) | - |
| - |
| - |
| - |
| (124,000 | ) | |||||||
Purchase of treasury stock |
| - |
| - |
| - |
| - |
| (20,228 | ) | - |
| - |
| (20,228 | ) | |||||||
Other comprehensive income, net of income tax |
| - |
| - |
| - |
| - |
| - |
| - |
| 15,029 |
| 15,029 |
| |||||||
Net income |
| - |
| - |
| - |
| 6,534,245 |
| - |
| 43,345 |
| - |
| 6,577,590 |
| |||||||
|
|
|
|
|
|
|
|
|
|
|
|
|
|
|
|
|
| |||||||
Balance, June 30, 2009 |
| 24,517,696 |
| $ | 24,518 |
| $ | 76,250,309 |
| $ | 1,743,565 |
| $ | (489,174 | ) | $ | 93,654 |
| $ | 24,751 |
| $ | 77,647,623 |
|
|
|
|
|
|
|
|
|
|
|
|
|
|
|
|
|
|
| |||||||
Exercise of stock options |
| 125,600 |
| 126 |
| 566,659 |
| - |
| - |
| - |
| - |
| 566,785 |
| |||||||
Shares issued in connection with employee stock purchase plan |
| 41,602 |
| 41 |
| 189,217 |
| - |
| - |
| - |
| - |
| 189,258 |
| |||||||
Share based compensation |
|
|
|
|
|
|
|
|
|
|
|
|
|
|
|
|
| |||||||
Restricted stock |
| - |
| - |
| 522,374 |
| - |
| - |
| - |
| - |
| 522,374 |
| |||||||
Stock options |
|
|
|
|
| 1,172,656 |
| - |
| - |
| - |
| - |
| 1,172,656 |
| |||||||
Employee stock purchase plan |
| - |
| - |
| 52,564 |
| - |
| - |
| - |
| - |
| 52,564 |
| |||||||
Shares issued in connection with restricted stock grant |
| 197,225 |
| 197 |
| 1,048,765 |
| - |
| - |
| - |
| - |
| 1,048,962 |
| |||||||
Tax benefit on stock options exercised |
| - |
| - |
| 60,396 |
| - |
| - |
| - |
| - |
| 60,396 |
| |||||||
Purchase of treasury stock |
| - |
| - |
| - |
| - |
| (162,239 | ) |
|
| - |
| (162,239 | ) | |||||||
Distribution to noncontrolling interests |
| - |
| - |
| - |
| - |
| - |
| (168,633 | ) | - |
| (168,633 | ) | |||||||
Other comprehensive income, net of income tax |
| - |
| - |
| - |
| - |
| - |
| - |
| 19,941 |
| 19,941 |
| |||||||
Net income |
| - |
| - |
| - |
| 7,821,067 |
| - |
| 186,961 |
| - |
| 8,008,028 |
| |||||||
|
|
|
|
|
|
|
|
|
|
|
|
|
|
|
|
|
| |||||||
Balance, June 30, 2010 |
| 24,882,123 |
| $ | 24,882 |
| $ | 79,862,940 |
| $ | 9,564,632 |
| $ | (651,413 | ) | $ | 111,982 |
| $ | 44,692 |
| $ | 88,957,715 |
|
|
|
|
|
|
|
|
|
|
|
|
|
|
|
|
|
|
| |||||||
Exercise of stock options |
| 73,068 |
| 73 |
| 282,670 |
| - |
| - |
| - |
| - |
| 282,743 |
| |||||||
Shares issued in connection with employee stock purchase plan |
| 54,702 |
| 55 |
| 218,159 |
| - |
| - |
| - |
| - |
| 218,214 |
| |||||||
Share based compensation |
|
|
|
|
|
|
|
|
|
|
|
|
|
|
|
|
| |||||||
Restricted stock |
| - |
| - |
| 753,909 |
| - |
| - |
| - |
| - |
| 753,909 |
| |||||||
Stock options |
|
|
|
|
| 1,013,448 |
| - |
| - |
| - |
| - |
| 1,013,448 |
| |||||||
Employee stock purchase plan |
| - |
| - |
| 57,466 |
| - |
| - |
| - |
| - |
| 57,466 |
| |||||||
Shares issued in connection with restricted stock grant |
| 144,053 |
| 144 |
| (144 | ) | - |
| - |
| - |
| - |
| - |
| |||||||
Shares issued in connection with public stock offering |
| 3,250,000 |
| 3,250 |
| 14,947,092 |
| - |
| - |
| - |
| - |
| 14,950,342 |
| |||||||
Tax shortfall on stock options exercised |
| - |
| - |
| (53,180 | ) | - |
| - |
| - |
| - |
| (53,180 | ) | |||||||
Purchase of treasury stock |
| - |
| - |
| - |
| - |
| (220,890 | ) |
|
| - |
| (220,890 | ) | |||||||
Distribution to noncontrolling interests |
| - |
| - |
| - |
| - |
| - |
| (10,000 | ) | - |
| (10,000 | ) | |||||||
Other comprehensive loss, net of income tax |
| - |
| - |
| - |
| - |
| - |
| - |
| (20,793 | ) | (20,793 | ) | |||||||
Net (loss) income |
| - |
| - |
| - |
| (276,900 | ) | - |
| 37,100 |
| - |
| (239,800 | ) | |||||||
|
|
|
|
|
|
|
|
|
|
|
|
|
|
|
|
|
| |||||||
Balance, June 30, 2011 |
| 28,403,946 |
| $ | 28,404 |
| $ | 97,082,360 |
| $ | 9,287,732 |
| $ | (872,303 | ) | $ | 139,082 |
| $ | 23,899 |
| $ | 105,689,174 |
|
The accompanying notes to consolidated financial statements are an integral part of these statements.
70
Table of Contents
LANNETT COMPANY, INC. AND SUBSIDIARIES
CONSOLIDATED STATEMENTS OF CASH FLOWS
|
| Fiscal Year Ended June 30, |
| |||||||
|
| 2011 |
| 2010 |
| 2009 |
| |||
OPERATING ACTIVITIES: |
|
|
|
|
|
|
| |||
Net (loss) income |
| $ | (239,800 | ) | $ | 8,008,028 |
| $ | 6,577,590 |
|
Adjustments to reconcile net (loss) income to net cash (used in) provided by operating activities: |
|
|
|
|
|
|
| |||
Depreciation and amortization |
| 4,976,200 |
| 4,888,015 |
| 5,099,108 |
| |||
Deferred tax expense |
| 2,850,128 |
| 182,075 |
| 2,983,538 |
| |||
Stock compensation expense |
| 1,824,823 |
| 2,037,844 |
| 1,286,177 |
| |||
Tax shortfall on stock options exercised |
| 53,180 |
| - |
| - |
| |||
Loss (gain) on sale of assets |
| 21,695 |
| (315,330 | ) | 30,885 |
| |||
Gain on investments |
| (205,781 | ) | (1,623 | ) | (53,524 | ) | |||
Grant income |
| (410,000 | ) | - |
| - |
| |||
Other noncash expenses (income) |
| 18,790 |
| (3,135 | ) | 15,110 |
| |||
Changes in assets and liabilities which (used) provided cash: |
|
|
|
|
|
|
| |||
Trade accounts receivable |
| 4,859,818 |
| (8,802,182 | ) | (5,548,253 | ) | |||
Inventories |
| (7,845,653 | ) | (2,861,507 | ) | (4,578,103 | ) | |||
Prepaid and income taxes payable |
| (5,115,964 | ) | 768,585 |
| 2,310,010 |
| |||
Prepaid expenses and other assets |
| 168,343 |
| (1,908,110 | ) | 46,917 |
| |||
Accounts payable |
| 2,007,107 |
| (524,793 | ) | 3,719,696 |
| |||
Accrued expenses |
| (2,110,086 | ) | 1,621,747 |
| 34,806 |
| |||
Rebates, chargebacks and returns payable |
| (1,685,017 | ) | 1,938,544 |
| 5,125,610 |
| |||
Accrued payroll and payroll related |
| (5,369,961 | ) | 1,913,073 |
| 4,505,949 |
| |||
Deferred revenue |
| - |
| - |
| (982,668 | ) | |||
Net cash (used in) provided by operating activities |
| (6,202,178 | ) | 6,941,231 |
| 20,572,848 |
| |||
|
|
|
|
|
|
|
| |||
INVESTING ACTIVITIES: |
|
|
|
|
|
|
| |||
Purchases of property, plant and equipment (including construction in progress) |
| (7,253,739 | ) | (11,186,833 | ) | (1,604,114 | ) | |||
Proceeds from sale of property, plant and equipment |
| 9,206 |
| 368,463 |
| 1,500 |
| |||
Purchase of intangible asset (product rights) |
| - |
| (500,000 | ) | - |
| |||
Proceeds from sale of investment securities |
| 9,749,622 |
| 339,782 |
| 7,408,295 |
| |||
Purchase of investment securities |
| (28,152,634 | ) | - |
| (5,979,257 | ) | |||
Net cash used in investing activities |
| (25,647,545 | ) | (10,978,588 | ) | (173,576 | ) | |||
|
|
|
|
|
|
|
| |||
FINANCING ACTIVITIES: |
|
|
|
|
|
|
| |||
Proceeds from the issuance of debt |
| 5,056,000 |
| - |
| - |
| |||
Repayments of debt |
| (4,953,896 | ) | (418,941 | ) | (840,066 | ) | |||
Deferred financing fees |
| (26,682 | ) | - |
| - |
| |||
Proceeds from public stock offering |
| 14,950,342 |
| - |
| - |
| |||
Proceeds from issuance of stock |
| 500,957 |
| 756,043 |
| 160,766 |
| |||
Tax (shortfall) benefit on stock options exercised |
| (53,180 | ) | 60,396 |
| - |
| |||
Purchase of treasury stock |
| (220,890 | ) | (162,239 | ) | (20,228 | ) | |||
Repurchase of stock options |
| - |
| - |
| (124,000 | ) | |||
Distribution to noncontrolling interests |
| (10,000 | ) | (168,633 | ) | - |
| |||
Net cash provided by (used in) financing activities |
| 15,242,651 |
| 66,626 |
| (823,528 | ) | |||
|
|
|
|
|
|
|
| |||
Effect of foreign currency rates on cash and cash equivalents |
| (11,841 | ) | 33,923 |
| - |
| |||
|
|
|
|
|
|
|
| |||
NET (DECREASE) INCREASE IN CASH AND CASH EQUIVALENTS |
| (16,618,913 | ) | (3,936,808 | ) | 19,575,744 |
| |||
|
|
|
|
|
|
|
| |||
CASH AND CASH EQUIVALENTS, BEGINNING OF PERIOD |
| 21,895,648 |
| 25,832,456 |
| 6,256,712 |
| |||
|
|
|
|
|
|
|
| |||
CASH AND CASH EQUIVALENTS, END OF PERIOD |
| $ | 5,276,735 |
| $ | 21,895,648 |
| $ | 25,832,456 |
|
|
|
|
|
|
|
|
| |||
SUPPLEMENTAL DISCLOSURE OF CASH FLOW INFORMATION - |
|
|
|
|
|
|
| |||
Interest paid |
| $ | 271,689 |
| $ | 180,186 |
| $ | 217,463 |
|
Income taxes paid |
| $ | 1,808,975 |
| $ | 3,801,987 |
| $ | 250,000 |
|
Lannett stock issued - Fiscal 2009 accrued incentive compensation |
| $ | - |
| $ | 758,712 |
| $ | - |
|
Lannett stock issued - contingent consideration - Cody Labs acquisition |
| $ | - |
| $ | - |
| $ | 581,175 |
|
The accompanying notes to consolidated financial statements are an integral part of these statements.
71
Table of Contents
LANNETT COMPANY, INC. AND ITS SUBSIDIARIES
NOTES TO CONSOLIDATED FINANCIAL STATEMENTS
Note 1. Summary of Significant Accounting Policies
Lannett Company, Inc., a Delaware corporation, and subsidiaries (the "Company" or "Lannett"), develop, manufacture, package, market, and distribute active pharmaceutical ingredients as well as pharmaceutical products sold under generic chemical names. The Company manufactures solid oral dosage forms, including tablets and capsules, topical and oral solutions, and is pursuing partnerships and research contracts for the development and production of other dosage forms, including ophthalmic, nasal and injectable products.
The Company is engaged in an industry which is subject to considerable government regulation related to the development, manufacturing and marketing of pharmaceutical products. In the normal course of business, the Company periodically responds to inquiries or engages in administrative and judicial proceedings involving regulatory authorities, particularly the Food and Drug Administration (FDA) and the Drug Enforcement Agency (DEA).
Use of Estimates - The preparation of financial statements in conformity with accounting principles generally accepted in the United States of America requires management to make estimates and assumptions that affect the reported amounts of assets and liabilities and disclosure of contingent assets and liabilities at the date of the financial statements and the reported amounts of revenues and expenses during the reporting period. Actual results could differ from those estimates.
Principles of Consolidation - The consolidated financial statements include the accounts of the operating parent company, Lannett Company, Inc., and its wholly owned subsidiaries, as well as the consolidation of Cody LCI Realty, LLC, a variable interest entity. See Note 13 regarding the consolidation of this variable interest entity. All intercompany accounts and transactions have been eliminated.
Foreign Currency Translation - The local currency is the functional currency of the Company's foreign subsidiary. Assets and liabilities of the foreign subsidiary are translated into U.S. dollars at the period-end currency exchange rate and revenues and expenses are translated at an average currency exchange rate for the period. The resulting translation adjustment is recorded in a separate component of shareholders' equity and changes to such are included in comprehensive income. Exchange adjustments resulting from transactions denominated in foreign currencies are recognized in the consolidated statements of operations.
Reclassifications - Certain prior year amounts have been reclassified to conform to the current year financial statement presentation.
Revenue Recognition - The Company recognizes revenue when its products are shipped. At this point, title and risk of loss have transferred to the customer and provisions for estimates, including rebates, promotional adjustments, price adjustments, returns, chargebacks, and other potential adjustments are reasonably determinable. Accruals for these provisions are presented in the consolidated financial statements as rebates, chargebacks and returns payable and reductions to net sales. The change in the reserves for various sales adjustments may not be proportionally equal to the change in sales because of changes in both the product and the customer mix. Increased sales to wholesalers will generally require additional accruals as they are the primary recipient of chargebacks and rebates. Incentives offered to secure sales vary from product to product. Provisions for estimated rebates and promotional credits are estimated based upon contractual terms. Provisions for other customer credits, such as price adjustments, returns, and chargebacks, require management to make subjective judgments on customer mix. Unlike branded innovator drug companies, Lannett does not use information about product levels in distribution channels from third-party sources, such as IMS and Wolters Kluwer, in estimating future returns and other credits. Lannett calculates a chargeback/rebate rate based on contractual terms with its customers and applies this rate to customer sales. The only variable is customer mix, and this assumption is based on historical data and sales expectations.
Chargebacks - The provision for chargebacks is the most significant and complex estimate used in the recognition of revenue. The Company sells its products directly to wholesale distributors, generic distributors, retail pharmacy chains, and mail-order pharmacies. The Company also sells its products indirectly to independent pharmacies, managed care organizations, hospitals, nursing homes, and group purchasing organizations, collectively referred to as "indirect customers." Lannett enters into agreements with its indirect customers to establish pricing for certain products. The indirect customers then independently select a wholesaler from which to actually purchase the products at these agreed-upon prices. Lannett will provide credit to the wholesaler for the difference between the agreed-upon price with the indirect customer and the wholesaler's invoice price if the price sold to the indirect customer is lower than the direct price to the wholesaler. This credit is called a chargeback. The provision for chargebacks is based on expected sell-through levels by the Company's wholesale customers to the indirect customers and estimated wholesaler inventory levels. As sales by the Company to the large wholesale customers, such as Cardinal Health, AmerisourceBergen, and McKesson, increase, the reserve for chargebacks will also generally increase. However, the size of the increase depends on the product mix. The Company
72
Table of Contents
continually monitors the reserve for chargebacks and makes adjustments when management believes that expected chargebacks on actual sales may differ from actual chargeback reserves.
Rebates - Rebates are offered to the Company's key chain drug store and wholesaler customers to promote customer loyalty and increase product sales. These rebate programs provide customers with rebate credits upon attainment of pre-established volumes or attainment of net sales milestones for a specified period. Other promotional programs are incentive programs offered to the customers. At the time of shipment, the Company estimates reserves for rebates and other promotional credit programs based on the specific terms in each agreement. The reserve for rebates increases as sales to certain wholesale and retail customers increase. However, since these rebate programs are not identical for all customers, the size of the reserve will depend on the mix of customers that are eligible to receive rebates.
Returns - Consistent with industry practice, the Company has a product returns policy that allows customers to return product within a specified period before and after the product's lot expiration date in exchange for a credit to be applied to future purchases. The Company's policy requires that the customer obtain pre-approval from the Company for any qualifying return. The Company estimates its provision for returns based principally on historical experience. However, the Company continually monitors the provisions for returns and makes adjustments when management believes that future product returns may differ from historical experience. Generally, the reserve for returns increases as net sales increase. The reserve for returns is included in the rebates, chargebacks and returns payable account on the balance sheet.
Other Adjustments - Other adjustments consist primarily of price adjustments, also known as "shelf stock adjustments," which are credits issued to reflect decreases in the selling prices of the Company's products that customers have remaining in their inventories at the time of the price reduction. Decreases in selling prices are discretionary decisions made by management to reflect competitive market conditions. Amounts recorded for estimated shelf stock adjustments are based upon specified terms with direct customers, estimated declines in market prices, and estimates of inventory held by customers. The Company regularly monitors these and other factors and evaluates the reserve as additional information becomes available. Other adjustments are included in the rebates, chargebacks and returns payable account on the balance sheet.
The following tables identify the reserves for each major category of revenue allowance and a summary of the activity for the fiscal years ended June 30, 2010, 2009 and 2008:
For the Year Ended June 30, 2011
Reserve Category |
| Chargebacks |
| Rebates |
| Returns |
| Other |
| Total |
| |||||
Reserve Balance as of June 30, 2010 |
| $ | 6,282,127 |
| $ | 3,566,031 |
| $ | 5,401,254 |
| $ | - |
| $ | 15,249,412 |
|
|
|
|
|
|
|
|
|
|
|
|
| |||||
Actual credits issued related to sales recorded in prior fiscal years |
| (6,100,391 | ) | (3,946,924 | ) | (4,592,322 | ) | - |
| (14,639,637 | ) | |||||
|
|
|
|
|
|
|
|
|
|
|
| |||||
Reserves or (reversals) charged during Fiscal 2011 related to sales in prior fiscal years |
| - |
| 380,894 |
| - |
| - |
| 380,894 |
| |||||
|
|
|
|
|
|
|
|
|
|
|
| |||||
Reserves charged to net sales during Fiscal 2011 related to sales recorded in Fiscal 2011 |
| 53,686,637 |
| 16,587,393 |
| 6,714,748 |
| 3,502,492 |
| 80,491,270 |
| |||||
|
|
|
|
|
|
|
|
|
|
|
| |||||
Actual credits issued related to sales recorded in Fiscal 2011 |
| (48,371,462 | ) | (13,661,917 | ) | (2,381,673 | ) | (3,502,492 | ) | (67,917,544 | ) | |||||
|
|
|
|
|
|
|
|
|
|
|
| |||||
Reserve Balance as of June 30, 2011 |
| $ | 5,496,911 |
| $ | 2,925,477 |
| $ | 5,142,007 |
| $ | - |
| $ | 13,564,395 |
|
73
Table of Contents
For the Year Ended June 30, 2010
Reserve Category |
| Chargebacks |
| Rebates |
| Returns |
| Other |
| Total |
| |||||
Reserve Balance as of June 30, 2009 |
| $ | 6,089,802 |
| $ | 2,537,746 |
| $ | 5,106,992 |
| $ | - |
| $ | 13,734,540 |
|
|
|
|
|
|
|
|
|
|
|
|
| |||||
Actual credits issued related to sales recorded in prior fiscal years |
| (6,068,639 | ) | (2,537,746 | ) | (3,832,652 | ) | - |
| (12,439,037 | ) | |||||
|
|
|
|
|
|
|
|
|
|
|
| |||||
Reserves or (reversals) charged during Fiscal 2010 related to sales in prior fiscal years |
| - |
| - |
| (401,203 | ) | - |
| (401,203 | ) | |||||
|
|
|
|
|
|
|
|
|
|
|
| |||||
Reserves charged to net sales during Fiscal 2010 related to sales recorded in Fiscal 2010 |
| 48,539,403 |
| 16,353,467 |
| 4,528,118 |
| 1,226,614 |
| 70,647,601 |
| |||||
|
|
|
|
|
|
|
|
|
|
|
| |||||
Actual credits issued related to sales recorded in Fiscal 2010 |
| (42,278,440 | ) | (12,787,436 | ) | - |
| (1,226,614 | ) | (56,292,489 | ) | |||||
|
|
|
|
|
|
|
|
|
|
|
| |||||
Reserve Balance as of June 30, 2010 |
| $ | 6,282,127 |
| $ | 3,566,031 |
| $ | 5,401,254 |
| $ | - |
| $ | 15,249,412 |
|
For the Year Ended June 30, 2009
Reserve Category |
| Chargebacks |
| Rebates |
| Returns |
| Other |
| Total |
| |||||
Reserve Balance as of June 30, 2008 |
| $ | 4,049,407 |
| $ | 632,314 |
| $ | 13,642,589 |
| $ | 2,107 |
| $ | 18,326,417 |
|
|
|
|
|
|
|
|
|
|
|
|
| |||||
Actual credits issued related to sales recorded in prior fiscal years |
| (3,954,794 | ) | (632,314 | ) | (12,853,342 | ) | - |
| (17,440,450 | ) | |||||
|
|
|
|
|
|
|
|
|
|
|
| |||||
Reserves or (reversals) charged during Fiscal 2009 related to sales in prior fiscal years |
| - |
| - |
| 2,107 |
| (2,107 | ) | - |
| |||||
|
|
|
|
|
|
|
|
|
|
|
| |||||
Reserves charged to net sales during Fiscal 2009 related to sales recorded in Fiscal 2009 |
| 35,391,475 |
| 12,141,204 |
| 4,315,638 |
| 204,119 |
| 52,052,436 |
| |||||
|
|
|
|
|
|
|
|
|
|
|
| |||||
Actual credits issued related to sales recorded in Fiscal 2009 |
| (29,396,286 | ) | (9,603,458 | ) | - |
| (204,119 | ) | (39,203,863 | ) | |||||
|
|
|
|
|
|
|
|
|
|
|
| |||||
Reserve Balance as of June 30, 2009 |
| $ | 6,089,802 |
| $ | 2,537,746 |
| $ | 5,106,992 |
| $ | - |
| $ | 13,734,540 |
|
The total reserve for chargebacks, rebates, returns and other adjustments decreased from $15,249,412 at June 30, 2010 to $13,564,395 at June 30, 2011. The decrease in total reserves was due to a decrease in the rebates reserve as a result of reduced gross sales to customers who participate in rebate programs as well as timing of actual rebate credits issued. The $380,894 of rebates reserves charged during Fiscal 2011 related to sales in prior fiscal years resulted from a change in estimate based on new information obtained from an audit of customers' accounts. Although gross sales to wholesalers increased in Fiscal 2011 compared to Fiscal 2010, the decrease in chargeback reserves is due primarily to a decrease in inventory levels at wholesaler distribution centers as of June 30, 2011. The activity in the Other category for the year ended June 30, 2011 includes shelf-stock adjustments totaling $2,670,406 primarily related to products for the treatment of thyroid deficiency and heart failure.
During Fiscal 2010, approximately $424,000 of the original $10,545,000 return reserve recorded in Fiscal 2008 for Prenatal Multivitamin was applied to accounts receivable for customers who had returned the Prenatal Multivitamin product during 2010. In addition, the Company reversed approximately $387,000 to net sales in the fourth quarter of Fiscal 2010 as a result of new information that the Company received regarding the amount of Multivitamin product that remained to be returned to the Company. This adjustment left a balance of approximately $17,000 of Multivitamin returns reserve on the consolidated balance sheet at June 30, 2010. As of June 30, 2011, there is a zero balance for this reserve.
74
Table of Contents
The Company ships its products to the warehouses of its wholesale and retail chain customers. When the Company and a customer enter into an agreement for the supply of a product, the customer will generally continue to purchase the product, stock its warehouse(s), and resell the product to its own customers. The Company's customer will reorder the product as its warehouse is depleted. The Company generally has no minimum size orders for its customers. Additionally, most warehousing customers prefer not to stock excess inventory levels due to the additional carrying costs and inefficiencies created by holding excess inventory. As such, the Company's customers continually reorder the Company's products. It is common for the Company's customers to order the same products on a monthly basis. For generic pharmaceutical manufacturers, it is critical to ensure that customers' warehouses are adequately stocked with its products. This is important due to the fact that multiple generic competitors may compete for the consumer demand for a given product. Availability of inventory ensures that a manufacturer's product is considered. Otherwise, retail prescriptions would be filled with competitors' products. For this reason, the Company periodically offers incentives to its customers to purchase its products. These incentives are generally up-front discounts off its standard prices at the beginning of a generic campaign launch for a newly-approved or newly-introduced product, or when a customer purchases a Lannett product for the first time. Customers generally inform the Company that such purchases represent an estimate of expected resale for a period of time. This period of time is generally up to three months. The Company records this revenue, net of any discounts offered and accepted by its customers at the time of shipment. The Company's products generally have either 24 months or 36 months of shelf-life at the time of manufacture. The Company monitors its customers' purchasing trends to attempt to identify any significant lapses in purchasing activity. If the Company observes a lack of recent activity, inquiries will be made to such customer regarding the success of the customer's resale efforts. The Company attempts to minimize any potential return (or shelf life issues) by maintaining an active dialogue with the customers.
The products that the Company sells are generic versions of brand named drugs. The consumer markets for such drugs are well-established markets with many years of historically-confirmed consumer demand. Such consumer demand may be affected by several factors, including alternative treatments and costs, etc. However, the effects of changes in such consumer demand for the Company's products, like generic products manufactured by other generic companies, are gradual in nature. Any overall decrease in consumer demand for generic products generally occurs over an extended period of time. This is because there are thousands of doctors, prescribers, third-party payers, institutional formularies and other buyers of drugs that must change prescribing habits and medicinal practices before such a decrease would affect a generic drug market. If the historical data the Company uses and the assumptions management makes to calculate its estimates of future returns, chargebacks, and other credits do not accurately approximate future activity, its net sales, gross profit, net income and earnings per share could change. However, management believes that these estimates are reasonable based upon historical experience and current conditions.
Cash and cash equivalents - The Company considers all highly liquid securities purchased with original maturities of 90 days or less to be cash equivalents. Cash equivalents are stated at cost, which approximates market value, and consist of certificates of deposit that are readily converted to cash. The Company maintains cash and cash equivalents with several major financial institutions. Such amounts frequently exceed Federal Deposit Insurance Corporation ("FDIC") limits.
Accounts Receivable - The Company performs ongoing credit evaluations of its customers and adjusts credit limits based upon payment history and the customer's current credit worthiness, as determined by a review of current credit information. The Company continuously monitors collections and payments from its customers and maintains a provision for estimated credit losses based upon historical experience and any specific customer collection issues that have been identified. While such credit losses have historically been within both the Company's expectations and the provisions established, the Company cannot guarantee that it will continue to experience the same credit loss rates that it has in the past.
Inventories - The Company values its inventory at the lower of cost (determined by the first-in, first-out method) or market, regularly reviews inventory quantities on hand, and records a provision for excess and obsolete inventory based primarily on estimated forecasts of product demand and production requirements. The Company's estimates of future product demand may fluctuate, in which case estimated required reserves for excess and obsolete inventory may increase or decrease. If the Company's inventory is determined to be overvalued, the Company recognizes such costs in cost of goods sold at the time of such determination. Likewise, if inventory is determined to be undervalued, the Company may have recognized excess cost of goods sold in previous periods and would recognize such additional operating income at the time of sale.
Property, Plant and Equipment - Property, plant and equipment are stated at cost. Depreciation is provided for by the straight-line method for financial reporting purposes over the estimated useful lives of the assets. Depreciation expense for the fiscal years ended June 30, 2011, 2010, and 2009 was approximately $3,101,000, $3,055,000 and $3,275,000, respectively.
Investment Securities - The Company's investment securities consist of certificates of deposit, equity securities and marketable debt securities, primarily U.S. government and agency obligations. The Company's certificates of deposit are classified as held-to-maturity, its equity securities are classified as trading and all of its marketable debt securities are classified as available-for-sale. Investment securities are recorded at fair value based on quoted market prices. For trading investments, unrealized holding gains and
75
Table of Contents
losses are recorded in gain of investments on the consolidated statements of operations. For available-for-sale investments, unrealized holding gains and losses are recorded, net of any tax effect, as a separate component of accumulated other comprehensive income. No gains or losses on investment securities are realized until they are sold or a decline in fair value is determined to be other-than-temporary. The Company reviews its investment securities and determines whether the investments are other-than-temporarily impaired. If the investments are deemed to be other-than-temporarily impaired, the investments are written down to their then current fair market value with a new cost basis being established. There were no securities determined by management to be other-than-temporarily impaired for the fiscal years ended June 30, 2011, 2010 and 2009.
Shipping and Handling Costs - The cost of shipping products to customers is recognized at the time the products are shipped, and is included in cost of sales.
Research and Development - Research and development costs are charged to expense as incurred.
Intangible Assets - In March 2004, the Company entered into an agreement with Jerome Stevens Pharmaceuticals, Inc. (JSP) for the exclusive marketing and distribution rights in the United States to the current line of JSP products in exchange for four million (4,000,000) shares of the Company's common stock. As a result of the JSP agreement, the Company recorded an intangible asset for the exclusive marketing and distribution rights obtained from JSP. The Company will incur annual amortization expense of approximately $1,785,000 for the JSP intangible asset over the remaining term of the agreement.
On April 10, 2007, the Company entered into a Stock Purchase Agreement to acquire Cody by purchasing all of the remaining shares of common stock of Cody. The consideration for the April 10, 2007 acquisition was approximately $4,438,000, which represented the fair value of the tangible net assets acquired. The agreement also required Lannett to issue to the sellers up to 120,000 shares of unregistered common stock of the Company contingent upon the receipt of a license from a regulatory agency. This license was subsequently received in July 2008 and triggered the payment of 105,000 shares (87.5% of the 120,000 shares as the Company already owned 12.5%) of Lannett stock to the former owners of Cody Labs, which was completed in October 2008. Therefore, the Company recorded an intangible asset related to the acquisition of a drug import license in the original amount of $581,175 and recorded a corresponding deferred tax liability of approximately $150,700 due to the non-deductibility of the amortization for tax purposes. The Company has assigned a 15 year life to this intangible asset based on average life cycles of Lannett products.
In January 2005, Lannett Holdings, Inc. entered into an agreement in which the Company purchased for $100,000 and future royalty payments the proprietary rights to manufacture and distribute a product for which Pharmeral, Inc. owned the ANDA. In May 2008, the Company and Pharmeral waived their rights to any royalty payments on the sales of the drug by Lannett, under Lannett's current ownership structure. Should Lannett undergo a major change in control where a third party is involved, this royalty will be reinstated. In Fiscal 2008, the Company obtained FDA approval to use these proprietary rights. Accordingly, the Company has capitalized this purchased product right as an indefinite lived intangible asset which is tested for impairment at least on an annual basis. During the fourth quarter of fiscal 2009, it was determined that this intangible asset no longer had an indefinite life. No impairment existed because the estimated fair value exceeded the carrying amount on that date. Accordingly, the $100,000 carrying amount of this intangible asset will be amortized on a straight line basis prospectively over its 10 year remaining estimated useful life. See Note 17.
In August 2009, the Company acquired eight new ANDAs covering three separate product lines from another generic drug manufacturer for a purchase price of $500,000. The Company began shipping one of these product lines in October 2010. Accordingly, the Company allocated $325,000 of the purchase price to this product line, based on the relative fair market values of the acquired ANDAs, which is being amortized on a straight line basis over its 15 year estimated product life. It is expected that the Company will be able to produce one of the other product lines by the first half of Fiscal 2013. Since it has no current plans to manufacture the third product line acquired under these new ANDAs, the Company wrote off the purchase price that was allocated to that product line during the fourth quarter of Fiscal 2011 which amounted to $26,000. Amortization will begin on the remaining $149,000 when the Company starts shipping this product.
An intangible asset that is not subject to amortization shall be tested for impairment annually or more frequently if events or changes in circumstances indicate that the asset might be impaired. An impairment loss is measured as the excess of the asset's carrying value over its fair value, calculated using a discounted future cash flow method. Our discounted cash flow models are highly reliant on various assumptions which are considered level 3 inputs, including estimates of future cash flow (including long-term growth rates), discount rate, and expectations about variations in the amount and timing of cash flows and the probability of achieving the estimated cash flows. As of June 30, 2011 and 2010, no impairment existed with respect to this non-amortized asset.
For the fiscal years ended June 30, 2011, 2010 and 2009, the Company incurred amortization expense of approximately $1,876,000, $1,833,000, and $1,824,000, respectively. As of June 30, 2011 and 2010, accumulated amortization totaled approximately $11,334,000 and $9,458,000, respectively.
76
Table of Contents
Future annual amortization expense consists of the following:
Fiscal Year Ending June 30, |
| Annual Amortization Expense |
| |
2012 |
| $ | 1,855,079 |
|
2013 |
| 1,855,079 |
| |
2014 |
| 1,408,912 |
| |
2015 |
| 70,412 |
| |
2016 |
| 70,412 |
| |
Thereafter |
| 500,744 |
| |
|
| $ | 5,760,636 |
|
The amounts above do not include the product line covered by the ANDA's purchased in August 2009 for $149,000, as amortization will begin when the Company starts shipping these products.
Other Assets - As of July 24, 2010, Lannett stopped manufacturing and distributing Morphine Sulfate Oral Solution. Lannett filed a 505(b)(2) New Drug Application ("MS NDA") in February 2010 and received FDA approval on the submission in June 2011. The filing fee related to this application totaled $1,405,500 and was initially recorded within other current assets on the consolidated balance sheets because part or all of this fee was thought to be refundable. Lannett met with the FDA in January 2011 to review the status of the application. At that time, the FDA stated that it will need to inspect Lannett's facilities as part of a Pre-Approval Inspection before it could give final approval on the MS NDA. Additionally, the Company corresponded with the FDA in March 2011 regarding whether any of the fee is refundable. The FDA's response was that all of the filing fee was not refundable, but the Company awaits a final decision from the FDA.
The Company's position is that the value related to the part of the fee that is not refunded is the cost of getting regulatory approval for its MS product and that this value should be properly recorded as an intangible asset based upon approval and amortized over the product's estimated useful life upon shipment of the product. The revenues and gross profit margins attained by the Company when it was previously selling its MS product currently substantiate its value as an intangible asset.
As of June 30, 2011, the Company received approval on the MS application, it has not received final determination on whether any of the fee is refundable, and it has not yet restarted shipments of the MS product. As a result of this information, the Company continues to carry this amount in other long-term assets as of June 30, 2011. As a result of the FDA approval of the MS NDA, an estimate of the nonrefundable amount will be reclassified to intangible assets upon shipment of the product which commenced in August 2011. Amortization will begin upon shipment of the product in August 2011 over the products estimated useful life. Amortization will be adjusted prospectively once the nonrefundable amount is finalized.
Advertising Costs - The Company charges advertising costs to operations as incurred. Advertising expense for the fiscal years ended June 30, 2011, 2010 and 2009 was approximately $53,000, $30,000, and $48,000, respectively.
Income Taxes - The Company uses the liability method to account for income taxes. Deferred tax assets and liabilities are determined based on the difference between the financial statement and tax bases of assets and liabilities as measured by the enacted tax rates which will be in effect when these differences reverse. Deferred tax expense/(benefit) is the result of changes in deferred tax assets and liabilities. The Company may recognize the tax benefit from an uncertain tax position claimed on a tax return only if it is more likely than not that the tax position will be sustained on examination by the taxing authorities, based on the technical merits of the position. The tax benefits recognized in the financial statements from such a position should be measured based on the largest benefit that has a greater than 50% likelihood of being realized upon ultimate settlement. The authoritative standards issued by the FASB also provide guidance on de-recognition, classification, interest and penalties on income taxes, accounting in interim periods and requires increased disclosures.
Segment Information - The Company operates one business segment - generic pharmaceuticals; accordingly the Company has one reporting segment. The Company aggregates its financial information for all products and reports as one operating segment. The following table identifies the Company's approximate net product sales by medical indication for the fiscal years ended June 30, 2011, 2010 and 2009:
77
Table of Contents
|
| For the Fiscal Year Ended June 30, |
| |||||||
Medical Indication |
| 2011 |
| 2010 |
| 2009 |
| |||
|
|
|
|
|
|
|
| |||
Migraine Headache |
| $ | 8,653,978 |
| $ | 9,854,717 |
| $ | 9,553,143 |
|
Epilepsy |
| 1,663,097 |
| 2,020,371 |
| 1,777,820 |
| |||
Prescription Vitamin |
| 1,837,904 |
| 5,640,136 |
| 12,569,304 |
| |||
Heart Failure |
| 12,445,365 |
| 20,996,057 |
| 26,421,467 |
| |||
Thyroid Deficiency |
| 47,051,446 |
| 52,224,711 |
| 47,740,204 |
| |||
Antibiotic |
| 6,100,652 |
| 6,448,704 |
| 6,440,470 |
| |||
Pain Management |
| 14,746,540 |
| 14,128,982 |
| 4,155,176 |
| |||
Other |
| 14,336,150 |
| 13,864,271 |
| 10,344,631 |
| |||
|
|
|
|
|
|
|
| |||
Total |
| $ | 106,835,132 |
| $ | 125,177,949 |
| $ | 119,002,215 |
|
Concentration of Market and Credit Risk - The following table identifies certain of the Company's products, defined as generics containing the same active ingredient or combination of ingredients, which accounted for greater than 10% of net sales for the fiscal years ended June 30, 2011, 2010 and 2009, respectively.
|
| 2011 |
| 2010 |
| 2009 |
|
|
|
|
|
|
|
|
|
Product 1 |
| 44 | % | 42 | % | 40 | % |
Product 2 |
| 12 | % | 17 | % | 22 | % |
Product 3 |
| 2 | % | 5 | % | 11 | % |
The following table identifies certain of the Company's customers which accounted for greater than 10% of net sales for the fiscal years ended June 30, 2011, 2010 and 2009, respectively.
|
| 2011 |
| 2010 |
| 2009 |
|
|
|
|
|
|
|
|
|
Customer A |
| 17 | % | 26 | % | 28 | % |
Customer B |
| 10 | % | 11 | % | 7 | % |
At June 30, 2011 and 2010, four customers accounted for 69% of the Company's accounts receivable balances. Credit terms are offered to customers based on evaluations of the customers' financial condition. Generally, collateral is not required from customers. Accounts receivable payment terms vary and are stated in the financial statements at amounts due from customers net of an allowance for doubtful accounts. Accounts remaining outstanding longer than the payment terms are considered past due. The Company determines its allowance by considering a number of factors, including the length of time trade accounts receivable are past due, the Company's previous loss history, the customer's current ability to pay its obligation to the Company, and the condition of the general economy and the industry as a whole. The Company writes-off accounts receivable when they become uncollectible.
Share-based Payments - The Company recognizes compensation cost for share-based compensation issued to or purchased by employees, net of estimated forfeitures, under share-based compensation plans using a fair value method. Compensation cost related to share-based payments is included in the income statement in the same line item as the related other compensation costs.
At June 30, 2011, the Company had four stock-based employee compensation plans (the "Old Plan," the "2003 Plan," the 2006 Long-term Incentive Plan, or "2006 LTIP" and the 2011 Long-Term Incentive Plan or "2011 LTIP").
At June 30, 2011, there were 1,945,313 options outstanding. Of those, 953,850 were options issued under the 2006 LTIP, 786,230 were issued under the 2003 Plan, and 205,233 under the Old Plan. There are no further shares authorized to be issued under the Old Plan. 1,125,000 shares were authorized to be issued under the 2003 Plan, with 58,658 shares under options having already been exercised under that plan since its inception, leaving a balance of 280,112 shares in that plan for future issuances. 2,500,000 shares were authorized to be issued under the 2006 LTIP, with 158,500 shares under options having already been exercised under that plan since its inception. At June 30, 2011, there were 155,011 nonvested restricted shares outstanding which were issued under the 2006 LTIP, with 484,344 shares having already vested under that plan since its inception. At June 30, 2011, a balance of 748,295 shares is available in the 2006 LTIP for future issuances.
In January 2011, the shareholders of the Company approved a new stock option and restricted stock award plan, the 2011 LTIP, which authorized 1,500,000 new shares of common stock for future issuances under this plan. As of June 30, 2011, no shares have been issued under this plan.
78
Table of Contents
During the fiscal year ended June 30, 2011, the Company awarded 32,500 shares of restricted stock to non-management Board members under the 2006 LTIP which vested immediately. Stock compensation expense of $182,175 was recognized during the fiscal year ended June 30, 2011, related to these shares of restricted stock.
During the fiscal year ended June 30, 2010, the Company awarded 45,000 shares of restricted stock to non-management Board members under the 2006 LTIP which vested immediately. Stock compensation expense of $290,250 was recognized during the fiscal year ended June 30, 2010, related to these shares of restricted stock.
During the fiscal year ended June 30, 2010, the Company awarded 237,500 shares of restricted stock to management employees under the 2006 LTIP which vest in equal portions on October 29, 2010, 2011 and 2012. Stock compensation expense of $541,766 and $350,346 was recognized during the fiscal years ended June 30, 2011 and 2010, respectively, related to these shares of restricted stock.
During the fiscal year ended June 30, 2010, the Company awarded 116,725 shares of restricted stock to management employees under the 2006 LTIP which vested immediately in partial settlement of Fiscal 2009 accrued incentive compensation costs totaling $758,712.
During the fiscal year ended June 30, 2009, the Company awarded 30,000 shares of restricted stock to non-management Board members under the 2006 LTIP which vested immediately. Stock compensation expense of $101,400 was recognized during the fiscal year ended June 30, 2009, related to these shares of restricted stock.
During the fiscal year ended June 30, 2008, the Company awarded 209,264 shares of restricted stock to management employees under the 2006 LTIP, of which 74,464 of these shares vested 100% on January 1, 2008, and the remainder vest in equal portions on September 18, 2008, 2009 and 2010. Stock compensation expense of $29,968, $172,028 and $172,028 was recognized during the fiscal years ended June 30, 2011, 2010 and 2009, respectively, related to these shares of restricted stock.
The Company measures share-based compensation cost for options using the Black-Scholes option pricing model. The following table presents the weighted average assumptions used to estimate fair values of the stock options granted during the years ended June 30 and the estimated annual forfeiture rates used to recognize the associated compensation expense:
|
| Incentive |
| Non- |
| Incentive |
| Non- |
| Incentive |
| Non- |
| ||||||
Risk-free interest rate |
| 1.74 | % | - | % | 2.44 | % | 2.43 | % | 2.46 | % | 2.52 | % | ||||||
Expected volatility |
| 61 | % | - | % | 67 | % | 67 | % | 61 | % | 56 | % | ||||||
Expected dividend yield |
| 0.0 | % | - | % | 0.0 | % | 0.0 | % | 0.0 | % | 0.0 | % | ||||||
Forfeiture rate |
| 7.5 | % | - | % | 5.0 | % | 5.0 | % | 5.0 | % | 5.0 | % | ||||||
Expected term (in years) |
| 6.0 years |
| n/a |
| 5.0 years |
| 5.0 years |
| 5.0 years |
| 5.0 years |
| ||||||
Weighted average fair value |
| $ | 3.03 |
| $ | - |
| $ | 3.98 |
| $ | 4.00 |
| $ | 2.20 |
| $ | 1.41 |
|
Expected volatility is based on the historical volatility of the price of our common shares since the date we commenced trading on the NYSE - Amex, April 2002, or a historical period equal to the expected term of the option, whichever is shorter. We use historical information to estimate expected term within the valuation model. The expected term of awards represents the period of time that options granted are expected to be outstanding. The risk-free rate for periods within the expected life of the option is based on the U.S. Treasury yield curve in effect at the time of grant. Compensation cost is recognized using a straight-line method over the vesting or service period and is net of estimated forfeitures.
The forfeiture rate assumption is the estimated annual rate at which unvested awards are expected to be forfeited during the vesting period. This assumption is based on our historical forfeiture rate. Periodically, management will assess whether it is necessary to adjust the estimated rate to reflect changes in actual forfeitures or changes in expectations. For example, adjustments may be needed if, historically, forfeitures were affected mainly by turnover that resulted from a business restructuring that is not expected to recur. The forfeiture rate used to calculate compensation expense was 7.5% for fiscal year 2011 and 5% for fiscal years 2010 and 2009. The Company will incur additional expense if the actual forfeiture rate is lower than originally estimated. A recovery of prior expense will be recorded if the actual rate is higher than originally estimated.
79
Table of Contents
The following table presents all share-based compensation costs recognized in our statements of income, substantially all of which is reflected in the selling, general and administrative expense line:
|
| Twelve months ended June 30, |
| |||||||
|
| 2011 |
| 2010 |
| 2009 |
| |||
Share based compensation |
|
|
|
|
|
|
| |||
Stock options |
| $ | 1,013,448 |
| $ | 1,172,656 |
| $ | 930,878 |
|
Employee stock purchase plan |
| $ | 57,466 |
| $ | 52,564 |
| $ | 81,871 |
|
Restricted stock |
| $ | 753.909 |
| $ | 812,624 |
| $ | 273,428 |
|
Tax benefit at statutory rate |
| $ | 87,748 |
| $ | 79,611 |
| $ | 79,560 |
|
During Fiscal 2009 as part of a prior CFO's resignation, the Company repurchased all of his 185,000 outstanding stock options. Therefore, the Company recorded, as incremental stock compensation expense, the previously unrecognized compensation cost totaling approximately $83,000 related to options for which the requisite service period had not been rendered as of the repurchase date. See Note 10 for additional information.
Options outstanding that have vested and are expected to vest as of June 30, 2011 are as follows:
|
| Awards |
| Weighted |
| Aggregate |
| Weighted |
| ||
Options vested |
| 1,472,020 |
| $ | 7.90 |
| $ | 501,955 |
| 4.92 |
|
Options expected to vest |
| 445,219 |
| $ | 6.53 |
| $ | 91,884 |
| 8.23 |
|
Total vested and expected to vest |
| 1,917,239 |
| $ | 7.58 |
| $ | 593,839 |
| 5.69 |
|
A summary of nonvested restricted stock awards as of June 30, 2011, 2010, and 2009 and changes during the fiscal years then ended, is presented below:
|
| Awards |
| Weighted |
| |
|
|
|
|
|
| |
Nonvested at June 30, 2008 |
| 124,800 |
| $ | 502,944 |
|
Granted |
| 30,000 |
| 101,400 |
| |
Vested |
| (68,602 | ) | (256,966 | ) | |
Forfeited |
| (9,000 | ) | (36,270 | ) | |
Nonvested at June 30, 2009 |
| 77,198 |
| 311,108 |
| |
Granted |
| 399,225 |
| 2,697,213 |
| |
Vested |
| (197,225 | ) | (1,192,028 | ) | |
Forfeited |
| (9,300 | ) | (37,479 | ) | |
Nonvested at June 30, 2010 |
| 269,898 |
| 1,778,814 |
| |
Granted |
| 32,500 |
| 182,175 |
| |
Vested |
| (144,053 | ) | (862,075 | ) | |
Forfeited |
| (3,334 | ) | (23,138 | ) | |
Nonvested at June 30, 2011 |
| 155,011 |
| $ | 1,075,776 |
|
80
Table of Contents
A summary of stock option award activity under the Plans as of June 30, 2011, 2010 and 2009 and changes during the years then ended, is presented below:
|
| Incentive Stock Options |
| Nonqualified Stock Options |
| ||||||||||||||||
|
|
|
|
|
|
|
| Weighted |
|
|
|
|
|
|
| Weighted |
| ||||
|
|
|
| Weighted- |
|
|
| Average |
|
|
| Weighted- |
|
|
| Average |
| ||||
|
|
|
| Average |
| Aggregate |
| Remaining |
|
|
| Average |
| Aggregate |
| Remaining |
| ||||
|
|
|
| Exercise |
| Intrinsic |
| Contractual |
|
|
| Exercise |
| Intrinsic |
| Contractual |
| ||||
|
| Awards |
| Price |
| Value |
| Life |
| Awards |
| Price |
| Value |
| Life |
| ||||
|
|
|
|
|
|
|
|
|
|
|
|
|
|
|
|
|
| ||||
Outstanding at July 1, 2010 |
| 1,309,254 |
| $ | 6.11 |
|
|
|
|
| 749,597 |
| $ | 9.77 |
|
|
|
|
| ||
Granted |
| 2,250 |
| $ | 5.35 |
|
|
|
|
| - |
|
|
|
|
|
|
| |||
Exercised |
| (73,068 | ) | $ | 3.87 |
| $ | 144,498 |
|
|
| - |
| - |
| - |
|
|
| ||
Forfeited, expired or repurchased |
| (42,720 | ) | $ | 7.71 |
|
|
|
|
| - |
|
|
|
|
|
|
| |||
Outstanding at June 30, 2011 |
| 1,195,716 |
| $ | 6.19 |
| $ | 452,794 |
| 6.5 |
| 749,597 |
| $ | 9.77 |
| $ | 143,021 |
| 4.5 |
|
|
|
|
|
|
|
|
|
|
|
|
|
|
|
|
|
|
| ||||
Outstanding at June 30, 2011 and not yet vested |
| 397,211 |
| $ | 6.46 |
| $ | 93,860 |
| 8.2 |
| 76,082 |
| $ | 6.99 |
| $ | - |
| 8.3 |
|
Exercisable at June 30, 2011 |
| 798,505 |
| $ | 6.06 |
| $ | 358,934 |
| 5.7 |
| 673,515 |
| $ | 10.08 |
| $ | 143,021 |
| 4.0 |
|
|
| Incentive Stock Options |
| Nonqualified Stock Options |
| ||||||||||||||||
|
|
|
|
|
|
|
| Weighted |
|
|
|
|
|
|
| Weighted |
| ||||
|
|
|
| Weighted- |
|
|
| Average |
|
|
| Weighted- |
|
|
| Average |
| ||||
|
|
|
| Average |
| Aggregate |
| Remaining |
|
|
| Average |
| Aggregate |
| Remaining |
| ||||
|
|
|
| Exercise |
| Intrinsic |
| Contractual |
|
|
| Exercise |
| Intrinsic |
| Contractual |
| ||||
|
| Awards |
| Price |
| Value |
| Life |
| Awards |
| Price |
| Value |
| Life |
| ||||
|
|
|
|
|
|
|
|
|
|
|
|
|
|
|
|
|
| ||||
Outstanding at July 1, 2009 |
| 958,909 |
| $ | 5.60 |
|
|
|
|
| 626,772 |
| $ | 10.52 |
|
|
|
|
| ||
Granted |
| 507,142 |
| $ | 6.96 |
|
|
|
|
| 152,658 |
| $ | 6.99 |
|
|
|
|
| ||
Exercised |
| (111,796 | ) | $ | 4.46 |
| $ | 298,605 |
|
|
| (13,804 | ) | $ | 4.97 |
| $ | 57,108 |
|
|
|
Forfeited, expired or repurchased |
| (45,001 | ) | $ | 8.75 |
|
|
|
|
| (16,029 | ) | $ | 16.67 |
|
|
|
|
| ||
Outstanding at June 30, 2010 |
| 1,309,254 |
| $ | 6.11 |
| $ | 348,964 |
| 7.5 |
| 749,597 |
| $ | 9.77 |
| $ | 88,599 |
| 5.5 |
|
|
|
|
|
|
|
|
|
|
|
|
|
|
|
|
|
|
| ||||
Outstanding at June 30, 2010 and not yet vested |
| 720,699 |
| $ | 6.07 |
| $ | 179,684 |
| 8.9 |
| 196,218 |
| $ | 6.20 |
| $ | 49,215 |
| 9.0 |
|
Exercisable at June 30, 2010 |
| 588,555 |
| $ | 6.16 |
| $ | 170,699 |
| 5.9 |
| 553,379 |
| $ | 11.03 |
| $ | 39,384 |
| 4.2 |
|
81
Table of Contents
|
| Incentive Stock Options |
| Nonqualified Stock Options |
| ||||||||||||||||
|
|
|
|
|
|
|
| Weighted |
|
|
|
|
|
|
| Weighted |
| ||||
|
|
|
| Weighted- |
|
|
| Average |
|
|
| Weighted- |
|
|
| Average |
| ||||
|
|
|
| Average |
| Aggregate |
| Remaining |
|
|
| Average |
| Aggregate |
| Remaining |
| ||||
|
|
|
| Exercise |
| Intrinsic |
| Contractual |
|
|
| Exercise |
| Intrinsic |
| Contractual |
| ||||
|
| Awards |
| Price |
| Value |
| Life |
| Awards |
| Price |
| Value |
| Life |
| ||||
|
|
|
|
|
|
|
|
|
|
|
|
|
|
|
|
|
| ||||
Outstanding at July 1, 2008 |
| 991,267 |
| $ | 5.76 |
|
|
|
|
| 703,064 |
| $ | 10.16 |
|
|
|
|
| ||
Granted |
| 187,102 |
| $ | 4.03 |
|
|
|
|
| 37,998 |
| $ | 2.80 |
|
|
|
|
| ||
Exercised |
| (10,800 | ) | $ | 4.24 |
| $ | 11,799 |
|
|
| - |
| - |
| - |
|
|
| ||
Forfeited, expired or repurchased |
| (208,660 | ) | $ | 5.06 |
|
|
|
|
| (114,290 | ) | $ | 5.75 |
|
|
|
|
| ||
Outstanding at June 30, 2009 |
| 958,909 |
| $ | 5.60 |
| $ | 1,844,125 |
| 7.4 |
| 626,772 |
| $ | 10.52 |
| $ | 430,739 |
| 5.5 |
|
|
|
|
|
|
|
|
|
|
|
|
|
|
|
|
|
|
| ||||
Outstanding at June 30, 2009 and not yet vested |
| 478,551 |
| $ | 4.27 |
| $ | 1,234,175 |
| 8.6 |
| 120,893 |
| $ | 4.23 |
| $ | 317,515 |
| 8.2 |
|
Exercisable at June 30, 2009 |
| 480,358 |
| $ | 6.91 |
| $ | 609,950 |
| 6.2 |
| 505,879 |
| $ | 12.02 |
| $ | 113,224 |
| 4.9 |
|
Options with a fair value of approximately $1,076,615 vested during fiscal 2011. As of June 30, 2011, there was approximately $1,733,891 of total unrecognized compensation cost related to non-vested share-based compensation awards granted under the Plans. That cost is expected to be recognized over a weighted average period of 1.3 years. The Company issues new shares when stock options are exercised.
Unearned Grant Funds - The Company records all grant funds received as a liability until the Company fulfills all the requirements of the grant funding program.
(Loss) Earnings per Common Share - A dual presentation of basic and diluted (loss) earnings per share is required on the face of the Company's consolidated statement of operations as well as a reconciliation of the computation of basic (loss) earnings per share to diluted (loss) earnings per share. Basic (loss) earnings per share excludes the dilutive impact of common stock equivalents and is computed by dividing net (loss) income by the weighted-average number of shares of common stock outstanding for the period. Diluted earnings per share include the effect of potential dilution from the exercise of outstanding common stock equivalents into common stock using the treasury stock method. Dilutive shares have been excluded in the weighted average shares used for the calculation of (loss) earnings per share in periods of net loss because the effect of such securities would be anti-dilutive. A reconciliation of the Company's basic and diluted (loss) earnings per share follows:
|
| 2011 |
| 2010 |
| 2009 |
| |||||||||
|
| Net (Loss) |
| Shares |
| Net Income |
| Shares |
| Net Income |
| Shares |
| |||
|
| (Numerator) |
| (Denominator) |
| (Numerator) |
| (Denominator) |
| (Numerator) |
| (Denominator) |
| |||
|
|
|
|
|
|
|
|
|
|
|
|
|
| |||
Basic earnings/(loss) per share factors |
| $ | (276,900 | ) | 26,758,552 |
| $ | 7,821,067 |
| 24,743,902 |
| $ | 6,534,245 |
| 24,447,016 |
|
Effect of potentially dilutive options |
| - |
| - |
| - |
| 455,471 |
| - |
| 140,361 |
| |||
Diluted earnings/(loss) per share factors |
| $ | (276,900 | ) | 26,758,552 |
| $ | 7,821,067 |
| 25,199,373 |
| $ | 6,534,245 |
| 24,587,378 |
|
|
|
|
|
|
|
|
|
|
|
|
|
|
| |||
Basic earnings/(loss) per share |
| $ | (0.01 | ) |
|
| $ | 0.32 |
|
|
| $ | 0.27 |
|
|
|
Diluted earnings/(loss) per share |
| $ | (0.01 | ) |
|
| $ | 0.31 |
|
|
| $ | 0.27 |
|
|
|
The number of anti-dilutive shares that have been excluded in the computation of diluted earnings (loss) per share for the fiscal years ended June 30, 2011, 2010 and 2009 were 2,100,324, 1,281,364, and 980,781, respectively.
82
Table of Contents
Note 2. New Accounting Standards
In June 2009, the FASB issued authoritative guidance for determining whether an entity is a variable interest entity and modifies the methods allowed for determining the primary beneficiary of a variable interest entity. This guidance requires an enterprise to perform an analysis to determine whether the enterprise's variable interest or interests give it a controlling financial interest in a variable interest entity. It also requires ongoing reassessments of whether an enterprise is the primary beneficiary of a variable interest entity. The authoritative guidance is effective for the annual reporting period that begins after November 15, 2009. We adopted this authoritative guidance effective in our first quarter of Fiscal 2011 and it had no significant impact on our consolidated financial statements.
In January 2010, the FASB issued authoritative guidance which requires reporting entities to make new disclosures about recurring or nonrecurring fair value measurements including significant transfers into and out of Level 1 and Level 2 fair value measurements and information on purchases, sales, issuances, and settlements on a gross basis in the reconciliation of Level 3 fair value measurements. The authoritative guidance is effective for interim and annual reporting periods beginning after December 15, 2009, except for Level 3 reconciliation disclosures which are effective for fiscal years beginning after December 15, 2010 and for interim periods within those fiscal years. We do not anticipate that this update will have a material impact on our consolidated financial statements.
In June 2011, the FASB issued authoritative guidance which allows an entity the option to present the total of comprehensive income, the components of net income, and the components of other comprehensive income either in a single continuous statement of comprehensive income or in two separate but consecutive statements. In both options, an entity is required to present each component of net income along with total net income, each component of other comprehensive income along with a total for other comprehensive income, and a total amount for comprehensive income. This guidance eliminates the option to present the components of other comprehensive income as part of the statement of changes in stockholders' equity. This guidance does not change the items that must be reported in other comprehensive income or when an item of other comprehensive income must be reclassified to net income. This authoritative guidance must be applied retrospectively, and is effective for fiscal years and interim periods within those years, beginning after December 15, 2011.
Note 3. Inventories
Inventories at June 30, 2011 and 2010 consist of the following:
|
| 2011 |
| 2010 |
| ||
Raw Materials |
| $ | 11,810,564 |
| $ | 5,183,735 |
|
Work-in-process |
| 2,430,108 |
| 2,375,396 |
| ||
Finished Goods |
| 11,636,942 |
| 10,527,630 |
| ||
Packaging Supplies |
| 1,024,907 |
| 970,107 |
| ||
|
| $ | 26,902,521 |
| $ | 19,056,868 |
|
The preceding amounts are net of excess and obsolete inventory reserves of $3,486,450 and $2,481,810 at June 30, 2011 and 2010, respectively.
Recently, the FDA increased its efforts to force companies to file and seek FDA approval for GRASE or Grandfathered products. GRASE products are those "old drugs that do not require prior approval from FDA in order to be marketed because they are generally recognized as safe and effective based on published scientific literature." Similarly, Grandfathered products are those which "entered the market before the passage of the 1906 act, the 1938 act or the 1962 amendments to the act." Efforts have included granting market exclusivity to approved GRASE or Grandfathered products and issuing notices to discontinue marketing certain products to companies currently producing these products. Lannett currently manufactures and markets several products that are considered GRASE or Grandfathered products, including Morphine Sulfate Oral Solution. The Company is currently litigating the issue of Grandfathered drugs with the FDA. The FDA is currently undertaking activities to force all companies who manufacture Morphine Sulfate Oral Solution to file applications and seek approval for this product or remove their product from the market.
As of July 24, 2010, Lannett stopped manufacturing and distributing Morphine Sulfate Oral Solution. Lannett filed a 505(b)(2) New Drug Application ("MS NDA") in February 2010 and was waiting for FDA approval on the submission. Lannett met with the FDA in January 2011 to review the status of the application. At that time, the FDA stated that it would need to inspect Lannett's facilities as part of a Pre-Approval Inspection ("PAI") before it could give final approval on the MS NDA. As a result of the new information the Company received at this meeting related to what was now required for the MS NDA approval, the Company revised its date estimate for MS NDA approval and re-launch of its Morphine Sulfate Oral Solution product and recorded additional inventory reserves of $1,738,000 for the fiscal year ended June 30, 2011 based on the relevant expiration dates of the material. Although the Company received FDA approval to begin selling Morphine Sulfate Oral Solution in June 2011, the Company has approximately $2,063,000 of
83
Table of Contents
Morphine Sulfate Oral Solution finished goods inventory value which is fully reserved as of June 30, 2011. Lannett also has approximately $321,000 of net inventory value at June 30, 2011 of other Grandfathered products which would also be at risk if the FDA were to pursue enforcement actions on these products similar to their actions on Morphine Sulfate Oral Solution.
Note 4. Property, Plant and Equipment
Property, plant and equipment at June 30, 2011 and 2010 consist of the following:
|
| Useful Lives |
| 2011 |
| 2010 |
| ||
Land |
| - |
| $ | 1,350,499 |
| $ | 1,375,103 |
|
Building and improvements |
| 10 - 39 years |
| 25,476,506 |
| 23,101,751 |
| ||
Machinery and equipment |
| 5 - 15 years |
| 26,555,033 |
| 24,638,754 |
| ||
Furniture and fixtures |
| 5 - 7 years |
| 1,134,191 |
| 1,044,506 |
| ||
|
|
|
|
|
|
|
| ||
|
|
|
| 54,516,229 |
| 50,160,114 |
| ||
Less accumulated depreciation |
|
|
| (24,586,448 | ) | (21,531,845 | ) | ||
Total |
|
|
| $ | 29,929,781 |
| $ | 28,628,269 |
|
Note 5. Investment Securities
The Company follows the authoritative guidance which clarifies the definition of fair value, establishes a framework for measuring fair value, and expands the disclosures on fair value measurements. Fair value is defined as the exchange price that would be received for an asset or paid to transfer a liability (an exit price) in the principal or most advantageous market for the asset or liability in an orderly transaction between market participants on the measurement date. The authoritative guidance also establishes a fair value hierarchy which requires an entity to maximize the use of observable inputs and minimize the use of unobservable inputs when measuring fair value. Three levels of inputs were established that may be used to measure fair value:
Level 1 - Quoted prices in active markets for identical assets or liabilities. The fair value of the Company's equity securities classified as trading securities in the table below are derived solely from Level 1 inputs.
Level 2 - Observable inputs other than Level 1 prices such as quoted prices for similar assets or liabilities; quoted prices for identical or similar instruments in markets that are not active; or model-derived valuations whose inputs are observable or whose significant value drivers are observable. The Company's Level 2 assets and liabilities primarily include debt securities with quoted prices that are traded less frequently than exchange-traded instruments, corporate bonds, U.S. government and agency securities and certain mortgage-backed and asset-backed securities whose values are determined using pricing models with inputs that are observable in the market or can be derived principally from or corroborated by observable market data. The fair value of the Company's available-for-sale securities in the table below are derived solely from Level 2 inputs.
Level 3 - Unobservable inputs that are supported by little or no market activity and that are financial instruments whose values are determined using pricing models, discounted cash flow methodologies, or similar techniques, as well as instruments for which the determination of fair value requires significant judgment or estimation. The Company does not have any Level 3 investment securities as of June 30, 2011 or June 30, 2010.
If the inputs used to measure the financial assets and liabilities fall within more than one level described above, the categorization is based on the lowest level input that is significant to the fair value measurement of the instrument.
84
Table of Contents
The amortized cost, gross unrealized gains and losses, and fair value of the Company's investment securities as of June 30, 2011 and June 30, 2010:
June 30, 2011
|
| Amortized Cost |
| Gross Unrealized |
| Gross |
| Fair Value |
| ||||
Available-for-Sale |
|
|
|
|
|
|
|
|
| ||||
Corporate Bonds |
| $ | 179,507 |
| $ | 3,028 |
| $ | - |
| $ | 182,535 |
|
|
|
|
|
|
|
|
|
|
| ||||
Trading |
|
|
|
|
|
|
|
|
| ||||
Equity securities |
| $ | 7,067,677 |
| $ | 131,819 |
| $ | - |
| $ | 7,199,496 |
|
|
|
|
|
|
|
|
|
|
| ||||
Held-to-Maturity |
|
|
|
|
|
|
|
|
| ||||
Certificates of Deposit |
| $ | 12,000,048 |
| $ | - |
| $ | - |
| $ | 12,000,048 |
|
|
|
|
|
|
|
|
|
|
| ||||
Total Investment Securities |
| $ | 19,247,232 |
| $ | 134,847 |
| $ | - |
| $ | 19,382,079 |
|
June 30, 2010
|
| Amortized Cost |
| Gross Unrealized |
| Gross |
| Fair Value |
| ||||
Available-for-Sale |
|
|
|
|
|
|
|
|
| ||||
U.S. Government Agency |
| $ | 590,751 |
| $ | 13,713 |
| $ | - |
| $ | 604,464 |
|
Corporate Bonds |
| 179,507 |
| 4,235 |
| - |
| 183,742 |
| ||||
|
| $ | 770,258 |
| $ | 17,948 |
| $ | - |
| $ | 788,206 |
|
The amortized cost and fair value of the Company's investment securities by contractual maturity at June 30, 2011 and June 30, 2010 are summarized as follows:
|
| June 30, 2011 |
| June 30, 2010 |
| ||||||||
|
| Amortized |
| Fair |
| Amortized |
| Fair |
| ||||
|
| Cost |
| Value |
| Cost |
| Value |
| ||||
Due in one year or less |
| $ | 19,247,232 |
| $ | 19,382,079 |
| $ | 590,751 |
| $ | 604,464 |
|
Due after one year through five years |
| - |
| - |
| 179,507 |
| 183,742 |
| ||||
Due after five years through ten years |
| - |
| - |
| - |
| - |
| ||||
Due after ten years |
| - |
| - |
| - |
| - |
| ||||
Total investment securities |
| 19,247,232 |
| 19,382,079 |
| 770,258 |
| 788,206 |
| ||||
Less current portion |
| 19,247,232 |
| 19,382,079 |
| 590,751 |
| 604,464 |
| ||||
Long-term investment securities |
| $ | - |
| $ | - |
| $ | 179,507 |
| $ | 183,742 |
|
The Company uses the specific identification method to determine the cost of securities sold. For fiscal year 2011, the Company had gains on investments of $205,781, of which $73,962 was realized and $131,819 was unrealized gains, respectively. For the fiscal years 2010 and 2009, the Company had realized gains of $1,623 and $53,524, respectively.
As of June 30, 2011 and 2010, there were no securities held from a single issuer that represented more than 10% of shareholders' equity. As of June 30, 2011, there were no individual securities in a continuous unrealized loss position.
Note 6. Bank Line of Credit
The Company had a $3,000,000 line of credit from Wells Fargo, N. A., formerly Wachovia Bank, N.A. ("Wells Fargo") that bears interest at the prime interest rate less 0.25% (3.0% at June 30, 2011 and June 30, 2010, respectively). Availability under the line of credit is reduced by outstanding letters of credit. As of June 30, 2011 and 2010, the Company had $2,995,000 and $3,000,000,
85
Table of Contents
respectively, of availability under this line of credit. The line of credit was collateralized by substantially all of the Company's assets. The agreement contained covenants with respect to working capital, net worth and certain ratios, as well as other covenants.
Effective as of March 31, 2011, the Company renegotiated this line of credit as part of establishing a mortgage on its new Townsend Road property (see Note 8 - Long Term-Debt). As part of this renegotiation, the line which expires on March 31, 2012, is now only collateralized by the working capital assets of the Company. As of June 30, 2011, the Company was in compliance with the new financial covenants under the agreement. The availability fee on the unused balance of the line of credit is 0.375%. Under the previous agreement with Wells Fargo, the existing line of credit would have expired on November 30, 2011.
Note 7. Unearned Grant Funds
In July 2004, the Company received $500,000 of grant funding from the Commonwealth of Pennsylvania, acting through the Department of Community and Economic Development. The grant funding program required the Company to use the funds for machinery and equipment located at their Pennsylvania locations, hire an additional 100 full-time employees by June 30, 2006, operate its Pennsylvania locations a minimum of five years and meet certain matching investment requirements. If the Company failed to comply with any of the requirements above, the Company would be liable to repay the full amount of the grant funding ($500,000). The Company has recorded the unearned grant funds as a liability until the Company complies with all of the requirements of the grant funding program. As of June 30, 2011, the Company reached a formal agreement with the Commonwealth of Pennsylvania which determined that the Company will be required to repay $90,000 of the funds provided under the grant funding program. Therefore, during the fourth quarter of FY 2011, the Company recorded $410,000 of the grant funds as Grant Income.
Note 8. Long-Term Debt
Long-term debt consists of the following:
|
| June 30, |
| June 30, |
| ||
|
| 2011 |
| 2010 |
| ||
PIDC Regional Center, LP III loan |
| $ | - |
| $ | 4,500,000 |
|
Pennsylvania Industrial Development Authority loan |
| 856,549 |
| 933,820 |
| ||
Pennsylvania Department of Community & Economic Development loan |
| - |
| 88,141 |
| ||
Tax-exempt bond loan (PAID) |
| 425,000 |
| 555,000 |
| ||
Wells Fargo N.A. Townsend Road mortgage |
| 3,022,046 |
| - |
| ||
PIDA Townsend Road mortgage |
| 2,000,000 |
| - |
| ||
First National Bank of Cody mortgage |
| 1,518,336 |
| 1,642,866 |
| ||
|
|
|
|
|
| ||
Total debt |
| 7,821,931 |
| 7,719,827 |
| ||
Less current portion |
| 629,435 |
| 4,851,278 |
| ||
|
|
|
|
|
| ||
Long term debt |
| $ | 7,192,496 |
| $ | 2,868,549 |
|
Current Portion of Long Term Debt
|
| June 30, |
| June 30, |
| ||
|
| 2011 |
| 2010 |
| ||
PIDC Regional Center, LP III loan |
| $ | - |
| $ | 4,500,000 |
|
Pennsylvania Industrial Development Authority loan |
| 79,228 |
| 77,091 |
| ||
Pennsylvania Department of Community & Economic Development loan |
| - |
| 88,141 |
| ||
Tax-exempt bond loan (PAID) |
| 135,000 |
| 130,000 |
| ||
Wells Fargo N.A. Townsend Road mortgage |
| 203,733 |
| - |
| ||
PIDA Townsend Road mortgage |
| 101,262 |
| - |
| ||
First National Bank of Cody mortgage |
| 110,212 |
| 56,046 |
| ||
|
|
|
|
|
| ||
Total current portion of long term debt |
| $ | 629,435 |
| $ | 4,851,278 |
|
In December 2005, the Company financed $4,500,000 through the Philadelphia Industrial Development Corporation (PIDC) as part of the Company's expansion of its Torresdale Avenue facility. The outstanding principal balance, which was due and payable on December 13, 2010, was repaid on that date. The Company paid a bi-annual interest payment at a rate equal to two and one-half percent per annum.
The Company financed $1,250,000 through the Pennsylvania Industrial Development Authority (PIDA). The Company is required to make equal payments each month for 180 months starting February 1, 2006 with interest of two and three-quarter percent per annum.
86
Table of Contents
An additional $500,000 was financed through the Pennsylvania Department of Community and Economic Development Machinery and Equipment Loan Fund. The Company is required to make equal payments for 60 months starting May 1, 2006 with interest of two and three quarter percent per annum. As of June 30, 2011, this loan was repaid in full.
In April 1999, the Company entered into a loan agreement (the "Agreement") with a governmental authority, the Philadelphia Authority for Industrial Development (the "Authority" or "PAID"), to finance future construction and growth projects of the Company. The Authority issued $3,700,000 in tax-exempt variable rate demand and fixed rate revenue bonds to provide the funds to finance such growth projects pursuant to a trust indenture ("the Trust Indenture"). A portion of the Company's proceeds from the bonds was used to pay for bond issuance costs of approximately $170,000. The Trust Indenture requires that the Company repay the Authority loan through installment payments beginning in May 2003 and continuing through May 2014, the year the bonds mature. The bonds bear interest at the floating variable rate determined by the organization responsible for selling the bonds (the "remarketing agent"). The interest rate fluctuates on a weekly basis. The effective interest rate at June 30, 2011 and 2010 was 0.40% and 0.52%, respectively.
During the third and fourth quarters of Fiscal 2011, the Company negotiated a set of mortgages on its new Townsend Road facility with both Wells Fargo N.A. and the PIDA. The Wells Fargo portion of the loan is for $3,056,000, bears a floating interest rate of the One Month LIBOR rate plus 2.95%, amortizes the loan over a 15 year term and has an eight year maturity date. The effective interest rate at June 30, 2011 was 3.14%. The PIDA portion of the loan is for $2,000,000, bears an interest rate 3.75% and matures in 15 years. Both loans closed and were funded in May 2011. As of June 30, 2011, the Company was in compliance with the new financial covenants under the agreements.
The Company has executed Security Agreements with Wells Fargo, PIDA and PIDC in which the Company has agreed to pledge its working capital, some equipment and its Townsend Road property to collateralize the amounts due.
The Company is the primary beneficiary to a variable interest entity ("VIE") called Cody LCI Realty, LLC. See Note 13, Consolidation of Variable Interest Entity for additional description. The VIE owns land and a building which is being leased to Cody. A mortgage loan with First National Bank of Cody has been consolidated in the Company's financial statements, along with the related land and building. The mortgage requires monthly principal and interest payments of $14,782. Effective February 2011, the interest rate was modified from a fixed rate of 7.5% to a floating rate with a floor of 4.5% and a ceiling of 9.0%, with payments to be made through April 2022. As of June 30, 2011, the effective rate was 4.5%. The mortgage is collateralized by the land and building.
Long-term debt amounts are due as follows:
Fiscal Year Ending |
| Amounts Payable |
| |
June 30, |
| to Institutions |
| |
|
|
|
| |
2012 |
| $ | 629,435 |
|
2013 |
| 646,695 |
| |
2014 |
| 668,320 |
| |
2015 |
| 530,408 |
| |
2016 |
| 542,978 |
| |
Thereafter |
| 4,804,095 |
| |
|
|
|
| |
|
| $ | 7,821,931 |
|
Note 9. Contingencies
In January 2010, the Company initiated an arbitration proceeding against Olive Healthcare ("Olive") for damages arising out of Olive's delivery of defective soft-gel prenatal vitamin capsules. The Company seeks damages in excess of $3.5 million. Olive has denied liability and filed a counterclaim in February 2010 for breach of contract. The arbitration proceeding is still in its initial stages. A mediation meeting was scheduled to take place in mid-December 2010, but Olive did not appear. The Company is now moving forward with the arbitration proceeding. Olive also filed a lawsuit against the Company in December 2010 in Daman, India seeking to enjoin the United States arbitration and claiming damages of approximately $6.8 million for compensatory damages and an additional approximately $6.8 million for loss of business. The Company has engaged Indian counsel and is actively defending that suit.
In June 2008, the Company filed a declaratory judgment suit in the Federal District Court of Delaware (Civil Action No. 08-338 (JJF)) against KV Pharmaceuticals, DrugTech Corp. and Ther-Rx Corp (collectively, "KV"). The complaint sought declaratory judgment for non-infringement and invalidity of certain patents owned by KV. The complaint further sought declaratory judgment of anti-trust
87
Table of Contents
violations and federal and state unfair competition violations for actions taken by KV in securing and enforcing these patents. KV also countered with claims of infringement by the Company of KV's patents seeking the Company's profits for sales of MMCs or other monetary relief, preliminary and permanent injunctive relief, attorney's fees and a finding of willful infringement. In March 2009, the Company and KV settled the litigation. In May 2010, the Company filed an action for declaratory relief in the Delaware Superior Court against KV seeking a declaration that KV breached its obligations under a settlement agreement entered into with the Company (the "Binding Agreement"). In June 2010, KV filed a counterclaim to the complaint and asserted claims for breach of contract, declaratory judgment, negligent misrepresentation and fraud in connection with the Binding Agreement, alleging among other things that the Company has improperly withheld royalties from KV arising out of its sales of a pre-natal vitamin product. On December 15, 2010, the Company executed a settlement agreement with KV in which the Company paid KV $850,000 to satisfy all royalties earned through December 31, 2010. In addition, effective January 1, 2011, the license granted to Lannett in the Binding Agreement was terminated, and the Company and its affiliates were required to cease making, using or offering to sell products covered by the licensed patents.
On July 21, 2010, Lannett Company, Inc. and its subsidiary, Cody Laboratories Inc., filed suit against the Department of Health and Human Services and the FDA challenging the FDA's determination that Cody's concentrated Morphine Sulfate Solution was a "new drug" for purposes of the Food, Drug, and Cosmetic Act. Cody and the Company were therefore required to obtain FDA approval before the companies could continue manufacturing, marketing, and selling the drug. The Company and Cody sought a preliminary injunction to prevent the FDA from forcing them to remove the drug from the market as of July 24, 2010. After a hearing, the request for preliminary injunction was denied. On November 16, 2010, the Court dismissed the case, citing a lack of subject matter jurisdiction. The Company and Cody appealed the District Court ruling to the Tenth Circuit Court of Appeals, where briefing is complete and argument is scheduled for September 12, 2011. However, on June 23, 2011, the FDA granted the Company and Cody's New Drug Application (NDA), and thus concentrated Morphine Sulfate Solution may be sold under that approved NDA while questions of the validity of the FDA's "new drug" determination are litigated on appeal.
Note 10. Commitments
Leases
In June 2006, Lannett signed a lease agreement on a 66,000 square foot facility located on approximately seven acres in Philadelphia. The Company purchased this building in October 2009 for approximately $3.8 million, plus the cost of fit out of approximately $2.0 million. A significant portion of the purchase price and fit out costs were financed through a series of loans with Wells Fargo N.A. bank and a Pennsylvania state run development agency. These loans could not be put in place until all construction had been completed and a proper certificate of occupancy had been obtained, due to a requirement by the state run development agency. Construction was substantially complete by June 30, 2010. A certificate of occupancy was obtained by September 2010. The financing was competed and funded in May 2011 - see Note 8 - Long-Term Debt. This new facility is being used for certain administrative functions, warehouse space, shipping and possibly additional manufacturing space in the future.
Lannett's subsidiary, Cody leases a 73,000 square foot facility in Cody, Wyoming. This location houses Cody's manufacturing and production facilities. Cody leases the facility from Cody LCI Realty, LLC, a Wyoming limited liability company which is 50% owned by Lannett. See Note 13.
Rental and lease expense for the years ended June 30, 2011, 2010 and 2009 was approximately $93,000, $156,000, and $449,000, respectively.
Contractual Obligations
The following table represents annual contractual obligations as of June 30, 2011:
|
|
|
| Less than 1 |
|
|
|
|
| More than 5 |
| |||||
|
| Total |
| year |
| 1-3 years |
| 3-5 years |
| Years |
| |||||
|
|
|
|
|
|
|
|
|
|
|
| |||||
Long-Term Debt |
| $ | 7,821,931 |
| $ | 629,435 |
| $ | 1,315,015 |
| $ | 1,073,386 |
| $ | 4,804,095 |
|
Operating Leases |
| 61,075 |
| 40,600 |
| 20,475 |
| - |
| - |
| |||||
Purchase Obligations |
| 63,607,500 |
| 22,357,500 |
| 41,250,000 |
| - |
| - |
| |||||
Interest on Obligations |
| 1,859,876 |
| 259,514 |
| 459,501 |
| 381,090 |
| 759,771 |
| |||||
Total |
| $ | 73,350,382 |
| $ | 23,287,049 |
| $ | 43,044,991 |
| $ | 1,454,476 |
| $ | 5,563,866 |
|
The purchase obligations above are primarily due to the agreement with Jerome Stevens Pharmaceuticals, Inc. ("JSP"). If the minimum purchase requirement is not met, JSP has the right to terminate the contract within 60 days of Lannett's failure to meet the
88
Table of Contents
requirement. If JSP terminates the contract, Lannett does not pay any fee, but could lose its exclusive distribution rights in the United States. If Lannett's management believes that it is not in the Company's best interest to fulfill the minimum purchase requirements, it can also terminate the contract without any penalty. If either party were to terminate the purchase agreement, there would be a significant impact on the operating cash flows of the Company from the termination.
Employment Agreements
The Company has entered into employment agreements with Arthur P. Bedrosian, President and Chief Executive Officer, Martin P. Galvan, Vice President of Finance and Chief Financial Officer, Kevin Smith, Vice President of Sales and Marketing, William Schreck, Chief Operating Officer, Ernest Sabo, Vice President of Regulatory Affairs and Chief Compliance Officer and Robert Ehlinger, Vice President of Logistics and Chief Information Officer. Each of the agreements provide for an annual base salary and eligibility to receive a bonus. The salary and bonus amounts of these executives are determined by the Board of Directors. Additionally, these executives are eligible to receive stock options and restricted stock awards, which are granted at the discretion of the Board of Directors, and in accordance with the Company's policies regarding stock option and restricted stock grants. Under the agreements, these executive employees may be terminated at any time with or without cause, or by reason of death or disability. In certain termination situations, the Company is liable to pay severance compensation to these executives of between 18 months and three years.
Effective August 1, 2011, Keith R. Ruck, the former Vice President of Finance and Chief Financial Officer of the Company, separated his employment from the Company. Mr. Ruck entered into a Separation Agreement and Release with the Company dated August 1, 2011, pursuant to which he will receive seven months base salary totaling $110,833, medical benefits and vesting of outstanding options and previously awarded restricted stock grants.
During the third quarter of Fiscal Year 2009, the Company's then current Vice President of Finance, Treasurer, Secretary and Chief Financial Officer resigned. As part of his separation agreement, the Company was obligated to pay to him approximately $670,000 to settle any outstanding obligations from his employment agreement, including any salary, bonus, vacation, stock options and medical benefits. Of this amount, $300,440 was paid in Fiscal 2009 with $165,000 designated for the payment of pro rated bonus, and $11,440 was designated for the payment of accrued but unused paid time off. As part of the settlement, $124,000 was designated as the portion of the settlement related to the repurchase of his outstanding stock options. The Company therefore charged this amount to Additional Paid in Capital, as it represents the fair value of the options repurchased on the repurchase date. Additional payments totaling approximately $369,000 for severance and benefits were paid in Fiscal 2011 pursuant to the separation agreement.
Fiscal 2010 Bonus
The Company accrued approximately $4,812,000 of incentive compensation costs at June 30, 2010, of which approximately $3,421,000 was paid in cash during the first quarter of Fiscal 2011. The remaining $1,391,000 was expected to be paid in unrestricted shares of Company stock, and which shares were expected to vest immediately upon grant. These shares were only to be granted upon the timely approval by the FDA of Lannett's 505(b)(2) New Drug Application to manufacture and distribute its Morphine Sulfate Oral Solution product. The determination of the actual payment of this portion of the bonus was at the discretion of the CEO, dependent on the timing of the approval and the financial results of the Company dictated by the events surrounding the approval. At the January 2011 meeting with the FDA regarding the status of the MS NDA, the FDA stated that it will need to inspect Lannett's facilities as part of a PAI before it could give final approval on the MS NDA. Due to the amount of time the Company believed it would take to complete this inspection and receive approval on the MS NDA and the resulting impact to the value of the Morphine Sulfate inventory and the related expiration dates, the CEO has determined that the adverse financial results surrounding the MS NDA approval necessitated cancellation of the remaining Fiscal 2010 bonus. Therefore, the Company reversed the entire $1,391,000 remaining bonus accrual during the quarter ended December 31, 2010.
Note 11. Common Stock Offering
The Company completed a secondary offering of its common stock in December 2010. The initial offering of 2,500,000 shares was completed on December 17, 2010 and an over-allotment of 750,000 shares was exercised and closed on December 28, 2010. Net proceeds of the combined offerings were approximately $14,950,000 after deducting underwriting, legal and accounting fees.
89
Table of Contents
Note 12. Comprehensive (Loss) Income
The Company's other comprehensive (loss) income is comprised of unrealized gains (losses) on investment securities classified as available-for-sale as well as foreign currency translation adjustments. There is no other comprehensive income (loss) attributable to the noncontrolling interest. The components of comprehensive (loss) income and related taxes consisted of the following as of June 30, 2011, 2010 and 2009:
|
| For Fiscal Year Ended June 30, |
| |||||||
|
| 2011 |
| 2010 |
| 2009 |
| |||
|
|
|
|
|
|
|
| |||
Net (Loss) Income |
| $ | (276,900 | ) | $ | 8,008,028 |
| $ | 6,577,590 |
|
Foreign currency translation adjustments |
| (11,841 | ) | 33,923 |
| - |
| |||
Unrealized holding (loss) gain on securities |
| (14,920 | ) | (23,304 | ) | 25,049 |
| |||
Tax effect |
| 5,968 |
| 9,322 |
| (10,020 | ) | |||
|
|
|
|
|
|
|
| |||
Total Other Comprehensive (Loss) Income |
| (20,793 | ) | 19,941 |
| 15,029 |
| |||
|
|
|
|
|
|
|
| |||
Total Comprehensive (Loss) Income |
| $ | (297,693 | ) | $ | 8,027,969 |
| $ | 6,592,619 |
|
Note 13. Consolidation of Variable Interest Entity
Lannett consolidates any Variable Interest Entity ("VIE") of which we are the primary beneficiary. The liabilities recognized as a result of consolidating a VIE do not represent additional claims on our general assets rather, they represent claims against the specific assets of the consolidated VIE. Conversely, assets recognized as a result of consolidating a VIE do not represent additional assets that could be used to satisfy claims against our general assets. Reflected in each of the June 30, 2011 and 2010 balance sheets are consolidated VIE assets of approximately $1.8 million and $1.9 million, respectively, which are comprised mainly of land and a building. VIE liabilities consist primarily of a mortgage on that property in the amount of $1.5 million and $1.6 million at June 30, 2011 and 2010, respectively.
Cody LCI Realty LLC ("Realty") is the only VIE that is consolidated. Realty had been consolidated by Cody prior to its acquisition by Lannett. Realty is a 50/50 joint venture with a former shareholder of Cody. Its purpose was to acquire the facility used by Cody. Until the acquisition of Cody in April 2007, Lannett had not consolidated the VIE because Cody had been the primary beneficiary of the VIE. The risks associated with our interests in this VIE is limited to a decline in the value of the land and building as compared to the balance of the mortgage note on that property, up to Lannett's 50% share of the venture. Realty owns the land and building, and Cody leases the building and property from Realty for $20,000 per month effective October 2009, when the lease increased from $15,000 per month. All intercompany rent expense is eliminated upon consolidation with Cody. The Company is not involved in any other VIE.
Note 14. Employee Benefit Plan
The Company has a defined contribution 401k plan (the "Plan") covering substantially all employees. Pursuant to the Plan provisions, the Company is required to make matching contributions equal to 50% of each employee's contribution, but not to exceed 4% of the employee's compensation for the Plan year. Contributions to the Plan during the years ended June 30, 2011, 2010 and 2009 were approximately $393,000, $395,000, and $330,000, respectively.
Note 15. Employee Stock Purchase Plan
In February 2003, the Company's shareholders approved an Employee Stock Purchase Plan ("ESPP"). Employees eligible to participate in the ESPP may purchase shares of the Company's stock at 85% of the lower of the fair market value of the common stock on the first day of the calendar quarter, or the last day of the calendar quarter. Under the ESPP, employees can authorize the Company to withhold up to 10% of their compensation during any quarterly offering period, subject to certain limitations. The ESPP was implemented on April 1, 2003 and is qualified under Section 423 of the Internal Revenue Code. The Board of Directors authorized an aggregate total of 1,125,000 shares of the Company's common stock for issuance under the ESPP. As of June 30, 2011, 271,895 shares have been issued under the ESPP. Compensation expense of $57,466, $52,564, and $81,871was recognized in fiscal years 2011, 2010 and 2009, respectively, relating to the ESPP.
90
Table of Contents
Note 16. Income Taxes
The (benefit) provision for income taxes consists of the following for the fiscal years ended June 30:
|
| 2011 |
| 2010 |
| 2009 |
| |||
|
|
|
|
|
|
|
| |||
Current Income Taxes |
|
|
|
|
|
|
| |||
Federal |
| $ | (3,178,863 | ) | $ | 4,056,458 |
| $ | 1,074,723 |
|
State and Local Taxes |
| (132,833 | ) | 574,511 |
| 32,455 |
| |||
Total |
| (3,311,696 | ) | 4,630,969 |
| 1,107,178 |
| |||
|
|
|
|
|
|
|
| |||
Deferred Income Taxes |
|
|
|
|
|
|
| |||
Federal |
| 2,616,997 |
| (795,969 | ) | 3,151,911 |
| |||
State and Local Taxes |
| 233,131 |
| 978,044 |
| (168,373 | ) | |||
Total |
| 2,850,128 |
| 182,075 |
| 2,983,538 |
| |||
Total |
| $ | (461,568 | ) | $ | 4,813,044 |
| $ | 4,090,716 |
|
A reconciliation of the differences between the effective rates and federal statutory rates is as follows:
|
| 2011 |
| 2010 |
| 2009 |
|
|
|
|
|
|
|
|
|
Federal income tax at statutory rate |
| 34.0 | % | 34.0 | % | 34.0 | % |
State and local income tax, net |
| 0.2 | % | 3.7 | % | (0.4 | )% |
Nondeductible expenses |
| (35.1 | )% | 2.1 | % | 2.3 | % |
Change in valuation allowance |
| 2.7 | % | (0.6 | )% | (0.7 | )% |
Income tax credits |
| 83.3 | % | (8.2 | )% | (1.6 | )% |
Change in tax laws |
| - | % | 5.0 | % | - | % |
Change in state nexus position |
| (24.0 | )% | - | % | - | % |
Other |
| 4.7 | % | 1.5 | % | 4.7 | % |
Income tax expense |
| 65.8 | % | 37.5 | % | 38.3 | % |
The principal types of differences between assets and liabilities for financial statement and tax return purposes are accruals, reserves, impairment of intangibles, accumulated amortization, accumulated depreciation and stock compensation expense. A deferred tax asset is recorded for the future benefits created by the timing of accruals and reserves and the application of different amortization lives for financial statement and tax return purposes. A deferred tax asset valuation allowance was established based on the likelihood that it is more likely than not that the Company will be unable to realize certain of the deferred tax assets. A deferred tax liability is recorded for the future liability created by different depreciation methods for financial statement and tax return purposes.
91
Table of Contents
As of June 30, 2011 and 2010, temporary differences which give rise to deferred tax assets and liabilities are as follows:
|
| 2011 |
| 2010 |
| ||
Deferred tax assets: |
|
|
|
|
| ||
Accrued expenses |
| $ | 182,380 |
| $ | 474,679 |
|
Stock compensation expense |
| 958,560 |
| 928,133 |
| ||
Unearned grant funds |
| 33,277 |
| 186,653 |
| ||
Reserve for returns |
| 1,901,219 |
| 2,016,324 |
| ||
Reserves for accounts receivable and inventory |
| 3,173,340 |
| 3,485,512 |
| ||
Intangible impairment |
| 9,089,400 |
| 10,324,148 |
| ||
State net operating loss |
| 207,511 |
| - |
| ||
Federal net operating loss |
| 1,093,056 |
| 1,093,056 |
| ||
Impairment on Cody note receivable |
| 1,997,365 |
| 2,016,620 |
| ||
Accumulated amortization on intangible asset |
| 2,117,199 |
| 2,017,657 |
| ||
|
|
|
|
|
| ||
|
| 20,753,307 |
| 22,542,782 |
| ||
Valuation allowance |
| (1,997,365 | ) | (2,016,620 | ) | ||
Total |
| 18,755,942 |
| 20,526,162 |
| ||
|
|
|
|
|
| ||
Deferred tax liabilities: |
|
|
|
|
| ||
Prepaid expenses |
| 59,743 |
| 70,904 |
| ||
Property, plant and equipment |
| 3,637,123 |
| 2,539,961 |
| ||
Other |
| 74,695 |
| 33,576 |
| ||
|
|
|
|
|
| ||
Net deferred tax asset |
| $ | 14,984,381 |
| $ | 17,881,721 |
|
On April 10, 2007, the Company entered into a Stock Purchase Agreement to acquire Cody by purchasing all of the remaining shares of common stock of Cody. As a result of the acquisition, the Company recorded deferred tax assets related to Cody's federal net operation loss (NOL) carry forwards totaling approximately $3,774,000 at the date of acquisition with $1,902,000 expiring in 2026 and $1,872,000 in 2027. At June 30, 2011, the remaining gross deferred tax asset is $3,214,870. The income tax benefit associated with the NOL carry forwards has been recognized in accordance with Section 382 of the Internal Revenue Code of 1986.
The Company may recognize the tax benefit from an uncertain tax position claimed on a tax return only if it is more likely than not that the tax position will be sustained on examination by the taxing authorities, based on the technical merits of the position. The tax benefits recognized in the financial statements from such a position should be measured based on the largest benefit that has a greater than 50% likelihood of being realized upon ultimate settlement. The authoritative standards issued by the FASB also provide guidance on de-recognition of income tax assets and liabilities, classification of current and deferred income tax assets and liabilities, accounting for interest and penalties associated with tax positions, and income tax disclosures.
A reconciliation of the beginning and ending amount of gross unrecognized tax benefits (exclusive of interest and penalties) is as follows:
Balance at June 30, 2009 |
| $ | 297,663 |
|
Additions for tax positions of the current year |
| 24,295 |
| |
Additions for tax positions of prior years |
| 292,695 |
| |
Reductions for tax positions of prior years |
| - |
| |
Settlements |
| (215,619 | ) | |
Lapse of statute of limitations |
| - |
| |
Balance at June 30, 2010 |
| $ | 399,034 |
|
|
|
|
| |
Additions for tax positions of the current year |
| 39,749 |
| |
Additions for tax positions of prior years |
| 50,813 |
| |
Reductions for tax positions of prior years |
| - |
| |
Settlements |
| (263,793 | ) | |
Lapse of statute of limitations |
| (17,011 | ) | |
Balance at June 30, 2011 |
| $ | 208,792 |
|
92
Table of Contents
As of June 30, 2011 and 2010, the Company reported total unrecognized benefits of $208,792 and $399,034, respectively. As a result of the positions taken during the period, the Company has not recorded any interest and penalties for the period ended June 30, 2011 in the statement of operations and no cumulative interest and penalties have been recorded either in the Company's statement of financial position as of June 30, 2011 and 2010. The Company will recognize interest accrued on unrecognized tax benefits in interest expense and any related penalties in operating expenses. The Company does not believe that the total unrecognized tax benefits will significantly increase or decrease in the next twelve months.
The Company files income tax returns in the United States federal jurisdiction, Pennsylvania, New Jersey and California. The Company's tax returns for Fiscal 2007 and prior generally are no longer subject to review as such years generally are closed. The IRS has completed its review of the federal income tax return for Fiscal 2008. The Company recorded a refund receivable totaling approximately $421,000 and reduced its liability for unrecognized tax benefits by approximately $216,000 as a result of the settlement agreement reached with the IRS. In addition, the Company amended its Fiscal 2005 income tax return to claim additional federal income tax credits, which was accepted as timely filed by the IRS. As a result, the Company reduced it income taxes payable by approximately $528,000 related to this amended income tax return. The Company believes that an unfavorable resolution for open tax years would not be material to the financial position of the Company.
Note 17. Related Party Transactions
The Company had sales of approximately $876,000, $679,000, and $786,000 during the fiscal years ended June 30, 2011, 2010 and 2009, respectively, to a generic distributor, Auburn Pharmaceutical Company ("Auburn"). Jeffrey Farber (the "related party"), a board member and the son of the Chairman Emeritus of the Board of Directors and principal shareholder of the Company, William Farber, is the owner of Auburn. Accounts receivable includes amounts due from the related party of approximately $259,000 and $161,000 at June 30, 2011 and 2010, respectively. In the Company's opinion, the terms of these transactions were not more favorable to the related party than would have been to a non-related party.
In January 2005, Lannett Holdings, Inc. entered into an agreement in which the Company purchased for $100,000 and future royalty payments the proprietary rights to manufacture and distribute a product for which Pharmeral, Inc. ("Pharmeral") owned the ANDA. In Fiscal 2008, the Company obtained FDA approval to use the proprietary rights. Accordingly, the Company originally capitalized this purchased product right as an indefinite lived intangible asset and tested this asset for impairment on a quarterly basis. During the fourth quarter of Fiscal 2009, it was determined that this intangible asset no longer has an indefinite life. No impairment existed because the estimated fair value exceeded the carrying amount on that date. Accordingly, the $100,000 carrying amount of this intangible asset will be amortized on a straight line basis prospectively over its 10 year remaining estimated useful life. Arthur Bedrosian, President and Chief Executive Officer of the Company, Inc. currently owns 100% of Pharmeral. This transaction was approved by the Board of Directors of the Company and in their opinion the terms were not more favorable to the related party than they would have been to a non-related party. In May 2008, Mr. Bedrosian and Pharmeral waived their rights to any royalty payments on the sales of the drug by Lannett under Lannett's current ownership structure. Should Lannett undergo a change in control where a third party is involved, this royalty would be reinstated. The registered trademark OB-Natal® was transferred to Lannett for one dollar from Mr. Bedrosian.
Lannett Company, Inc. paid a management consultant, who is related to Mr. Bedrosian, $134,914 in fees and $18,905 in reimbursable expenses during Fiscal 2011 and $115,700 in fees and $16,803 in reimbursable expenses during Fiscal 2010. This consultant provided management, construction planning, laboratory set up and administrative services in regards to the Company's initial set up of its Bio-study laboratory in a foreign country. It is expected that this consultant will continue to be utilized into Fiscal 2012. In the Company's opinion, the fee rates paid to this consultant and the expenses reimbursed to him were not more favorable than what would have been paid to a non-related party.
Note 18. Material Contracts with Suppliers
Jerome Stevens Pharmaceuticals agreement:
The Company's primary finished product inventory supplier is Jerome Stevens Pharmaceuticals, Inc. ("JSP"), in Bohemia, New York. Purchases of finished goods inventory from JSP accounted for approximately 64%, 77% and 71% of the Company's inventory purchases in Fiscal 2011, 2010 and 2009, respectively. On March 23, 2004, the Company entered into an agreement with JSP for the exclusive distribution rights in the United States to the current line of JSP products, in exchange for four million (4,000,000) shares of the Company's common stock. The JSP products covered under the agreement included Butalbital, Aspirin, Caffeine with Codeine Phosphate Capsules, Digoxin Tablets and Levothyroxine Sodium Tablets, sold generically and under the brand name Unithroid®. The term of the agreement is ten years, beginning on March 23, 2004 and continuing through March 22, 2014. Both Lannett and JSP
93
Table of Contents
have the right to terminate the contract if one of the parties does not cure a material breach of the contract within thirty (30) days of notice from the non-breaching party.
During the term of the agreement, the Company is required to use commercially reasonable efforts to purchase minimum dollar quantities of JSP's products being distributed by the Company. The minimum quantity to be purchased in the first year of the agreement is $15.0 million. Thereafter, the minimum quantity to be purchased increases by $1.0 million per year up to $24.0 million for the last year of the ten-year contract. The Company has met the minimum purchase requirement for the first seven years of the contract, but there is no guarantee that the Company will be able to continue to do so in the future. If the Company does not meet the minimum purchase requirements, JSP's sole remedy is to terminate the agreement.
Under the agreement, JSP is entitled to nominate one person to serve on the Company's Board of Directors (the "Board") provided, however, that the Board shall have the right to reasonably approve any such nominee in order to fulfill its fiduciary duty by ascertaining that such person is suitable for membership on the board of a publicly traded corporation. Suitability is determined by, but not limited to, the requirements of the Securities and Exchange Commission, the American Stock Exchange, and other applicable laws, including the Sarbanes-Oxley Act of 2002. As of June 30, 2011, JSP has not exercised the nomination provision of the agreement.
The Company's financial condition, as well as its liquidity resources, is very dependent on an uninterrupted supply of product from JSP. Should there be an interruption in the supply of product from JSP for any reason, this event would have a material impact to the financial condition of Lannett.
Note 19. Fair Value of Financial Instruments
The Company's financial instruments consist primarily of cash and cash equivalents, accounts receivable, accounts payable, accrued expenses and debt obligations. The carrying values of these assets and liabilities approximate fair value based upon the short-term nature of these instruments. The Company has estimated that the fair value of long-term debt associated with the 20 year mortgage on its land and building in Cody, Wyoming approximates the discounted amount of future payments to the mortgage-holder.
Note 20. Quarterly Financial Information (Unaudited)
Lannett's quarterly consolidated results of operations are shown below:
|
| Fourth |
| Third |
| Second |
| First |
| ||||
|
| Quarter |
| Quarter |
| Quarter |
| Quarter |
| ||||
Fiscal 2011 |
|
|
|
|
|
|
|
|
| ||||
Net Sales |
| $ | 25,507,465 |
| $ | 25,892,483 |
| $ | 30,039,257 |
| $ | 25,395,927 |
|
Cost of Goods Sold |
| 21,752,029 |
| 20,588,833 |
| 21,682,571 |
| 19,491,986 |
| ||||
Gross Profit |
| 3,755,436 |
| 5,303,650 |
| 8,356,686 |
| 5,903,941 |
| ||||
Other Operating Expenses |
| 7,042,561 |
| 6,109,492 |
| 4,532,200 |
| 6,630,409 |
| ||||
Operating (Loss) Income |
| (3,287,125 | ) | (805,842 | ) | 3,824,486 |
| (726,468 | ) | ||||
Other Income (Expense) |
| 423,117 |
| (1,757 | ) | (70,581 | ) | (57,198 | ) | ||||
Income Tax (Benefit) Expense |
| (1,016,136 | ) | (449,797 | ) | 1,393,909 |
| (389,544 | ) | ||||
Less net income attributable to noncontrolling interest |
| 16,560 |
| 4,259 |
| 6,842 |
| 9,439 |
| ||||
Net (Loss) Income - Lannett Company, Inc. |
| $ | (1,864,432 | ) | $ | (362,061 | ) | $ | 2,353,154 |
| $ | (403,561 | ) |
(Loss) Earnings Per Share - Lannett Company, Inc. |
|
|
|
|
|
|
|
|
| ||||
Basic |
| $ | (0.07 | ) | $ | (0.01 | ) | $ | 0.09 |
| $ | (0.02 | ) |
Diluted |
| $ | (0.07 | ) | $ | (0.01 | ) | $ | 0.09 |
| $ | (0.02 | ) |
94
Table of Contents
|
| Fourth |
| Third |
| Second |
| First |
| ||||
|
| Quarter |
| Quarter |
| Quarter |
| Quarter |
| ||||
Fiscal 2010 |
|
|
|
|
|
|
|
|
| ||||
Net Sales |
| $ | 33,760,023 |
| $ | 31,266,224 |
| $ | 28,716,713 |
| $ | 31,434,989 |
|
Cost of Goods Sold |
| 22,428,694 |
| 20,868,954 |
| 20,639,735 |
| 19,900,759 |
| ||||
Gross Profit |
| 11,331,329 |
| 10,397,270 |
| 8,076,978 |
| 11,534,230 |
| ||||
Other Operating Expenses |
| 7,014,146 |
| 7,725,372 |
| 6,779,268 |
| 6,791,002 |
| ||||
Operating Income |
| 4,317,183 |
| 2,671,898 |
| 1,297,710 |
| 4,743,228 |
| ||||
Other Expense |
| (57,124 | ) | (42,310 | ) | (62,199 | ) | (47,314 | ) | ||||
Income Tax Expense |
| 1,288,071 |
| 527,327 |
| 1,169,996 |
| 1,827,650 |
| ||||
Less net income attributable to noncontrolling interest |
| 155,737 |
| 9,407 |
| 10,923 |
| 10,894 |
| ||||
Net Income - Lannett Company, Inc. |
| $ | 2,816,251 |
| $ | 2,092,854 |
| $ | 54,592 |
| $ | 2,857,370 |
|
Earnings Per Share - Lannett Company, Inc. |
|
|
|
|
|
|
|
|
| ||||
Basic |
| $ | 0.11 |
| $ | 0.08 |
| $ | 0.00 |
| $ | 0.12 |
|
Diluted |
| $ | 0.11 |
| $ | 0.08 |
| $ | 0.00 |
| $ | 0.11 |
|
|
| Fourth |
| Third |
| Second |
| First |
| ||||
|
| Quarter |
| Quarter |
| Quarter |
| Quarter |
| ||||
Fiscal 2009 |
|
|
|
|
|
|
|
|
| ||||
Net Sales |
| $ | 35,448,874 |
| $ | 28,761,316 |
| $ | 29,224,372 |
| $ | 25,567,653 |
|
Cost of Goods Sold |
| 21,835,563 |
| 17,154,288 |
| 18,201,534 |
| 16,566,361 |
| ||||
Gross Profit |
| 13,613,311 |
| 11,607,028 |
| 11,022,838 |
| 9,001,292 |
| ||||
Other Operating Expenses |
| 9,722,714 |
| 9,434,449 |
| 8,489,249 |
| 6,817,188 |
| ||||
Operating Income |
| 3,890,597 |
| 2,172,579 |
| 2,533,589 |
| 2,184,104 |
| ||||
Other (Expense) Income |
| (69,110 | ) | 2,537 |
| (25,548 | ) | (20,442 | ) | ||||
Income Tax Expense |
| 1,393,983 |
| 851,310 |
| 925,433 |
| 919,990 |
| ||||
Less net income attributable to noncontrolling interest |
| 6,968 |
| 9,324 |
| 9,546 |
| 17,507 |
| ||||
Net Income - Lannett Company, Inc. |
| $ | 2,420,536 |
| $ | 1,314,482 |
| $ | 1,573,062 |
| $ | 1,226,165 |
|
Earnings Per Share - Lannett Company, Inc. |
|
|
|
|
|
|
|
|
| ||||
Basic |
| $ | 0.10 |
| $ | 0.05 |
| $ | 0.06 |
| $ | 0.05 |
|
Diluted |
| $ | 0.10 |
| $ | 0.05 |
| $ | 0.06 |
| $ | 0.05 |
|
In the fourth quarter of Fiscal 2011, gross margins were 15%. Gross margins in the fourth quarter of Fiscal 2011 were primarily impacted by product mix as well as under utilization of labor resources in our manufacturing process as compared to the previous quarters in Fiscal 2011.
In the second quarter of Fiscal 2010 gross profit margins were 28%. The gross profit percentage decreased due to the decline in sales of prescription vitamins and two months of idle capacity costs at our Cody Labs subsidiary being directly expensed to the income statement. In March 2009, the FDA issued a warning letter to seven companies including Lannett to remove Morphine Sulfate Oral Solution from the market until someone could submit an application and receive approval on such application. In April 2009, due to shortages of this fairly necessary drug in the marketplace, the FDA reversed their position and allowed all seven companies to continue manufacturing and/or marketing Morphine Sulfate up until 180 days after someone received approval on a Morphine Sulfate application. These actions by the FDA caused the DEA to withhold purchasing and manufacturing quota from some or all of these seven companies, including Lannett. Although the Company had quota at that time, and quota issues were resolved by December 2009, the Cody Labs facility was left idle for the months of October and November 2009 due to the lack of Morphine Sulfate quota.
The effective tax rate in the second quarter of Fiscal 2010 was 95% due primarily to a change in Pennsylvania tax law which lowered the Company's apportionment factor within this state. The impact of this change caused the Company to reduce its deferred tax assets by approximately $650,000, and therefore increased the effective tax rate by 11% for the six months ended December 31, 2009, which in turn, had a significant impact on the second quarter of Fiscal 2010.
The Company recorded income tax expense of $527,000 in the third quarter of Fiscal 2010 resulting in an effective tax rate of 20% due primarily to the settlement reached with the IRS related to its review of the federal income tax return for Fiscal 2008. As a result of the settlement, the Company recorded a refund receivable totaling approximately $421,000. The Company also reduced its liability for unrecognized tax benefits by approximately $216,000 as a result of the IRS settlement.
95
Table of Contents
Schedule II - Valuation and Qualifying Accounts
For the years ended June 30:
Description |
| Balance at |
| Charged to |
| Deductions |
| Balance at |
| ||||
|
|
|
|
|
|
|
|
|
| ||||
Allowance for Doubtful Accounts |
|
|
|
|
|
|
|
|
| ||||
2011 |
| $ | 123,192 |
| $ | 381 |
| $ | - |
| $ | 123,573 |
|
2010 |
| 132,000 |
| - |
| 8,808 |
| 123,192 |
| ||||
2009 |
| 207,151 |
| (87,913 | ) | (12,762 | ) | 132,000 |
| ||||
|
|
|
|
|
|
|
|
|
| ||||
Inventory Valuation |
|
|
|
|
|
|
|
|
| ||||
2011 |
| $ | 2,481,810 |
| $ | 4,585,243 |
| $ | 3,580,603 |
| $ | 3,486,450 |
|
2010 |
| 2,744,305 |
| 1,279,781 |
| 1,542,276 |
| 2,481,810 |
| ||||
2009 |
| 1,642,668 |
| 2,004,403 |
| 902,767 |
| 2,744,305 |
| ||||
|
|
|
|
|
|
|
|
|
| ||||
Deferred Tax Asset Valuation Allowance |
|
|
|
|
|
|
|
|
| ||||
2011 |
| $ | 2,016,620 |
| $ | (19,255 | ) | $ | - |
| $ | 1,997,365 |
|
2010 |
| 2,097,175 |
| (80,555 | ) | - |
| 2,016,620 |
| ||||
2009 |
| 2,314,498 |
| (217,323 | ) | - |
| 2,097,175 |
| ||||
96
Table of Contents
Exhibit Index
Exhibit |
| Description |
| Method of Filing |
|
|
|
|
|
3.1 |
| Articles of Incorporation |
| Incorporated by reference to the Proxy Statement filed with respect to the Annual Meeting of Shareholders held on December 6, 1991 (the "1991 Proxy Statement"). |
|
|
|
|
|
3.2 |
| By-Laws, as amended |
| Incorporated by reference to the 1991 Proxy Statement. |
|
|
|
|
|
4 |
| Specimen Certificate for Common Stock |
| Incorporated by reference to Exhibit 4(a) to Form 8 dated April 23, 1993 (Amendment No. 3 to Form 10-KSB for Fiscal 1992) ("Form 8") |
|
|
|
|
|
10.1 |
| Line of Credit Note dated March 11, 1999 between the Company and First Union National Bank |
| Incorporated by reference to Exhibit 10(ad) to the Annual Report on 1999 Form 10-KSB |
|
|
|
|
|
10.2 |
| Philadelphia Authority for Industrial Development Taxable Variable Rate Demand/Fixed Rate Revenue Bonds, Series of 1999 |
| Incorporated by reference to Exhibit 10(ae) to the Annual Report on 1999 Form 10-KSB |
|
|
|
|
|
10.3 |
| Philadelphia Authority for Industrial Development Tax-Exempt Variable Rate Demand/Fixed Revenue Bonds (Lannett Company, Inc. Project) Series of 1999 |
| Incorporated by reference to Exhibit 10(af) to the Annual Report on 1999 Form 10-KSB |
|
|
|
|
|
10.4 |
| Letter of Credit and Agreements supporting bond issues between the Company and First Union National Bank |
| Incorporated by reference to Exhibit 10(ag) to the Annual Report on 1999 Form 10-KSB |
|
|
|
|
|
10.5 |
| 2003 Stock Option Plan |
| Incorporated by reference to the Proxy Statement for Fiscal Year Ending June 30, 2002 |
|
|
|
|
|
10.6 |
| Employment Agreement with Kevin Smith |
| Incorporated by reference to Exhibit 10.6 to the Annual Report on 2003 Form 10-KSB |
|
|
|
|
|
10.7 |
| Employment Agreement with Arthur Bedrosian |
| Incorporated by reference to Exhibit 10 to the Quarterly Report on Form 10-Q dated May 12, 2004. |
|
|
|
|
|
10.9 (Note A) |
| Agreement between Lannett Company, Inc and Siegfried (USA), Inc. |
| Incorporated by reference to Exhibit 10.9 to the Annual Report on 2003 Form 10-KSB |
|
|
|
|
|
10.10 (Note A) |
| Agreement between Lannett Company, Inc and Jerome Stevens, Pharmaceutical, Inc. |
| Incorporated by reference to Exhibit 2.1 to Form 8-K dated April 20, 2004 |
|
|
|
|
|
10.11 |
| Terms of Employment Agreement with Stephen J. Kovary |
| Incorporated by reference to Exhibit 10.11 to the Annual Report on 2009 Form 10-K |
|
|
|
|
|
10.12 |
| Agreement of Sale Between Anvil Construction Company, Inc. and Lannett Company, Inc. |
| Incorporated by reference to Exhibit 10.12 to the Annual Report on 2009 Form 10-K |
|
|
|
|
|
10.13 |
| 2007 Long Term Incentive Plan |
| Incorporated by reference to the Proxy Statement dated January 5, 2007 |
|
|
|
|
|
10.15 |
| 2011 Long Term Incentive Plan |
| Incorporated by reference to the Proxy Statement dated January 19, 2011 |
97
Table of Contents
Exhibit |
| Description |
| Method of Filing |
|
|
|
|
|
10.16 |
| Terms of Employment Agreement with Martin P. Galvan |
| Incorporated by reference to Exhibit 10.1 on Form 8-K dated August 8, 2011 |
|
|
|
|
|
10.17 |
| Amended and Restated Loan Agreement dated April 29, 2011 between the Company and Wells Fargo Bank, N. A. |
| Filed Herewith |
|
|
|
|
|
10.18 |
| Loan Agreement dated May 26, 2011 between the Company, the Pennsylvania Industrial Development Authority ("PIDA") and PIDC Financing Corporation |
| Filed Herewith |
|
|
|
|
|
21 |
| Subsidiaries of the Company |
| Filed Herewith |
|
|
|
|
|
23.1 |
| Consent of Grant Thornton, LLP |
| Filed Herewith |
|
|
|
|
|
31.1 |
| Certification of Chief Executive Officer Pursuant to Section 302 of the Sarbanes-Oxley Act of 2002 |
| Filed Herewith |
|
|
|
|
|
31.2 |
| Certification of Chief Financial Officer Pursuant to Section 302 of the Sarbanes-Oxley Act of 2002 |
| Filed Herewith |
|
|
|
|
|
32 |
| Certifications of Chief Executive Officer and Chief Financial Officer Pursuant to Section 906 of the Sarbanes-Oxley Act of 2002 |
| Filed Herewith |
98