UNITED STATES
SECURITIES AND EXCHANGE COMMISSION
Washington, D.C. 20549
FORM 10-Q
Quarterly report pursuant to Section 13 or 15(d) of
the Securities Exchange Act of 1934
For the quarterly period ended | Commission file |
September 30, 2017 | number 1-5805 |
JPMorgan Chase & Co.
(Exact name of registrant as specified in its charter)
Delaware | 13-2624428 |
(State or other jurisdiction of incorporation or organization) | (I.R.S. employer identification no.) |
|
|
270 Park Avenue, New York, New York | 10017 |
(Address of principal executive offices) | (Zip Code) |
|
|
Registrant's telephone number, including area code: (212) 270-6000
Indicate by check mark whether the registrant (1) has filed all reports required to be filed by Section 13 or 15(d) of the Securities Exchange Act of 1934 during the preceding 12 months (or for such shorter period that the registrant was required to file such reports), and (2) has been subject to such filing requirements for the past 90 days.
x Yes | o No |
Indicate by check mark whether the registrant has submitted electronically and posted on its corporate Web site, if any, every Interactive Data File required to be submitted and posted pursuant to Rule 405 of Regulation S-T (§232.405 of this chapter) during the preceding 12 months (or for such shorter period that the registrant was required to submit and post such files).
x Yes | o No |
Indicate by check mark whether the registrant is a large accelerated filer, an accelerated filer, a non-accelerated filer, a smaller reporting company, or an emerging growth company. See the definitions of "large accelerated filer," "accelerated filer," "smaller reporting company," and "emerging growth company" in Rule 12b-2 of the Exchange Act.
Large accelerated filer x | Accelerated filer | o |
|
|
|
Non-accelerated filer (Do not check if a smaller reporting company) o | Smaller reporting company | o |
|
|
|
| Emerging growth company | o |
|
|
|
If an emerging growth company, indicate by check mark if the registrant has elected not to use the extended transition period for complying with any new or revised financial accounting standards provided pursuant to Section 13(a) of the Exchange Act. o |
| |
Indicate by check mark whether the registrant is a shell company (as defined in Rule 12b-2 of the Exchange Act).
o Yes | x No |
|
|
FORM 10-Q
TABLE OF CONTENTS
Part I – Financial information | Page | ||
Item 1. | Financial Statements. |
| |
| Consolidated Financial Statements – JPMorgan Chase & Co.: |
| |
| Consolidated statements of income (unaudited) for the three and nine months ended September 30, 2017 and 2016 | 83 | |
| Consolidated statements of comprehensive income (unaudited) for the three and nine months ended September 30, 2017 and 2016 | 84 | |
| Consolidated balance sheets (unaudited) at September 30, 2017, and December 31, 2016 | 85 | |
| Consolidated statements of changes in stockholders' equity (unaudited) for the nine months ended September 30, 2017 and 2016 | 86 | |
| Consolidated statements of cash flows (unaudited) for the nine months ended September 30, 2017 and 2016 | 87 | |
| Notes to Consolidated Financial Statements (unaudited) | 88 | |
| Report of Independent Registered Public Accounting Firm | 165 | |
| Consolidated Average Balance Sheets, Interest and Rates (unaudited) for the three and nine months ended September 30, 2017 and 2016 | 166 | |
| Glossary of Terms and Acronyms and Line of Business Metrics | 168 | |
Item 2. | Management's Discussion and Analysis of Financial Condition and Results of Operations. |
| |
| Consolidated Financial Highlights | 3 | |
| Introduction | 4 | |
| Executive Overview | 5 | |
| Consolidated Results of Operations | 7 | |
| Consolidated Balance Sheets Analysis | 11 | |
| Consolidated Cash Flows Analysis | 13 | |
| Off-Balance Sheet Arrangements | 14 | |
| Explanation and Reconciliation of the Firm's Use of Non-GAAP Financial Measures and Key Performance Measures | 15 | |
| Business Segment Results | 18 | |
| Enterprise-Wide Risk Management | 41 | |
| Capital Risk Management | 42 | |
| Credit Risk Management | 49 | |
| Country Risk Management | 67 | |
| Liquidity Risk Management | 68 | |
| Market Risk Management | 73 | |
| Critical Accounting Estimates Used by the Firm | 78 | |
| Accounting and Reporting Developments | 80 | |
| Forward-Looking Statements | 82 | |
Item 3. | Quantitative and Qualitative Disclosures About Market Risk. | 176 | |
Item 4. | Controls and Procedures. | 176 | |
Part II – Other information |
| ||
Item 1. | Legal Proceedings. | 176 | |
Item 1A. | Risk Factors. | 176 | |
Item 2. | Unregistered Sales of Equity Securities and Use of Proceeds. | 176 | |
Item 3. | Defaults Upon Senior Securities. | 177 | |
Item 4. | Mine Safety Disclosures. | 177 | |
Item 5. | Other Information. | 177 | |
Item 6. | Exhibits. | 178 | |
2
JPMorgan Chase & Co.
Consolidated financial highlights
(unaudited) As of or for the period ended, (in millions, except per share, ratio, headcount data and where otherwise noted) |
|
|
|
|
| Nine months ended Sept. 30, | ||||||||||||||||
3Q17 | | 2Q17 | | 1Q17 | | 4Q16 | | 3Q16 | | 2017 | | 2016 | | |||||||||
Selected income statement data |
|
|
|
|
|
|
| |||||||||||||||
Total net revenue | $ | 25,326 | | $ | 25,470 | | $ | 24,675 | | $ | 23,376 | | $ | 24,673 | | $ | 75,471 | | $ | 72,292 | | |
Total noninterest expense | 14,318 | | 14,506 | | 15,019 | | 13,833 | | 14,463 | | 43,843 | | 41,938 | | ||||||||
Pre-provision profit | 11,008 | | 10,964 | | 9,656 | | 9,543 | | 10,210 | | 31,628 | | 30,354 | | ||||||||
Provision for credit losses | 1,452 | | 1,215 | | 1,315 | | 864 | | 1,271 | | 3,982 | | 4,497 | | ||||||||
Income before income tax expense | 9,556 | | 9,749 | | 8,341 | | 8,679 | | 8,939 | | 27,646 | | 25,857 | | ||||||||
Income tax expense | 2,824 | | 2,720 | | 1,893 | | 1,952 | | 2,653 | | 7,437 | | 7,851 | | ||||||||
Net income | $ | 6,732 | | $ | 7,029 | | $ | 6,448 | | $ | 6,727 | | $ | 6,286 | | $ | 20,209 | | $ | 18,006 | | |
Earnings per share data |
|
|
|
|
|
|
| |||||||||||||||
Net income: Basic | $ | 1.77 | | $ | 1.83 | | $ | 1.66 | | $ | 1.73 | | $ | 1.60 | | $ | 5.26 | | $ | 4.51 | | |
Diluted | 1.76 | | 1.82 | | 1.65 | | 1.71 | | 1.58 | | 5.22 | | 4.48 | | ||||||||
Average shares: Basic | 3,534.7 | | 3,574.1 | | 3,601.7 | | 3,611.3 | | 3,637.7 | | 3,570.9 | | 3,674.6 | | ||||||||
Diluted | 3,559.6 | | 3,599.0 | | 3,630.4 | | 3,646.6 | | 3,669.8 | | 3,597.0 | | 3,704.5 | | ||||||||
Market and per common share data |
|
|
|
|
|
|
| |||||||||||||||
Market capitalization | 331,393 | | 321,633 | | 312,078 | | 307,295 | | 238,277 | | 331,393 | | 238,277 | | ||||||||
Common shares at period-end | 3,469.7 | | 3,519.0 | | 3,552.8 | | 3,561.2 | | 3,578.3 | | 3,469.7 | | 3,578.3 | | ||||||||
Share price: (a) |
|
|
|
|
|
|
| |||||||||||||||
High | $ | 95.88 | | $ | 92.65 | | $ | 93.98 | | $ | 87.39 | | $ | 67.90 | | $ | 95.88 | | $ | 67.90 | | |
Low | 88.08 | | 81.64 | | 83.03 | | 66.10 | | 58.76 | | 81.64 | | 52.50 | | ||||||||
Close | 95.51 | | 91.40 | | 87.84 | | 86.29 | | 66.59 | | 95.51 | | 66.59 | | ||||||||
Book value per share | 66.95 | | 66.05 | | 64.68 | | 64.06 | | 63.79 | | 66.95 | | 63.79 | | ||||||||
Tangible book value per share ("TBVPS") (b) | 54.03 | | 53.29 | | 52.04 | | 51.44 | | 51.23 | | 54.03 | | 51.23 | | ||||||||
Cash dividends declared per share | 0.56 | | 0.50 | | 0.50 | | 0.48 | | 0.48 | | 1.56 | | 1.40 | | ||||||||
Selected ratios and metrics |
|
|
|
|
|
|
| |||||||||||||||
Return on common equity ("ROE") | 11 | % | 12 | % | 11 | % | 11 | % | 10 | % | 11 | % | 10 | % | ||||||||
Return on tangible common equity ("ROTCE") (b) | 13 | | 14 | | 13 | | 14 | | 13 | | 14 | | 13 | | ||||||||
Return on assets | 1.04 | | 1.10 | | 1.03 | | 1.06 | | 1.01 | | 1.06 | | 0.99 | | ||||||||
Overhead ratio | 57 | | 57 | | 61 | | 59 | | 59 | | 58 | | 58 | | ||||||||
Loans-to-deposits ratio | 63 | | 63 | | 63 | | 65 | | 65 | | 63 | | 65 | | ||||||||
High quality liquid assets ("HQLA") (in billions) (c) | $ | 568 | | $ | 541 | | $ | 528 | | $ | 524 | | $ | 539 | | NA | | $ | 539 | | ||
Liquidity coverage ratio ("LCR") (average) | 120 | % | 115 | % | NA% | | NA% | | NA% | | NA% | | NA% | | ||||||||
Common equity Tier 1 ("CET1") capital ratio (d) | 12.6 | | 12.6 | | 12.5 | | 12.4 | | 12.0 | | 12.6 | | 12.0 | | ||||||||
Tier 1 capital ratio (d) | 14.3 | | 14.4 | | 14.3 | | 14.1 | | 13.6 | | 14.3 | | 13.6 | | ||||||||
Total capital ratio (d) | 16.1 | | 16.0 | | 15.6 | | 15.5 | | 15.1 | | 16.1 | | 15.1 | | ||||||||
Tier 1 leverage ratio (d) | 8.4 | | 8.5 | | 8.4 | | 8.4 | | 8.5 | | 8.4 | | 8.5 | | ||||||||
Selected balance sheet data (period-end) |
|
|
|
|
|
|
| |||||||||||||||
Trading assets | $ | 420,418 | | $ | 407,064 | | $ | 402,513 | | $ | 372,130 | | $ | 374,837 | | $ | 420,418 | | $ | 374,837 | | |
Securities | 263,288 | | 263,458 | | 281,850 | | 289,059 | | 272,401 | | 263,288 | | 272,401 | | ||||||||
Loans | 913,761 | | 908,767 | | 895,974 | | 894,765 | | 888,054 | | 913,761 | | 888,054 | | ||||||||
Core loans | 843,432 | | 834,935 | | 812,119 | | 806,152 | | 795,077 | | 843,432 | | 795,077 | | ||||||||
Average core loans | 837,522 | | 824,583 | | 805,382 | | 799,698 | | 779,383 | | 822,611 | | 759,207 | | ||||||||
Total assets | 2,563,074 | | 2,563,174 | | 2,546,290 | | 2,490,972 | | 2,521,029 | | 2,563,074 | | 2,521,029 | | ||||||||
Deposits | 1,439,027 | | 1,439,473 | | 1,422,999 | | 1,375,179 | | 1,376,138 | | 1,439,027 | | 1,376,138 | | ||||||||
Long-term debt (e) | 288,582 | | 292,973 | | 289,492 | | 295,245 | | 309,418 | | 288,582 | | 309,418 | | ||||||||
Common stockholders' equity | 232,314 | | 232,415 | | 229,795 | | 228,122 | | 228,263 | | 232,314 | | 228,263 | | ||||||||
Total stockholders' equity | 258,382 | | 258,483 | | 255,863 | | 254,190 | | 254,331 | | 258,382 | | 254,331 | | ||||||||
Headcount | 251,503 | | 249,257 | | 246,345 | | 243,355 | | 242,315 | | 251,503 | | 242,315 | | ||||||||
Credit quality metrics |
|
|
|
|
|
|
| |||||||||||||||
Allowance for credit losses | $ | 14,648 | | $ | 14,480 | | $ | 14,490 | | $ | 14,854 | | $ | 15,304 | | $ | 14,648 | | $ | 15,304 | | |
Allowance for loan losses to total retained loans | 1.49 | % | 1.49 | % | 1.52 | % | 1.55 | % | 1.61 | % | 1.49 | % | 1.61 | % | ||||||||
Allowance for loan losses to retained loans excluding purchased credit-impaired loans (f) | 1.29 | | 1.28 | | 1.31 | | 1.34 | | 1.37 | | 1.29 | | 1.37 | | ||||||||
Nonperforming assets | $ | 6,154 | | $ | 6,432 | | $ | 6,826 | | $ | 7,535 | | $ | 7,779 | | $ | 6,154 | | $ | 7,779 | | |
Net charge-offs (g) | 1,265 | | 1,204 | | 1,654 | | 1,280 | | 1,121 | | 4,123 | | 3,412 | | ||||||||
Net charge-off rate (g) | 0.56 | % | 0.54 | % | 0.76 | % | 0.58 | % | 0.51 | % | 0.62 | % | 0.53 | % | ||||||||
(a) | Share prices are from the New York Stock Exchange. |
(b) | TBVPS and ROTCE are non-GAAP financial measures. For further discussion of these measures, see Explanation and Reconciliation of the Firm's Use of Non-GAAP Financial Measures and Key Financial Performance Measures on pages 15–17 . |
(c) | HQLA represents the amount of assets that qualify for inclusion in the LCR. The amounts represent quarterly average balances for September 30, 2017 and June 30, 2017, and period-end balances for the remaining periods. For additional information, see HQLA on page 68 . |
(d) | Ratios presented are calculated under the Basel III Transitional capital rules and for the capital ratios represent the lower of the Standardized or Advanced approach as required by the Collins Amendment of the Dodd-Frank Act (the "Collins Floor"). See Capital Risk Management on pages 42–48 for additional information on Basel III and the Collins Floor. |
(e) | Included unsecured long-term debt of $221.7 billion, $221.0 billion, $212.0 billion, $212.6 billion and $226.8 billion at September 30, 2017, June 30, 2017, March 31, 2017, December 31, 2016 and September 30, 2016 respectively. |
(f) | Excluded the impact of residential real estate purchased credit-impaired ("PCI") loans, a non-GAAP financial measure. For further discussion of these measures, see Explanation and Reconciliation of the Firm's Use of Non-GAAP Financial Measures and Key Performance Measures on pages 15–17 . For further discussion, see Allowance for credit losses on pages 64–66 . |
(g) | Excluding net charge-offs of $467 million related to the student loan portfolio transfer, the net charge-off rates for the three months ended March 31, 2017 and nine months ended September 30, 2017 would have been 0.54% and 0.55%, respectively. |
3
INTRODUCTION | ||||
The following is management's discussion and analysis ("MD&A") of the financial condition and results of operations of JPMorgan Chase & Co. ("JPMorgan Chase" or the "Firm") for the third quarter of 2017.
This Form 10-Q should be read in conjunction with JPMorgan Chase's Annual Report on Form 10-K for the year ended December 31, 2016, filed with the U.S. Securities and Exchange Commission (" 2016 Annual Report" or 2016 "Form 10-K"), to which reference is hereby made. See the Glossary of terms and acronyms on pages 168–175 for definitions of terms and acronyms used throughout this Form 10-Q.
The MD&A included in this Form 10-Q contains statements that are forward-looking within the meaning of the Private Securities Litigation Reform Act of 1995. These statements are based on the current beliefs and expectations of JPMorgan Chase's management and are subject to significant risks and uncertainties. Actual results may differ from those set forth in the forward-looking statements. For a discussion of certain of those risks and uncertainties and the factors that could cause JPMorgan Chase's actual results to differ materially because of those risks and uncertainties, see Forward-looking Statements on page 82 of this Form 10-Q and Part I, Item 1A, Risk Factors, on pages 8–21 of JPMorgan Chase's 2016 Annual Report.
JPMorgan Chase & Co., a financial holding company incorporated under Delaware law in 1968, is a leading global financial services firm and one of the largest banking institutions in the United States of America ( " U.S. " ), with operations worldwide; the Firm had $2.6 trillion in assets and $258.4 billion in stockholders' equity as of September 30, 2017 . The Firm is a leader in investment
banking, financial services for consumers and small businesses, commercial banking, financial transaction processing and asset management. Under the J.P. Morgan and Chase brands, the Firm serves millions of customers in the U.S. and many of the world's most prominent corporate, institutional and government clients.
JPMorgan Chase's principal bank subsidiaries are JPMorgan Chase Bank, National Association ( " JPMorgan Chase Bank, N.A. " ), a national banking association with U.S. branches in 23 states, and Chase Bank USA, National Association ( " Chase Bank USA, N.A. " ), a national banking association that is the Firm's credit card-issuing bank. JPMorgan Chase's principal nonbank subsidiary is J.P. Morgan Securities LLC ( " JPMorgan Securities " ), the Firm's U.S. investment banking firm. The bank and nonbank subsidiaries of JPMorgan Chase operate nationally as well as through overseas branches and subsidiaries, representative offices and subsidiary foreign banks. The Firm's principal operating subsidiary in the United Kingdom ( " U.K. " ) is J.P. Morgan Securities plc, a subsidiary of JPMorgan Chase Bank, N.A.
For management reporting purposes, the Firm's activities are organized into four major reportable business segments, as well as a Corporate segment. The Firm's consumer business is the Consumer & Community Banking ( " CCB " ) segment. The Firm's wholesale business segments are Corporate & Investment Bank ( " CIB " ), Commercial Banking ( " CB " ), and Asset & Wealth Management ( " AWM " ). For a description of the Firm's business segments, and the products and services they provide to their respective client bases, refer to Note 33 of JPMorgan Chase's 2016 Annual Report.
4
EXECUTIVE OVERVIEW | ||||
This executive overview of the MD&A highlights selected information and does not contain all of the information that is important to readers of this Form 10-Q. For a complete description of the trends and uncertainties, as well as the risks and critical accounting estimates affecting the Firm and its lines of business, this Form 10-Q and incorporated documents should be read in their entirety.
Financial performance of JPMorgan Chase |
|
|
|
|
|
|
|
| |||||||||||||
(unaudited) As of or for the period ended, (in millions, except per share data and ratios) | Three months ended September 30, |
| Nine months ended September 30, | ||||||||||||||||||
2017 | |
| 2016 | |
| Change | |
| 2017 | |
| 2016 | |
| Change | | |||||
Selected income statement data |
|
|
|
|
|
|
|
|
|
|
| ||||||||||
Total net revenue | $ | 25,326 | |
| $ | 24,673 | |
| 3 | % |
| $ | 75,471 | |
| $ | 72,292 | |
| 4 | % |
Total noninterest expense | 14,318 | |
| 14,463 | |
| (1 | ) |
| 43,843 | |
| 41,938 | |
| 5 | | ||||
Pre-provision profit | 11,008 | |
| 10,210 | |
| 8 | |
| 31,628 | |
| 30,354 | |
| 4 | | ||||
Provision for credit losses | 1,452 | |
| 1,271 | |
| 14 | |
| 3,982 | |
| 4,497 | |
| (11 | ) | ||||
Net income | 6,732 | |
| 6,286 | |
| 7 | |
| 20,209 | |
| 18,006 | |
| 12 | | ||||
Diluted earnings per share | $ | 1.76 | |
| $ | 1.58 | |
| 11 | |
| $ | 5.22 | |
| $ | 4.48 | |
| 17 | |
Selected ratios and metrics |
|
|
|
|
|
|
|
|
|
|
| ||||||||||
Return on common equity | 11 | % |
| 10 | % |
|
|
| 11 | % |
| 10 | % |
|
| ||||||
Return on tangible common equity | 13 | |
| 13 | |
|
|
| 14 | |
| 13 | |
|
| ||||||
Book value per share | $ | 66.95 | |
| $ | 63.79 | |
| 5 | |
| $ | 66.95 | |
| $ | 63.79 | |
| 5 | |
Tangible book value per share | 54.03 | |
| 51.23 | |
| 5 | |
| 54.03 | |
| 51.23 | |
| 5 | | ||||
Capital ratios (a) |
|
|
|
|
|
|
|
|
|
|
| ||||||||||
CET1 | 12.6 | % |
| 12.0 | % |
|
|
| 12.6 | % |
| 12.0 | % |
|
| ||||||
Tier 1 capital | 14.3 | |
| 13.6 | |
|
|
| 14.3 | |
| 13.6 | |
|
| ||||||
Total capital | 16.1 | |
| 15.1 | |
|
|
| 16.1 | |
| 15.1 | |
|
| ||||||
(a) | Ratios presented are calculated under the Basel III Transitional capital rules and represent the Collins Floor. See Capital Risk Management on pages 42–48 for additional information on Basel III. |
Comparisons noted in the sections below are calculated for the third quarter of 2017 versus the prior-year third quarter, unless otherwise specified.
Firmwide overview
JPMorgan Chase reported strong results in the third quarter of 2017 with net income of $6.7 billion, or $1.76 per share, on net revenue of $25.3 billion. The Firm reported ROE of 11% and ROTCE of 13%.
• | Net income increased 7%, reflecting higher net revenue, partially offset by a higher provision for credit losses. |
• | Total net revenue increased 3%. Net interest income was $12.8 billion, up 10%, primarily driven by the net impact of higher interest rates and loan growth, partially offset by declines in Markets net interest income. Noninterest revenue was $12.5 billion, down 4%, driven by lower Markets revenue in the CIB. |
• | Noninterest expense was $14.3 billion, down 1%. The prior year included two items in Consumer & Community Banking totaling $175 million related to liabilities from a merchant in bankruptcy and mortgage servicing reserves. |
• | The provision for credit losses was $1.5 billion, an increase from $1.3 billion in the prior year. The increase reflected a net addition to the allowance for credit losses in the Consumer portfolio of $303 million, driven by Card, and higher net charge-offs of $148 million (including $63 million of incremental charge-offs recorded in accordance with regulatory guidance), partially offset by a net reduction to the allowance for credit losses in the |
Wholesale portfolio of $116 million, primarily driven by Oil & Gas and Real Estate.
• | The total allowance for credit losses was $14.6 billion at September 30, 2017 , and the Firm had a loan loss coverage ratio, excluding the PCI portfolio, of 1.29%, compared with 1.37% in the prior year. The Firm's nonperforming assets totaled $6.2 billion at September 30, 2017 , a decrease from $7.8 billion in the prior year. |
• | Firmwide average core loans increased 7%. |
Selected capital-related metrics
• | The Firm's Basel III Fully Phased-In CET1 capital was $187 billion, and the Standardized and Advanced CET1 ratios were 12.5% and 12.9%, respectively. |
• | The Fully Phased-In supplementary leverage ratio ("SLR") was 6.6% for the Firm. |
• | The Firm continued to grow tangible book value per share ("TBVPS"), ending the third quarter of 2017 at $54.03, up 5%. |
ROTCE and TBVPS are considered non-GAAP financial measures. Core loans and each of the Fully Phased-In capital and leverage measures are considered key performance measures. For a further discussion of each of these measures, see Explanation and Reconciliation of the Firm's Use of Non-GAAP Financial Measures and Key Performance Measures on pages 15–17 , and Capital Risk Management on pages 42–48 .
5
Lines of business highlights
Selected business metrics for each of the Firm's four lines of business are presented below for the third quarter of 2017.
CCB ROE 19% |
| • Average core loans up 8%; average deposits of $646 billion, up 9%• 29.3 million active mobile customers, up 12%• Credit card sales volume and merchant processing volume each up 13% |
CIB ROE 13% |
| • Maintained #1 ranking for Global Investment Banking fees with 8.2% wallet share YTD• Banking revenue up 5%; Markets revenue down 21% |
CB ROE 17% |
| • Record revenue of $2.1 billion, up 15%; net income of $881 million, up 13%• Average loan balances of $200 billion, up 10% |
AWM ROE 29% |
| • Record net income of $674 million, up 21%; revenue of $3.2 billion, up 6%• Average loan balances of $125 billion, up 10%• Record assets under management ("AUM") of $1.9 trillion, up 10%; 81% of mutual fund AUM ranked in the 1 st or 2 nd quartile over 5 years |
For a detailed discussion of results by line of business, refer to the Business Segment Results on pages 18–40 .
Credit provided and capital raised
JPMorgan Chase continues to support consumers, businesses and communities around the globe. The Firm provided credit and raised capital of $1.7 trillion for wholesale and consumer clients during the first nine months of 2017:
• | $197 billion of credit for consumers |
• | $17 billion of credit for U.S. small businesses |
• | $601 billion of credit for corporations |
• | $820 billion of capital raised for corporate clients and non-U.S. government entities |
• | $65 billion of credit and capital raised for U.S. government and nonprofit entities, including states, municipalities, hospitals and universities. |
Recent events
During the second half of 2017, natural disasters caused significant disruptions to individuals and businesses, and damage to homes and communities in several regions where the Firm conducts business. The Firm continues to provide assistance to customers, clients, communities and employees who have been affected by these disasters. These events did not have a material impact on the Firm's third quarter 2017 financial results.
2017 outlook
These current expectations are forward-looking statements within the meaning of the Private Securities Litigation Reform Act of 1995. Such forward-looking statements are based on
the current beliefs and expectations of JPMorgan Chase's management and are subject to significant risks and uncertainties. These risks and uncertainties could cause the Firm's actual results to differ materially from those set forth in such forward-looking statements. See Forward-Looking Statements on page 82 of this Form 10-Q and Risk Factors on pages 8–21 of JPMorgan Chase's 2016 Annual Report. There is no assurance that actual results for the full year of 2017 will be in line with the outlook set forth below, and the Firm does not undertake to update any forward-looking statements to reflect the impact of circumstances or events that arise after the date hereof.
JPMorgan Chase's outlook for the remainder of 2017 should be viewed against the backdrop of the global and U.S. economies, financial markets activity, the geopolitical environment, the competitive environment, client activity levels, and regulatory and legislative developments in the U.S. and other countries where the Firm does business. Each of these interrelated factors will affect the performance of the Firm and its lines of business. The Firm expects it will continue to make appropriate adjustments to its businesses and operations in response to ongoing developments in the legal, regulatory, business and economic environments in which it operates.
Firmwide
• | Management expects 2017 net interest income to increase by approximately $4 billion compared with the prior year, depending on market conditions. |
• | The Firm continues to take a disciplined approach to managing its expenses, while investing in growth and innovation. As a result, Firmwide adjusted expense in 2017 is expected to be approximately $58 billion (excluding Firmwide legal expense). |
• | The Firm continues to experience charge-off rates at or near historically low levels, reflecting favorable credit conditions across the consumer and wholesale portfolios. Management expects total net charge-offs of approximately $5 billion in 2017, excluding net charge-offs of $467 million related to the write-down of the student loan portfolio in the first quarter of 2017. |
• | Management expects average core loan growth of approximately 8% in 2017. |
CCB
• | Management expects Card, Commerce Solutions & Auto ("CCSA") revenue for the fourth quarter of 2017 to be approximately flat compared to the third quarter of 2017. |
• | In Card, management expects the portfolio average net charge-off rate in 2017 to remain below 3% for the year, reflecting continued loan growth and the seasoning of newer vintages, with quarterly net charge-off rates reflecting normal seasonal trends. |
CIB
• | Management expects Markets revenue in the fourth quarter of 2017 to be lower compared to a strong prior-year period. |
CB
• | Management expects expense in the fourth quarter of 2017 to be approximately flat compared to the third quarter of 2017. |
6
CONSOLIDATED RESULTS OF OPERATIONS | ||||
Revenue |
|
|
|
|
|
|
|
|
|
|
| ||||||||||
| Three months ended September 30, |
| Nine months ended September 30, | ||||||||||||||||||
(in millions) | 2017 | |
| 2016 | |
| Change | |
| 2017 | |
| 2016 | |
| Change | | ||||
Investment banking fees | $ | 1,843 | |
| $ | 1,866 | |
| (1 | )% |
| $ | 5,470 | |
| $ | 4,843 | |
| 13 | % |
Principal transactions | 2,721 | |
| 3,451 | |
| (21 | ) |
| 9,440 | |
| 9,106 | |
| 4 | | ||||
Lending- and deposit-related fees | 1,497 | |
| 1,484 | |
| 1 | |
| 4,427 | |
| 4,290 | |
| 3 | | ||||
Asset management, administration and commissions | 3,846 | |
| 3,597 | |
| 7 | |
| 11,347 | |
| 10,902 | |
| 4 | | ||||
Securities gains/(losses) | (1 | ) |
| 64 | |
| NM | |
| (38 | ) |
| 136 | |
| NM | | ||||
Mortgage fees and related income | 429 | |
| 624 | |
| (31 | ) |
| 1,239 | |
| 1,980 | |
| (37 | ) | ||||
Card income | 1,242 | |
| 1,202 | |
| 3 | |
| 3,323 | |
| 3,861 | |
| (14 | ) | ||||
Other income (a) | 951 | |
| 782 | |
| 22 | |
| 3,193 | |
| 2,844 | |
| 12 | | ||||
Noninterest revenue | 12,528 | |
| 13,070 | |
| (4 | ) |
| 38,401 | |
| 37,962 | |
| 1 | | ||||
Net interest income | 12,798 | |
| 11,603 | |
| 10 | |
| 37,070 | |
| 34,330 | |
| 8 | | ||||
Total net revenue | $ | 25,326 | |
| $ | 24,673 | |
| 3 | % |
| $ | 75,471 | |
| $ | 72,292 | |
| 4 | % |
(a) | Included operating lease income of $928 million and $708 million for the three months ended September 30, 2017 and 2016 , respectively and $2.6 billion and $2.0 billion for the nine months ended September 30, 2017 and 2016 , respectively. |
Quarterly results
Investment banking fees remained relatively flat, as declines in equity underwriting fees driven by a lower share of fees, and debt underwriting fees driven by lower industry-wide fees were offset by higher advisory fees driven by a higher number of completed transactions in CIB. For additional information, see CIB segment results on pages 25–30 and Note 5 .
Principal transactions revenue decreased compared with a strong prior year in CIB's Markets business, primarily reflecting:
• | lower Fixed Income-related revenue across products driven by sustained low volatility and tighter credit spreads |
partially offset by
• | higher Equity-related revenue primarily in Prime Services. |
The decrease also reflected lower gains on private equity investments in several businesses. For additional information, see CIB, Corporate and CCB segment results
on pages 25–30 , page 39 and pages 20–24 , respectively, and Note 5 .
Asset management, administration and commissions revenue increased as a result of higher asset management fees in AWM and CCB, and higher asset-based fees in CIB, both driven by higher market levels, as well as higher brokerage commissions driven by higher volumes. For additional information, see AWM, CCB and CIB segment results on pages 35–38 , pages 20–24 and pages 25–30 , respectively, and Note 5 .
Mortgage fees and related income decreased driven by lower net production revenue on lower margins and volumes, lower mortgage servicing rights ("MSR") risk management results, and lower servicing revenue on lower average third-party loans serviced. For further information, see CCB segment results on pages 20–24 and Note 14 .
Card income increased predominantly driven by higher credit card-related fees, largely annual fees, predominantly offset by higher credit card new account origination costs. For further information, see CCB segment results on pages 20–24 .
Other income increased primarily driven by higher operating lease income reflecting growth in auto operating lease volume in CCB.
For further information, see Note 5 .
Net interest income increased primarily driven by the net impact of higher rates and loan growth, partially offset by declines in Markets net interest income in CIB. The Firm's average interest-earning assets were $2.2 trillion, and the net interest yield on these assets, on a fully taxable-equivalent ("FTE " ) basis, was 2.37%, an increase of 13 basis points from the prior year.
For additional information on lending- and deposit-related fees, see the segment results for CCB on pages 20–24 , CIB on pages 25–30 , and CB on pages 31–34 and Note 5 ; and on securities gains, see the Corporate segment discussion on page 39 .
7
Year-to-date results
Investment banking fees increased reflecting higher debt and equity underwriting fees in CIB. The increase in debt underwriting fees was driven by a higher share of fees and an overall increase in industry-wide fees; and the increase in equity underwriting fees was driven by growth in industry-wide issuance, including a stronger IPO market.
Principal transactions revenue increased primarily as a result of higher client-driven market-making revenue in CIB, primarily reflecting:
• | higher Equity-related revenue primarily in Prime Services, and |
• | higher Lending-related revenue reflecting lower fair value losses on hedges of accrual loans |
partially offset by
• | lower Fixed Income-related revenue driven by sustained low volatility and tighter credit spreads. |
Asset management, administration and commissions revenue increased as a result of higher asset management fees in AWM and CCB, and higher asset-based fees in CIB, both driven by higher market levels, as well as higher brokerage commissions driven by higher volumes in CIB and AWM.
Mortgage fees and related income decreased driven by lower MSR risk management results, lower net production revenue on lower margins and volumes, and lower servicing revenue on lower average third-party loans serviced.
Card income decreased predominantly driven by higher credit card new account origination costs, partially offset
by higher credit card-related fees, largely annual fees.
Other income increased primarily due to the following:
• | higher operating lease income reflecting growth in auto operating lease volume in CCB |
• | a legal benefit of $645 million recorded in the second quarter of 2017 in Corporate related to a settlement with the FDIC receivership for Washington Mutual and with Deutsche Bank as trustee to certain Washington Mutual trusts |
partially offset by
• | the absence in the current year of both gains on the sale of Visa Europe interests in CCB, as well as on the disposal of an asset in AWM, and |
• | lower other income in CIB. |
Net interest income increased primarily driven by the net impact of higher rates and loan growth across the businesses, partially offset by declines in Markets net interest income in CIB. The Firm's average interest-earning assets were $2.2 trillion, and the net interest yield on these assets, on a FTE basis, was 2.34%, an increase of 8 basis points from the prior year.
Provision for credit losses |
|
|
|
|
|
|
|
|
|
| |||||||||||
| Three months ended September 30, |
| Nine months ended September 30, | ||||||||||||||||||
(in millions) | 2017 | |
| 2016 | |
| Change | |
| 2017 | |
| 2016 | |
| Change | | ||||
Consumer, excluding credit card | $ | 206 | |
| $ | 262 | |
| (21 | )% |
| $ | 660 | |
| $ | 578 | |
| 14 | % |
Credit card | 1,319 | |
| 1,038 | |
| 27 | |
| 3,699 | |
| 2,978 | |
| 24 | | ||||
Total consumer | 1,525 | |
| 1,300 | |
| 17 | |
| 4,359 | |
| 3,556 | |
| 23 | | ||||
Wholesale | (73 | ) |
| (29 | ) |
| (152 | ) |
| (377 | ) |
| 941 | |
| NM | | ||||
Total provision for credit losses | $ | 1,452 | |
| $ | 1,271 | |
| 14 | % |
| $ | 3,982 | |
| $ | 4,497 | |
| (11 | )% |
Quarterly results
The provision for credit losses increased as a result of:
• | a higher consumer provision driven by: |
– | $148 million of higher net charge-offs, primarily in the credit card portfolio due to seasoning of newer vintages in line with expectations, partially offset by a decrease in net charge-offs in the residential real estate portfolio reflecting continued improvement in home prices and delinquencies. The higher net charge-offs included $63 million of incremental charge-offs recorded in accordance with regulatory guidance, and |
– | a $300 million addition to the allowance for credit losses in the credit card portfolio, due to higher loss rates and loan growth, compared to a $200 million addition in the prior year |
the increase was partially offset by
• | a higher net benefit of $44 million due to a net reduction of $116 million in the wholesale allowance for credit losses, primarily driven by paydowns and loan sales in the Oil & Gas portfolio , and improvements in the overall quality of the Real Estate portfolio. |
For a more detailed discussion of the credit portfolio and the allowance for credit losses, see the segment discussions of CCB on pages 20–24 , CIB on pages 25–30 , CB on pages 31–34 , the Allowance for Credit Losses on pages 64–66 and
Note 12 .
8
Year-to-date results
The provision for credit losses decreased as a result of:
• | a net $450 million reduction in the wholesale allowance for credit losses, reflecting credit quality improvements in Oil & Gas , Natural Gas Pipelines and Metals & Mining portfolios , compared with an addition of $680 million in the prior year driven by downgrades in the same portfolios |
the decrease was partially offset by
• | a higher consumer provision driven by: |
– | $432 million of higher net charge-offs, primarily in the credit card portfolio due to seasoning of newer vintages in line with expectations , partially offset by a decrease |
in net charge-offs in the residential real estate portfolio reflecting continued improvement in home prices and delinquencies,
– | a $218 million impact related to the transfer of the student loan portfolio to held-for-sale, and |
– | a $153 million higher addition to the allowance for credit losses, which included current year additions to the allowance in the credit card, business banking and auto portfolios, partially offset by a reduction in the allowance in the residential real estate portfolio. |
For a more detailed discussion of the student loan sale, see CCB segment results on pages 20–24 .
Noninterest expense |
|
|
|
|
|
|
|
|
|
| |||||||||||
| Three months ended September 30, |
| Nine months ended September 30, | ||||||||||||||||||
(in millions) | 2017 | |
| 2016 | |
| Change | |
| 2017 | |
| 2016 | |
| Change | |||||
Compensation expense | $ | 7,646 | |
| $ | 7,669 | |
| - | |
| $ | 23,553 | |
| $ | 23,107 | |
| 2 | % |
Noncompensation expense: |
|
|
|
|
|
|
|
|
|
|
| ||||||||||
Occupancy | 930 | |
| 899 | |
| 3 | |
| 2,803 | |
| 2,681 | |
| 5 | | ||||
Technology, communications and equipment | 1,972 | |
| 1,741 | |
| 13 | |
| 5,670 | |
| 5,024 | |
| 13 | | ||||
Professional and outside services | 1,705 | |
| 1,665 | |
| 2 | |
| 4,892 | |
| 4,913 | |
| - | | ||||
Marketing | 710 | |
| 825 | |
| (14 | ) |
| 2,179 | |
| 2,200 | |
| (1 | ) | ||||
Other expense (a)(b) | 1,355 | |
| 1,664 | |
| (19 | ) |
| 4,746 | |
| 4,013 | |
| 18 | | ||||
Total noncompensation expense | 6,672 | |
| 6,794 | |
| (2 | ) |
| 20,290 | |
| 18,831 | |
| 8 | | ||||
Total noninterest expense | $ | 14,318 | |
| $ | 14,463 | |
| (1 | )% |
| $ | 43,843 | |
| $ | 41,938 | |
| 5 | % |
(a) | Included Firmwide legal expense/(benefit) of $(107) million and $(71) million for the three months ended September 30, 2017 and 2016, respectively and $172 million and $(547) million for the nine months ended September 30, 2017 and 2016 , respectively. |
(b) | Included FDIC-related expense of $353 million and $360 million for the three months ended September 30, 2017 and 2016, respectively and $1.1 billion and $912 million for the nine months ended September 30, 2017 and 2016 , respectively. |
Quarterly results
Compensation expense decreased predominantly driven by lower performance-based compensation expense in CIB, partially offset by investments in certain businesses, including bankers and support staff.
Noncompensation expense decreased as a result of:
• | two items totaling $175 million included in the prior year in CCB related to liabilities from a merchant in bankruptcy and mortgage servicing reserves, and |
• | lower marketing expense in CCB |
partially offset by
• | higher depreciation expense from growth in auto operating lease volume in CCB. |
For a discussion of legal expense, see Note 21 .
Year-to-date results
Compensation expense increased predominantly driven by investments in certain businesses, including bankers and support staff, partially offset by lower performance-based compensation expense particularly in CIB.
Noncompensation expense increased as a result of:
• | higher legal expense as the prior year was a legal benefit |
• | higher depreciation expense from growth in auto operating lease volume in CCB |
• | higher FDIC-related expenses and |
• | contributions to the Firm's Foundation, |
partially offset by
• | two items totaling $175 million included in the prior year in CCB related to liabilities from a merchant in bankruptcy and mortgage servicing reserves. |
9
Income tax expense |
|
|
|
|
|
|
| ||||||||||||||
| Three months ended September 30, |
| Nine months ended September 30, | ||||||||||||||||||
(in millions) | 2017 | |
| 2016 | |
| Change | |
| 2017 | |
| 2016 | |
| Change | |||||
Income before income tax expense | $ | 9,556 | |
| $ | 8,939 | |
| 7 | % |
| $ | 27,646 | |
| $ | 25,857 | |
| 7 | % |
Income tax expense | 2,824 | |
| 2,653 | |
| 6 | |
| 7,437 | |
| 7,851 | |
| (5 | ) | ||||
Effective tax rate | 29.6 | % |
| 29.7 | % |
|
|
| 26.9 | % |
| 30.4 | % |
| | | |||||
Quarterly results
The effective tax rate was relatively flat compared to the prior period.
Year-to-date results
The effective tax rate decreased predominantly due to larger tax benefits resulting from the vesting of employee-based stock awards and the release of a valuation allowance. The tax benefits resulting from employee-based stock awards were related to the appreciation of the Firm's stock price upon vesting of these awards above their original grant price.
10
CONSOLIDATED BALANCE SHEETS ANALYSIS | ||||
Consolidated balance sheets overvie w
The following is a discussion of the significant changes between September 30, 2017 , and December 31, 2016 .
Selected Consolidated balance sheets data | |||||||||
(in millions) | Sep 30, | |
| Dec 31, | | Change | | ||
Assets |
|
|
|
| |||||
Cash and due from banks | $ | 21,994 | |
| $ | 23,873 | | (8 | )% |
Deposits with banks | 435,810 | |
| 365,762 | | 19 | | ||
Federal funds sold and securities purchased under resale agreements | 185,454 | |
| 229,967 | | (19 | ) | ||
Securities borrowed | 101,680 | |
| 96,409 | | 5 | | ||
Trading assets: |
|
|
|
| |||||
Debt and equity instruments | 362,158 | |
| 308,052 | | 18 | | ||
Derivative receivables | 58,260 | |
| 64,078 | | (9 | ) | ||
Securities | 263,288 | |
| 289,059 | | (9 | ) | ||
Loans | 913,761 | |
| 894,765 | | 2 | | ||
Allowance for loan losses | (13,539 | ) |
| (13,776 | ) | (2 | ) | ||
Loans, net of allowance for loan losses | 900,222 | |
| 880,989 | | 2 | | ||
Accrued interest and accounts receivable | 61,757 | |
| 52,330 | | 18 | | ||
Premises and equipment | 14,218 | |
| 14,131 | | 1 | | ||
Goodwill | 47,309 | |
| 47,288 | | - | | ||
Mortgage servicing rights | 5,738 | |
| 6,096 | | (6 | ) | ||
Other intangible assets | 808 | |
| 862 | | (6 | ) | ||
Other assets | 104,378 | |
| 112,076 | | (7 | ) | ||
Total assets | $ | 2,563,074 | |
| $ | 2,490,972 | | 3 | % |
Cash and due from banks and deposits with banks increased primarily driven by deposit growth and a shift in the deployment of excess cash from securities purchased under resale agreements and investment securities into deposits with banks. The Firm's excess cash is placed with various central banks, predominantly Federal Reserve Banks.
Federal funds sold and securities purchased under resale agreements decreased primarily due to the shift in the deployment of excess cash to deposits with banks. For additional information on the Firm's Liquidity Risk Management, see pages 68–72 .
Trading assets and trading liabilities–debt and equity instruments increased predominantly related to client-driven market-making activities in CIB.
• | The increase in trading assets was driven by higher debt and equity instruments in Prime Services reflecting client demand, and in Rates reflecting higher levels of client activity when compared to lower levels at year-end |
• | The increase in trading liabilities was driven by higher levels of client-driven short positions in equity instruments in Prime Services, partially offset by reductions in debt instruments in Securitized products. |
For additional information, refer to Note 2 .
Trading assets and trading liabilities–derivative receivables and payables decreased predominantly related to client-driven market-making activities in CIB Markets, reflecting lower foreign exchange and interest rate derivative receivables and payables, driven by maturities and market movements. The decrease in derivative receivables was partially offset by higher equity derivative receivables driven by higher market levels. For additional information, refer to Derivative contracts on pages 62–63 , and Notes 2 and 4 .
Securities decreased primarily reflecting net sales of
U.S. Treasuries. For information on Securities, see Notes 2
and 9 .
Loans increased reflecting the following:
• | higher wholesale loans driven by new originations in CB and higher loans to Private Banking clients in AWM, partially offset by paydowns in CIB |
• | higher consumer loans as a result of higher retention of originated high-quality prime mortgages in CCB and AWM, largely offset by the sale of the student loan portfolio, lower home equity loans and the run-off of PCI loans. |
The allowance for loan losses decreased reflecting the following:
• | a net reduction in the wholesale allowance, reflecting credit quality improvements in the Oil & Gas, Natural Gas Pipelines and Metals & Mining portfolios |
partially offset by
• | an increase in the consumer allowance, reflecting additions to the allowance for the credit card, business banking and auto portfolios, predominantly driven by |
11
higher loss rates and loan growth in credit card, largely offset by the utilization of the allowance in connection with the transfer of the student loan portfolio to held-for-sale, and a reduction in the allowance for the residential real estate portfolio predominantly driven by continued improvement in home prices and delinquencies.
For detailed discussion of loans and the allowance for loan losses, refer to Credit Risk Management on pages 49–66 , and Notes 2 , 3 , 11 and 12 .
Accrued interest and accounts receivable increased reflecting higher client receivables related to client-driven market-making activities in CIB.
Other assets decreased as a result of a shift in the collateral pledged by CIB from cash to securities (which are classified within trading assets).
For information on MSRs, see Note 14 .
Selected Consolidated balance sheets data (continued) |
| ||||||||
(in millions) | Sep 30, | |
| Dec 31, | | Change | | ||
Liabilities |
|
|
|
| |||||
Deposits | $ | 1,439,027 | |
| $ | 1,375,179 | | 5 | % |
Federal funds purchased and securities loaned or sold under repurchase agreements | 169,393 | |
| 165,666 | | 2 | | ||
Commercial paper | 24,248 | |
| 11,738 | | 107 | | ||
Other borrowed funds | 29,719 | |
| 22,705 | | 31 | | ||
Trading liabilities: |
|
|
|
| |||||
Debt and equity instruments | 89,089 | |
| 87,428 | | 2 | | ||
Derivative payables | 39,446 | |
| 49,231 | | (20 | ) | ||
Accounts payable and other liabilities | 196,764 | |
| 190,543 | | 3 | | ||
Beneficial interests issued by consolidated variable interest entities ("VIEs") | 28,424 | |
| 39,047 | | (27 | ) | ||
Long-term debt | 288,582 | |
| 295,245 | | (2 | ) | ||
Total liabilities | 2,304,692 | |
| 2,236,782 | | 3 | | ||
Stockholders' equity | 258,382 | |
| 254,190 | | 2 | | ||
Total liabilities and stockholders' equity | $ | 2,563,074 | |
| $ | 2,490,972 | | 3 | % |
Deposits increased due to the following:
• | higher consumer deposits reflecting the continuation of strong growth from new and existing customers, and low attrition rates |
• | higher wholesale deposits driven by growth in client cash management activity in CIB's Securities Services and Treasury Services businesses, partially offset by lower balances in AWM reflecting balance migration into investment-related products (retained predominantly within the Firm), and the impact of seasonality in both CB and AWM. |
For more information on deposits, refer to the Liquidity Risk Management discussion on pages 68–72 ; and Notes 2
and 15 .
Federal funds purchased and securities loaned or sold under repurchase agreements increased reflecting on-going client activity in CIB, partially offset by a change in the mix of funding to commercial paper and other borrowed funds.
Commercial paper increased due to higher issuance in the wholesale market, reflecting a change in the mix of funding from securities sold under repurchase agreements for CIB Markets activities. For additional information, see Liquidity Risk Management on pages 68–72 .
Other borrowed funds increased driven by a change in the mix of funding from securities sold under repurchase agreements in CIB.
Beneficial interests issued by consolidated VIEs decreased due to net maturities of credit card securitizations and the deconsolidation of the student loan securitization entities. For further information on Firm-sponsored VIEs and loan securitization trusts, see Off-Balance Sheet Arrangements on page 14 and Notes 13 and 19 ; and for a more detailed discussion of the student loan sale, see CCB segment results on pages 20–24 and Note 23.
For information on the Firm's long-term debt activities, see Liquidity Risk Management on pages 68–72 ; on changes in stockholders' equity, see page 86 , and on the Firm's capital actions, see Capital actions on page 47 .
12
CONSOLIDATED CASH FLOWS ANALYSIS | ||||
Consolidated cash flows overvie w
The following is a discussion of cash flow activities during
the nine months ended September 30, 2017 and 2016.
(in millions) |
| Nine months ended September 30, | ||||||
| 2017 | |
| 2016 | | |||
Net cash provided by/(used in) |
|
|
|
| ||||
Operating activities |
| $ | (16,038 | ) |
| $ | (18,715 | ) |
Investing activities |
| (22,342 | ) |
| (112,102 | ) | ||
Financing activities |
| 36,405 | |
| 131,699 | | ||
Effect of exchange rate changes on cash |
| 96 | |
| 18 | | ||
Net increase/(decrease) in cash and due from banks |
| $ | (1,879 | ) |
| $ | 900 | |
Operating activities
Cash used in operating activities for the nine month period ending September 30, 2017 resulted from:
Client-driven market-making activities in CIB
• | an increase in trading assets was driven by higher debt and equity instruments in Prime Services reflecting client demand, and in Rates reflecting higher levels of client activity when compared to lower levels at year-end |
• | a decrease in trading liabilities predominantly reflecting lower foreign exchange and interest rate derivative payables |
• | an increase in accrued interest and accounts receivable due to higher client receivables. |
Partially offsetting these outflows was a decrease in other assets as a result of a shift in the collateral pledged in CIB from cash to securities.
Cash used in operating activities for the nine month period ending September 30, 2016 resulted from:
Client-driven market-making activities in CIB
• | an increase in trading assets, which was largely offset by an increase in trading liabilities |
• | an increase in accrued interest and accounts receivable driven by higher client receivables |
• | an increase in securities borrowed driven by higher demand for securities to cover short positions. |
Investing activities
Cash used in investing activities during 2017 resulted from:
• | an increase in deposits with banks, primarily driven by growth in deposits and a shift in the deployment of excess cash from securities purchased under resale agreements and investment securities into deposits with banks |
• | higher wholesale loans driven by new originations in CB and higher loans to Private Banking clients in AWM, partially offset by paydowns in CIB |
• | higher consumer loans as a result of higher retention of originated high-quality prime mortgages in CCB and AWM, largely offset by the sale of the student loan portfolio, lower home equity loans and the run-off of PCI loans |
Cash used in investing activities during 2016 resulted from:
• | net originations of consumer and wholesale loans |
• | an increase in deposits with banks primarily due to growth in deposits and an increase in long-term debt |
• | an increase in securities purchased under resale agreements due to the deployment of excess cash by Treasury and higher demand for securities to cover short positions related to client-driven market-making activities in CIB. |
For both periods, partially offsetting these cash outflows were net proceeds from paydowns, maturities, sales and purchases of investment securities.
Financing activities
Cash provided by financing activities in 2017 resulted from:
• | higher wholesale deposits driven by growth in client cash management activity in CIB's Securities Services and Treasury Services businesses, partially offset by lower balances in AWM reflecting balance migration predominantly into the Firm's investment-related products, and the impact of seasonality in both CB and AWM |
• | higher consumer deposits reflecting the continuation of strong growth from new and existing customers, and low attrition rates |
• | an increase in commercial paper due to higher issuance in the wholesale market, reflecting a change in the mix of funding from securities sold under repurchase agreements for CIB Markets activities |
Partially offsetting these inflows were net payments of long-term borrowings.
Cash provided by financing activities in 2016 resulted from:
• | higher consumer and wholesale deposits |
• | an increase in securities loaned or sold under repurchase agreements predominantly due to higher client-driven market-making activities in CIB |
• | higher net proceeds from long-term borrowings consistent with Treasury's long-term funding plans. |
For both periods, cash was used for repurchases of common stock and dividends on common and preferred stock.
For a further discussion of the activities affecting the Firm's cash flows, see Consolidated Balance Sheets Analysis on pages 11–12 , Capital Risk Management on pages 42–48 , and Liquidity Risk Management on pages 68–72 of this Form 10-Q, and pages 110–115 of JPMorgan Chase's 2016 Annual Report.
13
OFF-BALANCE SHEET ARRANGEMENTS | ||||
In the normal course of business, the Firm enters into various contractual obligations that may require future cash payments. Certain obligations are recognized on-balance sheet, while others are off-balance sheet under accounting principles generally accepted in the U.S. ("U.S. GAAP"). The Firm is involved with several types of off–balance sheet arrangements, including through nonconsolidated special-purpose entities ("SPEs"), which are a type of VIE, and through lending-related financial instruments (e.g., commitments and guarantees). For further discussion, see Note 19 of this Form 10-Q and Off–Balance Sheet Arrangements and Contractual Cash Obligations on pages 45–46 and Note 29 of JPMorgan Chase's 2016 Annual Report.
Special-purpose entities
The most common type of VIE is an SPE. SPEs are commonly used in securitization transactions in order to isolate certain assets and distribute the cash flows from those assets to investors. SPEs are an important part of the financial markets, including the mortgage- and asset-backed securities and commercial paper markets, as they provide market liquidity by facilitating investors' access to specific portfolios of assets and risks. The Firm holds capital, as deemed appropriate, against all SPE-related transactions and related exposures, such as derivative transactions and lending-related commitments and guarantees. For further information on the types of SPEs, see Note 13 of this Form 10-Q, and Note 1 and Note 16 of JPMorgan Chase's 2016 Annual Report.
Implications of a credit rating downgrade to JPMorgan Chase Bank, N.A.
For certain liquidity commitments to SPEs, JPMorgan Chase Bank, N.A. could be required to provide funding if its short-term credit rating were downgraded below specific levels, primarily "P-1", "A-1" and "F1" for Moody's Investors Service ("Moody's"), Standard & Poor's and Fitch, respectively. These liquidity commitments support the issuance of asset-backed commercial paper by Firm-administered consolidated SPEs. In the event of a short-term credit rating downgrade, JPMorgan Chase Bank, N.A., absent other solutions, would be required to provide funding to the SPE if the commercial paper could not be reissued as it matured. The aggregate amounts of commercial paper outstanding held by third parties as of September 30, 2017 , and December 31, 2016 , was $2.9 billion and $2.7 billion , respectively. The aggregate amounts of commercial paper issued by these SPEs could increase in future periods should clients of the Firm-administered consolidated SPEs draw down on certain unfunded lending-related commitments. These unfunded lending-related commitments were $7.3 billion and $7.4 billion at September 30, 2017 , and December 31, 2016 , respectively. The Firm could facilitate the refinancing of some of the clients' assets in order to reduce the funding
obligation. For further information, see the discussion of Firm-administered multiseller conduits in Note 13 .
The Firm also acts as liquidity provider for certain municipal bond vehicles. The Firm's obligation to perform as liquidity provider is conditional and is limited by certain termination events, which include bankruptcy or failure to pay by the municipal bond issuer and any credit enhancement provider, an event of taxability on the municipal bonds or the immediate downgrade of the municipal bond to below investment grade. See Note 13 for additional information.
Off–balance sheet lending-related financial instruments, guarantees, and other commitments
JPMorgan Chase provides lending-related financial instruments (e.g., commitments and guarantees) to meet the financing needs of its customers. The contractual amount of these financial instruments represents the maximum possible credit risk to the Firm should the counterparty draw upon the commitment or the Firm be required to fulfill its obligation under the guarantee, and should the counterparty subsequently fail to perform according to the terms of the contract. Most of these commitments and guarantees are refinanced, extended, cancelled, or expire without being drawn upon or a default occurring. As a result, the total contractual amount of these instruments is not, in the Firm's view, representative of its expected future credit exposure or funding requirements. For further discussion of lending-related financial instruments, guarantees and other commitments, and the Firm's accounting for them, see Lending-related commitments on page 62 and Note 19 . For a discussion of liabilities associated with loan sales and securitization-related indemnifications, see Note 19 .
14
EXPLANATION AND RECONCILIATION OF THE FIRM'S USE OF NON-GAAP FINANCIAL MEASURES AND KEY PERFORMANCE MEASURES |
Non-GAAP financial measures
The Firm prepares its Consolidated Financial Statements using U.S. GAAP; these financial statements appear on pages 83–87 . That presentation, which is referred to as "reported" basis, provides the reader with an understanding of the Firm's results that can be tracked consistently from year-to-year and enables a comparison of the Firm's performance with other companies' U.S. GAAP financial statements.
In addition to analyzing the Firm's results on a reported basis, management reviews Firmwide results, including the overhead ratio, on a "managed" basis; these Firmwide managed basis results are considered non-GAAP financial measures. The Firm also reviews the results of the lines of business on a managed basis. The Firm's definition of managed basis starts , in each case, with the reported U.S. GAAP results and includes certain reclassifications to present total net revenue for the Firm (and each of the reportable business segments) on a FTE basis. Accordingly, revenue from investments that receive tax credits and tax-exempt securities is presented in the managed results on a basis comparable to taxable investments and securities. These financial measures allow management to assess the comparability of revenue from year-to-year arising from
both taxable and tax-exempt sources. The corresponding income tax impact related to tax-exempt items is recorded within income tax expense. These adjustments have no impact on net income as reported by the Firm as a whole or by the lines of business.
Management also uses certain non-GAAP financial measures at the Firm and business-segment level, because these other non-GAAP financial measures provide information to investors about the underlying operational performance and trends of the Firm or of the particular business segment, as the case may be, and, therefore, facilitate a comparison of the Firm or the business segment with the performance of its relevant competitors. For additional information on these non-GAAP measures, see Business Segment Results on pages 18–40 .
Additionally, certain credit metrics and ratios disclosed by the Firm exclude PCI loans, and are therefore non-GAAP measures. For additional information on these non-GAAP measures, see Credit Risk Management on pages 49–66 .
Non-GAAP financial measures used by the Firm may not be comparable to similarly named non-GAAP financial measures used by other companies.
| Three months ended September 30, | ||||||||||||||||||||||||
| 2017 |
| 2016 | ||||||||||||||||||||||
(in millions, except ratios) | Reported |
| Fully taxable-equivalent adjustments (a) |
| Managed |
| Reported |
| Fully taxable-equivalent adjustments (a) |
| Managed | ||||||||||||||
Other income | $ | 951 | |
| $ | 555 | |
|
| $ | 1,506 | |
| $ | 782 | |
| $ | 540 | |
|
| $ | 1,322 | |
Total noninterest revenue | 12,528 | |
| 555 | |
|
| 13,083 | |
| 13,070 | |
| 540 | |
|
| 13,610 | | ||||||
Net interest income | 12,798 | |
| 319 | |
|
| 13,117 | |
| 11,603 | |
| 299 | |
|
| 11,902 | | ||||||
Total net revenue | 25,326 | |
| 874 | |
|
| 26,200 | |
| 24,673 | |
| 839 | |
|
| 25,512 | | ||||||
Pre-provision profit | 11,008 | |
| 874 | |
|
| 11,882 | |
| 10,210 | |
| 839 | |
|
| 11,049 | | ||||||
Income before income tax expense | 9,556 | |
| 874 | |
|
| 10,430 | |
| 8,939 | |
| 839 | |
|
| 9,778 | | ||||||
Income tax expense | $ | 2,824 | |
| $ | 874 | |
|
| $ | 3,698 | |
| $ | 2,653 | |
| $ | 839 | |
|
| $ | 3,492 | |
Overhead ratio | 57 | % |
| NM | |
|
| 55 | % |
| 59 | % |
| NM | |
|
| 57 | % | ||||||
|
|
|
|
|
|
|
|
|
|
|
|
|
| ||||||||||||
| Nine months ended September 30, | ||||||||||||||||||||||||
| 2017 |
| 2016 | ||||||||||||||||||||||
(in millions, except ratios) | Reported |
| Fully taxable-equivalent adjustments (a) |
| Managed |
| Reported |
| Fully taxable-equivalent adjustments (a) |
| Managed | ||||||||||||||
Other income | $ | 3,193 | |
| $ | 1,733 | |
|
| $ | 4,926 | |
| $ | 2,844 | |
| $ | 1,620 | |
|
| $ | 4,464 | |
Total noninterest revenue | 38,401 | |
| 1,733 | |
|
| 40,134 | |
| 37,962 | |
| 1,620 | |
|
| 39,582 | | ||||||
Net interest income | 37,070 | |
| 987 | |
|
| 38,057 | |
| 34,330 | |
| 897 | |
|
| 35,227 | | ||||||
Total net revenue | 75,471 | |
| 2,720 | |
|
| 78,191 | |
| 72,292 | |
| 2,517 | |
|
| 74,809 | | ||||||
Pre-provision profit | 31,628 | |
| 2,720 | |
|
| 34,348 | |
| 30,354 | |
| 2,517 | |
|
| 32,871 | | ||||||
Income before income tax expense | 27,646 | |
| 2,720 | |
|
| 30,366 | |
| 25,857 | |
| 2,517 | |
|
| 28,374 | | ||||||
Income tax expense | $ | 7,437 | |
| $ | 2,720 | |
|
| $ | 10,157 | |
| $ | 7,851 | |
| $ | 2,517 | |
|
| $ | 10,368 | |
Overhead ratio | 58 | % |
| NM | |
|
| 56 | % |
| 58 | % |
| NM | |
|
| 56 | % | ||||||
(a) Predominantly recognized in CIB and CB business segments and Corporate.
15
Net interest income excluding CIB's Markets businesses
In addition to reviewing net interest income on a managed basis, management also reviews net interest income excluding net interest income arising from CIB's Markets businesses to assess the performance of the Firm's lending, investing (including asset-liability management) and deposit-raising activities. This net interest income is referred to as non-markets related net interest income. CIB's Markets businesses represent both Fixed Income Markets and Equity Markets. Management believes that disclosure of non-markets related net interest income
provides investors and analysts with another measure by which to analyze the non-markets-related business trends of the Firm and provides a comparable measure to other financial institutions that are primarily focused on lending, investing and deposit-raising activities.
The data presented below are non-GAAP financial measures due to the exclusion of markets-related net interest income arising from CIB.
(in millions, except rates) | Three months ended September 30, |
| Nine months ended September 30, | ||||||||||||||||
2017 | | 2016 | |
| Change | |
| 2017 | 2016 |
| Change | ||||||||
Net interest income – managed basis (a)(b) | $ | 13,117 | | $ | 11,902 | |
| 10 | % |
| $ | 38,057 | | $ | 35,227 | |
| 8 | % |
Less: CIB Markets net interest income (c) | 1,070 | | 1,625 | |
| (34 | ) |
| 3,509 | | 4,703 | |
| (25 | ) | ||||
Net interest income excluding CIB Markets (a) | $ | 12,047 | | $ | 10,277 | |
| 17 | |
| $ | 34,548 | | $ | 30,524 | |
| 13 | |
|
|
|
|
|
|
|
|
|
| ||||||||||
Average interest-earning assets | $ | 2,194,174 | | $ | 2,116,493 | |
| 4 | |
| $ | 2,177,520 | | $ | 2,080,133 | |
| 5 | |
Less: Average CIB Markets interest-earning assets (c) | 544,867 | | 518,862 | |
| 5 | |
| 535,044 | | 518,989 | |
| 3 | | ||||
Average interest-earning assets excluding CIB Markets | $ | 1,649,307 | | $ | 1,597,631 | |
| 3 | % |
| $ | 1,642,476 | | $ | 1,561,144 | |
| 5 | % |
Net interest yield on average interest-earning assets – managed basis | 2.37 | % | 2.24 | % |
|
|
| 2.34 | % | 2.26 | % |
|
| ||||||
Net interest yield on average CIB Markets interest-earning assets (c) | 0.78 | | 1.25 | |
|
|
| 0.88 | | 1.21 | |
|
| ||||||
Net interest yield on average interest-earning assets excluding CIB Markets | 2.90 | % | 2.56 | % |
|
|
| 2.81 | % | 2.61 | % |
|
| ||||||
(a) | Interest includes the effect of related hedges. Taxable-equivalent amounts are used where applicable. |
(b) | For a reconciliation of net interest income on a reported and managed basis, see reconciliation from the Firm's reported U.S. GAAP results to managed basis on page 15 . |
(c) | The amounts in this table differ from the prior-period to align with CIB's Markets businesses. For further information on CIB's Markets businesses, see page 29 . |
16
Tangible common equity, ROTCE and TBVPS
Tangible common equity ("TCE"), ROTCE and TBVPS are each non-GAAP financial measures. TCE represents the Firm's common stockholders' equity (i.e., total stockholders' equity less preferred stock) less goodwill and identifiable intangible assets (other than MSRs), net of related deferred tax liabilities. ROTCE measures the Firm's net income
applicable to common equity as a percentage of average TCE. TBVPS represents the Firm's TCE at period-end divided by common shares at period-end. TCE, ROTCE, and TBVPS are utilized by the Firm, as well as investors and analysts, in assessing the Firm's use of equity.
The following summary table provides a reconciliation from the Firm's common stockholders' equity to TCE.
| Period-end |
| Average | |||||||||||||||||
(in millions, except per share and ratio data) | Sep 30, | | Dec 31, | |
| Three months ended September 30, |
| Nine months ended September 30, | ||||||||||||
| 2017 | | 2016 | |
| 2017 | | 2016 | | |||||||||||
Common stockholders' equity | $ | 232,314 | | $ | 228,122 | |
| $ | 231,861 | | $ | 226,089 | |
| $ | 229,937 | | $ | 224,034 | |
Less: Goodwill | 47,309 | | 47,288 | |
| 47,309 | | 47,302 | |
| 47,297 | | 47,314 | | ||||||
Less: Certain identifiable intangible assets | 808 | | 862 | |
| 818 | | 903 | |
| 836 | | 938 | | ||||||
Add: Deferred tax liabilities (a) | 3,271 | | 3,230 | |
| 3,262 | | 3,226 | |
| 3,243 | | 3,205 | | ||||||
Tangible common equity | $ | 187,468 | | $ | 183,202 | |
| $ | 186,996 | | $ | 181,110 | |
| $ | 185,047 | | $ | 178,987 | |
|
|
|
|
|
|
|
|
| ||||||||||||
Return on tangible common equity | NA | | NA | |
| 13 | % | 13 | % |
| 14 | % | 13 | % | ||||||
Tangible book value per share | $ | 54.03 | | $ | 51.44 | |
| NA | | NA | |
| NA | | NA | | ||||
(a) | Represents deferred tax liabilities related to tax-deductible goodwill and to identifiable intangibles created in nontaxable transactions, which are netted against goodwill and other intangibles when calculating TCE. |
Key performance measures
The Firm considers the following to be key regulatory capital measures:
▪ | Capital, risk-weighted assets ("RWA"), and capital and leverage ratios presented under Basel III Standardized and Advanced Fully Phased-In rules and |
▪ | SLR calculated under Basel III Advanced Fully Phased-In rules. |
The Firm, as well as banking regulators, investors and analysts use these measures to assess the Firm's regulatory capital position and to compare the Firm's regulatory capital to that of other financial services companies.
For additional information on these measures, see Capital Risk Management on pages 42–48 .
Core loans are also considered a key performance measure. Core loans represent loans considered central to the Firm's ongoing businesses; and exclude loans classified as trading assets, runoff portfolios, discontinued portfolios and portfolios the Firm has an intent to exit. Core loans is a measure utilized by the Firm and its investors and analysts in assessing actual growth in the loan portfolio.
17
BUSINESS SEGMENT RESULTS | ||||
The Firm is managed on a line of business basis. There are four major reportable business segments – Consumer & Community Banking, Corporate & Investment Bank, Commercial Banking and Asset & Wealth Management. In addition, there is a Corporate segment.
The business segments are determined based on the products and services provided, or the type of customer served, and they reflect the manner in which financial information is currently evaluated by management. Results of these lines of business are presented on a managed basis. For a definition of managed basis, see Explanation and Reconciliation of the Firm's use of Non-GAAP Financial Measures and Key Performance Measures on pages 15–17 .
Description of business segment reporting methodology
Results of the business segments are intended to reflect each segment as if it were a stand-alone business. The management reporting process that derives business segment results allocates income and expense using market-based methodologies. For further information about line of business capital, see Line of business equity
on page 46 .
The Firm periodically assesses the assumptions, methodologies and reporting classifications used for segment reporting, and further refinements may be implemented in future periods.
Business segment capital allocation changes
Effective January 1, 2017, the Firm's methodology used to allocate capital to the business segments was updated. Under the new methodology, capital is no longer allocated to each line of business for goodwill and other intangibles associated with acquisitions effected by the line of business. In addition, the new methodology incorporates Basel III Standardized Fully Phased-In RWA (as well as Basel III Advanced Fully Phased-In RWA), leverage, the global systemically important banks ("GSIB") surcharge, and a simulation of capital in a severe stress environment. The methodology will continue to be weighted towards Basel III Advanced Fully Phased-In RWA because the Firm believes it to be the best proxy for economic risk.
For a further discussion of those methodologies, see Business Segment Results – Description of business segment reporting methodology on pages 51–52 of JPMorgan Chase's 2016 Annual Report.
18
The following discussions of the business segment results are based on a comparison of the three and nine months ended September 30, 2017 versus the corresponding period in the prior year, unless otherwise specified.
Segment results – managed basis
The following tables summarize the business segment results for the periods indicated.
Three months ended September 30, | Total net revenue |
| Total noninterest expense |
| Pre-provision profit/(loss) | |||||||||||||||||||||
(in millions) | 2017 | | 2016 | | Change | |
| 2017 | | 2016 | | Change | |
| 2017 | | 2016 | | Change | | ||||||
Consumer & Community Banking | $ | 12,033 | | $ | 11,328 | | 6 | % |
| $ | 6,495 | | $ | 6,510 | | - | |
| $ | 5,538 | | $ | 4,818 | | 15 | % |
Corporate & Investment Bank | 8,590 | | 9,455 | | (9 | ) |
| 4,768 | | 4,934 | | (3 | ) |
| 3,822 | | 4,521 | | (15 | ) | ||||||
Commercial Banking | 2,146 | | 1,870 | | 15 | |
| 800 | | 746 | | 7 | |
| 1,346 | | 1,124 | | 20 | | ||||||
Asset & Wealth Management | 3,245 | | 3,047 | | 6 | |
| 2,181 | | 2,130 | | 2 | |
| 1,064 | | 917 | | 16 | | ||||||
Corporate | 186 | | (188 | ) | NM | |
| 74 | | 143 | | (48 | ) |
| 112 | | (331 | ) | NM | | ||||||
Total | $ | 26,200 | | $ | 25,512 | | 3 | % |
| $ | 14,318 | | $ | 14,463 | | (1 | )% |
| $ | 11,882 | | $ | 11,049 | | 8 | % |
Three months ended September 30, | Provision for credit losses |
|
| Net income/(loss) |
| Return on equity | ||||||||||||||||
(in millions, except ratios) | 2017 | | 2016 | | Change | |
| 2017 | | 2016 | | Change | |
| 2017 | | 2016 | | ||||
Consumer & Community Banking | $ | 1,517 | | $ | 1,294 | | 17 | % |
| $ | 2,553 | | $ | 2,204 | | 16 | % |
| 19 | % | 16 | % |
Corporate & Investment Bank | (26 | ) | 67 | | NM | |
| 2,546 | | 2,912 | | (13 | ) |
| 13 | | 17 | | ||||
Commercial Banking | (47 | ) | (121 | ) | 61 | |
| 881 | | 778 | | 13 | |
| 17 | | 18 | | ||||
Asset & Wealth Management | 8 | | 32 | | (75 | ) |
| 674 | | 557 | | 21 | |
| 29 | | 24 | | ||||
Corporate | - | | (1 | ) | 100 | |
| 78 | | (165 | ) | NM | |
| NM | | NM | | ||||
Total | $ | 1,452 | | $ | 1,271 | | 14 | % |
| $ | 6,732 | | $ | 6,286 | | 7 | % |
| 11 | % | 10 | % |
Nine months ended September 30, | Total net revenue |
| Total noninterest expense |
| Pre-provision profit/(loss) | ||||||||||||||||||||
(in millions) | 2017 | | 2016 | | Change |
| 2017 | | 2016 | | Change | |
| 2017 | | 2016 | | Change | | ||||||
Consumer & Community Banking | $ | 34,415 | | $ | 33,896 | | 2 |
| $ | 19,390 | | $ | 18,602 | | 4 | % |
| $ | 15,025 | | $ | 15,294 | | (2 | )% |
Corporate & Investment Bank | 27,015 | | 26,755 | | 1 |
| 14,730 | | 14,820 | | (1 | ) |
| 12,285 | | 11,935 | | 3 | | ||||||
Commercial Banking | 6,252 | | 5,490 | | 14 |
| 2,415 | | 2,190 | | 10 | |
| 3,837 | | 3,300 | | 16 | | ||||||
Asset & Wealth Management | 9,544 | | 8,958 | | 7 |
| 6,953 | | 6,303 | | 10 | |
| 2,591 | | 2,655 | | (2 | ) | ||||||
Corporate | 965 | | (290 | ) | NM |
| 355 | | 23 | | NM | |
| 610 | | (313 | ) | NM | | ||||||
Total | $ | 78,191 | | $ | 74,809 | | 5 |
| $ | 43,843 | | $ | 41,938 | | 5 | % |
| $ | 34,348 | | $ | 32,871 | | 4 | % |
Nine months ended September 30, | Provision for credit losses |
| Net income/(loss) |
| Return on equity | |||||||||||||||||
(in millions, except ratios) | 2017 | | 2016 | | Change | |
| 2017 | | 2016 | | Change | |
| 2017 | | 2016 | | ||||
Consumer & Community Banking | $ | 4,341 | | $ | 3,545 | | 22 | % |
| $ | 6,764 | | $ | 7,350 | | (8 | )% |
| 17 | % | 18 | % |
Corporate & Investment Bank | (175 | ) | 761 | | NM | |
| 8,497 | | 7,384 | | 15 | |
| 15 | | 14 | | ||||
Commercial Banking | (214 | ) | 158 | | NM | |
| 2,582 | | 1,970 | | 31 | |
| 16 | | 15 | | ||||
Asset & Wealth Management | 30 | | 37 | | (19 | ) |
| 1,683 | | 1,665 | | 1 | |
| 24 | | 24 | | ||||
Corporate | - | | (4 | ) | 100 | |
| 683 | | (363 | ) | NM | |
| NM | | NM | | ||||
Total | $ | 3,982 | | $ | 4,497 | | (11 | )% |
| $ | 20,209 | | $ | 18,006 | | 12 | % |
| 11 | % | 10 | % |
19
CONSUMER & COMMUNITY BANKING | ||||
For a discussion of the business profile of CCB, see pages 53–57 of JPMorgan Chase's 2016 Annual Report and Line of Business Metrics on page 173 .
Selected income statement data |
|
|
|
|
|
|
|
|
|
| |||||||||||
| Three months ended September 30, |
| Nine months ended September 30, | ||||||||||||||||||
(in millions, except ratios) | 2017 | |
| 2016 | |
| Change |
| 2017 | |
| 2016 | |
| Change | ||||||
Revenue |
|
|
|
|
|
|
|
|
|
|
| ||||||||||
Lending- and deposit-related fees | $ | 885 | |
| $ | 841 | |
| 5 | % |
| $ | 2,547 | |
| $ | 2,390 | |
| 7 | % |
Asset management, administration and commissions | 543 | |
| 531 | |
| 2 | |
| 1,644 | |
| 1,596 | |
| 3 | | ||||
Mortgage fees and related income | 428 | |
| 624 | |
| (31 | ) |
| 1,235 | |
| 1,980 | |
| (38 | ) | ||||
Card income | 1,141 | |
| 1,099 | |
| 4 | |
| 3,019 | |
| 3,543 | |
| (15 | ) | ||||
All other income | 901 | |
| 773 | |
| 17 | |
| 2,454 | |
| 2,303 | |
| 7 | | ||||
Noninterest revenue | 3,898 | |
| 3,868 | |
| 1 | |
| 10,899 | |
| 11,812 | |
| (8 | ) | ||||
Net interest income | 8,135 | |
| 7,460 | |
| 9 | |
| 23,516 | |
| 22,084 | |
| 6 | | ||||
Total net revenue | 12,033 | |
| 11,328 | |
| 6 | |
| 34,415 | |
| 33,896 | |
| 2 | | ||||
|
|
|
|
|
|
|
|
|
|
|
| ||||||||||
Provision for credit losses | 1,517 | |
| 1,294 | |
| 17 | |
| 4,341 | |
| 3,545 | |
| 22 | | ||||
|
|
|
|
|
|
|
|
|
|
|
| ||||||||||
Noninterest expense |
|
|
|
|
|
|
|
|
|
|
| ||||||||||
Compensation expense | 2,554 | |
| 2,453 | |
| 4 | |
| 7,598 | |
| 7,255 | |
| 5 | | ||||
Noncompensation expense (a) | 3,941 | |
| 4,057 | |
| (3 | ) |
| 11,792 | |
| 11,347 | |
| 4 | | ||||
Total noninterest expense | 6,495 | |
| 6,510 | |
| - | |
| 19,390 | |
| 18,602 | |
| 4 | | ||||
Income before income tax expense | 4,021 | |
| 3,524 | |
| 14 | |
| 10,684 | |
| 11,749 | |
| (9 | ) | ||||
Income tax expense | 1,468 | |
| 1,320 | |
| 11 | |
| 3,920 | |
| 4,399 | |
| (11 | ) | ||||
Net income | $ | 2,553 | |
| $ | 2,204 | |
| 16 | % |
| $ | 6,764 | |
| $ | 7,350 | |
| (8 | )% |
|
|
|
|
|
|
|
|
|
|
|
| ||||||||||
Revenue by line of business |
|
|
|
|
|
|
|
|
|
|
| ||||||||||
Consumer & Business Banking | $ | 5,408 | |
| $ | 4,719 | |
| 15 | |
| $ | 15,547 | |
| $ | 13,885 | |
| 12 | |
Mortgage Banking | 1,558 | |
| 1,874 | |
| (17 | ) |
| 4,513 | |
| 5,671 | |
| (20 | ) | ||||
Card, Commerce Solutions & Auto | 5,067 | |
| 4,735 | |
| 7 | |
| 14,355 | |
| 14,340 | |
| - | | ||||
|
|
|
|
|
|
|
|
|
|
|
| ||||||||||
Mortgage fees and related income details: |
|
|
|
|
|
|
|
|
|
|
| ||||||||||
Net production revenue | 158 | |
| 247 | |
| (36 | ) |
| 451 | |
| 670 | |
| (33 | ) | ||||
Net mortgage servicing revenue (b) | 270 | |
| 377 | |
| (28 | ) |
| 784 | |
| 1,310 | |
| (40 | ) | ||||
Mortgage fees and related income | $ | 428 | |
| $ | 624 | |
| (31 | )% |
| $ | 1,235 | |
| $ | 1,980 | |
| (38 | )% |
|
|
|
|
|
|
|
|
|
|
|
| ||||||||||
Financial ratios |
|
|
|
|
|
|
|
|
|
|
| ||||||||||
Return on equity | 19 | % |
| 16 | % |
|
|
| 17 | % |
| 18 | % |
|
| ||||||
Overhead ratio | 54 | |
| 57 | |
|
|
| 56 | |
| 55 | |
|
| ||||||
Note: In the discussion and the tables which follow, CCB presents certain financial measures which exclude the impact of PCI loans; these are non-GAAP financial measures.
(a) | Included operating lease depreciation expense of $688 million and $504 million for the three months ended September 30, 2017 and 2016 , respectively, and $1.9 billion and $1.4 billion for the nine months ended September 30, 2017 and 2016 , respectively. |
(b) | Included MSR risk management of $(23) million and $38 million for the three months ended September 30, 2017 and 2016 , respectively, and $(132) million and $240 million for the nine months ended September 30, 2017 and 2016, respectively. |
20
Quarterly results
Net income was $2.6 billion, an increase of 16%, driven by higher net revenue, partially offset by a higher provision for credit losses.
Net revenue was $12.0 billion, an increase of 6%.
Net interest income was $8.1 billion, up 9%, driven by deposit margin expansion, higher deposit balances and higher loan balances in Card, partially offset by loan spread compression from higher rates, including the impact of higher funding costs, in Mortgage Banking and Auto.
Noninterest revenue was $3.9 billion, up 1%, driven by higher auto lease volume and higher card- and deposit-related fees, predominantly offset by higher new account origination costs in Card, lower net production revenue reflecting lower mortgage production margins and volumes, lower MSR risk management results and lower mortgage servicing revenue as a result of a lower level of third-party loans serviced. See Note 14 for further information regarding changes in value of the MSR asset and related hedges, and mortgage fees and related income.
Noninterest expense was $6.5 billion, flat compared to prior year, as a result of:
• | two items totaling $175 million included in the prior year related to liabilities from a merchant in bankruptcy and mortgage servicing reserves, and |
• | lower marketing expense |
offset by
• | higher auto lease depreciation, and |
• | continued business growth. |
The provision for credit losses was $1.5 billion, an increase of 17% from the prior year, driven by:
• | $ 148 million of higher net charge-offs, primarily in the credit card portfolio due to seasoning of newer vintages in line with expectations, partially offset by a decrease in net charge-offs in the residential real estate portfolio reflecting continued improvement in home prices and delinquencies. The higher net charge-offs included $63 million of incremental charge-offs recorded in accordance with regulatory guidance regarding the timing of loss recognition for certain auto and residential real estate loans in bankruptcy and auto loans where assets were acquired in loan satisfaction, and |
• | a $75 million higher addition to the allowance for credit losses, primarily related to the credit card portfolio. |
Year-to-date results
Net income was $6.8 billion, a decrease of 8%, driven by a higher provision for credit losses and noninterest expense, partially offset by higher net revenue.
Net revenue was $34.4 billion, an increase of 2%.
Net interest income was $23.5 billion, up 6%, driven by higher deposit balances, higher loan balances in Card and deposit margin expansion, partially offset by loan spread compression from higher rates, including the impact of higher funding costs, in Mortgage Banking and Auto, the impact of the student loan portfolio sale and an adjustment for capitalized interest on modified loans in Mortgage Banking.
Noninterest revenue was $10.9 billion, down 8%, driven by higher new account origination costs in Card, lower MSR risk management results, the absence in the current year of a gain on the sale of Visa Europe interests and lower net production revenue reflecting lower mortgage production margins and volumes, largely offset by higher auto lease volume and higher card- and deposit-related fees.
Noninterest expense was $19.4 billion, an increase of 4%, driven by:
• | higher auto lease depreciation, and |
• | continued business growth |
partially offset by
• | two items totaling $175 million included in the prior year related to liabilities from a merchant in bankruptcy and mortgage servicing reserves. |
The provision for credit losses was $4.3 billion, an increase of 22% from the prior year, reflecting:
• | $428 million of higher net charge-offs, primarily in the credit card portfolio due to seasoning of newer vintages in line with expectations, partially offset by a decrease in net charge-offs in the residential real estate portfolio reflecting continued improvement in home prices and delinquencies, |
• | a $218 million impact related to the transfer of the student loan portfolio to held-for-sale, and |
• | a $150 million higher addition to the allowance for credit losses. |
See the Allowance for credit losses section on page 64 of this Form 10-Q for additional information regarding the consumer portfolio.
The Firm transferred the student loan portfolio to held-for-sale in the first quarter of 2017. The Firm sold substantially all of the portfolio in the second quarter of 2017, and such sale did not have a material impact on the Firm's Consolidated Financial Statements.
21
Selected metrics |
|
|
|
|
|
|
|
|
|
|
| ||||||||||
| As of or for the three months |
| As of or for the nine months | ||||||||||||||||||
(in millions, except headcount) | 2017 |
| 2016 |
| Change |
| 2017 |
| 2016 |
| Change | ||||||||||
Selected balance sheet data (period-end) |
|
|
|
|
|
|
|
|
|
|
| ||||||||||
Total assets | $ | 537,459 | |
| $ | 521,276 | |
| 3 | % |
| $ | 537,459 | |
| $ | 521,276 | |
| 3 | % |
Loans: |
|
|
|
|
|
|
|
|
|
|
| ||||||||||
Consumer & Business Banking | 25,275 | |
| 23,846 | |
| 6 | |
| 25,275 | |
| 23,846 | |
| 6 | | ||||
Home equity | 44,542 | |
| 52,445 | |
| (15 | ) |
| 44,542 | |
| 52,445 | |
| (15 | ) | ||||
Residential mortgage | 195,134 | |
| 181,564 | |
| 7 | |
| 195,134 | |
| 181,564 | |
| 7 | | ||||
Mortgage Banking | 239,676 | |
| 234,009 | |
| 2 | |
| 239,676 | |
| 234,009 | |
| 2 | | ||||
Card | 141,313 | |
| 133,435 | |
| 6 | |
| 141,313 | |
| 133,435 | |
| 6 | | ||||
Auto | 65,102 | |
| 64,512 | |
| 1 | |
| 65,102 | |
| 64,512 | |
| 1 | | ||||
Student | 47 | |
| 7,354 | |
| (99 | ) |
| 47 | |
| 7,354 | |
| (99 | ) | ||||
Total loans | 471,413 | |
| 463,156 | |
| 2 | |
| 471,413 | |
| 463,156 | |
| 2 | | ||||
Core loans | 401,648 | |
| 371,060 | |
| 8 | |
| 401,648 | |
| 371,060 | |
| 8 | | ||||
Deposits | 653,460 | |
| 605,117 | |
| 8 | |
| 653,460 | |
| 605,117 | |
| 8 | | ||||
Equity | 51,000 | |
| 51,000 | |
| - | |
| 51,000 | |
| 51,000 | |
| - | | ||||
Selected balance sheet data (average) |
|
|
|
|
|
|
|
|
|
|
| ||||||||||
Total assets | $ | 531,959 | |
| $ | 521,882 | |
| 2 | |
| $ | 530,884 | |
| $ | 512,550 | |
| 4 | |
Loans: |
|
|
|
|
|
|
|
|
|
|
| ||||||||||
Consumer & Business Banking | 25,166 | |
| 23,678 | |
| 6 | |
| 24,753 | |
| 23,227 | |
| 7 | | ||||
Home equity | 45,424 | |
| 53,501 | |
| (15 | ) |
| 47,333 | |
| 55,604 | |
| (15 | ) | ||||
Residential mortgage | 192,805 | |
| 180,669 | |
| 7 | |
| 187,954 | |
| 175,059 | |
| 7 | | ||||
Mortgage Banking | 238,229 | |
| 234,170 | |
| 2 | |
| 235,287 | |
| 230,663 | |
| 2 | | ||||
Card | 141,172 | |
| 132,713 | |
| 6 | |
| 138,852 | |
| 129,481 | |
| 7 | | ||||
Auto | 65,175 | |
| 64,068 | |
| 2 | |
| 65,321 | |
| 62,998 | |
| 4 | | ||||
Student | 58 | |
| 7,490 | |
| (99 | ) |
| 3,847 | |
| 7,759 | |
| (50 | ) | ||||
Total loans | 469,800 | |
| 462,119 | |
| 2 | |
| 468,060 | |
| 454,128 | |
| 3 | | ||||
Core loans | 398,319 | |
| 367,999 | |
| 8 | |
| 389,103 | |
| 356,072 | |
| 9 | | ||||
Deposits | 645,732 | |
| 593,671 | |
| 9 | |
| 636,257 | |
| 579,741 | |
| 10 | | ||||
Equity | 51,000 | |
| 51,000 | |
| - | |
| 51,000 | |
| 51,000 | |
| - | | ||||
|
|
|
|
|
|
|
|
|
|
|
| ||||||||||
Headcount | 134,553 | |
| 132,092 | |
| 2 | % |
| 134,553 | |
| 132,092 | |
| 2 | % | ||||
22
Selected metrics |
|
|
|
|
|
|
|
|
|
| |||||||||||
| As of or for the three months |
| As of or for the nine months | ||||||||||||||||||
(in millions, except ratio data) | 2017 | | 2016 |
| Change |
| 2017 |
| 2016 |
| Change | ||||||||||
Credit data and quality statistics |
|
|
|
|
|
|
|
|
|
|
| ||||||||||
Nonaccrual loans (a)(b) | $ | 4,068 | | | $ | 4,853 | | | (16 | )% | | $ | 4,068 | | | $ | 4,853 | | | (16 | )% |
|
|
|
|
|
|
|
|
|
|
|
| ||||||||||
Net charge-offs/(recoveries) (c)(d) |
|
|
|
|
|
|
|
|
|
|
| ||||||||||
Consumer & Business Banking | $ | 71 | |
| $ | 71 | |
| - | |
| $ | 184 | |
| $ | 180 | |
| 2 | |
Home equity | 13 | |
| 42 | |
| (69 | ) |
| 67 | |
| 136 | |
| (51 | ) | ||||
Residential mortgage | (2 | ) |
| 7 | |
| NM | |
| (3 | ) |
| 11 | |
| NM | | ||||
Mortgage Banking | 11 | |
| 49 | |
| (78 | ) |
| 64 | |
| 147 | |
| (56 | ) | ||||
Card | 1,019 | |
| 838 | |
| 22 | |
| 3,049 | |
| 2,528 | |
| 21 | | ||||
Auto | 116 | |
| 79 | |
| 47 | |
| 245 | |
| 192 | |
| 28 | | ||||
Student | - | |
| 32 | |
| NM | |
| 498 | | (i) | 98 | |
| 408 | | ||||
Total net charge-offs/(recoveries) | $ | 1,217 | |
| $ | 1,069 | |
| 14 | |
| $ | 4,040 | | (i) | $ | 3,145 | |
| 28 | |
|
|
|
|
|
|
|
|
|
|
|
| ||||||||||
Net charge-off/(recovery) rate (c)(d) |
|
|
|
|
|
|
|
|
|
|
| ||||||||||
Consumer & Business Banking | 1.12 | % |
| 1.19 | % |
|
|
| 0.99 | % |
| 1.04 | % |
|
| ||||||
Home equity (e) | 0.15 | |
| 0.42 | |
|
|
| 0.25 | |
| 0.44 | |
|
| ||||||
Residential mortgage (e) | - | |
| 0.02 | |
|
|
| - | |
| 0.01 | |
|
| ||||||
Mortgage Banking (e) | 0.02 | |
| 0.10 | |
|
|
| 0.04 | |
| 0.10 | |
|
| ||||||
Card | 2.87 | |
| 2.51 | |
|
|
| 2.94 | |
| 2.61 | |
|
| ||||||
Auto | 0.71 | |
| 0.49 | |
|
|
| 0.50 | |
| 0.41 | |
|
| ||||||
Student | - | |
| 1.70 | |
|
|
| NM | |
| 1.69 | |
|
| ||||||
Total net charge-off/(recovery) rate (e) | 1.10 | |
| 1.00 | |
|
|
| 1.25 | | (i) | 1.01 | |
|
| ||||||
|
|
|
|
|
|
|
|
|
|
|
| ||||||||||
30+ day delinquency rate |
|
|
|
|
|
|
|
|
|
|
| ||||||||||
Mortgage Banking (f)(g) | 1.03 | % |
| 1.27 | % |
|
|
| 1.03 | % |
| 1.27 | % |
|
| ||||||
Card | 1.76 | |
| 1.53 | |
|
|
| 1.76 | |
| 1.53 | |
|
| ||||||
Auto | 0.93 | |
| 1.08 | |
|
|
| 0.93 | |
| 1.08 | |
|
| ||||||
Student (h) | - | |
| 1.81 | |
|
|
| - | |
| 1.81 | |
|
| ||||||
|
|
|
|
|
|
|
|
|
|
|
| ||||||||||
90+ day delinquency rate - Card | 0.86 | |
| 0.75 | |
|
|
| 0.86 | |
| 0.75 | |
|
| ||||||
|
|
|
|
|
|
|
|
|
|
|
| ||||||||||
Allowance for loan losses |
|
|
|
|
|
|
|
|
|
|
| ||||||||||
Consumer & Business Banking | $ | 796 | |
| $ | 703 | |
| 13 | |
| $ | 796 | |
| $ | 703 | |
| 13 | |
Mortgage Banking, excluding PCI loans | 1,153 | |
| 1,488 | |
| (23 | ) |
| 1,153 | |
| 1,488 | |
| (23 | ) | ||||
Mortgage Banking - PCI loans (d) | 2,245 | |
| 2,618 | |
| (14 | ) |
| 2,245 | |
| 2,618 | |
| (14 | ) | ||||
Card | 4,684 | |
| 3,884 | |
| 21 | |
| 4,684 | |
| 3,884 | |
| 21 | | ||||
Auto | 499 | |
| 474 | |
| 5 | |
| 499 | |
| 474 | |
| 5 | | ||||
Student | - | |
| 274 | |
| NM | |
| - | |
| 274 | |
| NM | | ||||
Total allowance for loan losses (d) | $ | 9,377 | |
| $ | 9,441 | |
| (1 | )% |
| $ | 9,377 | |
| $ | 9,441 | |
| (1 | )% |
(a) | Excludes PCI loans. The Firm is recognizing interest income on each pool of PCI loans as they are all performing. |
(b) | At September 30, 2017 and 2016 , nonaccrual loans excluded loans 90 or more days past due as follows: (1) mortgage loans insured by U.S. government agencies of $4.0 billion and $5.0 billion, respectively; and (2) student loans insured by U.S. government agencies under the Federal Family Education Loan Program ("FFELP") of zero and $259 million, respectively. These amounts have been excluded based upon the government guarantee. |
(c) | Net charge-offs and net charge-off rates for the three and nine months ended September 30, 2017 included $63 million of incremental charge-offs recorded in accordance with regulatory guidance regarding the timing of loss recognition for certain auto and residential real estate loans in bankruptcy and auto loans where assets were acquired in loan satisfaction. |
(d) | Net charge-offs/(recoveries) and the net charge-off/(recovery) rates for the three months ended September 30, 2017 and 2016 , excluded $20 million and $36 million, respectively, and for nine months ended September 30, 2017 and 2016, excluded $66 million and $124 million, respectively, of write-offs in the PCI portfolio. These write-offs decreased the allowance for loan losses for PCI loans. For further information on PCI write-offs, see summary of changes in the allowances on page 65 . |
(e) | Excludes the impact of PCI loans. For the three months ended September 30, 2017 and 2016 , the net charge-off/(recovery) rates including the impact of PCI loans were as follows: (1) home equity of 0.11% and 0.31%, respectively; (2) residential mortgage of -% and 0.02%, respectively; (3) Mortgage Banking of 0.02% and 0.08%, respectively; and (4) total CCB of 1.03% and 0.92%, respectively. For the nine months ended September 30, 2017 and 2016, the net charge-off/(recovery) rates including the impact of PCI loans were as follows: (1) home equity of 0.19% and 0.33%, respectively; (2) residential mortgage of -% and 0.01%,respectively; (3) Mortgage Banking of 0.04% and 0.09%, respectively; and (4) total CCB of 1.16% and 0.93%, respectively. |
(f) | At September 30, 2017 and 2016 , excluded mortgage loans insured by U.S. government agencies of $5.9 billion and $7.0 billion, respectively, that are 30 or more days past due. These amounts have been excluded based upon the government guarantee. |
(g) | Excludes PCI loans. The 30+ day delinquency rate for PCI loans was 9.30% and 10.01% at September 30, 2017 and 2016 , respectively. |
23
(h) | Excluded student loans insured by U.S. government agencies under FFELP of $461 million at September 30, 2016 , that are 30 or more days past due. This amount has been excluded based upon the government guarantee. |
(i) | Excluding net charge-offs of $467 million related to the student loan portfolio transfer in the first quarter of 2017, the total net charge-off rate for the nine months ended September 30, 2017 would have been 1.10%. |
Selected metrics |
|
|
|
|
|
|
|
|
|
| |||||||||||
| As of or for the three months |
| As of or for the nine months | ||||||||||||||||||
(in billions, except ratios and where otherwise noted) | 2017 | |
| 2016 | |
| Change | |
| 2017 | |
| 2016 | |
| Change | | ||||
Business Metrics |
|
|
|
|
|
|
|
|
|
|
| ||||||||||
CCB households (in millions) (a) | 61.2 | |
| 60.0 | |
| 2 | % |
| 61.2 | |
| 60.0 | |
| 2 | % | ||||
Number of branches | 5,174 | |
| 5,310 | |
| (3 | ) |
| 5,174 | |
| 5,310 | |
| (3 | ) | ||||
Active digital customers (in thousands) (b) | 46,349 | |
| 43,657 | |
| 6 | |
| 46,349 | |
| 43,657 | |
| 6 | | ||||
Active mobile customers (in thousands) (c) | 29,273 | |
| 26,047 | |
| 12 | |
| 29,273 | |
| 26,047 | |
| 12 | | ||||
Debit and credit card sales volume (a) | $ | 231.1 | | | $ | 207.9 | | | 11 | |
| $ | 671.8 | | | $ | 601.6 | |
| 12 | |
|
|
|
|
|
|
|
|
|
|
|
| ||||||||||
Consumer & Business Banking |
|
|
|
|
|
|
|
|
|
|
| ||||||||||
Average deposits | $ | 630.4 | |
| $ | 576.6 | |
| 9 | |
| $ | 621.7 | |
| $ | 564.2 | |
| 10 | |
Deposit margin | 2.02 | % |
| 1.79 | % |
|
|
| 1.95 | % |
| 1.82 | % |
|
| ||||||
Business banking origination volume | $ | 1.7 | |
| $ | 1.8 | |
| (8 | ) |
| $ | 5.6 | |
| $ | 5.7 | |
| (2 | ) |
Client investment assets | 262.5 | |
| 231.6 | |
| 13 | |
| 262.5 | |
| 231.6 | |
| 13 | | ||||
|
|
|
|
|
|
|
|
|
|
|
| ||||||||||
Mortgage Banking |
|
|
|
|
|
|
|
|
|
|
| ||||||||||
Mortgage origination volume by channel |
|
|
|
|
|
|
|
|
|
|
| ||||||||||
Retail | $ | 10.6 | |
| $ | 11.7 | |
| (9 | ) |
| $ | 29.3 | |
| $ | 31.6 | |
| (7 | ) |
Correspondent | 16.3 | |
| 15.4 | |
| 6 | |
| 43.9 | |
| 42.9 | |
| 2 | | ||||
Total mortgage origination volume (d) | $ | 26.9 | |
| $ | 27.1 | |
| (1 | ) |
| $ | 73.2 | |
| $ | 74.5 | |
| (2 | ) |
|
|
|
|
|
|
|
|
|
|
|
| ||||||||||
Total loans serviced (period-end) | $ | 821.6 | |
| $ | 863.3 | |
| (5 | ) |
| $ | 821.6 | |
| $ | 863.3 | |
| (5 | ) |
Third-party mortgage loans serviced (period-end) | 556.9 | |
| 609.2 | |
| (9 | ) |
| 556.9 | |
| 609.2 | |
| (9 | ) | ||||
MSR carrying value (period-end) | 5.7 | |
| 4.9 | |
| 16 | |
| 5.7 | |
| 4.9 | |
| 16 | | ||||
Ratio of MSR carrying value (period-end) to third-party mortgage loans serviced (period-end) | 1.02 | % |
| 0.80 | % |
|
|
| 1.02 | % |
| 0.80 | % |
|
| ||||||
|
|
|
|
|
|
|
|
|
|
|
| ||||||||||
MSR revenue multiple (e) | 2.91 | x |
| 2.29 | x |
|
|
| 2.91 | x |
| 2.29 | x |
|
| ||||||
|
|
|
|
|
|
|
|
|
|
|
| ||||||||||
Card, excluding Commercial Card |
|
|
|
|
|
|
|
|
|
|
| ||||||||||
Credit card sales volume | $ | 157.7 | |
| $ | 139.2 | |
| 13 | |
| $ | 454.2 | |
| $ | 396.9 | |
| 14 | |
New accounts opened (in millions) | 1.9 | |
| 2.7 | |
| (30 | ) |
| 6.5 | |
| 7.7 | |
| (16 | ) | ||||
|
|
|
|
|
|
|
|
|
|
|
| ||||||||||
Card Services |
|
|
|
|
|
|
|
|
|
|
| ||||||||||
Net revenue rate | 10.95 | % |
| 11.04 | % |
|
|
| 10.55 | % |
| 11.70 | % |
|
| ||||||
|
|
|
|
|
|
|
|
|
|
|
| ||||||||||
Commerce Solutions |
|
|
|
|
|
|
|
|
|
|
| ||||||||||
Merchant processing volume | $ | 301.6 | |
| $ | 267.2 | |
| 13 | |
| $ | 870.3 | |
| $ | 778.5 | |
| 12 | |
|
|
|
|
|
|
|
|
|
|
|
| ||||||||||
Auto |
|
|
|
|
|
|
|
|
|
|
| ||||||||||
Loan and lease origination volume | $ | 8.8 | |
| $ | 9.3 | |
| (5 | ) |
| $ | 25.1 | |
| $ | 27.4 | |
| (8 | ) |
Average Auto operating lease assets | 15.6 | |
| 11.4 | |
| 37 | % |
| 14.7 | |
| 10.5 | |
| 40 | % | ||||
(a) | The prior period amounts have been revised to conform with the current period presentation. |
(b) | Users of all web and/or mobile platforms who have logged in within the past 90 days. |
(c) | Users of all mobile platforms who have logged in within the past 90 days. |
(d) | Firmwide mortgage origination volume was $29.2 billion and $30.9 billion for the three months ended September 30, 2017 and 2016 , respectively, and $81.0 billion and $83.9 billion for the nine months ended September 30, 2017 and 2016 , respectively. |
(e) | Represents the ratio of MSR carrying value (period-end) to third-party mortgage loans serviced (period-end) divided by the ratio of annualized loan servicing-related revenue to third-party mortgage loans serviced (average). |
24
CORPORATE & INVESTMENT BANK | ||||
Selected income statement data |
|
|
|
|
|
|
|
| |||||||||||||
| Three months ended September 30, |
| Nine months ended September 30, | ||||||||||||||||||
(in millions, except ratios) | 2017 |
| 2016 |
| Change |
| 2017 |
| 2016 |
| Change | ||||||||||
Revenue |
|
|
|
|
|
|
|
|
|
|
| ||||||||||
Investment banking fees | $ | 1,819 | |
| $ | 1,855 | |
| (2 | )% |
| $ | 5,434 | |
| $ | 4,812 | |
| 13 | % |
Principal transactions | 2,673 | |
| 3,282 | |
| (19 | ) |
| 9,108 | |
| 8,717 | |
| 4 | | ||||
Lending- and deposit-related fees | 374 | |
| 402 | |
| (7 | ) |
| 1,149 | |
| 1,181 | |
| (3 | ) | ||||
Asset management, administration and commissions | 1,041 | |
| 968 | |
| 8 | |
| 3,161 | |
| 3,062 | |
| 3 | | ||||
All other income | 187 | |
| 183 | |
| 2 | |
| 622 | |
| 927 | |
| (33 | ) | ||||
Noninterest revenue | 6,094 | |
| 6,690 | |
| (9 | ) |
| 19,474 | |
| 18,699 | |
| 4 | | ||||
Net interest income | 2,496 | |
| 2,765 | |
| (10 | ) |
| 7,541 | |
| 8,056 | |
| (6 | ) | ||||
Total net revenue (a) | 8,590 | |
| 9,455 | |
| (9 | ) |
| 27,015 | |
| 26,755 | |
| 1 | | ||||
|
|
|
|
|
|
|
|
|
|
|
| ||||||||||
Provision for credit losses | (26 | ) |
| 67 | |
| NM | |
| (175 | ) |
| 761 | |
| NM | | ||||
|
|
|
|
|
|
|
|
|
|
|
| ||||||||||
Noninterest expense |
|
|
|
|
|
|
|
|
|
|
| ||||||||||
Compensation expense | 2,286 | |
| 2,513 | |
| (9 | ) |
| 7,537 | |
| 7,850 | |
| (4 | ) | ||||
Noncompensation expense | 2,482 | |
| 2,421 | |
| 3 | |
| 7,193 | |
| 6,970 | |
| 3 | | ||||
Total noninterest expense | 4,768 | |
| 4,934 | |
| (3 | ) |
| 14,730 | |
| 14,820 | |
| (1 | ) | ||||
Income before income tax expense | 3,848 | |
| 4,454 | |
| (14 | ) |
| 12,460 | |
| 11,174 | |
| 12 | | ||||
Income tax expense | 1,302 | |
| 1,542 | |
| (16 | ) |
| 3,963 | |
| 3,790 | |
| 5 | | ||||
Net income | $ | 2,546 | |
| $ | 2,912 | |
| (13 | )% |
| $ | 8,497 | |
| $ | 7,384 | |
| 15 | % |
Financial ratios |
|
|
|
|
|
|
|
|
|
|
| ||||||||||
Return on equity | 13 | % |
| 17 | % |
|
|
| 15 | % |
| 14 | % |
|
| ||||||
Overhead ratio | 56 | |
| 52 | |
|
|
| 55 | |
| 55 | |
|
| ||||||
Compensation to revenue ratio | 27 | |
| 27 | |
|
|
| 28 | |
| 29 | |
|
| ||||||
(a) | Included tax-equivalent adjustments, predominantly due to income tax credits related to alternative energy investments; income tax credits and amortization of the cost of investments in affordable housing projects; and tax-exempt income from municipal bonds of $505 million and $483 million for the three months ended September 30, 2017 and 2016, respectively, and $1.6 billion and $1.5 billion for the nine months ended September 30, 2017 and 2016, respectively. |
Selected income statement data |
|
|
|
|
|
|
|
| |||||||||||||
| Three months ended September 30, |
| Nine months ended September 30, | ||||||||||||||||||
(in millions) | 2017 |
| 2016 |
| Change |
| 2017 |
| 2016 |
| Change | ||||||||||
Revenue by business |
|
|
|
|
|
|
|
|
|
|
| ||||||||||
Investment Banking | $ | 1,705 | |
| $ | 1,740 | |
| (2 | )% |
| $ | 5,051 | |
| $ | 4,463 | |
| 13 | % |
Treasury Services | 1,058 | |
| 917 | |
| 15 | |
| 3,094 | |
| 2,693 | |
| 15 | | ||||
Lending | 331 | |
| 283 | |
| 17 | |
| 1,093 | |
| 862 | |
| 27 | | ||||
Total Banking | 3,094 | |
| 2,940 | |
| 5 | |
| 9,238 | |
| 8,018 | |
| 15 | | ||||
Fixed Income Markets | 3,164 | |
| 4,334 | |
| (27 | ) |
| 10,595 | |
| 11,890 | |
| (11 | ) | ||||
Equity Markets | 1,363 | |
| 1,414 | |
| (4 | ) |
| 4,555 | |
| 4,590 | |
| (1 | ) | ||||
Securities Services | 1,007 | |
| 916 | |
| 10 | |
| 2,905 | |
| 2,704 | |
| 7 | | ||||
Credit Adjustments & Other (a) | (38 | ) |
| (149 | ) |
| 74 | |
| (278 | ) |
| (447 | ) |
| 38 | | ||||
Total Markets & Investor Services | 5,496 | |
| 6,515 | |
| (16 | ) |
| 17,777 | |
| 18,737 | |
| (5 | ) | ||||
Total net revenue | $ | 8,590 | |
| $ | 9,455 | |
| (9 | )% |
| $ | 27,015 | |
| $ | 26,755 | |
| 1 | % |
(a) | Consists primarily of credit valuation adjustments ("CVA") managed centrally within CIB, funding valuation adjustments ("FVA") and debit valuation adjustments ("DVA") on derivatives. Results are primarily reported in principal transactions revenue. Results are presented net of associated hedging activities and net of CVA and FVA amounts allocated to Fixed Income Markets and Equity Markets. For additional information, see Accounting and Reporting Developments on pages 80–81 , and Notes 2 , 3 and 17 . |
25
Quarterly results
Net income was $2.5 billion, down 13%, reflecting lower net revenue, partially offset by lower noninterest expense and a lower provision for credit losses.
Net revenue was $8.6 billion, down 9%.
Banking revenue was $3.1 billion, up 5%. Investment banking revenue was $1.7 billion, down 2%, driven by lower equity and debt underwriting fees, largely offset by higher advisory fees. The Firm maintained its #1 ranking for Global Investment Banking fees, according to Dealogic. Equity underwriting fees were $293 million, down 21%, driven by a lower share of fees compared to a strong prior year. Debt underwriting fees were $906 million, down 4% compared to a strong prior year, primarily driven by declines in industry-wide fees. Advisory fees were $620 million, up 14%, driven by a higher number of completed transactions. Treasury Services revenue was $1.1 billion, up 15%, driven by the impact of higher interest rates and growth in operating deposits. Lending revenue was $331 million, up 17%, reflecting lower fair value losses on hedges of accrual loans.
Markets & Investor Services revenue was $5.5 billion, down 16%. Fixed Income Markets revenue was $3.2 billion, down 27%, as lower revenue across products was driven by sustained low volatility and tighter credit spreads, against a very strong prior year. Equity Markets revenue was $1.4 billion, down 4% compared to a strong prior year, driven by lower revenue in derivatives predominantly due to low volatility offset by higher revenue in Prime Services and Cash Equities. Securities Services revenue was $1.0 billion, up 10%, driven by the impact of higher interest rates and deposit growth, as well as higher asset-based fees driven by higher market levels.
The provision for credit losses was a benefit of $26 million. The prior year was an expense of $67 million, which included an addition to the allowance for credit losses driven by the Oil & Gas portfolio.
Noninterest expense was $4.8 billion, down 3%, driven by lower performance-based compensation expense.
Year-to-date results
Net income was $8.5 billion, up 15%, reflecting a lower provision for credit losses, higher net revenue and a tax benefit resulting from the vesting of employee-based stock awards.
Net revenue was $27.0 billion, relatively flat.
Banking revenue was $9.2 billion, up 15%. Investment banking revenue was $5.1 billion, up 13%, primarily driven by higher debt and equity underwriting fees. The Firm maintained its #1 ranking for Global Investment Banking fees, according to Dealogic. Debt underwriting fees were $2.8 billion, up 17%, driven by a higher share of fees and an overall increase in industry-wide fees. Equity underwriting fees were $1.1 billion, up 23%, driven by growth in industry-wide issuance including a strong IPO market. Advisory fees were $1.6 billion, up 2%. Treasury Services revenue was $3.1 billion, up 15%, driven by the impact of higher interest rates and growth in operating deposits. Lending revenue was $1.1 billion, up 27%, reflecting lower fair value losses on hedges of accrual loans.
Markets & Investor Services revenue was $17.8 billion, down 5%. Fixed Income Markets revenue was $10.6 billion, down 11%, as lower revenue across products was driven by sustained low volatility and tighter credit spreads, against a strong prior year. Equity Markets revenue was $4.6 billion, down 1%, driven by lower revenue in derivatives offset by higher revenue in Prime Services and Cash Equities. Securities Services revenue was $2.9 billion, up 7%, driven by the impact of higher interest rates and deposit growth, as well as higher asset-based fees driven by higher market levels. Credit Adjustments & Other was a loss of $278 million, largely driven by valuation adjustments.
The provision for credit losses was a benefit of $175 million, which included a net reduction in the allowance for credit losses driven by the Oil & Gas and Metals & Mining portfolios. The prior year was an expense of $761 million, which included an addition to the allowance for credit losses driven by the Oil & Gas and Metals & Mining portfolios.
Noninterest expense was $14.7 billion, down 1%.
26
Selected metrics |
|
|
|
|
|
|
|
|
|
| |||||||||||
| As of or for the three months |
| As of or for the nine months | ||||||||||||||||||
(in millions, except headcount) | 2017 |
| 2016 |
| Change |
| 2017 |
| 2016 |
| Change | ||||||||||
Selected balance sheet data (period-end) |
|
|
|
|
|
|
|
|
|
|
| ||||||||||
Assets | $ | 851,808 | |
| $ | 825,933 | |
| 3 | % |
| $ | 851,808 | |
| $ | 825,933 | |
| 3 | % |
Loans: |
|
|
|
|
|
|
|
|
|
|
| ||||||||||
Loans retained (a) | 106,955 | |
| 117,133 | |
| (9 | ) |
| 106,955 | |
| 117,133 | |
| (9 | ) | ||||
Loans held-for-sale and loans at fair value | 3,514 | |
| 4,184 | |
| (16 | ) |
| 3,514 | |
| 4,184 | |
| (16 | ) | ||||
Total loans | 110,469 | |
| 121,317 | |
| (9 | ) |
| 110,469 | |
| 121,317 | |
| (9 | ) | ||||
Core loans | 110,133 | |
| 120,885 | |
| (9 | ) |
| 110,133 | |
| 120,885 | |
| (9 | ) | ||||
Equity | 70,000 | |
| 64,000 | |
| 9 | |
| 70,000 | |
| 64,000 | |
| 9 | | ||||
Selected balance sheet data (average) |
|
|
|
|
|
|
|
|
|
|
| ||||||||||
Assets | $ | 858,912 | |
| $ | 811,217 | |
| 6 | |
| $ | 853,948 | |
| $ | 808,228 | |
| 6 | |
Trading assets-debt and equity instruments | 349,448 | |
| 306,431 | |
| 14 | |
| 343,232 | |
| 299,350 | |
| 15 | | ||||
Trading assets-derivative receivables | 55,875 | |
| 63,829 | |
| (12 | ) |
| 56,575 | |
| 62,619 | |
| (10 | ) | ||||
Loans: |
|
|
|
|
|
|
|
|
|
|
| ||||||||||
Loans retained (a) | $ | 107,829 | |
| $ | 110,941 | |
| (3 | ) |
| $ | 108,741 | |
| $ | 110,442 | |
| (2 | ) |
Loans held-for-sale and loans at fair value | 4,674 | |
| 3,864 | |
| 21 | |
| 5,254 | |
| 3,414 | |
| 54 | | ||||
Total loans | $ | 112,503 | |
| $ | 114,805 | |
| (2 | ) |
| $ | 113,995 | |
| $ | 113,856 | |
| - | |
Core loans | 112,168 | |
| 114,380 | |
| (2 | ) |
| 113,631 | |
| 113,410 | |
| - | | ||||
Equity | 70,000 | |
| 64,000 | |
| 9 | |
| 70,000 | |
| 64,000 | |
| 9 | | ||||
Headcount | 50,641 | |
| 49,176 | |
| 3 | % |
| 50,641 | |
| 49,176 | |
| 3 | % | ||||
(a) | Loans retained includes credit portfolio loans, loans held by consolidated Firm-administered multi-seller conduits, trade finance loans, other held-for-investment loans and overdrafts. |
Selected metrics |
|
|
|
|
|
|
|
|
|
|
| ||||||||||
| As of or for the three months |
| As of or for the nine months | ||||||||||||||||||
(in millions, except ratios) | 2017 |
| 2016 |
| Change |
| 2017 |
| 2016 |
| Change | ||||||||||
Credit data and quality statistics |
|
|
|
|
|
|
|
|
|
|
| ||||||||||
Net charge-offs/(recoveries) | $ | 20 | |
| $ | 3 | |
| NM | |
| $ | 49 | |
| $ | 139 | |
| (65 | )% |
Nonperforming assets: |
|
|
|
|
|
|
|
|
|
|
| ||||||||||
Nonaccrual loans: |
|
|
|
|
|
|
|
|
|
|
| ||||||||||
Nonaccrual loans retained (a) | $ | 437 | |
| $ | 614 | |
| (29 | )% |
| $ | 437 | |
| $ | 614 | |
| (29 | ) |
Nonaccrual loans held-for-sale and loans at fair value | 2 | |
| 26 | |
| (92 | ) |
| 2 | |
| 26 | |
| (92 | ) | ||||
Total nonaccrual loans | 439 | |
| 640 | |
| (31 | ) |
| 439 | |
| 640 | |
| (31 | ) | ||||
Derivative receivables | 164 | |
| 232 | |
| (29 | ) |
| 164 | |
| 232 | |
| (29 | ) | ||||
Assets acquired in loan satisfactions | 92 | |
| 75 | |
| 23 | |
| 92 | |
| 75 | |
| 23 | | ||||
Total nonperforming assets | $ | 695 | |
| $ | 947 | |
| (27 | ) |
| $ | 695 | |
| $ | 947 | |
| (27 | ) |
Allowance for credit losses: |
|
|
|
|
|
|
|
|
|
|
| ||||||||||
Allowance for loan losses | $ | 1,253 | |
| $ | 1,611 | |
| (22 | ) |
| $ | 1,253 | |
| $ | 1,611 | |
| (22 | ) |
Allowance for lending-related commitments | 745 | |
| 837 | |
| (11 | ) |
| 745 | |
| 837 | |
| (11 | ) | ||||
Total allowance for credit losses | $ | 1,998 | |
| $ | 2,448 | |
| (18 | )% |
| $ | 1,998 | |
| $ | 2,448 | |
| (18 | )% |
Net charge-off/(recovery) rate (b) | 0.07 | % |
| 0.01 | % |
|
|
| 0.06 | % |
| 0.17 | % |
|
| ||||||
Allowance for loan losses to period-end loans retained | 1.17 | |
| 1.38 | |
|
|
| 1.17 | |
| 1.38 | |
|
| ||||||
Allowance for loan losses to period-end loans retained, excluding trade finance and conduits (c) | 1.79 | |
| 2.02 | |
|
|
| 1.79 | |
| 2.02 | |
|
| ||||||
Allowance for loan losses to nonaccrual loans retained (a) | 287 | |
| 262 | |
|
|
| 287 | |
| 262 | |
|
| ||||||
Nonaccrual loans to total period-end loans | 0.40 | % |
| 0.53 | % |
|
|
| 0.40 | % |
| 0.53 | % |
|
| ||||||
(a) | Allowance for loan losses of $177 million and $202 million were held against these nonaccrual loans at September 30, 2017 and 2016, respectively. |
(b) | Loans held-for-sale and loans at fair value were excluded when calculating the net charge-off/(recovery) rate. |
(c) | Management uses allowance for loan losses to period-end loans retained, excluding trade finance and conduits, a non-GAAP financial measure, to provide a more meaningful assessment of CIB's allowance coverage ratio. |
27
Investment banking fees |
|
|
|
|
|
|
|
|
|
| |||||||||||
| Three months ended September 30, |
| Nine months ended September 30, | ||||||||||||||||||
(in millions) | 2017 |
| 2016 |
| Change |
| 2017 |
| 2016 |
| Change | ||||||||||
Advisory | $ | 620 | |
| $ | 542 | |
| 14 | % |
| $ | 1,624 | |
| $ | 1,593 | |
| 2 | % |
Equity underwriting | 293 | |
| 370 | |
| (21 | ) |
| 1,054 | |
| 860 | |
| 23 | | ||||
Debt underwriting (a) | 906 | |
| 943 | |
| (4 | ) |
| 2,756 | |
| 2,359 | |
| 17 | | ||||
Total investment banking fees | $ | 1,819 | |
| $ | 1,855 | |
| (2 | )% |
| $ | 5,434 | |
| $ | 4,812 | |
| 13 | % |
(a) | Includes loans syndication. |
League table results – wallet share |
|
|
|
| |||||||
| Nine months ended September 30, 2017 |
| Full-year 2016 | ||||||||
| Rank | Share |
| Rank | Share | ||||||
Based on fees (a) |
|
|
|
|
|
|
| ||||
Debt, equity and equity-related |
|
|
|
|
|
|
| ||||
Global | # | 1 | |
| 7.5 |
| # | 1 | |
| 7.1 |
U.S. | 1 | |
| 11.0 |
| 1 | |
| 11.9 | ||
Long-term debt (b) |
|
|
|
|
|
|
| ||||
Global | 1 | |
| 7.6 |
| 1 | |
| 6.8 | ||
U.S. | 2 | |
| 10.8 |
| 2 | |
| 11.1 | ||
Equity and equity-related (c) |
|
|
|
|
|
|
| ||||
Global | 1 | |
| 7.4 |
| 1 | |
| 7.6 | ||
U.S. | 1 | |
| 11.4 |
| 1 | |
| 13.3 | ||
M&A (d) |
|
|
|
|
|
|
| ||||
Global | 2 | |
| 8.7 |
| 2 | |
| 8.3 | ||
U.S. | 2 | |
| 9.0 |
| 2 | |
| 9.8 | ||
Loan syndications |
|
|
|
|
|
|
| ||||
Global | 1 | |
| 9.4 |
| 1 | |
| 9.4 | ||
U.S. | 1 | |
| 11.0 |
| 2 | |
| 11.9 | ||
Global investment banking fees (e) | # | 1 | |
| 8.2 |
| # | 1 | |
| 8.0 |
(a) | Source: Dealogic as of October 1, 2017. Reflects the ranking of revenue wallet and market share. |
(b) | Long-term debt rankings include investment-grade, high-yield, supranationals, sovereigns, agencies, covered bonds, asset-backed securities ("ABS") and mortgage-backed securities ("MBS"); and exclude money market, short-term debt, and U.S. municipal securities. |
(c) | Global equity and equity-related ranking includes rights offerings and Chinese A-Shares. |
(d) | Global M&A reflect the removal of any withdrawn transactions. U.S. M&A revenue wallet represents wallet from client parents based in the U.S. |
(e) | Global investment banking fees exclude money market, short-term debt and shelf deals. |
28
Markets revenue
The following table summarizes select income statement data for the Markets businesses. Markets includes both Fixed Income Markets and Equity Markets. Markets revenue comprises principal transactions, fees, commissions and other income, as well as net interest income. The Firm assesses its Markets business performance on a total revenue basis, as offsets may occur across revenue line items. For example, securities that generate net interest income may be risk-managed by derivatives that are recorded in principal transactions. For a description of the composition of these income statement line items, see Notes 5 and 6 .
Principal transactions reflects revenue on financial instruments and commodities transactions that arise from client-driven market making activity. Principal transactions revenue includes amounts recognized upon executing new transactions with market participants, as well as "inventory-related revenue", which is revenue recognized from gains and losses on derivatives and other instruments that the
Firm has been holding in anticipation of, or in response to, client demand, and changes in the fair value of instruments used by the Firm to actively manage the risk exposure arising from such inventory. Principal transactions revenue recognized upon executing new transactions with market participants is driven by many factors including the level of client activity, the bid-offer spread (which is the difference between the price at which a market participant is willing to sell an instrument to the Firm and the price at which another market participant is willing to buy it from the Firm, and vice versa), market liquidity and volatility. These factors are interrelated and sensitive to the same factors that drive inventory-related revenue, which include general market conditions, such as interest rates, foreign exchange rates, credit spreads, and equity and commodity prices, as well as other macroeconomic conditions. For the periods presented below, the predominant source of principal transactions revenue was the amount recognized upon executing new transactions.
| Three months ended September 30, |
| Three months ended September 30, | ||||||||||||||||
| 2017 |
| 2016 | ||||||||||||||||
(in millions) | Fixed Income Markets | Equity Markets | Total Markets |
| Fixed Income Markets | Equity Markets | Total Markets | ||||||||||||
Principal transactions | $ | 1,837 | | $ | 948 | | $ | 2,785 | |
| $ | 2,622 | | $ | 843 | | $ | 3,465 | |
Lending- and deposit-related fees | 47 | | 2 | | 49 | |
| 55 | | - | | 55 | | ||||||
Asset management, administration and commissions | 93 | | 397 | | 490 | |
| 95 | | 347 | | 442 | | ||||||
All other income | 121 | | 12 | | 133 | |
| 184 | | (23 | ) | 161 | | ||||||
Noninterest revenue | 2,098 | | 1,359 | | 3,457 | |
| 2,956 | | 1,167 | | 4,123 | | ||||||
Net interest income (a) | 1,066 | | 4 | | 1,070 | |
| 1,378 | | 247 | | 1,625 | | ||||||
Total net revenue | $ | 3,164 | | $ | 1,363 | | $ | 4,527 | |
| $ | 4,334 | | $ | 1,414 | | $ | 5,748 | |
| Nine months ended September 30, |
| Nine months ended September 30, | ||||||||||||||||
| 2017 |
| 2016 | ||||||||||||||||
(in millions) | Fixed Income Markets | Equity Markets | Total Markets |
| Fixed Income Markets | Equity Markets | Total Markets | ||||||||||||
Principal transactions | $ | 6,389 | | $ | 3,066 | | $ | 9,455 | |
| $ | 6,699 | | $ | 2,651 | | $ | 9,350 | |
Lending- and deposit-related fees | 144 | | 4 | | 148 | |
| 164 | | 1 | | 165 | | ||||||
Asset management, administration and commissions | 300 | | 1,230 | | 1,530 | |
| 299 | | 1,160 | | 1,459 | | ||||||
All other income | 505 | | 3 | | 508 | |
| 805 | | (2 | ) | 803 | | ||||||
Noninterest revenue | 7,338 | | 4,303 | | 11,641 | |
| 7,967 | | 3,810 | | 11,777 | | ||||||
Net interest income (a) | 3,257 | | 252 | | 3,509 | |
| 3,923 | | 780 | | 4,703 | | ||||||
Total net revenue | $ | 10,595 | | $ | 4,555 | | $ | 15,150 | |
| $ | 11,890 | | $ | 4,590 | | $ | 16,480 | |
Selected metrics |
|
|
|
|
|
|
|
|
|
|
| ||||||||
| As of or for the three months |
| As of or for the nine months | ||||||||||||||||
(in millions, except where otherwise noted) | 2017 |
| 2016 |
| Change |
| 2017 |
| 2016 |
| Change | ||||||||
Assets under custody ("AUC") by asset class (period-end) (in billions): |
|
|
|
|
|
|
|
|
|
|
| ||||||||
Fixed Income | $ | 12,878 | | | $ | 12,857 | |
| - |
| $ | 12,878 | |
| $ | 12,857 | |
| - |
Equity | 7,439 | | | 6,440 | |
| 16 |
| 7,439 | |
| 6,440 | |
| 16 | ||||
Other (b) | 2,421 | | | 1,927 | |
| 26 |
| 2,421 | |
| 1,927 | |
| 26 | ||||
Total AUC | $ | 22,738 | | | $ | 21,224 | |
| 7 |
| $ | 22,738 | |
| $ | 21,224 | |
| 7 |
Client deposits and other third party liabilities (average) (c) | $ | 421,588 | | | $ | 381,542 | |
| 10 |
| $ | 406,184 | |
| $ | 371,417 | |
| 9 |
Trade finance loans (period-end) | 17,171 | | | 16,957 | |
| 1 |
| 17,171 | |
| 16,957 | |
| 1 | ||||
(a) | Declines in Markets net interest income were driven by higher funding costs. |
(b) | Consists of mutual funds, unit investment trusts, currencies, annuities, insurance contracts, options and other contracts. |
(c) | Client deposits and other third party liabilities pertain to the Treasury Services and Securities Services businesses. |
29
International metrics |
|
|
|
|
|
|
|
|
|
|
| ||||||||||
| As of or for the three months |
| As of or for the nine months | ||||||||||||||||||
(in millions, except where otherwise noted) | 2017 |
| 2016 |
| Change |
| 2017 |
| 2016 |
| Change | ||||||||||
Total net revenue (a) |
|
|
|
|
|
|
|
|
|
|
| ||||||||||
Europe/Middle East/Africa | $ | 2,751 | |
| $ | 2,798 | |
| (2 | )% |
| $ | 8,974 | |
| $ | 8,078 | |
| 11 | % |
Asia/Pacific | 1,169 | |
| 1,281 | |
| (9 | ) |
| 3,442 | |
| 3,793 | |
| (9 | ) | ||||
Latin America/Caribbean | 329 | |
| 307 | |
| 7 | |
| 914 | |
| 1,031 | |
| (11 | ) | ||||
Total international net revenue | 4,249 | |
| 4,386 | |
| (3 | ) |
| 13,330 | |
| 12,902 | |
| 3 | | ||||
North America | 4,341 | |
| 5,069 | |
| (14 | ) |
| 13,685 | |
| 13,853 | |
| (1 | ) | ||||
Total net revenue | $ | 8,590 | |
| $ | 9,455 | |
| (9 | ) |
| $ | 27,015 | |
| $ | 26,755 | |
| 1 | |
|
|
|
|
|
|
|
|
|
|
|
| ||||||||||
Loans retained (period-end) (a) |
|
|
|
|
|
|
|
|
|
|
| ||||||||||
Europe/Middle East/Africa | $ | 25,677 | |
| $ | 32,016 | |
| (20 | ) |
| $ | 25,677 | |
| $ | 32,016 | |
| (20 | ) |
Asia/Pacific | 13,398 | |
| 15,262 | |
| (12 | ) |
| 13,398 | |
| 15,262 | |
| (12 | ) | ||||
Latin America/Caribbean | 6,737 | |
| 8,896 | |
| (24 | ) |
| 6,737 | |
| 8,896 | |
| (24 | ) | ||||
Total international loans | 45,812 | |
| 56,174 | |
| (18 | ) |
| 45,812 | |
| 56,174 | |
| (18 | ) | ||||
North America | 61,143 | |
| 60,959 | |
| - | |
| 61,143 | |
| 60,959 | |
| - | | ||||
Total loans retained | $ | 106,955 | |
| $ | 117,133 | |
| (9 | ) |
| $ | 106,955 | |
| $ | 117,133 | |
| (9 | ) |
|
|
|
|
|
|
|
|
|
|
|
| ||||||||||
Client deposits and other third-party liabilities (average) (a)(b) |
|
|
|
|
|
|
|
|
|
|
| ||||||||||
Europe/Middle East/Africa | $ | 160,778 | |
| $ | 138,628 | |
| 16 | |
| $ | 154,259 | |
| $ | 135,201 | |
| 14 | |
Asia/Pacific | 78,334 | |
| 70,301 | |
| 11 | |
| 75,284 | |
| 67,158 | |
| 12 | | ||||
Latin America/Caribbean | 25,236 | |
| 22,802 | |
| 11 | |
| 25,126 | |
| 22,555 | |
| 11 | | ||||
Total international | $ | 264,348 | |
| $ | 231,731 | |
| 14 | |
| $ | 254,669 | |
| $ | 224,914 | |
| 13 | |
North America | 157,240 | |
| 149,811 | |
| 5 | |
| 151,515 | |
| 146,503 | |
| 3 | | ||||
Total client deposits and other third-party liabilities | $ | 421,588 | |
| $ | 381,542 | |
| 10 | |
| $ | 406,184 | |
| $ | 371,417 | |
| 9 | |
|
|
|
|
|
|
|
|
|
|
|
| ||||||||||
AUC (period-end) (a) (in billions) |
|
|
|
|
|
|
|
|
|
|
| ||||||||||
North America | $ | 13,574 | |
| $ | 12,685 | |
| 7 | |
| $ | 13,574 | |
| $ | 12,685 | |
| 7 | |
All other regions | 9,164 | |
| 8,539 | |
| 7 | |
| 9,164 | |
| 8,539 | |
| 7 | | ||||
Total AUC | $ | 22,738 | |
| $ | 21,224 | |
| 7 | % |
| $ | 22,738 | |
| $ | 21,224 | |
| 7 | % |
(a) | Total net revenue is based predominantly on the domicile of the client or location of the trading desk, as applicable. Loans outstanding (excluding loans held-for-sale and loans at fair value), client deposits and other third-party liabilities, and AUC are based predominantly on the domicile of the client. |
(b) | Client deposits and other third party liabilities pertain to the Treasury Services and Securities Services businesses. |
30
COMMERCIAL BANKING | ||||
For a discussion of the business profile of CB, see pages 63–65 of JPMorgan Chase's 2016 Annual Report and Line of Business Metrics on page 174 .
Selected income statement data |
|
|
|
|
|
| |||||||||||||||
| Three months ended September 30, |
| Nine months ended September 30, | ||||||||||||||||||
(in millions) | 2017 | |
| 2016 | |
| Change | |
| 2017 | |
| 2016 | |
| Change | |||||
Revenue |
|
|
|
|
|
|
|
|
|
|
| ||||||||||
Lending- and deposit-related fees | $ | 223 | |
| $ | 228 | |
| (2 | )% |
| $ | 690 | |
| $ | 687 | |
| - | % |
Asset management, administration and commissions | 16 | |
| 14 | |
| 14 | |
| 50 | |
| 54 | |
| (7 | ) | ||||
All other income (a) | 353 | |
| 336 | |
| 5 | |
| 1,034 | |
| 979 | |
| 6 | | ||||
Noninterest revenue | 592 | |
| 578 | |
| 2 | |
| 1,774 | |
| 1,720 | |
| 3 | | ||||
Net interest income | 1,554 | |
| 1,292 | |
| 20 | |
| 4,478 | |
| 3,770 | |
| 19 | | ||||
Total net revenue (b) | 2,146 | |
| 1,870 | |
| 15 | |
| 6,252 | |
| 5,490 | |
| 14 | | ||||
|
|
|
|
|
|
|
|
|
|
|
| ||||||||||
Provision for credit losses | (47 | ) |
| (121 | ) |
| 61 | |
| (214 | ) |
| 158 | |
| NM | | ||||
|
|
|
|
|
|
|
|
|
|
|
| ||||||||||
Noninterest expense |
|
|
|
|
|
|
|
|
|
|
| ||||||||||
Compensation expense | 370 | |
| 343 | |
| 8 | |
| 1,106 | |
| 999 | |
| 11 | | ||||
Noncompensation expense | 430 | |
| 403 | |
| 7 | |
| 1,309 | |
| 1,191 | |
| 10 | | ||||
Total noninterest expense | 800 | |
| 746 | |
| 7 | |
| 2,415 | |
| 2,190 | |
| 10 | | ||||
|
|
|
|
|
|
|
|
|
|
|
| ||||||||||
Income before income tax expense | 1,393 | |
| 1,245 | |
| 12 | |
| 4,051 | |
| 3,142 | |
| 29 | | ||||
Income tax expense | 512 | |
| 467 | |
| 10 | |
| 1,469 | |
| 1,172 | |
| 25 | | ||||
Net income | $ | 881 | |
| $ | 778 | |
| 13 | % |
| $ | 2,582 | |
| $ | 1,970 | |
| 31 | % |
(a) | Includes revenue from investment banking products and commercial card transactions. |
(b) | Total net revenue included tax-equivalent adjustments from income tax credits related to equity investments in designated community development entities that provide loans to qualified businesses in low-income communities, as well as tax-exempt income related to municipal financing activities of $143 million and $127 million for the three months ended September 30, 2017 and 2016 , respectively, and $395 million and $371 million for the nine months ended September 30, 2017 and 2016 , respectively. |
Quarterly results
Net income was $881 million, an increase of 13%, driven by higher net revenue, partially offset by a lower net benefit for credit losses and higher noninterest expense.
Net revenue was $2.1 billion, an increase of 15%. Net interest income was $1.6 billion, an increase of 20%, driven by higher deposit spreads and loan growth.
Noninterest expense was $800 million, an increase of 7%, largely driven by hiring of bankers and business-related support staff, and investments in technology.
The provision for credit losses was a benefit of $47 million, driven by net reductions in the allowance for credit losses, largely in the Real Estate portfolio . The prior year provision for credit losses was a benefit of $121 million driven by net reductions in the allowance for credit losses largely in the Oil & Gas portfolio.
Year-to-date results
Net income was $2.6 billion, an increase of 31%, driven by higher net revenue and a lower provision for credit losses, partially offset by higher noninterest expense.
Net revenue was $6.3 billion, up 14%. Net interest income was $4.5 billion, up 19%, driven by higher deposit spreads and loan growth. Noninterest revenue was $1.8 billion, up 3%, driven by higher investment banking revenue from loan syndications and equity underwriting.
Noninterest expense was $2.4 billion, up 10%, largely driven by hiring of bankers and business-related support staff, and investments in technology.
The provision for credit losses was a benefit of $214 million, driven by net reductions in the allowance for credit losses, including in the Oil & Gas, Natural Gas Pipelines and Metals & Mining portfolios. The prior year provision for credit losses was $158 million reflecting net additions to the allowance for credit losses for downgrades in the Oil & Gas and Natural Gas Pipeline portfolios.
31
Selected income statement data (continued) |
|
|
|
|
|
| |||||||||||||||
| Three months ended September 30, |
| Nine months ended September 30, | ||||||||||||||||||
(in millions, except ratios) | 2017 | |
| 2016 | |
| Change | |
| 2017 | |
| 2016 | |
| Change | |||||
Revenue by product |
|
|
|
|
|
|
|
|
|
|
| ||||||||||
Lending | $ | 1,030 | |
| $ | 956 | |
| 8 | % |
| $ | 3,045 | |
| $ | 2,801 | |
| 9 | % |
Treasury services | 873 | |
| 693 | |
| 26 | |
| 2,523 | |
| 2,067 | |
| 22 | | ||||
Investment banking (a) | 196 | |
| 203 | |
| (3 | ) |
| 601 | |
| 565 | |
| 6 | | ||||
Other | 47 | |
| 18 | |
| 161 | |
| 83 | |
| 57 | |
| 46 | | ||||
Total Commercial Banking net revenue | $ | 2,146 | |
| $ | 1,870 | |
| 15 | |
| $ | 6,252 | |
| $ | 5,490 | |
| 14 | |
|
|
|
|
|
|
|
|
|
|
|
| ||||||||||
Investment banking revenue, gross (b) | $ | 570 | |
| $ | 600 | |
| (5 | ) |
| $ | 1,740 | |
| $ | 1,678 | |
| 4 | |
|
|
|
|
|
|
|
|
|
|
|
| ||||||||||
Revenue by client segment |
|
|
|
|
|
|
|
|
|
|
| ||||||||||
Middle Market Banking (c) | $ | 848 | |
| $ | 706 | |
| 20 | |
| $ | 2,471 | |
| $ | 2,095 | |
| 18 | |
Corporate Client Banking (c) | 688 | |
| 622 | |
| 11 | |
| 2,016 | |
| 1,784 | |
| 13 | | ||||
Commercial Term Lending | 367 | |
| 350 | |
| 5 | |
| 1,098 | |
| 1,053 | |
| 4 | | ||||
Real Estate Banking | 157 | |
| 117 | |
| 34 | |
| 438 | |
| 328 | |
| 34 | | ||||
Other | 86 | |
| 75 | |
| 15 | |
| 229 | |
| 230 | |
| - | | ||||
Total Commercial Banking net revenue | $ | 2,146 | |
| $ | 1,870 | |
| 15 | % |
| $ | 6,252 | |
| $ | 5,490 | |
| 14 | % |
|
|
|
|
|
|
|
|
|
|
|
| ||||||||||
Financial ratios |
|
|
|
|
|
|
|
|
|
|
| ||||||||||
Return on equity | 17 | % |
| 18 | % |
|
|
| 16 | % |
| 15 | % |
|
| ||||||
Overhead ratio | 37 | |
| 40 | |
|
|
| 39 | |
| 40 | |
|
| ||||||
(a) | Includes total Firm revenue from investment banking products sold to CB clients, net of revenue sharing with the CIB. |
(b) | Represents total Firm revenue from investment banking products sold to CB clients. |
(c) | Certain clients were transferred from Middle Market Banking to Corporate Client Banking in the second quarter of 2017. The prior period amounts have been revised to conform with the current period presentation. |
32
Selected metrics |
|
|
|
|
|
| |||||||||||
| As of or for the three months |
| As of or for the nine months | ||||||||||||||
(in millions, except headcount) | 2017 | | 2016 | | Change | |
| 2017 | 2016 | Change | |||||||
Selected balance sheet data (period-end) |
|
|
|
|
|
|
| ||||||||||
Total assets | $ | 220,064 | | $ | 212,189 | | 4 | % |
| $ | 220,064 | | $ | 212,189 | | 4 | % |
Loans: |
|
|
|
|
|
|
| ||||||||||
Loans retained | 201,463 | | 185,609 | | 9 | |
| 201,463 | | 185,609 | | 9 | | ||||
Loans held-for-sale and loans at fair value | 764 | | 191 | | 300 | |
| 764 | | 191 | | 300 | | ||||
Total loans | $ | 202,227 | | $ | 185,800 | | 9 | |
| $ | 202,227 | | $ | 185,800 | | 9 | |
Core loans | 201,999 | | 185,354 | | 9 | |
| 201,999 | | 185,354 | | 9 | | ||||
Equity | 20,000 | | 16,000 | | 25 | |
| 20,000 | | 16,000 | | 25 | | ||||
|
|
|
|
|
|
|
| ||||||||||
Period-end loans by client segment |
|
|
|
|
|
|
| ||||||||||
Middle Market Banking (a) | $ | 56,192 | | $ | 53,581 | | 5 | |
| $ | 56,192 | | $ | 53,581 | | 5 | |
Corporate Client Banking (a) | 47,682 | | 43,517 | | 10 | |
| 47,682 | | 43,517 | | 10 | | ||||
Commercial Term Lending | 74,349 | | 69,133 | | 8 | |
| 74,349 | | 69,133 | | 8 | | ||||
Real Estate Banking | 17,127 | | 13,905 | | 23 | |
| 17,127 | | 13,905 | | 23 | | ||||
Other | 6,877 | | 5,664 | | 21 | |
| 6,877 | | 5,664 | | 21 | | ||||
Total Commercial Banking loans | $ | 202,227 | | $ | 185,800 | | 9 | |
| $ | 202,227 | | $ | 185,800 | | 9 | |
|
|
|
|
|
|
|
| ||||||||||
Selected balance sheet data (average) |
|
|
|
|
|
|
| ||||||||||
Total assets | $ | 218,196 | | $ | 208,765 | | 5 | |
| $ | 216,574 | | $ | 205,748 | | 5 | |
Loans: |
|
|
|
|
|
|
| ||||||||||
Loans retained | 199,487 | | 180,962 | | 10 | |
| 195,604 | | 175,695 | | 11 | | ||||
Loans held-for-sale and loans at fair value | 675 | | 517 | | 31 | |
| 931 | | 516 | | 80 | | ||||
Total loans | $ | 200,162 | | $ | 181,479 | | 10 | |
| $ | 196,535 | | $ | 176,211 | | 12 | |
Core loans | 199,920 | | 181,016 | | 10 | |
| 196,254 | | 175,651 | | 12 | | ||||
|
|
|
|
|
|
|
| ||||||||||
Average loans by client segment |
|
|
|
|
|
|
| ||||||||||
Middle Market Banking (a) | $ | 55,782 | | $ | 52,646 | | 6 | |
| $ | 55,239 | | $ | 51,716 | | 7 | |
Corporate Client Banking (a) | 46,451 | | 42,141 | | 10 | |
| 45,516 | | 40,872 | | 11 | | ||||
Commercial Term Lending | 74,136 | | 67,696 | | 10 | |
| 73,041 | | 65,486 | | 12 | | ||||
Real Estate Banking | 16,936 | | 13,382 | | 27 | |
| 16,205 | | 12,597 | | 29 | | ||||
Other | 6,857 | | 5,614 | | 22 | |
| 6,534 | | 5,540 | | 18 | | ||||
Total Commercial Banking loans | $ | 200,162 | | $ | 181,479 | | 10 | |
| $ | 196,535 | | $ | 176,211 | | 12 | |
|
|
|
|
|
|
|
| ||||||||||
Client deposits and other third-party liabilities | $ | 176,218 | | $ | 173,696 | | 1 | |
| $ | 175,402 | | $ | 172,502 | | 2 | |
Equity | 20,000 | | 16,000 | | 25 | |
| 20,000 | | 16,000 | | 25 | | ||||
|
|
|
|
|
|
|
| ||||||||||
Headcount | 8,965 | | 8,333 | | 8 | % |
| 8,965 | | 8,333 | | 8 | % | ||||
(a) | Certain clients were transferred from Middle Market Banking to Corporate Client Banking in the second quarter of 2017. The prior period amounts have been revised to conform with the current period presentation. |
33
Selected metrics (continued) |
|
|
|
|
|
|
|
| |||||||||||
| As of or for the three months |
| As of or for the nine months | ||||||||||||||||
(in millions, except ratios) | 2017 | | 2016 | | Change | |
| 2017 | |
| 2016 | |
| Change | |||||
Credit data and quality statistics |
|
|
|
|
|
|
|
|
| ||||||||||
Net charge-offs/(recoveries) | $ | 19 | | $ | 44 | | (57 | )% |
| $ | 17 | |
| $ | 110 | |
| (85 | )% |
Nonperforming assets |
|
|
|
|
|
|
|
|
| ||||||||||
Nonaccrual loans: |
|
|
|
|
|
|
|
|
| ||||||||||
Nonaccrual loans retained (a) | $ | 744 | | $ | 1,212 | | (39 | )% |
| $ | 744 | |
| $ | 1,212 | |
| (39 | )% |
Nonaccrual loans held-for-sale and loans at fair value | - | | - | | - | |
| - | |
| - | |
| - | | ||||
Total nonaccrual loans | $ | 744 | | $ | 1,212 | | (39 | ) |
| $ | 744 | |
| $ | 1,212 | |
| (39 | ) |
Assets acquired in loan satisfactions | 3 | | 1 | | 200 | |
| 3 | |
| 1 | |
| 200 | | ||||
Total nonperforming assets | $ | 747 | | $ | 1,213 | | (38 | ) |
| $ | 747 | |
| $ | 1,213 | |
| (38 | ) |
Allowance for credit losses: |
|
|
|
|
|
|
|
|
| ||||||||||
Allowance for loan losses | $ | 2,620 | | $ | 2,858 | | (8 | ) |
| $ | 2,620 | |
| $ | 2,858 | |
| (8 | ) |
Allowance for lending-related commitments | 323 | | 244 | | 32 | |
| 323 | |
| 244 | |
| 32 | | ||||
Total allowance for credit losses | $ | 2,943 | | $ | 3,102 | | (5 | )% |
| $ | 2,943 | |
| $ | 3,102 | |
| (5 | )% |
Net charge-off/(recovery) rate (b) | 0.04 | % | 0.10 | % |
|
| 0.01 | % |
| 0.08 | % |
|
| ||||||
Allowance for loan losses to period-end loans retained | 1.30 | | 1.54 | |
|
| 1.30 | |
| 1.54 | |
|
| ||||||
Allowance for loan losses to nonaccrual loans retained (a) | 352 | | 236 | |
|
| 352 | |
| 236 | |
|
| ||||||
Nonaccrual loans to period-end total loans | 0.37 | | 0.65 | |
|
| 0.37 | |
| 0.65 | |
|
| ||||||
(a) | Allowance for loan losses of $128 million and $221 million was held against nonaccrual loans retained at September 30, 2017 and 2016 , respectively. |
(b) | Loans held-for-sale and loans at fair value were excluded when calculating the net charge-off/(recovery) rate. |
34
ASSET & WEALTH MANAGEMENT | ||||
For a discussion of the business profile of AWM, see pages 66–68 of JPMorgan Chase's 2016 Annual Report and Line of Business Metrics on pages 174–175 .
Selected income statement data |
|
|
|
| |||||||||||||
(in millions, except ratios) | Three months ended September 30, |
| Nine months ended September 30, | ||||||||||||||
2017 | | 2016 | | Change | |
| 2017 | | 2016 | | Change | | |||||
Revenue |
|
|
|
|
|
|
| ||||||||||
Asset management, administration and commissions | $ | 2,240 | | $ | 2,087 | | 7 | % |
| $ | 6,556 | | $ | 6,205 | | 6 | % |
All other income | 150 | | 190 | | (21 | ) |
| 468 | | 509 | | (8 | ) | ||||
Noninterest revenue | 2,390 | | 2,277 | | 5 | |
| 7,024 | | 6,714 | | 5 | | ||||
Net interest income | 855 | | 770 | | 11 | |
| 2,520 | | 2,244 | | 12 | | ||||
Total net revenue | 3,245 | | 3,047 | | 6 | |
| 9,544 | | 8,958 | | 7 | | ||||
|
|
|
|
|
|
|
| ||||||||||
Provision for credit losses | 8 | | 32 | | (75 | ) |
| 30 | | 37 | | (19 | ) | ||||
|
|
|
|
|
|
|
| ||||||||||
Noninterest expense |
|
|
|
|
|
|
| ||||||||||
Compensation expense | 1,319 | | 1,279 | | 3 | |
| 3,928 | | 3,769 | | 4 | | ||||
Noncompensation expense | 862 | | 851 | | 1 | |
| 3,025 | | 2,534 | | 19 | | ||||
Total noninterest expense | 2,181 | | 2,130 | | 2 | |
| 6,953 | | 6,303 | | 10 | | ||||
|
|
|
|
|
|
|
| ||||||||||
Income before income tax expense | 1,056 | | 885 | | 19 | |
| 2,561 | | 2,618 | | (2 | ) | ||||
Income tax expense | 382 | | 328 | | 16 | |
| 878 | | 953 | | (8 | ) | ||||
Net income | $ | 674 | | $ | 557 | | 21 | |
| $ | 1,683 | | $ | 1,665 | | 1 | |
|
|
|
|
|
|
|
| ||||||||||
Revenue by line of business |
|
|
|
|
|
|
| ||||||||||
Asset Management | $ | 1,587 | | $ | 1,497 | | 6 | |
| $ | 4,635 | | $ | 4,420 | | 5 | |
Wealth Management | 1,658 | | 1,550 | | 7 | |
| 4,909 | | 4,538 | | 8 | | ||||
Total net revenue | $ | 3,245 | | $ | 3,047 | | 6 | % |
| $ | 9,544 | | $ | 8,958 | | 7 | % |
|
|
|
|
|
|
|
| ||||||||||
Financial ratios |
|
|
|
|
|
|
| ||||||||||
Return on equity | 29 | % | 24 | % |
|
| 24 | % | 24 | % |
| ||||||
Overhead ratio | 67 | | 70 | |
|
| 73 | | 70 | |
| ||||||
Pre-tax margin ratio: |
|
|
|
|
|
|
| ||||||||||
Asset Management | 34 | | 31 | |
|
| 22 | | 31 | |
| ||||||
Wealth Management | 32 | | 27 | |
|
| 31 | | 27 | |
| ||||||
Asset & Wealth Management | 33 | | 29 | |
|
| 27 | | 29 | |
| ||||||
Quarterly results
Net income was $674 million , an increase of 21%, reflecting higher net revenue partially offset by higher noninterest expense.
Net revenue was $3.2 billion , an increase of 6 %. Net interest income was $855 million, up 11%, predominantly driven by higher deposit spreads. Noninterest revenue was $2.4 billion, up 5%, predominantly reflecting higher market levels.
Noninterest expense was $2.2 billion , an increase of 2 %, driven by a combination of higher compensation expense and higher external fees.
Year-to-date results
Net income was $1.7 billion , an increase of 1%, reflecting higher revenue and a tax benefit resulting from the vesting of employee-based stock awards, offset by higher noninterest expense.
Net revenue was $9.5 billion , an increase of 7%. Net interest income was $2.5 billion, up 12%, driven by higher deposit spreads. Noninterest revenue was $7.0 billion, up 5%, driven by higher market levels and brokerage revenue, partially offset by the absence of a gain in the prior year on the disposal of an asset.
Noninterest expense was $7.0 billion , an increase of 10%, driven by higher legal expense and compensation expense on higher revenue.
35
Selected metrics |
|
|
|
|
|
|
| ||||||||||
| As of or for the three months |
| As of or for the nine months | ||||||||||||||
(in millions, except ranking data, headcount and ratios) | 2017 | | 2016 | | Change | |
| 2017 | | 2016 | | Change | | ||||
% of JPM mutual fund assets rated as 4- or 5-star (a)(b) | 65 | % | 54 | % |
|
| 65 | % | 54 | % |
| ||||||
% of JPM mutual fund assets ranked in 1 st or 2 nd quartile: (c) |
|
|
|
|
|
|
| ||||||||||
1 year (b) | 61 | | 46 | |
|
| 61 | | 46 | |
| ||||||
3 years (b) | 82 | | 74 | |
|
| 82 | | 74 | |
| ||||||
5 years (b) | 81 | | 78 | |
|
| 81 | | 78 | |
| ||||||
|
|
|
|
|
|
|
| ||||||||||
Selected balance sheet data (period-end) |
|
|
|
|
|
|
| ||||||||||
Total assets | $ | 149,170 | | $ | 137,295 | | 9 | % |
| $ | 149,170 | | $ | 137,295 | | 9 | % |
Loans | 128,038 | | 116,043 | | 10 | |
| 128,038 | | 116,043 | | 10 | | ||||
Core loans | 128,038 | | 116,043 | | 10 | |
| 128,038 | | 116,043 | | 10 | | ||||
Deposits | 141,409 | | 157,274 | | (10 | ) |
| 141,409 | | 157,274 | | (10 | ) | ||||
Equity | 9,000 | | 9,000 | | - | |
| 9,000 | | 9,000 | | - | | ||||
|
|
|
|
|
|
|
| ||||||||||
Selected balance sheet data (average) |
|
|
|
|
|
|
| ||||||||||
Total assets | $ | 146,388 | | $ | 134,920 | | 8 | |
| $ | 142,541 | | $ | 132,090 | | 8 | |
Loans | 125,445 | | 114,201 | | 10 | |
| 122,002 | | 112,142 | | 9 | | ||||
Core loans | 125,445 | | 114,201 | | 10 | |
| 122,002 | | 112,142 | | 9 | | ||||
Deposits | 144,496 | | 153,121 | | (6 | ) |
| 151,311 | | 151,656 | | - | | ||||
Equity | 9,000 | | 9,000 | | - | |
| 9,000 | | 9,000 | | - | | ||||
|
|
|
|
|
|
|
| ||||||||||
Headcount | 22,685 | | 21,142 | | 7 | |
| 22,685 | | 21,142 | | 7 | | ||||
|
|
|
|
|
|
|
| ||||||||||
Number of Wealth Management client advisors | 2,581 | | 2,560 | | 1 | |
| 2,581 | | 2,560 | | 1 | | ||||
|
|
|
|
|
|
|
| ||||||||||
Credit data and quality statistics |
|
|
|
|
|
|
| ||||||||||
Net charge-offs | $ | 5 | | $ | 5 | | - | |
| $ | 10 | | $ | 16 | | (38 | ) |
Nonaccrual loans | 337 | | 372 | | (9 | ) |
| 337 | | 372 | | (9 | ) | ||||
Allowance for credit losses: |
|
|
|
|
|
|
| ||||||||||
Allowance for loan losses | $ | 285 | | $ | 285 | | - | |
| $ | 285 | | $ | 285 | | - | |
Allowance for lending-related commitments | 10 | | 5 | | 100 | |
| 10 | | 5 | | 100 | | ||||
Total allowance for credit losses | $ | 295 | | $ | 290 | | 2 | % |
| $ | 295 | | $ | 290 | | 2 | % |
Net charge-off rate | 0.02 | % | 0.02 | % |
|
| 0.01 | % | 0.02 | % |
| ||||||
Allowance for loan losses to period-end loans | 0.22 | | 0.25 | |
|
| 0.22 | | 0.25 | |
| ||||||
Allowance for loan losses to nonaccrual loans | 85 | | 77 | |
|
| 85 | | 77 | |
| ||||||
Nonaccrual loans to period-end loans | 0.26 | | 0.32 | |
|
| 0.26 | | 0.32 | |
| ||||||
(a) | Represents the "overall star rating" derived from Morningstar for the U.S., the U.K., Luxembourg, Hong Kong and Taiwan domiciled funds; and Nomura "star rating" for Japan domiciled funds. Includes only Asset Management retail open-ended mutual funds that have a rating. Excludes money market funds, Undiscovered Managers Fund, and Brazil and India domiciled funds. |
(b) | The prior period amounts have been revised to conform with current period presentation. |
(c) | Quartile ranking sourced from: Lipper for the U.S. and Taiwan domiciled funds; Morningstar for the U.K., Luxembourg and Hong Kong domiciled funds; Nomura for Japan domiciled funds and Fund Doctor for South Korea domiciled funds. Includes only Asset Management retail open-ended mutual funds that are ranked by the aforementioned sources. Excludes money market funds, Undiscovered Managers Fund, and Brazil and India domiciled funds. |
36
Client assets
Client assets of $2.7 trillion and assets under management of $1.9 trillion were up 9% and 10%, respectively, reflecting higher market levels, and net inflows into liquidity and long-term products.
Client assets |
|
|
| |||||
| September 30, | |||||||
(in billions) | 2017 | | 2016 | | Change | | ||
Assets by asset class |
|
|
| |||||
Liquidity | $ | 441 | | $ | 403 | | 9 | % |
Fixed income | 461 | | 437 | | 5 | | ||
Equity | 405 | | 357 | | 13 | | ||
Multi-asset and alternatives | 638 | | 575 | | 11 | | ||
Total assets under management | 1,945 | | 1,772 | | 10 | | ||
Custody/brokerage/administration/deposits | 733 | | 675 | | 9 | | ||
Total client assets | $ | 2,678 | | $ | 2,447 | | 9 | |
|
|
|
| |||||
Memo: |
|
|
| |||||
Alternatives client assets (a) | $ | 161 | | $ | 157 | | 3 | |
|
|
|
| |||||
Assets by client segment |
|
|
| |||||
Private Banking | $ | 507 | | $ | 433 | | 17 | |
Institutional | 921 | | 862 | | 7 | | ||
Retail | 517 | | 477 | | 8 | | ||
Total assets under management | $ | 1,945 | | $ | 1,772 | | 10 | |
|
|
|
| |||||
Private Banking | $ | 1,217 | | $ | 1,089 | | 12 | |
Institutional | 941 | | 879 | | 7 | | ||
Retail | 520 | | 479 | | 9 | | ||
Total client assets | $ | 2,678 | | $ | 2,447 | | 9 | % |
(a) | Represents assets under management, as well as client balances in brokerage accounts. |
Client assets (continued) |
|
|
|
|
| ||||||||
| Three months ended September 30, |
| Nine months ended | ||||||||||
(in billions) | 2017 | | 2016 | |
| 2017 | | 2016 | | ||||
Assets under management rollforward |
|
|
|
|
| ||||||||
Beginning balance | $ | 1,876 | | $ | 1,693 | |
| $ | 1,771 | | $ | 1,723 | |
Net asset flows: |
|
|
|
|
| ||||||||
Liquidity | 5 | | 18 | |
| (1 | ) | (11 | ) | ||||
Fixed income | 17 | | 9 | |
| 24 | | 36 | | ||||
Equity | (5 | ) | (7 | ) |
| (12 | ) | (17 | ) | ||||
Multi-asset and alternatives | 9 | | 21 | |
| 26 | | 25 | | ||||
Market/performance/other impacts | 43 | | 38 | |
| 137 | | 16 | | ||||
Ending balance, September 30 | $ | 1,945 | | $ | 1,772 | |
| $ | 1,945 | | $ | 1,772 | |
|
|
|
|
|
| ||||||||
Client assets rollforward |
|
|
|
|
| ||||||||
Beginning balance | $ | 2,598 | | $ | 2,344 | |
| $ | 2,453 | | $ | 2,350 | |
Net asset flows | 25 | | 47 | |
| 37 | | 42 | | ||||
Market/performance/other impacts | 55 | | 56 | |
| 188 | | 55 | | ||||
Ending balance, September 30 | $ | 2,678 | | $ | 2,447 | |
| $ | 2,678 | | $ | 2,447 | |
37
International metrics |
|
|
|
|
|
|
| ||||||||||
| As of or for the three months |
| As of or for the nine months | ||||||||||||||
(in millions) | 2017 | | 2016 | | Change | |
| 2017 | | 2016 | | Change | | ||||
Total net revenue (a) |
|
|
|
|
|
|
| ||||||||||
Europe/Middle East/Africa | $ | 526 | | $ | 475 | | 11 | % |
| $ | 1,482 | | $ | 1,369 | | 8 | % |
Asia/Pacific | 302 | | 280 | | 8 | |
| 858 | | 802 | | 7 | | ||||
Latin America/Caribbean | 227 | | 181 | | 25 | |
| 628 | | 539 | | 17 | | ||||
Total international net revenue | 1,055 | | 936 | | 13 | |
| 2,968 | | 2,710 | | 10 | | ||||
North America | 2,190 | | 2,111 | | 4 | |
| 6,576 | | 6,248 | | 5 | | ||||
Total net revenue | $ | 3,245 | | $ | 3,047 | | 6 | % |
| $ | 9,544 | | $ | 8,958 | | 7 | % |
(a) | Regional revenue is based on the domicile of the client. |
| As of or for the three months |
| As of or for the nine months | ||||||||||||||
(in billions) | 2017 | | 2016 | | Change | |
| 2017 | | 2016 | | Change | | ||||
Assets under management |
|
|
|
|
|
|
| ||||||||||
Europe/Middle East/Africa | $ | 357 | | $ | 314 | | 14 | % |
| $ | 357 | | $ | 314 | | 14 | % |
Asia/Pacific | 144 | | 131 | | 10 | |
| 144 | | 131 | | 10 | | ||||
Latin America/Caribbean | 59 | | 45 | | 31 | |
| 59 | | 45 | | 31 | | ||||
Total international assets under management | 560 | | 490 | | 14 | |
| 560 | | 490 | | 14 | | ||||
North America | 1,385 | | 1,282 | | 8 | |
| 1,385 | | 1,282 | | 8 | | ||||
Total assets under management | $ | 1,945 | | $ | 1,772 | | 10 | |
| $ | 1,945 | | $ | 1,772 | | 10 | |
|
|
|
|
|
|
|
| ||||||||||
Client assets |
|
|
|
|
|
|
| ||||||||||
Europe/Middle East/Africa | $ | 411 | | $ | 364 | | 13 | |
| $ | 411 | | $ | 364 | | 13 | |
Asia/Pacific | 206 | | 186 | | 11 | |
| 206 | | 186 | | 11 | | ||||
Latin America/Caribbean | 157 | | 116 | | 35 | |
| 157 | | 116 | | 35 | | ||||
Total international client assets | 774 | | 666 | | 16 | |
| 774 | | 666 | | 16 | | ||||
North America | 1,904 | | 1,781 | | 7 | |
| 1,904 | | 1,781 | | 7 | | ||||
Total client assets | $ | 2,678 | | $ | 2,447 | | 9 | % |
| $ | 2,678 | | $ | 2,447 | | 9 | % |
38
CORPORATE | ||||
For a discussion of Corporate, see pages 69–70 of JPMorgan Chase's 2016 Annual Report.
Selected income statement and balance sheet data |
|
|
|
|
|
| ||||||||||||||
| As of or for the three months |
| As of or for the nine months | |||||||||||||||||
(in millions, except headcount) | 2017 | | 2016 | |
| Change | |
| 2017 | |
| 2016 | |
| Change | | ||||
Revenue |
|
|
|
|
|
|
|
|
|
| ||||||||||
Principal transactions | $ | (2 | ) | $ | 57 | |
| NM | |
| $ | 161 | |
| $ | 183 | |
| (12 | )% |
Securities gains/(losses) | - | | 64 | |
| (100 | )% |
| (37 | ) |
| 135 | |
| NM | | ||||
All other income/(loss) (a) | 111 | | 76 | |
| 46 | |
| 839 | |
| 319 | |
| 163 | | ||||
Noninterest revenue | 109 | | 197 | |
| (45 | ) |
| 963 | |
| 637 | |
| 51 | | ||||
Net interest income | 77 | | (385 | ) |
| NM | |
| 2 | |
| (927 | ) |
| NM | | ||||
Total net revenue (b) | 186 | | (188 | ) |
| NM | |
| 965 | |
| (290 | ) |
| NM | | ||||
|
|
|
|
|
|
|
|
|
|
| ||||||||||
Provision for credit losses | - | | (1 | ) |
| 100 | |
| - | |
| (4 | ) |
| 100 | | ||||
|
|
|
|
|
|
|
|
|
|
| ||||||||||
Noninterest expense (c) | 74 | | 143 | |
| (48 | ) |
| 355 | |
| 23 | |
| NM | | ||||
Income/(loss) before income tax expense/(benefit) | 112 | | (330 | ) |
| NM | |
| 610 | |
| (309 | ) |
| NM | | ||||
Income tax expense/(benefit) | 34 | | (165 | ) |
| NM | |
| (73 | ) |
| 54 | |
| NM | | ||||
Net income/(loss) | $ | 78 | | $ | (165 | ) |
| NM | |
| $ | 683 | |
| $ | (363 | ) |
| NM | |
Total net revenue |
|
|
|
|
|
|
|
|
|
| ||||||||||
Treasury and CIO | $ | 265 | | $ | (211 | ) |
| NM | |
| $ | 344 | |
| $ | (531 | ) |
| NM | |
Other Corporate | (79 | ) | 23 | |
| NM | |
| 621 | |
| 241 | |
| 158 | | ||||
Total net revenue | $ | 186 | | $ | (188 | ) |
| NM | |
| $ | 965 | |
| $ | (290 | ) |
| NM | |
Net income/(loss) |
|
|
|
|
|
|
|
|
|
| ||||||||||
Treasury and CIO | $ | 75 | | $ | (208 | ) |
| NM | |
| $ | (6 | ) |
| $ | (518 | ) |
| 99 | |
Other Corporate | 3 | | 43 | |
| (93 | ) |
| 689 | |
| 155 | |
| 345 | | ||||
Total net income/(loss) | $ | 78 | | $ | (165 | ) |
| NM | |
| $ | 683 | |
| $ | (363 | ) |
| NM | |
Total assets (period-end) | $ | 804,573 | | $ | 824,336 | |
| (2 | ) |
| $ | 804,573 | |
| $ | 824,336 | |
| (2 | ) |
Loans (period-end) | 1,614 | | 1,738 | |
| (7 | ) |
| 1,614 | |
| 1,738 | |
| (7 | ) | ||||
Core loans (d) | 1,614 | | 1,735 | |
| (7 | ) |
| 1,614 | |
| 1,735 | |
| (7 | ) | ||||
Headcount | 34,659 | | 31,572 | |
| 10 | % |
| 34,659 | |
| 31,572 | |
| 10 | % | ||||
(a) | Included revenue related to a legal settlement of $645 million for the nine months ended September 30, 2017 . |
(b) | Included tax-equivalent adjustments, predominantly due to tax-exempt income from municipal bond investments of $216 million and $218 million for the three months ended September 30, 2017 and 2016 , respectively, and $681 million and $663 million for the nine months ended September 30, 2017 and 2016 , respectively. |
(c) | Included legal expense/(benefit) of $(148) million and $(85) million for the three months ended September 30, 2017 and 2016 , respectively, and $(360) million and $(550) million for the nine months ended September 30, 2017 and 2016 , respectively. |
(d) | Average core loans were $1.7 billion and $1.8 billion for the three months ended September 30, 2017 and 2016 , respectively, and $1.6 billion and $1.9 billion for the nine months ended September 30, 2017 and 2016 , respectively. |
Quarterly results
Net income was $78 million, compared with a net loss of $165 million in the prior-year quarter. Net revenue was $186 million, compared with a loss of $188 million in the prior year, primarily due to the benefit of higher rates.
Year-to-date results
Net income was $683 million, compared with a net loss of $363 million in the prior year. Net revenue was $965 million, compared with a loss of $290 million in the prior-year. Current period net revenue was driven by a $645 million benefit from a legal settlement with the FDIC receivership for Washington Mutual and with Deutsche Bank as trustee to certain Washington Mutual trusts; and by the net impact of higher rates. Noninterest expense was $355 million, up $332 million from prior year, driven by a lower legal benefit and higher compensation expense.
39
Treasury and CIO overview
At September 30, 2017 , the average credit rating of the Treasury and CIO investment securities comprising the portfolio in the table below was AA+ (based upon external ratings where available and, where not available, based primarily upon internal ratings that correspond to ratings as defined by S&P and Moody's). See Note 9 for further information on the Firm's investment securities portfolio.
For further information on liquidity and funding risk, see Liquidity Risk Management on pages 68–72 . For information on interest rate, foreign exchange and other risks, see Market Risk Management on pages 73–77 .
Selected income statement and balance sheet data |
|
|
|
|
|
| |||||||||||||||
| As of or for the three months |
| As of or for the nine months | ||||||||||||||||||
(in millions) | 2017 | |
| 2016 | |
| Change | |
| 2017 | |
| 2016 | |
| Change | | ||||
Securities gains/(losses) | $ | - | |
| $ | 64 | |
| (100 | )% |
| $ | (49 | ) |
| $ | 135 | |
| NM | |
AFS investment securities (average) | $ | 212,633 | |
| $ | 219,042 | |
| (3 | ) |
| $ | 224,094 | |
| $ | 226,533 | |
| (1 | )% |
HTM investment securities (average) | 47,034 | |
| 52,774 | |
| (11 | ) |
| 48,201 | |
| 51,518 | |
| (6 | ) | ||||
Investment securities portfolio (average) | $ | 259,667 | |
| $ | 271,816 | |
| (4 | ) |
| $ | 272,295 | |
| $ | 278,051 | |
| (2 | ) |
AFS investment securities (period-end) | $ | 214,257 | |
| $ | 217,196 | |
| (1 | ) |
| $ | 214,257 | |
| $ | 217,196 | |
| (1 | ) |
HTM investment securities (period-end) | 47,079 | |
| 52,011 | |
| (9 | ) |
| 47,079 | |
| 52,011 | |
| (9 | ) | ||||
Investment securities portfolio (period-end) | $ | 261,336 | |
| $ | 269,207 | |
| (3 | )% |
| $ | 261,336 | |
| $ | 269,207 | |
| (3 | )% |
40
ENTERPRISE-WIDE RISK MANAGEMENT | ||||
Risk is an inherent part of JPMorgan Chase's business activities. When the Firm extends a consumer or wholesale loan, advises customers on their investment decisions, makes markets in securities, or offers other products or services, the Firm takes on some degree of risk. The Firm's overall objective is to manage its businesses, and the associated risks, in a manner that balances serving the interests of its clients, customers and investors and protects the safety and soundness of the Firm.
Firmwide Risk Management is overseen and managed on an enterprise-wide basis. The Firm's approach to risk management covers a broad spectrum of economic and other core risk areas, such as credit, market, liquidity, model, principal, country, operational, compliance, conduct, legal, capital, and reputation risk, with controls and governance established for each area, as appropriate.
The Firm believes that effective risk management requires:
• | Acceptance of responsibility, including identification and escalation of risk issues, by all individuals within the Firm; |
• | Ownership of risk identification, assessment, data and management by each of the lines of business and corporate functions; and |
• | Firmwide structures for risk governance. |
The Firm's Operating Committee, which consists of the Firm's Chief Executive Officer ("CEO"), Chief Risk Officer ("CRO"), Chief Financial Officer ("CFO") and other senior executives, is the ultimate management escalation point in the Firm and may refer matters to the Firm's Board of Directors. The Operating Committee is responsible and accountable to the Firm's Board of Directors.
In June 2017, the Firm announced the departure of its Chief Operating Officer. As a result, his responsibilities have transitioned to other members of the Operating Committee. The Chief Investment Officer/Treasurer now reports to the Firm's CFO, and will continue to chair the Firmwide Asset Liability Committee ("ALCO"). For further discussion on the Firm's ALCO, see page 75 of JPMorgan Chase's 2016 Annual Report.
The Firm strives for continual improvement through efforts to enhance controls, ongoing employee training and development, talent retention, and other measures. The Firm follows a disciplined and balanced compensation framework with strong internal governance and independent Board oversight. The impact of risk and control issues are carefully considered in the Firm's performance evaluation and incentive compensation processes.
Risk disclosure | Form 10-Q page reference | Annual Report page reference |
Enterprise-Wide Risk Management | 41–77 | 71–131 |
I. Economic risks | ||
Capital Risk Management | 42–48 | 76–85 |
Credit Risk Management | 49–66 | 86–107 |
Country Risk Management | 67 | 108–109 |
Liquidity Risk Management | 68–72 | 110–115 |
Market Risk Management | 73–77 | 116–123 |
Principal Risk Management |
| 124 |
II. Other core risks | ||
Compliance Risk Management |
| 125 |
Conduct Risk Management |
| 126 |
Legal Risk Management |
| 127 |
Model Risk Management |
| 128 |
Operational Risk Management |
| 129–130 |
Reputation Risk Management |
| 131 |
41
CAPITAL RISK MANAGEMENT | ||||
Capital risk is the risk the Firm has an insufficient level and composition of capital to support the Firm's business activities and associated risks during normal economic environments and under stressed conditions. For a discussion of the Firm's Capital Risk Management, see pages 76–85 of JPMorgan Chase's 2016 Annual Report.
A strong capital position is essential to the Firm's business strategy and competitive position. Maintaining a strong balance sheet to manage through economic volatility is considered a strategic imperative of the Firm's Board of Directors, CEO and Operating Committee. The Firm's balance sheet philosophy focuses on risk-adjusted returns, strong capital and robust liquidity. The Firm's capital risk management strategy focuses on maintaining long-term stability to enable it to build and invest in market-leading businesses, even in a highly stressed environment. Prior to making any decisions on future business activities, senior management considers the implications on the Firm's capital. In addition to considering the Firm's earnings outlook, senior management evaluates all sources and uses of capital with a view to preserving the Firm's capital strength.
The Firm's capital risk management objectives are achieved through the establishment of minimum capital targets and a strong capital governance framework. Capital risk management is intended to be flexible in order to react to a range of potential events. The Firm's minimum capital targets are based on the most binding of three pillars: an internal assessment of the Firm's capital needs; an estimate of required capital under the Comprehensive Capital Analysis and Review ("CCAR") and Dodd-Frank Act stress testing requirements; and Basel III Fully Phased-In regulatory minimums. Where necessary, each pillar may include a management-established buffer. The capital governance framework requires regular monitoring of the Firm's capital positions, stress testing and escalation protocols, both at the Firm and material legal entity levels.
42
The following tables present the Firm's Transitional and Fully Phased-In risk-based and leverage-based capital metrics under both the Basel III Standardized and Advanced Approaches. The Firm's Basel III ratios exceed both the Transitional and Fully Phased-In regulatory minimums as of September 30, 2017 , and December 31, 2016 . For further discussion of these capital metrics, including regulatory minimums, and the Standardized and Advanced Approaches, refer to Strategy and Governance on pages 78–82 of JPMorgan Chase's 2016 Annual Report.
| Transitional |
| Fully Phased-In |
| ||||||||||||||||||
September 30, 2017 | Standardized |
| Advanced |
| Minimum capital ratios |
| Standardized |
| Advanced |
| Minimum capital ratios |
| ||||||||||
Risk-based capital metrics: |
|
|
|
|
|
|
|
|
|
|
|
| ||||||||||
CET1 capital | $ | 187,061 | |
| $ | 187,061 | |
|
|
| $ | 186,831 | |
| $ | 186,831 | |
|
|
| ||
Tier 1 capital | 212,297 | |
| 212,297 | |
|
|
| 212,196 | |
| 212,196 | |
|
|
| ||||||
Total capital | 242,949 | |
| 232,794 | |
|
|
| 241,668 | |
| 231,513 | |
|
|
| ||||||
Risk-weighted assets | 1,482,267 | |
| 1,443,019 | |
|
|
| 1,491,954 | |
| 1,453,287 | |
|
|
| ||||||
CET1 capital ratio | 12.6 | % |
| 13.0 | % |
| 7.5 | % |
| 12.5 | % |
| 12.9 | % |
| 10.5 | % |
| ||||
Tier 1 capital ratio | 14.3 | |
| 14.7 | |
| 9.0 | |
| 14.2 | |
| 14.6 | |
| 12.0 | |
| ||||
Total capital ratio | 16.4 | |
| 16.1 | |
| 11.0 | |
| 16.2 | |
| 15.9 | |
| 14.0 | |
| ||||
Leverage-based capital metrics |
|
|
|
|
|
|
|
|
|
|
|
| ||||||||||
Adjusted average assets (a) | $ | 2,521,889 | |
| $ | 2,521,889 | |
|
|
| $ | 2,522,504 | |
| $ | 2,522,504 | |
|
|
| ||
Tier 1 leverage ratio (b) | 8.4 | % |
| 8.4 | % |
| 4.0 | % |
| 8.4 | % |
| 8.4 | % |
| 4.0 | % |
| ||||
Total leverage exposure | NA | |
| $ | 3,211,053 | |
|
|
| NA | |
| $ | 3,211,667 | |
|
|
| ||||
SLR (c) | NA | |
| 6.6 | % |
| NA | |
| NA | |
| 6.6 | % |
| 5.0 | % | (d) | ||||
| Transitional |
| Fully Phased-In |
| ||||||||||||||||||
December 31, 2016 | Standardized |
| Advanced |
| Minimum capital ratios |
| Standardized |
| Advanced |
| Minimum capital ratios |
| ||||||||||
Risk-based capital metrics: |
|
|
|
|
|
|
|
|
|
|
|
| ||||||||||
CET1 capital | $ | 182,967 | |
| $ | 182,967 | |
|
|
| $ | 181,734 | |
| $ | 181,734 | |
|
|
| ||
Tier 1 capital | 208,112 | |
| 208,112 | |
|
|
| 207,474 | |
| 207,474 | |
|
|
| ||||||
Total capital | 239,553 | |
| 228,592 | |
|
|
| 237,487 | |
| 226,526 | |
|
|
| ||||||
Risk-weighted assets | 1,464,981 | |
| 1,476,915 | |
|
|
| 1,474,665 | |
| 1,487,180 | |
|
|
| ||||||
CET1 capital ratio | 12.5 | % |
| 12.4 | % |
| 6.25 | % |
| 12.3 | % |
| 12.2 | % |
| 10.5 | % |
| ||||
Tier 1 capital ratio | 14.2 | |
| 14.1 | |
| 7.75 | |
| 14.1 | |
| 14.0 | |
| 12.0 | |
| ||||
Total capital ratio | 16.4 | |
| 15.5 | |
| 9.75 | |
| 16.1 | |
| 15.2 | |
| 14.0 | |
| ||||
Leverage-based capital metrics |
|
|
|
|
|
|
|
|
|
|
|
| ||||||||||
Adjusted average assets (a) | $ | 2,484,631 | |
| $ | 2,484,631 | |
|
|
| $ | 2,485,480 | |
| $ | 2,485,480 | |
|
|
| ||
Tier 1 leverage ratio (b) | 8.4 | % |
| 8.4 | % |
| 4.0 | % |
| 8.3 | % |
| 8.3 | % |
| 4.0 | % |
| ||||
Total leverage exposure | NA | |
| $ | 3,191,990 | |
|
|
| NA | |
| $ | 3,192,839 | |
|
|
| ||||
SLR (c) | NA | |
| 6.5 | % |
| NA | |
| NA | |
| 6.5 | % |
| 5.0 | % | (d) | ||||
Note: As of September 30, 2017 , and December 31, 2016 , the lower of the Standardized or Advanced capital ratios under each of the Transitional and Fully Phased-In approaches in the table above represents the Firm's Collins Floor, as discussed in Risk-based capital regulatory minimums on page 44 .
(a) | Adjusted average assets, for purposes of calculating the Tier 1 leverage ratio, includes total quarterly average assets adjusted for unrealized gains/(losses) on available-for-sale ("AFS") securities, less deductions for goodwill and other intangible assets, defined benefit pension plan assets, and deferred tax assets related to net operating loss ("NOL") and tax credit carryforwards. |
(b) | The Tier 1 leverage ratio is calculated by dividing Tier 1 capital by adjusted average assets. |
(c) | The SLR leverage ratio is calculated by dividing Tier 1 capital by total leverage exposure. For additional information on total leverage exposure, see SLR on page 46 . |
(d) | In the case of the SLR, the Fully Phased-In minimum ratio is effective January 1, 2018. |
43
Basel III overview
Capital rules under Basel III establish minimum capital ratios and overall capital adequacy standards for large and internationally active U.S. bank holding companies and banks, including the Firm and its insured depository institution ("IDI") subsidiaries. Basel III sets forth two comprehensive approaches for calculating RWA: a standardized approach ("Basel III Standardized"), and an advanced approach ("Basel III Advanced"). Certain of the requirements of Basel III are subject to phase-in periods that began on January 1, 2014 and continue through the end of 2018 ("transitional period").
Basel III establishes capital requirements for calculating credit risk and market risk RWA, and in the case of Basel III Advanced, operational risk RWA. In addition to the RWA calculated under these methodologies, the Firm may supplement such amounts to incorporate management judgment and feedback from its bank regulators. For additional information on Basel III methodology refer to Basel III Overview on pages 78-80 of JPMorgan Chase's 2016 Annual Report.
Basel III also includes a requirement for Advanced Approach banking organizations, including the Firm, to calculate the SLR . For additional information on the SLR, see page 46 .
Basel III Fully Phased-In
Basel III capital rules will become fully phased-in on January 1, 2019, at which point the Firm will continue to calculate its capital ratios under both the Basel III Standardized and Advanced Approaches. In the case of the SLR, the Fully Phased-In well-capitalized ratio is effective January 1, 2018. The Firm manages each of the businesses, as well as the corporate functions, primarily on a Basel III Fully Phased-In basis.
For additional information on the Firm, JPMorgan Chase Bank, N.A. and Chase Bank USA, N.A.'s capital, RWA and capital ratios under the Basel III Standardized and Advanced Fully Phased-In rules and SLRs calculated under the Basel III Advanced Fully Phased-In rules, all of which are considered key regulatory capital measures, see Explanation and Reconciliation of the Firm's Use of Non-GAAP Financial Measures and Key Performance Measures on pages 15–17 .
The Basel III Standardized and Advanced Fully Phased-In capital, RWA and capital ratios, and SLRs for the Firm, JPMorgan Chase Bank, N.A. and Chase Bank USA, N.A. are based on the current published U.S. Basel III rules.
Risk-based capital regulatory minimums
The capital adequacy of the Firm and its IDI subsidiaries, both during the transitional period and upon full phase-in, is evaluated against the lower of the two ratios as calculated under the Basel III approaches (Standardized or Advanced) as required by the Collins Amendment of the Dodd-Frank Act (the "Collins Floor"). The Basel III Standardized Fully Phased-In CET1 ratio is the Firm's current binding constraint, and the Firm expects that this will remain its binding constraint for the foreseeable future.
The Basel III rules include minimum capital ratio requirements that are subject to phase-in periods through the end of 2018. In addition to having to maintain the CET1 minimum capital ratio of 4.5%, the Firm is also required to hold additional amounts of capital to serve as a "capital conservation buffer." As an expansion of the capital conservation buffer, the Firm is also required to hold additional levels of capital in the form of a GSIB surcharge and a countercyclical capital buffer. For additional information on minimum capital ratios, the capital conservation buffer, the countercyclical buffer, and the GSIB surcharge, refer to Risk-based capital regulatory minimums on pages 79-80 of JPMorgan Chase's 2016 Annual Report.
The Firm believes that it will operate with a Basel III CET1 capital ratio between 11% and 12.5% over time. It is the Firm's intention that the Firm's capital ratios will continue to meet regulatory minimums as they are fully implemented in 2019 and thereafter.
The following table represents the ratios the Firm and its IDI subsidiaries must maintain to meet the definition of "well-capitalized" under the regulations issued by the Federal Reserve and the Prompt Corrective Action ("PCA") requirements of the FDIC Improvement Act ("FDICIA") , respectively.
| Well-capitalized ratios | ||||||||
| BHC |
| IDI | ||||||
Capital ratios |
|
|
|
|
| ||||
CET1 | - | % |
|
| 6.5 | % |
| ||
Tier 1 capital | 6.0 |
|
|
| 8.0 |
|
| ||
Total capital | 10.0 |
|
|
| 10.0 |
|
| ||
Tier 1 leverage | - |
|
|
| 5.0 |
|
| ||
SLR (a) | 5.0 |
|
|
| 6.0 |
|
| ||
(a) | In the case of the SLR, the Fully Phased-In well-capitalized ratio is effective January 1, 2018. |
Additional information regarding the Firm's capital ratios, as well as the U.S. federal regulatory capital standards to which the Firm is subject, is presented in Note 18 .
For further information on the Firm's Basel III measures, see the Firm's Pillar 3 Regulatory Capital Disclosures reports, which are available on the Firm's website (http://investor.shareholder.com/jpmorganchase/basel.cfm).
44
Capital
The following table presents reconciliations of total stockholders' equity to Basel III Fully Phased-In CET1 capital, Tier 1 capital and Basel III Advanced and Standardized Fully Phased-In Total capital as of September 30, 2017 and December 31, 2016 .
For additional information on the components of regulatory capital, see Note 18 .
Capital components |
|
| ||||
(in millions) | September 30, 2017 | | December 31, 2016 | | ||
Total stockholders' equity | $ | 258,382 | | $ | 254,190 | |
Less: Preferred stock | 26,068 | | 26,068 | | ||
Common stockholders' equity | 232,314 | | 228,122 | | ||
Less: |
|
| ||||
Goodwill | 47,309 | | 47,288 | | ||
Other intangible assets | 808 | | 862 | | ||
Add: |
|
| ||||
Deferred tax liabilities (a) | 3,271 | | 3,230 | | ||
Less: Other CET1 capital adjustments | 637 | | 1,468 | | ||
Standardized/Advanced Fully Phased-In CET1 capital | 186,831 | | 181,734 | | ||
Preferred stock | 26,068 | | 26,068 | | ||
Less: |
|
| ||||
Other Tier 1 adjustments (b) | 703 | | 328 | | ||
Standardized/Advanced Fully Phased-In Tier 1 capital | $ | 212,196 | | $ | 207,474 | |
Long-term debt and other instruments qualifying as Tier 2 capital | $ | 14,929 | | $ | 15,253 | |
Qualifying allowance for credit losses | 14,648 | | 14,854 | | ||
Other | (105 | ) | (94 | ) | ||
Standardized Fully Phased-In Tier 2 capital | $ | 29,472 | | $ | 30,013 | |
Standardized Fully Phased-In Total capital | $ | 241,668 | | $ | 237,487 | |
Adjustment in qualifying allowance for credit losses for Advanced Tier 2 capital | (10,155 | ) | (10,961 | ) | ||
Advanced Fully Phased-In Tier 2 capital | $ | 19,317 | | $ | 19,052 | |
Advanced Fully Phased-In Total capital | $ | 231,513 | | $ | 226,526 | |
|
|
| ||||
(a) | Represents deferred tax liabilities related to tax-deductible goodwill and identifiable intangibles created in nontaxable transactions, which are netted against goodwill and other intangibles when calculating TCE . |
(b) | Includes the deduction associated with the permissible holdings of covered funds (as defined by the Volcker Rule) acquired after December 31, 2013. The deduction was not material as of September 30, 2017 and December 31, 2016 . |
The following table presents reconciliations of the Firm's Basel III Transitional CET1 capital to the Firm's Basel III Fully Phased-In CET1 capital as of September 30, 2017 and December 31, 2016 .
(in millions) | September 30, 2017 | | December 31, 2016 | | ||
Transitional CET1 capital | $ | 187,061 | | $ | 182,967 | |
AOCI phase-in (a) | 106 | | (156 | ) | ||
CET1 capital deduction phase-in (b) | (183 | ) | (695 | ) | ||
Intangibles deduction phase-in (c) | (148 | ) | (312 | ) | ||
Other adjustments to CET1 capital (d) | (5 | ) | (70 | ) | ||
Fully Phased-In CET1 capital | $ | 186,831 | | $ | 181,734 | |
(a) | Includes the remaining balance of accumulated other comprehensive income ("AOCI") related to AFS debt securities and defined benefit pension and other postretirement employee benefit ("OPEB") plans that will qualify as Basel III CET1 capital upon full phase-in. |
(b) | Predominantly includes regulatory adjustments related to changes in DVA, as well as CET1 deductions for defined benefit pension plan assets and deferred tax assets related to NOL and tax credit carryforwards. |
(c) | Relates to intangible assets, other than goodwill and MSRs, that are required to be deducted from CET1 capital upon full phase-in. |
(d) | Includes minority interest and the Firm's investments in its own CET1 capital instruments. |
Capital rollforward
The following table presents the changes in Basel III Fully Phased-In CET1 capital, Tier 1 capital and Tier 2 capital for the nine months ended September 30, 2017 .
Nine months ended September 30, | 2017 | | |
Standardized/Advanced CET1 capital at December 31, 2016 | $ | 181,734 | |
Net income applicable to common equity | 18,974 | | |
Dividends declared on common stock | (5,587 | ) | |
Net purchase of treasury stock | (9,131 | ) | |
Changes in additional paid-in capital | (930 | ) | |
Changes related to AOCI | 748 | | |
Adjustment related to DVA (a) | 402 | | |
Other | 621 | | |
Increase in Standardized/Advanced CET1 capital | 5,097 | | |
Standardized/Advanced CET1 capital at September 30, 2017 | $ | 186,831 | |
|
| ||
Standardized/Advanced Tier 1 capital at December 31, 2016 | $ | 207,474 | |
Change in CET1 capital | 5,097 | | |
Net issuance of noncumulative perpetual preferred stock | - | | |
Other | (375 | ) | |
Increase in Standardized/Advanced Tier 1 capital | 4,722 | | |
Standardized/Advanced Tier 1 capital at September 30, 2017 | $ | 212,196 | |
|
| ||
Standardized Tier 2 capital at December 31, 2016 | $ | 30,013 | |
Change in long-term debt and other instruments qualifying as Tier 2 | (324 | ) | |
Change in qualifying allowance for credit losses | (206 | ) | |
Other | (11 | ) | |
Decrease in Standardized Tier 2 capital | (541 | ) | |
Standardized Tier 2 capital at September 30, 2017 | $ | 29,472 | |
Standardized Total capital at September 30, 2017 | $ | 241,668 | |
|
| ||
Advanced Tier 2 capital at December 31, 2016 | $ | 19,052 | |
Change in long-term debt and other instruments qualifying as Tier 2 | (324 | ) | |
Change in qualifying allowance for credit losses | 600 | | |
Other | (11 | ) | |
Increase in Advanced Tier 2 capital | 265 | | |
Advanced Tier 2 capital at September 30, 2017 | $ | 19,317 | |
Advanced Total capital at September 30, 2017 | $ | 231,513 | |
(a) | Includes DVA recorded in other comprehensive income ("OCI"). |
45
RWA rollforward
The following table presents changes in the components of RWA under Basel III Standardized and Advanced Fully Phased-In for the nine months ended September 30, 2017 . The amounts in the rollforward categories are estimates, based on the predominant driver of the change.
| Standardized |
| Advanced | |||||||||||||||||||
Nine months ended | Credit risk RWA | Market risk RWA | Total RWA |
| Credit risk RWA | Market risk RWA | Operational risk RWA | Total RWA | ||||||||||||||
At December 31, 2016 | $ | 1,346,986 | | $ | 127,679 | | $ | 1,474,665 | |
| $ | 959,523 | | $ | 127,657 | | $ | 400,000 | | $ | 1,487,180 | |
Model & data changes (a) | (5,379 | ) | 4,539 | | (840 | ) |
| (6,081 | ) | 4,539 | | - | | (1,542 | ) | |||||||
Portfolio runoff (b) | (11,600 | ) | - | | (11,600 | ) |
| (14,300 | ) | - | | - | | (14,300 | ) | |||||||
Movement in portfolio levels (c) | 32,220 | | (2,491 | ) | 29,729 | |
| (15,622 | ) | (2,429 | ) | - | | (18,051 | ) | |||||||
Changes in RWA | 15,241 | | 2,048 | | 17,289 | |
| (36,003 | ) | 2,110 | | - | | (33,893 | ) | |||||||
September 30, 2017 | $ | 1,362,227 | | $ | 129,727 | | $ | 1,491,954 | |
| $ | 923,520 | | $ | 129,767 | | $ | 400,000 | | $ | 1,453,287 | |
(a) | Model & data changes refer to movements in levels of RWA as a result of revised methodologies and/or treatment per regulatory guidance (exclusive of rule changes). |
(b) | Portfolio runoff for credit risk RWA primarily reflects (under both the Standardized and Advanced approaches) reduced risk from position rolloffs in legacy portfolios in Mortgage Banking , the sale of substantially all of the student loan portfolio during the second quarter of 2017, and the sale of reverse mortgages during the third quarter of 2017. |
(c) | Movement in portfolio levels for credit risk RWA refers to changes in book size, composition, credit quality, and market movements; and for market risk RWA refers to changes in position and market movements. |
Supplementary leverage ratio
The SLR is defined as Tier 1 capital under Basel III divided by the Firm's total leverage exposure. For additional information on SLR, see Capital Risk Management on page 82 of JPMorgan Chase's 2016 Annual Report.
The following table presents the components of the Firm's Fully Phased-In SLR as of September 30, 2017 and December 31, 2016 .
(in millions, except ratio) | September 30, 2017 | | December 31, 2016 | | ||
Tier 1 capital | $ | 212,196 | | $ | 207,474 | |
Total average assets | 2,569,231 | | 2,532,457 | | ||
Less: Adjustments for deductions from Tier 1 capital | 46,727 | | 46,977 | | ||
Total adjusted average assets (a) | 2,522,504 | | 2,485,480 | | ||
Off-balance sheet exposures (b) | 689,163 | | 707,359 | | ||
Total leverage exposure | $ | 3,211,667 | | $ | 3,192,839 | |
SLR | 6.6 | % | 6.5 | % | ||
(a) | Adjusted average assets, for purposes of calculating the SLR, includes total quarterly average assets adjusted for on-balance sheet assets that are subject to deduction from Tier 1 capital, predominantly goodwill and other intangible assets. |
(b) | Off-balance sheet exposures are calculated as the average of the three month-end spot balances during the quarter. |
As of September 30, 2017 , JPMorgan Chase Bank, N.A.'s and Chase Bank USA, N.A.'s Fully Phased-In SLRs are approximately 6.8% and 11.1% , respectively.
Line of business equity
The Firm's framework for allocating capital to its business segments (line of business equity) is based on the following objectives:
• | Integrate Firmwide and line of business capital risk management activities; |
• | Measure performance consistently across all lines of business; and |
• | Provide comparability with peer firms for each of the lines of business. |
Each business segment is allocated capital by taking into consideration stand-alone peer comparisons and regulatory capital requirements. ROE is measured and internal targets for expected returns are established as key measures of a business segment's performance.
Line of business equity | |||||||
(in billions) | September 30, | |
| December 31, | | ||
Consumer & Community Banking | $ | 51.0 | |
| $ | 51.0 | |
Corporate & Investment Bank | 70.0 | |
| 64.0 | | ||
Commercial Banking | 20.0 | |
| 16.0 | | ||
Asset & Wealth Management | 9.0 | |
| 9.0 | | ||
Corporate | 82.3 | |
| 88.1 | | ||
Total common stockholders' equity | $ | 232.3 | |
| $ | 228.1 | |
Effective January 1, 2017, the Firm's methodology used to allocate capital to the business segments was updated. For additional information on the new methodology, see Business Segment Results on pages 18–40 .
46
Planning and stress testing
Comprehensive Capital Analysis and Review
The Federal Reserve requires large bank holding companies, including the Firm, to submit a capital plan on an annual basis. Through the CCAR process, the Federal Reserve evaluates each bank holding company's ("BHC") capital adequacy and internal capital adequacy assessment processes, as well as its plans to make capital distributions, such as dividend payments or stock repurchases.
On June 28, 2017, the Federal Reserve informed the Firm that it did not object, on either a quantitative or qualitative basis, to the Firm's 2017 capital plan.
Capital actions
Preferred stock
Preferred stock dividends declared were $412 million and $1.2 billion for the three and nine months ended September 30, 2017 .
On October 20, 2017, the Firm issued $1.3 billion of fixed-to-floating rate non-cumulative preferred stock, Series CC, with an initial dividend rate of 4.625%. On October 31, 2017, the Firm announced that it will redeem all $1.3 billion of its outstanding 5.50% non-cumulative preferred stock, Series O, on December 1, 2017. For additional information on the Firm's preferred stock, see Note 22 of JPMorgan Chase 's 2016 Annual Report.
Common stock dividends
On September 19, 2017, the Firm announced that its Board of Directors had declared a quarterly common stock dividend of $0.56 per share, effective with the dividend paid on October 31, 2017. The Firm's dividends are subject to the Board of Directors' approval on a quarterly basis.
Common equity
Effective as of June 28, 2017, the Firm's Board of Directors authorized the repurchase of up to $19.4 billion of common equity (common stock and warrants) between July 1, 2017 and June 30, 2018, as part of its annual capital plan.
There were 16.5 million and 24.9 million warrants outstanding at September 30, 2017 and December 31,
2016 , respectively.
The following table sets forth the Firm's repurchases of common equity for the three and nine months ended September 30, 2017 and 2016 . There were no repurchases of warrants during the three and nine months ended September 30, 2017 and 2016 .
| Three months ended September 30, | | Nine months ended September 30, | ||||||||||
(in millions) | 2017 | | 2016 | | | 2017 | | 2016 | | ||||
Total shares of common stock repurchased | 51.7 | | 35.6 | | | 118.8 | | 110.6 | | ||||
Aggregate common stock repurchases | $ | 4,763 | | $ | 2,295 | | | $ | 10,602 | | $ | 6,831 | |
The Firm may, from time to time, enter into written trading plans under Rule 10b5-1 of the Securities Exchange Act of 1934 to facilitate repurchases in accordance with the common equity repurchase program. A Rule 10b5-1 repurchase plan allows the Firm to repurchase its equity during periods when it would not otherwise be repurchasing common equity - for example, during internal trading blackout periods. All purchases under Rule 10b5-1 plans must be made according to predefined plans established when the Firm is not aware of material nonpublic information.
The authorization to repurchase common equity will be utilized at management's discretion, and the timing of purchases and the exact amount of common equity that may be repurchased is subject to various factors, including market conditions; legal and regulatory considerations affecting the amount and timing of repurchase activity; the Firm's capital position (taking into account goodwill and intangibles); internal capital generation; and alternative investment opportunities. The repurchase program does not include specific price targets or timetables; may be executed through open market purchases or privately negotiated transactions, or utilizing Rule 10b5-1 programs; and may be suspended at any time.
For additional information regarding repurchases of the Firm's equity securities, see Part II, Item 5: Market for Registrant's Common Equity, Related Stockholder Matters and Issuer Purchases of Equity Securities on page 22 of JPMorgan Chase 's 2016 Form 10-K.
47
Other capital requirements
TLAC
On December 15, 2016, the Federal Reserve issued its final Total Loss Absorbing Capacity ("TLAC") rule which requires the top-tier holding companies of eight U.S. global systemically important bank holding companies, including the Firm, to maintain minimum levels of external TLAC and external long-term debt that satisfies certain eligibility criteria ("eligible LTD") effective January 1, 2019.
The minimum external TLAC and the minimum level of eligible long-term debt requirements are shown below:
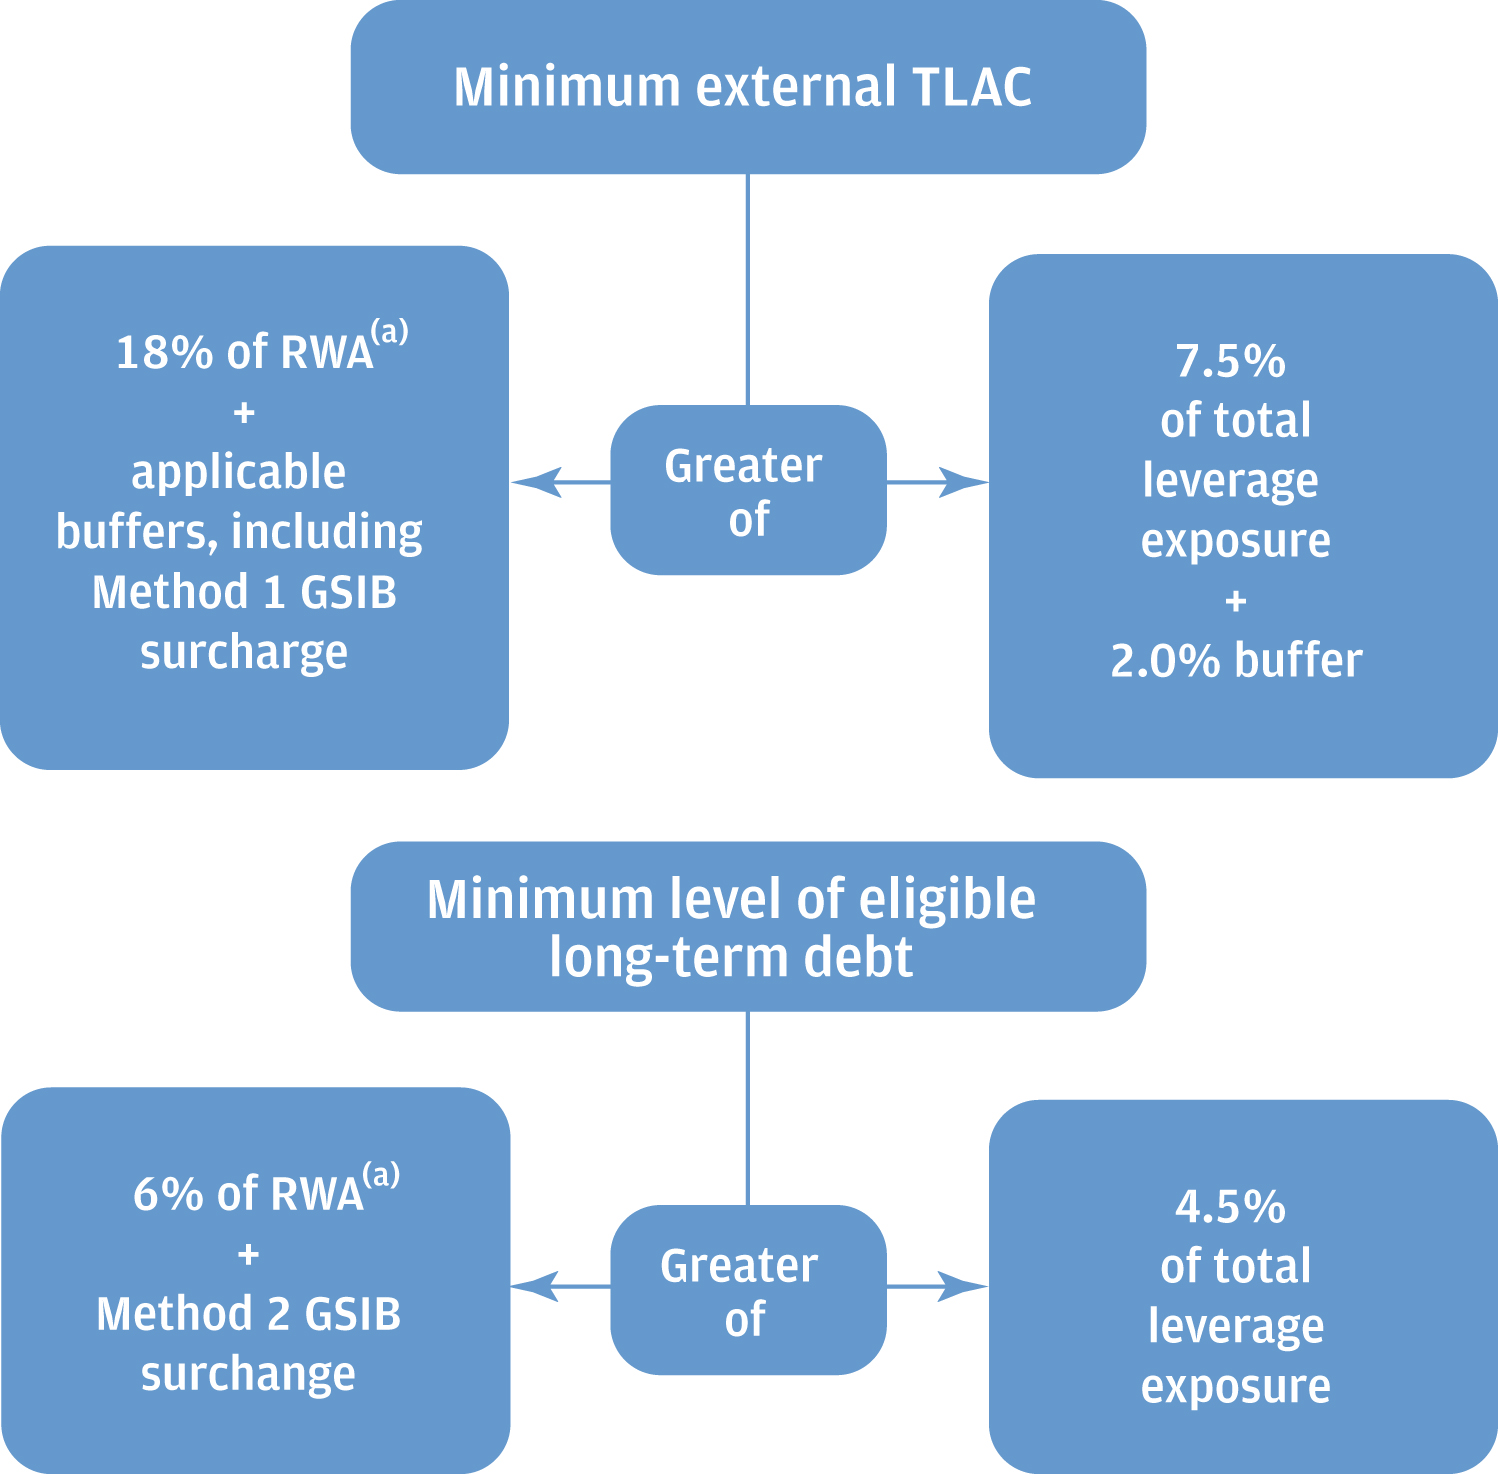
(a) RWA is the greater of Standardized and Advanced.
The final TLAC rule permanently grandfathered all long-term debt issued before December 31, 2016, to the extent these debt securities would be ineligible because they contained impermissible acceleration rights or were governed by non-U.S. law. As of September 30, 2017, the Firm is compliant with the requirements under the current rule to which it will be subject on January 1, 2019.
Broker-dealer regulatory capital
JPMorgan Securities
JPMorgan Chase's principal U.S. broker-dealer subsidiary is JPMorgan Securities. JPMorgan Securities is subject to Rule 15c3-1 under the Securities Exchange Act of 1934 (the "Net Capital Rule"). JPMorgan Securities is also registered as futures commission merchants and subject to Rule 1.17 of the Commodity Futures Trading Commission ("CFTC").
JPMorgan Securities has elected to compute its minimum net capital requirements in accordance with the "Alternative Net Capital Requirements" of the Net Capital Rule.
In accordance with the market and credit risk standards of Appendix E of the Net Capital Rule, JPMorgan Securities is eligible to use the alternative method of computing net capital if, in addition to meeting its minimum net capital requirement, it maintains tentative net capital of at least $1.0 billion and is also required to notify the Securities and Exchange Commission ("SEC") in the event that tentative net capital is less than $5.0 billion. As of September 30, 2017 , JPMorgan Securities maintained tentative net capital in excess of the minimum and notification requirements.
The following table presents JPMorgan Securities' net capital information:
September 30, 2017 | Net Capital | |||||
(in billions) | Actual | | Minimum | | ||
JPMorgan Securities | $ | 15.6 | | $ | 2.8 | |
J.P. Morgan Securities plc
J.P. Morgan Securities plc is a wholly-owned subsidiary of JPMorgan Chase Bank, N.A. and is the Firm's principal operating subsidiary in the U.K. It has authority to engage in banking, investment banking and broker-dealer activities. J.P. Morgan Securities plc is jointly regulated by the U.K. Prudential Regulatory Authority ("PRA") and the Financial Conduct Authority ("FCA"). J.P. Morgan Securities plc is subject to the European Union Capital Requirements Regulation and the U.K. PRA capital rules, each of which implemented Basel III and thereby subject J.P. Morgan Securities plc to its requirements.
The following table presents J.P. Morgan Securities plc's capital information:
September 30, 2017 | Total capital |
| CET1 ratio |
| Total capital ratio | ||||
(in billions, except ratios) | Estimated |
| Estimated | Minimum |
| Estimated | Minimum | ||
J.P. Morgan Securities plc | $ | 39.6 | |
| 15.9 | 4.5 |
| 15.9 | 8.0 |
48
CREDIT RISK MANAGEMENT | ||||
Credit risk is the risk of loss arising from the default of a customer, client or counterparty. The Firm provides credit to a variety of customers, ranging from large corporate and institutional clients to individual consumers and small businesses. For a further discussion of the Firm's Credit Risk Management framework and organization, and the identification, monitoring and management of credit risks, see Credit Risk Management on pages 86–107 of JPMorgan Chase's 2016 Annual Report.
In the following tables, total loans include loans retained (i.e., held-for-investment); loans held-for-sale; and certain loans accounted for at fair value. The following tables do not include certain loans the Firm accounts for at fair value and classifies as trading assets. For further information regarding these loans, see Notes 2 and 3 . For additional information on the Firm's loans, lending-related commitments and derivative receivables, including the Firm's accounting policies, see Notes 11 , 19 , and 4 , respectively.
For further information regarding the credit risk inherent in the Firm's cash placed with banks, see Wholesale credit exposure – industry exposures on pages 58–60 ; for information regarding the credit risk inherent in the
Firm's investment securities portfolio, see Note 9 of this Form 10-Q, and Note 12 of JPMorgan Chase's 2016 Annual Report; and for information regarding the credit risk inherent in the securities financing portfolio, see Note 10 of this Form 10-Q, and Note 13 of JPMorgan Chase's 2016 Annual Report.
Total credit portfolio |
|
|
|
| |||||||||
| Credit exposure |
| Nonperforming (b)(c) | ||||||||||
(in millions) | Sep 30, | | Dec 31, | |
| Sep 30, | | Dec 31, | | ||||
Loans retained | $ | 909,182 | | $ | 889,907 | |
| $ | 5,628 | | $ | 6,721 | |
Loans held-for-sale | 2,833 | | 2,628 | |
| 5 | | 162 | | ||||
Loans at fair value | 1,746 | | 2,230 | |
| - | | - | | ||||
Total loans | 913,761 | | 894,765 | |
| 5,633 | | 6,883 | | ||||
Derivative receivables | 58,260 | | 64,078 | |
| 164 | | 223 | | ||||
Receivables from customers and other | 19,350 | | 17,560 | |
| - | | - | | ||||
Total credit-related assets | 991,371 | | 976,403 | |
| 5,797 | | 7,106 | | ||||
Assets acquired in loan satisfactions |
|
|
|
|
| ||||||||
Real estate owned | NA | | NA | |
| 322 | | 370 | | ||||
Other | NA | | NA | |
| 35 | | 59 | | ||||
Total assets acquired in loan satisfactions | NA | | NA | |
| 357 | | 429 | | ||||
Total assets | 991,371 | | 976,403 | |
| 6,154 | | 7,535 | | ||||
Lending-related commitments | 1,002,092 | | 976,702 | |
| 764 | | 506 | | ||||
Total credit portfolio | $ | 1,993,463 | | $ | 1,953,105 | |
| $ | 6,918 | | $ | 8,041 | |
Credit derivatives used in credit portfolio management activities (a) | $ | (20,181 | ) | $ | (22,114 | ) |
| $ | - | | $ | - | |
Liquid securities and other cash collateral held against derivatives | (21,353 | ) | (22,705 | ) |
| NA | | NA | | ||||
(in millions, except ratios) | Three months ended September 30, |
| Nine months ended | ||||||||||
2017 | | 2016 | |
| 2017 | | 2016 | | |||||
Net charge-offs (d) | $ | 1,265 | | $ | 1,121 | |
| $ | 4,123 | | $ | 3,412 | |
Average retained loans |
|
|
|
|
| ||||||||
Loans | 903,892 | | 869,676 | |
| 894,170 | | 853,973 | | ||||
Loans – excluding residential real estate PCI loans | 871,465 | | 831,956 | |
| 860,443 | | 814,923 | | ||||
Net charge-off rates (d) |
|
|
|
|
| ||||||||
Loans | 0.56 | % | 0.51 | % |
| 0.62 | % | 0.53 | % | ||||
Loans – excluding PCI | 0.58 | | 0.54 | |
| 0.64 | | 0.56 | | ||||
(a) | Represents the net notional amount of protection purchased and sold through credit derivatives used to manage both performing and nonperforming wholesale credit exposures; these derivatives do not qualify for hedge accounting under U.S. GAAP. For additional information, see Credit derivatives on page 63 and Note 4 . |
(b) | Excludes PCI loans. The Firm is recognizing interest income on each pool of PCI loans as they are all performing. |
(c) | At September 30, 2017 , and December 31, 2016 , nonperforming assets excluded: (1) mortgage loans insured by U.S. government agencies of $4.0 billion and $5.0 billion , respectively, that are 90 or more days past due; (2) student loans insured by U.S. government agencies under the FFELP of zero and $263 million , respectively, that are 90 or more days past due; and (3) real estate owned ("REO") insured by U.S. government agencies of $99 million and $142 million , respectively. These amounts have been excluded based upon the government guarantee. In addition, the Firm's policy is generally to exempt credit card loans from being placed on nonaccrual status as permitted by regulatory guidance issued by the Federal Financial Institutions Examination Council ("FFIEC"). |
(d) | For the nine months ended September 30, 2017 , excluding net charge-offs of $467 million related to the student loan portfolio transfer, the net charge-off rate for loans would have been 0.55% and for loans – excluding PCI would have been 0.57%. For additional information refer to CCB segment results on page 21 . |
49
CONSUMER CREDIT PORTFOLIO | ||||
The Firm's retained consumer portfolio consists primarily of residential real estate loans, credit card loans, auto loans, and business banking loans, and associated lending-related commitments. The Firm's focus is on serving primarily the prime segment of the consumer credit market. For further
information on consumer loans, see Note 11 of this Form 10-Q and Consumer Credit Portfolio on pages 89–95 and Note 14 of JPMorgan Chase's 2016 Annual Report. For further information on lending-related commitments, see Note 19 of this Form 10-Q.
The following table presents consumer credit-related information with respect to the credit portfolio held by CCB, prime mortgage and home equity loans held by AWM, and prime mortgage loans held by Corporate.
Consumer credit portfolio |
|
|
|
|
|
|
|
|
|
|
|
|
|
| |||||||||||||||||||||
|
|
|
|
|
| Three months ended September 30, |
| Nine months ended September 30, | |||||||||||||||||||||||||||
| Credit exposure |
| Nonaccrual | Net | Average |
| Net | Average | |||||||||||||||||||||||||||
Sep 30, | |
| Dec 31, | |
| Sep 30, | | Dec 31, | | 2017 | | 2016 | | 2017 | | 2016 | |
| 2017 | | 2016 | | 2017 | | 2016 | | |||||||||
Consumer, excluding credit card |
|
|
|
|
|
|
|
|
|
|
|
|
|
|
| ||||||||||||||||||||
Loans, excluding PCI loans and loans held-for-sale |
|
|
|
|
|
|
|
|
|
|
|
|
|
|
| ||||||||||||||||||||
Home equity | $ | 34,657 | |
| $ | 39,063 | |
| $ | 1,601 | | $ | 1,845 | | $ | 13 | | $ | 45 | | 0.15 | % | 0.43 | % |
| $ | 71 | | $ | 140 | | 0.26 | % | 0.43 | % |
Residential mortgage (a) | 212,558 | |
| 192,486 | |
| 2,095 | | 2,256 | | 3 | | 9 | | 0.01 | | 0.02 | |
| 3 | | 13 | | - | | 0.01 | | ||||||||
Auto (b)(c) | 65,102 | |
| 65,814 | |
| 188 | | 214 | | 116 | | 79 | | 0.71 | | 0.49 | |
| 245 | | 192 | | 0.50 | | 0.41 | | ||||||||
Consumer & Business | 25,275 | |
| 24,307 | |
| 274 | | 287 | | 71 | | 71 | | 1.12 | | 1.19 | |
| 184 | | 180 | | 0.99 | | 1.04 | | ||||||||
Student (a)(e) | - | |
| 7,057 | |
| - | | 165 | | - | | 32 | | - | | 1.70 | |
| 498 | | 98 | | NM | | 1.69 | | ||||||||
Total loans, excluding PCI loans and loans held-for-sale | 337,592 | |
| 328,727 | |
| 4,158 | | 4,767 | | 203 | | 236 | | 0.24 | | 0.29 | |
| 1,001 | | 623 | | 0.40 | | 0.26 | | ||||||||
Loans – PCI |
|
|
|
|
|
|
|
|
|
|
|
|
|
|
| ||||||||||||||||||||
Home equity | 11,321 | |
| 12,902 | |
| NA | | NA | | NA | | NA | | NA | | NA | |
| NA | | NA | | NA | | NA | | ||||||||
Prime mortgage | 6,747 | |
| 7,602 | |
| NA | | NA | | NA | | NA | | NA | | NA | |
| NA | | NA | | NA | | NA | | ||||||||
Subprime mortgage | 2,691 | |
| 2,941 | |
| NA | | NA | | NA | | NA | | NA | | NA | |
| NA | | NA | | NA | | NA | | ||||||||
Option ARMs (f) | 11,062 | |
| 12,234 | |
| NA | | NA | | NA | | NA | | NA | | NA | |
| NA | | NA | | NA | | NA | | ||||||||
Total loans – PCI | 31,821 | |
| 35,679 | |
| NA | | NA | | NA | | NA | | NA | | NA | |
| NA | | NA | | NA | | NA | | ||||||||
Total loans – retained | 369,413 | |
| 364,406 | |
| 4,158 | | 4,767 | | 203 | | 236 | | 0.22 | | 0.26 | |
| 1,001 | | 623 | | 0.37 | | 0.23 | | ||||||||
Loans held-for-sale | 188 | | (j) | 238 | | (j) | 3 | | 53 | | - | | - | | - | | - | |
| - | | - | | - | | - | | ||||||||
Total consumer, excluding credit card loans | 369,601 | |
| 364,644 | |
| 4,161 | | 4,820 | | 203 | | 236 | | 0.22 | | 0.26 | |
| 1,001 | | 623 | | 0.37 | | 0.23 | | ||||||||
Lending-related commitments (g) | 55,071 | |
| 54,797 | |
|
|
|
|
|
|
|
|
|
|
|
| ||||||||||||||||||
Receivables from customers (h) | 132 | |
| 120 | |
|
|
|
|
|
|
|
|
|
|
|
| ||||||||||||||||||
Total consumer exposure, excluding credit card | 424,804 | |
| 419,561 | |
|
|
|
|
|
|
|
|
|
|
|
| ||||||||||||||||||
Credit card |
|
|
|
|
|
|
|
|
|
|
|
|
|
|
| ||||||||||||||||||||
Loans retained (i) | 141,200 | |
| 141,711 | |
| - | | - | | 1,019 | | 838 | | 2.87 | | 2.51 | |
| 3,049 | | 2,528 | | 2.94 | | 2.61 | | ||||||||
Loans held-for-sale | 113 | |
| 105 | |
| - | | - | | - | | - | | - | | - | |
| - | | - | | - | | - | | ||||||||
Total credit card loans | 141,313 | |
| 141,816 | |
| - | | - | | 1,019 | | 838 | | 2.87 | | 2.51 | |
| 3,049 | | 2,528 | | 2.94 | | 2.61 | | ||||||||
Lending-related commitments (g) | 574,641 | |
| 553,891 | |
|
|
|
|
|
|
|
|
|
|
|
| ||||||||||||||||||
Total credit card exposure | 715,954 | |
| 695,707 | |
|
|
|
|
|
|
|
|
|
|
|
| ||||||||||||||||||
Total consumer credit portfolio | $ | 1,140,758 | |
| $ | 1,115,268 | |
| $ | 4,161 | | $ | 4,820 | | $ | 1,222 | | $ | 1,074 | | 0.95 | % | 0.86 | % |
| $ | 4,050 | | $ | 3,151 | | 1.07 | % | 0.87 | % |
Memo: Total consumer credit portfolio, excluding PCI | $ | 1,108,937 | |
| $ | 1,079,589 | |
| $ | 4,161 | | $ | 4,820 | | $ | 1,222 | | $ | 1,074 | | 1.02 | % | 0.93 | % |
| $ | 4,050 | | $ | 3,151 | | 1.15 | % | 0.94 | % |
(a) | Certain loan portfolios have been reclassified. The prior period amounts have been revised to conform with the current period presentation. |
(b) | At September 30, 2017 , and December 31, 2016 , excluded operating lease assets of $16.2 billion and $13.2 billion , respectively. These operating lease assets are included in other assets on the Firm's Consolidated balance sheets. |
(c) | Includes certain business banking and auto dealer risk-rated loans that apply the wholesale methodology for determining the allowance for loan losses; these loans are managed by CCB, and therefore, for consistency in presentation, are included within the consumer portfolio. |
(d) | Predominantly includes Business Banking loans. |
(e) | For the nine months ended September 30, 2017, excluding net charge-offs of $467 million related to the student loan portfolio transfer, the net charge-off rate for Total consumer, excluding credit card and PCI loans and loans held-for-sale would have been 0.22%; Total consumer– retained excluding credit card loans would have been 0.20%; Total consumer credit portfolio would have been 0.95%; and Total consumer credit portfolio, excluding PCI loans would have been 1.02%. For additional information refer to CCB segment results on page 21 . |
(f) | At September 30, 2017 , and December 31, 2016 , approximately 68% and 66% , respectively, of the PCI option adjustable rate mortgage ("ARM") portfolio has been modified into fixed-rate, fully amortizing loans. |
(g) | Credit card and home equity lending-related commitments represent the total available lines of credit for these products. The Firm has not experienced, and does not anticipate, that all available lines of credit would be used at the same time. For credit card and home equity commitments (if certain conditions are met), the Firm can reduce or cancel these lines of credit by providing the borrower notice or, in some cases as permitted by law, without notice. |
50
(h) | Receivables from customers represent margin loans to brokerage customers that are collateralized through assets maintained in the clients' brokerage accounts, as such no allowance is held against these receivables. These receivables are reported within accrued interest and accounts receivable on the Firm's Consolidated balance sheets. |
(i) | Includes billed interest and fees net of an allowance for uncollectible interest and fees. |
(j) | Includes residential mortgage loans held-for-sale at both September 30, 2017 and December 31, 2016 . Also includes student loans held-for-sale at September 30, 2017. |
(k) | At September 30, 2017 and December 31, 2016 , nonaccrual loans excluded loans 90 or more days past due as follows: (1) mortgage loans insured by U.S. government agencies of $4.0 billion and $5.0 billion , respectively; and (2) student loans insured by U.S. government agencies under the FFELP of zero and $263 million , respectively. These amounts have been excluded from nonaccrual loans based upon the government guarantee. In addition, the Firm's policy is generally to exempt credit card loans from being placed on nonaccrual status, as permitted by regulatory guidance issued by the FFIEC. |
(l) | Excludes PCI loans. The Firm is recognizing interest income on each pool of PCI loans as they are all performing. |
(m) | Net charge-offs and the net charge-off rates excluded write-offs in the PCI portfolio of $20 million and $36 million for the three months ended September 30, 2017 and 2016 , respectively, and $66 million and $124 million for the nine months ended September 30, 2017 and 2016 , respectively. These write-offs decreased the allowance for loan losses for PCI loans. See Allowance for Credit Losses on pages 64–66 for further details. |
(n) | Net charge-offs and net charge-off rates for the three and nine months ended September 30, 2017 included $63 million of incremental charge-offs recorded in accordance with regulatory guidance regarding the timing of loss recognition for certain auto and residential real estate loans in bankruptcy and auto loans where assets were acquired in loan satisfaction. |
(o) | Average consumer loans held-for-sale were $339 million and $337 million for the three months ended September 30, 2017 and 2016 , respectively, and $1.9 billion and $372 million for the nine months ended September 30, 2017 and 2016 , respectively. These amounts were excluded when calculating net charge-off rates. |
Consumer, excluding credit card
Portfolio analysis
Consumer loan balances increased from December 31, 2016 predominantly due to originations of high-quality prime mortgage loans that have been retained on the balance sheet, partially offset by the sale of the student loan portfolio as well as paydowns and the charge-off or liquidation of delinquent loans. The credit environment remained favorable as a result of low unemployment levels and increases in home prices.
PCI loans are excluded from the following discussions of individual loan products and are addressed separately below. For further information about the Firm's consumer portfolio, including information about delinquencies, loan modifications and other credit quality indicators, see
Note 11 of this Form 10-Q.
Home equity: The home equity portfolio declined from December 31, 2016 primarily reflecting loan paydowns and charge-offs. Both early-stage and late-stage delinquencies showed improvement from December 31, 2016 . Nonaccrual loans decreased from December 31, 2016 primarily as a result of loss mitigation activities. Net charge-offs for the three and nine months ended September 30, 2017 declined when compared with the same periods of the prior year, partially as a result of lower loan balances.
At September 30, 2017 , approximately 90% of the Firm's home equity portfolio consists of home equity lines of credit ("HELOCs") and the remainder consists of home equity loans ("HELOANs"). For further information on the Firm's home equity portfolio, see Note 11 of this Form 10-Q and Consumer Credit Portfolio on pages 89–95 of JPMorgan Chase's 2016 Annual Report.
The carrying value of HELOCs outstanding was $31 billion at September 30, 2017 . Of such amounts, $14 billion have recast from interest-only to fully amortizing payments or have been modified. Of the remaining $17 billion , approximately:
• | $12 billion are scheduled to recast from interest-only to fully amortizing payments in future periods, and |
• | $5 billion are interest-only balloon HELOCs, which primarily mature after 2030. |
The following chart illustrates the payment recast composition of the approximately $ 17 billion of HELOCs scheduled to recast in the future, based upon their current contractual terms.
HELOCs scheduled to recast
(at September 30, 2017)
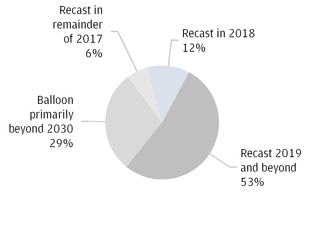 The Firm has considered this payment recast risk in its allowance for loan losses based upon the estimated amount of payment shock (i.e., the excess of the fully-amortizing payment over the interest-only payment in effect prior to recast) resulting from the increase in the monthly payment expected to occur at the payment recast date, along with the corresponding estimated probability of default ("PD") and loss severity assumptions. As part of its allowance estimate, the Firm also expects, based on observed activity in recent years, that approximately 25% of the carrying value of HELOCs scheduled to recast will voluntarily pre-pay prior to or after the recast. The HELOCs that have previously recast to fully amortizing payments generally have higher delinquency rates than the HELOCs within the revolving period, primarily as a result of the payment shock at the time of recast. Certain other factors, such as future developments in both unemployment rates and home prices, could also have a significant impact on the performance of these loans.
 51
The Firm manages the risk of HELOCs during their revolving period by closing or reducing the undrawn line to the extent permitted by law when borrowers are exhibiting a material deterioration in their credit risk profile. The Firm will continue to evaluate both the near-term and longer-term recast risks inherent in its HELOC portfolio to ensure that changes in the Firm's estimate of incurred losses are appropriately considered in the allowance for loan losses and that the Firm's account management practices are appropriate given the portfolio's risk profile.
Junior lien loans where the borrower has a senior lien loan that is either delinquent or has been modified are considered high-risk seconds. Such loans are considered to pose a higher risk of default than junior lien loans for which the senior lien is neither delinquent nor modified. At September 30, 2017 , the Firm estimated that the carrying value of its home equity portfolio contained approximately $0.8 billion of current junior lien loans that were considered high risk seconds, compared with $1.1 billion at December 31, 2016 . The Firm estimates the balance of its total exposure to high-risk seconds on a quarterly basis using internal data and loan level credit bureau data (which typically provides the delinquency status of the senior lien). The Firm considers the increased PD associated with these high-risk seconds in estimating the allowance for loan losses and classifies those loans that are subordinated to a first lien loan that is more than 90 days delinquent as nonaccrual loans. The estimated balance of these high-risk seconds may vary from quarter to quarter for reasons such as the movement of related senior liens into and out of the 30+ day delinquency bucket. The Firm continues to monitor the risks associated with these loans. For further information, see Note 11 .
Residential mortgage: The residential mortgage portfolio predominantly consists of high-quality prime mortgage loans, with a small component (approximately 1% ) of the residential mortgage portfolio consisting of subprime mortgage loans. These subprime mortgage loans continue to run-off and are performing in line with expectations. The residential mortgage portfolio, including loans held-for-sale, increased from December 31, 2016 due to retained originations of primarily high-quality fixed rate prime mortgage loans partially offset by paydowns and the charge-off or liquidation of delinquent loans. Both early-stage and late-stage delinquencies showed improvement from December 31, 2016 . Nonaccrual loans decreased from December 31, 2016 primarily as a result of loss mitigation activities. Net charge-offs for the three and nine months ended September 30, 2017 remain low, reflecting continued improvement in home prices and delinquencies.
At September 30, 2017 , and December 31, 2016 , the Firm's residential mortgage portfolio, including loans held-for-sale, included $8.4 billion and $9.5 billion , respectively, of mortgage loans insured and/or guaranteed by U.S. government agencies, of which $5.9 billion and $7.0 billion , respectively, were 30 days or more past due (of these past due loans, $4.0 billion and $5.0 billion , respectively, were
90 days or more past due). The Firm monitors its exposure to certain potential unrecoverable claim payments related to government-insured loans and considers this exposure in estimating the allowance for loan losses.
At September 30, 2017 , and December 31, 2016 , the Firm's residential mortgage portfolio included $19.8 billion and $19.1 billion , respectively, of interest-only loans. These loans have an interest-only payment period generally followed by an adjustable-rate or fixed-rate fully amortizing payment period to maturity and are typically originated as higher-balance loans to higher-income borrowers. To date, losses on this portfolio generally have been consistent with the broader residential mortgage portfolio and the Firm's expectations. The Firm continues to monitor the risks associated with these loans.
Auto: Auto loans were relatively flat compared with December 31, 2016 , as paydowns and the charge-off or liquidation of delinquent loans were largely offset by new originations. Nonaccrual loans decreased compared with December 31, 2016 . Net charge-offs for the three and nine months ended September 30, 2017 increased compared with the same period in the prior year, primarily as a result of an incremental $49 million recorded in accordance with regulatory guidance regarding the timing of loss recognition for certain loans in bankruptcy and loans where assets were acquired in loan satisfaction. The auto portfolio predominantly consists of prime-quality loans.
Consumer & Business Banking: Consumer & Business Banking loans increased compared with December 31, 2016 , as growth in loan originations was partially offset by paydowns and the charge-off or liquidation of delinquent loans. Nonaccrual loans decreased compared with December 31, 2016 . Net charge-offs for the three and nine months ended September 30, 2017 were relatively flat compared to the prior year.
Student: The Firm transferred the student loan portfolio to held-for-sale in the first quarter of 2017 and sold substantially all of the portfolio in the second quarter of 2017. Net charge-offs for the nine months ended September 30, 2017 increased as a result of the write-down of the portfolio at the time of the transfer.
Purchased credit-impaired loans: PCI loans decreased as the portfolio continues to run off. As of September 30, 2017 , approximately 11% of the option ARM PCI loans were delinquent and approximately 68% of the portfolio had been modified into fixed-rate, fully amortizing loans. Substantially all of the remaining loans are making amortizing payments, although such payments are not necessarily fully amortizing. This latter group of loans is subject to the risk of payment shock due to future payment recast. Default rates generally increase on option ARM loans when payment recast results in a payment increase. The expected increase in default rates is considered in the Firm's quarterly impairment assessment.
52
The following table provides a summary of lifetime principal loss estimates included in either the nonaccretable difference or the allowance for loan losses.
Summary of PCI loans lifetime principal loss estimates | |||||||||||||||
| Lifetime loss estimates (a) |
| Life-to-date liquidation losses (b) | ||||||||||||
(in billions) | Sep 30, | |
| Dec 31, | |
| Sep 30, | |
| Dec 31, | | ||||
Home equity | $ | 14.2 | |
| $ | 14.4 | |
| $ | 12.9 | |
| $ | 12.8 | |
Prime mortgage | 4.0 | |
| 4.0 | |
| 3.8 | |
| 3.7 | | ||||
Subprime mortgage | 3.3 | |
| 3.2 | |
| 3.1 | |
| 3.1 | | ||||
Option ARMs | 10.0 | |
| 10.0 | |
| 9.7 | |
| 9.7 | | ||||
Total | $ | 31.5 | |
| $ | 31.6 | |
| $ | 29.5 | |
| $ | 29.3 | |
(a) | Includes the original nonaccretable difference established in purchase accounting of $30.5 billion for principal losses plus additional principal losses recognized subsequent to acquisition through the provision and allowance for loan losses. The remaining nonaccretable difference for principal losses was $900 million and $1.1 billion at September 30, 2017 , and December 31, 2016 , respectively. |
(b) | Life-to-date liquidation losses represent both realization of loss upon loan resolution and any principal forgiven upon modification. |
Current estimated loan-to-value ratio of residential real estate loans
The current estimated average loan-to-value ("LTV") ratio for residential real estate loans retained, excluding mortgage loans guaranteed and/or insured by U.S. government agencies and PCI loans, was 57% at September 30, 2017 , compared with 58% at December 31, 2016 . The current estimated average LTV ratio for residential real estate PCI loans, based on the unpaid principal balances, was 61% at September 30, 2017 , compared with 64% at December 31, 2016 .
Average LTV ratios have declined consistent with recent improvements in home prices, customer pay downs, and charge-offs or liquidations of higher LTV loans. For further information on current estimated LTVs on residential real estate loans, see Note 11 .
Geographic composition of residential real estate loans
For information on the geographic composition of the Firm's residential real estate loans, see Note 11 .
Loan modification activities – residential real estate loans
The performance of modified loans generally differs by product type due to differences in both the credit quality and the types of modifications provided. The performance of modifications completed under both the U.S. Government's Home Affordable Modification Program ("HAMP") and the Firm's proprietary modification programs (primarily the Firm's modification program that was modeled after HAMP), as measured through cumulative redefault rates, was not materially different from December 31, 2016 . For further information on the Firm's cumulative redefault rates see Consumer Credit Portfolio on pages 89–95 of JPMorgan Chase's 2016 Annual Report.
Certain loans that were modified under HAMP and the Firm's proprietary modification programs have interest rate reset provisions ("step-rate modifications"). Interest rates on these loans generally began to increase commencing in 2014 by 1% per year, and will continue to do so, until the rate reaches a specified cap. The cap on these loans is typically at a prevailing market interest rate for a fixed-rate mortgage loan as of the modification date. At September 30, 2017 , the carrying value of non-PCI loans and the unpaid principal balance of PCI loans modified in step-rate modifications, which have not yet met their specified caps, were $3 billion and $8 billion , respectively. The Firm continues to monitor this risk exposure and the impact of these potential interest rate increases is considered in the Firm's allowance for loan losses.
The following table presents information as of September 30, 2017 , and December 31, 2016 , relating to modified retained residential real estate loans for which concessions have been granted to borrowers experiencing financial difficulty. For further information on modifications for the three and nine months ended September 30, 2017 and 2016 , see Note 11 .
Modified residential real estate loans | |||||||||||||
| September 30, 2017 |
| December 31, 2016 | ||||||||||
(in millions) | Retained loans | Non-accrual |
| Retained loans | Non-accrual | ||||||||
Modified residential real estate loans, excluding PCI loans (a)(b) |
|
|
|
|
| ||||||||
Home equity | $ | 2,134 | | $ | 1,021 | |
| $ | 2,264 | | $ | 1,116 | |
Residential mortgage | 5,667 | | 1,656 | |
| 6,032 | | 1,755 | | ||||
Total modified residential real estate loans, excluding PCI loans | $ | 7,801 | | $ | 2,677 | |
| $ | 8,296 | | $ | 2,871 | |
Modified PCI loans (c) |
|
|
|
|
| ||||||||
Home equity | $ | 2,315 | | NA | |
| $ | 2,447 | | NA | | ||
Prime mortgage | 4,624 | | NA | |
| 5,052 | | NA | | ||||
Subprime mortgage | 2,747 | | NA | |
| 2,951 | | NA | | ||||
Option ARMs | 8,523 | | NA | |
| 9,295 | | NA | | ||||
Total modified PCI loans | $ | 18,209 | | NA | |
| $ | 19,745 | | NA | | ||
(a) | Amounts represent the carrying value of modified residential real estate loans. |
(b) | At September 30, 2017 , and December 31, 2016 , $3.7 billion and $3.4 billion , respectively, of loans modified subsequent to repurchase from Ginnie Mae in accordance with the standards of the appropriate government agency (i.e., Federal Housing Administration ("FHA"), U.S. Department of Veterans Affairs ("VA"), Rural Housing Service of the U.S. Department of Agriculture ("RHS")) are not included in the table above. When such loans perform subsequent to modification in accordance with Ginnie Mae guidelines, they are generally sold back into Ginnie Mae loan pools. Modified loans that do not re-perform become subject to foreclosure. For additional information about sales |
of loans in securitization transactions with Ginnie Mae, see Note 13 .
(c) | Amounts represent the unpaid principal balance of modified PCI loans. |
(d) | At September 30, 2017 , and December 31, 2016 , nonaccrual loans included $2.2 billion and $2.3 billion , respectively, of troubled debt restructurings ("TDRs") for which the borrowers were less than 90 days past due. For additional information about loans modified in a TDR that are on nonaccrual status, see Note 11 . |
53
Nonperforming assets
The following table presents information as of September 30, 2017 , and December 31, 2016 , about consumer, excluding credit card, nonperforming assets.
Nonperforming assets (a) |
|
|
| ||||
(in millions) | September 30, | |
| December 31, | | ||
Nonaccrual loans (b) |
|
|
| ||||
Residential real estate (c) | $ | 3,696 | |
| $ | 4,154 | |
Other consumer (c) | 465 | |
| 666 | | ||
Total nonaccrual loans | 4,161 | |
| 4,820 | | ||
Assets acquired in loan satisfactions |
|
|
| ||||
Real estate owned | 229 | |
| 292 | | ||
Other | 33 | |
| 57 | | ||
Total assets acquired in loan satisfactions | 262 | |
| 349 | | ||
Total nonperforming assets | $ | 4,423 | |
| $ | 5,169 | |
(a) | At September 30, 2017 , and December 31, 2016 , nonperforming assets excluded: (1) mortgage loans insured by U.S. government agencies of $4.0 billion and $5.0 billion , respectively, that are 90 or more days past due; (2) student loans insured by U.S. government agencies under the FFELP of zero and $263 million , respectively, that are 90 or more days past due; and (3) REO insured by U.S. government agencies of $99 million and $142 million , respectively. These amounts have been excluded based upon the government guarantee. |
(b) | Excludes PCI loans which are accounted for on a pool basis. Since each pool is accounted for as a single asset with a single composite interest rate and an aggregate expectation of cash flows, the past-due status of the pools, or that of individual loans within the pools, is not meaningful. The Firm is recognizing interest income on each pool of loans as they are all performing. |
(c) | Certain loan portfolios have been reclassified. The prior period amounts have been revised to conform with the current period presentation. |
Nonaccrual loans in the residential real estate portfolio decreased to $3.7 billion at September 30, 2017 from $4.2 billion at December 31, 2016 , of which 26% and 29% , respectively, were greater than 150 days past due. In the aggregate, the unpaid principal balance of residential real estate loans greater than 150 days past due was charged down by approximately 42% and 43% , respectively, to the estimated net realizable value of the collateral at September 30, 2017 , and December 31, 2016 .
Active and suspended foreclosure: For information on loans that were in the process of active or suspended foreclosure, see Note 11 .
Nonaccrual loans: The following table presents changes in consumer, excluding credit card, nonaccrual loans for the nine months ended September 30, 2017 and 2016 .
Nonaccrual loan activity |
|
| |||||
Nine months ended September 30, (in millions) |
| 2017 | | 2016 | | ||
Beginning balance |
| $ | 4,820 | | $ | 5,413 | |
Additions |
| 2,553 | | 2,804 | | ||
Reductions: |
|
| | | |||
Principal payments and other (a) |
| 1,245 | | 1,078 | | ||
Charge-offs |
| 561 | | 572 | | ||
Returned to performing status |
| 1,121 | | 1,215 | | ||
Foreclosures and other liquidations |
| 285 | | 391 | | ||
Total reductions |
| 3,212 | | 3,256 | | ||
Net changes |
| (659 | ) | (452 | ) | ||
Ending balance |
| $ | 4,161 | | $ | 4,961 | |
(a) | Other reductions includes loan sales. |
54
Credit card
Total credit card loans decreased from December 31, 2016 due to seasonality. The September 30, 2017 30+ day delinquency rate increased to 1.76% from 1.61% at December 31, 2016 , but remains near record lows. Net charge-offs increased for the three and nine months ended September 30, 2017 primarily due to seasoning of newer vintages in line with expectations. The credit card portfolio continues to reflect a largely well-seasoned portfolio that has good U.S. geographic diversification. The higher mix of near-prime accounts in recent credit card originations have generated higher loss rates than the more seasoned portion of the portfolio; however, they are in line with the Firm's credit parameters and once seasoned, these accounts have net revenue rates and returns on equity that are higher than the portfolio average. For information on the geographic and FICO composition of the Firm's credit card loans, see Note 11 .
Modifications of credit card loans
At both September 30, 2017 and December 31, 2016 , the Firm had $1.2 billion of credit card loans outstanding that have been modified in TDRs. These balances included both credit card loans with modified payment terms and credit card loans that reverted back to their pre-modification payment terms because the cardholder did not comply with the modified payment terms.
Consistent with the Firm's policy, all credit card loans typically remain on accrual status until charged-off. However, the Firm establishes an allowance, which is offset against loans and charged to interest income, for the estimated uncollectible portion of accrued and billed interest and fee income.
For additional information about loan modification programs to borrowers, see Note 11 .
55
WHOLESALE CREDIT PORTFOLIO | ||||
The Firm's wholesale businesses are exposed to credit risk through underwriting, lending, market-making, and hedging activities with and for clients and counterparties, as well as through various operating services such as cash management and clearing activities. A portion of the loans originated or acquired by the Firm's wholesale businesses is generally retained on the balance sheet. The Firm distributes a significant percentage of the loans it originates into the market as part of its syndicated loan business and to manage portfolio concentrations and credit risk.
The wholesale credit portfolio continued to be generally stable for the nine months ended September 30, 2017 , characterized by low levels of criticized exposure, nonaccrual loans and charge-offs. See industry discussion on pages 58–60 for further information. The increase in retained loans was driven by new originations in CB and higher loans to Private Banking clients in AWM, which was partially offset by paydowns in CIB. Discipline in underwriting across all areas of lending continues to remain a key point of focus. The wholesale portfolio is actively managed, in part by conducting ongoing, in-depth reviews of client credit quality and transaction structure inclusive of collateral where applicable, as well as reviews of industry, product and client concentrations.
In the following tables, the Firm's wholesale credit portfolio includes exposure held in CIB, CB, AWM and Corporate, and excludes all exposure managed by CCB.
Wholesale credit portfolio | |||||||||||||
| Credit exposure |
| Nonperforming (c) | ||||||||||
(in millions) | Sep 30, | | Dec 31, | |
| Sep 30, | | Dec 31, | | ||||
Loans retained | $ | 398,569 | | $ | 383,790 | |
| $ | 1,470 | | $ | 1,954 | |
Loans held-for-sale | 2,532 | | 2,285 | |
| 2 | | 109 | | ||||
Loans at fair value | 1,746 | | 2,230 | |
| - | | - | | ||||
Loans | 402,847 | | 388,305 | |
| 1,472 | | 2,063 | | ||||
Derivative receivables | 58,260 | | 64,078 | |
| 164 | | 223 | | ||||
Receivables from customers and other (a) | 19,218 | | 17,440 | |
| - | | - | | ||||
Total wholesale credit-related assets | 480,325 | | 469,823 | |
| 1,636 | | 2,286 | | ||||
Lending-related commitments | 372,380 | | 368,014 | |
| 764 | | 506 | | ||||
Total wholesale credit exposure | $ | 852,705 | | $ | 837,837 | |
| $ | 2,400 | | $ | 2,792 | |
Credit derivatives used in credit portfolio management activities (b) | $ | (20,181 | ) | $ | (22,114 | ) |
| $ | - | | $ | - | |
Liquid securities and other cash collateral held against derivatives | (21,353 | ) | (22,705 | ) |
| NA | | NA | | ||||
(a) | Receivables from customers and other include $19.1 billion and $17.3 billion of margin loans at September 30, 2017 , and December 31, 2016 , respectively, to prime brokerage customers; these are classified in accrued interest and accounts receivable on the Consolidated balance sheets. |
(b) | Represents the net notional amount of protection purchased and sold through credit derivatives used to manage both performing and nonperforming wholesale credit exposures; these derivatives do not qualify for hedge accounting under U.S. GAAP. For additional information, see Credit derivatives on page 63 , and Note 4 . |
(c) | Excludes assets acquired in loan satisfactions. |
56
The following tables present the maturity and ratings profiles of the wholesale credit portfolio as of September 30, 2017 , and December 31, 2016 . The ratings scale is based on the Firm's internal risk ratings, which generally correspond to the ratings assigned by S&P and Moody's. For additional information on wholesale loan portfolio risk ratings, see Note 14 of JPMorgan Chase's 2016 Annual Report.
Wholesale credit exposure – maturity and ratings profile |
|
|
|
|
|
| |||||||||||||||||||
| Maturity profile (d) |
| Ratings profile | ||||||||||||||||||||||
| Due in 1 year or less | Due after 1 year through 5 years | Due after 5 years | Total |
| Investment-grade |
| Noninvestment-grade | Total | Total % of IG | |||||||||||||||
September 30, 2017 |
| AAA/Aaa to BBB-/Baa3 |
| BB+/Ba1 & below | |||||||||||||||||||||
Loans retained | $ | 118,523 | | $ | 176,895 | | $ | 103,151 | | $ | 398,569 | |
| $ | 307,194 | |
| $ | 91,375 | | $ | 398,569 | | 77 | % |
Derivative receivables |
|
|
| 58,260 | |
|
|
|
| 58,260 | |
| |||||||||||||
Less: Liquid securities and other cash collateral held against derivatives |
|
|
| (21,353 | ) |
|
|
|
| (21,353 | ) |
| |||||||||||||
Total derivative receivables, net of all collateral | 19,998 | | 8,126 | | 8,783 | | 36,907 | |
| 29,893 | |
| 7,014 | | 36,907 | | 81 | | |||||||
Lending-related commitments | 93,737 | | 265,830 | | 12,813 | | 372,380 | |
| 277,432 | |
| 94,948 | | 372,380 | | 75 | | |||||||
Subtotal | 232,258 | | 450,851 | | 124,747 | | 807,856 | |
| 614,519 | |
| 193,337 | | 807,856 | | 76 | | |||||||
Loans held-for-sale and loans at fair value (a) |
|
|
| 4,278 | |
|
|
|
| 4,278 | |
| |||||||||||||
Receivables from customers and other |
|
|
| 19,218 | |
|
|
|
| 19,218 | |
| |||||||||||||
Total exposure – net of liquid securities and other cash collateral held against derivatives |
|
|
| $ | 831,352 | |
|
|
|
| $ | 831,352 | |
| |||||||||||
Credit derivatives used in credit portfolio management activities (b)(c) | $ | (1,301 | ) | $ | (11,306 | ) | $ | (7,574 | ) | $ | (20,181 | ) |
| $ | (17,226 | ) |
| $ | (2,955 | ) | $ | (20,181 | ) | 85 | % |
| Maturity profile (d) |
| Ratings profile | ||||||||||||||||||||||
| Due in 1 year or less | Due after 1 year through 5 years | Due after 5 years | Total |
| Investment-grade |
| Noninvestment-grade | Total | Total % of IG | |||||||||||||||
December 31, 2016 |
| AAA/Aaa to BBB-/Baa3 |
| BB+/Ba1 & below | |||||||||||||||||||||
Loans retained | $ | 117,238 | | $ | 167,235 | | $ | 99,317 | | $ | 383,790 | |
| $ | 289,923 | |
| $ | 93,867 | | $ | 383,790 | | 76 | % |
Derivative receivables |
|
|
| 64,078 | |
|
|
|
| 64,078 | |
| |||||||||||||
Less: Liquid securities and other cash collateral held against derivatives |
|
|
| (22,705 | ) |
|
|
|
| (22,705 | ) |
| |||||||||||||
Total derivative receivables, net of all collateral | 14,019 | | 8,510 | | 18,844 | | 41,373 | |
| 33,081 | |
| 8,292 | | 41,373 | | 80 | | |||||||
Lending-related commitments | 88,399 | | 271,825 | | 7,790 | | 368,014 | |
| 269,820 | |
| 98,194 | | 368,014 | | 73 | | |||||||
Subtotal | 219,656 | | 447,570 | | 125,951 | | 793,177 | |
| 592,824 | |
| 200,353 | | 793,177 | | 75 | | |||||||
Loans held-for-sale and loans at fair value (a) |
|
|
| 4,515 | |
|
|
|
| 4,515 | |
| |||||||||||||
Receivables from customers and other |
|
|
| 17,440 | |
|
|
|
| 17,440 | |
| |||||||||||||
Total exposure – net of liquid securities and other cash collateral held against derivatives |
|
|
| $ | 815,132 | |
|
|
|
| $ | 815,132 | |
| |||||||||||
Credit derivatives used in credit portfolio management activities (b)(c) | $ | (1,354 | ) | $ | (16,537 | ) | $ | (4,223 | ) | $ | (22,114 | ) |
| $ | (18,710 | ) |
| $ | (3,404 | ) | $ | (22,114 | ) | 85 | % |
(a) | Represents loans held-for-sale, primarily related to syndicated loans and loans transferred from the retained portfolio, and loans at fair value. |
(b) | These derivatives do not qualify for hedge accounting under U.S. GAAP. |
(c) | The notional amounts are presented on a net basis by underlying reference entity and the ratings profile shown is based on the ratings of the reference entity on which protection has been purchased. Predominantly all of the credit derivatives entered into by the Firm where it has purchased protection, including credit derivatives used in credit portfolio management activities, are executed with investment-grade counterparties. |
(d) | The maturity profile of retained loans, lending-related commitments and derivative receivables is based on the remaining contractual maturity. Derivative contracts that are in a receivable position at September 30, 2017 , may become payable prior to maturity based on their cash flow profile or changes in market conditions. |
57
Wholesale credit exposure – industry exposures
The Firm focuses on the management and diversification of its industry exposures, and pays particular attention to industries with actual or potential credit concerns. Exposures deemed criticized align with the U.S. banking regulators' definition of criticized exposures, which consist of the special mention, substandard and doubtful
categories. The total criticized component of the portfolio, excluding loans held-for-sale and loans at fair value, was $16.7 billion at September 30, 2017 , compared with $19.8 billion at December 31, 2016 , driven by a 36% decrease in Oil & Gas.
Effective in the first quarter of 2017, the Firm revised its methodology for the assignment of industry classifications, to better monitor and manage concentrations. This largely resulted in the re-assignment of holding companies from All other to the industry of risk category based on the primary business activity of the holding company's underlying entities. In the tables and industry discussions below, the prior period amounts have been revised to conform with the current period presentation.
Below are summaries of the Firm's exposures as of September 30, 2017 , and December 31, 2016 . For additional information on industry concentrations, see Note 5 of JPMorgan Chase's 2016 Annual Report.
Wholesale credit exposure – industries (a) |
|
|
|
|
|
|
|
|
| ||||||||||||||||||||
|
|
|
|
|
| Selected metrics | |||||||||||||||||||||||
|
|
|
|
|
|
|
| 30 days or more past due and accruing | Net charge-offs/ | Credit derivative hedges (f) | Liquid securities | ||||||||||||||||||
|
|
|
| Noninvestment-grade | |||||||||||||||||||||||||
As of or for the nine months ended | Credit exposure (e) | Investment- grade |
| Noncriticized |
| Criticized performing | Criticized nonperforming | ||||||||||||||||||||||
September 30, 2017 | |||||||||||||||||||||||||||||
(in millions) | |||||||||||||||||||||||||||||
Real Estate | $ | 138,425 | | $ | 113,944 | |
| $ | 23,472 | |
| $ | 849 | | $ | 160 | | $ | 101 | | $ | (3 | ) | $ | - | | $ | (6 | ) |
Consumer & Retail | 87,022 | | 56,213 | |
| 28,820 | |
| 1,807 | | 182 | | 37 | | 16 | | (256 | ) | (29 | ) | |||||||||
Industrials | 63,375 | | 44,835 | |
| 17,400 | |
| 996 | | 144 | | 124 | | (1 | ) | (193 | ) | (45 | ) | |||||||||
Technology, Media & Telecommunications | 58,282 | | 35,466 | |
| 20,256 | |
| 2,485 | | 75 | | 19 | | (15 | ) | (465 | ) | (66 | ) | |||||||||
Banks & Finance Cos | 49,557 | | 35,827 | |
| 13,253 | |
| 471 | | 6 | | 58 | | 6 | | (1,382 | ) | (4,958 | ) | |||||||||
Healthcare | 48,658 | | 37,034 | |
| 10,812 | |
| 771 | | 41 | | 12 | | (1 | ) | - | | (278 | ) | |||||||||
Oil & Gas | 38,692 | | 19,092 | |
| 13,530 | |
| 4,968 | | 1,102 | | 17 | | 55 | | (908 | ) | (24 | ) | |||||||||
Asset Managers | 35,252 | | 30,034 | |
| 5,200 | |
| 18 | | - | | 12 | | - | | - | | (6,456 | ) | |||||||||
Utilities | 29,872 | | 24,549 | |
| 4,978 | |
| 124 | | 221 | | - | | 11 | | (196 | ) | (106 | ) | |||||||||
State & Municipal Govt (b) | 28,274 | | 27,662 | |
| 582 | |
| 1 | | 29 | | 62 | | - | | (130 | ) | (569 | ) | |||||||||
Central Govt | 18,466 | | 18,074 | |
| 343 | |
| 49 | | - | | 2 | | - | | (10,822 | ) | (2,977 | ) | |||||||||
Chemicals & Plastics | 16,632 | | 11,069 | |
| 5,500 | |
| 63 | | - | | 1 | | - | | (10 | ) | (6 | ) | |||||||||
Transportation | 16,383 | | 10,173 | |
| 5,486 | |
| 615 | | 109 | | 16 | | 16 | | (32 | ) | (164 | ) | |||||||||
Automotive | 16,259 | | 10,636 | |
| 5,526 | |
| 97 | | - | | 2 | | 1 | | (346 | ) | (9 | ) | |||||||||
Metals & Mining | 13,370 | | 6,409 | |
| 6,249 | |
| 712 | | - | | 2 | | (13 | ) | (362 | ) | (56 | ) | |||||||||
Insurance | 11,975 | | 9,896 | |
| 1,988 | |
| - | | 91 | | 8 | | - | | (182 | ) | (2,350 | ) | |||||||||
Financial Markets Infrastructure | 9,921 | | 8,762 | |
| 1,159 | |
| - | | - | | - | | - | | - | | (947 | ) | |||||||||
Securities Firms | 4,476 | | 3,012 | |
| 1,456 | |
| 8 | | - | | - | | - | | (274 | ) | (577 | ) | |||||||||
All other (c) | 144,318 | | 131,042 | |
| 12,758 | |
| 280 | | 238 | | 857 | | 1 | | (4,623 | ) | (1,730 | ) | |||||||||
Subtotal | $ | 829,209 | | $ | 633,729 | |
| $ | 178,768 | |
| $ | 14,314 | | $ | 2,398 | | $ | 1,330 | | $ | 73 | | $ | (20,181 | ) | $ | (21,353 | ) |
Loans held-for-sale and loans at fair value | 4,278 | |
|
|
|
|
|
|
|
|
|
| |||||||||||||||||
Receivables from customers and other | 19,218 | |
|
|
|
|
|
|
|
|
|
| |||||||||||||||||
Total (d) | $ | 852,705 | |
|
|
|
|
|
|
|
|
|
| ||||||||||||||||
58
(continued from previous page) |
|
|
|
|
|
|
|
|
|
| |||||||||||||||||||
| | | | | | | | Selected metrics | |||||||||||||||||||||
| | | | | | | | 30 days or more past due and accruing | Net | Credit derivative hedges (f) | Liquid securities | ||||||||||||||||||
| | | | Noninvestment-grade | |||||||||||||||||||||||||
As of or for the year ended | Credit exposure (e) | Investment- grade | | Noncriticized | | Criticized performing | Criticized nonperforming | ||||||||||||||||||||||
December 31, 2016 | |||||||||||||||||||||||||||||
(in millions) | |||||||||||||||||||||||||||||
Real Estate | $ | 134,287 | | $ | 104,869 | | | $ | 28,281 | | | $ | 937 | | $ | 200 | | $ | 206 | | $ | (7 | ) | $ | (54 | ) | $ | (11 | ) |
Consumer & Retail | 84,804 | | 54,730 | | | 28,255 | | | 1,571 | | 248 | | 75 | | 24 | | (424 | ) | (69 | ) | |||||||||
Industrials | 55,733 | | 36,710 | |
| 17,854 | |
| 1,033 | | 136 | | 128 | | 3 | | (434 | ) | (40 | ) | |||||||||
Technology, Media & Telecommunications | 63,324 | | 39,998 | | | 21,751 | | | 1,559 | | 16 | | 9 | | 2 | | (589 | ) | (30 | ) | |||||||||
Banks & Finance Cos | 48,393 | | 35,385 | |
| 12,560 | |
| 438 | | 10 | | 21 | | (2 | ) | (1,336 | ) | (7,337 | ) | |||||||||
Healthcare | 49,445 | | 39,244 | | | 9,279 | | | 882 | | 40 | | 86 | | 37 | | (286 | ) | (246 | ) | |||||||||
Oil & Gas | 40,367 | | 18,629 | | | 12,274 | | | 8,069 | | 1,395 | | 31 | | 233 | | (1,532 | ) | (18 | ) | |||||||||
Asset Managers | 33,201 | | 29,194 | | | 4,006 | | | 1 | | - | | 17 | | - | | - | | (5,737 | ) | |||||||||
Utilities | 29,672 | | 24,203 | | | 4,959 | | | 424 | | 86 | | 8 | | - | | (306 | ) | 39 | | |||||||||
State & Municipal Govt (b) | 28,263 | | 27,603 | | | 624 | | | 6 | | 30 | | 107 | | (1 | ) | (130 | ) | 398 | | |||||||||
Central Govt | 20,408 | | 20,123 | | | 276 | | | 9 | | - | | 4 | | - | | (11,691 | ) | (4,183 | ) | |||||||||
Chemicals & Plastics | 15,043 | | 10,405 | |
| 4,452 | |
| 156 | | 30 | | 3 | | - | | (35 | ) | (3 | ) | |||||||||
Transportation | 19,096 | | 12,178 | | | 6,421 | | | 444 | | 53 | | 9 | | 10 | | (93 | ) | (188 | ) | |||||||||
Automotive | 16,736 | | 9,235 | | | 7,299 | | | 201 | | 1 | | 7 | | - | | (401 | ) | (14 | ) | |||||||||
Metals & Mining | 13,419 | | 5,523 | | | 6,744 | | | 1,133 | | 19 | | - | | 36 | | (621 | ) | (62 | ) | |||||||||
Insurance | 13,510 | | 10,918 | | | 2,459 | | | - | | 133 | | 9 | | - | | (275 | ) | (2,538 | ) | |||||||||
Financial Markets Infrastructure | 8,732 | | 7,980 | | | 752 | | | - | | - | | - | | - | | - | | (390 | ) | |||||||||
Securities Firms | 4,211 | | 1,812 | | | 2,399 | | | - | | - | | - | | - | | (273 | ) | (491 | ) | |||||||||
All other (c) | 137,238 | | 124,661 | | | 11,988 | | | 303 | | 286 | | 598 | | 6 | | (3,634 | ) | (1,785 | ) | |||||||||
Subtotal | $ | 815,882 | | $ | 613,400 | | | $ | 182,633 | | | $ | 17,166 | | $ | 2,683 | | $ | 1,318 | | $ | 341 | | $ | (22,114 | ) | $ | (22,705 | ) |
Loans held-for-sale and loans at fair value | 4,515 | | | | | | | | | | | | | | | | | | | ||||||||||
Receivables from customers and other | 17,440 | | | | | | | | | | | | | | | | | | | | |||||||||
Total (d) | $ | 837,837 | |
|
|
|
|
|
|
|
|
|
| ||||||||||||||||
(a) | The industry rankings presented in the table as of December 31, 2016 , are based on the industry rankings of the corresponding exposures at September 30, 2017 , not actual rankings of such exposures at December 31, 2016 . |
(b) | In addition to the credit risk exposure to states and municipal governments (both U.S. and non-U.S.) at September 30, 2017 , and December 31, 2016 , noted above, the Firm held: $7.5 billion and $ 9.1 billion , respectively, of trading securities; $32.1 billion and $31.6 billion , respectively, of AFS securities; and $ 14.4 billion and $14.5 billion , respectively, of held-to-maturity ("HTM") securities, issued by U.S. state and municipal governments. For further information, see Note 2 and Note 9 . |
(c) | All other includes: individuals; SPEs; and private education and civic organizations; representing approximately 60%, 36%, and 4%, respectively, at September 30, 2017 , and 59%, 37%, and 4%, respectively, at December 31, 2016 . |
(d) | Excludes cash placed with banks of $450.1 bi llion and $380.2 billion, at September 30, 2017 , and December 31, 2016 , respectively, which is predominantly placed with various central banks, primarily Federal Reserve Banks. |
(e) | Credit exposure is net of risk participations and excludes the benefit of credit derivatives used in credit portfolio management activities held against derivative receivables or loans and liquid securities and other cash collateral held against derivative receivables. |
(f) | Represents the net notional amounts of protection purchased and sold through credit derivatives used to manage the credit exposures; these derivatives do not qualify for hedge accounting under U.S. GAAP. The All other category includes purchased credit protection on certain credit indices. |
59
Presented below is a discussion of certain industries to which the Firm has significant exposures and/or which present actual or potential credit concerns.
Real Estate
Exposure to the Real Estate industry increased $4.1 billion during the nine months ended September 30, 2017 , to $138.4 billion , predominantly driven by multifamily lending within CB. During the nine months ended September 30, 2017 , the credit quality of the total Real Estate exposure has improved, with the investment-grade percentage increasing from 78% to 82%. For further information on Real Estate loans, see Note 11.
| September 30, 2017 |
| ||||||||||||||||
(in millions, except ratios) | Loans and Lending-related Commitments |
| Derivative Receivables |
| Credit exposure |
| % Investment-grade | % Drawn (c) | ||||||||||
Multifamily (a) | $ | 83,972 | |
| $ | 31 | |
| $ | 84,003 | |
| 87 | % |
| 91 | % |
|
Other | 54,266 | |
| 156 | |
| 54,422 | |
| 74 | |
| 65 | |
| |||
Total Real Estate Exposure (b) | 138,238 | |
| 187 | |
| 138,425 | |
| 82 | |
| 81 | |
| |||
|
|
|
|
|
|
|
|
|
|
| ||||||||
| December 31, 2016 |
| ||||||||||||||||
(in millions, except ratios) | Loans and Lending-related Commitments |
| Derivative Receivables |
| Credit exposure |
| % Investment- grade | % Drawn (c) | ||||||||||
Multifamily (a) | $ | 80,280 | |
| $ | 34 | |
| $ | 80,314 | |
| 82 | % |
| 90 | % |
|
Other | 53,801 | |
| 172 | |
| 53,973 | |
| 72 | |
| 62 | |
| |||
Total Real Estate Exposure (b) | 134,081 | |
| 207 | |
| 134,287 | |
| 78 | |
| 79 | |
| |||
(a) | Multifamily exposure is largely in California. |
(b) | Real Estate exposure is predominantly secured; unsecured exposure is largely investment-grade. |
(c) | Represents drawn exposure as a percentage of credit exposure. |
Oil & Gas and Natural Gas Pipelines
Exposure to the Oil & Gas and Natural Gas Pipelines portfolios decreased by $0.9 billion during the nine months ended September 30, 2017 to $43.8 billion. During the nine months ended September 30, 2017 , the credit quality of this exposure has improved, with the investment-grade percentage increasing from 48% to 50% and criticized exposure decreasing $3.4 billion.
| September 30, 2017 |
| ||||||||||||||||
(in millions, except ratios) | Loans and Lending-related Commitments |
| Derivative Receivables |
| Credit exposure |
| % Investment-grade | % Drawn (d) | ||||||||||
Exploration & Production ("E&P") and Oilfield Services | $ | 20,129 | |
| $ | 494 | |
| $ | 20,623 | |
| 32 | % |
| 33 | % |
|
Other Oil & Gas (a) | 17,590 | |
| 479 | |
| 18,069 | |
| 69 | |
| 30 | |
| |||
Total Oil & Gas | 37,719 | |
| 973 | |
| 38,692 | |
| 49 | |
| 31 | |
| |||
Natural Gas Pipelines (b) | 5,090 | |
| 61 | |
| 5,151 | |
| 54 | |
| 12 | |
| |||
Total Oil & Gas and Natural Gas Pipelines (c) | $ | 42,809 | |
| $ | 1,034 | |
| $ | 43,843 | |
| 50 | |
| 29 | |
|
|
|
|
|
|
|
|
|
|
|
| ||||||||
| December 31, 2016 |
| ||||||||||||||||
(in millions, except ratios) | Loans and Lending-related Commitments |
| Derivative Receivables |
| Credit exposure |
| % Investment- grade | % Drawn (d) | ||||||||||
E&P and Oilfield Services | $ | 20,971 | |
| $ | 1,256 | |
| $ | 22,227 | |
| 27 | % |
| 35 | % |
|
Other Oil & Gas (a) | 17,518 | |
| 622 | |
| 18,140 | |
| 70 | |
| 31 | |
| |||
Total Oil & Gas | 38,489 | |
| 1,878 | |
| 40,367 | |
| 46 | |
| 33 | |
| |||
Natural Gas Pipelines (b) | 4,253 | |
| 106 | |
| 4,359 | |
| 66 | |
| 30 | |
| |||
Total Oil & Gas and Natural Gas Pipelines (c) | $ | 42,742 | |
| $ | 1,984 | |
| $ | 44,726 | |
| 48 | |
| 33 | |
|
(a) | Other Oil & Gas includes Integrated Oil & Gas companies, Midstream/Oil Pipeline companies and refineries. |
(b) | Natural Gas Pipelines is reported within the Utilities industry. |
(c) | Secured lending is $14.6 billion and $14.3 billion, at September 30, 2017 and December 31, 2016, respectively, approximately half of which is reserve-based lending to the Exploration & Production sub-sector; unsecured exposure is largely investment-grade. |
(d) | Represents drawn exposure as a percentage of credit exposure. |
Loans
In the normal course of its wholesale business, the Firm provides loans to a variety of customers, ranging from large corporate and institutional clients to high-net-worth
individuals. For further discussion on loans, including information on credit quality indicators and sales of loans, see Note 11 .
60
The following table presents the change in the nonaccrual loan portfolio for the nine months ended September 30, 2017 and 2016 .
Wholesale nonaccrual loan activity (a) | |||||||
Nine months ended September 30, (in millions) |
| 2017 | | 2016 | | ||
Beginning balance |
| $ | 2,063 | | $ | 1,016 | |
Additions |
| 993 | | 2,520 | | ||
Reductions: |
|
|
| ||||
Paydowns and other |
| 997 | | 701 | | ||
Gross charge-offs |
| 155 | | 287 | | ||
Returned to performing status |
| 184 | | 201 | | ||
Sales |
| 248 | | 170 | | ||
Total reductions |
| 1,584 | | 1,359 | | ||
Net changes |
| (591 | ) | 1,161 | | ||
Ending balance |
| $ | 1,472 | | $ | 2,177 | |
(a) | Loans are placed on nonaccrual status when management believes full payment of principal or interest is not expected, regardless of delinquency status, or when principal or interest have been in default for a period of 90 days or more, unless the loan is both well-secured and in the process of collection. |
The following table presents net charge-offs/recoveries, which are defined as gross charge-offs less recoveries, for the three and nine months ended September 30, 2017 and 2016 . The amounts in the table below do not include gains or losses from sales of nonaccrual loans.
Wholesale net charge-offs/(recoveries) | |||||||||||||
(in millions, except ratios) | Three months ended |
| Nine months ended | ||||||||||
2017 | | 2016 | |
| 2017 | | 2016 | | |||||
Loans – reported |
|
|
|
|
| ||||||||
Average loans retained | $ | 395,420 | | $ | 374,593 | |
| $ | 390,062 | | $ | 368,225 | |
Gross charge-offs | 55 | | 63 | |
| 154 | | 291 | | ||||
Gross recoveries | (12 | ) | (16 | ) |
| (81 | ) | (30 | ) | ||||
Net charge-offs/(recoveries) | 43 | | 47 | |
| 73 | | 261 | | ||||
Net charge-off/(recovery) rate | 0.04 | % | 0.05 | % |
| 0.03 | % | 0.09 | % | ||||
61
Lending-related commitments
The Firm uses lending-related financial instruments, such as commitments (including revolving credit facilities) and guarantees, to meet the financing needs of its customers. The contractual amounts of these financial instruments represent the maximum possible credit risk should the counterparties draw down on these commitments or the Firm fulfills its obligations under these guarantees, and the counterparties subsequently fail to perform according to the terms of these contracts. Most of these commitments and guarantees are refinanced, extended, cancelled, or expire without being drawn upon or a default occurring. In the Firm's view, the total contractual amount of these wholesale lending-related commitments is not representative of the Firm's expected future credit exposure or funding requirements. For further information on wholesale lending-related commitments, see Note 19 .
Derivative contracts
In the normal course of business, the Firm uses derivative instruments predominantly for market-making activities. Derivatives enable clients to manage exposures to fluctuations in interest rates, currencies and other markets. The Firm also uses derivative instruments to manage its own credit and other market risk exposure. For further discussion of derivative contracts, see Note 4 .
The following table summarizes the net derivative receivables for the periods presented.
Derivative receivables |
|
| ||||
(in millions) | Derivative receivables | |||||
September 30, | | December 31, | | |||
Interest rate | $ | 25,701 | | $ | 28,302 | |
Credit derivatives | 915 | | 1,294 | | ||
Foreign exchange | 17,077 | | 23,271 | | ||
Equity | 8,831 | | 4,939 | | ||
Commodity | 5,736 | | 6,272 | | ||
Total, net of cash collateral | 58,260 | | 64,078 | | ||
Liquid securities and other cash collateral held against derivative receivables (a) | (21,353 | ) | (22,705 | ) | ||
Total, net of collateral | $ | 36,907 | | $ | 41,373 | |
(a) | Includes collateral related to derivative instruments where an appropriate legal opinion has not been either sought or obtained. |
The fair value of derivative receivables reported on the Consolidated balance sheets were $58.3 billion and $64.1 billion at September 30, 2017 , and December 31, 2016 , respectively. These amounts represent the fair value of the derivative contracts after giving effect to legally enforceable master netting agreements and cash collateral held by the Firm. However, in management's view, the appropriate measure of current credit risk should also take into consideration additional liquid securities (primarily U.S. government and agency securities and other group of seven nations ("G7") government securities) and other cash collateral held by the Firm aggregating $21.4 billion and $22.7 billion at September 30, 2017 , and December 31, 2016 , respectively, that may be used as security when the fair value of the client's exposure is in the Firm's favor. The decrease in derivative receivables at September 30, 2017 from December 31, 2016 is predominantly related to client-driven market-making activities in CIB Markets, reflecting lower foreign exchange and interest rate derivative receivables, driven by maturities and market movements, partially offset by higher equity derivative receivables driven by higher market levels.
In addition to the collateral described in the preceding paragraph, the Firm also holds additional collateral (primarily cash, G7 government securities, other liquid government-agency and guaranteed securities, and corporate debt and equity securities) delivered by clients at the initiation of transactions, as well as collateral related to contracts that have a non-daily call frequency and collateral that the Firm has agreed to return but has not yet settled as of the reporting date. Although this collateral does not reduce the balances and is not included in the table above, it is available as security against potential exposure that could arise should the fair value of the client's derivative transactions move in the Firm's favor.
The derivative receivables fair value, net of all collateral, also does not include other credit enhancements, such as letters of credit. For additional information on the Firm's use of collateral agreements, see Note 4 .
62
The following table summarizes the ratings profile by derivative counterparty of the Firm's derivative receivables, including credit derivatives, net of all collateral, at the dates indicated. The ratings scale is based on the Firm's internal ratings, which generally correspond to the ratings as defined by S&P and Moody's.
Ratings profile of derivative receivables |
|
|
|
|
| ||||||
| September 30, 2017 |
| December 31, 2016 | ||||||||
Rating equivalent (in millions, except ratios) | Exposure net of collateral | % of exposure net of collateral |
| Exposure net of collateral | % of exposure net of collateral | ||||||
AAA/Aaa to AA-/Aa3 | $ | 9,856 | | 27 | % |
| $ | 11,449 | | 28 | % |
A+/A1 to A-/A3 | 7,262 | | 20 | |
| 8,505 | | 20 | | ||
BBB+/Baa1 to BBB-/Baa3 | 12,775 | | 35 | |
| 13,127 | | 32 | | ||
BB+/Ba1 to B-/B3 | 6,473 | | 17 | |
| 7,308 | | 18 | | ||
CCC+/Caa1 and below | 541 | | 1 | |
| 984 | | 2 | | ||
Total | $ | 36,907 | | 100 | % |
| $ | 41,373 | | 100 | % |
As previously noted, the Firm uses collateral agreements to mitigate counterparty credit risk. The percentage of the Firm's derivatives transactions subject to collateral agreements - excluding foreign exchange spot trades, which are not typically covered by collateral agreements due to their short maturity - was 91% and 90% at September 30, 2017 and December 31, 2016 , respectively.
Credit derivatives
The Firm uses credit derivatives for two primary purposes: first, in its capacity as a market-maker, and second, as an end-user, to manage the Firm's own credit risk associated with various exposures.
Credit portfolio management activities
Included in the Firm's end-user activities are credit derivatives used to mitigate the credit risk associated with traditional lending activities (loans and unfunded commitments) and derivatives counterparty exposure in the Firm's wholesale businesses (collectively, "credit portfolio management" activities). Information on credit portfolio management activities is provided in the table below.
Credit derivatives used in credit portfolio management activities | |||||||
| Notional amount of protection purchased and sold (a) | ||||||
(in millions) | September 30, | |
| December 31, | | ||
Credit derivatives used to manage: |
|
|
| ||||
Loans and lending-related commitments | $ | 1,559 | |
| $ | 2,430 | |
Derivative receivables | 18,622 | |
| 19,684 | | ||
Credit derivatives used in credit portfolio management activities | $ | 20,181 | |
| $ | 22,114 | |
(a) | Amounts are presented net, considering the Firm's net protection purchased or sold with respect to each underlying reference entity or index. |
For further information on credit derivatives and derivatives used in credit portfolio management activities, see Credit derivatives in Note 4 of this Form 10-Q , and Note 6 of JPMorgan Chase's 2016 Annual Report.
63
ALLOWANCE FOR CREDIT LOSSES | ||||
JPMorgan Chase 's allowance for loan losses covers both the consumer (primarily scored) portfolio and wholesale (risk-rated) portfolio. Management also determines an allowance for wholesale and certain consumer lending-related commitments.
For a further discussion of the components of the allowance for credit losses and related management judgments, see Critical Accounting Estimates Used by the Firm on pages 78–79 and Note 12 of this Form 10-Q, and Critical Accounting Estimates Used by the Firm on pages 132–134 and Note 15 of JPMorgan Chase's 2016 Annual Report.
At least quarterly, the allowance for credit losses is reviewed by the CRO, the CFO and the Controller of the Firm, and discussed with the Board of Directors' Risk Policy Committee ("DRPC") and Audit Committee. As of September 30, 2017 , JPMorgan Chase deemed the allowance for credit losses to be appropriate and sufficient to absorb probable credit losses inherent in the portfolio.
Overall, the consumer allowance for credit losses increased from December 31, 2016 . Changes to the allowance for credit losses included:
• | additions to the allowance for loan losses in the credit card, business banking and auto portfolios, predominantly driven by higher loss rates and loan growth in credit card, |
largely offset by
• | the utilization of the allowance for loan losses in connection with the transfer of the student loan portfolio to held-for-sale; and |
• | a reduction in the residential real estate portfolio, predominantly reflecting continued improvements in home prices and delinquencies. |
The wholesale allowance for credit losses decreased from December 31, 2016 , reflecting credit quality improvements in the Oil & Gas, Natural Gas Pipelines, and Metals & Mining portfolios.
For additional information on the consumer portfolio, see Consumer Credit Portfolio on pages 50–55 and Note 11 .
For additional information on the wholesale portfolio, see Wholesale Credit Portfolio on pages 56–63 and Note 11 .
64
Summary of changes in the allowance for credit losses |
|
|
|
|
| ||||||||||||||||||||
| 2017 |
| 2016 | ||||||||||||||||||||||
Nine months ended September 30, | Consumer, excluding credit card | Credit card | Wholesale | Total |
| Consumer, excluding credit card | Credit card | Wholesale | Total | ||||||||||||||||
(in millions, except ratios) |
| ||||||||||||||||||||||||
Allowance for loan losses |
|
|
|
|
|
|
|
|
| ||||||||||||||||
Beginning balance at January 1, | $ | 5,198 | | $ | 4,034 | | $ | 4,544 | | $ | 13,776 | |
| $ | 5,806 | | $ | 3,434 | | $ | 4,315 | | $ | 13,555 | |
Gross charge-offs | 1,479 | | 3,344 | | 154 | | 4,977 | |
| 1,071 | | 2,803 | | 291 | | 4,165 | | ||||||||
Gross recoveries | (478 | ) | (295 | ) | (81 | ) | (854 | ) |
| (448 | ) | (275 | ) | (30 | ) | (753 | ) | ||||||||
Net charge-offs (a) | 1,001 | | 3,049 | | 73 | | 4,123 | |
| 623 | | 2,528 | | 261 | | 3,412 | | ||||||||
Write-offs of PCI loans (b) | 66 | | - | | - | | 66 | |
| 124 | | - | | - | | 124 | | ||||||||
Provision for loan losses | 653 | | 3,699 | | (401 | ) | 3,951 | |
| 578 | | 2,978 | | 628 | | 4,184 | | ||||||||
Other | (2 | ) | - | | 3 | | 1 | |
| - | | - | | 1 | | 1 | | ||||||||
Ending balance at September 30, | $ | 4,782 | | $ | 4,684 | | $ | 4,073 | | $ | 13,539 | |
| $ | 5,637 | | $ | 3,884 | | $ | 4,683 | | $ | 14,204 | |
Impairment methodology |
|
|
|
|
|
|
|
|
| ||||||||||||||||
Asset-specific (c) | $ | 271 | | $ | 376 | | $ | 363 | | $ | 1,010 | |
| $ | 352 | | $ | 363 | | $ | 490 | | $ | 1,205 | |
Formula-based | 2,266 | | 4,308 | | 3,710 | | 10,284 | |
| 2,667 | | 3,521 | | 4,193 | | 10,381 | | ||||||||
PCI | 2,245 | | - | | - | | 2,245 | |
| 2,618 | | - | | - | | 2,618 | | ||||||||
Total allowance for loan losses | $ | 4,782 | | $ | 4,684 | | $ | 4,073 | | $ | 13,539 | |
| $ | 5,637 | | $ | 3,884 | | $ | 4,683 | | $ | 14,204 | |
Allowance for lending-related commitments |
|
|
|
|
|
|
|
|
| ||||||||||||||||
Beginning balance at January 1, | $ | 26 | | $ | - | | $ | 1,052 | | $ | 1,078 | |
| $ | 14 | | $ | - | | $ | 772 | | $ | 786 | |
Provision for lending-related commitments | 7 | | - | | 24 | | 31 | |
| - | | - | | 313 | | 313 | | ||||||||
Other | - | | - | | - | | - | |
| - | | - | | 1 | | 1 | | ||||||||
Ending balance at September 30, | $ | 33 | | $ | - | | $ | 1,076 | | $ | 1,109 | |
| $ | 14 | | $ | - | | $ | 1,086 | | $ | 1,100 | |
Impairment methodology |
|
|
|
|
|
|
|
|
| ||||||||||||||||
Asset-specific | $ | - | | $ | - | | $ | 220 | | $ | 220 | |
| $ | - | | $ | - | | $ | 162 | | $ | 162 | |
Formula-based | 33 | | - | | 856 | | 889 | |
| 14 | | - | | 924 | | 938 | | ||||||||
Total allowance for lending-related commitments (d) | $ | 33 | | $ | - | | $ | 1,076 | | $ | 1,109 | |
| $ | 14 | | $ | - | | $ | 1,086 | | $ | 1,100 | |
Total allowance for credit losses | $ | 4,815 | | $ | 4,684 | | $ | 5,149 | | $ | 14,648 | |
| $ | 5,651 | | $ | 3,884 | | $ | 5,769 | | $ | 15,304 | |
Memo: |
|
|
|
|
|
|
|
|
| ||||||||||||||||
Retained loans, end of period | $ | 369,413 | | $ | 141,200 | | $ | 398,569 | | $ | 909,182 | |
| $ | 363,398 | | $ | 133,346 | | $ | 386,449 | | $ | 883,193 | |
Retained loans, average | 365,359 | | 138,749 | | 390,062 | | 894,170 | |
| 356,347 | | 129,401 | | 368,225 | | 853,973 | | ||||||||
PCI loans, end of period | 31,821 | | - | | 3 | | 31,824 | |
| 37,045 | | - | | 3 | | 37,048 | | ||||||||
Credit ratios |
|
|
|
|
|
|
|
|
| ||||||||||||||||
Allowance for loan losses to retained loans | 1.29 | % | 3.32 | % | 1.02 | % | 1.49 | % |
| 1.55 | % | 2.91 | % | 1.21 | % | 1.61 | % | ||||||||
Allowance for loan losses to retained nonaccrual loans (e) | 115 | | NM | | 277 | | 241 | |
| 115 | | NM | | 218 | | 201 | | ||||||||
Allowance for loan losses to retained nonaccrual loans excluding credit card | 115 | | NM | | 277 | | 157 | |
| 115 | | NM | | 218 | | 146 | | ||||||||
Net charge-off rates (a) | 0.37 | | 2.94 | | 0.03 | | 0.62 | |
| 0.23 | | 2.61 | | 0.09 | | 0.53 | | ||||||||
Credit ratios, excluding residential real estate PCI loans |
|
|
|
|
|
|
|
|
| ||||||||||||||||
Allowance for loan losses to retained loans | 0.75 | | 3.32 | | 1.02 | | 1.29 | |
| 0.93 | | 2.91 | | 1.21 | | 1.37 | | ||||||||
Allowance for loan losses to retained nonaccrual loans (e) | 61 | | NM | | 277 | | 201 | |
| 62 | | NM | | 218 | | 164 | | ||||||||
Allowance for loan losses to retained nonaccrual loans excluding credit card | 61 | | NM | | 277 | | 117 | |
| 62 | | NM | | 218 | | 109 | | ||||||||
Net charge-off rates (a) | 0.40 | % | 2.94 | % | 0.03 | % | 0.64 | % |
| 0.26 | % | 2.61 | % | 0.09 | % | 0.56 | % | ||||||||
Note: In the table above, the financial measures which exclude the impact of PCI loans are non-GAAP financial measures.
(a) | For the nine months ended September 30, 2017 , excluding net charge-offs of $467 million related to the student loan portfolio transfer, the net charge-off rate for Consumer, excluding credit card would have been 0.20%; total Firm would have been 0.55%; Consumer, excluding credit card and PCI loans would have been 0.22%; and total Firm, excluding PCI would have been 0.57%. For additional information refer to CCB segment results on page 21 . |
(b) | Write-offs of PCI loans are recorded against the allowance for loan losses when actual losses for a pool exceed estimated losses that were recorded as purchase accounting adjustments at the time of acquisition. A write-off of a PCI loan is recognized when the underlying loan is removed from a pool (e.g., upon liquidation). |
(c) | Includes risk-rated loans that have been placed on nonaccrual status and loans that have been modified in a TDR. The asset-specific credit card allowance for loan losses modified in a TDR is calculated based on the loans' original contractual interest rates and does not consider any incremental penalty rates. |
(d) | The allowance for lending-related commitments is reported in accounts payable and other liabilities on the Consolidated balance sheets. |
(e) | The Firm's policy is generally to exempt credit card loans from being placed on nonaccrual status as permitted by regulatory guidance. |
65
Provision for credit losses
The following table presents the components of the Firm's provision for credit losses:
| Three months ended September 30, |
| Nine months ended September 30, | ||||||||||||||||||||||||||||||||||||||
| Provision for loan losses |
| Provision for lending-related commitments |
| Total provision for credit losses |
| Provision for loan losses |
| Provision for lending-related commitments |
| Total provision for credit losses | ||||||||||||||||||||||||||||||
(in millions) | 2017 | | 2016 | |
| 2017 | | 2016 | |
| 2017 | | 2016 | |
| 2017 | | 2016 | |
| 2017 | | 2016 | |
| 2017 | | 2016 | | ||||||||||||
Consumer, excluding credit card | $ | 205 | | $ | 262 | |
| $ | 1 | | $ | - | |
| $ | 206 | | $ | 262 | |
| $ | 653 | | $ | 578 | |
| $ | 7 | | $ | - | |
| $ | 660 | | $ | 578 | |
Credit card | 1,319 | | 1,038 | |
| - | | - | |
| 1,319 | | 1,038 | |
| 3,699 | | 2,978 | |
| - | | - | |
| 3,699 | | 2,978 | | ||||||||||||
Total consumer | 1,524 | | 1,300 | |
| 1 | | - | |
| 1,525 | | 1,300 | |
| 4,352 | | 3,556 | |
| 7 | | - | |
| 4,359 | | 3,556 | | ||||||||||||
Wholesale | (64 | ) | (168 | ) |
| (9 | ) | 139 | |
| (73 | ) | (29 | ) |
| (401 | ) | 628 | |
| 24 | | 313 | |
| (377 | ) | 941 | | ||||||||||||
Total | $ | 1,460 | | $ | 1,132 | |
| $ | (8 | ) | $ | 139 | |
| $ | 1,452 | | $ | 1,271 | |
| $ | 3,951 | | $ | 4,184 | |
| $ | 31 | | $ | 313 | |
| $ | 3,982 | | $ | 4,497 | |
Quarterly discussion
The provision for credit losses increased as a result of:
• | a higher consumer provision driven by: |
– | $148 million of higher net charge-offs, primarily in the credit card portfolio due to seasoning of newer vintages in line with expectations, partially offset by a decrease in net charge-offs in the residential real estate portfolio reflecting continued improvement in home prices and delinquencies. The higher net charge-offs included $63 million of incremental charge-offs recorded in accordance with regulatory guidance regarding the timing of loss recognition for certain auto and residential real estate loans in bankruptcy and auto loans where assets were acquired in loan satisfaction, and |
– | a $300 million addition to the allowance for credit losses in the credit card portfolio, due to higher loss rates and loan growth, compared to a $200 million addition in the prior year |
the increase was partially offset by
• | a higher net benefit of $44 million due to a net reduction of $116 million in the wholesale allowance for credit losses, primarily driven by paydowns and loan sales in the Oil & Gas portfolio, and improvements in the overall quality of the Real Estate portfolio. |
Year-to-date discussion
The provision for credit losses decreased as a result of:
• | a net $450 million reduction in the wholesale allowance for credit losses, reflecting credit quality improvements in the Oil & Gas, Natural Gas Pipelines and Metals & Mining portfolios, compared with an addition of $680 million in the prior year driven by downgrades in the same portfolios. |
the decrease was partially offset by
• | a higher consumer provision driven by: |
– | $432 million of higher net charge-offs, primarily in the credit card portfolio due to seasoning of newer vintages in line with expectations , partially offset by a decrease in net charge-offs in the residential real estate portfolio reflecting continued improvement in home prices and delinquencies, |
– | a $218 million impact related to the transfer of the student loan portfolio to held-for-sale, and |
– | a $153 million higher addition to the allowance for credit losses. |
Current year additions to the consumer allowance for credit losses included:
◦ | a $650 million addition to the allowance for credit losses in the credit card portfolio, due to higher loss rates and loan growth, compared to a $450 million addition in the prior year; |
◦ | a $50 million addition to the allowance for credit losses in the business banking portfolio; and |
◦ | a $25 million addition to the allowance for credit losses in the auto portfolio, compared to a $75 million addition in the prior year; |
the additions were partially offset by
◦ | a $167 million net reduction in the allowance for credit losses in the residential real estate portfolio, reflecting continued improvement in home prices and delinquencies, compared to a $95 million net reduction in the prior year. |
For additional information on the Firm's student loan portfolio, which was transferred to held-for-sale in the first quarter of 2017, see Note 23.
66
COUNTRY RISK MANAGEMENT | ||||
Country risk is the risk that a sovereign event or action alters the value or terms of contractual obligations of obligors, counterparties and issuers or adversely affects markets related to a particular country. The Firm has a country risk management framework for assessing country risks, determining risk tolerance, and measuring and monitoring its direct country exposures. The Country Risk Management group is responsible for developing guidelines and policies for managing country risk in both emerging and developed countries. The Country Risk Management group actively monitors the various portfolios giving rise to country risk to ensure the Firm's country risk exposures are diversified and that exposure levels are appropriate given the Firm's strategy and risk tolerance relative to a country.
Country Risk Management periodically defines and runs stress scenarios for individual countries or groups of countries in response to specific or potential market events, sector performance concerns and geopolitical risks.
For a discussion of the Firm's Country Risk Management organization; identification and measurement; stress testing; monitoring and control; and reporting, see pages 108–109 of JPMorgan Chase's 2016 Annual Report.
The following table presents the Firm's top 20 exposures by country (excluding the U.S.) as of September 30, 2017 . The selection of countries is based solely on the Firm's largest total exposures by country, based on the Firm's internal country risk management approach, and does not represent the Firm's view of any actual or potentially adverse credit conditions. Country exposures may fluctuate from period to period due to client activity and market flows.
Top 20 country exposures (excluding the U.S.) |
| ||||||||||||
|
| September 30, 2017 | |||||||||||
(in billions) |
| Lending and deposits (a) | Trading and investing (b)(c) | Other (d) | Total exposure | ||||||||
Germany |
| $ | 43.9 | | $ | 13.9 | | $ | 0.2 | | $ | 58.0 | |
United Kingdom |
| 34.0 | | 14.3 | | 0.9 | | 49.2 | | ||||
Japan |
| 16.4 | | 7.5 | | 0.2 | | 24.1 | | ||||
France |
| 12.4 | | 8.7 | | 0.3 | | 21.4 | | ||||
China |
| 8.7 | | 6.2 | | 0.9 | | 15.8 | | ||||
Switzerland |
| 8.1 | | 1.3 | | 5.6 | | 15.0 | | ||||
Canada |
| 11.7 | | 3.0 | | 0.2 | | 14.9 | | ||||
India |
| 4.6 | | 5.7 | | 1.1 | | 11.4 | | ||||
Australia |
| 6.0 | | 5.2 | | - | | 11.2 | | ||||
Netherlands |
| 7.3 | | 1.9 | | 0.7 | | 9.9 | | ||||
Luxembourg |
| 7.5 | | 1.4 | | - | | 8.9 | | ||||
South Korea |
| 5.4 | | 2.0 | | 0.3 | | 7.7 | | ||||
Brazil |
| 3.4 | | 3.2 | | - | | 6.6 | | ||||
Italy |
| 3.7 | | 1.8 | | 0.2 | | 5.7 | | ||||
Spain |
| 3.4 | | 2.1 | | - | | 5.5 | | ||||
Singapore |
| 2.8 | | 1.3 | | 1.1 | | 5.2 | | ||||
Hong Kong |
| 2.3 | | 1.2 | | 1.6 | | 5.1 | | ||||
Saudi Arabia |
| 3.8 | | 0.8 | | - | | 4.6 | | ||||
Mexico |
| 3.2 | | 1.3 | | - | | 4.5 | | ||||
Ireland |
| 1.1 | | 0.7 | | 1.2 | | 3.0 | | ||||
(a) | Lending and deposits includes loans and accrued interest receivable (net of collateral and the allowance for loan losses), deposits with banks (including central banks), acceptances, other monetary assets, issued letters of credit net of participations, and unused commitments to extend credit. Excludes intra-day and operating exposures, such as from settlement and clearing activities. |
(b) | Includes market-making inventory, AFS securities, counterparty exposure on derivative and securities financings net of collateral and hedging. |
(c) | Includes single reference entity ("single-name"), index and tranched credit derivatives for which one or more of the underlying reference entities is in a country listed in the above table. |
(d) | Includes capital invested in local entities and physical commodity inventory. |
67
LIQUIDITY RISK MANAGEMENT | ||||
Liquidity risk is the risk that the Firm will be unable to meet its contractual and contingent obligations or that it does not have the appropriate amount, composition or tenor of funding and liquidity to support its assets and liabilities. The following discussion of JPMorgan Chase's Liquidity Risk Management should be read together with pages 110–115 of JPMorgan Chase's 2016 Annual Report.
LCR and HQLA
The LCR rule requires the Firm to maintain an amount of unencumbered HQLA that is sufficient to meet its estimated total net cash outflows over a prospective 30 calendar-day period of significant stress. HQLA is the amount of liquid assets that qualify for inclusion in the LCR. HQLA primarily consist of unencumbered cash and certain high quality liquid securities as defined in the LCR rule.
Under the LCR rule, the amount of HQLA held by JPMorgan Chase Bank N.A. and Chase Bank USA, N.A that are in excess of each entity's standalone 100% minimum LCR requirement, and that are not transferable to non-bank affiliates, must be excluded from the Firm's reported HQLA. Commencing January 1, 2017, the LCR is required to be a minimum of 100%.
On December 19, 2016, the Federal Reserve published final LCR public disclosure requirements for certain bank holding companies and nonbank financial companies. Beginning with the second quarter of 2017, the Firm disclosed its average LCR for the quarter and the key quantitative components of the average LCR, along with a qualitative discussion of material drivers of the ratio. The Firm will continue to make available its U.S. LCR Disclosure report on a quarterly basis on the Firm's website at: (https://investor.shareholder.com/jpmorganchase/basel.cfm)
The following table summarizes the Firm's average LCR for the three months ended September 30, 2017 based on the Firm's current interpretation of the finalized LCR framework.
Average amount (in millions) | Three months ended September 30, 2017 | ||
HQLA |
| ||
Eligible cash (a) | $ | 389,516 | |
Eligible securities (b)(c) | 178,803 | | |
Total HQLA (d) | $ | 568,319 | |
Net cash outflows | $ | 475,229 | |
LCR | 120 | % | |
Net excess HQLA (d) | $ | 93,090 | |
(a) | Represents cash on deposit at central banks, primarily Federal Reserve Banks. |
(b) | Predominantly U.S. Agency MBS, U.S. Treasuries, and sovereign bonds net of applicable haircuts under the LCR rules |
(c) | HQLA eligible securities may be reported in securities borrowed or purchased under resale agreements, trading assets, or securities on the Firm's Consolidated balance sheets. |
(d) | Excludes average excess HQLA at JPMorgan Chase Bank, N.A. and Chase Bank USA, N.A. that are not transferable to non-bank affiliates. |
For the three months ended September 30, 2017 , the Firm's average LCR was 120%, compared with an average of 115% for the three months ended June 30, 2017 as reported in the Firm's U.S. LCR Public Disclosure. The increase in the ratio was largely attributable to an increase in average HQLA, driven by an increase in the amount of cash and securities held by JPMorgan Chase Bank, N.A. and Chase Bank USA, N.A that became available to transfer to non-bank affiliates. The Firm's average LCR may fluctuate from period to period, due to changes in its HQLA and estimated net cash outflows under the LCR as a result of ongoing business activity. The Firm's HQLA are expected to be available to meet its liquidity needs in a time of stress.
Other liquidity sources
As of September 30, 2017 , in addition to assets reported in the Firm's HQLA under the LCR rule, the Firm had approximately $234 billion of unencumbered marketable securities, such as equity securities and fixed income debt securities, available to raise liquidity, if required. This includes HQLA-eligible securities included as part of the excess liquidity at JPMorgan Chase Bank, N.A. that are not transferable to non-bank affiliates.
As of September 30, 2017 , the Firm also had approximately $273 billion of available borrowing capacity at various Federal Home Loan Banks ("FHLBs"), the Federal Reserve Bank discount window and various other central banks as a result of collateral pledged by the Firm to such banks. This remaining borrowing capacity excludes the benefit of securities reported in the Firm's HQLA or other unencumbered securities that are currently pledged at the Federal Reserve Bank discount window, but for which the Firm has not drawn liquidity. Although available, the Firm does not view the borrowing capacity at the Federal Reserve Bank discount window and the various other central banks as a primary source of liquidity.
NSFR
The Net Stable Funding Ratio ("NSFR") is intended to measure the adequacy of "available" and "required" amounts of stable funding over a one-year horizon. On April 26, 2016, the U.S. NSFR proposal was released for large banks and bank holding companies and was largely consistent with the Basel Committee's final standard.
While the final U.S. NSFR has yet to be released, the Firm estimates it was compliant with the proposed 100% minimum NSFR based on data as of June 30, 2017, and on its current understanding of the proposed rule.
68
Funding
Sources of funds
Management believes that the Firm's secured and unsecured funding capacity is sufficient to meet its on- and off-balance sheet obligations.
The Firm funds its global balance sheet through diverse sources of funding including a stable deposit franchise as well as secured and unsecured funding in the capital markets. The Firm's loan portfolio is funded with a portion of the Firm's deposits , and through securitizations and, with respect to a portion of the Firm's real estate-related loans, with secured borrowings from the FHLBs. Deposits in excess of the amount utilized to fund loans are primarily invested in the Firm's investment securities portfolio or deployed in cash or other short-term liquid investments based on their interest rate and liquidity risk characteristics. Securities
borrowed or purchased under resale agreements and trading assets-debt and equity instruments are primarily funded by the Firm's securities loaned or sold under agreements to repurchase, trading liabilities-debt and equity instruments, and a portion of the Firm's long-term debt and stockholders' equity. In addition to funding securities borrowed or purchased under resale agreements and trading assets-debt and equity instruments, proceeds from the Firm's debt and equity issuances are used to fund certain loans and other financial and non-financial assets, or may be invested in the Firm's investment securities portfolio. See the discussion below for additional information relating to Deposits, Short-term funding, and Long-term funding and issuance.
Deposits
The table below summarizes, by line of business, the deposit balances as of September 30, 2017 , and December 31, 2016 , and the average deposit balances for the three and nine months ended September 30, 2017 and 2016 , respectively.
| September 30, 2017 | | December 31, 2016 | |
| Three months ended September 30, |
| Nine months ended September 30, | ||||||||||||
Deposits |
| Average |
| Average | ||||||||||||||||
(in millions) |
| 2017 | | 2016 | |
| 2017 | | 2016 | | ||||||||||
Consumer & Community Banking | $ | 653,460 | | $ | 618,337 | |
| $ | 645,732 | | $ | 593,671 | |
| $ | 636,257 | | $ | 579,741 | |
Corporate & Investment Bank | 466,323 | | 412,434 | |
| 461,961 | | 413,698 | |
| 444,064 | | 404,501 | | ||||||
Commercial Banking | 176,452 | | 179,532 | |
| 176,095 | | 172,204 | |
| 175,265 | | 170,810 | | ||||||
Asset & Wealth Management | 141,409 | | 161,577 | |
| 144,496 | | 153,121 | |
| 151,311 | | 151,656 | | ||||||
Corporate | 1,383 | | 3,299 | |
| 2,739 | | 5,281 | |
| 4,152 | | 5,788 | | ||||||
Total Firm | $ | 1,439,027 | | $ | 1,375,179 | |
| $ | 1,431,023 | | $ | 1,337,975 | |
| $ | 1,411,049 | | $ | 1,312,496 | |
A key strength of the Firm is its diversified deposit franchise, through each of its lines of business, which
provides a stable source of funding and limits reliance on the wholesale funding markets. A significant portion of the Firm's deposits are consumer and wholesale operating deposits, which are both considered to be stable sources of liquidity. Wholesale operating deposits are considered a stable source of liquidity because they are generated from customers that maintain operating service relationships with the Firm.
The table below shows the loan and deposit balances, the loans-to-deposits ratios, and deposits as a percentage of total liabilities, as of September 30, 2017 and December 31, 2016 .
(in billions except ratios) | September 30, 2017 | | December 31, 2016 | | ||
Deposits | $ | 1,439.0 | | $ | 1,375.2 | |
Deposits as a % of total liabilities | 62 | % | 61 | % | ||
Loans | 913.8 | | 894.8 | | ||
Loans-to-deposits ratio | 63 | % | 65 | % | ||
Deposits increased due to both higher wholesale and consumer deposits. The higher wholesale deposits were driven by growth in client cash management activity in CIB's Securities Services and Treasury Services businesses, partially offset by lower balances in AWM reflecting balance migration into investment-related products (retained predominantly within the Firm), and the impact of seasonality in both CB and AWM. The higher consumer deposits reflected the continuation of strong growth from new and existing customers, and low attrition rates .
The Firm believes average deposit balances are generally more representative of deposit trends than period-end deposit balances. The increase in average deposits for the three and nine months ended September 30, 2017 , compared with the three and nine months ended September 30, 2016 , was driven by an increase in both consumer and wholesale deposits. For further discussions of deposit and liability balance trends, see the discussion of the Firm's Business Segment Results and the Consolidated Balance Sheets Analysis on pages 18–40 and pages 11–12 , respectively.
69
The following table summarizes short-term and long-term funding, excluding deposits, as of September 30, 2017 , and December 31, 2016 , and average balances for the three and nine months ended September 30, 2017 and 2016 , respectively. For additional information, see the Consolidated Balance Sheets Analysis on pages 11–12 and Note 10 .
| September 30, 2017 | December 31, 2016 |
| Three months ended September 30, |
| Nine months ended September 30, | ||||||||||||||
Sources of funds (excluding deposits) |
| Average |
| Average | ||||||||||||||||
(in millions) |
| 2017 | | 2016 | |
| 2017 | | 2016 | | ||||||||||
Commercial paper | $ | 24,248 | | $ | 11,738 | |
| $ | 23,022 | | $ | 13,798 | |
| $ | 18,653 | | $ | 16,257 | |
|
|
|
|
|
|
|
|
| ||||||||||||
Obligations of Firm-administered multi-seller conduits (a) | $ | 2,923 | | $ | 2,719 | |
| $ | 2,947 | | $ | 5,872 | |
| $ | 3,351 | | $ | 5,900 | |
Other borrowed funds | $ | 29,719 | | $ | 22,705 | |
| $ | 29,936 | | $ | 19,818 | |
| $ | 25,620 | | $ | 20,051 | |
|
|
|
|
|
|
|
|
| ||||||||||||
Securities loaned or sold under agreements to repurchase: |
|
|
|
|
|
|
|
| ||||||||||||
Securities sold under agreements to repurchase (b)(c) | $ | 154,463 | | $ | 149,826 | |
| $ | 167,652 | | $ | 165,120 | |
| $ | 173,334 | | $ | 157,808 | |
Securities loaned (c)(d) | 9,867 | | 12,137 | |
| 9,637 | | 10,946 | |
| 12,094 | | 13,270 | | ||||||
Total securities loaned or sold under agreements to repurchase (c)(e) | $ | 164,330 | | $ | 161,963 | |
| $ | 177,289 | | $ | 176,066 | |
| $ | 185,428 | | $ | 171,078 | |
|
|
|
|
|
|
|
|
| ||||||||||||
Senior notes | $ | 157,495 | | $ | 151,042 | |
| $ | 159,270 | | $ | 157,318 | |
| $ | 154,148 | | $ | 152,894 | |
Trust preferred securities | 2,334 | | 2,345 | |
| 2,336 | | 3,965 | |
| 2,340 | | 3,968 | | ||||||
Subordinated debt | 18,079 | | 21,940 | |
| 18,399 | | 23,779 | |
| 20,029 | | 24,769 | | ||||||
Structured notes | 43,760 | | 37,292 | |
| 44,157 | | 37,323 | |
| 42,025 | | 35,499 | | ||||||
Total long-term unsecured funding | $ | 221,668 | | $ | 212,619 | |
| $ | 224,162 | | $ | 222,385 | |
| $ | 218,542 | | $ | 217,130 | |
|
|
|
|
|
|
|
|
| ||||||||||||
Credit card securitization (a) | $ | 23,473 | | $ | 31,181 | |
| $ | 24,709 | | $ | 31,074 | |
| $ | 27,041 | | $ | 28,604 | |
Other securitizations (a)(f) | - | | 1,527 | |
| - | | 1,639 | |
| 837 | | 1,698 | | ||||||
Federal Home Loan Bank ("FHLB") advances | 63,769 | | 79,519 | |
| 67,288 | | 72,687 | |
| 72,504 | | 71,158 | | ||||||
Other long-term secured funding (g) | 3,145 | | 3,107 | |
| 3,176 | | 5,223 | |
| 3,202 | | 5,130 | | ||||||
Total long-term secured funding | $ | 90,387 | | $ | 115,334 | |
| $ | 95,173 | | $ | 110,623 | |
| $ | 103,584 | | $ | 106,590 | |
|
|
|
|
|
|
|
|
| ||||||||||||
Preferred stock (h) | $ | 26,068 | | $ | 26,068 | |
| $ | 26,068 | | $ | 26,068 | |
| $ | 26,068 | | $ | 26,068 | |
Common stockholders' equity (h) | $ | 232,314 | | $ | 228,122 | |
| $ | 231,861 | | $ | 226,089 | |
| $ | 229,937 | | $ | 224,034 | |
(a) | Included in beneficial interests issued by consolidated variable interest entities on the Firm's Consolidated balance sheets. |
(b) | Excluded long-term structured repurchase agreements of $2.0 billion and $1.8 billion as of September 30, 2017 , and December 31, 2016 , respectively, average balances of $2.0 billion and $1.9 billion for the three months ended September 30, 2017 and 2016 , respectively, and $1.4 billion and $2.9 billion for the nine months ended September 30, 2017 and 2016 , respectively. |
(c) | The prior period amounts have been revised to conform with the current period presentation. |
(d) | Excludes long-term securities loaned of $1.3 billion and $ 1.2 billion as of September 30, 2017 , and December 31, 2016 , respectively, average balances of $1.3 billion and $1.2 billion for the three months ended September 30, 2017 and 2016 , respectively, and $1.3 billion for both the nine months ended September 30, 2017 and 2016 . |
(e) | Excludes federal funds purchased. |
(f) | Other securitizations include securitizations of student loans. The Firm deconsolidated the student loan securitization entities in the second quarter of 2017 as it no longer had a controlling financial interest in these entities as a result of the sale of the student loan portfolio. For additional information about the sale of the student loan portfolio, see CCB Business Segment Results on pages 20–24 . The Firm's wholesale businesses also securitize loans for client-driven transactions, which are not considered to be a source of funding for the Firm and are not included in the table. |
(g) | Includes long-term structured notes which are secured. |
(h) | For additional information on preferred stock and common stockholders' equity see Capital Risk Management on pages 42–48 and the Consolidated statements of changes in stockholders' equity on page 86 ; and Note 22 and Note 23 of JPMorgan Chase's 2016 Annual Report. |
Short-term funding
The Firm's sources of short-term secured funding primarily consist of securities loaned or sold under agreements to repurchase. Securities loaned or sold under agreements to repurchase are secured predominantly by high-quality securities collateral, including government-issued debt and agency MBS, and constitute a significant portion of the federal funds purchased and securities loaned or sold under repurchase agreements on the Consolidated balance sheets.
The increase in the average balance of securities loaned or sold under agreements to repurchase for the three and nine months ended September 30, 2017 , compared with September 30, 2016 , was largely due to higher secured financing of trading assets-debt and equity instruments in the CIB related to client-driven market-making activities.
The balances associated with securities loaned or sold under agreements to repurchase fluctuate over time due to customers' investment and financing activities; the Firm's demand for financing; the ongoing management of the mix of the Firm's liabilities, including its secured and unsecured financing (for both the investment securities and market-making portfolios); and other market and portfolio factors.
The Firm's sources of short-term unsecured funding primarily consist of issuance of wholesale commercial paper. The increase in commercial paper as of September 30, 2017, compared to December 31, 2016, was due to a change in the mix of funding from securities sold under repurchase agreements.
70
Long-term funding and issuance
Long-term funding provides additional sources of stable funding and liquidity for the Firm. The Firm's long-term funding plan is driven primarily by expected client activity, liquidity considerations, and regulatory requirements, including TLAC . Long-term funding objectives include maintaining diversification, maximizing market access and optimizing funding costs. The Firm evaluates various funding markets, tenors and currencies in creating its optimal long-term funding plan.
The significant majority of the Firm's long-term unsecured funding is issued by the Parent Company to provide maximum flexibility in support of both bank and nonbank subsidiary funding needs. The Parent Company advances substantially all net funding proceeds to its subsidiary, the Intermediate Holding Company ("IHC"). The IHC does not issue debt to external counterparties. The following table summarizes long-term unsecured issuance and maturities or redemptions for the three and nine months ended September 30, 2017 and 2016 . For additional information on long-term debt and the IHC, see Note 21 and Executive Overview of JPMorgan Chase 's 2016 Annual Report .
Long-term unsecured funding |
|
|
|
| |||||||||
| Three months ended September 30, |
| Nine months ended September 30, | ||||||||||
(in millions) | 2017 | | 2016 | |
| 2017 | | 2016 | | ||||
Issuance |
|
|
|
|
| ||||||||
Senior notes issued in the U.S. market | $ | 3,967 | | $ | 8,467 | |
| $ | 18,646 | | $ | 21,654 | |
Senior notes issued in non-U.S. markets | - | | 2,172 | |
| 2,210 | | 7,063 | | ||||
Total senior notes | 3,967 | | 10,639 | |
| 20,856 | | 28,717 | | ||||
Subordinated debt | - | | - | |
| - | | - | | ||||
Structured notes | 6,587 | | 4,643 | |
| 23,181 | | 18,254 | | ||||
Total long-term unsecured funding – issuance | $ | 10,554 | | $ | 15,282 | |
| $ | 44,037 | | $ | 46,971 | |
|
|
|
|
|
| ||||||||
Maturities/redemptions |
|
|
|
|
| ||||||||
Senior notes | $ | 4,152 | | $ | 6,229 | |
| $ | 18,194 | | $ | 22,539 | |
Trust preferred securities | - | | - | |
| - | | - | | ||||
Subordinated debt | 895 | | 521 | |
| 3,901 | | 2,523 | | ||||
Structured notes | 5,657 | | 3,233 | |
| 18,030 | | 11,774 | | ||||
Total long-term unsecured funding – maturities/redemptions | $ | 10,704 | | $ | 9,983 | |
| $ | 40,125 | | $ | 36,836 | |
Long-term secured funding |
|
|
|
|
|
|
|
|
|
| |||||||||||||||||
| Three months ended September 30, |
| Nine months ended September 30, | ||||||||||||||||||||||||
| Issuance |
| Maturities/Redemptions |
| Issuance |
| Maturities/Redemptions | ||||||||||||||||||||
(in millions) | 2017 | | 2016 | |
| 2017 | | 2016 | |
| 2017 | | 2016 | |
| 2017 | | 2016 | | ||||||||
Credit card securitization | $ | - | | $ | 4,463 | |
| $ | 2,264 | | $ | - | |
| $ | 1,545 | | $ | 8,277 | |
| $ | 9,270 | | $ | 2,775 | |
Other securitizations (a) | - | | - | |
| - | | 58 | |
| - | | - | |
| 55 | | 177 | | ||||||||
FHLB advances | - | | 15,900 | |
| 4,694 | | 5,902 | |
| - | | 15,900 | |
| 15,748 | | 7,956 | | ||||||||
Other long-term secured funding (b) | 186 | | 89 | |
| 516 | | 2,546 | |
| 727 | | 415 | |
| 640 | | 2,635 | | ||||||||
Total long-term secured funding | $ | 186 | | $ | 20,452 | |
| $ | 7,474 | | $ | 8,506 | |
| $ | 2,272 | | $ | 24,592 | |
| $ | 25,713 | | $ | 13,543 | |
(a) | Other securitizations includes securitizations of student loans. The Firm deconsolidated the student loan securitization entities in the second quarter of 2017 as it no longer had a controlling financial interest in these entities as a result of the sale of the student loan portfolio. For additional information about the sale of the student loan portfolio, see CCB Business Segment Results on pages 20–24 . |
(b) | Includes long-term structured notes which are secured. |
The Firm's wholesale businesses also securitize loans for client-driven transactions; those client-driven loan securitizations are not considered to be a source of funding for the Firm and are not included in the table above. For further description of the client-driven loan securitizations, see Note 16 of JPMorgan Chase's 2016 Annual Report.
71
Credit ratings
The cost and availability of financing are influenced by credit ratings. Reductions in these ratings could have an adverse effect on the Firm's access to liquidity sources, increase the cost of funds, trigger additional collateral or funding requirements and decrease the number of investors and counterparties willing to lend to the Firm.
Additionally, the Firm's funding requirements for VIEs and other third-party commitments may be adversely affected by a decline in credit ratings. For additional information on the impact of a credit ratings downgrade on the funding requirements for VIEs, and on derivatives and collateral agreements, see SPEs on page 14 , and Liquidity risk and
credit-related contingent features in Note 4 .
The credit ratings of the Parent Company and the Firm's principal bank and nonbank subsidiaries as of September 30, 2017 , were as follows.
| JPMorgan Chase & Co. |
| JPMorgan Chase Bank, N.A. Chase Bank USA, N.A. |
| J.P. Morgan Securities LLC J.P. Morgan Securities plc | ||||||
September 30, 2017 | Long-term issuer | Short-term issuer | Outlook |
| Long-term issuer | Short-term issuer | Outlook |
| Long-term issuer | Short-term issuer | Outlook |
Moody's | A3 | P-2 | Stable |
| Aa3 | P-1 | Stable |
| A1 | P-1 | Stable |
Standard & Poor's | A- | A-2 | Stable |
| A+ | A-1 | Stable |
| A+ | A-1 | Stable |
Fitch Ratings | A+ | F1 | Stable |
| AA- | F1+ | Stable |
| AA- | F1+ | Stable |
On June 1, 2017, JPMorgan Chase Bank, N.A. terminated its guarantee of the payment of all obligations of J.P. Morgan Securities plc arising after such termination. J.P. Morgan Securities plc, whose credit ratings previously reflected the benefit of this guarantee, is now rated on a stand-alone, non-guaranteed basis.
Downgrades of the Firm's long-term ratings by one or two notches could result in an increase in its cost of funds, and the Firm's access to certain funding markets could be reduced. The nature and magnitude of the impact of ratings downgrades depends on numerous contractual and behavioral factors (which the Firm believes are incorporated in its liquidity risk and stress testing metrics). The Firm believes that it maintains sufficient liquidity to withstand a potential decrease in funding capacity due to ratings downgrades.
JPMorgan Chase's unsecured debt does not contain requirements that would call for an acceleration of payments, maturities or changes in the structure of the existing debt, provide any limitations on future borrowings or require additional collateral, based on unfavorable changes in the Firm's credit ratings, financial ratios,
earnings, or stock price.
Critical factors in maintaining high credit ratings include a stable and diverse earnings stream, strong capital and liquidity ratios, strong credit quality and risk management controls, diverse funding sources, and disciplined liquidity monitoring procedures. Rating agencies continue to evaluate economic and geopolitical trends, regulatory developments, future profitability, risk management practices, and litigation matters, as well as their broader ratings methodologies. Changes in any of these factors could lead to changes in the Firm's credit ratings.
Although the Firm closely monitors and endeavors to manage, to the extent it is able, factors influencing its credit ratings, there is no assurance that its credit ratings will not be changed in the future.
72
MARKET RISK MANAGEMENT | ||||
Market risk is the risk of loss arising from potential adverse changes in the value of the Firm's assets and liabilities resulting from changes in market variables such as interest rates, foreign exchange rates, equity prices, commodity prices, implied volatilities or credit spreads. For a discussion of the Firm's Market Risk Management organization, tools used to measure risk, risk monitoring and control and risk identification and classification, see Market Risk Management on pages 116–123 of JPMorgan Chase's 2016 Annual Report.
Value-at-risk
JPMorgan Chase utilizes value-at-risk ("VaR"), a statistical risk measure, to estimate the potential loss from adverse market moves in a normal market environment. The Firm has a single VaR framework used as a basis for calculating Risk Management VaR and Regulatory VaR.
Since VaR is based on historical data, it is an imperfect measure of market risk exposure and potential losses, and it is not used to estimate the impact of stressed market conditions or to manage any impact from potential stress events. In addition, based on their reliance on available historical data, limited time horizons, and other factors, VaR measures are inherently limited in their ability to measure certain risks and to predict losses, particularly those associated with market illiquidity and sudden or severe shifts in market conditions.
For certain products, specific risk parameters are not captured in VaR due to the lack of inherent liquidity and availability of appropriate historical data. The Firm uses proxies to estimate the VaR for these and other products when daily time series are not available. It is likely that using an actual price-based time series for these products, if available, would affect the VaR results presented. The Firm therefore considers other measures such as stress testing and nonstatistical measures, in addition to VaR, to capture and manage its market risk positions. For further information, see Other risk measures on pages 121–123 of JPMorgan Chase's 2016 Annual Report.
The Firm's VaR model calculations are periodically evaluated and enhanced in response to changes in the composition of the Firm's portfolios, changes in market conditions, improvements in the Firm's modeling techniques and measurements, and other factors. Such changes may affect historical comparisons of VaR results. For information regarding model reviews and approvals, see Model Risk Management on page 128 of JPMorgan Chase's 2016 Annual Report.
The Firm's Risk Management VaR is calculated assuming a one-day holding period and an expected tail-loss methodology which approximates a 95% confidence level. For risk management purposes, the Firm believes this methodology provides a stable measure of VaR that closely aligns to the day-to-day risk management decisions made by the lines of business, and provides the necessary and appropriate information to respond to risk events on a daily basis. The Firm calculates separately a daily aggregated VaR in accordance with regulatory rules ("Regulatory VaR"), which is used to derive the Firm's regulatory VaR-based capital requirements under Basel III. For further information regarding the key differences between Risk Management VaR and Regulatory VaR, see page 118 of JPMorgan Chase's 2016 Annual Report. For additional information on Regulatory VaR and the other components of market risk regulatory capital for the Firm (e.g., VaR-based measure, stressed VaR-based measure and the respective backtesting), see JPMorgan Chase's Basel III Pillar 3 Regulatory Capital Disclosures reports, which are available on the Firm's website at:
(http://investor.shareholder.com/jpmorganchase/basel.cfm).
73
The table below shows the results of the Firm's Risk Management VaR measure using a 95% confidence level.
Total VaR |
|
|
|
|
|
|
|
|
|
|
|
|
|
|
|
|
|
|
|
| ||||||||||||||||||
| Three months ended, |
| ||||||||||||||||||||||||||||||||||||
| September 30, 2017 |
| June 30, 2017 |
| September 30, 2016 |
| ||||||||||||||||||||||||||||||||
(in millions) | Avg. | Min | Max |
| Avg. | Min | Max |
| Avg. | Min | Max | |
| |||||||||||||||||||||||||
CIB trading VaR by risk type |
|
|
|
|
|
|
|
|
|
|
|
|
|
|
|
|
|
|
|
| ||||||||||||||||||
Fixed income | $ | 28 | |
| $ | 24 | |
| $ | 31 | |
|
| $ | 28 | |
| $ | 25 | |
| $ | 31 | |
|
| $ | 49 | |
| $ | 38 | |
| $ | 65 | |
|
Foreign exchange | 13 | |
| 6 | |
| 20 | |
|
| 8 | |
| 5 | |
| 12 | |
|
| 16 | |
| 10 | |
| 27 | |
| |||||||||
Equities | 12 | |
| 11 | |
| 14 | |
|
| 12 | |
| 9 | |
| 16 | |
|
| 8 | |
| 5 | |
| 10 | |
| |||||||||
Commodities and other | 6 | |
| 4 | |
| 8 | |
|
| 8 | |
| 6 | |
| 10 | |
|
| 9 | |
| 7 | |
| 11 | |
| |||||||||
Diversification benefit to CIB trading VaR | (31 | ) | (a) | NM | | (b) | NM | | (b) |
| (30 | ) | (a) | NM | | (b) | NM | | (b) |
| (42 | ) | (a) | NM | | (b) | NM | | (b) | |||||||||
CIB trading VaR | 28 | |
| 24 | |
| 32 | |
|
| 26 | |
| 20 | |
| 31 | |
|
| 40 | |
| 34 | |
| 50 | |
| |||||||||
Credit portfolio VaR | 5 | |
| 5 | |
| 6 | |
|
| 9 | |
| 6 | |
| 10 | |
|
| 13 | |
| 11 | |
| 16 | |
| |||||||||
Diversification benefit to CIB VaR | (3 | ) | (a) | NM | | (b) | NM | | (b) |
| (8 | ) | (a) | NM | | (b) | NM | | (b) |
| (10 | ) | (a) | NM | | (b) | NM | | (b) | |||||||||
CIB VaR | 30 | |
| 25 | |
| 33 | |
|
| 27 | |
| 22 | |
| 32 | |
|
| 43 | |
| 37 | |
| 51 | |
| |||||||||
|
|
|
|
|
|
|
|
|
|
|
|
|
|
|
|
|
|
|
|
| ||||||||||||||||||
CCB VaR | 2 | |
| 1 | |
| 3 | |
|
| 2 | |
| 2 | |
| 3 | |
|
| 3 | |
| 2 | |
| 4 | |
| |||||||||
Corporate VaR | 3 | |
| 1 | |
| 3 | |
|
| 3 | |
| 2 | |
| 3 | |
|
| 3 | |
| 3 | |
| 5 | |
| |||||||||
Diversification benefit to other VaR | (1 | ) | (a) | NM | | (b) | NM | | (b) |
| (2 | ) | (a) | NM | | (b) | NM | | (b) |
| (1 | ) | (a) | NM | | (b) | NM | | (b) | |||||||||
Other VaR | 4 | |
| 3 | |
| 5 | |
|
| 3 | |
| 3 | |
| 4 | |
|
| 5 | |
| 4 | |
| 6 | |
| |||||||||
Diversification benefit to CIB and other VaR | (4 | ) | (a) | NM | | (b) | NM | | (b) |
| (3 | ) | (a) | NM | | (b) | NM | | (b) |
| (5 | ) | (a) | NM | | (b) | NM | | (b) | |||||||||
Total VaR | $ | 30 | |
| $ | 26 | |
| $ | 34 | |
|
| $ | 27 | |
| $ | 22 | |
| $ | 33 | |
|
| $ | 43 | |
| $ | 37 | |
| $ | 49 | |
|
(a) | Average portfolio VaR is less than the sum of the VaR of the components described above, which is due to portfolio diversification. The diversification effect reflects the fact that the risks are not perfectly correlated. |
(b) | Designated as NM, because the minimum and maximum may occur on different days for different risk components, and hence it is not meaningful to compute a portfolio-diversification effect. |
Quarter over Quarter results
Average total VaR increased by $3 million for the three months ended September 30, 2017 as compared with the prior quarter, reflecting a change in exposure profile for the Foreign exchange risk type, partially offset by reduced volatility in the one-year historical look-back period.
Year over Year results
Average total VaR decreased by $13 million for the three months ended September 30, 2017, compared with the same period in the prior year. The decrease in average total VaR is primarily in the Fixed income risk type. The reduction reflects enhancements to VaR models to more appropriately reflect risk exposure for certain asset backed products and reduced volatility in the one-year historical look-back period.
The Firm refined the historical proxy time series inputs to certain VaR models during the first quarter of 2017. In the absence of this refinement, the average Total VaR for the three months ended September 30, 2017 would have been higher by $4 million and each of the components would have been higher by the amounts reported in the following table:
(in millions) | Amount by which reported VaR would have been higher for the three months ended September 30, 2017 | ||||
CIB fixed income VaR |
| $ | 4 | |
|
CIB trading VaR |
| 5 | |
| |
CIB VaR |
| 5 | |
| |
VaR can vary significantly as positions change, market volatility fluctuates, and diversification benefits change.
74
VaR back-testing
The Firm evaluates the effectiveness of its VaR methodology by back-testing, which compares the daily Risk Management VaR results with the daily gains and losses actually recognized on market-risk related revenue.
The Firm's definition of market risk-related gains and losses is consistent with the definition used by the banking regulators under Basel III. Under this definition market risk-related gains and losses are defined as: gains and losses on the positions included in the Firm's Risk Management VaR excluding fees, commissions, certain valuation adjustments (e.g., liquidity and DVA), net interest income, and gains and losses arising from intraday trading.
The following chart compares actual daily market risk-related gains and losses with the Firm's Risk Management VaR for the nine months ended September 30, 2017. As the chart presents market risk-related gains and losses related to those positions included in the Firm's Risk Management VaR, the results in the table below differ from the results of back-testing disclosed in the Market Risk section of the Firm's Basel III Pillar 3 Regulatory Capital Disclosures reports, which are based on Regulatory VaR applied to covered positions. The chart shows that for the nine months ended September 30, 2017, the Firm observed eight VaR back-testing exceptions and posted gains on 126 of the 194 days. The Firm observed one VaR back-testing exception and posted gains on 46 of the 65 days for the three months ended September 30, 2017.
Daily Market Risk-Related Gains and Losses
vs. Risk Management VaR (1-day, 95% Confidence level)
Nine months ended September 30, 2017
|
|
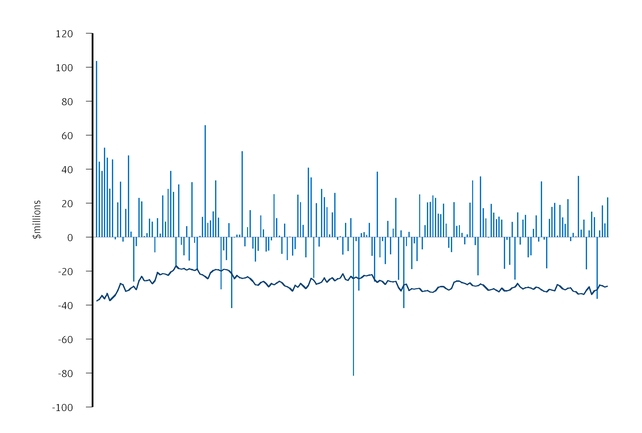
First Quarter 2017 | Second Quarter 2017 | Third Quarter 2017 |
75
Earnings-at-risk
The VaR and sensitivity measures illustrate the economic sensitivity of the Firm's Consolidated balance sheets to changes in market variables. The effect of interest rate exposure on the Firm's reported net income is also important as interest rate risk represents one of the Firm's significant market risks. Interest rate risk arises not only from trading activities but also from the Firm's traditional banking activities, which include extension of loans and credit facilities, taking deposits and issuing debt. The Firm evaluates its structural interest rate risk exposure through earnings-at-risk, which measures the extent to which changes in interest rates will affect the Firm's net interest income and interest rate-sensitive fees. For a summary by line of business, identifying positions included in earnings-at-risk, see the table on page 117 of JPMorgan Chase's 2016 Annual Report.
The Firm generates a baseline for net interest income and certain interest rate-sensitive fees, and then conducts simulations of changes for interest rate-sensitive assets and liabilities denominated in U.S. dollars and other currencies ("non-U.S. dollar" currencies). Earnings-at-risk scenarios estimate the potential change in this baseline, over the following 12 months utilizing multiple assumptions. These scenarios consider the impact on exposures as a result of changes in interest rates from baseline rates, as well as pricing sensitivities of deposits, optionality and changes in product mix. The scenarios include forecasted balance sheet changes, as well as modeled prepayment and reinvestment behavior, but do not include assumptions about actions that could be taken by the Firm in response to any such instantaneous rate changes. Mortgage prepayment assumptions are based on scenario interest rates compared with underlying contractual rates, the time since origination, and other factors which are updated periodically based on historical experience. The pricing sensitivity of deposits in the baseline and scenarios use modeled rates paid which may differ from actual rates paid due to timing lags and other factors. The Firm's earnings-at-risk scenarios are periodically evaluated and enhanced in response to changes in the composition of the Firm's balance sheet, changes in market conditions, improvements in the Firm's simulation and other factors.
JPMorgan Chase's 12-month earnings-at-risk sensitivity profiles | ||||||||||||||
U.S. dollar | Instantaneous change in rates | | ||||||||||||
(in billions) | +200bps | +100bps | -100bps | -200bps | ||||||||||
September 30, 2017 | $ | 2.9 | | | $ | 1.9 | | | $ | (4.0 | ) | (a) | NM | (b) |
December 31, 2016 | $ | 4.0 | | | $ | 2.4 | | | NM | | (b) | NM | (b) | |
(a) | As a result of the June 2017 increase in the Fed Funds target rate to between 1.00% and 1.25%, the -100 bps sensitivity has been included. |
(b) | Given the level of market interest rates, these downward parallel earnings-at-risk scenarios are not considered to be meaningful. |
The non-U.S. dollar sensitivities for an instantaneous
increase in rates by 200 and 100 basis points results in a 12-month benefit to net interest income of approximately $600 million and $400 million, respectively, at September 30, 2017 . The non-U.S. dollar sensitivity for an instantaneous decrease in rates by 200 and 100 basis points is not material to the Firm's earnings-at-risk at September 30, 2017 .
The Firm's sensitivity to rates is largely a result of assets re-pricing at a faster pace than deposits.
The Firm's net U.S. dollar sensitivity to 200 and 100 basis points instantaneous increase in rates decreased by approximately $1.1 billion and $500 million, respectively, when compared to December 31, 2016. The primary driver of that decrease was the updating of the Firm's baseline to reflect higher interest rates. As higher interest rates are reflected in the Firm's baselines, the magnitude of the sensitivity to further increases in rates would be expected to be less significant.
Separately, another U.S. dollar interest rate scenario used by the Firm - involving a steeper yield curve with long-term rates rising by 100 basis points and short-term rates staying at current levels - results in a 12-month benefit to net interest income of approximately $700 million. The increase in net interest income under this scenario reflects the Firm reinvesting at the higher long-term rates, with funding costs remaining unchanged. The result of the comparable non-U.S. dollar scenario was not material to the Firm.
76
Other sensitivity-based measures
The Firm quantifies the market risk of certain investment and funding activities by assessing the potential impact on net revenue and OCI due to changes in relevant market variables. For additional information on the positions
captured in other sensitivity-based measures, please refer to the Risk identification and classification table on page 117 of JPMorgan Chase's 2016 Annual Report.
The table below represents the potential impact to net revenue or OCI for market risk-sensitive instruments that are not included in VaR or earnings-at-risk. Where appropriate, instruments used for hedging purposes are reported along with the positions being hedged. The sensitivities disclosed in the table below may not be representative of the actual gain or loss that would have been realized at September 30, 2017 and December 31, 2016, as the movement in market parameters across maturities may vary and are not intended to imply management's expectation of future deterioration in these sensitivities.
Gain/(loss) (in millions) |
|
|
|
|
| September 30, 2017 | |
| December 31, 2016 | | ||
Activity |
| Description |
| Sensitivity measure |
|
| ||||||
|
|
|
|
|
|
|
|
| ||||
Investment activities |
|
|
|
|
|
|
|
| ||||
Investment management activities |
| Consists of seed capital and related hedges; and fund co-investments |
| 10% decline in market value |
| $ | (103 | ) |
| $ | (166 | ) |
Other investments |
| Consists of private equity and other investments held at fair value |
| 10% decline in market value |
| (376 | ) |
| (358 | ) | ||
|
|
|
|
|
|
|
|
| ||||
Funding activities |
|
|
|
|
|
|
|
| ||||
Non-USD LTD cross-currency basis |
| Represents the basis risk on derivatives used to hedge the foreign exchange risk on the non-USD LTD |
| 1 basis point parallel tightening of cross currency basis |
| (10 | ) |
| (7 | ) | ||
Non-USD LTD hedges foreign currency ("FX") exposure |
| Primarily represents the foreign exchange revaluation on the fair value of the derivative hedges |
| 10% depreciation of currency |
| (12 | ) |
| (23 | ) | ||
Funding spread risk – derivatives |
| Impact of changes in the spread related to derivatives DVA/FVA |
| 1 basis point parallel increase in spread |
| (5 | ) |
| (4 | ) | ||
Funding spread risk – fair value option elected liabilities (a) |
| Impact of changes in the spread related to fair value option elected liabilities DVA |
| 1 basis point parallel increase in spread |
| 19 | |
| 17 | | ||
(a) | Impact recognized through OCI. |
77
CRITICAL ACCOUNTING ESTIMATES USED BY THE FIRM | ||||
JPMorgan Chase 's accounting policies and use of estimates are integral to understanding its reported results. The Firm's most complex accounting estimates require management's judgment to ascertain the appropriate carrying value of assets and liabilities. The Firm has established policies and control procedures intended to ensure that estimation methods, including any judgments made as part of such methods, are well-controlled, independently reviewed and applied consistently from period to period. The methods used and judgments made reflect, among other factors, the nature of the assets or liabilities and the related business and risk management strategies, which may vary across the Firm's businesses and portfolios. In addition, the policies and procedures are intended to ensure that the process for changing methodologies occurs in an appropriate manner. The Firm believes its estimates for determining the carrying value of its assets and liabilities are appropriate. The following is a brief description of the Firm's critical accounting estimates involving significant judgments.
Allowance for credit losses
JPMorgan Chase 's allowance for credit losses covers the retained consumer and wholesale loan portfolios, as well as the Firm's wholesale and certain consumer lending-related commitments. The allowance for loan losses is intended to adjust the carrying value of the Firm's loan assets to reflect probable credit losses inherent in the loan portfolio as of the balance sheet date. Similarly, the allowance for lending-related commitments is established to cover probable credit losses inherent in the lending-related commitments portfolio as of the balance sheet date.
The allowance for credit losses includes a formula-based component, an asset-specific component, and a component related to PCI loans. The determination of each of these components involves significant judgment on a number of matters. For further discussion of these components, areas of judgment and methodologies used in establishing the Firm's allowance for credit losses, see pages 105–107 , pages 132–133 and Note 15 of JPMorgan Chase's 2016 Annual Report; and see Allowance for credit losses on pages 64–66 and Note 12 of this Form 10-Q.
As noted in the discussion on pages 132–133 of JPMorgan Chase's 2016 Annual Report, the Firm's allowance for credit losses is sensitive to numerous factors, which may differ depending on the portfolio. Changes in economic conditions or in the Firm's assumptions and estimates could affect its estimate of probable credit losses inherent in the portfolio at the balance sheet date. The Firm uses its best judgment to assess these economic conditions and loss data in estimating the allowance for credit losses and these estimates are subject to periodic refinement based on changes to underlying external or Firm-specific historical data. During the second quarter of 2017, the Firm refined its loss estimates relating to the wholesale portfolio. See Note 12 of this Form 10-Q for further discussion. The use of alternate estimates, data sources, adjustments to modeled loss estimates for model imprecision and other factors
would result in a different estimated allowance for credit losses, as well as impact any related sensitivities described below.
To illustrate the potential magnitude of certain alternate judgments, the Firm estimates that changes in the following inputs would have the following effects on the Firm's modeled credit loss estimates as of September 30, 2017 , without consideration of any offsetting or correlated effects of other inputs in the Firm's allowance for loan losses:
• | A combined 5% decline in housing prices and a 100 basis point increase in unemployment rates from current levels could imply: |
◦ | an increase to modeled credit loss estimates of approximately $550 million for PCI loans. |
◦ | an increase to modeled annual credit loss estimates of approximately $100 million for the residential real estate, excluding PCI loans. |
• | For credit card loans, a 100 basis point increase in unemployment rates from current levels could imply an increase to modeled annual credit loss estimates of approximately $975 million . |
• | An increase in PD factors consistent with a one-notch downgrade in the Firm's internal risk ratings for its entire wholesale loan portfolio could imply an increase in the Firm's modeled credit loss estimates of approximately $1.5 billion . |
• | A 100 basis point increase in estimated loss given default ("LGD") for the Firm's entire wholesale loan portfolio could imply an increase in the Firm's modeled credit loss estimates of approximately $175 million . |
The purpose of these sensitivity analyses is to provide an indication of the isolated impacts of hypothetical alternative assumptions on modeled loss estimates. The changes in the inputs presented above are not intended to imply management's expectation of future deterioration of those risk factors. In addition, these analyses are not intended to estimate changes in the overall allowance for loan losses, which would also be influenced by the judgment management applies to the modeled loss estimates to reflect the uncertainty and imprecision of these modeled loss estimates based on then-current circumstances and conditions.
It is difficult to estimate how potential changes in specific factors might affect the overall allowance for credit losses because management considers a variety of factors and inputs in estimating the allowance for credit losses. Changes in these factors and inputs may not occur at the same rate and may not be consistent across all geographies or product types, and changes in factors may be directionally inconsistent, such that improvement in one factor may offset deterioration in other factors. In addition, it is difficult to predict how changes in specific economic conditions or assumptions could affect borrower behavior or other factors considered by management in estimating the allowance for credit losses. Given the process the Firm
78
follows and the judgments made in evaluating the risk factors related to its loss estimates, management believes that its current estimate of the allowance for credit losses is appropriate.
Fair value of financial instruments, MSRs and commodities inventory
Assets measured at fair value
The following table includes the Firm's assets measured at fair value and the portion of such assets that are classified within level 3 of the valuation hierarchy. For further information, see Note 2 .
September 30, 2017 | Total assets at fair value |
| Total level 3 assets | |||||
Trading–debt and equity instruments | $ | 362.1 | |
|
| $ | 6.1 | |
Derivative receivables (a) | 58.3 | |
|
| 5.5 | | ||
Trading assets | 420.4 | |
|
| 11.6 | | ||
AFS securities | 216.2 | |
|
| 0.5 | | ||
Loans | 1.7 | |
|
| 0.3 | | ||
MSRs | 5.7 | |
|
| 5.7 | | ||
Other | 26.5 | |
|
| 1.8 | | ||
Total assets measured at fair value on a recurring basis | $ | 670.5 | |
|
| $ | 19.9 | |
Total assets measured at fair value on a nonrecurring basis | 1.1 | |
|
| 0.8 | | ||
Total assets measured at fair value | $ | 671.6 | |
|
| $ | 20.7 | |
Total Firm assets | $ | 2,563.1 | |
|
|
| ||
Level 3 assets as a percentage of total Firm assets (a) |
|
|
| 0.8 | % | |||
Level 3 assets as a percentage of total Firm assets at fair value (a) |
|
|
| 3.1 | % | |||
(a) | For purposes of the table above, the derivative receivables total reflects the impact of netting adjustments; however, the $5.5 billion of derivative receivables classified as level 3 does not reflect the netting adjustment as such netting is not relevant to a presentation based on the transparency of inputs to the valuation of an asset. The level 3 balances would be reduced if netting were applied, including the netting benefit associated with cash collateral. |
Valuation
Estimating fair value requires the application of judgment. The type and level of judgment required is largely dependent on the amount of observable market information available to the Firm. For instruments valued using internally developed models that use significant unobservable inputs and are therefore classified within level 3 of the valuation hierarchy, judgments used to estimate fair value are more significant than those required when estimating the fair value of instruments classified within levels 1 and 2.
In arriving at an estimate of fair value for an instrument within level 3, management must first determine the appropriate valuation technique to use. Second, the lack of observability of certain significant inputs requires management to assess all relevant empirical data in deriving valuation inputs - including, for example, transaction details, yield curves, interest rates, prepayment rates, default rates, volatilities, correlations, equity or debt prices, valuations of comparable instruments, foreign exchange rates and credit curves. For further discussion of the valuation of level 3 instruments, including unobservable inputs used, see Note 2 .
For instruments classified in levels 2 and 3, management judgment must be applied to assess the appropriate level of
valuation adjustments to reflect counterparty credit quality, the Firm's creditworthiness, market funding rates, liquidity considerations, unobservable parameters, and for portfolios that meet specified criteria, the size of the net open risk position. The judgments made are typically affected by the type of product and its specific contractual terms, and the level of liquidity for the product or within the market as a whole. For further discussion of valuation adjustments applied by the Firm see Note 2 .
Imprecision in estimating unobservable market inputs or other factors can affect the amount of gain or loss recorded for a particular position. Furthermore, while the Firm believes its valuation methods are appropriate and consistent with those of other market participants, the methods and assumptions used reflect management judgment and may vary across the Firm's businesses and portfolios.
The Firm uses various methodologies and assumptions in the determination of fair value. The use of methodologies or assumptions different than those used by the Firm could result in a different estimate of fair value at the reporting date. For a detailed discussion of the Firm's valuation process and hierarchy, and its determination of fair value for individual financial instruments, see Note 2 .
Goodwill impairment
Management applies significant judgment when testing goodwill for impairment. For a description of the significant valuation judgments associated with goodwill impairment, see Goodwill impairment on pages 133–134 of JPMorgan Chase's 2016 Annual Report.
For the three months ended September 30, 2017 , the Firm reviewed current conditions (including the estimated effects of regulatory and legislative changes and the current estimated market cost of equity) and prior projections of business performance for all its businesses. Based upon such reviews, the Firm concluded that the goodwill allocated to its reporting units was not impaired as of September 30, 2017 .
Declines in business performance, increases in credit losses, increases in equity capital requirements, as well as deterioration in economic or market conditions, adverse regulatory or legislative changes or increases in the estimated market cost of equity, could cause the estimated fair values of the Firm's reporting units or their associated goodwill to decline in the future, which could result in a material impairment charge to earnings in a future period related to some portion of the associated goodwill.
For additional information on goodwill, see Note 14 .
Income taxes
For a description of the significant assumptions, judgments and interpretations associated with the accounting for income taxes, see Income taxes on page 134 of JPMorgan Chase's 2016 Annual Report.
Litigation reserves
For a description of the significant estimates and judgments associated with establishing litigation reserves, see Note 21 of this Form 10-Q, and Note 31 of JPMorgan Chase's 2016 Annual Report.
79
ACCOUNTING AND REPORTING DEVELOPMENTS | ||||
Financial Accounting Standards Board ("FASB") Standards Issued but not yet Adopted | ||||
|
|
|
|
|
Standard |
| Summary of guidance |
| Effects on financial statements |
|
|
|
|
|
Revenue recognition – revenue from contracts with customers Issued May 2014 |
| • Requires that revenue from contracts with customers be recognized upon transfer of control of a good or service in the amount of consideration expected to be received. • Changes the accounting for certain contract costs, including whether they may be offset against revenue in the Consolidated statements of income, and requires additional disclosures about revenue and contract costs. • May be adopted using a full retrospective approach or a modified, cumulative effect approach wherein the guidance is applied only to existing contracts as of the date of initial application, and to new contracts transacted after that date. |
| • Required effective date: January 1, 2018. (a) • Because the guidance does not apply to revenue associated with financial instruments, including loans and securities that are accounted for under other U.S. GAAP, the Firm does not expect the new revenue recognition guidance to have a material impact on the elements of its Consolidated statements of income most closely associated with financial instruments, including securities gains, interest income and interest expense. • The Firm plans to adopt the revenue recognition guidance in the first quarter of 2018 using the modified retrospective method of adoption. • The Firm's implementation efforts include the identification of revenue and associated costs within the scope of the guidance, as well as the evaluation of revenue contracts, and any changes to existing revenue recognition policies. While the Firm has not yet identified any material changes in the timing of revenue recognition, the Firm's review is ongoing, and it continues to evaluate the presentation of certain contract costs (whether presented gross or offset against noninterest revenue). Based on its implementation work to date, the Firm expects it will be required to present certain underwriting costs (currently offset against Investment banking fees), as well as certain distribution costs (currently offset against Asset management, administration and commissions) gross as non-interest expense upon adoption. The Firm plans to expand its quantitative and qualitative disclosures within the noninterest revenue and noninterest expense note to the Consolidated Financial Statements. |
Recognition and measurement of financial assets and financial liabilities Issued January 2016 |
| • Requires that certain equity instruments be measured at fair value, with changes in fair value recognized in earnings. • Generally requires a cumulative-effect adjustment to retained earnings as of the beginning of the reporting period of adoption, except for those equity investments that are eligible for the measurement alternative. |
| • Required effective date: January 1, 2018. (a) • The Firm early adopted the provisions of this guidance related to presenting DVA in OCI for financial liabilities where the fair value option has been elected, effective January 1, 2016. The Firm plans to adopt the portions of the guidance that were not eligible for early adoption in the first quarter of 2018. • The Firm is currently evaluating the additional impacts on the Consolidated Financial Statements. The Firm's implementation efforts include the identification of securities within the scope of the guidance, the evaluation of the measurement alternative available for equity securities without a readily determinable fair value, and the related impact to accounting policies, presentation, and disclosures. The Firm expects to elect the measurement alternative for the majority of its equity investments that do not have readily determinable fair values. |
Leases Issued February 2016 |
| • Requires lessees to recognize all leases longer than twelve months on the Consolidated balance sheets as lease liabilities with corresponding right-of-use assets. • Requires lessees and lessors to classify most leases using principles similar to existing lease accounting, but eliminates the "bright line" classification tests. • Expands qualitative and quantitative disclosures regarding leasing arrangements. • Requires adoption using a modified cumulative effect approach wherein the guidance is applied to all periods presented. |
| • Required effective date: January 1, 2019. (a) • The Firm is in the process of its implementation which has included an initial evaluation of its leasing contracts and activities. As a lessee, the Firm is developing its methodology to estimate the right-of-use assets and lease liabilities, which is based on the present value of lease payments. The Firm expects to recognize lease liabilities and corresponding right-of-use assets (at their present value) related to predominantly all of the $10 billion of future minimum payments required under operating leases as disclosed in Note 30 of JPMorgan Chase's 2016 Annual report. However, the population of contracts subject to balance sheet recognition and their initial measurement remains under evaluation. The Firm does not expect material changes to the recognition of operating lease expense in its Consolidated statements of income. • The Firm plans to adopt the new guidance in the first quarter of 2019. |
Financial instruments – credit losses Issued June 2016 |
| • Replaces existing incurred loss impairment guidance and establishes a single allowance framework for financial assets carried at amortized cost (including HTM securities), which will reflect management's estimate of credit losses over the full remaining expected life of the financial assets. • Eliminates existing guidance for PCI loans, and requires recognition of an allowance for expected credit losses on financial assets purchased with more than insignificant credit deterioration since origination. • Amends existing impairment guidance for AFS securities to incorporate an allowance, which will allow for reversals of impairment losses in the event that the credit of an issuer improves. • Requires a cumulative-effect adjustment to retained earnings as of the beginning of the reporting period of adoption. |
| • Required effective date: January 1, 2020. (a) • The Firm has begun its implementation efforts by establishing a Firmwide, cross-discipline governance structure. The Firm is currently identifying key interpretive issues, and is assessing existing credit loss forecasting models and processes against the new guidance to determine what modifications may be required. The Firm is also evaluating the timing of adoption, as early adoption is permitted as of January 1, 2019. • The Firm expects that the new guidance will result in an increase in its allowance for credit losses due to several factors, including: 1. The allowance related to the Firm's loans and commitments will increase to cover credit losses over the full remaining expected life of the portfolio, and will consider expected future changes in macroeconomic conditions2. The nonaccretable difference on PCI loans will be recognized as an allowance, offset by an increase in the carrying value of the related loans3. An allowance will be established for estimated credit losses on HTM securities• The extent of the increase is under evaluation, but will depend upon the nature and characteristics of the Firm's portfolio at the adoption date, and the macroeconomic conditions and forecasts at that date. |
80
|
|
|
|
|
FASB Standards Issued but not yet Adopted (continued) | ||||
|
|
|
|
|
Standard |
| Summary of guidance |
| Effects on financial statements |
|
|
|
|
|
Classification of certain cash receipts and cash payments in the statement of cash flows Issued August 2016 |
| • Provides targeted amendments to the classification of certain cash flows, including treatment of cash payments for settlement of zero-coupon debt instruments and distributions received from equity method investments. • Requires retrospective application to all periods presented. |
| • Required effective date: January 1, 2018. (a) • No material impact is expected because the Firm is either already in compliance with the new guidance or the balances to which it would be applied are immaterial. The Firm plans to adopt the new guidance in the first quarter of 2018. |
Treatment of restricted cash on the statement of cash flows Issued November 2016 |
| • Requires inclusion of restricted cash in the cash and cash equivalents balances in the Consolidated statements of cash flows. • Requires additional disclosures to supplement the Consolidated statements of cash flows. • Requires retrospective application to all periods presented. |
| • Required effective date: January 1, 2018. (a) • The guidance will have no impact on the Firm's Consolidated statements of income or Consolidated balance sheets, but will result in reclassification of restricted cash balances and associated changes on the Consolidated statements of cash flows. • The Firm plans to adopt the new guidance in the first quarter of 2018. |
Definition of a business Issued January 2017 |
| • Narrows the definition of a business and clarifies that, to be considered a business, the fair value of the gross assets acquired (or disposed of) may not be substantially all concentrated in a single identifiable asset or a group of similar assets. • In addition, in order to be considered a business, a set of activities and assets must include, at a minimum, an input and a substantive process that together significantly contribute to the ability to create outputs. |
| • Required effective date: January 1, 2018. (a) • No material impact is expected because the guidance is to be applied prospectively, although it is anticipated that after adoption, fewer transactions will be treated as acquisitions or dispositions of a business. The Firm plans to adopt the new guidance in the first quarter of 2018. |
Goodwill Issued January 2017 |
| • Requires an impairment loss to be recognized when the estimated fair value of a reporting unit falls below its carrying value. • Eliminates the second condition in the current guidance that requires an impairment loss to be recognized only if the estimated implied fair value of the goodwill is below its carrying value. |
| • Required effective date: January 1, 2020. (a) • Based on current impairment test results, the Firm does not expect a material effect on the Consolidated Financial Statements. • After adoption, the guidance may result in more frequent goodwill impairment losses due to the removal of the second condition. • The Firm is evaluating the timing of adoption. |
Presentation of net periodic pension cost and net periodic postretirement benefit cost Issued March 2017 |
| • Requires the service cost component of net periodic pension and postretirement benefit cost to be reported separately in the consolidated results of operations from the other components (e.g., expected return on assets, interest costs, amortization of gains/losses and prior service costs). • Requires presentation in the consolidated results of operations of the service cost component in the same line item as other employee compensation costs and presentation of the other components in a different line item from the service cost component. |
| • Required effective date: January 1, 2018. (a) • The guidance will have no impact on the Firm's net income, but based on recent trends, the Firm expects that the guidance will result in an increase in compensation expense and a reduction in other expense. The Firm plans to adopt the new guidance in the first quarter of 2018. |
Premium amortization on purchased callable debt securities Issued March 2017 |
| • Requires amortization of premiums to the earliest call date on debt securities with call features that are explicit, noncontingent and callable at fixed prices and on preset dates. • Does not impact securities held at a discount; the discount continues to be amortized to the contractual maturity. • Requires adoption on a modified retrospective basis through a cumulative-effect adjustment directly to retained earnings as of the beginning of the period of adoption. |
| • Required effective date: January 1, 2019. (a) • The Firm is currently evaluating the impact on the Consolidated Financial Statements as well as the timing of adoption. At adoption, the guidance is expected to result in a cumulative effect adjustment which will reduce retained earnings which, for AFS securities, would have a corresponding increase in AOCI. Post-adoption, it will result in reduced interest income prior to the call date on callable debt securities held at a premium because those premiums will be amortized over a shorter time period. • The Firm's implementation efforts include identifying the population of debt securities subject to the new guidance (primarily obligations of U.S. states and municipalities) and quantifying the expected impact. |
Hedge accounting Issued August 2017 |
| • Reduces earnings volatility by better aligning the accounting with the economics of the risk management activities. • Expands the ability for certain hedges of interest rate risk to qualify for hedge accounting. • Allows recognition of ineffectiveness in cash flow hedges and net investment hedges in OCI. • Allows a one-time election at adoption to transfer certain securities classified as held-to-maturity to available-for-sale. • Simplifies hedge documentation requirements. |
| • Required effective date: January 1, 2019. (a) • The Firm's implementation efforts include identifying the population of hedge activity subject to the new guidance, evaluating the various transition elections and the timing of adoption, and determining the potential impact on the Consolidated Financial Statements. |
(a) | Early adoption is permitted. |
81
FORWARD-LOOKING STATEMENTS | ||||
From time to time, the Firm has made and will make forward-looking statements. These statements can be identified by the fact that they do not relate strictly to historical or current facts. Forward-looking statements often use words such as "anticipate," "target," "expect," "estimate," "intend," "plan," "goal," "believe," or other words of similar meaning. Forward-looking statements provide JPMorgan Chase's current expectations or forecasts of future events, circumstances, results or aspirations. JPMorgan Chase's disclosures in this Form 10-Q contain forward-looking statements within the meaning of the Private Securities Litigation Reform Act of 1995. The Firm also may make forward-looking statements in its other documents filed or furnished with the SEC. In addition, the Firm's senior management may make forward-looking statements orally to investors, analysts, representatives of the media and others.
All forward-looking statements are, by their nature, subject to risks and uncertainties, many of which are beyond the Firm's control. JPMorgan Chase's actual future results may differ materially from those set forth in its forward-looking statements. While there is no assurance that any list of risks and uncertainties or risk factors is complete, below are certain factors which could cause actual results to differ from those in the forward-looking statements:
• | Local, regional and global business, economic and political conditions and geopolitical events; |
• | Changes in laws and regulatory requirements, including capital and liquidity requirements affecting the Firm's businesses, and the ability of the Firm to address those requirements; |
• | Heightened regulatory and governmental oversight and scrutiny of JPMorgan Chase's business practices, including dealings with retail customers; |
• | Changes in trade, monetary and fiscal policies and laws; |
• | Changes in income tax laws and regulations; |
• | Securities and capital markets behavior, including changes in market liquidity and volatility; |
• | Changes in investor sentiment or consumer spending or savings behavior; |
• | Ability of the Firm to manage effectively its capital and liquidity, including approval of its capital plans by banking regulators; |
• | Changes in credit ratings assigned to the Firm or its subsidiaries; |
• | Damage to the Firm's reputation; |
• | Ability of the Firm to deal effectively with an economic slowdown or other economic or market disruption; |
• | Technology changes instituted by the Firm, its counterparties or competitors; |
• | The success of the Firm's business simplification initiatives and the effectiveness of its control agenda; |
• | Ability of the Firm to develop new products and services, and the extent to which products or services previously sold by the Firm (including but not limited to mortgages and asset-backed securities) require the Firm to incur liabilities or absorb losses not contemplated at their initiation or origination; |
• | Acceptance of the Firm's new and existing products and services by the marketplace and the ability of the Firm to innovate and to increase market share; |
• | Ability of the Firm to attract and retain qualified employees; |
• | Ability of the Firm to control expense; |
• | Competitive pressures; |
• | Changes in the credit quality of the Firm's customers and counterparties; |
• | Adequacy of the Firm's risk management framework, disclosure controls and procedures and internal control over financial reporting; |
• | Adverse judicial or regulatory proceedings; |
• | Changes in applicable accounting policies, including the introduction of new accounting standards; |
• | Ability of the Firm to determine accurate values of certain assets and liabilities; |
• | Occurrence of natural or man-made disasters or calamities or conflicts and the Firm's ability to deal effectively with disruptions caused by the foregoing; |
• | Ability of the Firm to maintain the security and integrity of its financial, accounting, technology, data processing and other operating systems and facilities; |
• | Ability of the Firm to effectively defend itself against cyberattacks and other attempts by unauthorized parties to access the Firm's information or disrupt its systems; and |
• | The other risks and uncertainties detailed in Part I, |
Item 1A: Risk Factors in JPMorgan Chase's 2016 Annual Report on Form 10-K for the year ended December 31, 2016.
Any forward-looking statements made by or on behalf of the Firm speak only as of the date they are made, and JPMorgan Chase does not undertake to update forward-looking statements to reflect the impact of circumstances or events that arise after the date the forward-looking statements were made. The reader should, however, consult any further disclosures of a forward-looking nature the Firm may make in any subsequent Annual Reports on Form 10-K, Quarterly Reports on Form 10-Q, or Current Reports on Form 8-K.
82
JPMorgan Chase & Co.
Consolidated statements of income (unaudited)
|
| Three months ended |
| Nine months ended | ||||||||||||
(in millions, except per share data) |
| 2017 | |
| 2016 | |
| 2017 | |
| 2016 | | ||||
Revenue |
|
|
|
|
|
|
|
| ||||||||
Investment banking fees |
| $ | 1,843 | |
| $ | 1,866 | |
| $ | 5,470 | |
| $ | 4,843 | |
Principal transactions |
| 2,721 | |
| 3,451 | |
| 9,440 | |
| 9,106 | | ||||
Lending- and deposit-related fees |
| 1,497 | |
| 1,484 | |
| 4,427 | |
| 4,290 | | ||||
Asset management, administration and commissions |
| 3,846 | |
| 3,597 | |
| 11,347 | |
| 10,902 | | ||||
Securities gains/(losses) |
| (1 | ) |
| 64 | |
| (38 | ) |
| 136 | | ||||
Mortgage fees and related income |
| 429 | |
| 624 | |
| 1,239 | |
| 1,980 | | ||||
Card income |
| 1,242 | |
| 1,202 | |
| 3,323 | |
| 3,861 | | ||||
Other income |
| 951 | |
| 782 | |
| 3,193 | |
| 2,844 | | ||||
Noninterest revenue |
| 12,528 | |
| 13,070 | |
| 38,401 | |
| 37,962 | | ||||
Interest income |
| 16,687 | |
| 14,070 | |
| 47,379 | |
| 41,435 | | ||||
Interest expense |
| 3,889 | |
| 2,467 | |
| 10,309 | |
| 7,105 | | ||||
Net interest income |
| 12,798 | |
| 11,603 | |
| 37,070 | |
| 34,330 | | ||||
Total net revenue |
| 25,326 | |
| 24,673 | |
| 75,471 | |
| 72,292 | | ||||
|
|
|
|
|
|
|
|
| ||||||||
Provision for credit losses |
| 1,452 | |
| 1,271 | |
| 3,982 | |
| 4,497 | | ||||
|
|
|
|
|
|
|
|
| ||||||||
Noninterest expense |
|
|
|
|
|
|
|
| ||||||||
Compensation expense |
| 7,646 | |
| 7,669 | |
| 23,553 | |
| 23,107 | | ||||
Occupancy expense |
| 930 | |
| 899 | |
| 2,803 | |
| 2,681 | | ||||
Technology, communications and equipment expense |
| 1,972 | |
| 1,741 | |
| 5,670 | |
| 5,024 | | ||||
Professional and outside services |
| 1,705 | |
| 1,665 | |
| 4,892 | |
| 4,913 | | ||||
Marketing |
| 710 | |
| 825 | |
| 2,179 | |
| 2,200 | | ||||
Other expense |
| 1,355 | |
| 1,664 | |
| 4,746 | |
| 4,013 | | ||||
Total noninterest expense |
| 14,318 | |
| 14,463 | |
| 43,843 | |
| 41,938 | | ||||
Income before income tax expense |
| 9,556 | |
| 8,939 | |
| 27,646 | |
| 25,857 | | ||||
Income tax expense |
| 2,824 | |
| 2,653 | |
| 7,437 | |
| 7,851 | | ||||
Net income |
| $ | 6,732 | |
| $ | 6,286 | |
| $ | 20,209 | |
| $ | 18,006 | |
Net income applicable to common stockholders (a) |
| $ | 6,262 | |
| $ | 5,812 | |
| $ | 18,786 | |
| $ | 16,584 | |
Net income per common share data |
|
|
|
|
|
|
|
| ||||||||
Basic earnings per share |
| $ | 1.77 | |
| $ | 1.60 | |
| $ | 5.26 | |
| $ | 4.51 | |
Diluted earnings per share |
| 1.76 | |
| 1.58 | |
| 5.22 | |
| 4.48 | | ||||
|
|
|
|
|
|
|
|
| ||||||||
Weighted-average basic shares (a) |
| 3,534.7 | |
| 3,637.7 | |
| 3,570.9 | |
| 3,674.6 | | ||||
Weighted-average diluted shares (a) |
| 3,559.6 | |
| 3,669.8 | |
| 3,597.0 | |
| 3,704.5 | | ||||
Cash dividends declared per common share |
| $ | 0.56 | |
| $ | 0.48 | |
| $ | 1.56 | |
| $ | 1.40 | |
(a) | The prior period amounts have been revised to conform with the current period presentation. The revision had no impact on the Firm's reported earnings per share. |
The Notes to Consolidated Financial Statements (unaudited) are an integral part of these statements.
|
|
|
|
|
83
JPMorgan Chase & Co.
Consolidated statements of comprehensive income (unaudited)
|
| Three months ended |
| Nine months ended | ||||||||||||
(in millions) |
| 2017 | |
| 2016 | |
| 2017 | |
| 2016 | | ||||
Net income |
| $ | 6,732 | |
| $ | 6,286 | |
| $ | 20,209 | |
| $ | 18,006 | |
Other comprehensive income/(loss), after–tax |
|
|
|
|
|
|
|
| ||||||||
Unrealized gains/(losses) on investment securities |
| 147 | |
| (160 | ) |
| 842 | |
| 1,132 | | ||||
Translation adjustments, net of hedges |
| - | |
| 4 | |
| 7 | |
| 5 | | ||||
Cash flow hedges |
| 26 | |
| 36 | |
| 170 | |
| (121 | ) | ||||
Defined benefit pension and OPEB plans |
| 22 | |
| 42 | |
| 26 | |
| 123 | | ||||
DVA on fair value option elected liabilities |
| (112 | ) |
| (66 | ) |
| (179 | ) |
| (11 | ) | ||||
Total other comprehensive income/(loss), after–tax |
| 83 | |
| (144 | ) |
| 866 | |
| 1,128 | | ||||
Comprehensive income |
| $ | 6,815 | |
| $ | 6,142 | |
| $ | 21,075 | |
| $ | 19,134 | |
The Notes to Consolidated Financial Statements (unaudited) are an integral part of these statements.
84
JPMorgan Chase & Co.
Consolidated balance sheets (unaudited)
(in millions, except share data) | Sep 30, 2017 |
| Dec 31, 2016 | ||||
Assets |
|
|
| ||||
Cash and due from banks | $ | 21,994 | |
| $ | 23,873 | |
Deposits with banks | 435,810 | |
| 365,762 | | ||
Federal funds sold and securities purchased under resale agreements (included $16,545 and $21,506 at fair value) | 185,454 | |
| 229,967 | | ||
Securities borrowed (included $3,080 and $0 at fair value) | 101,680 | |
| 96,409 | | ||
Trading assets (included assets pledged of $124,872 and $115,847) | 420,418 | |
| 372,130 | | ||
Securities (included $216,209 and $238,891 at fair value and assets pledged of $16,771 and $16,115) | 263,288 | |
| 289,059 | | ||
Loans (included $1,746 and $2,230 at fair value) | 913,761 | |
| 894,765 | | ||
Allowance for loan losses | (13,539 | ) |
| (13,776 | ) | ||
Loans, net of allowance for loan losses | 900,222 | |
| 880,989 | | ||
Accrued interest and accounts receivable | 61,757 | |
| 52,330 | | ||
Premises and equipment | 14,218 | |
| 14,131 | | ||
Goodwill | 47,309 | |
| 47,288 | | ||
Mortgage servicing rights | 5,738 | |
| 6,096 | | ||
Other intangible assets | 808 | |
| 862 | | ||
Other assets (included $7,509 and $7,557 at fair value and assets pledged of $1,491 and $1,603) | 104,378 | |
| 112,076 | | ||
Total assets (a) | $ | 2,563,074 | |
| $ | 2,490,972 | |
Liabilities |
|
|
| ||||
Deposits (included $21,157 and $13,912 at fair value) | $ | 1,439,027 | |
| $ | 1,375,179 | |
Federal funds purchased and securities loaned or sold under repurchase agreements (included $714 and $687 at fair value) | 169,393 | |
| 165,666 | | ||
Commercial paper | 24,248 | |
| 11,738 | | ||
Other borrowed funds (included $8,730 and $9,105 at fair value) | 29,719 | |
| 22,705 | | ||
Trading liabilities | 128,535 | |
| 136,659 | | ||
Accounts payable and other liabilities (included $12,557 and $9,120 at fair value) | 196,764 | |
| 190,543 | | ||
Beneficial interests issued by consolidated VIEs (included $118 and $120 at fair value) | 28,424 | |
| 39,047 | | ||
Long-term debt (included $44,170 and $37,686 at fair value) | 288,582 | |
| 295,245 | | ||
Total liabilities (a) | 2,304,692 | |
| 2,236,782 | | ||
Commitments and contingencies (see Notes 19, 20 and 21) | | |
| | | ||
Stockholders' equity |
|
|
| ||||
Preferred stock ($1 par value; authorized 200,000,000 shares; issued 2,606,750 shares) | 26,068 | |
| 26,068 | | ||
Common stock ($1 par value; authorized 9,000,000,000 shares; issued 4,104,933,895 shares) | 4,105 | |
| 4,105 | | ||
Additional paid-in capital | 90,697 | |
| 91,627 | | ||
Retained earnings | 175,827 | |
| 162,440 | | ||
Accumulated other comprehensive (loss) | (309 | ) |
| (1,175 | ) | ||
Shares held in restricted stock units ("RSU") Trust, at cost ( 472,953 shares) | (21 | ) |
| (21 | ) | ||
Treasury stock, at cost ( 635,208,318 and 543,744,003 shares) | (37,985 | ) |
| (28,854 | ) | ||
Total stockholders' equity | 258,382 | |
| 254,190 | | ||
Total liabilities and stockholders' equity | $ | 2,563,074 | |
| $ | 2,490,972 | |
(a) | The following table presents information on assets and liabilities related to VIEs that are consolidated by the Firm at September 30, 2017 , and December 31, 2016 . The difference between total VIE assets and liabilities represents the Firm's interests in those entities, which are eliminated in consolidation. |
(in millions) | Sep 30, 2017 |
| Dec 31, 2016 | ||||
Assets |
|
|
| ||||
Trading assets | $ | 1,595 | |
| $ | 3,185 | |
Loans | 69,052 | |
| 75,614 | | ||
All other assets | 2,698 | |
| 3,321 | | ||
Total assets | $ | 73,345 | |
| $ | 82,120 | |
Liabilities |
|
|
| ||||
Beneficial interests issued by consolidated VIEs | $ | 28,424 | |
| $ | 39,047 | |
All other liabilities | 412 | |
| 490 | | ||
Total liabilities | $ | 28,836 | |
| $ | 39,537 | |
The assets of the consolidated VIEs are used to settle the liabilities of those entities. The holders of the beneficial interests do not have recourse to the general credit of JPMorgan Chase . At September 30, 2017 , and December 31, 2016 , the Firm provided limited program-wide credit enhancements of $2.7 billion and $2.4 billion , respectively, related to its Firm-administered multi-seller conduits, which are eliminated in consolidation. For further discussion, see Note 13 .
The Notes to Consolidated Financial Statements (unaudited) are an integral part of these statements.
85
JPMorgan Chase & Co.
Consolidated statements of changes in stockholders' equity (unaudited)
|
| Nine months ended September 30, | ||||||
(in millions, except per share data) |
| 2017 | |
| 2016 | | ||
Preferred stock |
|
|
|
| ||||
Balance at January 1 and September 30 |
| $ | 26,068 | |
| $ | 26,068 | |
Common stock |
|
|
|
| ||||
Balance at January 1 and September 30 |
| 4,105 | |
| 4,105 | | ||
Additional paid-in capital |
|
|
|
| ||||
Balance at January 1 |
| 91,627 | |
| 92,500 | | ||
Shares issued and commitments to issue common stock for employee stock-based compensation awards, and related tax effects |
| (680 | ) |
| (380 | ) | ||
Other |
| (250 | ) |
| (17 | ) | ||
Balance at September 30 |
| 90,697 | |
| 92,103 | | ||
Retained earnings |
|
|
|
| ||||
Balance at January 1 |
| 162,440 | |
| 146,420 | | ||
Cumulative effect of change in accounting principle |
| - | |
| (154 | ) | ||
Net income |
| 20,209 | |
| 18,006 | | ||
Dividends declared: |
|
|
|
| ||||
Preferred stock |
| (1,235 | ) |
| (1,235 | ) | ||
Common stock ( $1.56 and $1.40 per share) |
| (5,587 | ) |
| (5,167 | ) | ||
Balance at September 30 |
| 175,827 | |
| 157,870 | | ||
Accumulated other comprehensive income/(loss) |
|
|
|
| ||||
Balance at January 1 |
| (1,175 | ) |
| 192 | | ||
Cumulative effect of change in accounting principle |
| - | |
| 154 | | ||
Other comprehensive income |
| 866 | |
| 1,128 | | ||
Balance at September 30 |
| (309 | ) |
| 1,474 | | ||
Shares held in RSU Trust, at cost |
|
|
|
| ||||
Balance at January 1 and September 30 |
| (21 | ) |
| (21 | ) | ||
Treasury stock, at cost |
|
|
|
| ||||
Balance at January 1 |
| (28,854 | ) |
| (21,691 | ) | ||
Purchase of treasury stock |
| (10,602 | ) |
| (6,831 | ) | ||
Reissuance from treasury stock |
| 1,471 | |
| 1,254 | | ||
Balance at September 30 |
| (37,985 | ) |
| (27,268 | ) | ||
Total stockholders' equity |
| $ | 258,382 | |
| $ | 254,331 | |
The Notes to Consolidated Financial Statements (unaudited) are an integral part of these statements.
86
JPMorgan Chase & Co.
| Nine months ended September 30, | ||||||
(in millions) | 2017 | |
| 2016 | | ||
Net income | $ | 20,209 | |
| $ | 18,006 | |
Adjustments to reconcile net income to net cash provided by operating activities: |
|
|
| ||||
Provision for credit losses | 3,982 | |
| 4,497 | | ||
Depreciation and amortization | 4,547 | |
| 4,032 | | ||
Deferred tax (benefit)/expense | (187 | ) |
| 851 | | ||
Other | 1,655 | |
| 1,424 | | ||
Originations and purchases of loans held-for-sale | (75,907 | ) |
| (32,619 | ) | ||
Proceeds from sales, securitizations and paydowns of loans held-for-sale | 75,255 | |
| 31,756 | | ||
Net change in: |
|
|
| ||||
Trading assets | (31,189 | ) |
| (44,082 | ) | ||
Securities borrowed | (5,191 | ) |
| (10,475 | ) | ||
Accrued interest and accounts receivable | (9,795 | ) |
| (17,731 | ) | ||
Other assets | 18,835 | |
| (6,428 | ) | ||
Trading liabilities | (23,162 | ) |
| 23,308 | | ||
Accounts payable and other liabilities | (2,948 | ) |
| 5,655 | | ||
Other operating adjustments | 7,858 | |
| 3,091 | | ||
Net cash used in operating activities | (16,038 | ) |
| (18,715 | ) | ||
Investing activities |
|
|
| ||||
Net change in: |
|
|
| ||||
Deposits with banks | (70,048 | ) |
| (56,185 | ) | ||
Federal funds sold and securities purchased under resale agreements | 44,463 | |
| (20,048 | ) | ||
Held-to-maturity securities: |
|
|
| ||||
Proceeds from paydowns and maturities | 3,508 | |
| 4,442 | | ||
Purchases | (594 | ) |
| (134 | ) | ||
Available-for-sale securities: |
|
|
| ||||
Proceeds from paydowns and maturities | 43,536 | |
| 49,652 | | ||
Proceeds from sales | 57,640 | |
| 34,971 | | ||
Purchases | (73,717 | ) |
| (66,767 | ) | ||
Proceeds from sales and securitizations of loans held-for-investment | 11,600 | |
| 8,761 | | ||
Other changes in loans, net | (39,385 | ) |
| (65,204 | ) | ||
All other investing activities, net | 655 | |
| (1,590 | ) | ||
Net cash used in investing activities | (22,342 | ) |
| (112,102 | ) | ||
Financing activities |
|
|
| ||||
Net change in: |
|
|
| ||||
Deposits | 51,352 | |
| 113,365 | | ||
Federal funds purchased and securities loaned or sold under repurchase agreements | 3,731 | |
| 15,797 | | ||
Commercial paper and other borrowed funds | 19,006 | |
| (469 | ) | ||
Beneficial interests issued by consolidated VIEs | (1,312 | ) |
| (4,767 | ) | ||
Proceeds from long-term borrowings | 46,311 | |
| 72,021 | | ||
Payments of long-term borrowings | (65,932 | ) |
| (51,054 | ) | ||
Treasury stock purchased | (10,602 | ) |
| (6,831 | ) | ||
Dividends paid | (6,478 | ) |
| (6,189 | ) | ||
All other financing activities, net | 329 | |
| (174 | ) | ||
Net cash provided by financing activities | 36,405 | |
| 131,699 | | ||
Effect of exchange rate changes on cash and due from banks | 96 | |
| 18 | | ||
Net increase/(decrease) in cash and due from banks | (1,879 | ) |
| 900 | | ||
Cash and due from banks at the beginning of the period | 23,873 | |
| 20,490 | | ||
Cash and due from banks at the end of the period | $ | 21,994 | |
| $ | 21,390 | |
Cash interest paid | $ | 10,294 | |
| $ | 6,922 | |
Cash income taxes paid, net | 3,238 | |
| 1,810 | | ||
The Notes to Consolidated Financial Statements (unaudited) are an integral part of these statements.
87
See the Glossary of Terms and Acronyms on pages 168–175 for definitions of terms and acronyms used throughout the Notes to Consolidated Financial Statements.
NOTES TO CONSOLIDATED FINANCIAL STATEMENTS (unaudited)
Note
1
– Basis of presentation
JPMorgan Chase & Co. ("JPMorgan Chase" or "the Firm"), a financial holding company incorporated under Delaware law in 1968, is a leading global financial services firm and one of the largest banking institutions in the U.S., with operations worldwide. The Firm is a leader in investment banking, financial services for consumers and small business, commercial banking, financial transaction processing and asset management. For a discussion of the Firm's business segments, see Note 22 .
The accounting and financial reporting policies of JPMorgan Chase and its subsidiaries conform to U.S. GAAP. Additionally, where applicable, the policies conform to the accounting and reporting guidelines prescribed by regulatory authorities.
The unaudited Consolidated Financial Statements prepared in conformity with U.S. GAAP require management to make estimates and assumptions that affect the reported amounts of assets, liabilities, revenue and expense, and the disclosures of contingent assets and liabilities. Actual results could be different from these estimates. In the opinion of management, all normal, recurring adjustments have been included such that this interim financial information is fairly presented.
These unaudited Consolidated Financial Statements should be read in conjunction with the audited Consolidated Financial Statements, and related notes thereto, included in JPMorgan Chase 's 2016 Annual Report.
Certain amounts reported in prior periods have been reclassified to conform with the current presentation.
Consolidation
The Consolidated Financial Statements include the accounts of JPMorgan Chase and other entities in which the Firm has a controlling financial interest. All material intercompany balances and transactions have been eliminated.
Assets held for clients in an agency or fiduciary capacity by the Firm are not assets of JPMorgan Chase and are not included on the Consolidated balance sheets.
The Firm determines whether it has a controlling financial interest in an entity by first evaluating whether the entity is a voting interest entity or a variable interest entity.
For a further description of JPMorgan Chase's accounting policies regarding consolidation, see Notes 1 and 16 of JPMorgan Chase's 2016 Annual Report.
Offsetting assets and liabilities
U.S. GAAP permits entities to present derivative receivables and derivative payables with the same counterparty and the related cash collateral receivables and payables on a net basis on the Consolidated balance sheets when a legally enforceable master netting agreement exists. U.S. GAAP also permits securities financing activities to be presented net when specified conditions are met, including the existence of a legally enforceable master netting agreement. The Firm has elected to net such balances when the specified conditions are met. For further information on offsetting assets and liabilities, see Note 1 of JPMorgan Chase 's 2016 Annual Report.
Note
2
– Fair value measurement
For a discussion of the Firm's valuation methodologies for assets, liabilities and lending-related commitments measured at fair value and the fair value hierarchy, see Note 3 of JPMorgan Chase's 2016 Annual Report.
88
Assets and liabilities measured at fair value on a recurring basis | | | | | | | |||||||||||
| Fair value hierarchy | | Derivative netting adjustments | | | ||||||||||||
September 30, 2017 (in millions) | Level 1 | Level 2 | | Level 3 | | Total fair value | | ||||||||||
Federal funds sold and securities purchased under resale agreements | $ | - | | $ | 16,545 | | | $ | - | | | $ | - | | $ | 16,545 | |
Securities borrowed | - | | 3,080 | | | - | | | - | | 3,080 | | |||||
Trading assets: | | | | | | | | | | | | | |||||
Debt instruments: | | | | | | | | | | | | | |||||
Mortgage-backed securities: | | | | | | | | | | | | | |||||
U.S. government agencies (a) | - | | 37,406 | | | 323 | | | - | | 37,729 | | |||||
Residential – nonagency | - | | 1,634 | | | 107 | | | - | | 1,741 | | |||||
Commercial – nonagency | - | | 1,489 | | | 27 | | | - | | 1,516 | | |||||
Total mortgage-backed securities | - | | 40,529 | | | 457 | | | - | | 40,986 | | |||||
U.S. Treasury and government agencies (a) | 33,625 | | 6,246 | | | 1 | | | - | | 39,872 | | |||||
Obligations of U.S. states and municipalities | - | | 6,742 | | | 715 | | | - | | 7,457 | | |||||
Certificates of deposit, bankers' acceptances and commercial paper | - | | 2,147 | |
| - | |
| - | | 2,147 | | |||||
Non-U.S. government debt securities | 32,227 | | 32,036 | |
| 80 | |
| - | | 64,343 | | |||||
Corporate debt securities | - | | 25,538 | |
| 361 | |
| - | | 25,899 | | |||||
Loans (b) | - | | 34,322 | |
| 3,207 | |
| - | | 37,529 | | |||||
Asset-backed securities | - | | 2,428 | |
| 271 | |
| - | | 2,699 | | |||||
Total debt instruments | 65,852 | | 149,988 | |
| 5,092 | |
| - | | 220,932 | | |||||
Equity securities | 123,229 | | 383 | |
| 288 | |
| - | | 123,900 | | |||||
Physical commodities (c) | 3,253 | | 1,119 | |
| - | |
| - | | 4,372 | | |||||
Other | - | | 12,212 | |
| 691 | |
| - | | 12,903 | | |||||
Total debt and equity instruments (d) | 192,334 | | 163,702 | |
| 6,071 | |
| - | | 362,107 | | |||||
Derivative receivables: |
|
|
|
|
|
|
| ||||||||||
Interest rate | 297 | | 473,589 | |
| 1,884 | |
| (450,069 | ) | 25,701 | | |||||
Credit | - | | 24,103 | |
| 1,593 | |
| (24,781 | ) | 915 | | |||||
Foreign exchange | 848 | | 167,191 | |
| 564 | |
| (151,526 | ) | 17,077 | | |||||
Equity | - | | 39,771 | |
| 1,298 | |
| (32,238 | ) | 8,831 | | |||||
Commodity | - | | 17,759 | |
| 142 | |
| (12,165 | ) | 5,736 | | |||||
Total derivative receivables (e) | 1,145 | | 722,413 | |
| 5,481 | |
| (670,779 | ) | 58,260 | | |||||
Total trading assets (f) | 193,479 | | 886,115 | |
| 11,552 | |
| (670,779 | ) | 420,367 | | |||||
Available-for-sale securities: |
|
|
|
|
|
|
| ||||||||||
Mortgage-backed securities: |
|
|
|
|
|
|
| ||||||||||
U.S. government agencies (a) | - | | 71,355 | |
| - | |
| - | | 71,355 | | |||||
Residential – nonagency | - | | 13,075 | |
| 1 | |
| - | | 13,076 | | |||||
Commercial – nonagency | - | | 6,118 | |
| - | |
| - | | 6,118 | | |||||
Total mortgage-backed securities | - | | 90,548 | |
| 1 | |
| - | | 90,549 | | |||||
U.S. Treasury and government agencies (a) | 26,209 | | - | |
| - | |
| - | | 26,209 | | |||||
Obligations of U.S. states and municipalities | - | | 32,092 | |
| - | |
| - | | 32,092 | | |||||
Certificates of deposit | - | | 58 | |
| - | |
| - | | 58 | | |||||
Non-U.S. government debt securities | 20,101 | | 11,186 | |
| - | |
| - | | 31,287 | | |||||
Corporate debt securities | - | | 3,759 | |
| - | |
| - | | 3,759 | | |||||
Asset-backed securities: |
|
|
|
|
|
|
| ||||||||||
Collateralized loan obligations | - | | 22,017 | |
| 486 | |
| - | | 22,503 | | |||||
Other | | | 9,200 | |
| - | |
| - | | 9,200 | | |||||
Equity securities | 552 | | - | |
| - | |
| - | | 552 | | |||||
Total available-for-sale securities | 46,862 | | 168,860 | |
| 487 | |
| - | | 216,209 | | |||||
Loans | - | | 1,469 | |
| 277 | |
| - | | 1,746 | | |||||
Mortgage servicing rights | - | | - | |
| 5,738 | |
| - | | 5,738 | | |||||
Other assets (f) | 4,905 | | - | |
| 1,871 | |
| - | | 6,776 | | |||||
Total assets measured at fair value on a recurring basis | $ | 245,246 | | $ | 1,076,069 | |
| $ | 19,925 | |
| $ | (670,779 | ) | $ | 670,461 | |
Deposits | $ | - | | $ | 17,319 | |
| $ | 3,838 | |
| $ | - | | $ | 21,157 | |
Federal funds purchased and securities loaned or sold under repurchase agreements | - | | 713 | |
| 1 | |
| - | | 714 | | |||||
Other borrowed funds | - | | 7,259 | |
| 1,471 | |
| - | | 8,730 | | |||||
Trading liabilities: |
|
|
|
|
|
| | | |||||||||
Debt and equity instruments (d) | 65,973 | | 23,073 | |
| 43 | |
| - | | 89,089 | | |||||
Derivative payables: |
|
|
|
|
|
| | | |||||||||
Interest rate | 220 | | 438,880 | |
| 1,220 | |
| (433,155 | ) | 7,165 | | |||||
Credit | - | | 24,540 | |
| 1,629 | |
| (24,499 | ) | 1,670 | | |||||
Foreign exchange | 895 | | 161,820 | |
| 1,103 | |
| (150,794 | ) | 13,024 | | |||||
Equity | - | | 41,590 | |
| 3,673 | |
| (35,387 | ) | 9,876 | | |||||
Commodity | - | | 20,381 | |
| 242 | |
| (12,912 | ) | 7,711 | | |||||
Total derivative payables (e) | 1,115 | | 687,211 | |
| 7,867 | |
| (656,747 | ) | 39,446 | | |||||
Total trading liabilities | 67,088 | | 710,284 | |
| 7,910 | |
| (656,747 | ) | 128,535 | | |||||
Accounts payable and other liabilities | 12,548 | | - | |
| 9 | |
| - | | 12,557 | | |||||
Beneficial interests issued by consolidated VIEs | - | | - | |
| 118 | |
| - | | 118 | | |||||
Long-term debt | - | | 27,519 | |
| 16,651 | |
| - | | 44,170 | | |||||
Total liabilities measured at fair value on a recurring basis | $ | 79,636 | | $ | 763,094 | |
| $ | 29,998 | |
| $ | (656,747 | ) | $ | 215,981 | |
89
| Fair value hierarchy | | Derivative netting adjustments | |
| | ||||||||||||
December 31, 2016 (in millions) | Level 1 | | Level 2 | | | Level 3 | | |
| Total fair value | | |||||||
Federal funds sold and securities purchased under resale agreements | $ | - | | $ | 21,506 | | | $ | - | | | $ | - | |
| $ | 21,506 | |
Securities borrowed | - | | - | | | - | | | - | |
| - | | |||||
Trading assets: |
|
| |
| |
|
|
| ||||||||||
Debt instruments: |
|
| |
| |
|
|
| ||||||||||
Mortgage-backed securities: |
|
| |
| |
|
|
| ||||||||||
U.S. government agencies (a) | 13 | | 40,586 | | | 392 | | | - | |
| 40,991 | | |||||
Residential – nonagency | - | | 1,552 | | | 83 | | | - | |
| 1,635 | | |||||
Commercial – nonagency | - | | 1,321 | | | 17 | | | - | |
| 1,338 | | |||||
Total mortgage-backed securities | 13 | | 43,459 | | | 492 | | | - | |
| 43,964 | | |||||
U.S. Treasury and government agencies (a) | 19,554 | | 5,201 | | | - | | | - | |
| 24,755 | | |||||
Obligations of U.S. states and municipalities | - | | 8,403 | | | 649 | | | - | |
| 9,052 | | |||||
Certificates of deposit, bankers' acceptances and commercial paper | - | | 1,649 | | | - | | | - | |
| 1,649 | | |||||
Non-U.S. government debt securities | 28,443 | | 23,076 | | | 46 | | | - | |
| 51,565 | | |||||
Corporate debt securities | - | | 22,751 | | | 576 | | | - | |
| 23,327 | | |||||
Loans (b) | - | | 28,965 | | | 4,837 | | | - | |
| 33,802 | | |||||
Asset-backed securities | - | | 5,250 | | | 302 | | | - | |
| 5,552 | | |||||
Total debt instruments | 48,010 | | 138,754 | | | 6,902 | | | - | |
| 193,666 | | |||||
Equity securities | 96,759 | | 281 | | | 231 | | | - | |
| 97,271 | | |||||
Physical commodities (c) | 5,341 | | 1,620 | | | - | | | - | |
| 6,961 | | |||||
Other | - | | 9,341 | | | 761 | | | - | |
| 10,102 | | |||||
Total debt and equity instruments (d) | 150,110 | | 149,996 | | | 7,894 | | | - | |
| 308,000 | | |||||
Derivative receivables: |
| | | | | | | | |
| | | ||||||
Interest rate | 715 | | 602,747 | | | 2,501 | | | (577,661 | ) |
| 28,302 | | |||||
Credit | - | | 28,256 | | | 1,389 | | | (28,351 | ) |
| 1,294 | | |||||
Foreign exchange | 812 | | 231,743 | | | 870 | | | (210,154 | ) |
| 23,271 | | |||||
Equity | - | | 34,032 | | | 908 | | | (30,001 | ) |
| 4,939 | | |||||
Commodity | 158 | | 18,360 | | | 125 | | | (12,371 | ) |
| 6,272 | | |||||
Total derivative receivables (e) | 1,685 | | 915,138 | | | 5,793 | | | (858,538 | ) |
| 64,078 | | |||||
Total trading assets (f) | 151,795 | | 1,065,134 | | | 13,687 | | | (858,538 | ) |
| 372,078 | | |||||
Available-for-sale securities: |
| | | | | | | | |
| | | ||||||
Mortgage-backed securities: |
| | | | | | | | |
| | | ||||||
U.S. government agencies (a) | - | | 64,005 | | | - | | | - | |
| 64,005 | | |||||
Residential – nonagency | - | | 14,442 | | | 1 | | | - | |
| 14,443 | | |||||
Commercial – nonagency | - | | 9,104 | | | - | | | - | |
| 9,104 | | |||||
Total mortgage-backed securities | - | | 87,551 | | | 1 | | | - | |
| 87,552 | | |||||
U.S. Treasury and government agencies (a) | 44,072 | | 29 | | | - | | | - | |
| 44,101 | | |||||
Obligations of U.S. states and municipalities | - | | 31,592 | | | - | | | - | |
| 31,592 | | |||||
Certificates of deposit | - | | 106 | | | - | | | - | |
| 106 | | |||||
Non-U.S. government debt securities | 22,793 | | 12,495 | | | - | | | - | |
| 35,288 | | |||||
Corporate debt securities | - | | 4,958 | | | - | | | - | |
| 4,958 | | |||||
Asset-backed securities: |
| | | | | | | | |
| | | ||||||
Collateralized loan obligations | - | | 26,738 | | | 663 | | | - | |
| 27,401 | | |||||
Other | - | | 6,967 | | | - | | | - | |
| 6,967 | | |||||
Equity securities | 926 | | - | | | - | | | - | |
| 926 | | |||||
Total available-for-sale securities | 67,791 | | 170,436 | | | 664 | | | - | |
| 238,891 | | |||||
Loans | - | | 1,660 | | | 570 | | | - | |
| 2,230 | | |||||
Mortgage servicing rights | - | | - | | | 6,096 | | | - | |
| 6,096 | | |||||
Other assets (f) | 4,357 | | - | | | 2,223 | | | - | |
| 6,580 | | |||||
Total assets measured at fair value on a recurring basis | $ | 223,943 | | $ | 1,258,736 | | | $ | 23,240 | | | $ | (858,538 | ) |
| $ | 647,381 | |
Deposits | $ | - | | $ | 11,795 | | | $ | 2,117 | | | $ | - | |
| $ | 13,912 | |
Federal funds purchased and securities loaned or sold under repurchase agreements | - | | 687 | | | - | | | - | |
| 687 | | |||||
Other borrowed funds | - | | 7,971 | | | 1,134 | | | - | |
| 9,105 | | |||||
Trading liabilities: |
|
| |
| | | |
| | | ||||||||
Debt and equity instruments (d) | 68,304 | | 19,081 | | | 43 | | | - | |
| 87,428 | | |||||
Derivative payables: |
|
| | | | |
|
|
| |||||||||
Interest rate | 539 | | 569,001 | | | 1,238 | | | (559,963 | ) |
| 10,815 | | |||||
Credit | - | | 27,375 | | | 1,291 | | | (27,255 | ) |
| 1,411 | | |||||
Foreign exchange | 902 | | 231,815 | | | 2,254 | | | (214,463 | ) |
| 20,508 | | |||||
Equity | - | | 35,202 | | | 3,160 | | | (30,222 | ) |
| 8,140 | | |||||
Commodity | 173 | | 20,079 | | | 210 | | | (12,105 | ) |
| 8,357 | | |||||
Total derivative payables (e) | 1,614 | | 883,472 | | | 8,153 | | | (844,008 | ) |
| 49,231 | | |||||
Total trading liabilities | 69,918 | | 902,553 | | | 8,196 | | | (844,008 | ) |
| 136,659 | | |||||
Accounts payable and other liabilities | 9,107 | | - | | | 13 | | | - | |
| 9,120 | | |||||
Beneficial interests issued by consolidated VIEs | - | | 72 | | | 48 | | | - | |
| 120 | | |||||
Long-term debt | - | | 23,792 | | | 13,894 | | | - | |
| 37,686 | | |||||
Total liabilities measured at fair value on a recurring basis | $ | 79,025 | | $ | 946,870 | | | $ | 25,402 | | | $ | (844,008 | ) |
| $ | 207,289 | |
(a) | At September 30, 2017 , and December 31, 2016 , included total U.S. government-sponsored enterprise obligations of $78.5 billion and $80.6 billion , respectively, which were predominantly mortgage-related. |
(b) | At September 30, 2017 , and December 31, 2016 , included within trading loans were $16.1 billion and $16.5 billion , respectively, of residential first-lien mortgages, and $3.4 billion and $3.3 billion , respectively, of commercial first-lien mortgages. Residential mortgage loans include conforming mortgage loans originated with the intent to sell to U.S. government agencies of $10.2 billion and $11.0 billion , respectively, and reverse mortgages of $838 million and $2.0 billion respectively. |
(c) | Physical commodities inventories are generally accounted for at the lower of cost or net realizable value. "Net realizable value" is a term defined in U.S. GAAP as not exceeding fair value less costs to sell ("transaction costs"). Transaction costs for the Firm's physical commodities inventories are either not applicable or immaterial to the value of the inventory. Therefore, net realizable value approximates fair value for the Firm's physical commodities inventories. When fair value hedging has been applied (or when net realizable value is below cost), the carrying value of physical commodities approximates fair value, because under fair value hedge accounting, the cost basis is adjusted for changes in fair value. For a further discussion of the Firm's hedge accounting relationships, see Note 4 . To provide consistent fair value disclosure information, all physical commodities inventories have been included in each period presented. |
(d) | Balances reflect the reduction of securities owned (long positions) by the amount of identical securities sold but not yet purchased (short positions). |
90
(e) | As permitted under U.S. GAAP, the Firm has elected to net derivative receivables and derivative payables and the related cash collateral received and paid when a legally enforceable master netting agreement exists. For purposes of the tables above, the Firm does not reduce derivative receivables and derivative payables balances for this netting adjustment, either within or across the levels of the fair value hierarchy, as such netting is not relevant to a presentation based on the transparency of inputs to the valuation of an asset or liability. The level 3 balances would be reduced if netting were applied, including the netting benefit associated with cash collateral. |
(f) | Certain investments that are measured at fair value using the net asset value per share (or its equivalent) as a practical expedient are not required to be classified in the fair value hierarchy. At September 30, 2017 , and December 31, 2016 , the fair values of these investments, which include certain hedge funds, private equity funds, real estate and other funds, were $784 million and $1.0 billion , respectively. Included in these balances at September 30, 2017 , and December 31, 2016 , were trading assets of $51 million and $52 million , respectively, and other assets of $733 million and $977 million , respectively. |
Transfers between levels for instruments carried at fair
value on a recurring basis
For the three months ended September 30, 2017 and 2016 and the nine months ended September 30, 2017 there were no individually significant transfers.
For the nine months ended September 30, 2016, transfers from level 3 to level 2 included $1.3 billion of long-term debt driven by an increase in observability and a reduction of the significance in the unobservable inputs for certain structured notes.
All transfers are based on changes in the observability of the valuation inputs and are assumed to occur at the beginning of the quarterly reporting period in which they occur.
Level 3 valuations
For further information on the Firm's valuation process and a detailed discussion of the determination of fair value for individual financial instruments, see Note 3 of JPMorgan Chase's 2016 Annual Report.
The following table presents the Firm's primary level 3 financial instruments, the valuation techniques used to measure the fair value of those financial instruments, the significant unobservable inputs, the range of values for those inputs and, for certain instruments, the weighted averages of such inputs. While the determination to classify an instrument within level 3 is based on the significance of the unobservable inputs to the overall fair value measurement, level 3 financial instruments typically include observable components (that is, components that are actively quoted and can be validated to external sources) in addition to the unobservable components. The level 1 and/or level 2 inputs are not included in the table. In addition, the Firm manages the risk of the observable components of level 3 financial instruments using securities and derivative positions that are classified within levels 1 or 2 of the fair value hierarchy.
The range of values presented in the table is representative of the highest and lowest level input used to value the significant groups of instruments within a product/instrument classification. Where provided, the weighted averages of the input values presented in the table are calculated based on the fair value of the instruments that the input is being used to value.
In the Firm's view, the input range and the weighted average value do not reflect the degree of input uncertainty or an assessment of the reasonableness of the Firm's estimates and assumptions. Rather, they reflect the characteristics of the various instruments held by the Firm and the relative distribution of instruments within the range of characteristics. For example, two option contracts may have similar levels of market risk exposure and valuation uncertainty, but may have significantly different implied volatility levels because the option contracts have different underlyings, tenors, or strike prices. The input range and weighted average values will therefore vary from period-to-period and parameter-to-parameter based on the characteristics of the instruments held by the Firm at each balance sheet date.
For the Firm's derivatives and structured notes positions classified within level 3 at September 30, 2017, interest rate correlation inputs used in estimating fair value were concentrated towards the upper end of the range presented; equity correlation and equity-FX and equity-IR correlation inputs were concentrated in the middle of the range; commodity correlation inputs were concentrated in the middle of the range; credit correlation inputs were distributed across the range; and the interest rate-foreign exchange ("IR-FX") correlation inputs were concentrated towards the lower end of the range. In addition, the interest rate spread volatility inputs used in estimating fair value were distributed across the range presented; equity volatilities and commodity volatilities were concentrated towards the lower end of the range; and forward commodity prices used in estimating the fair value of commodity derivatives were concentrated in the middle of the range presented. Recovery rate, yield, prepayment speed, conditional default rate and loss severity inputs used in estimating the fair value of credit derivatives were distributed across the range; and credit spreads were concentrated towards the lower end of the range.
91
Level 3 inputs (a) |
|
|
|
|
|
| |||||||||||
September 30, 2017 |
|
|
|
|
|
| |||||||||||
Product/Instrument | Fair value (in millions) |
| Principal valuation technique | Unobservable inputs (g) | Range of input values | Weighted average |
| ||||||||||
Residential mortgage-backed securities and loans (b) | $ | 1,490 | |
| Discounted cash flows | Yield | 4 | % | – | 16 | % |
| 6 | % | |||
|
|
| Prepayment speed | 0 | % | – | 40 | % |
| 9 | % | ||||||
|
|
|
| Conditional default rate | 0 | % | – | 10 | % |
| 1 | % | |||||
|
|
|
| Loss severity | 0 | % | – | 100 | % |
| 5 | % | |||||
Commercial mortgage-backed securities and loans (c) | 842 | |
| Market comparables | Price | $ | 1 | | – | $ | 102 | |
| $ | 94 | | |
Obligations of U.S. states and municipalities | 715 | |
| Market comparables | Price | $ | 59 | | – | $ | 100 | |
| $ | 97 | | |
Corporate debt securities | 361 | |
| Market comparables | Price | $ | 6 | | – | $ | 109 | |
| $ | 73 | | |
Loans (d) | 1,610 | |
| Market comparables | Price | $ | 5 | | – | $ | 105 | |
| $ | 82 | | |
Asset-backed securities | 486 | |
| Discounted cash flows | Credit spread | 186bps | – | 326bps | 216bps | | |||||||
|
|
|
| Prepayment speed | 20 | % |
| 20 | % | ||||||||
|
|
|
| Conditional default rate | 2 | % |
| 2 | % | ||||||||
|
|
|
| Loss severity | 30 | % |
| 30 | % | ||||||||
| 271 | |
| Market comparables | Price | $ | 3 | | – | $ | 179 | |
| $ | 92 | | |
Net interest rate derivatives | 605 | |
| Option pricing | Interest rate spread volatility | 3 | % | – | 38 | % |
|
| |||||
|
|
|
| Interest rate correlation | (50 | )% | – | 98 | % |
|
| ||||||
|
|
|
| IR-FX correlation | 60 | % | – | 70 | % |
|
| ||||||
| 59 | |
| Discounted cash flows | Prepayment speed | 4 | % | – | 25 | % |
|
| |||||
Net credit derivatives | (41 | ) |
| Discounted cash flows | Credit correlation | 40 | % | – | 75 | % |
|
| |||||
|
|
|
| Credit spread | 6bps | | – | 1502bps |
| ||||||||
|
|
|
| Recovery rate | 20 | % | – | 70 | % |
|
| ||||||
|
|
|
| Yield | 4 | % | – | 8 | % |
|
| ||||||
|
|
|
| Prepayment speed | 2 | % | – | 10 | % |
|
| ||||||
|
|
|
| Conditional default rate | 1 | % | – | 100 | % |
|
| ||||||
|
|
|
| Loss severity | 30 | % | – | 100 | % |
|
| ||||||
| 5 | |
| Market comparables | Price | $ | 10 | | | $ | 98 | |
|
| |||
Net foreign exchange derivatives | (345 | ) |
| Option pricing | IR-FX correlation | (50 | )% | – | 70 | % |
|
| |||||
| (194 | ) |
| Discounted cash flows | Prepayment speed | 7 | % |
|
| ||||||||
Net equity derivatives | (2,375 | ) |
| Option pricing | Equity volatility | 5 | % | – | 55 | % |
|
| |||||
|
|
|
| Equity correlation | (5 | )% | – | 90 | % |
|
| ||||||
|
|
|
| Equity-FX correlation | (50 | )% | – | 30 | % |
|
| ||||||
|
|
|
| Equity-IR correlation | 10 | % | – | 40 | % |
|
| ||||||
Net commodity derivatives | (100 | ) |
| Option pricing | Forward commodity price | $ | 46 | | – | $ 59 per barrel |
| ||||||
|
|
|
| Commodity volatility | 19 | % | – | 44 | % |
|
| ||||||
|
|
|
| Commodity correlation | (52 | )% | – | 88 | % |
|
| ||||||
MSRs | 5,738 | |
| Discounted cash flows | Refer to Note 14 |
|
| ||||||||||
Other assets | 1,028 | |
| Discounted cash flows | Credit spread | 40bps | | – | 90bps | 65bps | |||||||
|
|
|
| Yield | 8 | % | – | 46 | % |
| 37% | ||||||
| 1,534 | |
| Market comparables | EBITDA multiple | 6.8x | | – | 11.5x | |
| 8.2x | |||||
Long-term debt, other borrowed funds, and deposits (e) | 21,960 | |
| Option pricing | Interest rate spread volatility | 3 | % | – | 38 | % |
|
| |||||
|
|
| Interest rate correlation | (50 | )% | – | 98 | % |
|
| |||||||
|
|
| IR-FX correlation | (50 | )% | – | 70 | % |
|
| |||||||
|
|
| Equity correlation | (5 | )% | – | 90 | % |
|
| |||||||
|
|
| Equity-FX correlation | (50 | )% | – | 30 | % |
|
| |||||||
|
|
| Equity-IR correlation | 10 | % | – | 40 | % |
|
| |||||||
Other level 3 assets and liabilities, net (f) | 198 | |
|
|
|
|
|
|
|
| |||||||
(a) | The categories presented in the table have been aggregated based upon the product type, which may differ from their classification on the Consolidated balance sheets. Furthermore, the inputs presented for each valuation technique in the table are, in some cases, not applicable to every instrument valued using the technique as the characteristics of the instruments can differ. |
(b) | Includes U.S. government agency securities of $309 million , nonagency securities of $108 million and trading loans of $1.1 billion . |
(c) | Includes U.S. government agency securities of $14 million , nonagency securities of $27 million , trading loans of $525 million and non-trading loans of $276 million . |
(d) | Includes trading loans of $1.6 billion and non-trading loans of $1 million . |
(e) | Long-term debt, other borrowed funds and deposits include structured notes issued by the Firm that are predominantly financial instruments containing embedded derivatives. The estimation of the fair value of structured notes includes the derivative features embedded within the instrument. The significant unobservable inputs are broadly consistent with those presented for derivative receivables. |
(f) | Includes level 3 assets and liabilities that are insignificant both individually and in aggregate. |
(g) | Price is a significant unobservable input for certain instruments. When quoted market prices are not readily available, reliance is generally placed on price-based internal valuation techniques. The price input is expressed assuming a par value of $100 . |
92
Changes in and ranges of unobservable inputs
For a discussion of the impact on fair value of changes in unobservable inputs and the relationships between unobservable inputs as well as a description of attributes of the underlying instruments and external market factors that affect the range of inputs used in the valuation of the Firm's positions see Note 3 of JPMorgan Chase's 2016 Annual Report.
Changes in level 3 recurring fair value measurements
The following tables include a rollforward of the Consolidated balance sheets amounts (including changes in fair value) for financial instruments classified by the Firm within level 3 of the fair value hierarchy for the three and nine months ended September 30, 2017 and 2016. When a determination is made to classify a financial instrument within level 3, the determination is based on the significance of the unobservable parameters to the overall
fair value measurement. However, level 3 financial instruments typically include, in addition to the unobservable or level 3 components, observable components (that is, components that are actively quoted and can be validated to external sources); accordingly, the gains and losses in the table below include changes in fair value due in part to observable factors that are part of the valuation methodology. Also, the Firm risk-manages the observable components of level 3 financial instruments using securities and derivative positions that are classified within level 1 or 2 of the fair value hierarchy; as these level 1 and level 2 risk management instruments are not included below, the gains or losses in the following tables do not reflect the effect of the Firm's risk management activities related to such level 3 instruments.
93
| Fair value measurements using significant unobservable inputs |
|
| ||||||||||||||||||||||||||||||||
Three months ended | Fair | Total realized/unrealized gains/(losses) |
|
|
|
| Transfers into | Transfers (out of) level 3 (h) | Fair value at | Change in unrealized gains/(losses) related | |||||||||||||||||||||||||
Purchases (f) | Sales |
| Settlements (g) | ||||||||||||||||||||||||||||||||
Assets: |
|
|
|
|
|
|
|
|
|
|
|
|
|
|
| ||||||||||||||||||||
Trading assets: |
|
|
|
|
|
|
|
|
|
|
|
|
|
|
| ||||||||||||||||||||
Debt instruments: |
|
|
|
|
|
|
|
|
|
|
|
|
|
|
| ||||||||||||||||||||
Mortgage-backed securities: |
|
|
|
|
|
|
|
|
|
|
|
|
|
|
| ||||||||||||||||||||
U.S. government agencies | $ | 365 | |
| $ | (2 | ) |
| $ | - | | $ | (15 | ) |
| $ | (20 | ) | $ | 10 | | $ | (15 | ) |
| $ | 323 | |
| $ | (2 | ) |
| ||
Residential – nonagency | 98 | |
| 6 | |
| 4 | | (4 | ) |
| (12 | ) | 50 | | (35 | ) |
| 107 | |
| 5 | |
| |||||||||||
Commercial – nonagency | 65 | |
| 3 | |
| 10 | | (24 | ) |
| - | | 3 | | (30 | ) |
| 27 | |
| 3 | |
| |||||||||||
Total mortgage-backed securities | 528 | |
| 7 | |
| 14 | | (43 | ) |
| (32 | ) | 63 | | (80 | ) |
| 457 | |
| 6 | |
| |||||||||||
U.S. Treasury and government agencies | - | |
| - | |
| - | | - | |
| - | | 1 | | - | |
| 1 | |
| - | |
| |||||||||||
Obligations of U.S. states and municipalities | 681 | |
| 3 | |
| 31 | | - | |
| - | | - | | - | |
| 715 | |
| 3 | |
| |||||||||||
Non-U.S. government debt securities | 37 | |
| - | |
| 252 | | (217 | ) |
| - | | 23 | | (15 | ) |
| 80 | |
| - | |
| |||||||||||
Corporate debt securities | 461 | |
| 7 | |
| 193 | | (327 | ) |
| (22 | ) | 68 | | (19 | ) |
| 361 | |
| 8 | |
| |||||||||||
Loans | 4,488 | |
| 131 | |
| 564 | | (1,498 | ) |
| (421 | ) | 246 | | (303 | ) |
| 3,207 | |
| 71 | |
| |||||||||||
Asset-backed securities | 83 | |
| 5 | |
| 170 | | (10 | ) |
| (8 | ) | 36 | | (5 | ) |
| 271 | |
| 4 | |
| |||||||||||
Total debt instruments | 6,278 | |
| 153 | |
| 1,224 | | (2,095 | ) |
| (483 | ) | 437 | | (422 | ) |
| 5,092 | |
| 92 | |
| |||||||||||
Equity securities | 284 | |
| 6 | |
| 29 | | (40 | ) |
| - | | 16 | | (7 | ) |
| 288 | |
| 7 | |
| |||||||||||
Other | 731 | |
| 20 | |
| 5 | | (38 | ) |
| (25 | ) | - | | (2 | ) |
| 691 | |
| 16 | |
| |||||||||||
Total trading assets – debt and equity instruments | 7,293 | |
| 179 | | (c) | 1,258 | | (2,173 | ) |
| (508 | ) | 453 | | (431 | ) |
| 6,071 | |
| 115 | | (c) | |||||||||||
Net derivative receivables: (a) |
|
|
|
|
|
|
|
|
|
|
|
|
|
|
| ||||||||||||||||||||
Interest rate | 712 | |
| 101 | |
| 16 | | (23 | ) |
| (182 | ) | 21 | | 19 | |
| 664 | |
| (7 | ) |
| |||||||||||
Credit | (45 | ) |
| (32 | ) |
| - | | (1 | ) |
| (2 | ) | 40 | | 4 | |
| (36 | ) |
| (22 | ) |
| |||||||||||
Foreign exchange | (686 | ) |
| 16 | |
| 9 | | (2 | ) |
| 68 | | (39 | ) | 95 | |
| (539 | ) |
| 37 | |
| |||||||||||
Equity | (2,444 | ) |
| (10 | ) |
| 355 | | (184 | ) |
| (132 | ) | (1 | ) | 41 | |
| (2,375 | ) |
| 82 | |
| |||||||||||
Commodity | (58 | ) |
| (30 | ) |
| - | | - | |
| (3 | ) | (2 | ) | (7 | ) |
| (100 | ) |
| (51 | ) |
| |||||||||||
Total net derivative receivables | (2,521 | ) |
| 45 | | (c) | 380 | | (210 | ) |
| (251 | ) | 19 | | 152 | |
| (2,386 | ) |
| 39 | | (c) | |||||||||||
Available-for-sale securities: |
|
|
|
|
|
|
|
|
|
|
|
|
|
|
| ||||||||||||||||||||
Asset-backed securities | 547 | |
| 2 | |
| - | | - | |
| (63 | ) | - | | - | |
| 486 | |
| 2 | |
| |||||||||||
Other | 1 | |
| - | |
| - | | - | |
| - | | - | | - | |
| 1 | |
| - | |
| |||||||||||
Total available-for-sale securities | 548 | |
| 2 | | (d) | - | | - | |
| (63 | ) | - | | - | |
| 487 | |
| 2 | | (d) | |||||||||||
Loans | 305 | |
| 8 | | (c) | - | | (26 | ) |
| (10 | ) | - | | - | |
| 277 | |
| 8 | | (c) | |||||||||||
Mortgage servicing rights | 5,753 | |
| (66 | ) | (e) | 253 | | (2 | ) |
| (200 | ) | - | | - | |
| 5,738 | |
| (66 | ) | (e) | |||||||||||
Other assets | 1,934 | |
| 18 | | (c) | 3 | | (2 | ) |
| (82 | ) | - | | - | |
| 1,871 | |
| 16 | | (c) | |||||||||||
|
|
|
|
|
|
|
|
|
|
|
|
|
|
|
| ||||||||||||||||||||
| Fair value measurements using significant unobservable inputs |
|
| ||||||||||||||||||||||||||||||||
Three months ended | Fair | Total realized/unrealized (gains)/losses |
|
|
|
| Transfers into | Transfers (out of) level 3 (h) | Fair value at | Change in unrealized (gains)/ | |||||||||||||||||||||||||
Purchases | Sales | Issuances | Settlements (g) | ||||||||||||||||||||||||||||||||
Liabilities: (b) |
|
|
|
|
|
|
|
|
|
|
|
|
|
|
| ||||||||||||||||||||
Deposits | $ | 2,131 | |
| $ | 33 | | (c) | $ | - | | $ | - | | $ | 1,909 | | $ | (58 | ) | $ | - | | $ | (177 | ) |
| $ | 3,838 | |
| $ | 27 | | (c) |
Federal funds purchased and securities loaned or sold under repurchase agreements | - | |
| - | |
| - | | - | | - | | - | | 1 | | - | |
| 1 | |
| - | |
| ||||||||||
Other borrowed funds | 1,314 | |
| 33 | | (c) | - | | - | | 818 | | (631 | ) | 13 | | (76 | ) |
| 1,471 | |
| 21 | | (c) | ||||||||||
Trading liabilities – debt and equity instruments | 36 | |
| 2 | | (c) | (23 | ) | 28 | | - | | - | | - | | - | |
| 43 | |
| 3 | | (c) | ||||||||||
Accounts payable and other liabilities | 10 | |
| - | |
| - | | - | | - | | (1 | ) | - | | - | |
| 9 | |
| - | |
| ||||||||||
Beneficial interests issued by consolidated VIEs | 1 | |
| - | | | - | | 39 | | - | | - | | 78 | | - | |
| 118 | |
| - | | | ||||||||||
Long-term debt | 16,660 | |
| 397 | | (c) | - | | - | | 3,174 | | (3,552 | ) | 181 | | (209 | ) |
| 16,651 | |
| 320 | | (c) | ||||||||||
94
| Fair value measurements using significant unobservable inputs | |
| |||||||||||||||||||||||||||||||
Three months ended | Fair | Total realized/unrealized gains/(losses) | | | | | Transfers into level 3 (h) | Transfers (out of) level 3 (h) | Fair value at | Change in unrealized gains/(losses) related | ||||||||||||||||||||||||
Purchases (f) | Sales | | Settlements (g) | |||||||||||||||||||||||||||||||
Assets: | | | | | | | | | | | | | |
| | | | | | | | | | |||||||||||
Federal funds sold and securities purchased under resale agreements | $ | - | | $ | - | |
| $ | - | | $ | - | |
| $ | - | | $ | - | | $ | - | |
| $ | - | |
| $ | - | |
| ||
Trading assets: | | | | | | | | | | | | | |
| | | | | | | | | | |||||||||||
Debt instruments: | | | | | | | | | | | | | |
| | | | | | | | | | |||||||||||
Mortgage-backed securities: | | | | | | | | | | | | | |
| | | | | | | | | | |||||||||||
U.S. government agencies | 473 | | (4 | ) | | 4 | | (22 | ) | | | (31 | ) | 9 | | (3 | ) | | 426 | | | - | | | ||||||||||
Residential – nonagency | 200 | | (3 | ) | | 43 | | (66 | ) | | | (5 | ) | 10 | | (73 | ) | | 106 | | | 1 | | | ||||||||||
Commercial – nonagency | 30 | | - | | | - | | (1 | ) | | | (1 | ) | 33 | | (20 | ) | | 41 | | | - | | | ||||||||||
Total mortgage-backed securities | 703 | | (7 | ) | | 47 | | (89 | ) | | | (37 | ) | 52 | | (96 | ) | | 573 | | | 1 | | | ||||||||||
Obligations of U.S. states and municipalities | 551 | | 2 | | | 68 | | (25 | ) | | | - | | - | | - | | | 596 | | | 2 | | | ||||||||||
Non-U.S. government debt securities | 37 | | (1 | ) | | 54 | | (35 | ) | | | (2 | ) | - | | (12 | ) | | 41 | | | (1 | ) | | ||||||||||
Corporate debt securities | 516 | | 17 | | | 63 | | (43 | ) | | | (30 | ) | 21 | | (44 | ) | | 500 | | | (1 | ) | | ||||||||||
Loans | 6,016 | | 23 | | | 498 | | (1,111 | ) | | | (297 | ) | 159 | | (358 | ) | | 4,930 | | | 18 | | | ||||||||||
Asset-backed securities | 959 | | 18 | | | 133 | | (173 | ) | | | (40 | ) | 29 | | (600 | ) | | 326 | | | 13 | | | ||||||||||
Total debt instruments | 8,782 | | 52 | | | 863 | | (1,476 | ) | | | (406 | ) | 261 | | (1,110 | ) | | 6,966 | | | 32 | | | ||||||||||
Equity securities | 246 | | 21 | | | 42 | | (35 | ) | | | (2 | ) | 2 | | (2 | ) | | 272 | | | 18 | | | ||||||||||
Other | 670 | | 45 | | | 276 | | - | | | | (305 | ) | 1 | | (6 | ) | | 681 | | | 30 | | | ||||||||||
Total trading assets – debt and equity instruments | 9,698 | | 118 | | (c) | 1,181 | | (1,511 | ) | | | (713 | ) | 264 | | (1,118 | ) | | 7,919 | | | 80 | | (c) | ||||||||||
Net derivative receivables: (a) | | | | | | | | | | | | | |
| | | | | | | | | | |||||||||||
Interest rate | 1,107 | | 247 | | | 36 | | (7 | ) | | | (319 | ) | (1 | ) | 180 | | | 1,243 | | | 79 | | | ||||||||||
Credit | 279 | | (231 | ) | | 8 | | - | | | | 48 | | (8 | ) | (3 | ) | | 93 | | | (237 | ) | | ||||||||||
Foreign exchange | (1,205 | ) | 126 | | | - | | (5 | ) | | | (509 | ) | 4 | | 1 | | | (1,588 | ) | | (103 | ) | | ||||||||||
Equity | (1,892 | ) | (251 | ) | | 106 | | (249 | ) | | 158 | | (6 | ) | (303 | ) | | (2,437 | ) | | (67 | ) | | |||||||||||
Commodity | (719 | ) | (169 | ) | | - | | (9 | ) | | | 10 | | 5 | | (12 | ) | | (894 | ) | | 1 | | | ||||||||||
Total net derivative receivables | (2,430 | ) | (278 | ) | (c) | 150 | | (270 | ) | | (612 | ) | (6 | ) | (137 | ) | | (3,583 | ) | | (327 | ) | (c) | |||||||||||
Available-for-sale securities: |
|
| |
|
| | |
|
|
| |
| |
| | |||||||||||||||||||
Asset-backed securities | 809 | | 18 | | | - | | - | | | | (5 | ) | - | | (42 | ) | | 780 | | | 18 | | | ||||||||||
Other | 1 | | - | | | - | | - | | | | - | | - | | - | | | 1 | | | - | | | ||||||||||
Total available-for-sale securities | 810 | | 18 | | (d) | - | | - | | | | (5 | ) | - | | (42 | ) | | 781 | | | 18 | | (d) | ||||||||||
Loans | 785 | | 7 | | (c) | 75 | | - | | | | (23 | ) | - | | - | | | 844 | | | 7 | | (c) | ||||||||||
Mortgage servicing rights | 5,072 | | (87 | ) | (e) | 190 | | (5 | ) | | | (233 | ) | - | | - | | | 4,937 | | | (87 | ) | (e) | ||||||||||
Other assets | 2,369 | | 24 | | (c) | 6 | | - | |
| (34 | ) | - | | - | |
| 2,365 | |
| 15 | | (c) | |||||||||||
| Fair value measurements using significant unobservable inputs | | | |||||||||||||||||||||||||||||||
Three months ended | Fair value at | Total realized/unrealized (gains)/losses | | | | | Transfers into level 3 (h) | Transfers (out of) level 3 (h) | Fair value at | Change in unrealized (gains)/losses related | ||||||||||||||||||||||||
Purchases | Sales | Issuances | Settlements (g) | |||||||||||||||||||||||||||||||
Liabilities: (b) | | | | | | | | | | | | |
| | | | | | | | | |||||||||||||
Deposits | $ | 2,409 | | $ | 1 | | (c) | $ | - | | $ | - | | $ | 602 | | $ | (191 | ) | $ | - | | $ | (192 | ) | | $ | 2,629 | | | $ | (10 | ) | (c) |
Federal funds purchased and securities loaned or sold under repurchase agreements | - | | - | |
| - | | - | | - | | - | | - | | - | |
| - | |
| - | |
| ||||||||||
Other borrowed funds | 907 | | (67 | ) | (c) | - | | - | | 584 | | (420 | ) | 63 | | (16 | ) | | 1,051 | | | (48 | ) | (c) | ||||||||||
Trading liabilities – debt and equity instruments | 57 | | (4 | ) | (c) | (8 | ) | 5 | | - | | (6 | ) | 11 | | - | | | 55 | | | - | | (c) | ||||||||||
Accounts payable and other liabilities | 15 | | - | | | - | | - | | - | | (1 | ) | - | | - | | | 14 | | | - | | | ||||||||||
Beneficial interests issued by consolidated VIEs | 584 | | (11 | ) | (c) | - | | - | | - | | (525 | ) | - | | - | | | 48 | | | 7 | | (c) | ||||||||||
Long-term debt | 13,147 | | 324 | | (c) | - | | - | | 1,877 | | (1,432 | ) | 30 | | (217 | ) | | 13,729 | | | 268 | | (c) | ||||||||||
95
| Fair value measurements using significant unobservable inputs |
|
| ||||||||||||||||||||||||||||||||
Nine months ended | Fair | Total realized/unrealized gains/(losses) |
|
|
|
| Transfers into | Transfers (out of) level 3 (h) | Fair value at | Change in unrealized gains/(losses) related | |||||||||||||||||||||||||
Purchases (f) | Sales |
| Settlements (g) | ||||||||||||||||||||||||||||||||
Assets: |
|
|
|
|
|
|
|
|
|
|
|
|
|
|
| ||||||||||||||||||||
Trading assets: |
|
|
|
|
|
|
|
|
|
|
|
|
|
|
| ||||||||||||||||||||
Debt instruments: |
|
|
|
|
|
|
|
|
|
|
|
|
|
|
| ||||||||||||||||||||
Mortgage-backed securities: |
|
|
|
|
|
|
|
|
|
|
|
|
|
|
| ||||||||||||||||||||
U.S. government agencies | $ | 392 | |
| $ | (9 | ) |
| $ | 161 | | $ | (166 | ) |
| $ | (55 | ) | $ | 37 | | $ | (37 | ) |
| $ | 323 | |
| $ | (17 | ) |
| ||
Residential – nonagency | 83 | |
| 14 | |
| 40 | | (24 | ) |
| (21 | ) | 111 | | (96 | ) |
| 107 | |
| 2 | |
| |||||||||||
Commercial – nonagency | 17 | |
| 5 | |
| 27 | | (38 | ) |
| (5 | ) | 63 | | (42 | ) |
| 27 | |
| 1 | |
| |||||||||||
Total mortgage-backed securities | 492 | |
| 10 | |
| 228 | | (228 | ) |
| (81 | ) | 211 | | (175 | ) |
| 457 | |
| (14 | ) |
| |||||||||||
U.S. Treasury and government agencies | - | |
| - | |
| - | | - | |
| - | | 1 | | - | |
| 1 | |
| - | |
| |||||||||||
Obligations of U.S. states and municipalities | 649 | |
| 15 | |
| 126 | | (70 | ) |
| (5 | ) | - | | - | |
| 715 | |
| 15 | |
| |||||||||||
Non-U.S. government debt securities | 46 | |
| 3 | |
| 426 | | (395 | ) |
| - | | 50 | | (50 | ) |
| 80 | |
| - | |
| |||||||||||
Corporate debt securities | 576 | |
| - | |
| 690 | | (473 | ) |
| (398 | ) | 128 | | (162 | ) |
| 361 | |
| 11 | |
| |||||||||||
Loans | 4,837 | |
| 309 | |
| 2,055 | | (2,565 | ) |
| (1,186 | ) | 564 | | (807 | ) |
| 3,207 | |
| 73 | |
| |||||||||||
Asset-backed securities | 302 | |
| 27 | |
| 279 | | (178 | ) |
| (44 | ) | 50 | | (165 | ) |
| 271 | |
| 2 | |
| |||||||||||
Total debt instruments | 6,902 | |
| 364 | |
| 3,804 | | (3,909 | ) |
| (1,714 | ) | 1,004 | | (1,359 | ) |
| 5,092 | |
| 87 | |
| |||||||||||
Equity securities | 231 | |
| 40 | |
| 142 | | (87 | ) |
| - | | 18 | | (56 | ) |
| 288 | |
| 34 | |
| |||||||||||
Other | 761 | |
| 85 | |
| 27 | | (45 | ) |
| (137 | ) | 10 | | (10 | ) |
| 691 | |
| 46 | |
| |||||||||||
Total trading assets – debt and equity instruments | 7,894 | |
| 489 | | (c) | 3,973 | | (4,041 | ) |
| (1,851 | ) | 1,032 | | (1,425 | ) |
| 6,071 | |
| 167 | | (c) | |||||||||||
Net derivative receivables: (a) |
|
|
|
|
|
|
|
|
|
|
|
|
|
|
| ||||||||||||||||||||
Interest rate | 1,263 | |
| 182 | |
| 53 | | (76 | ) |
| (833 | ) | 55 | | 20 | |
| 664 | |
| (184 | ) |
| |||||||||||
Credit | 98 | |
| (126 | ) |
| 1 | | (4 | ) |
| (64 | ) | 57 | | 2 | |
| (36 | ) |
| (57 | ) |
| |||||||||||
Foreign exchange | (1,384 | ) |
| 86 | |
| 13 | | (6 | ) |
| 633 | | (16 | ) | 135 | |
| (539 | ) |
| (12 | ) |
| |||||||||||
Equity | (2,252 | ) |
| 24 | |
| 840 | | (312 | ) |
| (660 | ) | (182 | ) | 167 | |
| (2,375 | ) |
| 76 | |
| |||||||||||
Commodity | (85 | ) |
| (34 | ) |
| - | | - | |
| 22 | | 2 | | (5 | ) |
| (100 | ) |
| 27 | |
| |||||||||||
Total net derivative receivables | (2,360 | ) |
| 132 | | (c) | 907 | | (398 | ) |
| (902 | ) | (84 | ) | 319 | |
| (2,386 | ) |
| (150 | ) | (c) | |||||||||||
Available-for-sale securities: |
|
|
|
|
|
|
|
|
|
|
|
|
|
|
| ||||||||||||||||||||
Asset-backed securities | 663 | |
| 14 | |
| - | | (50 | ) |
| (141 | ) | - | | - | |
| 486 | |
| 12 | |
| |||||||||||
Other | 1 | |
| - | |
| - | | - | |
| - | | - | | - | |
| 1 | |
| - | |
| |||||||||||
Total available-for-sale securities | 664 | |
| 14 | | (d) | - | | (50 | ) |
| (141 | ) | - | | - | |
| 487 | |
| 12 | | (d) | |||||||||||
Loans | 570 | |
| 32 | | (c) | - | | (26 | ) |
| (299 | ) | - | | - | |
| 277 | |
| 8 | | (c) | |||||||||||
Mortgage servicing rights | 6,096 | |
| (223 | ) | (e) | 624 | | (140 | ) |
| (619 | ) | - | | - | |
| 5,738 | |
| (224 | ) | (e) | |||||||||||
Other assets | 2,223 | |
| 248 | | (c) | 35 | | (157 | ) |
| (478 | ) | - | | - | |
| 1,871 | |
| 126 | | (c) | |||||||||||
| Fair value measurements using significant unobservable inputs |
|
| ||||||||||||||||||||||||||||||||
Nine months ended | Fair | Total realized/unrealized (gains)/losses |
|
|
|
| Transfers into | Transfers (out of) level 3 (h) | Fair value at | Change in unrealized (gains)/losses related | |||||||||||||||||||||||||
Purchases | Sales | Issuances | Settlements (g) | ||||||||||||||||||||||||||||||||
Liabilities: (b) |
|
|
|
|
|
|
|
|
|
|
|
|
|
|
| ||||||||||||||||||||
Deposits | $ | 2,117 | |
| $ | 39 | | (c) | $ | - | | $ | - | | $ | 2,510 | | $ | (169 | ) | $ | - | | $ | (659 | ) |
| $ | 3,838 | |
| $ | 140 | | (c) |
Federal funds purchased and securities loaned or sold under repurchase agreements | - | |
| - | |
| - | | - | | - | | - | | 1 | | - | |
| 1 | |
| - | |
| ||||||||||
Other borrowed funds | 1,134 | |
| 80 | | (c) | - | | - | | 2,208 | | (1,873 | ) | 53 | | (131 | ) |
| 1,471 | |
| 50 | | (c) | ||||||||||
Trading liabilities – debt and equity instruments | 43 | |
| 1 | | (c) | (31 | ) | 32 | | - | | 1 | | 3 | | (6 | ) |
| 43 | |
| 1 | | (c) | ||||||||||
Accounts payable and other liabilities | 13 | |
| - | |
| (1 | ) | - | | - | | (3 | ) | - | | - | |
| 9 | |
| - | |
| ||||||||||
Beneficial interests issued by consolidated VIEs | 48 | |
| 3 | | (c) | (44 | ) | 39 | | - | | (6 | ) | 78 | | - | |
| 118 | |
| - | | | ||||||||||
Long-term debt | 13,894 | |
| 1,030 | | (c) | - | | - | | 10,757 | | (8,637 | ) | 269 | | (662 | ) |
| 16,651 | |
| 1,108 | | (c) | ||||||||||
96
| Fair value measurements using significant unobservable inputs |
|
| |||||||||||||||||||||||||||||||
Nine months ended September 30, 2016 | Fair value at | Total realized/unrealized gains/(losses) |
|
|
|
| Transfers into level 3 (h) | Transfers (out of) level 3 (h) | Fair value at | Change in unrealized gains/(losses) related to financial instruments held at September 30, 2016 | ||||||||||||||||||||||||
Purchases (f) | Sales |
| Settlements (g) | |||||||||||||||||||||||||||||||
Assets: |
|
|
|
|
|
|
|
|
|
|
|
|
|
| ||||||||||||||||||||
Federal funds sold and securities purchased under resale agreements | $ | - | | $ | - | |
| $ | - | | $ | - | |
| $ | - | | $ | 4 | | $ | (4 | ) |
| $ | - | |
| $ | - | |
| ||
Trading assets: |
|
|
|
|
|
|
|
|
|
|
|
|
|
| ||||||||||||||||||||
Debt instruments: |
|
|
|
|
|
|
|
|
|
|
|
|
|
| ||||||||||||||||||||
Mortgage-backed securities: |
|
|
|
|
|
|
|
|
|
|
|
|
|
| ||||||||||||||||||||
U.S. government agencies | 715 | | (78 | ) |
| 133 | | (230 | ) |
| (89 | ) | 96 | | (121 | ) |
| 426 | |
| (78 | ) |
| |||||||||||
Residential – nonagency | 194 | | (4 | ) |
| 220 | | (250 | ) |
| (16 | ) | 54 | | (92 | ) |
| 106 | |
| (3 | ) |
| |||||||||||
Commercial – nonagency | 115 | | (6 | ) |
| 65 | | (29 | ) |
| (1 | ) | 168 | | (271 | ) |
| 41 | |
| 2 | |
| |||||||||||
Total mortgage-backed securities | 1,024 | | (88 | ) |
| 418 | | (509 | ) |
| (106 | ) | 318 | | (484 | ) |
| 573 | |
| (79 | ) |
| |||||||||||
Obligations of U.S. states and municipalities | 651 | | 11 | |
| 104 | | (132 | ) |
| (38 | ) | | | - | |
| 596 | |
| 11 | |
| |||||||||||
Non-U.S. government debt securities | 74 | | 1 | |
| 83 | | (86 | ) |
| (2 | ) | | | (29 | ) |
| 41 | |
| (2 | ) |
| |||||||||||
Corporate debt securities | 736 | | (15 | ) |
| 222 | | (187 | ) |
| (155 | ) | 76 | | (177 | ) |
| 500 | |
| (28 | ) |
| |||||||||||
Loans | 6,604 | | (165 | ) |
| 1,363 | | (2,255 | ) |
| (939 | ) | 922 | | (600 | ) |
| 4,930 | |
| 65 | |
| |||||||||||
Asset-backed securities | 1,832 | | 35 | |
| 565 | | (643 | ) |
| (957 | ) | 270 | | (776 | ) |
| 326 | |
| (7 | ) |
| |||||||||||
Total debt instruments | 10,921 | | (221 | ) |
| 2,755 | | (3,812 | ) |
| (2,197 | ) | 1,586 | | (2,066 | ) |
| 6,966 | |
| (40 | ) |
| |||||||||||
Equity securities | 265 | | 18 | |
| 75 | | (68 | ) |
| (24 | ) | 9 | | (3 | ) |
| 272 | |
| 32 | |
| |||||||||||
Other | 744 | | (1 | ) |
| 629 | | (287 | ) |
| (340 | ) | 26 | | (90 | ) |
| 681 | |
| 73 | |
| |||||||||||
Total trading assets – debt and equity instruments | 11,930 | | (204 | ) | (c) | 3,459 | | (4,167 | ) |
| (2,561 | ) | 1,621 | | (2,159 | ) |
| 7,919 | |
| 65 | | (c) | |||||||||||
Net derivative receivables: (a) |
|
|
|
|
|
|
|
|
|
|
|
|
|
| ||||||||||||||||||||
Interest rate | 876 | | 787 | |
| 142 | | (27 | ) |
| (761 | ) | 4 | | 222 | |
| 1,243 | |
| (167 | ) |
| |||||||||||
Credit | 549 | | (679 | ) |
| 8 | | (2 | ) |
| 165 | | 40 | | 12 | |
| 93 | |
| (662 | ) |
| |||||||||||
Foreign exchange | (725 | ) | (68 | ) |
| 58 | | (123 | ) |
| (709 | ) | (41 | ) | 20 | |
| (1,588 | ) |
| (291 | ) |
| |||||||||||
Equity | (1,514 | ) | (615 | ) |
| 248 | | (571 | ) |
| 231 | | 32 | | (248 | ) |
| (2,437 | ) |
| (599 | ) |
| |||||||||||
Commodity | (935 | ) | 58 | |
| - | | 9 | |
| (30 | ) | 8 | | (4 | ) |
| (894 | ) |
| (7 | ) |
| |||||||||||
Total net derivative receivables | (1,749 | ) | (517 | ) | (c) | 456 | | (714 | ) |
| (1,104 | ) | 43 | | 2 | |
| (3,583 | ) |
| (1,726 | ) | (c) | |||||||||||
Available-for-sale securities: |
|
|
|
|
|
|
|
|
|
|
|
|
|
| ||||||||||||||||||||
Asset-backed securities | 823 | | 17 | |
| - | | - | |
| (18 | ) | - | | (42 | ) |
| 780 | |
| 17 | |
| |||||||||||
Other | 1 | | - | |
| - | | - | |
| - | | - | | - | |
| 1 | |
| - | |
| |||||||||||
Total available-for-sale securities | 824 | | 17 | | (d) | - | | - | |
| (18 | ) | - | | (42 | ) |
| 781 | |
| 17 | | (d) | |||||||||||
Loans | 1,518 | | (7 | ) | (c) | 259 | | - | |
| (613 | ) | - | | (313 | ) |
| 844 | |
| 38 | | (c) | |||||||||||
Mortgage servicing rights | 6,608 | | (1,296 | ) | (e) | 410 | | (72 | ) |
| (713 | ) | - | | - | |
| 4,937 | |
| (1,296 | ) | (e) | |||||||||||
Other assets | 2,401 | | 170 | | (c) | 477 | | (438 | ) |
| (245 | ) | - | | - | |
| 2,365 | |
| 94 | | (c) | |||||||||||
|
|
|
|
|
|
|
|
|
|
|
|
|
|
| ||||||||||||||||||||
| Fair value measurements using significant unobservable inputs |
|
| |||||||||||||||||||||||||||||||
Nine months ended | Fair value at | Total realized/unrealized (gains)/losses |
|
|
|
| Transfers into level 3 (h) | Transfers (out of) level 3 (h) | Fair value at | Change in unrealized (gains)/losses related | ||||||||||||||||||||||||
Purchases | Sales | Issuances | Settlements (g) | |||||||||||||||||||||||||||||||
Liabilities: (b) |
|
|
|
|
|
|
|
|
|
|
|
|
|
| ||||||||||||||||||||
Deposits | $ | 2,950 | | $ | 76 | | (c) | $ | - | | $ | - | | $ | 1,085 | | $ | (868 | ) | $ | - | | $ | (614 | ) |
| $ | 2,629 | |
| $ | (24 | ) | (c) |
Federal funds purchased and securities loaned or sold under repurchase agreements | - | | - | |
| - | | - | | - | | - | | 4 | | (4 | ) |
| - | |
| - | |
| ||||||||||
Other borrowed funds | 639 | | (223 | ) | (c) | - | | | | 1,356 | | (789 | ) | 113 | | (45 | ) |
| 1,051 | |
| (113 | ) | (c) | ||||||||||
Trading liabilities – debt and equity instruments | 63 | | (11 | ) | (c) | (8 | ) | 23 | | - | | (21 | ) | 14 | | (5 | ) |
| 55 | |
| - | |
| ||||||||||
Accounts payable and other liabilities | 19 | | - | |
| - | | - | | - | | (5 | ) | - | | - | |
| 14 | |
| - | |
| ||||||||||
Beneficial interests issued by consolidated VIEs | 549 | | (33 | ) | (c) | - | | - | | 143 | | (611 | ) | - | | - | |
| 48 | |
| - | |
| ||||||||||
Long-term debt | 11,613 | | 716 | | (c) | - | | - | | 6,752 | | (4,327 | ) | 289 | | (1,314 | ) |
| 13,729 | |
| 1,678 | | (c) | ||||||||||
97
(a) | All level 3 derivatives are presented on a net basis, irrespective of the underlying counterparty. |
(b) | Level 3 liabilities as a percentage of total Firm liabilities accounted for at fair value (including liabilities measured at fair value on a nonrecurring basis) were 14% and 12% at September 30, 2017 and December 31, 2016 , respectively. |
(c) | Predominantly reported in principal transactions revenue, except for changes in fair value for CCB mortgage loans and lending-related commitments originated with the intent to sell, and mortgage loan purchase commitments, which are reported in mortgage fees and related income. |
(d) | Realized gains/(losses) on AFS securities, as well as other-than-temporary impairment ( " OTTI " ) losses that are recorded in earnings, are reported in securities gains. Unrealized gains/(losses) are reported in OCI. Realized gains/(losses) and foreign exchange hedge accounting adjustments recorded in income on AFS securities were zero for the three and nine months ended September 30, 2017 and 2016 , respectively. Unrealized gains/(losses) recorded on AFS securities in OCI were $2 million and $18 million for the three months ended September 30, 2017 and 2016, respectively and $14 million and $16 million for the nine months ended September 30, 2017 and 2016 , respectively. |
(e) | Changes in fair value for CCB MSRs are reported in mortgage fees and related income. |
(f) | Loan originations are included in purchases. |
(g) | Includes financial assets and liabilities that have matured, been partially or fully repaid, impacts of modifications, deconsolidation associated with beneficial interests in VIEs and other items. |
(h) | All transfers into and/or out of level 3 are based on changes in the observability of the valuation inputs and are assumed to occur at the beginning of the quarterly reporting period in which they occur. |
Level 3 analysis
Consolidated balance sheets changes
Level 3 assets (including assets measured at fair value on a nonrecurring basis) were 0.8% of total Firm assets at September 30, 2017 . The following describes significant changes to level 3 assets since December 31, 2016, for those items measured at fair value on a recurring basis. For further information on changes impacting items measured at fair value on a nonrecurring basis, see Assets and liabilities measured at fair value on a nonrecurring basis on page 99 .
Three months ended September 30, 2017
Level 3 assets were $19.9 billion at September 30, 2017 , reflecting a decrease of $514 million from June, 2017 with no movements that were individually significant.
Nine months ended September 30, 2017
Level 3 assets at September 30, 2017 decreased by $3.3 billion from December 31, 2016, largely due to the following:
• | $2.1 billion decrease in trading assets driven by $1.6 billion in trading loans due to sales and settlements and $617 million in interest rate derivative receivables due to settlements. |
Gains and losses
The following describes significant components of total realized/unrealized gains/(losses) for instruments measured at fair value on a recurring basis for the periods indicated. For further information on these instruments, see Changes in level 3 recurring fair value measurements rollforward tables on pages 94–98 .
Three months ended September 30, 2017
• | $186 million of net gains on assets and $465 million of net losses on liabilities, none of which were individually significant. |
Three months ended September 30, 2016
• | $198 million of net losses on assets and $243 million of net losses on liabilities, none of which were individually significant. |
Nine months ended September 30, 2017
• | $692 million of net gains on assets and $1.2 billion of net losses on liabilities driven by market movements in long-term debt. |
Nine months ended September 30, 2016
• | $1.8 billion of net losses on assets largely driven by $1.3 billion loss on MSRs. For further details see Note 14. |
• | $525 million of net losses on liabilities, none of which were individually significant. |
Credit and funding adjustments - derivatives
The following table provides the impact of credit and funding adjustments on principal transactions revenue in the respective periods, excluding the effect of any associated hedging activities. The DVA and FVA reported below include the impact of the Firm's own credit quality on the inception value of liabilities as well as the impact of changes in the Firm's own credit quality over time.
| Three months ended September 30, |
| Nine months ended September 30, | ||||||||||||
(in millions) | 2017 | |
| 2016 | |
| 2017 | |
| 2016 | | ||||
Credit and funding adjustments: |
|
|
|
|
|
|
| ||||||||
Derivatives CVA | $ | 245 | |
| $ | 97 | |
| $ | 715 | |
| $ | (659 | ) |
Derivatives DVA and FVA | (222 | ) |
| (154 | ) |
| (289 | ) |
| (277 | ) | ||||
For further information about both credit and funding adjustments, as well as information about valuation adjustments on fair value option elected liabilities, see Note 3 of JPMorgan Chase's 2016 Annual Report.
98
Assets and liabilities measured at fair value on a nonrecurring basis
| Fair value hierarchy |
| Total fair value | |||||||||||
September 30, 2017 (in millions) | Level 1 | | Level 2 | |
| Level 3 | |
| ||||||
Loans | $ | - | | $ | 338 | | | $ | 542 | | (a) | $ | 880 | |
Other assets | - | | 7 | |
| 245 | |
| 252 | | ||||
Total assets measured at fair value on a nonrecurring basis | - | | 345 | |
| 787 | | (a) | 1,132 | | ||||
Accounts payable and other liabilities | - | | 1 | |
| 1 | |
| 2 | | ||||
Total liabilities measured at fair value on a nonrecurring basis | $ | - | | $ | 1 | |
| $ | 1 | |
| $ | 2 | |
| Fair value hierarchy |
| Total fair value | |||||||||||
September 30, 2016 (in millions) | Level 1 | | Level 2 | |
| Level 3 | |
| ||||||
Loans | $ | - | | $ | 272 | |
| $ | 470 | |
| $ | 742 | |
Other assets | - | | 9 | |
| 314 | |
| 323 | | ||||
Total assets measured at fair value on a nonrecurring basis | - | | 281 | |
| 784 | |
| 1,065 | | ||||
Accounts payable and other liabilities | - | | 2 | |
| 7 | |
| 9 | | ||||
Total liabilities measured at fair value on a nonrecurring basis | $ | - | | $ | 2 | |
| $ | 7 | |
| $ | 9 | |
(a) | Of the $787 million in level 3 assets measured at fair value on a nonrecurring basis as of September 30, 2017, $395 million related to residential real estate loans carried at the net realizable value of the underlying collateral (e.g., collateral-dependent loans and other loans charged off in accordance with regulatory guidance). These amounts are classified as level 3 as they are valued using a broker's price opinion and discounted based upon the Firm's experience with actual liquidation values. These discounts to the broker price opinions ranged from 20% to 48% with a weighted average of 29% . |
Nonrecurring fair value changes
The following table presents the total change in value of assets and liabilities for which a fair value adjustment has been recognized for the three and nine months ended September 30, 2017 and 2016, related to financial instruments held at those dates.
| Three months ended September 30, |
| Nine months ended September 30, | ||||||||||||
| 2017 | |
| 2016 | |
| 2017 | |
| 2016 | | ||||
Loans | $ | (52 | ) |
| $ | (61 | ) |
| $ | (157 | ) | | $ | (150 | ) |
Other Assets | (11 | ) |
| 33 | |
| (44 | ) |
| (29 | ) | ||||
Accounts payable and other liabilities | - | |
| - | |
| (1 | ) |
| (2 | ) | ||||
Total nonrecurring fair value gains/(losses) | $ | (63 | ) |
| $ | (28 | ) |
| $ | (202 | ) |
| $ | (181 | ) |
For further information about the measurement of impaired collateral-dependent loans, and other loans where the carrying value is based on the fair value of the underlying collateral (e.g., residential mortgage loans charged off in accordance with regulatory guidance), see Note 14 of JPMorgan Chase's 2016 Annual Report.
99
Additional disclosures about the fair value of financial instruments that are not carried on the Consolidated balance sheets at fair value
The following table presents by fair value hierarchy classification the carrying values and estimated fair values at September 30, 2017 , and December 31, 2016 , of financial assets and liabilities, excluding financial instruments that are carried at fair value on a recurring basis, and their classification within the fair value hierarchy. For additional information regarding the financial instruments within the scope of this disclosure, and the methods and significant assumptions used to estimate their fair value, see Note 3 of JPMorgan Chase's 2016 Annual Report.
| September 30, 2017 |
| December 31, 2016 | ||||||||||||||||||||||||||||
|
| Estimated fair value hierarchy |
|
|
| Estimated fair value hierarchy |
| ||||||||||||||||||||||||
(in billions) | Carrying value | Level 1 | Level 2 | Level 3 | Total estimated fair value |
| Carrying value | Level 1 | Level 2 | Level 3 | Total estimated fair value | ||||||||||||||||||||
Financial assets |
|
|
|
|
|
|
|
|
|
|
| ||||||||||||||||||||
Cash and due from banks | $ | 22.0 | | $ | 22.0 | | $ | - | | $ | - | | $ | 22.0 | |
| $ | 23.9 | | $ | 23.9 | | $ | - | | $ | - | | $ | 23.9 | |
Deposits with banks | 435.8 | | 434.0 | | 1.8 | | - | | 435.8 | |
| 365.8 | | 362.0 | | 3.8 | | - | | 365.8 | | ||||||||||
Accrued interest and accounts receivable | 60.5 | | - | | 60.4 | | 0.1 | | 60.5 | |
| 52.3 | | - | | 52.2 | | 0.1 | | 52.3 | | ||||||||||
Federal funds sold and securities purchased under resale agreements | 168.9 | | - | | 168.9 | | - | | 168.9 | |
| 208.5 | | - | | 208.3 | | 0.2 | | 208.5 | | ||||||||||
Securities borrowed | 98.6 | | - | | 98.6 | | - | | 98.6 | |
| 96.4 | | - | | 96.4 | | - | | 96.4 | | ||||||||||
Securities, held-to-maturity | 47.1 | | - | | 48.2 | | - | | 48.2 | |
| 50.2 | | - | | 50.9 | | - | | 50.9 | | ||||||||||
Loans, net of allowance for loan losses (a) | 898.5 | | - | | 27.2 | | 874.4 | | 901.6 | |
| 878.8 | | - | | 24.1 | | 851.0 | | 875.1 | | ||||||||||
Other | 62.9 | | - | | 52.7 | | 15.7 | | 68.4 | |
| 71.4 | | 0.1 | | 60.8 | | 14.3 | | 75.2 | | ||||||||||
Financial liabilities |
|
|
|
|
|
|
|
|
|
|
| ||||||||||||||||||||
Deposits | $ | 1,417.9 | | $ | - | | $ | 1,417.9 | | $ | - | | $ | 1,417.9 | |
| $ | 1,361.3 | | $ | - | | $ | 1,361.3 | | $ | - | | $ | 1,361.3 | |
Federal funds purchased and securities loaned or sold under repurchase agreements | 168.7 | | - | | 168.7 | | - | | 168.7 | |
| 165.0 | | - | | 165.0 | | - | | 165.0 | | ||||||||||
Commercial paper | 24.2 | | - | | 24.2 | | - | | 24.2 | |
| 11.7 | | - | | 11.7 | | - | | 11.7 | | ||||||||||
Other borrowed funds | 21.0 | | - | | 21.0 | | - | | 21.0 | |
| 13.6 | | - | | 13.6 | | - | | 13.6 | | ||||||||||
Accounts payable and other liabilities | 155.8 | | - | | 152.8 | | 2.7 | | 155.5 | |
| 148.0 | | - | | 144.8 | | 3.4 | | 148.2 | | ||||||||||
Beneficial interests issued by consolidated VIEs | 28.3 | | - | | 28.3 | | - | | 28.3 | |
| 38.9 | | - | | 38.9 | | - | | 38.9 | | ||||||||||
Long-term debt and junior subordinated deferrable interest debentures | 244.4 | | - | | 247.9 | | 2.6 | | 250.5 | |
| 257.5 | | - | | 260.0 | | 2.0 | | 262.0 | | ||||||||||
(a) | Fair value is typically estimated using a discounted cash flow model that incorporates the characteristics of the underlying loans (including principal, contractual interest rate and contractual fees) and other key inputs, including expected lifetime credit losses, interest rates, prepayment rates, and primary origination or secondary market spreads. For certain loans, the fair value is measured based on the value of the underlying collateral. The difference between the estimated fair value and carrying value of a financial asset or liability is the result of the different methodologies used to determine fair value as compared with carrying value. For example, credit losses are estimated for a financial asset's remaining life in a fair value calculation but are estimated for a loss emergence period in the allowance for loan loss calculation; future loan income (interest and fees) is incorporated in a fair value calculation but is generally not considered in the allowance for loan losses. For a further discussion of the Firm's methodologies for estimating the fair value of loans and lending-related commitments, see Valuation hierarchy on pages 150–153 of JPMorgan Chase's 2016 Annual Report. |
The majority of the Firm's lending-related commitments are not carried at fair value on a recurring basis on the Consolidated balance sheets, nor are they actively traded. The carrying value of the wholesale allowance for lending-related commitments and the estimated fair value of these wholesale lending-related commitments were as follows for the periods indicated.
| September 30, 2017 |
| December 31, 2016 | ||||||||||||||||||||||||||||
|
| Estimated fair value hierarchy |
|
|
| Estimated fair value hierarchy |
| ||||||||||||||||||||||||
(in billions) | Carrying value (a) | Level 1 | Level 2 | Level 3 | Total estimated fair value |
| Carrying value (a) | Level 1 | Level 2 | Level 3 | Total estimated fair value | ||||||||||||||||||||
Wholesale lending-related commitments | $ | 1.1 | | $ | - | | $ | - | | $ | 1.6 | | $ | 1.6 | |
| $ | 1.1 | | $ | - | | $ | - | | $ | 2.1 | | $ | 2.1 | |
(a) | Excludes the current carrying values of the guarantee liability and the offsetting asset, each of which is recognized at fair value at the inception of the guarantees. |
The Firm does not estimate the fair value of consumer lending-related commitments. In many cases, the Firm can reduce or cancel these commitments by providing the borrower notice or, in some cases as permitted by law, without notice. For a further discussion of the valuation of lending-related commitments, see page 151 of JPMorgan Chase's 2016 Annual Report.
100
Note
3
– Fair value option
For a discussion of the primary financial instruments for which the fair value option was elected, including the basis for those elections and the determination of instrument-specific credit risk, where relevant, see Note 4 of JPMorgan Chase's 2016 Annual Report.
Changes in fair value under the fair value option election
The following tables present the changes in fair value included in the Consolidated statements of income for the three and nine months ended September 30, 2017 and 2016 , for items for which the fair value option was elected. The profit and loss information presented below only includes the financial instruments that were elected to be measured at fair value; related risk management instruments, which are required to be measured at fair value, are not included in the table.
| Three months ended September 30, | |||||||||||||||||||||||
| 2017 |
| 2016 | |||||||||||||||||||||
(in millions) | Principal transactions | | All other income | Total changes in fair |
| Principal transactions |
| All other income | Total changes in fair value recorded | |||||||||||||||
Federal funds sold and securities purchased under resale agreements | $ | (17 | ) | | $ | - | | | $ | (17 | ) | |
| $ | (54 | ) |
| $ | - | |
| $ | (54 | ) |
Securities borrowed | (10 | ) | | - | | | (10 | ) | |
| - | |
| - | |
| - | | ||||||
Trading assets: | | | | | | | | | |
|
|
|
|
|
| |||||||||
Debt and equity instruments, excluding loans | 412 | | | - | | (c) | 412 | | |
| 256 | |
| - | | (c) | 256 | | ||||||
Loans reported as trading assets: | | | | | | | | | |
|
|
|
|
|
| |||||||||
Changes in instrument-specific credit risk | 139 | | | (2 | ) | (c) | 137 | | |
| 286 | |
| 10 | | (c) | 296 | | ||||||
Other changes in fair value | 111 | | | 249 | | (c) | 360 | | |
| 2 | |
| 452 | | (c) | 454 | | ||||||
Loans: | | | | | | | | | |
|
|
|
|
|
| |||||||||
Changes in instrument-specific credit risk | - | | | - | | | - | | |
| - | |
| - | |
| - | | ||||||
Other changes in fair value | 3 | | | - | | | 3 | | |
| 1 | |
| - | |
| 1 | | ||||||
Other assets | 3 | | | (4 | ) | (d) | (1 | ) | |
| 2 | |
| (3 | ) | (d) | (1 | ) | ||||||
Deposits (a) | (117 | ) | | - | | | (117 | ) | |
| 38 | |
| - | |
| 38 | | ||||||
Federal funds purchased and securities loaned or sold under repurchase agreements | 2 | | | - | | | 2 | | |
| 4 | |
| - | |
| 4 | | ||||||
Other borrowed funds (a) | (54 | ) | | - | | | (54 | ) | |
| (291 | ) |
| - | |
| (291 | ) | ||||||
Trading liabilities | (3 | ) | | - | | | (3 | ) | |
| 3 | |
| - | |
| 3 | | ||||||
Beneficial interests issued by consolidated VIEs | - | | | - | | | - | | |
| - | |
| - | |
| - | | ||||||
Long-term debt (a)(b) | (793 | ) | | - | | | (793 | ) | |
| (619 | ) |
| - | |
| (619 | ) | ||||||
101
| Nine months ended September 30, | |||||||||||||||||||||||
| 2017 |
|
| 2016 | ||||||||||||||||||||
(in millions) | Principal transactions |
| All other income | Total changes in fair value recorded |
| Principal transactions |
| All other income | Total changes in fair value recorded | |||||||||||||||
Federal funds sold and securities purchased under resale agreements | $ | (50 | ) |
| $ | - | |
| $ | (50 | ) |
|
| $ | 14 | |
| $ | - | |
| $ | 14 | |
Securities borrowed | 80 | |
| - | |
| 80 | |
|
| 1 | |
| - | |
| 1 | | ||||||
Trading assets: |
|
|
|
| | |
|
|
|
|
|
| | | ||||||||||
Debt and equity instruments, excluding loans | 1,107 | |
| 2 | | (c) | 1,109 | |
|
| 143 | |
| - | |
| 143 | | ||||||
Loans reported as trading assets: |
|
|
|
| | |
|
|
|
|
|
| | | ||||||||||
Changes in instrument-specific credit risk | 382 | |
| 13 | | (c) | 395 | |
|
| 384 | |
| 24 | | (c) | 408 | | ||||||
Other changes in fair value | 188 | |
| 601 | | (c) | 789 | |
|
| 188 | |
| 975 | | (c) | 1,163 | | ||||||
Loans: |
|
|
|
| | |
|
|
|
|
|
| | | ||||||||||
Changes in instrument-specific credit risk | (1 | ) |
| - | |
| (1 | ) |
|
| 13 | |
| - | |
| 13 | | ||||||
Other changes in fair value | 4 | |
| 3 | |
| 7 | |
|
| 5 | |
| - | |
| 5 | | ||||||
Other assets | 10 | |
| (26 | ) | (d) | (16 | ) |
|
| 16 | |
| 79 | | (d) | 95 | | ||||||
Deposits (a) | (362 | ) |
| - | |
| (362 | ) |
|
| (531 | ) |
| - | |
| (531 | ) | ||||||
Federal funds purchased and securities loaned or sold under repurchase agreements | 4 | |
| - | |
| 4 | |
|
| (16 | ) |
| - | |
| (16 | ) | ||||||
Other borrowed funds (a) | (485 | ) |
| - | |
| (485 | ) |
|
| (292 | ) |
| - | |
| (292 | ) | ||||||
Trading liabilities | (4 | ) |
| - | |
| (4 | ) |
|
| 5 | |
| - | |
| 5 | | ||||||
Beneficial interests issued by consolidated VIEs | - | |
| - | |
| - | |
|
| 23 | |
| - | |
| 23 | | ||||||
Long-term debt (a)(b) | (1,716 | ) |
| - | |
| (1,716 | ) |
|
| (1,537 | ) |
| - | |
| (1,537 | ) | ||||||
(a) | Unrealized gains/(losses) due to instrument-specific credit risk (DVA) for liabilities for which the fair value option has been elected is recorded in OCI, while realized gains/(losses) are recorded in principal transactions revenue. Realized gains/(losses) due to instrument-specific credit risk recorded in principal transaction revenue were not material for the three and nine months ended September 30, 2017 and 2016 , respectively. |
(b) | Long-term debt measured at fair value predominantly relates to structured notes. Although the risk associated with the structured notes is actively managed, the gains/(losses) reported in this table do not include the income statement impact of the risk management instruments used to manage such risk. |
(c) | Reported in mortgage fees and related income. |
(d) | Reported in other income. |
102
Difference between aggregate fair value and aggregate remaining contractual principal balance outstanding
The following table reflects the difference between the aggregate fair value and the aggregate remaining contractual principal balance outstanding as of September 30, 2017 , and December 31, 2016 , for loans, long-term debt and long-term beneficial interests for which the fair value option has been elected.
| September 30, 2017 |
| December 31, 2016 | ||||||||||||||||||
(in millions) | Contractual principal outstanding | | Fair value | Fair value over/(under) contractual principal outstanding |
| Contractual principal outstanding |
| Fair value | Fair value over/(under) contractual principal outstanding | ||||||||||||
Loans (a) | | | | | | | |
|
|
|
|
| |||||||||
Nonaccrual loans | | | | | | | |
|
|
|
|
| |||||||||
Loans reported as trading assets | $ | 3,938 | | | $ | 1,266 | | $ | (2,672 | ) |
| $ | 3,338 | |
| $ | 748 | | $ | (2,590 | ) |
Loans | 39 | | | - | | (39 | ) |
| - | |
| - | | - | | ||||||
Subtotal | 3,977 | | | 1,266 | | (2,711 | ) |
| 3,338 | |
| 748 | | (2,590 | ) | ||||||
All other performing loans | | | | | | | |
|
|
|
|
| |||||||||
Loans reported as trading assets | 38,050 | | | 36,263 | | (1,787 | ) |
| 35,477 | |
| 33,054 | | (2,423 | ) | ||||||
Loans | 1,760 | | | 1,745 | | (15 | ) |
| 2,259 | |
| 2,228 | | (31 | ) | ||||||
Total loans | $ | 43,787 | | | $ | 39,274 | | $ | (4,513 | ) |
| $ | 41,074 | |
| $ | 36,030 | | $ | (5,044 | ) |
Long-term debt | | | | | | | |
|
|
|
|
| |||||||||
Principal-protected debt | $ | 24,307 | | (c) | $ | 21,828 | | $ | (2,479 | ) |
| $ | 21,602 | | (c) | $ | 19,195 | | $ | (2,407 | ) |
Nonprincipal-protected debt (b) | NA | | | 22,342 | | NA | |
| NA | |
| 18,491 | | NA | | ||||||
Total long-term debt | NA | | | $ | 44,170 | | NA | |
| NA | |
| $ | 37,686 | | NA | | ||||
Long-term beneficial interests | | | | | | | |
|
|
|
|
| |||||||||
Nonprincipal-protected debt | NA | | | $ | 118 | | NA | |
| NA | |
| $ | 120 | | NA | | ||||
Total long-term beneficial interests | NA | | | $ | 118 | | NA | |
| NA | |
| $ | 120 | | NA | | ||||
(a) | There were no performing loans that were ninety days or more past due as of September 30, 2017 , and December 31, 2016 , respectively. |
(b) | Remaining contractual principal is not applicable to nonprincipal-protected notes. Unlike principal-protected structured notes, for which the Firm is obligated to return a stated amount of principal at the maturity of the note, nonprincipal-protected structured notes do not obligate the Firm to return a stated amount of principal at maturity, but to return an amount based on the performance of an underlying variable or derivative feature embedded in the note. However, investors are exposed to the credit risk of the Firm as issuer for both nonprincipal-protected and principal protected notes. |
(c) | Where the Firm issues principal-protected zero-coupon or discount notes, the balance reflects the contractual principal payment at maturity or, if applicable, the contractual principal payment at the Firm's next call date. |
At September 30, 2017 , and December 31, 2016 , the contractual amount of lending-related commitments for which the fair value option was elected was $4.5 billion and $4.6 billion , with a corresponding fair value of $(90) million and $(118) million , respectively. For further information regarding off-balance sheet lending-related financial instruments, see Note 29 of JPMorgan Chase's 2016 Annual Report, and Note 19 of this Form 10-Q.
Structured note products by balance sheet classification and risk component
The following table presents the fair value of the structured notes issued by the Firm, by balance sheet classification and the primary risk type.
| September 30, 2017 | | December 31, 2016 | ||||||||||||||||||||||
(in millions) | Long-term debt | Other borrowed funds | Deposits | Total | | Long-term debt | Other borrowed funds | Deposits | Total | ||||||||||||||||
Risk exposure | | | | | | | | | | | | | | | | | | ||||||||
Interest rate | $ | 19,903 | | $ | 87 | | $ | 7,755 | | $ | 27,745 | | | $ | 16,296 | | $ | 184 | | $ | 4,296 | | $ | 20,776 | |
Credit | 3,794 | | 61 | | - | | 3,855 | | | 3,267 | | 225 | | - | | 3,492 | | ||||||||
Foreign exchange | 2,841 | | 208 | | 30 | | 3,079 | | | 2,365 | | 135 | | 6 | | 2,506 | | ||||||||
Equity | 17,094 | | 7,302 | | 6,196 | | 30,592 | | | 14,831 | | 8,234 | | 5,481 | | 28,546 | | ||||||||
Commodity | 297 | | 22 | | 4,841 | | 5,160 | | | 488 | | 37 | | 1,811 | | 2,336 | | ||||||||
Total structured notes | $ | 43,929 | | $ | 7,680 | | $ | 18,822 | | $ | 70,431 | | | $ | 37,247 | | $ | 8,815 | | $ | 11,594 | | $ | 57,656 | |
103
Note
4
– Derivative instruments
JPMorgan Chase makes markets in derivatives for clients and also uses derivatives to hedge or manage its own risk exposures. For a further discussion of the Firm's use of and accounting policies regarding derivative instruments, see Note 6 of JPMorgan Chase's 2016 Annual Report .
The Firm's disclosures are based on the accounting treatment and purpose of these derivatives. A limited number of the Firm's derivatives are designated in hedge
accounting relationships and are disclosed according to the type of hedge (fair value hedge, cash flow hedge, or net investment hedge). Derivatives not designated in hedge accounting relationships include certain derivatives that are used to manage certain risks associated with specified assets or liabilities ("specified risk management" positions) as well as derivatives used in the Firm's market-making businesses or for other purposes.
The following table outlines the Firm's primary uses of derivatives and the related hedge accounting designation or disclosure category.
Type of Derivative | Use of Derivative | Designation and disclosure | Affected segment or unit | 10-Q page reference |
Manage specifically identified risk exposures in qualifying hedge accounting relationships: |
|
|
| |
◦ Interest rate | Hedge fixed rate assets and liabilities | Fair value hedge | Corporate | 110 |
◦ Interest rate | Hedge floating-rate assets and liabilities | Cash flow hedge | Corporate | 111 |
◦ Foreign exchange | Hedge foreign currency-denominated assets and liabilities | Fair value hedge | Corporate | 110 |
◦ Foreign exchange | Hedge foreign currency-denominated forecasted revenue and expense | Cash flow hedge | Corporate | 111 |
◦ Foreign exchange | Hedge the value of the Firm's investments in non-U.S. dollar functional currency entities | Net investment hedge | Corporate | 112 |
◦ Commodity | Hedge commodity inventory | Fair value hedge | CIB | 110 |
Manage specifically identified risk exposures not designated in qualifying hedge accounting relationships: |
|
|
| |
◦ Interest rate | Manage the risk of the mortgage pipeline, warehouse loans and MSRs | Specified risk management | CCB | 112 |
◦ Credit | Manage the credit risk of wholesale lending exposures | Specified risk management | CIB | 112 |
◦ Commodity | Manage the risk of certain commodities-related contracts and investments | Specified risk management | CIB | 112 |
◦ Interest rate and foreign exchange | Manage the risk of certain other specified assets and liabilities | Specified risk management | Corporate | 112 |
Market-making derivatives and other activities: |
|
|
| |
◦ Various | Market-making and related risk management | Market-making and other | CIB | 112 |
◦ Various | Other derivatives | Market-making and other | CIB, Corporate | 112 |
104
Notional amount of derivative contracts
The following table summarizes the notional amount of derivative contracts outstanding as of September 30, 2017 , and December 31, 2016 .
| Notional amounts (b) | |||||
(in billions) | September 30, 2017 | | December 31, 2016 | | ||
Interest rate contracts |
|
| ||||
Swaps | $ | 22,098 | | $ | 22,000 | |
Futures and forwards | 5,954 | | 5,289 | | ||
Written options | 3,973 | | 3,091 | | ||
Purchased options | 4,184 | | 3,482 | | ||
Total interest rate contracts | 36,209 | | 33,862 | | ||
Credit derivatives (a) | 1,851 | | 2,032 | | ||
Foreign exchange contracts |
|
| ||||
Cross-currency swaps | 4,037 | | 3,359 | | ||
Spot, futures and forwards | 6,763 | | 5,341 | | ||
Written options | 883 | | 734 | | ||
Purchased options | 874 | | 721 | | ||
Total foreign exchange contracts | 12,557 | | 10,155 | | ||
Equity contracts |
|
| ||||
Swaps | 307 | | 258 | | ||
Futures and forwards | 92 | | 59 | | ||
Written options | 587 | | 417 | | ||
Purchased options | 499 | | 345 | | ||
Total equity contracts | 1,485 | | 1,079 | | ||
Commodity contracts |
|
| ||||
Swaps | 118 | | 102 | | ||
Spot, futures and forwards | 170 | | 130 | | ||
Written options | 98 | | 83 | | ||
Purchased options | 103 | | 94 | | ||
Total commodity contracts | 489 | | 409 | | ||
Total derivative notional amounts | $ | 52,591 | | $ | 47,537 | |
(a) | For more information on volumes and types of credit derivative contracts, see the Credit derivatives discussion on page 113 . |
(b) | Represents the sum of gross long and gross short third-party notional derivative contracts. |
While the notional amounts disclosed above give an indication of the volume of the Firm's derivatives activity, the notional amounts significantly exceed, in the Firm's view, the possible losses that could arise from such transactions. For most derivative transactions, the notional amount is not exchanged; it is used simply as a reference to calculate payments.
105
Impact of derivatives on the Consolidated balance sheets
The following table summarizes information on derivative receivables and payables (before and after netting adjustments) that are reflected on the Firm's Consolidated balance sheets as of September 30, 2017 , and December 31, 2016 , by accounting designation (e.g., whether the derivatives were designated in qualifying hedge accounting relationships or not) and contract type.
Free-standing derivative receivables and payables (a) |
|
|
|
|
|
|
|
|
| ||||||||||||||||||||
| Gross derivative receivables |
|
|
| Gross derivative payables |
|
| ||||||||||||||||||||||
September 30, 2017 | Not designated as hedges |
| Designated as hedges | Total derivative receivables |
| Net derivative receivables (b) |
| Not designated as hedges |
| Designated as hedges | Total derivative payables |
| Net derivative payables (b) | ||||||||||||||||
Trading assets and liabilities |
|
|
|
|
|
|
|
|
|
|
|
|
| ||||||||||||||||
Interest rate | $ | 471,949 | |
| $ | 3,822 | | $ | 475,771 | |
| $ | 25,701 | |
| $ | 438,686 | |
| $ | 1,634 | | $ | 440,320 | |
| $ | 7,165 | |
Credit | 25,695 | |
| - | | 25,695 | |
| 915 | |
| 26,169 | |
| - | | 26,169 | |
| 1,670 | | ||||||||
Foreign exchange | 167,943 | |
| 661 | | 168,604 | |
| 17,077 | |
| 162,698 | |
| 1,121 | | 163,819 | |
| 13,024 | | ||||||||
Equity | 41,068 | |
| - | | 41,068 | |
| 8,831 | |
| 45,262 | |
| - | | 45,262 | |
| 9,876 | | ||||||||
Commodity | 17,846 | |
| 55 | | 17,901 | |
| 5,736 | |
| 20,473 | |
| 150 | | 20,623 | |
| 7,711 | | ||||||||
Total fair value of trading assets and liabilities | $ | 724,501 | |
| $ | 4,538 | | $ | 729,039 | |
| $ | 58,260 | |
| $ | 693,288 | |
| $ | 2,905 | | $ | 696,193 | |
| $ | 39,446 | |
|
|
|
|
|
|
|
|
|
|
|
|
|
| ||||||||||||||||
| Gross derivative receivables |
|
|
| Gross derivative payables |
|
| ||||||||||||||||||||||
December 31, 2016 | Not designated as hedges |
| Designated as hedges | Total derivative receivables |
| Net derivative receivables (b) |
| Not designated as hedges |
| Designated | Total derivative payables |
| Net derivative payables (b) | ||||||||||||||||
Trading assets and liabilities |
|
|
|
|
|
|
|
|
|
|
|
|
| ||||||||||||||||
Interest rate | $ | 601,557 | |
| $ | 4,406 | | $ | 605,963 | |
| $ | 28,302 | |
| $ | 567,894 | |
| $ | 2,884 | | $ | 570,778 | |
| $ | 10,815 | |
Credit | 29,645 | |
| - | | 29,645 | |
| 1,294 | |
| 28,666 | |
| - | | 28,666 | |
| 1,411 | | ||||||||
Foreign exchange | 232,137 | |
| 1,289 | | 233,426 | |
| 23,271 | |
| 233,823 | |
| 1,148 | | 234,971 | |
| 20,508 | | ||||||||
Equity | 34,940 | |
| - | | 34,940 | |
| 4,939 | |
| 38,362 | |
| - | | 38,362 | |
| 8,140 | | ||||||||
Commodity | 18,505 | |
| 137 | | 18,642 | |
| 6,272 | |
| 20,283 | |
| 179 | | 20,462 | |
| 8,357 | | ||||||||
Total fair value of trading assets and liabilities | $ | 916,784 | |
| $ | 5,832 | | $ | 922,616 | |
| $ | 64,078 | |
| $ | 889,028 | |
| $ | 4,211 | | $ | 893,239 | |
| $ | 49,231 | |
(a) | Balances exclude structured notes for which the fair value option has been elected. See Note 3 for further information. |
(b) | As permitted under U.S. GAAP, the Firm has elected to net derivative receivables and derivative payables and the related cash collateral receivables and payables when a legally enforceable master netting agreement exists. |
106
Derivatives netting
The following tables present, as of September 30, 2017 , and December 31, 2016 , gross and net derivative receivables and payables by contract and settlement type. Derivative receivables and payables, as well as the related cash collateral from the same counterparty have been netted on the Consolidated balance sheets where the Firm has obtained an appropriate legal opinion with respect to the master netting agreement. Where such a legal opinion has not been either sought or obtained, amounts are not eligible for netting on the Consolidated balance sheets, and those derivative receivables and payables are shown separately in the tables below.
In addition to the cash collateral received and transferred that is presented on a net basis with derivative receivables and payables, the Firm receives and transfers additional collateral (financial instruments and cash). These amounts mitigate counterparty credit risk associated with the Firm's derivative instruments, but are not eligible for net presentation:
• | collateral that consists of non-cash financial instruments (generally U.S. government and agency securities and other G7 government securities) and cash collateral held at third party custodians, which are shown separately as "Collateral not nettable on the Consolidated balance sheets" in the tables below, up to the fair value exposure amount. |
• | the amount of collateral held or transferred that exceeds the fair value exposure at the individual counterparty level, as of the date presented, which is excluded from the tables below; and |
• | collateral held or transferred that relates to derivative receivables or payables where an appropriate legal opinion has not been either sought or obtained with respect to the master netting agreement, which is excluded from the tables below. |
| September 30, 2017 |
| December 31, 2016 | ||||||||||||||||||||
(in millions) | Gross derivative receivables | Amounts netted on the Consolidated balance sheets | Net derivative receivables |
| Gross derivative receivables |
| Amounts netted on the Consolidated balance sheets | Net derivative receivables | |||||||||||||||
U.S. GAAP nettable derivative receivables |
|
|
|
|
|
|
|
|
|
| |||||||||||||
Interest rate contracts: |
|
|
|
|
|
|
|
|
|
| |||||||||||||
Over-the-counter ("OTC") | $ | 309,845 | | $ | (289,072 | ) |
| $ | 20,773 | |
| $ | 365,227 | |
| $ | (342,173 | ) |
| $ | 23,054 | | |
OTC–cleared | 160,949 | | (160,926 | ) |
| 23 | |
| 235,399 | |
| (235,261 | ) |
| 138 | | |||||||
Exchange-traded (a) | 172 | | (71 | ) |
| 101 | |
| 241 | |
| (227 | ) |
| 14 | | |||||||
Total interest rate contracts | 470,966 | | (450,069 | ) |
| 20,897 | |
| 600,867 | |
| (577,661 | ) |
| 23,206 | | |||||||
Credit contracts: |
|
|
|
|
|
|
|
|
|
| |||||||||||||
OTC | 16,852 | | (16,621 | ) |
| 231 | |
| 23,130 | |
| (22,612 | ) |
| 518 | | |||||||
OTC–cleared | 8,209 | | (8,160 | ) |
| 49 | |
| 5,746 | |
| (5,739 | ) |
| 7 | | |||||||
Total credit contracts | 25,061 | | (24,781 | ) |
| 280 | |
| 28,876 | |
| (28,351 | ) |
| 525 | | |||||||
Foreign exchange contracts: |
|
|
|
|
|
|
|
|
|
| |||||||||||||
OTC | 163,138 | | (150,110 | ) |
| 13,028 | |
| 226,271 | |
| (208,962 | ) |
| 17,309 | | |||||||
OTC–cleared | 1,506 | | (1,404 | ) |
| 102 | |
| 1,238 | |
| (1,165 | ) |
| 73 | | |||||||
Exchange-traded (a) | 133 | | (12 | ) |
| 121 | |
| 104 | |
| (27 | ) |
| 77 | | |||||||
Total foreign exchange contracts | 164,777 | | (151,526 | ) |
| 13,251 | |
| 227,613 | |
| (210,154 | ) |
| 17,459 | | |||||||
Equity contracts: |
|
|
|
|
|
|
|
|
|
| |||||||||||||
OTC | 21,917 | | (19,963 | ) |
| 1,954 | |
| 20,868 | |
| (20,570 | ) |
| 298 | | |||||||
OTC–cleared | - | | - | |
| - | |
| - | |
| - | |
| - | | |||||||
Exchange-traded (a) | 14,657 | | (12,275 | ) |
| 2,382 | |
| 11,439 | |
| (9,431 | ) |
| 2,008 | | |||||||
Total equity contracts | 36,574 | | (32,238 | ) |
| 4,336 | |
| 32,307 | |
| (30,001 | ) |
| 2,306 | | |||||||
Commodity contracts: |
|
|
|
|
|
|
|
|
|
| |||||||||||||
OTC | 8,884 | | (4,479 | ) |
| 4,405 | |
| 11,571 | |
| (5,605 | ) |
| 5,966 | | |||||||
OTC–cleared | - | | - | |
| - | |
| - | |
| - | |
| - | | |||||||
Exchange-traded (a) | 7,957 | | (7,686 | ) |
| 271 | |
| 6,794 | |
| (6,766 | ) |
| 28 | | |||||||
Total commodity contracts | 16,841 | | (12,165 | ) |
| 4,676 | |
| 18,365 | |
| (12,371 | ) |
| 5,994 | | |||||||
Derivative receivables with appropriate legal opinion | 714,219 | | (670,779 | ) | (b) | 43,440 | |
| 908,028 | |
| (858,538 | ) | (b) | 49,490 | | |||||||
Derivative receivables where an appropriate legal opinion has not been either sought or obtained | 14,820 | |
|
| 14,820 | |
| 14,588 | |
|
|
| 14,588 | | |||||||||
Total derivative receivables recognized on the Consolidated balance sheets | $ | 729,039 | |
|
| $ | 58,260 | |
| $ | 922,616 | |
|
|
| $ | 64,078 | | |||||
Collateral not nettable on the Consolidated balance sheets (c)(d) |
|
|
| (15,391 | ) |
|
|
|
|
| (18,638 | ) | |||||||||||
Net amounts |
|
|
| $ | 42,869 | |
|
|
|
|
| $ | 45,440 | | |||||||||
107
| September 30, 2017 |
| December 31, 2016 | ||||||||||||||||||||
(in millions) | Gross derivative payables | Amounts netted on the Consolidated balance sheets | Net derivative payables |
| Gross derivative payables |
| Amounts netted on the Consolidated balance sheets | Net derivative payables | |||||||||||||||
U.S. GAAP nettable derivative payables |
|
|
|
|
|
|
|
|
|
| |||||||||||||
Interest rate contracts: |
|
|
|
|
|
|
|
|
|
| |||||||||||||
OTC | $ | 279,319 | | $ | (274,060 | ) |
| $ | 5,259 | |
| $ | 338,502 | |
| $ | (329,325 | ) |
| $ | 9,177 | | |
OTC–cleared | 159,146 | | (159,026 | ) |
| 120 | |
| 230,464 | |
| (230,463 | ) |
| 1 | | |||||||
Exchange-traded (a) | 103 | | (69 | ) |
| 34 | |
| 196 | |
| (175 | ) |
| 21 | | |||||||
Total interest rate contracts | 438,568 | | (433,155 | ) |
| 5,413 | |
| 569,162 | |
| (559,963 | ) |
| 9,199 | | |||||||
Credit contracts: |
|
|
|
|
|
|
|
|
|
| |||||||||||||
OTC | 17,338 | | (16,530 | ) |
| 808 | |
| 22,366 | |
| (21,614 | ) |
| 752 | | |||||||
OTC–cleared | 7,991 | | (7,969 | ) |
| 22 | |
| 5,641 | |
| (5,641 | ) |
| - | | |||||||
Total credit contracts | 25,329 | | (24,499 | ) |
| 830 | |
| 28,007 | |
| (27,255 | ) |
| 752 | | |||||||
Foreign exchange contracts: |
|
|
|
|
|
|
|
|
|
| |||||||||||||
OTC | 159,282 | | (149,643 | ) |
| 9,639 | |
| 228,300 | |
| (213,296 | ) |
| 15,004 | | |||||||
OTC–cleared | 1,141 | | (1,140 | ) |
| 1 | |
| 1,158 | |
| (1,158 | ) |
| - | | |||||||
Exchange-traded (a) | 118 | | (11 | ) |
| 107 | |
| 328 | |
| (9 | ) |
| 319 | | |||||||
Total foreign exchange contracts | 160,541 | | (150,794 | ) |
| 9,747 | |
| 229,786 | |
| (214,463 | ) |
| 15,323 | | |||||||
Equity contracts: |
|
|
|
|
|
|
|
|
|
| |||||||||||||
OTC | 27,679 | | (23,112 | ) |
| 4,567 | |
| 24,688 | |
| (20,808 | ) |
| 3,880 | | |||||||
OTC–cleared | - | | - | |
| - | |
| - | |
| - | |
| - | | |||||||
Exchange-traded (a) | 12,704 | | (12,275 | ) |
| 429 | |
| 10,004 | |
| (9,414 | ) |
| 590 | | |||||||
Total equity contracts | 40,383 | | (35,387 | ) |
| 4,996 | |
| 34,692 | |
| (30,222 | ) |
| 4,470 | | |||||||
Commodity contracts: |
|
|
|
|
|
|
|
|
|
| |||||||||||||
OTC | 12,110 | | (5,224 | ) |
| 6,886 | |
| 12,885 | |
| (5,252 | ) |
| 7,633 | | |||||||
OTC–cleared | - | | - | |
| - | |
| - | |
| - | |
| - | | |||||||
Exchange-traded (a) | 7,800 | | (7,688 | ) |
| 112 | |
| 7,099 | |
| (6,853 | ) |
| 246 | | |||||||
Total commodity contracts | 19,910 | | (12,912 | ) |
| 6,998 | |
| 19,984 | |
| (12,105 | ) |
| 7,879 | | |||||||
Derivative payables with appropriate legal opinions | 684,731 | | (656,747 | ) | (b) | 27,984 | |
| 881,631 | |
| (844,008 | ) | (b) | 37,623 | | |||||||
Derivative payables where an appropriate legal opinion has not been either sought or obtained | 11,462 | |
|
| 11,462 | |
| 11,608 | |
|
|
| 11,608 | | |||||||||
Total derivative payables recognized on the Consolidated balance sheets | $ | 696,193 | |
|
| $ | 39,446 | |
| $ | 893,239 | |
|
|
| $ | 49,231 | | |||||
Collateral not nettable on the Consolidated balance sheets (c)(d)(e) |
|
|
| (5,137 | ) |
|
|
|
|
| (8,925 | ) | |||||||||||
Net amounts |
|
|
| $ | 34,309 | |
|
|
|
|
| $ | 40,306 | | |||||||||
(a) | Exchange-traded derivative balances that relate to futures contracts are settled daily. |
(b) | Net derivatives receivable included cash collateral netted of $57.6 billion and $71.9 billion at September 30, 2017 , and December 31, 2016 , respectively. Net derivatives payable included cash collateral netted of $43.5 billion and $57.3 billion related to OTC and OTC-cleared derivatives at September 30, 2017 , and December 31, 2016 , respectively. |
(c) | Excludes all collateral related to derivative instruments where an appropriate legal opinion has not been either sought or obtained. |
(d) | Represents liquid security collateral as well as cash collateral held at third party custodians related to derivative instruments where an appropriate legal opinion has been obtained. For some counterparties, the collateral amounts of financial instruments may exceed the derivative receivables and derivative payables balances. Where this is the case, the total amount reported is limited to the net derivative receivables and net derivative payables balances with that counterparty. |
(e) | Derivative payables collateral relates only to OTC and OTC-cleared derivative instruments. Amounts exclude collateral transferred related to exchange-traded derivative instruments. |
108
Liquidity risk and credit-related contingent features
For a more detailed discussion of liquidity risk and credit-related contingent features related to the Firm's derivative contracts, see Note 6 of JPMorgan Chase's 2016 Annual Report.
The following table shows the aggregate fair value of net derivative payables related to OTC and OTC-cleared derivatives that contain contingent collateral or termination features that may be triggered upon a ratings downgrade, and the associated collateral the Firm has posted in the normal course of business, at September 30, 2017 , and December 31, 2016 .
OTC and OTC-cleared derivative payables containing downgrade triggers | ||||||
(in millions) | September 30, 2017 | | December 31, 2016 | | ||
Aggregate fair value of net derivative payables | $ | 12,228 | | $ | 21,550 | |
Collateral posted | 10,117 | | 19,383 | | ||
The following table shows the impact of a single-notch and two-notch downgrade of the long-term issuer ratings of JPMorgan Chase & Co. and its subsidiaries , predominantly JPMorgan Chase Bank, National Association ("JPMorgan Chase Bank, N.A."),
at September 30, 2017 , and December 31, 2016 , related to OTC and OTC-cleared derivative contracts with contingent collateral or termination features that may be triggered upon a ratings downgrade. Derivatives contracts generally require additional collateral to be posted or terminations to be triggered when the predefined threshold rating is breached. A downgrade by a single rating agency that does not result in a rating lower than a preexisting corresponding rating provided by another major rating agency will generally not result in additional collateral, (except in certain instances in which additional initial margin may be required upon a ratings downgrade), nor in termination payments requirements. The liquidity impact in the table is calculated based upon a downgrade below the lowest current rating of the rating agencies referred to in the derivative contract.
Liquidity impact of downgrade triggers on OTC and OTC-cleared derivatives |
|
|
|
| |||||||||
| September 30, 2017 |
| December 31, 2016 | ||||||||||
(in millions) | Single-notch downgrade | Two-notch downgrade |
| Single-notch downgrade | Two-notch downgrade | ||||||||
Amount of additional collateral to be posted upon downgrade (a) | $ | 90 | | $ | 2,041 | |
| $ | 560 | | $ | 2,497 | |
Amount required to settle contracts with termination triggers upon downgrade (b) | 239 | | 547 | |
| 606 | | 1,049 | | ||||
(a) | Includes the additional collateral to be posted for initial margin. |
(b) | Amounts represent fair values of derivative payables, and do not reflect collateral posted. |
Derivatives executed in contemplation of a sale of the underlying financial asset
In certain instances the Firm enters into transactions in which it transfers financial assets but maintains the economic exposure to the transferred assets by entering into a derivative with the same counterparty in contemplation of the initial transfer. The Firm generally accounts for such transfers as collateralized financing transactions as described in Note 10 , but in limited circumstances they may qualify to be accounted for as a sale and a derivative under U.S. GAAP. There were no such transfers accounted for as a sale where the associated derivative was outstanding at September 30, 2017 , and such transfers at December 31, 2016 were not material.
109
Impact of derivatives on the Consolidated statements of income
The following tables provide information related to gains and losses recorded on derivatives based on their hedge accounting designation or purpose.
Fair value hedge gains and losses
The following tables present derivative instruments, by contract type, used in fair value hedge accounting relationships, as well as pre-tax gains/(losses) recorded on such derivatives and the related hedged items for the three and nine months ended September 30, 2017 and 2016 , respectively. The Firm includes gains/(losses) on the hedging derivative and the related hedged item in the same line item in the Consolidated statements of income.
| Gains/(losses) recorded in income |
| Income statement impact due to: | |||||||||||||
Three months ended September 30, 2017 | Derivatives | Hedged items | Total income statement impact |
| Hedge ineffectiveness (e) | Excluded components (f) | ||||||||||
Contract type |
|
|
|
|
|
| ||||||||||
Interest rate (a)(b) | $ | 22 | | $ | 182 | | $ | 204 | |
| $ | (2 | ) | $ | 206 | |
Foreign exchange (c) | (982 | ) | 1,002 | | 20 | |
| - | | 20 | | |||||
Commodity (d) | (457 | ) | 461 | | 4 | |
| 4 | | - | | |||||
Total | $ | (1,417 | ) | $ | 1,645 | | $ | 228 | |
| $ | 2 | | $ | 226 | |
|
|
|
|
|
|
| ||||||||||
| Gains/(losses) recorded in income |
| Income statement impact due to: | |||||||||||||
Three months ended September 30, 2016 | Derivatives | Hedged items | Total income statement impact |
| Hedge ineffectiveness (e) | Excluded components (f) | ||||||||||
Contract type |
|
|
|
|
|
| ||||||||||
Interest rate (a)(b) | $ | (232 | ) | $ | 430 | | $ | 198 | |
| $ | 7 | | $ | 191 | |
Foreign exchange (c) | (143 | ) | 194 | | 51 | |
| - | | 51 | | |||||
Commodity (d) | (203 | ) | 229 | | 26 | |
| 1 | | 25 | | |||||
Total | $ | (578 | ) | $ | 853 | | $ | 275 | |
| $ | 8 | | $ | 267 | |
|
|
|
|
|
|
| ||||||||||
| Gains/(losses) recorded in income |
| Income statement impact due to: | |||||||||||||
Nine months ended September 30, 2017 | Derivatives | Hedged items | Total income statement impact |
| Hedge ineffectiveness (e) | Excluded components (f) | ||||||||||
Contract type |
|
|
|
|
|
| ||||||||||
Interest rate (a)(b) | $ | (131 | ) | $ | 759 | | $ | 628 | |
| $ | (16 | ) | $ | 644 | |
Foreign exchange (c) | (3,254 | ) | 3,235 | | (19 | ) |
| - | | (19 | ) | |||||
Commodity (d) | (823 | ) | 861 | | 38 | |
| 23 | | 15 | | |||||
Total | $ | (4,208 | ) | $ | 4,855 | | $ | 647 | |
| $ | 7 | | $ | 640 | |
|
|
|
|
|
|
| ||||||||||
| Gains/(losses) recorded in income |
| Income statement impact due to: | |||||||||||||
Nine months ended September 30, 2016 | Derivatives | Hedged items | Total income statement impact |
| Hedge ineffectiveness (e) | Excluded components (f) | ||||||||||
Contract type |
|
|
|
|
|
| ||||||||||
Interest rate (a)(b) | $ | 2,049 | | $ | (1,478 | ) | $ | 571 | |
| $ | 36 | | $ | 535 | |
Foreign exchange (c) | 46 | | 104 | | 150 | |
| - | | 150 | | |||||
Commodity (d) | (276 | ) | 307 | | 31 | |
| (11 | ) | 42 | | |||||
Total | $ | 1,819 | | $ | (1,067 | ) | $ | 752 | |
| $ | 25 | | $ | 727 | |
(a) | Primarily consists of hedges of the benchmark (e.g., London Interbank Offered Rate ("LIBOR")) interest rate risk of fixed-rate long-term debt and AFS securities. Gains and losses were recorded in net interest income. |
(b) | Excludes the amortization expense associated with the inception hedge accounting adjustment applied to the hedged item. This expense is recorded in net interest income and substantially offsets the income statement impact of the excluded components. |
(c) | Primarily consists of hedges of the foreign currency risk of long-term debt and AFS securities for changes in spot foreign currency rates. Gains and losses related to the derivatives and the hedged items, due to changes in foreign currency rates, were recorded primarily in principal transactions revenue and net interest income. |
(d) | Consists of overall fair value hedges of physical commodities inventories that are generally carried at the lower of cost or net realizable value (net realizable value approximates fair value). Gains and losses were recorded in principal transactions revenue. |
(e) | Hedge ineffectiveness is the amount by which the gain or loss on the designated derivative instrument does not exactly offset the gain or loss on the hedged item attributable to the hedged risk. |
(f) | The assessment of hedge effectiveness excludes certain components of the changes in fair values of the derivatives and hedged items such as forward points on foreign exchange forward contracts and time values. |
110
Cash flow hedge gains and losses
The following tables present derivative instruments, by contract type, used in cash flow hedge accounting relationships, and the pre-tax gains/(losses) recorded on such derivatives, for the three and nine months ended September 30, 2017 and 2016 , respectively. The Firm includes the gain/(loss) on the hedging derivative and the change in cash flows on the hedged item in the same line item in the Consolidated statements of income .
| Gains/(losses) recorded in income and other comprehensive income/(loss) | |||||||||||||||
Three months ended September 30, 2017 | Derivatives – effective portion reclassified from AOCI to income | Hedge ineffectiveness recorded directly in income (c) | Total income statement impact |
| Derivatives – effective portion recorded in OCI | Total change in OCI for period | ||||||||||
Contract type |
|
|
|
|
|
| ||||||||||
Interest rate (a) | $ | 1 | | $ | - | | $ | 1 | |
| $ | (1 | ) | $ | (2 | ) |
Foreign exchange (b) | (11 | ) | - | | (11 | ) |
| 30 | | 41 | | |||||
Total | $ | (10 | ) | $ | - | | $ | (10 | ) |
| $ | 29 | | $ | 39 | |
|
|
|
|
|
|
| ||||||||||
| Gains/(losses) recorded in income and other comprehensive income/(loss) | |||||||||||||||
Three months ended September 30, 2016 | Derivatives – effective portion reclassified from AOCI to income | Hedge ineffectiveness recorded directly in income (c) | Total income statement impact |
| Derivatives – effective portion recorded in OCI | Total change | ||||||||||
Contract type |
|
|
|
|
|
| ||||||||||
Interest rate (a) | $ | (18 | ) | $ | - | | $ | (18 | ) |
| $ | 22 | | $ | 40 | |
Foreign exchange (b) | (104 | ) | - | | (104 | ) |
| (86 | ) | 18 | | |||||
Total | $ | (122 | ) | $ | - | | $ | (122 | ) |
| $ | (64 | ) | $ | 58 | |
|
|
|
|
|
|
| ||||||||||
| Gains/(losses) recorded in income and other comprehensive income/(loss) | |||||||||||||||
Nine months ended September 30, 2017 | Derivatives – effective portion reclassified from AOCI to income | Hedge ineffectiveness recorded directly in income (c) | Total income statement impact |
| Derivatives – effective portion recorded in OCI | Total change | ||||||||||
Contract type |
|
|
|
|
|
| ||||||||||
Interest rate (a) | $ | (16 | ) | $ | - | | $ | (16 | ) |
| $ | 11 | | $ | 27 | |
Foreign exchange (b) | (144 | ) | - | | (144 | ) |
| 100 | | 244 | | |||||
Total | $ | (160 | ) | $ | - | | $ | (160 | ) |
| $ | 111 | | $ | 271 | |
|
|
|
|
|
|
| ||||||||||
| Gains/(losses) recorded in income and other comprehensive income/(loss) | |||||||||||||||
Nine months ended September 30, 2016 | Derivatives – effective portion reclassified from AOCI to income | Hedge ineffectiveness recorded directly in income (c) | Total income statement impact |
| Derivatives – effective portion recorded in OCI | Total change | ||||||||||
Contract type |
|
|
|
|
|
| ||||||||||
Interest rate (a) | $ | (58 | ) | $ | - | | $ | (58 | ) |
| $ | (78 | ) | $ | (20 | ) |
Foreign exchange (b) | (167 | ) | - | | (167 | ) |
| (340 | ) | (173 | ) | |||||
Total | $ | (225 | ) | $ | - | | $ | (225 | ) |
| $ | (418 | ) | $ | (193 | ) |
(a) | Primarily consists of benchmark interest rate hedges of LIBOR-indexed floating-rate assets and floating-rate liabilities. Gains and losses were recorded in net interest income. |
(b) | Primarily consists of hedges of the foreign currency risk of non-U.S. dollar-denominated revenue and expense. The income statement classification of gains and losses follows the hedged item – primarily noninterest revenue and compensation expense. |
(c) | Hedge ineffectiveness is the amount by which the cumulative gain or loss on the designated derivative instrument exceeds the present value of the cumulative expected change in cash flows on the hedged item attributable to the hedged risk. |
The Firm did not experience any forecasted transactions that failed to occur for the three and nine months ended September 30, 2017 and 2016 .
Over the next 12 months, the Firm expects that approximately $58 million (after-tax) of net gains recorded in AOCI at September 30, 2017 , related to cash flow hedges will be recognized in income. For terminated cash flow hedges, the maximum length of time over which forecasted transactions are remaining is approximately 6 years .
For open cash flow hedges, the maximum length of time over which forecasted transactions are hedged is approximately 2 years . The Firm's longer-dated forecasted transactions relate to core lending and borrowing activities.
111
Net investment hedge gains and losses
The following table presents hedging instruments, by contract type, that were used in net investment hedge accounting relationships, and the pre-tax gains/(losses) recorded on such instruments for the three and nine months ended September 30, 2017 and 2016 .
| Gains/(losses) recorded in income and other comprehensive income/(loss) | ||||||||||||||||
| 2017 |
| 2016 | ||||||||||||||
Three months ended September 30, (in millions) | Excluded components recorded directly in income (a) | Effective portion recorded in OCI |
| Excluded components recorded directly in income (a) | Effective portion recorded in OCI | ||||||||||||
Foreign exchange derivatives |
| $ | (39 | ) |
| $ | (286 | ) |
|
| $ | (69 | ) |
| $ | (30 | ) |
|
|
|
|
|
|
|
|
|
| ||||||||
| Gains/(losses) recorded in income and other comprehensive income/(loss) | ||||||||||||||||
| 2017 |
| 2016 | ||||||||||||||
Nine months ended September 30, (in millions) | Excluded components recorded directly | Effective portion recorded in OCI |
| Excluded components | Effective portion recorded in OCI | ||||||||||||
Foreign exchange derivatives |
| $ | (150 | ) |
| $ | (1,161 | ) |
|
| $ | (219 | ) |
| $ | (603 | ) |
(a) | Certain components of hedging derivatives are permitted to be excluded from the assessment of hedge effectiveness, such as forward points on foreign exchange forward contracts. Amounts related to excluded components are recorded in other income. The Firm measures the ineffectiveness of net investment hedge accounting relationships based on changes in spot foreign currency rates, and, therefore, there was no significant ineffectiveness for net investment hedge accounting relationships during the three and nine months ended September 30, 2017 and 2016 . |
Gains and losses on derivatives used for specified risk management purposes
The following table presents pre-tax gains/(losses) recorded on a limited number of derivatives, not designated in hedge accounting relationships, that are used to manage risks associated with certain specified assets and liabilities, including certain risks arising from the mortgage pipeline, warehouse loans, MSRs, wholesale lending exposures, foreign currency-denominated assets and liabilities, and commodities-related contracts and investments.
| Derivatives gains/(losses) recorded in income | |||||||||||
| Three months ended September 30, | Nine months ended September 30, | ||||||||||
(in millions) | 2017 | 2016 | 2017 | 2016 | ||||||||
Contract type |
|
|
|
| ||||||||
Interest rate (a) | $ | 97 | | $ | 312 | | $ | 318 | | $ | 1,956 | |
Credit (b) | (18 | ) | (84 | ) | (70 | ) | (244 | ) | ||||
Foreign exchange (c) | (18 | ) | (2 | ) | (52 | ) | (2 | ) | ||||
Total | $ | 61 | | $ | 226 | | $ | 196 | | $ | 1,710 | |
(a) | Primarily represents interest rate derivatives used to hedge the interest rate risk inherent in the mortgage pipeline, warehouse loans and MSRs, as well as written commitments to originate warehouse loans. Gains and losses were recorded predominantly in mortgage fees and related income. |
(b) | Relates to credit derivatives used to mitigate credit risk associated with lending exposures in the Firm's wholesale businesses. These derivatives do not include credit derivatives used to mitigate counterparty credit risk arising from derivative receivables, which is included in gains and losses on derivatives related to market-making activities and other derivatives. Gains and losses were recorded in principal transactions revenue. |
(c) | Primarily relates to derivatives used to mitigate foreign exchange risk of specified foreign currency-denominated assets and liabilities. Gains and losses were recorded in principal transactions revenue. |
Gains and losses on derivatives related to market-making activities and other derivatives
The Firm makes markets in derivatives in order to meet the needs of customers and uses derivatives to manage certain risks associated with net open risk positions from its market-making activities, including the counterparty credit risk arising from derivative receivables. All derivatives not included in the hedge accounting or specified risk management categories above are included in this category. Gains and losses on these derivatives are primarily recorded in principal transactions revenue. See Note 5 for information on principal transactions revenue.
112
Credit derivatives
For a more detailed discussion of credit derivatives, see Note 6 of JPMorgan Chase's 2016 Annual Report. The Firm does not use notional amounts of credit derivatives as the primary measure of risk management for such derivatives, because the notional amount does not take into account the probability of the occurrence of a credit event, the recovery value of the reference obligation, or related cash instruments and economic hedges, each of which reduces, in the Firm's view, the risks associated with such derivatives.
Total credit derivatives and credit-related notes
| Maximum payout/Notional amount | |||||||||||||
September 30, 2017 (in millions) | Protection sold | Protection purchased with identical underlyings (b) | Net protection (sold)/purchased (c) |
| Other protection purchased (d) | |||||||||
Credit derivatives |
|
|
|
|
|
| ||||||||
Credit default swaps | $ | (848,527 | ) |
| $ | 853,147 | | $ | 4,620 | |
| $ | 11,164 | |
Other credit derivatives (a) | (61,205 | ) |
| 57,534 | | (3,671 | ) |
| 19,467 | | ||||
Total credit derivatives | (909,732 | ) |
| 910,681 | | 949 | |
| 30,631 | | ||||
Credit-related notes | (53 | ) |
| - | | (53 | ) |
| 6,370 | | ||||
Total | $ | (909,785 | ) |
| $ | 910,681 | | $ | 896 | |
| $ | 37,001 | |
|
|
|
|
|
|
| ||||||||
| Maximum payout/Notional amount | |||||||||||||
December 31, 2016 (in millions) | Protection sold | Protection purchased with identical underlyings (b) | Net protection (sold)/purchased (c) |
| Other protection purchased (d) | |||||||||
Credit derivatives |
|
|
|
|
|
| ||||||||
Credit default swaps | $ | (961,003 | ) |
| $ | 974,252 | | $ | 13,249 | |
| $ | 7,935 | |
Other credit derivatives (a) | (36,829 | ) |
| 31,859 | | (4,970 | ) |
| 19,991 | | ||||
Total credit derivatives | (997,832 | ) |
| 1,006,111 | | 8,279 | |
| 27,926 | | ||||
Credit-related notes | (41 | ) |
| - | | (41 | ) |
| 4,505 | | ||||
Total | $ | (997,873 | ) |
| $ | 1,006,111 | | $ | 8,238 | |
| $ | 32,431 | |
(a) | Other credit derivatives largely consists of credit swap options. |
(b) | Represents the total notional amount of protection purchased where the underlying reference instrument is identical to the reference instrument on protection sold; the notional amount of protection purchased for each individual identical underlying reference instrument may be greater or lower than the notional amount of protection sold. |
(c) | Does not take into account the fair value of the reference obligation at the time of settlement, which would generally reduce the amount the seller of protection pays to the buyer of protection in determining settlement value. |
(d) | Represents protection purchased by the Firm on referenced instruments (single-name, portfolio or index) where the Firm has not sold any protection on the identical reference instrument. |
The following tables summarize the notional amounts by the ratings, maturity profile, and total fair value, of credit derivatives and credit-related notes as of September 30, 2017 , and December 31, 2016 , where JPMorgan Chase is the seller of protection. The maturity profile is based on the remaining contractual maturity of the credit derivative contracts. The ratings profile is based on the rating of the reference entity on which the credit derivative contract is based. The ratings and maturity profile of credit derivatives and credit-related notes where JPMorgan Chase is the purchaser of protection are comparable to the profile reflected below.
Protection sold - credit derivatives and credit-related notes ratings (a) /maturity profile |
|
|
| ||||||||||||||||||||||||
September 30, 2017 | <1 year |
| 1–5 years |
| >5 years |
| Total notional amount |
| Fair value of receivables (b) |
| Fair value of payables (b) |
| Net fair value | ||||||||||||||
Risk rating of reference entity |
|
|
|
|
|
|
|
|
|
|
|
|
| ||||||||||||||
Investment-grade | $ | (222,740 | ) |
| $ | (306,362 | ) |
| $ | (71,992 | ) |
| $ | (601,094 | ) |
| $ | 8,914 | |
| $ | (1,447 | ) |
| $ | 7,467 | |
Noninvestment-grade | (100,298 | ) |
| (170,219 | ) |
| (38,174 | ) |
| (308,691 | ) |
| 8,884 | |
| (5,764 | ) |
| 3,120 | | |||||||
Total | $ | (323,038 | ) |
| $ | (476,581 | ) |
| $ | (110,166 | ) |
| $ | (909,785 | ) |
| $ | 17,798 | |
| $ | (7,211 | ) |
| $ | 10,587 | |
December 31, 2016 | <1 year |
| 1–5 years |
| >5 years |
| Total notional amount |
| Fair value of receivables (b) |
| Fair value of payables (b) |
| Net fair value | ||||||||||||||
Risk rating of reference entity |
|
|
|
|
|
|
|
|
|
|
|
|
| ||||||||||||||
Investment-grade | $ | (273,688 | ) |
| $ | (383,586 | ) |
| $ | (39,281 | ) |
| $ | (696,555 | ) |
| $ | 7,841 | |
| $ | (3,055 | ) |
| $ | 4,786 | |
Noninvestment-grade | (107,955 | ) |
| (170,046 | ) |
| (23,317 | ) |
| (301,318 | ) |
| 8,184 | |
| (8,570 | ) |
| (386 | ) | |||||||
Total | $ | (381,643 | ) |
| $ | (553,632 | ) |
| $ | (62,598 | ) |
| $ | (997,873 | ) |
| $ | 16,025 | |
| $ | (11,625 | ) |
| $ | 4,400 | |
(a) | The ratings scale is primarily based on external credit ratings defined by S&P and Moody's. |
(b) | Amounts are shown on a gross basis, before the benefit of legally enforceable master netting agreements and cash collateral received by the Firm. |
113
Note
5
– Noninterest revenue and noninterest expense
Noninterest revenue
For a discussion of the components of and accounting policies for the Firm's noninterest revenue, see Note 7 of JPMorgan Chase 's 2016 Annual Report .
Investment banking fees
The following table presents the components of investment banking fees.
| Three months ended September 30, | | Nine months ended September 30, | ||||||||||||
(in millions) | 2017 | |
| 2016 | | | 2017 | | 2016 | ||||||
Underwriting | | | | | | | | ||||||||
Equity | $ | 295 | | | $ | 369 | | | $ | 1,052 | | | $ | 854 | |
Debt | 927 | | | 958 | | | 2,802 | | | 2,404 | | ||||
Total underwriting | 1,222 | | | 1,327 | | | 3,854 | | | 3,258 | | ||||
Advisory | 621 | | | 539 | | | 1,616 | | | 1,585 | | ||||
Total investment banking fees | $ | 1,843 | | | $ | 1,866 | | | $ | 5,470 | | | $ | 4,843 | |
Principal transactions
The following table presents all realized and unrealized gains and losses recorded in principal transactions revenue. This table excludes interest income and interest expense on trading assets and liabilities, which are an integral part of the overall performance of the Firm's client-driven market-making activities. See Note 6 for further information on interest income and interest expense. Trading revenue is presented primarily by instrument type. The Firm's client-driven market-making businesses generally utilize a variety of instrument types in connection with their market-making and related risk-management activities; accordingly, the trading revenue presented in the table below is not representative of the total revenue of any individual line of business.
| Three months ended September 30, |
| Nine months ended September 30, | ||||||||||||
(in millions) | 2017 | |
| 2016 | |
| 2017 |
| 2016 | ||||||
Trading revenue by instrument type |
|
|
|
|
|
|
| ||||||||
Interest rate | $ | 649 | |
| $ | 825 | |
| $ | 2,032 | |
| $ | 1,843 | |
Credit | 330 | |
| 549 | |
| 1,288 | |
| 1,652 | | ||||
Foreign exchange | 681 | |
| 818 | |
| 2,363 | |
| 2,101 | | ||||
Equity | 915 | |
| 893 | |
| 3,153 | |
| 2,584 | | ||||
Commodity | 156 | |
| 245 | |
| 461 | |
| 695 | | ||||
Total trading revenue | 2,731 | |
| 3,330 | |
| 9,297 | |
| 8,875 | | ||||
Private equity gains/(losses) | (10 | ) |
| 121 | |
| 143 | |
| 231 | | ||||
Principal transactions | $ | 2,721 | |
| $ | 3,451 | |
| $ | 9,440 | |
| $ | 9,106 | |
Lending- and deposit-related fees
The following table presents the components of lending- and deposit-related fees.
| Three months ended September 30, |
| Nine months ended September 30, | ||||||||||||
(in millions) | 2017 | |
| 2016 | |
| 2017 |
| 2016 | ||||||
Lending-related fees | $ | 280 | |
| $ | 282 | |
| $ | 824 | |
| $ | 829 | |
Deposit-related fees | 1,217 | |
| 1,202 | |
| 3,603 | |
| 3,461 | | ||||
Total lending- and deposit-related fees | $ | 1,497 | |
| $ | 1,484 | |
| $ | 4,427 | |
| $ | 4,290 | |
Asset management, administration and commissions
The following table presents the components of Firmwide asset management, administration and commissions.
| Three months ended September 30, |
| Nine months ended September 30, | ||||||||||||
(in millions) | 2017 | |
| 2016 | |
| 2017 |
| 2016 | ||||||
Asset management fees |
|
|
|
|
|
|
| ||||||||
Investment management fees (a) | $ | 2,410 | |
| $ | 2,203 | |
| $ | 6,955 | |
| $ | 6,541 | |
All other asset management fees (b) | 63 | |
| 90 | |
| 225 | |
| 277 | | ||||
Total asset management fees | 2,473 | |
| 2,293 | |
| 7,180 | |
| 6,818 | | ||||
|
|
|
|
|
|
|
| ||||||||
Total administration fees (c) | 514 | |
| 478 | |
| 1,500 | |
| 1,444 | | ||||
|
|
|
|
|
|
|
| ||||||||
Commission and other fees |
|
|
|
|
|
|
| ||||||||
Brokerage commissions | 546 | |
| 505 | |
| 1,691 | |
| 1,628 | | ||||
All other commissions and fees | 313 | |
| 321 | |
| 976 | |
| 1,012 | | ||||
Total commissions and fees | 859 | |
| 826 | |
| 2,667 | |
| 2,640 | | ||||
Total asset management, administration and commissions | $ | 3,846 | |
| $ | 3,597 | |
| $ | 11,347 | |
| $ | 10,902 | |
(a) | Represents fees earned from managing assets on behalf of the Firm's clients, including investors in Firm-sponsored funds and owners of separately managed investment accounts. |
(b) | Represents fees for services that are ancillary to investment management services, such as commissions earned on the sales or distribution of mutual funds to clients. |
(c) | Predominantly includes fees for custody, securities lending, funds services and securities clearance. |
Other income
Other income on the Firm's Consolidated statements of income included the following:
| Three months ended September 30, |
| Nine months ended September 30, | ||||||||||||
(in millions) | 2017 | |
| 2016 | |
| 2017 | |
| 2016 | | ||||
Operating lease income | $ | 928 | |
| $ | 708 | |
| $ | 2,625 | |
| $ | 1,974 | |
Other income also included a legal benefit of $645 million recorded in Corporate in the second quarter of 2017 related to a settlement with the FDIC receivership for Washington Mutual and with Deutsche Bank as trustee to certain Washington Mutual trusts.
Noninterest expense
Other expense
Other expense on the Firm's Consolidated statements of income included the following:
| Three months ended September 30, |
| Nine months ended September 30, | ||||||||||||
(in millions) | 2017 | |
| 2016 | |
| 2017 | |
| 2016 | | ||||
Legal expense/(benefit) | $ | (107 | ) |
| $ | (71 | ) |
| $ | 172 | |
| $ | (547 | ) |
FDIC-related expense | 353 | |
| 360 | |
| 1,110 | |
| 912 | | ||||
114
Note
6
– Interest income and Interest expense
For a description of JPMorgan Chase's accounting policies regarding interest income and interest expense, see Note 8 of JPMorgan Chase 's 2016 Annual Report .
The following table presents the components of interest income and interest expense.
| Three months ended | | Nine months ended | ||||||||||||
(in millions) | 2017 | | | 2016 | | | 2017 | | | 2016 | | ||||
Interest income | | | | | | | | | | | | ||||
Loans (a) | $ | 10,519 | | | $ | 9,237 | | | $ | 30,265 | | | $ | 27,065 | |
Taxable securities | 1,362 | | | 1,365 | | | 4,202 | | | 4,187 | | ||||
Nontaxable securities (b) | 456 | | | 436 | | | 1,393 | | | 1,321 | | ||||
Total securities | 1,818 | | | 1,801 | | | 5,595 | | | 5,508 | | ||||
Trading assets | 1,947 | | | 1,890 | | | 5,611 | | | 5,448 | | ||||
Federal funds sold and securities purchased under resale agreements | 622 | | | 566 | | | 1,676 | | | 1,696 | | ||||
Securities borrowed (c) | - | | | (91 | ) | | (65 | ) | | (279 | ) | ||||
Deposits with banks | 1,256 | | | 448 | | | 2,986 | | | 1,374 | | ||||
Other assets (d) | 525 | | | 219 | | | 1,311 | | | 623 | | ||||
Total interest income | 16,687 | | | 14,070 | | | 47,379 | | | 41,435 | | ||||
Interest expense | | | | | | | | | | | | ||||
Interest-bearing deposits | 837 | | | 340 | | | 1,949 | | | 981 | | ||||
Federal funds purchased and securities loaned or sold under repurchase agreements | 451 | | | 286 | | | 1,131 | | | 828 | | ||||
Commercial paper | 83 | | | 34 | | | 186 | | | 105 | | ||||
Trading liabilities – debt, short-term and other liabilities (e) | 636 | | | 285 | | | 1,622 | | | 826 | | ||||
Beneficial interests issued by consolidated VIEs | 123 | |
| 135 | |
| 386 | |
| 366 | | ||||
Long-term debt | 1,759 | | | 1,387 | | | 5,035 | | | 3,999 | | ||||
Total interest expense | 3,889 | | | 2,467 | | | 10,309 | | | 7,105 | | ||||
Net interest income | 12,798 | | | 11,603 | | | 37,070 | | | 34,330 | | ||||
Provision for credit losses | 1,452 | | | 1,271 | | | 3,982 | | | 4,497 | | ||||
Net interest income after provision for credit losses | $ | 11,346 | | | $ | 10,332 | | | $ | 33,088 | | | $ | 29,833 | |
(a) | Includes the amortization of purchase price discounts or premiums, as well as net deferred loan fees or costs. |
(b) | Represents securities which are tax-exempt for U.S. federal income tax purposes. |
(c) | Negative interest income is related to client-driven demand for certain securities combined with the impact of low interest rates. This is matched book activity and the negative interest expense on the corresponding securities loaned is recognized in interest expense. |
(d) | Largely margin loans. |
(e) | Includes largely brokerage customer payables, and to a lesser extent, other borrowed funds. |
115
Note
7
– Pension and other postretirement employee benefit plans
For a discussion of JPMorgan Chase 's pension and OPEB plans, see Note 9 of JPMorgan Chase 's 2016 Annual Report.
The following table presents the components of net periodic benefit costs reported in the Consolidated statements of income for the Firm's U.S. and non-U.S. defined benefit pension, defined contribution and OPEB plans.
| Pension plans |
|
|
| ||||||||||||||||
| U.S. |
| Non-U.S. |
| OPEB plans | |||||||||||||||
Three months ended September 30, (in millions) | 2017 | | 2016 | |
| 2017 | | 2016 | |
| 2017 | | 2016 | | ||||||
Components of net periodic benefit cost |
|
|
|
|
|
|
|
| ||||||||||||
Benefits earned during the period | $ | 75 | | $ | 74 | |
| $ | 8 | | $ | 9 | |
| $ | - | | $ | - | |
Interest cost on benefit obligations | 130 | | 133 | |
| 18 | | 21 | |
| 7 | | 7 | | ||||||
Expected return on plan assets | (208 | ) | (223 | ) |
| (34 | ) | (32 | ) |
| (24 | ) | (26 | ) | ||||||
Amortization: |
|
|
|
|
|
|
|
| ||||||||||||
Net (gain)/loss | 55 | | 59 | |
| 8 | | 6 | |
| - | | - | | ||||||
Prior service cost/(credit) | (9 | ) | (9 | ) |
| - | | - | |
| - | | - | | ||||||
Net periodic defined benefit cost | 43 | | 34 | |
| - | | 4 | |
| (17 | ) | (19 | ) | ||||||
Other defined benefit pension plans (a) | 3 | | 3 | |
| 3 | | 3 | |
| NA | | NA | | ||||||
Total defined benefit plans | 46 | | 37 | |
| 3 | | 7 | |
| (17 | ) | (19 | ) | ||||||
Total defined contribution plans | 136 | | 123 | |
| 85 | | 80 | |
| NA | | NA | | ||||||
Total pension and OPEB cost included in compensation expense | $ | 182 | | $ | 160 | |
| $ | 88 | | $ | 87 | |
| $ | (17 | ) | $ | (19 | ) |
|
|
|
|
|
|
|
|
| ||||||||||||
| Pension plans |
|
|
| ||||||||||||||||
| U.S. |
| Non-U.S. |
| OPEB plans | |||||||||||||||
Nine months ended September 30, (in millions) | 2017 | | 2016 | |
| 2017 | | 2016 | |
| 2017 | | 2016 | | ||||||
Components of net periodic benefit cost |
|
|
|
|
|
|
|
| ||||||||||||
Benefits earned during the period | $ | 224 | | $ | 221 | |
| $ | 23 | | $ | 27 | |
| $ | - | | $ | - | |
Interest cost on benefit obligations | 390 | | 399 | |
| 57 | | 71 | |
| 21 | | 22 | | ||||||
Expected return on plan assets | (624 | ) | (668 | ) |
| (101 | ) | (102 | ) |
| (72 | ) | (78 | ) | ||||||
Amortization: |
|
|
|
|
|
|
|
| | |||||||||||
Net (gain)/loss | 165 | | 176 | |
| 22 | | 17 | |
| - | | - | | ||||||
Prior service cost/(credit) | (26 | ) | (26 | ) |
| (1 | ) | (1 | ) |
| - | | - | | ||||||
Settlement (gain)/loss | - | | - | |
| (3 | ) | - | |
| - | | - | | ||||||
Net periodic defined benefit cost | 129 | | 102 | |
| (3 | ) | 12 | |
| (51 | ) | (56 | ) | ||||||
Other defined benefit pension plans (a) | 9 | | 10 | |
| 7 | | 8 | |
| NA | | NA | | ||||||
Total defined benefit plans | 138 | | 112 | |
| 4 | | 20 | |
| (51 | ) | (56 | ) | ||||||
Total defined contribution plans | 363 | | 345 | |
| 254 | | 249 | |
| NA | | NA | | ||||||
Total pension and OPEB cost included in compensation expense | $ | 501 | | $ | 457 | |
| $ | 258 | | $ | 269 | |
| $ | (51 | ) | $ | (56 | ) |
(a) | Includes various defined benefit pension plans which are individually immaterial. |
The following table presents the fair values of plan assets for the U.S. defined benefit pension and OPEB plans and for the material non-U.S. defined benefit pension plans:
(in billions) | September 30, 2017 | |
| December 31, 2016 | | ||
Fair value of plan assets |
|
|
| ||||
U.S. defined benefit pension and OPEB plans | $ | 17.4 | |
| $ | 16.2 | |
Material non-U.S. defined benefit pension plans | 3.8 | |
| 3.4 | | ||
There are no expected contributions to the U.S. defined benefit pension plan for 2017.
116
Note
8
– Employee stock-based incentives
For a discussion of the accounting policies and other information relating to employee stock-based incentives, see Note 10 of JPMorgan Chase 's 2016 Annual Report .
The Firm recognized the following noncash compensation expense related to its various employee stock-based incentive plans in its Consolidated statements of income.
| Three months ended |
| Nine months ended | ||||||||||||
(in millions) | 2017 | |
| 2016 | |
| 2017 | |
| 2016 | | ||||
Cost of prior grants of RSUs, stock appreciation rights ("SARs") and performance share units ("PSUs") that are amortized over their applicable vesting periods | $ | 267 | |
| $ | 257 | |
| $ | 867 | |
| $ | 808 | |
Accrual of estimated costs of stock-based awards to be granted in future periods including those to full-career eligible employees | 224 | |
| 230 | |
| 750 | |
| 752 | | ||||
Total noncash compensation expense related to employee stock-based incentive plans | $ | 491 | |
| $ | 487 | |
| $ | 1,617 | |
| $ | 1,560 | |
In the first quarter of 2017, in connection with its annual incentive grant for the 2016 performance year, the Firm granted 23 million RSUs and 675 thousand PSUs, all with a weighted-average grant date fair value of $84.25 .
117
Note 9 – Securities
Securities are classified as trading, AFS or HTM. Securities classified as trading assets are discussed in Note 2 . Predominantly all of the Firm's AFS and HTM securities are held by Treasury and CIO within the investment securities portfolio in connection with the Firm's asset-liability management objectives. At September 30, 2017 , the investment securities portfolio consisted of debt securities
with an average credit rating of AA+ (based upon external ratings where available, and where not available, based primarily upon internal ratings which correspond to ratings as defined by S&P and Moody's). For additional information regarding the investment securities portfolio, see Note 12 of JPMorgan Chase's 2016 Annual Report.
The amortized costs and estimated fair values of the investment securities portfolio were as follows for the dates indicated.
| September 30, 2017 |
| December 31, 2016 | ||||||||||||||||||||||||
(in millions) | Amortized cost | Gross unrealized gains | Gross unrealized losses | Fair value |
| Amortized cost | Gross unrealized gains | Gross unrealized losses | Fair value | ||||||||||||||||||
Available-for-sale debt securities |
|
|
|
|
|
|
|
|
|
|
| ||||||||||||||||
Mortgage-backed securities: |
|
|
|
|
|
|
|
|
|
|
| ||||||||||||||||
U.S. government agencies (a) | $ | 70,554 | | $ | 1,061 | | $ | 260 | |
| $ | 71,355 | |
| $ | 63,367 | | $ | 1,112 | | $ | 474 | |
| $ | 64,005 | |
Residential: |
|
|
|
|
|
|
|
|
|
|
| ||||||||||||||||
U.S. (b) | 8,771 | | 205 | | 11 | |
| 8,965 | |
| 8,171 | | 100 | | 28 | |
| 8,243 | | ||||||||
Non-U.S. | 3,974 | | 139 | | 2 | |
| 4,111 | |
| 6,049 | | 158 | | 7 | |
| 6,200 | | ||||||||
Commercial | 6,024 | | 102 | | 8 | |
| 6,118 | |
| 9,002 | | 122 | | 20 | |
| 9,104 | | ||||||||
Total mortgage-backed securities | 89,323 | | 1,507 | | 281 | |
| 90,549 | |
| 86,589 | | 1,492 | | 529 | |
| 87,552 | | ||||||||
U.S. Treasury and government agencies (a) | 26,225 | | 180 | | 196 | |
| 26,209 | |
| 44,822 | | 75 | | 796 | |
| 44,101 | | ||||||||
Obligations of U.S. states and municipalities | 30,262 | | 1,894 | | 64 | |
| 32,092 | |
| 30,284 | | 1,492 | | 184 | |
| 31,592 | | ||||||||
Certificates of deposit | 58 | | - | | - | |
| 58 | |
| 106 | | - | | - | |
| 106 | | ||||||||
Non-U.S. government debt securities | 30,738 | | 580 | | 31 | |
| 31,287 | |
| 34,497 | | 836 | | 45 | |
| 35,288 | | ||||||||
Corporate debt securities | 3,660 | | 101 | | 2 | |
| 3,759 | |
| 4,916 | | 64 | | 22 | |
| 4,958 | | ||||||||
Asset-backed securities: |
|
|
|
|
|
|
|
|
|
|
| ||||||||||||||||
Collateralized loan obligations | 22,451 | | 54 | | 2 | |
| 22,503 | |
| 27,352 | | 75 | | 26 | |
| 27,401 | | ||||||||
Other | 9,136 | | 80 | | 16 | |
| 9,200 | |
| 6,950 | | 62 | | 45 | |
| 6,967 | | ||||||||
Total available-for-sale debt securities | 211,853 | | 4,396 | | 592 | |
| 215,657 | |
| 235,516 | | 4,096 | | 1,647 | |
| 237,965 | | ||||||||
Available-for-sale equity securities | 552 | | - | | - | |
| 552 | |
| 914 | | 12 | | - | |
| 926 | | ||||||||
Total available-for-sale securities | 212,405 | | 4,396 | | 592 | |
| 216,209 | |
| 236,430 | | 4,108 | | 1,647 | |
| 238,891 | | ||||||||
Held-to-maturity debt securities |
|
|
|
|
|
|
|
|
|
|
| ||||||||||||||||
Mortgage-backed securities: |
|
|
|
|
|
|
|
|
|
|
| ||||||||||||||||
U.S. government agencies (c) | 26,899 | | 715 | | 24 | |
| 27,590 | |
| 29,910 | | 638 | | 37 | |
| 30,511 | | ||||||||
Commercial | 5,793 | | 2 | | 67 | |
| 5,728 | |
| 5,783 | | - | | 129 | |
| 5,654 | | ||||||||
Total mortgage-backed securities | 32,692 | | 717 | | 91 | |
| 33,318 | |
| 35,693 | | 638 | | 166 | |
| 36,165 | | ||||||||
Obligations of U.S. states and municipalities | 14,387 | | 583 | | 65 | |
| 14,905 | |
| 14,475 | | 374 | | 125 | |
| 14,724 | | ||||||||
Total held-to-maturity debt securities | 47,079 | | 1,300 | | 156 | |
| 48,223 | |
| 50,168 | | 1,012 | | 291 | |
| 50,889 | | ||||||||
Total securities | $ | 259,484 | | $ | 5,696 | | $ | 748 | |
| $ | 264,432 | |
| $ | 286,598 | | $ | 5,120 | | $ | 1,938 | |
| $ | 289,780 | |
(a) | Included total U.S. government-sponsored enterprise obligations with fair values of $51.8 billion and $45.8 billion at September 30, 2017 , and December 31, 2016 , respectively, which were predominantly mortgage-related. |
(b) | Prior period amounts have been revised to conform with current period presentation. |
(c) | Included total U.S. government-sponsored enterprise obligations with amortized cost of $22.9 billion and $25.6 billion at September 30, 2017 , and December 31, 2016 , respectively, which were mortgage-related. |
118
Securities impairment
The following tables present the fair value and gross unrealized losses for investment securities by aging category at September 30, 2017 , and December 31, 2016 .
| Securities with gross unrealized losses | ||||||||||||||||||
| Less than 12 months |
| 12 months or more |
|
| ||||||||||||||
September 30, 2017 (in millions) | Fair value | Gross unrealized losses |
| Fair value | Gross unrealized losses | Total fair value | Total gross unrealized losses | ||||||||||||
Available-for-sale debt securities |
|
|
|
|
|
|
| ||||||||||||
Mortgage-backed securities: |
|
|
|
|
|
|
| ||||||||||||
U.S. government agencies | $ | 21,380 | | $ | 156 | |
| $ | 3,698 | | $ | 104 | | $ | 25,078 | | $ | 260 | |
Residential: |
|
|
|
|
|
|
| ||||||||||||
U.S. | 464 | | 1 | |
| 749 | | 10 | | 1,213 | | 11 | | ||||||
Non-U.S. | 634 | | 1 | |
| 430 | | 1 | | 1,064 | | 2 | | ||||||
Commercial | 1,055 | | 4 | |
| 789 | | 4 | | 1,844 | | 8 | | ||||||
Total mortgage-backed securities | 23,533 | | 162 | |
| 5,666 | | 119 | | 29,199 | | 281 | | ||||||
U.S. Treasury and government agencies | 695 | | 2 | |
| 5,803 | | 194 | | 6,498 | | 196 | | ||||||
Obligations of U.S. states and municipalities | 3,495 | | 32 | |
| 910 | | 32 | | 4,405 | | 64 | | ||||||
Certificates of deposit | - | | - | |
| - | | - | | - | | - | | ||||||
Non-U.S. government debt securities | 4,514 | | 10 | |
| 797 | | 21 | | 5,311 | | 31 | | ||||||
Corporate debt securities | - | | - | |
| 406 | | 2 | | 406 | | 2 | | ||||||
Asset-backed securities: |
|
|
|
|
|
|
| ||||||||||||
Collateralized loan obligations | - | | - | |
| 545 | | 2 | | 545 | | 2 | | ||||||
Other | 3,132 | | 8 | |
| 1,290 | | 8 | | 4,422 | | 16 | | ||||||
Total available-for-sale debt securities | 35,369 | | 214 | |
| 15,417 | | 378 | | 50,786 | | 592 | | ||||||
Available-for-sale equity securities | - | | - | |
| - | | - | | - | | - | | ||||||
Held-to-maturity securities |
|
|
|
|
|
|
| ||||||||||||
Mortgage-backed securities |
|
|
|
|
|
|
| ||||||||||||
U.S. government agencies | 2,706 | | 24 | |
| - | | - | | 2,706 | | 24 | | ||||||
Commercial | 5,253 | | 61 | |
| 274 | | 6 | | 5,527 | | 67 | | ||||||
Total mortgage-backed securities | 7,959 | | 85 | |
| 274 | | 6 | | 8,233 | | 91 | | ||||||
Obligations of U.S. states and municipalities | 1,137 | | 11 | |
| 1,803 | | 54 | | 2,940 | | 65 | | ||||||
Total held-to-maturity securities | 9,096 | | 96 | |
| 2,077 | | 60 | | 11,173 | | 156 | | ||||||
Total securities with gross unrealized losses | $ | 44,465 | | $ | 310 | |
| $ | 17,494 | | $ | 438 | | $ | 61,959 | | $ | 748 | |
119
| Securities with gross unrealized losses | ||||||||||||||||||
| Less than 12 months |
| 12 months or more |
|
| ||||||||||||||
December 31, 2016 (in millions) | Fair value | Gross unrealized losses |
| Fair value | Gross unrealized losses | Total fair value | Total gross unrealized losses | ||||||||||||
Available-for-sale debt securities |
|
|
|
|
|
|
| ||||||||||||
Mortgage-backed securities: |
|
|
|
|
|
|
| ||||||||||||
U.S. government agencies | $ | 29,856 | | $ | 463 | |
| $ | 506 | | $ | 11 | | $ | 30,362 | | $ | 474 | |
Residential: |
|
|
|
|
|
|
| ||||||||||||
U.S. (a) | 1,373 | | 6 | |
| 1,073 | | 22 | | $ | 2,446 | | 28 | | |||||
Non-U.S. | - | | - | |
| 886 | | 7 | | 886 | | 7 | | ||||||
Commercial | 2,328 | | 17 | |
| 1,078 | | 3 | | 3,406 | | 20 | | ||||||
Total mortgage-backed securities | 33,557 | | 486 | |
| 3,543 | | 43 | | 37,100 | | 529 | | ||||||
U.S. Treasury and government agencies | 23,543 | | 796 | |
| - | | - | | 23,543 | | 796 | | ||||||
Obligations of U.S. states and municipalities | 7,215 | | 181 | |
| 55 | | 3 | | 7,270 | | 184 | | ||||||
Certificates of deposit | - | | - | |
| - | | - | | - | | - | | ||||||
Non-U.S. government debt securities | 4,436 | | 36 | |
| 421 | | 9 | | 4,857 | | 45 | | ||||||
Corporate debt securities | 797 | | 2 | |
| 829 | | 20 | | 1,626 | | 22 | | ||||||
Asset-backed securities: |
|
|
|
|
|
|
| ||||||||||||
Collateralized loan obligations | 766 | | 2 | |
| 5,263 | | 24 | | 6,029 | | 26 | | ||||||
Other | 739 | | 6 | |
| 1,992 | | 39 | | 2,731 | | 45 | | ||||||
Total available-for-sale debt securities | 71,053 | | 1,509 | |
| 12,103 | | 138 | | 83,156 | | 1,647 | | ||||||
Available-for-sale equity securities | - | | - | |
| - | | - | | - | | - | | ||||||
Held-to-maturity debt securities |
|
|
|
|
|
|
| ||||||||||||
Mortgage-backed securities |
|
|
|
|
|
|
| ||||||||||||
U.S. government agencies | 3,129 | | 37 | |
| - | | - | | 3,129 | | 37 | | ||||||
Commercial | 5,163 | | 114 | |
| 441 | | 15 | | 5,604 | | 129 | | ||||||
Total mortgage-backed securities | 8,292 | | 151 | |
| 441 | | 15 | | 8,733 | | 166 | | ||||||
Obligations of U.S. states and municipalities | 4,702 | | 125 | |
| - | | - | | 4,702 | | 125 | | ||||||
Total Held-to-maturity securities | 12,994 | | 276 | |
| 441 | | 15 | | 13,435 | | 291 | | ||||||
Total securities with gross unrealized losses | $ | 84,047 | | $ | 1,785 | |
| $ | 12,544 | | $ | 153 | | $ | 96,591 | | $ | 1,938 | |
(a) | Prior period amounts have been revised to conform with current period presentation. |
Gross unrealized losses
The Firm has recognized unrealized losses on securities it intends to sell as OTTI. The Firm does not intend to sell any of the remaining securities with an unrealized loss in AOCI as of September 30, 2017, and it is not likely that the Firm will be required to sell these securities before recovery of their amortized cost basis. Except for the securities for which credit losses have been recognized in income, the Firm believes that the securities with an unrealized loss in AOCI as of September 30, 2017, are not other-than-temporarily impaired. For additional information on other-than-temporary impairment, see Note 12 of the JPMorgan Chase's 2016 Annual Report.
Securities gains and losses
The following table presents realized gains and losses and OTTI losses from AFS securities that were recognized in income.
| Three months ended September 30, |
| Nine months ended September 30, | ||||||||||
(in millions) | 2017 | | 2016 | |
| 2017 | | 2016 | | ||||
Realized gains | $ | 122 | | $ | 95 | |
| $ | 664 | | $ | 284 | |
Realized losses | (123 | ) | (22 | ) |
| (696 | ) | (110 | ) | ||||
OTTI losses (a) | - | | (9 | ) |
| (6 | ) | (38 | ) | ||||
Net securities gains/(losses) | $ | (1 | ) | $ | 64 | |
| $ | (38 | ) | $ | 136 | |
|
|
|
|
|
| ||||||||
OTTI losses |
|
|
|
|
| ||||||||
Credit-related losses recognized in income | $ | - | | $ | - | |
| $ | - | | $ | (1 | ) |
Securities the Firm intends to sell (a) | - | | (9 | ) |
| (6 | ) | (37 | ) | ||||
Total OTTI losses recognized in income | $ | - | | $ | (9 | ) |
| $ | (6 | ) | $ | (38 | ) |
(a) | Excludes realized losses on securities sold of $6 million and $14 million for the nine months ended September 30, 2017 and 2016, respectively, that had been previously reported as an OTTI loss due to the intention to sell the securities. |
Changes in the credit loss component of credit-impaired debt securities
The cumulative credit loss component, including any changes therein, of OTTI losses that have been recognized in income related to AFS debt securities that the Firm does not intend to sell was not material as of and during the three and nine month periods ended September 30, 2017 and 2016 .
120
Contractual maturities and yields
The following table presents the amortized cost and estimated fair value at September 30, 2017 , of JPMorgan Chase 's investment securities portfolio by contractual maturity.
By remaining maturity September 30, 2017 (in millions) | Due in one year or less | Due after one year through five years | Due after five years through 10 years | Due after 10 years (c) |
| Total | ||||||||||
Available-for-sale debt securities |
|
|
|
|
|
| ||||||||||
Mortgage-backed securities (a) |
|
|
|
|
|
| ||||||||||
Amortized cost | 982 | | 1,564 | | 6,160 | | 80,617 | |
| $ | 89,323 | | ||||
Fair value | 984 | | 1,591 | | 6,342 | | 81,632 | |
| $ | 90,549 | | ||||
Average yield (b) | 1.66 | % | 2.12 | % | 3.14 | % | 3.33 | % |
| 3.28 | % | |||||
U.S. Treasury and government agencies | | | | | | | | |
|
| ||||||
Amortized cost | 99 | | - | | 22,004 | | 4,122 | |
| $ | 26,225 | | ||||
Fair value | 100 | | - | | 21,968 | | 4,141 | |
| $ | 26,209 | | ||||
Average yield (b) | 0.93 | % | - | % | 1.52 | % | 1.64 | % |
| 1.54 | % | |||||
Obligations of U.S. states and municipalities | | | | | | | | |
|
| ||||||
Amortized cost | 44 | | 797 | | 1,174 | | 28,247 | |
| $ | 30,262 | | ||||
Fair value | 44 | | 820 | | 1,241 | | 29,987 | |
| $ | 32,092 | | ||||
Average yield (b) | 2.07 | % | 3.70 | % | 6.53 | % | 6.60 | % |
| 6.51 | % | |||||
Certificates of deposit | | | | | | | | |
|
| ||||||
Amortized cost | 58 | | - | | - | | - | |
| $ | 58 | | ||||
Fair value | 58 | | - | | - | | - | |
| $ | 58 | | ||||
Average yield (b) | 0.50 | % | - | % | - | % | - | % |
| 0.50 | % | |||||
Non-U.S. government debt securities | | | | | | | | |
|
| ||||||
Amortized cost | 4,683 | | 14,216 | | 11,785 | | 54 | |
| $ | 30,738 | | ||||
Fair value | 4,689 | | 14,441 | | 12,105 | | 52 | |
| $ | 31,287 | | ||||
Average yield (b) | 2.95 | % | 1.56 | % | 1.10 | % | 0.79 | % |
| 1.59 | % | |||||
Corporate debt securities | | | | | | | | |
|
| ||||||
Amortized cost | 971 | | 1,128 | | 1,415 | | 146 | |
| $ | 3,660 | | ||||
Fair value | 972 | | 1,164 | | 1,470 | | 153 | |
| $ | 3,759 | | ||||
Average yield (b) | 2.02 | % | 3.39 | % | 3.48 | % | 3.19 | % |
| 3.05 | % | |||||
Asset-backed securities | | | | | | | | |
|
| ||||||
Amortized cost | - | | 3,604 | | 17,060 | | 10,923 | |
| $ | 31,587 | | ||||
Fair value | - | | 3,597 | | 17,099 | | 11,007 | |
| $ | 31,703 | | ||||
Average yield (b) | - | % | 2.18 | % | 2.59 | % | 2.31 | % |
| 2.45 | % | |||||
Total available-for-sale debt securities | | | | | | | | |
|
| ||||||
Amortized cost | $ | 6,837 | | $ | 21,309 | | $ | 59,598 | | $ | 124,109 | |
| $ | 211,853 | |
Fair value | $ | 6,847 | | $ | 21,613 | | $ | 60,225 | | $ | 126,972 | |
| $ | 215,657 | |
Average yield (b) | 2.58 | % | 1.88 | % | 2.06 | % | 3.93 | % |
| 3.15 | % | |||||
Available-for-sale equity securities | | | | | | | | |
|
| ||||||
Amortized cost | - | | - | | - | | 552 | |
| 552 | | |||||
Fair value | - | | - | | - | | 552 | |
| 552 | | |||||
Average yield (b) | - | % | - | % | - | % | 0.63 | % |
| 0.63 | % | |||||
Total available-for-sale securities | | | | | | | | |
|
| ||||||
Amortized cost | $ | 6,837 | | $ | 21,309 | | $ | 59,598 | | $ | 124,661 | |
| $ | 212,405 | |
Fair value | $ | 6,847 | | $ | 21,613 | | $ | 60,225 | | $ | 127,524 | |
| $ | 216,209 | |
Average yield (b) | 2.58 | % | 1.88 | % | 2.06 | % | 3.91 | % |
| 3.14 | % | |||||
Held-to-maturity debt securities | | | | | | | | |
|
| ||||||
Mortgage-backed securities (a) | | | | | | | | |
|
| ||||||
Amortized cost | - | | - | | - | | 32,692 | |
| $ | 32,692 | | ||||
Fair value | - | | - | | - | | 33,318 | |
| $ | 33,318 | | ||||
Average yield (b) | - | % | - | % | - | % | 3.28 | % |
| 3.28 | % | |||||
Obligations of U.S. states and municipalities | | | | | | | | |
|
| ||||||
Amortized cost | - | | 56 | | 1,974 | | 12,357 | |
| $ | 14,387 | | ||||
Fair value | - | | 55 | | 2,047 | | 12,803 | |
| $ | 14,905 | | ||||
Average yield (b) | - | % | 6.25 | % | 5.18 | % | 5.68 | % |
| 5.61 | % | |||||
Total held-to-maturity securities | | | | | | | | |
|
| ||||||
Amortized cost | $ | - | | $ | 56 | | $ | 1,974 | | $ | 45,049 | |
| $ | 47,079 | |
Fair value | $ | - | | $ | 55 | | $ | 2,047 | | $ | 46,121 | |
| $ | 48,223 | |
Average yield (b) | - | % | 6.25 | % | 5.18 | % | 3.94 | % |
| 3.99 | % | |||||
(a) | As of September 30, 2017 , mortgage-backed securities issued by Fannie Mae exceeded 10% of JPMorgan Chase 's total stockholders' equity; the amortized cost and fair value of such securities was $59.7 billion and $61.0 billion , respectively. |
121
(b) | Average yield is computed using the effective yield of each security owned at the end of the period, weighted based on the amortized cost of each security. The effective yield considers the contractual coupon, amortization of premiums and accretion of discounts, and the effect of related hedging derivatives. Taxable-equivalent amounts are used where applicable. The effective yield excludes unscheduled principal prepayments; and accordingly, actual maturities of securities may differ from their contractual or expected maturities as certain securities may be prepaid. |
(c) | Includes securities with no stated maturity. Substantially all of the Firm's U.S. residential MBS and collateralized mortgage obligations are due in 10 years or more, based on contractual maturity. The estimated weighted-average life, which reflects anticipated future prepayments, is approximately 6 years for agency residential MBS, 3 years for agency residential collateralized mortgage obligations and 3 years for nonagency residential collateralized mortgage obligations. |
Note 10 – Securities financing activities
For a discussion of accounting policies relating to securities financing activities, see Note 13 of JPMorgan Chase's 2016 Annual Report. For further information regarding securities borrowed and securities lending agreements for which the fair value option has been elected, see Note 3 . For further information regarding assets pledged and collateral received in securities financing agreements, see Note 20 .
The table below summarizes the gross and net amounts of the Firm's securities financing agreements as of September 30, 2017 and December 31, 2016. When the Firm has obtained an appropriate legal opinion with respect to the master netting agreement with a counterparty and where other relevant netting criteria under U.S. GAAP are met, the Firm nets, on the Consolidated balance sheets, the balances outstanding under its securities financing agreements with the same counterparty. In addition, the Firm exchanges securities and/or cash collateral with its counterparties; this collateral also reduces, in the Firm's view, the economic exposure with the counterparty. Such collateral, along with securities financing balances that do not meet all these relevant netting criteria under U.S. GAAP, is presented as "Amounts not nettable on the Consolidated balance sheets," and reduces the "Net amounts" presented below, if the Firm has an appropriate legal opinion with respect to the master netting agreement with the counterparty. Where a legal opinion has not been either sought or obtained, the securities financing balances are presented gross in the "Net amounts" below, and related collateral does not reduce the amounts presented.
| September 30, 2017 | |||||||||||||||
(in millions) | Gross amounts | Amounts netted on the Consolidated balance sheets | Amounts presented on the Consolidated balance sheets (b) | Amounts not nettable on the Consolidated balance sheets (c) | Net amounts (d) | |||||||||||
Assets |
|
|
|
|
|
| ||||||||||
Securities purchased under resale agreements | $ | 454,541 | | $ | (269,164 | ) | $ | 185,377 | | $ | (175,359 | ) |
| $ | 10,018 | |
Securities borrowed | 105,338 | | (3,658 | ) | 101,680 | | (75,372 | ) |
| 26,308 | | |||||
Liabilities |
|
|
|
|
|
| ||||||||||
Securities sold under repurchase agreements | $ | 425,670 | | $ | (269,164 | ) | $ | 156,506 | | $ | (140,740 | ) |
| $ | 15,766 | |
Securities loaned and other (a) | 27,373 | | (3,658 | ) | 23,715 | | (23,414 | ) |
| 301 | | |||||
| December 31, 2016 | |||||||||||||||
(in millions) | Gross amounts | Amounts netted on the Consolidated balance sheets | Amounts presented on the Consolidated balance sheets (b) | Amounts not nettable on the Consolidated balance sheets (c) | Net amounts (d) | |||||||||||
Assets |
|
|
|
|
|
| ||||||||||
Securities purchased under resale agreements | $ | 480,735 | | $ | (250,832 | ) | $ | 229,903 | | $ | (222,413 | ) | | $ | 7,490 | |
Securities borrowed | 96,409 | | - | | 96,409 | | (66,822 | ) |
| 29,587 | | |||||
Liabilities |
|
|
|
|
|
| ||||||||||
Securities sold under repurchase agreements | $ | 402,465 | | $ | (250,832 | ) | $ | 151,633 | | $ | (133,300 | ) | | $ | 18,333 | |
Securities loaned and other (a) | 22,451 | | - | | 22,451 | | (22,177 | ) |
| 274 | | |||||
(a) | Includes securities-for-securities lending transactions of $12.5 billion and $9.1 billion at September 30, 2017 and December 31, 2016 , respectively, accounted for at fair value, where the Firm is acting as lender. These amounts are presented within other liabilities in the Consolidated balance sheets. |
(b) | Includes securities financing agreements accounted for at fair value. At September 30, 2017 and December 31, 2016 , included securities purchased under resale agreements of $16.5 billion and $21.5 billion , respectively and securities sold under agreements to repurchase of $714 million and $687 million , respectively. There were $3.1 billion of securities borrowed at September 30, 2017 and there were no securities borrowed at December 31, 2016 . There were no securities loaned accounted for at fair value in either period. |
(c) | In some cases, collateral exchanged with a counterparty exceeds the net asset or liability balance with that counterparty. In such cases, the amounts reported in this column are limited to the related asset or liability with that counterparty. |
(d) | Includes securities financing agreements that provide collateral rights, but where an appropriate legal opinion with respect to the master netting agreement has not been either sought or obtained. At September 30, 2017 and December 31, 2016 , included $7.2 billion and $4.8 billion , respectively, of securities purchased under resale agreements; $23.8 billion and $27.1 billion , respectively, of securities borrowed; $12.7 billion and $15.9 billion , respectively, of securities sold under agreements to repurchase; and $200 million and $90 million , respectively, of securities loaned and other. |
122
The tables below present as of September 30, 2017 , and December 31, 2016 the types of financial assets pledged in securities financing agreements and the remaining contractual maturity of the securities financing agreements.
| Gross liability balance | ||||||||||||
| September 30, 2017 |
| December 31, 2016 | ||||||||||
(in millions) | Securities sold under repurchase agreements | Securities loaned and other (a) |
| Securities sold under repurchase agreements | Securities loaned and other (a) | ||||||||
Mortgage-backed securities | $ | 7,903 | | $ | - | |
| $ | 10,546 | | $ | - | |
U.S. Treasury and government agencies | 206,803 | | - | |
| 199,030 | | - | | ||||
Obligations of U.S. states and municipalities | 1,282 | | - | |
| 2,491 | | - | | ||||
Non-U.S. government debt | 175,554 | | 3,234 | |
| 149,008 | | 1,279 | | ||||
Corporate debt securities | 16,562 | | 174 | |
| 18,140 | | 108 | | ||||
Asset-backed securities | 3,290 | | - | |
| 7,721 | | - | | ||||
Equity securities | 14,276 | | 23,965 | |
| 15,529 | | 21,064 | | ||||
Total | $ | 425,670 | | $ | 27,373 | |
| $ | 402,465 | | $ | 22,451 | |
| Remaining contractual maturity of the agreements | ||||||||||||||
| Overnight and continuous |
|
| Greater than 90 days |
| ||||||||||
September 30, 2017 (in millions) | Up to 30 days | 30 – 90 days | Total | ||||||||||||
Total securities sold under repurchase agreements | $ | 181,071 | | $ | 141,831 | | $ | 57,732 | | $ | 45,036 | | $ | 425,670 | |
Total securities loaned and other (a) | 20,992 | | 1,107 | | 1,676 | | 3,598 | | 27,373 | | |||||
| Remaining contractual maturity of the agreements | ||||||||||||||
| Overnight and continuous |
|
| Greater than 90 days |
| ||||||||||
December 31, 2016 (in millions) | Up to 30 days | 30 – 90 days | Total | ||||||||||||
Total securities sold under repurchase agreements | $ | 140,318 | | $ | 157,860 | | $ | 55,621 | | $ | 48,666 | | $ | 402,465 | |
Total securities loaned and other (a) | 13,586 | | 1,371 | | 2,877 | | 4,617 | | 22,451 | | |||||
(a) | Includes securities-for-securities lending transactions of $12.5 billion and $9.1 billion at September 30, 2017 and December 31, 2016 , respectively, accounted for at fair value, where the Firm is acting as lender. These amounts are presented within other liabilities on the Consolidated balance sheets. |
Transfers not qualifying for sale accounting
At September 30, 2017 , and December 31, 2016 , the Firm held $4.1 billion and $5.9 billion respectively, of financial assets for which the rights have been transferred to third parties; however, the transfers did not qualify as a sale in accordance with U.S. GAAP. These transfers have been recognized as collateralized financing transactions. The transferred assets are recorded in trading assets and loans, and the corresponding liabilities are recorded predominantly in other borrowed funds on the Consolidated balance sheets.
123
Note 11 – Loans
Loan accounting framework
The accounting for a loan depends on management's strategy for the loan, and on whether the loan was credit-impaired at the date of acquisition. The Firm accounts for loans based on the following categories:
• | Originated or purchased loans held-for-investment (i.e., "retained"), other than PCI loans |
• | Loans held-for-sale |
• | Loans at fair value |
• | PCI loans held-for-investment |
For a detailed discussion of loans, including accounting policies, see Note 14 of JPMorgan Chase 's 2016 Annual Report . See Note 3 of this Form 10-Q for further information on the Firm's elections of fair value accounting under the fair value option. See Note 2 of this Form 10-Q for information on loans carried at fair value and classified as trading assets.
Loan portfolio
Consumer, excluding credit card (a) |
| Credit card |
| Wholesale (f) |
Residential real estate – excluding PCI • Home equity (b) • Residential mortgage (c) Other consumer loans • Auto (d) • Consumer & Business Banking (d)(e) • Student Residential real estate – PCI • Home equity • Prime mortgage • Subprime mortgage • Option ARMs |
| • Credit card loans |
| • Commercial and industrial • Real estate • Financial institutions • Government agencies • Other (g) |
(a) | Includes loans held in CCB, prime mortgage and home equity loans held in AWM and prime mortgage loans held in Corporate . |
(b) | Includes senior and junior lien home equity loans. |
(c) | Predominantly includes prime (including option ARMs) and subprime loans. |
(d) | Includes certain business banking and auto dealer risk-rated loans that apply the wholesale methodology for determining the allowance for loan losses; these loans are managed by CCB, and therefore, for consistency in presentation, are included with the other consumer loan classes. |
(e) | Predominantly includes Business Banking loans. |
(f) | Includes loans held in CIB, CB, AWM and Corporate. Excludes prime mortgage and home equity loans held in AWM and prime mortgage loans held in Corporate. Classes are internally defined and may not align with regulatory definitions. |
(g) | Includes loans to: individuals; SPEs; and private education and civic organizations. For more information on SPEs, see Note 16 of JPMorgan Chase 's 2016 Annual Report . |
The following tables summarize the Firm's loan balances by portfolio segment.
September 30, 2017 | Consumer, excluding credit card |
| Credit card (a) |
| Wholesale |
| Total |
| ||||||||
(in millions) |
| |||||||||||||||
Retained | $ | 369,413 | |
| $ | 141,200 | |
| $ | 398,569 | |
| $ | 909,182 | | (b) |
Held-for-sale | 188 | |
| 113 | |
| 2,532 | |
| 2,833 | |
| ||||
At fair value | - | |
| - | |
| 1,746 | |
| 1,746 | |
| ||||
Total | $ | 369,601 | |
| $ | 141,313 | |
| $ | 402,847 | |
| $ | 913,761 | |
|
|
|
|
|
|
|
|
|
| ||||||||
December 31, 2016 | Consumer, excluding credit card |
| Credit card (a) |
| Wholesale |
| Total |
| ||||||||
(in millions) |
| |||||||||||||||
Retained | $ | 364,406 | |
| $ | 141,711 | |
| $ | 383,790 | |
| $ | 889,907 | | (b) |
Held-for-sale | 238 | |
| 105 | |
| 2,285 | |
| 2,628 | |
| ||||
At fair value | - | |
| - | |
| 2,230 | |
| 2,230 | |
| ||||
Total | $ | 364,644 | |
| $ | 141,816 | |
| $ | 388,305 | |
| $ | 894,765 | |
|
(a) | Includes accrued interest and fees net of an allowance for the uncollectible portion of accrued interest and fee income. |
(b) | Loans (other than PCI loans and loans for which the fair value option has been elected) are presented net of unearned income, unamortized discounts and premiums, and net deferred loan costs. These amounts were not material as of September 30, 2017 , and December 31, 2016 . |
124
The following table provides information about the carrying value of retained loans purchased, sold and reclassified to held-for-sale during the periods indicated. This table excludes loans recorded at fair value. The Firm manages its exposure to credit risk on an ongoing basis. Selling loans is one way that the Firm reduces its credit exposures.
| | 2017 |
| 2016 | ||||||||||||||||||||||||
Three months ended September 30, (in millions) | | Consumer, excluding credit card | | Credit card | Wholesale | Total |
| Consumer, excluding credit card |
| Credit card | Wholesale | Total | ||||||||||||||||
Purchases | | $ | 711 | | (a)(b) | $ | - | | $ | 479 | | $ | 1,190 | |
| $ | 959 | | (a)(b) | $ | - | | $ | 282 | | $ | 1,241 | |
Sales | | 672 | | | - | | 3,342 | | 4,014 | |
| 577 | |
| - | | 2,637 | | 3,214 | | ||||||||
Retained loans reclassified to held-for-sale | | - | |
| - | | 367 | | 367 | |
| 176 | | | - | | 777 | | 953 | | ||||||||
|
|
|
|
|
|
|
|
|
|
|
|
| ||||||||||||||||
|
| 2017 |
| 2016 | ||||||||||||||||||||||||
Nine months ended September 30, (in millions) |
| Consumer, excluding credit card |
| Credit card | Wholesale | Total |
| Consumer, excluding credit card |
| Credit card | Wholesale | Total | ||||||||||||||||
Purchases |
| $ | 2,277 | | (a)(b) | $ | - | | $ | 1,357 | | $ | 3,634 | |
| $ | 3,048 | | (a)(b) | $ | - | | $ | 975 | | $ | 4,023 | |
Sales |
| 2,025 | |
| - | | 8,166 | | 10,191 | |
| 2,242 | |
| - | | 6,383 | | 8,625 | | ||||||||
Retained loans reclassified to held-for-sale |
| 6,340 | | (c) | - | | 961 | | 7,301 | |
| 259 | |
| - | | 1,393 | | 1,652 | | ||||||||
(a) | Purchases predominantly represent the Firm's voluntary repurchase of certain delinquent loans from loan pools as permitted by Government National Mortgage Association ("Ginnie Mae") guidelines. The Firm typically elects to repurchase these delinquent loans as it continues to service them and/or manage the foreclosure process in accordance with applicable requirements of Ginnie Mae, FHA, RHS, and/or VA. |
(b) | Excludes purchases of retained loans sourced through the correspondent origination channel and underwritten in accordance with the Firm's standards. Such purchases were $6.9 billion and $6.7 billion for the three months ended September 30, 2017 and 2016 , respectively, and $18.2 billion and $23.8 billion for the nine months ended September 30, 2017 and 2016 , respectively. |
(c) | Includes the Firm's student loan portfolio, which was transferred to held-for-sale in the first quarter of 2017. For additional information see Note 23. |
The following table provides information about gains and losses on loan sales, including lower of cost or fair value adjustments, by portfolio segment.
| Three months ended |
| Nine months ended September 30, | ||||||||||
(in millions) | 2017 | 2016 |
| 2017 | 2016 | ||||||||
Net gains/(losses) on sales of loans (including lower of cost or fair value adjustments) (a) |
|
|
|
|
| ||||||||
Consumer, excluding credit card (b) | $ | 37 | | $ | 51 | |
| $ | (177 | ) | $ | 168 | |
Credit card | (2 | ) | (2 | ) |
| (4 | ) | (6 | ) | ||||
Wholesale | 11 | | 17 | |
| 33 | | 15 | | ||||
Total net gains on sales of loans (including lower of cost or fair value adjustments) | $ | 46 | | $ | 66 | |
| $ | (148 | ) | $ | 177 | |
(a) | Excludes sales related to loans accounted for at fair value. |
(b) | Includes the Firm's student loan portfolio, which was transferred to held-for-sale in the first quarter of 2017. For additional information see Note 23. |
Consumer, excluding credit card loan portfolio
Consumer loans, excluding credit card loans, consist primarily of residential mortgages, home equity loans and lines of credit, auto loans, consumer and business banking loans, and student loans, with a focus on serving the prime consumer credit market. The portfolio also includes home equity loans secured by junior liens, prime mortgage loans with an interest-only payment period, and certain payment-option loans that may result in negative amortization.
The table below provides information about retained consumer loans, excluding credit card, by class. In the first quarter of 2017, the Firm transferred the student loan portfolio to held-for-sale. For additional information see Note 23.
(in millions) | September 30, | | December 31, | | ||
Residential real estate – excluding PCI |
|
| ||||
Home equity | $ | 34,657 | | $ | 39,063 | |
Residential mortgage (a) | 212,558 | | 192,486 | | ||
Other consumer loans |
|
| ||||
Auto | 65,102 | | 65,814 | | ||
Consumer & Business Banking (a) | 25,275 | | 24,307 | | ||
Student (a) | - | | 7,057 | | ||
Residential real estate – PCI |
|
| ||||
Home equity | 11,321 | | 12,902 | | ||
Prime mortgage | 6,747 | | 7,602 | | ||
Subprime mortgage | 2,691 | | 2,941 | | ||
Option ARMs | 11,062 | | 12,234 | | ||
Total retained loans | $ | 369,413 | | $ | 364,406 | |
(a) | Certain loan portfolios have been reclassified. The prior period amounts have been revised to conform with the current period presentation. |
For further information on consumer credit quality indicators, see Note 14 of JPMorgan Chase 's 2016 Annual Report .
125
Residential real estate – excluding PCI loans
The following table provides information by class for residential real estate – excluding retained PCI loans in the consumer, excluding credit card, portfolio segment.
Residential real estate – excluding PCI loans |
|
|
|
|
|
| ||||||||||||||||
(in millions, except ratios) | Home equity |
|
| Residential mortgage (g) |
|
| Total residential real estate – excluding PCI | |||||||||||||||
Sep 30, | | Dec 31, | |
|
| Sep 30, | | Dec 31, | |
|
| Sep 30, | | Dec 31, | | |||||||
Loan delinquency (a) |
|
|
|
|
|
|
|
|
|
| ||||||||||||
Current | $ | 33,675 | | $ | 37,941 | |
|
| $ | 205,496 | | $ | 184,133 | |
|
| $ | 239,171 | | $ | 222,074 | |
30–149 days past due | 586 | | 646 | |
|
| 3,460 | | 3,828 | |
|
| 4,046 | | 4,474 | | ||||||
150 or more days past due | 396 | | 476 | |
|
| 3,602 | | 4,525 | |
|
| 3,998 | | 5,001 | | ||||||
Total retained loans | $ | 34,657 | | $ | 39,063 | |
|
| $ | 212,558 | | $ | 192,486 | |
|
| $ | 247,215 | | $ | 231,549 | |
% of 30+ days past due to total retained loans (b) | 2.83 | % | 2.87 | % |
|
| 0.61 | % | 0.75 | % |
|
| 0.92 | % | 1.11 | % | ||||||
90 or more days past due and government guaranteed (c) | $ | - | | $ | - | |
|
| $ | 3,877 | | $ | 4,858 | |
|
| $ | 3,877 | | $ | 4,858 | |
Nonaccrual loans | 1,601 | | 1,845 | |
|
| 2,095 | | 2,256 | |
|
| 3,696 | | 4,101 | | ||||||
Current estimated LTV ratios (d)(e) |
|
|
|
|
|
|
|
|
| | | |||||||||||
Greater than 125% and refreshed FICO scores: |
|
|
|
|
|
|
|
|
| | | |||||||||||
Equal to or greater than 660 | $ | 12 | | $ | 70 | |
|
| $ | 12 | | $ | 30 | |
|
| $ | 24 | | $ | 100 | |
Less than 660 | 4 | | 15 | |
|
| 31 | | 48 | |
|
| 35 | | 63 | | ||||||
101% to 125% and refreshed FICO scores: |
|
|
|
|
|
|
|
|
| | | |||||||||||
Equal to or greater than 660 | 360 | | 668 | |
|
| 47 | | 135 | |
|
| 407 | | 803 | | ||||||
Less than 660 | 117 | | 221 | |
|
| 119 | | 177 | |
|
| 236 | | 398 | | ||||||
80% to 100% and refreshed FICO scores: |
|
|
|
|
|
|
|
|
| | | |||||||||||
Equal to or greater than 660 | 1,959 | | 2,961 | |
|
| 4,357 | | 4,026 | |
|
| 6,316 | | 6,987 | | ||||||
Less than 660 | 635 | | 945 | |
|
| 550 | | 718 | |
|
| 1,185 | | 1,663 | | ||||||
Less than 80% and refreshed FICO scores: |
|
|
|
|
|
|
|
|
| | | |||||||||||
Equal to or greater than 660 | 25,756 | | 27,317 | |
|
| 190,749 | | 169,579 | |
|
| 216,505 | | 196,896 | | ||||||
Less than 660 | 3,896 | | 4,380 | |
|
| 6,974 | | 6,759 | |
|
| 10,870 | | 11,139 | | ||||||
No FICO/LTV available | 1,918 | | 2,486 | |
|
| 1,444 | | 1,650 | |
|
| 3,362 | | 4,136 | | ||||||
U.S. government-guaranteed | - | | - | |
|
| 8,275 | | 9,364 | |
|
| 8,275 | | 9,364 | | ||||||
Total retained loans | $ | 34,657 | | $ | 39,063 | |
|
| $ | 212,558 | | $ | 192,486 | |
|
| $ | 247,215 | | $ | 231,549 | |
Geographic region |
|
|
|
|
|
|
|
|
|
| ||||||||||||
California | $ | 6,771 | | $ | 7,644 | |
|
| $ | 67,329 | | $ | 59,802 | |
|
| $ | 74,100 | | $ | 67,446 | |
New York | 7,148 | | 7,978 | |
|
| 27,198 | | 24,916 | |
|
| 34,346 | | 32,894 | | ||||||
Illinois | 2,615 | | 2,947 | |
|
| 14,343 | | 13,126 | |
|
| 16,958 | | 16,073 | | ||||||
Texas | 2,072 | | 2,225 | |
|
| 12,209 | | 10,772 | |
|
| 14,281 | | 12,997 | | ||||||
Florida | 1,899 | | 2,133 | |
|
| 9,407 | | 8,395 | |
|
| 11,306 | | 10,528 | | ||||||
New Jersey | 2,010 | | 2,253 | |
|
| 7,073 | | 6,374 | |
|
| 9,083 | | 8,627 | | ||||||
Colorado | 603 | | 677 | |
|
| 7,168 | | 6,306 | |
|
| 7,771 | | 6,983 | | ||||||
Washington | 1,079 | | 1,229 | |
|
| 6,668 | | 5,451 | |
|
| 7,747 | | 6,680 | | ||||||
Massachusetts | 316 | | 371 | |
|
| 6,265 | | 5,834 | |
|
| 6,581 | | 6,205 | | ||||||
Arizona | 1,516 | | 1,772 | |
|
| 4,039 | | 3,595 | |
|
| 5,555 | | 5,367 | | ||||||
All other (f) | 8,628 | | 9,834 | |
|
| 50,859 | | 47,915 | |
|
| 59,487 | | 57,749 | | ||||||
Total retained loans | $ | 34,657 | | $ | 39,063 | |
|
| $ | 212,558 | | $ | 192,486 | |
|
| $ | 247,215 | | $ | 231,549 | |
(a) | Individual delinquency classifications include mortgage loans insured by U.S. government agencies as follows: current included $2.5 billion and $2.5 billion ; 30 – 149 days past due included $2.8 billion and $3.1 billion ; and 150 or more days past due included $3.0 billion and $3.8 billion at September 30, 2017 , and December 31, 2016 , respectively. |
(b) | At September 30, 2017 and December 31, 2016 , residential mortgage loans excluded mortgage loans insured by U.S. government agencies of $5.8 billion and $6.9 billion , respectively, that are 30 or more days past due. These amounts have been excluded based upon the government guarantee. |
(c) | These balances, which are 90 days or more past due, were excluded from nonaccrual loans as the loans are guaranteed by U.S government agencies. Typically the principal balance of the loans is insured and interest is guaranteed at a specified reimbursement rate subject to meeting agreed-upon servicing guidelines. At September 30, 2017 , and December 31, 2016 , these balances included $1.6 billion and $2.2 billion , respectively, of loans that are no longer accruing interest based on the agreed-upon servicing guidelines. For the remaining balance, interest is being accrued at the guaranteed reimbursement rate. There were no loans that were not guaranteed by U.S. government agencies that are 90 or more days past due and still accruing interest at September 30, 2017 , and December 31, 2016 . |
(d) | Represents the aggregate unpaid principal balance of loans divided by the estimated current property value. Current property values are estimated, at a minimum, quarterly, based on home valuation models using nationally recognized home price index valuation estimates incorporating actual data to the extent available and forecasted data where actual data is not available. These property values do not represent actual appraised loan level collateral values; as such, the resulting ratios are necessarily imprecise and should be viewed as estimates. Current estimated combined LTV for junior lien home equity loans considers all available lien positions, as well as unused lines, related to the property. |
(e) | Refreshed FICO scores represent each borrower's most recent credit score, which is obtained by the Firm on at least a quarterly basis. |
(f) | At September 30, 2017 , and December 31, 2016 , included mortgage loans insured by U.S. government agencies of $8.3 billion and $9.4 billion , respectively. |
(g) | Certain loan portfolios have been reclassified. The prior period amounts have been revised to conform with the current period presentation. |
126
The following table represents the Firm's delinquency statistics for junior lien home equity loans and lines as of September 30, 2017 , and December 31, 2016 .
| Total loans |
| Total 30+ day delinquency rate | ||||||||
(in millions, except ratios) | Sep 30, | | Dec 31, | |
| Sep 30, | | Dec 31, | | ||
| |||||||||||
HELOCs: (a) |
|
|
|
|
| ||||||
Within the revolving period (b) | $ | 7,058 | | $ | 10,304 | |
| 0.62 | % | 1.27 | % |
Beyond the revolving period | 13,613 | | 13,272 | |
| 3.11 | | 3.05 | | ||
HELOANs | 1,477 | | 1,861 | |
| 2.91 | | 2.85 | | ||
Total | $ | 22,148 | | $ | 25,437 | |
| 2.30 | % | 2.32 | % |
(a) | These HELOCs are predominantly revolving loans for a 10 -year period, after which time the HELOC converts to a loan with a 20 -year amortization period, but also include HELOCs that allow interest-only payments beyond the revolving period. |
(b) | The Firm manages the risk of HELOCs during their revolving period by closing or reducing the undrawn line to the extent permitted by law when borrowers are experiencing financial difficulty. |
HELOCs beyond the revolving period and HELOANs have higher delinquency rates than HELOCs within the revolving period. That is primarily because the fully-amortizing payment that is generally required for those products is higher than the minimum payment options available for HELOCs within the revolving period. The higher delinquency rates associated with amortizing HELOCs and HELOANs are factored into the Firm's allowance for loan losses.
Impaired loans
The table below sets forth information about the Firm's residential real estate impaired loans, excluding PCI loans. These loans are considered to be impaired as they have been modified in a TDR. All impaired loans are evaluated for an asset-specific allowance as described in Note 15 of JPMorgan Chase 's 2016 Annual Report .
| Home equity |
| Residential mortgage |
| Total residential real estate – excluding PCI | |||||||||||||||
Sep 30, | | Dec 31, | |
| Sep 30, | | Dec 31, | |
| Sep 30, | | Dec 31, | | |||||||
Impaired loans |
|
|
|
|
|
|
|
| ||||||||||||
With an allowance | $ | 1,224 | | $ | 1,266 | |
| $ | 4,418 | | $ | 4,689 | |
| $ | 5,642 | | $ | 5,955 | |
Without an allowance (a) | 910 | | 998 | |
| 1,249 | | 1,343 | |
| 2,159 | | 2,341 | | ||||||
Total impaired loans (b)(c) | $ | 2,134 | | $ | 2,264 | |
| $ | 5,667 | | $ | 6,032 | |
| $ | 7,801 | | $ | 8,296 | |
Allowance for loan losses related to impaired loans | $ | 110 | | $ | 121 | |
| $ | 66 | | $ | 68 | |
| $ | 176 | | $ | 189 | |
Unpaid principal balance of impaired loans (d) | 3,754 | | 3,847 | |
| 7,842 | | 8,285 | |
| 11,596 | | 12,132 | | ||||||
Impaired loans on nonaccrual status (e) | 1,021 | | 1,116 | |
| 1,656 | | 1,755 | |
| 2,677 | | 2,871 | | ||||||
(a) | Represents collateral-dependent residential real estate loans that are charged off to the fair value of the underlying collateral less cost to sell. The Firm reports, in accordance with regulatory guidance, residential real estate loans that have been discharged under Chapter 7 bankruptcy and not reaffirmed by the borrower ("Chapter 7 loans") as collateral-dependent nonaccrual TDRs, regardless of their delinquency status. At September 30, 2017 , Chapter 7 residential real estate loans included approximately 12% of home equity and 14% of residential mortgages that were 30 days or more past due. |
(b) | At September 30, 2017 , and December 31, 2016 , $3.7 billion and $3.4 billion , respectively, of loans modified subsequent to repurchase from Ginnie Mae in accordance with the standards of the appropriate government agency (i.e., FHA, VA, RHS) are not included in the table above. When such loans perform subsequent to modification in accordance with Ginnie Mae guidelines, they are generally sold back into Ginnie Mae loan pools. Modified loans that do not re-perform become subject to foreclosure. |
(c) | Predominantly all residential real estate impaired loans, excluding PCI loans, are in the U.S. |
(d) | Represents the contractual amount of principal owed at September 30, 2017 , and December 31, 2016 . The unpaid principal balance differs from the impaired loan balances due to various factors including charge-offs, net deferred loan fees or costs, and unamortized discounts or premiums on purchased loans. |
(e) | As of September 30, 2017 and December 31, 2016 , nonaccrual loans included $2.2 billion and $2.3 billion , respectively, of TDRs for which the borrowers were less than 90 days past due. For additional information about loans modified in a TDR that are on nonaccrual status refer to the Loan accounting framework in Note 14 of JPMorgan Chase 's 2016 Annual Report . |
127
The following tables present average impaired loans and the related interest income reported by the Firm.
Three months ended September 30, (in millions) | Average impaired loans |
| Interest income on impaired loans (a) |
| Interest income on impaired | |||||||||||||||
2017 | | 2016 | |
| 2017 | | 2016 | |
| 2017 | | 2016 | | |||||||
Home equity | $ | 2,150 | | $ | 2,276 | |
| $ | 32 | | $ | 31 | |
| $ | 20 | | $ | 20 | |
Residential mortgage | 5,743 | | 6,305 | |
| 71 | | 76 | |
| 19 | | 19 | | ||||||
Total residential real estate – excluding PCI | $ | 7,893 | | $ | 8,581 | |
| $ | 103 | | $ | 107 | |
| $ | 39 | | $ | 39 | |
|
|
|
|
|
|
|
|
| ||||||||||||
Nine months ended September 30, (in millions) | Average impaired loans |
| Interest income on impaired loans (a) |
| Interest income on impaired loans on a cash basis (a) | |||||||||||||||
2017 | | 2016 | |
| 2017 | | 2016 | |
| 2017 | | 2016 | | |||||||
Home equity | $ | 2,213 | | $ | 2,325 | |
| $ | 95 | | $ | 94 | |
| $ | 60 | | $ | 61 | |
Residential mortgage | 5,861 | | 6,457 | |
| 217 | | 231 | |
| 57 | | 58 | | ||||||
Total residential real estate – excluding PCI | $ | 8,074 | | $ | 8,782 | |
| $ | 312 | | $ | 325 | |
| $ | 117 | | $ | 119 | |
(a) | Generally, interest income on loans modified in TDRs is recognized on a cash basis until such time as the borrower has made a minimum of six payments under the new terms, unless the loan is deemed to be collateral-dependent. |
Loan modifications
Modifications of residential real estate loans, excluding PCI loans, are generally accounted for and reported as TDRs. There were no additional commitments to lend to borrowers whose residential real estate loans, excluding PCI loans, have been modified in TDRs.
The following table presents new TDRs reported by the Firm.
| Three months ended September 30, |
| Nine months ended September 30, | ||||||||||
(in millions) | 2017 | | 2016 | |
| 2017 | | 2016 | | ||||
Home equity | $ | 82 | | $ | 62 | |
| $ | 232 | | $ | 258 | |
Residential mortgage | 57 | | 72 | |
| 225 | | 194 | | ||||
Total residential real estate – excluding PCI | $ | 139 | | $ | 134 | |
| $ | 457 | | $ | 452 | |
128
Nature and extent of modifications
The U.S. Treasury's Making Home Affordable programs, as well as the Firm's proprietary modification programs, generally provide various concessions to financially troubled borrowers including, but not limited to, interest rate reductions, term or payment extensions and deferral of principal and/or interest payments that would otherwise have been required under the terms of the original agreement.
The following tables provide information about how residential real estate loans, excluding PCI loans, were modified under the Firm's loss mitigation programs described above during the periods presented. These tables exclude Chapter 7 loans where the sole concession granted is the discharge of debt .
Three months ended September 30, |
|
| Total residential real estate – excluding PCI | |||||||||||
Home equity |
| Residential mortgage |
| |||||||||||
2017 | | 2016 | |
| 2017 | | 2016 | |
| 2017 | | 2016 | | |
Number of loans approved for a trial modification | 536 | | 351 | |
| 206 | | 386 | |
| 742 | | 737 | |
Number of loans permanently modified | 1,228 | | 1,163 | |
| 510 | | 849 | |
| 1,738 | | 2,012 | |
Concession granted: (a) |
|
|
|
|
|
|
|
| ||||||
Interest rate reduction | 60 | % | 83 | % |
| 64 | % | 81 | % |
| 61 | % | 82 | % |
Term or payment extension | 66 | | 76 | |
| 80 | | 86 | |
| 70 | | 81 | |
Principal and/or interest deferred | 8 | | 21 | |
| 22 | | 15 | |
| 12 | | 18 | |
Principal forgiveness | 19 | | 6 | |
| 17 | | 25 | |
| 19 | | 14 | |
Other (b) | 32 | | 6 | |
| 15 | | 27 | |
| 27 | | 15 | |
|
|
|
|
|
|
|
|
| ||||||
Nine months ended September 30, |
|
| Total residential | |||||||||||
Home equity |
| Residential mortgage |
| |||||||||||
2017 | | 2016 | |
| 2017 | | 2016 | |
| 2017 | | 2016 | | |
Number of loans approved for a trial modification | 1,844 | | 2,088 | |
| 1,052 | | 1,521 | |
| 2,896 | | 3,609 | |
Number of loans permanently modified | 4,028 | | 3,804 | |
| 1,952 | | 2,560 | |
| 5,980 | | 6,364 | |
Concession granted: (a) |
|
|
|
|
|
|
|
| ||||||
Interest rate reduction | 68 | % | 74 | % |
| 73 | % | 75 | % |
| 69 | % | 75 | % |
Term or payment extension | 78 | | 84 | |
| 84 | | 89 | |
| 80 | | 86 | |
Principal and/or interest deferred | 12 | | 12 | |
| 16 | | 18 | |
| 13 | | 18 | |
Principal forgiveness | 12 | | 9 | |
| 18 | | 27 | |
| 14 | | 16 | |
Other (b) | 19 | | 1 | |
| 24 | | 14 | |
| 21 | | 11 | |
(a) | Represents concessions granted in permanent modifications as a percentage of the number of loans permanently modified. The sum of the percentages exceeds 100% because predominantly all of the modifications include more than one type of concession. A significant portion of trial modifications include interest rate reductions and/or term or payment extensions. |
(b) | Predominantly represents variable interest rate to fixed interest rate modifications. |
129
Financial effects of modifications and redefaults
The following tables provide information about the financial effects of the various concessions granted in modifications of residential real estate loans, excluding PCI, under the loss mitigation programs described above and about redefaults of certain loans modified in TDRs for the periods presented. Because the specific types and amounts of concessions offered to borrowers frequently change between the trial modification and the permanent modification, the following tables present only the financial effects of permanent modifications. These tables also exclude Chapter 7 loans where the sole concession granted is the discharge of debt.
Three months ended September 30, (in millions, except weighted-average data) | Home equity |
| Residential mortgage |
| Total residential real estate – excluding PCI | |||||||||||||||
2017 | 2016 |
| 2017 | 2016 |
| 2017 | 2016 | |||||||||||||
Weighted-average interest rate of loans with interest rate reductions – before TDR | 5.26 | % | 4.99 | % |
| 4.92 | % | 5.76 | % |
| 5.06 | % | 5.47 | % | ||||||
Weighted-average interest rate of loans with interest rate reductions – after TDR | 2.96 | | 2.28 | |
| 2.89 | | 2.99 | |
| 2.92 | | 2.73 | | ||||||
Weighted-average remaining contractual term (in years) of loans with term or payment extensions – before TDR | 18 | | 19 | |
| 24 | | 24 | |
| 22 | | 22 | | ||||||
Weighted-average remaining contractual term (in years) of loans with term or payment extensions – after TDR | 38 | | 38 | |
| 38 | | 38 | |
| 38 | | 38 | | ||||||
Charge-offs recognized upon permanent modification | $ | - | | $ | | |
| $ | | | $ | 1 | |
| $ | | | $ | 1 | |
Principal deferred | 1 | | 6 | |
| 3 | | 7 | |
| 4 | | 13 | | ||||||
Principal forgiven | 4 | | 1 | |
| 5 | | 12 | |
| 9 | | 13 | | ||||||
Balance of loans that redefaulted within one year of permanent modification (a) | $ | 17 | | $ | 13 | |
| $ | 32 | | $ | 29 | |
| $ | 49 | | $ | 42 | |
|
|
|
|
|
|
|
|
| ||||||||||||
Nine months ended September 30, | Home equity |
| Residential mortgage |
| Total residential real estate – excluding PCI | |||||||||||||||
2017 | 2016 |
| 2017 | 2016 |
| 2017 | 2016 | |||||||||||||
Weighted-average interest rate of loans with interest rate reductions – before TDR | 4.92 | % | 5.08 | % |
| 5.16 | % | 5.66 | % |
| 5.06 | % | 5.43 | % | ||||||
Weighted-average interest rate of loans with interest rate reductions – after TDR | 2.55 | | 2.40 | |
| 2.97 | | 2.94 | |
| 2.79 | | 2.73 | | ||||||
Weighted-average remaining contractual term (in years) of loans with term or payment extensions – before TDR | 22 | | 18 | |
| 24 | | 25 | |
| 23 | | 22 | | ||||||
Weighted-average remaining contractual term (in years) of loans with term or payment extensions – after TDR | 39 | | 38 | |
| 38 | | 38 | |
| 38 | | 38 | | ||||||
Charge-offs recognized upon permanent modification | $ | 1 | | $ | 1 | |
| $ | 1 | | $ | 3 | |
| $ | 2 | | $ | 4 | |
Principal deferred | 8 | | 18 | |
| 10 | | 26 | |
| 18 | | 44 | | ||||||
Principal forgiven | 9 | | 5 | |
| 16 | | 37 | |
| 25 | | 42 | | ||||||
Balance of loans that redefaulted within one year of permanent modification (a) | $ | 36 | | $ | 31 | |
| $ | 86 | | $ | 72 | |
| $ | 122 | | $ | 103 | |
(a) | Represents loans permanently modified in TDRs that experienced a payment default in the periods presented, and for which the payment default occurred within one year of the modification. The dollar amounts presented represent the balance of such loans at the end of the reporting period in which such loans defaulted. For residential real estate loans modified in TDRs, payment default is deemed to occur when the loan becomes two contractual payments past due. In the event that a modified loan redefaults, it is probable that the loan will ultimately be liquidated through foreclosure or another similar type of liquidation transaction. Redefaults of loans modified within the last 12 months may not be representative of ultimate redefault levels. |
At September 30, 2017 , the weighted-average estimated remaining lives of residential real estate loans, excluding PCI loans, permanently modified in TDRs were 10 years for home equity and 14 years for residential mortgage. The estimated remaining lives of these loans reflect estimated prepayments, both voluntary and involuntary (i.e., foreclosures and other forced liquidations).
Active and suspended foreclosure
At September 30, 2017 , and December 31, 2016 , the Firm had non-PCI residential real estate loans, excluding those insured by U.S. government agencies, with a carrying value of $836 million and $932 million , respectively, that were not included in REO, but were in the process of active or suspended foreclosure.
130
Other consumer loans
The table below provides information for other consumer retained loan classes, including auto and business banking loans. This table excludes student loans as a result of the transfer of the student loan portfolio to held-for-sale in the first quarter of 2017 and its subsequent sale in the second quarter of 2017.
(in millions, except ratios) | Auto |
| Consumer & Business Banking (c) | ||||||||||||
Sep 30, 2017 | |
| Dec 31, 2016 | |
| Sep 30, 2017 | |
| Dec 31, 2016 | | |||||
Loan delinquency |
|
|
|
|
|
|
| ||||||||
Current | $ | 64,496 | |
| $ | 65,029 | |
| $ | 24,934 | |
| $ | 23,920 | |
30–119 days past due | 606 | |
| 773 | |
| 204 | |
| 247 | | ||||
120 or more days past due | - | |
| 12 | |
| 137 | |
| 140 | | ||||
Total retained loans | $ | 65,102 | |
| $ | 65,814 | |
| $ | 25,275 | |
| $ | 24,307 | |
% of 30+ days past due to total retained loans | 0.93 | % |
| 1.19 | % |
| 1.35 | % |
| 1.59 | % | ||||
Nonaccrual loans (a) | 188 | |
| 214 | |
| 274 | |
| 287 | | ||||
Geographic region |
|
|
|
|
|
|
| ||||||||
California | $ | 8,355 | |
| $ | 7,975 | |
| $ | 4,829 | |
| $ | 4,426 | |
Texas | 6,754 | |
| 7,041 | |
| 2,873 | |
| 2,954 | | ||||
New York | 3,919 | |
| 4,078 | |
| 4,115 | |
| 3,979 | | ||||
Illinois | 3,945 | |
| 3,984 | |
| 1,865 | |
| 1,758 | | ||||
Florida | 3,319 | |
| 3,374 | |
| 1,355 | |
| 1,195 | | ||||
Ohio | 2,077 | |
| 2,194 | |
| 1,410 | |
| 1,402 | | ||||
Arizona | 2,129 | |
| 2,209 | |
| 1,333 | |
| 1,307 | | ||||
Michigan | 1,411 | |
| 1,567 | |
| 1,349 | |
| 1,343 | | ||||
New Jersey | 2,037 | |
| 2,031 | |
| 704 | |
| 623 | | ||||
Louisiana | 1,672 | |
| 1,814 | |
| 872 | |
| 979 | | ||||
All other | 29,484 | |
| 29,547 | |
| 4,570 | |
| 4,341 | | ||||
Total retained loans | $ | 65,102 | |
| $ | 65,814 | |
| $ | 25,275 | |
| $ | 24,307 | |
Loans by risk ratings (b) |
|
|
|
|
|
|
| ||||||||
Noncriticized | $ | 14,136 | |
| $ | 13,899 | |
| $ | 17,640 | |
| $ | 16,858 | |
Criticized performing | 125 | |
| 201 | |
| 803 | |
| 816 | | ||||
Criticized nonaccrual | 48 | |
| 94 | |
| 207 | |
| 217 | | ||||
(a) | There were no loans that were 90 or more days past due and still accruing interest at September 30, 2017 , and December 31, 2016 . |
(b) | For risk-rated business banking and auto loans, the primary credit quality indicator is the risk rating of the loan, including whether the loans are considered to be criticized and/or nonaccrual. |
(c) | Certain loan portfolios have been reclassified. The prior period amounts have been revised to conform with the current period presentation. |
131
Other consumer impaired loans and loan
modifications
The table below sets forth information about the Firm's other consumer impaired loans, including risk-rated business banking and auto loans that have been placed on nonaccrual status, and loans that have been modified in TDRs.
(in millions) | September 30, | |
| December 31, | | ||
Impaired loans |
|
|
| ||||
With an allowance | $ | 317 | |
| $ | 614 | |
Without an allowance (a) | 29 | |
| 30 | | ||
Total impaired loans (b)(c) | $ | 346 | |
| $ | 644 | |
Allowance for loan losses related to impaired loans | $ | 95 | |
| $ | 119 | |
Unpaid principal balance of impaired loans (d) | 439 | |
| 753 | | ||
Impaired loans on nonaccrual status | 311 | |
| 508 | | ||
(a) | When discounted cash flows, collateral value or market price equals or exceeds the recorded investment in the loan, the loan does not require an allowance. This typically occurs when the impaired loans have been partially charged off and/or there have been interest payments received and applied to the loan balance. |
(b) | Predominantly all other consumer impaired loans are in the U.S. |
(c) | Other consumer average impaired loans were $366 million and $683 million for the three months ended September 30, 2017 and 2016 , respectively, and $459 million and $626 million for the nine months ended September 30, 2017 and 2016 , respectively. The related interest income on impaired loans, including those on a cash basis, was not material for the three and nine months ended September 30, 2017 and 2016 . |
(d) | Represents the contractual amount of principal owed at September 30, 2017 , and December 31, 2016 . The unpaid principal balance differs from the impaired loan balances due to various factors, including charge-offs, interest payments received and applied to the principal balance, net deferred loan fees or costs, and unamortized discounts or premiums on purchased loans. |
Loan modifications
Certain other consumer loan modifications are considered to be TDRs as they provide various concessions to borrowers who are experiencing financial difficulty. All of these TDRs are reported as impaired loans in the table above. See Note 14 of JPMorgan Chase's 2016 Annual Report for further information on other consumer loans modified in TDRs.
The following table provides information about the Firm's other consumer loans modified in TDRs. New TDRs were not material for the three and nine months ended September 30, 2017 and 2016 .
(in millions) | September 30, | |
| December 31, | | ||
Loans modified in TDRs (a)(b) | $ | 115 | |
| $ | 362 | |
TDRs on nonaccrual status | 80 | |
| 226 | | ||
(a) | The impact of these modifications were not material to the Firm for the three and nine months ended September 30, 2017 and 2016 . |
(b) | Additional commitments to lend to borrowers whose loans have been modified in TDRs as of September 30, 2017 , and December 31, 2016 , were immaterial. |
132
Purchased credit-impaired loans
For a detailed discussion of PCI loans, including the related accounting policies, see Note 14 of JPMorgan Chase 's 2016 Annual Report .
Residential real estate – PCI loans
The table below sets forth information about the Firm's consumer, excluding credit card, PCI loans.
| Home equity | | Prime mortgage | | Subprime mortgage | | Option ARMs | | Total PCI | |||||||||||||||||||||||||
Sep 30, | | Dec 31, | | | Sep 30, | | Dec 31, | | | Sep 30, | | Dec 31, | | | Sep 30, | | Dec 31, | | | Sep 30, | | Dec 31, | | |||||||||||
Carrying value (a) | $ | 11,321 | | $ | 12,902 | | | $ | 6,747 | | $ | 7,602 | | | $ | 2,691 | | $ | 2,941 | | | $ | 11,062 | | $ | 12,234 | | | $ | 31,821 | | $ | 35,679 | |
Related allowance for loan losses (b) | 1,133 | | 1,433 | | | 883 | | 829 | | | 150 | | - | | | 79 | | 49 | | | 2,245 | | 2,311 | | ||||||||||
Loan delinquency (based on unpaid principal balance) | | | | | | | | | | | | | | | | | | | | | ||||||||||||||
Current | $ | 10,860 | | $ | 12,423 | | | $ | 6,111 | | $ | 6,840 | | | $ | 2,798 | | $ | 3,005 | | | $ | 10,086 | | $ | 11,074 | | | $ | 29,855 | | $ | 33,342 | |
30–149 days past due | 289 | | 291 | | | 311 | | 336 | | | 316 | | 361 | | | 468 | | 555 | | | 1,384 | | 1,543 | | ||||||||||
150 or more days past due | 408 | | 478 | | | 349 | | 451 | | | 182 | | 240 | | | 739 | | 917 | | | 1,678 | | 2,086 | | ||||||||||
Total loans | $ | 11,557 | | $ | 13,192 | | | $ | 6,771 | | $ | 7,627 | | | $ | 3,296 | | $ | 3,606 | | | $ | 11,293 | | $ | 12,546 | | | $ | 32,917 | | $ | 36,971 | |
% of 30+ days past due to total loans | 6.03 | % | 5.83 | % | | 9.75 | % | 10.32 | % | | 15.11 | % | 16.67 | % | | 10.69 | % | 11.73 | % | | 9.30 | % | 9.82 | % | ||||||||||
Current estimated LTV ratios (based on unpaid principal balance) (c)(d) | | | | | | | | | | | | | | | | | | |||||||||||||||||
Greater than 125% and refreshed FICO scores: | | | | | | | | | | | | | | | | | | | | | | | | | ||||||||||
Equal to or greater than 660 | $ | 38 | | $ | 69 | | | $ | 4 | | $ | 6 | | | $ | 5 | | $ | 7 | | | $ | 6 | | $ | 12 | | | $ | 53 | | $ | 94 | |
Less than 660 | 22 | | 39 | | | 17 | | 17 | | | 23 | | 31 | | | 12 | | 18 | | | 74 | | 105 | | ||||||||||
101% to 125% and refreshed FICO scores: | | | | | | | | | | | | | | | | | | | | | | | | | ||||||||||
Equal to or greater than 660 | 331 | | 555 | | | 25 | | 52 | | | 24 | | 39 | | | 53 | | 83 | | | 433 | | 729 | | ||||||||||
Less than 660 | 163 | | 256 | | | 55 | | 84 | | | 88 | | 135 | | | 90 | | 144 | | | 396 | | 619 | | ||||||||||
80% to 100% and refreshed FICO scores: | | | | | | | | | | | | | | | | | | | | | | | | | ||||||||||
Equal to or greater than 660 | 1,373 | | 1,860 | | | 276 | | 442 | | | 140 | | 214 | | | 361 | | 558 | | | 2,150 | | 3,074 | | ||||||||||
Less than 660 | 618 | | 804 | | | 267 | | 381 | | | 341 | | 439 | | | 445 | | 609 | | | 1,671 | | 2,233 | | ||||||||||
Lower than 80% and refreshed FICO scores: | | | | | | | | | | | | | | | | | | | | | | | | | ||||||||||
Equal to or greater than 660 | 6,305 | | 6,676 | | | 3,624 | | 3,967 | | | 910 | | 919 | | | 6,253 | | 6,754 | | | 17,092 | | 18,316 | | ||||||||||
Less than 660 | 2,086 | | 2,183 | | | 2,153 | | 2,287 | | | 1,609 | | 1,645 | | | 3,553 | | 3,783 | | | 9,401 | | 9,898 | | ||||||||||
No FICO/LTV available | 621 | | 750 | | | 350 | | 391 | | | 156 | | 177 | | | 520 | | 585 | | | 1,647 | | 1,903 | | ||||||||||
Total unpaid principal balance | $ | 11,557 | | $ | 13,192 | | | $ | 6,771 | | $ | 7,627 | | | $ | 3,296 | | $ | 3,606 | | | $ | 11,293 | | $ | 12,546 | | | $ | 32,917 | | $ | 36,971 | |
Geographic region (based on unpaid principal balance) | | | | | | | | | | | | | | | | | | | | | ||||||||||||||
California | $ | 6,890 | | $ | 7,899 | | | $ | 3,860 | | $ | 4,396 | | | $ | 821 | | $ | 899 | | | $ | 6,402 | | $ | 7,128 | | | $ | 17,973 | | $ | 20,322 | |
Florida | 1,178 | | 1,306 | | | 447 | | 501 | | | 305 | | 332 | | | 939 | | 1,026 | | | 2,869 | | 3,165 | | ||||||||||
New York | 630 | | 697 | | | 474 | | 515 | | | 337 | | 363 | | | 642 | | 711 | | | 2,083 | | 2,286 | | ||||||||||
Washington | 565 | | 673 | | | 141 | | 167 | | | 62 | | 68 | | | 248 | | 290 | | | 1,016 | | 1,198 | | ||||||||||
New Jersey | 251 | | 280 | | | 190 | | 210 | | | 115 | | 125 | | | 363 | | 401 | | | 919 | | 1,016 | | ||||||||||
Illinois | 282 | | 314 | | | 208 | | 226 | | | 165 | | 178 | | | 263 | | 282 | | | 918 | | 1,000 | | ||||||||||
Massachusetts | 82 | | 94 | | | 155 | | 173 | | | 101 | | 110 | | | 312 | | 346 | | | 650 | | 723 | | ||||||||||
Maryland | 59 | | 64 | | | 134 | | 144 | | | 135 | | 145 | | | 239 | | 267 | | | 567 | | 620 | | ||||||||||
Arizona | 213 | | 241 | | | 110 | | 124 | | | 61 | | 68 | | | 160 | | 181 | | | 544 | | 614 | | ||||||||||
Virginia | 68 | | 77 | | | 127 | | 142 | | | 52 | | 56 | | | 288 | | 314 | | | 535 | | 589 | | ||||||||||
All other | 1,339 | | 1,547 | | | 925 | | 1,029 | | | 1,142 | | 1,262 | | | 1,437 | | 1,600 | | | 4,843 | | 5,438 | | ||||||||||
Total unpaid principal balance | $ | 11,557 | | $ | 13,192 | | | $ | 6,771 | | $ | 7,627 | | | $ | 3,296 | | $ | 3,606 | | | $ | 11,293 | | $ | 12,546 | | | $ | 32,917 | | $ | 36,971 | |
(a) | Carrying value includes the effect of fair value adjustments that were applied to the consumer PCI portfolio at the date of acquisition. |
(b) | Management concluded as part of the Firm's regular assessment of the PCI loan pools that it was probable that higher expected credit losses would result in a decrease in expected cash flows. As a result, an allowance for loan losses for impairment of these pools has been recognized. |
(c) | Represents the aggregate unpaid principal balance of loans divided by the estimated current property value. Current property values are estimated, at a minimum, quarterly, based on home valuation models using nationally recognized home price index valuation estimates incorporating actual data to the extent available and forecasted data where actual data is not available. These property values do not represent actual appraised loan level collateral values; as such, the resulting ratios are necessarily imprecise and should be viewed as estimates. Current estimated combined LTV for junior lien home equity loans considers all available lien positions, as well as unused lines, related to the property. |
(d) | Refreshed FICO scores represent each borrower's most recent credit score, which is obtained by the Firm on at least a quarterly basis. |
133
| Total loans |
| Total 30+ day delinquency rate | ||||||||
(in millions, except ratios) | Sep 30, | | Dec 31, | |
| Sep 30, | | Dec 31, | | ||
| |||||||||||
HELOCs: (a) |
|
|
|
|
| ||||||
Within the revolving period (b) | $ | 283 | | $ | 2,126 | |
| 2.83 | % | 3.67 | % |
Beyond the revolving period (c) | 8,051 | | 7,452 | |
| 4.10 | | 4.03 | | ||
HELOANs | 384 | | 465 | |
| 4.69 | | 5.38 | | ||
Total | $ | 8,718 | | $ | 10,043 | |
| 4.08 | % | 4.01 | % |
(a) | In general, these HELOCs are revolving loans for a 10 -year period, after which time the HELOC converts to an interest-only loan with a balloon payment at the end of the loan's term. |
(b) | Substantially all undrawn HELOCs within the revolving period have been closed. |
(c) | Includes loans modified into fixed rate amortizing loans. |
The table below sets forth the accretable yield activity for the Firm's PCI consumer loans for the three and nine months ended September 30, 2017 and 2016 , and represents the Firm's estimate of gross interest income expected to be earned over the remaining life of the PCI loan portfolios. The table excludes the cost to fund the PCI portfolios, and therefore the accretable yield does not represent net interest income expected to be earned on these portfolios.
| Total PCI | ||||||||||||
(in millions, except ratios) | Three months ended September 30, |
| Nine months ended September 30, | ||||||||||
2017 | 2016 |
| 2017 | 2016 | |||||||||
Beginning balance | $ | 12,639 | | $ | 12,301 | |
| $ | 11,768 | | $ | 13,491 | |
Accretion into interest income | (345 | ) | (382 | ) |
| (1,061 | ) | (1,184 | ) | ||||
Changes in interest rates on variable-rate loans | 51 | | 42 | |
| 218 | | 143 | | ||||
Other changes in expected cash flows (a) | (1,333 | ) | 291 | |
| 87 | | (198 | ) | ||||
Balance at September 30 | $ | 11,012 | | $ | 12,252 | |
| $ | 11,012 | | $ | 12,252 | |
Accretable yield percentage | 4.54 | % | 4.33 | % |
| 4.48 | % | 4.35 | % | ||||
(a) | Other changes in expected cash flows may vary from period to period as the Firm continues to refine its cash flow model, for example cash flows expected to be collected due to the impact of modifications and changes in prepayment assumptions. |
Active and suspended foreclosure
At September 30, 2017 , and December 31, 2016 , the Firm had PCI residential real estate loans with an unpaid principal balance of $1.4 billion and $1.7 billion , respectively, that were not included in REO, but were in the process of active or suspended foreclosure.
Credit card loan portfolio
For further information on the credit card loan portfolio, including credit quality indicators, see Note 14 of JPMorgan Chase's 2016 Annual Report.
(in millions, except ratios) | September 30, | | December 31, | | ||
Loan delinquency |
|
| ||||
Current and less than 30 days past due and still accruing | $ | 138,716 | | $ | 139,434 | |
30–89 days past due and still accruing | 1,269 | | 1,134 | | ||
90 or more days past due and still accruing | 1,215 | | 1,143 | | ||
Total retained credit card loans | $ | 141,200 | | $ | 141,711 | |
Loan delinquency ratios |
|
| ||||
% of 30+ days past due to total retained loans | 1.76 | % | 1.61 | % | ||
% of 90+ days past due to total retained loans | 0.86 | | 0.81 | | ||
Credit card loans by geographic region |
|
| ||||
California | $ | 20,839 | | $ | 20,571 | |
Texas | 13,376 | | 13,220 | | ||
New York | 12,468 | | 12,249 | | ||
Florida | 8,589 | | 8,585 | | ||
Illinois | 8,155 | | 8,189 | | ||
New Jersey | 6,185 | | 6,271 | | ||
Ohio | 4,732 | | 4,906 | | ||
Pennsylvania | 4,612 | | 4,787 | | ||
Colorado | 3,792 | | 3,699 | | ||
Michigan | 3,648 | | 3,741 | | ||
All other | 54,804 | | 55,493 | | ||
Total retained credit card loans | $ | 141,200 | | $ | 141,711 | |
Percentage of portfolio based on carrying value with estimated refreshed FICO scores |
|
| ||||
Equal to or greater than 660 | 84.1 | % | 84.4 | % | ||
Less than 660 | 15.0 | | 14.2 | | ||
No FICO available | 0.9 | | 1.4 | | ||
134
Credit card impaired loans and loan modifications
For a detailed discussion of impaired credit card loans, including credit card loan modifications, see Note 14 of JPMorgan Chase 's 2016 Annual Report .
The table below sets forth information about the Firm's impaired credit card loans. All of these loans are considered to be impaired as they have been modified in TDRs.
(in millions) | September 30, | | December 31, | | ||
Impaired credit card loans with an allowance (a)(b) |
|
| ||||
Credit card loans with modified payment terms (c) | $ | 1,080 | | $ | 1,098 | |
Modified credit card loans that have reverted to pre-modification payment terms (d) | 126 | | 142 | | ||
Total impaired credit card loans (e) | $ | 1,206 | | $ | 1,240 | |
Allowance for loan losses related to impaired credit card loans | $ | 376 | | $ | 358 | |
(a) | The carrying value and the unpaid principal balance are the same for credit card impaired loans. |
(b) | There were no impaired loans without an allowance. |
(c) | Represents credit card loans outstanding to borrowers enrolled in a credit card modification program as of the date presented. |
(d) | Represents credit card loans that were modified in TDRs but that have subsequently reverted back to the loans' pre-modification payment terms. |
At September 30, 2017 , and December 31, 2016 , $87 million and $94 million , respectively, of loans have reverted back to the pre-modification payment terms of the loans due to noncompliance with the terms of the modified loans. The remaining $39 million and $48 million at September 30, 2017 , and December 31, 2016 , respectively, of these loans are to borrowers who have successfully completed a short-term modification program. The Firm continues to report these loans as TDRs since the borrowers' credit lines remain closed.
(e) | Predominantly all impaired credit card loans are in the U.S. |
The following table presents average balances of impaired credit card loans and interest income recognized on those loans.
| Three months ended September 30, |
| Nine months ended September 30, | ||||||||||
(in millions) | 2017 | | 2016 | |
| 2017 | | 2016 | | ||||
Average impaired credit card loans | $ | 1,205 | | $ | 1,283 | |
| $ | 1,215 | | $ | 1,349 | |
Interest income on impaired credit card loans | 15 | | 15 | |
| 44 | | 48 | | ||||
Loan modifications
The Firm may modify loans to credit card borrowers who are experiencing financial difficulty. Most of these loans have been modified under programs that involve placing the customer on a fixed payment plan with a reduced interest rate, generally for 60 months. All of these credit card loan modifications are considered to be TDRs. New enrollments in these loan modification programs were $191 million and $162 million for the three months ended September 30, 2017 and 2016 , respectively , and $552 million and $462 million for the nine months ended September 30, 2017 and 2016 , respectively. For additional information about credit card loan modifications, see Note 14 of JPMorgan Chase 's 2016 Annual Report .
Financial effects of modifications and redefaults
The following table provides information about the financial effects of the concessions granted on credit card loans modified in TDRs and redefaults for the periods presented.
(in millions, except weighted-average data) | Three months ended September 30, |
| Nine months ended September 30, | ||||||||||
2017 | | 2016 | |
| 2017 | | 2016 | | |||||
Weighted-average interest rate of loans – before TDR | 16.84 | % | 15.60 | % |
| 16.52 | % | 15.56 | % | ||||
Weighted-average interest rate of loans – after TDR | 4.95 | | 4.66 | |
| 4.84 | | 4.76 | | ||||
Loans that redefaulted within one year of modification (a) | $ | 27 | | $ | 20 | |
| $ | 72 | | $ | 57 | |
(a) | Represents loans modified in TDRs that experienced a payment default in the periods presented, and for which the payment default occurred within one year of the modification. The amounts presented represent the balance of such loans as of the end of the quarter in which they defaulted. |
For credit card loans modified in TDRs, payment default is deemed to have occurred when the loans become two payments past due. A substantial portion of these loans is expected to be charged-off in accordance with the Firm's standard charge-off policy. Based on historical experience, the estimated weighted-average default rate for modified credit card loans was expected to be 31.23% and 28.87% as of September 30, 2017 , and December 31, 2016 , respectively.
135
Wholesale loan portfolio
Wholesale loans include loans made to a variety of customers, ranging from large corporate and institutional clients to high-net-worth individuals. The primary credit quality indicator for wholesale loans is the risk rating
assigned to each loan. For further information on these risk ratings, see Note 14 and Note 15 of JPMorgan Chase 's 2016 Annual Report .
The table below provides information by class of receivable for the retained loans in the Wholesale portfolio segment.
Effective in the first quarter of 2017, the Firm revised its methodology for the assignment of industry classifications, to better monitor and manage concentrations. This largely resulted in the re-assignment of holding companies from Other to the industry of risk category based on the primary business activity of the holding company's underlying entities. In the tables below, the prior period amounts have been revised to conform with the current period presentation.
| Commercial and industrial |
| Real estate |
| Financial | Government agencies |
| Other (d) | Total | ||||||||||||||||||||||||||||||
(in millions, except ratios) | Sep 30, | Dec 31, |
| Sep 30, | Dec 31, |
| Sep 30, | Dec 31, | Sep 30, | Dec 31, |
| Sep 30, | Dec 31, | Sep 30, | Dec 31, | ||||||||||||||||||||||||
Loans by risk ratings |
|
|
|
|
|
|
|
|
|
|
|
|
|
|
| ||||||||||||||||||||||||
Investment-grade | $ | 67,484 | | $ | 65,687 | |
| $ | 96,289 | | $ | 88,649 | |
| $ | 25,342 | | $ | 24,294 | | $ | 15,583 | | $ | 15,935 | |
| $ | 102,496 | | $ | 95,358 | | $ | 307,194 | | $ | 289,923 | |
Noninvestment-grade: |
|
|
|
|
|
|
|
|
|
|
|
|
|
|
| ||||||||||||||||||||||||
Noncriticized | 47,344 | | 47,531 | |
| 14,560 | | 16,155 | |
| 11,880 | | 11,075 | | 399 | | 439 | |
| 9,901 | | 9,360 | | 84,084 | | 84,560 | | ||||||||||||
Criticized performing | 4,594 | | 6,186 | |
| 695 | | 798 | |
| 252 | | 200 | | 1 | | 6 | |
| 279 | | 163 | | 5,821 | | 7,353 | | ||||||||||||
Criticized nonaccrual | 1,080 | | 1,491 | |
| 159 | | 200 | |
| 3 | | 9 | | - | | - | |
| 228 | | 254 | | 1,470 | | 1,954 | | ||||||||||||
Total noninvestment- grade | 53,018 | | 55,208 | |
| 15,414 | | 17,153 | |
| 12,135 | | 11,284 | | 400 | | 445 | |
| 10,408 | | 9,777 | | 91,375 | | 93,867 | | ||||||||||||
Total retained loans | $ | 120,502 | | $ | 120,895 | |
| $ | 111,703 | | $ | 105,802 | |
| $ | 37,477 | | $ | 35,578 | | $ | 15,983 | | $ | 16,380 | |
| $ | 112,904 | | $ | 105,135 | | $ | 398,569 | | $ | 383,790 | |
% of total criticized exposure to total retained loans | 4.71 | % | 6.35 | % |
| 0.76 | % | 0.94 | % |
| 0.68 | % | 0.59 | % | 0.01 | % | 0.04 | % |
| 0.45 | % | 0.40 | % | 1.83 | % | 2.43 | % | ||||||||||||
% of criticized nonaccrual to total retained loans | 0.90 | | 1.23 | |
| 0.14 | | 0.19 | |
| 0.01 | | 0.03 | | - | | - | |
| 0.20 | | 0.24 | | 0.37 | | 0.51 | | ||||||||||||
|
|
|
|
|
|
|
|
|
|
|
|
|
|
|
| ||||||||||||||||||||||||
Loans by geographic distribution (a) |
|
|
|
|
|
|
|
|
|
|
|
|
|
|
| ||||||||||||||||||||||||
Total non-U.S. | $ | 28,090 | | $ | 30,563 | |
| $ | 2,803 | | $ | 3,302 | |
| $ | 15,366 | | $ | 15,147 | | $ | 3,365 | | $ | 3,726 | |
| $ | 43,879 | | $ | 38,776 | | $ | 93,503 | | $ | 91,514 | |
Total U.S. | 92,412 | | 90,332 | |
| 108,900 | | 102,500 | |
| 22,111 | | 20,431 | | 12,618 | | 12,654 | |
| 69,025 | | 66,359 | | 305,066 | | 292,276 | | ||||||||||||
Total retained loans | $ | 120,502 | | $ | 120,895 | |
| $ | 111,703 | | $ | 105,802 | |
| $ | 37,477 | | $ | 35,578 | | $ | 15,983 | | $ | 16,380 | |
| $ | 112,904 | | $ | 105,135 | | $ | 398,569 | | $ | 383,790 | |
|
|
|
|
|
|
|
|
|
|
|
|
|
|
|
| ||||||||||||||||||||||||
Loan delinquency (b) |
|
|
|
|
|
|
|
|
|
|
|
|
|
|
| ||||||||||||||||||||||||
Current and less than 30 days past due and still accruing | $ | 119,192 | | $ | 119,050 | |
| $ | 111,440 | | $ | 105,396 | |
| $ | 37,396 | | $ | 35,523 | | $ | 15,919 | | $ | 16,269 | |
| $ | 111,822 | | $ | 104,280 | | $ | 395,769 | | $ | 380,518 | |
30–89 days past due and still accruing | 93 | | 268 | |
| 50 | | 204 | |
| 71 | | 25 | | 62 | | 107 | |
| 850 | | 582 | | 1,126 | | 1,186 | | ||||||||||||
90 or more days past due and still accruing (c) | 137 | | 86 | |
| 54 | | 2 | |
| 7 | | 21 | | 2 | | 4 | |
| 4 | | 19 | | 204 | | 132 | | ||||||||||||
Criticized nonaccrual | 1,080 | | 1,491 | |
| 159 | | 200 | |
| 3 | | 9 | | - | | - | |
| 228 | | 254 | | 1,470 | | 1,954 | | ||||||||||||
Total retained loans | $ | 120,502 | | $ | 120,895 | |
| $ | 111,703 | | $ | 105,802 | |
| $ | 37,477 | | $ | 35,578 | | $ | 15,983 | | $ | 16,380 | |
| $ | 112,904 | | $ | 105,135 | | $ | 398,569 | | $ | 383,790 | |
(a) | The U.S. and non-U.S. distribution is determined based predominantly on the domicile of the borrower. |
(b) | The credit quality of wholesale loans is assessed primarily through ongoing review and monitoring of an obligor's ability to meet contractual obligations rather than relying on the past due status, which is generally a lagging indicator of credit quality. For further discussion, see Note 14 of JPMorgan Chase 's 2016 Annual Report . |
(c) | Represents loans that are considered well-collateralized and therefore still accruing interest. |
(d) | Includes loans to: individuals; SPEs; and private education and civic organizations. For more information on SPEs, see Note 16 of JPMorgan Chase 's 2016 Annual Report . |
136
The following table presents additional information on the real estate class of loans within the Wholesale portfolio segment for the periods indicated. For further information on real estate loans, see Note 14 of JPMorgan Chase 's 2016 Annual Report .
(in millions, except ratios) | Multifamily |
| Other commercial |
| Total real estate loans | |||||||||||||||
Sep 30, | | Dec 31, | |
| Sep 30, | | Dec 31, | |
| Sep 30, | | Dec 31, | | |||||||
Real estate retained loans | $ | 76,418 | | $ | 72,143 | |
| $ | 35,285 | | $ | 33,659 | |
| $ | 111,703 | | $ | 105,802 | |
Criticized exposure | 447 | | 539 | |
| 407 | | 459 | |
| 854 | | 998 | | ||||||
% of total criticized exposure to total real estate retained loans | 0.58 | % | 0.75 | % |
| 1.15 | % | 1.36 | % |
| 0.76 | % | 0.94 | % | ||||||
Criticized nonaccrual | $ | 70 | | $ | 57 | |
| $ | 89 | | $ | 143 | |
| $ | 159 | | $ | 200 | |
% of criticized nonaccrual loans to total real estate retained loans | 0.09 | % | 0.08 | % |
| 0.25 | % | 0.42 | % |
| 0.14 | % | 0.19 | % | ||||||
Wholesale impaired loans and loan modifications
Wholesale impaired loans consist of loans that have been placed on nonaccrual status and/or that have been modified in a TDR. All impaired loans are evaluated for an asset-specific allowance as described in Note 15 of JPMorgan Chase 's 2016 Annual Report .
(in millions) | Commercial and industrial |
| Real estate |
| Financial institutions |
| Government agencies |
| Other |
| Total retained loans |
| |||||||||||||||||||||||||||||||
Sep 30, | Dec 31, |
| Sep 30, | Dec 31, |
| Sep 30, | Dec 31, |
| Sep 30, | Dec 31, |
| Sep 30, | Dec 31, |
| Sep 30, |
| Dec 31, |
| |||||||||||||||||||||||||
Impaired loans |
|
|
|
|
|
|
|
|
|
|
|
|
|
|
|
|
|
|
| ||||||||||||||||||||||||
With an allowance | $ | 891 | | $ | 1,127 | |
| $ | 100 | | $ | 124 | |
| $ | 95 | | $ | 9 | |
| $ | - | | $ | - | |
| $ | 161 | | $ | 180 | |
| $ | 1,247 | |
| $ | 1,440 | |
|
Without an allowance (a) | 263 | | 414 | |
| 61 | | 87 | |
| - | | - | |
| - | | - | |
| 67 | | 76 | |
| 391 | |
| 577 | |
| ||||||||||||
Total impaired loans | $ | 1,154 | | $ | 1,541 | |
| $ | 161 | | $ | 211 | |
| $ | 95 | | $ | 9 | |
| $ | - | | $ | - | |
| $ | 228 | | $ | 256 | |
| $ | 1,638 | | (c) | $ | 2,017 | | (c) |
Allowance for loan losses related to impaired loans | $ | 292 | | $ | 260 | |
| $ | 11 | | $ | 18 | |
| $ | 7 | | $ | 3 | |
| $ | - | | $ | - | |
| $ | 53 | | $ | 61 | |
| $ | 363 | |
| $ | 342 | |
|
Unpaid principal balance of impaired loans (b) | 1,428 | | 1,754 | |
| 234 | | 295 | |
| 96 | | 12 | |
| - | | - | |
| 205 | | 284 | |
| 1,963 | |
| 2,345 | |
| ||||||||||||
(a) | When the discounted cash flows, collateral value or market price equals or exceeds the recorded investment in the loan, the loan does not require an allowance. This typically occurs when the impaired loans have been partially charged-off and/or there have been interest payments received and applied to the loan balance. |
(b) | Represents the contractual amount of principal owed at September 30, 2017 , and December 31, 2016 . The unpaid principal balance differs from the impaired loan balances due to various factors, including charge-offs; interest payments received and applied to the carrying value; net deferred loan fees or costs; and unamortized discount or premiums on purchased loans. |
(c) | Based upon the domicile of the borrower, largely consists of loans in the U.S. |
| Three months ended September 30, |
| Nine months ended September 30, | ||||||||||
(in millions) | 2017 | | 2016 | |
| 2017 | | 2016 | | ||||
Commercial and industrial | $ | 1,042 | | $ | 1,489 | |
| $ | 1,002 | | $ | 1,437 | |
Real estate | 184 | | 210 | |
| 168 | | 227 | | ||||
Financial institutions | 19 | | 16 | |
| 9 | | 13 | | ||||
Government agencies | - | | - | |
| - | | - | | ||||
Other | 200 | | 213 | |
| 204 | | 197 | | ||||
Total (a) | $ | 1,445 | | $ | 1,928 | |
| $ | 1,383 | | $ | 1,874 | |
(a) | The related interest income on accruing impaired loans and interest income recognized on a cash basis were not material for the three and nine months ended September 30, 2017 and 2016 . |
Certain loan modifications are considered to be TDRs as they provide various concessions to borrowers who are experiencing financial difficulty. All TDRs are reported as impaired loans in the tables above. TDRs were $699 million and $733 million as of September 30, 2017 , and December 31, 2016 , respectively.
137
Note 12 – Allowance for credit losses
For detailed discussion of the allowance for credit losses and the related accounting policies, see Note 15 of JPMorgan Chase 's 2016 Annual Report . During the second quarter of 2017, the Firm refined its loss estimates relating to the wholesale portfolio by incorporating the use of internal historical data versus external credit rating agency default statistics to estimate PD. In addition, an adjustment to the modeled loss estimates for wholesale lending-related commitments was incorporated similar to the adjustment applied for wholesale loans. The impacts of these refinements were not material to the allowance for credit losses.
Allowance for credit losses and related information
The table below summarizes information about the allowances for loan losses and lending-related commitments, and includes a breakdown of loans and lending-related commitments by impairment methodology.
| 2017 |
| 2016 | ||||||||||||||||||||||||
Nine months ended September 30, | Consumer, excluding credit card | Credit card |
| Wholesale | Total |
| Consumer, excluding credit card | Credit card |
| Wholesale | Total | ||||||||||||||||
Allowance for loan losses |
|
|
|
|
|
|
|
|
|
|
| ||||||||||||||||
Beginning balance at January 1, | $ | 5,198 | | $ | 4,034 | |
| $ | 4,544 | | $ | 13,776 | |
| 5,806 | | $ | 3,434 | |
| $ | 4,315 | | $ | 13,555 | | |
Gross charge-offs | 1,479 | | 3,344 | |
| 154 | | 4,977 | |
| 1,071 | | 2,803 | |
| 291 | | 4,165 | | ||||||||
Gross recoveries | (478 | ) | (295 | ) |
| (81 | ) | (854 | ) |
| (448 | ) | (275 | ) |
| (30 | ) | (753 | ) | ||||||||
Net charge-offs | 1,001 | | 3,049 | |
| 73 | | 4,123 | |
| 623 | | 2,528 | |
| 261 | | 3,412 | | ||||||||
Write-offs of PCI loans (a) | 66 | | - | |
| - | | 66 | |
| 124 | | - | |
| - | | 124 | | ||||||||
Provision for loan losses | 653 | | 3,699 | |
| (401 | ) | 3,951 | |
| 578 | | 2,978 | |
| 628 | | 4,184 | | ||||||||
Other | (2 | ) | - | |
| 3 | | 1 | |
| - | | - | |
| 1 | | 1 | | ||||||||
Ending balance at September 30, | $ | 4,782 | | $ | 4,684 | |
| $ | 4,073 | | $ | 13,539 | |
| $ | 5,637 | | $ | 3,884 | |
| $ | 4,683 | | $ | 14,204 | |
|
|
|
|
|
|
|
|
|
|
|
| ||||||||||||||||
Allowance for loan losses by impairment methodology |
|
|
|
|
|
|
|
|
|
|
| ||||||||||||||||
Asset-specific (b) | $ | 271 | | $ | 376 | | (d) | $ | 363 | | $ | 1,010 | |
| $ | 352 | | $ | 363 | | (c) | $ | 490 | | $ | 1,205 | |
Formula-based | 2,266 | | 4,308 | |
| 3,710 | | 10,284 | |
| 2,667 | | 3,521 | |
| 4,193 | | 10,381 | | ||||||||
PCI | 2,245 | | - | |
| - | | 2,245 | |
| 2,618 | | - | |
| - | | 2,618 | | ||||||||
Total allowance for loan losses | $ | 4,782 | | $ | 4,684 | |
| $ | 4,073 | | $ | 13,539 | |
| $ | 5,637 | | $ | 3,884 | |
| $ | 4,683 | | $ | 14,204 | |
|
|
|
|
|
|
|
|
|
|
|
| ||||||||||||||||
Loans by impairment methodology |
|
|
|
|
|
|
|
|
|
|
| ||||||||||||||||
Asset-specific | $ | 8,147 | | $ | 1,206 | |
| $ | 1,638 | | $ | 10,991 | |
| $ | 9,145 | | $ | 1,264 | |
| $ | 2,233 | | $ | 12,642 | |
Formula-based | 329,445 | | 139,994 | |
| 396,928 | | 866,367 | |
| 317,208 | | 132,082 | |
| 384,213 | | 833,503 | | ||||||||
PCI | 31,821 | | - | |
| 3 | | 31,824 | |
| 37,045 | | - | |
| 3 | | 37,048 | | ||||||||
Total retained loans | $ | 369,413 | | $ | 141,200 | |
| $ | 398,569 | | $ | 909,182 | |
| $ | 363,398 | | $ | 133,346 | |
| $ | 386,449 | | $ | 883,193 | |
|
|
|
|
|
|
|
|
|
|
|
| ||||||||||||||||
Impaired collateral-dependent loans |
|
|
|
|
|
|
|
|
|
|
| ||||||||||||||||
Net charge-offs | $ | 47 | | $ | - | |
| $ | 30 | | $ | 77 | |
| $ | 63 | | $ | - | |
| $ | 7 | | $ | 70 | |
Loans measured at fair value of collateral less cost to sell | 2,198 | | - | |
| 250 | | 2,448 | |
| 2,371 | | - | |
| 346 | | 2,717 | | ||||||||
|
|
|
|
|
|
|
|
|
|
|
| ||||||||||||||||
Allowance for lending-related commitments |
|
|
|
|
|
|
|
|
|
|
| ||||||||||||||||
Beginning balance at January 1, | $ | 26 | | $ | - | |
| $ | 1,052 | | $ | 1,078 | |
| $ | 14 | | $ | - | |
| $ | 772 | | $ | 786 | |
Provision for lending-related commitments | 7 | | - | |
| 24 | | 31 | |
| - | | - | |
| 313 | | 313 | | ||||||||
Other | - | | - | |
| - | | - | |
| - | | - | |
| 1 | | 1 | | ||||||||
Ending balance at September 30, | $ | 33 | | $ | - | |
| $ | 1,076 | | $ | 1,109 | |
| $ | 14 | | $ | - | |
| $ | 1,086 | | $ | 1,100 | |
|
|
|
|
|
|
|
|
|
|
|
| ||||||||||||||||
Allowance for lending-related commitments by impairment methodology |
|
|
|
|
|
|
|
|
|
|
| ||||||||||||||||
Asset-specific | $ | - | | $ | - | |
| $ | 220 | | $ | 220 | |
| $ | - | | $ | - | |
| $ | 162 | | $ | 162 | |
Formula-based | 33 | | - | |
| 856 | | 889 | |
| 14 | | - | |
| 924 | | 938 | | ||||||||
Total allowance for lending-related commitments | $ | 33 | | $ | - | |
| $ | 1,076 | | $ | 1,109 | |
| $ | 14 | | $ | - | |
| $ | 1,086 | | $ | 1,100 | |
|
|
|
|
|
|
|
|
|
|
|
| ||||||||||||||||
Lending-related commitments by impairment methodology |
|
|
|
|
|
|
|
|
|
|
| ||||||||||||||||
Asset-specific | $ | - | | $ | - | |
| $ | 764 | | $ | 764 | |
| $ | - | | $ | - | |
| $ | 503 | | $ | 503 | |
Formula-based | 55,071 | | 574,641 | |
| 371,616 | | 1,001,328 | |
| 59,990 | | 549,634 | |
| 368,484 | | 978,108 | | ||||||||
Total lending-related commitments | $ | 55,071 | | $ | 574,641 | |
| $ | 372,380 | | $ | 1,002,092 | |
| $ | 59,990 | | $ | 549,634 | |
| $ | 368,987 | | $ | 978,611 | |
Note: In the first quarter of 2017, the Firm transferred the student loan portfolio to held-for-sale. For additional information see Note 23.
(a) | Write-offs of PCI loans are recorded against the allowance for loan losses when actual losses for a pool exceed estimated losses that were recorded as purchase accounting adjustments at the time of acquisition. A write-off of a PCI loan is recognized when the underlying loan is removed from a pool (e.g., upon liquidation). |
(b) | Includes risk-rated loans that have been placed on nonaccrual status and loans that have been modified in a TDR. |
(c) | The asset-specific credit card allowance for loan losses is related to loans that have been modified in a TDR; such allowance is calculated based on the loans' original contractual interest rates and does not consider any incremental penalty rates. |
138
Note 13 – Variable interest entities
For a further description of JPMorgan Chase's accounting policies regarding consolidation of VIEs, see Note 1 of JPMorgan Chase's 2016 Annual Report .
The following table summarizes the most significant types of Firm-sponsored VIEs by business segment.
Line of Business | Transaction Type | Activity | Form 10-Q page reference |
CCB | Credit card securitization trusts | Securitization of both originated and purchased credit card receivables | 139 |
| Mortgage securitization trusts | Servicing and securitization of both originated and purchased residential mortgages | 139–141 |
CIB | Mortgage and other securitization trusts | Securitization of both originated and purchased residential and commercial mortgages, and student loans | 139–141 |
| Multi-seller conduits Investor intermediation activities | Assist clients in accessing the financial markets in a cost-efficient manner and structures transactions to meet investor needs | 141 |
The Firm also invests in and provides financing and other services to VIEs sponsored by third parties, as described on page 141 of this Note.
Significant Firm-sponsored VIEs
Credit card securitizations
For a more detailed discussion of JPMorgan Chase's involvement with credit card securitizations, see Note 16 of JPMorgan Chase's 2016 Annual Report .
As a result of the Firm's continuing involvement, the Firm is considered to be the primary beneficiary of its Firm-sponsored credit card securitization trusts, including its primary vehicle, the Chase Issuance Trust. See the table on page 142 of this Note for further information on consolidated VIE assets and liabilities.
Firm-sponsored mortgage and other securitization trusts
The Firm securitizes (or has securitized) originated and purchased residential mortgages, commercial mortgages and other consumer loans (including student loans) primarily in its CCB and CIB businesses. Depending on the particular transaction, as well as the respective business involved, the Firm may act as the servicer of the loans and/or retain certain beneficial interests in the securitization trusts.
For a detailed discussion of the Firm's involvement with Firm-sponsored mortgage and other securitization trusts, as well as the accounting treatment relating to such trusts, see Note 16 of JPMorgan Chase's 2016 Annual Report .
139
The following table presents the total unpaid principal amount of assets held in Firm-sponsored private-label securitization entities, including those in which the Firm has continuing involvement, and those that are consolidated by the Firm. Continuing involvement includes servicing the loans, holding senior interests or subordinated interests, recourse or guarantee arrangements, and derivative transactions. In certain instances, the Firm's only continuing involvement is servicing the loans. See Securitization activity on page 142 of this Note for further information regarding the Firm's cash flows with and interests retained in nonconsolidated VIEs, and page 143 of this Note for information on the Firm's loan sales to U.S. government agencies.
| Principal amount outstanding |
| JPMorgan Chase interest in securitized assets in nonconsolidated VIEs (c)(d)(e) | ||||||||||||||||
September 30, 2017 (in millions) | Total assets held by securitization VIEs | Assets | Assets held in nonconsolidated securitization VIEs with continuing involvement |
| Trading assets | AFS securities | Total interests held by JPMorgan | ||||||||||||
Securitization-related (a) |
|
|
|
|
|
|
| ||||||||||||
Residential mortgage: |
|
|
|
|
|
|
| ||||||||||||
Prime/Alt-A and option ARMs | $ | 69,534 | | $ | 3,795 | | $ | 51,666 | |
| $ | 348 | | $ | 1,021 | | $ | 1,369 | |
Subprime | 19,592 | | - | | 18,164 | |
| 94 | | - | | 94 | | ||||||
Commercial and other (b) | 92,078 | | 140 | | 65,043 | |
| 583 | | 1,309 | | 1,892 | | ||||||
Total | $ | 181,204 | | $ | 3,935 | | $ | 134,873 | |
| $ | 1,025 | | $ | 2,330 | | $ | 3,355 | |
| Principal amount outstanding |
| JPMorgan Chase interest in securitized assets in nonconsolidated VIEs (c)(d)(e) | ||||||||||||||||
December 31, 2016 (in millions) | Total assets held by securitization VIEs | Assets held in consolidated securitization VIEs | Assets held in nonconsolidated securitization VIEs with continuing involvement |
| Trading assets | AFS securities | Total interests held by JPMorgan Chase | ||||||||||||
Securitization-related (a) |
|
|
|
|
|
|
| ||||||||||||
Residential mortgage: |
|
|
|
|
|
|
| ||||||||||||
Prime/Alt-A and option ARMs | $ | 76,789 | | $ | 4,209 | | $ | 57,543 | |
| $ | 226 | | $ | 1,334 | | $ | 1,560 | |
Subprime | 21,542 | | - | | 19,903 | |
| 76 | | - | | 76 | | ||||||
Commercial and other (b) | 101,265 | | 107 | | 71,464 | |
| 509 | | 2,064 | | 2,573 | | ||||||
Total | $ | 199,596 | | $ | 4,316 | | $ | 148,910 | |
| $ | 811 | | $ | 3,398 | | $ | 4,209 | |
(a) | Excludes U.S. government agency securitizations and re-securitizations, which are not Firm-sponsored. See page 143 of this Note for information on the Firm's loan sales to U.S. government agencies. |
(b) | Consists of securities backed by commercial loans (predominantly real estate) and non-mortgage-related consumer receivables purchased from third parties. |
(c) | Excludes the following: retained servicing (see Note 14 for a discussion of MSRs); securities retained from loan sales to U.S. government agencies; interest rate and foreign exchange derivatives primarily used to manage interest rate and foreign exchange risks of securitization entities (See Note 4 for further information on derivatives); senior and subordinated securities of $198 million and $23 million , respectively, at September 30, 2017 , and $180 million and $49 million , respectively, at December 31, 2016 , which the Firm purchased in connection with CIB's secondary market-making activities. |
(d) | Includes interests held in re-securitization transactions. |
(e) | As of September 30, 2017 , and December 31, 2016 , 63% and 61% , respectively, of the Firm's retained securitization interests, which are carried at fair value and include amounts required to be held pursuant to credit risk retention rules, were risk-rated "A" or better, on an S&P-equivalent basis. The retained interests in prime residential mortgages consisted of $1.3 billion and $1.5 billion of investment-grade and $94 million and $77 million of noninvestment-grade retained interests at September 30, 2017 , and December 31, 2016 , respectively. The retained interests in commercial and other securitization trusts consisted of $1.7 billion and $2.4 billion of investment-grade and $235 million and $210 million of noninvestment-grade retained interests at September 30, 2017 , and December 31, 2016 , respectively. |
140
Residential mortgage
The Firm securitizes residential mortgage loans originated by CCB , as well as residential mortgage loans purchased from third parties by either CCB or CIB . For a more detailed description of the Firm's involvement with residential mortgage securitizations, see Note 16 of JPMorgan Chase's 2016 Annual Report . See the table on page 142 of this Note for more information on the consolidated residential mortgage securitizations, and the table on the previous page of this Note for further information on interests held in nonconsolidated residential mortgage securitizations.
Commercial mortgages and other consumer securitizations
CIB originates and securitizes commercial mortgage loans, and engages in underwriting and trading activities involving the securities issued by securitization trusts. For a more detailed description of the Firm's involvement with commercial mortgage and other consumer securitizations, see Note 16 of JPMorgan Chase's 2016 Annual Report . See the table on page 142 of this Note for more information on the consolidated commercial mortgage securitizations, and the table on the previous page of this Note for further information on interests held in nonconsolidated securitizations.
Re-securitizations
For a more detailed description of JPMorgan Chase's participation in certain re-securitization transactions, see Note 16 of JPMorgan Chase's 2016 Annual Report.
The following table represents the transfers of securities to re-securitization VIEs.
| Three months ended |
| Nine months ended | ||||||||||||
(in millions) | 2017 | |
| 2016 | |
| 2017 | |
| 2016 | | ||||
Transfers of securities to VIEs |
|
|
|
|
|
|
| ||||||||
Firm-sponsored private-label | $ | - | |
| $ | 503 | |
| $ | - | |
| $ | 647 | |
Agency | $ | 1,477 | |
| $ | 1,237 | |
| $ | 6,163 | |
| $ | 7,587 | |
The following table represents information on nonconsolidated re-securitization VIEs.
| Nonconsolidated re-securitization VIEs | ||||||
(in millions) | September 30, 2017 | |
| December 31, 2016 | | ||
Firm-sponsored private-label |
|
|
| ||||
Assets held in VIEs with continuing involvement (a) | $ | 860 | |
| $ | 875 | |
Interest in VIEs | 26 | |
| 43 | | ||
Agency |
|
|
| ||||
Interest in VIEs | 1,593 | |
| 1,986 | | ||
(a) | Includes the notional amount of interest-only securities. |
As of September 30, 2017 , and December 31, 2016 , the Firm did not consolidate any Firm-sponsored private-label re-securitizations and agency re-securitizations.
Multi-seller conduits
For a more detailed description of JPMorgan Chase's principal involvement with Firm -administered multi-seller conduits, see Note 16 of JPMorgan Chase's 2016 Annual Report .
In the normal course of business, JPMorgan Chase makes markets in and invests in commercial paper issued by the Firm -administered multi-seller conduits. The Firm held $21.8 billion and $21.2 billion of the commercial paper issued by the Firm -administered multi-seller conduits at September 30, 2017 , and December 31, 2016 respectively, which have been eliminated in consolidation. The Firm's investments reflect the Firm's funding needs and capacity and were not driven by market illiquidity. Other than the amounts required to be held pursuant to credit risk retention rules, the Firm is not obligated under any agreement to purchase the commercial paper issued by the Firm -administered multi-seller conduits.
Deal-specific liquidity facilities, program-wide liquidity and credit enhancement provided by the Firm have been eliminated in consolidation. The Firm or the Firm-administered multi-seller conduits provide lending-related commitments to certain clients of the Firm-administered multi-seller conduits. The unfunded commitments were $7.3 billion and $7.4 billion at September 30, 2017 , and December 31, 2016 , respectively, and are reported as off-balance sheet lending-related commitments. For more information on off-balance sheet lending-related commitments, see Note 19 .
VIEs associated with investor intermediation activities
Municipal bond vehicles
For a more detailed description of JPMorgan Chase's investor intermediation activities, see Note 16 of JPMorgan Chase's 2016 Annual Report .
The Firm's maximum exposure as a liquidity provider to nonconsolidated Firm -sponsored municipal bond VIEs at September 30, 2017 and December 31, 2016 , was zero and $662 million , respectively.
VIEs sponsored by third parties
The Firm enters into transactions with VIEs structured by other parties. These include, for example, acting as a derivative counterparty, liquidity provider, investor, underwriter, placement agent, remarketing agent, trustee or custodian. These transactions are conducted at arm's-length, and individual credit decisions are based on the analysis of the specific VIE, taking into consideration the quality of the underlying assets. Where the Firm does not have the power to direct the activities of the VIE that most significantly impact the VIE's economic performance, or a variable interest that could potentially be significant, the Firm records and reports these positions on its Consolidated balance sheets in the same manner it would record and report positions in respect of any other third-party transaction.
141
Consolidated VIE assets and liabilities
The following table presents information on assets and liabilities related to VIEs consolidated by the Firm as of September 30, 2017 , and December 31, 2016 .
| Assets |
| Liabilities | |||||||||||||||||||
September 30, 2017 (in millions) | Trading assets | Loans | | Other (d) | | Total assets (e) |
| Beneficial interests in VIE assets (f) | Other (g) | | Total liabilities | |||||||||||
VIE program type (a) |
|
|
|
|
|
|
|
| ||||||||||||||
Firm-sponsored credit card trusts | $ | - | | $ | 40,706 | | $ | 666 | | $ | 41,372 | |
| $ | 23,473 | | $ | 16 | | $ | 23,489 | |
Firm-administered multi-seller conduits | 1 | | 24,504 | | 44 | | 24,549 | |
| 2,923 | | 25 | | 2,948 | | |||||||
Municipal bond vehicles | 1,374 | | - | | 6 | | 1,380 | |
| 1,452 | | 2 | | 1,454 | | |||||||
Mortgage securitization entities (b) | 151 | | 3,842 | | 53 | | 4,046 | |
| 441 | | 260 | | 701 | | |||||||
Student loan securitization entities (c) | - | | - | | - | | - | |
| - | | - | | - | | |||||||
Other | 69 | | - | | 1,929 | | 1,998 | |
| 135 | | 109 | | 244 | | |||||||
Total | $ | 1,595 | | $ | 69,052 | | $ | 2,698 | | $ | 73,345 | |
| $ | 28,424 | | $ | 412 | | $ | 28,836 | |
|
|
|
|
|
|
|
|
| ||||||||||||||
| Assets |
| Liabilities | |||||||||||||||||||
December 31, 2016 (in millions) | Trading assets | Loans | | Other (d) | | Total assets (e) |
| Beneficial interests in VIE assets (f) | Other (g) | | Total liabilities | |||||||||||
VIE program type (a) |
|
|
|
|
|
|
|
| ||||||||||||||
Firm-sponsored credit card trusts | $ | - | | $ | 45,919 | | $ | 790 | | $ | 46,709 | |
| $ | 31,181 | | $ | 18 | | $ | 31,199 | |
Firm-administered multi-seller conduits | - | | 23,760 | | 43 | | 23,803 | |
| 2,719 | | 33 | | 2,752 | | |||||||
Municipal bond vehicles | 2,897 | | - | | 8 | | 2,905 | |
| 2,969 | | 2 | | 2,971 | | |||||||
Mortgage securitization entities (b) | 143 | | 4,246 | | 103 | | 4,492 | |
| 468 | | 313 | | 781 | | |||||||
Student loan securitization entities (c) | - | | 1,689 | | 59 | | 1,748 | |
| 1,527 | | 4 | | 1,531 | | |||||||
Other | 145 | | - | | 2,318 | | 2,463 | |
| 183 | | 120 | | 303 | | |||||||
Total | $ | 3,185 | | $ | 75,614 | | $ | 3,321 | | $ | 82,120 | |
| $ | 39,047 | | $ | 490 | | $ | 39,537 | |
(a) | Excludes intercompany transactions which are eliminated in consolidation. |
(b) | Includes residential and commercial mortgage securitizations. |
(c) | The Firm deconsolidated the student loan securitization entities in the second quarter of 2017 as it no longer had a controlling financial interest in these entities as a result of the sale of the student loan portfolio. For additional information see Note 23. |
(d) | Includes assets classified as cash and other assets on the Consolidated balance sheets. |
(e) | The assets of the consolidated VIEs included in the program types above are used to settle the liabilities of those entities. The difference between total assets and total liabilities recognized for consolidated VIEs represents the Firm's interest in the consolidated VIEs for each program type. |
(f) | The interest-bearing beneficial interest liabilities issued by consolidated VIEs are classified in the line item on the Consolidated balance sheets titled, "Beneficial interests issued by consolidated VIEs." The holders of these beneficial interests do not have recourse to the general credit of JPMorgan Chase . Included in beneficial interests in VIE assets are long-term beneficial interests of $24.0 billion and $33.4 billion at September 30, 2017 , and December 31, 2016 , respectively. The maturities of the long-term beneficial interests as of September 30, 2017 , were as follows: $10.7 billion under one year, $13.0 billion between one and five years, and $0.3 billion over five years. |
(g) | Includes liabilities classified as accounts payable and other liabilities on the Consolidated balance sheets. |
Loan securitizations
The Firm has securitized and sold a variety of loans, including residential mortgage, credit card, student and commercial (primarily related to real estate) loans. For a further description of the Firm's accounting policies regarding securitizations, see Note 16 of JPMorgan Chase's 2016 Annual Report .
142
Securitization activity
The following table provides information related to the Firm's securitization activities for the three and nine months ended September 30, 2017 and 2016 , related to assets held in Firm -sponsored securitization entities that were not consolidated by the Firm, and where sale accounting was achieved based on the accounting rules in effect at the time of the securitization.
| Three months ended September 30, |
| Nine months ended September 30, | ||||||||||||||||||||||||
| 2017 |
| 2016 |
| 2017 |
| 2016 | ||||||||||||||||||||
(in millions) | Residential mortgage (c) | Commercial and other (d) |
| Residential mortgage (c) | Commercial and other (d) |
| Residential mortgage (c) | Commercial and other (d) |
| Residential mortgage (c) | Commercial and other (d) | ||||||||||||||||
Principal securitized | $ | 1,017 | | $ | 4,411 | |
| $ | 698 | | $ | 3,428 | |
| $ | 3,066 | | $ | 7,723 | |
| $ | 1,111 | | $ | 5,786 | |
All cash flows during the period (a) : |
|
|
|
|
|
|
|
|
|
|
| ||||||||||||||||
Proceeds from loan sales as securities |
|
|
|
|
|
|
|
|
|
|
| ||||||||||||||||
Level 2 | $ | 1,049 | | $ | 4,419 | |
| $ | 709 | | $ | 3,551 | |
| $ | 3,132 | | $ | 7,796 | |
| $ | 1,122 | | $ | 5,924 | |
Level 3 | 4 | | - | |
| - | | - | |
| 4 | | - | |
| - | | 2 | | ||||||||
Total proceeds received from loan sales | $ | 1,053 | | $ | 4,419 | |
| $ | 709 | | $ | 3,551 | |
| $ | 3,136 | | $ | 7,796 | |
| $ | 1,122 | | $ | 5,926 | |
Servicing fees collected | 128 | | 1 | |
| 111 | | 1 | |
| 395 | | 3 | |
| 334 | | 2 | | ||||||||
Purchases of previously transferred financial assets (or the underlying collateral) (b) | - | | - | |
| - | | - | |
| 1 | | - | |
| 37 | | - | | ||||||||
Cash flows received on interests | 125 | | 287 | |
| 121 | | 535 | |
| 384 | | 828 | |
| 326 | | 1,115 | | ||||||||
(a) | Excludes re-securitization transactions. |
(b) | Includes cash paid by the Firm to reacquire assets from off–balance sheet, nonconsolidated entities – for example, loan repurchases due to representation and warranties and servicer clean-up calls. |
(c) | Includes prime, Alt-A, subprime, and option ARMs. Excludes certain loan securitization transactions entered into with Ginnie Mae, Fannie Mae and Freddie Mac. |
(d) | Includes commercial mortgage and student loan securitizations. |
Loans and excess MSRs sold to U.S. government-sponsored enterprises, loans in securitization transactions pursuant to Ginnie Mae guidelines, and other third-party-sponsored securitization entities
In addition to the amounts reported in the securitization activity tables above, the Firm, in the normal course of business, sells originated and purchased mortgage loans and certain originated excess MSRs on a nonrecourse basis, predominantly to U.S. government-sponsored enterprises (" U.S. GSEs"). These loans and excess MSRs are sold primarily for the purpose of securitization by the U.S. GSEs, who provide certain guarantee provisions (e.g., credit enhancement of the loans). The Firm also sells loans into securitization transactions pursuant to Ginnie Mae guidelines; these loans are typically insured or guaranteed by another U.S. government agency. The Firm does not consolidate the securitization vehicles underlying these transactions as it is not the primary beneficiary. For a limited number of loan sales, the Firm is obligated to share a portion of the credit risk associated with the sold loans with the purchaser. See Note 19 of this Form 10-Q, and Note 29 of JPMorgan Chase's 2016 Annual Report for additional information about the Firm's loan sales- and securitization-related indemnifications. See Note 14 for additional information about the impact of the Firm 's sale of certain excess MSRs. The following table summarizes the activities related to loans sold to the U.S. GSEs, loans in securitization transactions pursuant to Ginnie Mae guidelines, and other third-party-sponsored securitization entities.
| Three months ended September 30, |
| Nine months ended September 30, | ||||||||||
(in millions) | 2017 | | 2016 | |
| 2017 | 2016 | ||||||
Carrying value of loans sold | $ | 15,402 | | $ | 14,811 | |
| $ | 44,282 | | $ | 32,647 | |
Proceeds received from loan sales as cash | 104 | | 68 | |
| 117 | | 306 | | ||||
Proceeds received from loan sales as securities (a) | 15,093 | | 14,610 | |
| 43,682 | | 32,113 | | ||||
Total proceeds received from loan sales (b) | $ | 15,197 | | $ | 14,678 | |
| $ | 43,799 | | $ | 32,419 | |
Gains on loan sales (c)(d) | $ | 41 | | $ | 50 | |
| $ | 114 | | $ | 164 | |
(a) | Predominantly includes securities from U.S. GSEs and Ginnie Mae that are generally sold shortly after receipt. |
(b) | Excludes the value of MSRs retained upon the sale of loans. |
(c) | Gains on loan sales include the value of MSRs. |
(d) | The carrying value of the loans accounted for at fair value approximated the proceeds received upon loan sale. |
143
Options to repurchase delinquent loans
In addition to the Firm's obligation to repurchase certain loans due to material breaches of representations and warranties as discussed in Note 19 , the Firm also has the option to repurchase delinquent loans that it services for Ginnie Mae loan pools, as well as for other U.S. government agencies under certain arrangements . The Firm typically elects to repurchase delinquent loans from Ginnie Mae loan pools as it continues to service them and/or manage the foreclosure process in accordance with the applicable requirements, and such loans continue to be insured or guaranteed. When the Firm's repurchase option becomes exercisable, such loans must be reported on the Consolidated balance sheets as a loan with a corresponding liability. For additional information, refer to Note 11 of this Form 10-Q and Note 14 of JPMorgan Chase's 2016 Annual Report.
The following table presents loans the Firm repurchased or had an option to repurchase, real estate owned, and foreclosed government-guaranteed residential mortgage loans recognized on the Firm's Consolidated balance sheets as of September 30, 2017 and December 31, 2016 . Substantially all of these loans and real estate are insured or guaranteed by U.S. government agencies.
(in millions) | Sept 30, 2017 | | Dec 31, | | ||
Loans repurchased or option to repurchase (a) | $ | 8,424 | | $ | 9,556 | |
Real estate owned | 99 | | 142 | | ||
Foreclosed government-guaranteed residential mortgage loans (b) | 625 | | 1,007 | | ||
(a) | Predominantly all of these amounts relate to loans that have been repurchased from Ginnie Mae loan pools. |
(b) | Relates to voluntary repurchases of loans, which are included in accrued interest and accounts receivable. |
Loan delinquencies and liquidation losses
The table below includes information about components of nonconsolidated securitized financial assets held in Firm -sponsored private-label securitization entities, in which the Firm has continuing involvement, and delinquencies as of September 30, 2017 , and December 31, 2016 .
|
|
|
|
| Liquidation losses | ||||||||||||||||||||||
| Securitized assets |
| 90 days past due |
| Three months ended September 30, |
| Nine months ended September 30, | ||||||||||||||||||||
(in millions) | Sep 30, | | Dec 31, | |
| Sep 30, | | Dec 31, | |
| 2017 | | 2016 | |
| 2017 | 2016 | ||||||||||
Securitized loans |
|
|
|
|
|
|
|
|
|
|
| ||||||||||||||||
Residential mortgage: |
|
|
|
|
|
|
|
|
|
|
| ||||||||||||||||
Prime / Alt-A & option ARMs | $ | 51,666 | | $ | 57,543 | |
| $ | 5,039 | | $ | 6,169 | |
| $ | 184 | | $ | 275 | |
| $ | 622 | | $ | 933 | |
Subprime | 18,164 | | 19,903 | |
| 3,435 | | 4,186 | |
| 153 | | 280 | |
| 529 | | 898 | | ||||||||
Commercial and other | 65,043 | | 71,464 | |
| 1,027 | | 1,755 | |
| 2 | | 78 | |
| 59 | | 564 | | ||||||||
Total loans securitized | $ | 134,873 | | $ | 148,910 | |
| $ | 9,501 | | $ | 12,110 | |
| $ | 339 | | $ | 633 | |
| $ | 1,210 | | $ | 2,395 | |
144
Note
14 – Goodwill and Mortgage servicing rights
For a discussion of the accounting policies related to goodwill and mortgage servicing rights, see Note 17 of JPMorgan Chase 's 2016 Annual Report .
Goodwill
The following table presents goodwill attributed to the business segments.
(in millions) | September 30, | | December 31, | | ||
Consumer & Community Banking | $ | 30,815 | | $ | 30,797 | |
Corporate & Investment Bank | 6,776 | | 6,772 | | ||
Commercial Banking | 2,860 | | 2,861 | | ||
Asset & Wealth Management | 6,858 | | 6,858 | | ||
Total goodwill | $ | 47,309 | | $ | 47,288 | |
The following table presents changes in the carrying amount of goodwill.
| Three months ended September 30, |
| Nine months ended September 30, | ||||||||||||
(in millions) | 2017 | |
| 2016 | |
| 2017 | |
| 2016 | | ||||
Balance at beginning of period | $ | 47,300 | |
| $ | 47,303 | |
| $ | 47,288 | |
| $ | 47,325 | |
Changes during the period from: |
|
|
|
|
|
|
| ||||||||
Dispositions (a) | - | |
| - | |
| - | | | (71 | ) | ||||
Other (b) | 9 | |
| (1 | ) |
| 21 | |
| 48 | | ||||
Balance at September 30, | $ | 47,309 | |
| $ | 47,302 | |
| $ | 47,309 | |
| $ | 47,302 | |
(a) | During the nine months ended September 30, 2016 , represents AWM goodwill, which was disposed of as part of AWM sales completed in March 2016. |
(b) | Includes foreign currency translation adjustments and other tax-related adjustments. |
Goodwill Impairment testing
For further description of the Firm's goodwill impairment testing, including the primary method used to estimate the fair value of the reporting units, and the assumptions used in the goodwill impairment test, see Impairment testing on pages 240–241 of JPMorgan Chase 's 2016 Annual Report .
Goodwill was not impaired at September 30, 2017 , or December 31, 2016 , nor was goodwill written off due to impairment during the nine months ended September 30, 2017 or 2016.
Declines in business performance, increases in credit losses, increases in equity capital requirements, as well as deterioration in economic or market conditions, estimates of adverse regulatory or legislative changes or increases in the estimated market cost of equity, could cause the estimated fair values of the Firm's reporting units or their associated goodwill to decline in the future, which could result in a material impairment charge to earnings in a future period related to some portion of the associated goodwill.
145
Mortgage servicing rights
MSRs represent the fair value of expected future cash flows for performing servicing activities for others. The fair value considers estimated future servicing fees and ancillary revenue, offset by estimated costs to service the loans, and generally declines over time as net servicing cash flows are received, effectively amortizing the MSR asset against contractual servicing and ancillary fee income. MSRs are either purchased from third parties or recognized upon sale or securitization of mortgage loans if servicing is retained. For a further description of the MSR asset, interest rate risk management, and the valuation of MSRs, see Note 17 of JPMorgan Chase 's 2016 Annual Report and Note 2 of this Form 10-Q .
| As of or for the three months |
| As of or for the nine months |
| ||||||||||||
(in millions, except where otherwise noted) | 2017 | |
| 2016 | |
| 2017 | |
| 2016 | |
| ||||
Fair value at beginning of period | $ | 5,753 | |
| $ | 5,072 | |
| $ | 6,096 | |
| $ | 6,608 | |
|
MSR activity: |
|
|
|
|
|
|
|
| ||||||||
Originations of MSRs | 253 | |
| 190 | |
| 624 | |
| 410 | |
| ||||
Purchase of MSRs | - | |
| - | |
| - | |
| - | |
| ||||
Disposition of MSRs (a) | (2 | ) |
| (5 | ) |
| (140 | ) |
| (72 | ) |
| ||||
Net additions | 251 | |
| 185 | |
| 484 | |
| 338 | |
| ||||
|
|
|
|
|
|
|
|
| ||||||||
Changes due to collection/realization of expected cash flows | (200 | ) |
| (233 | ) |
| (619 | ) |
| (713 | ) |
| ||||
|
|
|
|
|
|
|
|
| ||||||||
Changes in valuation due to inputs and assumptions: |
|
|
|
|
|
|
|
| ||||||||
Changes due to market interest rates and other (b) | (67 | ) |
| (35 | ) |
| (188 | ) |
| (1,230 | ) |
| ||||
Changes in valuation due to other inputs and assumptions: |
|
|
|
|
|
|
|
| ||||||||
Projected cash flows (e.g., cost to service) | (116 | ) |
| (21 | ) |
| (102 | ) |
| (28 | ) |
| ||||
Discount rates | - | |
| - | |
| (19 | ) |
| 7 | |
| ||||
Prepayment model changes and other (c) | 117 | |
| (31 | ) |
| 86 | |
| (45 | ) |
| ||||
Total changes in valuation due to other inputs and assumptions | 1 | |
| (52 | ) |
| (35 | ) |
| (66 | ) |
| ||||
Total changes in valuation due to inputs and assumptions | (66 | ) |
| (87 | ) |
| (223 | ) |
| (1,296 | ) |
| ||||
Fair value at September 30, | $ | 5,738 | |
| $ | 4,937 | |
| $ | 5,738 | |
| $ | 4,937 | |
|
|
|
|
|
|
|
|
|
| ||||||||
Change in unrealized gains/(losses) included in income related to MSRs held at September 30, | $ | (66 | ) |
| $ | (87 | ) |
| $ | (223 | ) |
| $ | (1,296 | ) |
|
Contractual service fees, late fees and other ancillary fees included in income | 463 | |
| 523 | |
| 1,427 | |
| 1,629 | |
| ||||
Third-party mortgage loans serviced at September 30, (in billions) | 558 | |
| 611 | |
| 558 | |
| 611 | |
| ||||
Net servicer advances at September 30, (in billions) (d) | 3.9 | |
| 5.0 | |
| 3.9 | |
| 5.0 | |
| ||||
(a) | Includes excess MSRs transferred to agency-sponsored trusts in exchange for stripped mortgage backed securities ("SMBS"). In each transaction, a portion of the SMBS was acquired by third parties at the transaction date; the Firm acquired the remaining balance of those SMBS as trading securities. |
(b) | Represents both the impact of changes in estimated future prepayments due to changes in market interest rates, and the difference between actual and expected prepayments. |
(c) | Represents changes in prepayments other than those attributable to changes in market interest rates. |
(d) | Represents amounts the Firm pays as the servicer (e.g., scheduled principal and interest, taxes and insurance), which will generally be reimbursed within a short period of time after the advance from future cash flows from the trust or the underlying loans. The Firm's credit risk associated with these servicer advances is minimal because reimbursement of the advances is typically senior to all cash payments to investors. In addition, the Firm maintains the right to stop payment to investors if the collateral is insufficient to cover the advance. However, certain of these servicer advances may not be recoverable if they were not made in accordance with applicable rules and agreements. |
146
The following table presents the components of mortgage fees and related income (including the impact of MSR risk management activities) for the three and nine months ended September 30, 2017 and 2016 .
|
| Three months ended September 30, |
| Nine months ended September 30, | ||||||||||||
(in millions) |
| 2017 | |
| 2016 | |
| 2017 | |
| 2016 | | ||||
CCB mortgage fees and related income |
|
|
|
|
|
|
|
| ||||||||
|
|
|
|
|
|
|
|
| ||||||||
Net production revenue |
| $ | 158 | |
| $ | 247 | |
| $ | 451 | |
| $ | 670 | |
|
|
|
|
|
|
|
|
| ||||||||
Net mortgage servicing revenue: |
|
|
|
|
|
|
|
| ||||||||
Operating revenue: |
|
|
|
|
|
|
|
| ||||||||
Loan servicing revenue |
| 493 | |
| 571 | |
| 1,533 | |
| 1,780 | | ||||
Changes in MSR asset fair value due to collection/realization of expected cash flows |
| (200 | ) |
| (232 | ) |
| (617 | ) |
| (710 | ) | ||||
Total operating revenue |
| 293 | |
| 339 | |
| 916 | |
| 1,070 | | ||||
Risk management: |
|
|
|
|
|
|
|
| ||||||||
Changes in MSR asset fair value due to market interest rates and other (a) |
| (67 | ) |
| (35 | ) |
| (188 | ) |
| (1,230 | ) | ||||
Other changes in MSR asset fair value due to other inputs and assumptions in model (b) |
| 1 | |
| (52 | ) |
| (35 | ) |
| (66 | ) | ||||
Change in derivative fair value and other |
| 43 | |
| 125 | |
| 91 | |
| 1,536 | | ||||
Total risk management |
| (23 | ) |
| 38 | |
| (132 | ) |
| 240 | | ||||
Total net mortgage servicing revenue |
| 270 | |
| 377 | |
| 784 | |
| 1,310 | | ||||
|
|
|
|
|
|
|
|
| ||||||||
Total CCB mortgage fees and related income |
| 428 | |
| 624 | |
| 1,235 | |
| 1,980 | | ||||
|
|
|
|
|
|
|
|
| ||||||||
All other |
| 1 | |
| - | |
| 4 | |
| - | | ||||
Mortgage fees and related income |
| $ | 429 | |
| $ | 624 | |
| $ | 1,239 | |
| $ | 1,980 | |
(a) | Represents both the impact of changes in estimated future prepayments due to changes in market interest rates, and the difference between actual and expected prepayments. |
(b) | Represents the aggregate impact of changes in model inputs and assumptions such as projected cash flows (e.g., cost to service), discount rates and changes in prepayments other than those attributable to changes in market interest rates (e.g., changes in prepayments due to changes in home prices). |
The table below outlines the key economic assumptions used to determine the fair value of the Firm's MSRs at September 30, 2017 , and December 31, 2016 , and outlines hypothetical sensitivities of those fair values to immediate adverse changes in those assumptions, as defined below.
(in millions, except rates) | Sep 30, | |
| Dec 31, | | |||
Weighted-average prepayment speed assumption ("CPR") | 9.60 | % |
| 9.41 | % | |||
Impact on fair value of 10% adverse change | $ | (220 | ) |
| $ | (231 | ) | |
Impact on fair value of 20% adverse change | (424 | ) |
| (445 | ) | |||
Weighted-average option adjusted spread | 9.17 | % |
| 8.55 | % | |||
Impact on fair value of a 100 basis point adverse change | $ | (239 | ) |
| $ | (248 | ) | |
Impact on fair value of a 200 basis point adverse change | (460 | ) |
| (477 | ) | |||
CPR: Constant prepayment rate.
Changes in fair value based on variation in assumptions generally cannot be easily extrapolated, because the relationship of the change in the assumptions to the change in fair value are often highly interrelated and may not be linear. In this table, the effect that a change in a particular assumption may have on the fair value is calculated without changing any other assumption. In reality, changes in one factor may result in changes in another, which could either magnify or counteract the impact of the initial change.
147
Note 15 – Deposits
For further discussion on deposits, see Note 19 of JPMorgan Chase's 2016 Annual Report.
At September 30, 2017 , and December 31, 2016 , noninterest-bearing and interest-bearing deposits were as follows.
(in millions) | September 30, | |
| December 31, 2016 | | ||
U.S. offices |
|
|
| ||||
Noninterest-bearing | $ | 390,863 | |
| $ | 400,831 | |
Interest-bearing (included $14,601 and $12,245 at fair value) (a) | 783,233 | |
| 737,949 | | ||
Total deposits in U.S. offices | 1,174,096 | |
| 1,138,780 | | ||
Non-U.S. offices |
|
|
| ||||
Noninterest-bearing | 17,907 | |
| 14,764 | | ||
Interest-bearing (included $6,556 and $1,667 at fair value) (a) | 247,024 | |
| 221,635 | | ||
Total deposits in non-U.S. offices | 264,931 | |
| 236,399 | | ||
Total deposits | $ | 1,439,027 | |
| $ | 1,375,179 | |
(a) | Includes structured notes classified as deposits for which the fair value option has been elected. For further discussion, see Note 3 of JPMorgan Chase's 2016 Annual Report . |
Note 16 – Earnings per share
For a discussion of the computation of basic and diluted earnings per share ("EPS"), see Note 24 of JPMorgan Chase 's 2016 Annual Report . The following table presents the calculation of basic and diluted EPS for the three and nine months ended September 30, 2017 and 2016 .
(in millions, except per share amounts) | Three months ended |
| Nine months ended | ||||||||||
2017 | | 2016 | |
| 2017 | | 2016 | | |||||
Basic earnings per share |
|
|
|
|
| ||||||||
Net income | $ | 6,732 | | $ | 6,286 | |
| $ | 20,209 | | $ | 18,006 | |
Less: Preferred stock dividends | 412 | | 412 | |
| 1,235 | | 1,235 | | ||||
Net income applicable to common equity | 6,320 | | 5,874 | |
| 18,974 | | 16,771 | | ||||
Less: Dividends and undistributed earnings allocated to participating securities (a) | 58 | | 62 | |
| 188 | | 187 | | ||||
Net income applicable to common stockholders (a) | $ | 6,262 | | $ | 5,812 | |
| $ | 18,786 | | $ | 16,584 | |
|
|
|
|
|
| ||||||||
Total weighted-average basic shares outstanding (a) | 3,534.7 | | 3,637.7 | |
| 3,570.9 | | 3,674.6 | | ||||
Net income per share | $ | 1.77 | | $ | 1.60 | |
| $ | 5.26 | | $ | 4.51 | |
|
|
|
|
|
| ||||||||
Diluted earnings per share |
|
|
|
|
| ||||||||
Net income applicable to common stockholders (a) | $ | 6,262 | | $ | 5,812 | |
| $ | 18,786 | | $ | 16,584 | |
Total weighted-average basic shares outstanding (a) | 3,534.7 | | 3,637.7 | |
| 3,570.9 | | 3,674.6 | | ||||
Add: Employee stock options, SARs, warrants and unvested PSUs | 24.9 | | 32.1 | |
| 26.1 | | 29.9 | | ||||
Total weighted-average diluted shares outstanding (a) | 3,559.6 | | 3,669.8 | |
| 3,597.0 | | 3,704.5 | | ||||
Net income per share | $ | 1.76 | | $ | 1.58 | |
| $ | 5.22 | | $ | 4.48 | |
(a) | The prior period amounts have been revised to conform with the current period presentation. The revision had no impact on the Firm's reported earnings per share. |
148
Note 17 – Accumulated other comprehensive income/(loss)
AOCI includes the after-tax change in unrealized gains and losses on investment securities, foreign currency translation adjustments (including the impact of related derivatives), cash flow hedging activities, net loss and prior service costs/(credit) related to the Firm's defined benefit pension and OPEB plans.
As of or for the three months ended | Unrealized |
| Translation adjustments, net of hedges |
| Cash flow hedges |
| Defined benefit | DVA on fair value option elected liabilities | Accumulated other comprehensive income/(loss) | |||||||||||||||||||||||||
Balance at July 1, 2017 |
| $ | 2,219 | |
|
|
| $ | (157 | ) |
|
|
| $ | 44 | |
|
|
| $ | (2,255 | ) |
|
| $ | (243 | ) |
|
| $ | (392 | ) |
| |
Net change |
| 147 | |
|
|
| - | |
|
|
| 26 | |
|
|
| 22 | |
|
| (112 | ) |
|
| 83 | |
| |||||||
Balance at September 30, 2017 |
| $ | 2,366 | |
|
|
| $ | (157 | ) |
|
|
| $ | 70 | |
|
|
| $ | (2,233 | ) |
|
| $ | (355 | ) |
|
| $ | (309 | ) |
| |
|
|
|
|
|
|
|
|
|
|
|
|
|
|
|
|
|
|
|
|
|
| |||||||||||||
As of or for the three months ended | Unrealized gains/(losses) on investment securities (b) |
| Translation adjustments, net of hedges |
| Cash flow hedges |
| Defined benefit pension and OPEB plans | DVA on fair value option elected liabilities | Accumulated other comprehensive income/(loss) | |||||||||||||||||||||||||
Balance at July 1, 2016 |
| $ | 3,921 | |
|
|
| $ | (161 | ) |
|
|
| $ | (201 | ) |
|
|
| $ | (2,150 | ) |
|
| $ | 209 | |
|
| $ | 1,618 | |
| |
Net change |
| (160 | ) |
|
|
| 4 | |
|
|
| 36 | |
|
|
| 42 | |
|
| (66 | ) |
|
| (144 | ) |
| |||||||
Balance at September 30, 2016 |
| $ | 3,761 | |
|
|
| $ | (157 | ) |
|
|
| $ | (165 | ) |
|
|
| $ | (2,108 | ) |
|
| $ | 143 | |
|
| $ | 1,474 | |
| |
|
|
|
|
|
|
|
|
|
|
|
|
|
|
|
|
|
|
|
|
|
| |||||||||||||
As of or for the nine months ended | Unrealized |
| Translation adjustments, net of hedges |
| Cash flow hedges |
| Defined benefit | DVA on fair value option elected liabilities | Accumulated other comprehensive income/(loss) | |||||||||||||||||||||||||
Balance at January 1, 2017 |
| $ | 1,524 | |
|
|
| $ | (164 | ) |
|
|
| $ | (100 | ) |
|
|
| $ | (2,259 | ) |
|
| $ | (176 | ) |
|
| $ | (1,175 | ) |
| |
Net change |
| 842 | |
|
|
| 7 | |
|
|
| 170 | |
|
|
| 26 | |
|
| (179 | ) |
|
| 866 | |
| |||||||
Balance at September 30, 2017 |
| $ | 2,366 | |
|
|
| $ | (157 | ) |
|
|
| $ | 70 | |
|
|
| $ | (2,233 | ) |
|
| $ | (355 | ) |
|
| $ | (309 | ) |
| |
|
|
|
|
|
|
|
|
|
|
|
|
|
|
|
|
|
|
|
|
|
| |||||||||||||
As of or for the nine months ended | Unrealized |
| Translation adjustments, net of hedges |
| Cash flow hedges |
| Defined benefit pension and | DVA on fair value option elected liabilities | Accumulated other comprehensive income/(loss) | |||||||||||||||||||||||||
Balance at January 1, 2016 |
| $ | 2,629 | |
|
|
| $ | (162 | ) |
|
|
| $ | (44 | ) |
|
|
| $ | (2,231 | ) |
|
| NA | |
|
| $ | 192 | |
| ||
Cumulative effect of change in accounting principle (a) |
| - | |
|
|
| - | |
|
|
| - | |
|
|
| - | |
|
| 154 | |
|
| 154 | |
| |||||||
Net change |
| 1,132 | |
|
|
| 5 | |
|
|
| (121 | ) |
|
|
| 123 | |
|
| (11 | ) |
|
| 1,128 | |
| |||||||
Balance at September 30, 2016 |
| $ | 3,761 | |
|
|
| $ | (157 | ) |
|
|
| $ | (165 | ) |
|
|
| $ | (2,108 | ) |
|
| $ | 143 | |
|
| $ | 1,474 | |
| |
(a) | Effective January 1, 2016, the Firm adopted new accounting guidance related to the recognition and measurement of financial liabilities where the fair value option has been elected. This guidance requires the portion of the total change in fair value caused by changes in the Firm's own credit risk (DVA) to be presented separately in OCI; previously these amounts were recognized in net income. |
(b) | Represents the after-tax difference between the fair value and amortized cost of securities accounted for as AFS, including net unamortized unrealized gains and losses related to AFS securities transferred to HTM. |
149
The following table presents the pre-tax and after-tax changes in the components of OCI.
| 2017 |
| 2016 | ||||||||||||||||||||
Three months ended September 30, (in millions) | Pre-tax |
| Tax effect |
| After-tax |
| Pre-tax |
| Tax effect |
| After-tax | ||||||||||||
Unrealized gains/(losses) on investment securities: |
|
|
|
|
|
|
|
|
|
|
| ||||||||||||
Net unrealized gains/(losses) arising during the period | $ | 232 | |
| $ | (86 | ) |
| $ | 146 | |
| $ | (192 | ) |
| $ | 72 | |
| $ | (120 | ) |
Reclassification adjustment for realized (gains)/losses included in net income (a) | 1 | |
| - | |
| 1 | |
| (64 | ) |
| 24 | |
| (40 | ) | ||||||
Net change | 233 | |
| (86 | ) |
| 147 | |
| (256 | ) |
| 96 | |
| (160 | ) | ||||||
Translation adjustments (b) : |
|
|
|
|
|
|
|
|
|
|
| ||||||||||||
Translation | 286 | |
| (106 | ) |
| 180 | |
| 34 | |
| (12 | ) |
| 22 | | ||||||
Hedges | (286 | ) |
| 106 | |
| (180 | ) |
| (30 | ) |
| 12 | |
| (18 | ) | ||||||
Net change | - | |
| - | |
| - | |
| 4 | |
| - | |
| 4 | | ||||||
Cash flow hedges: |
|
|
|
|
|
|
|
|
|
|
| ||||||||||||
Net unrealized gains/(losses) arising during the period | 29 | |
| (11 | ) |
| 18 | |
| (64 | ) |
| 23 | |
| (41 | ) | ||||||
Reclassification adjustment for realized (gains)/losses included in net income (c) | 10 | |
| (2 | ) |
| 8 | |
| 122 | |
| (45 | ) |
| 77 | | ||||||
Net change | 39 | |
| (13 | ) |
| 26 | |
| 58 | |
| (22 | ) |
| 36 | | ||||||
Defined benefit pension and OPEB plans: |
|
|
|
|
|
|
|
|
|
|
| ||||||||||||
Net gains/(losses) arising during the period | - | |
| - | |
| - | |
| - | |
| - | |
| - | | ||||||
Reclassification adjustments included in net income (d) : |
|
|
|
|
|
|
|
|
|
|
| ||||||||||||
Amortization of net loss | 63 | |
| (23 | ) |
| 40 | |
| 65 | |
| (24 | ) |
| 41 | | ||||||
Prior service costs/(credits) | (9 | ) |
| 3 | |
| (6 | ) |
| (9 | ) |
| 3 | |
| (6 | ) | ||||||
Foreign exchange and other | (19 | ) |
| 7 | |
| (12 | ) |
| 12 | |
| (5 | ) |
| 7 | | ||||||
Net change | 35 | |
| (13 | ) |
| 22 | |
| 68 | |
| (26 | ) |
| 42 | | ||||||
DVA on fair value option elected liabilities, net change: | $ | (178 | ) |
| $ | 66 | |
| $ | (112 | ) |
| $ | (106 | ) |
| $ | 40 | |
| $ | (66 | ) |
Total other comprehensive income/(loss) | $ | 129 | |
| $ | (46 | ) |
| $ | 83 | |
| $ | (232 | ) |
| $ | 88 | |
| $ | (144 | ) |
|
|
|
|
|
|
|
|
|
|
|
| ||||||||||||
| 2017 |
| 2016 | ||||||||||||||||||||
Nine months ended September 30, (in millions) | Pre-tax |
| Tax effect |
| After-tax |
| Pre-tax |
| Tax effect |
| After-tax | ||||||||||||
Unrealized gains/(losses) on investment securities: |
|
|
|
|
|
|
|
|
|
|
| ||||||||||||
Net unrealized gains/(losses) arising during the period | $ | 1,294 | |
| $ | (476 | ) |
| $ | 818 | |
| $ | 1,948 | |
| $ | (731 | ) |
| $ | 1,217 | |
Reclassification adjustment for realized (gains)/losses included in | 38 | |
| (14 | ) |
| 24 | |
| (136 | ) |
| 51 | |
| (85 | ) | ||||||
Net change | 1,332 | |
| (490 | ) |
| 842 | |
| 1,812 | |
| (680 | ) |
| 1,132 | | ||||||
Translation adjustments: (b) |
|
|
|
|
|
|
|
|
|
|
| ||||||||||||
Translation | 1,185 | |
| (448 | ) |
| 737 | |
| 613 | |
| (228 | ) |
| 385 | | ||||||
Hedges | (1,161 | ) |
| 431 | |
| (730 | ) |
| (603 | ) |
| 223 | |
| (380 | ) | ||||||
Net change | 24 | |
| (17 | ) |
| 7 | |
| 10 | |
| (5 | ) |
| 5 | | ||||||
Cash flow hedges: |
|
|
|
|
|
|
|
|
|
|
| ||||||||||||
Net unrealized gains/(losses) arising during the period | 111 | |
| (42 | ) |
| 69 | |
| (418 | ) |
| 156 | |
| (262 | ) | ||||||
Reclassification adjustment for realized (gains)/losses included in | 160 | |
| (59 | ) |
| 101 | |
| 225 | |
| (84 | ) |
| 141 | | ||||||
Net change | 271 | |
| (101 | ) |
| 170 | |
| (193 | ) |
| 72 | |
| (121 | ) | ||||||
Defined benefit pension and OPEB plans: |
|
|
|
|
|
|
|
|
|
|
| ||||||||||||
Net gains/(losses) arising during the period | (52 | ) |
| 19 | |
| (33 | ) |
| (15 | ) |
| 6 | |
| (9 | ) | ||||||
Reclassification adjustments included in net income (d) : |
|
|
|
|
|
|
|
|
|
|
| ||||||||||||
Amortization of net loss | 187 | |
| (69 | ) |
| 118 | |
| 193 | |
| (73 | ) |
| 120 | | ||||||
Prior service costs/(credits) | (27 | ) |
| 10 | |
| (17 | ) |
| (27 | ) |
| 10 | |
| (17 | ) | ||||||
Settlement (gain)/loss | (3 | ) |
| 1 | |
| (2 | ) |
| - | |
| - | |
| - | | ||||||
Foreign exchange and other | (51 | ) |
| 11 | |
| (40 | ) |
| 46 | |
| (17 | ) |
| 29 | | ||||||
Net change | 54 | |
| (28 | ) |
| 26 | |
| 197 | |
| (74 | ) |
| 123 | | ||||||
DVA on fair value option elected liabilities, net change: | $ | (283 | ) |
| $ | 104 | |
| $ | (179 | ) |
| $ | (18 | ) |
| $ | 7 | |
| $ | (11 | ) |
Total other comprehensive income/(loss) | $ | 1,398 | |
| $ | (532 | ) |
| $ | 866 | |
| $ | 1,808 | |
| $ | (680 | ) |
| $ | 1,128 | |
(a) | The pre-tax amount is reported in securities gains/(losses) in the Consolidated statements of income. |
(b) | Reclassifications of pre-tax realized gains/(losses) on translation adjustments and related hedges are reported in other income/expense in the Consolidated statements of income. The amounts were not material for the periods presented. |
(c) | The pre-tax amounts are predominantly recorded in net interest income in the Consolidated statements of income. |
(d) | The pre-tax amount is reported in compensation expense in the Consolidated statements of income. |
150
Note
18
– Regulatory capital
The Federal Reserve establishes capital requirements, including well-capitalized standards, for the consolidated financial holding company. The Office of the Comptroller of the Currency ("OCC") establishes similar minimum capital requirements and standards for the Firm's insured depository institutions ("IDI"), including JPMorgan Chase Bank, N.A. and Chase Bank USA, N.A.
Capital rules under Basel III establish minimum capital ratios and overall capital adequacy standards for large and internationally active U.S. bank holding companies and banks, including the Firm and its IDI subsidiaries. Basel III sets forth two comprehensive approaches for calculating RWA: a standardized approach ("Basel III Standardized"), and an advanced approach ("Basel III Advanced"). Certain of the requirements of Basel III are subject to phase-in periods that began on January 1, 2014 and continue through the end of 2018 ("transitional period").
The three categories of risk-based capital and their predominant components under the Basel III Transitional rules are illustrated below:
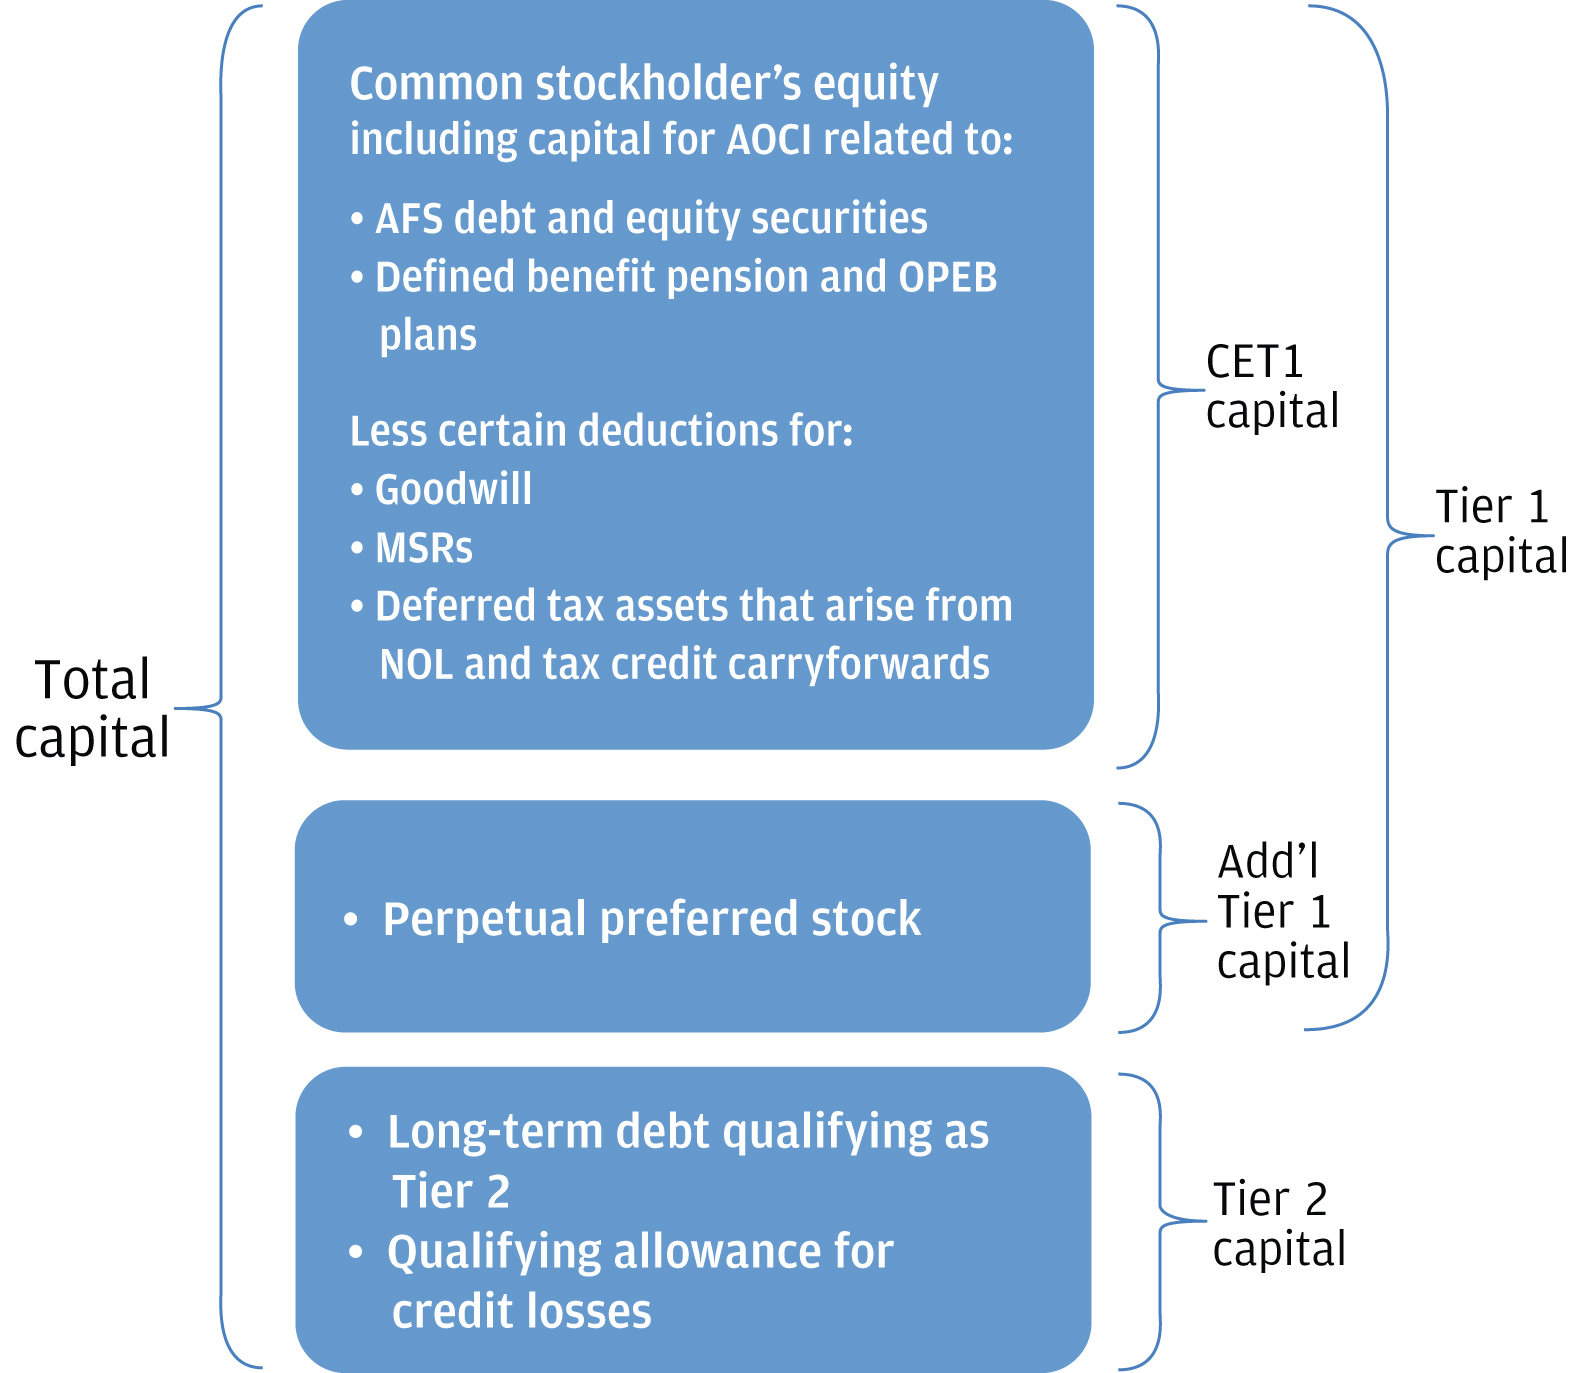
The following tables present the risk-based and leverage-based capital metrics for J PMorgan Chase and its significant IDI subsidiaries under both the Basel III Standardized Transitional and Basel III Advanced Transitional approaches at September 30, 2017, and December 31, 2016.
| JPMorgan Chase & Co. | ||||||||||||||
| Basel III Standardized Transitional |
| Basel III Advanced Transitional | ||||||||||||
(in millions, except ratios) | Sep 30, | |
| Dec 31, | |
| Sep 30, | |
| Dec 31, | | ||||
Regulatory capital |
|
|
|
|
|
|
| ||||||||
CET1 capital | $ | 187,061 | |
| $ | 182,967 | |
| $ | 187,061 | |
| $ | 182,967 | |
Tier 1 capital (a) | 212,297 | |
| 208,112 | |
| 212,297 | |
| 208,112 | | ||||
Total capital | 242,949 | |
| 239,553 | |
| 232,794 | |
| 228,592 | | ||||
|
|
|
|
|
|
|
| ||||||||
Assets |
|
|
|
|
|
|
| ||||||||
Risk-weighted | 1,482,267 | |
| 1,464,981 | |
| 1,443,019 | |
| 1,476,915 | | ||||
Adjusted average (b) | 2,521,889 | |
| 2,484,631 | |
| 2,521,889 | |
| 2,484,631 | | ||||
|
|
|
|
|
|
|
| ||||||||
Capital ratios (c) |
|
|
|
|
|
|
| ||||||||
CET1 | 12.6 | % |
| 12.5 | % |
| 13.0 | % |
| 12.4 | % | ||||
Tier 1 (a) | 14.3 | |
| 14.2 | |
| 14.7 | |
| 14.1 | | ||||
Total | 16.4 | |
| 16.4 | |
| 16.1 | |
| 15.5 | | ||||
Tier 1 leverage (d) | 8.4 | |
| 8.4 | |
| 8.4 | |
| 8.4 | | ||||
| JPMorgan Chase Bank, N.A. | ||||||||||||||
| Basel III Standardized Transitional |
| Basel III Advanced Transitional | ||||||||||||
(in millions, except ratios) | Sep 30, | |
| Dec 31, | |
| Sep 30, | |
| Dec 31, | | ||||
Regulatory capital |
|
|
|
|
|
|
| ||||||||
CET1 capital | $ | 186,440 | |
| $ | 179,319 | |
| $ | 186,440 | |
| $ | 179,319 | |
Tier 1 capital (a) | 186,440 | |
| 179,341 | |
| 186,440 | |
| 179,341 | | ||||
Total capital | 197,962 | |
| 191,662 | |
| 191,503 | |
| 184,637 | | ||||
|
|
|
|
|
|
|
| ||||||||
Assets |
|
|
|
|
|
|
| ||||||||
Risk-weighted | 1,312,292 | |
| 1,293,203 | |
| 1,240,585 | |
| 1,262,613 | | ||||
Adjusted | 2,123,214 | |
| 2,088,851 | |
| 2,123,214 | |
| 2,088,851 | | ||||
|
|
|
|
|
|
|
| ||||||||
Capital ratios (c) |
|
|
|
|
|
|
| ||||||||
CET1 | 14.2 | % |
| 13.9 | % |
| 15.0 | % |
| 14.2 | % | ||||
Tier 1 (a) | 14.2 | |
| 13.9 | |
| 15.0 | |
| 14.2 | | ||||
Total | 15.1 | |
| 14.8 | |
| 15.4 | |
| 14.6 | | ||||
Tier 1 leverage (d) | 8.8 | |
| 8.6 | |
| 8.8 | |
| 8.6 | | ||||
151
| Chase Bank USA, N.A. | ||||||||||||||
| Basel III Standardized Transitional |
| Basel III Advanced Transitional | ||||||||||||
(in millions, except ratios) | Sep 30, | |
| Dec 31, | |
| Sep 30, | |
| Dec 31, | | ||||
Regulatory capital |
|
|
|
|
|
|
| ||||||||
CET1 capital | $ | 20,114 | |
| $ | 16,784 | |
| $ | 20,114 | |
| $ | 16,784 | |
Tier 1 capital (a) | 20,114 | |
| 16,784 | |
| 20,114 | |
| 16,784 | | ||||
Total capital | 26,152 | |
| 22,862 | |
| 24,764 | |
| 21,434 | | ||||
|
|
|
|
|
|
|
| ||||||||
Assets |
|
|
|
|
|
|
| ||||||||
Risk-weighted | 108,901 | |
| 112,297 | |
| 192,734 | |
| 186,378 | | ||||
Adjusted | 124,082 | |
| 120,304 | |
| 124,082 | |
| 120,304 | | ||||
|
|
|
|
|
|
|
| ||||||||
Capital ratios (c) |
|
|
|
|
|
|
| ||||||||
CET1 | 18.5 | % |
| 14.9 | % |
| 10.4 | % |
| 9.0 | % | ||||
Tier 1 (a) | 18.5 | |
| 14.9 | |
| 10.4 | |
| 9.0 | | ||||
Total | 24.0 | |
| 20.4 | |
| 12.8 | |
| 11.5 | | ||||
Tier 1 leverage (d) | 16.2 | |
| 14.0 | |
| 16.2 | |
| 14.0 | | ||||
(a) | Includes the deduction associated with the permissible holdings of covered funds (as defined by the Volcker Rule) acquired after December 31, 2013. The deduction was not material as of September 30, 2017 and December 31, 2016 . |
(b) | Adjusted average assets, for purposes of calculating the Tier 1 leverage ratio, includes total quarterly average assets adjusted for unrealized gains/(losses) on AFS securities, less deductions for goodwill and other intangible assets, defined benefit pension plan assets, and deferred tax assets related to NOL and tax credit carryforwards. |
(c) | For each of the risk-based capital ratios, the capital adequacy of the Firm and its IDI subsidiaries is evaluated against the lower of the two ratios as calculated under Basel III approaches (Standardized or Advanced) as required by the Collins Amendment of the Dodd-Frank Act (the "Collins Floor"). |
(d) | The Tier 1 leverage ratio is not a risk-based measure of capital. This ratio is calculated by dividing Tier 1 capital by adjusted average assets. |
Under the risk-based capital guidelines of the Federal Reserve, JPMorgan Chase is required to maintain minimum ratios of CET1, Tier 1 and Total capital to RWA, as well as a minimum leverage ratio (which is defined as Tier 1 capital divided by adjusted quarterly average assets). Failure to meet these minimum requirements could cause the Federal Reserve to take action. IDI subsidiaries also are subject to these capital requirements by their respective primary regulators. The following table presents the minimum ratios to which the Firm and its IDI subsidiaries are subject as of September 30, 2017 .
| Minimum capital ratios |
| Well-capitalized ratios | ||||||
| BHC (a)(e) | | IDI (b)(e) | |
| BHC (c) | | IDI (d) | |
Capital ratios |
|
|
|
|
| ||||
CET1 | 7.50 | % | 5.75 | % |
| - | % | 6.50 | % |
Tier 1 | 9.00 | | 7.25 | |
| 6.00 | | 8.00 | |
Total | 11.00 | | 9.25 | |
| 10.00 | | 10.00 | |
Tier 1 leverage | 4.00 | | 4.00 | |
| - | | 5.00 | |
Note: The table above is as defined by the regulations issued by the Federal Reserve, OCC and FDIC and to which the Firm and its IDI subsidiaries are subject.
(a) | Represents the Transitional minimum capital ratios applicable to the Firm under Basel III at September 30, 2017 . At September 30, 2017 , the CET1 minimum capital ratio includes 1.25% resulting from the phase in of the Firm's 2.5% capital conservation buffer and 1.75% , resulting from the phase in of the Firm's 3.5% GSIB surcharge. |
(b) | Represents requirements for JPMorgan Chase 's IDI subsidiaries. The CET1 minimum capital ratio includes 1.25% resulting from the phase in of the 2.5% capital conservation buffer that is applicable to the IDI subsidiaries. The IDI subsidiaries are not subject to the GSIB surcharge. |
(c) | Represents requirements for bank holding companies pursuant to regulations issued by the Federal Reserve . |
(d) | Represents requirements for IDI subsidiaries pursuant to regulations issued under the FDIC Improvement Act. |
(e) | For the period ended December 31, 2016 the CET1, Tier 1, Total and Tier 1 leverage minimum capital ratios applicable to the Firm were 6.25% , 7.75% , 9.75% and 4.0% and the CET1, Tier 1, Total and Tier 1 leverage minimum capital ratios applicable to the Firm's IDI subsidiaries were 5.125% , 6.625% , 8.625% and 4.0% respectively. |
As of September 30, 2017 , and December 31, 2016 , JPMorgan Chase and all of its IDI subsidiaries were well-capitalized and met all capital requirements to which each was subject.
152
Note 19 – Off–balance sheet lending-related financial instruments, guarantees, and other commitments
JPMorgan Chase provides lending-related financial instruments (e.g., commitments and guarantees) to meet the financing needs of its customers. The contractual amount of these financial instruments represents the maximum possible credit risk to the Firm should the counterparty draw upon the commitment or the Firm be required to fulfill its obligation under the guarantee, and should the counterparty subsequently fail to perform according to the terms of the contract. Most of these commitments and guarantees are refinanced, extended, cancelled, or expire without being drawn upon or a default occurring. As a result, the total contractual amount of these instruments is not, in the Firm's view, representative of its expected future credit exposure or funding requirements. For further discussion of lending-related commitments and guarantees, and the Firm's related accounting policies, see Note 29 of JPMorgan Chase 's 2016 Annual Report .
To provide for probable credit losses inherent in wholesale and certain consumer lending-related commitments, an allowance for credit losses on lending-related commitments is maintained. See Note 12 for further information regarding the allowance for credit losses on lending-related commitments.
The following table summarizes the contractual amounts and carrying values of off-balance sheet lending-related financial instruments, guarantees and other commitments at September 30, 2017 , and December 31, 2016 . The amounts in the table below for credit card and home equity lending-related commitments represent the total available credit for these products. The Firm has not experienced, and does not anticipate, that all available lines of credit for these products will be utilized at the same time. The Firm can reduce or cancel credit card lines of credit by providing the borrower notice or, in some cases as permitted by law, without notice. In addition, the Firm typically closes credit card lines when the borrower is 60 days or more past due. The Firm may reduce or close HELOCs when there has been a demonstrable decline in the creditworthiness of the borrower.
153
Off–balance sheet lending-related financial instruments, guarantees and other commitments | | |||||||||||||||||||||||||
| Contractual amount | | Carrying value (h) | |||||||||||||||||||||||
| September 30, 2017 | | Dec 31, | | | Sep 30, | | Dec 31, | | |||||||||||||||||
By remaining maturity | Expires in 1 year or less | Expires after | Expires after | Expires after 5 years | Total | | Total | | | | ||||||||||||||||
Lending-related | | | | | | | | | | | | | | | | | | | ||||||||
Consumer, excluding credit card: | | | | | | | | | | | | | | | | | | | ||||||||
Home equity | $ | 3,052 | | $ | 1,519 | | $ | 1,311 | | $ | 14,593 | | $ | 20,475 | | | $ | 21,714 | | | $ | 12 | | $ | 12 | |
Residential mortgage (a)(b) | 11,152 | | - | | - | | 11 | | 11,163 | | | 11,882 | | | - | | - | | ||||||||
Auto | 8,604 | | 951 | | 333 | | 82 | | 9,970 | | | 8,468 | | | 2 | | 2 | | ||||||||
Consumer & Business Banking (b) | 11,911 | | 899 | | 113 | | 540 | | 13,463 | | | 12,733 | | | 19 | | 12 | | ||||||||
Total consumer, excluding credit card | 34,719 | | 3,369 | | 1,757 | | 15,226 | | 55,071 | | | 54,797 | | | 33 | | 26 | | ||||||||
Credit card | 574,641 | | - | | - | | - | | 574,641 | | | 553,891 | | | - | | - | | ||||||||
Total consumer (c) | 609,360 | | 3,369 | | 1,757 | | 15,226 | | 629,712 | | | 608,688 | | | 33 | | 26 | | ||||||||
Wholesale: | | | | | | | | | | | | | | | | | | | ||||||||
Other unfunded commitments to extend credit (d) | 73,709 | | 117,020 | | 132,228 | | 10,633 | | 333,590 | | | 328,497 | | | 881 | | 905 | | ||||||||
Standby letters of credit and other financial guarantees (d) | 16,698 | | 8,317 | | 7,945 | | 2,179 | | 35,139 | | | 35,947 | | | 575 | | 586 | | ||||||||
Other letters of credit (d) | 3,330 | | 206 | | 114 | | 1 | | 3,651 | | | 3,570 | | | 4 | | 2 | | ||||||||
Total wholesale (e) | 93,737 | | 125,543 | | 140,287 | | 12,813 | | 372,380 | | | 368,014 | | | 1,460 | | 1,493 | | ||||||||
Total lending-related | $ | 703,097 | | $ | 128,912 | | $ | 142,044 | | $ | 28,039 | | $ | 1,002,092 | | | $ | 976,702 | | | $ | 1,493 | | $ | 1,519 | |
Other guarantees and commitments | | | | | | | | | | | | | | | | | | | ||||||||
Securities lending indemnification agreements and guarantees (f) | $ | 177,835 | | $ | - | | $ | - | | $ | - | | $ | 177,835 | | | $ | 137,209 | | | $ | - | | $ | - | |
Derivatives qualifying as guarantees | 3,002 | | 268 | | 10,494 | | 39,918 | | 53,682 | | | 51,966 | | | 382 | | 80 | | ||||||||
Unsettled reverse repurchase and securities borrowing agreements | 89,327 | | - | | - | | - | | 89,327 | | | 50,722 | | | - | | - | | ||||||||
Unsettled repurchase and securities lending agreements | 84,687 | | - | | - | | - | | 84,687 | | | 26,948 | | | - | | - | | ||||||||
Loan sale and securitization-related indemnifications: | | | | | | | | | | | | | | | | | | | ||||||||
Mortgage repurchase liability | NA | | NA | | NA | | NA | | NA | | | NA | | | 124 | | 133 | | ||||||||
Loans sold with recourse | NA | | NA | | NA | | NA | | 1,708 | | | 2,730 | | | 41 | | 64 | | ||||||||
Other guarantees and commitments (g) | 1,801 | | 2,058 | | 130 | | 1,452 | | 5,441 | | | 5,715 | | | (90 | ) | (118 | ) | ||||||||
(a) | Includes certain commitments to purchase loans from correspondents. |
(b) | Certain loan portfolios have been reclassified. The prior period amounts have been revised to conform with the current period presentation. |
(c) | Predominantly all consumer lending-related commitments are in the U.S. |
(d) | At September 30, 2017 , and December 31, 2016 , reflected the contractual amount net of risk participations totaling $375 million and $328 million , respectively, for other unfunded commitments to extend credit; $10.5 billion and $11.1 billion , respectively, for standby letters of credit and other financial guarantees; and $372 million and $265 million , respectively, for other letters of credit. In regulatory filings with the Federal Reserve these commitments are shown gross of risk participations. |
(e) | At September 30, 2017 , and December 31, 2016 , the U.S. portion of the contractual amount of total wholesale lending-related commitments was 78% and 79% , respectively. |
(f) | At September 30, 2017 , and December 31, 2016 , collateral held by the Firm in support of securities lending indemnification agreements was $187.0 billion and $143.2 billion , respectively. Securities lending collateral primarily consists of cash and securities issued by governments that are members of the Organisation for Economic Co-operation and Development and U.S. government agencies. |
(g) | Included unfunded commitments of $ 41 million and $48 million at September 30, 2017 , and December 31, 2016 , respectively to third-party private equity funds; and $830 million and $1.0 billion , at September 30, 2017 , and December 31, 2016 , respectively, to other equity investments. These commitments included $29 million and $34 million , respectively, related to investments that are generally fair valued at net asset value as discussed in Note 2 . In addition, included letters of credit hedged by derivative transactions and managed on a market risk basis of $4.5 billion and $4.6 billion at September 30, 2017 , and December 31, 2016 , respectively. |
(h) | For lending-related products, the carrying value represents the allowance for lending-related commitments and the guarantee liability; for derivative-related products, the carrying value represents the fair value. |
154
Other unfunded commitments to extend credit
Other unfunded commitments to extend credit generally consist of commitments for working capital and general corporate purposes, extensions of credit to support commercial paper facilities and bond financings in the event that those obligations cannot be remarketed to new investors, as well as committed liquidity facilities to clearing organizations. The Firm also issues commitments under multipurpose facilities which could be drawn upon in several forms, including the issuance of a standby letter of credit.
The Firm acts as a settlement and custody bank in the U.S. tri-party repurchase transaction market. In its role as settlement and custody bank, the Firm is exposed to the intra-day credit risk of its cash borrower clients, usually broker-dealers. This exposure arises under secured
clearance advance facilities that the Firm extends to its clients (i.e., cash borrowers); these facilities contractually limit the Firm's intra-day credit risk to the facility amount
and must be repaid by the end of the day. As of September 30, 2017 , and December 31, 2016 , the maximum outstanding commitment under the secured clearance advance facility was $1.6 billion and $2.4 billion , respectively .
Standby letters of credit and other financial guarantees
Standby letters of credit and other financial guarantees are conditional lending commitments issued by the Firm to guarantee the performance of a customer to a third party under certain arrangements, such as commercial paper facilities, bond financings, acquisition financings, trade and similar transactions.
The following table summarizes the standby letters of credit and other letters of credit arrangements as of September 30, 2017 , and December 31, 2016 .
Standby letters of credit, other financial guarantees and other letters of credit
| September 30, 2017 |
| December 31, 2016 | ||||||||||||
(in millions) | Standby letters of |
| Other letters of credit |
| Standby letters of |
| Other letters of credit | ||||||||
Investment-grade (a) | $ | 28,160 | |
| $ | 2,646 | |
| $ | 28,245 | |
| $ | 2,781 | |
Noninvestment-grade (a) | 6,979 | |
| 1,005 | |
| 7,702 | |
| 789 | | ||||
Total contractual amount | $ | 35,139 | |
| $ | 3,651 | |
| $ | 35,947 | |
| $ | 3,570 | |
|
|
|
|
|
|
|
| ||||||||
Allowance for lending-related commitments | $ | 191 | |
| $ | 4 | |
| $ | 145 | |
| $ | 2 | |
Guarantee liability | 384 | |
| - | |
| 441 | |
| - | | ||||
Total carrying value | $ | 575 | |
| $ | 4 | |
| $ | 586 | |
| $ | 2 | |
|
|
|
|
|
|
|
| ||||||||
Commitments with collateral | $ | 17,956 | |
| $ | 889 | |
| $ | 19,346 | |
| $ | 940 | |
(a) | The ratings scale is based on the Firm's internal ratings which generally correspond to ratings as defined by S&P and Moody's. |
Derivatives qualifying as guarantees
The Firm transacts certain derivative contracts that have the characteristics of a guarantee under U.S. GAAP. For further information on these derivatives, see Note 29 of JPMorgan Chase's 2016 Annual Report.
The following table summarizes the derivatives qualifying as guarantees as of September 30, 2017 , and December 31, 2016 .
(in millions) | September 30, 2017 | |
| December 31, 2016 | |
Total notional value of derivatives (a) | 53,682 | |
| 51,966 | |
Notional amount of stable value contracts (b) | 28,995 | |
| 28,665 | |
Maximum exposure to loss on stable value contracts | 3,042 | |
| 3,012 | |
|
|
|
| ||
Fair value (c) |
|
|
| ||
Derivative payables | 382 | |
| 96 | |
Derivative receivables | - | |
| 16 | |
(a) | The notional amount generally represents the Firm 's maximum exposure to derivatives qualifying as guarantees. |
(b) | Exposure to certain stable value contracts is contractually limited to a substantially lower percentage of the notional amount. |
(c) | The fair value of the contracts reflect the probability, in the Firm 's view, of whether the Firm will be required to perform under the contract. |
The Firm reduces exposures to these contracts by entering into offsetting transactions, or by entering into contracts that hedge the market risk related to the derivative guarantees.
In addition to derivative contracts that meet the characteristics of a guarantee, the Firm is both a purchaser and seller of credit protection in the credit derivatives market. For a further discussion of credit derivatives, see Note 4 .
155
Loan sales- and securitization-related indemnifications
In connection with the Firm's mortgage loan sale and securitization activities with GSEs and in certain private label transactions, the Firm has made representations and warranties that the loans sold meet certain requirements, and that may require the Firm to repurchase the mortgage loans and/or indemnify the loan purchaser if such representations and warranties are breached by the Firm. In addition, although the Firm's securitizations are predominantly nonrecourse, the Firm does provide recourse servicing in certain limited cases where it agrees to share credit risk with the owner of the mortgage loans. For additional information, see Note 29 of JPMorgan Chase's 2016 Annual Report.
The liability related to repurchase demands associated with private label securitizations is separately evaluated by the Firm in establishing its litigation reserves. For additional information regarding litigation, see Note 21 of this Form 10-Q and Note 31 of JPMorgan Chase's 2016 Annual Report.
Guarantees of subsidiary
The Parent Company has guaranteed certain long-term debt and structured notes of its subsidiaries, including JPMorgan Chase Financial Company LLC ("JPMFC"), a 100%-owned finance subsidiary. All securities issued by JPMFC are fully and unconditionally guaranteed by the Parent Company, and these guarantees rank on a parity with the Firm's unsecured and unsubordinated indebtedness.
Note 20 – Pledged assets and collateral
For a discussion of the Firm's pledged assets and collateral, see Note 30 of JPMorgan Chase's 2016 Annual Report .
Pledged assets
The Firm may pledge financial assets that it owns to maintain potential borrowing capacity with central banks and for other purposes, including to secure borrowings and public deposits, collateralize repurchase and other securities financing agreements, and cover customer short sales . Certain of these pledged assets may be sold or repledged or otherwise used by the secured parties and are identified as financial instruments owned (pledged to various parties) on the Consolidated balance sheets.
The following table presents the Firm 's pledged assets.
(in billions) | September 30, 2017 | |
| December 31, | | ||
Assets that may be sold or repledged or otherwise used by secured parties | $ | 143.1 | |
| $ | 133.6 | |
Assets that may not be sold or repledged or otherwise used by secured parties | 75.4 | |
| 53.5 | | ||
Assets pledged at Federal Reserve banks and FHLBs | 487.8 | |
| 441.9 | | ||
Total assets pledged | $ | 706.3 | |
| $ | 629.0 | |
Total assets pledged do not include assets of consolidated VIEs; these assets are used to settle the liabilities of those entities. See Note 13 for additional information on assets and liabilities of consolidated VIEs. For additional information on the Firm 's securities financing activities, see Note 10 . For additional information on the Firm 's long-term debt, see Note 21 of JPMorgan Chase's 2016 Annual Report.
Collateral
The Firm had accepted financial assets as collateral that it could sell or repledge, deliver or otherwise use. This collateral was generally obtained under resale agreements, securities borrowing agreements, customer margin loans and derivative agreements. Collateral was generally used under repurchase agreements, securities lending agreements or to cover customer short sales and to collateralize deposits and derivative agreements.
The following table presents the fair value of collateral accepted.
(in billions) | September 30, 2017 | |
| December 31, | | ||
Collateral that could be sold or repledged, delivered, or otherwise used | $ | 957.2 | |
| $ | 914.1 | |
Collateral sold, repledged, delivered or otherwise used | 785.0 | |
| 746.6 | | ||
156
Note 21 – Litigation
Contingencies
As of September 30, 2017 , the Firm and its subsidiaries and affiliates are defendants or putative defendants in numerous legal proceedings, including private, civil litigations and regulatory/government investigations. The litigations range from individual actions involving a single plaintiff to class action lawsuits with potentially millions of class members. Investigations involve both formal and informal proceedings, by both governmental agencies and self-regulatory organizations. These legal proceedings are at varying stages of adjudication, arbitration or investigation, and involve each of the Firm's lines of business and geographies and a wide variety of claims (including common law tort and contract claims and statutory antitrust, securities and consumer protection claims), some of which present novel legal theories.
The Firm believes the estimate of the aggregate range of reasonably possible losses, in excess of reserves established, for its legal proceedings is from $0 to approximately $1.8 billion at September 30, 2017 . This estimated aggregate range of reasonably possible losses was based upon currently available information for those proceedings in which the Firm believes that an estimate of reasonably possible loss can be made. For certain matters, the Firm does not believe that such an estimate can be made, as of that date. The Firm's estimate of the aggregate range of reasonably possible losses involves significant judgment, given the number, variety and varying stages of the proceedings (including the fact that many are in preliminary stages), the existence in many such proceedings of multiple defendants (including the Firm) whose share of liability has yet to be determined, the numerous yet-unresolved issues in many of the proceedings (including issues regarding class certification and the scope of many of the claims) and the attendant uncertainty of the various potential outcomes of such proceedings, including where the Firm has made assumptions concerning future rulings by the court or other adjudicator, or about the behavior or incentives of adverse parties or regulatory authorities, and those assumptions prove to be incorrect. In addition, the outcome of a particular proceeding may be a result which the Firm did not take into account in its estimate because the Firm had deemed the likelihood of that outcome to be remote. Accordingly, the Firm's estimate of the aggregate range of reasonably possible losses will change from time to time, and actual losses may vary significantly.
Set forth below are descriptions of the Firm's material legal proceedings.
Foreign Exchange Investigations and Litigation. The Firm previously reported settlements with certain government authorities relating to its foreign exchange ("FX") sales and trading activities and controls related to those activities. FX-related investigations and inquiries by government authorities, including competition authorities, are ongoing, and the Firm is cooperating with those matters. In May
2015, the Firm pleaded guilty to a single violation of federal antitrust law. In January 2017, the Firm was sentenced, with judgment entered thereafter. The Department of Labor granted the Firm a temporary one -year waiver of disqualification, effective upon entry of judgment, that allows the Firm and its affiliates to continue to rely on the Qualified Professional Asset Manager exemption under the Employee Retirement Income Security Act ("ERISA"). The Firm's application for a lengthier exemption is pending. Separately, in February 2017 the South Africa Competition Commission referred its FX investigation of the Firm and other banks to the South Africa Competition Tribunal, which has initiated civil proceedings.
The Firm is also one of a number of foreign exchange dealers defending a class action filed in the United States District Court for the Southern District of New York by U.S.-based plaintiffs, principally alleging violations of federal antitrust laws based on an alleged conspiracy to manipulate foreign exchange rates (the "U.S. class action"). In January 2015, the Firm entered into a settlement agreement in the U.S. class action. Following this settlement, a number of additional putative class actions were filed seeking damages for persons who transacted FX futures and options on futures (the "exchanged-based actions"), consumers who purchased foreign currencies at allegedly inflated rates (the "consumer action"), participants or beneficiaries of qualified ERISA plans (the "ERISA actions"), and purported indirect purchasers of FX instruments (the "indirect purchaser action"). Since then, the Firm has entered into a revised settlement agreement to resolve the consolidated U.S. class action, including the exchange-based actions, and that agreement has been preliminarily approved by the Court. The District Court has dismissed one of the ERISA actions, and the plaintiffs have filed an appeal. The consumer action, a second ERISA action and the indirect purchaser action remain pending in the District Court.
General Motors Litigation. JPMorgan Chase Bank, N.A. participated in, and was the Administrative Agent on behalf of a syndicate of lenders on, a $1.5 billion syndicated Term Loan facility ("Term Loan") for General Motors Corporation ("GM"). In July 2009, in connection with the GM bankruptcy proceedings, the Official Committee of Unsecured Creditors of Motors Liquidation Company ("Creditors Committee") filed a lawsuit against JPMorgan Chase Bank, N.A., in its individual capacity and as Administrative Agent for other lenders on the Term Loan, seeking to hold the underlying lien invalid based on the filing of a UCC-3 termination statement relating to the Term Loan. In January 2015, following several court proceedings, the United States Court of Appeals for the Second Circuit reversed the Bankruptcy Court's dismissal of the Creditors Committee's claim and remanded the case to the Bankruptcy Court with instructions to enter partial summary judgment for the Creditors Committee as to the termination statement. The
157
proceedings in the Bankruptcy Court continue with respect to, among other things, additional defenses asserted by JPMorgan Chase Bank, N.A. and the value of additional collateral on the Term Loan that was unaffected by the filing of the termination statement at issue. In connection with that additional collateral, a trial in the Bankruptcy Court regarding the value of certain representative assets concluded in May 2017, and a ruling was issued in September 2017. The Bankruptcy Court found that 33 of the 40 representative assets are fixtures and that these fixtures generally should be valued on a "going concern" basis. The Creditors Committee is seeking leave to appeal the Bankruptcy Court's ruling that the fixtures should be valued on a "going concern" basis rather than on a liquidation basis. The parties have agreed to engage in mediation concerning the value of the remaining additional collateral in light of the Bankruptcy Court's ruling regarding the representative assets, as well as other issues. In addition, certain Term Loan lenders filed cross-claims in the Bankruptcy Court against JPMorgan Chase Bank, N.A. seeking indemnification and asserting various claims. The cross-claims are also expected to be addressed at the mediation.
Hopper Estate Litigation. The Firm is a defendant in an action in connection with its role as an independent administrator of an estate. The plaintiffs sought in excess of
$7 million in compensatory damages, primarily relating to attorneys' fees incurred by the plaintiffs. After a trial in probate court in Dallas, Texas that ended in September 2017, the jury returned a verdict against the Firm, awarding plaintiffs their full compensatory damages and multiple billions in punitive damages. Notwithstanding the jury verdict, in light of legal limitations on the availability of damages, certain of the plaintiffs moved for entry of judgment in the total amount of approximately $71 million , including punitive damages, while another plaintiff has not yet moved for judgment. The court has not yet entered a judgment in this matter. The parties are engaged in post-trial briefing.
Interchange Litigation. A group of merchants and retail associations filed a series of class action complaints alleging that Visa and MasterCard, as well as certain banks, conspired to set the price of credit and debit card interchange fees and enacted respective rules in violation of antitrust laws. The parties entered into an agreement to settle the cases for a cash payment of $6.1 billion to the class plaintiffs (of which the Firm's share is approximately 20% ) and an amount equal to ten basis points of credit card interchange for a period of eight months to be measured from a date within 60 days of the end of the opt-out period. The agreement also provided for modifications to each credit card network's rules, including those that prohibit surcharging credit card transactions. In December 2013, the District Court granted final approval of the settlement.
A number of merchants appealed to the United States Court of Appeals for the Second Circuit, which, in June 2016,
vacated the District Court's certification of the class action and reversed the approval of the class settlement. Both the plaintiffs and the defendants filed petitions seeking review by the U.S. Supreme Court of the Second Circuit's decision, and those petitions were denied in March 2017. The case has been remanded to the District Court for further proceedings consistent with the appellate decision.
In addition, certain merchants have filed individual actions raising similar allegations against Visa and MasterCard, as well as against the Firm and other banks, and those actions are proceeding.
LIBOR and Other Benchmark Rate Investigations and Litigation. JPMorgan Chase has received subpoenas and requests for documents and, in some cases, interviews, from federal and state agencies and entities, including the U.S. Department of Justice ("DOJ"), the U.S. Commodity Futures Trading Commission ("CFTC"), the U.S. Securities and Exchange Commission ("SEC") and various state attorneys general, as well as the European Commission ("EC"), the U.K. Financial Conduct Authority ("FCA"), the Canadian Competition Bureau, the Swiss Competition Commission ("ComCo") and other regulatory authorities and banking associations around the world relating primarily to the process by which interest rates were submitted to the British Bankers Association ("BBA") in connection with the setting of the BBA's London Interbank Offered Rate ("LIBOR") for various currencies, principally in 2007 and 2008. Some of the inquiries also relate to similar processes by which information on rates was submitted to the European Banking Federation ("EBF") in connection with the setting of the EBF's Euro Interbank Offered Rates ("EURIBOR") and to the Japanese Bankers' Association for the setting of Tokyo Interbank Offered Rates ("TIBOR") during similar time periods, as well as processes for the setting of U.S. dollar ISDAFIX rates and other reference rates in various parts of the world during similar time periods, including through 2012. The Firm continues to cooperate with these ongoing investigations, and is currently engaged in discussions with the CFTC about resolving its U.S. dollar ISDAFIX-related investigation with respect to the Firm. There is no assurance that such discussions will result in a settlement. As previously reported, the Firm has resolved EC inquiries relating to Yen LIBOR and Swiss Franc LIBOR. In December 2016, the Firm resolved ComCo inquiries relating to these same rates. ComCo's investigation relating to EURIBOR, to which the Firm and other banks are subject, continues. In December 2016, the EC issued a decision against the Firm and other banks finding an infringement of European antitrust rules relating to EURIBOR. The Firm has filed an appeal with the European General Court. In June 2016, the DOJ informed the Firm that the DOJ had closed its inquiry into LIBOR and other benchmark rates with respect to the Firm without taking action. Certain other inquiries have been discontinued without any action against JPMorgan Chase, including by the SEC, FCA and the Canadian Competition Bureau.
158
In addition, the Firm has been named as a defendant along with other banks in a series of individual and putative class actions filed in various United States District Courts. These actions have been filed, or consolidated for pre-trial purposes, in the United States District Court for the Southern District of New York. In these actions, plaintiffs make varying allegations that in various periods, starting in 2000 or later, defendants either individually or collectively manipulated the U.S. dollar LIBOR, Yen LIBOR, Swiss franc LIBOR, Euroyen TIBOR, EURIBOR, Singapore Interbank Offered Rate ("SIBOR"), Singapore Swap Offer Rate ("SOR") and/or the Bank Bill Swap Reference Rate ("BBSW") by submitting rates that were artificially low or high. Plaintiffs allege that they transacted in loans, derivatives or other financial instruments whose values are affected by changes in U.S. dollar LIBOR, Yen LIBOR, Swiss franc LIBOR, Euroyen TIBOR, EURIBOR, SIBOR, SOR or BBSW and assert a variety of claims including antitrust claims seeking treble damages. These matters are in various stages of litigation.
The Firm has agreed to settle the putative class actions related to Yen LIBOR, Euroyen TIBOR and Swiss franc LIBOR. Those settlements are subject to approval by the Court.
In the EURIBOR action, the District Court dismissed all claims except a single antitrust claim and two common law claims, and dismissed all defendants except the Firm and Citibank.
In the U.S. dollar LIBOR-related actions, the District Court dismissed certain claims, including antitrust claims brought by some plaintiffs whom the District Court found did not have standing to assert such claims, and permitted antitrust claims, claims under the Commodity Exchange Act and common law claims to proceed. The plaintiffs whose antitrust claims were dismissed for lack of standing have filed an appeal. In May 2017, plaintiffs in three putative class actions moved in the District Court for class certification, and the Firm and other defendants have opposed that motion.
In the action related to SIBOR and SOR, the District Court dismissed without prejudice all claims except a single antitrust claim, and dismissed without prejudice all defendants except the Firm, Bank of America and Citibank. The plaintiffs filed an amended complaint in September 2017, which the Firm and other defendants have moved to dismiss.
The Firm is one of the defendants in a number of putative class actions alleging that defendant banks and ICAP conspired to manipulate the U.S. dollar ISDAFIX rates. Plaintiffs primarily assert claims under the federal antitrust laws and Commodity Exchange Act. In April 2016, the Firm settled the ISDAFIX litigation, along with certain other banks. Those settlements have been preliminarily approved by the Court.
Madoff Litigation. Investors in the Ponzi scheme perpetrated by Bernard L. Madoff Investment Securities LLC ("Madoff") who were "net winners" (i.e., Madoff customers who took more money out of their accounts than they invested) filed
a lawsuit in the United States District Court for the Middle District of Florida against the Firm and affiliates alleging violations of federal securities law and state law, including claims that the Firm aided and abetted Madoff's fraud. The District Court granted the Firm's motion to dismiss the federal claims and declined to exercise jurisdiction over the state law claims. The United States Court of Appeals for the Eleventh Circuit affirmed the dismissal of the federal claims, and the United States Supreme Court denied plaintiffs' petition for writ of certiorari. The same plaintiffs have re-filed their state claims in Florida state court. In October 2017, the Firm filed a motion to dismiss the Florida state court action.
Mortgage-Backed Securities and Repurchase Litigation and Related Regulatory Investigations. The Firm and affiliates (together, "JPMC"), Bear Stearns and affiliates (together, "Bear Stearns") and certain Washington Mutual affiliates (together, "Washington Mutual") have been named as defendants in a number of cases in their various roles in offerings of MBS. The remaining civil cases include one investor action and actions for repurchase of mortgage loans. The Firm and certain of its current and former officers and Board members have also been sued in a shareholder derivative action relating to the Firm's MBS activities, which remains pending.
Issuer Litigation – Individual Purchaser Actions . With the exception of one remaining action, the Firm has resolved all of the individual actions brought against JPMC, Bear Stearns and Washington Mutual as MBS issuers (and, in some cases, also as underwriters of their own MBS offerings).
Repurchase Litigation . The Firm is defending a few actions brought by trustees, securities administrators and/or master servicers of various MBS trusts on behalf of purchasers of securities issued by those trusts. These cases generally allege breaches of various representations and warranties regarding securitized loans and seek repurchase of those loans or equivalent monetary relief, as well as indemnification of attorneys' fees and costs and other remedies. These repurchase actions, each specific to one or more MBS transactions issued by JPMC, are in various stages of litigation.
In addition, the Firm and a group of 21 institutional MBS investors made a binding offer to the trustees of MBS issued by JPMC and Bear Stearns providing for the payment of $4.5 billion and the implementation of certain servicing changes by JPMC, to resolve all repurchase and servicing claims that have been asserted or could have been asserted with respect to 330 MBS trusts created between 2005 and 2008. The offer does not resolve claims relating to Washington Mutual MBS. The trustees (or separate and successor trustees) for this group of 330 trusts have accepted the settlement for 319 trusts in whole or in part and excluded from the settlement 16 trusts in whole or in part. The trustees' acceptance has received final approval from the court and the trustees have secured the necessary rulings from the Internal Revenue Service triggering their obligation to allocate the settlement funds among the
159
settling trusts. The trustees are currently in the process of determining allocation amounts for each trust. The Firm expects to make payments pursuant to this settlement by January 2018.
Additional actions have been filed against third-party trustees that relate to loan repurchase and servicing claims involving trusts sponsored by JPMC, Bear Stearns and Washington Mutual.
In actions against the Firm involving offerings of MBS issued by the Firm, the Firm has contractual rights to indemnification from sellers of mortgage loans that were securitized in such offerings. However, certain of those indemnity rights may prove effectively unenforceable in various situations, such as where the loan sellers are now defunct.
The Firm has entered into agreements with a number of MBS trustees or entities that purchased MBS that toll applicable statute of limitations periods with respect to their claims, and has settled, and in the future may settle, tolled claims. There is no assurance that the Firm will not be named as a defendant in additional MBS-related litigation.
Derivative Action . A shareholder derivative action against the Firm, as nominal defendant, and certain of its current and former officers and members of its Board of Directors relating to the Firm's MBS activities is pending in California federal court. In June 2017, the court granted defendants' motion to dismiss the cause of action that alleged material misrepresentations and omissions in the Firm's proxy statement, found that the court did not have personal jurisdiction over the individual defendants with respect to the remaining causes of action, and transferred that remaining portion of the case to the United States District Court for the Southern District of New York without ruling on the merits.
Government Enforcement Investigations and Litigation . The Firm is responding to an ongoing investigation being conducted by the DOJ's Criminal Division and two United States Attorney's Offices relating to MBS offerings securitized and sold by the Firm and its subsidiaries.
Mortgage-Related Investigations and Litigation. In January 2017, a Consent Order was entered by the United States District Court for the Southern District of New York resolving allegations by the Civil Division of the United States Attorney's Office for the Southern District of New York that the Firm violated the Fair Housing Act and Equal Credit Opportunity Act by giving pricing discretion to independent mortgage brokers in its wholesale lending origination channel which, according to the government's model, may have charged higher fees and interest rates to African-American and Hispanic borrowers than non-Hispanic White borrowers during the period between 2006 and 2009. The Firm denied liability, but agreed to pay a total of approximately $55 million to resolve this matter. In addition, three municipalities have commenced litigation against the Firm alleging violations of an unfair competition law or the Fair Housing Act. The municipalities seek, among
other things, civil penalties for the unfair competition claim, and, for the Fair Housing Act claims, damages resulting from lost tax revenue and increased municipal costs associated with foreclosed properties. Two of the municipal actions were stayed pending an appeal to the United States Supreme Court. In May 2017, the Supreme Court held that the City of Miami has standing to bring claims under the Fair Housing Act, and remanded the case to the lower court to determine whether the City sufficiently alleged that the defendant's conduct proximately caused the alleged damages. In the two stayed municipal actions against the Firm, one remains stayed pending the resolution of the City of Miami case on remand, and in the other, the municipality has moved to reopen the case, which the Firm has opposed. The third municipal action against the Firm was stayed pending an appeal by the City of Los Angeles to the United States Court of Appeals for the Ninth Circuit in a related action. In May 2017, the Court of Appeals affirmed judgments against the City of Los Angeles and in favor of the defendants, and following that decision, the court has lifted the stay in the action against the Firm.
Municipal Derivatives Litigation. Several civil actions were commenced in New York and Alabama courts against the Firm relating to certain Jefferson County, Alabama (the "County") warrant underwritings and swap transactions. The claims in the civil actions generally alleged that the Firm made payments to certain third parties in exchange for being chosen to underwrite more than $3 billion in warrants issued by the County and to act as the counterparty for certain swaps executed by the County. The County filed for bankruptcy in November 2011. In June 2013, the County filed a Chapter 9 Plan of Adjustment, as amended (the "Plan of Adjustment"), which provided that all the above-described actions against the Firm would be released and dismissed with prejudice. In November 2013, the Bankruptcy Court confirmed the Plan of Adjustment, and in December 2013, certain sewer rate payers filed an appeal challenging the confirmation of the Plan of Adjustment. All conditions to the Plan of Adjustment's effectiveness, including the dismissal of the actions against the Firm, were satisfied or waived and the transactions contemplated by the Plan of Adjustment occurred in December 2013. Accordingly, all the above-described actions against the Firm have been dismissed pursuant to the terms of the Plan of Adjustment. The appeal of the Bankruptcy Court's order confirming the Plan of Adjustment remains pending.
Petters Bankruptcy and Related Matters. JPMorgan Chase and certain of its affiliates, including One Equity Partners ("OEP"), were named as defendants in several actions filed in connection with the receivership and bankruptcy proceedings pertaining to Thomas J. Petters and certain affiliated entities (collectively, "Petters") and the Polaroid Corporation. The principal actions against JPMorgan Chase and its affiliates were brought by a court-appointed receiver for Petters and the trustees in bankruptcy proceedings for three Petters entities. These actions generally sought to avoid certain putative transfers in connection with (i) the
160
2005 acquisition by Petters of Polaroid, which at the time was majority-owned by OEP; (ii) two credit facilities that JPMorgan Chase and other financial institutions entered into with Polaroid; and (iii) a credit line and investment accounts held by Petters. In January 2017, the Court substantially denied the defendants' motion to dismiss an amended complaint filed by the plaintiffs. In October 2017, JPMorgan Chase and its affiliates reached an agreement in principle to settle the litigation brought by the Petters bankruptcy trustees, or their successors, and the receiver for Thomas J. Petters. The settlement is subject to final documentation and Court approval.
Proprietary Products Investigations and Litigation. In December 2015, JPMorgan Chase Bank, N.A. and J.P. Morgan Securities LLC agreed to a settlement with the SEC, and JPMorgan Chase Bank, N.A. agreed to a settlement with the CFTC, regarding disclosures to clients concerning conflicts associated with the Firm's sale and use of proprietary products, such as J.P. Morgan mutual funds, in the Firm's CCB and AWM wealth management businesses, and the U.S. Private Bank's disclosures concerning the use of hedge funds that pay placement agent fees to JPMorgan Chase broker-dealer affiliates. The Firm settled with an additional government authority in July 2016, and continues to cooperate with inquiries from other government authorities concerning disclosure of conflicts associated with the Firm's sale and use of proprietary products. A putative class action, which was filed in the United States District Court for the Northern District of Illinois on behalf of financial advisory clients from 2007 to the present whose funds were invested in proprietary funds and who were charged investment management fees, was dismissed by the Court. The dismissal was affirmed on appeal, and the United States Supreme Court has denied plaintiffs' petition for writ of certiorari.
Referral Hiring Practices Investigations. In November 2016, the Firm entered into settlements with DOJ, the SEC and the Board of Governors of the Federal Reserve System (the "Federal Reserve") to resolve those agencies' respective investigations relating to a former hiring program for candidates referred by clients, potential clients and government officials in the Asia Pacific region. Other related investigations are ongoing, and the Firm continues to cooperate with these investigations.
Wendel. Since 2012, the French criminal authorities have been investigating a series of transactions entered into by senior managers of Wendel Investissement ("Wendel") during the period from 2004 through 2007 to restructure their shareholdings in Wendel. JPMorgan Chase Bank, N.A., Paris branch provided financing for the transactions to a number of managers of Wendel in 2007. JPMorgan Chase has cooperated with the investigation. The investigating judges issued an ordonnance de renvoi in November 2016, referring JPMorgan Chase Bank, N.A. to the French tribunal correctionnel for alleged complicity in tax fraud. No date for trial has been set by the court. The Firm has been successful in legal challenges made to the Court of
Cassation, France's highest court, which have been referred back to and remain pending before the Paris Court of Appeal. In addition, civil proceedings have been commenced against JPMorgan Chase Bank, N.A. by a number of the managers. The claims are separate, involve different allegations and are at various stages of proceedings.
* * *
In addition to the various legal proceedings discussed above, JPMorgan Chase and its subsidiaries are named as defendants or are otherwise involved in a substantial number of other legal proceedings. The Firm believes it has meritorious defenses to the claims asserted against it in its currently outstanding legal proceedings and it intends to defend itself vigorously. Additional legal proceedings may be initiated from time to time in the future.
The Firm has established reserves for several hundred of its currently outstanding legal proceedings. In accordance with the provisions of U.S. GAAP for contingencies, the Firm accrues for a litigation-related liability when it is probable that such a liability has been incurred and the amount of the loss can be reasonably estimated. The Firm evaluates its outstanding legal proceedings each quarter to assess its litigation reserves, and makes adjustments in such reserves, upwards or downward, as appropriate, based on management's best judgment after consultation with counsel. The Firm's legal expense was a benefit of $(107) million and $(71) million for the three months ended September 30, 2017 and 2016 , respectively, and an expense of $172 million and a benefit of $(547) million for the nine months ended September 30, 2017 and 2016 , respectively. There is no assurance that the Firm's litigation reserves will not need to be adjusted in the future.
In view of the inherent difficulty of predicting the outcome of legal proceedings, particularly where the claimants seek very large or indeterminate damages, or where the matters present novel legal theories, involve a large number of parties or are in early stages of discovery, the Firm cannot state with confidence what will be the eventual outcomes of the currently pending matters, the timing of their ultimate resolution or the eventual losses, fines, penalties or consequences related to those matters. JPMorgan Chase believes, based upon its current knowledge, after consultation with counsel and after taking into account its current litigation reserves, that the legal proceedings currently pending against it should not have a material adverse effect on the Firm's consolidated financial condition. The Firm notes, however, that in light of the uncertainties involved in such proceedings, there is no assurance that the ultimate resolution of these matters will not significantly exceed the reserves it has currently accrued or that a matter will not have material reputational consequences. As a result, the outcome of a particular matter may be material to JPMorgan Chase's operating results for a particular period, depending on, among other factors, the size of the loss or liability imposed and the level of JPMorgan Chase's income for that period.
161
Note 22 – Business segments
The Firm is managed on a line of business basis. There are four major reportable business segments - Consumer & Community Banking, Corporate & Investment Bank, Commercial Banking and Asset & Wealth Management. In addition, there is a Corporate segment.
The business segments are determined based on the products and services provided, or the type of customer served, and they reflect the manner in which financial information is currently evaluated by management. Results of these lines of business are presented on a managed basis. For a further discussion concerning JPMorgan Chase 's business segments, see Segment results below, and Note 33 of JPMorgan Chase 's 2016 Annual Report.
Segment results
The following table provides a summary of the Firm's segment results as of or for the three and nine months ended September 30, 2017 and 2016, on a managed basis. The Firm's definition of managed basis starts with the reported U.S. GAAP results and includes certain reclassifications to present total net revenue for the Firm (and each of the reportable business segments) on a FTE basis. Accordingly, revenue from investments that receive tax credits and tax-
exempt securities is presented in the managed results on a basis comparable to taxable investments and securities. This allows management to assess the comparability of revenue from year-to-year arising from both taxable and tax-exempt sources. The corresponding income tax impact related to tax-exempt items is recorded within income tax expense. These adjustments have no impact on net income as reported by the Firm as a whole or by the lines of business.
Effective January 1, 2017, the Firm's methodology used to allocate capital to the business segments was updated. Under the new methodology, capital is no longer allocated to each line of business for goodwill and other intangibles associated with acquisitions effected by the line of business. In addition, the new methodology incorporates Basel III Standardized Fully Phased-In RWA (as well as Basel III Advanced Fully Phased-In RWA), leverage, the global systemically important banks ("GSIB") surcharge, and a simulation of capital in a severe stress environment. The methodology will continue to be weighted towards Basel III Advanced Fully Phased-In RWA because the Firm believes it to be the best proxy for economic risk.
Segment results and reconciliation (a) | |||||||||||||||||||||||||||
As of or for the three months ended September 30, | Consumer & |
| Corporate & |
| Commercial Banking |
| Asset & Wealth Management | ||||||||||||||||||||
2017 | | 2016 | |
| 2017 | | 2016 | |
| 2017 | | 2016 | |
| 2017 | | 2016 | | |||||||||
Noninterest revenue | $ | 3,898 | | $ | 3,868 | |
| $ | 6,094 | | $ | 6,690 | |
| $ | 592 | | $ | 578 | |
| $ | 2,390 | | $ | 2,277 | |
Net interest income | 8,135 | | 7,460 | |
| 2,496 | | 2,765 | |
| 1,554 | | 1,292 | |
| 855 | | 770 | | ||||||||
Total net revenue | 12,033 | | 11,328 | |
| 8,590 | | 9,455 | |
| 2,146 | | 1,870 | |
| 3,245 | | 3,047 | | ||||||||
Provision for credit losses | 1,517 | | 1,294 | |
| (26 | ) | 67 | |
| (47 | ) | (121 | ) |
| 8 | | 32 | | ||||||||
Noninterest expense | 6,495 | | 6,510 | |
| 4,768 | | 4,934 | |
| 800 | | 746 | |
| 2,181 | | 2,130 | | ||||||||
Income before income tax expense | 4,021 | | 3,524 | |
| 3,848 | | 4,454 | |
| 1,393 | | 1,245 | |
| 1,056 | | 885 | | ||||||||
Income tax expense | 1,468 | | 1,320 | |
| 1,302 | | 1,542 | |
| 512 | | 467 | |
| 382 | | 328 | | ||||||||
Net income | $ | 2,553 | | $ | 2,204 | |
| $ | 2,546 | | $ | 2,912 | |
| $ | 881 | | $ | 778 | |
| $ | 674 | | $ | 557 | |
Average equity | $ | 51,000 | | $ | 51,000 | |
| $ | 70,000 | | $ | 64,000 | |
| $ | 20,000 | | $ | 16,000 | |
| $ | 9,000 | | $ | 9,000 | |
Total assets | 537,459 | | 521,276 | |
| 851,808 | | 825,933 | |
| 220,064 | | 212,189 | |
| 149,170 | | 137,295 | | ||||||||
Return on equity | 19 | % | 16 | % |
| 13 | % | 17 | % |
| 17 | % | 18 | % |
| 29 | % | 24 | % | ||||||||
Overhead ratio | 54 | | 57 | |
| 56 | | 52 | |
| 37 | | 40 | |
| 67 | | 70 | | ||||||||
As of or for the three months ended September 30, | Corporate |
| Reconciling Items (a) |
| Total | |||||||||||||||
2017 | | 2016 | |
| 2017 | | 2016 | |
| 2017 | | 2016 | | |||||||
Noninterest revenue | $ | 109 | | $ | 197 | |
| $ | (555 | ) | $ | (540 | ) |
| $ | 12,528 | | $ | 13,070 | |
Net interest income | 77 | | (385 | ) |
| (319 | ) | $ | (299 | ) |
| 12,798 | | 11,603 | | |||||
Total net revenue | 186 | | (188 | ) |
| (874 | ) | $ | (839 | ) |
| 25,326 | | 24,673 | | |||||
Provision for credit losses | - | | (1 | ) |
| - | | - | |
| 1,452 | | 1,271 | | ||||||
Noninterest expense | 74 | | 143 | |
| - | | - | |
| 14,318 | | 14,463 | | ||||||
Income/(loss) before income tax expense/(benefit) | 112 | | (330 | ) |
| (874 | ) | (839 | ) |
| 9,556 | | 8,939 | | ||||||
Income tax expense/(benefit) | 34 | | (165 | ) |
| (874 | ) | (839 | ) |
| 2,824 | | 2,653 | | ||||||
Net income/(loss) | $ | 78 | | $ | (165 | ) |
| $ | - | | $ | - | |
| $ | 6,732 | | $ | 6,286 | |
Average equity | $ | 81,861 | | $ | 86,089 | |
| $ | - | | $ | - | |
| $ | 231,861 | | $ | 226,089 | |
Total assets | 804,573 | | 824,336 | |
| NA | | NA | |
| 2,563,074 | | 2,521,029 | | ||||||
Return on equity | NM | | NM | |
| NM | | NM | |
| 11 | % | 10 | % | ||||||
Overhead ratio | NM | | NM | |
| NM | | NM | |
| 57 | | 59 | | ||||||
(a) | Segment managed results reflect revenue on a FTE basis with the corresponding income tax impact recorded within income tax expense/(benefit). These adjustments are eliminated in reconciling items to arrive at the Firm's reported U.S. GAAP results. |
162
Segment results and reconciliation (a) | |||||||||||||||||||||||||||
As of or for the nine months ended September 30, | Consumer & Community Banking |
| Corporate & Investment Bank |
| Commercial Banking |
| Asset & Wealth Management | ||||||||||||||||||||
2017 | | 2016 | |
| 2017 | | 2016 | |
| 2017 | | 2016 | |
| 2017 | | 2016 | | |||||||||
Noninterest revenue | $ | 10,899 | | $ | 11,812 | |
| $ | 19,474 | | $ | 18,699 | |
| $ | 1,774 | | $ | 1,720 | |
| $ | 7,024 | | $ | 6,714 | |
Net interest income | 23,516 | | 22,084 | |
| 7,541 | | 8,056 | |
| 4,478 | | 3,770 | |
| 2,520 | | 2,244 | | ||||||||
Total net revenue | 34,415 | | 33,896 | |
| 27,015 | | 26,755 | |
| 6,252 | | 5,490 | |
| 9,544 | | 8,958 | | ||||||||
Provision for credit losses | 4,341 | | 3,545 | |
| (175 | ) | 761 | |
| (214 | ) | 158 | |
| 30 | | 37 | | ||||||||
Noninterest expense | 19,390 | | 18,602 | |
| 14,730 | | 14,820 | |
| 2,415 | | 2,190 | |
| 6,953 | | 6,303 | | ||||||||
Income before income tax expense | 10,684 | | 11,749 | |
| 12,460 | | 11,174 | |
| 4,051 | | 3,142 | |
| 2,561 | | 2,618 | | ||||||||
Income tax expense | 3,920 | | 4,399 | |
| 3,963 | | 3,790 | |
| 1,469 | | 1,172 | |
| 878 | | 953 | | ||||||||
Net income | $ | 6,764 | | $ | 7,350 | |
| $ | 8,497 | | $ | 7,384 | |
| $ | 2,582 | | $ | 1,970 | |
| $ | 1,683 | | $ | 1,665 | |
Average equity | $ | 51,000 | | $ | 51,000 | |
| $ | 70,000 | | $ | 64,000 | |
| $ | 20,000 | | $ | 16,000 | |
| $ | 9,000 | | $ | 9,000 | |
Total assets | 537,459 | | 521,276 | |
| 851,808 | | 825,933 | |
| 220,064 | | 212,189 | |
| 149,170 | | 137,295 | | ||||||||
Return on equity | 17 | % | 18 | % |
| 15 | % | 14 | % |
| 16 | % | 15 | % |
| 24 | % | 24 | % | ||||||||
Overhead ratio | 56 | | 55 | |
| 55 | | 55 | |
| 39 | | 40 | |
| 73 | | 70 | | ||||||||
As of or for the nine months ended September 30, | Corporate |
| Reconciling Items (a) |
| Total | |||||||||||||||
2017 | | 2016 | |
| 2017 | | 2016 | |
| 2017 | | 2016 | | |||||||
Noninterest revenue | $ | 963 | | $ | 637 | |
| $ | (1,733 | ) | $ | (1,620 | ) |
| $ | 38,401 | | $ | 37,962 | |
Net interest income | 2 | | (927 | ) |
| (987 | ) | (897 | ) |
| 37,070 | | 34,330 | | ||||||
Total net revenue | 965 | | (290 | ) |
| (2,720 | ) | (2,517 | ) |
| 75,471 | | 72,292 | | ||||||
Provision for credit losses | - | | (4 | ) |
| - | | - | |
| 3,982 | | 4,497 | | ||||||
Noninterest expense | 355 | | 23 | |
| - | | - | |
| 43,843 | | 41,938 | | ||||||
Income/(loss) before income tax expense/(benefit) | 610 | | (309 | ) |
| (2,720 | ) | (2,517 | ) |
| 27,646 | | 25,857 | | ||||||
Income tax expense/(benefit) | (73 | ) | 54 | |
| (2,720 | ) | (2,517 | ) |
| 7,437 | | 7,851 | | ||||||
Net income/(loss) | $ | 683 | | $ | (363 | ) |
| $ | - | | $ | - | |
| $ | 20,209 | | $ | 18,006 | |
Average equity | $ | 79,937 | | $ | 84,034 | |
| $ | - | | $ | - | |
| $ | 229,937 | | $ | 224,034 | |
Total assets | 804,573 | | 824,336 | |
| NA | | NA | |
| 2,563,074 | | 2,521,029 | | ||||||
Return on equity | NM | | NM | |
| NM | | NM | |
| 11 | % | 10 | % | ||||||
Overhead ratio | NM | | NM | |
| NM | | NM | |
| 58 | | 58 | | ||||||
(a) | Segment managed results reflect revenue on a FTE basis with the corresponding income tax impact recorded within income tax expense/(benefit). These FTE adjustments are eliminated in reconciling items to arrive at the Firm's reported U.S. GAAP results. |
163
Note 23 – Business changes and developments
Student loan portfolio transfer and sale
The Firm transferred the student loan portfolio to held-for-sale in the first quarter of 2017. The transfer resulted in a write-down of the portfolio to the estimated fair value at the time of the transfer. This write-down was recognized predominantly as a $467 million charge-off, resulting in a $218 million increase in the provision for credit losses after utilization of the allowance for loan losses of $249 million in the first quarter of 2017. The Firm sold substantially all of the portfolio in the second quarter of 2017, and such sale did not have a material impact on the Firm's Consolidated Financial Statements.
Preferred stock issuance and redemption
On October 20, 2017, the Firm issued $1.3 billion of fixed-to-floating rate non-cumulative preferred stock, Series CC, with an initial dividend rate of 4.625% . On October 31, 2017, the Firm announced that it will redeem all $1.3 billion of its outstanding 5.50% non-cumulative preferred stock, Series O, on December 1, 2017. For additional information on the Firm's preferred stock, see Note 22 of JPMorgan Chase's 2016 Annual Report.
164

Report of Independent Registered Public Accounting Firm
To the Board of Directors and Stockholders of JPMorgan Chase & Co.:
We have reviewed the accompanying consolidated balance sheet of JPMorgan Chase & Co. and its subsidiaries (the
"Firm") as of September 30, 2017, and the related consolidated statements of income and comprehensive income for the three-month and nine-month periods ended September 30, 2017 and 2016 and changes in stockholders' equity, and cash flows for the nine-month periods ended September 30, 2017 and 2016. These interim financial statements are the responsibility of the Firm's management.
We conducted our review in accordance with the standards of the Public Company Accounting Oversight Board (United States). A review of interim financial information consists principally of applying analytical procedures and making inquiries of persons responsible for financial and accounting matters. It is substantially less in scope than an audit conducted in accordance with the standards of the Public Company Accounting Oversight Board (United States), the objective of which is the expression of an opinion regarding the financial statements taken as a whole. Accordingly, we do not express such an opinion.
Based on our review, we are not aware of any material modifications that should be made to the accompanying consolidated interim financial statements for them to be in conformity with accounting principles generally accepted in the United States of America.
We previously audited, in accordance with the standards of the Public Company Accounting Oversight Board (United States), the consolidated balance sheet as of December 31, 2016, and the related consolidated statements of income, comprehensive income, changes in stockholders' equity, and cash flows for the year then ended (not presented herein), and in our report dated February 28, 2017, we expressed an unqualified opinion on those consolidated financial statements. In our opinion, the information set forth in the accompanying consolidated balance sheet information as of December 31, 2016, is fairly stated in all material respects in relation to the consolidated balance sheet from which it has been derived.

November 1, 2017
PricewaterhouseCoopers LLP, 300 Madison Avenue, New York, NY 10017
165
JPMorgan Chase & Co. | |||||||||||||||||||||
Consolidated average balance sheets, interest and rates | |||||||||||||||||||||
(Taxable-equivalent interest and rates; in millions, except rates) | |||||||||||||||||||||
|
|
|
| ||||||||||||||||||
| Three months ended September 30, 2017 |
| Three months ended September 30, 2016 | ||||||||||||||||||
| Average | Interest (e) |
| Rate |
| Average | Interest (e) |
| Rate | ||||||||||||
Assets |
|
|
|
|
|
|
|
|
|
|
| ||||||||||
Deposits with banks | $ | 455,255 | | $ | 1,256 | |
| 1.09 | % |
|
| $ | 409,176 | | $ | 448 | |
| 0.44 | % |
|
Federal funds sold and securities purchased under resale agreements | 188,594 | | 622 | |
| 1.31 | |
|
| 196,657 | | 566 | |
| 1.14 | |
| ||||
Securities borrowed | 95,597 | | - | | | - | |
|
| 102,790 | | (91 | ) | (g) | (0.35 | ) |
| ||||
Trading assets – debt instruments | 240,876 | | 1,974 | |
| 3.25 | |
|
| 219,816 | | 1,911 | |
| 3.46 | |
| ||||
Taxable securities | 216,011 | | 1,362 | |
| 2.50 | |
|
| 228,719 | | 1,365 | |
| 2.37 | |
| ||||
Nontaxable securities (a) | 45,106 | | 676 | |
| 5.95 | |
|
| 44,274 | | 657 | |
| 5.91 | |
| ||||
Total securities | 261,117 | | 2,038 | |
| 3.10 | | (f) |
| 272,993 | | 2,022 | |
| 2.95 | | (f) | ||||
Loans | 909,580 | | 10,591 | |
| 4.62 | |
|
| 874,396 | | 9,294 | |
| 4.23 | |
| ||||
Other assets (b) | 43,155 | | 525 | |
| 4.83 | |
|
| 40,665 | | 219 | |
| 2.14 | |
| ||||
Total interest-earning assets | 2,194,174 | | 17,006 | |
| 3.07 | |
|
| 2,116,493 | | 14,369 | |
| 2.70 | |
| ||||
Allowance for loan losses | (13,290 | ) |
|
|
|
|
| (14,046 | ) |
|
|
|
| ||||||||
Cash and due from banks | 20,222 | |
|
|
|
|
| 18,614 | |
|
|
|
| ||||||||
Trading assets – equity instruments | 119,463 | |
|
|
|
|
| 98,714 | |
|
|
|
| ||||||||
Trading assets – derivative receivables | 59,839 | |
|
|
|
|
| 72,520 | |
|
|
|
| ||||||||
Goodwill | 47,309 | |
|
|
|
|
| 47,302 | |
|
|
|
| ||||||||
Mortgage servicing rights | 5,662 | |
|
|
|
|
| 4,991 | |
|
|
|
| ||||||||
Other intangible assets | 818 | |
|
|
|
|
| 903 | |
|
|
|
| ||||||||
Other assets | 135,034 | |
|
|
|
|
| 131,471 | |
|
|
|
| ||||||||
Total assets | $ | 2,569,231 | |
|
|
|
|
| $ | 2,476,962 | |
|
|
|
| ||||||
Liabilities |
|
|
|
|
|
|
|
|
|
|
| ||||||||||
Interest-bearing deposits | $ | 1,029,534 | | $ | 837 | |
| 0.32 | % |
|
| $ | 932,738 | | $ | 340 | |
| 0.15 | % |
|
Federal funds purchased and securities loaned or sold under repurchase agreements | 181,851 | | 451 | |
| 0.98 | |
|
| 180,098 | | 286 | |
| 0.63 | |
| ||||
Commercial paper | 23,022 | | 83 | |
| 1.43 | |
|
| 13,798 | | 34 | |
| 0.97 | |
| ||||
Trading liabilities – debt, short-term and other liabilities (c)(d) | 198,674 | | 636 | |
| 1.27 | |
|
| 196,247 | | 285 | |
| 0.58 | |
| ||||
Beneficial interests issued by consolidated VIEs | 29,832 | | 123 | |
| 1.62 | |
|
| 42,462 | | 135 | |
| 1.26 | |
| ||||
Long-term debt | 294,626 | | 1,759 | |
| 2.37 | |
|
| 300,295 | | 1,387 | |
| 1.84 | |
| ||||
Total interest-bearing liabilities | 1,757,539 | | 3,889 | |
| 0.88 | |
|
| 1,665,638 | | 2,467 | |
| 0.59 | |
| ||||
Noninterest-bearing deposits | 401,489 | |
|
|
|
|
| 405,237 | |
|
|
|
| ||||||||
Trading liabilities – equity instruments (d) | 20,905 | |
|
|
|
|
| 22,262 | |
|
|
|
| ||||||||
Trading liabilities – derivative payables | 44,627 | |
|
|
|
|
| 54,552 | |
|
|
|
| ||||||||
All other liabilities, including the allowance for lending-related commitments | 86,742 | |
|
|
|
|
| 77,116 | |
|
|
|
| ||||||||
Total liabilities | 2,311,302 | |
|
|
|
|
| 2,224,805 | |
|
|
|
| ||||||||
Stockholders' equity |
|
|
|
|
|
|
|
|
|
|
| ||||||||||
Preferred stock | 26,068 | |
|
|
|
|
| 26,068 | |
|
|
|
| ||||||||
Common stockholders' equity | 231,861 | |
|
|
|
|
| 226,089 | |
|
|
|
| ||||||||
Total stockholders' equity | 257,929 | |
|
|
|
|
| 252,157 | |
|
|
|
| ||||||||
Total liabilities and stockholders' equity | $ | 2,569,231 | |
|
|
|
|
| $ | 2,476,962 | |
|
|
|
| ||||||
Interest rate spread |
|
|
| 2.19 | % |
|
|
|
|
| 2.11 | % |
| ||||||||
Net interest income and net yield on interest-earning assets |
| $ | 13,117 | |
| 2.37 | |
|
|
| $ | 11,902 | |
| 2.24 | |
| ||||
(a) | Represents securities which are tax exempt for U.S. federal income tax purposes. |
(b) | Includes margin loans. |
(c) | Includes largely brokerage customer payables, and to a lesser extent, other borrowed funds. |
(d) | Included trading liabilities – debt and equity instruments of $89.4 billion and $94.7 billion for the three months ended September 30, 2017 and 2016, respectively. |
(e) | Interest includes the effect of certain related hedging derivatives. Taxable-equivalent amounts are used where applicable. |
(f) | For the three months ended September 30, 2017 and 2016, the annualized rates for securities, based on amortized cost, were 3.14% and 3.02% , respectively; this does not give effect to changes in fair value that are reflected in accumulated other comprehensive income/(loss). |
(g) | Negative interest income and yield is related to client-driven demand for certain securities combined with the impact of low interest rates; this is matched book activity and the negative interest expense on the corresponding securities loaned is recognized in interest expense and reported within trading liabilities – debt, short-term and other liabilities. |
166
JPMorgan Chase & Co. | |||||||||||||||||||||
Consolidated average balance sheets, interest and rates | |||||||||||||||||||||
(Taxable-equivalent interest and rates; in millions, except rates) | |||||||||||||||||||||
|
|
|
| ||||||||||||||||||
| Nine months ended September 30, 2017 |
| Nine months ended September 30, 2016 | ||||||||||||||||||
| Average | Interest (e) |
| Rate |
| Average | Interest (e) |
| Rate | ||||||||||||
Assets |
|
|
|
|
|
|
|
|
|
|
| ||||||||||
Deposits with banks | $ | 438,475 | | $ | 2,986 | |
| 0.91 | % |
|
| $ | 384,217 | | $ | 1,374 | |
| 0.48 | % |
|
Federal funds sold and securities purchased under resale agreements | 192,922 | | 1,676 | |
| 1.16 | |
|
| 201,157 | | 1,696 | |
| 1.13 | |
| ||||
Securities borrowed | 93,708 | | (65 | ) | (f) | (0.09 | ) |
|
| 102,640 | | (279 | ) | (f) | (0.36 | ) |
| ||||
Trading assets – debt instruments | 233,884 | | 5,691 | |
| 3.25 | |
|
| 214,656 | | 5,505 | |
| 3.43 | |
| ||||
Taxable securities | 228,580 | | 4,202 | |
| 2.46 | |
|
| 234,889 | | 4,187 | |
| 2.38 | |
| ||||
Nontaxable securities (a) | 45,123 | | 2,086 | |
| 6.18 | |
|
| 44,263 | | 1,993 | |
| 6.01 | |
| ||||
Total securities | 273,703 | | 6,288 | |
| 3.07 | | (g) |
| 279,152 | | 6,180 | |
| 2.96 | | (g) | ||||
Loans | 902,216 | | 30,479 | |
| 4.52 | |
|
| 858,275 | | 27,233 | |
| 4.24 | |
| ||||
Other assets (b) | 42,612 | | 1,311 | |
| 4.11 | |
|
| 40,036 | | 623 | |
| 2.08 | |
| ||||
Total interest-earning assets | 2,177,520 | | 48,366 | |
| 2.97 | |
|
| 2,080,133 | | 42,332 | |
| 2.72 | |
| ||||
Allowance for loan losses | (13,453 | ) |
|
|
|
|
| (13,889 | ) |
|
|
|
| ||||||||
Cash and due from banks | 19,942 | |
|
|
|
|
| 18,505 | |
|
|
|
| ||||||||
Trading assets – equity instruments | 120,307 | |
|
|
|
|
| 94,555 | |
|
|
|
| ||||||||
Trading assets – derivative receivables | 59,824 | |
|
|
|
|
| 71,004 | |
|
|
|
| ||||||||
Goodwill | 47,297 | |
|
|
|
|
| 47,314 | |
|
|
|
| ||||||||
Mortgage servicing rights | 5,845 | |
|
|
|
|
| 5,472 | |
|
|
|
| ||||||||
Other intangible assets | 836 | |
|
|
|
|
| 938 | |
|
|
|
| ||||||||
Other assets | 135,891 | |
|
|
|
|
| 133,802 | |
|
|
|
| ||||||||
Total assets | $ | 2,554,009 | |
|
|
|
|
| $ | 2,437,834 | |
|
|
|
| ||||||
Liabilities |
|
|
|
|
|
|
|
|
|
|
| ||||||||||
Interest-bearing deposits | $ | 1,007,345 | | $ | 1,949 | |
| 0.26 | % |
|
| $ | 913,682 | | $ | 981 | |
| 0.14 | % |
|
Federal funds purchased and securities loaned or sold under repurchase agreements | 189,236 | | 1,131 | |
| 0.80 | |
|
| 176,081 | | 828 | |
| 0.63 | |
| ||||
Commercial paper | 18,653 | | 186 | |
| 1.33 | |
|
| 16,257 | | 105 | |
| 0.86 | |
| ||||
Trading liabilities – debt, short-term and other liabilities (c)(d) | 198,569 | | 1,622 | |
| 1.09 | |
|
| 197,537 | | 826 | |
| 0.56 | |
| ||||
Beneficial interests issued by consolidated VIEs | 34,197 | | 386 | |
| 1.51 | |
|
| 40,245 | | 366 | |
| 1.22 | |
| ||||
Long-term debt | 294,248 | | 5,035 | |
| 2.29 | |
|
| 293,418 | | 3,999 | |
| 1.82 | |
| ||||
Total interest-bearing liabilities | 1,742,248 | | 10,309 | |
| 0.79 | |
|
| 1,637,220 | | 7,105 | |
| 0.58 | |
| ||||
Noninterest-bearing deposits | 403,704 | |
|
|
|
|
| 398,814 | |
|
|
|
| ||||||||
Trading liabilities – equity instruments (d) | 20,441 | |
|
|
|
|
| 20,511 | |
|
|
|
| ||||||||
Trading liabilities – derivative payables | 45,900 | |
|
|
|
|
| 56,390 | |
|
|
|
| ||||||||
All other liabilities, including the allowance for lending-related commitments | 85,711 | |
|
|
|
|
| 74,797 | |
|
|
|
| ||||||||
Total liabilities | 2,298,004 | |
|
|
|
|
| 2,187,732 | |
|
|
|
| ||||||||
Stockholders' equity |
|
|
|
|
|
|
|
|
|
|
| ||||||||||
Preferred stock | 26,068 | |
|
|
|
|
| 26,068 | |
|
|
|
| ||||||||
Common stockholders' equity | 229,937 | |
|
|
|
|
| 224,034 | |
|
|
|
| ||||||||
Total stockholders' equity | 256,005 | |
|
|
|
|
| 250,102 | |
|
|
|
| ||||||||
Total liabilities and stockholders' equity | $ | 2,554,009 | |
|
|
|
|
| $ | 2,437,834 | |
|
|
|
| ||||||
Interest rate spread |
| | |
| 2.18 | % |
|
|
|
|
| 2.14 | % |
| |||||||
Net interest income and net yield on interest-earning assets |
| $ | 38,057 | |
| 2.34 | |
|
|
| $ | 35,227 | |
| 2.26 | |
| ||||
(a) | Represents securities which are tax exempt for U.S. federal income tax purposes. |
(b) | Includes margin loans. |
(c) | Includes largely brokerage customer payables, and to a lesser extent, other borrowed funds. |
(d) | Included trading liabilities - debt and equity instruments of $91.3 billion and $92.5 billion for the nine months ended September 30, 2017 and 2016, respectively. |
(e) | Interest includes the effect of certain related hedging derivatives. Taxable-equivalent amounts are used where applicable. |
(f) | Negative interest income and yield is related to client-driven demand for certain securities combined with the impact of low interest rates; this is matched book activity and the negative interest expense on the corresponding securities loaned is recognized in interest expense and reported within trading liabilities - debt, short-term and other liabilities. |
(g) | For the nine months ended September 30, 2017 and 2016, the annualized rates for securities, based on amortized cost, were 3.11% and 3.02% respectively; this does not give effect to changes in fair value that are reflected in accumulated other comprehensive income/(loss). |
167
GLOSSARY OF TERMS AND ACRONYMS | ||||
2016 Annual Report or 2016 Form 10-K: Annual report on Form 10-K for year ended December 31, 2016, filed with the U.S. Securities and Exchange Commission.
ABS: Asset-backed securities
Active foreclosures: Loans referred to foreclosure where formal foreclosure proceedings are ongoing. Includes both judicial and non-judicial states.
AFS: Available-for-sale
Allowance for loan losses to total loans: represents period-end allowance for loan losses divided by retained loans.
AOCI: Accumulated other comprehensive income/(loss)
ARM(s): Adjustable rate mortgage(s)
AWM: Asset & Wealth Management
Beneficial interests issued by consolidated VIEs: represents the interest of third-party holders of debt, equity securities, or other obligations, issued by VIEs that JPMorgan Chase consolidates.
Benefit obligation: refers to the projected benefit obligation for pension plans and the accumulated postretirement benefit obligation for OPEB plans.
BHC: Bank holding company
CB: Commercial Banking
CBB: Consumer & Business Banking
CCAR: Comprehensive Capital Analysis and Review
CCB: Consumer & Community Banking
CCP: "Central counterparty" is a clearing house that interposes itself between counterparties to contracts traded in one or more financial markets, becoming the buyer to every seller and the seller to every buyer and thereby ensuring the future performance of open contracts. A CCP becomes counterparty to trades with market participants through novation, an open offer system, or another legally binding arrangement.
CDS: Credit default swaps
CEO: Chief Executive Officer
CET1 Capital: Common Equity Tier 1 Capital
CFTC: Commodity Futures Trading Commission
CFO: Chief Financial Officer
Chase Bank USA, N.A.: Chase Bank USA, National Association
CIB: Corporate & Investment Bank
CIO: Chief Investment Office
Client deposits and other third party liabilities: Deposits, as well as deposits that are swept to on-balance sheet liabilities (e.g., commercial paper, federal funds purchased and securities loaned or sold under repurchase agreements) as part of client cash management programs.
CLO: Collateralized loan obligations
CLTV: Combined loan-to-value
Collateral-dependent: A loan is considered to be collateral-dependent when repayment of the loan is expected to be provided solely by the underlying collateral, rather than by cash flows from the borrower's operations, income or other resources.
Commercial Card: provides a wide range of payment services to corporate and public sector clients worldwide through the commercial card products. Services include procurement, corporate travel and entertainment, expense management services, and business-to-business payment solutions.
Core loans: represents loans considered central to the Firm's ongoing businesses; core loans exclude loans classified as trading assets, runoff portfolios, discontinued portfolios and portfolios the Firm has an intent to exit.
Credit derivatives: Financial instruments whose value is derived from the credit risk associated with the debt of a third party issuer (the reference entity) which allow one party (the protection purchaser) to transfer that risk to another party (the protection seller). Upon the occurrence of a credit event by the reference entity, which may include, among other events, the bankruptcy or failure to pay its obligations, or certain restructurings of the debt of the reference entity, neither party has recourse to the reference entity. The protection purchaser has recourse to the protection seller for the difference between the face value of the CDS contract and the fair value at the time of settling the credit derivative contract. The determination as to whether a credit event has occurred is generally made by the relevant International Swaps and Derivatives Association ("ISDA") Determinations Committee.
Criticized: Criticized loans, lending-related commitments and derivative receivables that are classified as special mention, substandard and doubtful categories for regulatory purposes and are generally consistent with a rating of CCC+/Caa1 and below, as defined by S&P and Moody's.
CRO: Chief Risk Officer
CVA: Credit valuation adjustments
DFAST: Dodd-Frank Act Stress Test
Dodd-Frank Act: Wall Street Reform and Consumer Protection Act
DOJ: U.S. Department of Justice
DOL: U.S. Department of Labor
DVA: Debit valuation adjustment
E&P: Exploration & Production
EC: European Commission
Eligible LTD: Long-term debt satisfying certain eligibility criteria
Embedded derivatives: are implicit or explicit terms or features of a financial instrument that affect some or all of the cash flows or the value of the instrument in a manner similar to a derivative. An instrument containing such terms
168
or features is referred to as a "hybrid." The component of the hybrid that is the non-derivative instrument is referred to as the "host." For example, callable debt is a hybrid instrument that contains a plain vanilla debt instrument (i.e., the host) and an embedded option that allows the issuer to redeem the debt issue at a specified date for a specified amount (i.e., the embedded derivative). However, a floating rate instrument is not a hybrid composed of a fixed-rate instrument and an interest rate swap.
ERISA: Employee Retirement Income Security Act of 1974
EPS: Earnings per share
Exchange-traded derivatives: Derivative contracts that are executed on an exchange and settled via a central clearing house.
Fannie Mae: Federal National Mortgage Association
FASB: Financial Accounting Standards Board
FCA: Financial Conduct Authority
FCC: Firmwide Control Committee
FDIA: Federal Depository Insurance Act
FDIC: Federal Deposit Insurance Corporation
Federal Reserve: The Board of the Governors of the Federal Reserve System
Fee share: Proportion of fee revenue based on estimates of investment banking fees generated across the industry from investment banking transactions in M&A, equity and debt underwriting, and loan syndications. Source: Dealogic, a third party provider of investment banking fee competitive analysis and volume-based league tables for the above noted industry products.
FFELP: Federal Family Education Loan Program
FFIEC: Federal Financial Institutions Examination Council
FHA: Federal Housing Administration
FHLB: Federal Home Loan Bank
FICO score: A measure of consumer credit risk based on information in consumer credit reports produced by Fair Isaac Corporation. Because certain aged data is excluded from credit reports based on rules in the Fair Credit Reporting Act, FICO scores may not reflect all historical information about a consumer.
Firm: JPMorgan Chase & Co.
Forward points: represents the interest rate differential between two currencies, which is either added to or subtracted from the current exchange rate (i.e., "spot rate") to determine the forward exchange rate.
Freddie Mac: Federal Home Loan Mortgage Corporation.
Free-standing derivatives: is a derivative contract entered into either separate and apart from any of the Firms other financial instruments or equity transactions. Or, in conjunction with some other transaction and is legally detachable and separately exercisable.
FSB: Financial Stability Board
FTE: Fully taxable-equivalent
FVA: Funding valuation adjustment
FX: Foreign exchange
G7: "Group of Seven nations": Countries in the G7 are Canada, France, Germany, Italy, Japan, the U.K. and the U.S.
G7 government securities: Securities issued by the government of one of the G7 nations.
Ginnie Mae: Government National Mortgage Association
GSE: Fannie Mae and Freddie Mac
GSIB: Globally systemically important banks
HAMP: Home affordable modification program
Headcount-related expense: Includes salary and benefits (excluding performance-based incentives), and other noncompensation costs related to employees.
HELOAN: Home equity loan
HELOC: Home equity line of credit
Home equity – senior lien: represents loans and commitments where JPMorgan Chase holds the first security interest on the property.
Home equity – junior lien: represents loans and commitments where JPMorgan Chase holds a security interest that is subordinate in rank to other liens.
HQLA: High quality liquid assets
HTM: Held-to-maturity
IDI: Insured depository institutions
IHC: JPMorgan Chase Holdings LLC, an intermediate holding company
Impaired loan: Impaired loans are loans measured at amortized cost, for which it is probable that the Firm will be unable to collect all amounts due, including principal and interest, according to the contractual terms of the agreement. Impaired loans include the following:
• | All wholesale nonaccrual loans |
• | All TDRs (both wholesale and consumer), including ones that have returned to accrual status |
Interchange income: A fee paid to a credit card issuer in the clearing and settlement of a sales or cash advance transaction.
Investment-grade: An indication of credit quality based on JPMorgan Chase's internal risk assessment system. "Investment grade" generally represents a risk profile similar to a rating of a "BBB-"/"Baa3" or better, as defined by independent rating agencies.
IR: Interest rate
ISDA: International Swaps and Derivatives Association
JPMorgan Chase: JPMorgan Chase & Co.
JPMorgan Chase Bank, N.A.: JPMorgan Chase Bank, National Association
JPMorgan Securities: J.P. Morgan Securities LLC
LCR: Liquidity coverage ratio
LGD: Loss given default
LIBOR: London Interbank Offered Rate
LLC: Limited Liability Company
169
LOB: Line of business
Loss emergence period: represents the time period between the date at which the loss is estimated to have been incurred and the realization of that loss.
LTIP: Long-term incentive plan
LTV: "Loan-to-value ratio" : For residential real estate loans, the relationship, expressed as a percentage, between the principal amount of a loan and the appraised value of the collateral (i.e., residential real estate) securing the loan.
Origination date LTV ratio
The LTV ratio at the origination date of the loan. Origination date LTV ratios are calculated based on the actual appraised values of collateral (i.e., loan-level data) at the origination date.
Current estimated LTV ratio
An estimate of the LTV as of a certain date. The current estimated LTV ratios are calculated using estimated collateral values derived from a nationally recognized home price index measured at the metropolitan statistical area ("MSA") level. These MSA-level home price indices consist of actual data to the extent available and forecasted data where actual data is not available. As a result, the estimated collateral values used to calculate these ratios do not represent actual appraised loan-level collateral values; as such, the resulting LTV ratios are necessarily imprecise and should therefore be viewed as estimates.
Combined LTV ratio
The LTV ratio considering all available lien positions, as well as unused lines, related to the property. Combined LTV ratios are used for junior lien home equity products.
Master netting agreement: An agreement between two counterparties who have multiple contracts with each other that provides for the net settlement of all contracts, as well as cash collateral, through a single payment, in a single currency, in the event of default on or termination of any one contract.
MBS: Mortgage-backed securities
MD&A: Management's discussion and analysis
MMDA: Money Market Deposit Accounts
Moody's: Moody's Investor Services
Mortgage product types:
Alt-A
Alt-A loans are generally higher in credit quality than subprime loans but have characteristics that would disqualify the borrower from a traditional prime loan. Alt-A lending characteristics may include one or more of the following: (i) limited documentation; (ii) a high CLTV ratio; (iii) loans secured by non-owner occupied properties; or (iv) a debt-to-income ratio above normal limits. A substantial proportion of the Firm's Alt-A loans are those where a borrower does not provide complete documentation of his or her assets or the amount or source of his or her income.
Option ARMs
The option ARM real estate loan product is an adjustable-rate mortgage loan that provides the borrower with the option each month to make a fully amortizing, interest-only or minimum payment. The minimum payment on an option ARM loan is based on the interest rate charged during the introductory period. This introductory rate is usually significantly below the fully indexed rate. The fully indexed rate is calculated using an index rate plus a margin. Once the introductory period ends, the contractual interest rate charged on the loan increases to the fully indexed rate and adjusts monthly to reflect movements in the index. The minimum payment is typically insufficient to cover interest accrued in the prior month, and any unpaid interest is deferred and added to the principal balance of the loan. Option ARM loans are subject to payment recast, which converts the loan to a variable-rate fully amortizing loan upon meeting specified loan balance and anniversary date triggers.
Prime
P rime mortgage loans are made to borrowers with good credit records who meet specific underwriting requirements, including prescriptive requirements related to income and overall debt levels. New prime mortgage borrowers provide full documentation and generally have reliable payment histories.
Subprime
Subprime loans are loans that, prior to mid-2008, were offered to certain customers with one or more high risk characteristics, including but not limited to: (i) unreliable or poor payment histories; (ii) a high LTV ratio of greater than 80% (without borrower-paid mortgage insurance); (iii) a high debt-to-income ratio; (iv) an occupancy type for the loan is other than the borrower's primary residence; or (v) a history of delinquencies or late payments on the loan.
MSA: Metropolitan statistical areas
MSR: Mortgage servicing rights
NA: Data is not applicable or available for the period presented.
Net Capital Rule: Rule 15c3-1 under the Securities Exchange Act of 1934.
Net charge-off/(recovery) rate: represents net charge-offs/(recoveries) (annualized) divided by average retained loans for the reporting period.
Net yield on interest-earning assets: The average rate for interest-earning assets less the average rate paid for all sources of funds.
NM: Not meaningful
NOL: Net operating loss
Nonaccrual loans: Loans for which interest income is not recognized on an accrual basis. Loans (other than credit card loans and certain consumer loans insured by U.S. government agencies) are placed on nonaccrual status when full payment of principal and interest is not expected, regardless of delinquency status, or when principal and interest has been in default for a period of 90 days or more
170
unless the loan is both well-secured and in the process of collection. Collateral-dependent loans are typically maintained on nonaccrual status.
Nonperforming assets: Nonperforming assets include nonaccrual loans, nonperforming derivatives and certain assets acquired in loan satisfactions, predominantly real estate owned and other commercial and personal property.
NOW: Negotiable Order of Withdrawal
NSFR: Net stable funding ratio
OAS: Option-adjusted spread
OCC: Office of the Comptroller of the Currency
OCI: Other comprehensive income/(loss)
OEP: One Equity Partners
OIS: Overnight index swap
OPEB: Other postretirement employee benefit
OTC: "Over-the-counter derivatives": Derivative contracts that are negotiated, executed and settled bilaterally between two derivative counterparties, where one or both counterparties is a derivatives dealer.
OTC cleared: "Over-the-counter cleared derivatives": Derivative contracts that are negotiated and executed bilaterally, but subsequently settled via a central clearing house, such that each derivative counterparty is only exposed to the default of that clearing house.
OTTI: Other-than-temporary impairment
Overhead ratio: Noninterest expense as a percentage of total net revenue.
Parent Company: JPMorgan Chase & Co.
Participating securities: represents unvested stock-based compensation awards containing nonforfeitable rights to dividends or dividend equivalents (collectively, "dividends"), which are included in the earnings per share calculation using the two-class method. JPMorgan Chase grants restricted stock and RSUs to certain employees under its stock-based compensation programs, which entitle the recipients to receive nonforfeitable dividends during the vesting period on a basis equivalent to the dividends paid to holders of common stock. These unvested awards meet the definition of participating securities. Under the two-class method, all earnings (distributed and undistributed) are allocated to each class of common stock and participating securities, based on their respective rights to receive dividends.
PCA: Prompt corrective action
PCI: "Purchased credit-impaired" loans represents loans that were acquired in the Washington Mutual transaction and deemed to be credit-impaired on the acquisition date in accordance with the guidance of the FASB. The guidance allows purchasers to aggregate credit-impaired loans acquired in the same fiscal quarter into one or more pools, provided that the loans have common risk characteristics (e.g., product type, LTV ratios, FICO scores, past due status, geographic location). A pool is then accounted for as a single asset with a single composite interest rate and an aggregate expectation of cash flows.
PD: Probability of default
PRA: Prudential Regulatory Authority
Pre-provision profit/(loss): represents total net revenue less noninterest expense. The Firm believes that this financial measure is useful in assessing the ability of a lending institution to generate income in excess of its provision for credit losses.
Principal transactions revenue: Principal transactions revenue is driven by many factors, including the bid-offer spread, which is the difference between the price at which the Firm is willing to buy a financial or other instrument and the price at which the Firm is willing to sell that instrument. It also consists of realized (as a result of closing out or termination of transactions, or interim cash payments) and unrealized (as a result of changes in valuation) gains and losses on financial and other instruments (including those accounted for under the fair value option) primarily used in client-driven market-making activities and on private equity investments. In connection with its client-driven market-making activities, the Firm transacts in debt and equity instruments, derivatives and commodities (including physical commodities inventories and financial instruments that reference commodities). Principal transactions revenue also includes certain realized and unrealized gains and losses related to hedge accounting and specified risk-management activities, including: (a) certain derivatives designated in qualifying hedge accounting relationships (primarily fair value hedges of commodity and foreign exchange risk), (b) certain derivatives used for specific risk management purposes, primarily to mitigate credit risk, foreign exchange risk and commodity risk, and (c) other derivatives.
PSU(s): Performance share units
Receivables from customers: primarily represents margin loans to brokerage customers that are collateralized through assets maintained in the clients' brokerage accounts, as such no allowance is held against these receivables. These receivables are reported within accrued interest and accounts receivable on the Firm's Consolidated balance sheets.
Regulatory VaR: Daily aggregated VaR calculated in accordance with regulatory rules.
REO: Real estate owned
Reported basis: Financial statements prepared under U.S. GAAP, which excludes the impact of taxable-equivalent adjustments.
Retained loans: Loans that are held-for-investment (i.e. excludes loans held-for-sale and loans at fair value).
Revenue wallet: Total fee revenue based on estimates of investment banking fees generated across the industry (i.e., the revenue wallet) from investment banking transactions in M&A, equity and debt underwriting, and loan syndications. Source: Dealogic, a third-party provider of investment banking competitive analysis and volume based league tables for the above noted industry products.
RHS: Rural Housing Service of the U.S. Department of Agriculture
171
ROE: Return on equity
ROTCE: Return on tangible common equity
RSU(s): Restricted stock units
RWA: "Risk-weighted assets": Basel III establishes two comprehensive methodologies for calculating RWA (a Standardized approach and an Advanced approach) which include capital requirements for credit risk, market risk, and in the case of Basel III Advanced, also operational risk. Key differences in the calculation of credit risk RWA between the Standardized and Advanced approaches are that for Basel III Advanced, credit risk RWA is based on risk-sensitive approaches which largely rely on the use of internal credit models and parameters, whereas for Basel III Standardized, credit risk RWA is generally based on supervisory risk-weightings which vary primarily by counterparty type and asset class. Market risk RWA is calculated on a generally consistent basis between Basel III Standardized and Basel III Advanced.
S&P: Standard and Poor's 500 Index
SAR(s): Stock appreciation rights
SCCL : Single-counterparty credit limits
SEC: Securities and Exchange Commission
Seed capital: Initial JPMorgan capital invested in products, such as mutual funds, with the intention of ensuring the fund is of sufficient size to represent a viable offering to clients, enabling pricing of its shares, and allowing the manager to develop a track record. After these goals are achieved, the intent is to remove the Firm's capital from the investment.
Short sale: is a sale of real estate in which proceeds from selling the underlying property are less than the amount owed the Firm under the terms of the related mortgage and the related lien is released upon receipt of such proceeds.
Single-name: Single reference-entities
SLR: Supplementary leverage ratio
SMBS: Stripped mortgage-backed securities
SOA: Society of Actuaries
SPEs: Special purpose entities
Structural interest rate risk: represents interest rate risk of the non-trading assets and liabilities of the Firm.
Structured notes: Structured notes are predominantly financial instruments containing embedded derivatives. Where present, the embedded derivative is the primary driver of risk.
Suspended foreclosures: Loans referred to foreclosure where formal foreclosure proceedings have started but are currently on hold, which could be due to bankruptcy or loss mitigation. Includes both judicial and non-judicial states.
Taxable-equivalent basis: In presenting managed results, the total net revenue for each of the business segments and the Firm is presented on a tax-equivalent basis. Accordingly, revenue from investments that receive tax credits and tax-exempt securities is presented in the managed results on a basis comparable to taxable investments and securities; the
corresponding income tax impact related to tax-exempt items is recorded within income tax expense.
TBVPS: Tangible book value per share
TCE: Tangible common equity
TDR: "Troubled debt restructuring" is deemed to occur when the Firm modifies the original terms of a loan agreement by granting a concession to a borrower that is experiencing financial difficulty.
TLAC: Total Loss Absorbing Capacity
U.K.: United Kingdom
Unaudited: Financial statements and information that have not been subjected to auditing procedures sufficient to permit an independent certified public accountant to express an opinion.
U.S.: United States of America
U.S. GAAP: Accounting principles generally accepted in the United States of America.
U.S. GSE(s): "U.S. government-sponsored enterprises": In the U.S., GSEs are quasi-governmental, privately-held entities established by Congress to improve the flow of credit to specific sectors of the economy and provide certain essential services to the public. U.S. GSEs include Fannie Mae and Freddie Mac, but do not include Ginnie Mae, which is directly owned by the U.S. Department of Housing and Urban Development. U.S. GSE obligations are not explicitly guaranteed as to the timely payment of principal and interest by the full faith and credit of the U.S. government.
U.S. Treasury: U.S. Department of the Treasury
VA: U.S. Department of Veterans Affairs
VaR: "Value-at-risk" is a measure of the dollar amount of potential loss from adverse market moves in an ordinary market environment.
VIEs: Variable interest entities
Warehouse loans: consist of prime mortgages originated with the intent to sell that are accounted for at fair value and classified as trading assets.
Washington Mutual transaction: On September 25, 2008, JPMorgan Chase acquired certain of the assets of the banking operations of Washington Mutual Bank ("Washington Mutual") from the FDIC.
172
LINE OF BUSINESS METRICS | ||||
CONSUMER & COMMUNITY BANKING ("CCB")
Households: A household is a collection of individuals or entities aggregated together by name, address, tax identifier and phone. Reported on a one-month lag.
Debit and credit card sales volume: Dollar amount of cardmember purchases, net of returns.
Deposit margin/deposit spread: represents net interest income expressed as a percentage of average deposits.
Mortgage Production and Mortgage Servicing revenue comprises the following:
Net production revenue: includes net gains or losses on originations and sales of mortgage loans, other production-related fees and losses related to the repurchase of previously-sold loans.
Net mortgage servicing revenue: includes the following components :
a) Operating revenue predominantly represents the return on Mortgage Servicing's MSR asset and includes:
• | Actual gross income earned from servicing third-party mortgage loans, such as contractually specified servicing fees and ancillary income; and |
• | The change in the fair value of the MSR asset due to the collection or realization of expected cash flows. |
b) Risk management represents the components of Mortgage Servicing's MSR asset that are subject to ongoing risk management activities, together with derivatives and other instruments used in those risk management activities.
Mortgage origination channels comprise the following:
Retail: Borrowers who buy or refinance a home through direct contact with a mortgage banker employed by the Firm using a branch office, the Internet or by phone. Borrowers are frequently referred to a mortgage banker by a banker in a Chase branch, real estate brokers, home builders or other third parties.
Correspondent: Banks, thrifts, other mortgage banks and other financial institutions that sell closed loans to the Firm.
Card Services: includes the Card and Commerce Solutions businesses.
Card: is a business that primarily issues credit cards to consumers and small businesses.
Commerce Solutions: is a business that primarily processes transactions for merchants.
Net revenue rate: represents Card Services net revenue (annualized) expressed as a percentage of average loans for the period.
Auto loan and lease origination volume : Dollar amount of auto loans and leases originated.
CORPORATE & INVESTMENT BANK ("CIB")
Definition of selected CIB revenue:
Investment Banking: incorporates all revenue associated with investment banking activities, and is reported net of investment banking revenue shared with other lines of business.
Treasury Services: offers a broad range of products and services that enable clients to manage payments and receipts, as well as invest and manage funds. Products include U.S. dollar and multi-currency clearing, ACH, lockbox, disbursement and reconciliation services, check deposits, and currency-related services.
Lending: includes net interest income, fees, gains or losses on loan sale activity, gains or losses on securities received as part of a loan restructuring, and the risk management results related to the credit portfolio. Lending also includes Trade Finance, which includes loans tied directly to goods crossing borders, export/import loans, commercial letters of credit, standby letters of credit, and supply chain finance.
Fixed Income Markets: primarily includes revenue related to market-making across global fixed income markets, including foreign exchange, interest rate, credit and commodities markets.
Equity Markets: primarily includes revenue related to market-making across global equity products, including cash instruments, derivatives, convertibles and Prime Services.
Securities Services: primarily includes custody, fund accounting and administration, and securities lending products sold principally to asset managers, insurance companies and public and private investment funds. Also includes clearance, collateral management and depositary receipts business which provides broker-dealer clearing and custody services, including tri-party repo transactions, collateral management products, and depositary bank services for American and global depositary receipt programs.
Description of certain business metrics:
Assets under custody ("AUC"): represents activities associated with the safekeeping and servicing of assets on which Securities Services earns fees.
Investment banking fees: represents advisory, equity underwriting, bond underwriting and loan syndication fees.
173
COMMERCIAL BANKING ("CB")
CB is divided into four primary client segments: Middle Market Banking, Corporate Client Banking, Commercial Term Lending, and Real Estate Banking .
Middle Market Banking: covers corporate, municipal and nonprofit clients, with annual revenue generally ranging between $20 million and $500 million.
Corporate Client Banking: covers clients with annual revenue generally ranging between $500 million and $2 billion and focuses on clients that have broader investment banking needs.
Commercial Term Lending: primarily provides term financing to real estate investors/owners for multifamily properties as well as office, retail and industrial properties.
Real Estate Banking: provides full-service banking to investors and developers of institutional-grade real estate investment properties.
Other: primarily includes lending and investment-related activities within the Community Development Banking business.
CB product revenue comprises the following:
Lending: includes a variety of financing alternatives, which are primarily provided on a secured basis; collateral includes receivables, inventory, equipment, real estate or other assets. Products include term loans, revolving lines of credit, bridge financing, asset-based structures, leases, and standby letters of credit.
Treasury services: includes revenue from a broad range of products and services that enable CB clients to manage payments and receipts, as well as invest and manage funds.
Investment banking: includes revenue from a range of products providing CB clients with sophisticated capital-raising alternatives, as well as balance sheet and risk management tools through advisory, equity underwriting, and loan syndications. Revenue from fixed income and equity market products used by CB clients is also included.
Other: product revenue primarily includes tax-equivalent adjustments generated from Community Development Banking activity and certain income derived from principal transactions.
ASSET & WEALTH MANAGEMENT ("AWM")
Assets under management ("AUM"): represent assets managed by AWM on behalf of its Private Banking, Institutional and Retail clients. Includes "Committed capital not Called."
Client assets: represent assets under management, as well as custody, brokerage, administration and deposit accounts.
Multi-asset: Any fund or account that allocates assets under management to more than one asset class.
Alternative assets: The following types of assets constitute alternative investments – hedge funds, currency, real estate, private equity and other investment funds designed to focus on nontraditional strategies.
AWM's lines of business consist of the following:
Asset Management: provides comprehensive global investment services - including asset management, pension analytics, asset-liability management and active risk-budgeting strategies.
Wealth Management: offers investment advice and wealth management, including investment management, capital markets and risk management, tax and estate planning, banking, lending and specialty-wealth advisory services.
AWM's client segments consist of the following:
Private Banking: clients include high- and ultra-high-net-worth individuals, families, money managers, business owners and small corporations worldwide.
Institutional: clients include both corporate and public institutions, endowments, foundations, nonprofit organizations and governments worldwide.
Retail: clients include financial intermediaries and individual investors.
174
Asset Management has two high-level measures of its overall fund performance:
Percentage of mutual fund assets under management in funds rated 4- or 5-star : Mutual fund rating services rank funds based on their risk-adjusted performance over various periods. A 5-star rating is the best rating and represents the top 10% of industry-wide ranked funds.
A 4-star rating represents the next 22.5% of industry-wide ranked funds. A 3-star rating represents the next 35% of industry-wide ranked funds. A 2-star rating represents the next 22.5% of industry-wide ranked funds. A 1-star rating is the worst rating and represents the bottom 10% of industry-wide ranked funds. The "overall Morningstar rating" is derived from a weighted average of the performance associated with a fund's three-, five- and ten-year (if applicable) Morningstar Rating metrics. For U.S. domiciled funds, separate star ratings are given at the individual share class level. The Nomura "star rating" is based on three-year risk-adjusted performance only. Funds with fewer than three years of history are not rated and hence excluded from this analysis. All ratings, the assigned peer categories and the asset values used to derive this analysis are sourced from these fund rating providers. The data providers re-denominate the asset values into U.S. dollars. This % of AUM is based on star ratings at the share class level for U.S. domiciled funds, and at a "primary share class" level to represent the star rating of all other funds except for Japan where Nomura provides ratings at the fund level. The "primary share class", as defined by Morningstar, denotes the share class recommended as being the best proxy for the portfolio and in most cases will be the most retail version (based upon annual management charge, minimum investment, currency and other factors). The performance data could have been different if all funds/accounts would have been included. Past performance is not indicative of future results.
Percentage of mutual fund assets under management in funds ranked in the 1st or 2nd quartile (one, three, and five years): All quartile rankings, the assigned peer categories and the asset values used to derive this analysis are sourced from the fund ranking providers. Quartile rankings are done on the net-of-fee absolute return of each fund. The data providers re-denominate the asset values into U.S. dollars. This % of AUM is based on fund performance and associated peer rankings at the share class level for U.S. domiciled funds, at a "primary share class" level to represent the quartile ranking of the U.K., Luxembourg and Hong Kong funds and at the fund level for all other funds. The "primary share class", as defined by Morningstar, denotes the share class recommended as being the best proxy for the portfolio and in most cases will be the most retail version (based upon annual management charge, minimum investment, currency and other factors). Where peer group rankings given for a fund are in more than one "primary share class" territory both rankings are included to reflect local market competitiveness (applies to "Offshore Territories" and "HK SFC Authorized" funds only). The performance data could have been different if all funds/accounts would have been included. Past performance is not indicative of future results.
175
Item 3. Quantitative and Qualitative Disclosures About Market Risk.
For a discussion of the quantitative and qualitative disclosures about market risk, see the Market Risk Management section of Management's discussion and analysis on pages 73–77 of this Form 10-Q and pages 116–123 of JPMorgan Chase 's 2016 Annual Report .
Item 4. Controls and Procedures.
As of the end of the period covered by this report, an evaluation was carried out under the supervision and with the participation of the Firm's management, including its Chairman and Chief Executive Officer and its Chief Financial Officer, of the effectiveness of its disclosure controls and procedures (as defined in Rule 13a-15(e) under the Securities Exchange Act of 1934). Based on that evaluation, the Chairman and Chief Executive Officer and the Chief Financial Officer concluded that these disclosure controls and procedures were effective. See Exhibits 31.1 and 31.2 for the Certification statements issued by the Chairman and Chief Executive Officer and Chief Financial Officer.
The Firm is committed to maintaining high standards of internal control over financial reporting. Nevertheless, because of its inherent limitations, internal control over financial reporting may not prevent or detect misstatements. In addition, in a firm as large and complex as JPMorgan Chase, lapses or deficiencies in internal controls do occur from time to time, and there can be no assurance that any such deficiencies will not result in significant deficiencies or material weaknesses in internal controls in the future. For further information, see "Management's report on internal control over financial reporting" on page 139 of JPMorgan Chase's 2016 Annual Report. There was no change in the Firm's internal control over financial reporting (as defined in Rule 13a-15(f) under the Securities Exchange Act of 1934) that occurred during the three months ended September 30, 2017 , that has materially affected, or is reasonably likely to materially affect, the Firm's internal control over financial reporting.
Part II – Other Information
Item 1. Legal Proceedings.
For information that updates the disclosures set forth under Part I, Item 3: Legal Proceedings, in JPMorgan Chase's 2016 Annual Report on Form 10-K , see the discussion of the Firm's material legal proceedings in Note 21 of this Form 10-Q .
Item 1A. Risk Factors.
For a discussion of certain risk factors affecting the Firm, see Part I, Item 1A: Risk Factors on pages 8–21 of JPMorgan Chase 's 2016 Annual Report on Form 10-K and Forward-Looking Statements on page 82 of this Form 10-Q .
Supervision and regulation
For information on Supervision and Regulation, see the Supervision and regulation section on pages 1–8 of JPMorgan Chase's 2016 Form 10-K.
Item 2. Unregistered Sales of Equity Securities and Use of Proceeds.
During the three months ended September 30, 2017 , no shares of common stock of JPMorgan Chase & Co. were issued in transactions exempt from registration under the Securities Act of 1933, pursuant to Section 4(2) thereof.
Repurchases under the common equity repurchase program
Following receipt in June 2017 of the Federal Reserve's non-objection to the Firm's 2017 capital plan, the Firm's Board of Directors authorized the repurchase of up to $19.4 billion of common equity (common stock and warrants) between July 1, 2017 and June 30, 2018. This authorization includes shares repurchased to offset issuances under the Firm's equity-based compensation plans.
The following table sets forth the Firm's repurchases of common equity for the three and nine months ended September 30, 2017 and 2016 . There were no warrants repurchased during the nine months ended September 30, 2017 and 2016 .
|
| Three months ended September 30, |
| Nine months ended September 30, | ||||||||||
(in millions) |
| 2017 | | 2016 | |
| 2017 | 2016 | ||||||
Total shares of common stock repurchased |
| 51.7 | | 35.6 | |
| 118.8 | | 110.6 | | ||||
Aggregate common stock repurchases |
| $ | 4,763 | | $ | 2,295 | |
| $ | 10,602 | | $ | 6,831 | |
The Firm may, from time to time, enter into written trading plans under Rule 10b5-1 of the Securities Exchange Act of 1934 to facilitate repurchases in accordance with the common equity repurchase program. A Rule 10b5-1 repurchase plan allows the Firm to repurchase its equity during periods when it would not otherwise be repurchasing common equity - for example, during internal trading blackout periods. All purchases under Rule 10b5-1 plans must be made according to predefined plans established when the Firm is not aware of material nonpublic information.
176
The authorization to repurchase common equity will be utilized at management's discretion, and the timing of purchases and the exact amount of common equity that may be repurchased is subject to various factors, including market conditions; legal and regulatory considerations affecting the amount and timing of repurchase activity; the Firm's capital position (taking into account goodwill and intangibles); internal capital generation; and alternative
investment opportunities. The repurchase program does not include specific price targets or timetables; may be executed through open market purchases or privately negotiated transactions, or utilizing Rule 10b5-1 programs; and may be suspended at any time.
Shares repurchased pursuant to the common equity repurchase program during the nine months ended September 30, 2017 , were as follows.
Nine months ended September 30, 2017 | Total shares of common stock repurchased |
| Average price paid per share of common stock (a) |
| Aggregate repurchases of common equity (in millions) (a) |
| Dollar value of remaining authorized repurchase (in millions) (a) |
| |||||||
First quarter | 32,132,964 | |
| $ | 88.14 | |
| $ | 2,832 | |
| $ | 3,221 | | (b) |
Second quarter | 34,940,127 | |
| 86.05 | |
| 3,007 | |
| 214 | | (c) | |||
July | 14,353,325 | |
| 92.05 | |
| 1,321 | |
| 18,079 | |
| |||
August | 20,326,765 | |
| 92.25 | |
| 1,875 | |
| 16,204 | |
| |||
September | 17,076,802 | |
| 91.72 | |
| 1,567 | |
| 14,637 | |
| |||
Third quarter | 51,756,892 | |
| 92.02 | |
| 4,763 | |
| 14,637 | |
| |||
Year-to-date | 118,829,983 | |
| $ | 89.22 | |
| $ | 10,602 | |
| $ | 14,637 | |
|
(a) | Excludes commissions cost. |
(b) | Represents the amount remaining under the $10.6 billion repurchase program that was authorized by the Board of Directors on June 29, 2016. |
(c) | The $214 million unused portion under the prior Board authorization was canceled when the $19.4 billion program was authorized. |
Item 3. Defaults Upon Senior Securities.
None.
Item 4. Mine Safety Disclosures.
Not applicable.
Item 5. Other Information.
None.
177
Item 6. Exhibits.
Exhibit No. |
| Description of Exhibit |
|
|
|
15 |
| Letter re: Unaudited Interim Financial Information.(a) |
|
|
|
31.1 |
| Certification.(a) |
|
|
|
31.2 |
| Certification.(a) |
|
|
|
32 |
| Certification Pursuant to Section 906 of the Sarbanes-Oxley Act of 2002.(b) |
|
|
|
101.INS |
| XBRL Instance Document. (a)(c) |
101.SCH |
| XBRL Taxonomy Extension Schema Document. (a) |
101.CAL |
| XBRL Taxonomy Extension Calculation Linkbase Document. (a) |
101.DEF |
| XBRL Taxonomy Extension Definition Linkbase Document. (a) |
101.LAB |
| XBRL Taxonomy Extension Label Linkbase Document. (a) |
101.PRE |
| XBRL Taxonomy Extension Presentation Linkbase Document. (a) |
(a) | Filed herewith. |
(b) | Furnished herewith. This exhibit shall not be deemed "filed" for purposes of Section 18 of the Securities Exchange Act of 1934, or otherwise subject to the liability of that Section. Such exhibit shall not be deemed incorporated into any filing under the Securities Act of 1933 or the Securities Exchange Act of 1934. |
(c) | Pursuant to Rule 405 of Regulation S-T, includes the following financial information included in the Firm's Quarterly Report on Form 10-Q for the quarterly period ended September 30, 2017 , formatted in XBRL (eXtensible Business Reporting Language) interactive data files: (i) the Consolidated statements of income (unaudited) for the three and nine months ended September 30, 2017 and 2016 , (ii) the Consolidated statements of comprehensive income (unaudited) for the three and nine months ended September 30, 2017 and 2016 , (iii) the Consolidated balance sheets (unaudited) as of September 30, 2017 , and December 31, 2016 , (iv) the Consolidated statements of changes in stockholders' equity (unaudited) for the nine months ended September 30, 2017 and 2016 , (v) the Consolidated statements of cash flows (unaudited) for the nine months ended September 30, 2017 and 2016 , and (vi) the Notes to Consolidated Financial Statements (unaudited). |
178
SIGNATURE
Pursuant to the requirements of the Securities Exchange Act of 1934, the registrant has duly caused this report to be signed on its behalf by the undersigned thereunto duly authorized.
JPMorgan Chase & Co. |
(Registrant) |
By: | /s/ Nicole Giles |
| Nicole Giles |
| Managing Director and Corporate Controller |
| (Principal Accounting Officer) |
Date: | November 1, 2017 |
179
INDEX TO EXHIBITS
Exhibit No. |
| Description of Exhibit |
|
|
|
15 |
| Letter re: Unaudited Interim Financial Information. |
|
|
|
31.1 |
| Certification. |
|
|
|
31.2 |
| Certification. |
|
|
|
32 |
| Certification Pursuant to Section 906 of the Sarbanes-Oxley Act of 2002.† |
|
|
|
101.INS |
| XBRL Instance Document. |
101.SCH |
| XBRL Taxonomy Extension Schema Document. |
101.CAL |
| XBRL Taxonomy Extension Calculation Linkbase Document. |
101.DEF |
| XBRL Taxonomy Extension Definition Linkbase Document. |
101.LAB |
| XBRL Taxonomy Extension Label Linkbase Document. |
101.PRE |
| XBRL Taxonomy Extension Presentation Linkbase Document. |
|
|
|
† |
| This exhibit shall not be deemed "filed" for purposes of Section 18 of the Securities Exchange Act of 1934, or otherwise subject to the liability of that Section. Such exhibit shall not be deemed incorporated into any filing under the Securities Act of 1933 or the Securities Exchange Act of 1934. |
180