UNITED STATES
SECURITIES AND EXCHANGE COMMISSION
Washington, D.C. 20549
FORM 10-K
| ☒ | ANNUAL REPORT PURSUANT TO SECTION 13 OR 15(d) OF THE SECURITIES EXCHANGE ACT OF 1934 |
For the fiscal year ended September 28, 2018
OR
☐ | TRANSITION REPORT PURSUANT TO SECTION 13 OR 15(d) OF THE SECURITIES EXCHANGE ACT OF 1934 |
For the transition period from _____ _ to _____ _
Commission file number 0-16255
JOHNSON OUTDOORS INC.
(Exact name of registrant as specified in its charter)
Wisconsin | 39-1536083 | |
(State or other jurisdiction of incorporation or organization) | (I.R.S. Employer Identification No.) |
555 Main Street, Racine, Wisconsin 53403
(Address of principal executive offices, including zip code)
(262) 631-6600
(Registrant's telephone number, including area code)
Securities registered pursuant to Section 12(b) of the Act: | |
Title of Each Class | Name of Exchange on Which Registered |
Class A Common Stock, $.05 par value per share | NASDAQ Global Select Market SM |
Securities registered pursuant to section 12(g) of the Act: None
Indicate by check mark if the registrant is a well-known seasoned issuer, as defined in Rule 405 of the Securities Act. Yes ☐ No ☒
Indicate by check mark if the registrant is not required to file reports pursuant to Section 13 or Section 15(d) of the Act. Yes ☐ No ☒
Indicate by check mark whether the registrant (1) has filed all reports required to be filed by Section 13 or 15(d) of the Securities Exchange Act of 1934 during the preceding 12 months (or for such shorter period that the registrant was required to file such reports), and (2) has been subject to such filing requirements for the past 90 days. Yes ☒ No ☐
Indicate by check mark whether the registrant has submitted electronically every Interactive Data File required to be submitted pursuant to Rule 405 of Regulation S-T during the preceding 12 months (or for such shorter period that the registrant was required to submit such files). Yes ☒ No ☐
Indicate by check mark if disclosure of delinquent filers pursuant to Item 405 of Regulation S-K is not contained herein, and will not be contained, to the best of registrant's knowledge, in definitive proxy or information statements incorporated by reference in Part III of this Form 10-K, or any amendment to this Form 10‑K. ☐
Indicate by check mark whether the registrant is a large accelerated filer, an accelerated filer, a non-accelerated filer, a smaller reporting company or an emerging growth company. See the definitions of "large accelerated filer," "accelerated filer," "smaller reporting company" and "emerging growth company" in Rule 12b-2 of the Exchange Act:
Large Accelerated Filer | ☐ | ||
Accelerated Filer | ☒ | ||
Non-Accelerated Filer | ☐ | ||
Smaller Reporting Company | ☐ | ||
Emerging Growth Company | ☐ |
If an emerging growth company, indicate by check mark if the registrant has elected not to use the extended transition period for complying with any new or revised financial accounting standards provided pursuant to Section 13(a) of the Exchange Act. ☐
Indicate by check mark whether the registrant is a shell company (as defined in Rule 12b-2 of the Exchange Act). Yes ☐ No ☒
As of November 23, 2018, 8,787,360 shares of Class A and 1,211,686 shares of Class B common stock of the registrant were outstanding. The aggregate market value of voting and non-voting common stock of the registrant held by non-affiliates of the registrant was approximately $307,000,000 on March 30, 2018 (the last business day of the registrant's most recently completed fiscal second quarter) based on approximately 4,955,000 shares of Class A common stock held by non-affiliates as of such date. For purposes of this calculation only, shares of all voting stock are deemed to have a market value of $62.00 per share, the closing price of the Class A common stock as reported on the NASDAQ Global Select Market SM on March 29, 2018 (the last trading day of the registrant's most recently completed fiscal second quarter). Shares of common stock held by any executive officer or director of the registrant (including all shares beneficially owned by the Johnson Family, as defined herein) have been excluded from this computation because such persons may be deemed to be affiliates. This determination of affiliate status is not a conclusive determination for other purposes.
DOCUMENTS INCORPORATED BY REFERENCE
Portions of the Proxy Statement for the 2019 Annual Meeting of the Shareholders of the Registrant are incorporated by reference into Part III of this report.
As used in this report, the terms "we," "us," "our," "Johnson Outdoors" and the "Company" mean Johnson Outdoors Inc. and its subsidiaries collectively, unless the context indicates another meaning.
TABLE OF CONTENTS | Page |
Business | 4 |
Risk Factors | 9 |
Unresolved Staff Comments | 16 |
Properties | 16 |
Legal Proceedings | 17 |
Mine Safety Disclosures | 17 |
Market for Registrant's Common Equity, Related Stockholder Matters and Issuer Purchases of Equity Securities | 17 |
Selected Financial Data | 19 |
Management's Discussion and Analysis of Financial Condition and Results of Operations | 20 |
Quantitative and Qualitative Disclosures about Market Risk | 30 |
Financial Statements and Supplementary Data | 30 |
Changes in and Disagreements with Accountants on Accounting and Financial Disclosure | 30 |
Controls and Procedures | 31 |
Other Information | 31 |
Directors, Executive Officers and Corporate Governance | 32 |
Executive Compensation | 32 |
Security Ownership of Certain Beneficial Owners and Management and Related Stockholder Matters | 32 |
Certain Relationships and Related Transactions, and Director Independence | 33 |
Principal Accountant Fees and Services | 33 |
Exhibits and Financial Statement Schedules | 33 |
Form 10-K Summary | 34 |
Signatures | 34 |
Exhibit Index | 35 |
Consolidated Financial Statements | F-1 |
Forward Looking Statements
Certain matters discussed in this Form 10-K are "forward-looking statements," and the Company intends these forward-looking statements to be covered by the safe harbor provisions for forward-looking statements contained in the Private Securities Litigation Reform Act of 1995 and is including this statement for purposes of those safe harbor provisions. These statements may be identified by the use of forward-looking words or phrases such as "anticipate," "believe," "confident," "could," "expect," "intend," "may," "planned," "potential," "should," "will," "would" or the negative of those terms or other words of similar meaning. Similarly, statements that describe the Company's future plans, objectives or goals are also forward-looking statements. Such forward-looking statements are subject to certain risks and uncertainties which could cause actual results or outcomes to differ materially from those currently anticipated.
Factors that could affect actual results or outcomes include the matters described under the caption "Risk Factors" in Item 1A of this report and the following: changes in economic conditions, consumer confidence levels and discretionary spending patterns in key markets; uncertainties stemming from changes in US trade policies, tariffs, and the reaction of other countries to such changes; the Company's success in implementing its strategic plan, including its targeted sales growth platforms, innovation focus and its increasing digital presence; litigation costs related to actions of and disputes with third parties, including competitors; the Company's continued success in working capital management and cost-structure reductions; the Company's success in integrating strategic acquisitions; the risk of future writedowns of goodwill or other long-lived assets; the ability of the Company's customers to meet payment obligations; movements in foreign currencies, interest rates or commodity costs; fluctuations in the prices of raw materials or the availability of raw materials or components used by the Company; any disruptions in the Company's supply chain as a result of material fluctuations in the Company's order volumes and requirements for raw materials and other components necessary to manufacture and produce the Company's products; the success of the Company's suppliers and customers and the impact of any consolidation in the industries of the Company's suppliers and customers; the ability of the Company to deploy its capital successfully; unanticipated outcomes related to outsourcing certain manufacturing processes; unanticipated outcomes related to litigation matters; and adverse weather conditions. Shareholders, potential investors and other readers are urged to consider these factors in evaluating the forward-looking statements and are cautioned not to place undue reliance on such forward-looking statements. The forward-looking statements included herein are only made as of the date of this filing. The Company assumes no obligation, and disclaims any obligation, to update such forward-looking statements to reflect subsequent events or circumstances.
3
Table of Contents
Trademarks
We have registered the following trademarks, which may be used in this report: Minn Kota®, Cannon®, Humminbird®, Eureka!®, Jetboil®, Old Town®, Ocean Kayak TM , Carlisle® and SCUBAPRO®.
PART I
ITEM 1. | BUSINESS |
Johnson Outdoors is a leading global manufacturer and marketer of branded seasonal, outdoor recreation products used primarily for fishing from a boat, diving, paddling, hiking and camping. The Company's portfolio of well-known consumer brands has attained leading market positions due to continuous innovation, marketing excellence, product performance and quality. Company values and culture support innovation in all areas, promoting and leveraging best practices and synergies within and across its subsidiaries to advance the Company's strategic vision set by executive management and approved by the Board of Directors. The Company is controlled by Helen P. Johnson-Leipold (Chairman and Chief Executive Officer), members of her family and related entities.
The Company was incorporated in Wisconsin in 1987 as successor to various businesses.
Fishing
The Company's Fishing segment key brands are: Minn Kota electric motors for quiet trolling or primary propulsion, marine battery chargers and shallow water anchors; Humminbird sonar and GPS equipment for fishfinding, navigation and marine cartography; and Cannon downriggers for controlled-depth fishing. Minn Kota trolling motors and shallow water anchors and Cannon downriggers are designed and manufactured primarily at the Company's Mankato, Minnesota facility. Humminbird sonar and GPS equipment are designed and manufactured in Eufaula, Alabama and Alpharetta, Georgia.
Fishing brands and related accessories are sold across the globe, with the majority of sales coming from North America through large outdoor specialty retailers, such as Bass Pro Shops and Cabela's; large retail store chains; marine products distributors; original equipment manufacturers (OEM) of boat brands such as Tracker, Skeeter and Ranger; and internet retailers and distributors. The Company also sells direct to consumers via its Minn Kota and Humminbird websites. Markets outside of North America are accessed through a network of international distributors.
Fishing has achieved market share gains by focusing on product innovation, quality products and effective marketing. Such consumer marketing and promotion activities include: product placements on fishing-related television shows; print advertising and editorial coverage in outdoor, general interest and sport magazines; professional angler and tournament sponsorships; packaging and point-of-purchase materials and offers to increase consumer appeal and sales; the Minn Kota, Humminbird and Cannon brand websites; social media networks; and online promotions.
Camping
The Company's Camping segment key brands are: Eureka! consumer, commercial and military tents and accessories, sleeping bags, camping furniture and stoves and other recreational camping products; and Jetboil portable outdoor cooking systems.
4
Table of Contents
Eureka! consumer tents, sleeping bags, camping furniture, camping stoves and other recreational camping products are mid- to high-price range products sold in the U.S. and Canada through independent sales representatives, primarily to camping and backpacking specialty stores, sporting goods stores, internet retailers and direct to consumer via the Eureka! brand website. Marketing of the Company's tents, sleeping bags and other recreational camping products is focused on building the Eureka! brand name and establishing the Company as a leader in tent design and innovation. The Company's consumer camping tents and sleeping bags are produced by third party manufacturing sources in Asia. Eureka! camping products are sold under license in Japan and Australia. Consumer marketing and promotion activities include: digital marketing and social media networks; print advertising and editorial coverage in general outdoor magazines.
Eureka! commercial tents include party tents and accessories, sold primarily to general rental stores, and other commercial tents and accessories sold directly to tent erectors. The Company's commercial tent products range from 10'x10' canopies to 120' wide pole tents and other large scale frame structures and are primarily manufactured by the Company at the Company's Binghamton, New York location.
Eureka! also designs and manufactures large, heavy-duty tents and lightweight backpacking tents primarily for the U.S. military at its Binghamton, New York location. Tents produced for military use in the last twelve months include modular general purpose tents, rapid deployment shelters and various lightweight one and two person tents. The Company manufactures military tent accessories like fabric floors and insulated thermal liners and is also a subcontract manufacturer for other providers of military tents.
Jetboil portable outdoor cooking systems, single burner and two burner stoves, and accessories are sold in the U.S. and Canada through independent sales representatives, primarily to camping and backpacking specialty stores, sporting goods stores, internet retailers, and direct to consumer via the Jetboil brand website. Marketing of Jetboil systems is focused on building brand awareness and leadership in product features and innovation. Jetboil products are produced at both the Company's operating location in Manchester, New Hampshire and by third party manufacturing sources in Asia. Jetboil products are sold in approximately 30 countries around the world. Markets outside of North America are accessed through a network of international distributors.
During fiscal 2018, the Company sold its Silva North America trademark rights to Silva Sweden AB.
Watercraft Recreation
The Company's Watercraft Recreation segment designs and markets canoes and kayaks, including pedal-driven and Minn Kota motor-driven kayaks, under the Ocean Kayaks and Old Town brand names for family recreation, touring, angling and tripping. These brands are manufactured at the Company's facility in Old Town, Maine.
The Company uses a rotational molding process for manufacturing mid- to high-end polyethylene kayaks and canoes and uses a thermoform molding process in the manufacturing of lower priced models at its facility in Old Town, Maine. Watercraft Recreation accessory brands, including Carlisle branded paddles, are produced primarily by third party sources located in North America and Asia.
The Company's kayaks, canoes and accessories are sold through multiple channels in the U.S., Europe and the Pacific Basin with an emphasis on independent specialty retailers and large outdoor retailers. The Company also sells equipment direct to consumers via the Old Town and Ocean Kayak websites. The Company has a network of distributors who sell Company products outside of North America.
The Company's Watercraft Recreation business competes in the mid- to high-end of the product category by introducing product innovations, creating quality products and by focusing on the product-specific needs of each marketing channel. Consumer marketing and promotion activities include: digital marketing and social media networks; print advertising and editorial coverage in outdoor, general interest and sport magazines; and direct marketing.
5
Table of Contents
Diving
The Company manufactures and markets underwater diving products for recreational divers, which it sells and distributes under the SCUBAPRO brand name.
The Company markets a complete line of underwater diving and snorkeling equipment, including regulators, buoyancy compensators, dive computers and gauges, wetsuits, masks, fins, snorkels and accessories. SCUBAPRO diving equipment is marketed to the premium segment and high performance technical diving market. Products are sold via select distribution to independent specialty dive stores worldwide. These specialty dive stores generally provide a wide range of services to divers, including regular maintenance, product repair, diving education and travel programs. The Company also sells diving gear direct to consumers via the SCUBAPRO website and to dive training centers, resorts, public safety units and armed forces around the world.
The Company's consumer communication focuses on building brand awareness and highlighting exclusive product features and consumer benefits of its product lines. The Company's communication and distribution strategies reinforce the SCUBAPRO brand's position as the industry's quality and innovation leader. The Company markets its equipment in diving magazines, via websites, through social media and through information and displays in dive specialty stores.
The Company manufactures regulators, dive computers, gauges, and instruments at its Italian and Indonesian facilities. The Company sources buoyancy compensators, neoprene goods, plastic products, proprietary materials, and other components from third parties.
Financial Information for Business Segments
As noted above, the Company has four reportable business segments. See Note 12 to the consolidated financial statements included elsewhere in this report for financial information concerning each business segment.
International Operations
See Note 12 to the consolidated financial statements included elsewhere in this report for financial information regarding the Company's domestic and international operations. See Note 1, subheading "Foreign Operations and Related Derivative Financial Instruments," to the consolidated financial statements included elsewhere in this report, along with the information under "Risk Factors" below, for information regarding risks related to the Company's foreign operations.
Research and Development
The Company commits significant resources to new product research and development in each of its business segments. Fishing conducts its product research, design, engineering and software development activities at its locations in Mankato and Little Falls, Minnesota; Alpharetta, Georgia; Toronto, Canada; and Eufaula, Alabama. Diving maintains research and development facilities in Zurich, Switzerland and Casarza Ligure, Italy. Research and development activities for Watercraft Recreation are performed in Old Town, Maine. Product research, design and innovation for Camping products are conducted at the Company's Binghamton, New York and Manchester, New Hampshire locations.
The Company expenses research and development costs as incurred, except for software development for new electronics products and bathymetry data collection and processing. These software development and bathymetry data collection and processing costs are capitalized once technological feasibility is established and then amortized over the expected useful life of the software or database. The amounts expensed by the Company in connection with research and development activities for each of the last three fiscal years are set forth in the Company's Consolidated Statements of Operations included elsewhere in this report.
Industry and Competitive Environment
The Company believes its products compete favorably on the basis of product innovation, product performance and marketing support and, to a lesser extent, price.
6
Table of Contents
Fishing: Minn Kota's main competitors in the electric trolling motors business are Motor Guide®, owned by Brunswick Corporation, and private label branded motors sourced primarily from manufacturers in Asia. Competition in this business is focused on technological innovation, product quality and durability as well as product benefits and features for fishing.
The primary competitors in the marine battery charging business are Dual Pro™ and various Pro Mariner™ products. Competition in this business is based on charging time, reliability and battery protection. The primary competitor in shallow water anchors is Power Pole®. Competition in this business is based on secure positioning, speed of deployment and quiet operation.
Humminbird's main competitors in the market for on-boat electronics are Garmin ™ , Lowrance ™ , Simrad and Raymarine®. Competition in this business is primarily focused on the quality of sonar imaging and display, easy to use graphical interfaces as well as the integration of mapping and GPS technology. Humminbird products contain marine cartography features. Competitors offering marine cartography products include Navionics®, owned by Garmin, and C-Map®, owned by Navico. Competition in this business focuses primarily on quality of data and quantity of available charts for inland lakes and ocean shoreline.
Cannon's main competitors in the downrigger market are Big Jon Sports®, Walker and Scotty®. Competition in this business primarily focuses on ease of operation, speed and durability.
Camping: The Company's Camping brands and products compete in the sporting goods and specialty segments of the Camping market. Competitive brands with a strong position in the sporting goods channel include Coleman® and private label brands. The Company also competes with specialty companies such as Kelty®, The North Face®, Marmot® and Big Agnes® on the basis of materials and innovative designs for consumers who want performance products priced at a value.
The Company's portable outdoor cooking systems compete in the specialty and higher end performance backpacking and camping markets. The primary competitor in portable outdoor cooking systems is MSR®. Competition in this market is based on product size and weight, ease of use, reliability and performance.
The Company's competitors in the commercial tent market include Anchor Industries® and Aztec Tents for tension, frame and canopy tents. Competition in the commercial tent business is based on price, quality, structure, styling, ease of installation and technical support.
The Company sells military tents via third party distributors who hold supply contracts primarily with the U.S. Government, as well as to international governments. Such supply contracts can be for commercial off-the-shelf products in addition to products required to be built to unique specifications. Competitors in the military tent business include HDT®, Alaska Structures®, Camel, Outdoor Venture, and Diamond Brand.
Watercraft Recreation: The Company primarily competes in this segment in the kayak and canoe product categories of the paddlesports market. The Company's main competitors in this market are Confluence Outdoor, Hobie Cat®, Wenonah Canoe, Jackson Kayak and Legacy Paddlesports™, each of which competes on the basis of their product's design, performance, quality and price.
Diving: The main competitors in the Diving segment include Aqua Lung®, Suunto®, Atomic Aquatics, Oceanic, Cressi and Mares®. Competitive advantage in the life support product category of this segment, which consists of regulators, dive computers, and buoyancy compensators, is a function of product innovation, performance, quality and safety. Competition in the general diving product category of fins, masks, snorkels and wetsuits is characterized by low barriers to entry and numerous competitors who compete on the basis of product innovation, performance, quality and price.
7
Table of Contents
Backlog
Unfilled orders for future delivery of products totaled approximately $61 million at September 28, 2018. For the majority of its products, the Company's businesses do not receive significant orders in advance of expected shipment dates.
Employees
At September 28, 2018, the Company had approximately 1,200 regular, full-time employees. The Company considers its employee relations to be excellent. Temporary employees are utilized primarily to manage peaks in the seasonal manufacturing of products.
Patents, Trademarks and Proprietary Rights
The Company holds patents for various of the products it sells and regularly files applications for patents. The Company has numerous trademarks and trade names which it considers important to its business, many of which are noted in this report. Historically, the Company has vigorously defended its intellectual property rights and expects to continue to do so.
Supply Chain and Sourcing of Materials
The Company manufactures some products that use parts or materials that, due to geographical distance, limited supplier capacity or availability or competing demands for such parts or materials, are only available in a cost effective manner from a single vendor or require the Company to place orders several months in advance of required delivery.
The Company attempts to mitigate product availability and these supply chain risks when possible through the purchase of safety stock, use of forecast-based supply contracts, and, to a lesser extent, with just in time inventory deliveries or supplier-owned inventory located close to the Company's manufacturing locations. The Company strives to balance the businesses' need to maintain adequate inventory levels with the cost of holding such inventory by manufacturing to forecast for high volume products, utilizing build-to-order strategies wherever possible, and by having contract-manufactured products delivered to customers directly from the supplier. The Company also seeks to manage its inventory through on-going product design and logistical initiatives with its suppliers to reduce lead times.
As most military contracts require utilization of domestic suppliers, the Company is limited to key vendors for materials used in its military tent business.
Seasonality
The Company's products are warm-weather, outdoor recreation-related, which results in seasonal variations in sales and profitability. This seasonal variability is due to customers' increasing their inventories in the quarters ending March and June, the primary selling season for the Company's outdoor recreation products, with lower inventory volumes during the quarters ending September and December. The Company mitigates the seasonality of its businesses somewhat by encouraging customers to purchase and take delivery of products more evenly through the year. The following table shows, for the past three fiscal years, the total consolidated net sales and operating profit or loss of the Company for each quarter, as a percentage of the total year.
Fiscal Year | ||||||||||||||||||||||||
2018 | 2017 | 2016 | ||||||||||||||||||||||
Quarter Ended | Net Sales | Operating Profit | Net Sales | Operating Profit | Net Sales | Operating Profit | ||||||||||||||||||
December | 21 | % | 11 | % | 19 | % | 1 | % | 20 | % | (4 | )% | ||||||||||||
March | 31 | % | 41 | % | 30 | % | 45 | % | 31 | % | 66 | % | ||||||||||||
June | 31 | % | 51 | % | 32 | % | 54 | % | 32 | % | 59 | % | ||||||||||||
September | 17 | % | (3 | )% | 19 | % | 0 | % | 17 | % | (21 | )% | ||||||||||||
100 | % | 100 | % | 100 | % | 100 | % | 100 | % | 100 | % | |||||||||||||
8
Table of Contents
Environment and Climate Change
The Company is subject to various supranational, federal, state and local environmental laws, ordinances, regulations, and other requirements of governmental authorities. We believe we comply with such laws and regulations. Expenditures on environmental compliance have not had, and we believe in the future, are not expected to have, a material adverse effect on the Company's capital expenditures, earnings or competitive position. We do not believe that any direct or indirect consequences of legislation related to climate change will have a material adverse effect on our operating costs, facilities or products.
Available Information
The Company maintains a website at www.johnsonoutdoors.com. On its website, the Company makes available, free of charge, its Annual Report on Form 10-K, quarterly reports on Form 10-Q, current reports on Form 8-K and amendments to those reports, as soon as reasonably practical after the reports have been electronically filed or furnished to the Securities and Exchange Commission. In addition, the Company makes available on its website, free of charge, its (a) proxy statement for its annual meeting of shareholders; (b) Code of Business Conduct; (c) Code of Ethics for its Chief Executive Officer and Senior Financial and Accounting Officers; and (d) the charters for the following committees of the Board of Directors: Audit; Compensation; Executive; and Nominating and Corporate Governance. Except as specifically provided herein, the Company is not including the information contained on or available through its website as a part of, or incorporating such information by reference into, this Annual Report on Form 10-K. This report includes all material information about the Company that is included on the Company's website and is otherwise required to be included in this report. Copies of any materials the Company files with the Securities and Exchange Commission (SEC) can also be obtained free of charge through the SEC's website at www.sec.gov. The SEC's Public Reference Room can be contacted at 100 F Street, N.E., Washington, D.C. 20549, or by calling 1 (800) 732-0330.
ITEM 1A. | RISK FACTORS |
The risks described below are not the only risks we face. Additional risks that we do not yet know of or that we currently think are immaterial may also impair our future business operations. If any of the events or circumstances described in the following risks actually occur, our business, financial condition or results of operations could be materially adversely affected. In such cases, the trading price of our common stock could decline.
Our net sales and profitability depend on our ability to continue to conceive, design and market products that appeal to our consumers.
Our business depends on our ability to continue to conceive, design, manufacture and market new products and upon continued market acceptance of our product offering. Rapidly changing consumer preferences and trends make it difficult to predict how long consumer demand for our existing products will continue or what new products will be successful. A decline in consumer demand for our products, our failure to develop new products on a timely basis in anticipation of changing consumer preferences or the failure of our new products to achieve and sustain consumer acceptance could reduce our net sales and profitability.
Competition, consolidation and financial distress in our markets could reduce our net sales, profitability and cash flows.
We operate in highly competitive markets. We compete with several large domestic and foreign companies such as Brunswick, Navico, Garmin, Confluence Outdoor and Aqua Lung International, with private label products sold by many of our retail customers and with other producers of outdoor recreation products. Some of our competitors have longer operating histories, stronger brand recognition and greater financial, technical, marketing and other resources than us. In addition, we may face competition from new participants in our markets because some of the outdoor recreation product industries have limited barriers to entry. We experience price competition for our products, and competition for shelf space at retailers, all of which may increase in the future. Consolidation of our retail markets could result in fewer but larger retail customers, which may further result in lower selling prices or reduced sales volumes of our products or greater competition for shelf space in these retail markets. Further, financial distress or bankruptcies in our retail markets could negatively impact our operating results and cash flows. If we cannot compete in our product markets successfully in the future, our net sales, profitability and cash flows will likely decline.
9
Table of Contents
General economic conditions affect the Company's results.
Our revenues are affected by economic conditions and consumer confidence worldwide, but especially in the United States and Europe. In times of economic uncertainty, consumers tend to defer expenditures for discretionary items, which affects demand for our products. Moreover, our businesses are cyclical in nature, and their success is impacted by general economic conditions and specific economic conditions affecting the regions and markets we serve, the overall level of consumer confidence in the economy and discretionary income levels. Any substantial deterioration in general economic conditions that diminishes consumer confidence or discretionary income can reduce our sales and adversely affect our financial results. Moreover, declining economic conditions create the potential for future impairments of goodwill and other intangible and long-lived assets that may negatively impact our financial condition and results of operations. The impact of weak consumer credit markets, corporate restructurings, layoffs, prolonged high unemployment rates, declines in the value of investments and residential real estate, higher fuel prices and increases in federal and state taxation all can negatively affect our operating results.
Intellectual property disputes relating to our products could increase our costs.
Our industry is susceptible to litigation regarding patent infringement and infringement of other intellectual property rights. We could be either a plaintiff or a defendant in trademark, patent and/or other intellectual property infringement or misappropriation claims and claims of breach of license from time to time. The prosecution or defense of any intellectual property litigation is both costly and disruptive of the time and resources of our management and product development teams, even if the claim or defense against us is without merit. The scope of any patent or other intellectual property to which we have or may obtain rights also may not prevent others from developing and selling competing products. The validity and breadth of claims covered in patents and other intellectual property involve complex legal and factual questions, and the resolution of such claims may be highly uncertain, lengthy and expensive. In addition, our patents or other intellectual property may be held invalid upon challenge, or others may claim that we have improperly or invalidly sought patent or other intellectual property protection for our technology, thus exposing us to direct or counter claims in any patent or intellectual property proceeding. We could also be required to pay substantial damages or settlement costs to resolve intellectual property litigation. Furthermore, we may rely on trade secret law to protect technologies and proprietary information that we cannot or have chosen not to patent. Trade secrets, however, are difficult to protect. Although we attempt to maintain protection through confidentiality agreements with necessary personnel, contractors and consultants, we cannot guarantee that such contracts will not be breached. In the event of a breach of a confidentiality agreement or the divulgence of proprietary information, we may not have adequate legal remedies to maintain our trade secret protection. Litigation to determine the scope of intellectual property rights, even if ultimately successful, could be costly and could divert management's attention away from the Company's business. Any of these negative events could adversely affect our profitability or operating results.
Product recalls and other claims could affect our financial position and results of operations.
As a manufacturer and distributor of consumer products, we could be required to repurchase or recall one or more of our products if they are found to not meet quality or safety standards or be defective. A repurchase or recall of our products could be costly to us and could damage the reputation of our brands. If we were required to remove, or voluntarily remove our products from the market, our reputation could be tarnished and we might have large quantities of finished products that we could not sell. As a result, product recalls could have a material adverse effect on our business, results of operations and financial condition.
10
Table of Contents
Impairment charges could impact our future financial position and results of operations.
We test our goodwill, other indefinite-lived intangible assets and other long-lived assets for impairment on an annual basis or when an event occurs that might reduce the fair value of the reporting unit or applicable asset or group of assets below its carrying value. Various uncertainties, including significant adverse changes in business climate, adverse actions by regulators, unanticipated competition, loss of key customers, a downturn in the economy or in discretionary income levels or changes in consumer preferences could impact the expected cash flows to be generated by an asset or group of assets, and may result in an impairment of those assets. Although any such impairment charge would be a non-cash expense, any impairment of our assets could materially increase our expenses and reduce our profitability.
Sales of our products are seasonal, which causes our operating results to vary from quarter to quarter.
Sales of our products are seasonal. Historically, our net sales and profitability have peaked in our second and third fiscal quarters due to the buying patterns of our customers for our products. Seasonal variations in operating results may also cause us to increase our debt levels and interest expense primarily in the second and third fiscal quarters as we fund our working capital requirements.
The trading price of shares of our common stock fluctuates and investors in our common stock may experience substantial losses.
The trading price of our common stock has been volatile and may continue to be volatile in the future. The trading price of our common stock could decline or fluctuate in response to a variety of factors, including:
| • | the timing of our announcements or those of our competitors concerning significant product developments, acquisitions or financial performance; |
| • | fluctuation in our quarterly operating results; |
| • | substantial sales of our common stock; |
| • | general stock market conditions; or |
| • | other economic or external factors. |
You may be unable to sell your stock at or above your purchase price.
A limited number of our shareholders can exert significant influence over the Company.
As of October 17, 2018, Helen P. Johnson-Leipold, members of her family and related entities (hereinafter the Johnson Family), held approximately 76% of the voting power of both classes of our common stock taken as a whole. This voting power would permit these shareholders, if they chose to act together, to exert significant influence over the outcome of shareholder votes, including votes concerning the election of directors, by-law amendments, possible mergers, corporate control contests and other significant corporate transactions. Moreover, certain members of the Johnson Family have entered into a voting trust agreement covering approximately 96% of our outstanding class B common shares. This voting trust agreement permits these shareholders, if they continue to choose to act together, to exert significant influence over the outcome of shareholder votes, including votes concerning the election of directors, by-law amendments, possible mergers, corporate control contests and other significant corporate transactions.
We may experience difficulties in integrating strategic acquisitions.
We have, as part of our strategy, historically pursued strategic acquisitions. The pursuit of future growth through acquisitions involves significant risks that could have a material adverse effect on our business. Risks associated with integrating strategic acquisitions include:
| • | the acquired business may experience losses which could adversely affect our profitability; |
11
Table of Contents
| • | unanticipated costs relating to the integration of acquired businesses may increase our expenses and reduce our profitability; |
| • | the possible failure to obtain any necessary consents to the transfer of licenses or other material agreements of the acquired company; |
| • | the possible failure to maintain customer, licensor and other relationships of the acquired company after the closing of the transaction with the acquired company; |
| • | difficulties in achieving planned cost savings and synergies may increase our expenses; |
| • | diversion of our management's attention could impair their ability to effectively manage our other business operations; |
| • | unanticipated management or operational problems or liabilities may adversely affect our profitability and financial condition; and/or |
| • | breaches of the representations or warranties or other violations of the contractual obligations required by the acquisition agreement of other parties to the acquisition transaction and any contractual remedies related thereto may not adequately protect or compensate us. |
We are dependent upon certain key members of management.
Our success will depend to a significant degree on the abilities and efforts of our senior management. Moreover, our success depends on our ability to attract, retain and motivate qualified management, marketing, technical and sales personnel. These people are in high demand and often have competing employment opportunities. The labor market for skilled employees is highly competitive and we may lose key employees or be forced to increase their compensation to retain these people. Employee turnover could significantly increase our recruitment, training and other related employee costs. The loss of key personnel, or the failure to attract qualified personnel, could have a material adverse effect on our business, financial condition or results of operations.
Sources of and fluctuations in market prices of raw materials can affect our operating results.
The primary raw materials we use in manufacturing our products are metals, resins and packaging materials. These materials are generally available from a number of suppliers, but we have chosen to concentrate our sourcing with a limited number of vendors for each commodity or purchased component. We believe our sources of raw materials are reliable and adequate for our needs. However, the development of future sourcing issues related to the availability of these materials as well as significant fluctuations in the market prices of these materials may have an adverse effect on our financial results.
Our profitability is also affected by significant fluctuations in the prices of the raw materials we use in our products, including the effect of fluctuations in foreign currency exchange rates on raw materials and purchased components. We may not be able to pass along any price increases in our raw materials or other component costs to our customers. As a result, an increase in the cost of raw materials, labor or other costs associated with the manufacturing of our products could increase our costs of sales and reduce our gross margins.
Financial distress in supply chain and shortage of raw materials or components of supply.
Deteriorating industry conditions can adversely affect our supply base. Lower production levels at our major suppliers and volatility in certain raw material and energy costs may result in severe financial distress among many companies within our supply base. Financial distress within our supply base and/or our suppliers' inability to obtain credit from lending institutions could lead to commercial disputes and possible supply chain interruptions to our business. In addition, potential adverse industry conditions may require us to provide financial assistance or other measures to ensure uninterrupted production of key components or materials used in the production of our products which could have a material adverse effect on our existing and future revenues and net income.
Additionally, in the event of catastrophic acts of nature such as fires, tsunamis, hurricanes and earthquakes or a rapid increase in production demands, either we, or our suppliers may experience supply shortages of raw materials or components. This could be caused by a number of factors, including a lack of production line capacity or manpower or working capital constraints. As our industry consolidates its supply base in order to manage the costs of purchased goods and services, there is greater dependence on fewer sources of supply for certain components and materials used in our products, which could increase the possibility of a supply shortage of any particular component. If we or one of our own suppliers experience a supply shortage, we may become unable to produce the affected products if we cannot procure the components from another source. Such production interruptions could impede a ramp-up in production and could have a material adverse effect on our business, results of operations and financial condition.
12
Table of Contents
We consider the production capacities and financial condition of suppliers in our selection process, and expect that they will meet our delivery requirements. However, there can be no assurance that strong demand, capacity limitations, shortages of raw materials, labor disputes or other problems will not result in any shortages or delays in the supply of components to us.
Currency exchange rate fluctuations could adversely affect the Company's results.
We have significant foreign operations, for which the functional currencies are denominated primarily in euros, Swiss francs, Hong Kong dollars and Canadian dollars. As the values of the currencies of the foreign countries in which we have operations increase or decrease relative to the U.S. dollar, the sales, expenses, profits, losses, assets and liabilities of our foreign operations, as reported in our consolidated financial statements, increase or decrease, accordingly. Approximately 16% of our revenues for the year ended September 28, 2018 were denominated in currencies other than the U.S. dollar. Approximately 7% were denominated in euros and approximately 6% were denominated in Canadian dollars with the remaining 3% denominated in various other foreign currencies. We may mitigate a portion of the impact of fluctuations in certain foreign currencies on our operations through the purchase of foreign currency swaps, forward contracts and options to hedge known commitments denominated in foreign currencies or to reduce the risk of changes in foreign currency exchange rates on foreign currency borrowings.
Because we rely on foreign suppliers and we sell products in foreign markets, we are susceptible to numerous international business risks that could increase our costs or disrupt the supply of our products.
Our international operations subject us to risks, including:
| • | economic and political instability; |
| • | restrictive actions by foreign governments; |
| • | opportunity costs and reputational damage related to the presence of counterfeit versions of the Company's products in such foreign markets; |
| • | greater difficulty enforcing intellectual property rights and weaker laws protecting intellectual property rights; |
| • | changes in tariffs, import duties or import or export restrictions; |
| • | timely shipping of product and unloading of product, including the timely rail/truck delivery to our warehouses and/or a customer's warehouse of our products; |
| • | complications in complying with the laws and policies of the United States affecting the importation of goods, including tariffs, duties, quotas and taxes; |
| • | required compliance with U.S. laws that impact the Company's operations in foreign jurisdictions that do not impact local operating companies; and |
| • | complications in complying with trade and foreign tax laws. |
Any of these risks could disrupt the supply of our products or increase our expenses. In particular, the uncertainty regarding the ability of certain European countries to continue to service their sovereign debt obligations and the related financial restructuring efforts by European governments, as well as the impact of the decision of the United Kingdom to withdraw from the European Union, may cause the value of several European currencies, including the euro, to fluctuate, which may adversely affect our non-U.S. dollar sales and earnings. As we have manufacturing operations in Italy, a significant disruption of the political or financial systems there could put these manufacturing operations at risk, which could ultimately adversely affect our profitability or operating results.
13
Table of Contents
Uncertainty over global tariffs, or the financial impact of tariffs, may negatively affect our results.
Recent changes in U.S. domestic and global tariff frameworks have increased our costs of producing goods and resulted in additional risks to our supply chain. More tariff changes are also possible. We have developed strategies to mitigate previously implemented and, in some cases, proposed tariff increases, but there is no assurance we will be able to continue to mitigate the impact of tariff increases in substantial part on our financial and operating results. Further, uncertainties about future tariff changes could result in mitigation actions undertaken by us that could prove to be detrimental to our business and our relationships with our customers and suppliers.
The recently implemented tariffs are estimated to negatively impact our fiscal 2019 operating profit in the range of $6 million to $9 million, which includes any expected benefit of mitigation efforts contemplated by us and which are identified to date.
We may be subject to disruptions or failures in our information technology systems and network infrastructures that could have a material adverse effect on our business.
We rely on the efficient and uninterrupted operation of complex information technology systems and network infrastructures to operate our business. We also hold data in various company-owned and third party data center facilities upon which our business depends. A disruption, infiltration or failure of these information technology systems or any of these data centers as a result of software or hardware malfunctions, system implementations or upgrades, computer viruses, third-party security breaches, employee error, theft or misuse, malfeasance, power disruptions, natural disasters or accidents could cause breaches of data security, loss of intellectual property and critical data and the release and misappropriation of sensitive competitive information. Any of these events could result in the loss of key information, impair our production and supply chain processes, harm our competitive position, damage our reputation with customers, cause us to incur significant costs to remedy any damages and ultimately materially and adversely affect our business, results of operations and financial condition. While we have implemented a number of protective measures, such measures may not be adequate or implemented properly to prevent or fully address the adverse effect of such events.
Cyber security vulnerabilities, threats and more sophisticated and targeted computer crime could pose a risk to our systems, networks, products, solutions, services and data.
Increased global cyber security vulnerabilities, threats, computer viruses and more sophisticated and targeted cyber-related attacks, as well as cyber security failures resulting from human error and technological errors, pose a risk to our systems, products and data as well as potentially to our employees', customers' and suppliers' data. We attempt to mitigate these risks by employing a number of measures, including employee training, monitoring and testing, and maintenance of protective systems and contingency plans, but we remain potentially vulnerable to additional known or unknown threats. There is no assurance the impact from such threats will not be material to our financial results or reputation and it could result in security breaches, theft, lost or corrupted data, misappropriation of sensitive, confidential or personal data or information, loss of trade secrets and commercially valuable information, production downtimes and operational disruptions, any of which may adversely affect our profitability or operating results.
Our failure to adequately protect personal information could have a material adverse effect on our business.
A wide variety of local, state, national, and international laws, directives and regulations apply to the collection, use, retention, protection, disclosure, transfer, and other processing of personal data (including with respect to the European Union's General Data Protection Regulation). These data protection and privacy-related laws and regulations continue to evolve and may result in ever-increasing regulatory and public scrutiny and escalating levels of enforcement and sanctions and increased costs of compliance. Our failure to comply with applicable laws and regulations, or to protect such data, could result in enforcement actions against us, including fines, imprisonment of company officials and public censure, claims for damages by end-customers and other affected individuals, damage to our reputation and loss of goodwill (both in relation to existing end-customers and prospective end-customers), any of which could have a material adverse effect on our operations, financial performance, and business. Changing definitions of personal data and personal information, within the European Union, the United States, and elsewhere may limit or inhibit our ability to operate or expand our business, including limiting strategic partnerships that may involve the sharing of data. The evolving data protection regulatory environment may require significant management attention and financial resources to analyze and modify our information technology infrastructure to meet these changing requirements all of which could reduce our operating margins and impact our operating results and financial condition.
14
Table of Contents
Future terror attacks, war, natural disasters or other catastrophic events beyond our control could negatively impact our business.
Terror attacks, war or other civil disturbances, natural disasters and other catastrophic events could lead to economic instability and decreased demand for our products, which could negatively impact our business, financial condition, results of operations and cash flows. In the past, terrorist attacks have caused instability in global financial markets and the industries in which we compete and have negatively affected spending on consumer discretionary products. In addition, our facilities are located throughout the world and could be subject to damage from terrorism incidents or from fires, floods, earthquakes or other natural or man-made disasters. Terrorist incidents could also lead to increased border security which could in turn negatively impact our global supply chain by causing shipping delays or shortages in key materials or components, increasing the cost of such goods or requiring us to keep greater inventories, any of which may adversely impact our business, results of operations, financial condition or cash flows.
The inability to successfully defend claims asserted by taxing authorities could adversely affect our financial condition, results of operations and cash flows.
We conduct business in many countries, which requires us to interpret the income tax laws and rulings in each of those taxing jurisdictions. Due to the subjectivity of tax laws in or between those jurisdictions, as well as the subjectivity of factual interpretations, our estimates of income tax liabilities may differ from actual payments or assessments. Claims from taxing authorities related to these differences could have an adverse impact on our financial condition, results of operations and cash flows.
The effective tax rate of the Company may be negatively impacted by future changes to tax laws in global jurisdictions in which we operate.
Changes in tax laws or tax rulings could have a material impact on our effective tax rate. Many countries in the European Union, as well as a number of other countries and organizations such as the Organization for Economic Cooperation and Development, are actively considering changes to existing tax laws. Certain proposals could include recommendations that could increase our tax obligations in many countries where we do business. Any changes in the taxation of our activities in such jurisdictions may result in a material increase in our effective tax rate.
We are subject to environmental, safety and human rights regulations.
We are subject to supranational, federal, state, local and foreign laws and other legal requirements related to the generation, storage, transport, treatment and disposal of materials as a result of our manufacturing and assembly operations. These laws include the Resource Conservation and Recovery Act (as amended), the Clean Air Act (as amended) and the Comprehensive Environmental Response, Compensation and Liability Act (as amended). Risk of environmental liability and changes associated with maintaining compliance with environmental laws is inherent in the nature of our business and there is no assurance that material liabilities or changes would not arise.
The Company is also subject to the requirement of Section 1502 of the Dodd-Frank Wall Street Reform and Consumer Protection Act and SEC rules related thereto to conduct due diligence and disclose and report on whether certain minerals and metals, known as "conflict minerals," are contained in the Company's products and whether they originate from the Democratic Republic of Congo ("DRC") and adjoining countries. We may face reputational challenges if we determine that certain of our products contain minerals not determined to be conflict free or if we are unable to sufficiently verify the origins of all conflict minerals used in our products through the procedures we implement.
15
Table of Contents
We rely on our credit facilities to provide us with sufficient working capital to operate our business.
Historically, we have relied upon our existing credit facilities to provide us with adequate working capital to operate our business. If our lenders reduce or terminate our access to amounts under our credit facilities, we may not have sufficient capital to fund our working capital needs and/or we may need to secure additional capital or financing to fund our working capital requirements or to repay outstanding debt under our credit facilities. We can make no assurance that we will be successful in ensuring our availability of amounts under our credit facilities or in connection with raising additional capital and that any amount, if raised, will be sufficient to meet our cash flow requirements. If we are not able to maintain our borrowing availability under our credit facilities and/or raise additional capital when needed, we may be forced to sharply curtail our efforts to manufacture and promote the sale of our products or to curtail our operations.
Our debt covenants may limit our ability to complete acquisitions, incur debt, make investments, sell assets, merge or complete other significant transactions.
Our credit facilities and certain other of our debt instruments include limitations on a number of our activities in the event of a default, and in some cases regardless of whether a default has occurred, including our ability to:
| • | incur additional debt; |
| • | create liens on our assets or make guarantees; |
| • | make certain investments or loans; or |
| • | dispose of or sell assets, make acquisitions above certain amounts or enter into a merger or similar transaction. |
The restrictive covenants in our credit facilities may limit our ability to engage in acts that may be in our best long term interests. A breach of any of the restrictive covenants in our credit facilities could result in a default under these facilities. If a default occurs, the lenders under our credit facilities may elect to declare all outstanding borrowings, together with accrued interest, to be immediately due and payable, to terminate any commitments they have to provide further borrowings and to exercise any other rights they have under the facilities or applicable law.
Our shares of common stock are thinly traded and our stock price may be volatile.
Because our common stock is thinly traded, its market price may fluctuate significantly more than the stock market in general or the stock prices of similar companies, which are exchanged, listed or quoted on NASDAQ. We believe there are approximately 4,955,000 shares of our Class A common stock held by non-affiliates as of October 17, 2018. Thus, our common stock will be less liquid than the stock of companies with broader public ownership, and as a result, the trading price for our shares of common stock may be more volatile. Among other things, trading of a relatively small volume of our common stock may have a greater impact on the trading price for our stock than would be the case if our public float were larger.
Our business is susceptible to adverse weather conditions or events.
Our success is in part affected by adverse weather conditions, including fires, floods, tornadoes, severe cold and other natural disasters. Such events have the tendency to create fluctuations in demand for our products which may impact our borrowing costs, increase our expenses and reduce our profitability. Moreover, our profitability is affected by our ability to successfully manage our inventory levels and demand for our products, which, in part depends upon the efficient operation of our production and delivery systems. These systems are vulnerable to damage or interruption from the aforementioned natural disasters. Such natural disasters could adversely impact our ability to meet delivery requirements of our customers, which may result in our need to incur extra costs to expedite production and delivery of product to meet customer demand. Any of these events could negatively impact our profitability.
ITEM 1A. | UNRESOLVED STAFF COMMENTS |
Not Applicable
ITEM 2. | PROPERTIES |
16
Table of Contents
The Company maintains leased and owned manufacturing, warehousing, distribution and office facilities throughout the world. The Company believes that its facilities are well maintained and have capacity adequate to meet its current needs.
See Note 5 to the consolidated financial statements included elsewhere in this report for a discussion of the Company's lease obligations.
As of September 28, 2018, the Company's principal manufacturing (identified with an asterisk) and other locations are:
Alpharetta, Georgia (Fishing)
Antibes, France (Diving)
Barcelona, Spain (Diving)
Batam, Indonesia* (Diving)
Binghamton, New York* (Camping)
Brussels, Belgium (Diving)
Burlington, Ontario, Canada (Fishing, Camping, Watercraft Recreation)
Casarza Ligure, Italy* (Diving)
Chai Wan, Hong Kong (Diving)
Chatswood, Australia (Diving)
El Cajon, California (Diving)
Eufaula, Alabama* (Fishing)
Little Falls, Minnesota (Fishing)
Manchester, New Hampshire* (Camping)
Mankato, Minnesota* (Fishing)
Mexicali, Mexico* (Fishing)
Old Town, Maine* (Watercraft Recreation)
Toronto, Canada (Fishing)
Nuremberg, Germany (Diving)
Zurich, Switzerland (Diving)
The Company's corporate headquarters is located in a facility in Racine, Wisconsin.
ITEM 3. | LEGAL PROCEEDINGS |
In the normal course of business, we may be involved in various legal proceedings from time to time. As of the date of the filing of this Report, we are not involved in any litigation involving amounts deemed to be material to the business or financial condition of the Company.
ITEM 4. | MINE SAFETY DISCLOSURES |
None.
PART II
ITEM 5. | MARKET FOR REGISTRANT'S COMMON EQUITY, RELATED STOCKHOLDER MATTERS AND ISSUER PURCHASES OF EQUITY SECURITIES |
17
Table of Contents
Market Information
Certain information with respect to this item is included in Notes 9 and 10 to the Company's consolidated financial statements included elsewhere in this report. The Company's Class A common stock is traded on the NASDAQ Global Select Market SM under the symbol: JOUT. There is no public market for the Company's Class B common stock. However, the Class B common stock is convertible at all times at the option of the holder into shares of Class A common stock on a share for share basis. As of October 17, 2018, the Company had approximately 540 holders of record of its Class A common stock and 24 holders of record of its Class B common stock. We believe the number of beneficial owners of our Class A common stock on that date was substantially greater.
A summary of the high and low closing prices for the Company's Class A common stock during each quarter of the years ended September 28, 2018, September 29, 2017 and September 30, 2016 is as follows:
First Quarter | Second Quarter | Third Quarter | Fourth Quarter | |||||||||||||||||||||||||||||||||||||||||||||
2018 | 2017 | 2016 | 2018 | 2017 | 2016 | 2018 | 2017 | 2016 | 2018 | 2017 | 2016 | |||||||||||||||||||||||||||||||||||||
Stock prices: | ||||||||||||||||||||||||||||||||||||||||||||||||
High | $ | 75.21 | $ | 44.86 | $ | 24.24 | $ | 74.48 | $ | 37.77 | $ | 22.99 | $ | 86.66 | $ | 48.85 | $ | 26.75 | $ | 105.16 | $ | 73.28 | $ | 36.62 | ||||||||||||||||||||||||
Low | 59.92 | 34.72 | 21.43 | 60.16 | 31.68 | 19.69 | 61.82 | 33.38 | 20.79 | 78.92 | 46.68 | 26.09 | ||||||||||||||||||||||||||||||||||||
Dividends
The Company's Articles of Incorporation provide that no dividend, other than a dividend payable in shares of the Company's common stock, may be declared or paid upon the Class B common stock unless such dividend is declared or paid upon both classes of common stock. Whenever a dividend (other than a dividend payable in shares of Company common stock) is declared or paid upon any shares of Class B common stock, at the same time there must be declared and paid a dividend on the shares of Class A common stock equal in value to 110% of the amount per share of the dividend declared and paid on the shares of Class B common stock. Whenever a dividend is payable in shares of Company common stock, such dividend must be declared or paid at the same rate on the Class A common stock and the Class B common stock.
Quarterly dividends declared in the first quarter of fiscal 2018 were $0.10 per share of Class A common stock, $0.12 per share for each of the second and third fiscal quarters of fiscal 2018 and $0.14 per share for the fourth fiscal quarter of 2018. Quarterly dividends declared per share of Class B common stock were $0.09 for the first quarter of fiscal 2018, $0.11 per share for each of the second and third fiscal quarters of 2018 and $0.13 per share for the fourth fiscal quarter of 2018. Total dividends declared in fiscal 2018 were $4,746. Cash dividends paid in fiscal 2018 totaled $4,350 and dividends payable of $1,384 were included in current liabilities at September 28, 2018.
While the Board of Directors of the Company presently intends to continue the payment of regular quarterly cash dividends on the Company's common stock, they monitor and evaluate the Company's dividend payment practice quarterly and may elect to increase, decrease or not pay a dividend at any time. The Company's ability to pay dividends could be affected by future business performance, liquidity, capital needs, alternative investment opportunities and compliance with debt covenants in its loan agreements.
Total Shareholder Return
The graph below compares on a market cap weighted cumulative basis the yearly percentage change since September 27, 2013 in the total return (assuming reinvestment of dividends) to shareholders on the Class A common stock with (a) the total return (assuming reinvestment of dividends) on The NASDAQ Stock Market-U.S. Index; (b) the total return (assuming reinvestment of dividends) on the Russell 2000 Index; and (c) the total return (assuming reinvestment of dividends) on a self-constructed peer group index. The Company's peer group consists of Black Diamond Inc., Brunswick Corporation, Callaway Golf Company, Escalade Inc., Garmin Ltd., Marine Products Corporation, Malibu Boats Inc. and Nautilus, Inc. The graph assumes $100 was invested on September 27, 2013 in the Company's Class A common stock, The NASDAQ Stock Market-U.S. Index, the Russell 2000 Index and the peer group index.
18
Table of Contents
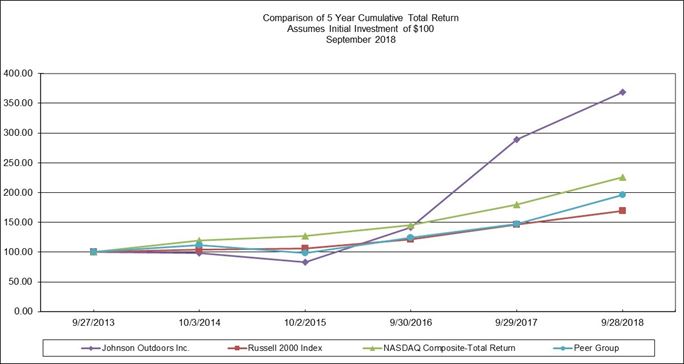
* | $100 invested on September 27, 2013 in stock or index, including reinvestment of dividends. |
Indices calculated on a mid-month basis.
9/27/2013 | 10/3/2014 | 10/2/2015 | 9/30/2016 | 9/29/2017 | 9/28/2018 | |||||||||||||||||||
Johnson Outdoors Inc. | $ | 100.0 | $ | 98.1 | $ | 83.1 | $ | 142.0 | $ | 288.9 | $ | 368.9 | ||||||||||||
NASDAQ Composite | 100.0 | 119.8 | 127.5 | 145.7 | 180.2 | 225.5 | ||||||||||||||||||
Russell 2000 Index | 100.0 | 104.2 | 106.5 | 121.5 | 146.7 | 169.0 | ||||||||||||||||||
Peer Group | 100.0 | 112.3 | 98.7 | 124.4 | 147.1 | 195.8 | ||||||||||||||||||
The information in this section titled "Total Shareholder Return" shall not be deemed to be "soliciting material" or "filed" with the Securities and Exchange Commission or subject to Regulation 14A or 14C promulgated by the Securities and Exchange Commission or subject to the liabilities of section 18 of the Securities Exchange Act of 1934, as amended, and this information shall not be deemed to be incorporated by reference into any filing under the Securities Act of 1933, as amended, or the Securities Exchange Act of 1934, as amended.
ITEM 6. | SELECTED FINANCIAL DATA |
The following table presents selected consolidated financial data, which should be read along with the Company's consolidated financial statements and the notes to those statements and with "Item 7 – Management's Discussion and Analysis of Financial Condition and Results of Operations" included in or referred to elsewhere in this report. The operating results for the years ended September 28, 2018, September 29, 2017 and September 30, 2016 and the balance sheet data as of September 28, 2018 and September 29, 2017, are derived from the Company's audited consolidated financial statements included elsewhere herein. The operating results for the years ended October 2, 2015 and October 3, 2014, and the balance sheet data as of September 30, 2016, October 2, 2015 and October 3, 2014 are derived from the Company's audited consolidated financial statements which are not included in this report. The historical results are not necessarily indicative of results to be expected for future periods.
19
Table of Contents
(thousands, except per share data) | September 28 2018 | September 29 2017 | September 30 2016 | October 2 2015 | October 3 2014 | |||||||||||||||
OPERATING RESULTS | ||||||||||||||||||||
Net sales | $ | 544,268 | $ | 490,565 | $ | 433,727 | $ | 430,489 | $ | 425,410 | ||||||||||
Gross profit | 241,860 | 210,940 | 176,462 | 171,733 | 168,613 | |||||||||||||||
Impairment losses | - | - | 6,197 | - | 8,475 | |||||||||||||||
Operating expenses | 178,839 | 165,349 | 147,371 | 153,880 | 143,447 | |||||||||||||||
Operating profit | 63,021 | 45,591 | 22,894 | 17,853 | 16,691 | |||||||||||||||
Interest expense | 203 | 757 | 727 | 865 | 788 | |||||||||||||||
Other (income) expense, net | (5,288 | ) | (3,376 | ) | (1,488 | ) | 1,235 | (1,519 | ) | |||||||||||
Income before income taxes | 68,106 | 48,210 | 23,655 | 15,753 | 17,422 | |||||||||||||||
Income tax expense | 27,437 | 13,053 | 10,154 | 5,137 | 8,299 | |||||||||||||||
Net income | $ | 40,669 | $ | 35,157 | $ | 13,501 | $ | 10,616 | $ | 9,123 | ||||||||||
Weighted average common shares - Dilutive | 9,996 | 9,920 | 9,855 | 9,727 | 9,635 | |||||||||||||||
Net income per common share - Diluted: | ||||||||||||||||||||
Class A | $ | 4.05 | $ | 3.51 | $ | 1.34 | $ | 1.06 | $ | 0.90 | ||||||||||
Class B | 4.05 | 3.51 | 1.34 | 1.06 | 0.90 | |||||||||||||||
Dividends declared, per common share*: | ||||||||||||||||||||
Class A | $ | 0.48 | $ | 0.37 | $ | 0.32 | $ | 0.31 | $ | 0.38 | ||||||||||
Class B | 0.44 | 0.34 | 0.29 | 0.28 | 0.34 | |||||||||||||||
* There were five quarterly dividends declared in fiscal 2014 and four quarterly dividends declared in fiscal 2015, 2016, 2017 and 2018.
(thousands, except per share data) | September 28 2018 | September 29 2017 | September 30 2016 | October 2 2015 | October 3 2014 | |||||||||||||||
BALANCE SHEET DATA | ||||||||||||||||||||
Current assets | $ | 285,694 | $ | 240,849 | $ | 201,968 | $ | 209,370 | $ | 197,550 | ||||||||||
Total assets | 395,936 | 353,659 | 310,279 | 299,204 | 288,626 | |||||||||||||||
Current liabilities | 92,784 | 84,077 | 67,654 | 69,554 | 60,232 | |||||||||||||||
Long-term debt, less current maturities | - | - | 7,008 | 7,062 | 7,431 | |||||||||||||||
Total debt | - | - | 7,389 | 7,430 | 7,791 | |||||||||||||||
Shareholders' equity | 279,197 | 243,004 | 207,496 | 197,968 | 198,458 | |||||||||||||||
ITEM 7. | MANAGEMENT'S DISCUSSION AND ANALYSIS OF FINANCIAL CONDITION AND RESULTS OF OPERATIONS |
Unless otherwise stated, all monetary amounts in this Management's Discussion and Analysis of Financial Condition and Results of Operations, other than per share amounts, are stated in thousands.
Executive Overview
The Company designs, manufactures and markets high quality recreational products for the outdoor enthusiast. Through a combination of innovative products, strong marketing, a talented and passionate workforce and efficient distribution, the Company seeks to set itself apart from the competition. Its subsidiaries operate as a network that promotes innovation and leverages best practices and synergies, following the strategic vision set by executive management and approved by the Company's Board of Directors.
20
Table of Contents
Highlights
The Company's fiscal 2018 revenues increased by 11% over the prior year driven primarily by strong performance in the Fishing segment. Operating profit grew faster than sales in 2018, increasing $17,430, or 38%, over 2017 due primarily to the higher sales volume and related operating efficiencies.
Results of Operations
Summary consolidated financial results from continuing operations for the fiscal years presented were as follows:
(thousands, except per share data) | 2018 | 2017 | 2016 | |||||||||
Net sales | $ | 544,268 | $ | 490,565 | $ | 433,727 | ||||||
Gross profit | 241,860 | 210,940 | 176,462 | |||||||||
Operating expenses | 178,839 | 165,349 | 153,568 | |||||||||
Operating profit | 63,021 | 45,591 | 22,894 | |||||||||
Interest expense | 203 | 757 | 727 | |||||||||
Other (income) expense, net | (5,288 | ) | (3,376 | ) | (1,488 | ) | ||||||
Income tax expense | 27,437 | 13,053 | 10,154 | |||||||||
Net income | 40,669 | 35,157 | 13,501 | |||||||||
The Company's internal and external sales and operating profit (loss) by business segment for each of the three most recent completed fiscal years were as follows:
2018 | 2017 | 2016 | ||||||||||
Net sales: | ||||||||||||
Fishing | $ | 391,110 | $ | 328,138 | $ | 274,872 | ||||||
Camping | 37,770 | 37,920 | 40,018 | |||||||||
Watercraft Recreation | 36,280 | 48,272 | 50,388 | |||||||||
Diving | 78,932 | 76,732 | 69,137 | |||||||||
Other / Eliminations | 176 | (497 | ) | (688 | ) | |||||||
$ | 544,268 | $ | 490,565 | $ | 433,727 | |||||||
2018 | 2017 | 2016 | ||||||||||
Operating profit (loss): | ||||||||||||
Fishing | $ | 83,696 | $ | 58,697 | $ | 43,092 | ||||||
Camping | 1,867 | 1,946 | 2,077 | |||||||||
Watercraft Recreation | (1,555 | ) | 2,860 | 3,349 | ||||||||
Diving | 2,766 | 1,847 | (9,384 | ) | ||||||||
Other / Eliminations | (23,753 | ) | (19,759 | ) | (16,240 | ) | ||||||
$ | 63,021 | $ | 45,591 | $ | 22,894 | |||||||
See Note 12 to the Consolidated Financial Statements included elsewhere in this report for the definition of segment net sales and operating profit.
21
Table of Contents
Fiscal 2018 vs. Fiscal 2017
Net Sales
Net sales in 2018 increased by 11% to $544,268 compared to $490,565 in 2017. Foreign currency exchange had a $3,396 favorable impact, less than 1%, on the current year's sales versus the prior year.
Net sales for the Fishing business increased by $62,972, or 19% during 2018. Strong performance of new products drove the growth over the prior year.
Camping net sales decreased $150 in 2018 from 2017. Increases in sales of consumer camping products during the current year were offset by the impact on our sales of the divestiture of the Silva brand at the beginning of fiscal 2018.
Net sales in the Watercraft Recreation business decreased $11,992, or 25%, due to a weakened paddling market and lost distribution related to retail consolidations.
Diving net sales increased $2,200, or 3%, year over year. A decrease in sales due to the closure of the Company's subsidiary in Japan at the beginning of 2018 was offset by increased sales of new products in 2018. Foreign currency translation impacted Diving's year to date sales favorably by 3% versus the prior year period.
Cost of Sales
Cost of sales was $302,408, or 55.6% of net sales, on a consolidated basis for fiscal 2018 compared to $279,625, or 57.0% of net sales, in the prior year. Higher sales volumes between years were the primary driver of the increase in the cost of sales, while modest increases in labor rates were more than offset by volume related efficiencies occurring between the fiscal years.
Gross Profit
Gross profit of $241,860 was 44.4% of net sales on a consolidated basis for the year ended September 28, 2018 compared to $210,940, or 43.0% of net sales in the prior year.
Gross profit in the Fishing business increased by $34,480 from the prior year due primarily to the 19% increase in net sales year over year and a sales mix shift to higher value new products during fiscal 2018.
Camping gross profit decreased by $294 from 2017 due primarily to its decreased sales volume between years.
Gross profit in the Watercraft Recreation segment decreased by $5,435 from 2017 levels due primarily to lower sales volumes occurring during 2018.
The $2,114 increase in gross profit in the Diving segment was due primarily to price increases and the favorable impact of foreign currency translation in that segment during fiscal 2018.
Operating Expenses
Operating expenses increased from the prior year by $13,490. The increase was driven primarily by higher sales volume related costs, higher spending on the Company's digital initiatives and increased compensation costs spread across all businesses.
Operating expenses for the Fishing segment increased by $9,481 from fiscal 2017 levels. The increase was due primarily to higher sales volume related expenses. In addition, higher research and development expenses further contributed to the increase between years.
Camping operating expenses decreased by $215 from the prior year due primarily to lower marketing spending in 2018.
In the Watercraft Recreation segment, operating expenses decreased $1,020 from their levels in fiscal 2017 due primarily to lower sales volume related costs in 2018.
22
Table of Contents
Operating expenses for the Diving business increased by $1,195 year over year due primarily to increased marketing and advertising and promotional spending in the current year over the prior year.
The Company's 2018 general corporate expenses of $24,008 increased $4,049 from $19,959 in 2017. The year over year increase primarily reflects additional investment in digital marketing capabilities.
Operating Results
The Company's operating profit was $63,021 in fiscal 2018 compared to an operating profit of $45,591 in fiscal 2017. Fishing operating profit increased by $24,999 to $83,696 from $58,697 in the prior year due primarily to higher sales volumes. The operating profit for Camping was $1,867 compared to $1,946 in 2017. Operating profit for the Watercraft Recreation business decreased by $4,415 in fiscal 2018 due to the factors noted above. Operating profit for the Diving business increased by $919 in fiscal 2018 from fiscal 2017.
Other Income and Expenses
Interest expense of $203 declined from the prior year expense of $757. Interest income of $1,166 increased from prior year income of $316 due to the increase in cash and short-term investments and rising interest rates in 2018. Net other income of $4,122 in fiscal 2018 compared favorably to net other income of $3,060 in fiscal 2017. The current year other income included currency gains of $1,985 and market gains and dividends of $1,734 on deferred compensation plan assets. In the prior year, other income included $903 of currency gains and $2,142 of market gains and dividends on the deferred compensation plan assets. The dividends and market gains and losses on deferred compensation plan assets recognized in the Consolidated Statement of Operations in "Other (income) expense" are offset as compensation expense in "Operating expenses."
Pretax Income and Income Taxes
The Company realized pretax income of $68,106 in fiscal 2018 compared to $48,210 in fiscal 2017. The Company recorded income tax expense of $27,437 in 2018, which equated to an effective tax rate of 40.3%, compared to $13,053 in 2017, which equated to an effective tax rate of 27.1%. The fiscal 2018 expense reflects the impact of provisional expense of $8,456 from the enactment of U.S. Tax Cuts & Jobs Act during our fiscal 2018 in the current year. The fiscal 2017 tax expense reflects the impact of a first quarter foreign tax credit net tax benefit of $4,537 generated by the repatriation of $22,315 in that quarter from foreign jurisdictions into the U.S.
Net Income
The Company recognized net income of $40,669, or $4.05 per diluted common share, in fiscal 2018 compared to $35,157, or $3.51 per diluted common share, in fiscal 2018 based on the factors discussed above.
Fiscal 2017 vs. Fiscal 2016
Net Sales
Net sales in 2017 increased by 13% to $490,565 compared to $433,727 in 2016. Foreign currency exchange had a $236 unfavorable impact, less than 1%, on fiscal 2017 sales versus fiscal 2016.
Net sales for the Fishing business increased by $53,266, or 19% during fiscal 2017. The increase from fiscal 2016 was driven primarily by exceptional new product performance in both the Minn Kota and Humminbird product lines, which included sales of new electric steer trolling motors with redesigned i-Pilot and i-Pilot Link systems, the new Ultrex trolling motor and large display HELIX series fish finders.
23
Table of Contents
Camping net sales decreased $2,098, or 5%, in 2017 from 2016. An increase in sales of Jetboil products during 2017 was not able to offset declines in sales of consumer tents year over year driven by a soft retail marketplace and bankruptcies in key accounts.
Net sales in the Watercraft Recreation business decreased in 2017 by $2,116, or 4%, from 2016 due to softness in the paddling market and bankruptcies in key accounts.
Diving net sales increased $7,595, or 11%, year over year on the strength of new product offerings in the dive computer, buoyancy compensator and regulator product segments.
Cost of Sales
Cost of sales was $279,625, or 57.0% of net sales, on a consolidated basis for fiscal 2017 compared to $257,265, or 59.3% of net sales, in 2016. Higher sales volumes between years were the primary driver of the increase in the cost of sales, while modest increases in labor rates were more than offset by process improvements in each of the business segments.
Gross Profit
Gross profit of $210,940 was 43.0% of net sales on a consolidated basis for the year ended September 29, 2017 compared to $176,462, or 40.7% of net sales in fiscal 2016. Each business segment grew its profit margin percentage year over year.
Gross profit in the Fishing business increased by $29,110 from 2016 due primarily to the 19% increase in net sales and a sales mix shift to higher value new products.
Camping gross profit was essentially flat year over year, growing $72 over 2016 despite a 5% decline in sales due primarily to a favorable mix of products sold.
Gross profit in the Watercraft Recreation segment decreased by $280 from 2016 levels due primarily to lower sales volumes occurring during 2017.
The 11% increase in net sales in the Diving segment was the primary driver of a $5,653 increase in gross profit of that segment year over year. Price increases and a favorable mix of products sold also contributed to the increase.
Operating Expenses
Operating expenses increased in fiscal 2017 from fiscal 2016 levels by $11,781. The increase was driven primarily by higher sales volume related costs, higher incentive and deferred compensation expenses and higher health care expense in fiscal 2017 offset in part by the impact of $6,197 of impairment charges on Diving goodwill recognized in the third quarter of the fiscal 2016.
Operating expenses for the Fishing segment increased by $13,505 from fiscal 2016 levels. The increase in fiscal 2017 was due primarily to higher sales volume related expenses. In addition, higher administrative and legal expenses further contributed to the increase.
Camping operating expenses increased in fiscal 2017 by $203 from fiscal 2016 due primarily to higher marketing costs in 2017 offset in part by lower sales volume related costs.
In the Watercraft Recreation segment, operating expenses increased $210 from their levels in fiscal 2016 due primarily to higher marketing costs in 2017.
Operating expenses for the Diving business decreased by $5,579 year over year due primarily to a goodwill impairment charge of $6,197 recognized in fiscal 2016 offset in part by higher sales volume related costs in fiscal 2017.
24
Table of Contents
The Company's general corporate expenses in 2017 of $19,959 increased $3,441 from $16,518 in 2016. The year over year increase primarily reflects approximately $1,100 of higher deferred compensation expense, offset with market gains on deferred compensation plan assets in Other Income and Expense, approximately $1,100 of higher health care costs and approximately $1,200 of additional investment in digital marketing capabilities.
Operating Results
The Company's operating profit was $45,591 in fiscal 2017 compared to an operating profit of $22,894 in fiscal 2016. Fishing operating profit increased by $15,605 to $58,697 from $43,092 in 2016 due primarily to higher sales volumes. The operating profit for Camping was $1,946 compared to $2,077 and reflects the decline in consumer tent sales year over year. Operating profit for the Watercraft Recreation business decreased by $489 in fiscal 2017 due to the factors noted above. Operating profit for the Diving business increased by $11,231 from fiscal 2016 due in part to the goodwill impairment charge recognized in 2016 as well as the increase in sales volume in 2017.
Other Income and Expenses
Interest expense in fiscal 2017 of $757 was comparable to the 2016 expense of $727. Interest income of $316 increased from 2016 income of $81 due to the investment of excess cash in short-term investments in 2017. Net other income of $3,060 in fiscal 2017 compared favorably to net other income of $1,407 in fiscal 2016. Other income in 2017 included currency gains of $903 and market gains and dividends of $2,142 on deferred compensation plan assets. In 2016, other income included $277 of currency gains as well as $1,092 of market gains and dividends on the deferred compensation plan assets. The dividends and market gains and losses on deferred compensation plan assets recognized in the Consolidated Statement of Operations in "Other (income) expense" are offset as compensation expense in "Operating expenses."
Pretax Income and Income Taxes
The Company realized pretax income of $48,210 in fiscal 2017 compared to $23,655 in fiscal 2016. The Company recorded income tax expense of $13,053 in 2017, which equated to an effective tax rate of 27.1%, compared to $10,154 in 2016, which equated to an effective tax rate of 42.9%. The fiscal 2017 tax expense reflects the impact of a foreign tax credit net tax benefit of $4,537 generated by the repatriation of $22,315 in the first quarter of fiscal 2017 from foreign jurisdictions into the U.S. Additionally, the change in the comparative effective tax rate was also impacted from the result of no tax benefit being recorded on the non-deductible portion of the goodwill impairment charge recognized in the Diving segment in 2016.
Net Income
The Company recognized net income of $35,157, or $3.51 per diluted common share, in fiscal 2017 compared to $13,501, or $1.34 per diluted common share, in fiscal 2016 based on the factors discussed above.
Financial Condition, Liquidity and Capital Resources
The Company believes its existing balances of cash, cash equivalents and short-term investments will be sufficient to satisfy its working capital needs, capital asset purchases, outstanding commitments and other liquidity requirements associated with its existing operations over the next twelve months. The Company currently anticipates the cash used for future dividends will come from its current cash and cash generated from ongoing operating activities.
The Company's short-term investment portfolio is invested in certificates of deposit with original maturities greater than three months but less than one year, with the primary objective of minimizing the potential risk of principal loss. The Company's investment policy generally requires securities to be investment grade.
25
Table of Contents
The Company's cash flows from operating, investing and financing activities, as reflected in the accompanying Consolidated Statements of Cash Flows, are summarized in the following table:
Year Ended | ||||||||||||
(thousands) | September 28 2018 | September 29 2017 | September 30 2016 | |||||||||
Cash provided by (used for): | ||||||||||||
Operating activities | $ | 63,358 | $ | 46,350 | $ | 43,434 | ||||||
Investing activities | 48 | (58,008 | ) | (20,741 | ) | |||||||
Financing activities | (4,935 | ) | (11,551 | ) | (4,736 | ) | ||||||
Effect of foreign currency rate changes on cash | (404 | ) | (275 | ) | 178 | |||||||
Increase (decrease) in cash and cash equivalents | $ | 58,067 | $ | (23,484 | ) | $ | 18,135 | |||||
Operating Activities
The following table sets forth the Company's working capital position at the end of each of the years shown:
(thousands, except share data) | September 28 2018 | September 29 2017 | ||||||
Current assets | $ | 285,694 | $ | 240,849 | ||||
Current liabilities | 92,784 | 84,077 | ||||||
Working capital | $ | 192,910 | $ | 156,772 | ||||
Current ratio | 3.1:1 | 2.9:1 | ||||||
Cash flows provided by operations totaled $63,358, $46,350 and $43,434 in fiscal 2018, 2017 and 2016, respectively. The increase in net income and the effect of an increase in non-cash tax expense in the current year were the primary drivers of the increase in operating cash in 2018 versus 2017. Cash provided by the significant increase in net income in 2017 over 2016 was nearly offset by an increase in inventory in 2017 versus a decrease in inventory in 2016.
Depreciation and amortization charges were $13,105, $13,080 and $11,833 in fiscal 2018, 2017 and 2016, respectively.
Investing Activities
Cash flows provided by investing activities were $48 in fiscal 2018. Cash flows used for investing activities were $58,008 and $20,741 in fiscal 2017 and 2016, respectively. Proceeds from the sale of short-term investments in 2018 provided cash of $52,682, offset by purchases of $34,789, while the purchase of short-term investments in 2017 used cash of $46,607. The purchases of the Seabear and Northport businesses in fiscal 2016 used cash of $9,152. Expenditures for property, plant and equipment were $19,152, $11,613 and $11,702 in fiscal 2018, 2017 and 2016, respectively. In general, the Company's ongoing capital expenditures are primarily related to tooling for new products and facilities and information systems improvements.
Financing Activities
Cash flows used for financing activities totaled $4,935 in fiscal 2018 compared to $11,551 and $4,736 in 2017 and 2016, respectively. Dividend payments were $4,350, $3,559 and $3,169 in 2018, 2017 and 2016, respectively.
On October 24, 2016, the Company repaid its outstanding term loans with Ridgestone Bank totaling $7,068. The early repayment of these loans resulted in payment of a 3% pre-payment penalty. The Company's term loans had a maturity date of September 29, 2029. The interest rate in effect on the term loans was 5.50% at the date of repayment. Payments on long-term debt were $332 in fiscal 2016. The Company had current maturities of its long-term debt of $381 as of September 30, 2016. The Company had outstanding borrowings on long-term debt (net of current maturities) of $7,008 as of September 30, 2016.
26
Table of Contents
On November 15, 2017, the Company and certain of its subsidiaries entered into a new unsecured revolving credit facility with PNC Bank, National Association and Associated Bank, N.A. ("the Lending Group"). This credit facility replaced the Company's previous revolving credit agreement dated September 16, 2013 and consists of an Amended and Restated Revolving Credit Agreement dated November 15, 2017 among the Company, certain of the Company's subsidiaries, PNC Bank, National Association, as lender and as administrative agent, and the other lender named therein (the "New Revolving Credit Agreement" or "New Revolver"). The New Revolver has an expiration date of November 15, 2022, and provides for borrowing of up to an aggregate principal amount not to exceed $75,000 with a $50,000 accordion feature that gives the Company the option to increase the maximum financing availability subject to the conditions of the New Revolving Credit Agreement and subject to the approval of the lenders.
The interest rate on the New Revolver is based on LIBOR plus an applicable margin, which margin resets each quarter. The applicable margin ranges from 1.00% to 1.75% and is dependent on the Company's leverage ratio for the trailing twelve month period. The interest rates on the Revolvers were approximately 3.3% at September 28, 2018 and 2.5% at September 29, 2017.
The New Revolving Credit Agreement restricts the Company's ability to incur additional debt, includes maximum leverage ratio and minimum interest coverage ratio covenants and is unsecured.
As of September 28, 2018, the Company held approximately $40,999 of cash and cash equivalents in bank accounts in foreign jurisdictions.
Contractual Obligations and Off Balance Sheet Arrangements
The Company has contractual obligations and commitments to make future payments under its operating leases and open purchase orders. The following schedule details these significant contractual obligations at September 28, 2018.
Total | Less than 1 year | 2-3 years | 4-5 years | After 5 years | ||||||||||||||||
Operating lease obligations | $ | 52,163 | $ | 7,723 | $ | 13,022 | $ | 6,586 | $ | 24,832 | ||||||||||
Open purchase orders | 90,470 | 90,470 | - | - | - | |||||||||||||||
Total contractual obligations | $ | 142,633 | $ | 98,193 | $ | 13,022 | $ | 6,586 | $ | 24,832 | ||||||||||
The Company utilizes letters of credit primarily as security for the payment of future claims under its workers' compensation insurance. Letters of credit outstanding at September 28, 2018 and September 29, 2017 were $279 and were included in the Company's total loan availability. The Company had no unsecured revolving credit facilities at its foreign subsidiaries as of September 28, 2018 or September 29, 2017.
The Company has no other off-balance sheet arrangements. The Company anticipates making contributions of approximately $184 to its defined benefit pension plans through September 27, 2019.
Market Risk Management
Foreign Exchange Risk
The Company has significant foreign operations, for which the functional currencies are denominated primarily in euros, Swiss francs, Hong Kong dollars and Canadian dollars. As the values of the currencies of the foreign countries in which the Company has operations increase or decrease relative to the U.S. dollar, the sales, expenses, profits, losses, assets and liabilities of the Company's foreign operations, as reported in the Company's consolidated financial statements, increase or decrease, accordingly. Approximately 16% of the Company's revenues for the fiscal year ended September 28, 2018 were denominated in currencies other than the U.S. dollar. Approximately 7% were denominated in euros and approximately 6% were denominated in Canadian dollars, with the remaining 3% denominated in various other foreign currencies. Changes in foreign currency exchange rates can cause unexpected financial losses or cash flow needs.
27
Table of Contents
The Company may mitigate the impact on its operating results of a portion of the fluctuations in certain foreign currencies through the use of foreign currency forward contracts. Foreign currency forward contracts enable the Company to lock in the foreign currency exchange rate for a fixed amount of currency to be paid or received on a specified date in the future. The Company may use such foreign currency forward contracts to mitigate the risk associated with changes in foreign currency exchange rates on financial instruments and known commitments denominated in foreign currencies. As of September 28, 2018 and September 29, 2017, the Company held no foreign currency forward contracts.
Interest Rate Risk
The Company operates in a seasonal business and experiences significant fluctuations in operating cash flow as working capital needs increase in advance of the Company's primary selling and cash generation season, and decline as accounts receivable are collected and cash is accumulated.
Commodities
Certain components used in the Company's products are exposed to commodity price changes. The Company manages this risk through instruments such as purchase orders and non-cancellable supply contracts. Primary commodity price exposures include costs associated with metals, resins and packaging materials.
Impact of Inflation
The Company anticipates that changing costs of basic raw materials may impact future operating costs and, accordingly, the prices of its products. The Company is involved in continuing programs to mitigate the impact of cost increases through changes in product design and identification of sourcing and manufacturing efficiencies. Price increases and, in certain situations, price decreases are implemented for individual products, when appropriate.
The Company's results of operations and financial condition are presented based on historical cost. The Company does not believe that inflation has significantly affected its results of operations.
Critical Accounting Estimates
The Company's management discussion and analysis of its financial condition and results of operations are based upon the Company's consolidated financial statements, which have been prepared in accordance with accounting principles generally accepted in the U.S. The preparation of these financial statements requires the Company to make estimates and judgments that affect the reported amounts of its assets, liabilities, sales and expenses, and related footnote disclosures. On an on-going basis, the Company evaluates its estimates for product returns, bad debts, inventories, long lived assets and goodwill, income taxes, warranty obligations, pensions and other post-retirement benefits, litigation and other subjective matters impacting the financial statements. The Company bases its estimates on historical experience and on various other assumptions that are believed to be reasonable under the circumstances, the results of which form the basis for making judgments about the carrying values of assets and liabilities that are not readily apparent from other sources. Actual results may differ from these estimates under different assumptions or conditions.
The Company believes the following critical accounting policies affect its more significant judgments and estimates used in the preparation of its consolidated financial statements. Management has discussed these policies with the Audit Committee of the Company's Board of Directors.
Allowance for Doubtful Accounts
Allowances for doubtful accounts are estimated by the individual operating companies based on estimates of losses related to customer accounts receivable balances. Estimates are developed by using standard quantitative measures based on historical losses, adjusting for current economic conditions and, in some cases, evaluating specific customer accounts for risk of loss. The establishment of reserves requires the use of judgment and assumptions regarding the potential for losses on receivable balances. Though the Company considers these balances adequate and proper, changes in economic conditions in specific markets in which the Company operates and any specific customer collection issues the Company identifies could have a favorable or unfavorable effect on required reserve balances.
28
Table of Contents
Inventories
The Company values inventory at the lower of cost (determined using the first-in first-out method) or net realizable value. Management's judgment is required to determine the reserve for obsolete or excess inventory. Inventory on hand may exceed future demand either because the product is outdated or because the amount on hand is more than will be used to meet future needs. Inventory reserves are estimated by the individual operating companies using standard quantitative measures based on criteria established by the Company. The Company also considers current forecast plans, as well as market and industry conditions in establishing reserve levels. Though the Company considers these reserve balances to be adequate, changes in economic conditions, customer inventory levels or competitive conditions could have a favorable or unfavorable effect on required reserve balances.
Deferred Taxes
The Company records a valuation allowance to reduce its deferred tax assets to the amount that is more likely than not to be realized. While the Company has considered future taxable income and ongoing prudent and feasible tax planning strategies in assessing the need for the valuation allowance, in the event the Company were to determine that it would not be able to realize all or part of its net deferred tax assets in the future, an adjustment to the deferred tax assets would be charged to income in the period such determination was made. Likewise, should the Company determine that it would be able to realize its deferred tax assets in the future in excess of its net recorded amount, an adjustment to the deferred tax assets would increase income in the period such determination was made.
Goodwill and Other Intangible Assets Impairment
Goodwill and indefinite-lived intangible assets are tested for impairment annually or more frequently if events or changes in circumstances indicate that the assets might be impaired. Generally, annual impairment tests are performed by the Company in the fourth quarter of each fiscal year.
In assessing the recoverability of the Company's goodwill, the Company estimates the fair value of the businesses to which the goodwill relates. Fair value is estimated using a discounted cash flow analysis. If the fair value of a reporting unit exceeds its net book value, no impairment exists. When fair value is less than the carrying value of the net assets and related goodwill, an impairment charge is recognized based on the excess of carrying amount over its fair value. The Company recognized goodwill impairment charges of $6,197 in 2016. See further discussion at Note 1 to the consolidated financial statements included elsewhere in this report.
The discounted cash flow analysis used to estimate fair value requires a number of key estimates and assumptions. The Company estimates the future cash flows of the reporting units based on historical and forecasted revenues and operating costs and applies a discount rate to the estimated future cash flows for purposes of the valuation. This discount rate is based on the estimated weighted average cost of capital, which includes certain assumptions made by management such as market capital structure, market betas, the risk-free rate of return and the estimated costs of borrowing. Changes in these key estimates and assumptions, or in other assumptions used in this process, could materially affect our impairment analysis in a given year.
In assessing the recoverability of the Company's other indefinite lived intangible assets, the Company estimates the fair value of the various intangible assets. The fair value of trademarks and patents is estimated using the relief from royalty method. If the fair value of an intangible asset exceeds its net book value, no impairment exists. When fair value is less than the carrying value of the intangible asset, an impairment loss is recognized for the amount of the difference.
29
Table of Contents
A number of factors, many of which the Company has no ability to control, could affect its financial condition, operating results and business prospects and could cause actual results to differ from the estimates and assumptions that the Company uses in preparing its financial statements. These factors include: a prolonged global economic crisis, a significant decrease in demand for the Company's products, a significant adverse change in legal factors or in the business climate, an adverse action or assessment by a regulator and successful efforts by the Company's competitors to gain market share.
Impairment of Long-Lived Assets and Long-Lived Assets to be Disposed of
The Company evaluates long-lived assets for impairment whenever events or changes in circumstances, such as unplanned negative cash flow indicate that the carrying amount of an asset group may not be recoverable. Recoverability of assets to be held and used is measured by a comparison of the carrying amount of an asset group to future undiscounted cash flows expected to be generated by the asset group. If such assets are determined to be impaired, the impairment to be recognized is measured by the amount by which the carrying amount of the assets exceeds the fair value of the assets. Assets to be disposed of are reported at the lower of the carrying amount or fair value less costs to sell. Application of alternative assumptions, such as changes in the estimate of future cash flows, could produce significantly different results. Because of the significance of the judgments and estimation processes, it is likely that materially different amounts could be recorded if we used different assumptions or if the underlying circumstances were to change.
Warranties
The Company accrues a warranty reserve for estimated costs to provide warranty services. Warranty reserves are estimated using standard quantitative measures based on criteria established by the Company. Estimates of costs to service its warranty obligations are based on historical experience, expectation of future conditions and known product issues. To the extent the Company experiences increased warranty claim activity or increased costs associated with servicing those claims, revisions to the estimated warranty reserve would be required. The Company engages in product quality programs and processes, including monitoring and evaluating the quality of its suppliers, to help minimize warranty obligations.
ITEM 7A. | QUANTITATIVE AND QUALITATIVE DISCLOSURES ABOUT MARKET RISK |
Information with respect to this item is included in Management's Discussion and Analysis of Financial Condition and Results of Operations under the heading "Market Risk Management."
ITEM 8. | FINANCIAL STATEMENTS AND SUPPLEMENTARY DATA |
Information with respect to this item is included in the Company's consolidated financial statements attached to this report on pages F-1 to F-38.
ITEM 9. | CHANGES IN AND DISAGREEMENTS WITH ACCOUNTANTS ON ACCOUNTING AND FINANCIAL DISCLOSURE |
None.
30
Table of Contents
ITEM 9A. | CONTROLS AND PROCEDURES |
| (a) | Evaluation of Disclosure Controls and Procedures |
The Company maintains disclosure controls and procedures (as defined in Rules 13a-15(e) and 15d-15(e) under the Securities Exchange Act of 1934) designed to ensure that information required to be disclosed by the Company in the reports that it files or submits under the Securities Exchange Act of 1934 is recorded, processed, summarized and reported within the time periods specified in the Securities and Exchange Commission's rules and forms, and that the information required to be disclosed by the Company in reports that it files or submits under the Securities Exchange Act of 1934 is accumulated and communicated to its management, including its Chief Executive Officer and Chief Financial Officer, as appropriate to allow timely decisions regarding required disclosure. The Company carried out an evaluation as of September 28, 2018, under the supervision and with the participation of the Company's management, including its Chief Executive Officer and Chief Financial Officer, of the effectiveness of the design and operation of the Company's disclosure controls and procedures. Based on such evaluation, the Company's Chief Executive Officer and Chief Financial Officer concluded that the Company's disclosure controls and procedures were effective as of September 28, 2018 at reaching a level of reasonable assurance. In designing and evaluating the disclosure controls and procedures, management recognized that any controls and procedures, no matter how well designed and operated, can provide only reasonable assurance of achieving the desired control objectives, and management necessarily was required to apply its judgment in evaluating the cost-benefit relationship of possible controls and procedures. The Company has designed its disclosure controls and procedures to reach a level of reasonable assurance of achieving the desired control objectives.
The report of management required under this Item 9A is included on page F-2 of the Company's Consolidated Financial Statements attached to this Report under the heading "Management's Report on Internal Control over Financial Reporting" and is incorporated herein by reference.
| (b) | Changes in Internal Control over Financial Reporting. |
There was no change in the Company's internal control over financial reporting (as defined in Rules 13a-15(f) and 15d-15(f) under the Securities Exchange Act of 1934, as amended) that occurred during the Company's most recently completed fiscal quarter that has materially affected, or is reasonably likely to materially affect, the Company's internal control over financial reporting.
| (c) | Attestation Report of Independent Registered Public Accounting Firm |
RSM US LLP, the independent registered public accounting firm who audited the Company's consolidated financial statements, has issued an attestation report on the Company's internal control over financial reporting, which is contained in the Company's consolidated financial statements under the heading "Report of Independent Registered Public Accounting Firm on Internal Control over Financial Reporting."
ITEM 9B. | OTHER INFORMATION |
None.
31
Table of Contents
PART III
ITEM 10. | DIRECTORS, EXECUTIVE OFFICERS AND CORPORATE GOVERNANCE |
Information with respect to this item is incorporated herein by reference to the discussion under the headings "Proposal 1: Election of Directors," "Executive Officers," "Section 16(a) Beneficial Ownership Reporting Compliance," "Nominating and Corporate Governance Committee" and "Audit Committee Matters – Audit Committee Financial Expert" in the Company's Proxy Statement for the 2019 Annual Meeting of Shareholders, which will be filed with the Securities and Exchange Commission on or before January 26, 2019. Information regarding the Company's Code of Business Ethics is incorporated herein by reference to the discussion under "Corporate Governance Matters – Employee Code of Conduct and Code of Ethics; Corporate Governance Guidelines; and Procedures for Reporting of Accounting Concerns" in the Company's Proxy Statement for the 2019 Annual Meeting of Shareholders, which will be filed with the Securities and Exchange Commission on or before January 26, 2019.
The Audit Committee of the Company's Board of Directors is an "audit committee" for purposes of Section 3(a)(58)(A) of the Securities Exchange Act of 1934. The members of the Audit Committee are Terry E. London (Chairman), Thomas F. Pyle, Jr., Edward F. Lang and Richard ("Casey") Sheahan.
ITEM 11. | EXECUTIVE COMPENSATION |
Information with respect to this item is incorporated herein by reference to the discussion under the headings "Directors Compensation" and "Executive Compensation" and "CEO Pay Relative to Median Pay of our Employees" in the Company's Proxy Statement for the 2019 Annual Meeting of Shareholders, which will be filed with the Securities and Exchange Commission on or before January 26, 2019.
The information incorporated by reference from "Report of the Compensation Committee" in the Company's Proxy Statement for the 2019 Annual Meeting of Shareholders, which will be filed with the Securities and Exchange Commission on or before January 26, 2019, shall not be deemed "filed" for purposes of Section 18 of the Securities Exchange Act of 1934 nor shall it be deemed incorporated by reference in any filing under the Securities Act of 1933 or the Securities Exchange Act of 1934, except as shall be expressly set forth by specific reference in such filing.
ITEM 12. | SECURITY OWNERSHIP OF CERTAIN BENEFICIAL OWNERS AND MANAGEMENT AND RELATED STOCKHOLDER MATTERS |
Information with respect to this item is incorporated herein by reference to the discussion under the heading "Stock Ownership of Management and Others" in the Company's Proxy Statement for the 2019 Annual Meeting of Shareholders, which will be filed with the Securities and Exchange Commission on or before January 26, 2019.
Equity Compensation Plan Information
The following table summarizes share information, as of September 28, 2018, for the Company's equity compensation plans, including the Johnson Outdoors Inc. 2012 Non-Employee Director Stock Ownership Plan, the Johnson Outdoors Inc. 2010 Long-Term Stock Incentive Plan and the Johnson Outdoors Inc. 2009 Employee Stock Purchase Plan. All of these plans have been approved by the Company's shareholders.
Plan Category | Number of Common Shares to Be Issued Upon Exercise of Outstanding Options, Warrants and Rights | Weighted-average Exercise Price of Outstanding Options, Warrants and Rights | Number of Common Shares Available for Future Issuance Under Equity Compensation Plans | |||||||||
2010 Long-Term Stock Incentive Plan | - | $ | - | 523,879 | ||||||||
2012 Non-Employee Director Stock Ownership Plan | 32,908 | - | 54,291 | |||||||||
2009 Employee Stock Purchase Plan | - | - | 87,624 | |||||||||
Total All Plans | 32,908 | - | 665,794 | |||||||||
32
Table of Contents
ITEM 13. | CERTAIN RELATIONSHIPS AND RELATED TRANSACTIONS AND DIRECTOR INDEPENDENCE |
Information with respect to this item is incorporated herein by reference to the discussion under the heading "Certain Relationships and Related Transactions" in the Company's Proxy Statement for the 2019 Annual Meeting of Shareholders, which will be filed with the Securities and Exchange Commission on or before January 26, 2019. Information regarding director independence is incorporated by reference to the discussions under "Corporate Governance Matters-Director Independence" in the Company's Proxy Statement for the 2019 Annual Meeting of Shareholders, which will be filed with the Securities and Exchange Commission on or before January 26, 2019.
ITEM 14. | PRINCIPAL ACCOUNTANT FEES AND SERVICES |
Information with respect to this item is incorporated herein by reference to the discussion under the heading "Audit Committee Matters – Fees of Independent Registered Public Accounting Firm" in the Company's Proxy Statement for the 2019 Annual Meeting of Shareholders, which will be filed with the Securities and Exchange Commission on or before January 26, 2019.
PART IV
ITEM 15. | EXHIBITS AND FINANCIAL STATEMENT SCHEDULES |
The following documents are filed as a part of this report:
Financial Statements
Included in Item 8 of Part II of this report are the following:
| • | Reports of Independent Registered Public Accounting Firm |
| • | Consolidated Statements of Operations – Years ended September 28, 2018, September 29, 2017 and September 30, 2016 |
| • | Consolidated Statements of Comprehensive Income – Years ended September 28, 2018, September 29, 2017 and September 30, 2016 |
| • | Consolidated Balance Sheets – September 28, 2018 and September 29, 2017 |
| • | Consolidated Statements of Shareholders' Equity – Years ended September 28, 2018, September 29, 2017 and September 30, 2016 |
| • | Consolidated Statements of Cash Flows – Years ended September 28, 2018, September 29, 2017 and September 30, 2016 |
| • | Notes to Consolidated Financial Statements |
Exhibits
See Exhibit Index.
33
Table of Contents
ITEM 16. | FORM 10-K SUMMARY |
None.
SIGNATURES
Pursuant to the requirements of Section 13 or 15(d) of the Securities Exchange Act of 1934, the registrant has duly caused this report to be signed on its behalf by the undersigned, thereunto duly authorized, in the City of Racine and State of Wisconsin, on the 7 th day of December 2018.
JOHNSON OUTDOORS INC. (Registrant) | ||
By | /s/ Helen P. Johnson-Leipold | |
Helen P. Johnson-Leipold | ||
Chairman and Chief Executive Officer |
Pursuant to the requirements of the Securities Exchange Act of 1934, this report has been signed by the following persons on behalf of the registrant and in the capacities indicated on the 7 th day of December 2018.
/s/ Helen P. Johnson-Leipold | Chairman and Chief Executive Officer | |
(Helen P. Johnson-Leipold) | and Director | |
(Principal Executive Officer) | ||
/s/ Thomas F. Pyle, Jr. | Vice Chairman of the Board | |
(Thomas F. Pyle, Jr.) | and Lead Outside Director | |
/s/ Terry E. London | Director | |
(Terry E. London) | ||
/s/ John M. Fahey, Jr. | Director | |
(John M. Fahey, Jr.) | ||
/s/ Edward Stevens | Director | |
(Edward Stevens) | ||
/s/ Edward F. Lang | Director | |
(Edward F. Lang) | ||
/s/ Katherine Button Bell | Director | |
(Katherine Button Bell) | ||
/s/ Richard Sheahan | Director | |
(Richard ("Casey") Sheahan) | ||
/s/ William D. Perez | Director | |
(William D. Perez) | ||
/s/ David W. Johnson | Vice President and Chief Financial Officer | |
(David W. Johnson) | (Principal Financial and Accounting Officer) |
34
Table of Contents
EXHIBIT INDEX
Exhibit | Title |
3.1 | Articles of Incorporation of the Company as amended through February 17, 2000. (Filed as Exhibit 3.1(a) to the Company's Form 10-Q for the quarter ended March 31, 2000 and incorporated herein by reference.) |
3.2 | Bylaws of the Company as amended and restated through December 6, 2010. (Filed as Exhibit 3.2 to the Company's Form 10-K for the year ended October 1, 2010 and incorporated herein by reference.) |
9.1 | Johnson Outdoors Inc. Class B common stock Amended and Restated Voting Trust Agreement, dated as of February 16, 2010 (Filed as Exhibit 2 to Amendment No. 14 to the Schedule 13D filed by Helen P. Johnson-Leipold on February 24, 2017 and incorporated herein by reference.) |
10.1 | Registration Rights Agreement regarding Johnson Outdoors Inc. common stock issued to the Johnson family prior to the acquisition of Johnson Diversified, Inc. (Filed as Exhibit 10.1 to the Company's Form 10-K dated and filed with the Securities and Exchange Commission on December 8, 2017 and incorporated herein by reference.) |
10.2 | Registration Rights Agreement regarding Johnson Outdoors Inc. Class A common stock held by Mr. Samuel C. Johnson. (Filed as Exhibit 10.2 to the Company's Form 10-K dated and filed with the Securities and Exchange Commission on December 8, 2017 and incorporated herein by reference.) |
10.3 + | Johnson Outdoors Inc. 2000 Long-Term Stock Incentive Plan. (Filed as Exhibit 99.1 to the Company's Current Report on Form 8-K dated July 29, 2005 and incorporated herein by reference.) |
10.4 + | Johnson Outdoors Inc. Worldwide Key Executives' Discretionary Bonus Plan. (Filed as Appendix A to the Company's Proxy Statement on Schedule 14A filed with the Securities and Exchange Commission on January 13, 2014 and incorporated herein by reference.) |
10.5 + | Johnson Outdoors Inc. 2003 Non-Employee Director Stock Ownership Plan. (Filed as Exhibit 10.2 to the Company's Form 10-Q dated April 2, 2004 and incorporated herein by reference.) |
10.6 + | Form of Restricted Stock Agreement under Johnson Outdoors Inc. 2003 Non-Employee Director Stock Ownership Plan. (Filed as Exhibit 4.2 to the Company's Form S-8 Registration Statement No. 333-115298 and incorporated herein by reference.) |
10.7 + | Form of Stock Option Agreement under Johnson Outdoors Inc. 2003 Non-Employee Director Stock Ownership Plan. (Filed as Exhibit 10.2 to the Company's Form S-8 Registration Statement No. 333-115298 and incorporated herein by reference.) |
35
Table of Contents
10.8 | Amended and Restated Credit Agreement dated as of November 15, 2017 among Johnson Outdoors Inc., certain subsidiaries of Johnson Outdoors Inc., PNC Bank, National Association, as lender and administrative agent, PNC Capital markets LLC, as sole lead arranger and bookrunner, and the other lender named therein (filed as Exhibit 99.1 to the current report on Form 8-K dated and filed with the Securities and Exchange Commission on November 20, 2017). |
10.9 + | Johnson Outdoors Inc. 2009 Employees' Stock Purchase Plan. (Filed as Exhibit 99.2 to the current report on Form 8-K dated and filed with the Securities and Exchange Commission on March 8, 2010.) |
10.10 + | Johnson Outdoors Inc. 2010 Long Term Stock Incentive Plan. (Filed as Appendix A to the Company's Proxy Statement on Schedule 14A filed with the Securities and Exchange Commission on January 15, 2015 and incorporated herein by reference.) |
10.11 + | Johnson Outdoors Inc. 2012 Non-Employee Director Stock Ownership Plan. (Filed as Appendix A to the Company's Proxy Statement on Schedule 14A filed with the Securities and Exchange Commission on January 13, 2017 and incorporated herein by reference.) |
10.12 + | Form of Restricted Stock Unit Agreement under Johnson Outdoors Inc. 2012 Non-Employee Director Stock Ownership Plan. (Filed as Exhibit 10.31 to the annual report on Form 10-K dated and filed with the Securities and Exchange Commission on December 5, 2014.) |
10.13 + | Form of Restricted Stock Unit Agreement (Performance Based) under Johnson Outdoors Inc. 2012 Non-Employee Director Stock Ownership Plan. (Filed as Exhibit 10.32 to the annual report on Form 10-K dated and filed with the Securities and Exchange Commission on December 7, 2015.) |
10.14+ | Form of Restricted Stock Agreement under Johnson Outdoors Inc. 2012 Non-Employee Director Stock Ownership Plan. |
21 | Subsidiaries of the Company as of September 28, 2018. |
23 | Consent of Independent Registered Public Accounting Firm. |
31.1 | Certification of Chief Executive Officer pursuant to Rule 13a-14(a) or 15d-14(a). |
31.2 | Certification of Chief Financial Officer pursuant to Rule 13a-14(a) or 15d-14(a). |
32.1 | Certifications of Chief Executive Officer and Chief Financial Officer pursuant to 18 U.S.C. Section 1350. (1) |
101 | The following materials from Johnson Outdoors Inc.'s Annual Report on Form 10-K for the fiscal year ended September 28, 2018 formatted in XBRL (eXtensible Business Reporting Language) and furnished electronically herewith: (i) Consolidated Statements of Operations; (ii) Consolidated Statements of Comprehensive Income, (iii) Consolidated Balance Sheets; (iv) Consolidated Statements of Shareholders' Equity; (v) Consolidated Statements of Cash Flows; and (vi) Notes to Consolidated Financial Statements. |
| + | A management contract or compensatory plan or arrangement. |
| (1) | This certification is not "filed" for purposes of Section 18 of the Securities Exchange Act of 1934, as amended, or incorporated by reference into any filing under the Securities Act of 1933, as amended, or the Securities Exchange Act of 1934, as amended. |
36
Table of Contents
CONSOLIDATED FINANCIAL STATEMENTS
Table of Contents | Page | |
Management's Report on Internal Control over Financial Reporting | F-2 | |
Report of Independent Registered Public Accounting Firm on Internal Control over Financial Reporting | F-3 | |
Report of Independent Registered Public Accounting Firm | F-4 | |
Consolidated Statements of Operations | F-5 | |
Consolidated Statements of Comprehensive Income | F-6 | |
Consolidated Balance Sheets | F-7 | |
Consolidated Statements of Shareholders' Equity | F-8 | |
Consolidated Statements of Cash Flows | F-9 | |
Notes to Consolidated Financial Statements | F-10 |
Table of Contents
MANAGEMENT'S REPORT ON INTERNAL CONTROL OVER FINANCIAL REPORTING
The management of Johnson Outdoors Inc. is responsible for establishing and maintaining adequate internal control over financial reporting, as such term is defined in Rule 13a-15(f) of the Securities Exchange Act of 1934. The Company's internal control over financial reporting is designed to provide reasonable assurance to the Company's management and board of directors regarding the preparation and fair presentation of published financial statements. The Company's internal control over financial reporting includes those policies and procedures that:
| (a) | pertain to the maintenance of records that, in reasonable detail, accurately and fairly reflect the transactions and dispositions of the assets of the Company; |
| (b) | provide reasonable assurance that transactions are recorded as necessary to permit preparation of financial statements in accordance with U.S. generally accepted accounting principles, and that receipts and expenditures of the Company are being made only in accordance with authorizations of management and directors of the Company; and |
| (c) | provide reasonable assurance regarding prevention or timely detection of unauthorized acquisition, use or disposition of the Company's assets that could have a material effect on the financial statements. |
Because of its inherent limitations, internal control over financial reporting may not prevent or detect misstatements. Therefore, even those systems determined to be effective can provide only reasonable assurance with respect to financial statement preparation and presentation. Also, projections of any evaluation of effectiveness to future periods are subject to the risk that controls may become inadequate because of changes in conditions, or that the degree of compliance with the policies or procedures may deteriorate.
Management assessed the effectiveness of the Company's internal control over financial reporting as of September 28, 2018. In making this assessment, management used the criteria established in Internal Control - Integrated Framework issued by the Committee of Sponsoring Organizations of the Treadway Commission (COSO) in 2013. Based on our assessment, management believes that, as of September 28, 2018, the Company's internal control over financial reporting was effective based on those criteria.
/s/ Helen P. Johnson-Leipold | /s/ David W. Johnson | ||
Chairman and Chief Executive Officer | Vice President and Chief Financial Officer |
F-2
Table of Contents
REPORT OF INDEPENDENT REGISTERED PUBLIC ACCOUNTING FIRM ON INTERNAL CONTROL OVER FINANCIAL REPORTING
To the Shareholders and the Board of Directors of Johnson Outdoors Inc.
Opinion on the Internal Control Over Financial Reporting
We have audited Johnson Outdoors Inc.'s internal control over financial reporting as of September 28, 2018, based on criteria established in Internal Control - Integrated Framework issued by the Committee of Sponsoring Organizations of the Treadway Commission in 2013. In our opinion, Johnson Outdoors Inc. maintained, in all material respects, effective internal control over financial reporting as of September 28, 2018, based on criteria established in Internal Control - Integrated Framework issued by the Committee of Sponsoring Organizations of the Treadway Commission in 2013.
We have also audited, in accordance with the standards of the Public Company Accounting Oversight Board (United States) (PCAOB), the consolidated financial statements of Johnson Outdoors Inc. and our report dated December 7, 2018 expressed an unqualified opinion.
Basis for Opinion
Johnson Outdoors Inc.'s management is responsible for maintaining effective internal control over financial reporting and for its assessment of the effectiveness of internal control over financial reporting included in the accompanying Management's Report on Internal Control over Financial Reporting. Our responsibility is to express an opinion on the Johnson Outdoors Inc.'s internal control over financial reporting based on our audit. We are a public accounting firm registered with the PCAOB and are required to be independent with respect to Johnson Outdoors Inc. in accordance with U.S. federal securities laws and the applicable rules and regulations of the Securities and Exchange Commission and the PCAOB.
We conducted our audit in accordance with the standards of the PCAOB. Those standards require that we plan and perform the audit to obtain reasonable assurance about whether effective internal control over financial reporting was maintained in all material respects. Our audit included obtaining an understanding of internal control over financial reporting, assessing the risk that a material weakness exists, and testing and evaluating the design and operating effectiveness of internal control based on the assessed risk. Our audit also included performing such other procedures as we considered necessary in the circumstances. We believe that our audit provides a reasonable basis for our opinion.
Definition and Limitations of Internal Control Over Financial Reporting
A company's internal control over financial reporting is a process designed to provide reasonable assurance regarding the reliability of financial reporting and the preparation of financial statements for external purposes in accordance with generally accepted accounting principles. A company's internal control over financial reporting includes those policies and procedures that (1) pertain to the maintenance of records that, in reasonable detail, accurately and fairly reflect the transactions and dispositions of the assets of Johnson Outdoors Inc. ; (2) provide reasonable assurance that transactions are recorded as necessary to permit preparation of financial statements in accordance with generally accepted accounting principles, and that receipts and expenditures of Johnson Outdoors Inc. are being made only in accordance with authorizations of management and directors of Johnson Outdoors Inc. ; and (3) provide reasonable assurance regarding prevention or timely detection of unauthorized acquisition, use or disposition of Johnson Outdoors Inc.'s assets that could have a material effect on the financial statements.
Because of its inherent limitations, internal control over financial reporting may not prevent or detect misstatements. Also, projections of any evaluation of effectiveness to future periods are subject to the risk that controls may become inadequate because of changes in conditions, or that the degree of compliance with the policies or procedures may deteriorate.
/s/ RSM US LLP
Milwaukee, Wisconsin
December 7, 2018
F-3
Table of Contents
REPORT OF INDEPENDENT REGISTERED PUBLIC ACCOUNTING FIRM
To the Shareholders and the Board of Directors of Johnson Outdoors Inc.
Opinion on the Financial Statements
We have audited the accompanying consolidated balance sheets of Johnson Outdoors Inc. as of September 28, 2018 and September 29, 2017, and the related consolidated statements of operations, comprehensive income, shareholders' equity, and cash flows for each of the three years in the period ended September 28, 2018, and the related notes to the consolidated financial statements. In our opinion, the financial statements present fairly, in all material respects, the financial position of Johnson Outdoors Inc. as of September 28, 2018 and September 29, 2017, and the results of their operations and their cash flows for each of the three years in the period ended September 28, 2018, in conformity with accounting principles generally accepted in the United States of America.
We have also audited, in accordance with the standards of the Public Company Accounting Oversight Board (United States) (PCAOB), Johnson Outdoors Inc.'s internal control over financial reporting as of September 28, 2018, based on criteria established in Internal Control - Integrated Framework issued by the Committee of Sponsoring Organizations of the Treadway Commission in 2013, and our report dated December 7, 2018 expressed an unqualified opinion on the effectiveness of Johnson Outdoors Inc.'s internal control over financial reporting.
Basis for Opinion
These financial statements are the responsibility of Johnson Outdoors Inc.'s management. Our responsibility is to express an opinion on these financial statements based on our audits. We are a public accounting firm registered with the PCAOB and are required to be independent with respect to Johnson Outdoors Inc. in accordance with U.S. federal securities laws and the applicable rules and regulations of the Securities and Exchange Commission and the PCAOB.
We conducted our audits in accordance with the standards of the PCAOB. Those standards require that we plan and perform the audits to obtain reasonable assurance about whether the financial statements are free of material misstatement, whether due to error or fraud. Our audits included performing procedures to assess the risks of material misstatement of the financial statements, whether due to error or fraud, and performing procedures that respond to those risks. Such procedures included examining, on a test basis, evidence regarding the amounts and disclosures in the financial statements. Our audits also included evaluating the accounting principles used and significant estimates made by management, as well as evaluating the overall presentation of the financial statements. We believe that our audits provide a reasonable basis for our opinion.
/s/ RSM US LLP
We have served as Johnson Outdoors Inc.' s auditor since 2010.
Milwaukee, Wisconsin
December 7, 2018
F-4
Table of Contents
CONSOLIDATED STATEMENTS OF OPERATIONS
Year Ended | ||||||||||||
(thousands, except per share data) | September 28 2018 | September 29 2017 | September 30 2016 | |||||||||
Net sales | $ | 544,268 | $ | 490,565 | $ | 433,727 | ||||||
Cost of sales | 302,408 | 279,625 | 257,265 | |||||||||
Gross profit | 241,860 | 210,940 | 176,462 | |||||||||
Operating expenses: | ||||||||||||
Marketing and selling | 112,782 | 100,359 | 90,690 | |||||||||
Administrative management, finance and information systems | 45,616 | 45,824 | 38,251 | |||||||||
Goodwill and other intangible assets impairment | - | - | 6,197 | |||||||||
Research and development | 20,441 | 19,166 | 18,430 | |||||||||
Total operating expenses | 178,839 | 165,349 | 153,568 | |||||||||
Operating profit | 63,021 | 45,591 | 22,894 | |||||||||
Interest income | (1,166 | ) | (316 | ) | (81 | ) | ||||||
Interest expense | 203 | 757 | 727 | |||||||||
Other (income) expense | (4,122 | ) | (3,060 | ) | (1,407 | ) | ||||||
Profit before income taxes | 68,106 | 48,210 | 23,655 | |||||||||
Income tax expense | 27,437 | 13,053 | 10,154 | |||||||||
Net income | $ | 40,669 | $ | 35,157 | $ | 13,501 | ||||||
Weighted average common shares - Basic: | ||||||||||||
Class A | 8,730 | 8,675 | 8,627 | |||||||||
Class B | 1,212 | 1,212 | 1,212 | |||||||||
Dilutive stock options and restricted stock units | 54 | 33 | 16 | |||||||||
Weighted average common shares - Dilutive | 9,996 | 9,920 | 9,855 | |||||||||
Net income per common share - Basic: | ||||||||||||
Class A | $ | 4.12 | $ | 3.56 | $ | 1.36 | ||||||
Class B | $ | 3.74 | $ | 3.23 | $ | 1.24 | ||||||
Net income per common share - Diluted: | ||||||||||||
Class A | $ | 4.05 | $ | 3.51 | $ | 1.34 | ||||||
Class B | $ | 4.05 | $ | 3.51 | $ | 1.34 | ||||||
Dividends declared per common share: | ||||||||||||
Class A | $ | 0.48 | $ | 0.37 | $ | 0.32 | ||||||
Class B | $ | 0.44 | $ | 0.34 | $ | 0.29 | ||||||
The accompanying notes are an integral part of the Consolidated Financial Statements.
F-5
Table of Contents
CONSOLIDATED STATEMENTS OF COMPREHENSIVE INCOME
Year Ended | ||||||||||||
(thousands, except per share data) | September 28 2018 | September 29 2017 | September 30 2016 | |||||||||
Net income | $ | 40,669 | $ | 35,157 | $ | 13,501 | ||||||
Other comprehensive (loss) income: | ||||||||||||
Foreign currency translation: | ||||||||||||
Foreign currency translation | (1,005 | ) | 590 | 521 | ||||||||
Reclassification adjustment for currency translation (gains) losses related to the liquidation of foreign entities included in net income | (2,378 | ) | 64 | (249 | ) | |||||||
Defined benefit pension plan: | ||||||||||||
Unrecognized gain (loss) arising during period, net of tax of ($460), ($938) and $1,168, respectively | 1,457 | 1,532 | (1,906 | ) | ||||||||
Amortization of unrecognized losses included in net periodic benefit cost, net of tax of ($133), ($278) and ($215), respectively | 420 | 453 | 351 | |||||||||
Total other comprehensive (loss) income | (1,506 | ) | 2,639 | (1,283 | ) | |||||||
Total comprehensive income | $ | 39,163 | $ | 37,796 | $ | 12,218 | ||||||
The accompanying notes are an integral part of the Consolidated Financial Statements.
F-6
Table of Contents
CONSOLIDATED BALANCE SHEETS
(thousands, except share data) | September 28 2018 | September 29 2017 | ||||||
ASSETS | ||||||||
Current assets: | ||||||||
Cash and cash equivalents | $ | 121,877 | $ | 63,810 | ||||
Short-term investments | 28,714 | 46,607 | ||||||
Accounts receivable, net | 40,866 | 46,814 | ||||||
Inventories | 88,864 | 79,148 | ||||||
Other current assets | 5,373 | 4,470 | ||||||
Total current assets | 285,694 | 240,849 | ||||||
Property, plant and equipment, net of accumulated depreciation of $131,322 and $132,567, respectively | 55,934 | 48,938 | ||||||
Deferred income taxes | 11,748 | 22,632 | ||||||
Goodwill | 11,199 | 11,238 | ||||||
Other intangible assets, net | 12,341 | 13,476 | ||||||
Other assets | 19,020 | 16,526 | ||||||
Total assets | $ | 395,936 | $ | 353,659 | ||||
LIABILITIES AND SHAREHOLDERS' EQUITY | ||||||||
Current liabilities: | ||||||||
Accounts payable | 34,160 | 31,686 | ||||||
Accrued liabilities: | ||||||||
Salaries, wages and benefits | 22,315 | 21,825 | ||||||
Accrued warranty | 8,499 | 6,393 | ||||||
Income taxes payable | 7,739 | 5,434 | ||||||
Accrued discounts and returns | 7,505 | 5,137 | ||||||
Other | 12,566 | 13,602 | ||||||
Total current liabilities | 92,784 | 84,077 | ||||||
Deferred income taxes | 1,715 | 1,845 | ||||||
Retirement benefits | 1,945 | 8,844 | ||||||
Other liabilities | 20,295 | 15,889 | ||||||
Total liabilities | 116,739 | 110,655 | ||||||
Shareholders' equity: | ||||||||
Preferred stock: none issued | - | - | ||||||
Common stock: | ||||||||
Class A shares issued and outstanding: | 442 | 442 | ||||||
September 28, 2018: 8,787,360 | ||||||||
September 29, 2017: 8,784,513 | ||||||||
Class B shares issued and outstanding: | 61 | 61 | ||||||
September 28, 2018: 1,211,686 | ||||||||
September 29, 2017: 1,211,686 | ||||||||
Capital in excess of par value | 75,025 | 72,801 | ||||||
Retained earnings | 202,828 | 166,905 | ||||||
Accumulated other comprehensive income | 3,487 | 4,993 | ||||||
Treasury stock at cost, shares of Class A common stock: 67,655 and 67,137, respectively | (2,646 | ) | (2,198 | ) | ||||
Total shareholders' equity | 279,197 | 243,004 | ||||||
Total liabilities and shareholders' equity | $ | 395,936 | $ | 353,659 | ||||
The accompanying notes are an integral part of the Consolidated Financial Statements.
F-7
Table of Contents
CONSOLIDATED STATEMENTS OF SHAREHOLDERS' EQUITY
(thousands except for shares) | Shares | Common Stock | Capital in Excess of Par Value | Retained Earnings | Treasury Stock | Accumulated Other Comprehensive Income (Loss) | ||||||||||||||||||
BALANCE AT OCTOBER 2, 2015 | 9,982,994 | $ | 502 | $ | 69,545 | $ | 125,173 | $ | (889 | ) | $ | 3,637 | ||||||||||||
Net income | - | - | - | 13,501 | - | - | ||||||||||||||||||
Dividends declared | - | - | - | (3,269 | ) | - | - | |||||||||||||||||
Issuance of stock under employee stock purchase plan | 7,732 | - | 160 | - | - | - | ||||||||||||||||||
Award of non-vested shares | 54,850 | - | (493 | ) | - | 493 | - | |||||||||||||||||
Stock-based compensation | - | - | 1,813 | - | - | - | ||||||||||||||||||
Tax effects on stock based awards | - | - | 112 | - | - | - | ||||||||||||||||||
Currency translation adjustment | - | - | - | - | - | 521 | ||||||||||||||||||
Write off of currency translation adjustment loss | - | - | - | - | - | (249 | ) | |||||||||||||||||
Change in pension plans, net of tax of $952 | - | - | - | - | - | (1,555 | ) | |||||||||||||||||
Non-vested stock forfeitures | (7,885 | ) | - | - | - | - | - | |||||||||||||||||
Purchase of treasury stock at cost | (19,973 | ) | - | - | - | (1,506 | ) | - | ||||||||||||||||
Reissue of treasury stock | 3,416 | - | (10 | ) | - | 10 | - | |||||||||||||||||
BALANCE AT SEPTEMBER 30, 2016 | 10,021,134 | 502 | 71,127 | 135,405 | (1,892 | ) | 2,354 | |||||||||||||||||
Net income | - | - | - | 35,157 | - | - | ||||||||||||||||||
Dividends declared | - | - | - | (3,657 | ) | - | - | |||||||||||||||||
Issuance of stock under employee stock purchase plan | 1,414 | - | 47 | - | - | - | ||||||||||||||||||
Award of non-vested shares | 20,460 | 1 | (553 | ) | - | 553 | - | |||||||||||||||||
Stock-based compensation | - | - | 1,985 | - | - | - | ||||||||||||||||||
Currency translation adjustment | - | - | - | - | - | 590 | ||||||||||||||||||
Write off of currency translation adjustment loss | - | - | - | - | - | 64 | ||||||||||||||||||
Change in pension plans, net of tax of $1,216 | - | - | - | - | - | 1,985 | ||||||||||||||||||
Non-vested stock forfeitures | - | - | 195 | - | (195 | ) | - | |||||||||||||||||
Purchase of treasury stock at cost | (46,809 | ) | - | - | - | (664 | ) | - | ||||||||||||||||
BALANCE AT SEPTEMBER 29, 2017 | 9,996,199 | 503 | 72,801 | 166,905 | (2,198 | ) | 4,993 | |||||||||||||||||
Net income | - | - | - | 40,669 | - | - | ||||||||||||||||||
Dividends declared | - | - | - | (4,746 | ) | - | - | |||||||||||||||||
Issuance of stock under employee stock purchase plan | 3,365 | - | 154 | - | - | - | ||||||||||||||||||
Award of non-vested shares | 8,859 | - | (227 | ) | - | 227 | - | |||||||||||||||||
Stock-based compensation | - | - | 2,297 | - | - | - | ||||||||||||||||||
Currency translation adjustment | - | - | - | - | - | (1,005 | ) | |||||||||||||||||
Write off of currency translation adjustment gain | - | - | - | - | - | (2,378 | ) | |||||||||||||||||
Change in pension plans, net of tax of $593 | - | - | - | - | - | 1,877 | ||||||||||||||||||
Purchase of treasury stock at cost | (9,377 | ) | - | - | - | (675 | ) | - | ||||||||||||||||
BALANCE AT SEPTEMBER 28, 2018 | 9,999,046 | $ | 503 | $ | 75,025 | $ | 202,828 | $ | (2,646 | ) | $ | 3,487 | ||||||||||||
The accompanying notes are an integral part of the Consolidated Financial Statements.
F-8
Table of Contents
CONSOLIDATED STATEMENTS OF CASH FLOWS
Year Ended | ||||||||||||
(thousands) | September 28 2018 | September 29 2017 | September 30 2016 | |||||||||
CASH PROVIDED BY OPERATING ACTIVITIES | ||||||||||||
Net income | $ | 40,669 | $ | 35,157 | $ | 13,501 | ||||||
Adjustments to reconcile net income to net cash provided by operating activities: | ||||||||||||
Depreciation | 11,994 | 11,804 | 10,654 | |||||||||
Amortization of intangible assets | 1,111 | 1,276 | 1,179 | |||||||||
Amortization of deferred financing costs | 58 | 297 | 122 | |||||||||
(Gain) loss on sale of productive assets | (1,134 | ) | (17 | ) | 16 | |||||||
Impairment losses | - | - | 6,197 | |||||||||
Stock based compensation | 2,297 | 1,986 | 1,832 | |||||||||
Write off of currency translation adjustment (gain) loss | (2,378 | ) | 64 | (249 | ) | |||||||
Provision for doubtful accounts receivable | 21 | 876 | 299 | |||||||||
Provision for inventory reserves | 394 | 1,356 | 3,650 | |||||||||
Pension contributions | (5,188 | ) | (1,365 | ) | (482 | ) | ||||||
Deferred income taxes | 10,772 | (2,784 | ) | (2,219 | ) | |||||||
Change in operating assets and liabilities: | ||||||||||||
Accounts receivable, net | 5,409 | (5,364 | ) | 3,390 | ||||||||
Inventories, net | (10,495 | ) | (11,413 | ) | 8,524 | |||||||
Accounts payable and accrued liabilities | 8,432 | 15,901 | (2,513 | ) | ||||||||
Other current assets | (837 | ) | 193 | 197 | ||||||||
Other non-current assets | - | 57 | (246 | ) | ||||||||
Other long-term liabilities | 1,990 | (1,034 | ) | (140 | ) | |||||||
Other, net | 243 | (640 | ) | (278 | ) | |||||||
63,358 | 46,350 | 43,434 | ||||||||||
CASH PROVIDED BY (USED FOR) INVESTING ACTIVITIES | ||||||||||||
Payments for purchase of business | - | - | (9,152 | ) | ||||||||
Purchase of short-term investments | (34,789 | ) | (46,607 | ) | - | |||||||
Proceeds from sales of short-term investments | 52,682 | - | - | |||||||||
Capital expenditures | (19,152 | ) | (11,613 | ) | (11,702 | ) | ||||||
Proceeds from sale of productive assets | 1,307 | 212 | 113 | |||||||||
48 | (58,008 | ) | (20,741 | ) | ||||||||
CASH USED FOR FINANCING ACTIVITIES | ||||||||||||
Principal payments on term loans and other long-term debt | - | (7,376 | ) | (332 | ) | |||||||
Debt issuance costs paid | (63 | ) | - | - | ||||||||
Common stock transactions | 153 | 47 | 271 | |||||||||
Dividends paid | (4,350 | ) | (3,559 | ) | (3,169 | ) | ||||||
Purchases of treasury stock | (675 | ) | (663 | ) | (1,506 | ) | ||||||
(4,935 | ) | (11,551 | ) | (4,736 | ) | |||||||
Effect of foreign currency rate changes on cash | (404 | ) | (275 | ) | 178 | |||||||
Increase (decrease) in cash and cash equivalents | 58,067 | (23,484 | ) | 18,135 | ||||||||
CASH AND CASH EQUIVALENTS | ||||||||||||
Beginning of period | 63,810 | 87,294 | 69,159 | |||||||||
End of period | $ | 121,877 | $ | 63,810 | 87,294 | |||||||
Supplemental Disclosure: | ||||||||||||
Cash paid for taxes | $ | 14,422 | $ | 13,751 | $ | 14,496 | ||||||
Cash paid for interest | 143 | 493 | 732 | |||||||||
The accompanying notes are an integral part of the Consolidated Financial Statements.
F-9
Table of Contents
NOTES TO CONSOLIDATED FINANCIAL STATEMENTS
SEPTEMBER 28, 2018
(IN THOUSANDS EXCEPT SHARE AND PER SHARE AMOUNTS)
1 | SUMMARY OF SIGNIFICANT ACCOUNTING POLICIES |
Business
Johnson Outdoors Inc. (the "Company") is an integrated, global outdoor recreation products company engaged in the design, manufacture and marketing of brand name camping, diving, watercraft and marine electronics products.
Principles of Consolidation
The consolidated financial statements include the accounts of Johnson Outdoors Inc. and all majority owned subsidiaries and are stated in conformity with U.S. generally accepted accounting principles. Intercompany accounts and transactions have been eliminated upon consolidation.
Use of Estimates
The preparation of financial statements requires management to make estimates and assumptions that impact the reported amounts of assets, liabilities and operating results and the disclosure of commitments and contingent liabilities. Actual results could differ significantly from those estimates.
Fiscal Year
The Company's fiscal year ends on the Friday nearest September 30. The fiscal years ended September 28, 2018 (hereinafter 2018), September 29, 2017 (hereinafter 2017) and September 30, 2016 (hereinafter 2016) all comprised 52 weeks.
Cash, Cash Equivalents and Short-term Investments
The Company considers all short-term investments in interest-bearing bank accounts, and all securities and other instruments with an original maturity of three months or less, to be equivalent to cash. Cash equivalents are stated at cost which approximates market value. Short-term investments consist of certificates of deposit with original maturities greater than three months but less than one year.
The Company maintains cash in bank accounts in excess of insured limits. The Company has not experienced any losses and does not believe that significant credit risk exists as a result of this practice.
As of September 28, 2018, the Company held approximately $40,999 of cash and cash equivalents in bank accounts in foreign jurisdictions.
Accounts Receivable
Accounts receivable are recorded at face value less an allowance for doubtful accounts. The allowance for doubtful accounts is based on a combination of factors. In circumstances where specific collection concerns exist, a reserve is established to reduce the amount recorded to an amount the Company believes will be collected. For all other customers, the Company recognizes allowances for doubtful accounts based on historical experience of bad debts as a percent of outstanding accounts receivable for each business unit. Uncollectible accounts are written off against the allowance for doubtful accounts after collection efforts have been exhausted. The Company typically does not require collateral on its accounts receivable.
F-10
Table of Contents
Inventories
The Company values inventory at the lower of cost (determined using the first-in first-out method) or net realizable value. Management's judgment is required to determine the reserve for obsolete or excess inventory. Inventory on hand may exceed future demand either because the product is outdated or because the amount on hand is more than will be used to meet future needs. Inventory reserves are estimated by the individual operating companies using standard quantitative measures based on criteria established by the Company. The Company also considers current forecast plans, as well as market and industry conditions in establishing reserve levels. Though the Company considers these reserve balances to be adequate, changes in economic conditions, customer inventory levels or competitive conditions could have a favorable or unfavorable effect on required reserve balances.
Inventories at the end of the respective fiscal years consisted of the following:
September 28 2018 | September 29 2017 | |||||||
Raw materials | $ | 40,375 | $ | 32,826 | ||||
Work in process | 39 | 48 | ||||||
Finished goods | 48,450 | 46,274 | ||||||
$ | 88,864 | $ | 79,148 | |||||
Property, Plant and Equipment
Property, plant and equipment are stated at cost less accumulated depreciation. Depreciation of property, plant and equipment is determined by straight-line methods over the following estimated useful lives:
Property improvements | 5-20 years |
Buildings and improvements | 20-40 years |
Furniture and fixtures, equipment and computer software | 3-10 years |
Upon retirement or disposition of any of the foregoing types of assets, cost and the related accumulated depreciation are removed from the applicable account and any resulting gain or loss is recognized in the statements of operations.
Property, plant and equipment at the end of the respective years consisted of the following:
2018 | 2017 | |||||||
Property improvements | $ | 590 | $ | 590 | ||||
Buildings and improvements | 21,669 | 21,770 | ||||||
Furniture and fixtures, equipment and computer software | 164,997 | 159,145 | ||||||
187,256 | 181,505 | |||||||
Less accumulated depreciation | 131,322 | 132,567 | ||||||
$ | 55,934 | $ | 48,938 | |||||
Goodwill
The Company applies a fair value-based impairment test to the carrying value of goodwill on an annual basis as of the last day of the eleventh month of the Company's fiscal year and, if certain events or circumstances indicate that an impairment loss may have been incurred, on an interim basis. The results of the impairment tests performed in 2018 and 2017 indicated no impairment to the Company's goodwill.
F-11
Table of Contents
During the third quarter of fiscal 2016, the Company recognized an impairment charge of $6,197 in the Diving reporting unit. Revised projections for the unit based on lower than anticipated results due to a sustained decline in sales and unfavorable operating margins were considered an indicator of potential goodwill impairment, and accordingly, the Company performed an impairment analysis on the goodwill of the Diving reporting unit following the previous guidance which required a two step approach.
In conducting its analysis, the Company uses the income approach to compare the reporting unit's carrying value to its indicated fair value. Fair value is determined primarily by using a discounted cash flow methodology that requires considerable management judgment and long-term assumptions and is considered a Level 3 (unobservable) fair value determination in the fair value hierarchy (see Note 4 below).
The Company's analysis indicated the carrying value of the Diving reporting unit exceeded its indicated fair value as of the measurement date of June 3, 2016 resulting in performing a step 2 hypothetical business combination analysis, which determined that the carrying amount of goodwill exceeded its implied fair value. As a result, the Company recognized an impairment charge in the third quarter of fiscal 2016 of $6,197 in "Goodwill and other intangible assets impairment" in the accompanying Condensed Consolidated Statements of Operations in the Diving segment, thereby reducing its carrying value to $0.
The Company's impairment analysis is based on management's estimates. Due to the uncertainty of future events, the Company cannot assure that growth rates will not be lower than expected, that discount rates will not increase or that projected cash flows will not decline, all of which factors could impact the carrying value of any remaining goodwill (or portion thereof) in future periods, and accordingly, whether any impairment losses need to be recorded in future periods.
The changes in the carrying amount and the composition of the Company's goodwill for fiscal 2018 and 2017 were as follows:
Fishing | Camping | Watercraft | Diving | Total | ||||||||||||||||
Balance at September 30, 2016 | ||||||||||||||||||||
Goodwill | $ | 17,425 | $ | 7,038 | $ | 6,242 | $ | 33,078 | $ | 63,783 | ||||||||||
Accumulated impairment losses | (6,229 | ) | (7,038 | ) | (6,242 | ) | (33,078 | ) | (52,587 | ) | ||||||||||
11,196 | - | - | - | 11,196 | ||||||||||||||||
Currency translation | 42 | - | - | - | 42 | |||||||||||||||
Balance at September 29, 2017 | ||||||||||||||||||||
Goodwill | 17,467 | 7,038 | 6,242 | 33,078 | 63,825 | |||||||||||||||
Accumulated impairment losses | (6,229 | ) | (7,038 | ) | (6,242 | ) | (33,078 | ) | (52,587 | ) | ||||||||||
11,238 | - | - | - | 11,238 | ||||||||||||||||
Currency translation | (39 | ) | - | - | - | (39 | ) | |||||||||||||
Balance at September 28, 2018 | ||||||||||||||||||||
Goodwill | 17,428 | 7,038 | 6,242 | 33,078 | 63,786 | |||||||||||||||
Accumulated impairment losses | (6,229 | ) | (7,038 | ) | (6,242 | ) | (33,078 | ) | (52,587 | ) | ||||||||||
$ | 11,199 | $ | - | $ | - | $ | - | $ | 11,199 | |||||||||||
Other Intangible Assets
Indefinite-lived intangible assets are also tested for impairment annually and, if certain events or circumstances indicate that an impairment loss may have been incurred, on an interim basis. There were no impairment losses recognized in fiscal 2018, 2017 or 2016.
Intangible assets with definite lives are stated at cost less accumulated amortization. Amortization is computed using the straight-line method over periods ranging from 4 to 15 years. Amortization of patents and other intangible assets with definite lives was $1,111, $1,276 and $1,179 for 2018, 2017 and 2016, respectively. Amortization of these definite-lived intangible assets is expected to be approximately $1,073, $1,007, $817, $688 and $688 for fiscal years 2019, 2020, 2021, 2022 and 2023, respectively.
F-12
Table of Contents
Intangible assets at the end of the last two years consisted of the following:
2018 | 2017 | |||||||||||||||||||||||
Gross Intangible | Accumulated Amortization | Net | Gross Intangible | Accumulated Amortization | Net | |||||||||||||||||||
Amortized other intangible assets: | ||||||||||||||||||||||||
Patents and trademarks | $ | 4,205 | $ | (4,170 | ) | $ | 35 | $ | 4,213 | $ | (4,144 | ) | $ | 69 | ||||||||||
Other amortizable intangibles | 11,095 | (5,814 | ) | 5,281 | 11,131 | (4,749 | ) | 6,382 | ||||||||||||||||
Non-amortized trademarks | 7,025 | - | 7,025 | 7,025 | - | 7,025 | ||||||||||||||||||
$ | 22,325 | $ | (9,984 | ) | $ | 12,341 | $ | 22,369 | $ | (8,893 | ) | $ | 13,476 | |||||||||||
Impairment of Long-Lived Assets
The Company reviews long-lived assets for impairment whenever events or changes in business circumstances such as unplanned negative cash flow indicate that the carrying amount of these assets may not be fully recoverable. In such an event, the carrying amount of the asset group is compared to the future undiscounted cash flows expected to be generated by the asset group to determine if impairment exists on these assets. If impairment is determined to exist, any related impairment loss is calculated based on the difference between the fair value and the carrying value on these assets. The Company performed an impairment analysis, which included a discounted cash flow analysis, on the long-lived assets in its Watercraft segment during the fourth quarter of fiscal 2018. No impairment was indicated.
Warranties
The Company provides for warranties of certain products as they are sold. Warranty reserves are estimated using standard quantitative measures based on criteria established by the Company. Estimates of costs to service its warranty obligations are based on historical experience, expectation of future conditions and known product issues. The following table summarizes the warranty activity for the three years in the period ended September 28, 2018.
Balance at October 2, 2015 | $ | 4,301 | ||
Expense accruals for warranties issued during the period | 4,699 | |||
Less current period warranty claims paid | 4,674 | |||
Balance at September 30, 2016 | $ | 4,326 | ||
Expense accruals for warranties issued during the period | 7,452 | |||
Less current period warranty claims paid | 5,385 | |||
Balance at September 29, 2017 | $ | 6,393 | ||
Expense accruals for warranties issued during the period | 9,389 | |||
Less current period warranty claims paid | 7,283 | |||
Balance at September 28, 2018 | $ | 8,499 |
Accumulated Other Comprehensive Income
The components of Accumulated other comprehensive income ("AOCI") on the accompanying Consolidated Balance Sheets as of the end of fiscal year 2018, 2017 and 2016 were as follows:
F-13
Table of Contents
2018 | 2017 | 2016 | ||||||||||||||||||||||||||||||||||
Pre-Tax Amount | Tax Effect | Net of Tax Effect | Pre-Tax Amount | Tax Effect | Net of Tax Effect | Pre-Tax Amount | Tax Effect | Net of Tax Effect | ||||||||||||||||||||||||||||
Foreign currency translation adjustment | $ | 7,796 | $ | - | $ | 7,796 | $ | 11,179 | $ | - | $ | 11,179 | $ | 10,525 | $ | - | $ | 10,525 | ||||||||||||||||||
Unamortized loss on pension plans | (5,329 | ) | 1,020 | (4,309 | ) | (7,799 | ) | 1,613 | (6,186 | ) | (10,999 | ) | 2,828 | (8,171 | ) | |||||||||||||||||||||
Accumulated other comprehensive income | $ | 2,467 | $ | 1,020 | $ | 3,487 | $ | 3,380 | $ | 1,613 | $ | 4,993 | $ | (474 | ) | $ | 2,828 | $ | 2,354 | |||||||||||||||||
The reclassifications out of AOCI for the year ended September 28, 2018 were as follows:
Statement of Operations Presentation | |||||
Unamortized loss on defined benefit pension plans | |||||
Amortization of loss | $ | 553 | Cost of sales / Operating expense | ||
Tax effects | (133 | ) | Income tax expense | ||
Foreign currency translation adjustments | |||||
Write off of currency translation amounts | (2,378 | ) | Other income and expense | ||
Total reclassifications for the period | $ | (1,958 | ) | ||
The reclassifications out of AOCI for the year ended September 29, 2017 were as follows:
Statement of Operations Presentation | |||||
Unamortized loss on defined benefit pension plans: | |||||
Amortization of loss | $ | 731 | Cost of sales / Operating expense | ||
Tax effects | (278 | ) | Income tax expense | ||
Foreign currency translation adjustments: | |||||
Write off of currency translation amounts | 64 | Other income and expense | |||
Total reclassifications for the period | $ | 517 | |||
The reclassifications out of AOCI for the year ended September 30, 2016 were as follows:
Statement of Operations Presentation | |||||
Unamortized loss on defined benefit pension plans: | |||||
Amortization of loss | $ | 566 | Cost of sales / Operating expense | ||
Tax effects | (215 | ) | Income tax expense | ||
Foreign currency translation adjustments | |||||
Write off of currency translation amounts | (249 | ) | Other income and expense | ||
Total reclassifications for the period | $ | 102 | |||
F-14
Table of Contents
The changes in AOCI by component, net of tax, for the year ended September 28, 2018 were as follows:
Foreign Currency Translation Adjustment | Unamortized Loss on Defined Benefit Pension Plans | Accumulated Other Comprehensive Income (Loss) | ||||||||||
Balance at September 29, 2017 | $ | 11,179 | $ | (6,186 | ) | $ | 4,993 | |||||
Other comprehensive (loss) income before reclassifications | (1,005 | ) | 1,917 | 912 | ||||||||
Amounts reclassified from accumulated other comprehensive income | (2,378 | ) | 553 | (1,825 | ) | |||||||
Tax effects | - | (593 | ) | (593 | ) | |||||||
Balance at September 28, 2018 | $ | 7,796 | $ | (4,309 | ) | $ | 3,487 | |||||
The changes in AOCI by component, net of tax, for the year ended September 29, 2017 were as follows:
Foreign Currency Translation Adjustment | Unamortized Loss on Defined Benefit Pension Plans | Accumulated Other Comprehensive Income (Loss) | ||||||||||
Balance at September 30, 2016 | $ | 10,525 | $ | (8,171 | ) | $ | 2,354 | |||||
Other comprehensive income before reclassifications | 590 | 2,470 | 3,060 | |||||||||
Amounts reclassified from accumulated other comprehensive income | 64 | 731 | 795 | |||||||||
Tax effects | - | (1,216 | ) | (1,216 | ) | |||||||
Balance at September 29, 2017 | $ | 11,179 | $ | (6,186 | ) | $ | 4,993 | |||||
Earnings per Share ("EPS")
Net income or loss per share of Class A common stock and Class B common stock is computed using the two-class method. Grants of restricted stock (whether vested or unvested) which receive non-forfeitable dividends are required to be included as part of the basic weighted average share calculation under the two-class method.
Holders of Class A common stock are entitled to cash dividends equal to 110% of all dividends declared and paid on each share of Class B common stock. The Company grants shares of unvested restricted stock in the form of Class A shares, which carry the same distribution rights as the Class A common stock described above. As such, the undistributed earnings for each period are allocated to each class of common stock based on the proportionate share of the amount of cash dividends that each such class is entitled to receive.
Basic EPS
Basic net income or loss per share is computed by dividing net income or loss allocated to Class A common stock and Class B common stock by the weighted-average number of shares of Class A common stock and Class B common stock outstanding, respectively. In periods with cumulative year to date net income and undistributed income, the undistributed income for each period is allocated to each class of common stock based on the proportionate share of the amount of cash dividends that each such class is entitled to receive. In periods where there is a cumulative year to date net loss or no undistributed income because distributions through dividends exceed net income, Class B shares are treated as anti-dilutive and, therefore, net losses are allocated equally on a per share basis among all participating securities.
For the years ended September 28, 2018, September 29, 2017 and September 30, 2016, basic income per share for Class A and Class B shares has been presented using the two class method as described above.
F-15
Table of Contents
Diluted EPS
Diluted net income per share is computed by dividing allocated net income by the weighted-average number of common shares outstanding, adjusted for the effect of dilutive stock options, restricted stock units and non-vested restricted stock. Anti-dilutive stock options, restricted stock units and non-vested stock are excluded from the calculation of diluted EPS. The computation of diluted net income per share of Class A common stock assumes that Class B common stock is converted into Class A common stock. Therefore, diluted net income per share is the same for both Class A and Class B common shares. In periods where the Company reports a net loss, the effect of anti-dilutive stock options, restricted stock units and non-vested stock is excluded and diluted loss per share is equal to basic loss per share.
For the years ended September 28, 2018, September 29, 2017 and September 30, 2016, diluted net income per share reflects the effect of dilutive stock options and restricted stock units and assumes the conversion of Class B common stock into Class A common stock.
There were no stock options that could potentially dilute earnings per share in the future which were not included in the fully diluted computation because they would have been anti-dilutive for the years ended September 28, 2018, September 29, 2017 and September 30, 2016. Non-vested stock that could potentially dilute earnings per share in the future which were not included in the fully diluted computation because they would have been anti-dilutive totaled 46,776, 95,068 and 162,472 shares for the years ended September 28, 2018, September 29, 2017 and September 30, 2016, respectively.
The following table sets forth a reconciliation of net income to dilutive earnings used in the diluted earnings per common share calculations and the computation of basic and diluted earnings per common share:
2018 | 2017 | 2016 | ||||||||||
Net income | $ | 40,669 | $ | 35,157 | $ | 13,501 | ||||||
Less: Undistributed earnings reallocated to non-vested shareholders | (224 | ) | (375 | ) | (258 | ) | ||||||
Dilutive earnings | $ | 40,445 | $ | 34,782 | $ | 13,243 | ||||||
Weighted average common shares – Basic: | ||||||||||||
Class A | 8,730 | 8,675 | 8,627 | |||||||||
Class B | 1,212 | 1,212 | 1,212 | |||||||||
Dilutive stock options and restricted stock units | 54 | 33 | 16 | |||||||||
Weighted average common shares - Dilutive | 9,996 | 9,920 | 9,855 | |||||||||
Net income per common share – Basic: | ||||||||||||
Class A | $ | 4.12 | $ | 3.56 | $ | 1.36 | ||||||
Class B | $ | 3.74 | $ | 3.23 | $ | 1.24 | ||||||
Net income per common share – Diluted: | ||||||||||||
Class A | $ | 4.05 | $ | 3.51 | $ | 1.34 | ||||||
Class B | $ | 4.05 | $ | 3.51 | $ | 1.34 | ||||||
Stock-Based Compensation
Stock-based compensation cost is recorded for all option grants and awards of non-vested stock and restricted stock units based on their grant-date fair value. Stock-based compensation expense is recognized on a straight-line basis over the vesting period of each award. No stock options were granted in 2018, 2017 or 2016. See Note 10 of these Notes to Consolidated Financial Statements for information regarding the Company's stock-based incentive plans, including stock options, non-vested stock, and employee stock purchase plans.
Income Taxes
The Company provides for income taxes currently payable and deferred income taxes resulting from temporary differences between financial statement income/loss and taxable income/loss. Accrued interest and penalties related to unrecognized tax benefits are recognized as a component of income tax expense. Deferred income tax assets and liabilities are determined based on the difference between the amounts reported in the financial statements and the tax basis of assets and liabilities, using enacted tax rates in effect in the years in which the differences are expected to reverse. Deferred income tax assets and liabilities are adjusted for the effects of changes in tax laws and rates on the date of enactment. A valuation allowance is established if it is more likely than not that some portion or all of a deferred income tax asset will not be realized. See Note 6 of these Notes to Consolidated Financial Statements for further discussion.
F-16
Table of Contents
Employee Benefits
The Company and certain of its subsidiaries have various retirement and profit sharing plans. The Company does not have any significant foreign retirement plans. Pension obligations, which are generally based on compensation and years of service, are funded by payments to pension fund trustees. The Company's policy is to annually fund the minimum amount required under the Employee Retirement Income Security Act of 1974 for plans subject thereto although the Company may choose to fund more than the minimum amount at its discretion. Other retirement costs are funded at least annually. See Note 7 of these Notes to Consolidated Financial Statements for additional discussion.
Foreign Operations and Related Derivative Financial Instruments
The functional currencies of the Company's foreign operations are the local currencies. Accordingly, assets and liabilities of foreign operations are translated into U.S. dollars at the rate of exchange existing at the end of the year. Results of operations are translated at monthly average exchange rates. Adjustments resulting from the translation of foreign currency financial statements are classified as "Accumulated other comprehensive income (loss)," a separate component of Shareholders' equity.
Currency gains and losses are recognized when assets and liabilities of foreign operations, denominated in other than their local currency, are converted into the local currency of the entity. Additionally, currency gains and losses are recognized through the settlement of transactions denominated in other than the local currency. The Company recognized currency gains from transactions of $1,985, $903, and $277 in 2018, 2017, and 2016, respectively, which were included in Other (income) expense in the accompanying Consolidated Statements of Operations.
Because the Company operates internationally, it has exposure to market risk from movements in foreign currency exchange rates. Approximately 16% of the Company's revenues for the year ended September 28, 2018 were denominated in currencies other than the U.S. dollar. Approximately 7% were denominated in euros and approximately 6% were denominated in Canadian dollars, with the remaining 3% denominated in various other foreign currencies. The Company may mitigate the impact on its operating results of a portion of the fluctuations in certain foreign currencies through the purchase of foreign currency swaps, forward contracts and options to hedge known commitments denominated in foreign currencies or borrowings in foreign currencies. The Company did not use foreign currency forward contracts in 2018, 2017 or 2016. The Company does not enter into foreign exchange contracts for trading or speculative purposes.
Revenue Recognition
The Company recognizes revenue when all of the following criteria have been met:
| • | Persuasive evidence of an arrangement exists. Contracts, internet commerce agreements, and customer purchase orders are generally used to determine the existence of an arrangement. |
| • | All substantial risk of ownership transfers to the customer. Shipping documents and customer acceptance, when applicable, are used to verify delivery. |
| • | The fee is fixed or determinable. This is assessed based on the payment terms associated with the transaction and whether the sales price is subject to refund or adjustment. |
| • | Collectability is reasonably assured. Collectability is assessed based on the creditworthiness of the customer as determined by credit checks and analysis, as well as by the customer's payment history. |
Estimated costs of returns and allowances and discounts are accrued as a reduction to sales when revenue is recognized.
Advertising & Promotions
The Company expenses substantially all costs related to the production of advertising the first time the advertising takes place. Cooperative promotional arrangements are accrued as related revenue is earned.
F-17
Table of Contents
Advertising and promotions expense in 2018, 2017 and 2016 totaled $26,319, $24,349 and $23,611, respectively. These charges are included in "Marketing and selling expenses." Capitalized advertising costs, included in Other current assets, totaled $606 and $621 at September 28, 2018 and September 29, 2017, respectively, and primarily included catalogs and costs of advertising which have not yet run for the first time.
Shipping and Handling Costs
Shipping and handling fees billed to customers are included in "Net sales." Shipping and handling costs are included in "Marketing and selling expenses" and totaled $11,846, $10,844 and $10,240 for 2018, 2017 and 2016, respectively.
Research and Development
The Company expenses research and development costs as incurred except for costs of software development for new electronic products which are capitalized once technological feasibility is established and are included in Furniture, Fixtures and Equipment. The gross amount capitalized related to software development was $38,062, less accumulated amortization of $21,788, at September 28, 2018 and $34,528, less accumulated amortization of $18,040, at September 29, 2017. These costs are amortized over the expected life of the software of three to seven years. Amortization expense related to capitalized software in 2018, 2017 and 2016 was $3,747, $3,444 and $2,738, respectively, and is included in depreciation expense on plant, property and equipment.
Fair Values
The carrying amounts of cash, cash equivalents, short-term investments, accounts receivable, and accounts payable approximated fair value at September 28, 2018 and September 29, 2017 due to the short maturities of these instruments. During 2018, 2017 and 2016, the Company held investments in equity and debt securities that were carried at fair value related to its deferred compensation liability which was also carried at the same fair value. When indicators of impairment are present, the Company may be required to value certain long-lived assets such as property, plant, and equipment, and other intangibles at fair value.
Valuation Techniques
Rabbi Trust Assets
Rabbi trust assets, used to fund amounts the Company owes to certain officers and other employees under the Company's non-qualified deferred compensation plan, are included in "Other assets," and are classified as trading securities. These assets are comprised of marketable debt and equity securities that are marked to fair value based on unadjusted quoted prices in active markets.
Goodwill and Other Intangible Assets
In assessing the recoverability of the Company's goodwill and other intangible assets, the Company estimates the future discounted cash flows of the business segments to which the goodwill relates. When estimated future discounted cash flows are less than the carrying value of the net assets and related goodwill, an impairment charge is recognized based on the excess of the carrying amount over the fair value. In determining estimated future cash flows, the Company makes assumptions regarding anticipated financial position, future earnings and other factors to determine the fair value of the respective assets.
See Note 4 of these Notes to Consolidated Financial Statements for disclosures regarding fair value measurements.
F-18
Table of Contents
New Accounting Pronouncements
In May 2014, the Financial Accounting Standards Board ("FASB") issued Accounting Standards Update ("ASU") 2014-09, Revenue from Contracts with Customers (Topic 606), which supersedes existing revenue recognition requirements and provides a new comprehensive revenue recognition model. The underlying principle of the new standard requires entities to recognize revenue to depict the transfer of promised goods or services to customers in an amount that reflects what it expects to receive in exchange for those goods or services. Topic 606 also requires additional disclosures about the nature, amount, timing and uncertainty of revenue and cash flows arising from customer contracts, including significant judgments and changes in judgments. The provisions are effective for the Company in the first quarter of fiscal 2019 at which time the Company will adopt Topic 606 using the modified retrospective approach.
The Company's project plan for the implementation of the new standard included a review of all revenue streams to identify potential differences in the performance obligations, timing, measurement or presentation that would result from applying the new standard. The Company is in the process of implementing appropriate changes to its business processes, systems and controls to support revenue recognition and disclosures under Topic 606.
The Company anticipates that the adoption of this standard will not have a significant impact on its consolidated financial statements.
In July 2015, the FASB issued ASU 2015-11, Simplifying the Measurement of Inventory . The ASU includes provisions intended to simplify the measurement of inventory and to more clearly articulate the requirements for the measurement and disclosure of inventory. Under such provisions, an entity should measure inventory within the scope of this amendment at the lower of cost or net realizable value. Net realizable value is the estimated selling prices in the ordinary course of business, less reasonably predictable costs of completion, disposal and transportation. The Company adopted this standard at the beginning of the first quarter of fiscal 2018. The adoption of this ASU did not have a significant impact on the Company's consolidated financial statements.
In February 2016, the FASB issued ASU 2016-02, Leases (Topic 842) . In July 2018, the FASB also issued ASU 2018-10 Codification Improvements to Topic 842, Leases and ASU 2018-11 Leases (Topic 842) Targeted Improvements. The amendments in this update will increase the transparency and comparability among organizations by recognizing lease assets and lease liabilities on the balance sheet and disclosing key information about leasing arrangements. This guidance is effective for the Company in the first quarter of fiscal year 2020, and may be applied through a modified retrospective transition approach for leases existing at, or entered into after, the beginning of the earliest comparative period presented in the financial statements with certain practical expedients available. An entity may apply the new leases standard at the adoption date and recognize a cumulative-effect adjustment to the opening balance of retained earnings in the period of adoption. The Company is currently evaluating the effect of this standard on its consolidated financial statements.
In March 2017, the FASB issued ASU 2017-07, Improving the Presentation of Net Periodic Pension Cost and Net Periodic Postretirement Benefit Cost . The ASU includes, among other provisions, one that will require presentation of the service cost component of net benefit cost in the same line item(s) as other compensation costs arising from services rendered by the pertinent employees during the period. The other components of net benefit cost are required to be presented in the income statement separately from the service cost component and outside of a subtotal of income from operations. This amendment is effective for annual periods beginning after December 15, 2017 and the interim periods within those annual periods. The Company elected to adopt this accounting standard at the beginning of the first quarter of fiscal 2018. The adoption of this standard resulted in a reduction of an annual operating expense of $848 and an increase in other expense of $848. The adoption of this standard did not have an effect on the Company's consolidated balance sheets or consolidated statements of cash flows.
In February 2018, the FASB issued ASU 2018-02, Income Statement - Reporting Comprehensive Income -
Reclassification of Certain Tax Effects from Accumulated Other Comprehensive Income (Topic 220) , which allows for a reclassification from accumulated other comprehensive income to retained earnings for stranded tax effects resulting from the Tax Cuts and Jobs Act of 2017. ASU No. 2018-02 is effective for fiscal years beginning after December 15, 2018, including interim periods within those fiscal years. The ASU allows for early adoption in any interim period after issuance of the update. The Company is currently assessing the impact this ASU will have on its consolidated financial statements.
F-19
Table of Contents
In August 2018, the FASB issued ASU 2018-14, Changes to the Disclosure Requirements for Defined Benefit Plans (Topic 715) , intended to modify the disclosure requirements for employers that sponsor defined pension or postretirement plans. The amendments in this guidance are effective for fiscal years ending after December 15, 2020, with early adoption permitted. The Company is currently evaluating the potential impact of this guidance on its disclosures.
2 | INDEBTEDNESS |
The Company had no outstanding debt at September 28, 2018 or September 29, 2017.
Term Loans
On October 24, 2016 the Company repaid its outstanding term loans with Ridgestone Bank totaling $7,068. The early repayment of these loans resulted in of a 3% pre-payment penalty. The Company's term loans had a maturity date of September 29, 2029. The interest rate in effect on the term loans was 5.5% at the date of repayment.
Revolvers
On November 15, 2017, the Company and certain of its subsidiaries entered into a new unsecured revolving credit facility with PNC Bank, National Association and Associated Bank, N.A. ("the Lending Group"). This credit facility replaced the Company's previous revolving credit agreement dated September 16, 2013 and consists of an Amended and Restated Revolving Credit Agreement dated November 15, 2017 among the Company, certain of the Company's subsidiaries, PNC Bank, National Association, as lender and as administrative agent, and the other lender named therein (the "New Revolving Credit Agreement" or "New Revolver"). The New Revolver has an expiration date of November 15, 2022, and provides for borrowing of up to an aggregate principal amount not to exceed $75,000 with a $50,000 accordion feature that gives the Company the option to increase the maximum financing availability subject to the conditions of the New Revolving Credit Agreement and subject to the approval of the lenders.
The interest rate on the New Revolver is based on LIBOR plus an applicable margin, which margin resets each quarter. The applicable margin ranges from 1.00% to 1.75% and is dependent on the Company's leverage ratio for the trailing twelve month period. The interest rates on the Revolver were approximately 3.3% at September 28, 2018 and 2.5% at September 29, 2017.
The New Revolving Credit Agreement restricts the Company's ability to incur additional debt, includes maximum leverage ratio and minimum interest coverage ratio covenants and is unsecured.
Other Borrowings
The Company utilizes letters of credit primarily as security for the payment of future claims under its workers' compensation insurance which totaled $279 and $279 at September 28, 2018 and September 29, 2017, respectively. The Company had no unsecured lines of credit as of September 28, 2018 or September 29, 2017.
The weighted average borrowing rate for short-term debt was approximately 3.3%, 2.5% and 1.7% for 2018, 2017 and 2016, respectively.
Under the Company's New Revolving Credit Agreement, a change in control of the Company would constitute an event of default. A change in control would be deemed to have occurred if, among other events described in the terms of the New Revolving Agreement, a person or group other than the Company's Chief Executive Officer, Helen P. Johnson-Leipold, members of her family and related entities (hereinafter the Johnson Family) became or obtained rights as a beneficial owner (as interpreted under the Securities Exchange Act of 1934) of a certain minimum percentage of the outstanding capital stock of the Company.
F-20
Table of Contents
3 | DERIVATIVE INSTRUMENTS AND HEDGING ACTIVITIES |
The following disclosures describe the Company's objectives in using derivative instruments, the business purpose or context for using derivative instruments, and how the Company believes the use of derivative instruments helps achieve the stated objectives. In addition, the following disclosures describe the effects of the Company's use of derivative instruments and hedging activities on its financial statements. See Note 4 of these Notes to Consolidated Financial Statements for disclosures regarding the fair value and effects of changes in the fair value of derivative instruments.
Foreign Exchange Risk
The Company has significant foreign operations, for which the functional currencies are denominated primarily in euros, Swiss francs, Hong Kong dollars and Canadian dollars. As the values of the currencies of the foreign countries in which the Company has operations increase or decrease relative to the U.S. dollar, the sales, expenses, profits, losses, assets and liabilities of the Company's foreign operations, as reported in the Company's consolidated financial statements, increase or decrease, accordingly. Approximately 16% of the Company's revenues for the fiscal year ended September 28, 2018 were denominated in currencies other than the U.S. dollar. Approximately 7% were denominated in euros and approximately 6% were denominated in Canadian dollars, with the remaining 3% denominated in various other foreign currencies. Changes in foreign currency exchange rates can cause unexpected financial losses or cash flow needs.
The Company may mitigate the impact on its operating results of a portion of the fluctuations in certain foreign currencies through the use of foreign currency forward contracts. Foreign currency forward contracts enable the Company to lock in the foreign currency exchange rate for a fixed amount of currency to be paid or received on a specified date in the future. The Company may use such foreign currency forward contracts to mitigate the risk associated with changes in foreign currency exchange rates on financial instruments and known commitments denominated in foreign currencies. As of September 28, 2018 and September 29, 2017, the Company held no foreign currency forward contracts.
Interest Rate Risk
The Company operates in a seasonal business and experiences significant fluctuations in operating cash flow as working capital needs increase in advance of the Company's primary selling and cash generation season, and decline as accounts receivable are collected and cash is accumulated. As of September 28, 2018 and September 29, 2017, the Company held no interest rate swap contracts.
4 | FAIR VALUE MEASUREMENTS |
Fair value is defined as the exchange price that would be received for an asset or paid to transfer a liability (an exit price) in the principal or most advantageous market for the asset or liability in an orderly transaction between market participants on the measurement date. Valuation techniques used to measure fair value must maximize the use of observable inputs and minimize the use of unobservable inputs. A fair value hierarchy has been established based on three levels of inputs, of which the first two are considered observable and the last unobservable.
| • | Level 1 - Quoted prices in active markets for identical assets or liabilities. These are typically obtained from real-time quotes for transactions in active exchange markets involving identical assets. |
| • | Level 2 - Inputs, other than quoted prices included within Level 1, which are observable for the asset or liability, either directly or indirectly. These are typically obtained from readily-available pricing sources for comparable instruments. |
| • | Level 3 - Unobservable inputs, where there is little or no market activity for the asset or liability. These inputs reflect the reporting entity's own assumptions of the data that market participants would use in pricing the asset or liability, based on the best information available in the circumstances. |
F-21
Table of Contents
The following table summarizes the Company's financial assets measured at fair value as of September 28, 2018:
Level 1 | Level 2 | Level 3 | Total | |||||||||||||
Assets: | ||||||||||||||||
Rabbi trust assets | $ | 17,477 | $ | - | $ | - | $ | 17,477 | ||||||||
The following table summarizes the Company's financial assets measured at fair value as of September 29, 2017:
Level 1 | Level 2 | Level 3 | Total | |||||||||||||
Assets: | ||||||||||||||||
Rabbi trust assets | $ | 14,932 | $ | - | $ | - | $ | 14,932 | ||||||||
Rabbi trust assets are classified as trading securities and are comprised of marketable debt and equity securities that are marked to fair value based on unadjusted quoted prices in active markets. The rabbi trust assets are owed by the Company to certain officers and other employees under the Company's non-qualified deferred compensation plan. These assets are included in "Other assets" in the Company's Consolidated Balance Sheets, and the mark-to-market adjustments on the assets are recorded in "Other (income) expense" in the accompanying Consolidated Statements of Operations. The offsetting deferred compensation liability is also reported at fair value and is included in "Other liabilities" in the Company's Consolidated Balance Sheets. Changes in the liability are recorded in "Administrative management, finance and information systems" expense in the accompanying Consolidated Statements of Operations.
The effect of changes in the fair value of financial instruments on the Consolidated Statements of Operations for the years ended September 28, 2018, September 29, 2017 and September 30, 2016 was:
Location of income recognized in Statement of Operations | 2018 | 2017 | 2016 | ||||||||||
Rabbi trust assets | Other (income) expense | $ | (1,395 | ) | $ | (1,687 | ) | $ | (624 | ) | |||
Certain assets and liabilities are measured at fair value on a non-recurring basis in periods subsequent to their initial recognition. During 2016, the Company recorded a $6,197 impairment charge on goodwill held by the Diving business reducing its carrying value to $0, its implied fair value. The charge is reflected in "Goodwill and other intangible assets impairment." See further discussion of this impairment charge at Note 1 of these Notes to Consolidated Financial Statements.
No assets or liabilities were measured at fair value on a non-recurring basis in 2018 or 2017.
5 | LEASES AND OTHER COMMITMENTS |
The Company leases certain facilities and machinery and equipment under long-term, non-cancelable operating leases. Future minimum rental commitments under non-cancelable operating leases with an initial lease term in excess of one year at September 28, 2018 were as follows:
F-22
Table of Contents
Year | Related parties included in total | Total | ||||||
2019 | $ | 1,053 | $ | 7,723 | ||||
2020 | 1,081 | 7,187 | ||||||
2021 | 1,098 | 5,835 | ||||||
2022 | 179 | 4,069 | ||||||
2023 | - | 2,517 | ||||||
Thereafter | - | 24,832 | ||||||
Rental expense under all leases was approximately $8,316, $7,969 and $7,011 for 2018, 2017 and 2016, respectively. Rent expense to related parties was $992, $949 and $907 for 2018, 2017 and 2016, respectively.
6 | INCOME TAXES |
The U.S. and foreign income before income taxes for the respective years consisted of the following:
2018 | 2017 | 2016 | ||||||||||
United States | $ | 57,888 | $ | 41,463 | $ | 28,881 | ||||||
Foreign | 10,218 | 6,747 | (5,226 | ) | ||||||||
$ | 68,106 | $ | 48,210 | $ | 23,655 | |||||||
Income tax expense for the respective years consisted of the following:
2018 | 2017 | 2016 | ||||||||||
Current: | ||||||||||||
Federal | $ | 12,390 | $ | 13,154 | $ | 9,471 | ||||||
State | 4,482 | 2,361 | 1,492 | |||||||||
Foreign | 1,678 | 1,455 | 986 | |||||||||
Deferred | 8,887 | (3,917 | ) | (1,795 | ) | |||||||
$ | 27,437 | $ | 13,053 | $ | 10,154 | |||||||
F-23
Table of Contents
The tax effects of temporary differences that give rise to deferred tax assets and deferred tax liabilities at the end of the respective years are presented below:
2018 | 2017 | |||||||
Deferred tax assets: | ||||||||
Inventories | $ | 1,477 | $ | 2,263 | ||||
Compensation | 6,930 | 14,260 | ||||||
Tax credit carryforwards | 3,890 | 8,203 | ||||||
Net operating loss carryforwards | 4,399 | 5,844 | ||||||
Other | 6,458 | 8,041 | ||||||
Total gross deferred tax assets | 23,154 | 38,611 | ||||||
Less valuation allowance | 6,402 | 8,613 | ||||||
Deferred tax assets | 16,752 | 29,998 | ||||||
Deferred tax liabilities: | ||||||||
Goodwill and other intangibles | 1,236 | 1,805 | ||||||
Depreciation and amortization | 4,759 | 6,802 | ||||||
Foreign statutory reserves | 724 | 604 | ||||||
Net deferred tax assets | $ | 10,033 | $ | 20,787 | ||||
The net deferred tax assets recorded in the accompanying Consolidated Balance Sheets as of the years ended September 28, 2018 and September 29, 2017 were as follows:
2018 | 2017 | |||||||
Non-current assets | $ | 11,748 | $ | 22,632 | ||||
Non-current liabilities | 1,715 | 1,845 | ||||||
Net deferred tax assets | $ | 10,033 | $ | 20,787 | ||||
The significant differences between the statutory federal tax rate and the effective income tax rates for the Company for the respective years shown below were as follows:
2018 | 2017 | 2016 | ||||||||||||
Statutory U.S. federal income tax rate | 24.5 | % | ** | 35.0 | % | 35.0 | % | |||||||
Foreign rate differential | - | % | (1.1 | )% | 0.3 | % | ||||||||
State income tax, net of federal benefit | 4.1 | % | 4.0 | % | 6.1 | % | ||||||||
Tax credit | (0.7 | )% | (0.9 | )% | (3.2 | )% | ||||||||
Deferred tax asset valuation allowance | 0.6 | % | (0.3 | )% | 0.8 | % | ||||||||
Uncertain tax positions, net of settlements | 2.2 | % | 0.9 | % | 1.4 | % | ||||||||
Goodwill impairment | - | % | - | % | 6.6 | % | ||||||||
Section 199 manufacturer's deduction | (2.2 | )% | (2.8 | )% | (4.2 | )% | ||||||||
Taxes related to foreign income, net of credits | 0.1 | % | (8.7 | )% | * | 0.5 | % | |||||||
Compensation | 1.5 | % | - | % | - | % | ||||||||
Tax rate or Law Change | 12.3 | % | - | % | - | % | ||||||||
Other | (2.1 | )% | 1.0 | % | (0.4 | )% | ||||||||
40.3 | % | 27.1 | % | 42.9 | % | |||||||||
* Rate benefit is primarily from excess foreign tax credits generated by a dividend repatriation in the first quarter of fiscal 2017.
** The federal statutory rate is a blended rate which reflects 35.0% through December 31, 2017 and the lower rate of 21.0% beginning on January 1, 2018 due to tax reform.
F-24
Table of Contents
On December 22, 2017, the Tax Cuts and Jobs Act (the "Act") was enacted into law. The Act includes significant changes to the U.S. corporate income tax system which reduces the U.S. federal corporate income tax rate from 35.0% to 21.0% as of January 1, 2018; shifts to a modified territorial tax regime which requires companies to pay a transition tax on earnings of certain foreign subsidiaries that were previously deferred from U.S. income tax; and creates new taxes on certain foreign-sourced earnings. The decrease in the U.S. federal corporate income tax rate from 35.0% to 21.0% results in a blended statutory tax rate of 24.5% for the fiscal year ending September 28, 2018. The new taxes for certain foreign-sourced earnings under the Act are effective for the Company in fiscal 2019.
Income tax effects resulting from changes in tax laws are accounted for by the Company in the period in which the law is enacted and the effects are recorded as a component of income tax expense or benefit. As a result, the Company recorded provisional income tax expense resulting from application of the Act totaling $8,386 during the year ended September 28, 2018, which includes (i) a transition tax of $3,414 on the Company's total post-1986 earnings and profits ("E&P") which, prior to the Act, were previously deferred from U.S. income tax, and (ii) a $4,972 increase in income tax expense as a result of the re-measurement of the Company's deferred tax assets and liabilities to the new corporate tax rate of 21.0%.
Consistent with provisions allowed under the Tax Act, the Transition Tax liability will be paid over an eight year period beginning in fiscal year 2019. As of September 28, 2018, the noncurrent portion of the estimated Transition Tax liability in the amount of $2,049 has been included in "Other liabilities" in the Consolidated Balance Sheets.
The Securities and Exchange Commission staff issued Staff Accounting Bulletin ("SAB") 118 to provide guidance on accounting for various effects of the Act that may be at different stages of completion. To the extent that a company's accounting for a certain income tax effect of the Act is incomplete, but it is able to determine a reasonable estimate, it must record a provisional estimate in the financial statements. The final impact may differ from these provisional amounts, possibly materially, due to, among other things, issuance of additional regulatory guidance, changes in interpretations and assumptions the Company has made, and actions the Company may take as a result of the Act. In accordance with SAB 118, the financial reporting impact of the Act will be completed no later than the first quarter of fiscal 2019. As of September 28, 2018, the tax effects related to the Act are provisional and represent the Company's best estimate. Amounts recorded are based in part on a reasonable estimate of the effects on its transition tax and existing deferred tax balances which are subject to change and modification. Provisional amounts recorded may change as a result of the following:
| • | The amount recorded for the transition tax liability is a provisional amount and based on current estimates of total post-1986 foreign E&P and the income tax pools for all foreign subsidiaries which will continue to be refined over the coming periods. Further, the transition tax is based in part on the amount of those earnings held in cash and other specified assets. This amount may change when the Company finalizes the calculation of post-1986 foreign E&P previously deferred from U.S. federal taxation and finalizes the amounts held in cash or other specified assets as of September 28, 2018. Further interpretations from U.S. federal and state governments and regulatory organizations may change the provisional tax liability or the accounting treatment of the provisional tax liability. |
| • | The Company is still analyzing certain aspects of the Act and refining the estimate of the expected revaluation of its deferred tax balances. This can potentially affect the measurement of these balances or potentially give rise to new deferred tax amounts. The Act also provides changes related to the limits of deduction for employee compensation. The Company is treating any future non-deductible compensation as impacting compensation expenses in the period incurred and will review further guidance and the related impact as provided through the first quarter of fiscal 2019. |
F-25
Table of Contents
| • | The Act also includes a provision designed to tax global intangible low taxed income (GILTI) and benefit foreign-derived intangible income (FDII) which will be effective in fiscal 2019. Under the provision, a U.S. shareholder is required to include in gross income the amount of its GILTI, which is generally the net income of its controlled foreign corporations in excess of a 10% return on depreciable tangible assets after identification of other income subject to non-deferral rules. Due to the complexity of the new GILTI tax rules and uncertainty of the application of the foreign tax credit rules in relation to GILTI and FDII, we are continuing to evaluate this provision of the Act and the application of ASC 740, and are considering available accounting policy alternatives to either record the U.S. income tax effect of future GILTI inclusions in the period in which they arise or establish deferred taxes with respect to the expected future tax liabilities associated with future GILTI inclusions. Our accounting policies depend, in part, on analyzing our global income to determine whether we expect a tax liability resulting from the application of this provision, and, if so, whether and when to record related current and deferred income taxes. In addition, we are awaiting further interpretive guidance in connection with the computation of the GILTI tax. For these reasons, we are not yet able to reasonably estimate the effect of this provision of the Act. Therefore, we have not made any adjustments relating to potential GILTI tax in our consolidated financial statements and have not made a policy decision regarding our accounting for GILTI. |
| • | Prior to the Act, our practice and intention was to reinvest the earnings in our non-U.S. subsidiaries outside of the U.S., and no U.S. deferred income taxes or foreign withholding taxes were recorded. The transition tax noted above resulted in the previously untaxed foreign earnings being included in the federal and state fiscal 2018 taxable income. We are currently analyzing our global working capital requirements and the potential tax liabilities that would be incurred if the non-U.S. subsidiaries distribute cash to the U.S. parent, which may include withholding taxes, local country taxes and potential U.S. state taxation. For these reasons, we are not yet able to reasonably estimate the effect of this provision of the Act and have not recorded any withholding or state tax liabilities, any deferred taxes attributable to GILTI (as noted above) or any deferred taxes attributable to our investment in our foreign subsidiaries. |
| • | We are also currently analyzing certain additional provisions of the Act that come into effect in fiscal 2019 and will determine if and how these items would impact the effective tax rate in the year the income or expense occurs. These provisions include the Base Erosion Anti-Abuse Tax (BEAT), eliminating U.S. federal income taxes on dividends from foreign subsidiaries, the new provision that could limit the amount of deductible interest expense, and the limitations on the deductibility of certain executive compensation. |
The Company's net operating loss carryforwards and their expirations as of September 28, 2018 were as follows:
State | Foreign | Total | |||||||||||
Year of expiration | |||||||||||||
2019-2023 | $ | 840 | $ | 3,626 | $ | 4,466 | |||||||
2024-2028 | 2,427 | 1,209 | 3,636 | ||||||||||
2029-2033 | 14,060 | - | 14,060 | ||||||||||
2034-2038 | 67 | - | 67 | ||||||||||
Indefinite | - | 6,326 | 6,326 | ||||||||||
Total | $ | 17,394 | $ | 11,161 | $ | 28,555 | |||||||
The Company has tax credit carryforwards as follows:
State | Federal | Total | |||||||||||
Year of expiration | |||||||||||||
2019-2023 | $ | 1,782 | $ | - | $ | 1,782 | |||||||
2024-2028 | 1,365 | - | 1,365 | ||||||||||
2029-2033 | 598 | - | 598 | ||||||||||
2034-2038 | 120 | - | 120 | ||||||||||
Indefinite | - | - | - | ||||||||||
Total | $ | 3,865 | $ | - | $ | 3,865 | |||||||
F-26
Table of Contents
A reconciliation of the beginning and ending amount of unrecognized tax benefits follows:
2018 | 2017 | |||||||
Beginning balance | $ | 5,489 | $ | 5,096 | ||||
Gross increases - tax positions in prior period | 2,962 | 300 | ||||||
Gross decreases - tax positions in prior period | (105 | ) | - | |||||
Gross increases - tax positions in current period | 1,064 | 554 | ||||||
Settlements | - | (81 | ) | |||||
Lapse of statute of limitations | (581 | ) | (380 | ) | ||||
Ending balance | $ | 8,829 | $ | 5,489 | ||||
The total accrued interest and penalties with respect to income taxes was approximately $1,863 and $1,326 for the years ended September 28, 2018 and September 29, 2017, respectively. The Company's liability for unrecognized tax benefits as of September 28, 2018 was $8,829, and if recognized, $6,596 would have an effective tax rate impact.
In accordance with its accounting policy, the Company recognizes accrued interest and penalties related to unrecognized tax benefits as a component of income tax expense. Interest and penalties of $537, $246 and $194 were recorded as a component of income tax expense in the accompanying Consolidated Statements of Operations during fiscal years 2018, 2017 and 2016, respectively.
The Company files income tax returns, including returns for its subsidiaries, with federal, state, local and foreign taxing jurisdictions. At September 28, 2018, the Company was under income tax examination in Italy and Germany. The amount of unrecognized tax benefits recognized within the next twelve months may decrease due to expiration of the statute of limitations for certain years in various jurisdictions. However, it is possible that a jurisdiction may open an audit prior to the statute expiring or the aforementioned audit may result in adjustments to the Company's tax filings. At this time, an estimate of the range of the reasonably possible change cannot be made.
The following tax years remain subject to examination by the Company's respective major tax jurisdictions:
Jurisdiction | Fiscal Years |
United States | 2015-2018 |
Canada | 2014-2018 |
France | 2015-2018 |
Germany | 2013-2018 |
Italy | 2013-2018 |
Switzerland | 2008-2018 |
7 | EMPLOYEE BENEFITS |
The Company has non-contributory defined benefit pension plans covering certain U.S. employees. Retirement benefits are generally provided based on the employees' years of service and average earnings. Normal retirement age is 65, with provisions for earlier retirement. The Company elected to freeze its U.S. defined benefit pension plans as of September 30, 2009 and, as a result, there are no benefit accruals related to service performed after that date.
F-27
Table of Contents
The financial position of the Company's non-contributory defined benefit plans as of fiscal year end 2018 and 2017 was as follows:
2018 | 2017 | |||||||
Projected benefit obligation: | ||||||||
Projected benefit obligation, beginning of year | $ | 28,472 | $ | 29,449 | ||||
Service cost | - | - | ||||||
Interest cost | 1,058 | 1,043 | ||||||
Actuarial gain | (1,712 | ) | (1,025 | ) | ||||
Benefits paid | (987 | ) | (995 | ) | ||||
Projected benefit obligation, end of year | 26,831 | 28,472 | ||||||
Fair value of plan assets: | ||||||||
Fair value of plan assets, beginning of year | 20,802 | 17,793 | ||||||
Actual gain on plan assets | 968 | 2,639 | ||||||
Company contributions | 5,188 | 1,365 | ||||||
Benefits paid | (987 | ) | (995 | ) | ||||
Fair value of plan assets, end of year | 25,971 | 20,802 | ||||||
Funded status of the plans | (860 | ) | (7,670 | ) | ||||
Amounts recognized in the Consolidated Balance Sheets consist of: | ||||||||
Current pension liabilities | 184 | 186 | ||||||
Non-current pension liabilities | 676 | 7,484 | ||||||
Accumulated other comprehensive loss | (5,329 | ) | (7,799 | ) | ||||
Components of accumulated other comprehensive loss: | ||||||||
Net actuarial loss | (5,329 | ) | (7,799 | ) | ||||
Accumulated other comprehensive loss | $ | (5,329 | ) | $ | (7,799 | ) | ||
Net periodic benefit cost for the non-contributory defined benefit pension plans for the respective years included the following pre-tax amounts:
2018 | 2017 | 2016 | ||||||||||
Interest cost | $ | 1,058 | $ | 1,043 | $ | 1,137 | ||||||
Expected return on plan assets | (763 | ) | (1,193 | ) | (1,265 | ) | ||||||
Amortization of unrecognized net actuarial loss | 553 | 731 | 566 | |||||||||
Net periodic pension cost | 848 | 581 | 438 | |||||||||
Other changes in benefit obligations recognized in other comprehensive income ("OCI"): | ||||||||||||
Net actuarial (gain) loss | (2,470 | ) | (3,201 | ) | 2,507 | |||||||
Total recognized in net periodic pension cost and OCI | $ | (1,622 | ) | $ | (2,620 | ) | $ | 2,945 | ||||
The Company expects to recognize $330 of unrecognized loss amortization as a component of net periodic benefit cost in 2019. This amount is included in accumulated other comprehensive income as of September 28, 2018.
At September 28, 2018, the aggregate accumulated benefit obligation and aggregate fair value of plan assets for plans with benefit obligations in excess of plan assets was $26,831 and $25,971, respectively, and there were no plans with plan assets in excess of benefit obligations. At September 29, 2017, the aggregate accumulated benefit obligation and aggregate fair value of plan assets for plans with benefit obligations in excess of plan assets was $28,472 and $20,802, respectively, and there were no plans with plan assets in excess of benefit obligations.
The Company anticipates making contributions to the defined benefit pension plans of $184 through September 30, 2019.
F-28
Table of Contents
Estimated benefit payments from the Company's defined benefit plans to participants for each of the next five years and the five years thereafter are as follows:
2019 | $ | 1,160 | ||
2020 | 1,214 | |||
2021 | 1,228 | |||
2022 | 1,245 | |||
2023 | 1,284 | |||
Five years thereafter | 7,231 |
Actuarial assumptions used to determine the projected benefit obligation and net periodic pension cost as of the following fiscal years were as follows:
Projected Benefit Obligation | Net Periodic Pension Cost | |||||||||||||||||||||||
2018 | 2017 | 2016 | 2018 | 2017 | 2016 | |||||||||||||||||||
Discount rate | 4.22 | % | 3.79 | % | 3.60 | % | 3.79 | % | 3.60 | % | 4.35 | % | ||||||||||||
Long-term rate of return | N/A | N/A | N/A | 3.45 | % | 6.50 | % | 7.50 | % | |||||||||||||||
Average salary increase rate | N/A | N/A | N/A | N/A | N/A | N/A | ||||||||||||||||||
The change in discount rates in 2018 and 2017 resulted in an actuarial gain during the year of approximately $1,633 and $795, respectively. The change in discount rates in 2016 resulted in an actuarial loss during 2016 of approximately $3,152. The remainder of the actuarial gains or losses for each of the three years was related to adjustments to mortality tables and other modifications to actuarial assumptions.
To determine the discount rate assumption used in the Company's pension valuation, the Company identified a benefit payout stream based on the demographics of the pension plans and constructed a hypothetical bond portfolio using high-quality corporate bonds with cash flows that matched that benefit payout stream. A yield curve was calculated based on this hypothetical portfolio which was used for the discount rate determination.
The Company determines the long-term rate of return assumption for plan assets by using the historical asset returns for various investment asset classes and adjusting them to reflect future expectations. The expected asset class returns are weighted by the targeted asset allocations, resulting in a weighted average return which is rounded to the nearest quarter percent.
The Company uses measurement dates of October 1 to determine pension expenses for each year and the last day of the fiscal year to determine the fair value of the pension assets.
The Company's pension plans' weighted average asset allocations at September 28, 2018 and September 29, 2017, by asset category were as follows:
2018 | 2017 | |||||||
Equity securities | 5 | % | 73 | % | ||||
Fixed income securities | 93 | % | 24 | % | ||||
Other securities | 2 | % | 3 | % | ||||
100 | % | 100 | % | |||||
The Company elected to make additional contributions to its defined benefit plans in fiscal 2018, continuing its strategy to de-risk the plans. As a result
of the improved funded status, the Company changed its investment strategy for the plans, allocating the majority of its assets, 95%, into fixed income securities designed to minimize the pension plans' exposure to changes in interest rates. The
remaining 5% of assets are allocated to global equities.
F-29
Table of Contents
The following table summarizes the Company's pension plan assets measured at fair value as of September 28, 2018:
Level 1 | Level 2 | Level 3 | Total | |||||||||||||
Description: | ||||||||||||||||
Mutual funds | $ | 25,588 | $ | - | $ | - | $ | 25,588 | ||||||||
Money market funds | 331 | - | - | 331 | ||||||||||||
Group annuity contract | - | - | 52 | 52 | ||||||||||||
Total | $ | 25,919 | $ | - | $ | 52 | $ | 25,971 | ||||||||
The following table summarizes the Company's pension plan assets measured at fair value as of September 29, 2017:
Level 1 | Level 2 | Level 3 | Total | |||||||||||||
Description: | ||||||||||||||||
Mutual funds | $ | 20,207 | $ | - | $ | - | $ | 20,207 | ||||||||
Money market funds | 515 | - | - | 515 | ||||||||||||
Group annuity contract | - | - | 80 | 80 | ||||||||||||
Total | $ | 20,722 | $ | - | $ | 80 | $ | 20,802 | ||||||||
The tables below set forth a summary of changes in fair value of the Company's Level 3 pension plan assets for the years ended September 28, 2018 and September 29, 2017:
2018 | 2017 | |||||||
Level 3 assets, beginning of year | $ | 80 | $ | 113 | ||||
Purchases | - | 2 | ||||||
Unrealized (loss) gain | (2 | ) | 1 | |||||
Sales | (26 | ) | (36 | ) | ||||
Level 3 assets, end of year | $ | 52 | $ | 80 | ||||
The fair values of the money market fund and mutual fund assets were derived from quoted market prices as substantially all of these instruments have active markets. The fair value of the group annuity contract was derived using a discounted cash flow model with inputs based on current yields of similar instruments with comparable durations. The annuity contract consists of high quality bonds.
The Company also has a non-qualified deferred compensation plan that provides certain officers and employees the ability to defer a portion of their compensation until a later date. The deferred amounts and earnings thereon are payable to participants, or designated beneficiaries, at specified future dates upon retirement, death or termination of employment from the Company. The deferred compensation liability, which is reported at fair value equal to the related rabbi trust assets, and is classified as "Other liabilities" on our accompanying Consolidated Balance Sheets, was approximately $17,477 and $14,932 as of September 28, 2018 and September 29, 2017, respectively. See "Note 4 Fair Value" for additional information.
A majority of the Company's full-time employees are covered by defined contribution programs. Expenses attributable to the defined contribution programs were approximately $1,321, $1,189 and $1,126 for 2018, 2017 and 2016, respectively.
8 | PREFERRED STOCK |
The Company is authorized to issue 1,000,000 shares of preferred stock in various classes and series, of which there are none currently issued and none outstanding.
F-30
Table of Contents
9 | COMMON STOCK |
The number of authorized and outstanding shares of each class of the Company's common stock at the end of the respective years was as follows:
2018 | 2017 | |||||||
Class A, $0.05 par value: | ||||||||
Authorized | 20,000,000 | 20,000,000 | ||||||
Outstanding | 8,787,360 | 8,784,513 | ||||||
Class B, $0.05 par value: | ||||||||
Authorized | 3,000,000 | 3,000,000 | ||||||
Outstanding | 1,211,686 | 1,211,686 | ||||||
Holders of Class A common stock are entitled to elect 25%, or the next highest whole number, of the members of the Company's Board of Directors and holders of Class B common stock are entitled to elect the remaining directors. With respect to matters other than the election of directors or any matters for which class voting is required by law, holders of Class A common stock are entitled to one vote per share while holders of Class B common stock are entitled to ten votes per share. If any dividends (other than dividends paid in shares of the Company's stock) are paid by the Company on its common stock, a dividend would be paid on each share of Class A common stock equal to 110% of the amount paid on each share of Class B common stock. Each share of Class B common stock is convertible at any time into one share of Class A common stock. During 2018 and 2017 there were 0 and 320 shares of Class B common stock converted into Class A common stock, respectively.
10 | STOCK-BASED COMPENSATION AND STOCK OWNERSHIP PLANS |
The Company's current stock ownership plans provide for issuance of options to acquire shares of Class A common stock by key executives and non-employee directors. Current plans also allow for issuance of shares of restricted stock, restricted stock units or stock appreciation rights in lieu of options.
Under the Company's 2010 Long-Term Stock Incentive Plan and the 2012 Non-Employee Director Stock Ownership Plan there were 578,170 shares of the Company's Class A common stock available for grant to key executives and non-employee directors at September 28, 2018. Shares issued pursuant to the exercise of stock options or grants of restricted stock are typically issued first out of treasury stock to the extent that treasury shares are available.
The Company recognized tax benefits from the vesting of restricted stock and restricted stock units of $369, $404 and $112 for 2018, 2017 and 2016, respectively. In 2018 and 2017, these amounts were recorded as a component of income tax expense. In 2016, the amount was recorded as an increase in additional paid-in capital on the consolidated balance sheets and as cash from financing activities on the consolidated statements of cash flows. The Company recognizes forfeitures of equity awards as incurred.
Non-Vested Stock
All shares of non-vested stock awarded by the Company have been granted at their fair market value on the date of grant and vest within five years after the grant date. The fair value at date of grant is based on the number of shares granted and the average of the Company's high and low Class A common stock price on the date of grant or, if the Company's shares did not trade on the date of grant, the average of the Company's high and low Class A common stock price on the last preceding date on which the Company's shares traded.
F-31
Table of Contents
A summary of non-vested stock activity for the two year period ended September 28, 2018 related to the Company's stock ownership plans is as follows:
Shares | Weighted Average Grant Price | |||||||
Non-vested stock at September 30, 2016 | 162,472 | $ | 24.49 | |||||
Non-vested stock grants | 8,846 | 43.12 | ||||||
Restricted stock vested | (76,250 | ) | 20.54 | |||||
Non-vested stock at September 29, 2017 | 95,068 | 27.68 | ||||||
Non-vested stock grants | 6,532 | 70.39 | ||||||
Restricted stock vested | (54,824 | ) | 25.36 | |||||
Non-vested stock September 28, 2018 | 46,776 | 36.37 | ||||||
Non-vested stock grantees may elect to reimburse the Company for withholding taxes due as a result of the vesting of shares by tendering a portion of the vested shares back to the Company. Shares tendered back to the Company were 9,377 and 17,832 during 2018 and 2017, respectively. The fair value of restricted stock vested during 2018, 2017 and 2016 was approximately $3,948, $3,219 and $2,348, respectively.
Stock compensation expense, net of forfeitures, related to non-vested stock was $501, $941 and $1,252 during 2018, 2017 and 2016, respectively. The tax benefit recognized during 2018, 2017 and 2016 related to stock based compensation was $122, $358 and $476, respectively. Unrecognized compensation cost related to non-vested stock as of September 28, 2018 was $692, which amount will be amortized to expense through November 2021 or adjusted for changes in future estimated or actual forfeitures.
Restricted Stock Units
All restricted stock units awarded by the Company during fiscal 2018 and in prior years have been granted at their fair market value on the date of grant. The fair value at date of grant is based on the number of units granted and the average of the Company's high and low Class A common stock trading price on the date of grant or, if the Company's shares did not trade on the date of grant, the average of the Company's high and low Class A common stock trading price on the last preceding date on which the Company's shares traded. The vesting period for RSUs is generally one year from the date of grant for RSUs granted to directors and three years from the date of the grant for RSUs granted to employees.
A summary of RSU activity follows:
Number of RSUs | Weighted Average Grant Price | |||||||
RSUs at September 30, 2016 | 46,411 | $ | 23.62 | |||||
RSUs granted | 28,301 | 40.64 | ||||||
RSUs vested | (14,070 | ) | 22.39 | |||||
RSUs at September 29, 2017 | 60,642 | 31.85 | ||||||
RSUs granted | 27,868 | 67.82 | ||||||
RSUs vested | (8,931 | ) | 35.27 | |||||
RSUs at September 28, 2018 | 79,579 | 44.06 | ||||||
Stock compensation expense, net of forfeitures, related to restricted stock units was $1,743, $1,011 and $547 for the years ended September 28, 2018, September 29, 2017 and September 30, 2016, respectively. The tax benefit recognized during 2018, 2017 and 2016 related to restricted stock unit based compensation was $424, $384 and $208, respectively. Unrecognized compensation cost related to non-vested restricted stock units as of September 28, 2018 was $938, which amount will be amortized to expense through September 2020 or adjusted for changes in future estimated or actual forfeitures.
F-32
Table of Contents
Compensation expense related to units earned by employees is based upon the attainment of certain financial goals related to cumulative net sales and cumulative operating profit over a three-year performance period. Awards are only paid if at least 80% of the target levels are met and maximum payouts are made if 120% of more of target levels are achieved. The payouts for achievement at the minimum threshold levels of performance are equal to 50% of the target award amount. The payouts for achievement at maximum levels of performance are equal to 150% of the target award amount. To the extent earned, awards are issued in shares of Company common stock after the end of the three year performance period.
Employee Stock Purchase Plan
The 2009 Employees' Stock Purchase Plan (the "Purchase Plan") provides for the issuance of shares of Class A common stock at a purchase price of not less than 85% of the fair market value of such shares on the date of grant or at the end of the offering period, whichever is lower.
The Company issued 3,365, 1,414 and 7,732 shares of Class A common stock under the Purchase Plan during the years 2018, 2017 and 2016, respectively, and recognized expense of $53, $34 and $33 in 2018, 2017 and 2016, respectively.
11 | RELATED PARTY TRANSACTIONS |
The Company conducts transactions with certain related parties including organizations controlled by the Johnson Family and other related parties. These transactions include consulting services, aviation services, office rental, and certain administrative activities. Total costs of these transactions were $1,231, $1,144 and $1,196 for 2018, 2017 and 2016, respectively. Amounts due to/from related parties were immaterial at September 28, 2018 and September 29, 2017.
12 | SEGMENTS OF BUSINESS |
The Company conducts its worldwide operations through separate business segments, each of which represent major product lines. Operations are conducted in the U.S. and various foreign countries, primarily in Europe, Canada and the Pacific Basin. During the year ended September 28, 2018, combined net sales to one customer of the Company's Fishing, Camping and Watercraft Recreation segments represented approximately $90,554 of the Company's consolidated revenues. As of September 25, 2017, two customers of the Company's Fishing, Camping and Watercraft Recreation segments combined into a single entity. The combined net sales to these two customers represented approximately $80,795 of the Company's consolidated revenues during fiscal 2017. The Company had no single customer that accounted for more than 10% of its total net sales in fiscal 2016.
Net sales and operating profit include both sales to customers, as reported in the Company's accompanying Consolidated Statements of Operations, and inter-unit transfers, which are priced to recover costs plus an appropriate profit margin. Total assets represent assets that are used in the Company's operations in each business segment at the end of the years presented.
F-33
Table of Contents
A summary of the Company's operations by business segment is presented below:
2018 | 2017 | 2016 | ||||||||||
Net sales: | ||||||||||||
Fishing: | ||||||||||||
Unaffiliated customers | $ | 390,679 | $ | 327,796 | $ | 274,539 | ||||||
Interunit transfers | 431 | 342 | 333 | |||||||||
Camping: | ||||||||||||
Unaffiliated customers | 37,732 | 37,887 | 39,975 | |||||||||
Interunit transfers | 38 | 33 | 43 | |||||||||
Watercraft Recreation: | ||||||||||||
Unaffiliated customers | 36,120 | 48,126 | 50,240 | |||||||||
Interunit transfers | 160 | 146 | 148 | |||||||||
Diving | ||||||||||||
Unaffiliated customers | 78,907 | 76,080 | 68,330 | |||||||||
Interunit transfers | 25 | 652 | 807 | |||||||||
Other / Corporate | 830 | 676 | 643 | |||||||||
Eliminations | (654 | ) | (1,173 | ) | (1,331 | ) | ||||||
Total | $ | 544,268 | $ | 490,565 | $ | 433,727 | ||||||
Operating profit (loss): | ||||||||||||
Fishing | $ | 83,696 | $ | 58,697 | $ | 43,092 | ||||||
Camping | 1,867 | 1,946 | 2,077 | |||||||||
Watercraft Recreation | (1,555 | ) | 2,860 | 3,349 | ||||||||
Diving (1) | 2,766 | 1,847 | (9,384 | ) | ||||||||
Other / Corporate | (23,753 | ) | (19,759 | ) | (16,240 | ) | ||||||
$ | 63,021 | $ | 45,591 | $ | 22,894 | |||||||
Depreciation and amortization expense: | ||||||||||||
Fishing | $ | 8,174 | $ | 8,437 | $ | 7,597 | ||||||
Camping | 816 | 888 | 1,121 | |||||||||
Watercraft Recreation | 977 | 950 | 819 | |||||||||
Diving | 1,166 | 1,573 | 1,210 | |||||||||
Other / Corporate | 1,972 | 1,232 | 1,086 | |||||||||
$ | 13,105 | $ | 13,080 | $ | 11,833 | |||||||
Capital expenditures: | ||||||||||||
Fishing | $ | 9,709 | $ | 6,774 | $ | 6,970 | ||||||
Camping | 253 | 372 | 311 | |||||||||
Watercraft Recreation | 859 | 988 | 911 | |||||||||
Diving | 1,109 | 695 | 1,464 | |||||||||
Other / Corporate | 7,222 | 2,784 | 2,046 | |||||||||
$ | 19,152 | $ | 11,613 | $ | 11,702 | |||||||
Goodwill, net: | ||||||||||||
Fishing | $ | 11,199 | $ | 11,238 | ||||||||
Camping | - | - | ||||||||||
Watercraft Recreation | - | - | ||||||||||
Diving | - | - | ||||||||||
$ | 11,199 | $ | 11,238 | |||||||||
Total assets (end of period): | ||||||||||||
Fishing | $ | 135,808 | $ | 128,706 | ||||||||
Camping | 32,728 | 32,652 | ||||||||||
Watercraft Recreation | 16,994 | 20,222 | ||||||||||
Diving | 56,498 | 58,190 | ||||||||||
Other / Corporate | 153,908 | 113,889 | ||||||||||
$ | 395,936 | $ | 353,659 | |||||||||
(1) Diving 2016 operating loss includes $6,197 of goodwill impairment charges.
F-34
Table of Contents
A summary of the Company's operations by geographic area is presented below:
2018 | 2017 | 2016 | ||||||||||
Net sales: | ||||||||||||
United States: | ||||||||||||
Unaffiliated customers | $ | 456,816 | $ | 404,073 | $ | 357,592 | ||||||
Interunit transfers | 20,886 | 19,725 | 14,672 | |||||||||
Europe: | ||||||||||||
Unaffiliated customers | 37,014 | 34,521 | 32,069 | |||||||||
Interunit transfers | 10,438 | 10,983 | 9,824 | |||||||||
Canada: | ||||||||||||
Unaffiliated customers | 33,358 | 32,553 | 28,308 | |||||||||
Interunit transfers | 25 | 2 | 16 | |||||||||
Other: | ||||||||||||
Unaffiliated customers | 17,080 | 19,418 | 15,758 | |||||||||
Interunit transfers | 231 | 22 | 62 | |||||||||
Eliminations | (31,580 | ) | (30,732 | ) | (24,574 | ) | ||||||
$ | 544,268 | $ | 490,565 | $ | 433,727 | |||||||
Total assets: | ||||||||||||
United States | $ | 316,903 | $ | 276,916 | ||||||||
Europe | 42,048 | 42,956 | ||||||||||
Canada and other | 36,985 | 33,787 | ||||||||||
$ | 395,936 | $ | 353,659 | |||||||||
Long-term assets (1) : | ||||||||||||
United States | $ | 91,949 | $ | 83,726 | ||||||||
Europe | 3,553 | 3,396 | ||||||||||
Canada and other | 2,992 | 3,056 | ||||||||||
$ | 98,494 | $ | 90,178 | |||||||||
| (1) | Long term assets consist of net property, plant and equipment, net intangible assets, goodwill and other assets excluding deferred income taxes. |
13 | CONTINGENCIES |
The Company is subject to various legal actions and proceedings in the normal course of business, including those related to commercial disputes, product liability, intellectual property and environmental matters. The Company is insured against loss for certain of these matters. Although litigation is subject to many uncertainties and the ultimate exposure with respect to these matters cannot be ascertained, management does not believe the final outcome of any pending litigation will have a material adverse effect on the financial condition, results of operations, liquidity or cash flows of the Company.
F-35
Table of Contents
14 | VALUATION AND QUALIFYING ACCOUNTS |
The following summarizes changes to valuation and qualifying accounts for 2018, 2017 and 2016:
Balance at Beginning of Year | Additions Charged to Costs and Expenses | Less Deductions | Balance at End of Year | |||||||||||||
Year Ended September 28, 2018 | ||||||||||||||||
Allowance for doubtful accounts | $ | 2,231 | $ | 21 | $ | 615 | $ | 1,637 | ||||||||
Reserves for inventory valuation | 5,428 | 394 | 698 | 5,124 | ||||||||||||
Valuation of deferred tax assets | 8,724 | 1,148 | 3,470 | 6,402 | ||||||||||||
Reserves for sales returns | 1,930 | 3,927 | 4,325 | 1,532 | ||||||||||||
Year ended September 29, 2017 | ||||||||||||||||
Allowance for doubtful accounts | $ | 2,182 | $ | 876 | $ | 827 | $ | 2,231 | ||||||||
Reserves for inventory valuation | 5,623 | 1,356 | 1,551 | 5,428 | ||||||||||||
Valuation of deferred tax assets | 10,215 | 603 | 2,094 | 8,724 | ||||||||||||
Reserves for sales returns | 2,772 | 2,346 | 3,188 | 1,930 | ||||||||||||
Year ended September 30, 2016 | ||||||||||||||||
Allowance for doubtful accounts | $ | 2,329 | $ | 299 | $ | 446 | $ | 2,182 | ||||||||
Reserves for inventory valuation | 4,879 | 3,650 | 2,906 | 5,623 | ||||||||||||
Valuation of deferred tax assets | 9,786 | 1,670 | 1,241 | 10,215 | ||||||||||||
Reserves for sales returns | 1,945 | 4,596 | 3,769 | 2,772 | ||||||||||||
15 | QUARTERLY FINANCIAL SUMMARY (UNAUDITED) |
The following summarizes quarterly operating results for the years presented below:
First Quarter | Second Quarter | Third Quarter | Fourth Quarter | |||||||||||||||||||||||||||||
(thousands, except per share data) | 2018 | 2017 | 2018 | 2017 | 2018 | 2017 | 2018 | 2017 | ||||||||||||||||||||||||
Net sales | $ | 116,579 | $ | 93,729 | $ | 165,778 | $ | 149,807 | $ | 170,779 | $ | 155,274 | $ | 91,132 | $ | 91,755 | ||||||||||||||||
Gross profit | 48,811 | 36,565 | 74,195 | 64,913 | 79,333 | 70,630 | 39,521 | 38,832 | ||||||||||||||||||||||||
Operating profit (loss) | 7,037 | 472 | 26,002 | 20,458 | 31,955 | 24,737 | (1,973 | ) | (76 | ) | ||||||||||||||||||||||
Income (loss) before income taxes | 8,324 | (45 | ) | 29,445 | 21,837 | 31,779 | 25,560 | (1,442 | ) | 858 | ||||||||||||||||||||||
Income tax expense (benefit) | 8,089 | (4,101 | ) | 7,825 | 7,878 | 8,009 | 9,007 | 3,514 | 269 | |||||||||||||||||||||||
Net income (loss) | $ | 235 | $ | 4,056 | $ | 21,620 | $ | 13,959 | $ | 23,770 | $ | 16,553 | $ | (4,956 | ) | $ | 589 | |||||||||||||||
Net income (loss) per common share - Basic: | ||||||||||||||||||||||||||||||||
Class A | $ | 0.02 | $ | 0.41 | $ | 2.19 | $ | 1.41 | $ | 2.40 | $ | 1.68 | $ | (0.50 | ) | $ | 0.06 | |||||||||||||||
Class B | $ | 0.02 | $ | 0.37 | $ | 1.99 | $ | 1.28 | $ | 2.19 | $ | 1.52 | $ | (0.46 | ) | $ | 0.05 | |||||||||||||||
Net income (loss) per common share - Diluted: | ||||||||||||||||||||||||||||||||
Class A | $ | 0.02 | $ | 0.40 | $ | 2.15 | $ | 1.39 | $ | 2.37 | $ | 1.65 | $ | (0.49 | ) | $ | 0.06 | |||||||||||||||
Class B | $ | 0.02 | $ | 0.40 | $ | 2.15 | $ | 1.39 | $ | 2.37 | $ | 1.65 | $ | (0.49 | ) | $ | 0.06 | |||||||||||||||
Due to changes in stock prices during the year and the timing of issuance of shares, the cumulative total of quarterly net income (loss) per share amounts may not equal the net income (loss) per share for the entire year.
F-36
Table of Contents
16 | ACQUISITIONS |
During the year ended September 30, 2016, the Company completed two acquisitions for a total of approximately $9,200. No acquisitions were completed during fiscal 2017 or fiscal 2018.
Acquisition of SeaBear
On October 27, 2015, the Company acquired all of the outstanding common stock of SeaBear GmbH ("SeaBear") and related assets in a purchase transaction with SeaBear's sole shareholder (the "Seller"). SeaBear, founded and based in Graz, Austria, specializes in the development of underwater instrumentation through unique application of existing, new and emerging technologies.
The Company believed that sales of SeaBear's innovative diving technology could be expanded through the Company's global marketing and distribution networks. The SeaBear acquisition is included in the Company's Diving segment. Goodwill, of $2,219, which represents the excess of the purchase price over the net tangible and intangible assets acquired, is not deductible for tax purposes.
Acquisition of Northport
On April 4, 2016, the Company acquired substantially all of the assets of Northport Systems, Inc. ("Northport") in a purchase transaction with Northport and its owners (collectively, the "Seller"). Northport, based in Toronto, Canada, specializes in the development and application of unique digital cartography technologies and web, e-commerce and data solutions for fishing and marine markets.
The acquisition cost for the Northport assets was funded with existing cash and credit facilities. Approximately $500 of the purchase price was paid into a segregated escrow account which was set aside to fund potential indemnity claims that may be made by the Company against the Seller in connection with the inaccuracy of certain representations and warranties made by the Seller or related to the breach or nonperformance of certain other actions, agreements or conditions related to the acquisition, for a period of 24 months from the acquisition date. The escrow balance was released to the Seller in full in fiscal 2018. Approximately $250 of the purchase price was paid in the form of contingent consideration which required the Seller to meet certain conditions prior to the release of such funds.
The Company believes that Northport will bring new cartography capabilities, which can broaden the Company's innovation horizon and accelerate speed-to-market of new products in this segment. The Northport acquisition is included in the Company's Fishing segment. Goodwill of $827, which represents the excess of the purchase price over the net tangible and intangible assets acquired, is deductible for tax purposes. The goodwill resulting from this acquisition reflects the strong cash flow expected from the acquisition due primarily to expected expanded distribution and growth of Humminbird marine electronics and cartography products.
F-37
Table of Contents
Purchase Price Allocation
Pro forma results of operations for these acquisitions have not been presented because they are not material to the Company's combined and consolidated results of operations, either individually or in the aggregate. The following table presents the aggregate purchase price allocation for the Company's acquisitions described above:
Recognized amounts of identifiable assets acquired and liabilities assumed | ||||
Accounts receivable | $ | 66 | ||
Inventories | 197 | |||
Other current assets | 40 | |||
Property, plant and equipment | 27 | |||
Identifiable intangible assets | 6,706 | |||
Less, accounts payable and accruals | 350 | |||
Less, long term liabilities | 580 | |||
Total identifiable net assets | 6,106 | |||
Goodwill | 3,046 | |||
Net assets acquired | $ | 9,152 | ||
The values assigned in the acquisitions to finite lived intangible assets were as follows:
Description | Amount | Useful Life (yrs) | |||
Developed technologies | $ | 6,131 | 7.6 years | ||
Non-compete agreements | 575 | 5.0 years | |||
Developed technologies were valued using the discounted cash flow method. Under this method, the after-tax direct cash flows expected to be generated by the technologies were discounted over their remaining useful lives, net of contributions of other assets to those cash flows. The discount rates used were commensurate with the inherent risks associated with each type of asset and the level and timing of cash flows appropriately reflect market participant assumptions. We valued base product technology that generates cash flows from sales of the existing products using the income approach, specifically the multi-period excess earnings method which calculates the value based on the risk-adjusted present value of the cash flows specific to the products, allowing for a reasonable return.
Non-compete agreements were valued using the comparative income differential method based on the estimated negative impact that could occur in the absence of the restrictions enforced by the agreements.
The weighted average useful life at the dates of acquisition of total amortizable intangible assets acquired was approximately 7.5 years.
Transaction costs incurred for the acquisitions was $753 for the twelve months ended September 30, 2016. Such transaction costs are included in "Administrative management, finance and information system" in the accompanying Consolidated Statement of Operations.
During the quarter ended July 1, 2016, the Company re-evaluated its projections for its Diving reporting unit as a result of deteriorating business conditions. As a result, the Company performed an impairment test on the goodwill of the Diving reporting unit, including the goodwill acquired in the SeaBear acquisition, and determined an impairment charge was required. See "Note 1 – Goodwill" for additional information.
F-38