UNITED STATES
SECURITIES AND EXCHANGE COMMISSION
Washington, D.C. 20549
FORM 10-K
(Mark One)
☒ | ANNUAL REPORT PURSUANT TO SECTION 13 OR 15(d) OF THE SECURITIES EXCHANGE ACT OF 1934 |
For the fiscal year ended February 3, 2018
OR
☐ | TRANSITION REPORT PURSUANT TO SECTION 13 OR 15(d) OF THE SECURITIES EXCHANGE ACT OF 1934 For the transition period from to |
Commission File Number 001-38026
J.Jill, Inc.
(Exact name of Registrant as specified in its Charter)
Delaware |
| 45-1459825 |
(State or other jurisdiction of incorporation or organization) |
| (I.R.S. Employer Identification No.) |
4 Batterymarch Park Quincy, MA |
| 02169 |
(Address of principal executive offices) |
| (Zip Code) |
Registrant's telephone number, including area code: (617) 376-4300
Securities registered pursuant to Section 12(b) of the Act :
Title of each class |
| Name of each exchange on which registered |
Common Stock, $0.01 par value |
| New York Stock Exchange |
Securities registered pursuant to Section 12(g) of the Act: None
Indicate by check mark if the Registrant is a well-known seasoned issuer, as defined in Rule 405 of the Securities Act. Yes ☐ No ☒
Indicate by check mark if the Registrant is not required to file reports pursuant to Section 13 or 15(d) of the Act. Yes ☐ No ☒
Indicate by check mark whether the Registrant: (1) has filed all reports required to be filed by Section 13 or 15(d) of the Securities Exchange Act of 1934 during the preceding 12 months (or for such shorter period that the Registrant was required to file such reports), and (2) has been subject to such filing requirements for the past 90 days. Yes ☒ No ☐
Indicate by check mark whether the Registrant has submitted electronically and posted on its corporate Web site, if any, every Interactive Data File required to be submitted and posted pursuant to Rule 405 of Regulation S-T (§232.405 of this chapter) during the preceding 12 months (or for such shorter period that the Registrant was required to submit and post such files). Yes ☒ No ☐
Indicate by check mark if disclosure of delinquent filers pursuant to Item 405 of Regulation S-K (§229.405) is not contained herein, and will not be contained, to the best of Registrant's knowledge, in definitive proxy or information statements incorporated by reference in Part III of this Form 10-K or any amendment to this Form 10-K. ☒
Indicate by check mark whether the registrant is a large accelerated filer, an accelerated filer, a non-accelerated filer, smaller reporting company, or an emerging growth company. See the definitions of "large accelerated filer," "accelerated filer," "smaller reporting company," and "emerging growth company" in Rule 12b-2 of the Exchange Act.
(Check one):
Large accelerated filer | ☐ |
|
| Accelerated filer | ☐ |
|
|
|
|
|
|
Non-accelerated filer | ☒ | (Do not check if a small reporting company) |
| Small reporting company | ☐ |
|
|
|
|
|
|
|
|
|
| Emerging growth company | ☒ |
If an emerging growth company, indicate by check mark if the registrant has elected not to use the extended transition period for complying with any new or revised financial accounting standards provided pursuant to Section 13(a) of the Exchange Act. ☐
Indicate by check mark whether the Registrant is a shell company (as defined in Rule 12b-2 of the Exchange Act). Yes ☐ No ☒
The aggregate market value of the voting and non-voting common equity held by non-affiliates of the Registrant, based on the closing price of the shares of common stock on NYSE Stock Market on July 28, 2017, was $153,888,871.
The number of shares of Registrant's Common Stock outstanding as of April 13, 2018 was 43,759,200.
Documents Incorporated by Reference
Portions of Part II of this Form 10-K are incorporated by reference from the Registrant's definitive proxy statement for its 2018 annual meeting of shareholders to be filed with the Securities and Exchange Commission no later than 120 days after the end of the Registrant's fiscal year.
Table of Contents
|
| Page |
PART I |
|
|
Item 1. | Business | 4 |
Item 1A. | Risk Factors | 10 |
Item 1B. | Unresolved Staff Comments | 27 |
Item 2. | Properties | 27 |
Item 3. | Legal Proceedings | 28 |
Item 4. | Mine Safety Disclosures | 28 |
|
|
|
PART II |
|
|
Item 5. | Market for Registrant's Common Equity, Related Stockholder Matters and Issuer Purchases of Equity Securities | 29 |
Item 6. | Selected Financial Data | 30 |
Item 7. | Management's Discussion and Analysis of Financial Condition and Results of Operations | 34 |
Item 7A. | Quantitative and Qualitative Disclosures About Market Risk | 52 |
Item 8. | Financial Statements and Supplementary Data | 53 |
Item 9. | Changes in and Disagreements With Accountants on Accounting and Financial Disclosure | 53 |
Item 9A. | Controls and Procedures | 53 |
Item 9B. | Other Information | 54 |
|
|
|
PART III |
|
|
Item 10. | Directors, Executive Officers and Corporate Governance | 55 |
Item 11. | Executive Compensation | 55 |
Item 12. | Security Ownership of Certain Beneficial Owners and Management and Related Stockholder Matters | 55 |
Item 13. | Certain Relationships and Related Transactions, and Director Independence | 55 |
Item 14. | Principal Accounting Fees and Services | 55 |
|
|
|
PART IV |
|
|
Item 15. | Exhibits, Financial Statement Schedules | 56 |
Item 16. | Form 10-K Summary | 58 |
1
CAUTIONARY NOTE REGARDING FORWARD-LOOKING STATEMENTS
This Annual Report on Form 10-K ("Annual Report") contains forward-looking statements, which involve risks and uncertainties. These forward-looking statements are generally identified by the use of forward-looking terminology, including the terms "anticipate," "believe," "could," "estimate," "expect," "intend," "may," "plan," "potential," "predict," "project," "should," "target," "will," "would" and, in each case, their negative or other various or comparable terminology. All statements other than statements of historical facts contained in this Annual Report, including statements regarding our strategy, future operations, future financial position, future revenue, projected costs, prospects, plans, objectives of management and expected market growth are forward-looking statements. The forward-looking statements are contained principally in the sections entitled "Item 1. Business," "Item 1A. Risk Factors" and "Item 7. Management's Discussion and Analysis of Financial Condition and Results of Operations" and include, among other things, statements relating to:
| • | our strategy, outlook and growth prospects; |
| • | our operational and financial targets and dividend policy; |
| • | our planned expansion of the store base; |
| • | general economic trends and trends in the industry and markets; and |
| • | the competitive environment in which we operate. |
These statements involve known and unknown risks, uncertainties and other important factors that may cause our actual results, performance or achievements to be materially different from any future results, performance or achievements expressed or implied by the forward-looking statements. Important factors that could cause our results to vary from expectations include, but are not limited to:
| • | our ability to successfully expand and increase sales; |
| • | our ability to maintain and enhance a strong brand image; |
| • | our ability to successfully optimize our omnichannel operations and maintain a relevant and reliable omnichannel experience; |
| • | our ability to generate adequate cash from our existing business to support our growth; |
| • | our ability to identify and respond to new and changing customer preferences; |
| • | our ability to compete effectively in an environment of intense competition; |
| • | our ability to contain the increase in the cost of shipping our merchandise, mailing catalogs, paper and printing; |
| • | our ability to acquire new customers in a cost-effective manner; |
| • | the success of the locations in which our stores are located and our ability to open and operate new retail stores on a profitable basis; |
| • | our ability to adapt to changes in consumer spending and general economic conditions; |
| • | natural disasters, unusually adverse weather conditions, boycotts and unanticipated events; |
| • | our dependence on third-party vendors to provide us with sufficient quantities of merchandise at acceptable prices; |
| • | increases in costs of raw materials, distribution and sourcing costs and in the costs of labor and employment; |
| • | the susceptibility of the price and availability of our merchandise to international trade conditions; |
| • | failure of our suppliers and their manufacturing sources to use acceptable labor or other practices; |
| • | our dependence upon key executive management or our inability to hire or retain the talent required for our business; |
| • | failure of our information technology systems to support our current and growing business; |
| • | disruptions in our supply chain and distribution and customer contact center; |
| • | our ability to protect our trademarks or other intellectual property rights; |
| • | infringement on the intellectual property of third parties; |
| • | acts of war, terrorism or civil unrest; |
| • | the impact of governmental laws and regulations and the outcomes of legal proceedings; |
| • | our ability to secure the personal information of our customers and employees and comply with applicable security standards; |
| • | impairment charges for goodwill, indefinite-lived intangible assets or other long-lived assets; |
| • | our failure to maintain adequate internal controls over our financial and management systems; |
| • | increased costs as a result of being a public company; and |
| • | other risks, uncertainties and factors set forth in this Annual Report, including those set forth under "Item 1A. Risk Factors." |
2
These forward-looking statements reflect our views with respect to future events as of the date of this Annual Report and are based on assumptions and subject to risks and uncertainties. Given these uncertainties, you should not place undue reliance on these forward-looking statements. These forward-looking statements represent our estimates and assumptions only as of the date of this Annual Report and, except as required by law, we undertake no obligation to update or review publicly any fo rward-looking statements, whether as a result of new information, future events or otherwise after the date of this Annual Report. We anticipate that subsequent events and developments will cause our views to change. You should read this Annual Report an d the documents filed as exhibits to the Annual Report, completely and with the understanding that our actual future results may be materially different from what we expect. Our forward-looking statements do not reflect the potential impact of any future acquisitions, mergers, dispositions, joint ventures or investments we may undertake. We qualify all of our forward-looking statements by these cautionary statements.
3
PART I
Item 1. Business
In this Annual Report, unless otherwise indicated or the context otherwise requires, references to the "Company," "J.Jill," "we," "us," and "our" refer to J.Jill, Inc. and its consolidated subsidiaries. We operate on a 52- or 53-week fiscal year that ends on the Saturday that is closest to January 31. Each fiscal year generally is comprised of four 13-week fiscal quarters, although in the years with 53 weeks, the fourth quarter represents a 14-week period. References in this Annual Report to "fiscal year 2017" refer to the fiscal year ended February 3, 2018 and references to "fiscal year 2016" refer to the fiscal year ended January 28, 2017. References in this Annual Report to "pro forma fiscal year 2015" refer to the unaudited pro forma consolidated statement of operations, which has been derived from our consolidated audited statements of operations included elsewhere in this Annual Report. See "Item 7. Management's Discussion and Analysis of Financial Condition and Results of Operations" for additional information regarding our presentation of the pro forma fiscal year ended January 30, 2016. Fiscal year 2017 is comprised of 53 weeks and fiscal year 2016 and pro forma fiscal year 2015 were each comprised of 52 weeks.
Company Overview
J.Jill is a premier omnichannel retailer and nationally recognized women's apparel brand committed to delighting customers with great wear-now product. The brand represents an easy, relaxed, inspired style that reflects the confidence and comfort of a woman with a rich, full life. J.Jill provides guiding service through more than 270 stores nationwide and a robust e-commerce platform. J.Jill is headquartered outside Boston.
Brand
We have developed a differentiated brand image that encourages customers to build deep, personal connections with our brand. Our brand promise to the J.Jill customer is to delight her with great wear-now product, to inspire her confidence through J.Jill's approach to dressing and to provide her with friendly, guiding service wherever and whenever she chooses to shop. We use our key brand attributes - Naturally Authentic, Thoughtfully Engaging, Relaxed Femininity, Positive Energy and Confident Simplicity - to guide brand messaging, which is consistently communicated to our customers, whether she chooses to shop on our www.jjill.com website, in our retail stores or through our catalog.
Customer
While women of all ages are attracted to our brand, our typical customer is 40 to 65 years old, is college educated and has an annual household income of approximately $150,000. She leads a busy, yet balanced life, as she works outside the home, is involved in her community and has a family with children. She values comfort, ease and versatility in her wardrobe, in addition to quality fabrics and thoughtful details. She is fashion conscious and looks to J.Jill to interpret current trends relevant to her needs and lifestyle. She is tech savvy, but also loves the J.Jill store experience and frequently engages with us across all channels.
As our customers increase their tenure with our brand, they tend to spend more and purchase more frequently. Additionally, as we retain customers over time, they tend to migrate from single channel customers to more valuable omnichannel customers. Omnichannel customers reflect 23% of our active customer base for fiscal year 2017, which has increased from 22% in fiscal year 2016 and 20% in pro forma fiscal year 2015. See "Management's Discussion of Financial Condition and Results of Operations Supplemental Unaudited Pro Forma Consolidated Financial Information" for discussion regarding our pro forma fiscal year 2015.
Product
Our Products
Our products are marketed under the J.Jill brand name and sold exclusively through our retail and direct channels. Our diverse assortment of apparel spans knit and woven tops, bottoms and dresses as well as sweaters and outerwear. We also offer a range of complementary footwear and accessories, including scarves, jewelry and hosiery. By presenting our merchandise in clear product stories, we strive to uncomplicate fashion, providing comfortable, easy and versatile collections that enable our customer to dress confidently for a broad range of occasions. Our products are available across the full range of sizes including Misses, Petites, Women's and Tall, and reflect a modern balance of style, quality, comfort and ease at
4
accessible price points. The core products of our assortment are designed and merchandised in-house, grounded with essential yet versatile styles and fabrications that are typically represented across a season. Assortments are updated each month with fresh colors, layering options, novelty and fashion. In addition to our core assortment, we have two sub-brands as extensions of our brand aesthetic and our customer lifestyle needs:
Pure Jill : Our Pure Jill sub-brand reflects the art of understated ease. It is designed with a clear focus and minimalist approach to style, and reflected in simple shapes, unstructured silhouettes, interesting textures, soft natural fabrics and artful details.
Wearever : Our Wearever sub-brand consists of our refined rayon jersey knit collection that is designed for work, travel and home. It has a foundational collection of versatile shapes and proportions, in solids and prints that mix easily to provide endless options that work together. These soft knits are easy care and wrinkle-free, and always look great.
We also offer accessories in unique, versatile and wearable collections. These accessory collections are primarily driven by scarves and jewelry and seamlessly complete our customer's wardrobe.
Product Design and Development
We offer 12 merchandise collections that are introduced every four weeks and designed and delivered to provide a consistent flow of fresh products. All of our merchandise is designed in-house, and we create newness through the use of different fabrics, colors, patterns and silhouettes. We introduce each collection simultaneously in our retail stores, on our website and in our catalogs. We support each collection with sequenced floor sets, continuous web updates and 24 corresponding catalog editions in addition to regular, coordinated marketing activities. Our new product development lifecycle typically takes 48 weeks from design concept through delivery. We leverage feedback and purchasing data from our customer database along with continual collaborative hindsighting to guide our product and merchandising decision making. The close coordination between our teams ensures that our product and brand message is clearly communicated to our customers across all channels.
Channel
Driven by our direct-to-consumer heritage, we have a well-diversified and profitable omnichannel platform. We strive to deliver a seamless brand experience to our customer, wherever and whenever she chooses to shop across our retail stores, website and catalogs. Our sales channels reinforce one another and drive traffic to each other, and we deliver a consistent brand message by coordinating the release of our monthly product collection across channels, allowing our customers to experience a uniform brand message. We believe that our customers' buying decisions are influenced by this consistent messaging and experience across sales channels. We have a track record of migrating customers from a single-channel customer to a more valuable, omnichannel customer over time.
Retail Channel
Our Stores
Our retail channel represented 57% of net sales for fiscal year 2017. As of February 3, 2018, we operated 276 stores across 42 states with approximately half located in lifestyle centers and the remaining in premium malls; all of our stores are leased. Our stores range in size from approximately 2,350 to 6,100 square feet, and the average store is approximately 3,700 square feet.
Our store designs showcase our brand and elevate, yet simplify, the J.Jill shopping experience. Our stores provide a welcoming, easy-to-shop format that guides her through clearly merchandised product stories. With natural materials in soothing neutral colors, comfortable fabrics and elegant seating areas, the atmosphere is aspirational, yet attainable. When she cannot find an item in-stock at her local store, our concierge service leverages our in-store ordering platform and ships products to her home with no shipping charge.
Site Selection
We believe our store expansion model supports our ability to grow our store footprint in both new and existing markets across the United States with the potential to simultaneously enhance our direct channel sales by migrating single-channel customers to omnichannel customers. New store locations are evaluated on various factors, including customer demographics within a market, concentration of existing customers, location of existing stores and center tenant quality and mix. We also
5
leverage our customer database, including purchasing history and customer demographics, to determine geographic locations that may benefit from a retail store. We target opening new stores in high traffic locations with desirable demographic characteristics and favorable lease economics. We believe we have the opportunity to add up to 100 stores to our store base of 276. We plan to open 10-12 new stores in fiscal year 2018. We also selectively close underperforming stores.
The following table shows new store openings since fiscal year 2013. The stores opened in the last three years were primarily in lifestyle centers.
|
|
|
|
|
| Total Stores at |
| |
|
| Total Stores |
|
| the End of the |
| ||
Store Open Year |
| Opened |
|
| Fiscal Year |
| ||
Fiscal Year 2013 |
|
| 13 |
|
|
| 234 |
|
Fiscal Year 2014 |
|
| 19 |
|
|
| 248 |
|
Pro Forma Fiscal Year 2015 |
|
| 15 |
|
|
| 261 |
|
Fiscal Year 2016 |
|
| 15 |
|
|
| 275 |
|
Fiscal Year 2017 |
|
| 9 |
|
|
| 276 |
|
Direct Channel
Our direct channel, which represented 43% of total net sales for fiscal year 2017, consists of our website and catalog orders.
E-commerce Platform
At the end of fiscal year 2017, we upgraded our website, www.jjill.com , from a proprietary platform to a new, enhanced platform. The improved capabilities of the new platform will improve our customers' shopping experience and engagement by featuring updates on new collections, guidance on how to wardrobe and wear our products and the ability to chat live with a sales representative.
Our website also provides customers with a broader range of colors and sizes, including Women's and Tall sizes, than available in our stores. Additionally, we leverage our website as an inventory clearance vehicle, which allows us to keep our retail store products fresh and representative of our newest collection. Within our direct channel, E-commerce represented 89% of fiscal 2017 net sales.
Catalog
Our catalogs are an integral part of our business. As one of our primary marketing vehicles, our catalogs promote and reinforce our brand image and drive customer acquisition and engagement across all of our channels. We produce 24 annual editions of our catalog that, when combined with increased online marketing, drives customer acquisition and engagement across all sales channels. As on our website and in our retail stores, our catalogs reflect our product offering in settings that align with our merchandise segments, including our sub-brands, and provide guidance on styling and wardrobing. Our catalogs are designed in-house, providing us with greater creative control as well as effectively managing our catalog production costs. Within our direct channel, catalog orders represented 11% of fiscal year 2017 net sales.
Competitive Strengths
Distinct, Well-Recognized Brand. The J.Jill brand represents an easy, relaxed and inspired style that reflects the confidence and comfort of a woman with a rich, full life. We have cultivated a differentiated brand and through our commitment to our customer and our brand building activities, we have created significant brand trust and an emotional connection with our customers.
Omnichannel Business. We have developed an omnichannel business model comprised of our retail stores and our direct channel. Our retail and direct channels complement and drive traffic to one another, and we leverage our targeted marketing initiatives to acquire new customers across channels. We have a track record of migrating customers from a single-channel customer to a more valuable, omnichannel customer over time. We believe our omnichannel capabilities enable us to deliver a seamless brand experience to our customer, wherever and whenever she chooses to shop.
6
Data-Centric Approach That Drives Consistent Profitability and Mitigates Risk. We believe we have industry-leading data capture capabilities that allow us to match approximately 98% of transactions to an identifiable customer. We use our extensive customer database to track and effe ctively analyze customer information (e.g., name, address, age, household income and occupation) as well as contact history (e.g., catalog and email). We also have significant visibility into our customers' transaction behavior (e.g., orders, returns, orde r value), including purchases made across our channels. As such, we can identify a single-channel customer who purchases a product through our website, our retail store or our catalogs, as well as an omnichannel customer who purchases in more than one chan nel. We continually leverage this database and apply our insights to operate our business as well as to acquire new customers and then create, build and maintain a relationship with each customer to drive optimum value.
Affluent and Loyal Customer Base. We target an attractive demographic of affluent women in the 40-65 age range, a segment of the population that is experiencing outsized population growth between 2010 and 2020 in the United States, according to the U.S. Census Bureau. With an average annual household income of approximately $150,000, our customer has significant spending power. Our private label credit card program also drives customer loyalty and encourages spending. We believe we will continue to develop long-term customer relationships that can drive profitable sales growth.
Customer-Focused Product Assortment. Our customers strongly associate our product with a modern balance of style, quality, comfort and ease suitable for a broad range of occasions at accessible price points. Our customer-focused assortment spans a full range of sizes and is designed to provide easy wardrobing that is relevant to her lifestyle. Each year we offer 12 merchandise collections that are introduced approximately every four weeks and designed and delivered to provide a consistent flow of fresh products. We create product newness through the use of different fabrics, colors, patterns and silhouettes. We have an in-house, customer centric product design and development process that leverages our extensive database of customer feedback and allows us to identify and incorporate changes in our customers' preferences. We believe our customer focused approach to product development and continual delivery of fresh, high quality products drives traffic, frequency and conversion.
Highly Experienced Leadership Team. Our leadership team has experience with leading global organizations and an average of 25 years of industry experience with significant expertise in merchandising, marketing, retail, E-commerce, human resources, and finance. We have developed a strong and collaborative culture aligned around our goals to Create a great brand, to Build a successful business and to Make J.Jill a great place to work.
Growth Strategy
Key drivers of our growth strategy include:
Grow Size and Value of Our Customer Base. We have a significant opportunity to continue to attract new customers to our brand and to grow the size and value of our active customer base across all channels. We have strategically increased our marketing investment to drive growth through the acquisition of new customers, reactivation of lapsed customers, and the retention of existing customers. We recently began a brand voice initiative and a customer segmentation initiative which, upon completion, will further enhance our ability to target the highest value customers and increase customer spending. Through these initiatives, we believe we will continue to attract new customers to our brand, migrate from single-channel to more profitable omnichannel customers and increase overall customer spend.
Increase Direct Sales. Given our strong foundation and recent website enhancements, we believe we can leverage our direct platform to broaden our customer reach and drive additional sales. We are undertaking initiatives to further develop our recently upgraded website to provide a more personalized shopping experience with more features and services for our customers. The new website also provides enhanced capability to engage customers on mobile devices, improved access to product information and the ability to better connect with the brand on social media.
Profitably Expand Our Store Base. Based on our proven new store economics, we believe that we have the potential to grow our store base by up to 100 stores from our total of 276 stores as of February 3, 2018. We target new locations in lifestyle centers and premium malls, and plan to open 10-12 new stores in fiscal year 2018.
Strengthen Omnichannel Capabilities. We are pursuing initiatives to enhance our omnichannel capabilities focused on best serving our customer, wherever and whenever she chooses to shop. We will continue to leverage our insight into customer attributes and behavior, which will guide strategic investments in our business. For example, we plan to implement technology to further fulfill customer demand, including ship from store to customer and order online for pickup in store.
7
Enhance Product Assortment. We believe there is an opportunity to grow our business by selectively broadening and enhancing our assortment in certain product categories, including our Pure Jill and Wearever sub-brands, our Women's and Petite's businesses, and accessories. We also believe we hav e the opportunity to continue to optimize our assortment architecture and productivity by delivering the right mix and flow of fashion and basics to our channels. In addition, we will continue delivering high quality customer-focused product assortments ac ross each of our channels, while strengthening visual merchandising.
Marketing and Advertising
We leverage a variety of marketing and advertising vehicles to increase brand awareness, acquire new customers, drive customer traffic across our channels, and strengthen and reinforce our brand image. These include our 24 annual catalog editions, promotional mailings, email communications, digital and print advertisements and public relations initiatives. We leverage our customer database to strategically optimize the value of our marketing investments across customer segments and channels. This enables us to productively acquire new customers, effectively market to existing customers, increase customer retention levels and reactivate lapsed customers.
Our catalogs, combined with an increased investment in online marketing, drive customer acquisition and engagement. We reinforce a consistent brand message by coordinating the release of our monthly collection across our retail stores, website and catalogs, allowing our customers to experience a uniform brand message wherever and whenever she chooses to shop. We also engage in a wide range of other marketing and advertising strategies to promote our brand, including media coverage in specialty publications and magazines.
We offer a private label credit card program through an agreement with Comenity Capital Bank ("ADS"), under which they own the credit card receivables. All credit card holders receive invitations to exclusive customer events and promotions including special purchase events three times per year, a special offer for her birthday, and a 5% discount when purchases are made on the card. We promote the benefits of the credit card throughout our retail stores, our website and our catalogs through banner ads, signage and customer service and selling associate representatives. Additionally, we leverage regional print advertising to promote the card and its benefits to new and existing customers. We believe that our credit card program encourages customer loyalty, repeat visits and additional spending. In fiscal year 2017, 55% of our gross sales were generated by our credit card holders.
Sourcing and Supply Strategy
We outsource the manufacturing of our products. In order to efficiently source our products, we work primarily with agents who represent suppliers and factories. In fiscal year 2017 approximately 82% of our products were sourced through agents and 18% were sourced directly from suppliers and factories. We currently work with three primary agents that help us identify quality suppliers and coordinate our manufacturing requirements. Additionally, the agents manage the development of samples of merchandise produced in the factories, inspect finished merchandise, ensure the timely delivery of goods and carry out other administrative and oversight functions on our behalf. We source the remainder of our products by interacting directly with suppliers and factories both domestically and abroad.
Agents work with approximately 25 suppliers on our behalf. We source our merchandise globally from six countries with the top three by volume including China, India and the Philippines. No single supplier accounts for more than 20% of merchandise purchased.
We have no long-term merchandise supply contracts as we typically transact business on an order-by-order basis to maintain flexibility. We believe our strong relationships with suppliers have provided us with the ability to negotiate favorable pricing terms, further improving our overall cost structure and profitability. Our dedicated sourcing team actively negotiates and manages product costs to deliver initial mark-up objectives. The team further focuses on quality control to ensure that merchandise meets required technical specifications and inspects the merchandise to ensure it meets our strict standards, including regular in-line inspections while goods are in production. Upon receipt, merchandise is further inspected on a test basis for consistency in cut, size and color, as well as for conformity with specifications and overall quality of manufacturing. Our sourcing team ensures that the customer has a consistent product and satisfying brand experience regardless of product size, color or collection.
8
Omnichannel Distribution and Customer Contact Center
We lease our 520,000 square foot state-of-the-art distribution and customer contact center in Tilton, New Hampshire. The facility manages the receipt, storage, sorting, packing and distribution of merchandise for our retail and direct channels. Retail stores are replenished at least twice a week from this facility and shipped by third-party delivery services, providing our retail stores with a steady flow of new inventory that helps to maintain product freshness. Our distribution system is designed to operate in a highly-efficient and cost-effective manner, including our ability to profitably support individual direct orders which we believe differentiates ourselves from our competitors. In fiscal year 2017, the distribution center handled 37 million units, split between 18 million retail (49%) and 19 million direct (51%), and we believe this facility is sufficient to support our future growth.
The customer contact center is an extension of our brand, providing a consistent customer experience at every stage of a purchase across all of our channels. In fiscal year 2017, we managed approximately 4.4 million customer interactions through our in-house customer contact center in Tilton, New Hampshire. Our customer contact center is responsible for nearly all live customer interactions, other than in retail stores, including order taking and further serves as an important feedback loop in gathering customer responses to our brand, product and service. We continue to refine and improve our contact center strategy and experience to support the constantly evolving digital landscape.
Information Systems
We use information systems to support business intelligence and processes across our sales channels. We continue to invest in information systems and technology to enhance the customer experience and create operating efficiencies. We utilize third-party providers for customer database and customer campaign management, ensuring efficient maintenance of information in a secure, backed-up environment. In fiscal 2017, we migrated our website to a new platform and are undertaking initiatives to improve the customers' shopping experience and engagement. We also implemented a new merchandise financial planning system that provides timely views of inventory ownership and adds pre-season and in-season inventory management capabilities.
Seasonality
While the retail business is generally seasonal in nature, we have historically not experienced significant seasonal fluctuations in our sales. Our merchandise offering drives consistent sales across seasons with no quarter contributing more than 27% of total annual net sales in fiscal year 2017.
Competition
The women's apparel industry is highly competitive. We compete with local, national and international retail chains and department stores, specialty and discount stores, catalogs and internet businesses offering similar categories of merchandise. We compete primarily on the basis of design, service, quality and value. We believe our distinct combination of design, service, quality and value allows us to compete effectively and we believe we differentiate ourselves from competitors based on the strength of our brand, our omnichannel platform, our strong data capabilities, our loyal customer base, our customer-focused product assortment and our highly experienced leadership team. Our competitors range from smaller, growing companies to considerably larger companies with substantially greater financial, marketing and other resources.
Employees
As of February 3, 2018, we employed 1,501 full-time and 2,254 part-time employees. Of these employees, 386 are employed in our headquarters in Quincy, Massachusetts, 2,884 are employed in our retail stores and 485 work in our distribution and customer contact center and administrative office in Tilton, New Hampshire. The number of employees, particularly part-time employees, fluctuates depending upon seasonal needs.
Our employees are not represented by a labor union and are not party to a collective bargaining agreement. We consider our relations with our employees to be good.
9
Intellectual Property
Our trademarks are important to our marketing efforts. We own or have the rights to use certain trademarks, service marks and trade names that are registered with the U.S. Patent and Trademark Office or other foreign trademark registration offices or exist under common law in the United States and other jurisdictions. Trademarks that are important in identifying and distinguishing our products and services include, but are not limited to, J.Jill ® , The J.Jill Wearever Collection ® and Pure Jill ® . Our rights to some of these trademarks may be limited to select markets. We also own domain names, including www.jjill.com .
Corporate Information
We were originally organized as Jill Intermediate LLC, a Delaware limited liability company, in February 2011. On February 24, 2017, we completed transactions pursuant to which we converted into a Delaware corporation and changed our name to J.Jill, Inc. Our principal executive office is located at 4 Batterymarch Park, Quincy, MA 02169, and our telephone number is (617) 376-4300.
On May 8, 2015, an investment vehicle of investment funds affiliated with TowerBrook Capital Partners L.P. ("TowerBrook") acquired all of our outstanding equity interests through the newly formed entities JJill Holdings, Inc. ("JJill Holdings") and JJill Topco Holdings, LP ("JJill Topco Holdings"). We refer to such acquisition and the related financing transactions as the "Acquisition." See "Item 7. Management's Discussion and Analysis of Financial Condition and Results of Operations" for additional information.
Item 1A. Risk Factors
Risks Related to Our Business and Industry
Our business is sensitive to economic conditions and consumer spending .
We face numerous business risks relating to macroeconomic factors. The retail industry is cyclical and consumer purchases of discretionary retail items, including our merchandise, generally decline during recessionary periods and other times when disposable income is lower. Factors impacting discretionary consumer spending include general economic conditions, wages and employment, consumer debt, reductions in net worth based on severe market declines, residential real estate and mortgage markets, taxation, volatility of fuel and energy prices, interest rates, consumer confidence, political and economic uncertainty and other macroeconomic factors. Deterioration in economic conditions or increasing unemployment levels may reduce the level of consumer spending and inhibit consumers' use of credit, which may adversely affect our revenues and profits. In recessionary periods and other periods where disposable income is adversely affected, we may have to increase the number of promotional sales or otherwise dispose of inventory for which we have previously paid to manufacture, which could further adversely affect our profitability. It is difficult to predict when or for how long any of these conditions can affect our business and a prolonged economic downturn could have a material adverse effect on our business, financial condition and results of operations.
Our inability to anticipate and respond to changing customer preferences and shifts in fashion and industry trends in a timely manner could have a material adverse effect on our business, financial condition and results of operations .
Our success largely depends on our ability to consistently gauge tastes and trends and provide a balanced assortment of merchandise that satisfies customer demands in a timely manner. We enter into agreements to manufacture and purchase our merchandise well in advance of the applicable selling season and our failure to anticipate, identify or react appropriately in a timely manner to changes in customer preferences, tastes and trends and economic conditions could lead to, among other things, missed opportunities, excess inventory or inventory shortages, markdowns and write-offs, all of which could negatively impact our profitability and have a material adverse effect on our business, financial condition and results of operations. Failure to respond to changing customer preferences and fashion trends could also negatively impact our brand image with our customers and result in diminished brand loyalty.
Our inability to maintain our brand image, engage new and existing customers and gain market share could have a material adverse effect on our growth strategy and our business, financial condition and results of operations .
Our ability to maintain our brand image and reputation is integral to our business, as well as the implementation of our strategy to grow. Maintaining, promoting and growing our brand will depend largely on the success of our design,
10
merchandising and marketing efforts and our ability to provide a consistent, high-quality customer experience. Our reputation could be jeopardized if we fail to maintain high standards for merchandise quality and integrity and any negative publicity about these types of concerns may reduce demand for our merchandise. While our brand enjoys a loyal customer base, the success of our growth strategy depends, in part, on our ability to keep existing customers engaged as well as attract new customers to shop our brand. If we experience damage to our reputation or loss of consumer confidence, we m ay not be able to retain existing customers or acquire new customers, which could have a material adverse effect on our business, financial condition and results of operations.
Our inability to manage our inventory levels and merchandise mix, including with respect to our omnichannel retail operations, could have a material adverse effect on our business, financial condition and results of operations .
Customer demand is difficult to predict and the lead times required for a substantial portion of our merchandise make it challenging to respond quickly to changes. Though we have the ability to source certain merchandise categories with shorter lead times, we generally enter into contracts for a substantial portion of our merchandise well in advance of the applicable selling season. Our business, financial condition and results of operations could be materially adversely affected if we are unable to manage inventory levels and merchandise mix and respond to changes in customer demand patterns. Inventory levels in excess of customer demand may result in lower than planned profitability. On the other hand, if we underestimate demand for our merchandise, we may experience inventory shortages resulting in missed sales and lost revenues. Either of these events could significantly affect our operating results and brand image and loyalty. Our profitability may also be impacted by changes in our merchandise mix and changes in our pricing. These changes could have a material adverse effect on our business, financial condition and results of operations.
In addition, our omnichannel operations create additional complexities in our ability to manage inventory levels, as well as certain operational issues in stores and on our website, including timely shipping and returns. Accordingly, our success depends to a large degree on continually evolving the processes and technology that enable us to plan and manage inventory levels and fulfill orders, address any related operational issues in store and on our website and further align channels to optimize our omnichannel operations. If we are unable to successfully manage these complexities, it may have a material adverse effect on our business, financial condition and results of operations.
Competitive pressures from other retailers as well as adverse structural developments in the retail sector may have a material adverse effect on our business, financial condition and results of operations .
The women's apparel industry is highly competitive. We compete with local, national and international retail chains and department stores, specialty and discount stores, catalogs and internet businesses offering similar categories of merchandise. We face a variety of competitive challenges, including price pressure, anticipating and quickly responding to changing customer demands or preferences, maintaining favorable brand recognition and effectively marketing our merchandise to our customers in diverse demographic markets, sourcing merchandise efficiently and developing merchandise assortments in styles that appeal to our customers in ways that favorably distinguish us from our competitors. In addition, the internet and other new technologies facilitate competitive entry and comparison shopping. We strive to offer an omnichannel shopping experience for our customers that enhances their shopping experiences. Omnichannel retailing is constantly evolving and we must keep pace with changing customer expectations and new developments by our competitors. Furthermore, many of our competitors have advantages over us, including substantially greater financial, marketing and other resources. Increased levels of promotional activity by our competitors, some of whom may be able to adopt more aggressive pricing policies than we can, both on our website and in stores, may negatively impact our sales and profitability. There can be no assurances that we will be able to compete successfully with these companies in the future. In addition to competing for sales, we compete for favorable store locations, lease terms and qualified sales associates and professional staff. Increased competition in these areas may result in higher costs and reduced profitability, which could have a material adverse effect on our business, financial condition and results of operations.
We may be unable to accurately forecast our operating results and growth rate, which may adversely affect our reported results .
We may not be able to accurately forecast our operating results and growth rate. We use a variety of factors in our forecasting and planning processes, including historical results, recent history and assessments of economic and market conditions, among other things. The growth rates in sales and profitability that we have experienced historically may not be sustainable as our active customer base expands and we achieve higher market penetration rates, and our percentage growth rates may decrease. The growth of our sales and profitability depends on the continued growth of demand for the merchandise we offer. A softening of demand, whether caused by changes in customer preferences or a weakening of the
11
economy or other factors, may result in decreased net sales or growth. Furthermore, many of our expenses and investments are fixed, and we may not be able to adjust ou r spending in a timely manner to compensate for any unexpected shortfall in our net sales results. Failure to accurately forecast our operating results and growth rate could cause our actual results to be materially lower than anticipated, and if our grow th rates decline as a result, investors' perceptions of our business may be adversely affected, and the market price of our common stock could decline.
Our inability to successfully optimize our omnichannel operations and maintain a relevant and reliable omnichannel experience for our customers could have an adverse effect on our growth strategy and our business, financial condition and results of operations .
Growing our business through our omnichannel operations is key to our growth strategy. Our goal is to offer our customers seamless access to our merchandise across our channels, including both our direct and retail channels. Accordingly, our success depends on our ability to anticipate and implement innovations in sales and marketing strategies to appeal to existing and potential customers who increasingly rely on multiple channels, such as E-commerce, to meet their shopping needs. Failure to enhance our technology and marketing efforts to align with our customers' developing shopping preferences could significantly impair our ability to meet our strategic business and financial goals. If we do not successfully optimize our omnichannel operations or if they do not achieve their intended objectives, it could have a material adverse effect on our business, financial condition and results of operations.
We depend on our E-commerce business and failure to successfully manage this business and deliver a seamless omnichannel shopping experience to our customers could have an adverse effect on our growth strategy and our business, financial condition and results of operations .
Sales through our direct channel, of which our E-commerce business constitutes the vast majority, accounted for approximately 43% of our total net sales for fiscal year 2017. Our business, financial condition and results of operations are dependent on maintaining our E-commerce business and expanding this business is an important part of our strategy to grow through our omnichannel operations. Dependence on our E-commerce business and the continued growth of our direct and retail channels subjects us to certain risks, including:
| • | the failure to successfully implement new systems, system enhancements and internet platforms; |
| • | the failure of our technology infrastructure or the computer systems that operate our website and their related support systems, causing, among other things, website downtimes, telecommunications issues or other technical failures; |
| • | the reliance on third-party computer hardware/software providers; |
| • | rapid technological change; |
| • | liability for online content; |
| • | violations of federal, state, foreign or other applicable laws, including those relating to data protection; |
| • | credit card fraud; |
| • | cyber security and vulnerability to electronic break-ins and other similar disruptions; and |
| • | diversion of traffic and sales from our stores. |
Our failure to successfully address and respond to these risks and uncertainties could negatively impact sales, increase costs, diminish our growth prospects and damage the reputation of our brand, each of which could have a material adverse effect on our business, financial condition and results of operations.
Our business depends on effective marketing and increasing customer traffic and the success of our direct channel depends on customers' use of our website and response to catalogs and digital marketing .
We have many initiatives in our marketing programs. If our competitors increase their spending on marketing, if our marketing expenses increase, if our marketing becomes less effective than that of our competitors, or if we do not adequately leverage technology and data analytics needed to generate concise competitive insight, we could experience a material adverse effect on our business, financial condition and results of operations. A failure to sufficiently innovate or maintain adequate and effective marketing strategies could inhibit our ability to maintain brand relevance and increase sales.
In particular, the level of customer traffic and volume of customer purchases through our direct channel, which accounted for approximately 43% of our net sales for fiscal year 2017, is substantially dependent on our ability to provide a content-rich and user-friendly website, widely distributed and informative catalogs, a fun, easy and hassle-free customer experience and reliable delivery of our merchandise. If we are unable to maintain and increase customers' use of our E-
12
commerce platform, and the volume of purchases declines, our business, financial condition and results of operations could be adversely affe cted.
Customer response to our catalogs and digital marketing is substantially dependent on merchandise assortment, merchandise availability and creative presentation, as well as the selection of customers to whom our catalogs are sent and to whom our digital marketing is directed, changes in mailing strategies and the size of our mailings. Our maintenance of a robust customer database has also been a key component of our overall strategy. If the performance of our website, catalogs and email declines, or if our overall marketing strategy is not successful, it could have a material adverse effect on our business, financial condition and results of operations.
We occupy our stores under long-term leases, which are subject to future increases in occupancy costs and which we may be unable to renew or may limit our flexibility to move to new locations .
We lease all of our store locations, our corporate headquarters and our distribution and customer contact center. We typically occupy our stores under operating leases with terms of up to ten years, which may include options to renew for additional multi-year periods thereafter. We depend on cash flow from operations to pay our lease expenses. If our business does not generate sufficient cash flow from operating activities to fund these expenses, we may not be able to service our lease expenses, which could materially harm our business. In the future, we may not be able to negotiate favorable lease terms. Our inability to do so may cause our occupancy costs to be higher in future years or may force us to close stores in desirable locations. If we are unable to renew our store leases, we may be forced to close or relocate a store, which could subject us to significant construction and other costs. Closing a store, for even a brief period to permit relocation, would reduce the revenue contribution of that store. Additionally, the revenue and profit, if any, generated at a relocated store may not equal the revenue and profit generated at the previous location.
Long-term leases can limit our flexibility to move a store to a new location. Some of our leases have early cancellation clauses, which permit the lease to be terminated if certain sales levels are not met in specific periods, whereas some of our leases are non-cancelable. If an existing or future store is not profitable, and we have the right to close it, we may nonetheless be committed to perform our obligations under the applicable lease including, among other things, paying the base rent for the balance of the lease term. Moreover, even if a lease has an early cancellation clause, we may not satisfy the contractual requirements for early cancellation under that lease. Our inability to enter into new leases or renew existing leases on terms acceptable to us or be released from our obligations under leases for stores that we close could have a material adverse effect on our business, financial condition and results of operations.
Our growth strategy depends in part on our ability to open and operate new retail stores on a profitable basis and if we are not successful in implementing future retail store expansion, or if such new stores would negatively impact sales from our existing stores or from our direct channel, our growth and profitability could be adversely impacted .
Our growth strategy depends in part on our ability to open and operate new retail stores on a profitable basis. We may be unable to identify and open new retail locations in desirable places in the future. We compete with other retailers and businesses for suitable retail locations. Local land use, local zoning issues, environmental regulations, governmental permits and approvals and other regulations may affect our ability to find suitable retail locations and also influence the cost of leasing them. We also may have difficulty negotiating real estate leases for new stores on acceptable terms. In addition, construction, environmental, zoning and real estate delays may negatively affect retail location openings and increase costs and capital expenditures. If we are unable to open new retail store locations in desirable places and on favorable terms, our net sales and profits could be materially adversely affected.
As we expand our store base, our lease expense and our cash outlays for rent under the lease terms will increase. Such growth will require that we continue to expand and improve our operating capabilities, including making investments in our information technology and operational infrastructure, and expand, train and manage our employee base, and we may be unable to do so. We primarily rely on cash flow generated from our operations to pay our lease expenses and to fund our growth initiatives. It requires a significant investment to open a new retail store. If we open a large number of stores relatively close in time, the cost of these retail store openings and lease expenses and the cost of continuing operations could reduce our cash position. If our business does not generate sufficient cash flow from operating activities to fund these expenses, we may not have sufficient cash available to address other aspects of our business or we may be unable to service our lease expenses, which could materially harm our business.
As we increase the number of retail stores, our stores may become more highly concentrated in geographic regions we already serve. As a result, the number of customers and related net sales at individual stores may decline and the payback
13
period may be increased. The growth in the number of our retail store s could also draw customers away from our direct business and if our competitors open stores with similar formats, our retail store format may become less unique and may be less attractive to customers as a shopping destination. If either of these events occurs, our business, financial condition and results of operations could be materially adversely affected.
There can be no assurances that we will be able to achieve our store expansion goals, nor can there be any assurances that our newly opened stores will achieve revenue or profitability levels comparable to those of our existing stores in the time periods estimated by us. In addition, the substantial management time and resources which our retail store expansion strategy requires may result in disruption to our existing business operations which may decrease our profitability. If our stores fail to achieve, or are unable to sustain, acceptable revenue, profitability and cash flow levels, we may incur store asset impairment charges, significant costs associated with closing those stores or both, which could have a material adverse effect on our business, financial condition and results of operations.
We rely on third-party service providers, such as Federal Express and the U . S . Postal Service, for the delivery of our merchandise and our catalogs .
We primarily utilize Federal Express to support retail store shipping. We also use the U.S. Postal Service to deliver millions of catalogs each year, and we depend on third parties to print and mail our catalogs. As a result, postal rate increases and paper and printing costs will affect the cost of our catalog and promotional mailings. We rely on discounts from the basic postal rate structure, such as discounts for bulk mailings and sorting. The operational and financial difficulties of the U.S. Postal Service are well documented. Any significant and unanticipated increase in postage, shipping costs, reduction in service, slow-down in delivery or increase in paper and printing costs could impair our ability to deliver merchandise and catalogs in a timely or economically efficient manner and could adversely impact our profitability if we are unable to pass such increases directly on to our customers or if we are unable to implement more efficient delivery and order fulfillment systems, all of which could have a material adverse effect on our business, financial condition and results of operations.
Competitive pricing pressures with respect to shipping our merchandise to our customers may harm our business and results of operations .
Historically, the shipping and handling fees we charge our direct customers are intended to recover the related shipping and handling expenses. Online and omnichannel retailers are increasing their focus on delivery services, as customers are increasingly seeking faster, guaranteed delivery times and low-price or free shipping. To remain competitive, we may be required to offer discounted, free or other more competitive shipping options to our customers, which may result in declines in our shipping and handling fees and increased shipping and handling expense. Declines in the shipping and handling fees that we generate may have a material adverse effect on our profitability to the extent that our shipping and handling expense is not declining proportionally, or if our shipping and handling expense would increase, which could have a material adverse effect on our business, financial condition and results of operations.
We are subject to payment-related risks .
We accept payments using a variety of methods, including credit cards, debit cards, gift cards, cash and bank checks. For existing and future payment methods we offer to our customers, we may become subject to additional regulations and compliance requirements (including obligations to implement enhanced authentication processes that could result in increased costs and reduce the ease of use of certain payment methods), as well as fraud. For certain payment methods, including credit and debit cards, we pay interchange and other fees, which may increase over time, thereby raising our operating costs and lowering profitability. We rely on third-party service providers for payment processing services, including the processing of credit and debit cards. In each case, it could disrupt our business if these third-party service providers become unwilling or unable to provide these services to us. We are also subject to payment card association operating rules, including data security rules, certification requirements and rules governing electronic funds transfers, which could change or be reinterpreted to make it difficult or impossible for us to comply. If we fail to comply with these rules or requirements, or if our data security systems are breached or compromised, we may be liable for card issuing banks' and others' costs, subject to fines and higher transaction fees and/or lose our ability to accept credit and debit card payments from our customers and process electronic funds transfers or facilitate other types of payments. Any of these developments could have a material adverse effect on our business, financial condition and results of operations.
On October 1, 2015, under payment card industry standards, liability shifted for certain debit and credit card transactions to retailers who do not accept Europay, MasterCard and Visa ("EMV") chip technology transactions. In response, we have completed the implementation of EMV chip technology in our stores as of fiscal year 2017.
14
If we fail to acquire new customers in a cost-effective manner, it could have an adverse impact on our growth strategy as we may not be able to increase net revenue or profit per active customer .
The success of our growth strategy depends in part on our ability to acquire new customers in a cost-effective manner. In order to expand our active customer base, we must appeal to and acquire customers who identify with our brand. We have made significant investments related to customer acquisition and expect to continue to spend significant amounts to acquire additional customers. As our brand becomes more widely known in the market, future marketing campaigns may not result in the acquisition of new customers at the same rate as past campaigns. There can be no assurances that the revenue from new customers we acquire will ultimately exceed the cost of acquiring those customers.
We use paid and non-paid advertising. Our paid advertising includes catalogs, paid search engine marketing, email, display and other advertising. Our non-paid advertising efforts include search engine optimization and social media. We obtain a significant amount of traffic via search engines and, therefore, rely on search engines such as Google, Yahoo! and Bing. Search engines frequently update and change the logic that determines the placement and display of results of a user's search, such that the purchased or algorithmic placement of links to our site can be negatively affected. A major search engine could change its algorithms in a manner that negatively affects our paid or non-paid search ranking, and competitive dynamics could impact the effectiveness of search engine marketing or search engine optimization. We also obtain traffic via social networking websites or other channels used by our current and prospective customers. As E-commerce and social networking continue to rapidly evolve, we must continue to establish relationships with these channels and may be unable to develop or maintain these relationships on acceptable terms. Additionally, digital advertising costs may continue to rise and as our usage of these channels expands, such costs may impact our ability to acquire new customers in a cost-effective manner. If the level of usage of these channels by our active customer base does not grow as expected, we may suffer a decline in customer growth or net sales. If we are unable to acquire new customers in a cost-effective manner, it could have a material adverse effect on our business, financial condition and results of operations.
Interruptions in our foreign sourcing operations and the relationships with our suppliers and agents could disrupt production, shipment or receipt of our merchandise, which would result in lost sales and increased costs .
We do not own or operate any manufacturing facilities and therefore depend upon independent third-party suppliers for the manufacturing of all of our merchandise, primarily through the use of agents. In fiscal year 2017, approximately 82% of our products were sourced through agents and 18% were sourced directly from suppliers and factories. Our merchandise is manufactured to our specifications primarily by factories outside of the United States. Some of the factors that might affect a supplier's ability to ship orders of our merchandise in a timely manner or to meet our quality standards are outside of our control, including inclement weather, natural disasters, political and financial instability, legal and regulatory developments, strikes, health concerns regarding infectious diseases, and acts of terrorism. Inadequate labor conditions, health or safety issues in the factories where goods are produced can negatively impact our brand's reputation. Late delivery of merchandise or delivery of merchandise that does not meet our quality standards could cause us to miss the delivery date requirements of our customers or delay timely delivery of merchandise to our stores for those items. These events could cause us to fail to meet customer expectations, cause our customers to cancel orders or cause us to be unable to deliver merchandise in sufficient quantities or of sufficient quality to our stores, which could result in lost sales.
We have no long-term merchandise supply contracts as we typically transact business on an order-by-order basis. If we are unable to maintain the relationships with our suppliers and agents and are unexpectedly required to change suppliers or agents, or if a key supplier or agent is unable or unwilling to supply acceptable merchandise in sufficient quantities on acceptable terms, we could experience a significant disruption in the supply of merchandise. We could also experience operational difficulties with our suppliers, such as reductions in the availability of production capacity, supply chain disruptions, errors in complying with merchandise specifications, insufficient quality control, shortages of fabrics or other raw materials, failures to meet production deadlines or increases in manufacturing costs.
We source our imported merchandise from six countries with the top three by volume including China, India, and the Philippines. Approximately 85% of our products were sourced in southeast Asia in fiscal year 2017. Any event causing a sudden disruption of manufacturing or imports from Asia or elsewhere, including the imposition of additional import restrictions, could materially harm our operations. Many of our imports are subject to existing or potential duties, tariffs or quotas that may limit the quantity of certain types of goods that may be imported into the United States from countries in Asia or elsewhere. We compete with other companies for production facilities and import quota capacity. While substantially all of our foreign purchases of our merchandise are negotiated and paid for in U.S. dollars, the cost of our merchandise may be affected by fluctuations in the value of relevant foreign currencies.
15
In addition, we are engaging in growing the amount of production carried out in other developing countries. These countries may present other risks with regard to infrastructure available to suppo rt manufacturing, labor and employee relations, political and economic stability, corruption, regulatory, environmental, health and safety compliance. While we endeavor to monitor and audit facilities where our production is done, any significant events w ith factories we use can adversely impact our reputation, brand and product delivery.
Furthermore, many of our suppliers rely on working capital financing to support their operations. To the extent any of our suppliers are unable to obtain adequate credit or their borrowing costs increase, we may experience delays in obtaining merchandise, our suppliers increasing their prices or our suppliers modifying payment terms in a manner that is unfavorable to us.
The failure of our suppliers to comply with our social compliance program requirements could have a material adverse effect on our reputation, business, financial condition and results of operations .
We require our third-party suppliers to comply with all applicable laws and regulations, as well as our Terms of Engagement-Commitment to Ethical Sourcing, which cover many areas, including labor, health, safety, environmental and other legal standards. We monitor compliance with these standards using third-party monitoring firms. Although we have an active program to provide training for our third-party suppliers and monitor their compliance with these standards, we do not control the suppliers or their practices. Any failure of our third-party suppliers to comply with our ethical sourcing standards or labor or other local laws in the country of manufacture, or the divergence of a third-party supplier's labor practices from those generally accepted as ethical in the United States, could disrupt the shipment of merchandise to our stores, force us to locate alternative manufacturing sources, reduce demand for our merchandise, damage our reputation and/or expose us to potential liability for their wrongdoings. Any of these events could have a material adverse effect on our reputation, business, financial condition and results of operations.
We rely on third parties to provide services in connection with certain aspects of our business, and any failure by these third parties to perform their obligations could have an adverse effect on our business, financial condition and results of operations .
We have entered into agreements with third parties that include, but are not limited to, logistics services, information technology systems (including hosting our website), servicing certain customer calls, software development and support, catalog production, select marketing services, distribution and employee benefits servicing. Services provided by third-party suppliers could be interrupted as a result of many factors, such as acts of nature or contract disputes. Any failure by a third party to provide services for which we have contracted on a timely basis or within expected service level and performance standards could result in a disruption of our business and have an adverse effect on our business, financial condition and results of operations.
Increases in the demand for, or the price of, cotton and other raw materials used to manufacture our merchandise or other fluctuations in sourcing or distribution costs could increase our costs and negatively impact our profitability .
We believe that we have strong supplier relationships, and we work continuously with our suppliers to manage cost increases. Our overall profitability depends, in part, on the success of our ability to mitigate rising costs or shortages of raw materials used to manufacture our merchandise. Cotton and other raw materials used to manufacture our merchandise are subject to availability constraints and price volatility impacted by a number of factors, including supply and demand for fabrics, weather, government regulations, economic climate and other unpredictable factors. In addition, our sourcing costs may fluctuate due to labor conditions, transportation or freight costs, energy prices, currency fluctuations or other unpredictable factors. The cost of labor at many of our third-party suppliers has been increasing in recent years, and we believe it is unlikely that such cost pressures will abate.
Most of our merchandise is shipped from our suppliers by ocean vessel. If a disruption occurs in the operation of ports through which our merchandise is imported, we may incur increased costs related to air freight or use of alternative ports. Shipping by air is significantly more expensive than shipping by ocean and our margins and profitability could be reduced. Shipping to alternative ports could also lead to delays in receipt of our merchandise. We rely on third-party shipping companies to deliver our merchandise to us. Failures by these shipping companies to deliver our merchandise to us or lack of capacity in the shipping industry could lead to delays in receipt of our merchandise or increased expense in the delivery of our merchandise. Any of these developments could have a material adverse effect on our business, financial condition and results of operations.
16
Reductions in the volume of mall traffic or the closing of shopping malls as a result of changing economic conditions or demographic patterns could significantly reduce our sales and leave us with unsold inventory .
A significant portion of our stores are currently located in shopping malls. Sales at stores located in malls are highly dependent on the traffic in those malls and the ability of developers to generate traffic near our stores. In recent years, there has been increased purchasing of merchandise online. This has adversely affected mall traffic. A continuation of this trend could adversely impact the sales generated by our mall stores, which could have a material adverse effect on our business, financial condition and results of operations.
Unseasonal or severe weather conditions may adversely affect our merchandise sales .
Our business is adversely affected by unseasonal weather conditions. Sales of certain seasonal apparel items are dependent in part on the weather and may decline when weather conditions do not favor the use of this apparel. Severe weather events may also impact our ability to supply our retail stores, deliver orders to customers on schedule and staff our retail stores and distribution and customer contact center, which could have a material adverse effect on our business, financial condition and results of operations.
Material damage to, or interruptions in, our information systems could have a material adverse effect on our business, financial condition and results of operations, and we may be exposed to risks and costs associated with protecting the integrity and security of our customers' information .
We depend largely upon our information technology systems in the conduct of all aspects of our operations, including to operate our website, process transactions, respond to customer inquiries, manage inventory, purchase, sell and ship goods on a timely basis and maintain cost-efficient operations. Such systems are subject to damage or interruption from power outages, computer and telecommunications failures, computer viruses, security breaches and natural disasters. Damage or interruption to our information technology systems may require a significant investment to fix or replace the affected system, and we may suffer interruptions in our operations in the interim. In addition, costs and potential problems and interruptions associated with the implementation of new or upgraded systems and technology or with maintenance or adequate support of existing systems could also disrupt or reduce the efficiency of our operations.
Additionally, a significant number of customer purchases across our omnichannel platform are made using credit cards, and a significant number of our customer orders are placed through our website. We process, store and transmit large amounts of data, including personal information, for our customers. From time to time, we may implement strategic initiatives related to elevating our customer service experience, such as customer membership programs, where we collect and maintain increasing amounts of customer data. We also handle and transmit sensitive information about our suppliers and workforce, including social security numbers, bank account information and health and medical information. We depend in part throughout our operations on the secure transmission of confidential information over public networks. In addition, security breaches can also occur as a result of non-technical issues, including vandalism, catastrophic events and human error. Our operations may further be impacted by security breaches that occur at third-party suppliers. Although we maintain cyber-security insurance, there can be no assurances that our insurance coverage will be sufficient, or that insurance proceeds will be paid to us in a timely manner.
States and the federal government have enacted additional laws and regulations to protect consumers against identity theft, including laws governing treatment of personally identifiable information. As the data privacy and security laws and regulations evolve, we may be subject to more extensive requirements to protect the customer information that we process in connection with the purchases of our merchandise. There can be no assurances that we will be able to operate our operations in accordance with Payment Card Industry Data Security Standards (PCI DSS), other industry recommended practices or applicable laws and regulations or any future security standards or regulations, or that meeting those standards will in fact prevent a data breach. These laws have increased the costs of doing business and, if we fail to implement appropriate safeguards or we fail to detect and provide prompt notice of unauthorized access as required by some of these laws, we could be subject to potential claims for damages and other remedies.
If a third party is able to circumvent our security measures, they could destroy or steal valuable information or disrupt our operations. Because techniques used to obtain unauthorized access or to sabotage systems change frequently and often are not recognized until launched against a target, we may be unable to anticipate these techniques or to implement adequate preventative measures. Any security breach could expose us to risks of data loss, fines, litigation and liability and could seriously disrupt our operations and harm our reputation. In addition, we could be required to expend significant resources to
17
change our business practices or modify our service offerings in connection with the protection of personally identifiable information, which coul d have a material adverse effect on our business, financial condition and results of operations.
The impact of privacy breaches at service providers could also severely damage our business and reputation .
We rely heavily on technology services provided by third parties for the successful operation of our business, including electronic messaging, digital marketing efforts and the collection and retention of customer data and associate information. We also rely on third parties to process credit card transactions, perform E-commerce and social media activities and retain data relating to our financial position and results of operations, strategic initiatives and other important information. The facilities and systems of our third-party service providers may be vulnerable to cyber-security breaches, acts of vandalism, computer viruses, misplaced or lost data, programming and/or human errors or other similar events. Any actual or perceived misappropriation, loss or other unauthorized disclosure of confidential or personally identifiable information by our third-party service providers could severely damage our reputation and our relationship with our customers, associates and investors as well as expose us to risks of litigation, liability or other penalties, all of which could have a material adverse effect on our business, financial condition and results of operations.
Our failure to comply with data protection laws and regulations could subject us to sanctions and damages and could harm our reputation and business .
We collect and process personal data as part of our business. As a result, we are subject to U.S. data protection laws and regulations at both the federal and state levels. The legislative and regulatory landscape for data protection continues to evolve, and in recent years there has been an increasing focus on privacy and data security issues. The strategic use of our customer data base, including interactions with our customers, marketing efforts and analysis of customer behavior, rely on the collection, retention and use of customer data and may be affected by these laws and regulations and their interpretation and enforcement. Alleged violations of laws, regulations or contractual obligations relating to privacy and data protection, and any relevant claims, may expose us to potential liability, require us to expend significant resources in responding to and defending such allegations and claims, and result in negative publicity and a loss of confidence in us by our customers, all of which could have an adverse effect on our business, financial condition and results of operations. Further, it is unclear how the laws and regulations relating to the collection, process and use of personal data will further develop in the United States, and to what extent this may affect our operations in the future. Any failure to comply with data protection laws and regulations, or future changes required to the way in which we use personal data, could have a material adverse effect on our business, financial condition and results of operations.
Increased usage of social media poses reputational risks .
As use of social media becomes more prevalent, our susceptibility to risks related to social media increases. The immediacy of social media precludes us from having real-time control over postings made regarding us via social media, whether matters of fact or opinion. Information distributed via social media could result in immediate unfavorable publicity for which we, like our competitors, do not have the ability to reverse. This unfavorable publicity could result in damage to our reputation and therefore have a material adverse effect on our business, financial condition and results of operations.
We depend on our executive management and key personnel and may not be able to retain or replace these employees or recruit additional qualified personnel, which could harm our business .
The loss of the services of any of our senior executives could have a material adverse effect on our business, financial condition and results of operations, as we may not be able to find suitable management personnel to replace departing executives on a timely basis. In addition, as our business expands, we believe that our future success will depend greatly on our continued ability to attract and retain highly skilled and qualified personnel. There is a high level of competition for personnel in the retail industry. Our inability to meet our staffing requirements in the future could impair our ability to increase revenue and could otherwise harm our business.
Our failure to find store employees that reflect our brand image and embody our culture could adversely affect our business, financial condition and results of operations .
Our success depends in part upon our ability to attract, motivate and retain a sufficient number of store employees, including store managers, who understand and appreciate our culture and customers, and are able to adequately and effectively represent this culture and establish credibility with our customers. The store employee turnover rate in the retail industry is generally high. Labor shortages and excessive store employee turnover will result in higher employee costs
18
associated with finding, hiring and training new store employees. If we are unable t o hire and retain store personnel capable of consistently providing a high level of customer service, our ability to open new stores and operate existing stores may be impaired and our performance and brand image may be negatively impacted. Competition fo r such qualified individuals and wage increases by other retailers could require us to pay higher wages to attract a sufficient number of employees. We are also dependent upon temporary personnel to adequately staff our stores and distribution and custome r contact center, with heightened dependence during busy periods such as the holiday season. There can be no assurances that there will be sufficient sources of suitable temporary personnel to meet our demand. Any such failure to meet our staffing needs or any material increases in employee turnover rates could have a material adverse effect on our business, financial condition and results of operations.
Labor organizing and other activities could negatively impact us .
Currently, none of our employees are represented by a union. However, our employees have the right at any time to form or affiliate with a union. Such organizing activities could lead to work slowdowns or stoppages, which could lead to disruption in our operations and increases in our labor costs, either of which could materially adversely affect our business, financial condition and results of operations.
Increases in labor costs, including wages, could adversely affect our business, financial condition and results of operations .
The labor costs associated with our retail stores and our distribution and customer contact center are subject to many external factors, including unemployment levels, prevailing wage rates, minimum wage laws, potential collective bargaining arrangements, health insurance costs and other insurance costs and changes in employment and labor legislation or other workplace regulation. From time to time, legislative proposals are made to increase the federal minimum wage in the United States, as well as the minimum wage in a number of individual states and municipalities, and to reform entitlement programs, such as health insurance and paid leave programs. As minimum wage rates increase or related laws and regulations change, our labor costs may increase. Any increase in the cost of our labor could have an adverse effect on our business, financial condition and results of operations or if we fail to pay such higher wages we could suffer increased employee turnover. Increases in labor costs could force us to increase prices, which could adversely impact our sales. If competitive pressures or other factors prevent us from offsetting increased labor costs by increases in prices, our profitability may decline and could have a material adverse effect on our business, financial condition and results of operations.
We could be materially and adversely affected if our distribution and customer contact center is damaged or closed or if its operations are diminished .
Our distribution and customer contact center is located in Tilton, New Hampshire. The distribution center manages the receipt, storage, sorting, packing and distribution of merchandise to our stores and to our direct customers. Independent third-party transportation companies then deliver merchandise from the distribution center to our stores or direct to our customers. The customer contact center handles all customer interactions, other than those in retail stores, including phone sales orders and service calls, emails and internet contacts. Any significant interruption in the operations of our Tilton distribution and customer contact center, our third-party distribution, fulfillment or transportation providers, for any reason, including natural disasters, accidents, inclement weather, technology system failures, work stoppages, slowdowns or strikes or other unforeseen events and circumstances, could delay or impair our ability to receive orders and to distribute merchandise to our stores and/or our customers. This could lead to inventory issues, increased costs, lower sales and a loss of loyalty to our brand, among other things, which could adversely affect our business, financial condition and results of operations.
Inventory shrinkage could have a material adverse effect on our business, financial condition and results of operations .
We are subject to the risk of inventory loss and theft. Although our inventory shrinkage rates have not been material, or fluctuated significantly in recent years, there can be no assurances that actual rates of inventory loss and theft in the future will be within our estimates or that the measures we are taking will effectively reduce inventory shrinkage. Although some level of inventory shrinkage is an unavoidable cost of doing business, if we were to experience higher rates of inventory shrinkage or incur increased security costs to combat inventory theft, it could have a material adverse effect on our business, financial condition and results of operations.
19
We may be unable to protect our trademarks and other intellectual propert y rights .
We believe that our trademarks and service marks are important to our success and our competitive position due to their name recognition with our customers. We devote substantial resources to the establishment and protection of our trademarks and service marks. We are not aware of any valid claims of infringement or challenges to our right to use any of our trademarks and service marks. Nevertheless, there can be no assurances that the actions we have taken to establish and protect our trademarks and service marks will be adequate to prevent imitation of our merchandise by others or to prevent others from seeking to block sales of our merchandise as a violation of the trademarks, service marks and intellectual property of others. Also, others may assert rights in, or ownership of, our trademarks and other intellectual property and we may not be able to successfully resolve these types of conflicts to our satisfaction.
We may be subject to liability if we infringe upon the intellectual property rights of third parties .
Third parties may sue us for alleged infringement of their proprietary rights. The party claiming infringement might have greater resources than we do to pursue its claims, and we could be forced to incur substantial costs and devote significant management resources to defend against such litigation. If the party claiming infringement were to prevail, we could be forced to discontinue the use of the related trademark or design and/or pay significant damages or enter into expensive royalty or licensing arrangements with the prevailing party, assuming these royalty or licensing arrangements are available at all on an economically feasible basis, which they may not be. We could also be required to pay substantial damages. Such infringement claims could harm our brand. In addition, any payments we are required to make and any injunction we are required to comply with as a result of such infringement could have a material adverse effect on our business, financial condition and results of operations.
We are subject to laws and regulations in the jurisdictions in which we operate and changes to the regulatory environment in which we operate or failure to comply with applicable laws and regulations could adversely affect our business, financial condition and results of operations .
Our business requires compliance with many laws and regulations in the United States and abroad, including, without limitation, labor and employment, tax, environmental, privacy, anti-bribery laws and regulations, trade laws and customs, truth-in-advertising, E-commerce, consumer protection and zoning and occupancy laws and ordinances that regulate retailers generally and/or govern the importation, promotion and sale of merchandise and the operation of stores and warehouse facilities. In addition, in the future, there may be new legal or regulatory requirements or more stringent interpretations of applicable requirements, which could increase the complexity of the regulatory environment in which we operate and the related cost of compliance. While it is our policy and practice to comply with all legal and regulatory requirements and our procedures and internal controls are designed to ensure such compliance, failure to achieve compliance could subject us to lawsuits and other proceedings, and could also lead to damage awards, fines and penalties. Litigation matters may include, among other things, government and agency investigations, employment, commercial, intellectual property, tort, advertising and stockholder claims. We cannot predict with certainty the outcomes of these legal proceedings and other contingencies. The outcome of some of these legal proceedings, audits and other contingencies could require us to take, or refrain from taking, actions which could negatively affect our operations or require us to pay substantial amounts of money adversely affecting our business, financial condition and results of operations. Even a claim of an alleged violation of applicable laws or regulations could negatively affect our reputation. Additionally, defending against these lawsuits and proceedings may be necessary, which could result in substantial costs and diversion of management's attention and resources, causing a material adverse effect on our business, financial condition and results of operations. Any pending or future legal proceedings and audits could have a material adverse effect on our business, financial condition and results of operations.
Changes in tax laws and regulations or in our operations may impact our effective tax rate and may adversely affect our business, financial condition and operating results .
Changes in tax laws in any of the multiple jurisdictions in which we operate, or adverse outcomes from tax audits that we may be subject to in any of the jurisdictions in which we operate, could result in an unfavorable change in our effective tax rate, which could adversely affect our business, financial condition and operating results.
Additionally, the current U.S. administration has publicly supported changes with respect to tax and trade policies, tariffs and government regulations affecting trade between the U.S. and other countries. We source the majority of our merchandise from manufacturers located outside of the U.S., including a significant amount from Asia. Major developments in tax policy or trade relations, such as the disallowance of tax deductions for imported merchandise or the imposition of
20
unilateral tariffs on imported products, could have a material adverse effect on our business, results of operations and liquidity.
The recently enacted comprehensive U.S. tax reform legislation could adversely affect our business, financial condition and results of operations .
On December 22, 2017, the U.S. Tax Cuts and Jobs Act was enacted that significantly revises the Internal Revenue Code of 1986, as amended. The newly enacted federal income tax law contains significant changes to corporate taxation, including but not limited to, a reduction of the corporate tax rate from a top marginal rate of 35% to a flat rate of 21%, a limitation of the tax deduction for interest expense to 30% of adjusted earnings (except for certain small businesses), elimination of U.S. tax on foreign earnings (subject to certain important exceptions), immediate deductions for certain new investments instead of deductions for depreciation expense over time, and modifying or repealing many business deductions and credits. Notwithstanding the reduction in the corporate income tax rate, it is unclear how certain provisions of the new federal tax law will be applied absent further legislative clarification and guidance. In addition, it is uncertain if and to what extent various states will conform to the newly enacted federal tax law. These uncertainties and the ultimate interpretation of the federal provisions may adversely affect our business, financial condition and results of operations.
War, terrorism, civil unrest or other violence may negatively impact availability of merchandise and/or otherwise adversely impact our business .
In the event of war, terrorism, civil unrest or other violence, our ability to obtain merchandise available for sale in our stores or on our websites may be negatively impacted. A substantial portion of our merchandise is imported from other countries, see "- Interruptions in our foreign sourcing operations and the relationships with our suppliers and agents could disrupt production, shipment or receipt of our merchandise, which would result in lost sales and could increase our costs." If commercial transportation is curtailed or substantially delayed, our business may be adversely impacted, as we may have difficulty shipping merchandise to our distribution and customer contact center and stores, as well as fulfilling catalog and website orders. In addition, our stores are located in public areas where large numbers of people typically gather. Terrorist attacks, threats of terrorist attacks or civil unrest involving public areas could cause people not to visit areas where our stores are located. Other types of violence in malls or in other public areas could lead to lower customer traffic in areas in which we operate stores. If any of these events were to occur, we may be required to suspend operations in some or all of our stores, which could have a material adverse effect on our business, financial condition and results of operations.
The terms of our term loan credit agreement and asset-based revolving credit facility restrict our operational and financial flexibility, which could adversely affect our ability to respond to changes in our business and to manage our operations .
Our term loan credit agreement, dated as of May 8, 2015, by and among Jill Holdings LLC, Jill Acquisition LLC, a wholly-owned subsidiary of us, the various lenders party thereto and Jefferies Finance LLC as the administrative agent, as amended on May 27, 2016 by Amendment No. 1 thereto (the "Term Loan") and our ABL credit agreement, dated as of May 8, 2015, by and among Jill Holdings LLC, Jill Acquisition LLC, certain subsidiaries from time to time party thereto, the lenders party thereto and CIT Finance LLC as the administrative agent and collateral agent, as amended on May 27, 2016 by Amendment No. 1 thereto (the "ABL Facility" and, together with the Term Loan, the "Credit Agreements"), contain, and any additional debt financing we may incur would likely contain, covenants that restrict our operations, including limitations on our ability to grant liens, incur additional debt, pay dividends, cause our subsidiaries to pay dividends to us, make certain investments and engage in certain merger, consolidation or asset sale transactions. A failure by us to comply with the covenants or financial ratios contained in our Credit Agreements could result in an event of default, which could adversely affect our ability to respond to changes in our business and manage our operations. Upon the occurrence of an event of default, the lenders could elect to declare all amounts outstanding to be due and payable and exercise other remedies as set forth in our Credit Agreements. If the indebtedness under our Credit Agreements were to be accelerated, our future financial condition could be materially adversely affected. See "Management's Discussion and Analysis of Financial Condition and Results of Operations-Liquidity and Capital Resources-Credit Facilities."
Changes to estimates related to our property, fixtures and equipment or operating results that are lower than our current estimates at certain store locations may cause us to incur impairment charges on certain long-lived assets, which may adversely affect our results of operations .
In accordance with accounting guidance as it relates to the impairment of long-lived assets, we make certain estimates and projections with regard to individual store operations, as well as our overall performance, in connection with our impairment analyses for long-lived assets. When impairment triggers are deemed to exist for any location, the estimated undiscounted future cash flows are compared to its carrying value. If the carrying value exceeds the undiscounted cash
21
flows, an impairment charge equal to the difference between the carrying value and the fair value is recorded. The projections of f uture cash flows used in these analyses require the use of judgment and a number of estimates and projections of future operating results. If actual results differ from our estimates, additional charges for asset impairments may be required in the future. If future impairment charges are significant, our reported operating results would be adversely affected.
Goodwill and identifiable intangible assets represent a significant portion of our total assets and any impairment of these assets could adversely affect our results of operations .
Our goodwill and indefinite-lived intangible assets, which consist of goodwill from the Acquisition, and our trade name, represented a significant portion of our total assets as of February 3, 2018. Accounting rules require the evaluation of our goodwill and indefinite-lived intangible assets for impairment at least annually, or more frequently when events or changes in circumstances indicate that the carrying value of such assets may not be recoverable. Such indicators are based on market conditions and the operational performance of our business.
To test goodwill for impairment, we may initially use a qualitative approach to determine whether conditions exist to indicate that it is more likely than not that the fair value of a reporting unit is less than its carrying value. If our management concludes, based on its assessment of relevant events, facts and circumstances that it is more likely than not that a reporting unit's carrying value is greater than its fair value, then a quantitative analysis will be performed to determine if there is any impairment. We also have the option to bypass the qualitative assessment and proceed directly to the quantitative assessment. The quantitative assessment requires comparing the fair value of a reporting unit to its carrying value, including goodwill. We estimate the fair value of reporting units using the income approach. The income approach uses a discounted cash flow model, which involves significant estimates and assumptions, including preparation of revenue and profitability growth forecasts, selection of a discount rate, and selection of a terminal year multiple. The estimates of fair value of reporting units are based on the best information available as of the date of the assessment. If the fair value of a reporting unit exceeds its carrying amount, goodwill is not considered to be impaired and no further testing is required. If the carrying amount exceeds the reporting unit's fair value, a goodwill impairment charge is recognized for the amount in excess, not to exceed the total amount of goodwill allocated to that reporting unit.
To test our other indefinite-lived assets for impairment, which consists of our trade name, we determine the fair value of our trade name using the relief-from-royalty method, which estimates the present value of royalty income that could be hypothetically earned by licensing the brand name to a third party over the remaining useful life. If in conducting an impairment evaluation we determine that the carrying value of an asset exceeded its fair value, we would be required to record a non-cash impairment charge for the difference between the carrying value and the fair value of the asset. If a significant amount of our goodwill and identifiable intangible assets were deemed to be impaired, our business, financial condition and results of operations could be materially adversely affected.
Changes in accounting standards and subjective assumptions, estimates and judgments by management related to complex accounting matters could significantly affect our financial results or financial condition .
Generally accepted accounting principles and related accounting pronouncements, implementation guidelines and interpretations with regard to a wide range of matters that are relevant to our business, including but not limited to revenue recognition, business combinations, impairment of goodwill, indefinite-lived intangible assets and long-lived assets, inventory and equity-based compensation, are highly complex and involve many subjective assumptions, estimates and judgments. Changes in these rules or their interpretation or changes in underlying assumptions, estimates or judgments could significantly change our reported or expected financial performance or financial condition.
Changes in lease accounting standards may materially and adversely affect us .
The Financial Accounting Standards Board, or FASB, recently adopted new accounting rules, to be effective for our fiscal year beginning after December 2018 that will require companies to capitalize all leases on their balance sheets by recognizing a lessee's rights and obligations. When the rules are effective, we will be required to account for the leases for stores as assets and liabilities on our balance sheet, where previously we accounted for such leases on an "off balance sheet" basis. As a result, a significant amount of lease related assets and liabilities will be recorded on our balance sheet and we may be required to make other changes to the recording and classification of our lease related expenses. Though these changes will not have any direct impact on our overall financial condition, these changes could cause investors or others to believe that we are highly leveraged and could change the calculations of financial metrics and covenants under our debt facilities, as well as third-party financial models regarding our financial condition.
22
Risks Related to Ownership of Our Common Stock
We are an "emerging growth company," and are taking advantage of reduced disclosure requirements applicable to "emerging growth companies," which could make our common stock less attractive to investors .
We are an "emerging growth company," as defined in the Jumpstart Our Business Startups Act of 2012, or JOBS Act, and, for as long as we continue to be an "emerging growth company," we intend to take advantage of certain exemptions from various reporting requirements applicable to other public companies but not to "emerging growth companies." These exemptions include not being required to comply with the auditor attestation requirements of Section 404 of the Sarbanes-Oxley Act, reduced disclosure obligations regarding executive compensation in our periodic reports and proxy statements, and exemptions from the requirements of holding a nonbinding advisory vote on executive compensation and stockholder approval of any golden parachute payments not previously approved. We could be an "emerging growth company" for up to five years, or until the earliest of (i) the last day of the first fiscal year in which our annual gross revenues exceed $1.07 billion, (ii) the date that we become a "large accelerated filer" as defined in Rule 12b-2 under the Exchange Act, which would occur if the market value of our common stock that is held by non-affiliates exceeds $700 million as of the last business day of our most recently completed second fiscal quarter, or (iii) the date on which we have issued more than $1 billion in non-convertible debt during the preceding three-year period. We cannot predict if investors will find our common stock less attractive if we choose to rely on these exemptions. If some investors find our common stock less attractive as a result of any choices to reduce future disclosure, there may be a less active trading market for our common stock and our stock price may be more volatile.
We will incur significantly increased costs and devote substantial management time as a result of operating as a public company particularly after we are no longer an "emerging growth company . "
As a public company, we will incur significant legal, accounting and other expenses that we did not incur as a private company. For example, we are required to comply with certain of the requirements of the Sarbanes-Oxley Act and the Dodd-Frank Wall Street Reform and Consumer Protection Act, as well as rules and regulations subsequently implemented by the Securities and Exchange Commission, and the NYSE, our stock exchange, including the establishment and maintenance of effective disclosure and financial controls and changes in corporate governance practices. We expect that compliance with these requirements will increase our legal and financial compliance costs and will make some activities more time consuming and costly. In addition, we expect that our management and other personnel will need to divert attention from operational and other business matters to devote substantial time to these public company requirements. In particular, we expect to incur significant expenses and devote substantial management effort toward ensuring compliance with the requirements of the Sarbanes-Oxley Act.
However, for as long as we remain an "emerging growth company" as defined in the JOBS Act, we intend to take advantage of certain exemptions from various reporting requirements that are applicable to other public companies that are not "emerging growth companies" including, but not limited to, not being required to comply with the auditor attestation requirements of Section 404 of the Sarbanes-Oxley Act, reduced disclosure obligations regarding executive compensation in our periodic reports and proxy statements, and exemptions from the requirements of holding a nonbinding advisory vote on executive compensation and stockholder approval of any golden parachute payments not previously approved. We intend to take advantage of these reporting exemptions until we are no longer an "emerging growth company."
Under the JOBS Act, "emerging growth companies" can delay adopting new or revised accounting standards until such time as those standards apply to private companies. We have elected to avail ourselves of this exemption from new or revised accounting standards and, therefore, while we are an "emerging growth company" we will not be subject to new or revised accounting standards at the same time that they become applicable to other public companies that are not "emerging growth companies". Accordingly, we will incur additional costs in connections with complying with the accounting standards applicable to public companies at such time or times as they become applicable to us.
After we are no longer an "emerging growth company," we expect to incur additional management time and cost to comply with the more stringent reporting requirements applicable to companies that are deemed accelerated filers or large accelerated filers, including complying with the auditor attestation requirements of Section 404 of the Sarbanes-Oxley Act.
We cannot predict or estimate the amount of additional costs we may incur as a result of becoming a public company or the timing of such costs.
23
If we are unable to design, implement and maintain effective internal controls in accordance with Section 404 of the Sarbanes-Oxley Act, it could have a material adverse effect on our business and stock price .
As a public company, we have significant requirements for enhanced financial reporting and internal controls. The process of designing and implementing effective internal controls is a continuous effort that requires us to anticipate and react to changes in our business and the economic and regulatory environments and to expend significant resources to maintain a system of internal controls that is adequate to satisfy our reporting obligations as a public company. If we are unable to maintain appropriate internal financial reporting controls and procedures, it could cause us to fail to meet our reporting obligations on a timely basis, result in material misstatements in our consolidated financial statements and harm our operating results. In addition, we are required, pursuant to Section 404 of the Sarbanes-Oxley Act, to furnish a report by management on, among other things, the effectiveness of our internal control over financial reporting. This assessment includes disclosure of any material weaknesses identified by our management in our internal control over financial reporting. Testing and maintaining internal controls may divert our management's attention from other matters that are important to our business. We may not be able to conclude on an ongoing basis that we have effective internal control over financial reporting in accordance with Section 404 of the Sarbanes-Oxley Act.
We are a "controlled company" within the meaning of the NYSE rules and, as a result, qualify for and intend to rely on exemptions from certain corporate governance requirements .
TowerBrook controls a majority of the voting power of our outstanding voting stock, and as a result we are a controlled company within the meaning of the NYSE corporate governance standards. Under the NYSE rules, a company of which more than 50% of the voting power is held by another person or group of persons acting together is a controlled company and may elect not to comply with certain corporate governance requirements, including the requirements that:
| • | a majority of the board of directors consist of independent directors; |
| • | the nominating and corporate governance committee be composed entirely of independent directors with a written charter addressing the committee's purpose and responsibilities; |
| • | the compensation committee be composed entirely of independent directors with a written charter addressing the committee's purpose and responsibilities; and |
| • | there be an annual performance evaluation of the nominating and corporate governance and compensation committees. |
These requirements do not apply to us as long as we remain a controlled company. Accordingly, you may not have the same protections afforded to stockholders of companies that are subject to all of the corporate governance requirements of the NYSE.
We continue to be controlled by TowerBrook, and TowerBrook's interests may conflict with our interests and the interests of other stockholders .
TowerBrook owns approximately 59% of our common stock. As a result, TowerBrook will have effective control over the outcome of votes on all matters requiring approval by our stockholders, including entering into significant corporate transactions such as mergers, tender offers and the sale of all or substantially all of our assets and issuance of additional debt or equity. In addition, as long as TowerBrook beneficially owns at least 50% of our common stock, a Stockholders Agreement provides TowerBrook with veto rights with respect to certain material matters. The interests of TowerBrook and its affiliates could conflict with or differ from our interests or the interests of our other stockholders. For example, the concentration of ownership held by TowerBrook could delay, defer or prevent a change of control of our company or impede a merger, takeover or other business combination which may otherwise be favorable for us. Additionally, TowerBrook is in the business of making investments in companies and may, from time to time, acquire and hold interests in businesses that compete, directly or indirectly with us. TowerBrook may also pursue acquisition opportunities that may be complementary to our business, and as a result, those acquisition opportunities may not be available to us. So long as TowerBrook continues to directly or indirectly own a significant amount of our equity, even if such amount is less than 50%, TowerBrook will continue to be able to substantially influence or effectively control our ability to enter into corporate transactions.
Our certificate of incorporation contains a provision renouncing our interest and expectancy in certain corporate opportunities .
Our certificate of incorporation provides for the allocation of certain corporate opportunities between us and TowerBrook. Under these provisions, neither TowerBrook, its portfolio companies, funds or other affiliates, nor any of their officers, directors, agents, stockholders, members or partners have any duty to refrain from engaging, directly or indirectly, in
24
the same business activities, similar business activities or lines of business i n which we operate. For instance, a director of our company who also serves as a director, officer, partner or employee of TowerBrook or any of its portfolio companies, funds or other affiliates may pursue certain acquisitions or other opportunities that may be complementary to our business and, as a result, such acquisition or other opportunities may not be available to us. These potential conflicts of interest could have a material adverse effect on our business, financial condition, results of operatio ns or prospects if attractive corporate opportunities are allocated by TowerBrook to itself or its portfolio companies, funds or other affiliates instead of to us.
Provisions in our organizational documents and Delaware law may discourage our acquisition by a third party .
Our certificate of incorporation authorizes our board of directors to issue preferred stock without stockholder approval. If the board of directors elects to issue preferred stock, it could be more difficult for a third party to acquire us. In addition, some provisions of our certificate of incorporation and bylaws could make it more difficult for a third party to acquire control of us, even if the change of control would be beneficial to our stockholders.
Section 203 of the General Corporation Law of the State of Delaware (the "DGCL") affects the ability of an "interested stockholder" to engage in certain business combinations, for a period of three years following the time that the stockholder becomes an "interested stockholder." We have elected in our certificate of incorporation not to be subject to Section 203 of the DGCL. Nevertheless, our certificate of incorporation contains provisions that have the same effect as Section 203 of the DGCL, except that it provides that affiliates of TowerBrook and their transferees will not be deemed to be "interested stockholders," regardless of the percentage of our voting stock owned by them, and will therefore not be subject to such restrictions. These charter provisions may limit the ability of third parties to acquire control of our company.
We are a holding company and rely on dividends, distributions and other payments, advances and transfers of funds from our subsidiaries to meet our obligations .
We are a holding company that does not conduct any business operations of our own. As a result, we are largely dependent upon cash dividends and distributions and other transfers from our subsidiaries to meet our obligations. The agreements governing the indebtedness of our subsidiaries impose restrictions on our subsidiaries' ability to pay dividends or other distributions to us. See "Management's Discussion and Analysis of Financial Condition and Results of Operations-Liquidity and Capital Resources-Credit Facilities." The deterioration of the earnings from, or other available assets of, our subsidiaries for any reason could also limit or impair their ability to pay dividends or other distributions to us.
Future sales of our common stock in the public market, or the perception in the public market that such sales may occur, could reduce our stock price .
We have 43,752,790 outstanding shares of common stock. The number of outstanding shares of common stock includes 31,172,577 shares, including shares controlled by TowerBrook, that are "restricted securities," as defined under Rule 144 under the Securities Act of 1933, as amended (the "Securities Act"), and eligible for sale in the public market subject to the requirements of Rule 144. Sales of significant amounts of stock in the public market could adversely affect prevailing market prices of our common stock.
There can be no assurances that a viable public market for our common stock will be maintained .
An active, liquid and orderly trading market for our common stock may not be maintained. Active, liquid and orderly trading markets usually result in less price volatility and more efficiency in carrying out investors' purchase and sale orders. We cannot predict the extent to which investor interest in our common stock will lead to the maintenance of an active trading market on the NYSE or otherwise or how liquid that market might continue to be. If an active public market for our common stock is not sustained, it may be difficult for you to sell your shares at a price that is attractive to you or at all.
25
Our stock price has been and may continue to be volatile .
The market price of our common stock could vary significantly as a result of a number of factors, some of which are beyond our control. In the event of a drop in the market price of our common stock, you could lose a substantial part or all of your investment in our common stock. The following factors could affect our stock price:
| • | our operating and financial performance; |
| • | quarterly variations in the rate of growth (if any) of our financial indicators, such as net income per share, net income and revenues; |
| • | the public reaction to our press releases, our other public announcements and our filings with the SEC; |
| • | strategic actions by our competitors; |
| • | changes in operating performance and the stock market valuations of other companies; |
| • | announcements related to litigation; |
| • | our failure to meet revenue or earnings estimates made by research analysts or other investors; |
| • | changes in revenue or earnings estimates, or changes in recommendations or withdrawal of research coverage, by equity research analysts; |
| • | speculation in the press or investment community; |
| • | sales of our common stock by us or our stockholders, or the perception that such sales may occur; |
| • | changes in accounting principles, policies, guidance, interpretations or standards; |
| • | additions or departures of key management personnel; |
| • | actions by our stockholders; |
| • | general market conditions; |
| • | domestic and international economic, legal and regulatory factors unrelated to our performance; and |
| • | the realization of any risks described under this "Risk Factors" section, or other risks that may materialize in the future. |
The stock markets in general have experienced extreme volatility that has often been unrelated to the operating performance of particular companies. These broad market fluctuations may adversely affect the trading price of our common stock. Securities class action litigation has often been instituted against companies following periods of volatility in the overall market and in the market price of a company's securities. Beginning in October 2017, we, certain of our officers and directors, and the underwriters of our initial public offering were named as defendants in securities class actions purportedly brought on behalf of purchasers of our common stock. This litigation and any future securities class actions, if instituted against us, could result in very substantial costs, divert our management's attention and resources and harm our business, financial condition and results of operations.
If securities or industry analysts do not publish research or reports about our business or publish negative reports, our stock price could decline .
The trading market for our common stock will be influenced by the research and reports that industry or securities analysts publish about us or our business. If one or more of these analysts cease coverage of our company or fail to publish reports on us regularly, we could lose visibility in the financial markets, which in turn could cause our stock price or trading volume to decline. Moreover, if one or more of the analysts who cover our company downgrades our common stock or if our operating results do not meet their expectations, our stock price could decline.
The issuance by us of additional shares of common stock or convertible securities may dilute your ownership of us and could adversely affect our stock price .
We have filed a registration statement with the SEC on Form S-8 providing for the registration of 2,237,303 shares of our common stock issued or reserved for issuance under our long-term incentive plan. Subject to the satisfaction of vesting conditions and the expiration of lock-up agreements, shares registered under the registration statement on Form S-8 will be available for resale immediately in the public market without restriction. From time to time in the future, we may also issue additional shares of our common stock or securities convertible into common stock pursuant to a variety of transactions, including acquisitions. The issuance by us of additional shares of our common stock or securities convertible into our common stock would dilute your ownership of us and the sale of a significant amount of such shares in the public market could adversely affect prevailing market prices of our common stock.
26
We may issue preferred stock whose terms could adversely affect the voting power or value of our common stock .
Our certificate of incorporation authorizes us to issue, without the approval of our stockholders, one or more classes or series of preferred stock having such designations, preferences, limitations and relative rights, including preferences over our common stock respecting dividends and distributions, as our board of directors may determine. The terms of one or more classes or series of preferred stock could adversely impact the voting power or value of our common stock. For example, we might grant holders of preferred stock the right to elect some number of our directors in all events or on the happening of specified events or the right to veto specified transactions. Similarly, the repurchase or redemption rights or liquidation preferences we might assign to holders of preferred stock could affect the residual value of the common stock.
Our designation of the Delaware Court of Chancery as the exclusive forum for certain types of stockholder legal proceedings could limit our stockholders' ability to obtain a more favorable forum .
Our certificate of incorporation provides that unless we consent in writing to the selection of an alternative forum, the Court of Chancery of the State of Delaware will, to the fullest extent permitted by applicable law, be the sole and exclusive forum for (i) any derivative action or proceeding brought on our behalf, (ii) any action asserting a claim of breach of a fiduciary duty owed by any of our directors, officers, employees or agents to us or our stockholders, (iii) any action asserting a claim arising pursuant to any provision of the DGCL, our certificate of incorporation or our bylaws or (iv) any action asserting a claim against us that is governed by the internal affairs doctrine, in each such case subject to such Court of Chancery having personal jurisdiction over the indispensable parties named as defendants therein. Any person or entity purchasing or otherwise acquiring any interest in shares of our capital stock will be deemed to have notice of, and consented to, the provisions of our certificate of incorporation described in the preceding sentence. This choice of forum provision may limit a stockholder's ability to bring a claim in a judicial forum that it finds favorable for disputes with us or our directors, officers, employees or agents, which may discourage such lawsuits against us and such persons. See "Description of Capital Stock-Forum Selection." Alternatively, if a court were to find these provisions of our certificate of incorporation inapplicable to, or unenforceable in respect of, one or more of the specified types of actions or proceedings, we may incur additional costs that we do not currently anticipate associated with resolving such matters in other jurisdictions, which could adversely affect our business, financial condition and results of operations.
Item 1B. Unresolved Staff Comments
None.
Item 2. Properties
We are headquartered in Quincy, Massachusetts. Our principal executive offices are leased under a lease agreement expiring in December 2026, with options to renew thereafter. Our 520,000 square foot distribution and customer contact center, located in Tilton, New Hampshire, supports both our retail and direct channels and is leased under a lease agreement expiring in September 2030, with options to renew thereafter. We consider these properties to be in good condition and believe that our facilities are adequate for operations and provide sufficient capacity to meet our anticipated future requirements.
As of February 3, 2018, we operated 276 stores in 42 states. Of these stores, approximately half located in lifestyle centers and half in premium malls. The average size of our stores is approximately 3,700 square feet. All of our retail stores are leased from third parties and new stores historically have had terms of ten years. The average remaining lease term is 5.2 years. A portion of our leases have options to renew for periods up to five years. Generally, store leases contain standard provisions concerning the payment of rent, events of default and the rights and obligations of each party. Rent due under the leases is generally comprised of annual base rent plus a contingent rent payment based on the store's sales in excess of a specified threshold. Some of the leases also contain early termination options, which can be exercised by us or the landlord under certain conditions. The leases also generally require us to pay real estate taxes, insurance and certain common area costs. We renegotiate with landlords to obtain more favorable terms as opportunities arise.
27
The current terms of our leases expire as follows:
Fiscal Years Lease Terms Expire |
| Number of Stores |
| |
2017 – 2019 |
|
| 66 |
|
2020 – 2022 |
|
| 79 |
|
2023 – 2025 |
|
| 74 |
|
2026 and later |
|
| 57 |
|
The table below sets forth the number of retail stores by state that we operated as of February 3, 2018.
|
| Number |
|
|
|
| Number |
|
|
|
| Number |
| |||
State |
| of Stores |
|
| State |
| of Stores |
|
| State |
| of Stores |
| |||
Alabama |
|
| 5 |
|
| Kentucky |
|
| 2 |
|
| New York |
|
| 11 |
|
Arizona |
|
| 6 |
|
| Louisiana |
|
| 3 |
|
| North Carolina |
|
| 10 |
|
Arkansas |
|
| 3 |
|
| Maine |
|
| 1 |
|
| Ohio |
|
| 9 |
|
California |
|
| 29 |
|
| Maryland |
|
| 8 |
|
| Oklahoma |
|
| 2 |
|
Colorado |
|
| 7 |
|
| Massachusetts |
|
| 13 |
|
| Oregon |
|
| 5 |
|
Connecticut |
|
| 8 |
|
| Michigan |
|
| 10 |
|
| Pennsylvania |
|
| 11 |
|
Delaware |
|
| 1 |
|
| Minnesota |
|
| 8 |
|
| Rhode Island |
|
| 2 |
|
Florida |
|
| 12 |
|
| Mississippi |
|
| 1 |
|
| South Carolina |
|
| 4 |
|
Georgia |
|
| 10 |
|
| Missouri |
|
| 6 |
|
| Tennessee |
|
| 6 |
|
Idaho |
|
| 1 |
|
| Nebraska |
|
| 2 |
|
| Texas |
|
| 17 |
|
Illinois |
|
| 16 |
|
| Nevada |
|
| 2 |
|
| Utah |
|
| 1 |
|
Indiana |
|
| 2 |
|
| New Hampshire |
|
| 1 |
|
| Virginia |
|
| 10 |
|
Iowa |
|
| 3 |
|
| New Jersey |
|
| 14 |
|
| Washington |
|
| 6 |
|
Kansas |
|
| 2 |
|
| New Mexico |
|
| 1 |
|
| Wisconsin |
|
| 5 |
|
|
|
|
|
|
|
|
|
|
|
|
|
|
|
|
|
|
Item 3. Legal Proceedings
Shareholder Class Action Lawsuits
On October 13, 2017, a securities lawsuit was filed in the United States District Court for the District of Massachusetts against the Company, several members of our Board of Directors and our Chief Financial Officer, among others. The complaint was brought under the Securities Act of 1933 and sought certification of a class of plaintiffs comprised of all shareholders that acquired stock issued by the Company in its initial public offering in March 2017. The plaintiffs sought compensation for losses they incurred since purchasing the stock. Following the filing of this lawsuit, two additional, similar actions were brought in the same court. The three matters were eventually consolidated, and a lead plaintiff was appointed by the court. On March 9, 2018, an amended complaint was filed. The Company has not yet filed a responsive pleading in the matter, entitled The Pension Trust v. J.Jill, Inc., et al., and no material amount has been accrued. The Company believes the claims in the case are without merit and intends to defend the matter vigorously.
We are not presently party to any other legal proceedings the resolution of which we believe would have a material adverse effect on our business, financial condition, operating results or cash flows. We establish reserves for specific legal matters when we determine that the likelihood of an unfavorable outcome is probable and the loss is reasonably estimable.
Item 4. Mine Safety Disclosures
Not applicable.
28
PART II
Item 5. Market for Registrant's Common Equity, Rel ated Stockholder Matters and Issuer Purchases of Equity Securities
Market Information
Our common stock began trading publicly on the New York Stock Exchange ("NYSE") under the symbol "JILL" on March 9, 2017. Prior to that time, there was no public market for our common stock.
The following table sets forth the high and low sales prices of our common stock as reported on the NYSE for the fiscal 2017 quarters ended:
|
| High |
|
| Low |
| ||
April 29, 2017 |
| $ | 14.40 |
|
| $ | 12.00 |
|
July 29, 2017 |
| $ | 13.71 |
|
| $ | 10.94 |
|
October 29, 2018 |
| $ | 12.43 |
|
| $ | 4.74 |
|
February 3, 2018 |
| $ | 8.95 |
|
| $ | 4.84 |
|
Holders of Record
As of February 9, 2018, there were approximately 24 holders of record of our common stock. This number does not include beneficial owners whose shares are held of record by banks, brokers and other financial institutions.
Dividends
On June 6, 2016, Jill Intermediate LLC, our predecessor entity prior to our conversion to a Delaware corporation, paid a $70.0 million dividend to the partners of JJill Topco Holdings.
Since March 9, 2017, we have not declared or paid any cash dividends. We have no plans to pay cash dividends on shares of our common stock in the foreseeable future. Subject to the foregoing, the payment of cash dividends in the future, if any, will be at the discretion of our board of directors and will depend upon such factors as earnings levels, capital requirements, restrictions imposed by applicable law, our overall financial condition, restrictions in our debt agreements, including our Term Loan and ABL Facility, and any other factors deemed relevant by our board of directors. As a holding company, our ability to pay dividends depends on our receipt of cash dividends from our operating subsidiaries, which may further restrict our ability to pay dividends as a result of restrictions on their ability to pay dividends to us under our Term Loan, our ABL Facility and under future indebtedness that we or they may incur. See "Management's Discussion and Analysis of Financial Condition and Results of Operations-Liquidity and Capital Resources-Credit Facilities."
Performance Graph
The following graph shows a comparison from March 9, 2017 (the date our common stock commenced trading on the NYSE) through February 3, 2018 of the cumulative total return for our common stock, the S&P 500 Index and an S&P Retail Index. The graph assumes $100 was invested in each of the Company's common stock, the S&P 500 Index and the S&P Retail Index as of the market close on March 9, 2017. Such returns are based on historical results and are not intended to suggest future performance.
29
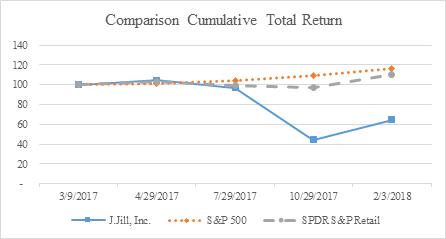
Recent Sales of Unregistered Securities
None.
Purchases of Equity Securities by the Issuer and Affiliated Purchasers
None.
Securities Authorized for Issuance Under Equity Compensation Plans
Information regarding our equity compensation plans is set forth in Item 12, Security Ownership of Certain Beneficial Owners and Management and Related Shareholder Matters.
Item 6. Selected Financial Data
The following tables present our selected consolidated financial and other data as of and for the periods indicated. As more fully described below, the periods are presented as "Predecessor" or "Successor", depending on whether they relate to periods preceding or periods succeeding the acquisition of all of our outstanding equity interests on May 8, 2015. The selected consolidated statements of operations data for the fiscal years ended February 3, 2018 (Successor), January 28, 2017 (Successor) and the periods from May 8, 2015 to January 30, 2016 (Successor) and from February 1, 2015 to May 7, 2015 (Predecessor), and the selected consolidated balance sheet data as of February 3, 2018 (Successor) and January 28, 2017 (Successor) are derived from our audited consolidated financial statements included elsewhere in this Annual Report on Form 10-K. We have derived the selected consolidated balance sheet data as of January 30, 2016 (Successor), January 31, 2015 (Predecessor) and February 1, 2014 (Predecessor) and the consolidated statement of operations data for the fiscal years ended January 31, 2015 (Predecessor) and February 1, 2014 (Predecessor) from our audited consolidated financial statements, which are not included in this Annual Report on Form 10-K. Our historical audited results are not necessarily indicative of the results that should be expected in any future period.
On May 8, 2015, an investment vehicle of investment funds affiliated with TowerBrook Capital Partners L.P. acquired all of our outstanding equity interests through the newly formed entities JJill Holdings, Inc. ("JJill Holdings") and JJill Topco Holdings, LP ("JJill Topco Holdings"). We refer to such acquisition and the related financing transactions as the "Acquisition." As a result of the Acquisition and related change in control, JJill Holdings applied purchase accounting as of May 8, 2015. We elected to push down the effects of the Acquisition to our consolidated financial statements. As such, the financial information provided in this Annual Report on Form 10-K is presented as "Predecessor" or "Successor" to indicate whether they relate to the period preceding the Acquisition or the period succeeding the Acquisition, respectively. Due to the change in the basis of accounting resulting from the Acquisition, the consolidated financial statements for the Predecessor periods and the consolidated financial statements for the Successor periods, included elsewhere in this Annual Report on Form 10-K are not necessarily comparable.
For purposes of presenting a comparison of our fiscal year 2017, 2016 and fiscal year 2014 results, in addition to standalone results for the 2015 Successor Period and 2015 Predecessor Period, we have also presented supplemental
30
unaudited pro forma consolidated financial and other data for the fiscal year ended January 30, 2016. The unaudited pro forma consolidated statement of operations for the fiscal year ended January 30, 2016 has been derived from the historical audited statements of operations included elsewhere in this Annual Report on Form 10-K, and represents the addition of the 2015 Successor Period and the 2015 Predecessor Period and gives effect to certain trans actions, as described in "Management Discussion and Analysis of Financial Condition and Results of Operations – Supplemental Unaudited Pro Forma Consolidated Financial Information" contained elsewhere in this Annual Report on Form 10-K, as if they had occu rred on February 1, 2015. We believe that this presentation provides meaningful information about our results of operations on a period to period basis. The unaudited pro forma consolidated statement of operations is presented for illustrative purposes and does not purport to represent what the results of operations would actually have been if the transactions had occurred as of the date indicated or what the results of operations would be for any future periods.
The selected historical financial data presented below does not purport to project our financial position or results of operations for any future date or period and should be read together with "Management's Discussion and Analysis of Financial Condition and Results of Operations," and our consolidated financial statements and related notes thereto included elsewhere in this Annual Report on Form 10-K.
31
|
| Successor |
|
|
| Predecessor |
|
| Pro Forma (1) |
|
| Predecessor |
| ||||||||||||||||
(in thousands, except share and per share data) |
| For the Fiscal Year Ended February 3, 2018 |
|
| For the Fiscal Year Ended January 28, 2017 |
|
| For the Period from May 8, 2015 to January 30, 2016 |
|
|
| For the Period from February 1, 2015 to May 7, 2015 |
|
| For the Fiscal Year Ended January 30, 2016 |
|
| For the Fiscal Year Ended January 31, 2015 |
|
| For the Fiscal Year Ended February 1, 2014 |
| |||||||
Statements of Operations Data: |
|
|
|
|
|
|
|
|
|
|
|
|
|
|
|
|
|
|
|
|
|
|
|
|
|
|
|
|
|
Net sales |
| $ | 698,145 |
|
| $ | 639,056 |
|
| $ | 420,094 |
|
|
| $ | 141,921 |
|
| $ | 562,015 |
|
| $ | 483,400 |
|
| $ | 456,026 |
|
Costs of goods sold |
|
| 234,065 |
|
|
| 211,117 |
|
|
| 155,091 |
|
|
|
| 44,232 |
|
|
| 188,852 |
|
|
| 164,792 |
|
|
| 161,261 |
|
Gross profit |
|
| 464,080 |
|
|
| 427,939 |
|
|
| 265,003 |
|
|
|
| 97,689 |
|
|
| 373,163 |
|
|
| 318,608 |
|
|
| 294,765 |
|
Selling, general and administrative expenses |
|
| 394,893 |
|
|
| 368,525 |
|
|
| 246,482 |
|
|
|
| 80,151 |
|
|
| 331,752 |
|
|
| 279,557 |
|
|
| 267,319 |
|
Acquisition-related expenses |
|
| - |
|
|
| - |
|
|
| 8,560 |
|
|
|
| 13,341 |
|
|
| - |
|
|
| - |
|
|
| - |
|
Operating income |
|
| 69,187 |
|
|
| 59,414 |
|
|
| 9,961 |
|
|
|
| 4,197 |
|
|
| 41,411 |
|
|
| 39,051 |
|
|
| 27,446 |
|
Interest expense |
|
| 19,261 |
|
|
| 18,670 |
|
|
| 11,893 |
|
|
|
| 4,599 |
|
|
| 16,893 |
|
|
| 17,895 |
|
|
| 19,064 |
|
Income (loss) before provision for income taxes |
|
| 49,926 |
|
|
| 40,744 |
|
|
| (1,932 | ) |
|
|
| (402 | ) |
|
| 24,518 |
|
|
| 21,156 |
|
|
| 8,382 |
|
Income tax (benefit) provision |
|
| (5,439 | ) |
|
| 16,669 |
|
|
| 2,322 |
|
|
|
| 1,499 |
|
|
| 10,223 |
|
|
| 10,860 |
|
|
| 3,884 |
|
Net income (loss) |
| $ | 55,365 |
|
| $ | 24,075 |
|
| $ | (4,254 | ) |
|
| $ | (1,901 | ) |
| $ | 14,295 |
|
| $ | 10,296 |
|
| $ | 4,498 |
|
Net income (loss) per common share attributable to common shareholders (1) : |
|
|
|
|
|
|
|
|
|
|
|
|
|
|
|
|
|
|
|
|
|
|
|
|
|
|
|
|
|
Basic |
| $ | 1.32 |
|
| $ | 0.55 |
|
| $ | (0.10 | ) |
|
| $ | (0.04 | ) |
| $ | 0.33 |
|
| $ | 0.24 |
|
| $ | 0.10 |
|
Diluted |
| $ | 1.27 |
|
| $ | 0.55 |
|
| $ | (0.10 | ) |
|
| $ | (0.04 | ) |
| $ | 0.33 |
|
| $ | 0.24 |
|
| $ | 0.10 |
|
Weighted average number of common shares outstanding (1) : |
|
|
|
|
|
|
|
|
|
|
|
|
|
|
|
|
|
|
|
|
|
|
|
|
|
|
|
|
|
Basic |
|
| 41,926,157 |
|
|
| 43,747,944 |
|
|
| 43,747,944 |
|
|
|
| 43,747,944 |
|
|
| 43,747,944 |
|
|
| 43,747,944 |
|
|
| 43,747,944 |
|
Diluted |
|
| 43,571,746 |
|
|
| 43,747,944 |
|
|
| 43,747,944 |
|
|
|
| 43,747,944 |
|
|
| 43,747,944 |
|
|
| 43,747,944 |
|
|
| 43,747,944 |
|
32
Other Financial Data: |
|
|
|
|
|
|
|
|
|
|
|
|
|
|
|
|
|
|
|
|
|
|
|
|
|
|
|
|
|
Adjusted EBITDA (2) |
| $ | 113,476 |
|
| $ | 106,220 |
|
| $ | 59,699 |
|
|
| $ | 23,672 |
|
| $ | 81,955 |
|
| $ | 65,720 |
|
| $ | 54,241 |
|
Adjusted EBITDA margin (3) |
|
| 16.3 | % |
|
| 16.6 | % |
|
| 14.2 | % |
|
|
| 16.7 | % |
|
| 14.6 | % |
|
| 13.6 | % |
|
| 11.9 | % |
|
| Successor |
|
| Predecessor |
| ||||||||||||||
(in thousands) |
| February 3, 2018 |
|
| January 28, 2017 |
|
| January 30, 2016 |
|
| January 31, 2015 |
|
| February 1, 2014 |
| |||||
Balance Sheet data (at end of period): |
|
|
|
|
|
|
|
|
|
|
|
|
|
|
|
|
|
|
|
|
Cash |
| $ | 25,978 |
|
| $ | 13,468 |
|
| $ | 27,505 |
|
| $ | 604 |
|
| $ | 518 |
|
Net operating assets and liabilities (4) |
|
| 3,769 |
|
|
| 6,414 |
|
|
| 3,477 |
|
|
| (8,055 | ) |
|
| (7,472 | ) |
Total assets |
|
| 597,557 |
|
|
| 568,305 |
|
|
| 582,032 |
|
|
| 278,232 |
|
|
| 259,735 |
|
Current and non-current portions of long-term debt, net of discount and debt issuance cost |
|
| 241,680 |
|
|
| 267,239 |
|
|
| 239,978 |
|
|
| 82,369 |
|
|
| 94,153 |
|
Preferred capital |
|
| - |
|
|
| - |
|
|
| - |
|
|
| 72,824 |
|
|
| 72,824 |
|
Total equity |
|
| 179,316 |
|
|
| 122,864 |
|
|
| 166,571 |
|
|
| (1,317 | ) |
|
| (16,765 | ) |
(1) | See "Management Discussion and Analysis of Financial Condition and Results of Operations Supplemental Unaudited Pro Forma Consolidated Financial Information" for information regarding our presentation of the pro forma fiscal year ended January 30, 2016. Pro forma adjustments do not impact the weighted average number of basic or diluted common shares outstanding during the period. Accordingly, basic and diluted EPS for the pro forma fiscal year ended January 30, 2016 is impacted only as a result of pro forma adjustments to net income attributable to common shareholders. |
(2) | Adjusted EBITDA represents net income (loss) plus interest expense, income tax (benefit) provision, depreciation and amortization, the amortization of the step-up to fair value of merchandise inventory resulting from the application of a purchase accounting adjustment related to the Acquisition, certain Acquisition-related expenses, sponsor fees, equity-based compensation expense, write-off of property and equipment and other non-recurring expenses, primarily consisting of outside legal and professional fees associated with certain non-recurring transactions and events. We present Adjusted EBITDA on a consolidated basis because our management uses it as a supplemental measure in assessing our operating performance, and we believe that it is helpful to investors, securities analysts and other interested parties as a measure of our comparative operating performance from period to period. Adjusted EBITDA is not a measurement of financial performance under GAAP. It should not be considered an alternative to net income (loss) as a measure of our operating performance or any other measure of performance derived in accordance with GAAP. In addition, Adjusted EBITDA should not be construed as an inference that our future results will be unaffected by unusual or nonrecurring items, or affected by similar nonrecurring items. Adjusted EBITDA has limitations as an analytical tool, and you should not consider such measure either in isolation or as a substitute for analyzing our results as reported under GAAP. Our definition and calculation of Adjusted EBITDA is not necessarily comparable to other similarly titled measures used by other companies due to different methods of calculation. We recommend that you review the reconciliation of Adjusted EBITDA to net income (loss), the most directly comparable GAAP financial measure, under "Management Discussion and Analysis of Financial Condition and Result of Operations - Reconciliation of Net Income to Adjusted EBITDA and Calculation of Adjusted EBITDA Margin" and not rely solely on Adjusted EBITDA or any single financial measure to evaluate our business. |
(3) | Adjusted EBITDA margin is defined as Adjusted EBITDA divided by net sales. We recommend that you review the calculation of Adjusted EBITDA margin, under "Management Discussion and Analysis of Financial Condition and Result of Operations Reconciliation of Net Income to Adjusted EBITDA and Calculation of Adjusted EBITDA Margin." |
(4) | Net operating assets and liabilities consist of current assets excluding cash, less current liabilities excluding the current portion of long-term debt. |
33
Item 7. Management's Discussion and Analysis o f Financial Condition and Results of Operations
The following discussion and analysis should be read in conjunction with our consolidated financial statements and related notes thereto included elsewhere in this Annual Report on Form 10-K, as well as the information presented under "Selected Financial Data." The following discussion contains forward-looking statements that reflect our plans, estimates and assumptions. Our actual results could differ materially from those discussed in the forward-looking statements. Factors that could cause such differences are discussed in the sections of this Annual Report on Form 10-K titled "Risk Factors" and "Cautionary Note Regarding Forward-Looking Statements."
We operate on a 52- or 53-week fiscal year that ends on the Saturday that is closest to January 31. Each fiscal year generally is comprised of four 13-week fiscal quarters, although in the years with 53 weeks, the fourth quarter represents a 14-week period. Fiscal year 2017 ended on February 3, 2018 and was comprised of 53 weeks while fiscal years 2016 and 2015 ended on January 28, 2017 and January 30, 2016 respectively, and were each comprised of 52 weeks.
Overview
J.Jill is a premier omnichannel retailer and nationally recognized women's apparel brand committed to delighting customers with great wear-now product. The brand represents an easy, relaxed, inspired style that reflects the confidence and comfort of a woman with a rich, full life. J.Jill provides guiding service through more than 270 stores nationwide and a robust e-commerce platform. J.Jill is headquartered outside Boston.
Factors Affecting Our Operating Results
Various factors are expected to continue to affect our results of operations going forward, including the following:
Overall Economic Trends . Consumer purchases of clothing and other merchandise generally decline during recessionary periods and other periods when disposable income is adversely affected, and consequently our results of operations may be affected by general economic conditions. For example, reduced consumer confidence and lower availability and higher cost of consumer credit may reduce demand for our merchandise and may limit our ability to increase or sustain prices. The growth rate of the market could be affected by macroeconomic conditions in the United States.
Consumer Preferences and Fashion Trends . Our ability to maintain our appeal to existing customers and attract new customers depends on our ability to anticipate fashion trends. During periods in which we have successfully anticipated fashion trends, we have generally had more favorable results.
Competition . The retail industry is highly competitive and retailers compete based on a variety of factors, including design, quality, price and customer service. Levels of competition and the ability of our competitors to more accurately predict fashion trends and otherwise attract customers through competitive pricing or other factors may impact our results of operations.
Our Strategic Initiatives . Our business will continue to have an impact on our results of operations, including our newly re-platformed e-commerce site, merchandise financial planning system, and brand voice initiatives. Although these initiatives are designed to create growth in our business and continuing improvement in our operating results, the timing of expenditures related to these initiatives, as well as the achievement of returns on our investments, may affect our results of operation in future periods.
Pricing and Changes in Our Merchandise Mix . Our product offering changes from period to period, as do the prices at which goods are sold and the margins we are able to earn from the sales of those goods. The levels at which we are able to price our merchandise are influenced by a variety of factors, including the quality of our products, cost of production, prices at which our competitors are selling similar products and the willingness of our customers to pay for products.
How We Assess the Performance of Our Business
In assessing the performance of our business, we consider a variety of financial and operating metrics, including GAAP and non-GAAP measures, including the following:
Net sales consists primarily of revenues, net of merchandise returns and discounts, generated from the sale of apparel and accessory merchandise through our retail channel and direct channel. Net sales also include shipping and handling fees
34
collected from customers. Revenue from our retail channel is recognized at the time of sale and revenue from our direct channel is recognized upon receipt of merchandise by the customer.
Net sales are impacted by the size of our active customer base, product assortment and availability, marketing and promotional activities and the spending habits of our customers. Net sales are also impacted by the migration of single-channel customers to omnichannel customers who, on average, spend nearly three times more than single channel customers.
Total company comparable sales includes net sales from our full-price stores that have been open for more than 52 weeks and from our direct channel. This measure highlights the performance of existing stores open during the period, while excluding the impact of new store openings and closures. When a store in the total company comparable store base is temporarily closed for remodeling or other reasons, it is included in total company comparable sales only using the full weeks it was open. Certain of our competitors and other retailers may calculate total company comparable sales differently than we do. As a result, the reporting of our total company comparable sales may not be comparable to sales data made available by other companies.
Number of stores reflects all stores open at the end of a reporting period. In connection with opening new stores, we incur pre-opening costs. Pre-opening costs include expenses incurred prior to opening a new store and primarily consist of payroll, travel, training, marketing, initial opening supplies and costs of transporting initial inventory and fixtures to store locations, as well as occupancy costs incurred from the time of possession of a store site to the opening of that store. These pre-opening costs are included in selling, general and administrative expenses and are generally incurred and expensed within 30 days of opening a new store.
Gross profit is equal to our net sales less costs of goods sold. Gross profit as a percentage of our net sales is referred to as gross margin. Costs of goods sold includes the direct costs of sold merchandise, inventory shrinkage, and adjustments and reserves for excess, aged and obsolete inventory. We review our inventory levels on an ongoing basis to identify slow-moving merchandise and use product markdowns to efficiently sell these products. Changes in the assortment of our products may also impact our gross profit. The timing and level of markdowns are driven by customer acceptance of our merchandise. Certain of our competitors and other retailers may report costs of goods sold differently than we do. As a result, the reporting of our gross profit and gross margin may not be comparable to other companies.
The primary drivers of the costs of goods sold are raw materials, which fluctuate based on certain factors beyond our control, including labor conditions, transportation or freight costs, energy prices, currency fluctuations and commodity prices. We place orders with merchandise suppliers in United States dollars and, as a result, are not exposed to significant foreign currency exchange risk.
Selling, general and administrative expenses include all operating costs not included in costs of goods sold. These expenses include all payroll and related expenses, occupancy costs and other operating expenses related to our stores and to our operations at our headquarters, including utilities, depreciation and amortization. These expenses also include marketing expense, including catalog production and mailing costs, warehousing, distribution and shipping costs, customer service operations, consulting and software services, professional services and other administrative costs.
Our historical revenue growth has been accompanied by increased selling, general and administrative expenses. The most significant increases were in occupancy costs associated with retail store expansion, and in marketing and payroll investments. While we expect these expenses to increase as we continue to open new stores, increase brand awareness and grow our business, we believe these expenses will decrease as a percentage of net sales over time.
Adjusted EBITDA and Adjusted EBITDA Margin . Adjusted EBITDA represents net income (loss) plus interest expense, provision (benefit) for income taxes, depreciation and amortization, the amortization of the step-up to fair value of merchandise inventory resulting from the application of a purchase accounting adjustment related to the Acquisition, certain Acquisition-related expenses, sponsor fees, equity-based compensation expense, write-off of property and equipment, prior period adjustment for tenant allowances, and other non-recurring expenses, primarily consisting of outside legal and professional fees associated with certain non-recurring transactions and events. We present Adjusted EBITDA on a consolidated basis because our management uses it as a supplemental measure in assessing our operating performance, and we believe that it is helpful to investors, securities analysts and other interested parties as a measure of our comparative operating performance from period to period. We also use Adjusted EBITDA as one of the primary methods for planning and forecasting overall expected performance of our business and for evaluating on a quarterly and annual basis actual results against such expectations. Further, we recognize Adjusted EBITDA as a commonly used measure in determining business value and as such, use it internally to report results. Adjusted EBITDA margin represents, for any period, Adjusted EBITDA as a percentage of net sales.
35
While we believe that Adjusted EBIT DA is useful in evaluating our business, Adjusted EBITDA is a non-GAAP financial measure that has limitations as an analytical tool. Adjusted EBITDA should not be considered an alternative to, or substitute for, net income (loss), which is calculated in ac cordance with GAAP. In addition, other companies, including companies in our industry, may calculate Adjusted EBITDA differently or not at all, which reduces the usefulness of Adjusted EBITDA as a tool for comparison. We recommend that you review the recon ciliation and calculation of Adjusted EBITDA and Adjusted EBITDA margin to net income (loss), the most directly comparable GAAP financial measure, below and not rely solely on Adjusted EBITDA or any single financial measure to evaluate our business.
Reconciliation of Net Income to Adjusted EBITDA and Calculation of Adjusted EBITDA Margin
The following table provides a reconciliation of net income (loss) to Adjusted EBITDA and the calculation of Adjusted EBITDA margin for the periods presented:
|
| Successor |
|
|
| Predecessor |
|
|
| Pro Forma |
|
| |||||||||||
(in thousands) |
| For the Fiscal Year Ended February 3, 2018 |
|
| For the Fiscal Year Ended January 28, 2017 |
|
| For the Period from May 8, 2015 to January 30, 2016 |
|
|
| For the Period from February 1, 2015 to May 7, 2015 |
|
|
| For the Year Ended January 30, 2016 |
|
| |||||
Statements of Operations Data: |
|
|
|
|
|
|
|
|
|
|
|
|
|
|
|
|
|
|
|
|
|
|
|
Net income (loss) |
| $ | 55,365 |
|
| $ | 24,075 |
|
| $ | (4,254 | ) |
|
| $ | (1,901 | ) |
|
| $ | 14,295 |
|
|
Interest expense |
|
| 19,261 |
|
|
| 18,670 |
|
|
| 11,893 |
|
|
|
| 4,599 |
|
|
|
| 16,893 |
|
|
Income tax (benefit) provision |
|
| (5,439 | ) |
|
| 16,669 |
|
|
| 2,322 |
|
|
|
| 1,499 |
|
|
|
| 10,223 |
|
|
Depreciation and amortization |
|
| 35,052 |
|
|
| 36,219 |
|
|
| 28,702 |
|
|
|
| 5,147 |
|
|
|
| 37,802 |
|
|
Inventory step-up (a) |
|
| - |
|
|
| - |
|
|
| 10,471 |
|
|
|
| - |
|
|
|
| - |
|
|
Acquisition-related expenses (b) |
|
| - |
|
|
| - |
|
|
| 8,560 |
|
|
|
| 13,341 |
|
|
|
| - |
|
|
Sponsor fees (c) |
|
| - |
|
|
| - |
|
|
| - |
|
|
|
| 250 |
|
|
|
| - |
|
|
Equity-based compensation expense (d) |
|
| 782 |
|
|
| 624 |
|
|
| 168 |
|
|
|
| 441 |
|
|
|
| 609 |
|
|
Write-off of property and equipment (e) |
|
| 586 |
|
|
| 385 |
|
|
| 237 |
|
|
|
| 112 |
|
|
|
| 349 |
|
|
Impairment of long lived assets (f) |
|
| 2,164 |
|
|
| - |
|
|
| - |
|
|
|
| - |
|
|
|
| - |
|
|
Special bonus |
|
| 624 |
|
|
| - |
|
|
| - |
|
|
|
| - |
|
|
|
| - |
|
|
Other non-recurring expenses (g) |
|
| 5,081 |
|
|
| 9,741 |
|
|
| 1,600 |
|
|
|
| 184 |
|
|
|
| 1,784 |
|
|
Prior period adjustment for tenant allowance (h) |
|
| - |
|
|
| (163 | ) |
|
| - |
|
|
|
| - |
|
|
|
| - |
|
|
Adjusted EBITDA |
| $ | 113,476 |
|
| $ | 106,220 |
|
| $ | 59,699 |
|
|
| $ | 23,672 |
|
|
| $ | 81,955 |
|
|
Net sales |
| $ | 698,145 |
|
| $ | 639,056 |
|
| $ | 420,094 |
|
|
| $ | 141,921 |
|
|
| $ | 562,015 |
|
|
Adjusted EBITDA margin |
|
| 16.3 | % |
|
| 16.6 | % |
|
| 14.2 | % |
|
|
| 16.7 | % |
|
|
| 14.6 | % |
|
| (a) | Represents the impact to costs of goods sold resulting from the amortization of the step-up to fair value of merchandise inventory resulting from the application of a purchase accounting adjustment related to the Acquisition. |
| (b) | Represents transaction costs incurred in connection with the Acquisition, consisting substantially of legal and advisory fees, which are not expected to recur. |
| (c) | Represents management fees charged by our previous equity sponsors. |
| (d) | Represents expenses associated with equity incentive units granted to our management. Prior to the Acquisition, incentive units were accounted for as a liability-classified award and the related compensation expense was recognized based on changes in the intrinsic value of the award at each reporting period. Subsequent to the Acquisition, new incentive units were granted to management and are accounted for as equity-classified awards with the related compensation expense recognized based on fair value at the date of the grants. |
| (e) | Represents the net loss on the disposal of fixed assets. |
| (f) | Represents the impairment of assets associated with three underperforming stores. |
| (g) | Represents items management believes are not indicative of ongoing operating performance. These expenses are primarily composed of legal and professional fees associated with non-recurring events. The pro forma fiscal year 2015 expenses are primarily due to legal, accounting, and professional fees incurred in connection with the initial public offering of our common shares in March 2017. |
| (h) | Represents the prior period correction to recognize lease incentives as reductions of rental expense by the lessee on a straight-line basis over the term of the new lease, in accordance with ASC 840. |
36
Factors Affecting the Comparability of our Results of Operations
On May 8, 2015, an investment vehicle of investment funds affiliated with TowerBrook Capital Partners L.P. acquired all of our outstanding equity interests through the newly formed entities JJill Holdings, Inc. ("JJill Holdings") and JJill Topco Holdings, LP ("JJill Topco Holdings"). We refer to such acquisition and the related financing transactions as the "Acquisition." JJill Holdings acquired approximately 94% of the outstanding interests of Jill Intermediate LLC, our predecessor entity, and JJill Topco Holdings acquired the remaining 6% of the outstanding interests of Jill Intermediate LLC in the Acquisition. The purchase price was $396.4 million, which consisted of $386.3 million of cash consideration and $10.1 million of noncash consideration in the form of an equity rollover by Jill Intermediate LLC's predecessor management owners. The Acquisition was funded through an equity contribution by JJill Holdings and JJill Topco Holdings and borrowings under our seven-year $250.0 million Term Loan, as described under "Credit Facilities" below.
JJill Holdings accounted for the Acquisition as a business combination under the acquisition method of accounting. Accordingly, the purchase price was allocated to the assets acquired and liabilities assumed based on their estimated fair values at the date of Acquisition.
We have elected to push down the effects of the Acquisition to our consolidated financial statements. As such, the financial information provided in this Annual Report on Form 10-K is presented as "Predecessor" or "Successor" to indicate whether they relate to the period preceding the Acquisition or the period succeeding the Acquisition, respectively. The financial information for all periods after May 7, 2015 represents the financial information of the Successor. Prior to, and including, May 7, 2015, the consolidated financial statements, included elsewhere in this Annual Report on Form 10-K, include the accounts of the Predecessor.
Due to the change in the basis of accounting resulting from the Acquisition, the Predecessor's consolidated financial statements and the Successor's consolidated financial statements, included elsewhere in this Annual Report on Form 10-K, are not comparable. See our historical audited consolidated financial statements and the related notes thereto included elsewhere in this Annual Report on Form 10-K for additional information regarding the Acquisition.
On February 24, 2017, we completed a conversion from a Delaware limited liability company named Jill Intermediate LLC into a Delaware corporation and changed our name to J.Jill, Inc. In conjunction with the conversion, all of our outstanding equity interests converted into shares of common stock. Accordingly, all historical earnings per share amounts presented in the accompanying consolidated statements of operations and comprehensive income (loss) and the related notes to the consolidated financial statements have been adjusted retroactively to reflect our conversion from a limited liability company to a corporation.
Following our conversion from a limited liability company to a corporation, J.Jill, Inc. merged with and into its direct parent company, JJill Holdings, on February 24, 2017, with J.Jill, Inc. continuing as the surviving entity. JJill Holdings did not have operations of its own, except for buyer transaction costs of $8,560 incurred to execute the Acquisition.
On May 27, 2016, we entered into an agreement to amend our Term Loan to borrow an additional $40.0 million. The other terms and conditions of the Term Loan remained substantially unchanged, as discussed in "Liquidity and Capital Resources-Credit Facilities." We used the additional loan proceeds, along with cash on hand, to fund a $70.0 million dividend to the partners of JJill Topco Holdings, which was approved by the members of Jill Intermediate LLC and the board of directors of JJill Topco Holdings on May 27, 2016.
On January 18, 2017 and June 1, 2017, we made voluntary prepayments of $10.1 million and $20.2 million, including accrued interest, on our Term Loan. On December 15, 2017, we repurchased $5.0 million of our Term Loan on the open market at 98% of par value.
37
Results of Operations
Fiscal Year Ended February 3, 2018, which is comprised of 53 weeks, compared to the 52 week period ended January 28, 2017.
The following table summarizes our consolidated results of operations for the periods indicated:
|
| Successor |
| |||||||||||||
|
| For the Fiscal Year Ended February 3, 2018 |
|
| For the Fiscal Year Ended January 28, 2017 |
| ||||||||||
(in thousands) |
| Dollars |
|
| % of Net Sales |
|
| Dollars |
|
| % of Net Sales |
| ||||
Net sales |
| $ | 698,145 |
|
|
| 100.0 | % |
| $ | 639,056 |
|
|
| 100.0 | % |
Costs of goods sold |
|
| 234,065 |
|
|
| 33.5 | % |
|
| 211,117 |
|
|
| 33.0 | % |
Gross profit |
|
| 464,080 |
|
|
| 66.5 | % |
|
| 427,939 |
|
|
| 67.0 | % |
Selling, general and administrative expenses |
|
| 394,893 |
|
|
| 56.6 | % |
|
| 368,525 |
|
|
| 57.7 | % |
Operating income |
|
| 69,187 |
|
|
| 9.9 | % |
|
| 59,414 |
|
|
| 9.3 | % |
Interest expense |
|
| 19,261 |
|
|
| 2.8 | % |
|
| 18,670 |
|
|
| 2.9 | % |
Income before provision for income taxes |
|
| 49,926 |
|
|
| 7.1 | % |
|
| 40,744 |
|
|
| 6.4 | % |
Income tax (benefit) provision |
|
| (5,439 | ) |
|
| (0.8 | )% |
|
| 16,669 |
|
|
| 2.6 | % |
Net income |
| $ | 55,365 |
|
|
| 7.9 | % |
| $ | 24,075 |
|
|
| 3.8 | % |
Net Sales
Net sales for fiscal year ended February 3, 2018 ("fiscal year 2017") increased $59.1 million, or 9.2%, to $698.1 million, from $639.1 million for fiscal year ended January 28, 2017 ("fiscal year 2016"). This increase was primarily due to an increase in total comparable company sales of 6.4%, which was substantially driven by a 6.8% increase in our active customer base.
Our direct channel was responsible for 43% of our net sales in fiscal year 2017 compared to 43% in fiscal year 2016. Our retail channel was responsible for 57% of our net sales in fiscal year 2017 and 57% in fiscal year 2016. We operated 276 and 275 retail stores at the end of these same periods, respectively.
Gross Profit and Cost of Goods Sold
Gross profit for fiscal year 2017 increased $36.1 million, or 8.5%, to $464.1 million, from $427.9 million for fiscal year 2016. This increase was due primarily to the increase in net sales of 9.2% offset by a decrease in gross margin for fiscal year 2017 to 66.5% from 67.0% for fiscal year 2016. The decrease in gross margin was primarily due to an increase in promotional discounts to clear merchandise.
Selling, General and Administrative Expenses
Selling, general and administrative expenses for fiscal year 2017 increased $26.4 million, or 7.2%, to $394.9 million from $368.5 million for fiscal year 2016. As a percentage of net sales, selling, general and administrative expenses for fiscal year 2017 were 56.6% as compared to 57.7% for fiscal year 2016. The increase was primarily due to higher sales related expenses of $16.1 million, increased marketing costs of $7.9 million and increased corporate payroll and other expenses of $6.5 million to support business initiatives, costs associated with our transition to a public company and one-time costs resulting from the impairment of retail store assets. This increase was offset by decreases related to depreciation and amortization expense of $2.0 million and a decrease in incentive compensation expense of $2.1 million.
Interest Expense
Interest expense for fiscal year 2017 increased by $0.6 million, or 3.2%, to $19.3 million from $18.7 million for fiscal year 2016. The increase in interest expense was due to higher interest rates, and higher amortization of deferred financing costs resulting from voluntary Term Loan prepayments totaling $25.0 million during fiscal year 2017.
38
Provision for Income Taxes
The income tax benefit for fiscal year 2017 was $5.4 million compared to an income tax provision of $16.7 million for fiscal year 2016. On December 22, 2017, the U.S. Tax Cuts and Jobs Act (TCJA) legislation was signed. The new U.S. tax legislation is subject to a number of provisions, including a reduction of the U.S. federal corporate income tax rate from 35.0% to 21.0% (effective January 1, 2018) and a change in certain business deductions, including allowing for immediate expensing of certain qualified capital expenditures. As a result of TCJA, the Company recognized a tax benefit of $24.0 million related to the remeasurement of deferred tax assets and liabilities. The Company's effective tax benefit rate for fiscal year 2017 was 10.9%. The Company's effective tax rate for fiscal year 2017, after excluding the $24.0 million impact of revaluing deferred tax liabilities, was 37.2%. The Company's effective tax rate for fiscal year 2016 was 40.9%.
Fiscal year ended, January 28, 2017 compared to the period from May 8, 2015 through January 30, 2016 (Successor) and Period from February 1, 2015 to May 7, 2015 (Predecessor).
The following table summarizes our consolidated results of operations for the periods indicated:
|
| Successor |
|
|
| Predecessor |
| ||||||||||||||||||
|
| For the Fiscal Year Ended January 28, 2017 |
|
| For the Period May 8, 2015 to January 30, 2016 |
|
|
| For the Period February 1, 2015 to May 7, 2015 |
| |||||||||||||||
(in thousands) |
| Dollars |
|
| % of Net Sales |
|
| Dollars |
|
| % of Net Sales |
|
|
| Dollars |
|
| % of Net Sales |
| ||||||
Net sales |
| $ | 639,056 |
|
|
| 100.0 | % |
| $ | 420,094 |
|
|
| 100.0 | % |
|
| $ | 141,921 |
|
|
| 100.0 | % |
Costs of goods sold |
|
| 211,117 |
|
|
| 33.0 | % |
|
| 155,091 |
|
|
| 36.9 | % |
|
|
| 44,232 |
|
|
| 31.2 | % |
Gross profit |
|
| 427,939 |
|
|
| 67.0 | % |
|
| 265,003 |
|
|
| 63.1 | % |
|
|
| 97,689 |
|
|
| 68.8 | % |
Selling, general and administrative expenses |
|
| 368,525 |
|
|
| 57.7 | % |
|
| 246,482 |
|
|
| 58.7 | % |
|
|
| 80,151 |
|
|
| 56.5 | % |
Acquisition-related expenses |
|
| - |
|
|
|
|
|
|
| 8,560 |
|
|
| 2.0 | % |
|
|
| 13,341 |
|
|
| 9.4 | % |
Operating income |
|
| 59,414 |
|
|
| 9.3 | % |
|
| 9,961 |
|
|
| 2.4 | % |
|
|
| 4,197 |
|
|
| 2.9 | % |
Interest expense |
|
| 18,670 |
|
|
| 2.9 | % |
|
| 11,893 |
|
|
| 2.8 | % |
|
|
| 4,599 |
|
|
| 3.2 | % |
Income (loss) before provision for income taxes |
|
| 40,744 |
|
|
| 6.4 | % |
|
| (1,932 | ) |
|
| (0.4 | )% |
|
|
| (402 | ) |
|
| (0.3 | )% |
Provision for income taxes |
|
| 16,669 |
|
|
| 2.6 | % |
|
| 2,322 |
|
|
| 0.6 | % |
|
|
| 1,499 |
|
|
| 1.1 | % |
Net income (loss) |
| $ | 24,075 |
|
|
| 3.8 | % |
| $ | (4,254 | ) |
|
| (1.0 | )% |
|
| $ | (1,901 | ) |
|
| (1.4 | )% |
Net Sales
Net sales were $639.1 million for the Successor fiscal year ended January 28, 2017 ("fiscal year 2016") compared to $420.1 million for the Successor period from May 8, 2015 to January 30, 2016 ("2015 Successor Period") and $141.9 million for the Predecessor period from February 1, 2015 to May 7, 2015 ("2015 Predecessor Period"). At the end of those same periods, we operated 275, 261 and 250 retail stores, respectively. The increase in net sales in fiscal year 2016 was due to an increase in total comparable company sales, driven by an increase in our active customer base, and an increase in store count.
Our direct channel was responsible for 43% of our net sales in fiscal year 2016, 41% in the 2015 Successor Period and 37% in the 2015 Predecessor Period. Our retail channel was responsible for 57% of our net sales in fiscal year 2016, 59% in the 2015 Successor Period and 63% in the 2015 Predecessor Period.
Gross Profit and Costs of Goods Sold
Gross profit was $427.9 million for fiscal year 2016 compared to $265.0 million for the 2015 Successor Period and $97.7 million for the 2015 Predecessor Period. The increase in fiscal year 2016 was primarily due to an increase in net sales and an increase in costs of goods sold during the 2015 Successor Period resulting from the amortization of the fair value step-up of merchandise inventory reflected in the purchase price allocation at the date of the Acquisition.
39
Selling, General and Administrative Expenses
Selling, general and administrative expenses were $368.5 million for fiscal year 2016 compared to $246.5 million for the 2015 Successor Period and $80.2 million for the 2015 Predecessor Period. The increase in fiscal year 2016 included higher sales related expenses, increased marketing and corporate expenses to support business growth, and costs associated with our initial public offering in March 2017. These increases are partially offset by lower incentive compensation expense.
As a percentage of net sales, selling, general and administrative expenses were 57.7% in fiscal year 2016 compared to 58.7% for the 2015 Successor Period and 56.5% for the 2015 Predecessor Period.
Acquisition-Related Expenses
We incurred acquisition-related expenses of $8.6 million during the 2015 Successor Period and $13.3 million during the 2015 Predecessor Period, consisting primarily of legal and advisory fees. No such costs were incurred during fiscal year 2016.
Interest Expense
Interest expense was $18.7 million for fiscal year 2016 compared to $11.9 million for the 2015 Successor Period and $4.6 million for the 2015 Predecessor Period. The increase in fiscal year 2016 is due to the addition of $40.0 million to our Term Loan pursuant to an amendment on May 27, 2016 and an acceleration of the amortization of deferred financing costs due to a voluntary prepayment on our Term Loan on January 18, 2017.
Provision for Income Taxes
The provision for income taxes was $16.7 million for fiscal year 2016 compared to $2.3 million for the 2015 Successor Period and $1.5 million for the 2015 Predecessor Period. Our effective tax rates for the same periods were 40.9%, (120.2%) and (372.9%), respectively. The increase in fiscal year 2016 was primarily due to higher income (loss) before provision for income taxes. The effective tax rates in the 2015 Successor and Predecessor Periods reflect transaction costs related to the Acquisition, which were not deductible for tax purposes.
Supplemental Unaudited Pro Forma Consolidated Financial Information
The following unaudited pro forma financial information should be read in conjunction with our consolidated financial statements and the related notes thereto, included elsewhere in this Annual Report on Form 10-K.
The unaudited pro forma consolidated statement of operations for the year ended January 30, 2016 has been derived from our consolidated audited statements of operations included elsewhere in this Annual Report on Form 10-K and represents the addition of the Predecessor period from February 1, 2015 through May 7, 2015 and the Successor period from May 8, 2015 through January 30, 2016, and gives effect to the following as if they had occurred on February 1, 2015:
| • | JJill Holdings' acquisition of approximately 94% of the outstanding interests of Jill Intermediate LLC and JJill Topco Holdings' acquisition of approximately 6% of the outstanding interests of Jill Intermediate LLC and our election to push down the effects of the Acquisition to our consolidated financial statements (the "Acquisition"); and |
| • | the related Acquisition financing as provided for under the Term Loan for $250.0 million and the ABL Facility for $40.0 million (the "Financing"). |
The unaudited pro forma consolidated statement of operations does not include the impacts of any revenue, cost or other operating synergies that may result from the Acquisition.
The pro forma adjustments reflect events that are (i) directly attributed to the Acquisition and related Financing; (ii) factually supportable; and (iii) with respect to the pro forma statements of operations, expected to have a continuing impact on the consolidated results.
The unaudited pro forma consolidated financial information presented is based on available information and assumptions we believe are reasonable. The unaudited pro forma consolidated statement of operations is presented for illustrative purposes and does not purport to represent what the results of operations would actually have been if the
40
Acquisition and the related Financing had occurred as of the date indicated or what the results of operations would be for any future periods.
|
| Successor |
|
|
| Predecessor |
|
|
|
|
|
|
| Pro Forma |
| |||
(in thousands) |
| For the period from May 8, 2015 to January 30, 2016 |
|
|
| For the Period from February 1, 2015 to May 7, 2015 |
|
| Pro Forma Adjustments |
|
|
| For the Fiscal Year Ended January 30, 2016 |
| ||||
Net sales |
| $ | 420,094 |
|
|
| $ | 141,921 |
|
| $ | - |
|
|
| $ | 562,015 |
|
Costs of goods sold |
|
| 155,091 |
|
|
|
| 44,232 |
|
|
| (10,471 | ) | (1) |
|
| 188,852 |
|
Gross profit |
|
| 265,003 |
|
|
|
| 97,689 |
|
|
| 10,471 |
|
|
|
| 373,163 |
|
Operating expenses |
|
| 246,482 |
|
|
|
| 80,151 |
|
|
| 2,044 |
| (2) |
|
| 331,752 |
|
|
|
|
|
|
|
|
|
|
|
|
| 1,943 |
| (3) |
|
|
|
|
|
|
|
|
|
|
|
|
|
|
|
| (250 | ) | (4) |
|
|
|
|
|
|
|
|
|
|
|
|
|
|
|
| (34 | ) | (5) |
|
|
|
|
|
|
|
|
|
|
|
|
|
|
|
| 973 |
| (6) |
|
|
|
|
|
|
|
|
|
|
|
|
|
|
|
| 443 |
| (7) |
|
|
|
|
Acquisition-related expenses |
|
| 8,560 |
|
|
|
| 13,341 |
|
|
| (21,901 | ) | (8) |
|
| - |
|
Operating income |
|
| 9,961 |
|
|
|
| 4,197 |
|
|
| 27,253 |
|
|
|
| 41,411 |
|
Interest expense |
|
| 11,893 |
|
|
|
| 4,599 |
|
| 401 |
| (9) |
|
| 16,893 |
| |
Income (loss) before provision for income taxes |
|
| (1,932 | ) |
|
|
| (402 | ) |
|
| 26,852 |
|
|
|
| 24,518 |
|
Provision for income taxes |
|
| 2,322 |
|
|
|
| 1,499 |
|
|
| 6,402 |
| (10) |
|
| 10,223 |
|
Net income (loss) |
| $ | (4,254 | ) |
|
| $ | (1,901 | ) |
| $ | 20,450 |
|
|
| $ | 14,295 |
|
Description of the Acquisition and Financing
On May 8, 2015, JJill Holdings and JJill Topco Holdings completed the Acquisition of the Company. The purchase price of the Acquisition was $396.4 million, which was funded through an equity contribution by JJill Holdings and JJill Topco Holdings and borrowings under our Term Loan. JJill Holdings accounted for the Acquisition as a business combination under the acquisition method of accounting. Accordingly, the purchase price was allocated to the assets acquired and liabilities assumed based on their estimated fair values at the date of Acquisition. We have elected to push down the effects of the Acquisition to our consolidated historical financial statements.
In conjunction with the Acquisition, we entered into a seven-year Term Loan of $250.0 million, which contains certain terms and conditions that require us to comply with financial and other covenants. The Term Loan has a variable interest rate which is based on a rate per annum equal to LIBOR plus 5.0%, with a minimum required LIBOR per annum of 1.0%. The rate per annum was 6.0% at January 30, 2016. The Term Loan is collateralized by all of our assets and contains a provision requiring scheduled quarterly repayments that began October 31, 2015 and that continue until maturity on May 8, 2022.
We also entered into a five-year secured $40.0 million asset-based ABL Facility. Our ABL Facility is collateralized by a first lien on accounts receivable and inventory. Amounts outstanding under the ABL Facility bear interest of LIBOR plus the applicable margin, as defined in the agreement. The ABL Facility consists of revolving loans whereby interest on each revolving loan is payable upon maturity, with durations ranging between 30 to 180 days. Principal is payable upon maturity of the ABL Facility on May 8, 2020. The ABL Facility also requires the payment of monthly fees based on the average quarterly unused portion, as well as a fee on the balance of the outstanding letters of credit.
In securing the Term Loan and the ABL Facility, we incurred financing and issuance costs of $9.6 million. Debt issuance costs are deferred and amortized using the effective interest rate method for the Term Loan and the straight-line method for the ABL Facility. Debt discounts are deferred and amortized using the effective interest rate method over the term of the Term Loan agreement.
Notes to Unaudited Pro Forma Consolidated Statement of Operations Adjustments:
| (1) | Represents the elimination of the increase in costs of goods sold resulting from the amortization of the fair value step-up of merchandise inventory reflected in the purchase price allocation at the date of the Acquisition. |
41
| (2) | Represents the incremental depreciation expense resulting from the increase in fair value of certain fixed assets, reflected in the purchase price allocation at the date of the Acquisition. |
| (3) | Represents the incremental amortization expense resulting from the increase in fair value of certain definite-lived intangible assets, reflected in the purchase price allocation at the date of the Acquisition. |
| (4) | Represents the elimination of the management fee charged by our previous equity sponsor for the period from February 1, 2015 through May 7, 2015. |
| (5) | Represents the net decrease in amortization expense related to recognition of the fair value of favorable/unfavorable leases. |
| (6) | Represents incremental pro forma deferred rent expense resulting from the recalculation of deferred rent expense from the Acquisition. |
| (7) | Represents the incremental compensation expense related to certain management incentive bonuses awarded in connection with the Acquisition. |
| (8) | Represents the elimination of the transaction costs incurred in connection with the Acquisition. |
| (9) | Represents the net change in interest expense. |
| (10) | Represents the income tax effect for the above adjustments reflecting an estimated statutory tax rate of 35%. |
Fiscal Year Ended January 28, 2017 Compared to Pro Forma Fiscal Year Ended January 30, 2016
In addition to the historical analysis of results of operations for the audited historical statements of operations presented for fiscal year 2016, the 2015 Successor Period and the 2015 Predecessor Period, we have also presented a supplemental unaudited pro forma consolidated statement of operations for the fiscal year ended January 30, 2016 ("pro forma fiscal year 2015").
The following table summarizes our consolidated results of operations for the periods indicated:
|
| Successor |
|
| Pro Forma |
|
|
|
|
|
|
|
|
| ||||||||||
(in thousands) |
| For the Fiscal Year Ended January 28, 2017 |
|
| For the Fiscal Year Ended January 30, 2016 |
|
| Change from Pro Forma Year Ended January 30, 2016 to Fiscal Year Ended January 28, 2017 |
| |||||||||||||||
|
| Dollars |
|
| % of Net Sales |
|
| Dollars |
|
| % of Net Sales |
|
| $ Change |
|
| % Change |
| ||||||
Net sales |
| $ | 639,056 |
|
|
| 100.0 | % |
| $ | 562,015 |
|
|
| 100.0 | % |
| $ | 77,041 |
|
|
| 13.7 | % |
Costs of goods sold |
|
| 211,117 |
|
|
| 33.0 | % |
|
| 188,852 |
|
|
| 33.6 | % |
|
| 22,265 |
|
|
| 11.8 | % |
Gross profit |
|
| 427,939 |
|
|
| 67.0 | % |
|
| 373,163 |
|
|
| 66.4 | % |
|
| 54,776 |
|
|
| 14.7 | % |
Selling, general and administrative expenses |
|
| 368,525 |
|
|
| 57.7 | % |
|
| 331,752 |
|
|
| 59.0 | % |
|
| 36,773 |
|
|
| 11.1 | % |
Operating income |
|
| 59,414 |
|
|
| 9.3 | % |
|
| 41,411 |
|
|
| 7.4 | % |
|
| 18,003 |
|
|
| 43.5 | % |
Interest expense |
|
| 18,670 |
|
|
| 2.9 | % |
|
| 16,893 |
|
|
| 3.0 | % |
|
| 1,777 |
|
|
| 10.5 | % |
Income before provision for income taxes |
|
| 40,744 |
|
|
| 6.4 | % |
|
| 24,518 |
|
|
| 4.4 | % |
|
| 16,226 |
|
|
| 66.2 | % |
Provision for income taxes |
|
| 16,669 |
|
|
| 2.6 | % |
|
| 10,223 |
|
|
| 1.8 | % |
|
| 6,446 |
|
|
| 63.1 | % |
Net income |
| $ | 24,075 |
|
|
| 3.8 | % |
| $ | 14,295 |
|
|
| 2.6 | % |
| $ | 9,780 |
|
|
| 68.4 | % |
Net Sales
Net sales for fiscal year 2016 increased $77.0 million, or 13.7%, to $639.1 million, from $562.0 million for pro forma fiscal year 2015. This increase was primarily due to an increase in total comparable company sales of 11.2%, which was substantially driven by an 11.2% increase in our active customer base.
Our direct channel was responsible for 43% of our net sales in fiscal year 2016, an increase from 40% in pro forma fiscal year 2015. Our retail channel was responsible for 57% of our net sales in fiscal year 2016 and 60% in pro forma fiscal year 2015. We operated 275 and 261 retail stores at the end of these same periods, respectively.
42
Gross Profit and Cost of Goods Sold
Gross profit for fiscal year 2016 increased $54.8 million, or 14.7%, to $427.9 million, from $373.2 million for pro forma fiscal year 2015. This increase was due primarily to the increase in net sales of 13.7%. The balance of the increase reflects gross margin for fiscal year 2016 increasing to 67.0% from 66.4% for pro forma fiscal year 2015. The increased gross margin was primarily due to supply chain efficiencies.
Selling, General and Administrative Expenses
Selling, general and administrative expenses for fiscal year 2016 increased $36.8 million, or 11.1%, to $368.5 million from $331.8 million for pro forma fiscal year 2015. As a percentage of net sales, selling, general and administrative expenses for fiscal year 2016 were 57.7% as compared to 59.0% for pro forma fiscal year 2015. These increases related to higher sales related expenses of $15.2 million, increased marketing costs of $11.9 million and increased corporate payroll and other expenses of $17.3 million to support business growth and costs associated with our initial public offering. This increase was offset by decreases related to depreciation and amortization expense of $3.9 million, including deferred rent amortization, and a decrease in incentive compensation expense of $3.8 million.
Interest Expense
Interest expense for fiscal year 2016 increased by $1.8 million, or 10.5%, to $18.7 million from $16.9 million for pro forma fiscal year 2015. The increase in interest expense was due to an increase in the average debt outstanding to $276.7 million during fiscal year 2016 from $249.4 million in pro forma 2015, the increase in average debt was due to an additional $40.0 million of debt incurred in May 2016, and higher amortization of deferred financing costs resulting from a voluntary prepayment on our Term Loan in January 2017.
The average debt balance and weighted average interest rates for pro forma fiscal year 2015 assume our Term Loan and ABL Facility were entered into on February 1, 2015. See "Supplemental Unaudited Pro Forma Consolidated Financial Information," "-Factors Affecting the Comparability of our Results of Operations," "-Liquidity and Capital Resources-Credit Facilities" elsewhere in this Annual Report on Form 10-K for additional information regarding our Term Loan and ABL Facility and the Acquisition.
Provision for Income Taxes
The provision for income taxes for fiscal year 2016 increased by $6.4 million, or 63.1%, to $16.7 million from $10.2 million for pro forma fiscal year 2015. Our effective tax rate was 40.9% for fiscal year 2016 and 41.7% for pro forma fiscal year 2015.
Liquidity and Capital Resources
General
Our primary sources of liquidity and capital resources are cash generated from operating activities and availability under our ABL Facility. Our primary requirements for liquidity and capital are working capital and general corporate needs, including merchandise inventories, marketing, including catalog production and distribution, payroll, store occupancy costs and capital expenditures associated with opening new stores, remodeling existing stores and upgrading information systems and the costs of operating as a public company. We believe that our current sources of liquidity and capital will be sufficient to finance our continued operations for at least the next 12 months. There can be no assurance, however, that our business will generate sufficient cash flows from operations or that future borrowings will be available under our ABL Facility or otherwise to enable us to service our indebtedness, or to make capital expenditures in the future. Our future operating performance and our ability to service or extend our indebtedness will be subject to future economic conditions and to financial, business, and other factors, many of which are beyond our control.
Capital expenditures were $38.4 million in fiscal year 2017 compared to $37.1 million during fiscal year 2016, $26.6 million during the 2015 Successor Period and $7.4 million during the 2015 Predecessor Period. The increase in capital expenditures in fiscal year 2017 was due primarily to an increase in spending on store remodels and technology projects.
43
Cash Flow Analysis
The following table shows our cash flows information for the periods presented:
|
| Successor |
|
|
| Predecessor |
| ||||||||||
(in thousands) |
| For the Fiscal Year Ended February 3, 2018 |
|
| For the Fiscal Year Ended January 28, 2017 |
|
| For the Period from May 8, 2015 to January 30, 2016 |
|
|
| For the Period from February 1, 2015 to May 7, 2015 |
| ||||
Net cash provided by operating activities |
| $ | 76,354 |
|
| $ | 67,200 |
|
| $ | 42,002 |
|
|
| $ | 5,733 |
|
Net cash used in investing activities |
|
| (38,372 | ) |
|
| (37,077 | ) |
|
| (412,303 | ) |
|
|
| (7,406 | ) |
Net cash (used in) provided by financing activities |
|
| (25,472 | ) |
|
| (44,160 | ) |
|
| 397,806 |
|
|
|
| 1,604 |
|
Net Cash provided by Operating Activities
Net cash provided by operating activities during fiscal year 2017 was $76.4 million. Key elements of cash provided by operating activities were (i) net income of $55.4 million, (ii) adjustments to reconcile net income to net cash provided by operating activities of $14.8 million, primarily driven by depreciation and amortization partially offset by the revaluation of deferred income tax liabilities, and (iii) a decrease in net operating assets and liabilities of $6.2 million, primarily driven by an increase in other noncurrent liabilities.
Net cash provided by operating activities during fiscal year 2016 was $67.2 million. Key elements of cash provided by operating activities were (i) net income of $24.1 million, (ii) adjustments to reconcile net income to net cash provided by operating activities of $36.3 million, primarily driven by depreciation and amortization, and (iii) a decrease in net operating assets and liabilities of $6.8 million, primarily driven by increases in other noncurrent liabilities.
Net cash provided by operating activities during the 2015 Successor Period was $42.0 million. Key elements of cash provided by operating activities were (i) net loss of $4.3 million, (ii) adjustments to reconcile net income to net cash provided by operating activities of $36.4 million, primarily driven by depreciation and amortization and amortization of the step-up to fair value of merchandise inventory resulting from the application of a purchase accounting adjustment related to the Acquisition, and (iii) a decrease in net operating assets and liabilities and other activities of $9.9 million, primarily due to a decrease in accounts receivable and an increase in accounts payable as well as an increase in accrued incentive plan expenses resulting from increased earnings, partially offset by increases in taxes receivable, prepaid expenses, and other current assets.
Net cash provided by operating activities during the 2015 Predecessor Period was $5.7 million. Key elements of cash provided by operating activities were (i) net loss of $1.9 million, (ii) adjustments to reconcile net loss to net cash provided by operating activities of $6.7 million, which primarily consisted of depreciation and amortization, and payment-in-kind interest on debt, and (iii) a decrease in net operating assets and liabilities and other activities of $1.0 million, primarily driven by accrued Acquisition expenses paid at the Acquisition date, partially offset by a decrease in accounts payable and increases in accounts receivable and inventories.
Net Cash used in Investing Activities
Net cash used in investing activities during fiscal year 2017 was $38.4 million, representing purchases of property and equipment related to new store openings, remodeling existing stores and upgrading our information systems, including the re-platforming of our e-commerce site and implementation a merchandise financial planning system.
Net cash used in investing activities during fiscal year 2016 was $37.1 million, representing purchases of property and equipment related to new store openings, remodeling existing stores and upgrading our information systems, including our merchandising system.
Net cash used in investing activities during the 2015 Successor Period was $412.3 million, consisting of the $385.7 million of cash paid in connection with the Acquisition, net of cash received, and $26.6 million of purchases of property and equipment to new store openings, remodeling existing stores and upgrading our information systems, including our merchandising system.
44
Net cash used in investing activities during the 2015 Predecessor Period was $7.4 million, consisting of purchases of property and equipment related to new store openings, remodeling existing stores and upgrading our information systems, including our merchandising system.
Net Cash (used in) provided by Financing Activities
Net cash used in financing activities during fiscal year 2017 was $25.5 million, consisting of payments on our Term Loan. Included in this amount is $25.0 million of voluntary prepayments.
Net cash used in financing activities during fiscal year 2016 was $44.2 million, including $38.3 million of proceeds received on long-term debt, net of $1.7 million debt issuance costs paid. The proceeds from the long-term debt, along with cash on hand, were used to fund a $70.0 million dividend to the partners of JJill Topco Holdings. Financing activities also included a $10.0 million prepayment on our Term Loan and $2.8 million of scheduled repayments on our Term Loan.
Net cash provided by financing activities during the 2015 Successor Period was $397.8 million, primarily consisting of $240.4 million of proceeds from borrowings under our Term Loan, net of $9.6 million debt issuance costs paid, and $160.5 million of equity proceeds, both incurred in connection with the Acquisition. Financing activities also included a $1.9 million receivable from a related third party and $1.3 million of scheduled repayments of our Term Loan.
Net cash provided by financing activities during the 2015 Predecessor Period was $1.6 million, consisting of $7.3 million of net proceeds from borrowings on our previous revolving credit facility in excess of repayments, which was partially offset by $5.0 million of prepayments and $0.7 million of scheduled repayments on our predecessor term loans.
Dividends
We did not pay any dividends in fiscal year 2017, and have no plans to pay cash dividends in the foreseeable future.
On June 6, 2016, we paid a $70.0 million dividend to the partners of JJill Topco Holdings.
Credit Facilities
As described above, we entered into our Term Loan and ABL Facility in connection with the Acquisition. Concurrently, we repaid the principal and interest balances outstanding under our previous credit facilities, as required by the respective agreements upon a change-in-control transaction. The following describes the credit facilities entered into in connection with the Acquisition.
On May 8, 2015, we entered into the seven-year Term Loan of $250.0 million in conjunction with the Acquisition. Obligations under the Term Loan are guaranteed by all of our current and future domestic restricted subsidiaries, subject to certain exceptions. Our borrowings under the Term Loan are secured by (i) first-priority liens on substantially all assets other than the ABL Priority Collateral (as defined below) and (ii) second-priority liens on the ABL Priority Collateral, in each case subject to permitted liens and certain exceptions. The Term Loan contains certain terms and conditions which require us to comply with financial and other covenants, including certain restrictions on our ability to incur additional indebtedness, create liens, enter into transactions with affiliates, transfer assets, pay dividends, cause our subsidiaries to pay dividends to us, consolidate or merge with other entities or undergo a change in control, make advances, investments and loans and modify our organizational documents. The financial covenants requiring us to comply with a maximum leverage ratio and limiting our capital expenditures are considered by us to be the covenants which are currently the most restrictive. The maximum leverage ratio covenant requires us not to exceed, with respect to the four quarter period ending February 3, 2018, a ratio of consolidated debt (net of unrestricted cash) to Adjusted EBITDA (subject to certain adjustments under the Term Loan) of 4.5 to 1.0, which steps down to 3.0 to 1.0 over time. The Term Loan contains a financial covenant limiting our capital expenditures to $37.5 million for the fiscal year ending February 3, 2018 plus additional amounts as permitted, decreasing to $27.5 million per fiscal year over time. The Term Loan prohibits our ability to pay dividends to our shareholders and the ability of our subsidiaries to pay dividends to us, subject to certain exceptions. We may pay dividends, and our subsidiaries may pay dividends to us, if our leverage ratio would not exceed 2.5 to 1.0 after giving effect thereto. We may also pay dividends up to the amount of our retained excess cash flow, plus certain other amounts, if our leverage ratio would not exceed 3.25 to 1.0 after giving effect thereto. The Term Loan contains certain events of default. If a default occurs and is not cured within an applicable cure period or is not waived, our obligations under the Term Loan may be accelerated. The Term Loan allows us to elect, at our own option, the applicable interest rate for borrowings under the Term Loan using a LIBOR or Base Rate variable interest rate plus an applicable margin. LIBOR loans under the Term Loan accrue interest at a
45
rate equal to LIBOR plus 5.00%, with a minimum L IBOR per annum of 1.00%. Base Rate loans under the Term Loan accrue interest at a rate equal to (i) the highest of (a) the prime rate, (b) the Federal Funds Effective Rate plus 0.50%, (c) LIBOR with a one-month interest period plus 1.00% and (d) 2.00%. As of February 3, 2018, we were in compliance with all financial covenants under our Term Loan.
On May 27, 2016, we entered into an agreement to amend our Term Loan to borrow an additional $40.0 million in additional loans to permit certain dividends and to make certain adjustments to the financial covenant. The other terms and conditions of the Term Loan remained substantially unchanged.
On May 8, 2015, we also entered into the ABL Facility, our five-year secured $40.0 million asset-based revolving credit facility. Obligations under the ABL Facility are guaranteed by all of our current and future domestic restricted subsidiaries, subject to certain exceptions. Our borrowings under the ABL Facility are secured by (i) first-priority liens on accounts, inventory and certain other assets (the "ABL Priority Collateral") and (ii) second-priority liens on substantially all other assets, in each case subject to permitted liens and certain exceptions. The ABL Facility provides for a calculated borrowing base of up to (i) 90% of the net amount of eligible credit card receivables, plus (ii) 85% of the net book value of eligible accounts receivable, plus (iii) the lesser of (A) 100% of the value of eligible inventory and (B) 90% of the net orderly liquidation value of eligible inventory, plus (iv) the least of (A) 100% of the value of eligible in-transit inventory, (B) 90% of the net orderly liquidation value of eligible in-transit inventory and (C) the in-transit maximum amount (the in-transit maximum amount is an amount not to exceed $12.5 million during the 1st and 3rd calendar quarters and $10.0 million during the 2nd and 4th calendar quarters), minus (v) the sum of certain reserves established from time to time by the administrative agent under the ABL Facility.
The ABL Facility allows us to elect, at our own option, the applicable interest rate for borrowings under the ABL Facility using a LIBOR or Base Rate variable interest rate plus an applicable margin. LIBOR loans under the ABL Facility accrue interest at a rate equal to LIBOR plus a spread ranging from 1.50% to 1.75%, subject to availability. Base Rate loans under the ABL Facility accrue interest at a rate equal to (i) the highest of (a) the prime rate, (b) the overnight Federal Funds Effective Rate plus 0.50%, (c) LIBOR with a one-month interest period plus 1.00% and (d) 2.00%, plus (ii) a spread ranging from 0.50% to 0.75%, subject to availability. Principal is payable upon maturity of the ABL Facility on May 8, 2020. The ABL Facility also requires the payment of monthly fees based on the average quarterly unused portion of the commitment, as well as a fee on the balance of the outstanding letters of credit.
The ABL Facility contains certain terms and conditions which require us to comply with financial and other covenants, including certain restrictions on the ability to incur additional indebtedness, create liens, enter into transactions with affiliates, transfer assets, pay dividends, consolidate or merge with other entities, undergo a change in control, make advances, investments and loans or modify our organizational documents. The ABL Facility contains a financial covenant requiring us to maintain a minimum fixed charge coverage ratio of 1.0 to 1.0, with the ratio being Adjusted EBITDA (subject to certain adjustments under the ABL Facility) to fixed charges. The ABL Facility prohibits our ability to pay dividends to our shareholders and the ability of our subsidiaries to pay dividends to us, subject to certain exceptions. We may pay dividends, and our subsidiaries may pay dividends to us, if our fixed charge coverage ratio is at least 1.0 to 1.0 and our availability under the ABL Facility exceeds certain thresholds after giving effect thereto. The ABL Facility contains certain events of default. If a default occurs and is not cured within an applicable cure period or is not waived, our obligations under the ABL Facility may be accelerated. As of February 3, 2018, we were in compliance with all financial covenants under our ABL Facility.
As of February 3, 2018 and January 28, 2017 there were no loan amounts outstanding under the ABL Facility. As of those same dates, we had outstanding letters of credit in the amounts of $1.6 million and $2.1 million, respectively. Based on the borrowing terms of the ABL Facility, the maximum additional borrowing capacity was $38.4 million as of February 3, 2018 and $37.9 million as of January 28, 2017.
On January 18, 2017 and June 1, 2017, we made a voluntary prepayments of $10.1 million and $20.2 million, including accrued interest, on our Term Loan. On December 15, 2017 we repurchased $5.0 million of our Term Loan on the open market at 98% of par value.
See our audited consolidated financial statements and Note 9 thereto for a discussion of our credit facilities prior to the Acquisition.
46
Contractual Obligations
We enter into long-term contractual obligations and commitments in the normal course of business. As of February 3, 2018 our outstanding contractual cash obligations were due during the periods presented below.
|
|
|
|
|
| Payments Due by Period |
| |||||||||||||
|
|
|
|
|
| Less than 1 |
|
|
|
|
|
|
|
|
|
| More than 5 |
| ||
(in thousands) |
| Total |
|
| year |
|
| 1 - 3 years |
|
| 3 - 5 years |
|
| years |
| |||||
Long-Term Debt Obligations |
|
|
|
|
|
|
|
|
|
|
|
|
|
|
|
|
|
|
|
|
Principal payment obligations (1) |
| $ | 248,176 |
|
| $ | 2,799 |
|
| $ | 5,598 |
|
| $ | 239,779 |
|
| $ | - |
|
Interest expense on long-term debt (2) |
|
| 71,028 |
|
|
| 16,940 |
|
|
| 33,305 |
|
|
| 20,783 |
|
|
| - |
|
Operating Lease Obligations (3) |
|
| 323,455 |
|
|
| 46,406 |
|
|
| 82,326 |
|
|
| 72,677 |
|
|
| 122,046 |
|
Purchase Obligations (4) |
|
| 128,015 |
|
|
| 128,015 |
|
|
| - |
|
|
| - |
|
|
| - |
|
Total |
| $ | 770,674 |
|
| $ | 194,160 |
|
| $ | 121,229 |
|
| $ | 333,239 |
|
| $ | 122,046 |
|
| (1) | Amounts assume that the Term Loan is paid upon maturity, and the ABL Facility remains undrawn, which may or may not reflect future events. |
| (2) | Assumes an interest rate of 6.8% per annum, consistent with the interest rate as of February 3, 2018. |
| (3) | Assumes the base lease term included in our outstanding operating lease arrangements as of February 3, 2017. Our future operating lease obligations would change if we were to exercise renewal options or if we renewed existing leases or entered into new operating leases. |
| (4) | Purchase obligations represent purchase commitments on inventory that are short-term and are typically made six to nine months in advance of planned receipt. It also includes commitments related to certain selling, general and administrative expenses that are generally for periods of a year or less. |
Off Balance Sheet Arrangements
We are not a party to any off balance sheet arrangements.
Critical Accounting Policies and Significant Estimates
Our discussion of results of operations and financial condition is based upon the consolidated financial statements included elsewhere in this Annual Report on Form 10-K, which have been prepared in accordance with GAAP. The preparation of financial statements in conformity with GAAP requires management to make estimates and certain assumptions about future events that affect the classification and amounts reported in our consolidated financial statements and accompanying notes, including revenue and expenses, assets and liabilities, and the disclosure of contingent assets and liabilities. These estimates and assumptions are based on our historical results as well as management's judgment. Although management believes the judgment applied in preparing estimates is reasonable based on circumstances and information known at the time, actual results could vary materially from estimates based on assumptions used in the preparation of our consolidated financial statements.
The most significant accounting estimates involve a high degree of judgment or complexity. Management believes the estimates and judgments most critical to the preparation of our consolidated financial statements and to the understanding of our reported financial results include those made in connection with revenue recognition, including accounting for gift card breakage and estimated merchandise returns; accounting for business combinations; estimating the value of inventory; impairment assessments for goodwill and other indefinite-lived intangible assets, and long-lived assets; and estimating equity-based compensation expense. Management evaluates its policies and assumptions on an ongoing basis. Our significant accounting policies related to these accounts in the preparation of our consolidated financial statements are described below (see Note 2 to our audited consolidated financial statements presented elsewhere in this Annual Report on Form 10-K for additional information regarding our critical accounting policies).
Revenue Recognition
We recognize revenue and the related cost of merchandise sold when merchandise is received by our customers. Revenue from our retail operations is recognized at the time of sale. Revenue from catalog and e-commerce sales is recognized upon receipt of merchandise by the customer. Discounts provided to customers are recorded as a reduction to sales revenue. The criteria for recognition of revenue is met when persuasive evidence that an arrangement exists, delivery of product has occurred, the price is fixed or determinable and collectability is reasonably assured. In circumstances where either title or risk of loss passes upon receipt by the customer, we defer recognition of revenue until such event occurs, based on shipping records.
47
At the time sales revenue is recognized , we record a reserve for merchandise returns based on prior returns experience and expected future returns in accordance with our return policy and discretionary returns practices. We monitor our returns experience and resulting reserves on an ongoing bas is and we believe our estimates are reasonable. We do not believe there is a reasonable likelihood that there will be a material change in the assumptions used to calculate the allowance for sales returns. However, if the actual cost of sales returns are s ignificantly different than the estimated allowance, our results of operations could be materially affected.
We sell gift cards without expiration dates to customers. Proceeds from the sale of gift cards are deferred and reflected as gift cards redeemable until the customer redeems the gift card or when the likelihood of redemption is remote. Based upon historical experience, we estimate the value of outstanding gift cards that will ultimately not be redeemed (breakage) nor escheated under statutory unclaimed property laws. This amount is recognized as revenue over the time pattern established by our historical gift card redemption experience. We monitor our gift card redemption experience and associated accounting on an ongoing basis. Our historical experience has not varied significantly from amounts historically recorded and we believe our assumptions are reasonable.
Business Combinations
JJill Holdings accounted for the Acquisition under the acquisition method of accounting. We elected to push down the effects of the Acquisition and the application of the acquisition method of accounting to our consolidated financial statements. This method requires allocating the purchase price to the acquisition date fair value of assets acquired, including separately identifiable intangible assets, and liabilities assumed. The excess of the purchase price over the fair value of net assets acquired is recorded as goodwill. Determining the fair value of assets acquired and liabilities assumed requires management's judgment, based on available information at the time of acquisition and subsequently obtained during a measurement period up to one year following the date of acquisition, relating to events or circumstances that existed at the acquisition date. Management's judgment relies upon estimates and assumptions related to future cash flows, discount rates, useful lives of assets, market conditions and other items. The fair value of assets acquired and liabilities assumed in a business combination is estimated in accordance with the policies described below.
Inventory : Our inventory consists entirely of finished goods merchandise. Management values the inventory acquired in business combinations based on the income approach, which bases fair value on the net retail value, less operating expenses and a reasonable profit allowance.
Property and equipment : Our property and equipment consists primarily of leasehold improvements, furniture and fixtures, computer software and hardware, and construction in progress. To determine the fair value of property and equipment acquired in a business transaction, we primarily apply the replacement cost approach, which assumes that replacement cost is the best indication of fair value. In certain instances, particularly with respect to determining the fair value of assets with an active secondary market, we also give consideration to the market approach, which is based on current selling prices of similar assets available for purchase in an arms-length transaction.
Intangible assets other than goodwill : The fair value of intangible assets other than goodwill acquired in a business combination is recorded at fair value at the date of acquisition, as follows:
Trade Name : The fair value of our trade name is determined using the relief-from-royalty method, a variation of the income approach. The relief-from-royalty method determines the present value of the economic royalty savings associated with the ownership or possession of the trade name based on an estimated royalty rate applied to the cash flows to be generated by the business. The estimated royalty rate is determined based on the assessment of a reasonable royalty rate that a third party would negotiate in an arm's-length license agreement for the use of the trade name.
Customer Relationships : The fair value of customer relationships are calculated using the excess earnings method. Under this method, the value of an intangible asset is equal to the present value of the after-tax cash flows attributable solely to the subject intangible asset, after making adjustments for the required return on and of the other associated assets.
Leasehold interests : Leasehold interests acquired are recorded as intangible real estate assets to the extent the terms of a lease are favorable compared to current market transactions, or as liabilities to the extent lease terms are unfavorable compared to the current market transactions. We assess the value of its assumed leaseholds based on the difference between contractual rent and market rent calculated for each remaining lease year of each lease, discounted to present value. Market rent is estimated by analyzing comparable leases in the location of its retail locations and an assumed annual inflation rate. The rate applied to calculate present value is based upon data available from industry reports. Variations in any of these factors could have an impact on the classification of leaseholds and the value of resulting assets and liabilities. We include favorable and unfavorable leasehold interests as other assets and other liabilities, respectively, on its consolidated balance sheet.
48
Deferred tax assets and liabilities: We record deferred tax as sets and liabilities in connection with a business combination in accordance with the basis of the purchase price consideration for tax purposes as allocated to the assets acquired, based on the established hierarchy of tax regulations.
Merchandise Inventory
Inventory consists of finished goods merchandise held for sale to our customers. Inventory is stated at the lower of cost or net realizable value, net of reserves for inventory. Cost is calculated using the weighted average method of accounting, and includes the cost to purchase merchandise from our manufacturers, duties, commissions and inbound freight.
In the normal course of business, we record inventory reserves based on past and projected sales performance, as well as the inventory on hand. The carrying value of inventory is reduced to estimated net realizable value when factors indicate that merchandise will not be sold on terms sufficient to recover its cost.
We monitor inventory levels, sales trends and sales forecasts to estimate and record reserves for excess, slow-moving and obsolete inventory. We utilize internal channels, including sales catalogs, the internet, and price reductions in retail and outlet stores to liquidate excess inventory. In some cases, external channels such as inventory liquidators are utilized. The prices obtained through these off-price selling methods varies based on many factors. Accordingly, estimates of future sales prices requires management judgment based on historical experience, assessment of current conditions and assumptions about future transactions. In addition, we conduct physical inventory counts to determine and record actual shrinkage. Estimates for shrinkage are recorded between physical counts, based on actual shrinkage experience. Actual shrinkage can vary from these estimates. When observed differences are identified, we adjust our inventory balances accordingly. We believe our assumptions are reasonable, and monitor actual results to adjust estimates and inventory balances on an ongoing basis. We have not made significant changes to our assumptions during the periods presented in our consolidated financial statements included elsewhere in this Annual Report on Form 10-K, and estimates have not varied significantly from historically recorded amounts.
Asset Impairment Assessments
Goodwill
We evaluate goodwill annually at year end to determine whether the carrying value reflected on the balance sheet is recoverable, and more frequently if events or circumstances indicate that the fair value of a reporting unit is less than its carrying value. Our two reporting units applicable to goodwill impairment assessments are defined as our direct and retail sales channels. Examples of impairment indicators that would trigger an impairment assessment of goodwill between annual evaluations include, among others, macro-economic conditions, competitive environment, industry conditions, changes in our profitability and cash flows, and changes in sales trends or customer demand.
We may assess our goodwill for impairment initially using a qualitative approach ("step zero") to determine whether conditions exist to indicate that it is more likely than not that the fair value of a reporting unit is less than its carrying value. If management concludes, based on assessment of relevant events, facts and circumstances, that it is more likely than not that a reporting unit's fair value is greater than its carrying value, no further impairment testing is required.
If management's assessment of qualitative factors indicates that it is more likely than not that the fair value of a reporting unit is less than its carrying value, then a quantitative assessment is performed. We also have the option to bypass the qualitative assessment described above and proceed directly to the quantitative assessment. The quantitative assessment requires comparing the fair value of a reporting unit to its carrying value, including goodwill. We estimate the fair value of reporting units using the income approach. The income approach uses a discounted cash flow analysis, which involves significant estimates and assumptions, including preparation of revenue and profitability growth forecasts, selection of the discount rate and the terminal year multiple.
If the fair value of a reporting unit exceeds its carrying amount, goodwill is not considered to be impaired and no further testing is required. If the carrying amount exceeds the reporting unit's fair value, a goodwill impairment charge is recognized for the amount in excess, not to exceed the total amount of goodwill allocated to that reporting unit.
For the fourth quarters of 2017 and 2016, we performed a step zero test, and during the 2015 Successor Period, we performed a step one test. Our tests for impairment of goodwill resulted in a determination that the fair value of each reporting unit exceeded the carrying value of its net assets during fiscal year 2017, 2016, and the 2015 Successor Period. We
49
do not anticipate any material impairment charges in the near term. This analysis contains uncertainties b ecause it requires us to make assumptions and to apply judgments to estimate industry economic factors and the profitability of future business strategies. If actual results are not consistent with our estimates and assumptions, we may be exposed to future impairment losses that could be material.
Indefinite-Lived Intangible Assets
Our trade name has been assigned an indefinite life as we currently anticipate that it will contribute cash flows to us indefinitely. Our trade name is reviewed at least annually to determine whether events and circumstances continue to support an indefinite, useful life.
We evaluate our trade name for potential impairment at least annually during the fourth fiscal quarter, or whenever events or changes in circumstances indicate that its carrying value may not be recoverable. Conditions that may indicate impairment include, but are not limited to, significant loss of market share to a competitor, the identification of other impaired assets within a reporting unit, loss of key personnel that negatively and materially has an adverse effect on our operations, the disposition of a significant portion of a reporting unit or a significant adverse change in business climate or regulations.
Impairment losses are recorded to the extent that the carrying value of the indefinite-lived intangible asset exceeds its fair value. We measure the fair value of our trade name using the income approach, which uses a discounted cash flow analysis. The most significant estimates and assumptions inherent in this approach are the preparation of revenue and profitability growth forecasts, selection of the discount rate, and selection of the terminal year multiple.
We assessed the carrying value of intangible assets as described above and determined that no impairment losses were required during fiscal years 2017 and 2016, or the 2015 Successor period.
Long-Lived Assets
Long-lived assets include definite-lived intangible assets subject to amortization and property and equipment. Long-lived assets obtained in a business combination are recorded at the acquisition-date fair value, while property and equipment purchased in the normal course of business is recorded at cost.
We assess the carrying value of long-lived assets for potential impairment whenever indicators exist that the carrying value of an asset group might not be recoverable. Indicators of impairment include, among others, a significant decrease in the market price of an asset, a significant adverse change in the extent or manner in which an asset is being used or in its physical condition, and operating or cash flow performance that demonstrates continuing losses associated with an asset group.
When indicators of potential impairment exist, we compare the sum of estimated undiscounted future cash flows expected to result from the use and eventual disposition of the asset group to the carrying value of the asset group. If the carrying value of an asset group exceeds the sum of estimated undiscounted future cash flows, we record an impairment loss in the amount required to reduce carrying value of the asset group to fair value. We estimate the fair value of an asset group based on the present value of estimated future cash flows, calculated by discounting the cash flow projections used in the previous step.
During 2017, the Company recorded impairment charges of $2.2 million associated with the assets of underperforming retail locations. The impairment charge was calculated using a discounted cash flow model and was recorded in selling, general and administrative in the Company's consolidated statement of operations and comprehensive income (loss). During the 2016, 2015 Successor and 2015 Predecessor periods, the Company did not record any impairment charges associated with property and equipment.
Determining the fair value of long-lived assets requires management judgment and relies upon the use of significant estimates and assumptions, including future sales, our margins and cash flows, current and future market conditions, discount rates applied, useful lives and other factors. We believe our assumptions are reasonable based on available information. Changes in assumptions and estimates used in the impairment analysis, or future results that vary from assumptions used in the analysis, could affect the estimated fair value of long-lived intangible assets and could result in impairment charges in a future period.
50
Equity-based Compensation
Successor
Following our initial public offering on March 9, 2017, the Company accounts for equity-based compensation using the grant-date market price of our common stock and the Black-Scholes option pricing model. The Company recognizes equity-based compensation expense in the periods in which the employee or director is required to provide service, which is generally over the vesting period of the individual equity instruments.
Previous to our initial public offering on March 9, 2017, JJill Topco Holdings maintained an Incentive Equity Plan that allowed JJill Topco Holdings to grant incentive units to certain of our directors and senior executives, by granting Class A Common Interests ("Common Interests"). During the 2015 Successor Period, JJill Topco Holdings issued Common Interests, which are considered to be equity-classified awards. We recognized the fair value of the awards as compensation expense, net of forfeitures, over the requisite service period, which was generally the vesting period of the award. We accounted for equity-based compensation for JJill Topco Holdings' Common Interests by recognizing the fair value of equity-based compensation as an expense within selling, general and administrative expenses in our consolidated statements of operations and comprehensive income (loss) as the costs are deemed to be for our benefit. Fair value of the awards was determined at the date of grant using an option pricing model. Use of an option pricing model required that we made assumptions as to the volatility of JJill Topco Holdings' Common Interests, the expected dividend yield, the expected term and the risk-free interest rate that approximates the expected term. All key assumptions and inputs are the responsibility of management and we believe they were reasonable.
JJill Topco Holdings' Common Interests were not publicly traded. As there was no public market for JJill Topco Holdings' Common Interests, the estimated fair value of the Common Interests was determined by JJill Topco Holdings' board of directors as of the respective grant date of each Common Interest, with input from management, considering as one of the factors the most recently available third-party valuations of common stock and JJill Topco Holdings' board of directors' assessment of additional objective and subjective factors that it believed were relevant and which may have changed from the date of the most recent valuation through the date of the grant. These third-party valuations were performed in accordance with the guidance outlined in the American Institute of Certified Public Accountants' Accounting and Valuation Guide, Valuation of Privately-Held-Company Equity Securities Issued as Compensation. JJill Topco Holdings' Common Interests valuation was prepared using the option-pricing method ("OPM"), which uses market approaches to estimate the enterprise value. The OPM treats common interests and preferred stock as call options on the total equity value of a company, with exercise prices based on the value thresholds at which the allocation among the various holders of a company's securities changes. Under this method, the common interest has value only if the funds available for distribution to stockholders exceeded the value of the preferred stock liquidation preferences at the time of the liquidity event, such as a sale. In addition to considering these valuations, JJill Topco Holdings' board of directors considered various objective and subjective factors to determine the fair value of JJill Topco Holdings' Common Interest as of each grant date, including:
| • | our financial position, including cash on hand, and our historical and forecasted performance and operating results; |
| • | external market conditions affecting our industry; |
| • | the lack of an active market for JJill Topco Holdings' Common Interests and preferred stock; and |
| • | the likelihood of achieving a liquidity event, such as an initial public offering ("IPO") or sale of our company in light of prevailing market conditions. |
The assumptions underlying these valuations represented management's best estimates, which involved inherent uncertainties and the application of management judgment.
Predecessor
During the Predecessor periods, we accounted for compensation expense related to our share-based awards using the intrinsic value method, as permitted by ASC 718 for nonpublic entities, with changes in the value of the share-based awards being recognized as compensation expense at each reporting period. JJIP LLC ("JJIP"), a Limited Partnership, was formed by our then current owners and held a portion of our outstanding common units. A management incentive unit equity program was established by JJIP to provide the opportunity for our key employees to participate in the appreciation of the business. During such periods, service-based and performance-based awards were issued. For service-only share-based awards, we recognized the related compensation expense in the period in which the award holder is required to provide service, which is generally over the required service period.
51
For the performance-based awards, vesting occurred upon achievement or satisfaction of a specified performance condition. Such conditions would be met upon the earlier of the attainment of a predetermined return on investment b y certain equity investors in the Predecessor entity, or a change in control, whereby all outstanding unvested awards would immediately vest. We considered the probability of achieving the established performance targets in determining our equity-based com pensation with respect to these awards at the end of each reporting period. During the 2015 Predecessor period, there was no compensation expense recognized for the performance-based awards. The performance conditions of the Predecessor plan were met only on the date of the Acquisition.
Jumpstart Our Business Startups Act of 2012 (JOBS Act)
In April 2012, the JOBS Act was signed into law. The JOBS Act contains provisions that, among other things, reduce certain reporting requirements for an "emerging growth company." As an "emerging growth company," we are electing not to take advantage of the extended transition period afforded by the JOBS Act for the implementation of new or revised accounting standards, and, as a result, we will comply with new or revised accounting standards on the relevant dates on which adoption of such standards is required for non-emerging growth public companies. Section 107 of the JOBS Act provides that our decision not to take advantage of the extended transition period is irrevocable.
We have chosen to rely on the other exemptions and reduced reporting requirements provided by the JOBS Act. Subject to certain conditions set forth in the JOBS Act, as an "emerging growth company" we are not required to, among other things, (i) provide an auditor's attestation report on our system of internal controls over financial reporting pursuant to Section 404 of the Sarbanes-Oxley Act, (ii) provide all of the compensation disclosure that may be required of non-emerging growth public companies under the Dodd-Frank Act, (iii) comply with any requirement that may be adopted by the Public Company Accounting Oversight Board (United States) regarding mandatory audit firm rotation or a supplement to the auditor's report providing additional information about the audit and the consolidated financial statements (auditor discussion and analysis) and (iv) disclose certain executive compensation-related items, such as the correlation between executive compensation and performance and comparisons of the chief executive officer's compensation to median employee compensation. We may remain an "emerging growth company" until the last day of the fiscal year following the fifth anniversary of the completion of our initial public offering on March 9, 2017. However, if certain events occur prior to the end of such five-year period, including if we become a "large accelerated filer," our annual gross revenue equals or exceeds $1.07 billion or we issue more than $1.0 billion of non-convertible debt in any three-year period, we will cease to be an "emerging growth company" prior to the end of such five-year period.
Recent Accounting Pronouncements
See Note 3 to our audited consolidated financial statements included elsewhere in this Annual Report on Form 10-K for information regarding recently issued accounting pronouncements.
Item 7A. Quantitative and Qualitative Disclosures About Market Risk
Interest Rate Risk
We are subject to interest rate risk in connection with borrowings under the Term Loan and ABL Facility, which bear interest at variable rates equal to LIBOR plus a margin as defined in the respective agreements described above. As of February 3, 2018, there was no outstanding balance under the ABL Facility, and $1.6 million letters of credit outstanding. The undrawn borrowing availability under the ABL Facility was $38.4 million and the amount outstanding under the Term Loan had decreased to $248.2 million as a result of scheduled payments and $25.2 million of voluntary prepayments and open market repurchases. We currently do not engage in any interest rate hedging activity and we have no intention to do so in the foreseeable future. Based on the interest rate on the ABL Facility at February 3, 2018, and the schedule of outstanding borrowings under our Term Loan, a 10% change in our current interest rate would affect net income by $1.9 million during fiscal year 2017.
Impact of Inflation
Our results of operations and financial condition are presented based on historical cost. While it is difficult to accurately measure the impact of inflation due to the imprecise nature of the estimates required, we believe the effects of inflation, if any, on our results of operations and financial condition have been immaterial. We cannot assure you our business will not be affected in the future by inflation.
52
Item 8. Financial Stateme n ts and Supplementary Data
The financial statements required to be filed pursuant to this Item 8 are appended to this report. An index of those financial statements is found in Item 15.
Item 9. Changes in and Disagreements With Accountants on Accounting and Financial Disclosure
None.
Item 9A. Controls and Procedures
Evaluation of Disclosure Controls and Procedures
We maintain disclosure controls and procedures that are designed to provide reasonable assurance that information required to be disclosed in the reports we file or submit under the Securities Exchange Act of 1934, as amended, is recorded, processed, summarized and reported within the time periods specified in the SEC's rules and forms, and that such information is accumulated and communicated to our management, including our Chief Executive Officer and Chief Financial Officer, to allow timely decisions regarding required disclosure.
Our management, under the supervision of our Chief Executive Officer and Chief Financial Officer, evaluated the effectiveness of our disclosure controls and procedures (as defined in Rules 13a-15(e) and 15d-15(e) under the Securities Exchange Act of 1934, as amended (the "Exchange Act")) as of the end of the period covered by this Annual Report on Form-10-K. Based on that evaluation, our Chief Executive Officer and Chief Financial Officer have concluded that as of the end of the period covered by this Annual Report on Form-10-K our disclosure controls and procedures were effective to provide such reasonable assurance.
Management's Annual Report on Internal Control over Financial Reporting
Our management, with the participation of our Chief Executive Officer and Chief Financial Officer, is responsible for establishing and maintaining adequate internal control over financial reporting. Internal control over financial reporting is defined in Rules 13a-15(f) or 15d-15(f) promulgated under the Exchange Act as a process designed by, or under the supervision of, the company's principal executive and principal financial officers and effected by the company's board of directors, management and other personnel, to provide reasonable assurance regarding the reliability of financial reporting and the preparation of financial statements for external purposes in accordance with generally accepted accounting principles and includes those policies and procedures that pertain to the maintenance of records that in reasonable detail accurately and fairly reflect the transactions and dispositions of the assets of the company; provide reasonable assurance that transactions are recorded as necessary to permit preparation of financial statements in accordance with generally accepted accounting principles, and that receipts and expenditures of the company are being made only in accordance with authorizations of management and directors of the company; and provide reasonable assurance regarding prevention or timely detection of unauthorized acquisition, use or disposition of the company's assets that could have a material effect on the financial statements.
Because of its inherent limitations, internal control over financial reporting may not prevent or detect misstatements. Also, projections of any evaluation of effectiveness to future periods are subject to the risk that controls may become inadequate because of changes in conditions, or that the degree of compliance with the policies or procedures may deteriorate.
Our management assessed the effectiveness of the Company's internal control over financial reporting as of February 3, 2018. In making this assessment, our management used the criteria set forth by the Committee of Sponsoring Organizations of the Treadway Commission (COSO) in Internal Control – Integrated Framework (2013).
Based on our assessment, management, with the participation of our Chief Executive Officer and Chief Financial Officer, concluded that, as of February 3, 2018, our internal control over financial reporting was effective based on those criteria.
This Annual Report on Form 10-K does not include an attestation report of our independent registered public accounting firm due to a transition period established by SEC rules and regulations for newly public companies.
53
Limitations on the Effectiveness of Controls and Procedur es
In designing and evaluating our disclosure controls and procedures, our management recognizes that any controls and procedures, no matter how well designed and operated, can provide only reasonable, not absolute, assurance of achieving the desired control objectives. In addition, the design of disclosure controls and procedures must reflect the fact that there are resource constraints and our management is required to apply judgment in evaluating the benefits of possible controls and procedures relative to their costs. The design of any disclosure controls and procedures also is based in part upon certain assumptions about the likelihood of future events, and there can be no assurance that any design will succeed in achieving its stated goals under all potential future conditions.
Changes to Internal Control over Financial Reporting
There have been no changes in our internal control over financial reporting during our most recent fiscal quarter ended February 3, 2018 that have materially affected, or are reasonably likely to materially affect, our internal control over financial reporting.
Item 9B. Other Information
Not applicable.
54
PART III
Item 10. Directors, Executive Officers and Corporate Governance
The information required by this item will be contained in our definitive proxy statement in connection with our 2018 Annual Meeting of Stockholders (the "Proxy Statement"), which is expected to be filed with the SEC not later than 120 days after the end of our fiscal year ended February 3, 2018, and is incorporated herein by reference.
Code of Business Conduct and Ethics
Our board of directors has adopted a code of conduct and ethics that applies to all of our directors, officers and employees and is intended to comply with the relevant listing requirements for a code of conduct as well as qualify as a "code of ethics" as defined by the rules of the SEC. The statement contains general guidelines for conducting our business consistent with the highest standards of business ethics. We intend to disclose future amendments to certain provisions of our code of conduct and ethics, or waivers of such provisions applicable to any principal executive officer, principal financial officer, principal accounting officer and controller, or persons performing similar functions, and our directors, on our website at www.jjill.com . The code of conduct and ethics is available on our website at www.jjill.com .
Item 11. Executive Compensation
The information required by this Item will be set forth in the Proxy Statement and is incorporated herein by reference.
Item 12. Security Ownership of Certain Beneficial Owners and Management and Related Stockholder Matters
The information required by this Item will be set forth in the Proxy Statement and is incorporated herein by reference.
Item 13. Certain Relationships and Related Transactions, and Director Independence
The information required by this Item will be set forth in the Proxy Statement and is incorporated herein by reference.
Item 14. Pr incipal Accounting Fees and Services
The information required by this Item will be set forth in the Proxy Statement and is incorporated herein by reference.
55
PART IV
Item 15. Exhibits, Financial Statement Schedules
(a)(1) | Financial Statements. |
See the "Index to Consolidated Financial Statements" on page F-1 below for the list of financial statements filed as part of this report.
(a)(2) | Financial Statement Schedules. |
All schedules have been omitted because they are not required or because the required information is given in the Consolidated Financial Statements or Notes thereto set forth below beginning on page F-1.
(a)(3) | Exhibits. |
The exhibits listed in the Exhibit Index below are filed or incorporated by reference as part of this Annual Report on Form 10-K.
56
Exhibit Index
Exhibit Number | Exhibit Description |
|
|
3.1 | Certificate of Incorporation of J.Jill, Inc. (incorporated by reference from Exhibit 3.1 to the Company's Form 10-K, filed on April 28, 2017 (File No. 001-38026)). |
|
|
3.2 | Bylaws of J.Jill, Inc. (incorporated by reference from Exhibit 3.2 to the Company's Form 10-K, filed on April 28, 2017 (File No. 001-38026)). |
|
|
10.1 | Form of Indemnification Agreement (incorporated by reference from Exhibit 10.1 to Amendment No. 1 to the Company's Registration Statement on Form S-1, filed on February 27, 2017 (File No. 333-215993)). |
|
|
10.2 | Registration Rights Agreement, dated as of March 14, 2017 (incorporated by reference from Exhibit 10.2 to the Company's Form 10-K, filed on April 28, 2017 (File No. 001-38026)). |
|
|
10.3† | J.Jill, Inc. 2017 Omnibus Equity Incentive Plan (incorporated by reference from Exhibit 10.3 to the Company's Form 10-K, filed on April 28, 2017 (File No. 001-38026)). |
|
|
10.4 | Term Loan Credit Agreement, dated as of May 8, 2015, among Jill Holdings LLC, Jill Acquisition LLC, the various lenders party thereto from time to time and Jefferies Finance LLC, as the administrative agent (incorporated by reference from Exhibit 10.4 to the Company's Registration Statement on Form S-1, filed on February 10, 2017 (File No. 333-215993)). |
|
|
10.5 | Amendment No. 1 to Term Loan Credit Agreement, dated as of May 27, 2016, among Jill Acquisition LLC, Jill Intermediate LLC, the lenders party thereto and Jefferies LCC as the administrative agent (incorporated by reference from Exhibit 10.5 to the Company's Registration Statement on Form S-1, filed on February 10, 2017 (File No. 333-215993)). |
|
|
10.6 | ABL Credit Agreement, dated as of May 8, 2015, among Jill Holdings LLC, Jill Acquisition LLC, certain subsidiaries of Jill Acquisition LLC from time to time party thereto, the lenders party thereto and CIT Finance LLC, as the administrative agent and collateral agent (incorporated by reference from Exhibit 10.6 to the Company's Registration Statement on Form S-1, filed on February 10, 2017 (File No. 333-215993)). |
|
|
10.7 | Amendment No. 1 to ABL Credit Agreement, dated as of May 27, 2016, among Jill Acquisition LLC, Jill Intermediate LLC, certain subsidiaries of Jill Acquisition LLC from time to time party thereto, the lenders party thereto and CIT Finance LLC, as the administrative agent and collateral agent (incorporated by reference from Exhibit 10.7 to the Company's Registration Statement on Form S-1, filed on February 10, 2017 (File No. 333-215993)). |
|
|
10.8 | Services Agreement, dated as of May 8, 2015, by and between Jill Acquisition LLC and TowerBrook Capital Partners L.P (incorporated by reference from Exhibit 10.8 to the Company's Registration Statement on Form S-1, filed on February 10, 2017 (File No. 333-215993)). |
|
|
10.9† | Second Amended and Restated Employment Agreement, dated as of March 14, 2017, by and between Paula Bennett, J.Jill, Inc., JJill Topco Holdings, LP, Jill Acquisition LLC, and certain other parties thereto (incorporated by reference from Exhibit 10.9 to the Company's Form 10-K, filed on April 28, 2017 (File No. 001-38026)). |
|
|
10.10† | Amended and Restated Employment Agreement, dated as of as May 22, 2015, by and between David Biese and Jill Acquisition LLC (incorporated by reference from Exhibit 10.10 to Amendment No. 1 to the Company's Registration Statement on Form S-1, filed on February 27, 2017 (File No. 333-215993)). |
|
|
10.11† | Amended and Restated Employment Agreement, dated as of May 22, 2015, by and between Joann Fielder and Jill Acquisition LLC and Amendment No. 1 thereto, dated as of July 27, 2015 (incorporated by reference from Exhibit 10.11 to Amendment No. 1 to the Company's Registration Statement on Form S-1, filed on February 27, 2017 (File No. 333-215993)). |
|
|
10.12 | Lease Agreement, dated as of September 30, 2010, by and between Cole JJ Tilton NH, LLC and Jill Acquisition LLC (incorporated by reference from Exhibit 10.12 to the Company's Registration Statement on Form S-1, filed on February 10, 2017 (File No. 333-215993)). |
|
|
57
Exhibit Number | Exhibit Description |
10.13 | Stockholders Agreement, dated as of March 14, 2017 (incorporated by reference from Exhibit 10.13 to the Company's Form 10-K, filed on April 28, 2017 (File No. 001-38026)). |
|
|
10.14*† | Form of Stock Option Award Agreement for Vice Presidents and Above under the J.Jill, Inc. 2017 Omnibus Equity Incentive Plan. |
|
|
10.15† | Form of Restricted Stock Unit Award Agreement for Non-Employee Directors under the J.Jill, Inc. 2017 Omnibus Equity Incentive Plan (incorporated by reference from Exhibit 10.15 to Amendment No. 1 to the Company's Registration Statement on Form S-1, filed on February 27, 2017 (File No. 333-215993)). |
|
|
10.16 | Amended and Restated Agreement of Limited Partnership of JJill Topco Holdings, LP, dated as of May 8, 2015 (incorporated by reference from Exhibit 10.16 to Amendment No. 1 to the Company's Registration Statement on Form S-1, filed on February 27, 2017 (File No. 333-215993)). |
|
|
10.17† | JJill Topco Holdings, LP Incentive Equity Plan (incorporated by reference from Exhibit 10.17 to Amendment No. 1 to the Company's Registration Statement on Form S-1, filed on February 27, 2017 (File No. 333-215993)). |
|
|
10.18† | Form of Grant Agreement under the JJill Topco Holdings, LP Incentive Equity Plan (incorporated by reference from Exhibit 10.18 to Amendment No. 1 to the Company's Registration Statement on Form S-1, filed on February 27, 2017 (File No. 333-215993)). |
|
|
10.19*† | J.Jill, Inc. Employee Stock Purchase Plan. |
|
|
10.20*† | Employment Agreement, dated as of March 13, 2018, by and between Linda Heasley and J.Jill, Inc. |
|
|
10.21*† | Retirement Agreement, dated as of March 13, 2018, by and between Paula Bennett and J.Jill, Inc. |
|
|
10.22† | Form of Restricted Stock Unit Award Agreement for Vice Presidents and Above under the J.Jill, Inc. 2017 Omnibus Equity Incentive Plan (incorporated by reference from Exhibit 10.1 to the Company's Form 8-K, filed on April 11, 2018 (File No. 001-38026)). |
|
|
21.1 | Subsidiaries of J.Jill, Inc. (incorporated by reference from Exhibit 21.1 to the Company's Form 10-K, filed on April 28, 2017 (File No. 001-30826)). |
|
|
23.1* | Consent of PricewaterhouseCoopers LLP, independent registered public accounting firm. |
|
|
31.1* | Certification of Principal Executive Officer Pursuant to Rules 13a-14(a) and 15d-14(a) under the Securities Exchange Act of 1934, as Adopted Pursuant to Section 302 of the Sarbanes-Oxley Act of 2002. |
|
|
31.2* | Certification of Principal Financial Officer Pursuant to Rules 13a-14(a) and 15d-14(a) under the Securities Exchange Act of 1934, as Adopted Pursuant to Section 302 of the Sarbanes-Oxley Act of 2002. |
|
|
32.1* | Certification of Principal Executive Officer Pursuant to 18 U.S.C. Section 1350, as Adopted Pursuant to Section 906 of the Sarbanes-Oxley Act of 2002. |
|
|
32.2* | Certification of Principal Financial Officer Pursuant to 18 U.S.C. Section 1350, as Adopted Pursuant to Section 906 of the Sarbanes-Oxley Act of 2002. |
|
|
101* | XBRL Interactive Data Files |
* | Filed herewith. |
† | Management contract or compensatory plan or arrangement. |
Item 16. Form 10-K Summary
None
58
SIGNATURES
Pursuant to the requirements of Section 13 or 15(d) of the Securities Exchange Act of 1934, as amended, the Registrant has duly caused this Report to be signed on its behalf by the undersigned, thereunto duly authorized .
| J.Jill, Inc. | |
|
|
|
Date: April 13, 2018 | By: | /s/ Paula Bennett |
|
| Paula Bennett |
|
| President, Chief Executive Officer and Director |
Pursuant to the requirements of the Securities Exchange Act of 1934, as amended, this Report has been signed below by the following persons on behalf of the Registrant in the capacities and on the dates indicated.
Name |
| Title |
| Date |
|
|
|
|
|
/s/ Paula Bennett |
| President, Chief Executive Officer and Director (Principal Executive Officer) |
| April 13, 2018 |
Paula Bennett |
|
|
|
|
|
|
|
|
|
/s/ David Biese |
| Executive Vice President, Chief Financial and Operating Officer (Principal Financial Officer and Principal Accounting Officer) |
| April 13, 2018 |
David Biese |
|
|
|
|
|
|
|
|
|
/s/ Michael Rahamim |
| Chairman of the Board of Directors |
| April 13, 2018 |
Michael Rahamim |
|
|
|
|
|
|
|
|
|
/s/ Andrew Rolfe |
| Director |
| April 13, 2018 |
Andrew Rolfe |
|
|
|
|
|
|
|
|
|
/s/ Travis Nelson |
| Director |
| April 13, 2018 |
Travis Nelson |
|
|
|
|
|
|
|
|
|
/s/ Marka Hansen |
| Director |
| April 13, 2018 |
Marka Hansen |
|
|
|
|
|
|
|
|
|
/s/ Michael Recht |
| Director |
| April 13, 2018 |
Michael Recht |
|
|
|
|
|
|
|
|
|
/s/ Michael Eck |
| Director |
| April 13, 2018 |
Michael Eck |
|
|
|
|
|
|
|
|
|
/s/ Linda Heasley |
| Director |
| April 13, 2018 |
Linda Heasley |
|
|
|
|
|
|
|
|
|
/s/ James Scully |
| Director |
| April 13, 2018 |
James Scully |
|
|
|
|
59
J.Jill, Inc.
INDEX TO CONSOLIDATED FINANCIAL STATEMENTS
|
|
Report of Independent Registered Public Accounting Firm | F-2 |
|
|
Audited Consolidated Financial Statements |
|
Consolidated Balance Sheets as of February 3, 2018 and January 28, 2017 | F-4 |
Consolidated Statements of Operations and Comprehensive Income (Loss) for the Fiscal Year Ended February 3, 2018 (Successor), January 28, 2017 (Successor), the Period from May 8, 2015 through January 30, 2016 (Successor), and the Period from February 1, 2015 through May 7, 2015 (Predecessor) | F-5 |
Consolidated Statements of Members' Equity for the Period From February 1, 2015 through May 7, 2015 (Predecessor) | F-6 |
Consolidated Statements of Shareholders' / Members' Equity for the Fiscal Year Ended February 3, 2018 (Successor), January 28, 2017 (Successor), and the Period from May 8, 2015 through January 30, 2016 (Successor) | F-7 |
Consolidated Statements of Cash Flows for the Fiscal Year Ended February 3, 2018 (Successor), January 28, 2017 (Successor), the Period from May 8, 2015 through January 30, 2016 (Successor), and the Period from February 1, 2015 through May 7, 2015 (Predecessor) | F-8 |
Notes to Consolidated Financial Statements | F-9 |
F-1
Report of Independent Registered Public Accounting Firm
To the Board of Directors and Shareholders of J.Jill, Inc
Opinion on the Financial Statements
We have audited the accompanying consolidated balance sheets of J.Jill, Inc. and its subsidiaries (Successor) as of February 3, 2018 and January 28, 2017, and the related consolidated statements of operations and comprehensive income (loss), of shareholders'/members' equity and of cash flows for the period from May 8, 2015 to January 30, 2016 and for each of the two years in the period ended February 3, 2018, including the related notes (collectively referred to as the "consolidated financial statements"). In our opinion, the consolidated financial statements present fairly, in all material respects, the financial position of the Company as of February 3, 2018 and January 28, 2017, and the results of their operations and their cash flows for the period from May 8, 2015 to January 30, 2016 and for each of the two years in the period ended February 3, 2018 in conformity with accounting principles generally accepted in the United States of America.
Basis for Opinion
These consolidated financial statements are the responsibility of the Company's management. Our responsibility is to express an opinion on the Company's consolidated financial statements based on our audits. We are a public accounting firm registered with the Public Company Accounting Oversight Board (United States) ("PCAOB") and are required to be independent with respect to the Company in accordance with the U.S. federal securities laws and the applicable rules and regulations of the Securities and Exchange Commission and the PCAOB.
We conducted our audits of these consolidated financial statements in accordance with the standards of the PCAOB. Those standards require that we plan and perform the audit to obtain reasonable assurance about whether the consolidated financial statements are free of material misstatement, whether due to error or fraud. The Company is not required to have, nor were we engaged to perform, an audit of its internal control over financial reporting. As part of our audits we are required to obtain an understanding of internal control over financial reporting but not for the purpose of expressing an opinion on the effectiveness of the Company's internal control over financial reporting. Accordingly, we express no such opinion.
Our audits inclu ded performing procedures to assess the risks of material misstatement of the consolidated financial statements, whether due to error or fraud, and performing procedures that respond to those risks. Such procedures included examining, on a test basis, evidence regarding the amounts and disclosures in the consolidated financial statements. Our audits also included evaluating the accounting principles used and significant estimates made by management, as well as evaluating the overall presentation of the consolidated financial statements. We believe that our audits provide a reasonable basis for our opinion.
/s/ PricewaterhouseCoopers LLP
Boston, MA
April 12, 2018
We have served as the Company's auditor since 2009, which includes periods before the Company became subject to SEC reporting requirements.
F-2
Report of Independent Registered Public Accounting Firm
To the Board of Directors a nd Shareh o l d ers of J.Jill, Inc.
In our opini o n, the accompanying cons o l i dated state m ents of ope r a t ions and co m p rehensi v e income (loss), o f members' equity and of cash flows for the period from Feb r u a ry 1, 2015 to May 7, 2015 present f airly, in all m aterial resp ec ts, the res u lts of operations and cash flows of J.Jill, Inc. and its s ubsidiar i es (Prede c essor) f or the period from Feb r ua r y 1, 2015 to May 7, 2015 in conform i ty w i th acco u nt i ng principles g e nerally a c cep t ed in the Un it ed S tates of America. These fin a nc i al sta t em e nts are the r e sponsibility of t h e Company's management. Our responsibility is to express an o p ini o n on these fin a nc i al sta t em e nts based o n our audit. W e c ondu c t e d our audit of these financial statements in acc o rd a nce with the s tandards of the Public Company Acco u nt i ng O versight Boa r d (Un i ted St a tes). Tho s e standards req u ire that we plan and perfo r m the audit to obtain rea s onable assur a nce a bo u t whether t h e fin a n c ial s tatements are free of material mi s statement. An aud i t in cl udes exam i n i ng, on a test basis, evidence supporting the amounts a nd disclosures in the finan c ial st a t em e nts, asse s s ing t h e acc o unt i ng princ i ples used a nd signific a nt e s timates made by manag e me n t, and eva l uat i ng the o verall financi a l statem e nt pres en tati o n. We b e lie v e that our audit provides a re a s onable basis for our opinion.
/s/ Pricew a terh o useCoopers L LP Boston, Mas s achusetts
October 21, 2 0 16, except for the effects of the corpora t e conversion as discussed in Note 1, Note 13 and Note 1 5, and the parent m erger discus s ed in N o te 1 as to which the date is Feb r uary 25, 2017
F-3
J.Jill, Inc.
CONSOLIDATED BALANCE SHEETS
(in thousands, except unit data)
|
| February 3, 2018 |
|
| January 28, 2017 |
| ||
Assets |
|
|
|
|
|
|
|
|
Current assets: |
|
|
|
|
|
|
|
|
Cash |
| $ | 25,978 |
|
| $ | 13,468 |
|
Accounts receivable |
|
| 4,733 |
|
|
| 3,851 |
|
Inventories, net |
|
| 80,591 |
|
|
| 66,641 |
|
Prepaid expenses and other current assets |
|
| 21,166 |
|
|
| 18,559 |
|
Receivable from related party |
|
| - |
|
|
| 1,922 |
|
Total current assets |
|
| 132,468 |
|
|
| 104,441 |
|
Property and equipment, net |
|
| 118,420 |
|
|
| 102,322 |
|
Intangible assets, net |
|
| 148,961 |
|
|
| 163,483 |
|
Goodwill |
|
| 197,026 |
|
|
| 197,026 |
|
Other assets |
|
| 682 |
|
|
| 1,033 |
|
Total assets |
| $ | 597,557 |
|
| $ | 568,305 |
|
Liabilities and Shareholders' / Members' Equity |
|
|
|
|
|
|
|
|
Current liabilities: |
|
|
|
|
|
|
|
|
Accounts payable |
| $ | 53,962 |
|
| $ | 38,438 |
|
Accrued expenses and other current liabilities |
|
| 48,759 |
|
|
| 46,121 |
|
Current portion of long-term debt |
|
| 2,799 |
|
|
| 2,799 |
|
Total current liabilities |
|
| 105,520 |
|
|
| 87,358 |
|
Long-term debt, net of discount and current portion |
|
| 238,881 |
|
|
| 264,440 |
|
Deferred income taxes |
|
| 46,263 |
|
|
| 73,511 |
|
Other liabilities |
|
| 27,577 |
|
|
| 20,132 |
|
Total liabilities |
|
| 418,241 |
|
|
| 445,441 |
|
Commitments and contingencies (see Note 11) |
|
|
|
|
|
|
|
|
Shareholders' / Members' Equity |
|
|
|
|
|
|
|
|
Common stock, par value $0.01 per share; 250,000,000 shares authorized; 43,752,790 and zero shares issued and outstanding at February 3, 2018 and January 28, 2017, respectively |
|
| 437 |
|
|
| - |
|
Common units, zero par value, zero and 1,000,000 units authorized, issued and outstanding at February 3, 2018 and January 28, 2017, respectively |
|
| - |
|
|
| - |
|
Contributed capital |
|
| - |
|
|
| 116,743 |
|
Additional paid-in capital |
|
| 117,393 |
|
|
| - |
|
Accumulated earnings |
|
| 61,486 |
|
|
| 6,121 |
|
Total shareholders' / members' equity |
|
| 179,316 |
|
|
| 122,864 |
|
Total liabilities and shareholders' / members' equity |
| $ | 597,557 |
|
| $ | 568,305 |
|
The accompanying notes are an integral part of these consolidated financial statements.
F-4
J.Jill, Inc.
CONSOLIDATED STATEMENTS OF OPERATIONS AND
COMPREHENSIVE INCOME (LOSS)
(in thousands, except share and per share data)
|
| Successor |
|
|
| Predecessor |
| ||||||||||
|
| For the Fiscal Year Ended February 3, 2018 |
|
| For the Fiscal Year Ended January 28, 2017 |
|
| For the Period from May 8, 2015 to January 30, 2016 |
|
|
| For the Period from February 1, 2015 to May 7, 2015 |
| ||||
Net sales |
| $ | 698,145 |
|
| $ | 639,056 |
|
| $ | 420,094 |
|
|
| $ | 141,921 |
|
Costs of goods sold |
|
| 234,065 |
|
|
| 211,117 |
|
|
| 155,091 |
|
|
|
| 44,232 |
|
Gross profit |
|
| 464,080 |
|
|
| 427,939 |
|
|
| 265,003 |
|
|
|
| 97,689 |
|
Selling, general and administrative expenses |
|
| 394,893 |
|
|
| 368,525 |
|
|
| 246,482 |
|
|
|
| 80,151 |
|
Acquisition-related expenses |
|
| - |
|
|
| - |
|
|
| 8,560 |
|
|
|
| 13,341 |
|
Operating income |
|
| 69,187 |
|
|
| 59,414 |
|
|
| 9,961 |
|
|
|
| 4,197 |
|
Interest expense |
|
| 19,261 |
|
|
| 18,670 |
|
|
| 11,893 |
|
|
|
| 4,599 |
|
Income (loss) before provision for income taxes |
|
| 49,926 |
|
|
| 40,744 |
|
|
| (1,932 | ) |
|
|
| (402 | ) |
Income tax (benefit) provision |
|
| (5,439 | ) |
|
| 16,669 |
|
|
| 2,322 |
|
|
|
| 1,499 |
|
Net income (loss) and total comprehensive income (loss) |
| $ | 55,365 |
|
| $ | 24,075 |
|
| $ | (4,254 | ) |
|
| $ | (1,901 | ) |
Net income (loss) per common share attributable to common shareholders: |
|
|
|
|
|
|
|
|
|
|
|
|
|
|
|
|
|
Basic |
| $ | 1.32 |
|
| $ | 0.55 |
|
| $ | (0.10 | ) |
|
| $ | (0.04 | ) |
Diluted |
| $ | 1.27 |
|
| $ | 0.55 |
|
| $ | (0.10 | ) |
|
| $ | (0.04 | ) |
Weighted average number of common shares outstanding: |
|
|
|
|
|
|
|
|
|
|
|
|
|
|
|
|
|
Basic |
|
| 41,926,157 |
|
|
| 43,747,944 |
|
|
| 43,747,944 |
|
|
|
| 43,747,944 |
|
Diluted |
|
| 43,571,746 |
|
|
| 43,747,944 |
|
|
| 43,747,944 |
|
|
|
| 43,747,944 |
|
The accompanying notes are an integral part of these consolidated financial statements.
F-5
J.Jill, Inc.
CONSOLIDATED STATEMENTS OF MEMBERS' EQUITY
(PREDECESSOR)
(in thousands, except unit data)
|
| Preferred |
|
|
| Class A Units |
|
| Class B Units |
|
| Common Units |
|
| Contributed |
|
| Accumulated |
|
| Total Members' Equity |
| |||||||||||||||||||
|
| Capital |
|
|
| Units |
|
| Amount |
|
| Units |
|
| Amount |
|
| Units |
|
| Amount |
|
| Capital |
|
| (Deficit) |
|
| (Deficit) |
| ||||||||||
Balance, January 31, 2015 |
| $ | 72,824 |
|
|
|
| 100 |
|
| $ | 1 |
|
|
| 3,927,601 |
|
| $ | 39,276 |
|
|
| 1,000,000 |
|
| $ | - |
|
| $ | 7,292 |
|
| $ | (47,886 | ) |
| $ | (1,317 | ) |
Equity-based compensation |
|
| - |
|
|
|
| - |
|
|
| - |
|
|
| - |
|
|
| - |
|
|
| - |
|
|
| - |
|
|
| 441 |
|
|
| - |
|
|
| 441 |
|
Net loss |
|
| - |
|
|
|
| - |
|
|
| - |
|
|
| - |
|
|
| - |
|
|
| - |
|
|
| - |
|
|
| - |
|
|
| (1,901 | ) |
|
| (1,901 | ) |
Balance, May 7 2015 |
| $ | 72,824 |
|
|
|
| 100 |
|
| $ | 1 |
|
|
| 3,927,601 |
|
| $ | 39,276 |
|
|
| 1,000,000 |
|
| $ | - |
|
| $ | 7,733 |
|
| $ | (49,787 | ) |
| $ | (2,777 | ) |
Elimination of equity in connection with Acquisition (see Note 4) |
|
| (72,824 | ) |
|
|
| (100 | ) |
|
| (1 | ) |
|
| (3,927,601 | ) |
|
| (39,276 | ) |
|
| (1,000,000 | ) |
|
| - |
|
|
| (7,733 | ) |
|
| 49,787 |
|
|
| 2,777 |
|
Balance, May 8, 2015 |
| $ | - |
|
|
|
| - |
|
| $ | - |
|
|
| - |
|
| $ | - |
|
|
| - |
|
| $ | - |
|
| $ | - |
|
| $ | - |
|
| $ | - |
|
F-6
J.Jill, Inc.
CONSOLIDATED STATEMENTS OF SHAREHOLDERS' / MEMBERS' EQUITY
(SUCCESSOR)
(in thousands, except unit data)
|
| Common Units |
|
| Common Shares |
|
| Contributed |
|
| Additional Paid-in |
|
| Accumulated |
|
| Total Shareholders' / Members' |
| ||||||||||||||
|
| Units |
|
| Amount |
|
| Shares |
|
| Amount |
|
| Capital |
|
| Capital |
|
| Earnings |
|
| Equity |
| ||||||||
Balance, May 8, 2015 |
|
| 1,000,000 |
|
| $ | - |
|
|
| - |
|
| $ | - |
|
| $ | 170,657 |
|
| $ | - |
|
| $ | 1,594 |
|
| $ | 172,251 |
|
Equity-based compensation |
|
| - |
|
|
| - |
|
|
| - |
|
|
| - |
|
|
| 168 |
|
|
| - |
|
|
| - |
|
|
| 168 |
|
Net income |
|
| - |
|
|
| - |
|
|
| - |
|
|
| - |
|
|
| - |
|
|
| - |
|
|
| (4,254 | ) |
|
| (4,254 | ) |
Balance, January 30, 2016 |
|
| 1,000,000 |
|
| $ | - |
|
|
| - |
|
| $ | - |
|
| $ | 170,825 |
|
| $ | - |
|
| $ | (2,660 | ) |
| $ | 168,165 |
|
Distribution to member |
|
| - |
|
|
| - |
|
|
| - |
|
|
| - |
|
|
| (54,706 | ) |
|
| - |
|
|
| (15,294 | ) |
|
| (70,000 | ) |
Equity-based compensation |
|
| - |
|
|
| - |
|
|
| - |
|
|
| - |
|
|
| 624 |
|
|
| - |
|
|
| - |
|
|
| 624 |
|
Net income |
|
| - |
|
|
| - |
|
|
| - |
|
|
| - |
|
|
| - |
|
|
| - |
|
|
| 24,075 |
|
|
| 24,075 |
|
Balance, January 28, 2017 |
|
| 1,000,000 |
|
| $ | - |
|
|
| - |
|
| $ | - |
|
| $ | 116,743 |
|
| $ | - |
|
| $ | 6,121 |
|
| $ | 122,864 |
|
Other equity transactions |
|
| - |
|
|
| - |
|
|
| - |
|
|
| - |
|
|
| 305 |
|
|
| - |
|
|
| - |
|
|
| 305 |
|
Corporate conversion |
|
| (1,000,000 | ) |
|
| - |
|
|
| - |
|
|
| - |
|
|
| (117,048 | ) |
|
| 117,048 |
|
|
| - |
|
|
| - |
|
Issuance of common stock |
|
| - |
|
|
| - |
|
|
| 43,747,944 |
|
|
| 437 |
|
|
| - |
|
|
| (437 | ) |
|
| - |
|
|
| - |
|
Vesting of restricted stock |
|
| - |
|
|
| - |
|
|
| 4,846 |
|
|
| - |
|
|
| - |
|
|
| - |
|
|
| - |
|
|
| - |
|
Equity-based compensation |
|
| - |
|
|
| - |
|
|
| - |
|
|
| - |
|
|
| - |
|
|
| 782 |
|
|
| - |
|
|
| 782 |
|
Net income |
|
| - |
|
|
| - |
|
|
| - |
|
|
| - |
|
|
| - |
|
|
| - |
|
|
| 55,365 |
|
|
| 55,365 |
|
Balance, February 3, 2018 |
|
| - |
|
| $ | - |
|
|
| 43,752,790 |
|
| $ | 437 |
|
| $ | - |
|
| $ | 117,393 |
|
| $ | 61,486 |
|
| $ | 179,316 |
|
The accompanying notes are an integral part of these consolidated financial statements.
F-7
J.Jill, Inc.
CONSOLIDATED STATEMENTS OF CASH FLOWS
(in thousands)
|
| Successor |
|
|
| Predecessor |
|
| ||||||||||
|
| For the Fiscal Year Ended February 3, 2018 |
|
| For the Fiscal Year Ended January 28, 2017 |
|
| For the Period from May 8, 2015 to January 30, 2016 |
|
|
| For the Period from February 1, 2015 to May 7, 2015 |
|
| ||||
Net income (loss) |
| $ | 55,365 |
|
| $ | 24,075 |
|
| $ | (4,254 | ) |
|
| $ | (1,901 | ) |
|
Operating activities: |
|
|
|
|
|
|
|
|
|
|
|
|
|
|
|
|
|
|
Adjustments to reconcile net income (loss) to net cash provided by operating activities |
|
|
|
|
|
|
|
|
|
|
|
|
|
|
|
|
|
|
Depreciation and amortization |
|
| 35,040 |
|
|
| 36,219 |
|
|
| 28,702 |
|
|
|
| 5,147 |
|
|
Impairment of long lived assets |
|
| 2,164 |
|
|
| - |
|
|
| - |
|
|
|
| - |
|
|
Amortization of inventory fair value adjustment |
|
| - |
|
|
| - |
|
|
| 10,471 |
|
|
|
| - |
|
|
Gain on extinguishment of debt |
|
| (100 | ) |
|
| - |
|
|
| - |
|
|
|
| - |
|
|
Loss on disposal of fixed assets |
|
| 586 |
|
|
| 385 |
|
|
| 237 |
|
|
|
| 112 |
|
|
Noncash amortization of deferred financing and debt discount costs |
|
| 2,570 |
|
|
| 1,861 |
|
|
| 983 |
|
|
|
| 657 |
|
|
Payment-in-kind interest on debt |
|
| - |
|
|
| - |
|
|
| - |
|
|
|
| 1,192 |
|
|
Equity-based compensation |
|
| 782 |
|
|
| 624 |
|
|
| 168 |
|
|
|
| 441 |
|
|
Deferred rent liability |
|
| 985 |
|
|
| 1,785 |
|
|
| 3,071 |
|
|
|
| 84 |
|
|
Deferred income taxes |
|
| (27,248 | ) |
|
| (4,541 | ) |
|
| (7,261 | ) |
|
|
| (961 | ) |
|
Changes in operating assets and liabilities, net of Acquisition |
|
|
|
|
|
|
|
|
|
|
|
|
|
|
|
|
|
|
Accounts receivable |
|
| (882 | ) |
|
| (687 | ) |
|
| 4,017 |
|
|
|
| (3,504 | ) |
|
Inventories |
|
| (13,950 | ) |
|
| (2,235 | ) |
|
| (1,577 | ) |
|
|
| (6,955 | ) |
|
Prepaid expenses and other current assets |
|
| (2,607 | ) |
|
| 1,980 |
|
|
| (7,112 | ) |
|
|
| (1,716 | ) |
|
Accounts payable |
|
| 15,322 |
|
|
| (2,630 | ) |
|
| 3,931 |
|
|
|
| (7,608 | ) |
|
Accrued expenses |
|
| 1,272 |
|
|
| 3,318 |
|
|
| 6,390 |
|
|
|
| 18,827 |
|
|
Other noncurrent assets |
|
| (7 | ) |
|
| (13 | ) |
|
| (1,113 | ) |
|
|
| 12 |
|
|
Other noncurrent liabilities |
|
| 7,062 |
|
|
| 7,059 |
|
|
| 5,349 |
|
|
|
| 1,906 |
|
|
Net cash provided by operating activities |
|
| 76,354 |
|
|
| 67,200 |
|
|
| 42,002 |
|
|
|
| 5,733 |
|
|
Investing activities: |
|
|
|
|
|
|
|
|
|
|
|
|
|
|
|
|
|
|
Acquisition, net of cash acquired |
|
| - |
|
|
| - |
|
|
| (385,744 | ) |
|
|
| - |
|
|
Purchases of property and equipment |
|
| (38,372 | ) |
|
| (37,077 | ) |
|
| (26,559 | ) |
|
|
| (7,406 | ) |
|
Net cash used in investing activities |
|
| (38,372 | ) |
|
| (37,077 | ) |
|
| (412,303 | ) |
|
|
| (7,406 | ) |
|
Financing activities: |
|
|
|
|
|
|
|
|
|
|
|
|
|
|
|
|
|
|
Repurchase of Common Units |
|
| - |
|
|
| (305 | ) |
|
| - |
|
|
|
| - |
|
|
Repayments on long-term debt |
|
| (27,699 | ) |
|
| (12,775 | ) |
|
| (1,250 | ) |
|
|
| (5,646 | ) |
|
Proceeds from long-term debt |
|
| - |
|
|
| 40,000 |
|
|
| 250,000 |
|
|
|
| - |
|
|
Payment of debt issuance costs |
|
| - |
|
|
| (1,668 | ) |
|
| (9,640 | ) |
|
|
| - |
|
|
Proceeds from equity investment |
|
| - |
|
|
| - |
|
|
| 160,546 |
|
|
|
| - |
|
|
Receivable from related party |
|
| 2,227 |
|
|
| 588 |
|
|
| (1,850 | ) |
|
|
| - |
|
|
Distribution to member |
|
| - |
|
|
| (70,000 | ) |
|
| - |
|
|
|
| - |
|
|
Proceeds from revolving credit facility |
|
| - |
|
|
| - |
|
|
| - |
|
|
|
| 58,750 |
|
|
Repayments of revolving credit facility |
|
| - |
|
|
| - |
|
|
| - |
|
|
|
| (51,500 | ) |
|
Net cash (used in) provided by financing activities |
|
| (25,472 | ) |
|
| (44,160 | ) |
|
| 397,806 |
|
|
|
| 1,604 |
|
|
Net change in cash |
|
| 12,510 |
|
|
| (14,037 | ) |
|
| 27,505 |
|
|
|
| (69 | ) |
|
Cash: |
|
|
|
|
|
|
|
|
|
|
|
|
|
|
|
|
|
|
Beginning of Period |
|
| 13,468 |
|
|
| 27,505 |
|
|
| - |
|
|
|
| 604 |
|
|
End of Period |
| $ | 25,978 |
|
| $ | 13,468 |
|
| $ | 27,505 |
|
|
| $ | 535 |
|
|
Supplemental cash flow information: |
|
|
|
|
|
|
|
|
|
|
|
|
|
|
|
|
|
|
Cash paid for interest |
| $ | 16,390 |
|
| $ | 16,406 |
|
| $ | 11,192 |
|
|
| $ | 2,952 |
|
|
Cash paid for taxes |
|
| 20,521 |
|
|
| 15,497 |
|
|
| 16,033 |
|
|
|
| 882 |
|
|
Noncash investing and financing activities: |
|
|
|
|
|
|
|
|
|
|
|
|
|
|
|
|
|
|
Noncash purchase consideration |
|
| - |
|
|
| - |
|
|
| 10,111 |
|
|
|
| - |
|
|
Capital expenditures financed with the ending balance in accounts payable and accrued expenses |
|
| 2,404 |
|
|
| 740 |
|
|
| 1,274 |
|
|
|
| 2,547 |
|
|
The accompanying notes are an integral part of these consolidated financial statements.
F-8
J.Jill, Inc.
Notes to Consolidated Financial Statements
1. General
J.Jill, Inc., "J.Jill" or the "Company", is a nationally recognized women's apparel brand, headquartered in Quincy, Massachusetts, focused on affluent customers in the 40-65 age segment in 42 states. J.Jill operates an integrated omnichannel platform that is well diversified across its retail stores, website and catalogs.
J.Jill, Inc. was formed on February 24, 2017, when the Company converted from a Delaware limited liability company named Jill Intermediate LLC ("Intermediate") into a Delaware corporation named J.Jill, Inc. In conjunction with the conversion, all of Intermediate's outstanding equity interests converted into 43,747,944 shares of common stock. Accordingly, all share and per share amounts for all periods presented in the accompanying financial statements and notes thereto have been adjusted retroactively, where applicable, to reflect this conversion.
Intermediate had one class of equity interests, all of which were held by JJill Holdings, Inc. ("Holdings"), its former direct parent company, and JJill Topco Holdings, LP ("Topco"), the direct parent company of Holdings. In conjunction with the Company's conversion into a Delaware corporation, JJill Holdings and JJill Topco Holdings each received shares of common stock in proportion to the percentage of Intermediate's equity interests held by them prior to the conversion.
Following the Company's conversion into a Delaware corporation, Holdings, the Company's former direct parent, merged with and into J.Jill, Inc., and J.Jill, Inc. was the surviving entity to such merger ("Parent Merger"). The Company's consolidated financial statements were retroactively restated to reflect the Parent Merger as of the earliest date that common control existed in the period in which the Parent Merger occurred.
In connection with the conversion, J.Jill, Inc. continues to hold all assets of Intermediate and assumed all of its liabilities and obligations. J.Jill, Inc. is a holding company, and Jill Acquisition LLC, its wholly-owned subsidiary, remains the operating company for the business assets.
Intermediate was a Delaware Limited Liability Company that was formed on February 17, 2011 and held the ownership interests of Jill Acquisition LLC and its subsidiaries. On May 8, 2015, a 94% controlling interest in the Company was acquired (the "Acquisition") by Holdings and the remaining 6% was acquired by Topco, a Delaware limited partnership formed by TowerBrook Capital Partners L.P. ("TowerBrook"). The purchase price was $396.4 million, which consisted of $386.3 million of cash consideration and $10.1 million of noncash consideration in the form of an equity rollover by management. Holdings, a Delaware corporation, was formed for the purpose of effecting the Acquisition and had no operations of its own, except for costs incurred related to the Acquisition. Holdings was a wholly-owned subsidiary of Topco. Holdings accounted for the Acquisition as a business combination under the acquisition method of accounting. Accordingly, the assets acquired and liabilities assumed were recorded at fair value with the remaining purchase price recorded as goodwill (see Note 4). The Company elected to pushdown the effects of the Acquisition to its consolidated financial statements.
2. Summary of Significant Accounting Policies
Basis of Presentation
The consolidated financial statements for the periods beginning and subsequent to May 8, 2015 represent the financial information of the Company and its subsidiaries subsequent to the Acquisition and are labeled as Successor ("Successor"). The consolidated financial statements prior to and including May 7, 2015 represent the financial information of the Company and its subsidiaries prior to the Acquisition, as well as consolidated variable interest entities ("VIEs") (see Note 10), and are labeled as Predecessor ("Predecessor"). Due to the change in the basis of accounting resulting from the Acquisition, the Company's consolidated financial statements for these reporting periods are not comparable.
The consolidated financial statements have been prepared in conformity with accounting principles generally accepted in the United States of America ("GAAP").
The Company uses a 52 to 53 week fiscal year ending on the Saturday closest to January 31. Each fiscal year generally is comprised of four 13 week fiscal quarters, although in the years with 53 weeks the fourth quarter represents a 14 week period. The Successor fiscal years of 2017 had 53 weeks of operations and 2016 had 52 weeks of operations. The period from
F-9
May 8, 2015 to January 30, 2016 (Succe ssor period) included approximately 38 weeks of operations. The period from February 1, 2015 to May 7, 2015 (Predecessor period) included approximately 14 weeks of operations.
Use of Estimates
The preparation of the consolidated financial statements in accordance with GAAP requires management to make estimates and judgments that affect reported amounts of assets, liabilities, members' equity, net sales and expenses, and the disclosure of contingent assets and liabilities. Significant estimates relied upon in preparing these consolidated financial statements include, but are not limited to, revenue recognition, including merchandise returns and accounting for gift card breakage; accounting for business combinations; estimating the fair value of inventory and inventory reserves; impairment assessments of goodwill, intangible assets, and other long-lived assets; and equity-based compensation. Actual results could differ from those estimates.
Principles of Consolidation
The accompanying consolidated financial statements include the assets, liabilities and results of operations of the Company and its subsidiaries. For periods prior to the Acquisition, the consolidated financial statements include the assets, liabilities and results of operations of the Predecessor and its subsidiaries, as well as consolidated VIEs, for which the Predecessor had determined that it was the primary beneficiary (see Note 10). All intercompany balances and transactions have been eliminated in the consolidated financial statements.
Segment Reporting
The Company determined its operating segments on the same basis that it assesses performance and makes operating decisions. The Company's operating segments consist of its retail and direct channels, which have been aggregated into one reportable segment.
All of the Company's identifiable assets are located in the United States, which is where the Company is domiciled. The Company does not have sales outside the United States, nor does any customer represent more than 10% of total revenues for any period presented.
Variable Interest Entities
The Company regularly evaluates its relationships with other entities to identify whether they are variable interest entities and to assess whether it is the primary beneficiary of such entities. Under GAAP, a reporting entity shall consolidate a VIE when that reporting entity has a variable interest that provides the reporting entity with a controlling financial interest. The entity that ultimately consolidates the VIE shall be the reporting entity that a) has the power to direct the activities of the VIE that most significantly impact the VIE's economic performance, and b) has the obligation to absorb losses or the right to receive benefits from the VIE that could be significant to the VIE. If the determination is made that a company is the primary beneficiary of a variable interest entity, then that entity is included in its consolidated financial statements.
As of January 31, 2015 (Predecessor), the Company determined that it had a variable interest in three unrelated entities for which it determined it was the primary beneficiary (see Note 10). These VIEs were consolidated during the 2015 Predecessor period and all intercompany transactions were eliminated in consolidation.
Concurrent with the May 8, 2015 Acquisition (see Note 4), the obligations held by each of the three VIEs were repaid in full and no further obligations remained. Accordingly, these entities were not consolidated in the 2015 Successor period and they were dissolved.
Business Combinations
The Company accounts for business combinations under the acquisition method of accounting. Under this method, acquired assets, including separately identifiable intangible assets, and any assumed liabilities are recorded at their acquisition date estimated fair value. The excess of purchase price over the fair value amounts assigned to the assets acquired and liabilities assumed represents the goodwill amount resulting from the acquisition. Determining the fair value of assets acquired and liabilities assumed involves the use of significant estimates and assumptions.
F-10
Concurrent with the Acquisition, the Company elected to apply pushdown accounting. Pushdown accounting refers to the use of the acquirer's basis in the preparation of the acquiree's separate financial statements as the new basis of account ing for the acquiree. See Note 4 for a discussion of the Acquisition and the related impact of pushdown accounting on the Company's consolidated financial statements.
Accounts Receivable
The Company's accounts receivable relate primarily to payments due from banks for credit and debit transactions for approximately 2 to 5 days of sales. These receivables do not bear interest.
Inventories
Inventory consists of finished goods held for sale. Inventory is stated at the lower of cost or net realizable value, net of reserves. Cost is calculated using the weighted average method of accounting, and includes the cost to purchase merchandise from the Company's manufacturers plus duties, inbound freight and commissions. The net realizable value of the Company's inventory is estimated based on historical experience, current and forecasted demand, and market conditions. The allowance for excess and obsolete inventory requires management to make assumptions and to apply judgment regarding a number of factors, including past and projected sales performance and current inventory levels. As of February 3, 2018 and January 28, 2017, an inventory reserve of $1.8 million and $2.0 million has been recorded, respectively. The Company sells excess inventory in its stores and on-line at www.jjill.com. In limited cases, inventory liquidators are utilized.
Inventory from domestic suppliers is recorded when it is received at the distribution center. Inventory from foreign suppliers is recorded when goods are cleared for export on board the ship at the port of shipment.
Property and Equipment
Property and equipment purchases are recorded at cost. Property and equipment is presented net of accumulated depreciation. Depreciation is computed using the straight-line method over the estimated useful lives of the respective assets. Leasehold improvements are amortized over the shorter of the term of the related lease or the estimated useful lives of the improvements. Expenditures for repairs and maintenance are charged to expense as incurred. Expenditures for betterments and major improvements that significantly enhance the value and increase the estimated useful life of the asset are capitalized and depreciated over the new estimated useful life. The carrying amounts of assets sold or retired and the related accumulated depreciation are eliminated in the year of disposal, and any resulting gains or losses are included in the accompanying consolidated statements of operations and comprehensive income (loss).
Estimated useful lives of property and equipment asset categories are as follows:
|
|
Furniture, fixtures and equipment | 5-7 years |
Computer software and hardware | 3-5 years |
Leasehold improvements | Shorter of estimated useful life or lease term |
Capitalized Interest
The cost of interest that is incurred in connection with ongoing construction projects is capitalized using a weighted average interest rate. These costs are included in property and equipment and amortized over the useful life of the related property or equipment.
Long-lived Assets
The carrying value of long-lived assets, including amortizable identifiable intangible assets, and asset groups are evaluated whenever events or changes in circumstances indicate that the carrying value may not be recoverable. Conditions that may indicate impairment include, but are not limited to, a significant decrease in the market price of an asset, a significant adverse change in the extent or manner in which an asset is being used or a significant decrease in its physical condition, and operating or cash flow performance that demonstrates continuing losses associated with an asset or asset group. A potential impairment has occurred if the projected future undiscounted cash flows expected to result from the use and eventual disposition of the asset or asset group are less than the carrying value of the asset or asset group. The estimate of cash flows includes management's assumptions of cash inflows and outflows directly resulting from the use of the asset in operation. If the carrying value exceeds the sum of the undiscounted cash flows, an impairment charge is recorded equal to
F-11
the excess of the asset or asset group's carrying value over its fair value. Fair value is measured based on a projected discounted cash flow model using a discount rate the Comp any believes is commensurate with the risk inherent in its business. Any impairment charge would be recognized within operating expenses as a selling, general and administrative expense.
Goodwill and Indefinite-lived Intangible Assets
Goodwill and indefinite-lived intangible assets are not amortized, but are reviewed for impairment at least annually, or more frequently when events or changes in circumstances indicate that the carrying value may not be recoverable. Judgments regarding indicators of potential impairment are based on market conditions and operational performance of the business.
At each fiscal year-end, the Company performs an impairment analysis of goodwill. The Company may assess its goodwill for impairment initially using a qualitative approach ("step zero") to determine whether conditions exist to indicate that it is more likely than not that the fair value of a reporting unit is less than its carrying value. If management concludes, based on its assessment of relevant events, facts and circumstances that it is more likely than not that a reporting unit's carrying value is greater than its fair value, then a quantitative analysis will be performed to determine if there is any impairment. The Company may also elect to initially perform a quantitative analysis instead of starting with step zero. The quantitative assessment requires comparing the fair value of a reporting unit to its carrying value, including goodwill. The Company estimates fair value using the income approach. The income approach uses a discounted cash flow model, which involves significant estimates and assumptions, including preparation of revenue and profitability growth forecasts, selection of a discount rate, and selection of a terminal year multiple.
If the fair value of a reporting unit exceeds its carrying amount, goodwill is not considered to be impaired and no further testing is required. If the carrying amount exceeds the reporting unit's fair value, a goodwill impairment charge is recognized for the amount in excess, not to exceed the total amount of goodwill allocated to that reporting unit. An impairment charge is recorded as a selling, general and administrative expense within the Company's consolidated statement of operations and comprehensive income (loss).
At each year end, the Company also performs an impairment analysis of its indefinite-lived intangible assets. Impairment losses are recorded to the extent that the carrying value of the indefinite-lived intangible asset exceeds its fair value. The Company measures the fair value of its trade name using the income approach, which uses a discounted cash flow model. The most significant estimates and assumptions inherent in this approach are the preparation of revenue and profitability growth forecasts, selection of a discount rate and a terminal year multiple.
Revenue Recognition
Revenue is primarily derived from the sale of apparel and accessory merchandise through our retail channel and direct channel, which includes website and catalog phone orders and is recognized when all of the following criteria are satisfied: (i) persuasive evidence of an arrangement exists; (ii) the price is fixed or determinable; (iii) collectability is reasonably assured; and (iv) delivery of products has occurred. Revenue also includes shipping and handling fees collected from customers. Revenue from our retail channel is recognized at the time of sale and revenue from our direct channel is recognized upon receipt of merchandise by the customer.
The Company has a return policy where merchandise returns will be accepted within 90 days of the original purchase date. At the sole discretion of the Company, returns may also be accepted after 90 days as a customer accommodation. At the time of sale, the Company records an estimated sales reserve for merchandise returns based on historical prior returns experience and expected future returns. The Company collects and remits sales and use taxes in all states in which retail and direct sales occur and taxes are applicable. These taxes are reported on a net basis and are thereby excluded from revenue.
Shipping and handling costs of $14.5 million, $12.6 million, $7.9 million and $2.3 million were recorded in selling, general and administrative expenses, for the 2017, 2016, 2015 Successor and 2015 Predecessor periods, respectively. Customer payments made in advance of the customer receiving merchandise are recorded as deferred revenue within accrued expenses and other liabilities in the Company's consolidated balance sheets.
The Company sells gift cards without expiration dates to customers. The Company does not charge administrative fees on unused gift cards. Proceeds from the sale of gift cards are recorded as deferred revenue until the customer redeems the gift card or when the likelihood of redemption is remote. Based upon historical experience, the Company estimates the value of outstanding gift cards that will ultimately not be redeemed ("gift card breakage") and will not be escheated under statutory
F-12
unclaimed property laws. This gift card breakage amount is recognized as revenue over the time period established by the Company's historical gift card redemption pattern.
The Company recognized gift card breakage revenue of $0.9 million, $0.7 million, $0.4 million and $0.3 million during the 2017, 2016, 2015 Successor and 2015 Predecessor periods, respectively.
The Company also receives royalty payments through its private label credit card agreement. The royalty payments are recognized as revenue as they are received over the term of the agreement. Royalty payments recognized were $4.7 million, $2.9 million, $1.3 million and $0.5 million for the 2017, 2016, 2015 Successor and 2015 Predecessor periods, respectively.
Costs of Goods Sold
The Company's costs of goods sold includes the direct costs of sold merchandise, which include customs, taxes, duties, commissions and inbound shipping costs, inventory shrinkage, and adjustments and reserves for excess, aged and obsolete inventory. Costs of goods sold does not include distribution center costs and allocations of indirect costs, such as occupancy, depreciation, amortization, or labor and benefits.
Advertising Costs
The Company incurs costs to produce, print, and distribute its catalogs. Catalog costs are considered direct response advertising, are capitalized as incurred, and are amortized over the expected sales life of each catalog for a period generally not exceeding six months. The expected sales life of each catalog is determined based on a detailed marketing forecast, which considers historical experience for similar catalogs, coupled with current sales trends. Amortized catalog advertising expenses were approximately $39.2 million, $34.2 million, $21.6 million and $7.8 million for the 2017, 2016, 2015 Successor and 2015 Predecessor periods, respectively, and are included in selling, general and administrative expenses in the accompanying consolidated statements of operations and comprehensive income (loss).
Other advertising costs are recorded as incurred. Other advertising expenses recorded were $20.9 million, $18.4 million, $10.9 million and $3.2 million for the 2017, 2016, 2015 Successor and 2015 Predecessor periods, respectively, and are included in selling, general and administrative expenses in the accompanying consolidated statements of operations and comprehensive income (loss).
Operating Leases and Deferred Rent
Certain operating leases contain predetermined escalations of the minimum rental payments to be made over the lease term. The Company recognizes the related rent expense on a straight-line basis over the life of the lease, taking into account fixed escalations as well as reasonably assured renewal periods.
Certain retail store leases include allowances from landlords in the form of cash. These allowances are part of the negotiated terms of the lease. The Company records the full amount of the allowance when specific performance criteria are met as a deferred liability. The deferred liability is amortized into income as a reduction of rent expense over the term of the applicable lease, including reasonably assured renewal periods. The Company recognizes those liabilities to be amortized within a year as a current liability and those greater than a year as a long-term liability. For purposes of recognizing these allowances and minimum rental expenses on a straight-line basis, the Company uses the date it obtains the legal right to use and control the leased space to begin amortization, which is generally when the Company takes possession of the space and begins to make improvements in preparation for its intended use.
Certain retail store leases also provide for contingent rent in addition to fixed rent. The contingent rent is determined as a percentage of gross sales in excess of predefined levels. The Company records a rent liability in accrued liabilities and the corresponding rent expense when it becomes probable that the Company will achieve a specified gross sales amount.
F-13
Certain store operating leases contain cancellation clauses allowing the leases to be terminated at the Company's discretion, provided certain minimum sales levels are not achieved within a defined period of time after opening. The Company has not historic ally exercised these cancellation clauses and has therefore disclosed commitments for the full terms of such leases in the accompanying disclosures.
Debt Issuance Costs
The Company defers costs directly associated with acquiring third-party financing. Debt issuance costs are deferred and amortized using the effective interest rate method over the term of the related long-term debt agreement and the straight-line method for the revolving credit agreement. Debt issuance costs related to long-term debt are reflected as a direct deduction from the carrying amount of the debt. From time-to-time the Company could make prepayments on the long-term debt and a portion of the debt issuance costs associated with the prepayment would be accelerated and expensed at that time.
Income Taxes
The Company accounts for income taxes using the asset and liability method and elected to be taxed as a C corporation. Under this method, deferred tax assets and liabilities are recognized for the expected future tax consequences of temporary differences between the financial statement carrying values and their respective tax bases, using enacted tax rates expected to be applicable in the years in which the temporary differences are expected to reverse. Changes in deferred tax assets and liabilities are recorded in the provision for income taxes. The Company evaluates the realizability of its deferred tax assets and establishes a valuation allowance when it is more likely than not that all or a portion of the deferred tax assets will not be realized. Potential for recovery of deferred tax assets is evaluated by estimating the future taxable profits expected, scheduling of anticipated reversals of taxable temporary differences, and considering prudent and feasible tax planning strategies.
The Company records liabilities for uncertain income tax positions based on a two-step process. The first step is recognition, where an individual tax position is evaluated as to whether it has a likelihood of greater than 50% of being sustained upon examination based on the technical merits of the position, including resolution of any related appeals or litigation processes. For tax positions that are currently estimated to have less than a 50% likelihood of being sustained, no tax benefit is recorded. For tax positions that have met the recognition threshold in the first step, the Company performs the second step of measuring the benefit to be recorded. The amount of the benefit that may be recognized is the largest amount that has a greater than 50% likelihood of being realized on ultimate settlement. The actual benefits ultimately realized may differ from the estimates. In future periods, changes in facts, circumstances and new information may require the Company to change the recognition and measurement estimates with regard to individual tax positions. Changes in recognition and measurement estimates are recorded in income tax expense and liability in the period in which such changes occur.
Any interest or penalties incurred are recorded in the provision for income tax expense line item of the accompanying consolidated statements of operations and comprehensive income (loss). The Company incurred an immaterial amount of interest expense and penalties related to income taxes for the 2017 period and no amounts were incurred in the 2016, 2015 Successor or 2015 Predecessor periods.
Fair Value of Financial Instruments
Certain assets and liabilities are carried at fair value in accordance with GAAP. Fair value is defined as the exchange price that would be received for an asset or paid to transfer a liability (an exit price) in the principal or most advantageous market for the asset or liability in an orderly transaction between market participants on the measurement date.
Valuation techniques used to measure fair value requires the Company to maximize the use of observable inputs and minimize the use of unobservable inputs. The hierarchy gives the highest priority to unadjusted quoted prices in active markets for identical assets or liabilities (Level 1 measurements) and the lowest priority to unobservable inputs (Level 3 measurements). Financial assets and liabilities carried at fair value are to be classified and disclosed in one of the following three levels of the fair value hierarchy, of which the first two are considered observable and the last is considered unobservable:
| Level 1: | Quoted prices in active markets for identical assets or liabilities. |
| Level 2: | Observable inputs, other than Level 1 prices, such as quoted prices for similar assets or liabilities in active markets; quoted prices for similar assets or liabilities in markets that are not active; or other inputs other than quoted prices that are observable or can be corroborated by observable market data for substantially the full term of the assets or liabilities, including interest rates and yield curves, and market corroborated inputs. |
F-14
| Level 3: | Unobservable inputs for the asset or liability that are supported by little or no market activity and that are significant to the fair value of the ass ets or liabilities. These are valued based on management's estimates and assumptions that market participants would use in pricing the asset or liability. |
As of February 3, 2018 the Company had no assets or liabilities that were measured at fair value for reporting purposes on a recurring basis. The fair value of the Company's debt was approximately $245.8 million and $279.7 million at February 3, 2018 and January 28, 2017, respectively.
The Company believes that the carrying amounts of its other financial instruments, including cash, accounts receivable, accounts payable and any amounts drawn on its revolving credit facilities, consisting primarily of instruments without extended maturities, based on management's estimates, approximates their fair value due to the short-term maturities of these instruments.
Comprehensive Income (Loss)
Comprehensive income (loss) is a measure of net income (loss) and all other changes in equity that result from transactions other than with equity holders, and would normally be recorded in the consolidated statements of members' equity and the consolidated statements of comprehensive income (loss). The Company's management has determined that net income (loss) is the only component of the Company's comprehensive income (loss). Accordingly, there is no difference between net income (loss) and comprehensive income (loss).
Equity-based Compensation
Successor
The Company accounts for equity-based compensation for employees and directors by recognizing the fair value of equity-based compensation as an expense in the calculation of net income (loss), based on the grant-date fair value. The Company recognizes equity-based compensation expense in the periods in which the employee or director is required to provide service, which is generally over the vesting period of the individual equity instruments. The fair value of the equity-based awards is determined using the Black-Scholes option pricing model.
All of the equity-based awards granted by the Company during fiscal year 2017, 2016 and the 2015 Successor period were considered equity-classified awards and compensation expense for these awards was fully recognized and forfeitures were recorded as they occurred.
The Company recognizes equity-based compensation generated at Topco and records the related expense in its consolidated financial statements as the costs are deemed to be for the benefit of the Company (see Note 16). The expenses were allocated from the parent level to the Company and recognized as an equity contribution prior to the corporate conversion.
Predecessor
The Predecessor accounted for liability-classified equity-based compensation for employees and a director of the Company by recognizing the value of equity-based compensation as an expense in the calculation of net income (loss), based on the intrinsic value of the award, in accordance with ASC 718. The awards were revalued at each reporting period and the Predecessor recognized the related equity-based compensation expense.
The Predecessor recognized equity-based compensation generated at JJIP LLC ("JJIP") (see Note 16) and recognized the related expense in the Predecessor's consolidated financial statements. These equity-based compensation costs were incurred by JJIP and deemed to be for the benefit of J.Jill, and were therefore recognized as an equity contribution by the Company.
Earnings Per Share
Basic net income (loss) per common share attributable to common shareholders is calculated by dividing net income (loss) attributable to common shareholders by the weighted average number of common shares outstanding for the period. Diluted net income (loss) per common share attributable to common shareholders is calculated by dividing net income (loss) attributable to common shareholders by the diluted weighted average number of common shares outstanding for the period.
F-15
There were 1.6 million di lutive securities outstanding during fiscal year 2017. There were no potentially dilutive securities outstanding during fiscal year 2016, the 2015 Successor, or 2015 Predecessor periods.
Credit Card Agreement
The Company has an arrangement with a third party to provide a private label credit card to its customers through February 2018 with two, two-year extension periods. The Company does not bear the credit risk associated with the private label credit card at any point prior to the termination of the agreement, at which point the Company is obligated to purchase the receivables. If the arrangement is terminated prior to September 7, 2021 and other criteria are met, the Company is obligated to pay a purchase price premium. The potential impact of the purchase obligation cannot be reasonably estimated as of the issuance date.
The Company also receives reimbursements for costs of marketing programs related to the credit card, which are recorded as a reduction in operating expenses in the accompanying consolidated statements of operations and comprehensive income (loss). Reimbursements amounted to $1.3 million, $1.6 million, $0.6 million and $0.2 million for the 2017, 2016, 2015 Successor and 2015 Predecessor periods, respectively.
The Company also receives royalty payments from the credit card agreement, as discussed in Revenue Recognition , above.
Employee Benefit Plan
The Company has a 401(k) retirement plan under third-party administration covering all eligible employees who meet certain age and employment requirements pursuant to Section 401(k) of the Internal Revenue Code. Subject to certain dollar limits, eligible employees may contribute a portion of their pretax annual compensation to the plan, on a tax-deferred basis. The plan operates on a calendar year basis. The Company may, at its discretion, make elective contributions of up to 50% of the first 6% of the gross salary of the employee, which vests over a five year period. Discretionary contributions made by the Company for the 2017, 2016, 2015 Successor and 2015 Predecessor periods, were $1.1 million, $0.6 million, $0.4 million and $0.2 million, respectively.
Concentration of Credit Risks
Financial instruments that potentially subject the Company to concentrations of credit risk principally consist of cash held in financial institutions and accounts receivable. The Company considers the credit risk associated with these financial instruments to be minimal. Cash is held by financial institutions with high credit ratings and the Company has not historically sustained any credit losses associated with its cash balances. The Company evaluates the credit risk associated with accounts receivable to determine if an allowance for doubtful accounts is necessary. As of February 3, 2018 and January 28, 2017, the Company determined that no allowance for doubtful accounts was necessary.
3. Accounting Standards
Recently Adopted Accounting Standards
In January 2017, the FASB issued ASU 2017-04, Intangibles - Goodwill and Other (Topic 350) : Simplifying the Accounting for Goodwill Impairment . ASU 2017-04 removes Step 2 of the goodwill impairment test, which requires a hypothetical purchase price allocation. A goodwill impairment will now be the amount by which a reporting unit's carrying value exceeds its fair value, not to exceed the carrying amount of goodwill. This standard was early adopted as of January 29, 2017. The adoption of ASU 2017-04 was done on a prospective basis and did not have a material impact on the consolidated financial statements.
In March 2016, the FASB issued ASU 2016-09, Improvements to Employee Share-Based Payment Accounting . The amendments in this update involve several aspects of accounting for equity-based payment transactions, including income tax consequences, classification of awards, and classification on the statement of cash flows. For public business entities, the amendments in this update are effective for annual periods beginning after December 15, 2016, and interim periods within those annual periods. The adoption of ASU 2016-09 was done on a prospective basis and did not have a material impact on the consolidated financial statements.
F-16
In July 2015, the FASB issued ASU 2015-11 , Simplifying the Measurement of Inventory . The amendments in this update more closely align the mea surement of inventory in GAAP with the measurement of inventory in International Financial Reporting Standards, under which an entity should measure inventory at the lower of cost or net realizable value. Net realizable value is the estimated selling price in the ordinary course of business, less reasonably predictable costs of completion, disposal, and transportation. The adoption of ASU 2015-11 was done on a prospective basis and did not have a material impact on the consolidated financial statements.
Recently Issued Accounting Pronouncements
In October 2016 the FASB issued ASU 2016-16, Income Taxes (Topic 740): Intra-Entity Transfers of Assets Other Than Inventory . This update is intended to improve the accounting for the income tax consequences of intra-entity transfers of assets other than inventory. Under the new guidance, an entity would recognize the current and deferred income tax consequences of an intra-entity asset transfer when the transfer occurs. Intra-entity inventory transfers would still be an exception. The provisions of ASU 2016-16 are effective for reporting periods beginning after December 15, 2017. Early adoption is permitted. The amendments in this update should be applied on a modified retrospective basis through a cumulative-effect adjustment directly to retained earnings as of the beginning of the period of adoption. The Company is evaluating the impact that adopting ASU 2016-16 will have on its consolidated financial statements, but does not expect that impact to be material.
In August 2016, the FASB issued ASU 2016-15, Statement of Cash Flows - Classification of Certain Cash Receipts and Cash Payments, which addresses eight specific cash flow issues with the objective of reducing the existing diversity in practice in how certain cash receipts and cash payments are presented and classified in the statement of cash flows. The standard is effective for fiscal years beginning after December 15, 2017, including interim periods within those fiscal years. Early adoption is permitted, including adoption in an interim period. The Company is evaluating the impact that adopting ASU 2016-15 will have on its consolidated financial statements.
In February 2016, the FASB issued ASU 2016-02, Leases . The amendments in this update include a new FASB ASC Topic 842, which supersedes Topic 840. The core principle of Topic 842 is that a lessee should recognize the assets and liabilities that arise from leases. For public business entities, the amendments in this update are effective for fiscal years beginning after December 15, 2018, including interim periods within those fiscal years. Early application is permitted for all entities as of the beginning of interim or annual reporting periods. The Company is currently evaluating the impact that adopting ASU 2016-02 will have on its consolidated financial statements and expects to raise significant "Right of Use" assets and significant, offsetting lease liabilities. These amounts have not yet been quantified.
In May 2014, the FASB issued ASU 2014-09, Revenue from Contracts with Customers-Topic 606 , which supersedes the revenue recognition requirements in FASB ASC 605. The new guidance established principles for reporting revenue and cash flows arising from an entity's contracts with customers. This new revenue recognition standard will replace most of the recognition guidance within GAAP. This guidance was deferred by ASU 2015-14, Revenue from Contracts with Customers (Topic 606) : Deferral of the Effective Date, issued by the FASB in August 2015, which deferred the effective date of ASU 2014-09 from annual and interim periods beginning after December 15, 2016 to annual and interim periods beginning after December 15, 2017. In March 2016, the FASB issued ASU 2016-08, Revenue from Contracts with Customers: Principal versus Agent Considerations , which further clarifies the implementation guidance in ASU 2014-09. In April 2016, the FASB issued ASU 2016-10, Revenue from Contracts with Customers (Topic 606) : Identifying Performance Obligations and Licensing, to expand the guidance on identifying performance obligations and licensing within ASU 2014-09. In May 2016, the FASB issued ASU 2016-12, Revenues from Contracts with Customers: Narrow-Scope Improvements and Practical Expedients , which amends the guidance in the new revenue standard on collectability, noncash consideration, presentation of sales tax, and transition. The amendments are intended to address implementation issues that were raised by stakeholders and provide additional practical expedients to reduce the cost and complexity of applying the new revenue standard. In December 2016, the FASB issued ASU 2016-20, Technical Corrections and Improvements to Topic 606, Revenue from Contracts with Customers, which addresses various technical corrections for the ASUs listed above. These standards are effective for fiscal years beginning after December 15, 2017, including interim periods within that reporting period. Earlier application is permitted only as of annual reporting periods beginning after December 15, 2016, including interim reporting periods within that reporting period. Based on the Company's assessment of these standards, it has identified certain changes to accounting policies, including the timing of revenue recognition, direct response advertising costs, the presentation of marketing program reimbursements under the private label credit card arrangement and the gross versus net presentation of merchandise returns. The Company will adopt the standard on February 4, 2018, using the modified retrospective method, which will result in a cumulative effect reduction to accumulated retained earnings of $0.3 million.
F-17
4. Acquisition
On May 8, 2015, Holdings, a wholly-owned subsidiary of Topco, acquired approximately 94% of the outstanding interests of the Company, with Topco acquiring the remaining 6% of the outstanding membership interests of the Company (the "Acquisition"). The purchase price was $396.4 million, which consisted of $386.3 million of cash consideration and $10.1 million of noncash consideration in the form of an equity rollover by management owners of the Predecessor entity. The Acquisition was funded through an equity contribution by Holdings and Topco and borrowings under the Company's term loan agreement (see Note 9).
The Acquisition resulted in a new basis of accounting for Holdings, and in accordance with the Company's election to apply pushdown accounting, the impact of the Acquisition has been recognized in the Successor periods of the Company's consolidated financial statements. The following table summarizes the final allocation of the $396.4 million purchase price to the assets acquired and liabilities assumed (in thousands):
|
| As of May 8, 2015 |
| |
Assets acquired: |
|
|
|
|
Cash |
| $ | 535 |
|
Accounts receivable |
|
| 7,181 |
|
Inventories |
|
| 73,300 |
|
Prepaid expenses and other |
|
| 13,427 |
|
Property and equipment |
|
| 78,684 |
|
Intangible assets |
|
| 192,300 |
|
Goodwill |
|
| 196,572 |
|
Other assets |
|
| 256 |
|
Total assets acquired |
|
| 562,255 |
|
Liabilities assumed: |
|
|
|
|
Current liabilities |
|
| 75,583 |
|
Deferred income taxes |
|
| 86,098 |
|
Other liabilities |
|
| 4,184 |
|
Total liabilities assumed |
|
| 165,865 |
|
Net assets acquired |
| $ | 396,390 |
|
As a result of the Company pushing down the effects of the Acquisition recorded by Holdings, certain accounting adjustments are reflected in Intermediate's consolidated financial statements, as discussed below.
The Company recorded goodwill of $196.6 million in the Successor consolidated balance sheet. Goodwill recognized is primarily attributable to the acquisition of an assembled workforce and other intangible assets that do not qualify for separate recognition.
The fair value of the acquired intangible assets was estimated using the relief from royalty method for our trade name and the excess earnings method for customer relationships. Under the relief-from-royalty method, the fair value estimate of the acquired trade name was determined based on the present value of the economic royalty savings associated with the ownership or possession of the trade name based on an estimated royalty rate applied to the cash flows to be generated by the business. The fair value of the trade name acquired as a result of the Acquisition was $58.1 million.
The fair value of customer relationships acquired in the Acquisition was estimated using the excess earnings method. Under the excess earnings method, the value of the intangible asset is equal to the present value of the after-tax cash flows attributable solely to the subject intangible asset. The fair value of customer relationships acquired as a result of the Acquisition was $134.2 million.
The Company also recorded certain favorable and unfavorable leasehold interests as a result of the Acquisition. Favorable leasehold interests are included in other assets and unfavorable leasehold interests are included in other liabilities. The fair value of favorable leasehold interests is determined using the income approach, whereby the difference between contractual rent and market rent is calculated for each remaining term for each lease, and then discounted to present value. All leasehold interests are amortized based upon patterns in which the economic benefits or obligations are expected to be
F-18
realized. Accordingly, the favorable and unfavorable leasehold interests are being amortized over the respective lease terms of the properties.
The following are the favorable and unfavorable leasehold interests and their respective weighted average useful lives (in thousands):
|
| Fair Value at Acquisition |
|
| Weighted Averaged Useful Life | |
Leasehold Interests |
|
|
|
|
|
|
Favorable |
| $ | 161 |
|
| 8.8 years |
Unfavorable |
|
| (3,727 | ) |
| 6.4 years |
Net non-market leasehold interests |
| $ | (3,566 | ) |
|
|
The Company recorded $13.3 million of costs related to the Acquisition in the 2015 Predecessor period. These costs are included as acquisition-related expenses on the consolidated statement of operations and comprehensive income (loss) of the 2015 Predecessor period and were paid at the close of the Acquisition by Holdings and included as part of consideration for the acquired business. Additionally, there were management incentive bonuses awarded as part of the Acquisition that were deemed to be for the benefit of the acquired entity, and therefore, were recognized separately within sales, general and administrative expenses on the consolidated statement of operations and comprehensive income (loss) in the 2015 Successor period over the service period of 18 months.
The following unaudited pro forma financial information summarizes the combined results of operations for the Company as though the Acquisition occurred on February 1, 2015 (in thousands):
|
| For the Year Ended January 30, 2016 |
| |
Net sales |
| $ | 562,015 |
|
Net income (loss) |
| $ | 20,751 |
|
Net income for the pro forma year ended January 31, 2015 includes $13.3 million of acquisition-related expenses incurred during the 2015 Predecessor period. Pro forma net income for the year ended January 31, 2015 also includes $10.5 million costs of goods sold incurred during the 2015 Successor period resulting from the increase in fair value of merchandise inventory reflected in the purchase price allocation at the date of acquisition, as though the Acquisition occurred on February 2, 2014. These amounts are excluded from pro forma net income for the year ended January 30, 2016. The unaudited pro forma financial information is presented for informational purposes only and may not be indicative of results that would have been achieved if the Acquisition had taken place on February 2, 2014.
5. Prepaid Expenses and Other Current Assets
Prepaid expenses and other current assets include the following (in thousands):
|
| February 3, 2018 |
|
| January 28, 2017 |
| ||
Prepaid rent |
| $ | 5,285 |
|
| $ | 5,575 |
|
Prepaid catalog costs |
|
| 3,551 |
|
|
| 3,608 |
|
Prepaid store supplies |
|
| 2,133 |
|
|
| 2,032 |
|
Prepaid shipping |
|
| 4,000 |
|
|
| - |
|
Other prepaid expenses |
|
| 4,147 |
|
|
| 3,811 |
|
Other current assets |
|
| 2,050 |
|
|
| 3,533 |
|
Total prepaid expenses and other current assets |
| $ | 21,166 |
|
| $ | 18,559 |
|
F-19
6. Goodwill and Other Intangible Assets
Goodwill
The following table shows changes in the carrying amount of goodwill for the 2017 and 2016 periods (in thousands):
Balance at January 30, 2016 |
| $ | 196,572 |
|
Post measurement period tax adjustments |
|
| 454 |
|
Balance at January 28, 2017 |
|
| 197,026 |
|
Balance at February 3, 2018 |
| $ | 197,026 |
|
During 2017, the Company performed a step zero impairment analysis and determined goodwill and indefinite-lived intangibles were not impaired based on a qualitative analysis. During 2016, the Company identified deferred tax liabilities that should have been recorded on the acquisition date; as these were considered immaterial, the Company recognized these liabilities in the 2016 period.
Intangible Assets
A summary of intangible assets as of February 3, 2018 and January 28, 2017 is as follows (in thousands):
|
| Weighted Average |
|
| February 3, 2018 |
|
| January 28, 2017 |
| |||||||||||||||||||
|
| Useful Life (Years) |
|
| Gross |
|
| Accumulated Amortization |
|
| Net Book Value |
|
| Gross |
|
| Accumulated Amortization |
|
| Net Book Value |
| |||||||
Indefinite-lived: |
|
|
|
|
|
|
|
|
|
|
|
|
|
|
|
|
|
|
|
|
|
|
|
|
|
|
|
|
Trade name |
| N/A |
|
| $ | 58,100 |
|
| $ | - |
|
| $ | 58,100 |
|
| $ | 58,100 |
|
| $ | - |
|
| $ | 58,100 |
| |
Definite-lived: |
|
|
|
|
|
|
|
|
|
|
|
|
|
|
|
|
|
|
|
|
|
|
|
|
|
|
|
|
Customer Relationships |
|
| 13.2 |
|
|
| 134,200 |
|
|
| (43,339 | ) |
|
| 90,861 |
|
|
| 134,200 |
|
|
| (28,817 | ) |
|
| 105,383 |
|
Total Intangible Assets |
|
|
|
|
| $ | 192,300 |
|
| $ | (43,339 | ) |
| $ | 148,961 |
|
| $ | 192,300 |
|
| $ | (28,817 | ) |
| $ | 163,483 |
|
The definite-lived intangible assets are amortized over the period the Company expects to receive the related economic benefit, which for customer lists is based upon estimated future net cash inflows. The estimated useful lives of intangible assets are as follows:
|
|
|
For intangible assets prior to the Acquisition (Predecessor) |
| |
Asset | Amortization Method | Estimated Useful Life |
Customer lists | Pattern of economic benefit | 9 – 14 years |
Non-compete agreements | Straight-line basis | 1.5 years |
|
| |
For intangible assets subsequent to the Acquisition (Successor) |
| |
Asset | Amortization Method | Estimated Useful Life |
Customer lists | Pattern of economic benefit | 9 – 16 years |
Total amortization expense for these amortizable intangible assets was $14.5 million, $16.5 million, $12.3 million and $1.8 million for the 2017, 2016, 2015 Successor and 2015 Predecessor periods, respectively. The Company did not recognize any impairment charges related to definite and indefinite-lived intangible assets during the 2017, 2016, 2015 Successor and 2015 Predecessor periods, respectively.
F-20
The estimated amortization expense for each of the next five years and thereafter is as follows (in thousands).
Fiscal Year |
| Estimated Amortization Expense |
| |
2018 |
| $ | 12,784 |
|
2019 |
|
| 11,263 |
|
2020 |
|
| 10,015 |
|
2021 |
|
| 9,005 |
|
2022 |
|
| 8,094 |
|
Thereafter |
|
| 39,700 |
|
Total |
| $ | 90,861 |
|
7. Property and Equipment
Property and equipment at February 3, 2018 and January 28, 2017 consist of the following (in thousands):
|
| February 3, 2018 |
|
| January 28, 2017 |
| ||
Leasehold improvements |
| $ | 85,012 |
|
| $ | 67,966 |
|
Furniture, fixtures and equipment |
|
| 42,132 |
|
|
| 35,765 |
|
Computer hardware and software |
|
| 31,290 |
|
|
| 25,679 |
|
Total property and equipment, gross |
|
| 158,434 |
|
|
| 129,410 |
|
Accumulated depreciation |
|
| (57,689 | ) |
|
| (36,619 | ) |
|
|
| 100,745 |
|
|
| 92,791 |
|
Construction in progress |
|
| 17,675 |
|
|
| 9,531 |
|
Property and equipment, net |
| $ | 118,420 |
|
| $ | 102,322 |
|
Construction in progress is primarily comprised of leasehold improvements, furniture, fixtures and equipment related to unopened retail stores and costs incurred related to the implementation of certain computer software. Capitalized software, subject to amortization, included in property and equipment at February 3, 2018 and January 28, 2017 had a cost basis of approximately $22.1 million and $18.7 million, respectively, and accumulated amortization of $9.0 million and $5.7 million, respectively.
Total depreciation expense was $21.1 million, $20.4 million, $17.0 million and $3.5 million, for the 2017, 2016, 2015 Successor and 2015 Predecessor periods, respectively.
During 2017, the Company recorded impairment charges of $2.2 million associated with the assets of underperforming retail locations. The impairment charge was calculated using a discounted cash flow model and was recorded in selling, general and administrative in the Company's consolidated statement of operations and comprehensive income (loss). During the 2016, 2015 Successor and 2015 Predecessor periods, the Company did not record any impairment charges associated with property and equipment.
The Company capitalized interest in connection with construction in progress of $0.6 million, $0.5 million, $0.4 million and $0.1 million for the 2017, 2016, 2015 Successor and 2015 Predecessor periods, respectively.
F-21
8. Accrued Expenses and Other Current Liabilities
Accrued expenses and other current liabilities include the following (in thousands):
|
| February 3, 2018 |
|
| January 28, 2017 |
| ||
Accrued payroll and benefits |
| $ | 9,052 |
|
| $ | 10,387 |
|
Accrued returns reserve |
|
| 7,663 |
|
|
| 6,883 |
|
Gift certificates redeemable |
|
| 6,466 |
|
|
| 6,109 |
|
Accrued professional fees |
|
| 2,186 |
|
|
| 4,681 |
|
Taxes, other than income taxes |
|
| 3,928 |
|
|
| 2,950 |
|
Accrued occupancy |
|
| 3,647 |
|
|
| 2,546 |
|
Other |
|
| 15,817 |
|
|
| 12,565 |
|
Total accrued expenses and other current liabilities |
| $ | 48,759 |
|
| $ | 46,121 |
|
The following table reflects the changes in the accrued returns reserve for the 2017, 2016, 2015 Successor and 2015 Predecessor periods (in thousands):
Accrued returns reserve |
| Beginning of Period |
|
| Charged to Expenses |
|
| Deductions |
|
| End of Period |
| ||||
Period from February 1, 2015 to May 7, 2015 (Predecessor) |
| $ | 4,929 |
|
| $ | 21,282 |
|
| $ | (20,051 | ) |
| $ | 6,160 |
|
Period from May 8, 2015 to January 30, 2016 (Successor) |
|
| 6,160 |
|
|
| 64,696 |
|
|
| (64,424 | ) |
|
| 6,432 |
|
Fiscal Year Ended January 28, 2017 (Successor) |
|
| 6,432 |
|
|
| 112,739 |
|
|
| (112,288 | ) |
|
| 6,883 |
|
Fiscal Year Ended February 3, 2018 (Successor) |
|
| 6,883 |
|
|
| 131,322 |
|
|
| (130,542 | ) |
|
| 7,663 |
|
9. Debt
The components of the Company's outstanding Term Loan were as follows (in thousands):
|
| February 3, 2018 |
|
| January 28, 2017 |
| ||
Term loan |
| $ | 248,176 |
|
| $ | 275,975 |
|
Discount on debt and debt issuance costs |
|
| (6,496 | ) |
|
| (8,736 | ) |
Less: Current portion |
|
| (2,799 | ) |
|
| (2,799 | ) |
Net long-term debt |
| $ | 238,881 |
|
| $ | 264,440 |
|
On June 1, 2017, the Company made a voluntary prepayment of $20.2 million, including accrued interest, on the Term Loan. On December 15, 2017, the Company repurchased and retired $5.0 million of debt on the open market at 98% of par value, with a gain of $0.1 million recorded in interest expense in the Company's consolidated statement of operations and comprehensive income (loss).
The Company recorded interest expense of $19.3 million, $18.7 million, $11.9 million, and $4.6 million, in the 2017, 2016, 2015 Successor and 2015 Predecessor periods, respectively.
Successor Debt
Term Loan Credit Agreement
On May 8, 2015, the Company entered into a term loan credit agreement (the "Term Loan Agreement") in conjunction with the Acquisition (see Note 4). The seven-year Term Loan Agreement provides for borrowings of $250.0 million. The Company can elect, at its option, the applicable interest rate for borrowings under the Term Loan Agreement using a LIBOR or Base Rate variable interest rate plus an applicable margin. LIBOR loans under the Term Loan Agreement accrue interest at a rate equal to LIBOR plus 5.00%, with a minimum LIBOR per annum of 1.00%. Base Rate loans under the Term Loan
F-22
Agreement accrue interest at a rate equal to (i) the greatest of (a) the financial institution's prime rate, (b) the Federal Funds Effect ive Rate plus 0.50%, or (c) LIBOR, with a minimum LIBOR of 1.00% plus 1.00%, and (d) 2.00%.
On May 27, 2016, the Company entered into an agreement to amend (the "Term Loan Amendment") our Term Loan Agreement to borrow an additional $40.0 million in additional loans to permit certain dividends and to make certain adjustments to the financial covenant. The other terms and conditions of the Term Loan remained substantially unchanged.
Current borrowings under the Term Loan Agreement accrue interest at a rate equal to LIBOR plus 5.00%, with a minimum LIBOR per annum of 1.00%, and are payable on a quarterly basis. The rate per annum was 6.04 - 6.78% in fiscal year 2017 and 6.00% throughout fiscal year 2016 and the 2015 Successor period. Repayments of $0.7 million are payable quarterly, beginning on October 31, 2015 and continuing until maturity on May 8, 2022, when the remaining outstanding principal balance of $236.3 million is due.
The Company incurred $11.3 million of debt issuance costs in connection with the Term Loan Agreement and Term Loan Amendment. These fees are presented as a direct deduction from the carrying amount of the long-term debt on the consolidated balance sheet. During 2017 and 2016, $2.2 million and $1.7 million of the debt issuance cost was amortized to interest expense, respectively.
Borrowings under the Term Loan Agreement are collateralized by all of the assets of the Company. In connection with the Term Loan Agreement, the Company is subject to various financial reporting, financial and other covenants, including maintaining specific liquidity measurements. In addition, there are negative covenants, including certain restrictions on the Company's ability to: incur additional indebtedness, create liens, enter into transactions with affiliates, transfer assets, pay dividends, consolidate or merge with other entities, undergo a change in control, make advances, investments and loans, or modify its organizational documents. As of February 3, 2018 and January 28, 2017, the Company was in compliance with all financial covenants.
Asset-Based Revolving Credit Agreement
On May 8, 2015, the Company entered into a five-year secured $40.0 million asset-based revolving credit facility agreement (the "ABL Facility"). The ABL Facility matures on May 8, 2020.
Under the terms of this agreement, the ABL Facility provides for borrowings up to (i) 90% of eligible credit card receivables, plus (ii) 85% of eligible accounts receivable, plus (iii) the lesser of (a) 100% of the value of eligible inventory at such time and (b) 90% of the net orderly liquidation value of eligible inventory at such time, plus (iv) the lesser of (a) 100% of the value of eligible in-transit inventory at such time, (b) 90% of the net orderly liquidation value of eligible in-transit inventory at such time and (c) the in-transit maximum amount (the in-transit maximum amount is not to exceed $12.5 million during the 1 st and 3 rd calendar quarters and $10.0 million during the 2 nd and 4 th calendar quarters), less (v) certain reserves established by the lender, as defined in the ABL Facility.
The ABL Facility consists of revolving loans and swingline loans. Borrowings classified as revolving loans under the ABL Facility may be maintained as either LIBOR or Base Rate loans, each of which has a variable interest rate plus an applicable margin. Borrowings classified as swingline loans under the ABL Facility are Base Rate loans. LIBOR loans under the ABL Facility accrue interest at a rate equal to LIBOR plus a spread of 2.00% from May 8, 2015 to August 31, 2015, and thereafter ranging from 1.50% to 1.75%, depending on borrowing amounts. Base Rate loans under the ABL Facility accrue interest at a rate equal to (i) the greatest of (a) the financial institution's prime rate, (b) the overnight Federal Funds Effective Rate plus 0.50%, (c) LIBOR plus 1.00%, and (d) 2.00%, plus (ii) a spread of 1.00% from May 8, 2015 to August 31, 2015, and thereafter ranging from 0.50% to 0.75%, depending on borrowing amounts.
Interest on each LIBOR loan is payable on the last day of each interest period and no more than quarterly, and interest on each Base Rate loan is payable in arrears on the last business day of April, July, October and January. For both LIBOR and Base Rate loans, interest is payable periodically upon repayment, conversion or maturity, with interest periods ranging between 30 to 180 days at the election of the Company, or 12 months with the consent of all lenders.
The ABL Facility also requires the quarterly payment, in arrears, of a commitment fee. The commitment fee is payable in an amount equal to 0.375% from May 8, 2015 to July 1, 2016, and thereafter at an amount equal to (i) 0.375% for each calendar quarter during which historical excess availability is greater than 50% of availability, and (ii) 0.25% for each calendar quarter during which historical excess availability is less than or equal to 50% of availability.
F-23
During the fiscal year ended February 3, 2018 and January 28, 2017, there were no amounts drawn or outstanding under the ABL Facility. Based on the terms of the agreement and the reduction for the letters of credit, the Company's available borrowing capacity under the ABL Facility as of February 3, 2018 and January 28, 2017 was $38.4 m illion and $37.9 million, respectively.
The Company incurred $1.1 million of debt issuance costs in connection with the related ABL Facility, which were capitalized and are included in other assets on the consolidated balance sheet. In 2017 and 2016, $0.3 million and $0.2 million of the debt issuance cost were amortized to interest expense, respectively.
Borrowings under the ABL Facility are collateralized by a first lien on accounts receivable and inventory. In connection with the ABL Facility, the Company is subject to various financial reporting, financial and other covenants, including maintaining specific liquidity measurements. In addition, there are negative covenants, including certain restrictions on the Company's ability to: incur additional indebtedness, create liens, enter into transactions with affiliates, transfer assets, pay dividends, consolidate or merge with other entities, undergo a change in control, make advances, investments and loans or modify its organizational documents. As of February 3, 2018 and January 28, 2017, the Company was in compliance with all financial covenants.
The Term Loan Agreement and the ABL Facility contain provisions on the occurrence of a default event. In the event of a payment default that is not cured within five business days or is not waived, or a covenant default that is not cured within 30 business days or is not waived, the Company's obligations under these credit facilities may be accelerated. In addition, a 2% interest surcharge will be imposed during events of default.
Letters of Credit
As of February 3, 2018 and January 28, 2017, there were outstanding letters of credit of $1.6 million and $2.1 million, respectively, which reduced the availability under the ABL Facility. As of February 3, 2018, the maximum commitment for letters of credit was $10.0 million. Letters of credit accrue interest at a rate equal to revolving loans maintained as Base Rate loans under the ABL facility. In addition, a 2% interest surcharge will be imposed during events of default. The Company primarily used letters of credit to secure payment of workers' compensation claims. Letters of credit are generally obtained for a one year term and automatically renew annually, and would only be drawn upon if the Company fails to comply with its contractual obligations.
Payments of Debt Obligations Due by Period
As of February 3, 2018, minimum future principal amounts payable under the Company's Term Loan Agreement are as follows (in thousands):
Fiscal Year |
|
|
|
|
2018 |
| $ | 2,799 |
|
2019 |
|
| 2,799 |
|
2020 |
|
| 2,799 |
|
2021 |
|
| 2,799 |
|
2022 |
|
| 236,980 |
|
Thereafter |
|
| - |
|
Total |
| $ | 248,176 |
|
Predecessor Debt
Prior to the Acquisition on May 8, 2015, the Company had a term loan facility, a revolving credit facility and a subordinated debt facility. In conjunction with the Acquisition (see Note 4), these facilities were settled and the agreements were terminated. Certain prepayment penalties and fees of $2.9 million related to the settlement of these facilities are not reflected in either the Predecessor or Successor consolidated statements of operation and comprehensive income (loss) periods, but instead are presented "on the black line." These terminated facility agreements are discussed below.
Term Loan Facility
On April 29, 2011, the Company entered into a term loan facility agreement and an asset-based revolving credit facility agreement. Both the term loan facility and the asset-based revolving credit facility were subsequently amended on September
F-24
27, 2012. Th ese facilities were provided through JJ Lease Funding Corp. and JJ AB Funding Corp., respectively, both of which were variable interest entities established to facilitate such financings (see Note 10).
The amended six-year term loan facility agreement provided for borrowings of $120.0 million. Borrowings under the amended term loan facility were maintained as either Eurodollar or Base Rate loans, each of which had a variable interest rate plus an applicable margin. Eurodollar loans under the amended term loan facility accrued interest at a rate equal to adjusted LIBOR plus 8.50%, with a minimum adjusted LIBOR per annum of 1.50%. Base Rate loans under the amended term loan facility accrued interest at a rate equal to (i) the greatest of (a) the financial institution's prime rate, (b) the Federal Funds Effective Rate plus 0.50% and (c) adjusted LIBOR, with a minimum adjusted LIBOR of 1.50%, plus 1.00%, plus (ii) 7.50%. The rate per annum was 10.00% as of January 31, 2015 (Predecessor). Borrowings under the amended term loan facility were collateralized by all of the assets of the Company and the agreement contained a provision requiring scheduled quarterly interest and principal payments.
Revolving Credit Facility
The five-year amended secured asset-based revolving credit facility agreement provided for borrowings up to $40.0 million. Under the terms of the agreement, the asset-based revolving credit facility agreement provided for borrowings up to (i) 90% of eligible credit card receivables, plus (ii) 85% of the net orderly liquidation value of eligible inventory, plus (iii) the lesser of (a) the in-transit maximum amount or (b) 85% of the net orderly liquidation value of eligible in-transit inventory, less (iv) certain reserves established by the lender, as defined in the agreement. Borrowings under the asset-based revolving credit facility agreements were collateralized by a first lien on accounts receivable and inventory.
The asset-based revolving credit facility consisted of revolving loans and swingline loans. Borrowings classified as revolving loans under the asset-based revolving credit facility were able to be maintained as either Eurodollar or Base Rate loans, each of which had a variable interest rate plus an applicable margin. Borrowings classified as swingline loans under the asset-based revolving credit facility were Base Rate loans. Eurodollar loans accrued interest at a rate equal to LIBOR plus a spread ranging from 2.25% to 2.75%, depending on borrowing amounts. Base Rate loans accrued interest at a rate equal to (i) the greatest of (a) the financial institution's prime rate, (b) the Federal Funds Effective Rate plus 0.50% and (c) LIBOR plus 1.00%, plus (ii) a spread ranging from 1.25% to 1.75%, depending on borrowing amounts.
Interest on each Eurodollar loan was payable on the last day of each interest period, and interest on each Base Rate loan was payable on the last business day of April, July, October and January. For both Eurodollar and Base Rate loans, interest was payable upon repayment maturity, with durations ranging between 30 to 90 days.
The asset-based revolving credit facility agreement also required the quarterly payment, in arrears, of a commitment fee of 0.5% per annum of the average daily unused portion of the facility as well as a fee on the balance of the outstanding letters of credit. As of January 31, 2015 (Predecessor), there were no amounts outstanding under the asset-based revolving credit facility agreement. Based on the terms of the agreement, the Predecessor's available borrowing capacity under the asset-based revolving credit facility agreement as of January 31, 2015 (Predecessor) was $36.7 million.
Subordinated Debt Facility
On September 27, 2012, the Company entered into a six-year subordinated debt facility agreement with an affiliate of the Company in conjunction with the amendment to the term loan facility agreement and asset-based revolving credit facility agreement. The subordinated debt facility was an unsecured mezzanine term loan and provided for borrowings of $30.0 million. This facility was provided through JJ Mezz Funding Corp., which was a variable interest entity established to facilitate such financing (see Note 10).
Borrowings under the mezzanine term loan accrued interest at a rate of 24.0%. The 24.0% interest rate on the mezzanine term loan included a Payment in Kind ("PIK") interest factor whereby one half of the 24.0% interest due was payable in cash and one half was added to the outstanding principal amount of the mezzanine term loan. The outstanding principal balance was to be payable upon maturity of the mezzanine term loans on September 27, 2018. As a result of the PIK interest factor, additional long-term debt of $4.5 million was incurred as of January 31, 2015 (Predecessor). As of January 31, 2015 (Predecessor), the Company had $39.7 million of outstanding borrowings under the mezzanine term loan.
In connection with the amended term loan facility agreement, amended asset-based revolving loan agreement and the subordinated debt facility agreement, the Company was subject to various financial reporting, financial and other covenants, including maintaining specific liquidity measures. In addition, there were negative covenants including certain restrictions on the ability to: incur additional indebtedness, create liens, enter into transactions with affiliates, transfer assets, pay dividends,
F-25
consolidate or merge with other entities, or undergo a change in control. Each loan also contained provisions in the event of default.
10. Variable Interest Entities
During the Predecessor periods the Company maintained several financing facilities with third-party financing companies, including JJ Lease Funding Corp., JJ AB Funding Corp. and JJ Mezz Funding Corp. The financing facilities were independent special purpose entities established for the sole purpose of obtaining financing for the benefit and at the direction of the Company. Each of these facilities was deemed a VIE, for which the Company was determined to be the primary beneficiary. Each of these VIEs was consolidated within the Company's financial statements for the 2015 Predecessor period.
Contemporaneously with the Acquisition, on May 8, 2015 (see Note 4), these financing facilities were repaid and terminated by the Company. These three financing facilities ceased being VIEs to the Company and were no longer consolidated in the 2015 Successor period.
JJ Lease Funding Corp.
The Company entered into a sale leaseback arrangement with JJ Lease Funding Corp., whereby the Company sold and immediately leased back from JJ Lease Funding Corp. certain tangible and intangible assets of the Company in exchange for cash consideration to the Company of $120.0 million. The Company did not recognize any gain or loss on the sale of its assets.
The Company's lease financing arrangement with JJ Lease Funding Corp. was funded through a term loan agreement between JJ Lease Funding Corp. and a commercial lender. The terms of the term loan agreement were structured such that the aggregated payments due under the lease financing arrangement would equal the principal and interest due under the term loan. When the term loan is repaid in full, the ownership of the assets would be reverted back to the Company. JJ Lease Funding Corp. does not have any other assets or liabilities or income and expense other than those associated with the term loan and the sale leaseback arrangement. Under the terms of the lease financing arrangement, the Company's obligations are limited to amounts due to JJ Lease Funding Corp. and the Company has no obligations under the term loan facility. The Company determined that it was the primary beneficiary of JJ Lease Funding Corp. due to i) the establishment of JJ Lease Funding Corp. being for the sole purpose of effecting the lease financing arrangement at the direction of the Company and ii) the Company absorbing any potential variability related to the term loan based on its payment terms equaling the payment terms of the lease financing arrangement.
During the 2015 Predecessor period, the Company consolidated $1.6 million in interest expense related to the term loan as interest expense within its consolidated statements of operations and comprehensive income (loss).
JJ AB Funding Corp.
The Company entered into a commodities purchase financing agreement with JJ AB Funding Corp., whereby JJ AB Funding Corp. entered into a five-year secured $40.0 million asset-based revolving credit facility with a commercial lender. Under the terms of the commodities purchase financing agreement, the Company's obligations were limited to amounts due to JJ AB Funding Corp. and the Company had no obligations under the revolving credit facility. Amounts due by the Company were equal to the purchase price of the commodities purchased plus a nominal agreed upon profit rate, which were equal in total to JJ AB Funding Corp.'s interest and principal obligations under the revolving credit facility.
JJ AB Funding Corp. does not have any other assets or liabilities or income and expense other than those associated with the revolving credit facility and commodities purchase financing agreement. The Company determined that it was the primary beneficiary of JJ AB Funding Corp. due to i) the establishment of JJ AB Funding Corp. being for the sole purpose of effecting the commodities purchase financing agreement at the direction of the Company and ii) the Company absorbing any potential variability related to the revolving credit facility based on its payment terms equaling the payment terms of the commodities purchase financing agreement.
During the 2015 Predecessor period, the Company consolidated $0.3 million in interest expense related to the revolving credit facility as interest expense within its consolidated statements of operations and comprehensive income (loss).
F-26
JJ Mezz Funding Corp.
The Company entered into a commodities purchase financing arrangement with JJ Mezz Funding Corp., whereby JJ Mezz Funding Corp. entered into a six-year unsecured $30.0 million subordinated debt facility with a commercial lender. Amounts due under the subordinated debt facility were to be paid through the proceeds received under JJ Mezz Funding Corp.'s commodities purchase financing arrangement, whose payments were guaranteed by the Company. Payments due by the Company to JJ Mezz Funding Corp. for the commodities purchase financing arrangement were equal to the purchase price of the commodities purchased plus a nominal agreed upon profit rate, which were equal in total to JJ Mezz Funding Corp.'s interest and principal obligations under the subordinated debt facility.
JJ Mezz Funding Corp. does not have any other assets or liabilities or income and expense other than those associated with the subordinated debt facility and commodities purchase financing arrangement. Under the terms of the commodities purchase financing arrangement, the Company's obligations were limited to amounts due to JJ Mezz Funding Corp. and the Company had no obligations under the subordinated debt facility. The Company determined that it was the primary beneficiary of JJ Mezz Funding Corp. due to i) the establishment of JJ Mezz Funding Corp. being for the sole purpose of effecting the commodities purchase financing arrangement at the direction of the Company and ii) the Company absorbing any potential variability related to the subordinated debt facility based on its payment terms equaling the payment terms of the commodities purchase financing arrangement.
During the 2015 Predecessor period, the Company consolidated $2.7 million in interest expense related to the subordinated debt facility as interest expense within its consolidated statements of operations and comprehensive income (loss).
11. Commitments and Contingencies
Operating Lease Agreements
The Company leases retail, distribution and corporate office facilities under various operating leases having initial or remaining terms of more than one year. Many of these leases require that the Company pay taxes, maintenance, insurance, and certain other operating expenses applicable to leased properties. Rental payments under the terms of some store facility leases include contingent rent based on sales levels, whereas other payment terms are based on the greater of a minimum rental payment or a percentage of the store's gross receipts.
The original lease terms under existing arrangements range from 1-20 years and may or may not include renewal options, rent escalation clauses, and/or landlord leasehold improvement incentives. In the case of operating leases with ren t escalation clauses, the payment escalations are accrued and the rent expense is recognized on a straight-line basis over the lease term. The Company recorded a deferred lease liability of $9.5 million and $6.5 million as of February 3, 2018 and January 28, 2017, respectively. In certain instances, the Company also receives allowances for its store leases, which it accrues and amortizes ratably over the life of the lease. The Company maintained a tenant improvement incentive liability of $17.3 million and $11.3 million as of February 3, 2018 and January 28, 2017, respectively.
The following table summarizes future minimum rental payments required under all non-cancelable operating lease obligations as of February 3, 2018 (in thousands):
Fiscal Year |
|
|
|
|
2018 |
| $ | 46,406 |
|
2019 |
|
| 42,204 |
|
2020 |
|
| 40,122 |
|
2021 |
|
| 38,355 |
|
2022 |
|
| 34,322 |
|
Thereafter |
|
| 122,046 |
|
Total |
| $ | 323,455 |
|
Total rental expense was $60.2 million, $55.6 million, $36.2 million and $12.7 million for the 2017, 2016, 2015 Successor and 2015 Predecessor periods, respectively, exclusive of contingent rental expense recorded of $2.2 million, $2.2 million, $1.8 million and $0.5 million for the same respective periods.
F-27
Legal Proceedings
Shareholder Class Action Lawsuits
On October 13, 2017, a securities lawsuit was filed in the United States District Court for the District of Massachusetts against the Company, several members of our Board of Directors and our Chief Financial Officer, among others. The complaint was brought under the Securities Act of 1933 and sought certification of a class of plaintiffs comprised of all shareholders that acquired stock issued by the Company in its initial public offering in March 2017. The plaintiffs sought compensation for losses they incurred since purchasing the stock. Following the filing of this lawsuit, two additional, similar actions were brought in the same court. The three matters were eventually consolidated, and a lead plaintiff was appointed by the court. On March 9, 2018, an amended complaint was filed. The Company has not yet filed a responsive pleading in the matter, entitled The Pension Trust v. J.Jill, Inc., et al., and no material amount has been accrued. The Company believes the claims in the case are without merit and intends to defend the matter vigorously.
We are not presently party to any other legal proceedings the resolution of which we believe would have a material adverse effect on our business, financial condition, operating results or cash flows. We establish reserves for specific legal matters when we determine that the likelihood of an unfavorable outcome is probable and the loss is reasonably estimable.
Concentration Risk
An adverse change in the Company's relationships with its key suppliers, or loss of the supply of one of the Company's key products for any reason, could have a material effect on the business and results of operations of the Company. One supplier accounted for approximately 15.5% of the Company's purchases during 2017.
Other Commitments
In addition to the lease commitments disclosed above, the Company enters into other cancelable and noncancelable commitments. Typically, these commitments are for less than one year in duration and are principally for the procurement of inventory. Preliminary commitments with the Company's merchandise vendors are made approximately six months in advance of the planned receipt date. The Company had outstanding purchase commitments of $128.0 million as of February 3, 2018.
12. Other Liabilities
Other liabilities include the following (in thousands):
|
| February 3, 2018 |
|
| January 28, 2017 |
| ||
Deferred rent |
| $ | 9,521 |
|
| $ | 6,493 |
|
Deferred lease credits |
|
| 15,064 |
|
|
| 9,878 |
|
Unfavorable leasehold interests |
|
| 1,809 |
|
|
| 2,411 |
|
Other |
|
| 1,183 |
|
|
| 1,350 |
|
Total other liabilities |
| $ | 27,577 |
|
| $ | 20,132 |
|
13. Preferred Capital and Shareholders' Equity
Successor
On May 8, 2015, Holdings, a wholly owned subsidiary of Topco, acquired approximately 94% of the 1,000,000 issued and outstanding interests of the Company, with Topco acquiring the remaining 6% of the issued and outstanding membership interests of the Company (see Note 4). In connection with the Acquisition, the Predecessor LLC Agreement of the Company was amended. The terms of the amended agreement were substantially the same as the previously amended and restated agreement, including the rights of Common Unit holders.
On February 24, 2017, the Company completed a corporate conversion from a Delaware limited liability company named Jill Intermediate LLC into a Delaware corporation and changed its name to J.Jill, Inc. In conjunction with the corporate conversion, all of the outstanding equity of Jill Intermediate LLC converted into shares of common stock of J.Jill,
F-28
Inc. Following the Company's conversion from a limited liability company to a corporation, JJill Holdings, Inc. merged with and into J.Jill, Inc. on February 24, 2017, with J.Jill, Inc. continuing as the surviving entity.
On March 14, 2017, J.Jill, Inc. completed an IPO. An existing shareholder of the Company sold 11,666,667 shares of the Company's common stock at a share price of $13.00 per share. The underwriters subsequently elected to exercise their over-allotment option to purchase an additional 865,000 shares of common stock from the selling shareholder at the IPO price of $13.00 per share. All proceeds of the IPO, net of the underwriter's discount, were distributed to the selling shareholder.
Upon the closing of the IPO on March 14, 2017, Topco completed a distribution of J.Jill, Inc. common stock to its partners that held vested and unvested common interests in accordance with its limited partnership agreement. The shares of J.Jill, Inc. common stock distributed in respect of unvested common interests became restricted J.Jill, Inc. common stock, subject to the original vesting terms of such common interests. Holders of vested and unvested common interests received a pro-rata distribution of vested and unvested J.Jill, Inc. common stock, equal to their fair value of common interests immediately prior to the distribution, resulting in no incremental fair value.
As a result, 2,385,001 shares of the 43,747,944 shares of J.Jill, Inc. common shares are treated as restricted shares and will vest in accordance with the original vesting terms of the common interests. All restricted shares of J.Jill, Inc. continue to be considered outstanding shares for legal purposes. The restricted shares are contingently issuable upon vesting and have been included in diluted earnings per share.
Predecessor
In conjunction with the Acquisition (see Note 4), the securities that were in existence in the Predecessor periods, as further discussed below, were settled and no longer outstanding subsequent to May 8, 2015.
Common Units
The Predecessor LLC Agreement, as amended and restated (the "Predecessor LLC Agreement"), authorized the Predecessor to issue up to 1,000,000 Common Units. In April 2011, the Predecessor issued 1,000,000 Common Units, 100 Class A Units and 3,927,601.3 Class B Units, and simultaneously entered into a commodities purchase agreement (the "Commodities Purchase Agreement") for purposes of providing a preferred capital investment of $72.8 million (the "Preferred Capital") to an investor of the Predecessor. The voting and liquidation rights of the holders of the Predecessor's Common Units were subject to and qualified by rights, powers and preferences of holders of the Preferred Capital, and Class A and Class B Units as set forth below. As of January 31, 2015 (Predecessor), 1,000,000 Common Units were outstanding and no Common Units were available for future issuance.
Preferred Capital
The Preferred Capital is classified outside of members' equity because it contains certain redemption features that are not solely within the control of the Company. The voting and liquidation rights of the Preferred Capital were subject to and qualified by rights, powers and preferences of the Predecessor's investors as set forth below.
Class A and B Units
The Predecessor's LLC Agreement authorized the Predecessor to issue up to 100 Class A Units and 3,927,601.3 Class B Units. In April 2011, the Predecessor issued 100 Class A Units and 3,927,601.3 Class B Units and received $1,000 and $39.3 million, respectively, as a capital contribution upon issuance. The voting and liquidation rights of the holders of the Predecessor's Class A and Class B Units were subject to and qualified by rights, powers and preferences of the holder of the Preferred Capital as set forth below. As of January 31, 2015 (Predecessor), 100 Class A Units and 3,927,601.3 Class B Units were outstanding and no Class A or Class B Units were available for future issuance.
Non-Liquidating Distributions
In the event of a non-liquidating distribution, at the discretion of the Predecessor, the holder of the Preferred Capital and the holders of Class A and Class B Units as a group, were limited to an amount up to each holder's aggregate unreturned capital on a pro rata basis. Any remaining amounts were to be distributed to holders of Common Units.
F-29
Liquidation Preferences
As defined within the Predecessor LLC Agreements, if the Predecessor were liquidated, dissolved or wound-up, the holder of the Preferred Capital would have been entitled to their return of capital in preference of holders of Class A and Class B Units, while Common Unit holders would have been entitled to any remaining liquidating distributions. The holder of the Preferred Capital was entitled to all liquidating distributions paid by the Predecessor until such payments equal the aggregate original issuance price paid of $72.8 million.
Subject to the payment in full of amounts due to the holder of the Preferred Capital, each holder of Class A and B Units would have been entitled to any liquidating distributions paid by the Predecessor up to an amount equal to each holder's aggregate original issuance price paid of $1,000 and $39.3 million, respectively, on a pro rata basis.
Any remaining liquidating distributions paid by the Predecessor, subsequent to payment in full of amounts due first to the holder of the Preferred Capital and second to holders of Class A and Class B Units, would have been paid out to holders of Common Units.
Redemption Rights
The Predecessor was established with a finite life of 49 years, commencing on the date of filing of its certificate of formation. At the end of its 49-year term, the Predecessor would be liquidated and all outstanding unreturned capital would be distributed to the then current owners, in accordance with the liquidation preferences described above. Owners were also entitled to a distribution of their unreturned capital prior to the completion of the Predecessor's 49-year term upon the occurrence of an earlier liquidation event as defined by the Commodities Purchase Agreement.
Voting Rights
The Preferred Capital, Class A Units, Class B Units and Common Units held no voting rights. The Predecessor was governed by the board of managers, for which the holders of the Preferred Capital, Class A and Class B Units each had the right to appoint members to the board of managers, as determined by the Predecessor LLC Agreements.
14. Income Taxes
The provision for income taxes for the 2017, 2016, 2015 Successor and 2015 Predecessor periods consists of the following (in thousands):
|
| Successor |
|
|
| Predecessor |
| ||||||||||
|
| For the Fiscal Year Ended February 3, 2018 |
|
| For the Fiscal Year Ended January 28, 2017 |
|
| For the Period May 8, 2015 to January 30, 2016 |
|
|
| For the Period February 1, 2015 to May 7, 2015 |
| ||||
Current |
|
|
|
|
|
|
|
|
|
|
|
|
|
|
|
|
|
U.S. Federal |
| $ | 17,510 |
|
| $ | 17,442 |
|
| $ | 8,052 |
|
|
| $ | 1,957 |
|
State and local |
|
| 4,299 |
|
|
| 3,686 |
|
|
| 1,533 |
|
|
|
| 503 |
|
Total current |
|
| 21,809 |
|
|
| 21,128 |
|
|
| 9,585 |
|
|
|
| 2,460 |
|
Deferred tax benefit |
|
|
|
|
|
|
|
|
|
|
|
|
|
|
|
|
|
U.S. Federal |
|
| (28,374 | ) |
|
| (3,663 | ) |
|
| (6,212 | ) |
|
|
| (793 | ) |
State and local |
|
| 1,126 |
|
|
| (796 | ) |
|
| (1,051 | ) |
|
|
| (168 | ) |
Total deferred tax benefit |
|
| (27,248 | ) |
|
| (4,459 | ) |
|
| (7,263 | ) |
|
|
| (961 | ) |
Total income tax (benefit) provision |
| $ | (5,439 | ) |
| $ | 16,669 |
|
| $ | 2,322 |
|
|
| $ | 1,499 |
|
F-30
A reconciliation of the federal statutory income tax rate to the Company's effective tax rate is as follows for the periods presented:
|
| Successor |
|
|
| Predecessor |
| ||||||||||
|
| For the Fiscal Year Ended February 3, 2018 |
|
| For the Fiscal Year Ended January 28, 2017 |
|
| For the Period May 8, 2015 to January 30, 2016 |
|
|
| For the Period February 1, 2015 to May 7, 2015 |
| ||||
Federal statutory income tax rate |
|
| 33.8 | % |
|
| 35.0 | % |
|
| 35.0 | % |
|
|
| 35.0 | % |
State income taxes, net of federal tax effect |
|
| 4.7 | % |
|
| 4.6 | % |
|
| 0.9 | % |
|
|
| (39.9 | )% |
Tax rate changes |
|
| (48.3 | )% |
|
| - |
|
|
| - |
|
|
|
| - |
|
Acquisition-related costs |
|
| 1.2 | % |
|
| 3.5 | % |
|
| - |
|
|
|
| (344.5 | )% |
Nondeductible equity-based compensation expense |
|
| 0.2 | % |
|
| 0.5 | % |
|
| 0.9 | % |
|
|
| (38.3 | )% |
Charitable contributions |
|
| (1.7 | )% |
|
| - |
|
|
| - |
|
|
|
| - |
|
Tax return to provision adjustments |
|
| (1.2 | )% |
|
| - |
|
|
| - |
|
|
|
| - |
|
Other |
|
| 0.4 | % |
|
| (2.7 | )% |
|
| (1.8 | )% |
|
|
| 14.8 | % |
Effective tax rate |
|
| (10.9 | )% |
|
| 40.9 | % |
|
| 35.0 | % |
|
|
| (372.9 | )% |
The effective tax rate in the 2015 Predecessor period reflects transaction costs related to the Acquisition, which were not deductible for tax purposes.
The components of deferred tax assets (liabilities) were as follows (in thousands):
|
| February 3, 2018 |
|
| January 28, 2017 |
| ||
Deferred tax assets |
|
|
|
|
|
|
|
|
Accrued expenses |
| $ | 5,515 |
|
| $ | 6,612 |
|
Start-up costs (a) |
|
| 759 |
|
|
| 1,239 |
|
Deferred revenue |
|
| 179 |
|
|
| 311 |
|
Total deferred tax assets |
|
| 6,453 |
|
|
| 8,162 |
|
Deferred tax liabilities |
|
|
|
|
|
|
|
|
Inventory |
|
| (2,332 | ) |
|
| (3,878 | ) |
Fixed assets |
|
| (12,792 | ) |
|
| (18,270 | ) |
Intangible assets |
|
| (35,864 | ) |
|
| (58,372 | ) |
Prepaid expenses |
|
| (1,728 | ) |
|
| (1,153 | ) |
Total deferred tax liabilities |
|
| (52,716 | ) |
|
| (81,673 | ) |
Net deferred tax liabilities |
| $ | (46,263 | ) |
| $ | (73,511 | ) |
| (a) | For fiscal year ended February 3, 2018 and January 28, 2017, the deferred tax asset for Section 195 costs related to the Acquisition have been separately stated as start-up costs. The fiscal year ended January 28, 2017 start-up costs were previously presented in the accrued expenses line item. |
On December 22, 2017, the U.S. Tax Cuts and Jobs Act (TCJA) legislation was signed. The new U.S. tax legislation is subject to a number of provisions, including a reduction of the U.S. federal corporate income tax rate from 35.0% to 21.0% (effective January 1, 2018) and a change in certain business deductions, including allowing for immediate expensing of certain qualified capital expenditures. In accordance with U.S. GAAP, which requires the Company to recognize the effects of tax reform in the period of enactment, the Company is required to use a blended U.S. federal tax rate of 33.8% for fiscal 2017. As a result of TCJA, the Company recognized a tax benefit of $24.0 million related to the remeasurement of deferred tax assets and liabilities. After the remeasurement, the Company's deferred tax liability, net of deferred tax assets, was $46.3 million at February 3, 2018 compared to $73.5 million at January 28, 2017. There are no other tax law changes resulting from TCJA that are expected to have a significant impact on the Company's consolidated financial statements.
In December 2017, the Securities and Exchange Commission issued Staff Accounting Bulletin No. 118, Income Tax Accounting Implications of the Tax Cuts and Jobs Act ("SAB 118"), which allows the Company to record provisional
F-31
amounts during a measurement period not to extend beyond one year of the enactment date. The Company believes the tax benefit of $24.0 million recorded in the fourth quarter of fiscal 2017, is a reasonable estimate of tax benefit related to TCJA based on the information available at this time. The Company has not completed its process to determine the final impact of TCJA. The final impact may differ from this estimate, possibly materially, due to , among other things, changes in interpretations and assumptions that the Company has made and the issuance of additional regulatory and other guidance. Further, any required adjustment would be reflected as a discrete expense or benefit in the quarter tha t it is identified, as allowed by SAB 118. A lthough no material changes are anticipated, the Company expects to complete the analysis within the measurement period in accordance with SAB 118.
The Company had no federal or state tax credit carryforwards as of February 3, 2018 and January 28, 2017 and had no federal and an immaterial amount of state net operating loss carryforwards for the same respective periods.
The Company has considered the need for a valuation allowance based on the more likely than not criterion. In determining the need for a valuation allowance, management makes assumptions and applies judgment, including forecasting future earnings and considering the reversals of existing deferred tax liabilities. Based on this analysis, management determined that no valuation allowance was required. The Company performed an analysis of its current and historical tax positions and determined that no material uncertain tax positions exist. Therefore, there is no liability for uncertain tax positions as of February 3, 2018 and January 28, 2017.
The Company's income tax returns are periodically examined by the Internal Revenue Service (the "IRS"). The IRS recently completed an exam of the 2015 Successor period. On December 12, 2017, at the conclusion of the examination, the Company received a Revenue Agent's Report, proposing an increase to our U.S. taxable income which resulted in an additional federal tax payment of $1.1 million, subject to interest. The federal tax payment was offset by a deferred tax asset. The Company agrees with the proposed adjustments and has settled through payment of the assessment on January 31, 2018. In prior years, the IRS completed an examination of the fiscal year 2013 income tax return, without adjustment. For federal and state income tax purposes, the Company's tax years remain open under statute from fiscal year 2014 to the present.
J.Jill, Inc. is the parent entity required to file the consolidated income tax return for federal purposes and several state jurisdictions, which include subsidiary entities, Jill Acquisition LLC and J.Jill Gift Card Solutions, Inc. The Company has allocated its share of the parent entity's federal and combined state income tax accrual, or benefit, in accordance with an intercompany tax allocation policy, which is based on the separate return method.
15. Earnings Per Share
Successor
In conjunction with the Acquisition (see Note 4), the holder of the Preferred Capital received a return of their original investment of $72.8 million and the Commodities Purchase Agreement was terminated. In addition, the capital relating to the 100 Class A Units and the 3,927,601.3 Class B Units was returned to the holders and these units were no longer outstanding subsequent to the May 8, 2015 Acquisition.
On February 24, 2017, the Company converted from a Delaware limited liability company named Jill Intermediate LLC into a Delaware corporation named J.Jill, Inc. In conjunction with the conversion, all of the outstanding equity interests converted into 43,747,944 shares of common stock. Accordingly, all share and per share amounts for all periods presented in the accompanying financial statements and notes thereto have been adjusted retroactively, where required, to reflect this conversion.
F-32
The following tab le summarizes the computation of basic and diluted net income (loss) per common unit for the 2017, 2016, 2015 Successor and 2015 Predecessor periods (in thousands, except share and per share data):
|
| Successor |
|
|
| Predecessor |
| ||||||||||
|
| For the Fiscal Year Ended February 3, 2018 |
|
| For the Fiscal Year Ended January 28, 2017 |
|
| For the Period May 8, 2015 to January 30, 2016 |
|
|
| For the Period February 1, 2015 to May 7, 2015 |
| ||||
Numerator |
|
|
|
|
|
|
|
|
|
|
|
|
|
|
|
|
|
Net income (loss) attributable to common shareholders: |
| $ | 55,365 |
|
| $ | 24,075 |
|
| $ | (4,254 | ) |
|
| $ | (1,901 | ) |
Denominator |
|
|
|
|
|
|
|
|
|
|
|
|
|
|
|
|
|
Weighted average number of common shares outstanding, basic: |
|
| 41,926,157 |
|
|
| 43,747,944 |
|
|
| 43,747,944 |
|
|
|
| 43,747,944 |
|
Dilutive effect of restricted shares |
|
| 1,645,589 |
|
|
| - |
|
|
| - |
|
|
|
| - |
|
Weighted average number of common shares outstanding, diluted: |
|
| 43,571,746 |
|
|
| 43,747,944 |
|
|
| 43,747,944 |
|
|
|
| 43,747,944 |
|
Net income (loss) per common share attributable to common shareholders, basic: |
| $ | 1.32 |
|
| $ | 0.55 |
|
| $ | (0.10 | ) |
|
| $ | (0.04 | ) |
Net income (loss) per common share attributable to common shareholders, diluted: |
| $ | 1.27 |
|
| $ | 0.55 |
|
| $ | (0.10 | ) |
|
| $ | (0.04 | ) |
The weighted average common shares for the diluted earnings per share calculation exclude the impact of outstanding equity awards if the assumed proceeds per share of the award is in excess of the related fiscal period's average price of the Company's common stock. Such awards are excluded because they would have an anti-dilutive effect. There were 318,875 such awards excluded for the 2017 period. There were no awards excluded for the 2016, 2015 Successor and 2015 Predecessor periods.
Predecessor
Given the liquidation preferences and distribution terms as described in Note 13, the Preferred Capital, Class A Units and Class B Units have been excluded from the calculation of earnings per unit as any non-liquidating distributions to each of these equity holders were limited to each equity holder's return of capital. During the 2015 Predecessor period there were no non-liquidating distributions approved by the Predecessor's board of managers.
16. Equity-Based Compensation
Successor Plan
On May 8, 2015, Topco established an Incentive Equity Plan (the "Plan"), which allows Topco to grant Topco Class A Common Interests ("Common Interests") to certain directors, senior executives and key employees of the Company. The Plan is administered by Topco's board of directors, along with input from the Company's Chief Executive Officer. Grant date fair value, vesting and any other restrictions are determined at the discretion of Topco's board of directors.
Common Interests granted to employees of the Company are classified as equity awards and are generally subject to a five year vesting period, with either a monthly or annual cliff vest. The Plan also contains a fair value repurchase feature, allowing Topco to repurchase vested Common Interests upon termination of employment. The Common Interests contain provisions for accelerated vesting upon an approved sale of the Partnership or the termination of employment. If termination of employment is without cause, as defined in the Grant Agreement, all then-unvested units are forfeited and vested interests are subject to repurchase. If termination of employment is for cause, as defined in the Grant Agreement, all vested and unvested units will be forfeited.
The Plan allowed Topco to grant up to 32,683,677 of its Class A Common Interests. As of February 3, 2018, there were no Common Interests authorized and available for future issuance. Topco did not grant any Common Interests to nonemployees.
During 2016, Topco repurchased 234,652 units and 1,122,978 units were forfeited during the same period. There were no units repurchased or forfeited during 2017.
F-33
During 2017, at the time of the IPO, the total issued unvested Common Interests under the Plan were converted to 2, 385,001 restricted share awards ("RSAs") under the Plan. The RSA terms are the same as the Common Interests. During 2017, there were no repurchased or forfeited RSAs .
In conjunction with the IPO, on March 9, 2017, the Company established the J.Jill, Inc. Omnibus Equity Incentive Plan (the "2017 Plan"), which reserves common stock for issuance upon exercise of options, or in respect of granted awards. The 2017 Plan is administered by the Compensation Committee of the Board of Directors (the "Committee"). The Committee has the authority to determine the type, size and terms and conditions of awards to be granted and to grant such awards.
During 2017, the Committee granted restricted stock units ("RSUs") under the 2017 Plan, which generally vest one year from grant date. The grant-date fair value of RSUs is recognized as expense on a straight-line basis over the requisite service period, which is generally the vesting period. The fair market value of RSUs is determined based on the market price of the Company's shares on the date of grant.
The following table summarizes restricted stock activity during 2017, 2016 and the 2015 Successor period:
|
| Number of Units |
|
| Weighted Average Grant Date Fair Value |
| ||
Units outstanding at May 8, 2015 |
|
| - |
|
| $ | - |
|
Granted |
|
| 20,535,403 |
|
|
| 0.07 |
|
Vested |
|
| (2,402,837 | ) |
|
| 0.07 |
|
Forfeited |
|
| - |
|
|
| - |
|
Unvested units outstanding at January 30, 2016 |
|
| 18,132,566 |
|
|
| 0.07 |
|
Granted |
|
| 3,126,954 |
|
|
| 0.24 |
|
Vested |
|
| (4,056,798 | ) |
|
| 0.07 |
|
Forfeited |
|
| (1,122,978 | ) |
|
| 0.07 |
|
Unvested units outstanding at January 28, 2017 |
|
| 16,079,744 |
|
|
| 0.10 |
|
Converted Common Interests |
|
| (16,079,744 | ) |
|
| 0.10 |
|
RSAs issued from Common Interests |
|
| 2,385,001 |
|
|
| 0.67 |
|
Granted |
|
| 18,172 |
|
|
| 12.63 |
|
Vested |
|
| (635,383 | ) |
|
| 0.77 |
|
Forfeited |
|
| - |
|
|
| - |
|
Unvested units outstanding at February 3, 2018 |
|
| 1,767,790 |
|
| $ | 0.65 |
|
The aggregate intrinsic value of Common Interests is calculated as the difference between the price paid, if any, of the Common Interests and its fair value. The aggregate intrinsic value of Common Interests that vested during 2016 was $8.2 million and no Common Interests vested during 2017. As of February 3, 2018, there was $1.2 million of total unrecognized compensation expense related to unvested restricted stock, which is expected to be recognized over a weighted average service period of 2.5 years.
The 2017 Plan has 2,237,303 shares of common stock reserved for issuance to awards granted by the Committee. As of February 3, 2018, there were an aggregate of 1,939,093 shares authorized and available for future issuance.
During 2017, the Committee granted stock options under the 2017 Plan. Stock options are granted to purchase ordinary shares at prices as determined by the Committee, but in no event shall the exercise price be less than the fair market value of the common stock at the time of grant. Options generally vest in equal installments over a four year period. Options expire not more than 10 years from the date of grant. The grant date fair value of options is recognized as an expense on a straight line basis over the requisite service period, which is generally the vesting period. Forfeitures are recorded as incurred.
The following table summarizes stock option activity during 2017:
F-34
|
| Number of Units |
|
| Weighted Average Grant Date Fair Value |
|
| Weighted Average Exercise Price |
| |||
Units outstanding at January 28, 2017 |
|
| - |
|
| $ | - |
|
| $ | - |
|
Granted |
|
| 280,038 |
|
|
| 6.05 |
|
|
| 13.25 |
|
Exercised |
|
| - |
|
|
| - |
|
|
| - |
|
Forfeited |
|
| (14,922 | ) |
|
| 6.03 |
|
|
| 13.12 |
|
Units outstanding at February 3, 2018 |
|
| 265,116 |
|
| $ | 6.05 |
|
| $ | 13.26 |
|
As of February 3, 2018, there was $1.3 million of unrecognized compensation cost related to non-vested stock options. This cost is expected to be recognized over a weighted average period of 3.3 years.
The Company historically has been a private company and lacks certain company-specific historical and implied volatility information. Therefore, it estimates its expected share volatility based on the historical volatility of a publicly traded group of peer companies. Due to the lack of relevant historical data, the simplified approach was used to determine the expected term of the options. The risk-free rate is determined by reference to the U.S. Treasury yield curve in effect at the time of grant of the award for time periods approximately equal to the expected term of the award. Expected dividend yield is based on the fact that the Company has never paid cash dividends, and as of February 3, 2018 did not anticipate paying any cash dividends to option holders in the foreseeable future.
The fair values of options are estimated using the Black-Scholes option-pricing model with the following assumptions:
|
| February 3, 2018 |
| |
Risk-free rate |
| 2.02 - 2.21% |
| |
Expected term (in years) |
|
| 6.25 |
|
Expected volatility |
| 43.03 - 44.64% |
| |
Expected dividend yield |
| 0.00% |
| |
The Company established an Employee Stock Purchase Plan (the "Purchase Plan") during 2017, under which a maximum of 200,000 shares of common stock may be purchased by eligible employees as defined by the Purchase Plan.
The Purchase Plan provides for one "purchase period" each year, commencing on January 1 of each year and continuing through December 31. Shares are purchased through an accumulation of payroll deductions (no more than 10% of compensation, as defined) for the number of whole shares determined by dividing the balance in the employee's account on the last day of the purchase period by the purchase price per share for the stock determined under the Purchase Plan. The purchase price for shares is the lower of 85% of the fair market value of the common stock at the beginning of the purchase period, or 85% of such value at the end of the purchase period.
The fair value of shares purchased under the Purchase Plan are estimated using the Black-Scholes option-pricing model with the following assumptions:
|
| February 3, 2018 |
| |
Risk-free rate |
| 1.76% |
| |
Expected term (in years) |
|
| 1.00 |
|
Expected volatility |
| 41.81% |
| |
Expected dividend yield |
| 0.0% |
| |
The weighted average grant date fair value of the one year option inherent in the Purchase Plan was approximately $2.50 during 2017.
Equity-based compensation expense for all award types of $0.8 million, $0.6 million and $0.2 million was recorded as a selling, general and administrative expense in the consolidated statement of operations and comprehensive income (loss) during 2017, 2016 and the 2015 Successor periods, respectively.
Predecessor Plan
In conjunction with the Acquisition (see Note 4), the equity-based compensation plans that were in existence in the Predecessor periods, as further discussed below, were settled and no longer outstanding subsequent to May 8, 2015.
F-35
On March 30, 2012, JJIP, a Limited Partnership (the "Partnership"), was formed by the then current owners of the Company and held a portion of the outstanding common units of the Company. A Management Incentive Unit equity program (the "Predecessor Plan") was established by JJIP to provide the opportunity for key employees of the Company to participate in the appreciation of the business.
The Predecessor Plan allowed Management Incentive Units ("MIUs") to be granted to employees of the Company at the discretion of JJIP's board of managers, not to exceed a maximum of 105,000 outstanding at any given time. The MIUs entitled the employees to an interest in JJIP upon the vesting of the MIU. When distributions are made by the Company to JJIP, a holder of common units in the Predecessor periods, JJIP's board of managers would determine the allocation of that distribution to the JJIP interest holders. As of January 31, 2015 (Predecessor), there were an aggregate 14,006 MIUs authorized and available for future issuance.
The vesting terms of MIUs granted by JJIP to employees of the Company were determined on a grant-by-grant basis, according to the terms set forth by JJIP's board of managers. Half of the MIUs were granted as time-based vesting awards with the remaining half granted as performance-based vesting awards. MIUs granted with time-based vesting features generally vested over a four year vesting period, with 25% of the MIUs cliff vesting at the later of one year from the date of employment with the Company ("First Vesting Date"), but not to exceed one year from the date of grant. The remaining 75% of the Units vested quarterly over a three year period, beginning on the First Vesting Date. The MIUs contain provisions for accelerated vesting upon an approved sale of the Partnership or forfeiture of unvested MIUs or both vested and unvested MIUs in the event of termination of employment from the Company without cause or with cause, respectively.
MIUs with a performance-based vesting feature were determined to vest upon the achievement of a specified Threshold Return, as defined by the Plan. The Company reviewed the likelihood of achieving the Threshold Return at the end of each reporting period. During the 2015 Predecessor period, the Company determined that the likelihood of achieving the Threshold Return was not probable, and therefore no compensation expense was recognized related to the MIUs with performance-based vesting features. As of January 31, 2015 (Predecessor), there were 45,450 performance-based vesting units outstanding and unvested.
The MIUs also contained a repurchase feature, whereby upon termination, JJIP had the right to purchase from former employees any or all of the vested MIUs for cash. The amount of consideration provided by JJIP was based on a stated formula, per the terms of the Plan, which prevented employees from being exposed to all of the risks and rewards of owning the MIUs. Based on the repurchase feature of the MIUs, the Company determined that the MIUs were liability classified awards.
Although the MIUs were granted by JJIP, which had an economic interest in the Predecessor entity, the services provided were for the benefit of J.Jill. As a result, the corresponding compensation expense was recognized in the consolidated statement of operations and comprehensive income (loss) of the Company with a corresponding capital contribution from JJIP.
The Company accounted for compensation expense related to liability classified awards using the intrinsic value method, as permitted by ASC 718 for nonpublic entities, and recorded changes in the value of these awards as compensation expense at each reporting period. To determine the intrinsic value, the Predecessor calculated the difference between the exercise price, if any, of the MIU compared to its estimated repurchase price at each reporting period. The repurchase price of the MIUs was determined using an estimate of the excess of the Predecessor's EBITDA, multiplied by a fixed multiple, over a predetermined dollar value threshold. The difference between these two amounts, if positive, was then divided by the total number of MIUs outstanding. As a result of the pending Acquisition, at January 31, 2015, the repurchase calculation was amended to reflect the anticipated transaction value.
As of January 31, 2015 (Predecessor), 36,113 time vesting units were vested and 9,431 time vesting units were unvested. The following table summarizes the MIU activity of the time vesting units during the 2015 Predecessor period:
|
| Number of Units |
| |
Unvested units outstanding, January 31, 2015 |
|
| 9,431 |
|
Granted |
|
| - |
|
Vested |
|
| (3,403 | ) |
Forfeited |
|
| - |
|
Unvested units outstanding, May 7, 2015 |
|
| 6,028 |
|
F-36
The aggregate intrinsic value of MIUs as of January 31, 2015 that vested during the period was $2.2 million . The aggregate intrinsic value of the unvested time and performance units was $9.9 million as of January 31, 2015. Compensation expense of $0.4 million was recorded in sell ing, general and administrative expenses in the consolidated statements of operations and comprehensive income (loss) for the 2015 Predecessor period. The intrinsic value of MIUs was $7.3 million as of January 31, 2015 (Predecessor).
In conjunction with the Acquisition (see Note 4), the unvested time-based MIUs were automatically vested as a result of the change in control and all of the issued and outstanding vested time-based MIUs were settled. All of the performance-based awards issued and outstanding achieved their specified Threshold Return upon the Acquisition and were also settled. The acceleration of the vesting conditions due to a change in control resulted in compensation expense of approximately $7.4 million, which was not reflected in either the Predecessor or Successor consolidated statements of operations and comprehensive income (loss) periods, but instead are presented "on the black line."
17. Related Party Transactions
As part of the Acquisition (see Note 4), TowerBrook, an affiliate of Topco, has performed and will continue to perform management support advisory services, planning and finance services for the Company. Under the terms of the services agreement with TowerBrook, effective May 8, 2015, Holdings paid an upfront lump sum fee of $4.0 million. TowerBrook was also eligible to earn a fee of up to 1% of the Transaction Value at completion of: (i) a sale of all or substantially all of the assets of the Company; or (ii) the sale of a majority of the outstanding voting equity interests of the Company or entity of which the Company is a direct and wholly-owned subsidiary; or (iii) an underwritten public offering and sale of equity securities of the Company or any beneficiary affiliate ("Exit"). The Company also agreed to pay and reimburse reasonable out of pocket expenses. The agreement term is continuous and terminates only upon a complete equity Exit by TowerBrook and its affiliates, mutual written consent, unilateral consent by TowerBrook, or by the Company upon a willful material breach of the agreement that is not cured within 30 days of written notice. In conjunction with the IPO in March 2017, the advisory services agreement was terminated.
For the 2017 period, the Company incurred an immaterial amount of out-of-pocket expenses. Related party expenses are included in operating expenses in the 2017 consolidated statements of operations and comprehensive income (loss).
For the 2016 period, the Company incurred out-of-pocket expenses of $0.2 million in relation to the advisory services agreement described above. These expenses are included in operating expenses in the accompanying 2016 Successor consolidated statements of operations and comprehensive income (loss). The Company also distributed $70.0 million to Topco in the 2016 Successor period to as a dividend.
The Company had a net receivable from related parties of $1.3 million recorded at January 28, 2017. This was made up of $1.6 million receivable from Topco which consisted of $1.9 million in cash paid directly by investors' to Topco for an ownership stake in J.Jill, Inc. which was partially offset by $0.3 million related to repurchased MIUs. The Topco receivable was further offset by a $0.3 million payable to Holdings in relation to tax benefits claimed by the Company for transaction costs paid by Holdings in relation to the Acquisition.
For the 2015 Successor period, the Company incurred out-of-pocket expenses of $0.3 million in relation to these services, which are included in operating expenses in the accompanying Successor consolidated statements of operations and comprehensive income (loss). Amounts payable to Topco equity holders were $0.1 million and were included in accrued expenses in the accompanying January 30, 2016 (Successor) consolidated balance sheet. The Company also distributed $8.6 million to Topco in the Successor period to reimburse them for expenses associated with the Acquisition.
Prior to the May 8, 2015 Acquisition, the Company's equity holders (the "Advisors") performed certain management support, advisory services, planning and finance services for the Company. Under the terms of the services agreement entered into in 2011, the Company paid an annual advisory fee of $1.0 million, payable in four quarterly installments, and subject to an adjustment increase in the event of an acquisition. The agreement term was continuous and could be terminated only upon a public offering, a change of control to a new equity investor, gross negligence or willful breach by the Advisors, mutual agreement, or dissolution, liquidation, sale or disposal of the Company's assets.
For the 2015 Predecessor period, the Company incurred management fees and out of pocket expenses of $1.0 million, which are included in operating expenses in the accompanying Predecessor consolidated statements of operations and comprehensive income (loss).
F-37
In connection with a refinancing, the Company entered into a subordinated, unsecured $30.0 million debt facility with an affiliate of a minority equity holder of the Company. A total amount of $40.9 million was paid in connection with the Acquisition, including principal and accrued interest, to settle all remaining obligations under this credit facility.
18. Subsequent Events
On March 15, 2018, the Company announced the retirement of President, CEO and Director, Paula Bennett effective April 14, 2018, after serving over 10 years in the role. Ms. Bennett will be succeeded by Linda Heasley, who currently serves on the Board of Directors of J.Jill, Inc., effective April 15, 2018.
19. Quarterly Financial Data (unaudited)
The following table sets forth our historical consolidated statements of income for each of the eight fiscal quarters through the year ended February 3, 2018. This unaudited quarterly information has been prepared on the same basis as our annual audited consolidated financial statements, consisting of only normal recurring adjustments that we consider necessary to fairly present the financial information for the fiscal quarters presented below.
|
|
|
|
|
|
| ||||||||||||||||||||||||||
|
| Fiscal Year 2016 |
|
| Fiscal Year 2017 |
| ||||||||||||||||||||||||||
|
| Thirteen weeks ended |
|
| Thirteen weeks ended |
| ||||||||||||||||||||||||||
|
| April 30, 2016 |
|
| July 30, 2016 |
|
| October 29, 2016 |
|
| January 28, 2017 |
|
| April 29, 2017 |
|
| July 29, 2017 |
|
| October 28, 2017 |
|
| February 3, 2018 |
| ||||||||
(in thousands, unaudited) |
|
|
|
|
|
|
|
|
|
|
|
|
|
|
|
|
|
|
|
|
|
|
|
|
|
|
|
|
|
|
|
|
Net sales |
| $ | 147,665 |
|
| $ | 165,035 |
|
| $ | 159,439 |
|
| $ | 166,917 |
|
| $ | 166,126 |
|
| $ | 181,372 |
|
| $ | 161,975 |
|
| $ | 188,672 |
|
Costs of goods sold |
|
| 46,159 |
|
|
| 52,179 |
|
|
| 51,335 |
|
|
| 61,444 |
|
|
| 50,518 |
|
|
| 58,724 |
|
|
| 53,479 |
|
|
| 71,344 |
|
Gross profit |
|
| 101,506 |
|
|
| 112,856 |
|
|
| 108,104 |
|
|
| 105,473 |
|
|
| 115,608 |
|
|
| 122,648 |
|
|
| 108,496 |
|
|
| 117,328 |
|
Selling, general and administrative expenses |
|
| 87,072 |
|
|
| 94,173 |
|
|
| 92,637 |
|
|
| 94,643 |
|
|
| 97,033 |
|
|
| 97,011 |
|
|
| 95,240 |
|
|
| 105,609 |
|
Operating income |
|
| 14,434 |
|
|
| 18,683 |
|
|
| 15,467 |
|
|
| 10,830 |
|
|
| 18,575 |
|
|
| 25,637 |
|
|
| 13,256 |
|
|
| 11,719 |
|
Interest expense |
|
| 4,112 |
|
|
| 4,674 |
|
|
| 4,844 |
|
|
| 5,040 |
|
|
| 4,945 |
|
|
| 5,084 |
|
|
| 4,496 |
|
|
| 4,736 |
|
Income (loss) before provision (benefit) for income taxes |
|
| 10,322 |
|
|
| 14,009 |
|
|
| 10,623 |
|
|
| 5,790 |
|
|
| 13,630 |
|
|
| 20,553 |
|
|
| 8,760 |
|
|
| 6,983 |
|
Income tax provision (benefit) |
|
| 4,249 |
|
|
| 5,860 |
|
|
| 2,815 |
|
|
| 3,745 |
|
|
| 5,603 |
|
|
| 8,557 |
|
|
| 2,766 |
|
|
| (22,365 | ) |
Net income (loss) |
| $ | 6,073 |
|
| $ | 8,149 |
|
| $ | 7,808 |
|
| $ | 2,045 |
|
| $ | 8,027 |
|
| $ | 11,996 |
|
| $ | 5,994 |
|
| $ | 29,348 |
|
Net income (loss) per common share attributable to common shareholders: |
|
|
|
|
|
|
|
|
|
|
|
|
|
|
|
|
|
|
|
|
|
|
|
|
|
|
|
|
|
|
|
|
Basic |
| $ | 0.14 |
|
| $ | 0.19 |
|
| $ | 0.18 |
|
| $ | 0.05 |
|
| $ | 0.19 |
|
| $ | 0.29 |
|
| $ | 0.14 |
|
| $ | 0.70 |
|
Diluted |
| $ | 0.14 |
|
| $ | 0.19 |
|
| $ | 0.18 |
|
| $ | 0.05 |
|
| $ | 0.18 |
|
| $ | 0.28 |
|
| $ | 0.14 |
|
| $ | 0.67 |
|
Weighted average number of common shares outstanding: |
|
|
|
|
|
|
|
|
|
|
|
|
|
|
|
|
|
|
|
|
|
|
|
|
|
|
|
|
|
|
|
|
Basic |
|
| 43,747,944 |
|
|
| 43,747,944 |
|
|
| 43,747,944 |
|
|
| 43,747,944 |
|
|
| 42,518,143 |
|
|
| 41,549,825 |
|
|
| 41,731,765 |
|
|
| 41,906,414 |
|
Diluted |
|
| 43,747,944 |
|
|
| 43,747,944 |
|
|
| 43,747,944 |
|
|
| 43,747,944 |
|
|
| 43,680,485 |
|
|
| 43,554,275 |
|
|
| 43,554,000 |
|
|
| 43,499,744 |
|
F-38