UNITED STATES
SECURITIES AND EXCHANGE COMMISSION
Washington, D.C. 20549
Form 10-K
| x | ANNUAL REPORT PURSUANT TO SECTION 13 OR 15(d) OF THE SECURITIES EXCHANGE ACT OF 1934. |
For the fiscal year ended November 30, 2014
OR
| ¨ | TRANSITION REPORT PURSUANT TO SECTION 13 OR 15(d) OF THE SECURITIES EXCHANGE ACT OF 1934. |
For the transition period from to
Commission File Number: 1-14947
JEFFERIES GROUP LLC
(Exact name of registrant as specified in its charter)
| Delaware | 95-4719745 | |
(State or other jurisdiction of incorporation or organization) | (I.R.S. Employer Identification No.) | |
520 Madison Avenue, New York, New York | 10022 | |
| (Address of principal executive offices) | (Zip Code ) | |
Registrant's telephone number, including area code:
(212) 284-2550
Securities registered pursuant to Section 12(b) of the Act:
Title of each class: | Name of each exchange on which registered: | |
| 5.125% Senior Notes Due 2023 | New York Stock Exchange |
Securities registered pursuant to Section 12(g) of the Act: Limited Liability Company Interests
Indicate by check mark if the registrant is a well-known seasoned issuer, as defined in Rule 405 of the Securities Act. Yes x No ¨
Indicate by check mark if the registrant is not required to file reports pursuant to Section 13 or Section 15(d) of the Act. Yes ¨ No x
Indicate by check mark whether the registrant (1) has filed all reports required to be filed by Section 13 or 15(d) of the Securities Exchange Act of 1934 during the preceding 12 months (or for such shorter period that the registrant was required to file such reports), and (2) has been subject to such filing requirements for the past 90 days. Yes x No ¨
Indicate by check mark whether the registrant has submitted electronically and posted on its corporate Web site, if any, every Interactive Data File required to be submitted and posted pursuant to Rule 405 of Regulation S-T (§ 232.405 of this chapter) during the preceding 12 months (or for such shorter period that the registrant was required to submit and post such files). Yes x No ¨
Indicate by check mark if disclosure of delinquent filers pursuant to Item 405 of Regulation S-K (§ 232.405 of this chapter) is not contained herein, and will not be contained, to the best of registrant's knowledge, in definitive proxy or information statements incorporated by reference in Part III of this Form 10-K or any amendment to this Form 10-K. ¨
Indicate by check mark whether the registrant is a large accelerated filer, an accelerated filer, a non-accelerated filer, or a smaller reporting company. See the definitions of "large accelerated filer," "accelerated filer" and "smaller reporting company" in Rule 12b-2 of the Exchange Act.
| Large accelerated filer | ¨ | Accelerated filer | ¨ | |||
| Non-accelerated filer | x | Smaller Reporting company | ¨ | |||
Indicate by check mark whether the registrant is a shell company (as defined in Rule 12b-2 of the Act). Yes ¨ No x
State the aggregate market value of the voting and non-voting common equity held by non-affiliates computed by reference to the price at which the common equity was last sold, or the average bid and asked price of such common equity, as of the last business day of the registrant's most recently completed second fiscal quarter. $0 as of May 31, 2014.
The Registrant is a wholly-owned subsidiary of Leucadia National Corporation and meets the conditions set forth in General Instructions I(1)(a) and (b) of Form 10-K and is therefore filing this Form 10-K with a reduced disclosure format as permitted by Instruction I(2).
JEFFERIES GROUP LLC
2014 FORM 10-K ANNUAL REPORT
TABLE OF CONTENTS
| PART I | ||||||
Item 1. | Business | 2 | ||||
Item 1A. | Risk Factors | 7 | ||||
Item 1B. | Unresolved Staff Comments | 12 | ||||
Item 2. | Properties | 12 | ||||
Item 3. | Legal Proceedings | 12 | ||||
Item 4. | Mine Safety Disclosures | 13 | ||||
| PART II | ||||||
Item 5. | Market for Registrant's Common Equity, Related Stockholder Matters and Issuer Purchases of Equity Securities | 14 | ||||
Item 6. | Selected Financial Data | 14 | ||||
Item 7. | Management's Discussion and Analysis of Financial Condition and Results of Operations | 14 | ||||
Item 7A. | Quantitative and Qualitative Disclosures About Market Risk | 57 | ||||
Item 8. | Financial Statements and Supplementary Data | 58 | ||||
Item 9. | Changes in and Disagreements with Accountants on Accounting and Financial Disclosure | 145 | ||||
Item 9A. | Controls and Procedures | 145 | ||||
Item 9B. | Other Information | 145 | ||||
| PART III | ||||||
Item 10. | Directors, Executive Officers and Corporate Governance | 146 | ||||
Item 11. | Executive Compensation | 146 | ||||
Item 12. | Security Ownership of Certain Beneficial Owners and Management and Related Stockholder Matters | 146 | ||||
Item 13. | Certain Relationships and Related Transactions, and Director Independence | 146 | ||||
Item 14. | Principal Accountant Fees and Services | 146 | ||||
| PART IV | ||||||
Item 15. | Exhibits and Financial Statement Schedules | 148 | ||||
1
JEFFERIES GROUP LLC AND SUBSIDIARIES
PART I
| Item 1. | Business. |
Introduction
Jefferies Group LLC and its subsidiaries operate as a global full service, integrated securities and investment banking firm. Our principal operating subsidiary, Jefferies LLC ("Jefferies"), was founded in the U.S. in 1962 and our first international operating subsidiary, Jefferies International Limited ("Jefferies Europe"), was established in the U.K. in 1986. On March 1, 2013, Jefferies Group, Inc. converted into a limited liability company (renamed Jefferies Group LLC) and became an indirect wholly owned subsidiary of Leucadia National Corporation ("Leucadia") (referred to herein as the "Leucadia Transaction"). Richard Handler, our Chief Executive Officer and Chairman, was also appointed the Chief Executive Officer of Leucadia, as well as a Director of Leucadia. Brian P. Friedman, our Chairman of the Executive Committee, was also appointed Leucadia's President and a Director of Leucadia. Following the Leucadia Transaction, Jefferies Group LLC retains a credit rating separate from Leucadia and remains an SEC reporting company, filing annual, quarterly and periodic financial reports.
Since 2000, we have grown considerably and become increasingly diversified, increasing our market share and the breadth and depth of our business. Our growth has been achieved through the addition of talented personnel in targeted areas, as well as the acquisition of complementary businesses. At November 30, 2014, we had 3,915 employees in the Americas, Europe, Asia and the Middle East. Our global headquarters and executive offices are located at 520 Madison Avenue, New York, New York 10022. We also have regional headquarters in London and Hong Kong. Our primary telephone number is (212) 284-2550 and our Internet address is jefferies.com.
The following documents and reports are available on our public website:
| • | Annual and interim reports on Form 10-K; |
| • | Quarterly reports on Form 10-Q; |
| • | Current reports on Form 8-K; |
| • | Code of Ethics |
| • | Reportable waivers, if any, from our Code of Ethics by our executive officers; |
| • | Board of Directors Corporate Governance Guidelines; |
| • | Charter of the Corporate Governance and Nominating Committee of the Board of Directors; |
| • | Charter of the Compensation Committee of the Board of Directors; |
| • | Charter of the Audit Committee of the Board of Directors; |
| • | Any amendments to the above-mentioned documents and reports. |
Interested persons may also obtain a printed copy of any of these documents or reports by sending a request to Investor Relations, Jefferies Group LLC, 520 Madison Avenue, New York, NY 10022, by calling 203-708-5975 or by sending an email to [email protected].
Business Segments
We currently operate in two business segments, Capital Markets and Asset Management. Our Capital Markets reportable segment, which principally represents our entire business, consists of our securities and commodities trading activities and our investment banking activities. The Capital Markets reportable segment provides the sales, trading and/or origination and execution effort for various equity, fixed income, commodities, futures, foreign exchange and advisory products and services. The Asset Management segment includes asset management activities and related services.
2
JEFFERIES GROUP LLC AND SUBSIDIARIES
Financial information regarding our reportable business segments at November 30, 2014, November 30, 2013 and November 30, 2012 is set forth in Note 24, Segment Reporting, in this Annual Report on Form 10-K.
Our Businesses
Capital Markets
Our Capital Markets segment focuses on Equities, Fixed Income (including futures, foreign exchange and commodities activities) and Investment Banking. We primarily serve institutional investors, corporations and government entities.
Equities
Equities Research, Sales and Trading
We provide our clients full-service equities research, sales and trading capabilities across global securities markets. We earn commissions or spread revenue by executing, settling and clearing transactions for clients across these markets in equity and equity-related products, including common stock, American depository receipts, global depository receipts, exchange-traded funds, exchange-traded and over-the-counter ("OTC") equity derivatives, convertible and other equity-linked products and closed-end funds. We act as agent or principal (including as a market-maker) when executing client transactions via traditional "high-touch" and electronic "low-touch" channels. In order to facilitate client transactions, we may act as principal to provide liquidity, which requires the commitment of our capital and certain maintenance of dealer inventory.
Our equity research, sales and trading efforts are organized across three geographical regions: the Americas; Europe, the Middle East, and Africa ("EMEA"); and Asia Pacific. Our main product lines within the regions are cash equities, electronic trading, derivatives and convertibles. Our clients are primarily institutional market participants such as mutual funds, hedge funds, investment advisors, pension and profit sharing plans, and insurance companies. Through our global research team and sales force, we maintain relationships with our clients, distribute investment research and strategy, trading ideas, market information and analyses across a range of industries and receive and execute client orders. Our equity research covers over 1,800 companies around the world and a further approximate 600 companies are covered by eight leading local firms in Asia Pacific with whom we maintain alliances.
Equity Finance
Our Equity Finance business provides financing, securities lending and other prime brokerage services.
We offer prime brokerage services in the U.S. that provide hedge funds, money managers and registered investment advisors with execution, financing, clearing, reporting and administrative services. We finance our clients' securities positions through margin loans that are collateralized by securities, cash or other acceptable liquid collateral. We earn an interest spread equal to the difference between the amount we pay for funds and the amount we receive from our clients. We also operate a matched book in equity and corporate bond securities, whereby we borrow and lend securities versus cash or liquid collateral and earn a net interest spread.
Customer assets (securities and funds) held by us are segregated in accordance with regulatorily mandated customer protection rules. We offer selected prime brokerage clients with the option of custodying their assets at an unaffiliated U.S. broker-dealer that is a subsidiary of a bank holding company. Under this arrangement, we provide our clients directly with all customary prime brokerage services.
3
JEFFERIES GROUP LLC AND SUBSIDIARIES
Wealth Management
We provide tailored wealth management services designed to meet the needs of high net worth individuals, their families and their businesses, private equity and venture funds and small institutions. Our advisors provide access to all of our institutional execution capabilities and deliver other financial services. Our open architecture platform affords clients access to products and services from both our firm and from a variety of other major financial services institutions.
Fixed Income
Fixed Income Sales and Trading
We provide our clients with sales and trading of investment grade and high yield corporate bonds, U.S. and European government and agency securities, municipal bonds, mortgage- and asset-backed securities, whole loans, leveraged loans, distressed securities, emerging markets debt and derivative products. Jefferies is designated as a Primary Dealer by the Federal Reserve Bank of New York and Jefferies International Limited is designated in similar capacities for several countries in Europe and trades a broad spectrum of other European government bonds. Additionally, through the use of repurchase agreements, we act as an intermediary between borrowers and lenders of short-term funds and obtain funding for various of our inventory positions. We trade and make markets globally in cleared and uncleared swaps and forwards referencing, among other things, interest rates, investment grade and non-investment grade corporate credits, credit indexes and asset-backed security indexes. We are registered as a swap dealer with the CFTC.
Our strategists and economists provide ongoing commentary and analysis of the global fixed income markets. In addition, our fixed income research professionals, including research and desk analysts, provide investment ideas and analysis across a variety of fixed income products.
Futures, Foreign Exchange and Commodities
We provide our clients 24-hour global coverage, with direct access to major commodity and financial futures exchanges including the CME, CBOT, NYMEX, ICE, NYSE Euronext, LME and Eurex and provide 24-hour global coverage, execution, clearing and market making in futures, options and derivatives on industrial metals including aluminum, copper, nickel, zinc, tin and lead. Products provided to clients include LME and CME futures and over-the-counter metals swaps and options.
We operate a full-service trading desk in all precious metals, cash, futures and exchange-for-physicals markets, and are a market maker providing execution and clearing services as well as market analysis. We also provide prime brokerage services and are an authorized coin distributor of the U.S. Mint.
In addition, we are a market-maker in foreign exchange spot, forward, swap and option contracts across major currencies and emerging markets globally and conduct these activities through our futures commission merchant and our swap dealer each registered with the CFTC.
In late 2014, we began to pursue various strategic alternatives for our futures, foreign exchange and commodities business. These alternatives may include a sale to or combination with another similar business that improves the combined businesses' competitive standing and margin and we anticipate that a decision in this regard will be forthcoming in the first half of fiscal 2015.
Investment Banking
We provide our clients around the world with a full range of equity capital markets, debt capital markets and financial advisory services. Our services are enhanced by our industry sector expertise, our global distribution capabilities and our senior level commitment to our clients.
4
JEFFERIES GROUP LLC AND SUBSIDIARIES
Over 800 investment banking professionals operate in the Americas, Europe and Asia, and are organized into industry, product and geographic coverage groups. Our sector coverage groups include Consumer & Retailing; Financial Institutions; Industrials; Healthcare; Energy; Real Estate, Gaming & Lodging; Media & Telecommunications; Technology; Financial Sponsors and State & Local Governments. Our product coverage groups include equity capital markets; debt capital markets; financial advisory, which includes both mergers and acquisitions and restructuring and recapitalization and U.K. corporate broking. Our geographic coverage groups include coverage teams based in major cities in the United States, Canada, Brazil, the United Kingdom, Germany, Sweden, Russia, India, China and Singapore.
Equity Capital Markets
We provide a broad range of equity financing capabilities to companies and financial sponsors. These capabilities include private equity placements, initial public offerings, follow-on offerings, block trades and equity-linked convertible securities.
Debt Capital Markets
We provide a wide range of debt financing capabilities for companies, financial sponsors and government entities. We focus on structuring, underwriting and distributing public and private debt, including investment grade and non-investment grade corporate debt, leveraged loans, mortgage and other asset-backed securities, and liability management solutions.
Advisory Services
We provide mergers and acquisition and restructuring and recapitalization services to companies, financial sponsors and government entities. In the mergers and acquisition area, we advise sellers and buyers on corporate sales and divestitures, acquisitions, mergers, tender offers, spinoffs, joint ventures, strategic alliances and takeover and proxy fight defense. We also provide a broad range of acquisition financing capabilities to assist our clients. In the restructuring and recapitalization area, we provide to companies, bondholders and lenders a full range of restructuring advisory capabilities as well as expertise in the structuring, valuation and placement of securities issued in recapitalizations.
Asset Management
We provide investment management services to pension funds, insurance companies and other institutional investors. Our primary asset management programs are strategic investment, special situation and convertible bond strategies. We partner with Leucadia's asset management business in providing asset management services.
Our strategic investment programs, including our Structured Alpha Program, are provided through the Strategic Investments Division of Jefferies Investment Advisers, LLC, which is registered as an investment adviser with the SEC. These programs are systematic, multi-strategy, multi-asset class programs with the objective of generating a steady stream of absolute returns irrespective of the direction of major market indices or phase of the economic cycle. These strategies are provided through both long-short equity private funds and separately managed accounts.
Our special situation programs, are also provided by Jefferies Investment Advisers, LLC, as investment manager, and consist of managed account and hedge fund offerings that employ event driven strategies evaluating corporate events, including mergers and restructuring for investment opportunities. Leucadia has made significant investments in the funds managed by these programs and, accordingly, a significant portion of the net results are allocated to Leucadia.
We offer convertible bond strategies through Jefferies (Switzerland) Limited, which is licensed by the Swiss Financial Market Supervisory Authority. These strategies are long only investment solutions in global convertible bonds offered to pension funds, insurance companies and private banking clients. As a result of an analysis of this activity, we have decided to wind-down our convertible bond offerings and expect that, pending regulatory approvals, these actions will be completed within the next twelve months.
5
JEFFERIES GROUP LLC AND SUBSIDIARIES
Competition
All aspects of our business are intensely competitive. We compete primarily with large global bank holding companies that engage in capital markets activities, but also with firms listed in the AMEX Securities Broker/Dealer Index, other brokers and dealers, and boutique investment banking firms. The large global bank holding companies have substantially greater capital and resources than we do. We believe that the principal factors affecting our competitive standing include the quality, experience and skills of our professionals, the depth of our relationships, the breadth of our service offerings, our ability to deliver consistently our integrated capabilities, and our tenacity and commitment to serve our clients.
Regulation
Regulation in the United States. The financial services industry in which we operate is subject to extensive regulation. In the U.S., the Securities and Exchange Commission ("SEC") is the federal agency responsible for the administration of federal securities laws, and the Commodity Futures Trading Commission ("CFTC") is the federal agency responsible for the administration of laws relating to commodity interests (including futures and swaps). In addition, self-regulatory organizations, principally Financial Industry Regulatory Authority ("FINRA") and the National Futures Association ("NFA"), are actively involved in the regulation of financial service businesses. The SEC, CFTC and self-regulatory organizations conduct periodic examinations of broker-dealers investment advisers, futures commission merchants ("FCMs") and swap dealers. The applicable self-regulatory authority for Jefferies' activities as a broker-dealer is FINRA, and the applicable self-regulatory authority for Jefferies' FCM activities is the Chicago Board of Trade (which is owned by the CME Group). Financial service businesses are also subject to regulation by state securities commissions and attorneys general in those states in which they do business.
Broker-dealers are subject to SEC and FINRA regulations that cover all aspects of the securities business, including sales and trading methods, trade practices among broker-dealers, use and safekeeping of customers' funds and securities, capital structure of securities firms, anti-money laundering efforts, recordkeeping and the conduct of directors, officers and employees. Registered advisors are subject to, among other requirements, SEC regulations concerning marketing, transactions with affiliates, disclosure to clients, and recordkeeping; and advisors that are also registered as commodity trading advisors or commodity pool operators are also subject to regulation by the CFTC and the NFA. FCMs, introducing brokers and swap dealers that engage in commodities, futures or swap transactions are subject to regulation by the CFTC and the NFA. Additional legislation, changes in rules promulgated by the SEC, CFTC and self-regulatory organizations, or changes in the interpretation or enforcement of existing laws and rules may directly affect the operations and profitability of broker-dealers, investment advisers, FCMs and swap dealers. The SEC, the CFTC and self-regulatory organizations, state securities commissions and state attorneys general may conduct administrative proceedings or initiate civil litigation that can result in censure, fine, suspension, expulsion of a firm, its officers or employees, or revocation of a firm's licenses.
On July 21, 2010, the Dodd-Frank Wall Street Reform and Consumer Protection Act ("Dodd-Frank Act") was enacted in the United States. The Dodd-Frank Act is being implemented through extensive rulemaking by the SEC, the CFTC and other governmental agencies. The Dodd-Frank Act also mandates the preparation of studies on a wide range of issues. These studies could lead to additional regulatory changes. For additional information see Item 1A. Risk Factors – "Recent legislation and new and pending regulation may significantly affect our business."
Net Capital Requirements. U.S. registered broker-dealers are subject to the SEC's Uniform Net Capital Rule (the "Net Capital Rule"), which specifies minimum net capital requirements. Jefferies Group LLC is not a registered broker-dealer and is therefore not subject to the Net Capital Rule; however, its U.S. broker-dealer subsidiaries, Jefferies and Jefferies Execution Services, Inc. ("Jefferies Execution"), are registered broker-dealers and are subject to the Net Capital Rule. Jefferies and Jefferies Execution have elected to compute their minimum net capital requirement in accordance with the "Alternative Net Capital Requirement" as permitted by the Net Capital Rule, which provides that a broker-dealer shall not permit its net capital, as defined, to be less than the greater of 2% of its aggregate debit balances (primarily customer-related receivables) or $250,000 ($1.5 million for prime brokers). Compliance with the Net Capital Rule could limit operations of our broker-dealers, such as underwriting and trading activities, that require the use of significant amounts of capital, and may also restrict their ability to make loans, advances, dividends and other payments.
6
JEFFERIES GROUP LLC AND SUBSIDIARIES
U.S. registered FCMs are subject to the CFTC's minimum financial requirements for futures commission merchants and introducing brokers. Jefferies Group LLC is not a registered FCM or a registered Introducing Broker, and is therefore not subject to the CFTC's minimum financial requirements; however, Jefferies is registered as a FCM following its merger with Jefferies Bache, LLC in September 2014 and is therefore subject to the minimum financial requirements. Under the minimum financial requirements, an FCM must maintain adjusted net capital equal to or in excess of the greater of (A) $1,000,000 or (B) the FCM's risk-based capital requirements totaling (1) eight percent of the total risk margin requirement for positions carried by the FCM in customer accounts, plus (2) eight percent of the total risk margin requirement for positions carried by the FCM in noncustomer accounts. An FCM's ability to make capital and certain other distributions is subject to the rules and regulations of various exchanges, clearing organizations and other regulatory agencies which may have capital requirements that are greater than the CFTC's. Jefferies, as a dually registered broker-dealer and FCM, is required to maintain net capital in excess of the greater of the SEC or CFTC minimum financial requirements.
Our subsidiaries that are registered swap dealers will become subject to capital requirements under the Dodd-Frank Act once they become final. For additional information see Item 1A. Risk Factors – "Recent legislation and new and pending regulation may significantly affect our business."
See Net Capital within Item 7. Management's Discussion and Analysis and Note 23, Net Capital Requirements in this Annual Report on Form 10-K for additional discussion of net capital calculations.
Regulation outside the United States. We are an active participant in the international capital markets, engaging in commodity futures brokerage and providing investment banking services internationally, but primarily in Europe and Asia. As is true in the U.S., our subsidiaries are subject to extensive regulations promulgated and enforced by, among other regulatory bodies, the U.K. Financial Conduct Authority, the Hong Kong Securities and Futures Commission, the Japan Financial Services Agency and the Monetary Authority of Singapore. Every country in which we do business imposes upon us laws, rules and regulations similar to those in the U.S., including with respect to some form of capital adequacy rules, customer protection rules, anti-money laundering and anti-bribery rules, compliance with other applicable trading and investment banking regulations and similar regulatory reform. For additional information see Item 1A. Risk Factors – "Extensive international regulation of our business limits our activities, and, if we violate these regulations, we may be subject to significant penalties."
Item 1A. Risk Factors.
Factors Affecting Our Business
The following factors describe some of the assumptions, risks, uncertainties and other factors that could adversely affect our business or that could otherwise result in changes that differ materially from our expectations. In addition to the specific factors mentioned in this report, we may also be affected by other factors that affect businesses generally such as global or regional changes in economic or business conditions, acts of war, terrorism and natural disasters.
Recent legislation and new and pending regulation may significantly affect our business.
In recent years, there has been significant legislation and increased regulation affecting the financial services industry. These legislative and regulatory initiatives affect not only us, but also our competitors and certain of our clients. These changes could have an effect on our revenue and profitability, limit our ability to pursue certain business opportunities, impact the value of assets that we hold, require us to change certain business practices, impose additional costs on us and otherwise adversely affect our business. Accordingly, we cannot provide assurance that legislation and regulation will not eventually have an adverse effect on our business, results of operations, cash flows and financial condition.
Title VII of the Dodd-Frank Act and the rules and regulations adopted and to be adopted by the SEC and CFTC introduce a comprehensive regulatory regime for swaps and security-based swaps and parties that deal in such swaps and security-based swaps. We have registered three of our subsidiaries as swap dealers with the CFTC and the NFA and may register one or more subsidiaries as security-based swap dealers with the SEC. The new laws and
7
JEFFERIES GROUP LLC AND SUBSIDIARIES
regulations subject certain swaps and security-based swaps to clearing and exchange trading requirements and subject swap dealers and security-based swap dealers to significant new burdens, including (i) capital and margin requirements, (ii) reporting, recordkeeping and internal business conduct requirements, (iii) external business conduct requirements in dealings with swap counterparties (which are particularly onerous when the counterparty is a special entity such as a federal, state, or municipal entity, an ERISA plan, a government employee benefit plan or an endowment), and (iv) large trader position reporting and certain position limit requirements. The final rules under Title VII, including those rules that have already been adopted, for both cleared and uncleared swap transactions will impose increased capital and margin requirements on our registered entities and require additional operational and compliance costs and resources that will likely affect our business.
Section 619 of the Dodd-Frank Act (Volcker Rule) limits certain proprietary trading by banking entities such as banks, bank holding companies and similar institutions. Although we are not a banking entity and are not otherwise subject to these rules, some of our clients and many of our counterparties are banks or entities affiliated with banks and are subject to these restrictions. These sections of the Dodd-Frank Act and the regulations that are adopted to implement them could negatively affect the swaps and securities markets by reducing their depth and liquidity and thereby affect pricing in these markets. Other negative effects could result from an expansive extraterritorial application of the Dodd-Frank Act in general or the Volcker Rule in particular and/or insufficient international coordination with respect to adoption of rules for derivatives and other financial reforms in other jurisdictions. We will not know the exact impact that these changes in the markets will have on our business until after the final rules are implemented.
The Dodd-Frank Act, in addressing systemic risks to the financial system, charges the Federal Reserve with drafting enhanced regulatory requirements for systemically important bank holding companies and certain other nonbank financial companies designated as systemically important by the Financial Stability Oversight Council. The enhanced requirements proposed by the Federal Reserve include capital requirements, liquidity requirements, limits on credit exposure concentrations and risk management requirements. We do not believe that we will be deemed to be a systemically important nonbank financial company under the new legislation and therefore will not be directly impacted. However, there will be an indirect impact to us to the extent that the new regulations apply to our competitors, counterparties and certain of our clients.
Extensive international regulation of our business limits our activities, and, if we violate these regulations, we may be subject to significant penalties.
The financial services industry is subject to extensive laws, rules and regulations in every country in which we operate. Firms that engage in securities and derivatives trading, commodity futures brokerage, wealth and asset management and investment banking must comply with the laws, rules and regulations imposed by national and state governments and regulatory and self-regulatory bodies with jurisdiction over such activities. Such laws, rules and regulations cover all aspects of the financial services business, including, but not limited to, sales and trading methods, trade practices, use and safekeeping of customers' funds and securities, capital structure, anti-money laundering and anti-bribery and corruption efforts, recordkeeping and the conduct of directors, officers and employees.
Each of our regulators supervises our business activities to monitor compliance with such laws, rules and regulations in the relevant jurisdiction. In addition, if there are instances in which our regulators question our compliance with laws, rules, and regulations, they may investigate the facts and circumstances to determine whether we have complied. At any moment in time, we may be subject to one or more such investigation or similar reviews. At this time, all such investigations and similar reviews are insignificant in scope and immaterial to us. However, there can be no assurance that, in the future, the operations of our businesses will not violate such laws, rules, or regulations and that related investigations and similar reviews could result in adverse regulatory requirements, regulatory enforcement actions and/or fines.
The European Market Infrastructure Regulation ("EMIR") was enacted in August 2012 and, in common with the Dodd-Frank Act in the U.S., is intended, among other things, to reduce counterparty risk by requiring standardized over-the-counter derivatives be cleared through a central counterparty and reported to registered trade repositories. EMIR is being introduced in phases in the U.K., with implementation of additional requirements
8
JEFFERIES GROUP LLC AND SUBSIDIARIES
expected through 2019. Likewise, the amendments to the Markets in Financial Instruments Directive and the Market Abuse Regulation and new Market Abuse Directive ("MAD 2") both in response to recommendations from the European Commission following the financial crisis are likely to impact our business when they come into force during 2016. The European Commission's changes to the Capital Requirements Directive ("CRD") comprising CRD IV and the Capital Requirements Regulation ("CRR") became effective January 1, 2014.
Additional legislation, changes in rules, changes in the interpretation or enforcement of existing laws and rules, or the entering into businesses that subject us to new rules and regulations may directly affect our business, results of operations and financial condition. We continue to monitor the impact of new European regulation on our businesses.
Changing conditions in financial markets and the economy could result in decreased revenues, losses or other adverse consequences.
As a global securities and investment banking firm, global or regional changes in the financial markets or economic conditions could adversely affect our business in many ways, including the following:
| • | A market downturn could lead to a decline in the volume of transactions executed for customers and, therefore, to a decline in the revenues we receive from commissions and spreads. |
| • | Unfavorable financial or economic conditions could reduce the number and size of transactions in which we provide underwriting, financial advisory and other services. Our investment banking revenues, in the form of financial advisory and sales and trading or placement fees, are directly related to the number and size of the transactions in which we participate and could therefore be adversely affected by unfavorable financial or economic conditions. |
| • | Adverse changes in the market could lead to losses from principal transactions on our inventory positions. |
| • | Adverse changes in the market could also lead to a reduction in revenues from asset management fees and investment income from managed funds and losses on our own capital invested in managed funds. Even in the absence of a market downturn, below-market investment performance by our funds and portfolio managers could reduce asset management revenues and assets under management and result in reputational damage that might make it more difficult to attract new investors. |
| • | Limitations on the availability of credit, such as occurred during 2008, can affect our ability to borrow on a secured or unsecured basis, which may adversely affect our liquidity and results of operations. |
| • | New or increased taxes on compensation payments such as bonuses or on balance sheet items may adversely affect our profits. |
| • | Should one of our customers or competitors fail, our business prospects and revenue could be negatively impacted due to negative market sentiment causing customers to cease doing business with us and our lenders to cease loaning us money, which could adversely affect our business, funding and liquidity. |
Unfounded allegations about us could result in extreme price volatility and price declines in our securities and loss of revenue, clients, and employees.
Our reputation and business activity can be affected by statements and actions of third parties, even false or misleading statements by them. While we have been able to dispel such rumors in the past, our debt-securities prices suffered not only extreme volatility but also record high yields. In addition, our operations in the past have been impacted as some clients either ceased doing business or temporarily slowed down the level of business they do, thereby decreasing our revenue stream. Although we were able to reverse the negative impact of such unfounded allegations and false rumors, there is no assurance that we will be able to do so successfully in the future and our potential failure to do so could have a material adverse effect on our business, financial condition and liquidity.
9
JEFFERIES GROUP LLC AND SUBSIDIARIES
A credit-rating agency downgrade could significantly impact our business.
Maintaining an investment grade credit rating is important to our business and financial condition. We intend to access the capital markets and issue debt securities from time to time; and a decrease in our credit rating would not only increase our borrowing costs, but could also decrease demand for our debt securities and make a successful financing more difficult. In addition, in connection with certain over-the-counter derivative contract arrangements and certain other trading arrangements, we may be required to provide additional collateral to counterparties, exchanges and clearing organizations in the event of a credit rating downgrade. Such a downgrade could also negatively impact our debt-securities prices. There can be no assurance that our credit ratings will not be downgraded.
Our principal trading and investments expose us to risk of loss.
A considerable portion of our revenues is derived from trading in which we act as principal. We may incur trading losses relating to the purchase, sale or short sale of fixed income, high yield, international, convertible, and equity securities and futures and commodities for our own account. In any period, we may experience losses on our inventory positions as a result of price fluctuations, lack of trading volume, and illiquidity. From time to time, we may engage in a large block trade in a single security or maintain large position concentrations in a single security, securities of a single issuer, securities of issuers engaged in a specific industry, or securities from issuers located in a particular country or region. In general, because our inventory is marked to market on a daily basis, any adverse price movement in these securities could result in a reduction of our revenues and profits. In addition, we may engage in hedging transactions that if not successful, could result in losses.
Increased competition may adversely affect our revenues, profitability and staffing.
All aspects of our business are intensely competitive. We compete directly with a number of bank holding companies and commercial banks, other brokers and dealers, investment banking firms and other financial institutions. In addition to competition from firms currently in the securities business, there has been increasing competition from others offering financial services, including automated trading and other services based on technological innovations. We believe that the principal factors affecting competition involve market focus, reputation, the abilities of professional personnel, the ability to execute the transaction, relative price of the service and products being offered, bundling of products and services and the quality of service. Increased competition or an adverse change in our competitive position could lead to a reduction of business and therefore a reduction of revenues and profits.
Competition also extends to the hiring and retention of highly skilled employees. A competitor may be successful in hiring away employees, which may result in our losing business formerly serviced by such employees. Competition can also raise our costs of hiring and retaining the employees we need to effectively operate our business.
Operational risks may disrupt our business, result in regulatory action against us or limit our growth.
Our businesses are highly dependent on our ability to process, on a daily basis, a large number of transactions across numerous and diverse markets in many currencies, and the transactions we process have become increasingly complex. If any of our financial, accounting or other data processing systems do not operate properly or are disabled or if there are other shortcomings or failures in our internal processes, people or systems, we could suffer an impairment to our liquidity, financial loss, a disruption of our businesses, liability to clients, regulatory intervention or reputational damage. These systems may fail to operate properly or become disabled as a result of events that are wholly or partially beyond our control, including a disruption of electrical or communications services or our inability to occupy one or more of our buildings. The inability of our systems to accommodate an increasing volume of transactions could also constrain our ability to expand our businesses.
We also face the risk of operational failure or termination of any of the clearing agents, exchanges, clearing houses or other financial intermediaries we use to facilitate our securities transactions. Any such failure or termination could adversely affect our ability to effect transactions and manage our exposure to risk.
10
JEFFERIES GROUP LLC AND SUBSIDIARIES
In addition, despite the contingency plans we have in place, our ability to conduct business may be adversely impacted by a disruption in the infrastructure that supports our businesses and the communities in which they are located. This may include a disruption involving electrical, communications, transportation or other services used by us or third parties with which we conduct business.
Our operations rely on the secure processing, storage and transmission of confidential and other information in our computer systems and networks. Although we take protective measures and endeavor to modify them as circumstances warrant, our computer systems, software and networks may be vulnerable to unauthorized access, computer viruses or other malicious code, and other events that could have a security impact. Additionally, if a client's computer system, network or other technology is compromised by unauthorized access, we may face losses or other adverse consequences by unknowingly entering into unauthorized transactions. If one or more of such events occur, this potentially could jeopardize our or our clients' or counterparties' confidential and other information processed and stored in, and transmitted through, our computer systems and networks. Furthermore, such events may cause interruptions or malfunctions in our, our clients', our counterparties' or third parties' operations, including the transmission and execution of unauthorized transactions. We may be required to expend significant additional resources to modify our protective measures or to investigate and remediate vulnerabilities or other exposures, and we may be subject to litigation and financial losses that are either not insured against or not fully covered through any insurance maintained by us.
We face numerous risks and uncertainties as we expand our business.
We expect the growth of our business to come primarily from internal expansion and through acquisitions and strategic partnering. As we expand our business, there can be no assurance that our financial controls, the level and knowledge of our personnel, our operational abilities, our legal and compliance controls and our other corporate support systems will be adequate to manage our business and our growth. The ineffectiveness of any of these controls or systems could adversely affect our business and prospects. In addition, as we acquire new businesses and introduce new products, we face numerous risks and uncertainties integrating their controls and systems into ours, including financial controls, accounting and data processing systems, management controls and other operations. A failure to integrate these systems and controls, and even an inefficient integration of these systems and controls, could adversely affect our business and prospects.
Certain business intiatives, including expansions of exsiting businesses, may bring us into contact directly or indirectly, with individuals and entities that are not within our traditional client and counterparty base and may expose us to new asset classes and new markets. These business activities expose us to new and enhanced risks, greater regulatory scrutiny of these activities, increased credit-related, sovereign and operational risks, and reputational concerns regarding the manner in which these assets are being operated or held.
Our international operations subject us to numerous risks which could adversely impact our business in many ways.
Our business and operations are expanding internationally. Wherever we operate, we are subject to legal, regulatory, political, economic and other inherent risks. The laws and regulations applicable to the securities and investment banking industries differ in each country. Our inability to remain in compliance with applicable laws and regulations in a particular country could have a significant and negative effect on our business and prospects in that country as well as in other countries. A political, economic or financial disruption in a country or region could adversely impact our business and increase volatility in financial markets generally.
Legal liability may harm our business.
Many aspects of our business involve substantial risks of liability, and in the normal course of business, we have been named as a defendant or codefendant in lawsuits involving primarily claims for damages. The risks associated with potential legal liabilities often may be difficult to assess or quantify and their existence and magnitude often remain unknown for substantial periods of time. The expansion of our business, including increases in the number and size of investment banking transactions and our expansion into new areas impose greater risks of liability. In addition, unauthorized or illegal acts of our employees could result in substantial liability to us. Substantial legal liability could have a material adverse financial effect or cause us significant reputational harm, which in turn could seriously harm our business and our prospects.
11
JEFFERIES GROUP LLC AND SUBSIDIARIES
Our business is subject to significant credit risk.
In the normal course of our businesses, we are involved in the execution, settlement and financing of various customer and principal securities and derivative transactions. These activities are transacted on a cash, margin or delivery-versus-payment basis and are subject to the risk of counterparty or customer nonperformance. Although transactions are generally collateralized by the underlying security or other securities, we still face the risks associated with changes in the market value of the collateral through settlement date or during the time when margin is extended and the risk of counterparty nonperformance to the extent collateral has not been secured or the counterparty defaults before collateral or margin can be adjusted. We may also incur credit risk in our derivative transactions to the extent such transactions result in uncollateralized credit exposure to our counterparties.
We seek to control the risk associated with these transactions by establishing and monitoring credit limits and by monitoring collateral and transaction levels daily. We may require counterparties to deposit additional collateral or return collateral pledged. In the case of aged securities failed to receive, we may, under industry regulations, purchase the underlying securities in the market and seek reimbursement for any losses from the counterparty. However, there can be no assurances that our risk controls will be successful.
Derivative transactions may expose us to unexpected risk and potential losses.
We are party to a number of derivative transactions that require us to deliver to the counterparty the underlying security, loan or other obligation in order to receive payment. In a number of cases, we do not hold the underlying security, loan or other obligation and may have difficulty obtaining, or be unable to obtain, the underlying security, loan or other obligation through the physical settlement of other transactions. As a result, we are subject to the risk that we may not be able to obtain the security, loan or other obligation within the required contractual time frame for delivery. This could cause us to forfeit the payments due to us under these contracts or result in settlement delays with the attendant credit and operational risk as well as increased costs to the firm.
| Item 1B. | Unresolved Staff Comments. |
None.
| Item 2. | Properties. |
We maintain offices in over 30 cities throughout the world including, in the United States, Charlotte, Chicago, Boston, Houston, Los Angeles, San Francisco, Stamford, and Jersey City, and internationally, London, Frankfurt, Milan, Paris, Zurich, Dubai, Hong Kong, Singapore, Tokyo and Mumbai. In addition, we maintain backup data center facilities with redundant technologies for each of our three main data center hubs in Jersey City, London and Hong Kong. We lease all of our office space, or contract via service arrangement, which management believes is adequate for our business.
| Item 3. | Legal Proceedings. |
Many aspects of our business involve substantial risks of legal and regulatory liability. In the normal course of business, we have been named as defendants or co-defendants in lawsuits involving primarily claims for damages. We are also involved in a number of judicial and regulatory matters, including exams, investigations and similar reviews, arising out of the conduct of our business. Based on currently available information, we do not believe that any matter will have a material adverse effect on our financial condition.
Seven class-action lawsuits had been filed in New York and Delaware on behalf of a class consisting of Jefferies Group's stockholders concerning the transaction through which Jefferies Group LLC became a wholly owned subsidiary of Leucadia National Corporation. The class actions named as defendants Leucadia, Jefferies Group, Inc., certain members of our board of directors, certain members of Leucadia's board of directors and, in certain of the
12
JEFFERIES GROUP LLC AND SUBSIDIARIES
actions, certain transaction-related subsidiaries. On October 31, 2014, the remaining defendants in the Delaware litigation entered into a settlement agreement with the plaintiffs in the Delaware litigation. The terms of that agreement, which are subject to court approval, provide for an aggregate payment of $70.0 million by Leucadia, who will bear the costs of the settlement, to certain former equity holders of Jefferies Group, Inc., other than the defendants and certain of their affiliates, along with attorneys' fees to be determined and approved by the court. The agreement further provides that the settlement will be paid, at Leucadia's option, in either cash or Leucadia common shares. If approved by the court, the settlement will resolve all of the class-action claims in Delaware, and release the claims brought in New York.
During the first quarter of 2014, we reached a non-prosecution agreement ("NPA") with the United States Attorney for the District of Connecticut and a settlement agreement with the SEC relating to an investigation of purchases and sales of mortgage-backed securities. That NPA expires on January 29, 2015. That investigation arose from a matter that came to light in late 2011, at which time we terminated a mortgage-backed-securities trader who was then indicted by the United States Attorney for the District of Connecticut in January 2013 and separately charged in a civil complaint by the SEC. Those agreements include an aggregate $25.0 million in payments, of which approximately $11.0 million are payments to trading counterparties impacted by those activities, approximately $10.0 million of which is a fine payable to the U.S. Attorney's Office, and approximately $4.0 million of which is a fine payable to the SEC. All such amounts were recognized in our year-end 2013 financial statements. At November 30, 2014, the outstanding reserve with respect to remaining payments to be made under the agreements is approximately $1.9 million. Additionally, pursuant to an undertaking required by the SEC settlement, Jefferies has retained an Independent Compliance Consultant ("ICC"). We anticipate that the ICC's work will be completed in early 2015.
| Item 4. | Mine Safety Disclosures. |
Not applicable.
13
JEFFERIES GROUP LLC AND SUBSIDIARIES
PART II
Item 5. Market for Registrant's Common Equity, Related Stockholder Matters and Issuer Purchases of Equity Securities.
Prior to the Leucadia Transaction, our common stock was traded on the NYSE under the symbol JEF. On March 1, 2013, all of our outstanding common shares were exchanged for shares of Leucadia, our common stock was delisted and there is no longer a public trading market for our common stock. Our ability to pay distributions to Leucadia is subject to the restrictions set forth in certain financial covenants associated with our $750.0 million Credit Facility described in Note 14, Long-Term Debt in our consolidated financial statements included within this Annual Report on Form 10-K and the governing provisions of the Delaware Limited Liability Company Act. We do not currently anticipate making distributions.
Dividends per Common Share (declared) were as follows:
| 1 st Quarter | 2 nd Quarter | 3 rd Quarter | 4 th Quarter | |||||||||||||
2014 | N/a | N/a | N/a | N/a | ||||||||||||
2013 | $ | 0.075 | N/a | N/a | N/a | |||||||||||
2012 | $ | 0.075 | $ | 0.075 | $ | 0.075 | $ | 0.075 | ||||||||
| Item 6 . | Selected Financial Data. |
Omitted pursuant to general instruction I(2)(a) to Form 10-K.
| Item 7. | Management's Discussion and Analysis of Financial Condition and Results of Operations. |
This report contains or incorporates by reference "forward looking statements" within the meaning of the safe harbor provisions of Section 27A of the Securities Act of 1933 and Section 21E of the Securities Exchange Act of 1934. Forward looking statements include statements about our future and statements that are not historical facts. These forward looking statements are usually preceded by the words "believe," "intend," "may," "will," or similar expressions. Forward looking statements may contain expectations regarding revenues, earnings, operations and other results, and may include statements of future performance, plans and objectives. Forward looking statements also include statements pertaining to our strategies for future development of our business and products. Forward looking statements represent only our belief regarding future events, many of which by their nature are inherently uncertain. It is possible that the actual results may differ, possibly materially, from the anticipated results indicated in these forward-looking statements. Information regarding important factors that could cause actual results to differ, perhaps materially, from those in our forward looking statements is contained in this report and other documents we file. You should read and interpret any forward looking statement together with these documents, including the following:
| • | the description of our business contained in this report under the caption "Business"; |
| • | the risk factors contained in this report under the caption "Risk Factors"; |
| • | the discussion of our analysis of financial condition and results of operations contained in this report under the caption "Management's Discussion and Analysis of Financial Condition and Results of Operations" herein; |
| • | the discussion of our risk management policies, procedures and methodologies contained in this report under the caption "Management's Discussion and Analysis of Financial Condition and Results of Operations-Risk Management" herein; |
| • | the notes to the consolidated financial statements contained in this report; and |
| • | cautionary statements we make in our public documents, reports and announcements. |
14
JEFFERIES GROUP LLC AND SUBSIDIARIES
Any forward looking statement speaks only as of the date on which that statement is made. We will not update any forward looking statement to reflect events or circumstances that occur after the date on which the statement is made, except as required by applicable law.
Consolidated Results of Operations
On March 1, 2013, Jefferies Group, Inc. converted into a limited liability company (renamed Jefferies Group LLC) and became an indirect wholly owned subsidiary of Leucadia National Corporation ("Leucadia") pursuant to an agreement with Leucadia (the "Leucadia Transaction"). Each outstanding share of Jefferies Group LLC was converted into 0.81 of a common share of Leucadia (the "Exchange Ratio"). Jefferies Group LLC continues to operate as a full-service investment banking firm and as the holding company to its various regulated and unregulated operating subsidiaries, retain a credit rating separate from Leucadia and remain an SEC reporting company, filing annual, quarterly and periodic financial reports. Richard Handler, our Chief Executive Officer and Chairman, is also the Chief Executive Officer of Leucadia, as well as a Director of Leucadia. Brian P. Friedman, our Chairman of the Executive Committee, is Leucadia's President and a Director of Leucadia. (See Note 1, Organization and Basis of Presentation in our consolidated financial statements for further information.)
In Management's Discussion and Analysis of Financial Condition and Results of Operations, we have presented the historical financial results in the tables that follow for the periods before and after the Leucadia Transaction. Periods prior to March 1, 2013 are referred to as Predecessor periods, while periods after March 1, 2013 are referred to as Successor periods to reflect the fact that under U.S. generally accepted accounting principles ("U.S. GAAP") Leucadia's cost of acquiring Jefferies Group LLC has been pushed down to create a new accounting basis for Jefferies Group LLC. The Predecessor and Successor periods have been separated by a vertical line to highlight the fact that the financial information for such periods has been prepared under two different cost bases of accounting. Our financial results of operations are discussed separately for the following periods (i) the year ended November 30, 2014 and the nine months ended November 30, 2013 (the "Successor periods") and (ii) the three months ended February 28, 2013 and the year ended November 30, 2012 (the "Predecessor period"). The following table provides an overview of our consolidated results of operations (in thousands):
| Successor | Predecessor | |||||||||||||||
| Year Ended November 30, 2014 (1) | Nine Months Ended November 30, 2013 | Three Months Ended February 28, 2013 | Year Ended November 30, 2012 | |||||||||||||
Net revenues, less mandatorily redeemable preferred interests | $ | 2,990,138 | $ | 2,137,313 | $ | 807,583 | $ | 3,018,769 | ||||||||
Non-interest expenses | 2,687,117 | 1,873,018 | 668,096 | 2,526,974 | ||||||||||||
Earnings before income taxes | 303,021 | 264,295 | 139,487 | 491,795 | ||||||||||||
Income tax expense | 142,061 | 94,686 | 48,645 | 168,646 | ||||||||||||
Net earnings | 160,960 | 169,609 | 90,842 | 323,149 | ||||||||||||
Net earnings to noncontrolling interests | 3,400 | 8,418 | 10,704 | 40,740 | ||||||||||||
Net earnings attributable to Jefferies Group LLC / common stockholders | 157,560 | 161,191 | 80,138 | 282,409 | ||||||||||||
Effective tax rate | 46.9 | % | 35.8 | % | 34.9 | % | 34.3 | % | ||||||||
| (1) | Our results of operations for the year ended November 30, 2014 as reported in this Annual Report on Form 10-K differ from the results of operations as presented in our Current Report on Form 8-K, dated December 16, 2014 to reflect post-closing adjustments for inventory valuations, year-end compensation accruals and accruals for estimated other expenses. The net impact of these adjustments was to reduce Net earnings attributable to Jefferies Group LLC for the reported period from that previously disclosed by $7.4 million. As a result of these adjustments, Total Net revenues decreased by $12.8 million to $2,990.1 million and Total Non-interest expenses decreased by $0.2 million to $2,687.1 million. The tax effect of these adjustments was to reduce Income tax expense by $5.1 million to $142.1 million. |
15
JEFFERIES GROUP LLC AND SUBSIDIARIES
Executive Summary
Year Ended November 30, 2014
Net revenues, less mandatorily redeemable preferred interests, for the year ended November 30, 2014 were $2,990.1 million, reflecting record revenues in investment banking, partially offset by lower revenues in fixed income due to challenging market conditions during portions of the year. The results reflected the continued tapering of the U.S. Federal reserve monetary stimulus and global economic pressures, as well as the challenging credit markets, specifically the high yield bond and distressed markets in the fourth quarter of 2014. In addition, our Jefferies Bache business has experienced various challenges with respect to its profitability and consequently we have decided to pursue alternatives for this business, which may include disposal. The results for the year ended November 30, 2014 reflect within Net revenues positive income of $100.6 million from the amortization of premiums arising from recognizing our long-term debt at fair value as part of the pushdown accounting for the Leucadia Transaction and a loss of $14.7 million from our investment in KCG Holdings, Inc. ("Knight") and a gain of $19.9 from our investment in Harbinger Group Inc. ("Harbinger"), the latter of which we sold to Leucadia in March 2014.
Non-interest expenses were $2,687.1 million for the year ended November 30, 2014 and include Compensation and benefits expense of $1,698.5 million recognized commensurate with the level of net revenues for the year. Compensation and benefits expenses as a percentage of Net revenues was 56.8% for the year ended November 30, 2014. Non-interest expenses include goodwill impairment losses of $54.0 million and impairment losses of $7.8 million on certain intangible assets related to our Jefferies Bache (also referred to as Futures) and International Asset Management businesses. In addition, Non-interest expenses include $7.7 million in additional lease expense related to recognizing existing leases at their current market value, incremental amortization expense of $14.2 million associated with intangible assets and internally developed software recognized at the Leucadia Transaction date, and $14.4 million of additional amortization expense related to the write-up of the cost of outstanding share-based awards which had future service requirements and was recognized in connection with the Leucadia Transaction.
At November 30, 2014, we had 3,915 employees globally, an increase of 118 employees from our headcount of 3,797 at November 30, 2013.
Nine Months Ended November 30, 2013
Net revenues, less mandatorily redeemable preferred interests, for the nine months ended November 30, 2013 were $2,137.3 million reflecting a challenging environment for our fixed income businesses during portions of the period, partially offset by strong results in equities and investment banking. The results for the nine month period reflect within Net revenues positive income of $73.8 million, representing the amortization of premiums arising from recognizing our long-term debt at fair value as part of the pushdown accounting for the Leucadia Transaction and gains of $89.3 million in aggregate from our investments in Knight Capital, Inc. ("Knight Capital") and Harbinger.
Non-interest expenses were $1,873.0 million for the nine months ended November 30, 2013 and include Compensation and benefits expense of $1,213.9 million recognized commensurate with the level of net revenues for the nine month period. Compensation and benefits expenses as a percentage of Net revenues was 56.7% for the nine months ended November 30, 2013. Non-interest expense also includes approximately $50.0 million in merger related costs associated with the closing of the Leucadia Transaction. These costs are comprised of $11.6 million in transaction-related investment banking, legal and filing fees, $6.3 million in additional lease expense related to recognizing existing leases at their current market value, incremental amortization expense of $21.1 million associated with intangible assets and internally developed software recognized at the Leucadia Transaction date, and $11.0 million of additional amortization expense related to the write-up of the cost of outstanding share-based awards, which had future service requirements at the merger date. In addition, occupancy and equipment includes an $8.7 million charge associated with our relocating certain staff and abandoning certain London office space recognized during the nine month period.
At November 30, 2013, we had 3,797 employees globally, slightly below our headcount at November 30, 2012.
16
JEFFERIES GROUP LLC AND SUBSIDIARIES
Three Months Ended February 28, 2013
Net revenues, less mandatorily redeemable preferred interests, for the three months ended February 28, 2013 were $807.6 million, which include strong investment banking revenues, particularly in debt and equity capital markets, and a gain of $26.5 million on our then share ownership in Knight Capital. Non-interest expenses of $668.1 million for the three months ended February 28, 2013 reflect compensation expense consistent with the level of net revenues and professional service costs associated with the Leucadia Transaction. Compensation costs as a percentage of Net revenues for the three months ended February 28, 2013 were 57.9%.
Year Ended November 30, 2012
Net revenues, less mandatorily redeemable preferred interests, for the year ended November 30, 2012 were a record $3,018.8 million, primarily due to strong results in our fixed income businesses. During 2012, we structured and invested in a convertible preferred stock offering of Knight Capital. Net revenues for the year ended November 30, 2012 include a mark-to-market gain of $151.9 million on our share ownership in Knight Capital and an advisory fee of $20.0 million for services in respect of the transaction. Net revenues for the year ended November 30, 2012 also include within Other revenues a bargain purchase gain of $3.4 million on the acquisition of the corporate broking business of Hoare Govett from The Royal Bank of Scotland plc, a gain on debt extinguishment of $9.9 million and a gain of $23.8 million on the sale of certain mortgage servicing right assets by our Fixed Income business.
Non-interest expenses totaled $2,527.0 million for the year ended November 30, 2012 and included compensation expense of $1,770.8 million, consistent with higher net revenues. Compensation expense as a percentage of Net revenues was 57.8%. Within non-interest expenses, Technology and communications costs include the expansion of our personnel and business platforms, which has increased the demand for market data, technology connections and applications. Occupancy costs were a result of strengthening our presence in Europe and Asia and Business development expenses are commensurate with furthering the expansion of our market share. Increased professional service costs are primarily associated with the announced Leucadia Transaction and efforts associated with Dodd-Frank compliance. Floor brokerage and clearing fees for the 2012 year are reflective of lower equity trading volumes. Non-interest expenses include within Other expenses donations to Hurricane Sandy relief of $4.1 million. Our effective tax rate was 34.3% for the year ended November 30, 2012.
At November 30, 2012, we had 3,804 employees globally. We added an additional 51 employees with the acquisition of Hoare Govett in February 2012 and expanded our headcount during 2012 in our metal and energy futures business. These increases were offset by headcount reductions since the start of 2012 aimed at better resource allocation and improved productivity.
Revenues by Source
The Capital Markets reportable segment includes our securities and commodities trading activities, and our investment banking activities. The Capital Markets reportable segment provides the sales, trading and origination and advisory effort for various equity, fixed income, commodities, futures, foreign exchange and advisory products and services. The Capital Markets segment comprises many business units, with many interactions and much integration among them. In addition, we separately discuss our Asset Management business.
For presentation purposes, the remainder of "Results of Operations" is presented on a detailed product and expense basis, rather than on a business segment basis. Net revenues presented for our equity and fixed income businesses include allocations of interest income and interest expense as we assess the profitability of these businesses inclusive of the net interest revenue or expense associated with the respective activities, which is a function of the mix of each business' associated assets and liabilities and the related funding costs.
17
JEFFERIES GROUP LLC AND SUBSIDIARIES
The composition of our net revenues has varied over time as financial markets and the scope of our operations have changed. The composition of net revenues can also vary from period to period due to fluctuations in economic and market conditions, and our own performance. The following provides a summary of "Revenues by Source" for the Successor periods for the year ended November 30, 2014 and the nine months ended November 30, 2013 and the Predecessor periods for the three months ended February 28, 2013 and the year ended November 30, 2012 (amounts in thousands):
| Successor | Predecessor | |||||||||||||||||||||||||||||||
| Year Ended November 30, 2014 | Nine Months Ended November 30, 2013 | Three Months Ended February 28, 2013 | Year Ended November 30, 2012 | |||||||||||||||||||||||||||||
| Amount (1) | (2) | Amount | (2) | Amount | (2) | Amount | (2) | |||||||||||||||||||||||||
|
|
|
|
|
|
|
|
|
|
|
|
|
| |||||||||||||||||||
Equities | $ | 696,221 | 23 | % | $ | 582,355 | 27 | % | $ | 167,354 | 21 | % | $ | 642,360 | 21 | % | ||||||||||||||||
Fixed income | 747,596 | 25 | 504,092 | 24 | 352,029 | 43 | 1,253,268 | 41 | ||||||||||||||||||||||||
|
|
|
|
|
|
|
|
|
|
|
|
|
|
|
| |||||||||||||||||
Total sales and trading | 1,443,817 | 48 | 1,086,447 | 51 | 519,383 | 64 | 1,895,628 | 62 | ||||||||||||||||||||||||
Other | - | - | 4,624 | - | - | - | 13,175 | - | ||||||||||||||||||||||||
Equity | 339,683 | 11 | 228,394 | 11 | 61,380 | 7 | 193,797 | 6 | ||||||||||||||||||||||||
Debt | 627,536 | 21 | 415,932 | 19 | 140,672 | 17 | 455,790 | 15 | ||||||||||||||||||||||||
|
|
|
|
|
|
|
|
|
|
|
|
|
|
|
| |||||||||||||||||
Capital markets | 967,219 | 32 | 644,326 | 30 | 202,052 | 24 | 649,587 | 21 | ||||||||||||||||||||||||
Advisory | 562,055 | 19 | 369,191 | 17 | 86,226 | 11 | 476,296 | 16 | ||||||||||||||||||||||||
|
|
|
|
|
|
|
|
|
|
|
|
|
|
|
| |||||||||||||||||
Total investment banking | 1,529,274 | 51 | 1,013,517 | 47 | 288,278 | 35 | 1,125,883 | 37 | ||||||||||||||||||||||||
Asset management fees and investment income (loss) from managed funds: | ||||||||||||||||||||||||||||||||
Asset management fees | 26,682 | 1 | 26,473 | 2 | 11,083 | 1 | 38,130 | 1 | ||||||||||||||||||||||||
Investment income (loss) from managed funds | (9,635 | ) | - | 9,620 | - | (200 | ) | - | (11,164 | ) | - | |||||||||||||||||||||
|
|
|
|
|
|
|
|
|
|
|
|
|
|
|
| |||||||||||||||||
Total | 17,047 | 1 | 36,093 | 2 | 10,883 | 1 | 26,966 | 1 | ||||||||||||||||||||||||
|
|
|
|
|
|
|
|
|
|
|
|
|
|
|
| |||||||||||||||||
Net revenues | 2,990,138 | 100 | % | 2,140,681 | 100 | % | 818,544 | 100 | % | 3,061,652 | 100 | % | ||||||||||||||||||||
Interest on mandatorily redeemable preferred interests of consolidated subsidiaries | - | 3,368 | 10,961 | 42,883 | ||||||||||||||||||||||||||||
|
|
|
|
|
|
|
| |||||||||||||||||||||||||
Net revenues, less mandatorily redeemable preferred interests | $ | 2,990,138 | $ | 2,137,313 | $ | 807,583 | $ | 3,018,769 | ||||||||||||||||||||||||
|
|
|
|
|
|
|
| |||||||||||||||||||||||||
| (1) | Fixed income revenues for the year ended November 30, 2014 as reported in this Annual Report on Form 10-K differ from the results of operations as presented in our Current Report on Form 8-K, dated December 16, 2014 to reflect post-closing adjustments for inventory valuations. The net impact of these adjustments was to reduce both Fixed income revenues and Total net revenues by $12.8 million. |
| (2) | Amounts represent Revenues by Source as a percentage of Net revenues. |
Net Revenues
Net revenues for the year ended November 30, 2014 were $2,990.1 million, reflecting record investment banking revenues, partially offset by lower revenues due to challenging trading environments in our fixed income business, particularly in the fourth quarter of 2014. Our core equities business performed relatively well during the year ended November 30, 2014. The 2014 results include a loss of $14.7 million from our investment in Knight Capital and a gain of $19.9 from our investment in Harbinger, the latter of which we sold to Leucadia in March 2014. Asset management fee results were offset by write-downs on certain of our investments in unconsolidated funds and the exclusion of fees from our ownership interest in CoreCommodity Management, LLC ("CoreCommodity"), which we restructured on September 11, 2013.
Net revenues for the nine months ended November 30, 2013 of $2,140.7 million reflect a solid performance in our equity sales and trading business and continued strength in our investment banking platform. Our fixed income businesses experienced difficult trading conditions for a portion of the period as a result of a change in expectations for interest rates surrounding the Federal Reserve's plans for tapering its asset purchase program. The nine months results include gains of $89.3 million in aggregate within Equities Principal transaction revenues from our investments in Knight Capital and Harbinger.
18
JEFFERIES GROUP LLC AND SUBSIDIARIES
Net revenues for the three months ended February 28, 2013 were $818.5 million as a result of improved overall market activity, with all of our business lines demonstrating strong results. Within Equities revenues, Net revenues include Principal transaction revenues of $26.5 million from unrealized gains related to our investment in Knight Capital during the quarter.
Net revenues for the year ended November 30, 2012 were a record $3,061.7 million. Our 2012 results include Principal transaction revenues of $151.9 million from our investment in Knight Capital. Fixed income revenues were supported by investor demand for higher-yielding assets translating into reasonably robust trading volumes while muted secondary trading volume affected equities revenues (excluding revenues from our ownership of Knight Capital). Investment banking revenue of $1,125.9 million reflects the building strength of our franchise. Asset management fee results were offset by write-downs on certain of our investments in unconsolidated funds. In addition, Net revenues for the year included within Other revenues a bargain purchase gain of $3.4 million recognized in connection with our acquisition of Hoare Govett in February 2012 and a gain on extinguishment of debt of $9.9 million related to transactions in our own debt by our broker-dealer's market-making desk in December 2011.
Interest on mandatorily redeemable preferred interests of consolidated subsidiaries represents primarily the allocation of earnings and losses from our high yield business to third party noncontrolling interest holders that were invested in that business through mandatorily redeemable preferred securities. These interests were redeemed in April 2013 and all of the results in our high yield business are now wholly allocated to us.
Equities Revenue
Equities revenue is comprised of equity commissions, principal transactions and net interest revenue relating to cash equities, electronic trading, equity derivatives, convertible securities, prime brokerage, securities finance and alternative investment strategies. Equities revenue is heavily dependent on the overall level of trading activity of our clients. Equities revenue also includes our share of the net earnings from our joint venture investments in Jefferies Finance, LLC ("Jefferies Finance") and Jefferies LoanCore, LLC ("LoanCore"), which are accounted for under the equity method, as well changes in the value of our investments in Knight Capital and Harbinger. In March 2014, we sold our investment in Harbinger to Leucadia at fair market value. Equities revenue is heavily dependent on the overall trading activity of our clients.
Year Ended November 30, 2014
Total equities revenue was $696.2 million for the year ended November 30, 2014. Equities revenue includes losses of $14.7 million from our investment in Knight Capital and a gain of $19.9 from our investment in Harbinger, as compared to gains of $116.8 million recognized primarily in the fourth quarter of fiscal 2013. Revenues also include an unrealized gain of $8.9 million from marking to market the option on Leucadia shares embedded in our 3.875% Senior Convertible Debentures. Additionally, during the first quarter of 2014, we recognized a gain of $12.2 million in connection with our investment in CoreCommodity, which was transferred to Leucadia on February 28, 2014. Also included within interest expense allocated to our equities business is positive income of $45.1 million related to the amortization of premiums arising from the adjustment of our long-term debt to fair value as part of accounting for the Leucadia Transaction.
For the year ended November 30, 2014, U.S. stock prices continue an overall upward trend with company earnings and economic data largely meeting expectations and the outlook for monetary policy remaining favorable. While the markets in the fourth quarter were relatively unsettled, the S&P 500 Index was up 14.5% for the fiscal year and exchange trading volumes increased generally, which contributed to increased commission revenue. Similarly, European exchange volumes grew significantly throughout the 2014 year. Additionally, the performance from our electronic trading platform and our prime brokerage business has continued to increase.
Equities revenue from our Jefferies Finance joint venture decreased during the year ended November 30, 2014 as compared to the nine months ended November 30, 2013 and the three months ended February 28, 2013, due to a reduction in loan closings and syndications by the venture, particularly in the fourth quarter of 2014. Equities revenue from our LoanCore joint venture decreased during the year ended November 30, 2014 as compared to the
19
JEFFERIES GROUP LLC AND SUBSIDIARIES
nine months ended November 30, 2013 and the three months ended February 28, 2013, due to fewer securitizations by the venture over the period. These declines were offset by results from certain block trading opportunities and the benefits of the general stock market rise and other positioning on certain security positions. In addition, during the first quarter of 2014, we deconsolidated certain of our strategic investment entities as additional third party investments were received during the period. Accordingly, the results from this business reflected in equities revenues for the year ended November 30, 2014 represent trading revenues solely from managed accounts that are solely owned by us. Results from our strategic investments business in prior periods represented 100% of strategic investment trading revenues, a portion of which was attributed to noncontrolling interests.
Nine Months Ended November 30, 2013
Total equities revenue was $582.4 million for the nine months ended November 30, 2013. Equities revenue includes within Principal transaction revenues a gain of $19.5 million on our investment in Knight Capital, a gain of $69.8 million from our investment in Harbinger and an unrealized gain of $6.9 million from marking to market the option on Leucadia shares embedded in our 3.875% Senior Convertible Debentures. In addition, included within Interest expense is positive income of $33.7 million from the allocation to our equities business of a portion of the amortization of premiums arising from the adjustment of our long-term debt to fair value as part of accounting for the Leucadia Transaction.
U.S. equity market conditions during the period were characterized by continually increasing stock prices as the U.S. government maintained its monetary stimulus program. In the equity markets, the NASDAQ Composite Index, the S&P 500 Index and the Dow Jones Industrial Average increased by 28%, 19% and 14%, respectively, over the nine month period ended November 30, 2013, with the S&P Index registering a series of record closing highs. However, during the nine months ended November 30, 2013, economic data in the U.S. continued to indicate a slow recovery and geopolitical concerns regarding the Middle East and a U.S. federal government shutdown added volatility in the U.S. and international markets. Despite the rally in the equity markets in 2013, overall market volumes were subdued moderating customer flow in our U.S. cash equity business, although we benefited from certain block trading opportunities during the period.
In Europe, liquidity returned to the market as the European Central Bank convinced investors that it would not allow the Eurozone to breakup aiding results to both our cash and option desks, although the results are still impacted by relatively low trading volumes given the region's fragile economy. Additionally, Asian equity commissions are stronger, particularly in Japan with new monetary policies increasing trading volumes on the Nikkei Exchange.
Our Securities Finance desk also contributed solidly to Equities revenue for the period and the performance of certain strategic investment strategies were strong. Revenue from our sales and trading of convertible securities for the nine months are reflective of increased market share as we have expanded our team in this business. Net earnings from our Jefferies Finance and LoanCore joint ventures reflect a solid level of securitization deals and loan closings during the 2013 nine month period.
Three Months Ended February 28, 2013
Total equities revenue was $167.4 million for the three months ended February 28, 2013 and includes within Principal transaction revenues an unrealized gain of $26.5 million recognized on our investment in Knight Capital. While U.S. equity markets posted gains during our first quarter, with the S&P index up 7%, investors remained cautious as evidenced by declining volumes. Although market volumes declined, our equity trading desks experienced ample client trading volumes. For the three months ended February 28, 2013, performance from certain strategic investments benefited from the increase in the overall stock markets and other positioning.
Year Ended November 30, 2012
For the year ended November 30, 2012, total equities revenue was $642.4 million, including a gain of $151.9 million earned on our investment in Knight Capital and recognized within Principal transaction revenues. While U.S. equity markets posted gains during the year with the S&P index up over 13%, investor caution, due to less favorable economic data in the U.S. and concerns of a slowdown in the global economy, was evidenced through declining volumes which contributed to reduced commissions. Similarly, European equity revenues were affected by
20
JEFFERIES GROUP LLC AND SUBSIDIARIES
lower overall volumes across the broader markets, compounded by fears over Eurozone uncertainty. Partially offsetting these lower revenues was an increase in our Asian equity commissions as our client base increased. Trading revenue from our equity derivatives business improved on a change in our strategy regarding client activity. LoanCore closed its first securitization in May 2012, which contributed to alternative equity investment revenues.
Fixed Income Revenue
Fixed income revenue includes commissions, principal transactions and net interest revenue from investment grade corporate bonds, mortgage- and asset-backed securities, government and agency securities, municipal bonds, emerging markets debt, high yield and distressed securities, bank loans, foreign exchange and commodities trading activities.
Year Ended November 30, 2014
Fixed income revenue was $747.6 million for the year ended November 30, 2014. Included within Interest expense for the period is positive income of $55.5 million from the allocation to our fixed income business of a portion of the amortization of premiums arising from adjusting our long-term debt to fair value as part of accounting for the Leucadia Transaction.
The fixed income markets during the year ended November 30, 2014 were impacted at various points by uncertainty with respect to U.S. economic data and concerns about the global economy, as well as reactions to legal matters regarding Freddie Mac and Fannie Mae and anticipated monetary policy, which created market uncertainty. Client trading demand was lower across most of the fixed income platform with the exception of increased customer flow in our international rates business, which benefited from tightening yields in Europe. Credit spreads continued to tighten as the U.S. Federal Reserve continued to taper its bond buyback program at a measured pace. In the fourth quarter of 2014, the volatility in the equity markets and the lowering of oil prices, put downward pressure on high yield bonds, especially those in the energy and transport sectors, as well as on the distressed trading markets. We experienced a decline in the results of our efforts in distressed trading for the year, which was primarily due to mark to market inventory losses as a result of the broad sell-off in distressed and post-reorganization securities, although investor interest in high yield asset classes was strong during the year as investors continued to migrate to certain asset classes in search of higher yields. Futures sales and trading revenues for the year ended November 30, 2014 were negatively impacted by challenging market conditions for foreign currency trading and U.S. futures trading given political and economic instability in various global environments.
During the fourth quarter, as a result of the growth and margin challenges recently faced in our Jefferies Bache business, which conducts our futures and foreign exchange trading activities, we decided to pursue strategic alternatives for the business. We are currently evaluating various options, which may include a sale to or combination with another similar business that improves the combined businesses' competitive standing and margin. Global net revenues from this business activity for the year ended November 30, 2014, which are included within our Fixed income results, were $175.3 million. This is comprised of commissions, principal transaction revenues and net interest revenues.
Nine Months Ended November 30, 2013
Fixed income revenue was $504.1 million for the nine months ended November 30, 2013. Included within Interest expense for the period is positive income of $40.1 million from the allocation to our fixed income business of a portion of the amortization of premiums arising from adjusting our long-term debt to fair value as part of acquisition accounting.
The second quarter of fiscal 2013 was characterized by improving U.S. macroeconomic conditions, and, through the first half of May 2013, the U.S. Federal Reserve's policies resulted in historically low yields for fixed income securities motivating investors to take on more risk in search for yield. In May 2013, however, the Treasury market experienced a steep sell-off and credit spreads widened across the U.S. fixed income markets in reaction to an anticipated decrease in Federal Reserve treasury issuances and mortgage debt security purchases in future periods. These market conditions negatively impacted our U.S. rates, corporates and U.S. mortgages revenues through
21
JEFFERIES GROUP LLC AND SUBSIDIARIES
August as the volatility made it difficult to realize net revenue from our customer flow. In the latter part of the 2013 year, the fixed income markets stabilized with lower volatility and tightening spreads increasing overall customer flows across the various fixed income product classes.
While revenues rebounded towards the end of the fiscal year for our mortgage-backed securities business, the mid-year sell-off in U.S. Treasuries and the widening of credit spreads for mortgage products negatively impacted the overall results for the nine months ended November 30, 2013 by reducing trading volumes and increasing market volatility. Corporate bond revenues were also negatively impacted by the widening of credit spreads in the third quarter though there was significant improvement during the fourth quarter of 2013 with more robust trading volumes and narrowing credit spreads. Municipal securities underperformed as an asset class for a large part of the period as investors discounted greater risk than they had previously although investors began to return to the municipal market at the end of the period increasing our trading volumes. Components of our futures business experienced varying degrees of fluctuations in customer trading volume, but trading volume was relatively constant when considered overall and across the full nine month period ended November 30, 2013.
While our U.S. rates, corporates and U.S. mortgages desks underpeformed, our leveraged credit business produced solid results as investors sought investment yields in this fixed income class and issuers of bank debt were active with the supply level creating a positive effect on liquidity in the secondary market. Further, the low interest rate environment in the U.S. caused investors to seek higher yields in emerging market debt. In addition, suppressed long-term interest rates in the U.S. encouraged investment in international mortgage-backed securities resulting in increased trading volumes, improved market liquidity and ultimately increased revenues on our international mortgage desk, despite experiencing reduced market liquidity and consequently lower levels of secondary market activity during the summer months of 2013.
During the second quarter of 2013, we redeemed the third party interests in our high yield joint venture, Jefferies High Yield Holdings, LLC. As a result of this redemption, effective April 1, 2013, results of this business are allocated to us in full.
Three Months Ended February 28, 2013
For the three months ended February 28, 2013, fixed income revenue was $352.0 million. Credit spreads narrowed through the first quarter of 2013. In January 2013, global macroeconomic conditions appeared to be improving, with the U.S. economy expanding and the U.S. Federal reserve continuing quantitative easing. U.S. rates revenues were robust, with strong treasury issuance and strong demand and yields at historic lows. Revenues from our leveraged finance and emerging markets sales and trading businesses were sound as investor confidence returned in 2013 and investors were attracted to the relatively higher yield on these products. Revenue in our emerging markets business is reflective of our efforts to strengthen our position in this business and revenues for the period include significant gains generated by certain high yield positions. Revenues from our international mortgage desk were positively impacted by the demand for European mortgage bonds and foreign exchange revenues demonstrated a successful navigation of volatile currency markets. Revenues also benefited from new client activity associated with our expansion of our global metals desk in the latter part of 2012. However, international rates sales and trading revenues were negatively impacted by investor concerns over the European markets resulting in restrained trading volumes and a high level of market volatility.
Of the net earnings recognized in Jefferies High Yield Holdings, LLC (our high yield and distressed securities and bank loan trading and investment business) for the three months ended February 28, 2013, approximately 65% is allocated to minority investors and are presented within interest on mandatorily redeemable preferred interests and net earnings to noncontrolling interests in our Consolidated Statements of Earnings.
Year Ended November 30, 2012
Fixed income revenue was $1,253.3 million for the year ended November 30, 2012. In 2012, despite occasional investor concerns surrounding the European sovereign debt crisis and global economic growth, a Greek default was avoided, and coordinated austerity measures taken by European governments and the European Central Bank proved successful in allaying fears of a Eurozone breakup and disbanding of the Euro currency. In the U.S., Treasuries benefited from their perception of safety and a third round of quantitative easing by the U.S. Federal Reserve.
22
JEFFERIES GROUP LLC AND SUBSIDIARIES
Investors continued to seek higher yields in a low interest rate environment. Narrowing credit spreads and improved credit and emerging market conditions contributed to strong performances and customer flow across a broad number of fixed income products.
Revenues from our leveraged finance sales and trading business for the year ended November 30, 2012 reflected investor confidence and tightened credit spreads. Additionally, certain of our high yield positions generated significant gains. Similarly, mortgage revenues benefited from a market rally on tighter interest and mortgage index spreads. Municipal trading activities also benefited from spreads tightening over the period as well as investors seeking higher yields in a low interest rate environment. Additionally, revenues from our investment grade corporates business profited on improved credit market conditions, tightening spreads and stronger trading volumes.
In 2012, we recognized gains on our investment in shares of the London Metal Exchange and benefited from new client activity with the global metals desk introduced in the latter part of 2012. Fixed income revenues for the year ended November 30, 2012 also include a gain of $23.8 million on the sale of mortgage servicing rights for military housing assets.
Other Revenue
Other revenue for the nine months ended November 30, 2013 includes a gain of $4.6 million related to the restructuring of our ownership interest in our commodity asset management business. For the year ended November 30, 2012, Other revenue of $13.2 million is primarily comprised of gains on debt extinguishment of $9.9 million in connection with the accounting treatment for certain purchases of our long-term debt by our secondary market making corporates desk and a bargain purchase gain of $3.4 million arising in the accounting for the acquisition of Hoare Govett on February 1, 2012. (See Note 5, Acquisitions and Note 14, Long-term Debt, respectively, in our consolidated financial statements for additional information.)
Investment Banking Revenue
We provide a full range of capital markets and financial advisory services across most industry sectors to our clients in the Americas, Europe and Asia. Capital markets revenue includes underwriting and placement revenue related to corporate debt, municipal bonds, mortgage- and asset-backed securities and equity and equity-linked securities. Advisory revenue consists primarily of advisory and transaction fees generated in connection with merger, acquisition and restructuring transactions. The following table sets forth our investment banking revenue (in thousands):
| Successor | Predecessor | |||||||||||||||
| Year Ended November 30, 2014 | Nine Months Ended November 30, 2013 | Three Months February 28, 2013 | Year Ended November 30, 2012 | |||||||||||||
Equity | $ | 339,683 | $ | 228,394 | $ | 61,380 | $ | 193,797 | ||||||||
Debt | 627,536 | 415,932 | 140,672 | 455,790 | ||||||||||||
|
|
|
|
|
|
|
| |||||||||
Capital markets | 967,219 | 644,326 | 202,052 | 649,587 | ||||||||||||
Advisory | 562,055 | 369,191 | 86,226 | 476,296 | ||||||||||||
|
|
|
|
|
|
|
| |||||||||
Total | $ | 1,529,274 | $ | 1,013,517 | $ | 288,278 | $ | 1,125,883 | ||||||||
|
|
|
|
|
|
|
| |||||||||
Year Ended November 30, 2014
Low borrowing costs and generally strong capital market conditions throughout most of our fiscal year were important factors in driving the growth in our debt and equity capital markets businesses. These factors, together with generally strong corporate balance sheets and record equity valuations, were important in driving the growth in our merger and acquisition advisory business.
Investment banking revenues were a record $1,529.3 million for the year ended November 30, 2014. From equity and debt capital raising activities, we generated $339.7 million and $627.5 million in revenues, respectively. During the year ended November 30, 2014, we completed 1,109 public and private debt financings that raised $250 billion and we completed 184 public equity financings and nine convertible offerings that raised $66 billion (159 of which we
23
JEFFERIES GROUP LLC AND SUBSIDIARIES
acted as sole or joint bookrunner). Financial advisory revenues totaled $562.1 million, including revenues from 132 merger and acquisition transactions and 12 restructuring and recapitalization transactions with an aggregate transaction value of $176 billion.
Nine Months Ended November 30, 2013
During the nine month period, despite uneven U.S. economic growth and uncertainty surrounding the U.S. Federal Reserve's decision on quantitative easing, capital market conditions continued to improve due to the availability of low-priced credit and a general rise in the stock market. Mergers and acquisition activity gained momentum through the later part of the 2013 nine month period.
Investment banking revenue was $1,013.5 million for the nine months ended November 30, 2013. From equity and debt capital raising activities, we generated $228.4 million and $415.9 million in revenues, respectively. During the nine months ended November 30, 2013, we completed 412 public and private debt financings that raised $162.3 billion in aggregate, as companies took advantage of low borrowing costs and we completed 130 public equity financings that raised $32.9 billion (111 of which we acted as sole or joint bookrunner). During the nine month period, our financial advisory revenues totaled $369.2 million, including revenues from 108 merger and acquisition transactions where we served as financial advisor.
Three Months Ended February 28, 2013
For the three months ended February 28, 2013, investment banking revenue was $288.3 million, including advisory revenues of $86.2 million and $202.1 million in revenues from capital market activities. Debt capital markets revenue were $140.7 million, driven by a high number of debt capital market transactions as companies took advantage of lower borrowing costs and more favorable economic and market conditions. During the three months ended February 28, 2013, we completed 121 public and private debt financings that raised a total of $42 billion. Equity capital markets revenue totaled $61.4 million, completing 30 public equity financings that raised $10.0 billion (25 of which we acted as sole or joint bookrunner). Reflective of a subdued mergers and acquisition deal environment, despite improving fundamentals, for the three months ended February 28, 2013, advisory revenue totaled $86.2 million. During the three months ended February 28, 2013, we served as financial advisor on 31 merger and acquisition transactions and two restructuring transactions with an aggregate transaction value of approximately $21 billion.
Year Ended November 30, 2012
Investment banking revenue was $1,125.9 million for the year ended November 30, 2012, with higher debt capital market revenues offset by lower advisory revenues. Revenue was driven by a higher number of debt capital market transactions as companies took advantage of lower borrowing costs and more favorable economic and market conditions. During 2012, we completed 482 public and private debt financings raising a total of $175 billion. Equity capital markets revenue totaled $193.8 million for the year ended November 30, 2012 and we completed 111 public equity financings raising $21 billion in capital (96 of which we acted as sole or joint bookrunner). For 2012, advisory revenue totaled $476 million, as we served as financial advisor on 111 merger and acquisition and 10 restructuring transactions having an aggregate transaction value of approximately $104 billion.
Asset Management Fees and Investment Income (Loss) from Managed Funds
Asset management revenue includes management and performance fees from funds and accounts managed by us, management and performance fees from related party managed funds and accounts and investment income (loss) from our investments in these funds, accounts and related party managed funds. The key components of asset management revenue are the level of assets under management and the performance return, whether on an absolute basis or relative to a benchmark or hurdle. These components can be affected by financial markets, profits and losses in the applicable investment portfolios and client capital activity. Further, asset management fees vary with the nature of investment management services. The terms under which clients may terminate our investment management authority, and the requisite notice period for such termination, varies depending on the nature of the investment vehicle and the liquidity of the portfolio assets.
24
JEFFERIES GROUP LLC AND SUBSIDIARIES
On September 11, 2013, we restructured our ownership interest in CoreCommodity, our commodity asset management business. Pursuant to the terms of that restructuring, we acquired Class B Units in what is now called CoreCommodity Capital, LLC. As a consequence, subsequent to September 11, 2013, we no longer report asset management revenues, assets under management and managed accounts attributed to the commodities asset class. On February 28, 2014, we sold our Class B Units to Leucadia at fair market value.
During the fourth quarter of 2014, as part of a strategic review of our business, we decided to liquidate our International Asset Management business, which provides long only investment solutions in global convertible bonds to institutional investors. Asset management fees and assets under management from this business comprise our convertibles asset strategy in the tables below. We currently anticipate liquidation to occur within the next 12 months; pending regulatory approvals.
The following summarizes the results of our Asset Management businesses for the year ended November 30, 2014, the nine months ended November 30, 2013, the three months ended February 28, 2013 and the year ended November 30, 2012 (in thousands):
| Successor | Predecessor | |||||||||||||||
| Year Ended November 30, 2014 | Nine Months Ended November 30, 2013 | Three Months Ended February 28, 2013 | Year Ended November 30, 2012 | |||||||||||||
Asset management fees: | ||||||||||||||||
Fixed income | $ | 6,087 | $ | 3,932 | $ | 1,154 | $ | 4,094 | ||||||||
Equities | 18,075 | 7,626 | 2,295 | 4,573 | ||||||||||||
Convertibles | 2,520 | 2,890 | 1,376 | 10,387 | ||||||||||||
Commodities | - | 12,025 | 6,258 | 19,076 | ||||||||||||
|
|
|
|
|
|
|
| |||||||||
Total asset management fees | 26,682 | 26,473 | 11,083 | 38,130 | ||||||||||||
Investment income (loss) from managed funds | (9,635 | ) | 9,620 | (200 | ) | (11,164 | ) | |||||||||
|
|
|
|
|
|
|
| |||||||||
Total | $ | 17,047 | $ | 36,093 | $ | 10,883 | $ | 26,966 | ||||||||
|
|
|
|
|
|
|
| |||||||||
As a result of deconsolidation of certain strategic investment entities during the first quarter of 2014, results above attributed to Equities now include asset management fees from these entities. Fixed income asset management fees represent ongoing consideration we receive from the sale of contracts to manage certain collateralized loan obligations ("CLOs") to Babson Capital Management, LLC in January 2010. As sale consideration, we are entitled to a portion of the asset management fees earned under the contracts for their remaining lives. Investment income (loss) from managed funds comprise net unrealized markups (markdowns) in private equity funds managed by related parties.
Assets under Management
Period end assets under management by predominant asset strategy were as follows (in millions):
| November 30, 2014 | November 30, 2013 | |||||||
Assets under management (1): | ||||||||
Equities | $ | 483 | $ | 14 | ||||
Convertibles | 225 | 492 | ||||||
|
|
|
| |||||
Total | $ | 708 | $ | 506 | ||||
|
|
|
| |||||
| (1) | Assets under management include assets actively managed by us, including hedge funds and certain managed accounts. Assets under management do not include the assets of funds that are consolidated due to the level or nature of our investment in such funds. |
25
JEFFERIES GROUP LLC AND SUBSIDIARIES
Non-interest Expenses
Non-interest expenses for the year ended November 30, 2014, the nine months ended November 30, 2013, the three months ended February 28, 2013 and the year ended November 30, 2012 were as follows (in thousands):
| Successor | Predecessor | |||||||||||||||
| Year Ended November 30, 2014 | Nine Months Ended November 30, 2013 | Three Months Ended February 28, 2013 | Year Ended November 30, 2012 | |||||||||||||
Compensation and benefits | $ | 1,698,530 | $ | 1,213,908 | $ | 474,217 | $ | 1,770,798 | ||||||||
Non-compensation expenses: | ||||||||||||||||
Floor brokerage and clearing fees | 215,329 | 150,774 | 46,155 | 183,013 | ||||||||||||
Technology and communications | 268,212 | 193,683 | 59,878 | 244,511 | ||||||||||||
Occupancy and equipment rental | 107,767 | 86,701 | 24,309 | 97,397 | ||||||||||||
Business development | 106,984 | 63,115 | 24,927 | 95,330 | ||||||||||||
Professional services | 109,601 | 72,802 | 24,135 | 73,427 | ||||||||||||
Bad debt provision | 55,355 | 179 | 1,945 | 1,152 | ||||||||||||
Goodwill impairment | 54,000 | - | - | - | ||||||||||||
Other | 71,339 | 91,856 | 12,530 | 61,346 | ||||||||||||
|
|
|
|
|
|
|
| |||||||||
Total non-compensation expenses | 988,587 | 659,110 | 193,879 | 756,176 | ||||||||||||
|
|
|
|
|
|
|
| |||||||||
Total non-interest expenses | $ | 2,687,117 | $ | 1,873,018 | $ | 668,096 | $ | 2,526,974 | ||||||||
|
|
|
|
|
|
|
| |||||||||
Compensation and Benefits
Compensation and benefits expense consists of salaries, benefits, cash bonuses, commissions, annual cash compensation awards, historical annual share-based compensation awards and the amortization of certain nonannual share-based and cash compensation awards to employees. Cash- and historical share-based awards granted to employees as part of year end compensation generally contain provisions such that employees who terminate their employment or are terminated without cause may continue to vest in their awards, so long as those awards are not forfeited as a result of other forfeiture provisions (primarily non-compete clauses) of those awards. Accordingly, the compensation expense for a substantial portion of awards granted at year end as part of annual compensation is fully recorded in the year of the award.
Included within Compensation and benefits expense are share-based amortization expense for senior executive awards granted in January 2010 and September 2012, non-annual share-based and cash-based awards to other employees and certain year end awards that contain future service requirements for vesting. Such awards are being amortized over their respective future service periods.
Year Ended November 30, 2014
Compensation and benefits expense for the year ended November 30, 2014 was $1,698.5 million, which is 56.8% as a percentage of Net revenues. Amortization expense of $284.3 million related to share- and cash-based awards is included within 2014 compensation cost, as well as additional amortization expense of $14.4 million related to the write-up of the cost of outstanding share-based awards, which had remaining future service requirements at the date of the Leucadia Transaction. Employee headcount was 3,915 at November 30, 2014. We expanded our headcount modestly during 2014, primarily in our investment banking and equities businesses. These increases were partially offset by headcount reductions due to corporate services outsourcing.
Nine Months Ended November 30, 2013 and Three Months Ended February 28, 2013
Compensation and benefits expense was $1,213.9 million for the nine months ended November 30, 2013 and was $474.2 million for the three months ended February 28, 2013, which is 56.7% and 57.9% as a percentage of Net revenues for the nine months ended November 30, 2013 and the three months ended February 28, 2013, respectively. Amortization expense of $232.0 million and $73.1 million related to share- and cash-based awards is included within compensation cost for the nine months ended November 30, 2013 and the three months ended February 28, 2013, respectively. Compensation cost in the nine months ended November 30, 2013 also included additional amortization expense of $11.0 million related to the write-up of the cost of outstanding share-based awards, which had remaining future service requirements at the date of the Leucadia Transaction. Employee headcount was 3,797 at November 30, 2013.
26
JEFFERIES GROUP LLC AND SUBSIDIARIES
Year Ended November 30, 2012
Compensation and benefits expense for the year ended November 30, 2012 was of $1,770.8 million, equivalent to 57.8% of Net revenues, and includes a full year of compensation costs related to Jefferies Bache. Compensation and benefits expense for the period includes amortization expense of $283.9 million related to share- and cash-based awards. In addition, compensation expense includes $22.9 million relating to the acquisition of Jefferies Bache on July 1, 2011 and Hoare Govett on February 1, 2012, comprised of the amortization of retention and stock replacement awards granted to Jefferies Bache employees as replacement awards for previous Prudential stock awards that were forfeited at acquisition and amortization of retention awards granted to Hoare Govett employees and bonus costs for employees as a result of the completion of the acquisition of Hoare Govett. When excluding these costs, together with the gain on debt extinguishment of $9.9 million relating to trading activities in our own debt, amortization of discounts recognized on our long-term debt purchased and re-issued in December 2011 and January 2012 and recognized in Interest expense of $4.8 million and the bargain purchase gain of $3.4 million on our Hoare Govett acquisition, our ratio of Compensation and benefits expense to Net revenues for the year ended November 30, 2012 was 57.2%. Compensation and benefits expense for the year ended November 30, 2012 also includes severance costs of approximately $30.6 million. Employee headcount was 3,804 at November 30, 2012.
Non-Compensation Expenses
Year Ended November 30, 2014
Non-compensation expenses were $988.6 million for the year ended November 30, 2014, equating to 33.1% of Net revenues. Non-compensation expenses include a goodwill impairment loss of $51.9 million related to our Jefferies Bache business, which constitutes our global futures sales and trading operations. In addition, a goodwill impairment loss of $2.1 million was recognized for the period related to our International Asset Management business. (See the "Critical Accounting Policies-Goodwill" section herein.) Additionally, approximately $7.6 million in impairment losses were recognized related to customer relationship intangible assets within our Jefferies Bache and International Asset Management businesses, which is presented within Other expenses.
Floor brokerage and clearing expenses for the period are reflective of the trading volumes in our equities trading businesses. Technology and communications expense includes costs associated with development of the various trading systems and projects associated with corporate support infrastructure, including communication enhancements to our global headquarters at 520 Madison Avenue and incremental amortization expense associated with fair value adjustments to capitalized software recognized as part of accounting for the Leucadia Transaction. Occupancy and equipment rental expense reflects incremental office re-configuration expenditures at 520 Madison Avenue. Business development costs reflect our continued efforts to continue to build market share, including our loan origination business conducted through our Jefferies Finance joint venture. We continue to incur legal and consulting fees as part of implementing various regulatory requirements, which is recognized in Professional services expense. During the fourth quarter of 2014, we recognized a bad debt provision, which primarily relates to a receivable of $52.3 million from a client to which we provided futures clearing and execution services, which declared bankruptcy.
Nine Months Ended November 30, 2013
Non-compensation expenses were $659.1 million for the nine months ended November 30, 2013, equating to 30.8% of Net revenues. Non-compensation expenses include approximately $21.1 million in incremental amortization expense associated with fair value adjustments to identifiable tangible and intangible assets recognized as part of acquisition accounting reported within Technology and communications expense and Other expense, $6.3 million in additional lease expense related to recognizing existing leases at their current market value in Occupancy and equipment rental expense and $11.6 million in merger-related investment banking filing fees recognized in Professional services expense. Additionally, during the nine month period an $8.7 million charge was recognized in Occupancy and equipment rental expense due to vacating certain office space in London. Other expenses for the nine months ended November 30, 2013 include $38.4 million in litigation expenses, which includes litigation costs related to the final judgment on our last outstanding auction rate securities legal matter and to agreements reached in principle with the relevant authorities pertaining to an investigation of purchases and sales of mortgage-backed securities. Excluding these expenses, our Non-compensation expenses as a percentage of Net revenues, after excluding from revenues $76.9 million of net interest income due to the amortization of premiums arising from the one-time fair value adjustment of our long term debt to fair value as of the date of the Leucadia Transaction and the concurrent assumption of our mandatorily redeemable convertible preferred stock by Leucadia, was 27.8%.
27
JEFFERIES GROUP LLC AND SUBSIDIARIES
Floor brokerage and clearing expenses for the period are reflective of the trading volumes in our fixed income and equities trading businesses, including a meaningful volume of trading by our foreign exchange business. Technology and communications expense includes costs associated with development of the various trading systems and various projects associated with corporate support infrastructure, including technology initiatives to support Dodd-Frank reporting requirements. We continued to incur legal and consulting fees as part of implementing various regulatory requirements, which is recognized in Professional services expense.
Three Months Ended February 28, 2013
Non-compensation expenses were $193.9 million for the three months ended February 28, 2013, or 23.7% of Net revenues. Floor brokerage and clearing expense for the 2013 first quarter is commensurate with equity, fixed income and futures trading volumes for the quarter. Occupancy and equipment expense for the period includes costs associated with taking on additional space at our global head office in New York offset by a reduction in integration costs for technology and communications as significant system migrations for Jefferies Bache have been completed. Professional services expense includes legal and consulting fees of $2.1 million related to the Leucadia Transaction and business and development expense contains costs incurred in connection with our efforts to build out our market share.
Year Ended November 30, 2012
Non-compensation expenses were $756.2 million for the year ended November 30, 2012, equating to 24.7% of Net revenues, and includes a full year of operating costs of Jefferies Bache. Floor brokerage and clearing expense of $183.0 million was commensurate with lower equity trading volumes, though includes a full twelve months of Jefferies Bache futures activity in 2012. Technology and communications expense was $244.5 million with increased costs associated with the continued build out of our Asian businesses offset by lower corporate support infrastructure project costs. Occupancy and equipment expense was $97.4 million for 2012, reflecting the cost for our office growth in Asia and Europe and additional space at our global head office in New York. Legal and consulting fees related to the announced Leucadia Transaction and efforts associated with Dodd-Frank compliance contributed to Professional services expense of $73.4 million for the year ended November 30, 2012. Business development expense of $95.3 million is primarily driven by our continued efforts to build market share, specifically our futures business. Other expenses of $62.5 million for the 2012 year include a $2.9 million impairment charge recognized in the second quarter of 2012 on certain indefinite-lived intangible assets, donations to Hurricane Sandy relief of $4.1 million and fees associated with the announced Leucadia Transaction.
Income Taxes
For the year ended November 30, 2014, the provision for income taxes was $142.1 million, equating to an effective tax rate of 46.9%. For the nine months ended November 30, 2013, the three months ended February 28, 2013 and the year ended November 30, 2012, the provision for income taxes was $94.7 million, $48.6 million and $168.6 million, respectively, equating to an effective tax rate of 35.8%, 34.9% and 34.3%, respectively. At November 30, 2014, the effective tax rate differed from the U.S. federal statutory rate of 35.0%, primarily due to state income taxes, the impact of the goodwill impairment charge that is not tax-deductible and a valuation allowance provided on deferred tax assets within our London Jefferies Bache business, partially offset by tax-exempt income and international earnings taxed at rates that are generally lower than the U.S. federal statutory rate.
Earnings per Common Share
Diluted net earnings per common share was $0.35 for the three months ended February 28, 2013 on 217,844,000 shares. Diluted net earnings per common share was $1.22 for the year ended November 30, 2012 on 220,110,000 shares. Earnings per share data is not provided for periods subsequent to February 28, 2013, coinciding with the date we became a limited liability company and wholly-owned subsidiary of Leucadia. (See Note 20, Earnings per Share, in our consolidated financial statements for further information regarding the calculation of earnings per common share.)
28
JEFFERIES GROUP LLC AND SUBSIDIARIES
Accounting Developments
For a discussion of recently issued accounting developments and their impact on our consolidated financial statements. (See Note 3, Accounting Developments, in our consolidated financial statements.)
Critical Accounting Policies
The consolidated financial statements are prepared in conformity with U.S. GAAP, which require management to make estimates and assumptions that affect the amounts reported in the consolidated financial statements and related notes. Actual results can and may differ from estimates. These differences could be material to the financial statements.
We believe our application of U.S. GAAP and the associated estimates are reasonable. Our accounting policies and estimates are constantly reevaluated, and adjustments are made when facts and circumstances dictate a change. Historically, we have found our application of accounting policies to be appropriate, and actual results have not differed materially from those determined using necessary estimates.
We believe our critical accounting policies (policies that are both material to the financial condition and results of operations and require our most subjective or complex judgments) are our valuation of financial instruments, assessment of goodwill and our use of estimates related to compensation and benefits during the year.
Valuation of Financial Instruments
Financial instruments owned and Financial instruments sold, not yet purchased are recorded at fair value. The fair value of a financial instrument is the amount that would be received to sell an asset or paid to transfer a liability in an orderly transaction between market participants at the measurement date (the exit price). Unrealized gains or losses are generally recognized in Principal transaction revenues in our Consolidated Statements of Earnings.
The following is a summary of the fair value of major categories of financial instruments owned and financial instruments sold, not yet purchased, at November 30, 2014 and November 30, 2013 (in thousands):
| November 30, 2014 | November 30, 2013 | |||||||||||||||
| Financial Instruments Owned | Financial Instruments Sold, Not Yet Purchased | Financial Instruments Owned | Financial Instruments Sold, Not Yet Purchased | |||||||||||||
Corporate equity securities | $ | 2,426,242 | 1,985,864 | $ | 2,098,597 | $ | 1,823,299 | |||||||||
Corporate debt securities | 3,398,194 | 1,612,217 | 2,982,768 | 1,346,078 | ||||||||||||
Government, federal agency and other sovereign obligations | 6,125,901 | 4,044,140 | 5,346,152 | 3,155,683 | ||||||||||||
Mortgage- and asset-backed securities | 4,493,214 | 4,557 | 4,473,135 | 34,691 | ||||||||||||
Loans and other receivables | 1,556,018 | 870,975 | 1,349,128 | 695,300 | ||||||||||||
Derivatives | 406,268 | 363,515 | 261,093 | 180,079 | ||||||||||||
Investments | 168,541 | - | 101,282 | - | ||||||||||||
Physical commodities | 62,234 | - | 37,888 | 36,483 | ||||||||||||
|
|
|
|
|
|
|
| |||||||||
| $ | 18,636,612 | $ | 8,881,268 | $ | 16,650,043 | $ | 7,271,613 | |||||||||
|
|
|
|
|
|
|
| |||||||||
Fair Value Hierarchy - In determining fair value, we maximize the use of observable inputs and minimize the use of unobservable inputs by requiring that observable inputs be used when available. Observable inputs are inputs that market participants would use in pricing the asset or liability based on market data obtained from independent sources. Unobservable inputs reflect our assumptions that market participants would use in pricing the asset or liability developed based on the best information available in the circumstances. We apply a hierarchy to categorize
29
JEFFERIES GROUP LLC AND SUBSIDIARIES
our fair value measurements broken down into three levels based on the transparency of inputs, where Level 1 uses observable prices in active markets and Level 3 uses valuation techniques that incorporate significant unobservable inputs and broker quotes that are considered less observable. Greater use of management judgment is required in determining fair value when inputs are less observable or unobservable in the marketplace, such as when the volume or level of trading activity for a financial instrument has decreased and when certain factors suggest that observed transactions may not be reflective of orderly market transactions. Judgment must be applied in determining the appropriateness of available prices, particularly in assessing whether available data reflects current prices and/or reflects the results of recent market transactions. Prices or quotes are weighed when estimating fair value with greater reliability placed on information from transactions that are considered to be representative of orderly market transactions.
Fair value is a market based measure; therefore, when market observable inputs are not available, our judgment is applied to reflect those judgments that a market participant would use in valuing the same asset or liability. The availability of observable inputs can vary for different products. We use prices and inputs that are current as of the measurement date even in periods of market disruption or illiquidity. The valuation of financial instruments classified in Level 3 of the fair value hierarchy involves the greatest amount of management judgment. (See Note 2, Summary of Significant Accounting Policies and Note 6, Fair Value Disclosures, in our consolidated financial statements for further information on the fair value definition, Level 1, Level 2, Level 3 and related valuation techniques.)
Level 3 Assets and Liabilities – The following table reflects the composition of our Level 3 assets and Level 3 liabilities by asset class at November 30, 2014 and November 30, 2013 (in thousands):
| Financial Instruments Owned | Financial Instruments Sold, Not Yet Purchased | |||||||||||||||
| November 30, 2014 | November 30, 2013 | November 30, 2014 | November 30, 2013 | |||||||||||||
Loans and other receivables | $ | 97,258 | $ | 145,890 | $ | 14,450 | $ | 22,462 | ||||||||
Investments at fair value | 95,389 | 101,242 | - | - | ||||||||||||
Residential mortgage-backed securities | 82,557 | 105,492 | - | - | ||||||||||||
Derivatives | 54,190 | 1,493 | 49,552 | 8,398 | ||||||||||||
Collateralized debt obligations | 91,498 | 37,216 | - | - | ||||||||||||
Commercial mortgage-backed securities | 26,655 | 17,568 | - | - | ||||||||||||
Corporate debt securities | 55,918 | 25,666 | 223 | - | ||||||||||||
Corporate equity securities | 20,964 | 9,884 | 38 | 38 | ||||||||||||
Other asset-backed securities | 2,294 | 12,611 | - | - | ||||||||||||
|
|
|
|
|
|
|
| |||||||||
Total Level 3 financial instruments | 526,723 | 457,062 | $ | 64,263 | $ | 30,898 | ||||||||||
|
|
|
| |||||||||||||
Investments in managed funds | 54,982 | 57,285 | ||||||||||||||
|
|
|
| |||||||||||||
Total Level 3 assets | $ | 581,705 | $ | 514,347 | ||||||||||||
|
|
|
| |||||||||||||
Total Level 3 financial instruments as a percentage of total financial instruments | 2.8 | % | 2.7 | % | 0.7 | % | 0.4 | % | ||||||||
While our Financial instruments sold, not yet purchased, which are included within liabilities on our Consolidated Statements of Financial Condition, are accounted for at fair value, we do not account for any of our other liabilities at fair value, except for certain secured financings that arise in connection with our securitization activities included with Other secured financings of approximately $30.8 million and $39.7 million at November 30, 2014 and November 30, 2013, respectively, and the conversion option to Leucadia shares embedded in our 3.875% Convertible Senior debenture of approximately $0.7 million and $9.6 million reported within Long-term debt at November 30, 2014 and November 30, 2013, respectively.
30
JEFFERIES GROUP LLC AND SUBSIDIARIES
The following table reflects activity with respect to our Level 3 assets and liabilities (in millions):
| Successor | Predecessor | |||||||||||||||||
| Year Ended November 30, 2014 | Nine Months Ended November 30, 2013 | Three Months February 28, 2013 | Year Ended November 30, 2012 | |||||||||||||||
Assets: | ||||||||||||||||||
Transfers from Level 3 to Level 2 | $ | 58.2 | $ | 55.9 | $ | 112.7 | $ | 81.8 | ||||||||||
Transfers from Level 2 to Level 3 | 145.0 | 82.4 | 100.5 | 180.6 | ||||||||||||||
Net gains (losses) | (39.4 | ) | 9.4 | 14.5 | 28.8 | |||||||||||||
Liabilities: | ||||||||||||||||||
Transfers from Level 3 to Level 2 | $ | 4.3 | $ | 0.1 | $ | 0.7 | $ | 2.2 | ||||||||||
Transfers from Level 2 to Level 3 | - | - | - | - | ||||||||||||||
Net gains (losses) | (6.0 | ) | (1.1 | ) | (2.7 | ) | (2.5 | ) | ||||||||||
For additional discussion on transfers of assets and liabilities among the fair value hierarchy levels, see Note 6, Fair Value Disclosures, in our consolidated financial statements.
Controls Over the Valuation Process for Financial Instruments - Our Independent Price Verification Group, independent of the trading function, plays an important role in determining that our financial instruments are appropriately valued and that fair value measurements are reliable. This is particularly important where prices or valuations that require inputs are less observable. In the event that observable inputs are not available, the control processes are designed to assure that the valuation approach utilized is appropriate and consistently applied and that the assumptions are reasonable. Where a pricing model is used to determine fair value, these control processes include reviews of the pricing model's theoretical soundness and appropriateness by risk management personnel with relevant expertise who are independent from the trading desks. In addition, recently executed comparable transactions and other observable market data are considered for purposes of validating assumptions underlying the model.
Goodwill
At November 30, 2014, goodwill recorded on our Consolidated Statement of Financial Condition is $1,662.6 million (3.7% of total assets). The nature and accounting for goodwill is discussed in Note 2, Summary of Significant Accounting Policies and Note 12, Goodwill and Other Intangible Assets, in our consolidated financial statements. Goodwill must be allocated to reporting units and tested for impairment at least annually, or when circumstances or events make it more likely than not that an impairment occurred. Goodwill is tested by comparing the estimated fair value of each reporting unit with its carrying value. Our annual goodwill impairment testing date is August 1. We engaged an independent valuation specialist to assist us in our valuation process at August 1, 2014. The results of our annual impairment test did not indicate any goodwill impairment in any of our reporting units.
We use allocated tangible equity plus allocated goodwill and intangible assets as a proxy for the carrying amount of each reporting unit. The amount of equity allocated to a reporting unit is based on our cash capital model deployed in managing our businesses, which seeks to approximate the capital a business would require if it were operating independently. For further information on our Cash Capital Policy, refer to the Liquidity, Financial Condition and Capital Resources section herein. Intangible assets are allocated to a reporting unit based on either specifically identifying a particular intangible asset as pertaining to a reporting unit or, if shared among reporting units, based on an assessment of the reporting unit's benefit from the intangible asset in order to generate results.
Estimating the fair value of a reporting unit requires management judgment and often involves the use of estimates and assumptions that could have a significant effect on whether or not an impairment charge is recorded and the magnitude of such a charge. Estimated fair values for our reporting units utilize market valuation methods that incorporate price-to-earnings and price-to-book multiples of comparable public companies, as well as discounted
31
JEFFERIES GROUP LLC AND SUBSIDIARIES
cash flow valuation methodologies that incorporate risk-adjusted discount rates. In addition, for certain reporting units, we utilize a net asset value method. Under the market approach, the key assumptions are the selected multiples and our internally developed forecasts of future profitability, growth and return on equity for each reporting unit. The weight assigned to the multiples requires judgment in qualitatively and quantitatively evaluating the size, profitability and the nature of the business activities of the reporting units as compared to the comparable publicly-traded companies. In addition, as the fair values determined under the market approach represent a noncontrolling interest, we apply a control premium to arrive at the estimate fair value of each reporting unit on a controlling basis.
Futures Reporting Unit – Our Jefferies Bache business has experienced various challenges with respect to its profitability. Consequently, during the fourth quarter of 2014, management decided to pursue alternative strategies for the Futures reporting unit, including a possible divestiture. Given this circumstance, we performed an updated impairment test for the goodwill allocated to the Futures reporting unit at November 30, 2014. Given the uncertainty surrounding the prospects for the reporting unit, we utilized dual valuation methods to estimate the reporting unit's fair value. We employed a discounted cash flow methodology, which, given the increasing uncertainty as to the profitability forecasts for the Futures business, caused us to incorporate a higher risk-adjusted discount rate than used in our annual impairment test, which impacted the fair value estimate. Additionally, we employed a market valuation approach. The key assumption under the market approach is the selection of an appropriate price multiple and the consideration of the operating performance of the Futures reporting unit as compared to selected publicly traded guideline companies. Based on the most recent performance of the business and its margin challenges, the level and expected growth in return on tangible equity was benchmarked against the guideline companies in selecting an appropriate multiple. Giving proper weighting to the outputs from both valuation approaches, we determined that the fair value of the Futures reporting unit did not exceed its carrying value.
As a result of the decline in the estimated fair value of the Futures reporting unit since our annual impairment testing date of August 1, 2014, we recognized an impairment loss of the allocated goodwill of $51.9 million for the quarter ended November 30, 2014. The effect of the impairment loss is to reduce the balance of goodwill attributed to the Futures business to $-0- at November 30, 2014. In addition, considering the most recent operating margin for the business, we estimated that the fair value of recognized customer relationship intangible assets using a discounted cash flow methodology was $-0- at November 30, 2014. Accordingly, we recognized an impairment loss of $7.5 million during the fourth quarter of 2014 related to this intangible asset.
International Asset Management – As part of strategic evaluations of our businesses, during the fourth quarter of 2014, management decided to liquidate our International Asset Management business, which consists of long only, convertible bond strategies offered to institutional investors. We used a net asset value approach at August 1, 2014 to perform our annual goodwill impairment testing of this reporting unit and, accordingly, the fair value of the International Asset Reporting Unit was equal to its book value. Considering management's decision to cease this business activity, we do not reasonably anticipate any future cash flows associated with this reporting unit beyond one year to support the carrying value of the International Asset Management reporting unit. During the fourth quarter of 2014, we recognized an impairment loss of the allocated goodwill of $2.1 million, which reduced the balance of goodwill attributed to this reporting unit to $-0- at November 30, 2014.
As of November 30, 2014, substantially all of our goodwill is allocated to our Investment Banking, Equities and Fixed Income reporting units, which is $1,659.6 million of total goodwill of $1,662.6 million at November 30, 2014.
Refer to Note 12, Goodwill and Other Intangible Assets for further details on goodwill and intangible assets.
Compensation and Benefits
A portion of our compensation and benefits represents discretionary bonuses, which are finalized at year end. In addition to the level of net revenues, our overall compensation expense in any given year is influenced by prevailing labor markets, revenue mix, profitability, individual and business performance metrics, and our use of share-based compensation programs. We believe the most appropriate way to allocate estimated annual total compensation among interim periods is in proportion to projected net revenues earned. Consequently, during the year we accrue compensation and benefits based on annual targeted compensation ratios, taking into account the mix of our revenues and the timing of expense recognition.
32
JEFFERIES GROUP LLC AND SUBSIDIARIES
For further discussion of these and other significant accounting policies, see Note 2, Summary of Significant Accounting Policies, in our consolidated financial statements.
Liquidity, Financial Condition and Capital Resources
Our Chief Financial Officer and Global Treasurer are responsible for developing and implementing our liquidity, funding and capital management strategies. These policies are determined by the nature and needs of our day to day business operations, business opportunities, regulatory obligations, and liquidity requirements.
Our actual levels of capital, total assets and financial leverage are a function of a number of factors, including asset composition, business initiatives and opportunities, regulatory requirements and cost and availability of both long term and short term funding. We have historically maintained a balance sheet consisting of a large portion of our total assets in cash and liquid marketable securities, arising principally from traditional securities brokerage and trading activity. The liquid nature of these assets provides us with flexibility in financing and managing our business.
Analysis of Financial Condition
A business unit level balance sheet and cash capital analysis is prepared and reviewed with senior management on a weekly basis. As a part of this balance sheet review process, capital is allocated to all assets and gross and adjusted balance sheet limits are established. This process ensures that the allocation of capital and costs of capital are incorporated into business decisions. The goals of this process are to protect the firm's platform, enable our businesses to remain competitive, maintain the ability to manage capital proactively and hold businesses accountable for both balance sheet and capital usage.
We actively monitor and evaluate our financial condition and the composition of our assets and liabilities. Substantially all of our Financial instruments owned and Financial instruments sold, not yet purchased are valued on a daily basis and we monitor and employ balance sheet limits for our various businesses. In connection with our government and agency fixed income business and our role as a primary dealer in these markets, a sizable portion of our securities inventory is comprised of U.S. government and agency securities and other G-7 government securities.
The following table provides detail on key balance sheet asset and liability line items (in millions):
| November 30, 2014 | November 30, 2013 | % Change | ||||||||||
Total assets | $ | 44,517.6 | $ | 40,177.0 | 10.8 | % | ||||||
Cash and cash equivalents | 4,080.0 | 3,561.1 | 14.6 | % | ||||||||
Cash and securities segregated and on deposit for regulatory purposes or deposited with clearing and depository organizations | 3,444.7 | 3,616.6 | -4.8 | % | ||||||||
Financial instruments owned | 18,636.6 | 16,650.0 | 11.9 | % | ||||||||
Financial instruments sold, not yet purchased | 8,881.3 | 7,271.6 | 22.1 | % | ||||||||
Total Level 3 assets | 581.7 | 514.3 | 13.1 | % | ||||||||
Securities borrowed | $ | 6,853.1 | $ | 5,359.8 | 27.9 | % | ||||||
Securities purchased under agreements to resell | 3,926.9 | 3,746.9 | 4.8 | % | ||||||||
|
|
|
| |||||||||
Total securities borrowed and securities purchased under agreements to resell | $ | 10,780.0 | $ | 9,106.7 | 18.4 | % | ||||||
|
|
|
| |||||||||
Securities loaned | $ | 2,598.5 | $ | 2,506.1 | 3.7 | % | ||||||
Securities sold under agreements to repurchase | 10,672.2 | 10,779.8 | -1.0 | % | ||||||||
|
|
|
| |||||||||
Total securities loaned and securities sold under agreements to repurchase | $ | 13,270.7 | $ | 13,285.9 | -0.1 | % | ||||||
|
|
|
| |||||||||
33
JEFFERIES GROUP LLC AND SUBSIDIARIES
Total assets at November 30, 2014 and November 30, 2013 were $44.5 billion and $40.2 billion, respectively. During the year ended November 30, 2014, average total assets were approximately 13% higher than total assets at November 30, 2014.
Jefferies LLC (our U.S. futures commission merchant) and Jefferies Bache Limited (our U.K. commodities and financial futures broker-dealer), receive cash or securities as margin to secure customer futures trades. Jefferies LLC ("Jefferies") (a U.S. broker-dealer), under SEC Rule 15c3-3 and under CFTC Regulation 1.25, is required to maintain customer cash or qualified securities in a segregated reserve account for the exclusive benefit of our clients. We are required to conduct customer segregation calculations to ensure the appropriate amounts of funds are segregated and that no customer funds are used to finance firm activity. Similar requirements exist under the U.K. Financial Conduct Authority's Client Money Rules with respect to our European-based activities conducted through Jefferies Bache Limited and Jefferies International Limited (a U.K. broker-dealer). Customer funds received are required to be separately segregated and held by us as statutory trustee for our customers. If we rehypothecate customer securities, that activity is conducted only to finance customer activity. Additionally, we do not lend customer cash to counterparties to conduct securities financing activity ( i.e. , we do not lend customer cash to reverse in securities). Further, we have no customer loan activity in Jefferies International Limited and we do not have any European prime brokerage operations. In Jefferies Bache Limited, any funds received from a customer are placed on deposit and not used as part of our operations. We do not transfer U.S. customer assets to our U.K. entities.
Our total Financial instruments owned inventory at November 30, 2014 was $18.6 billion, an increase of 12.0% from inventory of $16.7 billion at November 30, 2013, driven by increases in inventory positions across most asset classes. Higher trading volumes and increased client activity during most periods of the year and increases in equity and corporate debt offerings contributed to overall inventory levels. Financial instruments sold, not yet purchased inventory was $8.9 billion and $7.3 billion at November 30, 2014 and November 30, 2013, respectively, with the increase primarily driven by increased trading by our U.S. and international rates businesses. Derivative activity and outstanding balances, including both over-the-counter and listed contracts, increased across multiple inventory classes from that of the prior year. Our overall net inventory position was $9.8 billion and $9.4 billion at November 30, 2014 and November 30, 2013, respectively. The change in our net inventory balance is primarily attributed to an increase in our net inventory of corporate equity and debt securities, partially offset by a reduction in our net inventory of U.S. government and agency securities and sovereign obligations.
We continually monitor our overall securities inventory, including the inventory turnover rate, which confirms the liquidity of our overall assets. As a Primary Dealer in the U.S. and with our similar role in several European jurisdictions, we carry inventory and make an active market for our clients in securities issued by the various governments. These inventory positions are substantially comprised of the most liquid securities in the asset class, with a significant portion in holdings of securities of G-7 countries. For further detail on our outstanding sovereign exposure to Greece, Ireland, Italy, Portugal and Spain at November 30, 2014, refer to the Risk Management section herein.
Of our total Financial instruments owned, approximately 74% are readily and consistently financeable at haircuts of 10% or less. In addition, as a matter of our policy, a portion of these assets has internal capital assessed, which is in addition to the funding haircuts provided in the securities finance markets. Additionally, our Financial instruments owned primarily consisting of bank loans, investments and non-agency mortgage-backed securities are predominantly funded by long term capital. Under our cash capital policy, we model capital allocation levels that are more stringent than the haircuts used in the market for secured funding; and we maintain surplus capital at these maximum levels.
At November 30, 2014 and November 30, 2013, our Level 3 financial instruments owned was 3% of our financial instruments owned.
Securities financing assets and liabilities include both financing for our financial instruments trading activity and matched book transactions. Matched book transactions accommodate customers, as well as obtain securities for the settlement and financing of inventory positions. The aggregate outstanding balance of our securities borrowed and securities purchased under agreements to resell increased by 18% from November 30, 2013 to November 30, 2014, primarily due to an increase in firm financing of our short inventory and an increase in our matched book activity.
34
JEFFERIES GROUP LLC AND SUBSIDIARIES
The outstanding balance of our securities loaned and securities sold under agreements to repurchase was relatively unchanged from November 30, 2013 to November 30, 2014 due to a decrease in our matched book activity, offset by an increase in firm financing of our inventory, less netting for our collateralized financing transactions. By executing repurchase agreements with central clearing corporations to finance liquid inventory, rather than bi-lateral arrangements, we reduce the credit risk associated with these arrangements and decrease net outstanding balances. Our average month end balances of total reverse repos and stock borrows and total repos and stock loans during the year ended November 30, 2014 were 19% and 22% higher, respectively, than the November 30, 2014 balances.
The following table presents our period end balance, average balance and maximum balance at any month end within the periods presented for Securities purchased under agreements to resell and Securities sold under agreements to repurchase (in millions):
| Successor | Predecessor | |||||||||||
| Year Ended November 30, 2014 | Nine Months Ended November 30, 2013 | Three Months Ended February 28, 2013 | ||||||||||
Securities Purchased Under Agreements to Resell: | ||||||||||||
Period end | $ | 3,927 | $ | 3,747 | $ | 3,578 | ||||||
Month end average | 5,788 | 4,936 | 5,132 | |||||||||
Maximum month end | 8,081 | 6,007 | 6,288 | |||||||||
Securities Sold Under Agreements to Repurchase: | ||||||||||||
Period end | $ | 10,672 | $ | 10,780 | $ | 7,976 | ||||||
Month end average | 13,291 | 13,308 | 11,895 | |||||||||
Maximum month end | 16,586 | 16,502 | 15,168 | |||||||||
Fluctuations in the balance of our repurchase agreements from period to period and intraperiod are dependent on business activity in those periods. Additionally, the fluctuations in the balances of our securities purchased under agreements to resell over the periods presented are influenced in any given period by our clients' balances and our clients' desires to execute collateralized financing arrangements via the repurchase market or via other financing products. Average balances and period end balances will fluctuate based on market and liquidity conditions and we consider the fluctuations intraperiod to be typical for the repurchase market.
35
JEFFERIES GROUP LLC AND SUBSIDIARIES
Leverage Ratios
The following table presents total assets, adjusted assets, total equity, total member's equity, tangible equity and tangible member's equity with the resulting leverage ratios at November 30, 2014 and November 30, 2013 (in thousands):
| November 30, | November 30, | |||||||||
| 2014 | 2013 | |||||||||
Total assets | $ | 44,517,648 | $ | 40,176,996 | ||||||
Deduct: | Securities borrowed | (6,853,103 | ) | (5,359,846 | ) | |||||
| Securities purchased under agreements to resell | (3,926,858 | ) | (3,746,920 | ) | ||||||
Add: | Financial instruments sold, not yet purchased | 8,881,268 | 7,271,613 | |||||||
| Less derivative liabilities | (363,515 | ) | (180,079 | ) | ||||||
|
|
|
| |||||||
Subtotal | 8,517,753 | 7,091,534 | ||||||||
Deduct: | Cash and securities segregated and on deposit for regulatory purposes or deposited with clearing and depository organizations | (3,444,674 | ) | (3,616,602 | ) | |||||
| Goodwill and intangible assets | (1,904,417 | ) | (1,986,436 | ) | ||||||
|
|
|
| |||||||
Adjusted assets | $ | 36,906,349 | $ | 32,558,726 | ||||||
|
|
|
| |||||||
Total equity | $ | 5,463,431 | $ | 5,421,674 | ||||||
Deduct: | Goodwill and intangible assets | (1,904,417 | ) | (1,986,436 | ) | |||||
|
|
|
| |||||||
Tangible equity | $ | 3,559,014 | $ | 3,435,238 | ||||||
|
|
|
| |||||||
Total member's equity | $ | 5,424,583 | $ | 5,304,520 | ||||||
Deduct: | Goodwill and intangible assets | (1,904,417 | ) | (1,986,436 | ) | |||||
|
|
|
| |||||||
Tangible member's equity | $ | 3,520,166 | $ | 3,318,084 | ||||||
|
|
|
| |||||||
Leverage ratio (1) | 8.1 | 7.4 | ||||||||
|
|
|
| |||||||
Tangible gross leverage ratio (2) | 12.1 | 11.5 | ||||||||
|
|
|
| |||||||
Leverage ratio - excluding impacts of the Leucadia Transaction (3) | 10.3 | 9.3 | ||||||||
|
|
|
| |||||||
Adjusted leverage ratio (4) | 10.4 | 9.5 | ||||||||
|
|
|
| |||||||
| (1) | Leverage ratio equals total assets divided by total equity. |
| (2) | Tangible gross leverage ratio (a non-GAAP financial measure) equals total assets less goodwill and identifiable intangible assets divided by tangible member's equity. The tangible gross leverage ratio is used by Rating Agencies in assessing our leverage ratio. |
| (3) | Leverage ratio - excluding impacts of the Leucadia Transaction (a non-GAAP financial measure) equals total assets less the increase in goodwill and asset fair values in accounting for the Leucadia Transaction of $1,957 million less amortization and impairments of goodwill and certain intangible assets of $108 million and $27 million during the year ended November 30, 2014 and the period since the Leucadia Transaction to November 30, 2013, respectively, on assets recognized at fair value in accounting for the Leucadia Transaction divided by the sum of total equity less $1,310 million and $1,326 million at November 30, 2014 and November 30, 2013, respectively, being the increase in equity arising from consideration of $1,426 million excluding the $125 million attributable to the assumption of our preferred stock by Leucadia, and less the impact on equity due to amortization of $9 million and $25 million at November 30, 2014 and November 30, 2013, respectively, on assets and liabilities recognized at fair value in accounting for the Leucadia Transaction. |
| (4) | Adjusted leverage ratio (a non-GAAP financial measure) equals adjusted assets divided by tangible total equity. |
Adjusted assets is a non-GAAP financial measure and excludes certain assets that are considered of lower risk as they are generally self-financed by customer liabilities through our securities lending activities. We view the resulting measure of adjusted leverage, also a non-GAAP financial measure, as a more relevant measure of financial risk when comparing financial services companies.
Liquidity Management
The key objectives of the liquidity management framework are to support the successful execution of our business strategies while ensuring sufficient liquidity through the business cycle and during periods of financial distress. Our liquidity management policies are designed to mitigate the potential risk that we may be unable to access adequate financing to service our financial obligations without material franchise or business impact.
36
JEFFERIES GROUP LLC AND SUBSIDIARIES
The principal elements of our liquidity management framework are our Contingency Funding Plan, our Cash Capital Policy and our assessment of Maximum Liquidity Outflow.
Contingency Funding Plan . Our Contingency Funding Plan is based on a model of a potential liquidity contraction over a one year time period. This incorporates potential cash outflows during a liquidity stress event, including, but not limited to, the following: (a) repayment of all unsecured debt maturing within one year and no incremental unsecured debt issuance; (b) maturity rolloff of outstanding letters of credit with no further issuance and replacement with cash collateral; (c) higher margin requirements than currently exist on assets on securities financing activity, including repurchase agreements; (d) liquidity outflows related to possible credit downgrade; (e) lower availability of secured funding; (f) client cash withdrawals; (g) the anticipated funding of outstanding investment and loan commitments; and (h) certain accrued expenses and other liabilities and fixed costs.
Cash Capital Policy . We maintain a cash capital model that measures long-term funding sources against requirements. Sources of cash capital include our equity and the noncurrent portion of long-term borrowings. Uses of cash capital include the following: (a) illiquid assets such as equipment, goodwill, net intangible assets, exchange memberships, deferred tax assets and certain investments; (b) a portion of securities inventory that is not expected to be financed on a secured basis in a credit stressed environment ( i.e. , margin requirements) and (c) drawdowns of unfunded commitments. To ensure that we do not need to liquidate inventory in the event of a funding crisis, we seek to maintain surplus cash capital, which is reflected in the leverage ratios we maintain. Our total capital of $11.3 billion at November 30, 2014 exceeded our cash capital requirements.
Maximum Liquidity Outflow . Our businesses are diverse, and our liquidity needs are determined by many factors, including market movements, collateral requirements and client commitments, all of which can change dramatically in a difficult funding environment. During a liquidity crisis, credit-sensitive funding, including unsecured debt and some types of secured financing agreements, may be unavailable, and the terms ( e.g. , interest rates, collateral provisions and tenor) or availability of other types of secured financing may change. As a result of our policy to ensure we have sufficient funds to cover what we estimate may be needed in a liquidity crisis, we hold more cash and unencumbered securities and have greater long-term debt balances than our businesses would otherwise require. As part of this estimation process, we calculate a Maximum Liquidity Outflow that could be experienced in a liquidity crisis. Maximum Liquidity Outflow is based on a scenario that includes both a market-wide stress and firm-specific stress, characterized by some or all of the following elements:
| • | Global recession, default by a medium-sized sovereign, low consumer and corporate confidence, and general financial instability. |
| • | Severely challenged market environment with material declines in equity markets and widening of credit spreads. |
| • | Damaging follow-on impacts to financial institutions leading to the failure of a large bank. |
| • | A firm-specific crisis potentially triggered by material losses, reputational damage, litigation, executive departure, and/or a ratings downgrade. |
The following are the critical modeling parameters of the Maximum Liquidity Outflow:
| • | Liquidity needs over a 30-day scenario. |
| • | A two-notch downgrade of our long-term senior unsecured credit ratings. |
| • | No support from government funding facilities. |
| • | A combination of contractual outflows, such as upcoming maturities of unsecured debt, and contingent outflows ( e.g. , actions though not contractually required, we may deem necessary in a crisis). We assume that most contingent outflows will occur within the initial days and weeks of a crisis. |
| • | No diversification benefit across liquidity risks. We assume that liquidity risks are additive. |
37
JEFFERIES GROUP LLC AND SUBSIDIARIES
The calculation of our Maximum Liquidity Outflow under the above stresses and modeling parameters considers the following potential contractual and contingent cash and collateral outflows:
| • | All upcoming maturities of unsecured long-term debt, commercial paper, promissory notes and other unsecured funding products assuming we will be unable to issue new unsecured debt or rollover any maturing debt. |
| • | Repurchases of our outstanding long-term debt in the ordinary course of business as a market maker. |
| • | A portion of upcoming contractual maturities of secured funding trades due to either the inability to refinance or the ability to refinance only at wider haircuts ( i.e. , on terms which require us to post additional collateral). Our assumptions reflect, among other factors, the quality of the underlying collateral and counterparty concentration. |
| • | Collateral postings to counterparties due to adverse changes in the value of our over-the-counter ("OTC") derivatives and other outflows due to trade terminations, collateral substitutions, collateral disputes, collateral calls or termination payments required by a two-notch downgrade in our credit ratings. |
| • | Variation margin postings required due to adverse changes in the value of our outstanding exchange-traded derivatives and any increase in initial margin and guarantee fund requirements by derivative clearing houses. |
| • | Liquidity outflows associated with our prime brokerage business, including withdrawals of customer credit balances, and a reduction in customer short positions. |
| • | Liquidity outflows to clearing banks to ensure timely settlements of cash and securities transactions. |
| • | Draws on our unfunded commitments considering, among other things, the type of commitment and counterparty. |
| • | Other upcoming large cash outflows, such as tax payments. |
Based on the sources and uses of liquidity calculated under the Maximum Liquidity Outflow scenarios we determine, based on a calculated surplus or deficit, additional long-term funding that may be needed versus funding through the repurchase financing market and consider any adjustments that may be necessary to our inventory balances and cash holdings. At November 30, 2014, we have sufficient excess liquidity to meet all contingent cash outflows detailed in the Maximum Liquidity Outflow. We regularly refine our model to reflect changes in market or economic conditions and the firm's business mix.
Sources of Liquidity
The following are financial instruments that are cash and cash equivalents or are deemed by management to be generally readily convertible into cash, marginable or accessible for liquidity purposes within a relatively short period of time (in thousands):
| November 30, 2014 | Average balance Quarter ended November 30, 2014 (1) | November 30, 2013 | ||||||||||
Cash and cash equivalents: | ||||||||||||
Cash in banks | $ | 1,083,605 | $ | 603,459 | $ | 830,438 | ||||||
Certificate of deposit | 75,000 | 59,524 | 50,005 | |||||||||
Money market investments | 2,921,363 | 2,333,772 | 2,680,676 | |||||||||
|
|
|
|
|
| |||||||
Total cash and cash equivalents | 4,079,968 | 2,996,755 | 3,561,119 | |||||||||
|
|
|
|
|
| |||||||
Other sources of liquidity: | ||||||||||||
Debt securities owned and securities purchased under agreements to resell (2) | 1,056,766 | 1,125,420 | 1,316,867 | |||||||||
Other (3) | 363,713 | 572,024 | 403,738 | |||||||||
|
|
|
|
|
| |||||||
Total other sources | 1,420,479 | 1,697,444 | 1,720,605 | |||||||||
|
|
|
|
|
| |||||||
Total cash and cash equivalents and other liquidity sources | $ | 5,500,447 | $ | 4,694,199 | $ | 5,281,724 | ||||||
|
|
|
|
|
| |||||||
Total cash and cash equivalents and other liquidity sources as % of Total Assets | 12.4 | % | 13.1 | % | ||||||||
Total cash and cash equivalents and other liquidity sources as % of Total Assets less Goodwill and Intangible Assets | 12.9 | % | 13.8 | % | ||||||||
| (1) | Average balances are calculated based on weekly balances. |
38
JEFFERIES GROUP LLC AND SUBSIDIARIES
| (2) | Consists of high quality sovereign government securities and reverse repurchase agreements collateralized by U.S. government securities and other high quality sovereign government securities; deposits with a central bank within the European Economic Area, Canada, Australia, Japan, Switzerland or the USA; and securities issued by a designated multilateral development bank and reverse repurchase agreements with underlying collateral comprised of these securities. |
| (3) | Other includes unencumbered inventory representing an estimate of the amount of additional secured financing that could be reasonably expected to be obtained from our financial instruments owned that are currently not pledged after considering reasonable financing haircuts and additional funds available under the committed senior secured revolving credit facility available for working capital needs of Jefferies Bache, LLC. On September 1, 2014, Jefferies Bache, LLC merged with and into Jefferies, with Jefferies as the surviving entity. |
In addition to the cash balances and liquidity pool presented above, the majority of financial instruments (both long and short) in our trading accounts are actively traded and readily marketable. At November 30, 2014, we have the ability to readily obtain repurchase financing for 74% of our inventory at haircuts of 10% or less, which reflects the liquidity of our inventory. We continually assess the liquidity of our inventory based on the level at which we could obtain financing in the market place for a given asset. Assets are considered to be liquid if financing can be obtained in the repurchase market or the securities lending market at collateral haircut levels of 10% or less. The following summarizes our financial instruments by asset class that we consider to be of a liquid nature and the amount of such assets that have not been pledged as collateral at November 30, 2014 and November 30, 2013 (in thousands):
| November 30, 2014 | November 30, 2013 | |||||||||||||||
| Liquid Financial Instruments | Unencumbered Liquid Financial Instruments (2) | Liquid Financial Instruments | Unencumbered Liquid Financial Instruments (2) | |||||||||||||
Corporate equity securities | $ | 2,191,288 | $ | 297,628 | $ | 1,982,877 | $ | 137,721 | ||||||||
Corporate debt securities | 2,583,779 | 11,389 | 2,250,512 | 26,983 | ||||||||||||
U.S. Government, agency and municipal securities | 3,124,780 | 250,278 | 2,513,388 | 400,821 | ||||||||||||
Other sovereign obligations | 2,671,807 | 877,366 | 2,346,485 | 991,774 | ||||||||||||
Agency mortgage-backed securities (1) | 3,395,771 | - | 2,976,133 | - | ||||||||||||
Physical commodities | 62,234 | - | 37,888 | - | ||||||||||||
|
|
|
|
|
|
|
| |||||||||
| $ | 14,029,659 | $ | 1,436,661 | $ | 12,107,283 | $ | 1,557,299 | |||||||||
|
|
|
|
|
|
|
| |||||||||
| (1) | Consists solely of agency mortgage-backed securities issued by Freddie Mac, Fannie Mae and Ginnie Mae. These securities include pass-through securities, securities backed by adjustable rate mortgages ("ARMs"), collateralized mortgage obligations, commercial mortgage-backed securities and interest- and principal-only securities. |
| (2) | Unencumbered liquid balances represent assets that can be sold or used as collateral for a loan, but have not been. |
Average liquid financial instruments for both the three and twelve months ended November 30, 2014 was $17.2 billion and for the three and twelve months ended November 30, 2013 were $15.7 billion and $16.1 billion, respectively.
In addition to being able to be readily financed at modest haircut levels, we estimate that each of the individual securities within each asset class above could be sold into the market and converted into cash within three business days under normal market conditions, assuming that the entire portfolio of a given asset class was not simultaneously liquidated. There are no restrictions on the unencumbered liquid securities, nor have they been pledged as collateral.
Sources of Funding and Capital Resources
Our assets are funded by equity capital, senior debt, convertible debt, securities loaned, securities sold under agreements to repurchase, customer free credit balances, bank loans and other payables.
39
JEFFERIES GROUP LLC AND SUBSIDIARIES
Secured Financing
We rely principally on readily available secured funding to finance our inventory of financial instruments. Our ability to support increases in total assets is largely a function of our ability to obtain short and intermediate-term secured funding, primarily through securities financing transactions. We finance a portion of our long inventory and cover some of our short inventory by pledging and borrowing securities in the form of repurchase or reverse repurchase agreements (collectively "repos"), respectively. Approximately 80% of our repurchase financing activities use collateral that is considered eligible collateral by central clearing corporations. Central clearing corporations are situated between participating members who borrow cash and lend securities (or vice versa); accordingly repo participants contract with the central clearing corporation and not one another individually. Therefore, counterparty credit risk is borne by the central clearing corporation which mitigates the risk through initial margin demands and variation margin calls from repo participants. The comparatively large proportion of our total repo activity that is eligible for central clearing reflects the high quality and liquid composition of the inventory we carry in our trading books. The tenor of our repurchase and reverse repurchase agreements generally exceeds the expected holding period of the assets we are financing. A significant portion of our financing of European Sovereign inventory is executed using central clearinghouse financing arrangements rather than via bi-lateral repo agreements. For those asset classes not eligible for central clearinghouse financing, we seek to execute our bi-lateral financings on an extended term basis.
In addition to the above financing arrangements, in November 2012, we initiated a program whereby we issue notes backed by eligible collateral under a master repurchase agreement, which provides an additional financing source for our inventory (our "repurchase agreement financing program"). At November 30, 2014, the outstanding amount of the notes issued under the program was $575.0 million in aggregate, which is presented within Other secured financings on the Consolidated Statement of Financial Condition. Of the $575.0 million aggregate notes, $60.0 million matures in February 2015, $85.0 million matures in March 2015, $200.0 million in July 2016 and $80.0 million in August 2016, all bearing interest at a spread over one month LIBOR. The remaining $150.0 million matures in February 2016 and bears interest at a spread over three month LIBOR. For additional discussion on the program, refer to Note 10, Variable Interest Entities, in our consolidated financial statements.
Weighted average maturity of repurchase agreements for non-clearing corporation eligible funded inventory is approximately three months at November 30, 2014. Our ability to finance our inventory via central clearinghouses and bi-lateral arrangements is augmented by our ability to draw bank loans on an uncommitted basis under our various banking arrangements. At November 30, 2014, short-term borrowings, which include bank loans, as well as borrowings under revolving credit facilities which must be repaid within one year or less, totaled $12.0 million. Interest under the bank lines is generally at a spread over the federal funds rate. Letters of credit are used in the normal course of business mostly to satisfy various collateral requirements in favor of exchanges in lieu of depositing cash or securities. Average daily short-term borrowings for the year ended November 30, 2014, the nine months ended November 30, 2013 and the three months ended February 28, 2013 were $81.7 million, $43.3 million and $110.0 million, respectively.
Total Capital
At November 30, 2014 and November 30, 2013, we have total long-term capital of $11.3 billion and $11.2 billion resulting in a long-term debt to equity capital ratio of 1.06:1 and 1.07:1, respectively. Our total capital base at November 30, 2014 and November 30, 2013 was as follows (in thousands):
| November 30, 2014 | November 30, 2013 | |||||||
Long-Term Debt (1) | $ | 5,805,673 | $ | 5,777,130 | ||||
Total Equity | 5,463,431 | 5,421,674 | ||||||
|
|
|
| |||||
Total Capital | $ | 11,269,104 | $ | 11,198,804 | ||||
|
|
|
| |||||
| (1) | Long-term debt for purposes of evaluating long-term capital at November 30, 2014 and November 30, 2013 excludes $170.0 million and $200.0 million, respectively, of our outstanding borrowings under our long-term revolving Credit Facility and excludes $507.9 million of our 3.875% Senior Notes at November 30, 2014 and $255.7 million of our 5.875% Senior Notes at November 30, 2013, as these notes mature in less than one year from the period end. |
40
JEFFERIES GROUP LLC AND SUBSIDIARIES
Long-Term Debt
On August 26, 2011, we entered into a committed senior secured revolving credit facility ("Credit Facility") with a group of commercial banks in Dollars, Euros and Sterling, for an aggregate committed amount of $950.0 million with availability subject to one or more borrowing bases and of which $250.0 million can be borrowed by Jefferies Bache Limited without a borrowing base requirement. On June 26, 2014, we amended and restated the Credit Facility to extend the term of the Credit Facility for three years and reduced the committed amount to $750.0 million. The borrowers under the Credit Facility are Jefferies Bache Financial Services, Inc., Jefferies Bache, LLC and Jefferies Bache Limited, with a guarantee from Jefferies Group LLC. On September 1, 2014, Jefferies Bache, LLC merged with and into Jefferies. Jefferies is the surviving entity, and therefore, a borrower under the Credit Facility. At November 30, 2014 and November 30, 2013, we had borrowings outstanding under the Credit Facility amounting to $170.0 million and $200.0 million, respectively.
Interest is based on the Federal funds rate or, in the case of Euro and Sterling borrowings, the Euro Interbank Offered Rate and the London Interbank Offered Rate, respectively. The Credit Facility is guaranteed by Jefferies Group LLC and contains financial covenants that, among other things, imposes restrictions on future indebtedness of our subsidiaries, requires Jefferies Group LLC to maintain specified levels of tangible net worth and liquidity amounts, and requires certain of our subsidiaries to maintain specified levels of regulated capital. On a monthly basis we provide a certificate to the Administrative Agent of the Credit Facility as to the maintenance of various financial covenant ratios at all times during the preceding month. At November 30, 2014 and November 30, 2013, the minimum tangible net worth requirement was $2,603.1 million and $2,564.0 million, respectively, and the minimum liquidity requirement was $541.7 million and $532.8 million, respectively, for which we were in compliance. Throughout the period, no instances of noncompliance with the Credit Facility occurred and we expect to remain in compliance given our current liquidity and anticipated additional funding requirements given our business plan and profitability expectations. While our subsidiaries are restricted under the Credit Facility from incurring additional indebtedness beyond trade payables and derivative liabilities in the normal course of business, we do not believe that these restrictions will have a negative impact on our liquidity.
On May 20, 2014, under our $2.0 billion Euro Medium Term Note Program, we issued senior unsecured notes with a principal amount of €500.0 million, due 2020, which bear interest at 2.375% per annum. Proceeds amounted to €498.7 million.
At November 30, 2014, our long-term debt, excluding the Credit Facility, has a weighted average maturity of 8 years. Our 5.875% Senior Notes with a principal amount of $250.0 million matured in June 2014.
Our long-term debt ratings at December 31, 2014 are as follows:
| Rating | Outlook | |||
Moody's Investors Service (1) | Baa3 | Negative | ||
Standard and Poor's (2) | BBB- | Stable | ||
Fitch Ratings | BBB- | Stable |
| (1) | On December 19, 2014, Moody's affirmed our long-term debt rating of Baa3 and assigned a negative outlook to our rating. |
| (2) | On December 11, 2014, Standard and Poor's ("S&P") announced its review of the ratings on 13 U.S. securities firms by applying its new ratings criteria for the sector. As part of this review, S&P downgraded our long-term debt rating one notch from "BBB" to "BBB-" and left the rating outlook unchanged at "stable". |
We rely upon our cash holdings and external sources to finance a significant portion of our day to day operations. Access to these external sources, as well as the cost of that financing, is dependent upon various factors, including our debt ratings. Our current debt ratings are dependent upon many factors, including industry dynamics, operating and economic environment, operating results, operating margins, earnings trend and volatility, balance sheet composition, liquidity and liquidity management, our capital structure, our overall risk management, business diversification and our market share and competitive position in the markets in which we operate. Deteriorations in any of these factors could impact our credit ratings. While certain aspects of a credit rating downgrade are quantifiable pursuant to contractual provisions, the impact on our business and trading results in future periods is inherently uncertain and depends on a number of factors, including the magnitude of the downgrade, the behavior of individual clients and future mitigating action taken by us.
41
JEFFERIES GROUP LLC AND SUBSIDIARIES
In connection with certain over-the-counter derivative contract arrangements and certain other trading arrangements, we may be required to provide additional collateral to counterparties, exchanges and clearing organizations in the event of a credit rating downgrade. At November 30, 2014, the amount of additional collateral that could be called by counterparties, exchanges and clearing organizations under the terms of such agreements in the event of a downgrade of our long-term credit rating below investment grade was $93.3 million. For certain foreign clearing organizations credit rating is only one of several factors employed in determining collateral that could be called. The above represents management's best estimate for additional collateral to be called in the event of credit rating downgrade. The impact of additional collateral requirements is considered in our Contingency Funding Plan and calculation of Maximum Liquidity Outflow, as described above.
Contractual Obligations and Commitments
The tables below provide information about our commitments related to debt obligations, purchase obligations, investments and derivative contracts at November 30, 2014. The table presents principal cash flows with expected maturity dates (in millions):
| Expected Maturity Date | ||||||||||||||||||||||||
| 2015 | 2016 | 2017 and 2018 | 2019 and 2020 | 2021 and Later | Total | |||||||||||||||||||
Contractual obligations: | ||||||||||||||||||||||||
Unsecured long-term debt (contractual principal payments net of unamortized discounts and premiums) | $ | 507.9 | $ | 363.2 | $ | 842.4 | $ | 1,453.5 | $ | 3,146.6 | $ | 6,313.6 | ||||||||||||
Senior secured revolving credit facilty | - | - | 170.0 | - | - | 170.0 | ||||||||||||||||||
Interest payment obligations on senior notes | 328.4 | 296.5 | 541.5 | 382.2 | 1,280.8 | 2,829.4 | ||||||||||||||||||
Purchase obligations (1) | 56.7 | 54.6 | 88.1 | 52.4 | 35.5 | 287.3 | ||||||||||||||||||
|
|
|
|
|
|
|
|
|
|
|
| |||||||||||||
| $ | 893.0 | $ | 714.3 | $ | 1,642.0 | $ | 1,888.1 | $ | 4,462.9 | $ | 9,600.3 | |||||||||||||
|
|
|
|
|
|
|
|
|
|
|
| |||||||||||||
Commitments and guarantees: | ||||||||||||||||||||||||
Equity commitments | $ | - | $ | 9.3 | $ | 0.8 | $ | - | $ | 216.3 | $ | 226.4 | ||||||||||||
Loan commitments | 50.7 | 440.2 | 283.1 | 20.7 | 0.2 | 794.9 | ||||||||||||||||||
Mortgage-related and other purchase commitments | 1,058.5 | 1,165.8 | 117.6 | - | - | 2,341.9 | ||||||||||||||||||
Forward starting repos | 5,127.2 | - | - | - | - | 5,127.2 | ||||||||||||||||||
Other unfunded commitments | 6.3 | - | - | - | 23.0 | 29.3 | ||||||||||||||||||
Derivative Contracts (2): | ||||||||||||||||||||||||
Derivative contracts-non credit related | 59,875.6 | 229.6 | 252.1 | 721.8 | 487.7 | 61,566.8 | ||||||||||||||||||
Derivative contracts - credit related | - | - | - | 485.0 | - | 485.0 | ||||||||||||||||||
|
|
|
|
|
|
|
|
|
|
|
| |||||||||||||
| $ | 66,118.3 | $ | 1,844.9 | $ | 653.6 | $ | 1,227.5 | $ | 727.2 | $ | 70,571.5 | |||||||||||||
|
|
|
|
|
|
|
|
|
|
|
| |||||||||||||
| (1) | Purchase obligations for goods and services primarily include payments for outsourcing and computer and telecommunications maintenance agreements. Purchase obligations at November 30, 2014 reflect the minimum contractual obligations under legally enforceable contracts. |
| (2) | Certain of our derivative contracts meet the definition of a guarantee and are therefore included in the above table. (See Note 22, Commitments, Contingencies and Guarantees, in our consolidated financial statements for additional information on commitments.) |
As lessee, we lease certain premises and equipment under noncancelable agreements expiring at various dates through 2029 which are operating leases. At November 30, 2014, future minimum aggregate annual lease payments under such leases (net of subleases) for fiscal years ended November 30, 2015 through 2019 and the aggregate amount thereafter, are as follows (in thousands):
42
JEFFERIES GROUP LLC AND SUBSIDIARIES
| Fiscal Year | Operating Leases | |||
2015 | $ | 42,697 | ||
2016 | 53,056 | |||
2017 | 56,089 | |||
2018 | 56,038 | |||
2019 | 54,785 | |||
Thereafter | 443,361 | |||
|
| |||
Total | $ | 706,026 | ||
|
| |||
During 2012, we entered into a master sale and leaseback agreement under which we sold and have leased back existing and additional new equipment supplied by the lessor with partial expirations through 2019. The transaction resulted in a gain of $2.0 million, which is being amortized into earnings in proportion to and is reflected net against the leased equipment. The lease may be terminated on September 30, 2017 for a termination cost of the present value of the remaining lease payments plus a residual value. At November 30, 2014, minimum future lease payments are as follows (in thousands):
| Fiscal Year | ||||
2015 | $ | 3,887 | ||
2016 | 3,887 | |||
2017 | 3,887 | |||
2018 | 1,583 | |||
2019 | 167 | |||
|
| |||
Net minimum lease payments | 13,411 | |||
Less amount representing interest | 927 | |||
|
| |||
Present value of net minimum lease payments | $ | 12,484 | ||
|
| |||
In the normal course of business we engage in other off balance sheet arrangements, including derivative contracts. Neither derivatives' notional amounts nor underlying instrument values are reflected as assets or liabilities in our Consolidated Statements of Financial Condition. Rather, the fair value of derivative contracts are reported in the Consolidated Statements of Financial Condition as Financial instruments owned-derivative contracts or Financial instruments sold, not yet purchased-derivative contracts as applicable. Derivative contracts are reflected net of cash paid or received pursuant to credit support agreements and are reported on a net by counterparty basis when a legal right of offset exists under an enforceable master netting agreement. (See Note 2, Summary of Significant Accounting Policies, Note 6, Fair Value Disclosures, and Note 7, Derivative Financial Instruments, in our consolidated financial statements for additional information about our accounting policies and our derivative activities.)
We are routinely involved with variable interest entities ("VIEs") in connection with our mortgage- and other asset- backed securities and collateralized loan obligation securitization activities. VIEs are entities in which equity investors lack the characteristics of a controlling financial interest or do not have sufficient equity at risk for the entity to finance its activities without additional subordinated financial support. VIEs are consolidated by the primary beneficiary. The primary beneficiary is the party who has the power to direct the activities of a variable interest entity ("VIE") that most significantly impact the entity's economic performance and who has an obligation to absorb losses of the entity or a right to receive benefits from the entity that could potentially be significant to the entity. Where we are the primary beneficiary of a VIE, we consolidate the VIE. We do not generally consolidate the various VIEs related to our securitization activities because we are not the primary beneficiary.
43
JEFFERIES GROUP LLC AND SUBSIDIARIES
At November 30, 2014, we did not have any commitments to purchase assets from our securitization vehicles. (See Note 9, Securitization Activities and Note 10, Variable Interest Entities, in our consolidated financial statements for additional information regarding our involvement with VIEs.)
We expect to make cash payments of $617.4 million on January 31, 2015 related to compensation awards for fiscal 2014.
Due to the uncertainty regarding the timing and amounts that will ultimately be paid, our liability for unrecognized tax benefits has been excluded from the above contractual obligations table. (See Note 21, Income Taxes, in our consolidated financial statements for further information.)
Equity Capital
On March 1, 2013, all of the outstanding common shares of Jefferies Group LLC were exchanged for shares of Leucadia and Jefferies Group LLC became wholly-owned by Leucadia with Leucadia as the sole equity owner of Jefferies Group LLC. The aggregate purchase price was approximately $4.8 billion and therefore, as a result of the Leucadia Transaction, our member's equity capital approximated $4.8 billion upon consummation. We do not anticipate making capital distributions in the future.
As compared to November 30, 2013, the increase to total member's equity at November 30, 2014 is primarily attributed to net earnings, partially offset by foreign currency translation adjustments during the year ended November 30, 2014.
Net Capital
As broker-dealers registered with the SEC and member firms of the Financial Industry Regulatory Authority ("FINRA"), Jefferies (a U.S. broker-dealer) and Jefferies Execution are subject to the Securities and Exchange Commission Uniform Net Capital Rule ("Rule 15c3-1"), which requires the maintenance of minimum net capital, and have elected to calculate minimum capital requirements under the alternative method permitted by Rule 15c3-1 in calculating net capital. On September 1, 2014, Jefferies Bache, LLC (a Futures Commission Merchant ("FCM")) merged with and into Jefferies. Jefferies, as the surviving entity, registered as an FCM and is subject to Rule 1.17 of the Commodities Futures Trading Commission ("CFTC"), which sets forth minimum financial requirements. The minimum net capital requirement in determining excess net capital for a dually-registered U.S. broker-dealer and FCM is equal to the greater of the requirement under Rule 15c3-1 or CFTC Rule 1.17.
At November 30, 2014, Jefferies and Jefferies Execution's net capital and excess net capital were as follows (in thousands):
| Net Capital | Excess Net Capital | |||||||
Jefferies | $ | 1,025,113 | $ | 913,465 | ||||
Jefferies Execution | 6,150 | 5,900 | ||||||
FINRA is the designated self-regulatory organization ("DSRO") for our U.S. broker-dealers and the Chicago Mercantile Exchange is the DSRO for Jefferies as an FCM.
Certain other U.S. and non-U.S. subsidiaries are subject to capital adequacy requirements as prescribed by the regulatory authorities in their respective jurisdictions, including Jefferies International Limited and Jefferies Bache Limited, which are authorized and regulated by the Financial Conduct Authority in the U.K. The Dodd-Frank Wall Street Reform and Consumer Protection Act (the "Dodd-Frank Act") was signed into law on July 21, 2010. The Dodd-Frank Act contains provisions that require the registration of all swap dealers, major swap participants, security-based swap dealers, and/or major security-based swap participants. While entities that register under these provisions will be subject to regulatory capital requirements, these regulatory capital requirements have not yet been finalized. We expect that these provisions will result in modifications to the regulatory capital requirements of some of our entities, and will result in some of our other entities becoming subject to regulatory capital requirements for the first time, including Jefferies Derivative Products, LLC and Jefferies Bache Financial Services, Inc., which registered as swap dealers with the CFTC during January 2013 and Jefferies Financial Products, LLC, which registered during August 2014.
44
JEFFERIES GROUP LLC AND SUBSIDIARIES
The regulatory capital requirements referred to above may restrict our ability to withdraw capital from our regulated subsidiaries.
Risk Management
Overview
Risk is an inherent part of our business and activities. The extent to which we properly and effectively identify, assess, monitor and manage each of the various types of risk involved in our activities is critical to our financial soundness, viability and profitability. Accordingly, we have a comprehensive risk management approach, with a formal governance structure and processes to identify, assess, monitor and manage risk. Principal risks involved in our business activities include market, credit, liquidity and capital, operational, legal and compliance, new business, and reputational risk.
Risk management is a multifaceted process that requires communication, judgment and knowledge of financial products and markets. Accordingly, our risk management process encompasses the active involvement of executive and senior management, and also many departments independent of the revenue-producing business units, including the Risk Management, Operations, Compliance, Legal and Finance Departments. Our risk management policies, procedures and methodologies are fluid in nature and are subject to ongoing review and modification.
For discussion of liquidity and capital risk management, refer to the "Liquidity, Financial Condition and Capital Resources" section herein.
Governance and Risk Management Structure
Our Board of Directors. Our Board of Directors and its Audit Committee play an important role in reviewing our risk management process and risk tolerance. Our Board of Directors and Audit Committee are provided with data relating to risk at each of its regularly scheduled meetings. Our Chief Risk Officer and Global Treasurer meet with the Board of Directors on not less than a quarterly basis to present our risk profile and liquidity profile and to respond to questions.
Risk Committees. We make extensive use of internal committees to govern risk taking and ensure that business activities are properly identified, assessed, monitored and managed. Our Risk Management Committee meets weekly to discuss our risk, capital, and liquidity profile in detail. In addition, business or market trends and their potential impact on the risk profile are discussed. Membership is comprised of our Chief Executive Officer and Chairman, Chairman of the Executive Committee, Chief Financial Officer, Chief Risk Officer and Global Treasurer. The Committee approves limits for us as a whole, and across risk categories and business lines. It also reviews all limit breaches. Limits are reviewed on at least an annual basis. Other risk related committees include Market Risk Management, Credit Risk Management, New Business, Underwriting Acceptance, Margin Oversight, Executive Management and Operating Committees. These Committees govern risk taking and ensure that business activities are properly managed for their area of oversight.
Risk Related Policies. We make use of various policies in the risk management process:
| • | Market Risk Policy- This policy sets out roles, responsibilities, processes and escalation procedures regarding market risk management. |
| • | Independent Price Verification Policy - This policy sets out roles, responsibilities, processes and escalation procedures regarding independent price verification for securities and other financial instruments. |
| • | Operational Risk Policy - This policy sets out roles, responsibilities, processes and escalation procedures regarding operational risk management. |
45
JEFFERIES GROUP LLC AND SUBSIDIARIES
| • | Credit Risk Policy- This policy provides standards and controls for credit risk-taking throughout our global business activities. This policy also governs credit limit methodology and counterparty review. |
| • | Model Validation Policy- This policy sets out roles, processes and escalation procedures regarding model validation and model risk management. |
Risk Management Key Metrics
We apply a comprehensive framework of limits on a variety of key metrics to constrain the risk profile of our business activities. The size of the limit reflects our risk tolerance for a certain activity under normal business conditions. Key metrics included in our framework include inventory position and exposure limits on a gross and net basis, scenario analysis and stress tests, Value-at-Risk, sensitivities (greeks), exposure concentrations, aged inventory, amount of Level 3 assets, counterparty exposure, leverage, cash capital, and performance analysis metrics.
Market Risk
The potential for changes in the value of financial instruments is referred to as market risk. Our market risk generally represents the risk of loss that may result from a change in the value of a financial instrument as a result of fluctuations in interest rates, credit spreads, equity prices, commodity prices and foreign exchange rates, along with the level of volatility. Interest rate risks result primarily from exposure to changes in the yield curve, the volatility of interest rates, and credit spreads. Equity price risks result from exposure to changes in prices and volatilities of individual equities, equity baskets and equity indices. Commodity price risks result from exposure to the changes in prices and volatilities of individual commodities, commodity baskets and commodity indices. Market risk arises from market making, proprietary trading, underwriting, specialist and investing activities. We seek to manage our exposure to market risk by diversifying exposures, controlling position sizes, and establishing economic hedges in related securities or derivatives. Due to imperfections in correlations, gains and losses can occur even for positions that are hedged. Position limits in trading and inventory accounts are established and monitored on an ongoing basis. Each day, consolidated position and exposure reports are prepared and distributed to various levels of management, which enable management to monitor inventory levels and results of the trading groups.
Value-at-Risk
We estimate Value-at-Risk ("VaR") using a model that simulates revenue and loss distributions on substantially all financial instruments by applying historical market changes to the current portfolio. Using the results of this simulation, VaR measures the potential loss in value of our financial instruments over a specified time horizon at a given confidence level. We calculate a one-day VaR using a one year look-back period measured at a 95% confidence level.
As with all measures of VaR, our estimate has inherent limitations due to the assumption that historical changes in market conditions are representative of the future. Furthermore, the VaR model measures the risk of a current static position over a one-day horizon and might not capture the market risk of positions that cannot be liquidated or offset with hedges in a one-day period. Published VaR results reflect past trading positions while future risk depends on future positions.
While we believe the assumptions and inputs in our risk model are reasonable, we could incur losses greater than the reported VaR because the historical market prices and rates changes may not be an accurate measure of future market events and conditions. Consequently, this VaR estimate is only one of a number of tools we use in our daily risk management activities. When comparing our VaR numbers to those of other firms, it is important to remember that different methodologies and assumptions could produce significantly different results.
Our average daily VaR increased to $14.35 million for the year ended November 30, 2014 from $10.43 million for the year ended November 30, 2013. The increase was primarily driven by higher equity price risk as a result of an increase in various equity block positions compared to the prior year along with our investments in Knight Capital and Harbinger. The increase was partially offset by an increase in the diversification benefit across asset classes.
46
JEFFERIES GROUP LLC AND SUBSIDIARIES
Market risk from interest rate volatility, currency rates and commodity prices risk did not change significantly from the comparable 2013 period. We have also calculated our average VaR excluding both our investments in Knight Capital and Harbinger for the years ended November 30, 2014 and 2013 to be $8.55 million and $6.59 million, respectively. On March 18, 2014, we sold our investment in Harbinger to Leucadia at the closing price on that date.
The following table illustrates each separate component of VaR for each component of market risk by interest rate, equity, currency and commodity products, as well as for our overall trading positions using the past 365 days of historical data (in millions).
Risk Categories | VaR at November 30, 2014 | Daily VaR
(1) Value-at-Risk In Trading Portfolios Daily VaR for the Year Ended November 30, 2014 | VaR at November 30, 2013 | Daily VaR for the Year Ended November 30, 2013 | ||||||||||||||||||||||||||||
| Average | High | Low | Average | High | Low | |||||||||||||||||||||||||||
Interest Rates | $ | 5.56 | $ | 5.77 | $ | 8.69 | $ | 3.16 | $ | 7.33 | $ | 5.38 | $ | 9.46 | $ | 3.68 | ||||||||||||||||
Equity Prices | 10.53 | 11.08 | 14.68 | 7.85 | 12.22 | 6.57 | 12.37 | 3.85 | ||||||||||||||||||||||||
Currency Rates | 0.87 | 1.33 | 6.59 | 0.15 | 0.56 | 0.83 | 2.07 | 0.11 | ||||||||||||||||||||||||
Commodity Prices | 0.19 | 0.70 | 2.14 | 0.07 | 0.74 | 0.94 | 1.70 | 0.37 | ||||||||||||||||||||||||
Diversification Effect (2) | (3.87 | ) | (4.53 | ) | - | - | (4.60 | ) | (3.29 | ) | N/A | N/A | ||||||||||||||||||||
|
|
|
|
|
|
|
|
|
|
|
|
|
|
|
| |||||||||||||||||
Firmwide | $ | 13.28 | $ | 14.35 | $ | 19.68 | $ | 10.31 | $ | 16.25 | $ | 10.43 | $ | 16.25 | $ | 6.00 | ||||||||||||||||
|
|
|
|
|
|
|
|
|
|
|
|
|
|
|
| |||||||||||||||||
| (1) | VaR is the potential loss in value of our trading positions due to adverse market movements over a defined time horizon with a specific confidence level. For the VaR numbers reported above, a one-day time horizon, with a one year look-back period, and a 95% confidence level were used. |
| (2) | The diversification effect is not applicable for the maximum and minimum VaR values as the firmwide VaR and the VaR values for the four risk categories might have occurred on different days during the period. |
The aggregated VaR presented here is less than the sum of the individual components ( i.e. , interest rate risk, foreign exchange rate risk, equity risk and commodity price risk) due to the benefit of diversification among the four risk categories. Diversification benefit equals the difference between aggregated VaR and the sum of VaRs for the four risk categories and arises because the market risk categories are not perfectly correlated.
On April 1, 2013, we redeemed the third party noncontrolling interests in our high yield business. The presentation of VaR therefore reflects the full economic interests of this business since the redemption date. This modification to include a full allocation of the high yield trading business in our calculation had no material effect on VaR calculated for the year ended and as of November 30, 2013.
47
JEFFERIES GROUP LLC AND SUBSIDIARIES
The chart below reflects our daily VaR over the last four quarters:
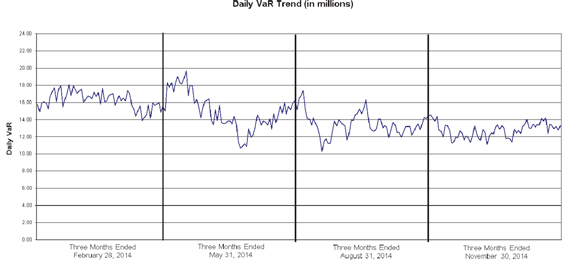
Certain positions within financial instruments are not included in the VaR model because VaR is not the most appropriate measure of risk. Accordingly, Risk Management has additional procedures in place to assure that the level of potential loss that would arise from market movements are within acceptable levels. Such procedures include performing stress tests, monitoring concentration risk and tracking price target/stop loss levels. The table below presents the potential reduction in net income associated with a 10% stress of the fair value of the positions that are not included in the VaR model at November 30, 2014 (in thousands):
| 10% Sensitivity | ||||
Private investments | $ | 39,019 | ||
Corporate debt securities in default | 12,971 | |||
Trade claims | 2,330 | |||
The primary method used to test the efficacy of the VaR model is to compare our actual daily net revenue for those positions included in our VaR calculation with the daily VaR estimate. This evaluation is performed at various levels of the trading portfolio, from the holding company level down to specific business lines. For the VaR model, trading related revenue is defined as principal transaction revenue, trading related commissions, revenue from securitization activities and net interest income. For a 95% confidence one day VaR model ( i.e., no intra-day trading), assuming current changes in market value are consistent with the historical changes used in the calculation, net trading losses would not be expected to exceed the VaR estimates more than twelve times on an annual basis ( i.e., once in every 20 days). During the year ended November 30, 2014, results of the evaluation at the aggregate level demonstrated three days when the net trading loss exceeded the 95% one day VaR.
Daily Net Trading Revenue
There were 44 days with trading losses out of a total of 251 days in the year ended November 30, 2014, including 17 in the three months ended November 30, 2014. Excluding trading losses associated with the daily marking to market of our position in Knight Capital in the year ended November 30, 2014, there were 26 days with trading losses, of which 16 occurred in the fourth quarter of 2014. The histogram below presents the distribution of our actual daily net trading revenue for substantially all of our trading activities for the year ended November 30, 2014 (in millions).
48
JEFFERIES GROUP LLC AND SUBSIDIARIES
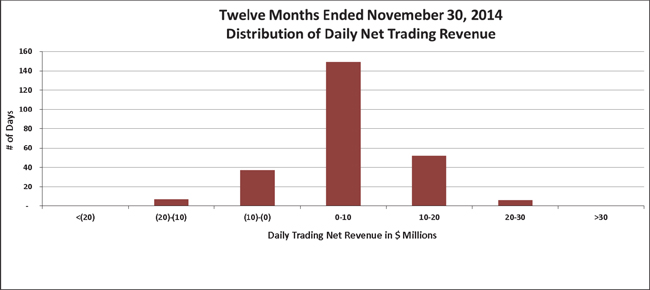
Scenario Analysis and Stress Tests
While VaR measures potential losses due to adverse changes in historical market prices and rates, we use stress testing to analyze the potential impact of specific events or moderate or extreme market moves on our current portfolio both firm wide and within business segments. Stress scenarios comprise both historical market price and rate changes and hypothetical market environments, and generally involve simultaneous changes of many risk factors. Indicative market changes in our scenarios include, but are not limited to, a large widening of credit spreads, a substantial decline in equities markets, significant moves in selected emerging markets, large moves in interest rates, changes in the shape of the yield curve and large moves in European markets. In addition, we also perform ad hoc stress tests and add new scenarios as market conditions dictate. Because our stress scenarios are meant to reflect market moves that occur over a period of time, our estimates of potential loss assume some level of position reduction for liquid positions. Unlike our VaR, which measures potential losses within a given confidence interval, stress scenarios do not have an associated implied probability; rather, stress testing is used to estimate the potential loss from market moves that tend to be larger than those embedded in the VaR calculation.
Stress testing is performed and reported regularly as part of the risk management process. Stress testing is used to assess our aggregate risk position as well as for limit setting and risk/reward analysis.
Counterparty Credit Risk and Issuer Country Exposure
Counterparty Credit Risk
Credit risk is the risk of loss due to adverse changes in a counterparty's credit worthiness or its ability or willingness to meet its financial obligations in accordance with the terms and conditions of a financial contract. We are exposed to credit risk as trading counterparty to other broker-dealers and customers, as a direct lender and through extending loan commitments, as a holder of securities and as a member of exchanges and clearing organizations.
It is critical to our financial soundness and profitability that we properly and effectively identify, assess, monitor, and manage the various credit and counterparty risks inherent in our businesses. Credit is extended to counterparties in a controlled manner in order to generate acceptable returns, whether such credit is granted directly or is incidental to a transaction. All extensions of credit are monitored and managed on an enterprise level in order to limit exposure to loss related to credit risk.
49
JEFFERIES GROUP LLC AND SUBSIDIARIES
Our Credit Risk Framework is responsible for identifying credit risks throughout the operating businesses, establishing counterparty limits and managing and monitoring those credit limits. Our framework includes:
| • | defining credit limit guidelines and credit limit approval processes; |
| • | providing a consistent and integrated credit risk framework across the enterprise; |
| • | approving counterparties and counterparty limits with parameters set by the Risk Management Committee; |
| • | negotiating, approving and monitoring credit terms in legal and master documentation; |
| • | delivering credit limits to all relevant sales and trading desks; |
| • | maintaining credit reviews for all active and new counterparties; |
| • | operating a control function for exposure analytics and exception management and reporting; |
| • | determining the analytical standards and risk parameters for on-going management and monitoring of global credit risk books; |
| • | actively managing daily exposure, exceptions, and breaches; |
| • | monitoring daily margin call activity and counterparty performance (in concert with the Margin Department); and |
| • | setting the minimum global requirements for systems, reports, and technology. |
Credit Exposures
Credit exposure exists across a wide-range of products including cash and cash equivalents, loans, securities finance transactions and over-the-counter derivative contracts.
| • | Loans and lending arise in connection with our capital markets activities and represents the notional value of loans that have been drawn by the borrower and lending commitments that were outstanding at November 30, 2014. In addition, credit exposures on forward settling traded loans are included within our loans and lending exposures for consistency with the balance sheet categorization of these items. |
| • | Securities and margin finance includes credit exposure arising on securities financing transactions (reverse repurchase agreements, repurchase agreements and securities lending agreements) to the extent the fair value of the underlying collateral differs from the contractual agreement amount and from margin provided to customers. |
| • | Derivatives represent OTC derivatives, which are reported net by counterparty when a legal right of setoff exists under an enforceable master netting agreement. Derivatives are accounted for at fair value net of cash collateral received or posted under credit support agreements. In addition, credit exposures on forward settling trades are included within our derivative credit exposures. |
| • | Cash and cash equivalents include both interest-bearing and non-interest bearing deposits at banks. |
Current counterparty credit exposures at November 30, 2014 and November 30, 2013 are summarized in the tables below and provided by credit quality, region and industry (in millions). Credit exposures presented take netting and collateral into consideration by counterparty and master agreement. Collateral taken into consideration includes both collateral received as cash as well as collateral received in the form of securities or other arrangements. Current exposure is the loss that would be incurred on a particular set of positions in the event of default by the counterparty, assuming no recovery. Current exposure equals the fair value of the positions less collateral. Issuer risk is the credit risk arising from inventory positions (for example, corporate debt securities and secondary bank loans). Issuer risk is included in our country risk exposure tables below. Of our counterparty credit exposure at November 30, 2014, excluding cash and cash equivalents, 70% are investment grade counterparties, compared to 66% at November 30, 2013, and are mainly concentrated in North America. When comparing our credit exposure at November 30, 2014 with credit exposure at November 30, 2013, excluding cash and cash equivalents, current exposure has increased 66% to approximately $1.7 billion from $1.0 billion, primarily due to exposure to investment grade banks and broker-dealers and, to a lesser extent, other financial services sectors .
50
JEFFERIES GROUP LLC AND SUBSIDIARIES
Counterparty Credit Exposure by Credit Rating
| Loans and Lending | Securities and Margin Finance | OTC Derivatives | Total | Cash and Cash Equivalents | Total with Cash and Cash Equivalents | |||||||||||||||||||||||||||||||||||||||||||
| At | At | At | At | At | At | |||||||||||||||||||||||||||||||||||||||||||
| November 30, 2014 | November 30, 2013 | November 30, 2014 | November 30, 2013 | November 30, 2014 | November 30, 2013 | November 30, 2014 | November 30, 2013 | November 30, 2014 | November 30, 2013 | November 30, 2014 | November 30, 2013 | |||||||||||||||||||||||||||||||||||||
AAA Range | $ | - | $ | - | $ | 1.9 | $ | 0.2 | $ | - | $ | - | $ | 1.9 | $ | 0.2 | $ | 2,921.4 | $ | 2,680.6 | $ | 2,923.3 | $ | 2,680.8 | ||||||||||||||||||||||||
AA Range | 2.7 | - | 134.6 | 104.8 | 7.1 | 14.7 | 144.4 | 119.5 | 412.9 | 144.1 | 557.3 | 263.6 | ||||||||||||||||||||||||||||||||||||
A Range | 7.6 | - | 586.9 | 374.4 | 218.1 | 56.7 | 812.6 | 431.1 | 731.3 | 734.7 | 1,543.9 | 1,165.8 | ||||||||||||||||||||||||||||||||||||
BBB Range | 132.3 | 71.0 | 73.6 | 39.9 | 34.8 | 16.2 | 240.7 | 127.1 | 2.8 | 1.7 | 243.5 | 128.8 | ||||||||||||||||||||||||||||||||||||
BB or Lower | 189.9 | 120.3 | 127.9 | 115.4 | 45.2 | 9.5 | 363.0 | 245.2 | - | - | 363.0 | 245.2 | ||||||||||||||||||||||||||||||||||||
Unrated | 139.6 | 86.6 | - | - | - | 18.6 | 139.6 | 105.2 | 11.5 | - | 151.1 | 105.2 | ||||||||||||||||||||||||||||||||||||
|
|
|
|
|
|
|
|
|
|
|
|
|
|
|
|
|
|
|
|
|
|
|
| |||||||||||||||||||||||||
Total | $ | 472.1 | $ | 277.9 | $ | 924.9 | $ | 634.7 | $ | 305.2 | $ | 115.7 | $ | 1,702.2 | $ | 1,028.3 | $ | 4,079.9 | $ | 3,561.1 | $ | 5,782.1 | $ | 4,589.4 | ||||||||||||||||||||||||
|
|
|
|
|
|
|
|
|
|
|
|
|
|
|
|
|
|
|
|
|
|
|
| |||||||||||||||||||||||||
Counterparty Credit Exposure by Region
|
| |||||||||||||||||||||||||||||||||||||||||||||||
| Loans and Lending | Securities and Margin Finance | OTC Derivatives | Total | Cash and Cash Equivalents | Total with Cash and Cash Equivalents | |||||||||||||||||||||||||||||||||||||||||||
| At | At | At | At | At | At | |||||||||||||||||||||||||||||||||||||||||||
| November 30, 2014 | November 30, 2013 | November 30, 2014 | November 30, 2013 | November 30, 2014 | November 30, 2013 | November 30, 2014 | November 30, 2013 | November 30, 2014 | November 30, 2013 | November 30, 2014 | November 30, 2013 | |||||||||||||||||||||||||||||||||||||
Asia/Latin America/Other | $ | 48.8 | $ | - | $ | 55.7 | $ | 30.9 | $ | 24.6 | $ | 11.6 | $ | 129.1 | $ | 42.5 | $ | 221.0 | $ | 183.3 | $ | 350.1 | $ | 225.8 | ||||||||||||||||||||||||
Europe | 8.5 | - | 218.2 | 180.3 | 76.1 | 47.6 | 302.8 | 227.9 | 617.5 | 269.3 | 920.3 | 497.2 | ||||||||||||||||||||||||||||||||||||
North America | 414.8 | 277.9 | 651.0 | 423.5 | 204.5 | 56.5 | 1,270.3 | 757.9 | 3,241.4 | 3,108.5 | 4,511.7 | 3,866.4 | ||||||||||||||||||||||||||||||||||||
|
|
|
|
|
|
|
|
|
|
|
|
|
|
|
|
|
|
|
|
|
|
|
| |||||||||||||||||||||||||
Total | $ | 472.1 | $ | 277.9 | $ | 924.9 | $ | 634.7 | $ | 305.2 | $ | 115.7 | $ | 1,702.2 | $ | 1,028.3 | $ | 4,079.9 | $ | 3,561.1 | $ | 5,782.1 | $ | 4,589.4 | ||||||||||||||||||||||||
|
|
|
|
|
|
|
|
|
|
|
|
|
|
|
|
|
|
|
|
|
|
|
| |||||||||||||||||||||||||
Counterparty Credit Exposure by Industry
|
| |||||||||||||||||||||||||||||||||||||||||||||||
| Loans and Lending | Securities and Margin Finance | OTC Derivatives | Total | Cash and Cash Equivalents | Total with Cash and Cash Equivalents | |||||||||||||||||||||||||||||||||||||||||||
| At | At | At | At | At | At | |||||||||||||||||||||||||||||||||||||||||||
| November 30, | November 30, | November 30, | November 30, | November 30, | November 30, | November 30, | November 30, | November 30, | November 30, | November 30, | November 30, | |||||||||||||||||||||||||||||||||||||
| 2014 | 2013 | 2014 | 2013 | 2014 | 2013 | 2014 | 2013 | 2014 | 2013 | 2014 | 2013 | |||||||||||||||||||||||||||||||||||||
Asset Managers | $ | - | $ | - | $ | 91.8 | $ | 7.1 | $ | - | $ | 0.5 | $ | 91.8 | $ | 7.6 | $ | 2,921.4 | $ | 2,680.7 | $ | 3,013.2 | $ | 2,688.3 | ||||||||||||||||||||||||
Banks, Broker-dealers | 10.7 | - | 482.2 | 354.9 | 251.4 | 73.8 | 744.3 | 428.7 | 1,158.5 | 880.4 | 1,902.8 | 1,309.1 | ||||||||||||||||||||||||||||||||||||
Commodities | - | - | 59.9 | 35.6 | 24.8 | 9.4 | 84.7 | 45.0 | - | - | 84.7 | 45.0 | ||||||||||||||||||||||||||||||||||||
Other | 461.4 | 277.9 | 291.0 | 237.1 | 29.0 | 32.0 | 781.4 | 547.0 | - | - | 781.4 | 547.0 | ||||||||||||||||||||||||||||||||||||
|
|
|
|
|
|
|
|
|
|
|
|
|
|
|
|
|
|
|
|
|
|
|
| |||||||||||||||||||||||||
Total | $ | 472.1 | $ | 277.9 | $ | 924.9 | $ | 634.7 | $ | 305.2 | $ | 115.7 | $ | 1,702.2 | $ | 1,028.3 | $ | 4,079.9 | $ | 3,561.1 | $ | 5,782.1 | $ | 4,589.4 | ||||||||||||||||||||||||
|
|
|
|
|
|
|
|
|
|
|
|
|
|
|
|
|
|
|
|
|
|
|
| |||||||||||||||||||||||||
For additional information regarding credit exposure to OTC derivative contracts, refer to Note 7, Derivative Financial Instruments, in our consolidated financial statements included within this Annual Report on Form 10-K.
Country Risk Exposure
Country risk is the risk that events or developments that occur in the general environment of a country or countries due to economic, political, social, regulatory, legal or other factors, will affect the ability of obligors of the country to honor their obligations. We define country risk as the country of jurisdiction or domicile of the obligor. The following tables reflect our top exposure at November 30, 2014 and November 30, 2013 to the sovereign governments, corporations and financial institutions in those non-U.S. countries in which we have a net long issuer and counterparty exposure (in millions):
51
JEFFERIES GROUP LLC AND SUBSIDIARIES
| November 30, 2014 | ||||||||||||||||||||||||||||||||||||
| Issuer Risk | Counterparty Risk | Issuer and Counterparty Risk | ||||||||||||||||||||||||||||||||||
| Fair Value of Long Debt Securities | Fair Value of Short Debt Securities | Net Derivative Notional Exposure | Loans and Lending | Securities and Margin Finance | OTC Derivatives | Cash and Cash Equivalents | Excluding Cash and Cash Equivalents | Including Cash and Cash Equivalents | ||||||||||||||||||||||||||||
Germany | $ | 357.6 | $ | (153.7 | ) | $ | 196.1 | $ | - | $ | 97.8 | $ | 16.8 | $ | 59.5 | $ | 514.6 | $ | 574.1 | |||||||||||||||||
Spain | 587.2 | (171.0 | ) | - | 0.2 | 1.2 | - | - | 417.6 | 417.6 | ||||||||||||||||||||||||||
Great Britain | 441.0 | (252.5 | ) | (25.4 | ) | 6.5 | 29.8 | 25.2 | 138.9 | 224.6 | 363.5 | |||||||||||||||||||||||||
Belgium | 137.6 | (65.9 | ) | (8.4 | ) | - | 2.5 | - | 278.7 | 65.8 | 344.5 | |||||||||||||||||||||||||
Canada | 123.1 | (28.8 | ) | (27.3 | ) | - | 120.2 | 79.6 | 5.3 | 266.8 | 272.1 | |||||||||||||||||||||||||
Netherlands | 341.4 | (121.0 | ) | (13.5 | ) | - | 5.4 | - | - | 212.3 | 212.3 | |||||||||||||||||||||||||
Italy | 1,467.9 | (880.1 | ) | (427.7 | ) | - | - | 0.3 | - | 160.4 | 160.4 | |||||||||||||||||||||||||
Hong Kong | 18.4 | (8.5 | ) | - | - | 0.6 | - | 145.1 | 10.5 | 155.6 | ||||||||||||||||||||||||||
Luxembourg | 5.6 | (6.9 | ) | 2.9 | - | 0.4 | - | 127.2 | 2.0 | 129.2 | ||||||||||||||||||||||||||
Puerto Rico | 108.2 | - | - | - | - | 0.8 | - | 109.0 | 109.0 | |||||||||||||||||||||||||||
|
|
|
|
|
|
|
|
|
|
|
|
|
|
|
|
|
| |||||||||||||||||||
Total | $ | 3,588.0 | $ | (1,688.4 | ) | $ | (303.3 | ) | $ | 6.7 | $ | 257.9 | $ | 122.7 | $ | 754.7 | $ | 1,983.6 | $ | 2,738.3 | ||||||||||||||||
|
|
|
|
|
|
|
|
|
|
|
|
|
|
|
|
|
| |||||||||||||||||||
| November 30, 2013 | ||||||||||||||||||||||||||||||||||||
| Issuer Risk | Counterparty Risk | Issuer and Counterparty Risk | ||||||||||||||||||||||||||||||||||
| Fair Value of Long Debt Securities | Fair Value of Short Debt Securities | Net Derivative Notional Exposure | Loans and Lending | Securities and Margin Finance | OTC Derivatives | Cash and Cash Equivalents | Excluding Cash and Cash Equivalents | Including Cash and Cash Equivalents | ||||||||||||||||||||||||||||
Great Britain | $ | 418.8 | $ | (181.5 | ) | $ | (27.2 | ) | $ | - | $ | 42.5 | $ | 20.7 | $ | 113.1 | $ | 273.3 | $ | 386.4 | ||||||||||||||||
Germany | 462.0 | (226.1 | ) | (70.5 | ) | - | 93.2 | 10.9 | 3.3 | 269.5 | 272.8 | |||||||||||||||||||||||||
Netherlands | 445.7 | (198.8 | ) | (2.3 | ) | - | 5.2 | 1.5 | 0.3 | 251.3 | 251.6 | |||||||||||||||||||||||||
Italy | 1,181.4 | (1,017.6 | ) | 74.2 | - | 1.8 | 0.1 | - | 239.9 | 239.9 | ||||||||||||||||||||||||||
Canada | 140.6 | (59.0 | ) | 18.8 | - | 99.5 | 0.2 | 2.2 | 200.1 | 202.3 | ||||||||||||||||||||||||||
Spain | 352.3 | (159.8 | ) | 0.3 | - | 3.0 | 0.2 | 0.1 | 196.0 | 196.1 | ||||||||||||||||||||||||||
Puerto Rico | 130.1 | - | - | - | - | - | - | 130.1 | 130.1 | |||||||||||||||||||||||||||
Luxembourg | 75.0 | (15.1 | ) | - | - | 0.1 | - | 68.0 | 60.0 | 128.0 | ||||||||||||||||||||||||||
Hong Kong | 33.9 | (18.3 | ) | (0.9 | ) | - | 0.3 | - | 104.3 | 15.0 | 119.3 | |||||||||||||||||||||||||
Austria | 130.2 | (32.8 | ) | - | - | 5.0 | - | 0.1 | 102.4 | 102.5 | ||||||||||||||||||||||||||
|
|
|
|
|
|
|
|
|
|
|
|
|
|
|
|
|
| |||||||||||||||||||
Total | $ | 3,370.0 | $ | (1,909.0 | ) | $ | (7.6 | ) | $ | - | $ | 250.6 | $ | 33.6 | $ | 291.4 | $ | 1,737.6 | $ | 2,029.0 | ||||||||||||||||
|
|
|
|
|
|
|
|
|
|
|
|
|
|
|
|
|
| |||||||||||||||||||
Exposure to the Sovereign Debt, Corporate and Financial Securities of Greece, Ireland, Italy, Portugal and Spain
The table below reflects our exposure to the sovereign debt and economic derivative positions in Greece, Ireland, Italy, Portugal, and Spain at November 30, 2014, and our exposure to the securities of corporations, financial institutions and mortgage-backed securities collateralized by assets domiciled in these countries. This table is presented in a manner consistent with how management views and monitors these exposures as part of our risk management framework. Our issuer exposure to these European countries arises primarily in the context of our market making activities and our role as a major dealer in the debt securities of these countries. While the economic derivative positions are presented on a notional basis, we believe this best reflects the underlying market risk due to interest rates or the issuer's credit as a result of our positions. Long and short financial instruments are offset against each other for determining net exposure although they do not represent identical offsetting positions of the same debt security. Components of risk embedded in the securities will generally offset, however, basis risk due to duration and the specific issuer may still exist. Economic hedges as represented by the notional amounts of the derivative contracts may not be perfect offsets for the risk represented by the net fair value of the debt securities.
52
JEFFERIES GROUP LLC AND SUBSIDIARIES
| November 30, 2014 | ||||||||||||||||||||||||||||
| Fair Value | Notional Amount | |||||||||||||||||||||||||||
| Long Debt Securities (1) (2) | Short Debt Securities (2) (3) | Net Cash Inventory | Long Derivatives | Short Derivatives | Net Derivatives | Total Net Exposure | ||||||||||||||||||||||
Greece: | ||||||||||||||||||||||||||||
Sovereigns | $ | 1.0 | $ | 0.3 | $ | 0.7 | $ | - | $ | - | $ | - | $ | 0.7 | ||||||||||||||
Corporations (4) | 7.9 | 1.3 | 6.6 | - | 0.2 | (0.2 | ) | 6.4 | ||||||||||||||||||||
Financial Institutions | 3.3 | - | 3.3 | - | - | - | 3.3 | |||||||||||||||||||||
Structured Products | 1.4 | - | 1.4 | - | - | - | 1.4 | |||||||||||||||||||||
|
|
|
|
|
|
|
|
|
|
|
|
|
| |||||||||||||||
Total Greece | 13.6 | 1.6 | 12.0 | - | 0.2 | (0.2 | ) | 11.8 | ||||||||||||||||||||
|
|
|
|
|
|
|
|
|
|
|
|
|
| |||||||||||||||
Ireland: | ||||||||||||||||||||||||||||
Sovereigns | 2.4 | 0.4 | 2.0 | - | - | - | 2.0 | |||||||||||||||||||||
Corporations | 1.7 | 1.1 | 0.6 | - | - | - | 0.6 | |||||||||||||||||||||
Financial Institutions | 17.1 | 12.5 | 4.6 | - | - | - | 4.6 | |||||||||||||||||||||
Structured Products | 2.0 | - | 2.0 | - | - | - | 2.0 | |||||||||||||||||||||
|
|
|
|
|
|
|
|
|
|
|
|
|
| |||||||||||||||
Total Ireland | 23.2 | 14.0 | 9.2 | - | - | - | 9.2 | |||||||||||||||||||||
|
|
|
|
|
|
|
|
|
|
|
|
|
| |||||||||||||||
Italy: | ||||||||||||||||||||||||||||
Sovereigns (5) | 1,283.9 | 858.0 | 425.9 | 51.8 | 479.5 | (427.7 | ) | (1.8 | ) | |||||||||||||||||||
Corporations | 61.3 | 10.6 | 50.7 | - | - | - | 50.7 | |||||||||||||||||||||
Financial Institutions | 60.2 | 11.5 | 48.7 | - | - | - | 48.7 | |||||||||||||||||||||
Structured Products | 62.5 | - | 62.5 | - | - | - | 62.5 | |||||||||||||||||||||
|
|
|
|
|
|
|
|
|
|
|
|
|
| |||||||||||||||
Total Italy | 1,467.9 | 880.1 | 587.8 | 51.8 | 479.5 | (427.7 | ) | 160.1 | ||||||||||||||||||||
|
|
|
|
|
|
|
|
|
|
|
|
|
| |||||||||||||||
Portugal: | ||||||||||||||||||||||||||||
Sovereigns | 72.0 | 45.3 | 26.7 | - | - | - | 26.7 | |||||||||||||||||||||
Corporations | - | 1.7 | (1.7 | ) | - | - | - | (1.7 | ) | |||||||||||||||||||
Financial Institutions | 2.2 | - | 2.2 | - | - | - | 2.2 | |||||||||||||||||||||
Structured Products | 28.3 | - | 28.3 | - | - | - | 28.3 | |||||||||||||||||||||
|
|
|
|
|
|
|
|
|
|
|
|
|
| |||||||||||||||
Total Portugal | 102.5 | 47.0 | 55.5 | - | - | - | 55.5 | |||||||||||||||||||||
|
|
|
|
|
|
|
|
|
|
|
|
|
| |||||||||||||||
Spain: | ||||||||||||||||||||||||||||
Sovereigns | 270.0 | 154.9 | 115.1 | - | - | - | 115.1 | |||||||||||||||||||||
Corporations | 18.9 | 13.0 | 5.9 | - | - | - | 5.9 | |||||||||||||||||||||
Financial Institutions | 111.9 | 3.1 | 108.8 | - | - | - | 108.8 | |||||||||||||||||||||
Structured Products | 186.4 | - | 186.4 | - | - | - | 186.4 | |||||||||||||||||||||
|
|
|
|
|
|
|
|
|
|
|
|
|
| |||||||||||||||
Total Spain | 587.2 | 171.0 | 416.2 | - | - | - | 416.2 | |||||||||||||||||||||
|
|
|
|
|
|
|
|
|
|
|
|
|
| |||||||||||||||
Total | $ | 2,194.4 | $ | 1,113.7 | $ | 1,080.7 | $ | 51.8 | $ | 479.7 | $ | (427.9 | ) | $ | 652.8 | |||||||||||||
|
|
|
|
|
|
|
|
|
|
|
|
|
| |||||||||||||||
Total Sovereign | $ | 1,629.3 | $ | 1,058.9 | $ | 570.4 | $ | 51.8 | $ | 479.5 | $ | (427.7 | ) | $ | 142.7 | |||||||||||||
|
|
|
|
|
|
|
|
|
|
|
|
|
| |||||||||||||||
Total Non-sovereign | $ | 565.1 | $ | 54.8 | $ | 510.3 | $ | - | $ | 0.2 | $ | (0.2 | ) | $ | 510.1 | |||||||||||||
|
|
|
|
|
|
|
|
|
|
|
|
|
| |||||||||||||||
| (1) | Long securities represent the fair value of debt securities and are presented within Financial instruments owned-corporate debt securities and government, federal agency and other sovereign obligations and mortgage- and asset-backed securities on the face of the Consolidated Statements of Financial Condition and are accounted for at fair value with changes in fair value recognized in Principal transactions revenues. |
| (2) | Classification of securities by country and by issuer type is presented based on the view of our Risk Management Department. Risk Management takes into account whether a particular security or issuer of a security is guaranteed or otherwise backed by a sovereign government and also takes into account whether a corporate or financial institution that issues a particular security is owned by a sovereign government when determining domicile and whether a particular security should be classified for risk purposes as a sovereign obligation. The classification of debt securities within the table above will differ from the financial statement presentation in the Consolidated Statements of Financial Condition because the classification used for financial statement presentation in the Consolidated Statements of Financial Condition classifies a debt security solely by the direct issuer and the domicile of the direct issuer. |
| (3) | Short securities represent the fair value of debt securities sold short and are presented within Financial instruments sold, not yet purchased - corporate debt securities and government, federal agency and other sovereign obligations on the face of the Consolidated Statements of Financial Condition and are accounted for at fair value with changes in fair value recognized in Principal transactions revenues. |
| (4) | These derivative contract positions are comprised of listed equity options. |
| (5) | These derivative contract positions are comprised of bond futures that are executed on exchanges outside Italy. |
53
JEFFERIES GROUP LLC AND SUBSIDIARIES
For the quarter ended November 30, 2014, our exposure to the sovereign debt of Greece, Ireland, Italy, Portugal and Spain calculated on an average daily basis was as follows (in millions):
| Remaining Maturity Less Than One Year | Remaining Maturity Greater Than or Equal to One Year | Total Average Balance | ||||||||||
Financial instruments owned - Debt securities | ||||||||||||
Greece | $ | - | $ | 4.1 | $ | 4.1 | ||||||
Ireland | 1.3 | 6.5 | 7.8 | |||||||||
Italy | 675.6 | 1,841.9 | 2,517.5 | |||||||||
Portugal | 6.7 | 106.2 | 112.9 | |||||||||
Spain | 125.9 | 304.6 | 430.5 | |||||||||
|
|
|
|
|
| |||||||
Total average fair value of long debt securities (1) | 809.5 | 2,263.3 | 3,072.8 | |||||||||
|
|
|
|
|
| |||||||
Financial instruments sold - Debt securities | ||||||||||||
Greece | - | 2.8 | 2.8 | |||||||||
Ireland | 0.5 | 3.8 | 4.3 | |||||||||
Italy | 537.0 | 1,113.1 | 1,650.1 | |||||||||
Portugal | 3.0 | 80.5 | 83.5 | |||||||||
Spain | 3.1 | 301.7 | 304.8 | |||||||||
|
|
|
|
|
| |||||||
Total average fair value of short debt securities | 543.6 | 1,501.9 | 2,045.5 | |||||||||
|
|
|
|
|
| |||||||
Total average net fair value of debt securities | 265.9 | 761.4 | 1,027.3 | |||||||||
|
|
|
|
|
| |||||||
Derivative contracts - long notional exposure Italy | - | 103.6 | (2) | 103.6 | ||||||||
|
|
|
|
|
| |||||||
Total average notional amount - long | - | 103.6 | 103.6 | |||||||||
|
|
|
|
|
| |||||||
Derivative contracts - short notional exposure Italy | - | 297.9 | (2) | 297.9 | ||||||||
|
|
|
|
|
| |||||||
Total average notional amount - short | - | 297.9 | 297.9 | |||||||||
|
|
|
|
|
| |||||||
Total average net derivative notional exposure | - | (194.3 | ) | (194.3 | ) | |||||||
|
|
|
|
|
| |||||||
Total average net exposure to select European countries | $ | 265.9 | $ | 567.1 | $ | 833.0 | ||||||
|
|
|
|
|
| |||||||
| (1) | Classification of securities by country and by issuer type is presented based on the view of our Risk Management Department. Risk Management takes into account whether a particular security or issuer of a security is guaranteed or otherwise backed by a sovereign government and also takes into account whether a corporate or financial institution that issues a particular security is owned by a sovereign government when determining domicile and whether a particular security should be classified for risk purposes as a sovereign obligation. The classification of debt securities within the table above will differ from the financial statement presentation in the Consolidated Statements of Financial Condition because the classification used for financial statement presentation in the Consolidated Statements of Financial Condition classifies a debt security solely by the direct issuer and the domicile of the direct issuer. |
| (2) | These positions are comprised of bond futures executed on exchanges outside Italy. |
54
JEFFERIES GROUP LLC AND SUBSIDIARIES
In addition, our non-U.S. sovereign obligations recorded in Financial Instruments owned and financial instruments sold, not yet purchased are routinely financed through reverse repurchase agreements and repurchase agreements, of which a significant portion are executed with central clearing organizations. Accordingly, we utilize foreign sovereign obligations as underlying collateral for our repurchase financing arrangements. At November 30, 2014, repurchase financing arrangements that are used to finance the debt securities presented above had underlying collateral of issuers domiciled in Greece, Ireland, Italy, Portugal and Spain as follows (in millions):
| November 30, 2014 | ||||||||||||
| Reverse Repurchase Agreements (1) | Repurchase Agreements (1) | Net | ||||||||||
Greece | $ | - | $ | - | $ | - | ||||||
Ireland | 5.2 | 81.0 | (75.8 | ) | ||||||||
Italy | 1,081.3 | 1,533.2 | (451.9 | ) | ||||||||
Portugal | 35.5 | 57.3 | (21.8 | ) | ||||||||
Spain | 159.1 | 513.4 | (354.3 | ) | ||||||||
|
|
|
|
|
| |||||||
Total | $ | 1,281.1 | $ | 2,184.9 | $ | (903.8 | ) | |||||
|
|
|
|
|
| |||||||
| (1) | Amounts represent the contract amount of the repurchase financing arrangements. |
Our collateral management of the risk due to exposure from these sovereign obligations is subject to our overall collateral and cash management risk framework. For further discussion regarding our cash and liquidity management framework and processes, see the "Liquidity, Financial Condition and Capital Resources" section herein.
Operational Risk
Operational risk refers to the risk of loss resulting from our operations, including, but not limited to, improper or unauthorized execution and processing of transactions, deficiencies in our operating systems, business disruptions and inadequacies or breaches in our internal control processes. Our businesses are highly dependent on our ability to process, on a daily basis, a large number of transactions across numerous and diverse markets in many currencies. In addition, the transactions we process have become increasingly complex. If our financial, accounting or other data processing systems do not operate properly or are disabled or if there are other shortcomings or failures in our internal processes, people or systems, we could suffer an impairment to our liquidity, financial loss, a disruption of our businesses, liability to clients, regulatory intervention or reputational damage.
These systems may fail to operate properly or become disabled as a result of events that are wholly or partially beyond our control, including a disruption of electrical or communications services or our inability to occupy one or more of our buildings. The inability of our systems to accommodate an increasing volume of transactions could also constrain our ability to expand our businesses. We also face the risk of operational failure or termination of any of the clearing agents, exchanges, clearing houses or other financial intermediaries we use to facilitate our securities transactions. Any such failure or termination could adversely affect our ability to effect transactions and manage our exposure to risk. In addition, despite the contingency plans we have in place, our ability to conduct business may be adversely impacted by a disruption in the infrastructure that supports our businesses and the communities in which they are located. This may include a disruption involving electrical, communications, transportation or other services used by us or third parties with which we conduct business.
Our operations rely on the secure processing, storage and transmission of confidential and other information in our computer systems and networks. Although we take protective measures and endeavor to modify them as circumstances warrant, our computer systems, software and networks may be vulnerable to unauthorized access, computer viruses or other malicious code, and other events that could have a security impact. If one or more of such events occur, this potentially could jeopardize our or our clients' or counterparties' confidential and other information processed and stored in, and transmitted through, our computer systems and networks, or otherwise cause interruptions or malfunctions in our, our clients', our counterparties' or third parties' operations. We may be required to expend significant additional resources to modify our protective measures or to investigate and remediate vulnerabilities or other exposures, and we may be subject to litigation and financial losses that are either not insured against or not fully covered through any insurance maintained by us.
55
JEFFERIES GROUP LLC AND SUBSIDIARIES
Our Operational Risk framework includes governance, collection of operational risk incidents, proactive operational risk management, and periodic review and analysis of business metrics to identify and recommend controls and process-related enhancements.
Each revenue producing and support department is responsible for the management and reporting of operational risks and the implementation of the Operational Risk policy and processes within the department. Operational Risk policy, framework, infrastructure, methodology, processes, guidance and oversight of the operational risk processes are centralized and consistent firm wide and also subject to regional operational risk governance.
Legal and Compliance Risk
Legal and compliance risk includes the risk of noncompliance with applicable legal and regulatory requirements. We are subject to extensive regulation in the different jurisdictions in which we conduct our business. We have various procedures addressing issues such as regulatory capital requirements, sales and trading practices, use of and safekeeping of customer funds, credit granting, collection activities, anti-money laundering and record keeping. These risks also reflect the potential impact that changes in local and international laws and tax statutes have on the economics and viability of current or future transactions. In an effort to mitigate these risks, we continuously review new and pending regulations and legislation and participate in various industry interest groups. We also maintain an anonymous hotline for employees or others to report suspected inappropriate actions by us or by our employees or agents.
New Business Risk
New business risk refers to the risks of entering into a new line of business or offering a new product. By entering a new line of business or offering a new product, we may face risks that we are unaccustomed to dealing with and may increase the magnitude of the risks we currently face. The New Business Committee reviews proposals for new businesses and new products to determine if we are prepared to handle the additional or increased risks associated with entering into such activities.
Reputational Risk
We recognize that maintaining our reputation among clients, investors, regulators and the general public is an important aspect of minimizing legal and operational risks. Maintaining our reputation depends on a large number of factors, including the selection of our clients and the conduct of our business activities. We seek to maintain our reputation by screening potential clients and by conducting our business activities in accordance with high ethical standards. Our reputation and business activity can be affected by statements and actions of third parties, even false or misleading statements by them. We actively monitor public comment concerning us and are vigilant in seeking to assure accurate information and perception prevails.
56
JEFFERIES GROUP LLC AND SUBSIDIARIES
| Item 7A. | Quantitative and Qualitative Disclosures About Market Risk. |
Quantitative and qualitative disclosures about market risk are set forth under "Management's Discussion and Analysis of Financial Condition and Results of Operations -Risk Management" in Part II, Item 7 of this Form 10-K.
57
JEFFERIES GROUP LLC AND SUBSIDIARIES
| Item 8. | Financial Statements and Supplementary Data. |
INDEX TO CONSOLIDATED FINANCIAL STATEMENTS
Management's Report on Internal Control over Financial Reporting | 59 | |||
Report of Independent Registered Public Accounting Firm | 60 | |||
Report of Independent Registered Public Accounting Firm | 61 | |||
Report of Independent Registered Public Accounting Firm | 62 | |||
Consolidated Statements of Financial Condition at November 30, 2014 and 2013 | 63 | |||
Consolidated Statements of Earnings for the Year Ended November 30, 2014, Nine Months Ended November 30, 2013, Three Months Ended February 28, 2013 and for the Year Ended November 30, 2012 | 64 | |||
Consolidated Statements of Comprehensive Income for the Year ended November 30, 2014, Nine Months Ended November 30, 2013, Three Months Ended February 28, 2013 and for the Year Ended November 30, 2012 | 65 | |||
Consolidated Statements of Changes in Equity for the Year Ended November 30, 2014, Nine Months Ended November 30, 2013, Three Months Ended February 28, 2013 and for the Year Ended November 30, 2012 | 66 | |||
Consolidated Statements of Cash Flows for the Year Ended November 30, 2014, Nine Months Ended November 30, 2013, Three Months Ended February 28, 2013 and for the Year Ended November 30, 2012 | 67 | |||
Notes to Consolidated Financial Statements | 69 |
58
Management's Report on Internal Control over Financial Reporting
Our management is responsible for establishing and maintaining adequate internal control over financial reporting. Internal control over financial reporting is a process designed to provide reasonable assurance regarding the reliability of financial reporting and the preparation of financial statements for external purposes in accordance with generally accepted accounting principles. A company's internal control over financial reporting includes those policies and procedures that pertain to the maintenance of records that, in reasonable detail, accurately and fairly reflect the transactions and dispositions of the assets of the company; provide reasonable assurance that transactions are recorded as necessary to permit preparation of financial statements in accordance with generally accepted accounting principles, and that receipts and expenditures of the company are being made only in accordance with authorizations of management and directors of the company; and provide reasonable assurance regarding prevention or timely detection of unauthorized acquisition, use, or disposition of the company's assets that could have a material effect on the financial statements.
Because of its inherent limitations, internal control over financial reporting may not prevent or detect misstatements. Also, projections of any evaluation of effectiveness to future periods are subject to the risk that controls may become inadequate because of changes in conditions, or that the degree of compliance with the policies or procedures may deteriorate.
Management evaluated our internal control over financial reporting as of November 30, 2014. In making this assessment, management used the criteria set forth by the Committee of Sponsoring Organizations of the Treadway Commission in Internal Control - Integrated Framework (2013) . As a result of this assessment and based on the criteria in this framework, management has concluded that, as of November 30, 2014, our internal control over financial reporting was effective.
PricewaterhouseCoopers LLP, our independent registered public accounting firm, has audited and issued a report on our internal control over financial reporting, which appears on page 60.
59
Report of Independent Registered Public Accounting Firm
To the Board of Directors and Member of Jefferies Group LLC
In our opinion, the accompanying consolidated statement of financial condition as of November 30, 2014 and 2013 and the related consolidated statements of earnings, of comprehensive income, of changes in equity, and of cash flows for the year ended November 30, 2014 and the nine months ended November 30, 2013 present fairly, in all material respects, the financial position of Jefferies Group LLC and its subsidiaries (Successor company) at November 30, 2014 and 2013 and the results of their operations and their cash flows for the year ended November 30, 2014 and the nine months ended November 30, 2013 in conformity with accounting principles generally accepted in the United States of America. Also in our opinion, the Company maintained, in all material respects, effective internal control over financial reporting as of November 30, 2014, based on criteria established in Internal Control - Integrated Framework (2013) issued by the Committee of Sponsoring Organizations of the Treadway Commission (COSO). The Company's management is responsible for these financial statements, for maintaining effective internal control over financial reporting and for its assessment of the effectiveness of internal control over financial reporting, included in the accompanying Management's Report on Internal Control over Financial Reporting. Our responsibility is to express opinions on these financial statements and on the Company's internal control over financial reporting based on our integrated audits). We conducted our audits in accordance with the standards of the Public Company Accounting Oversight Board (United States). Those standards require that we plan and perform the audits to obtain reasonable assurance about whether the financial statements are free of material misstatement and whether effective internal control over financial reporting was maintained in all material respects. Our audits of the financial statements included examining, on a test basis, evidence supporting the amounts and disclosures in the financial statements, assessing the accounting principles used and significant estimates made by management, and evaluating the overall financial statement presentation. Our audit of internal control over financial reporting included obtaining an understanding of internal control over financial reporting, assessing the risk that a material weakness exists, and testing and evaluating the design and operating effectiveness of internal control based on the assessed risk. Our audits also included performing such other procedures as we considered necessary in the circumstances. We believe that our audits provide a reasonable basis for our opinions.
A company's internal control over financial reporting is a process designed to provide reasonable assurance regarding the reliability of financial reporting and the preparation of financial statements for external purposes in accordance with generally accepted accounting principles. A company's internal control over financial reporting includes those policies and procedures that (i) pertain to the maintenance of records that, in reasonable detail, accurately and fairly reflect the transactions and dispositions of the assets of the company; (ii) provide reasonable assurance that transactions are recorded as necessary to permit preparation of financial statements in accordance with generally accepted accounting principles, and that receipts and expenditures of the company are being made only in accordance with authorizations of management and directors of the company; and (iii) provide reasonable assurance regarding prevention or timely detection of unauthorized acquisition, use, or disposition of the company's assets that could have a material effect on the financial statements.
Because of its inherent limitations, internal control over financial reporting may not prevent or detect misstatements. Also, projections of any evaluation of effectiveness to future periods are subject to the risk that controls may become inadequate because of changes in conditions, or that the degree of compliance with the policies or procedures may deteriorate.
/s/ PricewaterhouseCoopers LLP
New York, New York
January 28, 2015
60
Report of Independent Registered Public Accounting Firm
To Board of Directors and Shareholders of Jefferies Group, Inc.
In our opinion, the consolidated statements of earnings, of comprehensive income, of changes in equity and of cash flows of Jefferies Group, Inc. and its subsidiaries (Predecessor company) for the three months ended February 28, 2013 present fairly, in all material respects, the results of operations and cash flows of Jefferies Group, Inc. and its subsidiaries for the three months ended February 28, 2013, in conformity with accounting principles generally accepted in the United States of America. These financial statements are the responsibility of the Company's management. Our responsibility is to express an opinion on these financial statements based on our audit. We conducted our audit of these statements in accordance with the standards of the Public Company Accounting Oversight Board (United States). Those standards require that we plan and perform the audit to obtain reasonable assurance about whether the financial statements are free of material misstatement. An audit includes examining, on a test basis, evidence supporting the amounts and disclosures in the financial statements, assessing the accounting principles used and significant estimates made by management, and evaluating the overall financial statement presentation. We believe that our audit provides a reasonable basis for our opinion.
/s/ PricewaterhouseCoopers LLP
New York, New York
January 28,2015
61
REPORT OF INDEPENDENT REGISTERED PUBLIC ACCOUNTING FIRM
To the Board of Directors and Member of Jefferies Group LLC:
We have audited the consolidated statement of earnings, comprehensive income, stockholders' equity, and cash flow of Jefferies Group LLC (formerly Jefferies Group, Inc.) and subsidiaries (the "Company") for the year ended November 30, 2012. These financial statements are the responsibility of the Company's management. Our responsibility is to express an opinion on these financial statements based on our audits.
We conducted our audit in accordance with the standards of the Public Company Accounting Oversight Board (United States). Those standards require that we plan and perform the audit to obtain reasonable assurance about whether the financial statements are free of material misstatement. An audit includes examining, on a test basis, evidence supporting the amounts and disclosures in the financial statements. An audit also includes assessing the accounting principles used and significant estimates made by management, as well as evaluating the overall financial statement presentation. We believe that our audit provides a reasonable basis for our opinion.
In our opinion, such consolidated financial statements present fairly, in all material respects, the results of Jefferies Group LLC operations and cash flows for the years ended November 30, 2012, in conformity with accounting principles generally accepted in the United States of America.
/s/ DELOITTE & TOUCHE LLP
New York, New York
January 28, 2013 (January 28, 2014 as to the effects discussed in Note 1-Immaterial Prior Year Adjustments included in the Annual Report on Form 10-K of Jefferies Group LLC and its subsidiaries for the year ended November 30, 2013)
62
CONSOLIDATED STATEMENTS OF FINANCIAL CONDITION
(In thousands)
| November 30, | November 30, | |||||||
| 2014 | 2013 | |||||||
ASSETS | ||||||||
Cash and cash equivalents ($178 and $176 at November 30, 2014 and November 30, 2013, respectively, related to consolidated VIEs) | $ | 4,079,968 | $ | 3,561,119 | ||||
Cash and securities segregated and on deposit for regulatory purposes or deposited with clearing and depository organizations | 3,444,674 | 3,616,602 | ||||||
Financial instruments owned, at fair value, (including securities pledged of $14,794,488 and $13,253,537 at November 30, 2014 and November 30, 2013, respectively; and $62,990 and $97,912 at November 30, 2014 and November 30, 2013, respectively, related to consolidated VIEs) | 18,636,612 | 16,650,043 | ||||||
Investments in managed funds | 74,365 | 57,285 | ||||||
Loans to and investments in related parties | 773,141 | 701,873 | ||||||
Securities borrowed | 6,853,103 | 5,359,846 | ||||||
Securities purchased under agreements to resell | 3,926,858 | 3,746,920 | ||||||
Securities received as collateral | 5,418 | 11,063 | ||||||
Receivables: | ||||||||
Brokers, dealers and clearing organizations | 2,164,006 | 2,207,978 | ||||||
Customers | 1,250,520 | 958,246 | ||||||
Fees, interest and other ($363 and $0 at November 30, 2014 and November 30, 2013, respectively, related to consolidated VIEs) | 262,437 | 251,072 | ||||||
Premises and equipment | 251,957 | 202,467 | ||||||
Goodwill | 1,662,636 | 1,722,346 | ||||||
Other assets ($0 and $2,275 at November 30, 2014 and November 30, 2013, respectively, related to consolidated VIEs) | 1,131,953 | 1,130,136 | ||||||
|
|
|
| |||||
Total assets | $ | 44,517,648 | $ | 40,176,996 | ||||
|
|
|
| |||||
LIABILITIES AND EQUITY | ||||||||
Short-term borrowings | $ | 12,000 | $ | 12,000 | ||||
Financial instruments sold, not yet purchased, at fair value | 8,881,268 | 7,271,613 | ||||||
Collateralized financings: | ||||||||
Securities loaned | 2,598,487 | 2,506,122 | ||||||
Securities sold under agreements to repurchase | 10,672,157 | 10,779,845 | ||||||
Other secured financings ($597,999 and $226,000 at November 30, 2014 and November 30, 2013, respectively, related to consolidated VIEs) | 605,824 | 234,711 | ||||||
Obligation to return securities received as collateral | 5,418 | 11,063 | ||||||
Payables: | ||||||||
Brokers, dealers and clearing organizations | 2,280,103 | 1,320,700 | ||||||
Customers | 6,241,965 | 5,169,321 | ||||||
Accrued expenses and other liabilities ($589 and $706 at November 30, 2014 and November 30, 2013, respectively, related to consolidated VIEs) | 1,273,378 | 1,217,141 | ||||||
Long-term debt | 6,483,617 | 6,232,806 | ||||||
|
|
|
| |||||
Total liabilities | 39,054,217 | 34,755,322 | ||||||
|
|
|
| |||||
EQUITY | ||||||||
Member's paid-in capital | 5,439,256 | 5,280,420 | ||||||
Accumulated other comprehensive income: | ||||||||
Currency translation adjustments | (9,654 | ) | 21,341 | |||||
Additional minimum pension liability | (5,019 | ) | 2,759 | |||||
|
|
|
| |||||
Total accumulated other comprehensive income | (14,673 | ) | 24,100 | |||||
|
|
|
| |||||
Total member's equity | 5,424,583 | 5,304,520 | ||||||
Noncontrolling interests | 38,848 | 117,154 | ||||||
|
|
|
| |||||
Total equity | 5,463,431 | 5,421,674 | ||||||
|
|
|
| |||||
Total liabilities and equity | $ | 44,517,648 | $ | 40,176,996 | ||||
|
|
|
| |||||
See accompanying notes to consolidated financial statements.
63
JEFFERIES GROUP LLC AND SUBSIDIARIES
CONSOLIDATED STATEMENTS OF EARNINGS
(In thousands, except per share amounts)
| Successor | Predecessor | |||||||||||||||
| Year Ended | Nine Months Ended | Three Months Ended | Year Ended | |||||||||||||
| November 30, 2014 | November 30, 2013 | February 28, 2013 | November 30, 2012 | |||||||||||||
Revenues: | ||||||||||||||||
Commissions | $ | 668,801 | $ | 472,596 | $ | 146,240 | $ | 548,437 | ||||||||
Principal transactions | 532,292 | 399,091 | 300,278 | 1,035,974 | ||||||||||||
Investment banking | 1,529,274 | 1,003,517 | 288,278 | 1,125,883 | ||||||||||||
Asset management fees and investment income from managed funds | 17,047 | 36,093 | 10,883 | 26,966 | ||||||||||||
Interest | 1,019,970 | 714,248 | 249,277 | 1,031,839 | ||||||||||||
Other | 78,881 | 94,195 | 27,004 | 164,974 | ||||||||||||
|
|
|
|
|
|
|
| |||||||||
Total revenues | 3,846,265 | 2,719,740 | 1,021,960 | 3,934,073 | ||||||||||||
Interest expense | 856,127 | 579,059 | 203,416 | 872,421 | ||||||||||||
|
|
|
|
|
|
|
| |||||||||
Net revenues | 2,990,138 | 2,140,681 | 818,544 | 3,061,652 | ||||||||||||
Interest on mandatorily redeemable preferred interests of consolidated subsidiaries | - | 3,368 | 10,961 | 42,883 | ||||||||||||
|
|
|
|
|
|
|
| |||||||||
Net revenues, less interest on mandatorily redeemable preferred interests of consolidated subsidiaries | 2,990,138 | 2,137,313 | 807,583 | 3,018,769 | ||||||||||||
|
|
|
|
|
|
|
| |||||||||
Non-interest expenses: | ||||||||||||||||
Compensation and benefits | 1,698,530 | 1,213,908 | 474,217 | 1,770,798 | ||||||||||||
Non-compensation expenses: | ||||||||||||||||
Floor brokerage and clearing fees | 215,329 | 150,774 | 46,155 | 183,013 | ||||||||||||
Technology and communications | 268,212 | 193,683 | 59,878 | 244,511 | ||||||||||||
Occupancy and equipment rental | 107,767 | 86,701 | 24,309 | 97,397 | ||||||||||||
Business development | 106,984 | 63,115 | 24,927 | 95,330 | ||||||||||||
Professional services | 109,601 | 72,802 | 24,135 | 73,427 | ||||||||||||
Bad debt provision | 55,355 | 179 | 1,945 | 1,152 | ||||||||||||
Goodwill impairment | 54,000 | - | - | - | ||||||||||||
Other | 71,339 | 91,856 | 12,530 | 61,346 | ||||||||||||
|
|
|
|
|
|
|
| |||||||||
Total non-compensation expenses | 988,587 | 659,110 | 193,879 | 756,176 | ||||||||||||
|
|
|
|
|
|
|
| |||||||||
Total non-interest expenses | 2,687,117 | 1,873,018 | 668,096 | 2,526,974 | ||||||||||||
|
|
|
|
|
|
|
| |||||||||
Earnings before income taxes | 303,021 | 264,295 | 139,487 | 491,795 | ||||||||||||
Income tax expense | 142,061 | 94,686 | 48,645 | 168,646 | ||||||||||||
|
|
|
|
|
|
|
| |||||||||
Net earnings | 160,960 | 169,609 | 90,842 | 323,149 | ||||||||||||
Net earnings attributable to noncontrolling interests | 3,400 | 8,418 | 10,704 | 40,740 | ||||||||||||
|
|
|
|
|
|
|
| |||||||||
Net earnings attributable to Jefferies Group LLC/common stockholders | $ | 157,560 | $ | 161,191 | $ | 80,138 | $ | 282,409 | ||||||||
|
|
|
|
|
|
|
| |||||||||
Earnings per common share: | ||||||||||||||||
Basic | N/A | N/A | $ | 0.35 | $ | 1.23 | ||||||||||
Diluted | N/A | N/A | $ | 0.35 | $ | 1.22 | ||||||||||
Dividends declared per common share | N/A | N/A | $ | 0.075 | $ | 0.300 | ||||||||||
Weighted average common shares: | ||||||||||||||||
Basic | N/A | N/A | 213,732 | 215,989 | ||||||||||||
Diluted | N/A | N/A | 217,844 | 220,101 | ||||||||||||
See accompanying notes to consolidated financial statements.
64
JEFFERIES GROUP LLC AND SUBSIDIARIES
CONSOLIDATED STATEMENTS OF COMPREHENSIVE INCOME
(In thousands)
| Successor | Predecessor | |||||||||||||||
| Year Ended | Nine Months Ended | Three Months Ended | Year Ended | |||||||||||||
| November 30, 2014 | November 30, 2013 | February 28, 2013 | November 30, 2012 | |||||||||||||
Net earnings | $ | 160,960 | $ | 169,609 | $ | 90,842 | $ | 323,149 | ||||||||
|
|
|
|
|
|
|
| |||||||||
Other comprehensive income (loss), net of tax: | ||||||||||||||||
Currency translation adjustments | (30,995 | ) | 21,341 | (10,018 | ) | 1,511 | ||||||||||
Minimum pension liability adjustments, net of tax (1) | (7,778 | ) | 2,759 | - | (4,158 | ) | ||||||||||
|
|
|
|
|
|
|
| |||||||||
Total other comprehensive income (loss), net of tax (2) | (38,773 | ) | 24,100 | (10,018 | ) | (2,647 | ) | |||||||||
|
|
|
|
|
|
|
| |||||||||
Comprehensive income: | 122,187 | 193,709 | 80,824 | 320,502 | ||||||||||||
Net earnings attributable to noncontrolling interests | 3,400 | 8,418 | 10,704 | 40,740 | ||||||||||||
|
|
|
|
|
|
|
| |||||||||
Comprehensive income attributable to Jefferies Group LLC/common stockholders | $ | 118,787 | $ | 185,291 | $ | 70,120 | $ | 279,762 | ||||||||
|
|
|
|
|
|
|
| |||||||||
| (1) | Includes income tax benefit of $0.5 million, $2.5 million, $-0- and $0.2 million for the year ended November 30, 2014, nine months ended November 30, 2013, three months ended February 28, 2013, and for the year ended November 30, 2012. |
| (2) | None of the components of other comprehensive income (loss) are attributable to noncontrolling interests. |
See accompanying notes to consolidated financial statements.
65
JEFFERIES GROUP LLC AND SUBSIDIARIES
CONSOLIDATED STATEMENTS OF CHANGES IN EQUITY
(In thousands, except per share amount)
| Successor | Predecessor | |||||||||||||||
| Year Ended | Nine Months Ended | Three Months Ended | Year Ended | |||||||||||||
| November 30, 2014 | November 30, 2013 | February 28, 2013 | November 30, 2012 | |||||||||||||
Common stock, par value $0.0001 per share |
| |||||||||||||||
Balance, beginning of period | $ | - | $ | - | $ | 20 | $ | 20 | ||||||||
Issued | - | - | 1 | 1 | ||||||||||||
Retired | - | - | - | (1 | ) | |||||||||||
|
|
|
|
|
|
|
| |||||||||
Balance, end of period | $ | - | $ | - | $ | 21 | $ | 20 | ||||||||
|
|
|
|
|
|
|
| |||||||||
Member's paid-in capital | ||||||||||||||||
Balance, beginning of period | $ | 5,280,420 | $ | 4,754,101 | $ | - | $ | - | ||||||||
Contributions | - | 362,255 | - | - | ||||||||||||
Net earnings to Jefferies Group LLC | 157,560 | 161,191 | - | - | ||||||||||||
Tax benefit for issuance of share-based awards | 1,276 | 2,873 | - | - | ||||||||||||
|
|
|
|
|
|
|
| |||||||||
Balance, end of period | $ | 5,439,256 | $ | 5,280,420 | $ | - | $ | - | ||||||||
|
|
|
|
|
|
|
| |||||||||
Additional paid-in capital | ||||||||||||||||
Balance, beginning of period | $ | - | $ | - | $ | 2,219,959 | $ | 2,207,410 | ||||||||
Benefit plan share activity (1) | - | - | 3,138 | 12,076 | ||||||||||||
Share-based expense, net of forfeitures and clawbacks | - | - | 22,288 | 83,769 | ||||||||||||
Proceeds from exercise of stock options | - | - | 57 | 104 | ||||||||||||
Acquisitions and contingent consideration | - | - | 2,535 | - | ||||||||||||
Tax (deficiency) benefit for issuance of share-based awards | - | - | (17,965 | ) | 19,789 | |||||||||||
Equity component of convertible debt, net of tax | - | - | - | (427 | ) | |||||||||||
Dividend equivalents on share-based plans | - | - | 1,418 | 6,531 | ||||||||||||
Retirement of treasury stock | - | - | - | (109,293 | ) | |||||||||||
|
|
|
|
|
|
|
| |||||||||
Balance, end of period | $ | - | $ | - | $ | 2,231,430 | $ | 2,219,959 | ||||||||
|
|
|
|
|
|
|
| |||||||||
Retained earnings | ||||||||||||||||
Balance, beginning of period | $ | - | $ | - | $ | 1,281,855 | $ | 1,067,858 | ||||||||
Net earnings to common shareholders | - | - | 80,138 | 282,409 | ||||||||||||
Dividends | - | - | (17,217 | ) | (68,412 | ) | ||||||||||
|
|
|
|
|
|
|
| |||||||||
Balance, end of period | $ | - | $ | - | $ | 1,344,776 | $ | 1,281,855 | ||||||||
|
|
|
|
|
|
|
| |||||||||
Accumulated other comprehensive income (loss) (2) (3) | ||||||||||||||||
Balance, beginning of period | $ | 24,100 | $ | - | $ | (53,137 | ) | $ | (50,490 | ) | ||||||
Currency adjustment | (30,995 | ) | 21,341 | (10,018 | ) | 1,511 | ||||||||||
Pension adjustment, net of tax | (7,778 | ) | 2,759 | - | (4,158 | ) | ||||||||||
|
|
|
|
|
|
|
| |||||||||
Balance, end of period | $ | (14,673 | ) | $ | 24,100 | $ | (63,155 | ) | $ | (53,137 | ) | |||||
|
|
|
|
|
|
|
| |||||||||
Treasury stock, at cost | ||||||||||||||||
Balance, beginning of period | $ | - | $ | - | $ | (12,682 | ) | $ | (486 | ) | ||||||
Purchases | - | - | (166,541 | ) | (113,562 | ) | ||||||||||
Returns / forfeitures | - | - | (1,922 | ) | (7,928 | ) | ||||||||||
Retirement of treasury stock | - | - | - | 109,294 | ||||||||||||
|
|
|
|
|
|
|
| |||||||||
Balance, end of period | $ | - | $ | - | $ | (181,145 | ) | $ | (12,682 | ) | ||||||
|
|
|
|
|
|
|
| |||||||||
Total member's / common stockholders' equity | $ | 5,424,583 | $ | 5,304,520 | $ | 3,331,927 | $ | 3,436,015 | ||||||||
|
|
|
|
|
|
|
| |||||||||
Noncontrolling interests | ||||||||||||||||
Balance, beginning of period | $ | 117,154 | $ | 356,180 | $ | 346,738 | $ | 312,663 | ||||||||
Net earnings attributable to noncontrolling interests | 3,400 | 8,418 | 10,704 | 40,740 | ||||||||||||
Contributions | 39,075 | 100,210 | - | - | ||||||||||||
Distributions | - | (25 | ) | (1,262 | ) | (13,570 | ) | |||||||||
Redemptions | - | (347,629 | ) | - | - | |||||||||||
(Deconsolidation) Consolidation of asset management entity | (120,781 | ) | - | - | 6,905 | |||||||||||
|
|
|
|
|
|
|
| |||||||||
Balance, end of period | $ | 38,848 | $ | 117,154 | $ | 356,180 | $ | 346,738 | ||||||||
|
|
|
|
|
|
|
| |||||||||
Total equity | $ | 5,463,431 | $ | 5,421,674 | $ | 3,688,107 | $ | 3,782,753 | ||||||||
|
|
|
|
|
|
|
| |||||||||
| (1) | Includes grants related to the Incentive Plan, Deferred Compensation Plan and Directors' Plan. |
| (2) | The components of other comprehensive income (loss) are attributable to Jefferies Group LLC (formerly Jefferies Group, Inc.). None of the components of other comprehensive income (loss) are attributable to noncontrolling interests. |
| (3) | There were no reclassifications out of Accumulated other comprehensive income during the year ended November 30, 2014 and nine months ended November 30, 2013. |
See accompanying notes to consolidated financial statements.
66
JEFFERIES GROUP LLC AND SUBSIDIARIES
CONSOLIDATED STATEMENTS OF CASH FLOWS
(In thousands)
| Successor | Predecessor | |||||||||||||||
| Year Ended | Nine Months Ended | Three Months Ended | Year Ended | |||||||||||||
| November 30, 2014 | November 30, 2013 | February 28, 2013 | November 30, 2012 | |||||||||||||
Cash flows from operating activities: | ||||||||||||||||
Net earnings | $ | 160,960 | $ | 169,609 | $ | 90,842 | $ | 323,149 | ||||||||
|
|
|
|
|
|
|
| |||||||||
Adjustments to reconcile net earnings to net cash (used in) provided by operating activities: | ||||||||||||||||
Depreciation and amortization | 691 | (2,509 | ) | 17,393 | 72,692 | |||||||||||
Goodwill impairment | 54,000 | - | - | - | ||||||||||||
Gain on repurchase of long-term debt | - | - | - | (9,898 | ) | |||||||||||
Gain on sale of mortgage servicing rights | - | - | - | (23,826 | ) | |||||||||||
Interest on mandatorily redeemable preferred interests of consolidated subsidiaries | - | 3,368 | 10,961 | 42,883 | ||||||||||||
Accruals related to various benefit plans and stock issuances, net of forfeitures | - | - | 23,505 | 87,918 | ||||||||||||
Deferred income taxes | 122,195 | 31,284 | 30,835 | 84,643 | ||||||||||||
Income on loans to and investments in related parties | (90,243 | ) | (92,181 | ) | - | - | ||||||||||
Distributions received on investments in related parties | 53,985 | 37,742 | - | - | ||||||||||||
Other adjustments | (78,064 | ) | (14,740 | ) | (1,154 | ) | (7,462 | ) | ||||||||
Net change in assets and liabilities: | ||||||||||||||||
Cash and securities segregated and on deposit for regulatory purposes or deposited with clearing and depository organizations | 166,108 | 113,754 | 352,891 | (738,117 | ) | |||||||||||
Receivables: | ||||||||||||||||
Brokers, dealers and clearing organizations | 11,872 | 506,774 | (1,225,840 | ) | (101,903 | ) | ||||||||||
Customers | (294,412 | ) | (170,286 | ) | 67,626 | 200,679 | ||||||||||
Fees, interest and other | (12,062 | ) | (29,388 | ) | (29,149 | ) | (33,694 | ) | ||||||||
Securities borrowed | (1,497,438 | ) | (41,678 | ) | (224,557 | ) | 75,379 | |||||||||
Financial instruments owned | (2,243,053 | ) | (200,974 | ) | 229,394 | 52,737 | ||||||||||
Loans to and investments in related parties | - | - | (197,166 | ) | 7,302 | |||||||||||
Investments in managed funds | 13,473 | 2,674 | (2,213 | ) | 12,977 | |||||||||||
Securities purchased under agreements to resell | (200,568 | ) | (156,197 | ) | (224,418 | ) | (463,829 | ) | ||||||||
Other assets | (146,114 | ) | 47,296 | (5,346 | ) | (22,178 | ) | |||||||||
Payables: | ||||||||||||||||
Brokers, dealers and clearing organizations | 968,615 | (532,255 | ) | (1,018,241 | ) | (82,031 | ) | |||||||||
Customers | 1,089,423 | (224,772 | ) | (124,233 | ) | 804,539 | ||||||||||
Securities loaned | 95,607 | 600,539 | (28,138 | ) | 227,737 | |||||||||||
Financial instruments sold, not yet purchased | 1,832,930 | (2,511,777 | ) | 2,327,667 | 801,971 | |||||||||||
Securities sold under agreements to repurchase | (84,303 | ) | 2,794,412 | (197,493 | ) | (1,439,130 | ) | |||||||||
Accrued expenses and other liabilities | 69,459 | 414,515 | (267,336 | ) | 316,367 | |||||||||||
|
|
|
|
|
|
|
| |||||||||
Net cash (used in) provided by operating activities | (6,939 | ) | 745,210 | (394,170 | ) | 188,905 | ||||||||||
|
|
|
|
|
|
|
| |||||||||
Cash flows from investing activities: | ||||||||||||||||
Contributions to loans to and investments in related parties | (2,786,394 | ) | (2,241,232 | ) | - | - | ||||||||||
Distributions from loans to and investments in related parties | 2,751,384 | 2,360,691 | - | - | ||||||||||||
Net payments on premises and equipment | (110,536 | ) | (48,534 | ) | (10,706 | ) | (63,236 | ) | ||||||||
Cash received in connection with acquisition during the period, net of cash acquired | - | - | - | 2,257 | ||||||||||||
Cach disposed in connection with disposal of reporting units, net of cash received | - | (4,939 | ) | - | - | |||||||||||
Cash received from sales of mortgage servicing rights | - | - | - | 30,851 | ||||||||||||
(Deconsolidation) consolidation of asset management entity | (137,856 | ) | - | - | 9,711 | |||||||||||
Cash received from contingent consideration | 6,253 | 3,796 | 1,203 | 4,104 | ||||||||||||
Cash paid from contingent consideration | - | - | - | (1,172 | ) | |||||||||||
|
|
|
|
|
|
|
| |||||||||
Net cash (used in) provided by investing activities | (277,149 | ) | 69,782 | (9,503 | ) | (17,485 | ) | |||||||||
|
|
|
|
|
|
|
| |||||||||
Continued on next page.
67
JEFFERIES GROUP LLC AND SUBSIDIARIES
CONSOLIDATED STATEMENTS OF CASH FLOWS – CONTINUED
(In thousands)
| Successor | Predecessor | |||||||||||||||
| Year Ended | Nine Months Ended | Three Months Ended | Year Ended | |||||||||||||
| November 30, 2014 | November 30, 2013 | February 28, 2013 | November 30, 2012 | |||||||||||||
Cash flows from financing activities: | ||||||||||||||||
Excess tax benefits from the issuance of share-based awards | $ | 1,921 | $ | 3,054 | $ | 5,682 | $ | 31,413 | ||||||||
Proceeds from short-term borrowings | 18,965,163 | 13,623,650 | 6,744,000 | 12,912,063 | ||||||||||||
Payments on short-term borrowings | (18,965,163 | ) | (13,711,650 | ) | (6,794,000 | ) | (12,819,557 | ) | ||||||||
Proceeds from secured credit facility | 2,819,000 | 920,000 | 900,000 | 1,325,000 | ||||||||||||
Payments on secured credit facility | (2,849,000 | ) | (980,000 | ) | (990,007 | ) | (1,075,000 | ) | ||||||||
Repayment of long-term debt | (250,000 | ) | - | - | (253,232 | ) | ||||||||||
Net proceeds from other secured financings | 371,113 | 114,711 | 60,000 | - | ||||||||||||
Payments on repurchase of long-term debt | - | - | - | (1,435 | ) | |||||||||||
Payments on mandatorily redeemable preferred interest of consolidated subsidiaries | - | (64 | ) | (61 | ) | (5,366 | ) | |||||||||
Payments on repurchase of common stock | - | - | (166,541 | ) | (113,562 | ) | ||||||||||
Payments on dividends | - | - | (15,799 | ) | (61,881 | ) | ||||||||||
Proceeds from exercise of stock options, not including tax benefits | - | - | 57 | 104 | ||||||||||||
Net proceeds from issuance of senior notes, net of issuance costs | 681,222 | - | 991,469 | 201,010 | ||||||||||||
Proceeds from contributions of noncontrolling interests | 39,075 | 100,210 | - | - | ||||||||||||
Payments on distributions to noncontrolling interests | - | (347,654 | ) | (1,262 | ) | (13,570 | ) | |||||||||
|
|
|
|
|
|
|
| |||||||||
Net cash provided by (used in) financing activities | 813,331 | (277,743 | ) | 733,538 | 125,987 | |||||||||||
|
|
|
|
|
|
|
| |||||||||
Effect of exchange rate changes on cash and cash equivalents | (10,394 | ) | 5,912 | (4,502 | ) | 1,391 | ||||||||||
|
|
|
|
|
|
|
| |||||||||
Net increase in cash and cash equivalents | 518,849 | 543,161 | 325,363 | 298,798 | ||||||||||||
Cash and cash equivalents at beginning of period | 3,561,119 | 3,017,958 | 2,692,595 | 2,393,797 | ||||||||||||
|
|
|
|
|
|
|
| |||||||||
Cash and cash equivalents at end of period | $ | 4,079,968 | $ | 3,561,119 | $ | 3,017,958 | $ | 2,692,595 | ||||||||
|
|
|
|
|
|
|
| |||||||||
Supplemental disclosures of cash flow information: | ||||||||||||||||
Cash paid (received) during the period for: | ||||||||||||||||
Interest | $ | 922,194 | $ | 638,657 | $ | 178,836 | $ | 869,354 | ||||||||
Income taxes paid (refunds), net | 120,703 | 55,251 | (34,054 | ) | 43,113 | |||||||||||
Noncash financing activities:
In connection with the transaction with Leucadia National Corporation, Jefferies Group LLC recorded accounting adjustments for the Leucadia Transaction, which resulted in changes to equity. Refer to Note 4, Leucadia and Related Transactions, for further details.
On March 31, 2013, Leucadia contributed its mandatorily redeemable preferred interests in JHYH to Jefferies Group, LLC. The contribution was recorded as a capital contribution and increased member's equity by $362.3 million. Refer to Note 4, Leucadia and Related Transactions, for further details.
See accompanying notes to consolidated financial statements.
68
JEFFERIES GROUP LLC AND SUBSIDIARIES
NOTES TO CONSOLIDATED FINANCIAL STATEMENTS
Index
| Note | Page | |||
Note 1. Organization and Basis of Presentation | 70 | |||
Note 2. Summary of Significant Accounting Policies | 71 | |||
Note 3. Accounting Developments | 79 | |||
Note 4. Leucadia and Related Transactions | 81 | |||
Note 5. Acquisition | 83 | |||
Note 6. Fair Value Disclosures | 83 | |||
Note 7. Derivative Financial Instruments | 101 | |||
Note 8. Collateralized Transactions | 106 | |||
Note 9. Securitization Activities | 109 | |||
Note 10. Variable Interest Entities | 110 | |||
Note 11. Investments | 114 | |||
Note 12. Goodwill and Other Intangible Assets | 117 | |||
Note 13. Short-Term Borrowings | 120 | |||
Note 14. Long-Term Debt | 120 | |||
Note 15. Mandatorily Redeemable Convertible Preferred Stock | 122 | |||
Note 16. Noncontrolling Interests and Mandatorily Redeemable Preferred Interests of Consolidated Subsidiaries | 123 | |||
Note 17. Benefit Plans | 124 | |||
Note 18. Compensation Plans | 129 | |||
Note 19. Non-Interest Expenses | 131 | |||
Note 20. Earnings per Share | 131 | |||
Note 21. Income Taxes | 132 | |||
Note 22. Commitments, Contingencies and Guarantees | 136 | |||
Note 23. Net Capital Requirements | 139 | |||
Note 24. Segment Reporting | 140 | |||
Note 25. Related Party Transactions | 142 | |||
Note 26. Selected Quarterly Financial Data (Unaudited) | 144 | |||
69
Note 1. Organization and Basis of Presentation
Organization
Jefferies Group LLC and its subsidiaries operate as a global full service, integrated securities and investment banking firm. Jefferies Group LLC was previously known as Jefferies Group, Inc., which on March 1, 2013 was converted into a limited liability company and renamed Jefferies Group LLC. In addition, certain subsidiaries of Jefferies Group, Inc. also converted into limited liability companies. The accompanying Consolidated Financial Statements therefore refer to Jefferies Group LLC and represent the accounts of Jefferies Group, Inc., as it was formerly known, and all our subsidiaries (together "we" or "us"). The subsidiaries of Jefferies Group LLC include Jefferies LLC ("Jefferies"), Jefferies Execution Services, Inc. ("Jefferies Execution"), Jefferies International Limited, Jefferies Bache Limited, Jefferies Hong Kong Limited, Jefferies Bache Financial Services, Inc., Jefferies Mortgage Funding, LLC and Jefferies Leveraged Credit Products, LLC and all other entities in which we have a controlling financial interest or are the primary beneficiary.
On March 1, 2013, Jefferies Group LLC, through a series of transactions, became an indirect wholly owned subsidiary of Leucadia National Corporation ("Leucadia") (referred to herein as the "Leucadia Transaction"). Each outstanding share of Jefferies Group LLC was converted into 0.81 of a share of Leucadia common stock (the "Exchange Ratio"). Leucadia did not assume nor guarantee any of our outstanding debt securities. Our 3.875% Convertible Senior Debentures due 2029 are now convertible into Leucadia common shares at a price that reflects the Exchange Ratio and the 3.25% Series A Convertible Cumulative Preferred Stock of Jefferies Group, Inc. was exchanged for a comparable series of convertible preferred shares of Leucadia. Jefferies Group LLC continues to operate as a full-service investment banking firm and as the holding company of its various regulated and unregulated operating subsidiaries, retain a credit rating separate from Leucadia and remain a Securities and Exchange Commission ("SEC") reporting company, filing annual, quarterly and periodic financial reports. Richard Handler, our Chief Executive Officer and Chairman, is also the Chief Executive Officer of Leucadia, as well as a Director of Leucadia. Brian P. Friedman, our Chairman of the Executive Committee, is also Leucadia's President and a Director of Leucadia.
We operate in two business segments, Capital Markets and Asset Management. Capital Markets, which represents substantially our entire business, includes our securities, commodities, futures and foreign exchange trading and investment banking activities, which provides the research, sales, trading, origination and advisory effort for various equity, fixed income and advisory products and services. Asset Management provides investment management services to various private investment funds and separate accounts.
On September 1, 2014, Jefferies Bache, LLC merged with and into Jefferies (a broker-dealer in the United States of America ("U.S.")), with Jefferies as the surviving entity. In addition, on April 1, 2013, we merged Jefferies High Yield Trading, LLC (our high yield trading broker-dealer) with Jefferies and our high yield activities are now conducted by Jefferies. In addition, during the three months ended May 31, 2013, we redeemed the third party interests in our high yield joint venture.
Basis of Presentation
The accompanying Consolidated Financial Statements have been prepared in accordance with U.S. generally accepted accounting principles ("U.S. GAAP") for financial information.
As more fully described in Note 4, Leucadia and Related Transactions, the Leucadia Transaction is accounted for using the acquisition method of accounting, which requires that the assets, including identifiable intangible assets, and liabilities of Jefferies Group LLC be recorded at their fair values. The application of the acquisition method of accounting has been pushed down and reflected in the financial statements of Jefferies Group LLC as a wholly-owned subsidiary of Leucadia. The application of push down accounting represents the termination of the prior reporting entity and the creation of a new reporting entity, which do not have the same bases of accounting. As a result, our consolidated financial statements are presented for periods subsequent to March 1, 2013 for the new reporting entity (the "Successor"), and before March 1, 2013 for the prior reporting entity (the "Predecessor.") The Predecessor and Successor periods are separated by a vertical line to highlight the fact that the financial information for such periods has been prepared under two different cost bases of accounting.
70
We have made a number of estimates and assumptions relating to the reporting of assets and liabilities and the disclosure of contingent assets and liabilities to prepare these financial statements in conformity with U.S. GAAP. The most important of these estimates and assumptions relate to fair value measurements, compensation and benefits, goodwill and intangible assets, the ability to realize deferred tax assets and the recognition and measurement of uncertain tax positions. Although these and other estimates and assumptions are based on the best available information, actual results could be materially different from these estimates.
Cash Flow Statement Presentation
Amounts relating to loans and investments in related parties are classified as components of investing activities on the Consolidated Statements of Cash Flows to conform to the presentation of our Parent company in connection with the establishment of a new accounting entity through the application of push down accounting. These amounts are classified by the Predecessor entity as operating activities for reporting periods prior to the Leucadia Transaction.
Consolidation
Our policy is to consolidate all entities in which we control by ownership a majority of the outstanding voting stock. In addition, we consolidate entities which meet the definition of a variable interest entity ("VIE") for which we are the primary beneficiary. The primary beneficiary is the party who has the power to direct the activities of a VIE that most significantly impact the entity's economic performance and who has an obligation to absorb losses of the entity or a right to receive benefits from the entity that could potentially be significant to the entity. For consolidated entities that are less than wholly owned, the third-party's holding of equity interest is presented as Noncontrolling interests in the Consolidated Statements of Financial Condition and Consolidated Statements of Changes in Equity. The portion of net earnings attributable to the noncontrolling interests is presented as Net earnings to noncontrolling interests in the Consolidated Statements of Earnings.
In situations where we have significant influence, but not control, of an entity that does not qualify as a variable interest entity, we apply either the equity method of accounting or fair value accounting pursuant to the fair value option election under U.S. GAAP, with our portion of net earnings or gains and losses recorded within Other revenues or Principal transaction revenues, respectively. We also have formed nonconsolidated investment vehicles with third-party investors that are typically organized as partnerships or limited liability companies and are carried at fair value. We act as general partner or managing member for these investment vehicles and have generally provided the third-party investors with termination or "kick-out" rights.
Intercompany accounts and transactions are eliminated in consolidation.
Immaterial Adjustments
We have made correcting adjustments (referred to as "adjustments") to our financial statements at November 30, 2013. The first adjustment relates to a decrease of $88.7 million to Receivables from customers and a corresponding increase to Receivables from brokers, dealers and clearing organizations. The second adjustment relates to a decrease of $39.4 million to Payables from customers and a corresponding increase to Payables from brokers, dealers and clearing organizations. There was no change to Total assets or Total liabilities at November 30, 2013 as a result of these adjustments. The adjustments had the impact of increasing the Net change in Receivables: Brokers, dealers and clearing organizations by $170.5 million, decreasing the Net change in Receivables: Customers by $170.5 million, decreasing the Net change in Payables: Brokers, dealers and clearing organizations by $24.5 million, and increasing the Net change in Payables: Customers by $24.5 million on the Consolidated Statements of Cash Flows for the nine months ended November 30, 2013. The adjustments had the impact of decreasing the Net change in Receivables: Brokers, dealers and clearing organizations by $198.2 million, increasing the Net change in Receivables: Customers by $198.2 million, increasing the Net change in Payables: Brokers, dealers and clearing organizations by $13.1 million, and decreasing the Net change in Payables: Customers by $13.1 million on the Consolidated Statements of Cash Flows for the three months ended February, 2013. There was no impact on Net cash (used in) provided by operating activities on the Consolidated Statements of Cash Flows for the nine months ended November 30, 2013 and the three months ended February 28, 2013. These adjustments were made in order to classify amounts arising from unsettled securities transactions with other broker dealers. We do not believe these adjustments are material to our financial statements for any previously reported period.
Note 2. Summary of Significant Accounting Policies
Revenue Recognition Policies
Commissions. All customer securities transactions are reported on the Consolidated Statements of Financial Condition on a settlement date basis with related income reported on a trade-date basis. We permit institutional customers to allocate a portion of their gross commissions to pay for research products and other services provided
71
by third parties. The amounts allocated for those purposes are commonly referred to as soft dollar arrangements. These arrangements are accounted for on an accrual basis and, as we are not the primary obligor for these arrangements, netted against commission revenues in the Consolidated Statements of Earnings. The commissions and related expenses on client transactions executed by Jefferies, a futures commission merchant ("FCM"), are recorded on a half-turn basis.
Principal Transactions. Financial instruments owned and Financial instruments sold, but not yet purchased (all of which are recorded on a trade-date basis) are carried at fair value with gains and losses reflected in Principal transaction revenues in the Consolidated Statements of Earnings on a trade-date basis. Fees received on loans carried at fair value are also recorded within Principal transaction revenues.
Investment Banking. Underwriting revenues and fees from mergers and acquisitions, restructuring and other investment banking advisory assignments or engagements are recorded when the services related to the underlying transactions are completed under the terms of the assignment or engagement. Expenses associated with such assignments are deferred until reimbursed by the client, the related revenue is recognized or the engagement is otherwise concluded. Expenses are recorded net of client reimbursements and netted against revenues. Unreimbursed expenses with no related revenues are included in Business development and Professional services expenses in the Consolidated Statements of Earnings.
Asset Management Fees and Investment Income From Managed Funds. Asset management fees and investment income from managed funds include revenues we earn from management, administrative and performance fees from funds and accounts managed by us, revenues from management and performance fees we earn from related-party managed funds and investment income from our investments in these funds. We earn fees in connection with management and investment advisory services performed for various funds and managed accounts. These fees are based on assets under management or an agreed upon notional amount and may include performance fees based upon the performance of the funds. Management and administrative fees are generally recognized over the period that the related service is provided. Generally, performance fees are earned when the return on assets under management exceeds certain benchmark returns, "high-water marks" or other performance targets. Performance fees are accrued (or reversed) on a monthly basis based on measuring performance to date versus any relevant benchmark return hurdles stated in the investment management agreement. Performance fees are not subject to adjustment once the measurement period ends (generally annual periods) and the performance fees have been realized.
Interest Revenue and Expense. We recognize contractual interest on Financial instruments owned and Financial instruments sold, but not yet purchased, on an accrual basis as a component of interest revenue and expense. Interest flows on derivative trading transactions and dividends are included as part of the fair valuation of these contracts and recognized in Principal transaction revenues in the Consolidated Statements of Earnings rather than as a component of interest revenue or expense. We account for our short- and long-term borrowings on an accrual basis with related interest recorded as Interest expense. Discounts/premiums arising on our long-term debt are accreted/amortized to Interest expense using the effective yield method over the remaining lives of the underlying debt obligations. In addition, we recognize interest revenue related to our securities borrowed and securities purchased under agreements to resell activities and interest expense related to our securities loaned and securities sold under agreements to repurchase activities on an accrual basis.
Cash Equivalents
Cash equivalents include highly liquid investments, including certificates of deposit and money market funds, not held for resale with original maturities of three months or less.
72
Cash and Securities Segregated and on Deposit for Regulatory Purposes or Deposited With Clearing and Depository Organizations
In accordance with Rule 15c3-3 of the Securities Exchange Act of 1934, Jefferies as a broker-dealer carrying client accounts, is subject to requirements related to maintaining cash or qualified securities in a segregated reserve account for the exclusive benefit of its clients. In addition, certain financial instruments used for initial and variation margin purposes with clearing and depository organizations are recorded in this caption. Jefferies as a futures commission merchant, is obligated by rules mandated by the Commodities Futures Trading Commission under the Commodities Exchange Act, to segregate or set aside cash or qualified securities to satisfy such regulations, which regulations have been promulgated to protect customer assets. Certain other entities are also obligated by rules mandated by their primary regulators to segregate or set aside cash or equivalent securities to satisfy regulations, promulgated to protect customer assets.
Financial Instruments and Fair Value
Financial instruments owned and Financial instruments sold, not yet purchased are recorded at fair value, either as required by accounting pronouncements or through the fair value option election. These instruments primarily represent our trading activities and include both cash and derivative products. Gains and losses are recognized in Principal transaction revenues in our Consolidated Statements of Earnings. The fair value of a financial instrument is the amount that would be received to sell an asset or paid to transfer a liability in an orderly transaction between market participants at the measurement date (the exit price).
Fair Value Hierarchy
In determining fair value, we maximize the use of observable inputs and minimize the use of unobservable inputs by requiring that observable inputs be used when available. Observable inputs are inputs that market participants would use in pricing the asset or liability based on market data obtained from independent sources. Unobservable inputs reflect our assumptions that market participants would use in pricing the asset or liability developed based on the best information available in the circumstances. We apply a hierarchy to categorize our fair value measurements broken down into three levels based on the transparency of inputs as follows:
| Level 1: | Quoted prices are available in active markets for identical assets or liabilities at the reported date. |
| Level 2: | Pricing inputs are other than quoted prices in active markets, which are either directly or indirectly observable as of the reported date. The nature of these financial instruments include cash instruments for which quoted prices are available but traded less frequently, derivative instruments whose fair value have been derived using a model where inputs to the model are directly observable in the market, or can be derived principally from or corroborated by observable market data, and instruments that are fair valued using other financial instruments, the parameters of which can be directly observed. |
| Level 3: | Instruments that have little to no pricing observability at the reported date. These financial instruments are measured using management's best estimate of fair value, where the inputs into the determination of fair value require significant management judgment or estimation. |
Financial instruments are valued at quoted market prices, if available. Certain financial instruments have bid and ask prices that can be observed in the marketplace. For financial instruments whose inputs are based on bid-ask prices, the financial instrument is valued at the point within the bid-ask range that meets our best estimate of fair value. We use prices and inputs that are current at the measurement date. For financial instruments that do not have readily determinable fair values using quoted market prices, the determination of fair value is based upon consideration of available information, including types of financial instruments, current financial information, restrictions on dispositions, fair values of underlying financial instruments and quotations for similar instruments.
The valuation of financial instruments may include the use of valuation models and other techniques. Adjustments to valuations derived from valuation models may be made when, in management's judgment, features of the financial instrument such as its complexity, the market in which the financial instrument is traded and risk uncertainties about market conditions require that an adjustment be made to the value derived from the models. Adjustments from the price derived from a valuation model reflect management's judgment that other participants in the market for the financial instrument being measured at fair value would also consider in valuing that same financial instrument. To the extent that valuation is based on models or inputs that are less observable or unobservable in the market, the determination of fair value requires more judgment.
73
The availability of observable inputs can vary and is affected by a wide variety of factors, including, for example, the type of financial instrument and market conditions. As the observability of prices and inputs may change for a financial instrument from period to period, this condition may cause a transfer of an instrument among the fair value hierarchy levels. Transfers among the levels are recognized at the beginning of each period. The degree of judgment exercised in determining fair value is greatest for instruments categorized in Level 3.
Valuation Process for Financial Instruments
Our Independent Price Verification ("IPV") Group, which is part of our Finance department, in partnership with Risk Management, is responsible for establishing our valuation policies and procedures. The IPV Group and Risk Management, which are independent of our business functions, play an important role and serve as a control function in determining that our financial instruments are appropriately valued and that fair value measurements are reliable. This is particularly important where prices or valuations that require inputs are less observable. In the event that observable inputs are not available, the control processes are designed to assure that the valuation approach utilized is appropriate and consistently applied and that the assumptions are reasonable. The IPV Group reports to the Global Controller and is subject to the oversight of the IPV Committee, which is comprised of our Chief Financial Officer, Global Controller, Chief Risk Officer and Principal Accounting Officer, among other personnel. Our independent price verification policies and procedures are reviewed, at a minimum, annually and changes to the policies require the approval of the IPV Committee.
Price Testing Process. The business units are responsible for determining the fair value of our financial instruments using approved valuation models and methodologies. In order to ensure that the business unit valuations represent a fair value exit price, the IPV Group tests and validates the fair value of our financial instruments inventory. In the testing process, the IPV Group obtains prices and valuation inputs from independent sources, consistently adheres to established procedures set forth in our valuation policies for sourcing prices and valuation inputs and utilizing valuation methodologies. Sources used to validate fair value prices and inputs include, but are not limited to, exchange data, recently executed transactions, pricing data obtained from third party vendors, pricing and valuation services, broker quotes and observed comparable transactions.
To the extent discrepancies between the business unit valuations and the pricing or valuations resulting from the price testing process are identified, such discrepancies are investigated by the IPV Group and fair values are adjusted, as appropriate. The IPV Group maintains documentation of its testing, results, rationale and recommendations and prepares a monthly summary of its valuation results. This process also forms the basis for our classification of fair values within the fair value hierarchy ( i.e., Level 1, Level 2 or Level 3). The IPV Group utilizes the additional expertise of Risk Management personnel in valuing more complex financial instruments and financial instruments with less or limited pricing observability. The results of the valuation testing are reported to the IPV Committee on a monthly basis, which discusses the results and is charged with the final conclusions as to the financial instrument fair values in the consolidated financial statements. This process specifically assists the Chief Financial Officer in asserting as to the fair presentation of our financial condition and results of operations as included within our Quarterly Reports on Form 10-Q and Annual Report on Form 10-K. At each quarter end, the overall valuation results, as concluded upon by the IPV Committee, are presented to the Audit Committee.
Judgment exercised in determining Level 3 fair value measurements is supplemented by daily analysis of profit and loss performed by the Product Control functions. Gains and losses, which result from changes in fair value, are evaluated and corroborated daily based on an understanding of each of the trading desks' overall risk positions and developments in a particular market on the given day. Valuation techniques generally rely on recent transactions of suitably comparable financial instruments and use the observable inputs from those comparable transactions as a validation basis for Level 3 inputs. Level 3 fair value measurements are further validated through subsequent sales testing and market comparable sales, if such information is available. Level 3 fair value measurements require documentation of the valuation rationale applied, which is reviewed for consistency in application from period to period; and the documentation includes benchmarking the assumptions underlying the valuation rationale against relevant analytic data.
74
Third Party Pricing Information. Pricing information obtained from external data providers (including independent pricing services and brokers) may incorporate a range of market quotes from dealers, recent market transactions and benchmarking model derived prices to quoted market prices and trade data for comparable securities. External pricing data is subject to evaluation for reasonableness by the IPV Group using a variety of means including comparisons of prices to those of similar product types, quality and maturities, consideration of the narrowness or wideness of the range of prices obtained, knowledge of recent market transactions and an assessment of the similarity in prices to comparable dealer offerings in a recent time period. We have a process whereby we challenge the appropriateness of pricing information obtained from external data providers (including independent pricing services and brokers) in order to validate the data for consistency with the definition of a fair value exit price. Our process includes understanding and evaluating the external data providers' valuation methodologies. For corporate, U.S. government and agency and municipal debt securities, and loans, to the extent independent pricing services or broker quotes are utilized in our valuation process, the vendor service providers are collecting and aggregating observable market information as to recent trade activity and active bid-ask submissions. The composite pricing information received from the independent pricing service is thus not based on unobservable inputs or proprietary models. For mortgage- and other asset-backed securities and collateralized debt obligations, our independent pricing service uses a matrix evaluation approach incorporating both observable yield curves and market yields on comparable securities as well as implied inputs from observed trades for comparable securities in order to determine prepayment speeds, cumulative default rates and loss severity. Further, we consider pricing data from multiple service providers as available as well as compare pricing data to prices we have observed for recent transactions, if any, in order to corroborate our valuation inputs.
Model Review Process. Where a pricing model is to be used to determine fair value, the pricing model is reviewed for theoretical soundness and appropriateness by Risk Management, independent from the trading desks, and then approved by Risk Management to be used in the valuation process. Review and approval of a model for use may include benchmarking the model against relevant third party valuations, testing sample trades in the model, backtesting the results of the model against actual trades and stress-testing the sensitivity of the pricing model using varying inputs and assumptions. In addition, recently executed comparable transactions and other observable market data are considered for purposes of validating assumptions underlying the model. Models are independently reviewed and validated by Risk Management annually or more frequently if market conditions or use of the valuation model changes.
Investments in Managed Funds
Investments in managed funds include our investments in funds managed by us and our investments in related-party managed funds in which we are entitled to a portion of the management and/or performance fees. Investments in nonconsolidated managed funds are accounted for at fair value with gains or losses included in Asset management fees and investment income from managed funds in the Consolidated Statements of Earnings.
Loans to and Investments in Related Parties
Loans to and investments in related parties include investments in private equity and other operating entities made in connection with our capital markets activities in which we exercise significant influence over operating and capital decisions and loans issued in connection with such activities. Loans to and investments in related parties are accounted for using the equity method or at cost, as appropriate. Revenues on Loans to and investments in related parties are included in Other revenues in the Consolidated Statements of Earnings. (See Note 11, Investments, and Note 25, Related Party Transactions, for additional information regarding certain of these investments.)
Securities Borrowed and Securities Loaned
Securities borrowed and securities loaned are carried at the amounts of cash collateral advanced and received in connection with the transactions and accounted for as collateralized financing transactions. In connection with both trading and brokerage activities, we borrow securities to cover short sales and to complete transactions in which customers have failed to deliver securities by the required settlement date, and lend securities to other brokers and dealers for similar purposes. We have an active securities borrowed and lending matched book business in which we borrow securities from one party and lend them to another party. When we borrow securities, we generally provide cash to the lender as collateral, which is reflected in our Consolidated Statements of Financial Condition as Securities borrowed. We earn interest revenues on this cash collateral. Similarly, when we lend securities to another
75
party, that party provides cash to us as collateral, which is reflected in our Consolidated Statements of Financial Condition as Securities loaned. We pay interest expense on the cash collateral received from the party borrowing the securities. The initial collateral advanced or received approximates or is greater than the fair value of the securities borrowed or loaned. We monitor the fair value of the securities borrowed and loaned on a daily basis and request additional collateral or return excess collateral, as appropriate.
Securities Purchased Under Agreements to Resell and Securities Sold Under Agreements to Repurchase
Securities purchased under agreements to resell and Securities sold under agreements to repurchase (collectively "repos") are accounted for as collateralized financing transactions and are recorded at their contracted resale or repurchase amount plus accrued interest. We earn and incur interest over the term of the repo, which is reflected in Interest income and Interest expense on our Consolidated Statements of Earnings on an accrual basis. Repos are presented in the Consolidated Statements of Financial Condition on a net-basis by counterparty, where permitted by generally accepted accounting principles. We monitor the fair value of the underlying securities daily versus the related receivable or payable balances. Should the fair value of the underlying securities decline or increase, additional collateral is requested or excess collateral is returned, as appropriate.
Premises and Equipment
Premises and equipment are depreciated using the straight-line method over the estimated useful lives of the related assets (generally three to ten years). Leasehold improvements are amortized using the straight-line method over the term of the related leases or the estimated useful lives of the assets, whichever is shorter. Premises and equipment includes internally developed software, which was increased to its fair market value in the allocation of the purchase price on March 1, 2013. The revised carrying values of internally developed software ready for its intended use are depreciated over the remaining useful life. (See Note 4, Leucadia and Related Transactions for more information regarding the allocation of the purchase price.)
At November 30, 2014 and November 30, 2013, furniture, fixtures and equipment, including amounts under capital leases, amounted to $351.1 million and $278.5 million, respectively, and leasehold improvements amounted to $156.9 million and $134.1 million, respectively. Accumulated depreciation and amortization was $256.0 million and $210.1 million at November 30, 2014 and November 30, 2013, respectively.
Depreciation and amortization expense amounted to $58.0 million for the year ended November 30, 2014, $38.8 million for the nine months ended November 30, 2013, $12.9 million for the three months ended February 28, 2013, and $50.5 million for the year ended November 30, 2012, respectively.
Goodwill and Intangible Assets
Goodwill . Goodwill represents the excess acquisition cost over the fair value of net tangible and intangible assets acquired. Goodwill is not amortized and is subject to annual impairment testing on August 1 or between annual tests if an event or change in circumstance occurs that would more likely than not reduce the fair value of a reporting unit below its carrying value. In testing for goodwill impairment, we have the option to first assess qualitative factors to determine whether the existence of events or circumstances lead to a determination that it is more likely than not that the fair value of a reporting unit is less than its carrying amount. If, after assessing the totality of events and circumstances, we conclude that it is not more likely than not that the fair value of a reporting unit is less than its carrying amount, then performing the two-step impairment test is not required. If we conclude otherwise, we are required to perform the two-step impairment test. The goodwill impairment test is performed at the reporting unit level by comparing the estimated fair value of a reporting unit with its respective carrying value. If the estimated fair value exceeds the carrying value, goodwill at the reporting unit level is not impaired. If the estimated fair value is less than carrying value, further analysis is necessary to determine the amount of impairment, if any, by comparing the implied fair value of the reporting unit's goodwill to the carrying value of the reporting units goodwill.
The fair value of reporting units are based on widely accepted valuation techniques that we believe market participants would use, although the valuation process requires significant judgment and often involves the use of significant estimates and assumptions. The methodologies we utilize in estimating the fair value of reporting units include market valuation methods that incorporate price-to-earnings and price-to-book multiples of comparable
76
exchange traded companies and multiples of merger and acquisitions of similar businesses and discounted cash flow methodologies that incorporate an appropriate risk-adjusted discount rate. The estimates and assumptions used in determining fair value could have a significant effect on whether or not an impairment charge is recorded and the magnitude of such a charge. Adverse market or economic events could result in impairment charges in future periods.
Intangible Assets . Intangible assets deemed to have finite lives are amortized on a straight line basis over their estimated useful lives, where the useful life is the period over which the asset is expected to contribute directly, or indirectly, to our future cash flows. Intangible assets are reviewed for impairment on an interim basis when certain events or circumstances exist. For amortizable intangible assets, impairment exists when the carrying amount of the intangible asset exceeds its fair value. At least annually, the remaining useful life is evaluated.
An intangible asset with an indefinite useful life is not amortized but assessed for impairment annually, or more frequently, when events or changes in circumstances occur indicating that it is more likely than not that the indefinite-lived asset is impaired. Impairment exists when the carrying amount exceeds its fair value. In testing for impairment, we have the option to first perform a qualitative assessment to determine whether it is more likely than not that an impairment exists. If it is determined that it is not more likely than not that an impairment exists, a quantitative impairment test is not necessary. If we conclude otherwise, we are required to perform a quantitative impairment test. Our annual indefinite-lived intangible asset impairment testing date is August 1.
To the extent an impairment loss is recognized, the loss establishes the new cost basis of the asset that is amortized over the remaining useful life of that asset, if any. Subsequent reversal of impairment losses is not permitted.
Refer to Note 12, Goodwill and Other Intangible Assets, for further information.
Income Taxes
Prior to the Leucadia Transaction, we filed a consolidated U.S. federal income tax return, which included all of our qualifying subsidiaries. Subsequently, our results of operations are included in the consolidated federal and applicable state income tax returns filed by Leucadia. In states that neither accept nor require combined or unitary tax returns, certain subsidiaries file separate state income tax returns. We also are subject to income tax in various foreign jurisdictions in which we operate. We account for our provision for income taxes using a "separate return" method. Amounts provided for income taxes are based on income reported for financial statement purposes and do not necessarily represent amounts currently payable. Pursuant to a tax sharing agreement entered into between us and Leucadia, payments are between us and Leucadia settle current tax assets and liabilities.
Deferred tax assets and liabilities are recognized for the future tax consequences attributable to differences between the financial statement carrying amounts of existing assets and liabilities and their respective tax bases and for tax loss carryforwards. Deferred tax assets and liabilities are measured using enacted tax rates expected to apply to taxable income in the years in which those temporary differences are expected to be recovered or settled. The effect of a change in tax rates on deferred tax assets and liabilities is recognized in income in the period that includes the enactment date. Under acquisition accounting, the recognition of certain assets and liabilities at fair value created a change in the financial reporting basis for our assets and liabilities, while the tax basis of our assets and liabilities remained the same. As a result, deferred tax assets and liabilities were recognized for the change in the basis differences. Jefferies provides deferred taxes on its temporary differences and on any carryforwards that it could claim on its hypothetical tax return. The realization of deferred tax assets is assessed and a valuation allowance is recorded to the extent that it is more likely than not that any portion of the deferred tax asset will not be realized on the basis of its projected separate return results. The tax benefit related to Leucadia dividends and dividend equivalents paid on nonvested share-based payment awards are recognized as an increase to Additional paid-in capital. These amounts are included in tax benefits for issuance of share-based awards on the Consolidated Statements of Changes in Equity.
We record uncertain tax positions using a two-step process: (i) we determine whether it is more likely than not that each tax position will be sustained on the basis of the technical merits of the position; and (ii) for those tax positions that meet the more-likely-than-not recognition threshold, we recognize the largest amount of tax benefit that is more than 50 percent likely to be realized upon ultimate settlement with the related tax authority.
77
Legal Reserves
In the normal course of business, we have been named, from time to time, as a defendant in legal and regulatory proceedings. We are also involved, from time to time, in other exams, investigations and similar reviews (both formal and informal) by governmental and self-regulatory agencies regarding our businesses, certain of which may result in judgments, settlements, fines, penalties or other injunctions.
We recognize a liability for a contingency in Accrued expenses and other liabilities when it is probable that a liability has been incurred and the amount of loss can be reasonably estimated. If the reasonable estimate of a probable loss is a range, we accrue the most likely amount of such loss, and if such amount is not determinable, then we accrue the minimum in the range as the loss accrual. The determination of the outcome and loss estimates requires significant judgment on the part of management. At November 30, 2014, we have reserved approximately $1.9 million for remaining payments under a non-prosecution agreement with the United States Attorney for the District of Connecticut and a settlement agreement with the SEC, both with respect to an investigation of certain purchases and sales of mortgage-backed securities. We believe that any other matters for which we have determined a loss to be probable and reasonably estimable are not material to the consolidated financial statements.
In many instances, it is not possible to determine whether any loss is probable or even possible or to estimate the amount of any loss or the size of any range of loss. We believe that, in the aggregate, the pending legal actions or regulatory proceedings and any other exams, investigations or similar reviews (both formal and informal) should not have a material adverse effect on our consolidated results of operations, cash flows or financial condition. In addition, we believe that any amount that could be reasonably estimated of potential loss or range of potential loss in excess of what has been provided in the consolidated financial statements is not material.
Share-based Compensation
Share-based awards are measured based on the grant-date fair value of the award and recognized over the period from the service inception date through the date the employee is no longer required to provide service to earn the award. Expected forfeitures are included in determining share-based compensation expense.
Foreign Currency Translation
Assets and liabilities of foreign subsidiaries having non-U.S. dollar functional currencies are translated at exchange rates at the end of a period. Revenues and expenses are translated at average exchange rates during the period. The gains or losses resulting from translating foreign currency financial statements into U.S. dollars, net of hedging gains or losses and taxes, if any, are included in Other comprehensive income. Gains or losses resulting from foreign currency transactions are included in Principal transaction revenues in the Consolidated Statements of Earnings.
Securitization Activities
We engage in securitization activities related to corporate loans, commercial mortgage loans and mortgage-backed and other asset-backed securities. Such transfers of financial assets are accounted for as sales when we have relinquished control over the transferred assets. The gain or loss on sale of such financial assets depends, in part, on the previous carrying amount of the assets involved in the transfer allocated between the assets sold and the retained interests, if any, based upon their respective fair values at the date of sale. We may retain interests in the securitized financial assets as one or more tranches of the securitization. These retained interests are included within Financial instruments owned in the Consolidated Statements of Financial Condition at fair value. Any changes in the fair value of such retained interests are recognized within Principal transactions revenues in the Consolidated Statements of Earnings.
When a transfer of assets does not meet the criteria of a sale, we account for the transfer as a secured borrowing and continue to recognize the assets of a secured borrowing in Financial instruments owned and recognize the associated financing in Other secured financings in the Consolidated Statements of Financial Condition.
78
Earnings per Common Share
As a single member limited liability company, earnings per share is not calculated for Jefferies Group LLC (the Successor company).
Prior to the Leucadia Transaction, Jefferies Group, Inc. (the Predecessor company) had common shares and other common share equivalents outstanding. For the Predecessor periods, basic earnings per share ("EPS") was computed by dividing net earnings available to common shareholders by the weighted average number of common shares outstanding and certain other shares committed to be, but not yet issued. Net earnings available to common shareholders represent net earnings to common shareholders reduced by the allocation of earnings to participating securities. Losses are not allocated to participating securities. For Predecessor periods, diluted EPS was computed by dividing net earnings available to common shareholders plus dividends on dilutive mandatorily redeemable convertible preferred stock by the weighted average number of common shares outstanding and certain other shares committed to be, but not yet issued, plus all dilutive common stock equivalents outstanding during the period. Unvested share-based payment awards that contain nonforfeitable rights to dividends or dividend equivalents (whether paid or unpaid) are participating securities and, therefore, are included in the earnings allocation in computing earnings per share under the two-class method of earning per share. Restricted stock and Restricted stock units ("RSUs") granted as part of our share-based compensation contain nonforfeitable rights to dividends and dividend equivalents, respectively, and therefore, prior to the requisite service being rendered for the right to retain the award, restricted stock and RSUs meet the definition of a participating security. As such, Basic and Diluted earnings per share were calculated under the two-class method.
Note 3. Accounting Developments
Accounting Standards to be Adopted in Future Periods
Repurchase Agreements. In June 2014, the Financial Accounting Standards Board ("FASB") issued Accounting Standards Update ("ASU") No. 2014-11, Repurchase-to-Maturity Transactions, Repurchase Financings, and Disclosures. The accounting guidance changes the accounting for repurchase-to-maturity transactions and linked repurchase financings to secured borrowing accounting, which is consistent with the accounting for other repurchase agreements. The guidance also requires new disclosures about transfers that are accounted for as sales in transactions that are economically similar to repurchase agreements and increased transparency about the types of collateral pledged in repurchase agreements and similar transactions accounted for as secured borrowings. The guidance is effective prospectively in the second quarter of fiscal 2015. We do not expect this guidance to significantly affect our results of operations, financial condition or cash flows and we will provide the additional disclosures in our consolidated financial statements.
Revenue Recognition . In May 2014, the FASB issued ASU No. 2014-09, Revenue from Contracts with Customers. The accounting guidance defines how companies report revenues from contracts with customers, and also requires enhanced disclosures. The guidance is effective beginning in the first quarter of fiscal 2017. We are currently evaluating the impact of the new guidance on our consolidated financial statements.
Discontinued Operations . In April 2014, the FASB issued ASU No. 2014-08, Reporting Discontinued Operations and Disclosures of Disposals of Components of an Entity. The guidance changes the criteria for disposals to qualify as discontinued operations and requires new disclosures about disposals of both discontinued operations and certain other disposals that do not meet the new definition. The guidance is effective beginning in the first quarter of 2015. We do not expect the guidance to have a significant impact on our consolidated financial position or results of operations upon adoption.
Income Taxes. In July 2013, the FASB issued ASU No. 2013-11, Presentation of an Unrecognized Tax Benefit When a Net Operating Loss Carryforward, a Similar Tax Loss, or a Tax Credit Carryforward Exists. The guidance requires an entity to net their unrecognized tax benefit, or a portion of an unrecognized tax benefit, in the financial statements against a deferred tax asset for a net operating loss carryforward, a similar tax loss or tax credit carryforward, unless such tax loss or credit carryforward is not available at the reporting date under the tax law of the applicable jurisdiction to settle any additional income taxes resulting from the disallowance of a tax position. In the event that the tax position is disallowed or the tax law of the applicable jurisdiction does not require the entity to
79
use, and the entity does not intend to use, the deferred tax asset for such purpose, the unrecognized tax benefit shall be presented in the financial statements as a liability and shall not be combined with deferred tax assets. The guidance is effective for fiscal years and interim periods within those years, beginning after December 15, 2013, and is to be applied prospectively to all unrecognized tax benefits that exist at the effective date. We do not expect that the adoption of this update will have a material effect on our consolidated financial statements.
Adopted Accounting Standards
Balance Sheet Offsetting Disclosures . In December 2011, the FASB issued ASU No. 2011-11, Disclosures about Offsetting Assets and Liabilities and in January 2013 the FASB issued ASU 2013-01, Clarifying the Scope of Disclosures about Offsetting Assets and Liabilities. The updates require new disclosures regarding balance sheet offsetting and related arrangements. For derivatives, repurchase agreements and reverse repurchase agreements, and securities borrowing and securities lending transactions, the updates require disclosure of gross asset and liability amounts, amounts offset on the balance sheet, and amounts subject to the offsetting requirements but not offset on the balance sheet. We adopted the guidance effective December 1, 2013, presenting the additional disclosures in our notes to consolidated financial statements. This guidance did not amend the existing guidance on when it is appropriate to offset; as a result, the adoption of this guidance did not affect our financial condition, results of operations or cash flows.
Accumulated Other Comprehensive Income. In February 2013, the FASB issued ASU No. 2013-02, Reporting of Amounts Reclassified Out of Accumulated Other Comprehensive Income. The guidance requires an entity to report the effect of significant reclassifications out of accumulated other comprehensive income on the respective line items in net income if the amount being reclassified is required under U.S. GAAP to be reclassified in its entirety to net income. For other amounts that are not required under U.S. GAAP to be reclassified in their entirety from accumulated other comprehensive income to net income in the same reporting period, an entity is required to cross-reference to other disclosures required under U.S. GAAP that provide additional detail about those amounts. We adopted the guidance effective March 1, 2013, presenting the additional disclosures within our Consolidated Statements of Changes in Equity. Adoption did not affect our results of operations, financial condition or cash flows.
Indefinite-Lived Intangible Asset Impairment. In July 2012, the FASB issued ASU No. 2012-02, Testing Indefinite-Lived Intangible Assets for Impairment. The guidance permits an entity to first assess qualitative factors to determine whether it is more likely than not that an indefinite-lived intangible asset, other than goodwill, is impaired as a basis for determining whether it is necessary to perform the quantitative impairment test. The update does not revise the requirement to test indefinite-lived intangible assets annually for impairment, or more frequently if deemed appropriate. The adoption of this guidance on December 1, 2012 did not affect our financial condition, results of operations or cash flows as it did not affect how impairment is calculated.
Goodwill Testing. In September 2011, the FASB issued ASU No. 2011-08, Testing Goodwill for Impairment. The update outlines amendments to the two step goodwill impairment test permitting an entity to first assess qualitative factors in determining whether it is more likely than not that the fair value of a reporting unit is less than its carrying amount as a basis for determining whether it is necessary to perform the two-step quantitative goodwill impairment test. We adopted this guidance on December 1, 2012, which did not change how goodwill impairment is calculated nor assigned to reporting units and therefore had no effect on our financial condition, results of operations or cash flows.
Comprehensive Income . In June 2011, the FASB issued ASU No. 2011-05, Presentation of Comprehensive Income. The update requires entities to report comprehensive income either (1) in a single continuous statement of comprehensive income or (2) in two separate but consecutive statements. We adopted the guidance on March 1, 2012, and elected the two separate but consecutive statements approach. Accordingly, we now present our Consolidated Statements of Comprehensive Income immediately following our Consolidated Statements of Earnings within our consolidated financial statements.
Fair Value Measurements and Disclosures. In May 2011, the FASB issued ASU No. 2011-04, Amendments to Achieve Common Fair Value Measurement and Disclosure Requirements in U.S. GAAP and IFRS. The amendments prohibit the use of blockage factors at all levels of the fair value hierarchy and provide guidance on measuring financial instruments that are managed on a net portfolio basis. Additional disclosure requirements include transfers between Levels 1 and 2; and for Level 3 fair value measurements, a description of our valuation processes and additional information about unobservable inputs impacting Level 3 measurements. We adopted this guidance on March 1, 2012 and have reflected the new disclosures in our consolidated financial statements. The adoption of this guidance did not have an impact on our financial condition, results of operations or cash flows.
Reconsideration of Effective Control for Repurchase Agreements. In April 2011, the FASB issued ASU No. 2011-03, Reconsideration of Effective Control for Repurchase Agreements. In assessing whether to account for repurchase and other agreements that both entitle and obligate the transferor to repurchase or redeem financial assets before their maturity as sales or as secured financing, this guidance removes from the assessment of effective control 1) the criterion requiring the transferor to have the ability to repurchase or redeem the financial assets on substantially the agreed terms and 2) the collateral maintenance implementation guidance related to that criterion.
80
The adoption of this guidance for transactions beginning on or after January 1, 2012 did not have an impact on our financial condition, results of operations or cash flows.
Note 4. Leucadia and Related Transactions
Leucadia Transaction
On March 1, 2013, Jefferies Group LLC completed a business combination with Leucadia and became a wholly-owned subsidiary of Leucadia as described in Note 1, Organization and Basis of Presentation. Each share of Jefferies Group Inc.'s common stock outstanding was converted into common shares of Leucadia at an Exchange Ratio of 0.81 of a Leucadia common share for each share of Jefferies Group, Inc. (the "Exchange Ratio"). Leucadia exchanged Jefferies Group, Inc.'s $125.0 million 3.25% Series A-1 Convertible Cumulative Preferred Stock for a new series of Leucadia $125.0 million 3.25% Cumulative Convertible Preferred Shares. In addition, each restricted share and restricted stock unit of Jefferies Group, Inc. common stock was converted at the Exchange Ratio, into an equivalent award of shares of Leucadia, with all such awards for Leucadia shares subject to the same terms and conditions, including, without limitation, vesting and, in the case of performance-based restricted stock units, performance being measured at existing targets.
Leucadia did not assume or guarantee any of our outstanding debt securities, but our 3.875% Convertible senior Debentures due 2029 with an aggregate principal amount of $345.0 million became convertible into common shares of Leucadia. Other than the conversion into Leucadia common shares, the terms of the debenture remain the same.
The Leucadia Transaction resulted in a change in our ownership and was recorded under the acquisition method of accounting by Leucadia and pushed-down to us by allocating the total purchase consideration of $4.8 billion to the cost of the assets acquired, including intangible assets, and liabilities assumed based on their estimated fair values. The excess of the total purchase price over the fair value of assets acquired and the liabilities assumed is recorded as goodwill. The goodwill arising from the Leucadia Transaction consists largely of our commercial potential and the value of our assembled workforce.
In connection with the Leucadia Transaction, we recognized $11.5 million, $2.1 million and $4.7 million in transaction costs during the nine months ended November 30, 2013, three months ended February 28, 2013, and the year ended November 30, 2012, respectively.
The summary computation of the purchase price and the fair values assigned to the assets and liabilities are presented as follows (in thousands except share amounts):
Purchase Price | ||||
Jefferies common stock outstanding | 205,368,031 | |||
Less: Jefferies common stock owned by Leucadia | (58,006,024 | ) | ||
|
| |||
Jefferies common stock acquired by Leucadia | 147,362,007 | |||
Exchange ratio | 0.81 | |||
|
| |||
Leucadia's shares issued (excluding for Jefferies shares held by Leucadia) | 119,363,226 | |||
Less: restricted shares issued for share-based payment awards (1) | (6,894,856 | ) | ||
|
| |||
Leucadia's shares issued, excluding share-based payment awards | 112,468,370 | |||
Closing price of Leucadia's common stock (2) | $ | 26.90 | ||
|
| |||
Fair value of common shares acquired by Leucadia | 3,025,399 | |||
Fair value of 3.25% cumulative convertible preferred shares (3) | 125,000 | |||
Fair value of shares-based payment awards (4) | 343,811 | |||
Fair value of Jefferies shares owned by Leucadia (5) | 1,259,891 | |||
|
| |||
Total purchase price | $ | 4,754,101 | ||
|
|
| (1) | Represents shares of restricted stock included in Jefferies common stock outstanding that contained a future service requirement at March 1, 2013. |
| (2) | The value of the shares of common stock exchanged with Jefferies shareholders was based upon the closing price of Leucadia's common stock at February 28, 2013, the last trading day prior to the date of acquisition. |
| (3) | Represents Leucadia's 3.25% Cumulative Convertible Preferred Shares issued in exchange for Jefferies Group, Inc.'s 3.25% Series A-1 Convertible Cumulative Preferred Stock. |
81
| (4) | The fair value of share-based payment awards is calculated in accordance with ASC 718, Compensation – Stock Compensation. Share-based payment awards attributable to pre-combination service are included as part of the total purchase price. Share-based payment awards attributable to pre-combination service is estimated based on the ratio of the pre-combination service performed to the original service period of the award. |
| (5) | The fair value of Jefferies shares owned by Leucadia was based upon a price of $21.72, the closing price of Jefferies common stock at February 28, 2013. |
Assets acquired: |
| |||
Cash and cash equivalents | $ | 3,017,958 | ||
Cash and securities segregated | 3,728,742 | |||
Financial instruments owned, at fair value | 16,413,535 | |||
Investments in managed funds | 59,976 | |||
Loans to and investments in related parties | 766,893 | |||
Securities borrowed | 5,315,488 | |||
Securities purchased under agreements to resell | 3,578,366 | |||
Securities received as collateral | 25,338 | |||
Receivables: | ||||
Brokers, dealers and clearing organizations | 2,444,085 | |||
Customers | 1,045,251 | |||
Fees, interest and other | 225,555 | |||
Premises and equipment | 192,603 | |||
Indefinite-lived intangible exchange memberships and licenses (1) | 15,551 | |||
Finite-lived intangible customer relationships (1) | 136,002 | |||
Finite-lived trade name (1) | 131,299 | |||
Other assets | 939,600 | |||
|
| |||
Total assets | $ | 38,036,242 | ||
|
| |||
Liabilities assumed: |
| |||
Short-term borrowings | $ | 100,000 | ||
Financial instruments sold, not yet purchased, at fair value | 9,766,876 | |||
Securities loaned | 1,902,687 | |||
Securities sold under agreements to repurchase | 7,976,492 | |||
Other secured financings | 122,294 | |||
Obligation to return securities received as collateral | 25,338 | |||
Payables: | ||||
Brokers, dealers and clearing organizations | 1,787,055 | |||
Customers | 5,450,781 | |||
Accrued expenses and other liabilities | 793,843 | |||
Long-term debt | 6,362,024 | |||
Mandatorily redeemable preferred interests | 358,951 | |||
|
| |||
Total liabilities | $ | 34,646,341 | ||
|
| |||
Noncontrolling interests | 356,180 | |||
|
| |||
Fair value of net assets acquired, excluding goodwill | $ | 3,033,721 | ||
|
| |||
Goodwill | $ | 1,720,380 | ||
|
| |||
| (1) | Intangible assets are recorded within Other assets on the Consolidated Statements of Financial Condition. |
The goodwill of $1.7 billion is not deductible for tax purposes.
Reorganization of Jefferies High Yield Holdings, LLC
On March 1, 2013, we commenced a reorganization of our high yield joint venture with Leucadia, conducted through Jefferies High Yield Holdings, LLC ("JHYH") (the parent of Jefferies High Yield Trading, LLC (our high yield trading broker-dealer)). On March 1, 2013, we redeemed the outstanding third party noncontrolling interests in JHYH of $347.6 million. On March 31, 2013, Leucadia contributed its mandatorily redeemable preferred interests in JHYH of $362.3 million to Jefferies Group LLC as member's equity. On April 1, 2013, we redeemed the mandatorily redeemable preferred interests in JHYH received from Leucadia. In addition, on April 1, 2013, our high yield trading broker-dealer was merged into Jefferies LLC (our U.S. securities broker-dealer).
82
Note 5. Acquisition
Hoare Govett
On February 1, 2012, we acquired the corporate broking business of Hoare Govett from RBS. Total cash consideration paid by us to RBS for the acquisition was £1. In addition, under the terms of the purchase agreement RBS agreed to pay us approximately £1.9 million towards retention payments made to certain employees, which constituted a reduction of the final purchase price. The business acquired represents the corporate broking business carried on under the name RBS Hoare Govett in the United Kingdom and comprised corporate broking advice and services, as well as certain equity sales and trading activities. The acquisition included the Hoare Govett trade name, domain name, client agreements and the exclusive right to carry on the business in succession to RBS.
We accounted for the acquisition under the acquisition method of accounting . Accordingly, the assets acquired, including identifiable intangible assets, and liabilities assumed were recorded at their respective fair values as of the date of acquisition. The fair values of the net assets acquired, including identifiable intangible assets, specifically the Hoare Govett trademark/trade name, was approximately $0.3 million, which exceeded the negative purchase price of $3.1 million (cash consideration paid of £1 less remittance from RBS of £1.9 million), resulting in a bargain purchase gain of approximately $3.4 million. The bargain purchase gain is included within Other revenues in the Consolidated Statement of Earnings for the year ended November 30, 2012 and is reported within the Capital Markets business segment. Approximately $0.4 million was recognized at the date of acquisition as the fair value of the Hoare Govett trade name. (See Note 12, Goodwill and Other Intangible Assets for further details.) Additionally, on February 1, 2012, we recognized a deferred tax liability of approximately $0.1 million, recorded within Accrued expenses and other liabilities on the Consolidated Statement of Financial Condition.
Our results of operations for the year ended November 30, 2012 include the results of operations of Hoare Govett for ten months for the period from February 1, 2012 to November 30, 2012. The acquisition closed on February 29, 2012.
Note 6. Fair Value Disclosures
The following is a summary of our financial assets and liabilities that are accounted for at fair value on a recurring basis at November 30, 2014 and November 30, 2013 by level within the fair value hierarchy (in thousands):
83
| November 30, 2014 | ||||||||||||||||||||
| Level 1(1) | Level 2(1) | Level 3 | Counterparty and Cash Collateral Netting (2) | Total | ||||||||||||||||
Assets: | ||||||||||||||||||||
Financial instruments owned: | ||||||||||||||||||||
Corporate equity securities | $ | 2,178,837 | $ | 226,441 | $ | 20,964 | $ | - | $ | 2,426,242 | ||||||||||
Corporate debt securities | - | 3,342,276 | 55,918 | - | 3,398,194 | |||||||||||||||
Collateralized debt obligations | - | 306,218 | 91,498 | - | 397,716 | |||||||||||||||
U.S. government and federal agency securities | 2,694,268 | 81,273 | - | - | 2,775,541 | |||||||||||||||
Municipal securities | - | 590,849 | - | - | 590,849 | |||||||||||||||
Sovereign obligations | 1,968,747 | 790,764 | - | - | 2,759,511 | |||||||||||||||
Residential mortgage-backed securities | - | 2,879,954 | 82,557 | - | 2,962,511 | |||||||||||||||
Commercial mortgage-backed securities | - | 966,651 | 26,655 | - | 993,306 | |||||||||||||||
Other asset-backed securities | - | 137,387 | 2,294 | - | 139,681 | |||||||||||||||
Loans and other receivables | - | 1,458,760 | 97,258 | - | 1,556,018 | |||||||||||||||
Derivatives | 65,145 | 5,046,278 | 54,190 | (4,759,345 | ) | 406,268 | ||||||||||||||
Investments at fair value | - | 73,152 | 95,389 | - | 168,541 | |||||||||||||||
Physical commodities | - | 62,234 | - | - | 62,234 | |||||||||||||||
|
|
|
|
|
|
|
|
|
| |||||||||||
Total financial instruments owned | $ | 6,906,997 | $ | 15,962,237 | $ | 526,723 | $ | (4,759,345 | ) | $ | 18,636,612 | |||||||||
|
|
|
|
|
|
|
| |||||||||||||
Cash and cash equivalents | $ | 4,079,968 | $ | - | $ | - | $ | - | $ | 4,079,968 | ||||||||||
Investments in managed funds | $ | - | $ | 19,383 | $ | 54,982 | $ | - | $ | 74,365 | ||||||||||
Cash and securities segregated and on deposit for regulatory purposes (3) | $ | 3,444,674 | $ | - | $ | - | $ | - | $ | 3,444,674 | ||||||||||
Securities received as collateral | $ | 5,418 | $ | - | $ | - | $ | - | $ | 5,418 | ||||||||||
|
| |||||||||||||||||||
Total Level 3 assets | $ | 581,705 | ||||||||||||||||||
|
| |||||||||||||||||||
Liabilities: | ||||||||||||||||||||
Financial instruments sold, not yet purchased: | ||||||||||||||||||||
Corporate equity securities | $ | 1,911,145 | $ | 74,681 | $ | 38 | $ | - | $ | 1,985,864 | ||||||||||
Corporate debt securities | - | 1,611,994 | 223 | - | 1,612,217 | |||||||||||||||
Collateralized debt obligations | - | 4,557 | - | - | 4,557 | |||||||||||||||
U.S. government and federal agency securities | 2,253,055 | - | - | - | 2,253,055 | |||||||||||||||
Sovereign obligations | 1,217,075 | 574,010 | - | - | 1,791,085 | |||||||||||||||
Loans | - | 856,525 | 14,450 | - | 870,975 | |||||||||||||||
Derivatives | 52,778 | 5,117,803 | 49,552 | (4,856,618 | ) | 363,515 | ||||||||||||||
|
|
|
|
|
|
|
|
|
| |||||||||||
Total financial instruments sold, not yet purchased | $ | 5,434,053 | $ | 8,239,570 | $ | 64,263 | $ | (4,856,618 | ) | $ | 8,881,268 | |||||||||
|
|
|
|
|
|
|
|
|
| |||||||||||
Obligation to return securities received as collateral | $ | 5,418 | $ | - | $ | - | $ | - | $ | 5,418 | ||||||||||
Other secured financings | $ | - | $ | - | $ | 30,825 | $ | - | $ | 30,825 | ||||||||||
Embedded conversion option | $ | - | $ | - | $ | 693 | $ | - | $ | 693 | ||||||||||
| (1) | As of December 1, 2013, equity options presented within Financial instruments owned and Financial instruments sold, not yet purchased of $6.1 million and $6.6 million, respectively, were transferred from Level 1 to Level 2 as adjustments were incorporated into the valuation approach for such contracts to estimate the point within the bid-ask range that meets the best estimate of fair value. |
| (2) | Represents counterparty and cash collateral netting across the levels of the fair value hierarchy for positions with the same counterparty. |
| (3) | Cash and securities segregated and on deposit for regulatory purposes include U.S. government securities with a fair value of $453.7 million and Commodities Futures Trading Commission ("CFTC") approved money market funds with a fair value of $545.0 million. |
84
| November 30, 2013 | ||||||||||||||||||||
| Level 1 (1) | Level 2 (1) | Level 3 | Counterparty and Cash Collateral Netting (2) | Total | ||||||||||||||||
Assets: | ||||||||||||||||||||
Financial instruments owned: | ||||||||||||||||||||
Corporate equity securities | $ | 1,913,220 | $ | 175,493 | $ | 9,884 | $ | - | $ | 2,098,597 | ||||||||||
Corporate debt securities | - | 2,957,102 | 25,666 | - | 2,982,768 | |||||||||||||||
Collateralized debt obligations | - | 182,095 | 37,216 | - | 219,311 | |||||||||||||||
U.S. government and federal agency securities | 2,293,221 | 40,389 | - | - | 2,333,610 | |||||||||||||||
Municipal securities | - | 664,054 | - | - | 664,054 | |||||||||||||||
Sovereign obligations | 1,458,803 | 889,685 | - | - | 2,348,488 | |||||||||||||||
Residential mortgage-backed securities | - | 2,932,268 | 105,492 | - | 3,037,760 | |||||||||||||||
Commercial mortgage-backed securities | - | 1,130,410 | 17,568 | - | 1,147,978 | |||||||||||||||
Other asset-backed securities | - | 55,475 | 12,611 | - | 68,086 | |||||||||||||||
Loans and other receivables | - | 1,203,238 | 145,890 | - | 1,349,128 | |||||||||||||||
Derivatives | 40,952 | 2,472,237 | 1,493 | (2,253,589 | ) | 261,093 | ||||||||||||||
Investments at fair value | - | 40 | 101,242 | - | 101,282 | |||||||||||||||
Physical commodities | - | 37,888 | - | - | 37,888 | |||||||||||||||
|
|
|
|
|
|
|
|
|
| |||||||||||
Total financial instruments owned | $ | 5,706,196 | $ | 12,740,374 | $ | 457,062 | $ | (2,253,589 | ) | $ | 16,650,043 | |||||||||
|
|
|
|
|
|
|
| |||||||||||||
Cash and cash equivalents | $ | 3,561,119 | $ | - | $ | - | $ | - | $ | 3,561,119 | ||||||||||
Investments in managed funds | $ | - | $ | - | $ | 57,285 | $ | - | $ | 57,285 | ||||||||||
Cash and securities segregated and on deposit for regulatory purposes (3) | $ | 3,616,602 | $ | - | $ | - | $ | - | $ | 3,616,602 | ||||||||||
Securities received as collateral | $ | 11,063 | $ | - | $ | - | $ | - | $ | 11,063 | ||||||||||
|
| |||||||||||||||||||
Total Level 3 assets | $ | 514,347 | ||||||||||||||||||
|
| |||||||||||||||||||
Liabilities: | ||||||||||||||||||||
Financial instruments sold, not yet purchased: | ||||||||||||||||||||
Corporate equity securities | $ | 1,782,903 | $ | 40,358 | $ | 38 | $ | - | $ | 1,823,299 | ||||||||||
Corporate debt securities | - | 1,346,078 | - | - | 1,346,078 | |||||||||||||||
U.S. government and federal agency securities | 1,324,326 | - | - | - | 1,324,326 | |||||||||||||||
Sovereign obligations | 1,360,269 | 471,088 | - | - | 1,831,357 | |||||||||||||||
Residential mortgage-backed securities | - | 34,691 | - | - | 34,691 | |||||||||||||||
Loans | - | 672,838 | 22,462 | - | 695,300 | |||||||||||||||
Derivatives | 43,829 | 2,480,463 | 8,398 | (2,352,611 | ) | 180,079 | ||||||||||||||
Physical commodities | - | 36,483 | - | - | 36,483 | |||||||||||||||
|
|
|
|
|
|
|
|
|
| |||||||||||
Total financial instruments sold, not yet purchased | $ | 4,511,327 | $ | 5,081,999 | $ | 30,898 | $ | (2,352,611 | ) | $ | 7,271,613 | |||||||||
|
|
|
|
|
|
|
|
|
| |||||||||||
Obligation to return securities received as collateral | $ | 11,063 | $ | - | $ | - | $ | - | $ | 11,063 | ||||||||||
Other secured financings | $ | - | $ | 31,000 | $ | 8,711 | $ | - | $ | 39,711 | ||||||||||
Embedded conversion option | $ | - | $ | - | $ | 9,574 | $ | - | $ | 9,574 | ||||||||||
| (1) | During the nine months ended November 30, 2013, we transferred listed equity options with a fair value of $403.0 million within Financial instruments owned and $423.0 million within Financial instruments sold, not yet purchased from Level 1 to Level 2 as adjustments to the exchange closing price are necessary to best reflect the fair value of the population at its exit price. |
| (2) | Represents counterparty and cash collateral netting across the levels of the fair value hierarchy for positions with the same counterparty. |
| (3) | Cash and securities segregated and on deposit for regulatory purposes include U.S. government securities with a fair value of $304.2 million. |
85
The following is a description of the valuation basis, including valuation techniques and inputs, used in measuring our financial assets and liabilities that are accounted for at fair value on a recurring basis:
Corporate Equity Securities
| • | Exchange Traded Equity Securities: Exchange-traded equity securities are measured based on quoted closing exchange prices, which are generally obtained from external pricing services, and are categorized within Level 1 of the fair value hierarchy, otherwise they are categorized within Level 2 or Level 3 of the fair value hierarchy. |
| • | Non-exchange Traded Equity Securities : Non-exchange traded equity securities are measured primarily using broker quotations, pricing data from external pricing services and prices observed for recently executed market transactions and are categorized within Level 2 of the fair value hierarchy. Where such information is not available, non-exchange traded equity securities are categorized within Level 3 of the fair value hierarchy and measured using valuation techniques involving quoted prices of or market data for comparable companies, similar company ratios and multiples ( e.g. , price/EBITDA, price/book value), discounted cash flow analyses and transaction prices observed for subsequent financing or capital issuance by the company. When using pricing data of comparable companies, judgment must be applied to adjust the pricing data to account for differences between the measured security and the comparable security ( e.g. , issuer market capitalization, yield, dividend rate, geographical concentration). |
| • | Equity warrants: Non-exchange traded equity warrants are generally categorized within Level 3 of the fair value hierarchy and are measured using the Black-Scholes model with key inputs impacting the valuation including the underlying security price, implied volatility, dividend yield, interest rate curve, strike price and maturity date. |
Corporate Debt Securities
| • | Corporate Bonds: Corporate bonds are measured primarily using pricing data from external pricing services and broker quotations, where available, prices observed for recently executed market transactions and bond spreads or credit default swap spreads of the issuer adjusted for basis differences between the swap curve and the bond curve. Corporate bonds measured using these valuation methods are categorized within Level 2 of the fair value hierarchy. If broker quotes, pricing data or spread data is not available, alternative valuation techniques are used including cash flow models incorporating interest rate curves, single name or index credit default swap curves for comparable issuers and recovery rate assumptions. Corporate bonds measured using alternative valuation techniques are categorized within Level 3 of the fair value hierarchy and comprise a limited portion of our corporate bonds. |
| • | High Yield Corporate and Convertible Bonds: A significant portion of our high yield corporate and convertible bonds are categorized within Level 2 of the fair value hierarchy and are measured primarily using broker quotations and pricing data from external pricing services, where available, and prices observed for recently executed market transactions of comparable size. Where pricing data is less observable, valuations are categorized within Level 3 and are based on pending transactions involving the issuer or comparable issuers, prices implied from an issuer's subsequent financings or recapitalizations, models incorporating financial ratios and projected cash flows of the issuer and market prices for comparable issuers. |
Collateralized Debt Obligations
Collateralized debt obligations are measured based on prices observed for recently executed market transactions of the same or similar security or based on valuations received from third party brokers or data providers and are categorized within Level 2 or Level 3 of the fair value hierarchy depending on the observability and significance of the pricing inputs. Valuation that is based on recently executed market transitions of similar securities incorporates additional review and analysis of pricing inputs and comparability criteria including but not limited to collateral type, tranche type, rating, origination year, prepayment rates, default rates, and severities.
86
U.S. Government and Federal Agency Securities
| • | U.S. Treasury Securities: U.S. Treasury securities are measured based on quoted market prices and categorized within Level 1 of the fair value hierarchy. |
| • | U.S. Agency Issued Debt Securities: Callable and non-callable U.S. agency issued debt securities are measured primarily based on quoted market prices obtained from external pricing services and are generally categorized within Level 1 or Level 2 of the fair value hierarchy. |
Municipal Securities
Municipal securities are measured based on quoted prices obtained from external pricing services and are generally categorized within Level 2 of the fair value hierarchy.
Sovereign Obligations
Foreign sovereign government obligations are measured based on quoted market prices obtained from external pricing services, where available, or recently executed independent transactions of comparable size. To the extent external price quotations are not available or recent transactions have not been observed, valuation techniques incorporating interest rate yield curves and country spreads for bonds of similar issuers, seniority and maturity are used to determine fair value of sovereign bonds or obligations. Foreign sovereign government obligations are classified in Level 1, 2 or Level 3 of the fair value hierarchy, primarily based on the country of issuance.
Residential Mortgage-Backed Securities
| • | Agency Residential Mortgage-Backed Securities: Agency residential mortgage-backed securities include mortgage pass-through securities (fixed and adjustable rate), collateralized mortgage obligations and interest-only and principal-only securities and are generally measured using market price quotations from external pricing services and categorized within Level 2 of the fair value hierarchy. |
| • | Agency Residential Interest-Only and Inverse Interest-Only Securities ("Agency Inverse IOs"): The fair value of agency inverse IOs is estimated using expected future cash flow techniques that incorporate prepayment models and other prepayment assumptions to amortize the underlying mortgage loan collateral. We use prices observed for recently executed transactions to develop market-clearing spread and yield curve assumptions. Valuation inputs with regard to the underlying collateral incorporate weighted average coupon, loan-to-value, credit scores, geographic location, maximum and average loan size, originator, servicer, and weighted average loan age. Agency inverse IOs are categorized within Level 2 or Level 3 of the fair value hierarchy. We also use vendor data in developing our assumptions, as appropriate. |
| • | Non-Agency Residential Mortgage-Backed Securities: Fair values are determined primarily using discounted cash flow methodologies and securities are categorized within Level 2 or Level 3 of the fair value hierarchy based on the observability and significance of the pricing inputs used. Performance attributes of the underlying mortgage loans are evaluated to estimate pricing inputs, such as prepayment rates, default rates and the severity of credit losses. Attributes of the underlying mortgage loans that affect the pricing inputs include, but are not limited to, weighted average coupon; average and maximum loan size; loan-to-value; credit scores; documentation type; geographic location; weighted average loan age; originator; servicer; historical prepayment, default and loss severity experience of the mortgage loan pool; and delinquency rate. Yield curves used in the discounted cash flow models are based on observed market prices for comparable securities and published interest rate data to estimate market yields. |
Commercial Mortgage-Backed Securities
| • | Agency Commercial Mortgage-Backed Securities: Government National Mortgage Association ("GNMA") project loans are measured based on inputs corroborated from and benchmarked to observed prices of recent securitization transactions of similar securities with adjustments incorporating an evaluation for various factors, including prepayment speeds, default rates, and cash flow structures as well as the likelihood of pricing levels in the current market environment. Federal National Mortgage Association ("FNMA") Delegated Underwriting and Servicing ("DUS") mortgage-backed securities are generally measured by using prices observed for recently executed market transactions to estimate market-clearing spread levels for purposes of estimating fair value. GNMA project loan bonds and FNMA DUS mortgage-backed securities are categorized within Level 2 of the fair value hierarchy. |
87
| • | Non-Agency Commercial Mortgage-Backed Securities: Non-agency commercial mortgage-backed securities are measured using pricing data obtained from external pricing services and prices observed for recently executed market transactions and are categorized within Level 2 and Level 3 of the fair value hierarchy. |
Other Asset-Backed Securities
Other asset-backed securities include, but are not limited to, securities backed by auto loans, credit card receivables and student loans and are categorized within Level 2 and Level 3 of the fair value hierarchy. Valuations are determined using pricing data obtained from external pricing services and prices observed for recently executed market transactions.
Loans and Other Receivables
| • | Corporate Loans: Corporate loans categorized within Level 2 of the fair value hierarchy are measured based on market price quotations where market price quotations from external pricing services are supported by market transaction data. Corporate loans categorized within Level 3 of the fair value hierarchy are measured based on market price quotations that are considered to be less transparent, market prices for debt securities of the same creditor, and estimates of future cash flow incorporating assumptions regarding creditor default and recovery rates and consideration of the issuer's capital structure. |
| • | Participation Certificates in Agency Residential Loans: Valuations of participation certificates in agency residential loans are based on observed market prices of recently executed purchases and sales of similar loans. The loan participation certificates are categorized within Level 2 of the fair value hierarchy given the observability and volume of recently executed transactions and availability of data provider pricing. |
| • | Project Loans and Participation Certificates in GNMA Project and Construction Loans: Valuations of participation certificates in GNMA project and construction loans are based on inputs corroborated from and benchmarked to observed prices of recent securitizations of assets with similar underlying loan collateral to derive an implied spread. Securitization prices are adjusted to estimate the fair value of the loans incorporating an evaluation for various factors, including prepayment speeds, default rates, and cash flow structures as well as the likelihood of pricing levels in the current market environment. The measurements are categorized within Level 2 of the fair value hierarchy given the observability and volume of recently executed transactions. |
| • | Consumer Loans and Funding Facilities: Consumer and small business whole loans and related funding facilities are valued based on observed market transactions incorporating additional valuation inputs including, but not limited to, delinquency and default rates, prepayment rates, borrower characteristics, loan risk grades and loan age. These assets are categorized within Level 2 or Level 3 of the fair value hierarchy. |
| • | Escrow and Trade Claim Receivables: Escrow and trade claim receivables are categorized within Level 3 of the fair value hierarchy where fair value is estimated based on reference to market prices and implied yields of debt securities of the same or similar issuers. Escrow and trade claim receivables are categorized within Level 2 of the fair value hierarchy where fair value is based on recent trade activity in the same security. |
Derivatives
| • | Listed Derivative Contracts: Listed derivative contracts that are actively traded are measured based on quoted exchange prices, which are generally obtained from external pricing services, and are categorized within Level 1 of the fair value hierarchy. Listed derivatives for which there is limited trading activity are measured based on incorporating the closing auction price of the underlying equity security, use similar valuation approaches as those applied to over-the-counter derivative contracts and are categorized within Level 2 of the fair value hierarchy. |
| • | OTC Derivative Contracts: Over-the-counter ("OTC") derivative contracts are generally valued using models, whose inputs reflect assumptions that we believe market participants would use in valuing the derivative in a current period transaction. Inputs to valuation models are appropriately calibrated to market data. For many OTC derivative contracts, the valuation models do not involve material subjectivity as the methodologies do not entail significant judgment and the inputs to valuation models do not involve a high degree of subjectivity as the valuation model inputs are readily observable or can be derived from actively quoted markets. OTC derivative contracts are primarily categorized within Level 2 of the fair value hierarchy given the observability and significance of the inputs to the valuation models. Where significant inputs to the valuation are unobservable, derivative instruments are categorized within Level 3 of the fair value hierarchy. |
88
OTC options include OTC equity, foreign exchange and commodity options measured using various valuation models, such as the Black-Scholes, with key inputs impacting the valuation including the underlying security, foreign exchange spot rate or commodity price, implied volatility, dividend yield, interest rate curve, strike price and maturity date. Discounted cash flow models are utilized to measure certain OTC derivative contracts including the valuations of our interest rate swaps, which incorporate observable inputs related to interest rate curves, valuations of our foreign exchange forwards and swaps, which incorporate observable inputs related to foreign currency spot rates and forward curves and valuations of our commodity swaps and forwards, which incorporate observable inputs related to commodity spot prices and forward curves. Credit default swaps include both index and single-name credit default swaps. External prices are available as inputs in measuring index credit default swaps and single-name credit default swaps. For commodity and equity total return swaps, market prices are observable for the underlying asset and used as the basis for measuring the fair value of the derivative contracts. Total return swaps executed on other underlyings are measured based on valuations received from external pricing services.
Physical Commodities
Physical commodities include base and precious metals and are measured using observable inputs including spot prices and published indices. Physical commodities are categorized within Level 2 of the fair value hierarchy. To facilitate the trading in precious metals we undertake leasing of such precious metals. The fees earned or paid for such leases are recorded as Principal transaction revenues on the Consolidated Statements of Earnings.
Investments at Fair Value and Investments in Managed Funds
Investments at fair value and Investments in managed funds include investments in hedge funds, fund of funds, private equity funds, convertible bond funds and commodity funds, which are measured at fair value based on the net asset value of the funds provided by the fund managers and are categorized within Level 2 or Level 3 of the fair value hierarchy. Investments at fair value also include direct equity investments in private companies, which are measured at fair value using valuation techniques involving quoted prices of or market data for comparable companies, similar company ratios and multiples ( e.g. , price/EBITDA, price/book value), discounted cash flow analyses and transaction prices observed for subsequent financing or capital issuance by the company. Direct equity investments in private companies are categorized within Level 2 or Level 3 of the fair value hierarchy. Additionally, investments at fair value include investments in insurance contracts relating to our defined benefit plan in Germany. Fair value for the insurance contracts is determined using a third party and is categorized within Level 3 of the fair value hierarchy.
89
The following tables present information about our investments in entities that have the characteristics of an investment company at November 30, 2014 and November 30, 2013 (in thousands):
| November 30, 2014 | ||||||||||
| Fair Value (1) | Unfunded Commitments | Redemption Frequency (if currently eligible) | ||||||||
Equity Long/Short Hedge Funds (2) | $ | 44,983 | $ | - | Monthly, Quarterly | |||||
High Yield Hedge Funds (3) | 204 | - | - | |||||||
Fund of Funds (4) | 323 | 94 | - | |||||||
Equity Funds (5) | 65,216 | 26,023 | - | |||||||
Convertible Bond Funds (6) | 3,355 | - | At Will | |||||||
|
|
|
| |||||||
Total (7) | $ | 114,081 | $ | 26,117 | ||||||
|
|
|
| |||||||
| November 30, 2013 | ||||||||||
| Fair Value (1) | Unfunded Commitments | Redemption Frequency (if currently eligible) | ||||||||
Equity Long/Short Hedge Funds (2) | $ | 20,927 | $ | - | Monthly, Quarterly | |||||
High Yield Hedge Funds (3) | 244 | - | - | |||||||
Fund of Funds (4) | 494 | 94 | - | |||||||
Equity Funds (5) | 66,495 | 40,816 | - | |||||||
Convertible Bond Funds (6) | 3,473 | - | At Will | |||||||
|
|
|
| |||||||
Total (7) | $ | 91,633 | $ | 40,910 | ||||||
|
|
|
| |||||||
| (1) | Where fair value is calculated based on net asset value, fair value has been derived from each of the funds' capital statements. |
| (2) | This category includes investments in hedge funds that invest, long and short, in equity securities in domestic and international markets in both the public and private sectors. At November 30, 2014 and November 30, 2013, investments representing approximately 99% and 98%, respectively, of the fair value of investments in this category are redeemable with 30-90 days prior written notice. |
| (3) | Includes investments in funds that invest in domestic and international public high yield debt, private high yield investments, senior bank loans, public leveraged equities, distressed debt, and private equity investments. There are no redemption provisions. The underlying assets of the funds are being liquidated and we are unable to estimate when the underlying assets will be fully liquidated. |
| (4) | Includes investments in fund of funds that invest in various private equity funds. At November 30, 2014 and November 30, 2013, approximately 95% and 98%, respectively, of the fair value of investments in this category are managed by us and have no redemption provisions, instead distributions are received through the liquidation of the underlying assets of the fund of funds, which are estimated to be liquidated in approximately two years. For the remaining investments we have requested redemption; however, we are unable to estimate when these funds will be received. |
| (5) | At November 30, 2014 and November 30, 2013, investments representing approximately 99% and 99%, respectively, of the fair value of investments in this category include investments in equity funds that invest in the equity of various U.S. and foreign private companies in the energy, technology, internet service and telecommunication service industries. These investments cannot be redeemed, instead distributions are received through the liquidation of the underlying assets of the funds which are expected to liquidate in one to eight years. The remaining investments are in liquidation and we are unable to estimate when the underlying assets will be fully liquidated. |
| (6) | This category represents an investment in the Jefferies Umbrella Fund, an open-ended investment company managed by us that invests primarily in convertible bonds. The investment is redeemable with five days prior written notice. |
| (7) | Investments at fair value in the Consolidated Statements of Financial Condition at November 30, 2014 and November 30, 2013 include $128.8 million and $66.9 million, respectively, of direct investments which do not have the characteristics of investment companies and therefore not included within this table. |
90
Other Secured Financings
Other secured financings that are accounted for at fair value include notes issued by consolidated VIEs, which are classified as Level 2 or Level 3 within the fair value hierarchy. Fair value is based on recent transaction prices for similar assets. In addition, at November 30, 2014 and November 30, 2013, Other secured financings includes $7.8 million and $8.7 million, respectively, related to transfers of loans accounted for as secured financings rather than as sales and classified as Level 3 within the fair value hierarchy.
Embedded Conversion Option
The embedded conversion option presented within long-term debt represents the fair value of the conversion option on Leucadia shares within our 3.875% Convertible Senior Debentures, due November 1, 2029 and categorized as Level 3 within the fair value hierarchy. The conversion option was valued using a convertible bond model using as inputs the price of Leucadia's common stock, the conversion strike price, 252-day historical volatility, a maturity date of November 1, 2017 (the first put date), dividend yield and the risk-free interest rate curve.
Pricing Information
At November 30, 2014 and November 30, 2013, our Financial instruments owned and Financial instruments sold, not yet purchased are measured using different valuation bases as follows:
| November 30, 2014 | November 30, 2013 | |||||||||||||||
| Financial Instruments Owned | Financial Instruments Sold, Not Yet Purchased | Financial Instruments Owned | Financial Instruments Sold, Not Yet Purchased | |||||||||||||
Exchange closing prices | 12 | % | 20 | % | 12 | % | 25 | % | ||||||||
Recently observed transaction prices | 4 | % | 2 | % | 5 | % | 4 | % | ||||||||
External pricing services | 71 | % | 69 | % | 68 | % | 66 | % | ||||||||
Broker quotes | 4 | % | 3 | % | 3 | % | 3 | % | ||||||||
Valuation techniques | 9 | % | 6 | % | 12 | % | 2 | % | ||||||||
|
|
|
|
|
|
|
| |||||||||
| 100 | % | 100 | % | 100 | % | 100 | % | |||||||||
|
|
|
|
|
|
|
| |||||||||
91
The following is a summary of changes in fair value of our financial assets and liabilities that have been categorized within Level 3 of the fair value hierarchy for the year ended November 30, 2014 (in thousands):
| Successor | ||||||||||||||||||||||||||||||||||||
| Year Ended November 30, 2014 | ||||||||||||||||||||||||||||||||||||
| Balance at November 30, 2013 | Total gains/ losses (realized and unrealized) (1) | Purchases | Sales | Settlements | Issuances | Net transfers into/(out of) Level 3 | Balance at November 30, 2014 | Change in unrealized gains/(losses) relating to instruments still held at November 30, 2014 (1) | ||||||||||||||||||||||||||||
Assets: | ||||||||||||||||||||||||||||||||||||
Financial instruments owned: | ||||||||||||||||||||||||||||||||||||
Corporate equity securities | $ | 9,884 | $ | 957 | $ | 18,138 | $ | (12,826 | ) | $ | - | $ | - | $ | 4,811 | $ | 20,964 | $ | 2,324 | |||||||||||||||||
Corporate debt securities | 25,666 | 2,456 | 62,933 | (51,094 | ) | - | - | 15,867 | 55,918 | 16,000 | ||||||||||||||||||||||||||
Collateralized debt obligations | 37,216 | (2,303 | ) | 179,720 | (170,991 | ) | (1,297 | ) | - | 49,153 | 91,498 | 8,159 | ||||||||||||||||||||||||
U.S government and federal agency securities | - | 13 | 2,505 | (2,518 | ) | - | - | - | - | - | ||||||||||||||||||||||||||
Residential mortgage-backed securities | 105,492 | (9,870 | ) | 42,632 | (61,689 | ) | (1,847 | ) | - | 7,839 | 82,557 | (4,679 | ) | |||||||||||||||||||||||
Commercial mortgage-backed securities | 17,568 | (4,237 | ) | 49,159 | (51,360 | ) | (782 | ) | - | 16,307 | 26,655 | (2,384 | ) | |||||||||||||||||||||||
Other asset-backed securities | 12,611 | 1,784 | 4,987 | (18,002 | ) | - | - | 914 | 2,294 | 1,484 | ||||||||||||||||||||||||||
Loans and other receivables | 145,890 | (31,311 | ) | 130,169 | (92,140 | ) | (60,390 | ) | - | 5,040 | 97,258 | (26,864 | ) | |||||||||||||||||||||||
Investments, at fair value | 101,242 | 16,522 | 34,993 | (46,315 | ) | (1,243 | ) | - | (9,810 | ) | 95,389 | 865 | ||||||||||||||||||||||||
Investments in managed funds | 57,285 | (13,541 | ) | 14,876 | (315 | ) | - | - | (3,323 | ) | 54,982 | (13,541 | ) | |||||||||||||||||||||||
Liabilities: | ||||||||||||||||||||||||||||||||||||
Financial instruments sold, not yet purchased: | ||||||||||||||||||||||||||||||||||||
Corporate equity securities | $ | 38 | $ | - | $ | - | $ | - | $ | - | $ | - | $ | - | $ | 38 | $ | - | ||||||||||||||||||
Corporate debt securities | - | (149 | ) | (565 | ) | 960 | - | - | (23 | ) | 223 | (8 | ) | |||||||||||||||||||||||
Net derivatives (2) | 6,905 | 15,055 | (24,682 | ) | 1,094 | 322 | - | (3,332 | ) | (4,638 | ) | (15,615 | ) | |||||||||||||||||||||||
Loans | 22,462 | - | (18,332 | ) | 11,338 | - | - | (1,018 | ) | 14,450 | - | |||||||||||||||||||||||||
Other secured financings | 8,711 | - | - | - | (17,525 | ) | 39,639 | - | 30,825 | - | ||||||||||||||||||||||||||
Embedded conversion option | 9,574 | (8,881 | ) | - | - | - | - | - | 693 | 8,881 | ||||||||||||||||||||||||||
| (1) | Realized and unrealized gains/losses are reported in Principal transaction revenues in the Consolidated Statements of Earnings. |
| (2) | Net derivatives represent Financial instruments owned-Derivatives and Financial instruments sold, not yet purchased-Derivatives. |
Analysis of Level 3 Assets and Liabilities for the Year Ended November 30, 2014
During the year ended November 30, 2014, transfers of assets of $145.0 million from Level 2 to Level 3 of the fair value hierarchy are primarily attributed to:
| • | Non-agency residential mortgage-backed securities of $30.3 million and commercial mortgage-backed securities of $16.6 million for which no recent trade activity was observed for purposes of determining observable inputs; |
| • | Loans and other receivables of $8.5 million due to a lower number of contributors comprising vendor quotes to support classification within Level 2; |
| • | Collateralized debt obligations of $49.6 million which have little to no transparency related to trade activity; |
| • | Corporate debt securities of $23.4 million, corporate equity securities of $9.7 million and investments at fair value of $5.8 million due to a lack of observable market transactions. |
During the year ended November 30, 2014, transfers of assets of $58.2 million from Level 3 to Level 2 are primarily attributed to:
| • | Non-agency residential mortgage-backed securities of $22.4 million for which market trades were observed in the period for either identical or similar securities; |
| • | Loans and other receivables of $3.5 million and investments at fair value of $15.6 million due to a greater number of contributors for certain vendor quotes supporting classification into Level 2; |
| • | Corporate equity securities of $4.9 million, corporate debt securities of $7.5 million and investments in managed funds $3.5 million due to an increase in observable market transactions. |
92
There were $1.0 million transfers of loan liabilities from Level 3 to Level 2 and $3.3 million transfers of net derivative liabilities from Level 3 to Level 2 due to an increase in observable inputs in the valuation and an increase in observable inputs used in the valuing of derivative contracts, respectively.
Net losses on Level 3 assets were $39.4 million and net losses on Level 3 liabilities were $6.0 million for the year ended November 30, 2014. Net losses on Level 3 assets were primarily due to a decrease in valuation of certain loans and other receivables, residential and commercial mortgage-backed securities and investments in managed funds, partially offset by increased valuations of certain investments at fair value and corporate debt securities. Net losses on Level 3 liabilities were primarily due to increased valuations of certain derivatives, partially offset by decreased valuations of the embedded conversion option.
The following is a summary of changes in fair value of our financial assets and liabilities that have been categorized within Level 3 of the fair value hierarchy for the nine months ended November 30, 2013 (in thousands):
| Successor | ||||||||||||||||||||||||||||||||||||
| Nine Months Ended November 30, 2013 | ||||||||||||||||||||||||||||||||||||
| Balance, February 28, 2013 | Total gains/losses (realized and unrealized) (1) | Purchases | Sales | Settlements | Issuances | Net transfers into/(out of) Level 3 | Balance, November 30, 2013 | Change in unrealized gains/ (losses) relating to instruments still held at November 30, 2013 (1) | ||||||||||||||||||||||||||||
Assets: | ||||||||||||||||||||||||||||||||||||
Financial instruments owned: | ||||||||||||||||||||||||||||||||||||
Corporate equity securities | $ | 13,234 | $ | 1,551 | $ | 3,583 | $ | (7,141 | ) | $ | - | $ | - | $ | (1,343 | ) | $ | 9,884 | $ | (419 | ) | |||||||||||||||
Corporate debt securities | 31,820 | (2,454 | ) | 31,014 | (34,125 | ) | - | - | (589 | ) | 25,666 | (2,749 | ) | |||||||||||||||||||||||
Collateralized debt obligations | 24,736 | (2,309 | ) | 45,437 | (32,874 | ) | - | - | 2,226 | 37,216 | (8,384 | ) | ||||||||||||||||||||||||
Residential mortgage-backed securities | 169,426 | (4,897 | ) | 89,792 | (150,807 | ) | (11,007 | ) | - | 12,985 | 105,492 | (6,932 | ) | |||||||||||||||||||||||
Commercial mortgage-backed securities | 17,794 | (4,469 | ) | 20,130 | (13,538 | ) | (100 | ) | - | (2,249 | ) | 17,568 | (3,794 | ) | ||||||||||||||||||||||
Other asset-backed securities | 1,292 | (4,535 | ) | 105,291 | (104,711 | ) | - | - | 15,274 | 12,611 | (3,497 | ) | ||||||||||||||||||||||||
Loans and other receivables | 170,986 | 15,008 | 287,757 | (115,231 | ) | (211,805 | ) | - | (825 | ) | 145,890 | 13,402 | ||||||||||||||||||||||||
Investments, at fair value | 75,067 | 1,678 | 28,594 | (102 | ) | (5,012 | ) | - | 1,017 | 101,242 | 1,705 | |||||||||||||||||||||||||
Investments in managed funds | 59,976 | 9,863 | 15,651 | (17 | ) | (28,188 | ) | - | - | 57,285 | 9,863 | |||||||||||||||||||||||||
Liabilities: | ||||||||||||||||||||||||||||||||||||
Financial instruments sold, not yet purchased: | ||||||||||||||||||||||||||||||||||||
Corporate equity securities | $ | 38 | $ | - | $ | - | $ | - | $ | - | $ | - | $ | - | $ | 38 | $ | - | ||||||||||||||||||
Residential mortgage-backed securities | 1,542 | (1,542 | ) | - | - | - | - | - | - | - | ||||||||||||||||||||||||||
Net derivatives (2) | 11,185 | 4,408 | - | (300 | ) | (8,515 | ) | - | 127 | 6,905 | 1,609 | |||||||||||||||||||||||||
Loans | 7,398 | 2,959 | (16,027 | ) | 28,065 | 67 | - | - | 22,462 | (2,970 | ) | |||||||||||||||||||||||||
Other secured financings | - | - | - | - | - | 8,711 | - | 8,711 | - | |||||||||||||||||||||||||||
Embedded conversion option (3) | 16,488 | (6,914 | ) | - | - | - | - | - | 9,574 | 6,914 | ||||||||||||||||||||||||||
| (1) | Realized and unrealized gains/losses are reported in Principal transaction revenues in the Consolidated Statements of Earnings. |
| (2) | Net derivatives represent Financial instruments owned – Derivatives and Financial instruments sold, not yet purchased – Derivatives. |
| (3) | The embedded conversion option of $16.5 million is at March 1, 2013, upon completion of the Leucadia Transaction (See Note 14.) |
93
Analysis of Level 3 Assets and Liabilities for the Nine Months Ended November 30, 2013
During the nine months ended November 30, 2013, transfers of assets of $82.4 million from Level 2 to Level 3 of the fair value hierarchy are attributed to:
| • | Non-agency residential mortgage-backed securities of $58.8 million and other asset-backed securities of $16.4 million for which no recent trade activity was observed for purposes of determining observable inputs; |
| • | Loans and other receivables of $0.8 million due to a lower number of contributors comprising vendor quotes to support classification within Level 2. |
| • | Corporate equity securities of $2.3 million, corporate debt securities of $0.2 million and investments at fair value of $1.0 million due to lack of observable market transactions; |
| • | Collateralized debt obligations of $2.8 million which have little to no transparency in trade activity; |
During the nine months ended November 30, 2013, transfers of assets of $55.9 million from Level 3 to Level 2 are attributed to:
| • | Non-agency residential mortgage-backed securities of $45.9 million, commercial mortgage-backed securities of $2.2 million and other asset-backed securities of $1.1 million for which market trades were observed in the period for either identical or similar securities; |
| • | Collateralized debt obligations of $0.6 million and loans and other receivables of $1.7 million due to a greater number of contributors for certain vendor quotes supporting classification into Level 2; |
| • | Corporate equity securities of $3.6 million and corporate debt securities of $0.8 million due to an increase in observable market transactions. |
During the nine months ended November 30, 2013, there were no transfers of liabilities from Level 2 to Level 3 and there were $0.1 million transfers of net derivative liabilities from Level 3 to Level 2 due to an increase in observable inputs used in the valuing of derivative contracts.
Net gains on Level 3 assets were $9.4 million and net losses on Level 3 liabilities were $1.1 million for the nine months ended November 30, 2013, respectively. Net gains on Level 3 assets were primarily due to increased valuations of certain corporate equity securities, loans and other receivables, investments at fair value and investments in managed funds, partially offset by a decrease in valuation of certain corporate debt securities, collateralized debt obligations, residential and commercial mortgage-backed securities and other asset-backed securities. Net losses on Level 3 liabilities were primarily due to increased valuations of certain derivative instruments and loan positions.
94
The following is a summary of changes in fair value of our financial assets and liabilities that have been categorized within Level 3 of the fair value hierarchy for the three months ended February 28, 2013 (in thousands):
| Predecessor | ||||||||||||||||||||||||||||||||
| Three Months Ended February 28, 2013 (1) | ||||||||||||||||||||||||||||||||
| Balance at November 30, 2012 | Total gains/ losses (realized and unrealized) (2) | Purchases | Sales | Settlements | Net transfers into/(out of) Level 3 | Balance at February 28, 2013 | Change in unrealized gains/(losses) relating to instruments still held at February 28, 2013 (2) | |||||||||||||||||||||||||
Assets: | ||||||||||||||||||||||||||||||||
Financial instruments owned: | ||||||||||||||||||||||||||||||||
Corporate equity securities | $ | 16,815 | $ | 200 | $ | 707 | $ | 109 | $ | - | $ | (4,597 | ) | $ | 13,234 | $ | 172 | |||||||||||||||
Corporate debt securities | 3,631 | 7,836 | 11,510 | (1,918 | ) | - | 10,761 | 31,820 | 7,833 | |||||||||||||||||||||||
Collateralized debt obligations | 31,255 | 3,584 | 4,406 | (17,374 | ) | - | 2,865 | 24,736 | (1,165 | ) | ||||||||||||||||||||||
Residential mortgage-backed securities | 156,069 | 11,906 | 132,773 | (130,143 | ) | (6,057 | ) | 4,878 | 169,426 | 4,511 | ||||||||||||||||||||||
Commercial mortgage-backed securities | 30,202 | (995 | ) | 2,280 | (2,866 | ) | (1,188 | ) | (9,639 | ) | 17,794 | (2,059 | ) | |||||||||||||||||||
Other asset-backed securities | 1,114 | 90 | 1,627 | (1,342 | ) | (19 | ) | (178 | ) | 1,292 | 39 | |||||||||||||||||||||
Loans and other receivables | 180,393 | (8,682 | ) | 105,650 | (29,828 | ) | (61,407 | ) | (15,140 | ) | 170,986 | (12,374 | ) | |||||||||||||||||||
Investments, at fair value | 83,897 | 961 | 5,952 | (4,923 | ) | (9,721 | ) | (1,099 | ) | 75,067 | 1,171 | |||||||||||||||||||||
Investments in managed funds | 57,763 | (363 | ) | 11,068 | - | (8,492 | ) | - | 59,976 | (363 | ) | |||||||||||||||||||||
Liabilities: | ||||||||||||||||||||||||||||||||
Financial instruments sold, not yet purchased: | ||||||||||||||||||||||||||||||||
Corporate equity securities | $ | 38 | $ | - | $ | - | $ | - | $ | - | $ | - | $ | 38 | $ | - | ||||||||||||||||
Residential mortgage-backed securities | - | 25 | (73,846 | ) | 75,363 | - | - | 1,542 | (19 | ) | ||||||||||||||||||||||
Net derivatives (3) | 9,188 | 2,648 | - | - | - | (651 | ) | 11,185 | (2,648 | ) | ||||||||||||||||||||||
Loans | 1,711 | - | (1,711 | ) | 7,398 | - | - | 7,398 | - | |||||||||||||||||||||||
| (1) | There were no issuances during the three months ended February 28, 2013. |
| (2) | Realized and unrealized gains/losses are reported in Principal transaction revenues in the Consolidated Statements of Earnings. |
| (3) | Net derivatives represent Financial instruments owned-Derivatives and Financial instruments sold, not yet purchased-Derivatives. |
Analysis of Level 3 Assets and Liabilities for the Three Months Ended February 28, 2013
During the three months ended February 28, 2013, transfers of assets of $100.5 million from Level 2 to Level 3 of the fair value hierarchy are attributed to:
| • | Non-agency residential mortgage-backed securities of $78.4 million and commercial mortgage-backed securities of $1.3 million for which no recent trade activity was observed for purposes of determining observable inputs; |
| • | Corporate debt securities of $10.8 million and corporate equity securities of $0.1 million due to lack of observable market transactions; |
| • | Collateralized debt obligations of $5.3 million which have little to no transparency in trade activity; |
| • | Loans and other receivables of $4.8 million due to a lower number of contributors comprising vendor quotes to support classification within Level 2. |
95
During the three months ended February 28, 2013, transfers of assets of $112.7 million from Level 3 to Level 2 are attributed to:
| • | Non-agency residential mortgage-backed securities of $73.5 million, commercial mortgage-backed securities of $10.9 million and $0.2 million of other asset-backed securities for which market trades were observed in the period for either identical or similar securities; |
| • | Loans and other receivables of $19.9 million and collateralized debt obligations of $2.4 million due to a greater number of contributors for certain vendor quotes supporting classification into Level 2; |
| • | Corporate equity securities of $4.7 million due to an increase in observable market transactions. |
During the three months ended February 28, 2013, there were no transfers of liabilities from Level 2 to Level 3 and there were $0.7 million transfers of net derivative liabilities from Level 3 to Level 2 due to an increase in observable significant inputs used in valuing the derivative contracts.
Net gains on Level 3 assets were $14.5 million and net losses on Level 3 liabilities were $2.7 million for the three months ended February 28, 2013. Net gains on Level 3 assets were primarily due to increased valuations of certain residential mortgage-backed securities, corporate debt securities, collateralized debt obligations and investments at fair value, partially offset by a decrease in valuation of certain loans and other receivables, commercial mortgage-backed securities and investments in managed funds. Net losses on Level 3 liabilities were primarily due to increased valuations of certain derivative instruments.
Quantitative Information about Significant Unobservable Inputs used in Level 3 Fair Value Measurements at November 30, 2014 and November 30, 2013
The tables below present information on the valuation techniques, significant unobservable inputs and their ranges for our financial assets and liabilities, subject to threshold levels related to the market value of the positions held, measured at fair value on a recurring basis with a significant Level 3 balance. The range of unobservable inputs could differ significantly across different firms given the range of products across different firms in the financial services sector. The inputs are not representative of the inputs that could have been used in the valuation of any one financial instrument ( i.e., the input used for valuing one financial instrument within a particular class of financial instruments may not be appropriate for valuing other financial instruments within that given class). Additionally, the ranges of inputs presented below should not be construed to represent uncertainty regarding the fair values of our financial instruments; rather the range of inputs is reflective of the differences in the underlying characteristics of the financial instruments in each category.
For certain categories, we have provided a weighted average of the inputs allocated based on the fair values of the financial instruments comprising the category. We do not believe that the range or weighted average of the inputs is indicative of the reasonableness of uncertainty of our Level 3 fair values. The range and weighted average are driven by the individual financial instruments within each category and their relative distribution in the population. The disclosed inputs when compared with the inputs as disclosed in other periods should not be expected to necessarily be indicative of changes in our estimates of unobservable inputs for a particular financial instrument as the population of financial instruments comprising the category will vary from period to period based on purchases and sales of financial instruments during the period as well as transfers into and out of Level 3 each period.
96
November 30, 2014 | ||||||||||||||
Financial Instruments Owned | Fair Value (in thousands) | Valuation Technique | Significant Unobservable Input(s) | Input / Range | Weighted Average | |||||||||
Corporate equity securities | $ | 19,814 | ||||||||||||
Non-exchange traded securities | Market approach | EBITDA (a) multiple | 3.4 to 4.7 | 3.6 | ||||||||||
| Scenario analysis | Estimated recovery percentage | 24% | - | |||||||||||
|
|
|
| |||||||||||
Corporate debt securities | $ | 22,766 | Convertible bond model | Discount rate/yield | 32% | - | ||||||||
|
|
|
| |||||||||||
Collateralized debt obligations | $ | 41,784 | Discounted cash flows | Constant prepayment rate | 0% to 20% | 13 | % | |||||||
| Constant default rate | 0% to 2% | 2 | % | |||||||||||
| Loss severity | 0% to 70% | 39 | % | |||||||||||
| Yield | 2% to 51% | 16 | % | |||||||||||
|
|
|
| |||||||||||
Residential mortgage-backed securities | $ | 82,557 | Discounted cash flows | Constant prepayment rate | 1% to 50% | 13 | % | |||||||
| Constant default rate | 1% to 100% | 14 | % | |||||||||||
| Loss severity | 20% to 80% | 50 | % | |||||||||||
| Yield | 3% to 13% | 7 | % | |||||||||||
|
|
|
| |||||||||||
Commercial mortgage-backed securities | $ | 26,655 | Discounted cash flows | Yield | 8% to 12% | 11 | % | |||||||
| Cumulative loss rate | 4% to 72% | 15 | % | |||||||||||
| Scenario analysis | Estimated recovery percentage | 90% | - | |||||||||||
|
|
|
| |||||||||||
Other asset-backed securities | $ | 2,294 | Discounted cash flows | Constant prepayment rate | 8% | - | ||||||||
| Constant default rate | 3% | - | ||||||||||||
| Loss severity | 70% | - | ||||||||||||
| Yield | 7% | - | ||||||||||||
|
|
|
| |||||||||||
Loans and other receivables | $ | 88,154 | Comparable pricing | Comparable loan price | $100 to $101 | $ | 100.3 | |||||||
| Market approach | Yield | 3% to 5% | 4 | % | ||||||||||
| EBITDA (a) multiple | 3.4 to 8.2 | 7.6 | ||||||||||||
| Scenario analysis | Estimated recovery percentage | 10% to 41% | 36 | % | ||||||||||
|
|
|
| |||||||||||
Derivatives | $ | 54,190 | ||||||||||||
Foreign exchange options | Option model | Volatility | 13% to 23% | 17 | % | |||||||||
Commodity forwards | Discounted cash flows | Discount rate | 17% | - | ||||||||||
Loan commitments | Comparable pricing | Comparable loan price | $100 | - | ||||||||||
|
|
|
| |||||||||||
Investments at fair value | $ | 8,500 | ||||||||||||
Private equity securities | Market approach | Transaction Level | $50 | - | ||||||||||
|
|
|
| |||||||||||
Liabilities | Fair Value (in thousands) | Valuation Technique | Significant Unobservable Input(s) | Input / Range | Weighted Average | |||||||||
Financial Instruments Sold, Not Yet Purchased: |
| |||||||||||||
Derivatives | $ | 49,552 | ||||||||||||
FX options | Option model | Volatility | 13% to 23% | 17 | % | |||||||||
Unfunded commitment | Comparable pricing | Comparable loan price | $89 to $100 | $ | 92.0 | |||||||||
| Credit spread | 45bps | - | ||||||||||||
| Market approach | Yield | 5% | - | |||||||||||
|
|
|
| |||||||||||
Loans and other receivables | $ | 14,450 | Comparable pricing | Comparable loan price | $100 | - | ||||||||
|
|
|
| |||||||||||
Other secured financings | $ | 30,825 | Comparable pricing | Comparable loan price | $81-$100 | $ | 98.7 | |||||||
|
|
|
| |||||||||||
Embedded conversion option | $ | 693 | Option valuation model | Historical volatility | 18.9% | - | ||||||||
|
|
|
| |||||||||||
| (a) | Earnings before interest, taxes, depreciation and amortization ("EBITDA"). |
97
November 30, 2013 | ||||||||||||||
Financial Instruments Owned | Fair Value (in thousands) | Valuation Technique | Significant Unobservable Input(s) | Input / Range | Weighted Average | |||||||||
Corporate equity securities | $ | 8,034 | ||||||||||||
Non-exchange traded securities | Market approach | EBITDA multiple | 4.0 to 5.5 | 4.53 | ||||||||||
Warrants | Option model | Volatility | 36% | - | ||||||||||
|
|
|
| |||||||||||
Corporate debt securities | $ | 17,699 | Scenario analysis | Estimated recovery percentage | 24% | - | ||||||||
| Comparable pricing | Comparable bond or loan price | $69.10 to $70.50 | $ | 69.91 | ||||||||||
| Market approach | Yield | 13% | - | |||||||||||
|
|
|
| |||||||||||
Collateralized debt obligations | $ | 34,316 | Discounted cash flows | Constant prepayment rate | 0% to 20% | 13 | % | |||||||
| Constant default rate | 2% to 3% | 2 | % | |||||||||||
| Loss severity | 30% to 85% | 38 | % | |||||||||||
| Yield | 3% to 91% | 28 | % | |||||||||||
|
|
|
| |||||||||||
Residential mortgage-backed securities | $ | 105,492 | Discounted cash flows | Constant prepayment rate | 2% to 50% | 11 | % | |||||||
| Constant default rate | 1% to 100% | 17 | % | |||||||||||
| Loss severity | 30% to 90% | 48 | % | |||||||||||
| Yield | 0% to 20% | 7 | % | |||||||||||
|
|
|
| |||||||||||
Commercial mortgage-backed securities | $ | 17,568 | Discounted cash flows | Yield | 12% to 20% | 14 | % | |||||||
| Cumulative loss rate | 5% to 28.2% | 11 | % | |||||||||||
|
|
|
| |||||||||||
Other asset-backed securities | $ | 12,611 | Discounted cash flows | Constant prepayment rate | 4% to 30% | 17 | % | |||||||
| Constant default rate | 2% to 11% | 7 | % | |||||||||||
| Loss severity | 40% to 92% | 64 | % | |||||||||||
| Yield | 3% to 29% | 18 | % | |||||||||||
|
|
|
| |||||||||||
Loans and other receivables | $ | 101,931 | Comparable pricing | Comparable bond or loan price | $91 to $101 | $ | 98.90 | |||||||
| Market approach | Yield | 8.75% to 13.5% | 10 | % | ||||||||||
| EBITDA (a) multiple | 6.9 | - | ||||||||||||
| Scenario analysis | Estimated recovery percentage | 16.9% to 92% | 74 | % | ||||||||||
|
|
|
| |||||||||||
Derivatives | ||||||||||||||
Loan commitments | $ | 1,493 | Comparable pricing | Comparable bond or loan price | $100.875 | - | ||||||||
|
|
|
| |||||||||||
Investments at fair value | ||||||||||||||
Private equity securities | $ | 30,203 | Comparable pricing | Comparable share price | $414 | - | ||||||||
| Market approach | Discount rate | 15% to 30% | 23 | % | ||||||||||
|
|
|
| |||||||||||
Liabilities | Fair Value (in thousands) | Valuation Technique | Significant Unobservable Input(s) | Input / Range | Weighted Average | |||||||||
Financial Instruments Sold, Not Yet Purchased: |
| |||||||||||||
Derivatives | ||||||||||||||
Equity options | $ | 8,398 | Option model | Volatility | 36.25% to 41% | 39 | % | |||||||
|
|
|
| |||||||||||
Loans | $ | 8,106 | Comparable pricing | Comparable bond or loan price | $101.88 | - | ||||||||
|
|
|
| |||||||||||
Other secured financings | $ | 8,711 | Comparable pricing | Comparable loan price | $99-$103 | $ | 101.7 | |||||||
|
|
|
| |||||||||||
Embedded conversion option | $ | 9,574 | Option valuation model | Historical volatility | 22.55% | - | ||||||||
|
|
|
| |||||||||||
The fair values of certain Level 3 assets and liabilities that were determined based on third-party pricing information, unadjusted past transaction prices, reported net asset value or a percentage of the reported enterprise fair value are excluded from the above tables. At November 30, 2014 and November 30, 2013, asset exclusions consisted of $180.0 million and $127.7 million, respectively, primarily comprised of investments in non-exchange traded securities, private equity securities, investments in reinsurance contracts, derivatives and certain corporate loans. At November 30, 2014, liability exclusions consisted of $0.3 million comprised of corporate equity and debt securities. At November 30, 2013, liability exclusions consisted of $14.4 million of corporate loan commitments.
Sensitivity of Fair Values to Changes in Significant Unobservable Inputs
For recurring fair value measurements categorized within Level 3 of the fair value hierarchy, the sensitivity of the fair value measurement to changes in significant unobservable inputs and interrelationships between those unobservable inputs (if any) are described below:
| • | Private equity securities, corporate debt securities, other asset-backed securities, loans and other receivables and loan commitments using comparable pricing valuation techniques. A significant increase (decrease) in the comparable share, bond or loan price in isolation would result in a significant higher (lower) fair value measurement. |
98
| • | Non-exchange traded securities and loans and other receivables using a market approach valuation technique. A significant increase (decrease) in the EBITDA or other multiples in isolation would result in a significantly higher (lower) fair value measurement. A significant increase (decrease) in the yield of a corporate debt security, loan and other receivable would result in a significantly lower (higher) fair value measurement. A significant increase (decrease) in the discount rate of a private equity security would result in a significantly lower (higher) fair value measurement. |
| • | Corporate debt securities and loans and other receivables using scenario analysis. A significant increase (decrease) in the possible recovery rates of the cash flow outcomes underlying the investment would result in a significantly higher (lower) fair value measurement for the financial instrument. |
| • | Collateralized debt obligations, residential and commercial mortgage-backed securities and other asset-backed securities using a discounted cash flow valuation technique. A significant increase (decrease) in isolation in the constant default rate, and loss severities or cumulative loss rate would result in a significantly lower (higher) fair value measurement. The impact of changes in the constant prepayment rate would have differing impacts depending on the capital structure of the security. A significant increase (decrease) in the loan or bond yield would result in a significant lower (higher) fair value measurement. |
| • | Derivative equity options and equity warrants using an option model. A significant increase (decrease) in volatility would result in a significant higher (lower) fair value measurement. |
| • | Private equity securities using a net asset value technique. A significant increase (decrease) in the discount applied to net asset value would result in a significant (lower) higher fair value measurement. |
Fair Value Option Election
We have elected the fair value option for all loans and loan commitments made by our capital markets businesses. These loans and loan commitments include loans entered into by our investment banking division in connection with client bridge financing and loan syndications, loans purchased by our leveraged credit trading desk as part of its bank loan trading activities and mortgage loan commitments and fundings in connection with mortgage- and other asset-backed securitization activities. Loans and loan commitments originated or purchased by our leveraged credit and mortgage-backed businesses are managed on a fair value basis. Loans are included in Financial instruments owned and loan commitments are included in Financial instruments owned-Derivatives and Financial instruments sold, not yet purchased-Derivatives on the Consolidated Statements of Financial Condition. The fair value option election is not applied to loans made to affiliate entities as such loans are entered into as part of ongoing, strategic business ventures. Loans to affiliate entities are included within Loans to and investments in related parties on the Consolidated Statements of Financial Condition and are accounted for on an amortized cost basis. We have elected the fair value option for our investment in Knight Capital, which is included in Financial Instruments owned – Corporate equity securities on the Consolidated Statement of Financial Condition. (See Note 11, Investments for further details regarding our investment in Knight Capital.) We have also elected the fair value option for certain financial instruments held by subsidiaries as the investments are risk managed by us on a fair value basis. The fair value option has also been elected for certain secured financings that arise in connection with our securitization activities and other structured financings. Other secured financings, Receivables-Brokers, dealers and clearing organizations, Receivables-Customers, Receivables-Fees, interest and other, Payables-Brokers, dealers and clearing organizations and Payables-Customers are accounted for at cost plus accrued interest rather than at fair value; however, the recorded amounts approximate fair value due to their liquid or short-term nature.
99
The following is a summary of gains (losses) due to changes in instrument specific credit risk on loans and other receivables and loan commitments measured at fair value under the fair value option (in thousands):
| Successor | Predecessor | |||||||||||||||||
| Year Ended | Nine Months Ended | Three Months Ended | Year Ended | |||||||||||||||
| November 30, 2014 | November 30, 2013 | February 28, 2013 | November 30, 2012 | |||||||||||||||
Financial Instruments Owned: | ||||||||||||||||||
Loans and other receivables | $ | (24,785 | ) | $ | 15,327 | $ | 3,924 | $ | 24,547 | |||||||||
Financial Instruments Sold: | ||||||||||||||||||
Loans | $ | (585 | ) | $ | (32 | ) | $ | - | $ | (55 | ) | |||||||
Loan commitments | (15,459 | ) | (1,007 | ) | (2,746 | ) | (7,155 | ) | ||||||||||
The following is a summary of the amount by which contractual principal exceeds fair value for loans and other receivables measured at fair value under the fair value option (in thousands):
| November 30, 2014 | November 30, 2013 | |||||||
Financial Instruments Owned: | ||||||||
Loans and other receivables (1) | $ | 403,119 | $ | 264,896 | ||||
Loans and other receivables greater than 90 days past due (1) | 5,594 | - | ||||||
Loans and other receivables on nonaccrual status (1)(2) | (22,360 | ) | - | |||||
| (1) | Interest income is recognized separately from other changes in fair value and is included within Interest revenues on the Consolidated Statements of Earnings. |
| (2) | Amount includes all loans and other receivables greater than 90 or more days past due. |
The aggregate fair value of loans and other receivables that were 90 or more days past due was $-0- million and $-0- at November 30, 2014 and November 30, 2013, respectively.
The aggregate fair value of loans and other receivables on nonaccrual status, which includes all loans and other receivables greater than 90 or more days past due, was $274.6 million at November 30, 2014. There were no loan receivables on nonaccrual status at November 30, 2013.
Assets and Liabilities Measured at Fair Value on a Non-recurring Basis
Certain assets were measured at fair value on a non-recurring basis and are not included in the tables above. These assets include goodwill and intangible assets. The following table presents those assets measured at fair value on a non-recurring basis for which the Company recognized a non-recurring fair value adjustment during the year ended November 30, 2014 (in thousands):
| Carrying Value at November 30, 2014 | Level 2 | Level 3 | Impairment Losses for the Year Ended November 30, 2014 | |||||||||||||
Futures Reporting Unit (1): | ||||||||||||||||
Goodwill (2) | $ | - | $ | - | $ | - | $ | 51,900 | ||||||||
Intangible assets (3) | - | - | - | 7,534 | ||||||||||||
Exchange ownership interests (4) | 5,608 | 5,608 | - | 178 | ||||||||||||
International Asset Management Reporting Unit (5): | ||||||||||||||||
Goodwill (6) | $ | - | $ | - | $ | - | $ | 2,100 | ||||||||
Intangible assets (7) | - | - | - | 60 | ||||||||||||
| (1) | Given management's decision to pursue strategic alternatives for our Futures business, including possible disposal, as a result of recent operating performance and margin challenges experienced by the business, an impairment analysis of the carrying amounts of goodwill, intangible assets and certain other assets employed directly by the business was performed at November 30, 2014. (See Note 12, Goodwill and Other Intangible Assets.) |
100
| (2) | An impairment loss for goodwill allocated to our Futures business with a carrying amount of $51.9 million was recognized for the year ended November 30, 2014. The fair value of the Futures business was estimated 1) by comparison to similar companies using publicly traded price-to-tangible book multiples as the basis for valuation and 2) by utilizing a discounted cash flow methodology based on internally developed forecasts of profitability and an appropriate risk-adjusted discount rate. |
| (3) | Intangible assets relate primarily to customer relationship intangibles. An impairment loss for customer relationships within our Futures business with a carrying amount of $7.5 million was recognized in Other expenses for the year ended November 30, 2014. Fair value was estimated utilizing a discounted cash flow methodology based on projected future cash flows and operating margins and an appropriate risk-adjusted discount rate. |
| (4) | Exchange memberships, which represent ownership interests in market exchanges on which trading business is conducted, were written down to their fair value during the year ended November 30, 2014 resulting in impairment losses of $0.2 million recognized in Other expenses. The fair value of these exchange memberships is based on observed quoted sales prices for each individual membership. |
| (5) | Given management's decision to liquidate our International Asset Management business, an impairment analysis of the carrying amounts of goodwill, intangible assets and certain other assets employed directly by the business was performed at November 30, 2014. (See Note 12, Goodwill and Other Intangible Assets.) |
| (6) | An impairment loss for goodwill allocated to our International Asset Management business with a carrying amount of $2.1 million was recognized for the year ended November 30, 2014. Fair value was estimated by utilizing a discounted cash flow methodology based on internally developed forecasts of profitability and an appropriate risk-adjusted discount rate. |
| (7) | Intangible assets relate to customer relationship intangibles. Impairment losses of $0.1 million were recognized in Other expenses for the year ended November 30, 2014. Fair values were estimated utilizing a discounted cash flow methodology based on projected future cash flows and operating margins and an appropriate risk-adjusted discount rate. |
There were no assets measured at fair value on a non-recurring basis, which utilized Level 1 inputs during the year ended November 30, 2014. There were no liabilities measured at fair value on a non-recurring basis during the year ended November 30, 2014. There were no significant assets or liabilities measured at fair value on a non-recurring basis during the nine months ended November 30, 2013, the three months ended February 28, 2013 and the year ended November 30, 2012.
Note 7. Derivative Financial Instruments
Off-Balance Sheet Risk
We have contractual commitments arising in the ordinary course of business for securities loaned or purchased under agreements to resell, repurchase agreements, future purchases and sales of foreign currencies, securities transactions on a when-issued basis and underwriting. Each of these financial instruments and activities contains varying degrees of off-balance sheet risk whereby the fair values of the securities underlying the financial instruments may be in excess of, or less than, the contract amount. The settlement of these transactions is not expected to have a material effect upon our consolidated financial statements.
Derivative Financial Instruments
Our derivative activities are recorded at fair value in the Consolidated Statements of Financial Condition in Financial instruments owned – derivatives and Financial instruments sold, not yet purchased – derivatives net of cash paid or received under credit support agreements and on a net counterparty basis when a legally enforceable right to offset exists under a master netting agreement. Net realized and unrealized gains and losses are recognized in Principal transaction revenues in the Consolidated Statements of Earnings on a trade date basis and as a component of cash flows from operating activities in the Consolidated Statements of Cash Flows. Acting in a trading capacity, we may enter into derivative transactions to satisfy the needs of our clients and to manage our own exposure to market and credit risks resulting from our trading activities. (See Note 6, Fair Value Disclosures and Note 22, Commitments, Contingencies and Guarantees for additional disclosures about derivative financial instruments.)
101
Derivatives are subject to various risks similar to other financial instruments, including market, credit and operational risk. The risks of derivatives should not be viewed in isolation, but rather should be considered on an aggregate basis along with our other trading-related activities. We manage the risks associated with derivatives on an aggregate basis along with the risks associated with proprietary trading as part of our firm wide risk management policies.
In connection with our derivative activities, we may enter into International Swaps and Derivative Association, Inc. ("ISDA") master netting agreements or similar agreements with counterparties. A master agreement creates a single contract under which all transactions between two counterparties are executed allowing for trade aggregation and a single net payment obligation. Master agreements provide protection in bankruptcy in certain circumstances and, where legally enforceable, enable receivables and payables with the same counterparty to be settled or otherwise eliminated by applying amounts due against all or a portion of an amount due from the counterparty or a third party. In addition, we enter into customized bilateral trading agreements and other customer agreements that provide for the netting of receivables and payables with a given counterparty as a single net obligation.
Under our ISDA master netting agreements, we typically also execute credit support annexes, which provide for collateral, either in the form of cash or securities, to be posted by or paid to a counterparty based on the fair value of the derivative receivable or payable based on the rates and parameters established in the credit support annex. In the event of the counterparty's default, provisions of the master agreement permit acceleration and termination of all outstanding transactions covered by the agreement such that a single amount is owed by, or to, the non-defaulting party. In addition, any collateral posted can be applied to the net obligations, with any excess returned; and the collateralized party has a right to liquidate the collateral. Any residual claim after netting is treated along with other unsecured claims in bankruptcy court.
The conditions supporting the legal right of offset may vary from one legal jurisdiction to another and the enforceability of master netting agreements and bankruptcy laws in certain countries or in certain industries is not free from doubt. The right of offset is dependent both on contract law under the governing arrangement and consistency with the bankruptcy laws of the jurisdiction where the counterparty is located. Industry legal opinions with respect to the enforceability of certain standard provisions in respective jurisdictions are relied upon as a part of managing credit risk. In cases where we have not determined an agreement to be enforceable, the related amounts are not offset. Master netting agreements are a critical component of our risk management processes as part of reducing counterparty credit risk and managing liquidity risk.
We are also a party to clearing agreements with various central clearing parties. Under these arrangements, the central clearing counterparty facilitates settlement between counterparties based on the net payable owed or receivable due and, with respect to daily settlement, cash is generally only required to be deposited to the extent of the net amount. In the event of default, a net termination amount is determined based on the market values of all outstanding positions and the clearing organization or clearing member provides for the liquidation and settlement of the net termination amount among all counterparties to the open derivative contracts.
The following tables present the fair value and related number of derivative contracts at November 30, 2014 and November 30, 2013 categorized by type of derivative contract and the platform on which these derivatives are transacted. The fair value of assets/liabilities represents our receivable/payable for derivative financial instruments, gross of counterparty netting and cash collateral received and pledged. (See Note 8, Collateralized Transactions, for information related to offsetting of certain secured financing transactions.) The following tables also provide information regarding 1) the extent to which, under enforceable master netting arrangements, such balances are presented net in the Consolidated Statements of Financial Condition as appropriate under GAAP and 2) the extent to which other rights of setoff associated with these arrangements exist and could have an effect on our financial position (in thousands, except contract amounts).
102
| November 30, 2014 (1) | ||||||||||||||||
| Assets | Liabilities | |||||||||||||||
| Fair Value | Number of Contracts | Fair Value | Number of Contracts | |||||||||||||
Interest rate contracts | ||||||||||||||||
Exchange-traded | $ | 2,450 | 67,437 | $ | 1,400 | 87,008 | ||||||||||
Cleared OTC | 1,425,375 | 2,160 | 1,481,329 | 2,124 | ||||||||||||
Bilateral OTC | 871,982 | 1,908 | 809,962 | 729 | ||||||||||||
Foreign exchange contracts | ||||||||||||||||
Exchange-traded | - | 1,562 | - | 1,821 | ||||||||||||
Bilateral OTC | 1,514,881 | 11,299 | 1,519,349 | 10,931 | ||||||||||||
Equity contracts | ||||||||||||||||
Exchange-traded | 1,011,101 | 2,269,044 | 987,531 | 2,049,513 | ||||||||||||
Bilateral OTC | 39,889 | 2,463 | 70,484 | 1,956 | ||||||||||||
Commodity contracts | ||||||||||||||||
Exchange-traded | 62,091 | 1,027,542 | 51,145 | 1,015,894 | ||||||||||||
Bilateral OTC | 214,635 | 4,026 | 252,061 | 4,524 | ||||||||||||
Credit contracts | ||||||||||||||||
Cleared OTC | 17,831 | 27 | 23,264 | 22 | ||||||||||||
Bilateral OTC | 5,378 | 18 | 23,608 | 27 | ||||||||||||
|
|
|
| |||||||||||||
Total gross derivative assets/ liabilities: | ||||||||||||||||
Exchange-traded | 1,075,642 | 1,040,076 | ||||||||||||||
Cleared OTC | 1,443,206 | 1,504,593 | ||||||||||||||
Bilateral OTC | 2,646,765 | 2,675,464 | ||||||||||||||
Amounts offset in the Consolidated Statements of Financial Condition (2): | ||||||||||||||||
Exchange-traded | (1,038,992 | ) | (1,038,992 | ) | ||||||||||||
Cleared OTC | (1,416,613 | ) | (1,416,613 | ) | ||||||||||||
Bilateral OTC | (2,303,740 | ) | (2,401,013 | ) | ||||||||||||
|
|
|
| |||||||||||||
Net amounts per Consolidated Statements of Financial Condition (3) | $ | 406,268 | $ | 363,515 | ||||||||||||
|
|
|
| |||||||||||||
| (1) | Exchange traded derivatives include derivatives executed on an organized exchange. Cleared OTC derivatives include derivatives executed bilaterally and subsequently novated to and cleared through central clearing counterparties. Bilateral OTC derivatives include derivatives executed and settled bilaterally without the use of an organized exchange or central clearing counterparty. |
| (2) | Amounts netted include both netting by counterparty and for cash collateral paid or received. |
| (3) | We have not received or pledged additional collateral under master netting agreements and/or other credit support agreements that is eligible to be offset beyond what has been offset in the Consolidated Statements of Financial Condition. |
103
| November 30, 2013 (1) | ||||||||||||||||
| Assets | Liabilities | |||||||||||||||
| Fair Value | Number of Contracts | Fair Value | Number of Contracts | |||||||||||||
Interest rate contracts | ||||||||||||||||
Exchange-traded | $ | 8,696 | 57,344 | $ | 3,846 | 68,268 | ||||||||||
Cleared OTC | 432,667 | 5,402 | 396,422 | 7,730 | ||||||||||||
Bilateral OTC | 724,613 | 1,221 | 730,897 | 1,340 | ||||||||||||
Foreign exchange contracts | ||||||||||||||||
Exchange-traded | 33 | 111,229 | 40 | 104,205 | ||||||||||||
Bilateral OTC | 653,739 | 7,478 | 693,618 | 8,212 | ||||||||||||
Equity contracts | ||||||||||||||||
Exchange-traded | 495,069 | 1,742,195 | 465,110 | 1,800,467 | ||||||||||||
Bilateral OTC | 6,715 | 148 | 9,875 | 136 | ||||||||||||
Commodity contracts | ||||||||||||||||
Exchange-traded | 27,185 | 785,718 | 33,661 | 780,358 | ||||||||||||
Bilateral OTC | 114,095 | 11,811 | 139,458 | 8,359 | ||||||||||||
Credit contracts | ||||||||||||||||
Cleared OTC | 49,531 | 49 | 51,632 | 46 | ||||||||||||
Bilateral OTC | 2,339 | 16 | 8,131 | 19 | ||||||||||||
|
|
|
| |||||||||||||
Total gross derivative assets/ liabilities: | ||||||||||||||||
Exchange-traded | 530,983 | 502,657 | ||||||||||||||
Cleared OTC | 482,198 | 448,054 | ||||||||||||||
Bilateral OTC | 1,501,501 | 1,581,979 | ||||||||||||||
Amounts offset in the Consolidated Statements of Financial Condition (2): | ||||||||||||||||
Exchange-traded | (489,375 | ) | (489,375 | ) | ||||||||||||
Cleared OTC | (446,520 | ) | (445,106 | ) | ||||||||||||
Bilateral OTC | (1,317,694 | ) | (1,418,130 | ) | ||||||||||||
|
|
|
| |||||||||||||
Net amounts per Consolidated Statements of Financial Condition (3) | $ | 261,093 | $ | 180,079 | ||||||||||||
|
|
|
| |||||||||||||
| (1) | Exchange traded derivatives include derivatives executed on an organized exchange. Cleared OTC derivatives include derivatives executed bilaterally and subsequently novated to and cleared through central clearing counterparties. Bilateral OTC derivatives include derivatives executed and settled bilaterally without the use of an organized exchange or central clearing counterparty. |
| (2) | Amounts netted include both netting by counterparty and for cash collateral paid or received. |
| (3) | We have not received or pledged additional collateral under master netting agreements and/or other credit support agreements that is eligible to be offset beyond what has been offset in the Consolidated Statements of Financial Condition. |
104
The following table presents unrealized and realized gains (losses) on derivative contracts for year ended November 30, 2014, the nine months ended November 30, 2013, the three months ended February 28, 2013 and the year ended November 30, 2012 (in thousands):
| Successor | Predecessor | |||||||||||||||||
| Year Ended | Nine Months Ended | Three Months Ended | Year Ended | |||||||||||||||
| Gains (Losses) | November 30, 2014 | November 30, 2013 | February 28, 2013 | November 30, 2012 | ||||||||||||||
Interest rate contracts | $ | (149,587 | ) | $ | 132,397 | $ | 45,875 | $ | (146,439 | ) | ||||||||
Foreign exchange contracts | 39,872 | 5,514 | 12,228 | 9,076 | ||||||||||||||
Equity contracts | (327,978 | ) | (21,216 | ) | (20,938 | ) | (138,622 | ) | ||||||||||
Commodity contracts | 58,746 | 45,546 | 19,585 | 77,285 | ||||||||||||||
Credit contracts | (23,934 | ) | (18,098 | ) | (3,886 | ) | (25,086 | ) | ||||||||||
|
|
|
|
|
|
|
| |||||||||||
Total | $ | (402,881 | ) | $ | 144,143 | $ | 52,864 | $ | (223,786 | ) | ||||||||
|
|
|
|
|
|
|
| |||||||||||
OTC Derivatives. The following tables set forth by remaining contract maturity the fair value of OTC derivative assets and liabilities at November 30, 2014 (in thousands):
| OTC Derivative Assets (1) (2) (3) | ||||||||||||||||||||
| 0 – 12 Months | 1 – 5 Years | Greater Than 5 Years | Cross-Maturity Netting (4) | Total | ||||||||||||||||
Commodity swaps, options and forwards | $ | 62,275 | $ | 6,604 | $ | 23,387 | $ | (6,249 | ) | $ | 86,017 | |||||||||
Equity swaps and options | 2,291 | - | 20,128 | - | 22,419 | |||||||||||||||
Credit default swaps | - | 2,936 | - | - | 2,936 | |||||||||||||||
Total return swaps | 12,668 | 1 | - | (44 | ) | 12,625 | ||||||||||||||
Foreign currency forwards, swaps and options | 277,134 | 34,344 | 81 | (28,294 | ) | 283,265 | ||||||||||||||
Interest rate swaps, options and forwards | 74,804 | 111,810 | 158,530 | (61,665 | ) | 283,479 | ||||||||||||||
|
|
|
|
|
|
|
|
|
| |||||||||||
Total | $ | 429,172 | $ | 155,695 | $ | 202,126 | $ | (96,252 | ) | 690,741 | ||||||||||
|
|
|
|
|
|
|
| |||||||||||||
Cross product counterparty netting | (19,237 | ) | ||||||||||||||||||
|
| |||||||||||||||||||
Total OTC derivative assets included in Financial instruments owned | $ | 671,504 | ||||||||||||||||||
|
| |||||||||||||||||||
| (1) | At November 30, 2014, we held exchange traded derivative assets and other credit agreements with a fair value of $44.5 million, which are not included in this table. |
| (2) | OTC derivative assets in the table above are gross of collateral received. OTC derivative assets are recorded net of collateral received on the Consolidated Statements of Financial Condition. At November 30, 2014, cash collateral received was $309.7 million. |
| (3) | Derivative fair values include counterparty netting within product category. |
| (4) | Amounts represent the netting of receivable balances with payable balances for the same counterparty within product category across maturity categories. |
105
| OTC Derivative Liabilities (1) (2) (3) | ||||||||||||||||||||
| 0 – 12 Months | 1 – 5 Years | Greater Than 5 Years | Cross-Maturity Netting (4) | Total | ||||||||||||||||
Commodity swaps, options and forwards | $ | 120,863 | $ | 3,105 | $ | 5,722 | $ | (6,249 | ) | $ | 123,441 | |||||||||
Credit default swaps | - | 1,220 | 6,709 | - | 7,929 | |||||||||||||||
Equity swaps and options | 5,438 | 38,076 | 10,414 | - | 53,928 | |||||||||||||||
Total return swaps | 10,179 | 277 | - | (44 | ) | 10,412 | ||||||||||||||
Foreign currency forwards, swaps and options | 275,902 | 40,126 | - | (28,294 | ) | 287,734 | ||||||||||||||
Interest rate swaps, options and forwards | 58,328 | 77,487 | 210,161 | (61,665 | ) | 284,311 | ||||||||||||||
|
|
|
|
|
|
|
|
|
| |||||||||||
Total | $ | 470,710 | $ | 160,291 | $ | 233,006 | $ | (96,252 | ) | 767,755 | ||||||||||
|
|
|
|
|
|
|
| |||||||||||||
Cross product counterparty netting | (19,237 | ) | ||||||||||||||||||
|
| |||||||||||||||||||
Total OTC derivative liabilities included in Financial instruments sold, not yet purchased | $ | 748,518 | ||||||||||||||||||
|
| |||||||||||||||||||
| (1) | At November 30, 2014, we held exchange traded derivative liabilities and other credit agreements with a fair value of $21.9 million, which are not included in this table. |
| (2) | OTC derivative liabilities in the table above are gross of collateral pledged. OTC derivative liabilities are recorded net of collateral pledged on the Consolidated Statements of Financial Condition. At November 30, 2014, cash collateral pledged was $406.9 million. |
| (3) | Derivative fair values include counterparty netting within product category. |
| (4) | Amounts represent the netting of receivable balances with payable balances for the same counterparty within product category across maturity categories. |
At November 30, 2014, the counterparty credit quality with respect to the fair value of our OTC derivatives assets was as follows (in thousands):
Counterparty credit quality (1): | ||||
A- or higher | $ | 397,655 | ||
BBB- to BBB+ | 59,010 | |||
BB+ or lower | 127,332 | |||
Unrated | 87,507 | |||
|
| |||
Total | $ | 671,504 | ||
|
|
| (1) | We utilize internal credit ratings determined by our Risk Management. Credit ratings determined by Risk Management use methodologies that produce ratings generally consistent with those produced by external rating agencies. |
Contingent Features
Certain of our derivative instruments contain provisions that require our debt to maintain an investment grade credit rating from each of the major credit rating agencies. If our debt were to fall below investment grade, it would be in violation of these provisions and the counterparties to the derivative instruments could request immediate payment or demand immediate and ongoing full overnight collateralization on our derivative instruments in liability positions. The aggregate fair value of all derivative instruments with such credit-risk-related contingent features that are in a liability position at November 30, 2014 and November 30, 2013 is $269.0 million and $170.2 million, respectively, for which we have posted collateral of $234.6 million and $127.7 million, respectively, in the normal course of business. If the credit-risk-related contingent features underlying these agreements were triggered on November 30, 2014 and November 30, 2013, we would have been required to post an additional $55.1 million and $49.4 million, respectively, of collateral to our counterparties.
Note 8. Collateralized Transactions
We enter into secured borrowing and lending arrangements to obtain collateral necessary to effect settlement, finance inventory positions, meet customer needs or re-lend as part of our dealer operations. We monitor the fair value of the securities loaned and borrowed on a daily basis as compared with the related payable or receivable, and
106
request additional collateral or return excess collateral, as appropriate. We pledge financial instruments as collateral under repurchase agreements, securities lending agreements and other secured arrangements, including clearing arrangements. Our agreements with counterparties generally contain contractual provisions allowing the counterparty the right to sell or repledge the collateral. Pledged securities owned that can be sold or repledged by the counterparty are included within Financial instruments owned and noted parenthetically as Securities pledged on our Consolidated Statements of Financial Condition.
We receive securities as collateral under resale agreements, securities borrowing transactions and customer margin loans. We also receive securities as collateral in connection with securities-for-securities transactions in which we are the lender of securities. In many instances, we are permitted by contract or custom to rehypothecate the securities received as collateral. These securities may be used to secure repurchase agreements, enter into securities lending transactions, satisfy margin requirements on derivative transactions or cover short positions. At November 30, 2014 and November 30, 2013, the approximate fair value of securities received as collateral by us that may be sold or repledged was $25.8 billion and $21.9 billion, respectively. At November 30, 2014 and November 30, 2013, a substantial portion of the securities received by us had been sold or repledged.
In instances where we receive securities as collateral in connection with securities-for-securities transactions in which we are the lender of securities and are permitted to sell or repledge the securities received as collateral, we report the fair value of the collateral received and the related obligation to return the collateral in the Consolidated Statements of Financial Condition. At November 30, 2014 and November 30, 2013, $5.4 million and $11.1 million, respectively, were reported as Securities received as collateral and as Obligation to return securities received as collateral.
Offsetting of Securities Financing Agreements
To manage our exposure to credit risk associated with securities financing transactions, we may enter into master netting agreements and collateral arrangements with counterparties. Generally, transactions are executed under standard industry agreements, including, but not limited to, master securities lending agreements (securities lending transactions) and master repurchase agreements (repurchase transactions). A master agreement creates a single contract under which all transactions between two counterparties are executed allowing for trade aggregation and a single net payment obligation. Master agreements provide protection in bankruptcy in certain circumstances and, where legally enforceable, enable receivables and payables with the same counterparty to be settled or otherwise eliminated by applying amounts due against all or a portion of an amount due from the counterparty or a third party. In addition, we enter into customized bilateral trading agreements and other customer agreements that provide for the netting of receivables and payables with a given counterparty as a single net obligation.
In the event of the counterparty's default, provisions of the master agreement permit acceleration and termination of all outstanding transactions covered by the agreement such that a single amount is owed by, or to, the non-defaulting party. In addition, any collateral posted can be applied to the net obligations, with any excess returned; and the collateralized party has a right to liquidate the collateral. Any residual claim after netting is treated along with other unsecured claims in bankruptcy court.
The conditions supporting the legal right of offset may vary from one legal jurisdiction to another and the enforceability of master netting agreements and bankruptcy laws in certain countries or in certain industries is not free from doubt. The right of offset is dependent both on contract law under the governing arrangement and consistency with the bankruptcy laws of the jurisdiction where the counterparty is located. Industry legal opinions with respect to the enforceability of certain standard provisions in respective jurisdictions are relied upon as a part of managing credit risk. Master netting agreements are a critical component of our risk management processes as part of reducing counterparty credit risk and managing liquidity risk.
We are also a party to clearing agreements with various central clearing parties. Under these arrangements, the central clearing counterparty facilitates settlement between counterparties based on the net payable owed or receivable due and, with respect to daily settlement, cash is generally only required to be deposited to the extent of the net amount. In the event of default, a net termination amount is determined based on the market values of all outstanding positions and the clearing organization or clearing member provides for the liquidation and settlement of the net termination amount among all counterparties to the open repurchase and/or securities lending transactions.
107
The following tables provide information regarding repurchase agreements and securities borrowing and lending arrangements that are recognized in the Consolidated Statements of Financial Condition and 1) the extent to which, under enforceable master netting arrangements, such balances are presented net in the Consolidated Statements of Financial Condition as appropriate under GAAP and 2) the extent to which other rights of setoff associated with these arrangements exist and could have an effect on our financial position (in thousands). (See Note 7, Derivative Financial Instruments, for information related to offsetting of derivatives.)
| November 30, 2014 | ||||||||||||||||||||||||
| Gross Amounts | Netting in Consolidated Statement of Financial Condition | Net Amounts in Consolidated Statement of Financial Condition | Additional Amounts Available for Setoff (1) | Available Collateral (2) | Net Amount (3) | |||||||||||||||||||
Assets | ||||||||||||||||||||||||
Securities borrowing arrangements | $ | 6,853,103 | $ | - | $ | 6,853,103 | $ | (680,222 | ) | $ | (1,274,196 | ) | $ | 4,898,685 | ||||||||||
Reverse repurchase agreements | 14,059,133 | (10,132,275 | ) | 3,926,858 | (634,568 | ) | (3,248,817 | ) | 43,473 | |||||||||||||||
Liabilities | ||||||||||||||||||||||||
Securities lending arrangements | $ | 2,598,487 | $ | - | $ | 2,598,487 | $ | (680,222 | ) | $ | (1,883,140 | ) | $ | 35,125 | ||||||||||
Repurchase agreements | 20,804,432 | (10,132,275 | ) | 10,672,157 | (634,568 | ) | (8,810,770 | ) | 1,226,819 | |||||||||||||||
| November 30, 2013 | ||||||||||||||||||||||||
| Gross Amounts | Netting in Consolidated Statement of Financial Condition | Net Amounts in Consolidated Statement of Financial Condition | Additional Amounts Available for Setoff (1) | Available Collateral (2) | Net Amount (4) | |||||||||||||||||||
Assets | ||||||||||||||||||||||||
Securities borrowing arrangements | $ | 5,359,846 | $ | - | $ | 5,359,846 | $ | (530,293 | ) | $ | (957,140 | ) | $ | 3,872,413 | ||||||||||
Reverse repurchase agreements | 12,715,449 | (8,968,529 | ) | 3,746,920 | (590,754 | ) | (3,074,540 | ) | 81,626 | |||||||||||||||
Liabilities | ||||||||||||||||||||||||
Securities lending arrangements | $ | 2,506,122 | $ | - | $ | 2,506,122 | $ | (530,293 | ) | $ | (1,942,271 | ) | $ | 33,558 | ||||||||||
Repurchase agreements | 19,748,374 | (8,968,529 | ) | 10,779,845 | (590,754 | ) | (8,748,641 | ) | 1,440,450 | |||||||||||||||
| (1) | Under master netting agreements with our counterparties, we have the legal right of offset with a counterparty, which incorporates all of the counterparty's outstanding rights and obligations under the arrangement. These balances reflect additional credit risk mitigation that is available by counterparty in the event of a counterparty's default, but which are not netted in the balance sheet because other netting provisions of U.S. GAAP are not met. |
| (2) | Includes securities received or paid under collateral arrangements with counterparties that could be liquidated in the event of a counterparty default and thus offset against a counterparty's rights and obligations under the respective repurchase agreements or securities borrowing or lending arrangements. |
| (3) | Amounts include $4,847.4 million of securities borrowing arrangements, for which we have received securities collateral of $4,694.0 million, and $1,201.9 million of repurchase agreements, for which we have pledged securities collateral of $1,238.4 million, which are subject to master netting agreements but we have not yet determined the agreements to be legally enforceable. |
| (4) | Amounts include $3,818.4 million of securities borrowing arrangements, for which we have received securities collateral of $3,721.8 million, and $1,410.0 million of repurchase agreements, for which we have pledged securities collateral of $1,438.9 million, which are subject to master netting agreements but we have not yet determined the agreements to be legally enforceable. |
108
Cash and Securities Segregated and on Deposit for Regulatory Purposes or Deposited with Clearing and Depository Organizations
Cash and securities deposited with clearing and depository organizations and segregated in accordance with regulatory regulations totaled $3,444.7 million and $3,616.6 million at November 30, 2014 and November 30, 2013, respectively. Segregated cash and securities consist of deposits in accordance with Rule 15c3-3 of the Securities Exchange Act of 1934, which subjects Jefferies as a broker-dealer carrying customer accounts to requirements related to maintaining cash or qualified securities in segregated special reserve bank accounts for the exclusive benefit of its customers, and with the Commodity Exchange Act, which subjects Jefferies as an FCM to segregation requirements.
Note 9. Securitization Activities
We engage in securitization activities related to corporate loans, commercial mortgage loans and mortgage-backed and other asset-backed securities. In our securitization transactions, we transfer these assets to special purpose entities ("SPEs") and act as the placement or structuring agent for the beneficial interests sold to investors by the SPE. A significant portion of our securitization transactions are securitization of assets issued or guaranteed by U.S. government agencies. These SPEs generally meet the criteria of variable interest entities; however we generally do not consolidate the SPEs as we are not considered the primary beneficiary for these SPEs. (See Note 10, Variable Interest Entities for further discussion on variable interest entities and our determination of the primary beneficiary.)
We account for our securitization transactions as sales provided we have relinquished control over the transferred assets. Transferred assets are carried at fair value with unrealized gains and losses reflected in Principal transactions revenues in the Consolidated Statement of Earnings prior to the identification and isolation for securitization. Subsequently, revenues recognized upon securitization are reflected as net underwriting revenues. We generally receive cash proceeds in connection with the transfer of assets to an SPE. We may, however, have continuing involvement with the transferred assets, which is limited to retaining one or more tranches of the securitization (primarily senior and subordinated debt securities in the form of mortgage- and other-asset backed securities or collateralized loan obligations), which are included within Financial instruments owned and are generally initially categorized as Level 2 within the fair value hierarchy. We apply fair value accounting to the securities.
The following table presents activity related to our securitizations that were accounted for as sales in which we had continuing involvement (in millions):
| Successor | Predecessor | |||||||||||||||
| Year Ended | Nine Months Ended | Three Months Ended | Year Ended | |||||||||||||
| November 30, 2014 | November 30, 2013 | February 28, 2013 | November 30, 2012 | |||||||||||||
Transferred assets | $ | 6,112.6 | $ | 4,592.5 | $ | 2,735.2 | $ | 10,869.8 | ||||||||
Proceeds on new securitizations | 6,221.1 | 4,609.0 | 2,751.3 | 10,910.8 | ||||||||||||
Cash flows received on retained interests | 46.3 | 35.6 | 32.3 | 64.3 | ||||||||||||
We have no explicit or implicit arrangements to provide additional financial support to these SPEs, have no liabilities related to these SPEs and do not have any outstanding derivative contracts executed in connection with these securitization activities at November 30, 2014 and November 30, 2013.
109
The following tables summarize our retained interests in SPEs where we transferred assets and have continuing involvement and received sale accounting treatment (in millions):
| November 30, 2014 | ||||||||
Securitization Type | Total Assets | Retained Interests | ||||||
U.S. government agency residential mortgage-backed securities | $ | 19,196.9 | $ | 226.9 | ||||
U.S. government agency commercial mortgage-backed securities | 5,848.5 | 204.7 | ||||||
Collateralized loan obligations | 4,511.8 | 108.4 | ||||||
| November 30, 2013 | ||||||||
Securitization Type | Total Assets | Retained Interests | ||||||
U.S. government agency residential mortgage-backed securities | $ | 11,518.4 | $ | 281.3 | ||||
U.S. government agency commercial mortgage-backed securities | 5,385.6 | 96.8 | ||||||
Collateralized loan obligations | 728.5 | 9.0 | ||||||
Total assets represent the unpaid principal amount of assets in the SPEs in which we have continuing involvement and are presented solely to provide information regarding the size of the transaction and the size of the underlying assets supporting our retained interests, and are not considered representative of the risk of potential loss. Assets retained in connection with a securitization transaction represent the fair value of the securities of one or more tranches issued by an SPE, including senior and subordinated tranches. Our risk of loss is limited to this fair value amount which is included within total Financial instruments owned on our Consolidated Statements of Financial Condition.
Although not obligated, in connection with secondary market-making activities we may make a market in the securities issued by these SPEs. In these market-making transactions, we buy these securities from and sell these securities to investors. Securities purchased through these market-making activities are not considered to be continuing involvement in these SPEs, although the securities are included in Financial instruments owned. To the extent we purchased securities through these market-marking activities and we are not deemed to be the primary beneficiary of the variable interest entity, these securities are included in agency and non-agency mortgage- and asset-backed securitizations in the nonconsolidated variable interest entities section presented in Note 10, Variable Interest Entities.
If we have not relinquished control over the transferred assets, the assets continue to be recognized in Financial instruments owned and a corresponding liability is recognized in Other secured financings. The carrying value of assets and liabilities resulting from transfers of financial assets treated as secured financings was $7.8 million and $7.8 million, respectively, at November 30, 2014 and $8.7 million and $8.7 million, respectively, at November 30, 2013. The related liabilities do not have recourse to our general credit.
Note 10. Variable Interest Entities
Variable interest entities ("VIEs") are entities in which equity investors lack the characteristics of a controlling financial interest. VIEs are consolidated by the primary beneficiary. The primary beneficiary is the party who has both (1) the power to direct the activities of a variable interest entity that most significantly impact the entity's economic performance and (2) an obligation to absorb losses of the entity or a right to receive benefits from the entity that could potentially be significant to the entity.
Our variable interests in VIEs include debt and equity interests, commitments, guarantees and certain fees. Our involvement with VIEs arises primarily from:
| • | Purchases of securities in connection with our trading and secondary market making activities, |
| • | Retained interests held as a result of securitization activities, including the resecuritization of mortgage- and other asset-backed securities and the securitization of commercial mortgage and corporate loans, |
110
| • | Acting as placement agent and/or underwriter in connection with client-sponsored securitizations, |
| • | Financing of agency and non-agency mortgage- and other asset-backed securities, |
| • | Warehousing funding arrangements for client-sponsored consumer loan vehicles and collateralized loan obligations ("CLOs") through participation certificates and revolving loan commitments, and |
| • | Loans to, investments in and fees from various investment fund vehicles. |
We determine whether we are the primary beneficiary of a VIE upon our initial involvement with the VIE and we reassess whether we are the primary beneficiary of a VIE on an ongoing basis. Our determination of whether we are the primary beneficiary of a VIE is based upon the facts and circumstances for each VIE and requires significant judgment. Our considerations in determining the VIE's most significant activities and whether we have power to direct those activities include, but are not limited to, the VIE's purpose and design and the risks passed through to investors, the voting interests of the VIE, management, service and/or other agreements of the VIE, involvement in the VIE's initial design and the existence of explicit or implicit financial guarantees. In situations where we have determined that the power over the VIE's most significant activities is shared, we assess whether we are the party with the power over the majority of the significant activities. If we are the party with the power over the majority of the significant activities, we meet the "power" criteria of the primary beneficiary. If we do not have the power over a majority of the significant activities or we determine that decisions require consent of each sharing party, we do not meet the "power" criteria of the primary beneficiary.
We assess our variable interests in a VIE both individually and in aggregate to determine whether we have an obligation to absorb losses of or a right to receive benefits from the VIE that could potentially be significant to the VIE. The determination of whether our variable interest is significant to the VIE requires significant judgment. In determining the significance of our variable interest, we consider the terms, characteristics and size of the variable interests, the design and characteristics of the VIE, our involvement in the VIE and our market-making activities related to the variable interests.
Consolidated VIEs
The following table presents information about our consolidated VIEs at November 30, 2014 and November 30, 2013 (in millions). The assets and liabilities in the tables below are presented prior to consolidation and thus a portion of these assets and liabilities are eliminated in consolidation.
| November 30, 2014 | November 30, 2013 | |||||||||||||||
| Securitization Vehicles | Other | Securitization Vehicles | Other | |||||||||||||
Cash | $ | - | $ | 0.2 | $ | - | $ | 0.2 | ||||||||
Financial instruments owned | 62.7 | 0.3 | 97.5 | 0.4 | ||||||||||||
Securities purchased under agreement to resell (1) | 575.2 | - | 195.1 | - | ||||||||||||
Fees, interest and other receivables | 0.4 | - | - | - | ||||||||||||
Other assets | - | - | 2.3 | - | ||||||||||||
|
|
|
|
|
|
|
| |||||||||
| $ | 638.3 | $ | 0.5 | $ | 294.9 | $ | 0.6 | |||||||||
|
|
|
|
|
|
|
| |||||||||
Other secured financings (2) | $ | 637.7 | $ | - | $ | 292.5 | $ | - | ||||||||
Other liabilities | 0.6 | 0.2 | 2.1 | 0.2 | ||||||||||||
|
|
|
|
|
|
|
| |||||||||
| $ | 638.3 | $ | 0.2 | $ | 294.6 | $ | 0.2 | |||||||||
|
|
|
|
|
|
|
| |||||||||
| (1) | Securities purchased under agreement to resell represent an amount due under a collateralized transaction on a related consolidated entity, which is eliminated in consolidation. |
| (2) | Approximately $39.7 million and $66.5 million of the secured financing represents an amount held by us in inventory and is eliminated in consolidation at November 30, 2014 and November 30, 2013, respectively. |
Securitization Vehicles . We are the primary beneficiary of a securitization vehicle to which we transferred term loans backed by consumer installment receivables and retained a portion of the securities issued by the securitization vehicle. In the creation of the securitization vehicle, we were involved in the decisions made during the establishment and design of the entity and hold variable interests consisting of the securities retained that could potentially be significant. The assets of the VIE consist of the term loans backed by consumer installment receivables, which are available for the benefit of the vehicle's beneficial interest holders. The creditors of the VIE do not have recourse to our general credit and the assets of the VIE are not available to satisfy any other debt.
111
We are also the primary beneficiary of mortgage-backed financing vehicles to which we sell agency and non-agency residential and commercial mortgage-backed securities pursuant to the terms of a master repurchase agreement. We manage the assets within these vehicles. Our variable interests in these vehicles consist of our collateral margin maintenance obligations under the master repurchase agreement. The assets of these VIEs consist of reverse repurchase agreements, which are available for the benefit of the vehicle's debt holders. The creditors of these VIEs do not have recourse to our general credit and each such VIE's assets are not available to satisfy any other debt.
At November 30, 2013, we were the primary beneficiary of a securitization vehicle to which we transferred a corporate loan and retained a portion of the securities issued by the securitization vehicle. During the second quarter of 2014, the loan was repaid, the securities issued by the securitization vehicle were redeemed and the securitization vehicle was terminated. As a result, the securitization vehicle is no longer consolidated by us at November 30, 2014 and no gain or loss was recognized upon deconsolidation.
Other. We are the primary beneficiary of certain investment vehicles set up for the benefit of our employees. We manage and invest alongside our employees in these vehicles. The assets of these VIEs consist of private equity securities, and are available for the benefit of the entities' equity holders. Our variable interests in these vehicles consist of equity securities. The creditors of these VIEs do not have recourse to our general credit and each such VIE's assets are not available to satisfy any other debt.
Nonconsolidated VIEs
The following tables present information about our variable interests in nonconsolidated VIEs (in millions).
| November 30, 2014 | ||||||||||||||||
| Carrying Amount | Maximum | |||||||||||||||
| Assets | Liabilities | Exposure to loss | VIE Assets | |||||||||||||
Collateralized loan obligations | $ | 134.0 | $ | - | $ | 926.9 | $ | 7,737.1 | ||||||||
Consumer loan financing vehicles | 170.6 | - | 797.8 | 485.2 | ||||||||||||
Asset management vehicles (1) | 11.3 | - | 11.3 | 432.3 | ||||||||||||
Private equity vehicles (2) | 44.3 | - | 59.2 | 92.8 | ||||||||||||
|
|
|
|
|
|
|
| |||||||||
Total | $ | 360.2 | $ | - | $ | 1,795.2 | $ | 8,747.4 | ||||||||
|
|
|
|
|
|
|
| |||||||||
| November 30, 2013 | ||||||||||||||||
| Carrying Amount | Maximum | |||||||||||||||
| Assets | Liabilities | Exposure to loss | VIE Assets | |||||||||||||
Collateralized loan obligations | $ | 11.9 | $ | 0.2 | $ | 88.8 | $ | 1,122.3 | ||||||||
Asset management vehicle (1) | 5.1 | - | 5.1 | 454.2 | ||||||||||||
Private equity vehicles (2) | 40.8 | - | 68.8 | 89.4 | ||||||||||||
|
|
|
|
|
|
|
| |||||||||
Total | $ | 57.8 | $ | 0.2 | $ | 162.7 | $ | 1,665.9 | ||||||||
|
|
|
|
|
|
|
| |||||||||
| (1) | Assets consist of equity interests, which are included within Investments in managed funds, and accrued management and performance fees, which are included within Receivables: Fees, interest and other. |
| (2) | Assets consist of equity interests, which are included within Investments in managed funds. |
Our maximum exposure to loss often differs from the carrying value of the variable interests. The maximum exposure to loss is dependent on the nature of our variable interests in the VIEs and is limited to the notional amounts of certain loan commitments and guarantees. Our maximum exposure to loss does not include the offsetting benefit of any financial instruments that may be utilized to hedge the risks associated with our variable interests and is not reduced by the amount of collateral held as part of a transaction with a VIE.
112
Collateralized Loan Obligations. Assets collateralizing the CLOs include bank loans, participation interests and sub-investment grade and senior secured U.S. loans. We underwrite securities issued in CLO transactions on behalf of unaffiliated sponsors and provide advisory services to the unaffiliated sponsors. We may also sell corporate loans to the CLOs. Our variable interests in connection with collateralized loan obligations where we have been involved in providing underwriting and/or advisory services consist of the following:
| • | Forward sale agreements whereby we commit to sell, at a fixed price, corporate loans and ownership interests in an entity holding such corporate loans to CLOs, |
| • | Warehouse funding arrangements in the form of participation interests in corporate loans held by CLOs and commitments to fund such participation interests, |
| • | Trading positions in securities issued in a CLO transaction, |
| • | Investments in variable funding notes issued by CLOs, |
| • | A guarantee to a CLO managed by Jefferies Finance, whereby we guarantee certain of the obligations of Jefferies Finance to the CLO. |
In addition, we own variable interests in CLOs previously managed by us. Our variable interests consist of debt securities and a right to a portion of the CLOs' management and incentive fees. Our exposure to loss from these CLOs is limited to our investments in the debt securities held. Management and incentives fees are accrued as the amounts become realizable. These CLOs represent interests in assets consisting primarily of senior secured loans, unsecured loans and high yield bonds.
Consumer Loan Financing Vehicles. The underlying assets, which are collateralizing the vehicles, are primarily comprised of unsecured consumer installment loans. We provide financing and lending related services to certain client-sponsored VIEs in the form of revolving funding note agreements, revolving credit facilities and forward purchase agreements. In addition, we may provide structuring and advisory services and act as an underwriter or placement agent for securities issued by the vehicles. We do not control the activities of these entities.
Asset Management Vehicles. We manage asset management vehicles that provide investors with exposure to investment strategies consistent with the investment objectives of each vehicle. The vehicles consist of an "umbrella structure" company that invests primarily in convertible bonds and a fund that invests in absolute return strategies. Accounting changes to consolidation standards under generally accepted accounting principles have been deferred for entities that are considered to be investment companies; accordingly, consolidation continues to be determined under a risk and reward model. These asset management vehicles are subject to the deferral guidance and we are not the primary beneficiary at November 30, 2014 and November 30, 2013 under the risk and reward model. Our variable interests in these asset management vehicles consist of equity interests, management fees and performance fees.
Private Equity Vehicles. On July 26, 2010, we committed to invest equity of up to $75.0 million in Jefferies SBI USA Fund L.P. (the "SBI USA Fund"). At November 30, 2014 and November 30, 2013, we funded approximately $60.1 million and $47.0 million, respectively, of our commitment. The carrying amount of our equity investment was $43.1 million and $39.2 million at November 30, 2014 and November 30, 2013, respectively. Our exposure to loss is limited to our equity commitment. The SBI USA Fund has assets consisting primarily of private equity and equity related investments.
We have a variable interest in Jefferies Employees Partners IV, LLC ("JEP IV") consisting of an equity investment. The carrying amount of our equity investment was $1.2 million and $1.6 million at November 30, 2014 and November 30, 2013, respectively. Our exposure to loss is limited to our equity investment. JEP IV has assets consisting primarily of private equity and equity related investments.
Mortgage- and Other Asset-Backed Securitization Vehicles. In connection with our secondary trading and market making activities, we buy and sell agency and nonagency mortgage- backed securities and other asset-backed securities, which are issued by third party securitization SPEs and are generally considered variable interests in VIEs. Securities issued by securitization SPEs are backed by residential mortgage loans, U.S. agency collateralized mortgage obligations, commercial mortgage loans, collateralized debt obligations and CLOs and other consumer loans, such as installment receivables, auto loans and student loans. These securities are accounted for at fair value and included in Financial instruments owned on our Consolidated Statements of Financial Condition. We have no other involvement with the related SPEs and therefore do not consolidate these entities.
113
We also engage in underwriting, placement and structuring activities for third-party-sponsored securitization trusts generally through agency (Fannie Mae, Freddie Mac and Ginnie Mae) or nonagency sponsored SPEs and may purchase loans or mortgage-backed securities from third parties that are subsequently transferred into the securitization trusts. The securitizations are backed by residential and commercial mortgage, home equity and auto loans. We do not consolidate agency sponsored securitizations as we do not have the power to direct the activities of the SPEs that most significantly impact their economic performance. Further, we are not the servicer of nonagency-sponsored securitizations and therefore do not have power to direct the most significant activities of the SPEs and accordingly, do not consolidate these entities. We may retain unsold senior and/or subordinated interests at the time of securitization in the form of securities issued by the SPEs.
We transfer existing securities, typically mortgage-backed securities, into resecuritization vehicles. These transactions in which debt securities are transferred to a VIE in exchange for new beneficial interests occur in connection with both agency and nonagency sponsored VIEs. Our consolidation analysis is largely dependent on our role and interest in the resecuritization trusts. Most resecuritizations in which we are involved are in connection with investors seeking securities with specific risk and return characteristics. As such, we have concluded that the decision-making power is shared between us and the investor(s), considering the joint efforts involved in structuring the trust and selecting the underlying assets as well as the level of security interests the investor(s) hold in the SPE; therefore, we do not consolidate the resecuritization VIEs.
At November 30, 2014 and November 30, 2013, we held $3,186.9 million and $3,476.2 million of agency mortgage-backed securities, respectively, and $1,120.0 million and $985.0 million of nonagency mortgage- and other asset-backed securities, respectively, as a result of our secondary trading and market making activities, underwriting, placement and structuring activities and resecuritization activities. Our maximum exposure to loss on these securities is limited to the carrying value of our investments in these securities. Mortgage- and other asset-backed securitization vehicles discussed within this section are not included in the above table containing information about our variable interests in nonconsolidated VIEs.
Note 11. Investments
We have investments in Jefferies Finance, LLC ("Jefferies Finance"), Jefferies LoanCore LLC ("Jefferies LoanCore") and KCG Holdings, Inc. ("Knight"). Our investment in Knight is accounted for at fair value by electing the fair value option available under U.S. GAAP and is included in Financial instruments owned, at fair value – Corporate equity securities on the Consolidated Statements of Financial Condition with changes in fair value recognized in Principal transaction revenues on the Consolidated Statements of Earnings. Our investments in Jefferies Finance and Jefferies LoanCore are accounted for under the equity method and are included in Loans to and investments in related parties on the Consolidated Statements of Financial Condition with our share of the investees' earnings recognized in Other revenues in the Consolidated Statements of Earnings.
Jefferies Finance
On October 7, 2004, we entered into an agreement with Babson Capital Management LLC ("Babson Capital") and Massachusetts Mutual Life Insurance Company ("MassMutual") to form Jefferies Finance, a joint venture entity. Jefferies Finance is a commercial finance company whose primary focus is the origination and syndication of senior secured debt to middle market and growth companies in the form of term and revolving loans. Loans are originated primarily through the investment banking efforts of Jefferies, with Babson Capital providing primary credit analytics and portfolio management services. Jefferies Finance can also originate other debt products such as second lien term, bridge and mezzanine loans, as well as related equity co-investments. Jefferies Finance also purchases syndicated loans in the secondary market, including loans that are performing, stressed and distressed loan obligations.
114
At November 30, 2014, we and MassMutual each have equity commitments to Jefferies Finance of $600.0 million for a combined total commitment of $1.2 billion. At November 30, 2014, we have funded $496.0 million of our $600.0 million commitment, leaving $104.0 million unfunded. The investment commitment is scheduled to expire on March 1, 2016 with automatic one year extensions absent a 60 day termination notice by either party.
Jefferies Finance has executed a Secured Revolving Credit Facility with us and MassMutual, to be funded equally, to support loan underwritings by Jefferies Finance. The Secured Revolving Credit Facility bears interest based on the interest rates of the related Jefferies Finance underwritten loans and is secured by the underlying loans funded by the proceeds of the facility. The total committed Secured Revolving Credit Facility is $1.0 billion, comprised of committed and discretionary advances totaling $700.0 million and $300.0 million, respectively, at November 30, 2014. Committed advances are shared equally between us and MassMutual but discretionary advances may be funded in unequal amounts if agreed between MassMutual and us. The facility is scheduled to mature on March 1, 2016 with automatic one year extensions absent a 60 day termination notice by either party. At November 30, 2014 and November 30, 2013, we have funded $-0- and $123.8 million, respectively, of our $350.0 million commitment. During the year ended November 30, 2014, $2.0 million of interest income and $1.9 million of unfunded commitment fees are included in the Consolidated Statement of Earnings related to the Secured Revolving Credit Facility. During the nine months ended November 30, 2013, the three months ended February 28, 2013, and the year ended November 30, 2012 we earned interest income of $1.5 million, $4.1 million, and $8.4 million, respectively and unfunded commitment fees of $1.2 million, $0.3 million, and $1.8 million, respectively.
The following is a summary of selected financial information for Jefferies Finance (in millions):
| November 30, 2014 | November 30, 2013 | |||||||
Total assets | $ | 5,954.0 | $ | 3,271.9 | ||||
Total liabilities | 4,961.7 | 2,597.0 | ||||||
Total equity | 992.3 | 674.9 | ||||||
Our total equity balance | 496.0 | 337.3 | ||||||
Separate financial statements for Jefferies Finance is included in this Annual Report on Form 10-K. The net earnings of Jefferies Finance were $138.6 million, $132.7 million and $128.6 million for the years ended November 30, 2014 and November 30, 2013 and November 30, 2012, respectively.
We engage in debt capital markets transactions with Jefferies Finance related to the originations of loans by Jefferies Finance. In connection with such transactions, we earned net underwriting fees of $199.5 million for the year ended November 30, 2014, and $125.8 million, $39.9 million and $123.1 million during the nine months ended November 30, 2013, the three months ended February 28, 2013, and the year ended November 30, 2012, respectively, which are recognized in Investment banking revenues on the Consolidated Statements of Earnings. In addition, we paid fees to Jefferies Finance regarding certain loans originated by Jefferies Finance of $10.6 million during the year ended November 30, 2014, and $12.0 million, $0.8 million and $8.7 million during the nine months ended November 30, 2013, the three months ended February 28, 2013, and the year ended November 30, 2012, respectively, which are recognized as Business development expenses on the Consolidated Statements of Earnings.
During the years ended November 30, 2014 and November 30, 2013, we acted as placement agent in connection with CLOs managed by Jefferies Finance, for which we recognized fees of $4.6 million and $1.9 million, respectively, which are included in Investment banking revenues on the Consolidated Statements of Earnings. As part of the transactions, we purchased securities issued by the CLOs, which are included within Financial instruments owned and provided a guarantee, whereby we are required to make certain payments to a CLO in the event that Jefferies Finance is unable to meet its obligations to the CLO. Additionally, we have entered into a derivative contract with Jefferies Finance whose underlying is based on certain securities issued by the CLO for which we have recognized revenue of $0.7 million during the year ended November 30, 2014.
During the years ended November 30, 2014 and November 30, 2013, we acted as underwriter in connection with senior notes issued by Jefferies Finance, for which we recognized net underwriting fees of $7.7 million and $6.0 million, respectively, which are included in Investment banking revenues on the Consolidated Statements of Earnings.
Under a service agreement, we charged Jefferies Finance $41.6 million for services provided during the year ended November 30, 2014, and $14.2 million, $15.7 million and $26.8 million for the nine months ended November 30, 2013, the three months ended February 28, 2013 and the year ended November 30, 2012, respectively. Receivables from Jefferies Finance, included within Other assets on the Consolidated Statements of Financial Condition, were $41.5 million and $31.1 million at November 30, 2014 and November 30, 2013, respectively.
115
Jefferies LoanCore
On February 23, 2011, we entered into a joint venture agreement with the Government of Singapore Investment Corporation and LoanCore, LLC and formed Jefferies LoanCore, a commercial real estate finance company. Jefferies LoanCore originates and purchases commercial real estate loans throughout the U.S. with the support of the investment banking and securitization capabilities of Jefferies and the real estate and mortgage investment expertise of the Government of Singapore Investment Corporation and LoanCore, LLC. Jefferies LoanCore has aggregate equity commitments of $600.0 million. At November 30, 2014 and November 30, 2013, we have funded $200.9 million and $175.5 million, respectively, of our $291.0 million equity commitment and have a 48.5% voting interest in Jefferies LoanCore.
The following is a summary of selected financial information for Jefferies LoanCore (in millions):
| November 30, 2014 | November 30, 2013 | |||||||
Total assets | $ | 1,500.9 | $ | 975.1 | ||||
Total liabilities | 962.7 | 508.2 | ||||||
Total equity | 538.2 | 466.9 | ||||||
Our total equity balance | 261.0 | 226.5 | ||||||
The net earnings of Jefferies LoanCore were $38.1 million, $85.1 million and $84.2 million for the years ended November 30, 2014, November 30, 2013 and November 30, 2012, respectively.
Under a service agreement, we charged Jefferies LoanCore $0.1 million for year ended November 30, 2014, $0.5 million for the nine months ended November 30, 2013, $0.6 million for the three months ended February 28, 2013, and $0.5 million for the year ended November 30, 2012, respectively, for administrative services. Receivables from Jefferies LoanCore, included within Other assets on the Consolidated Statements of Financial Condition, were $8,900 and $230,000 at November 30, 2014 and November 30, 2013, respectively.
In connection with the securitization of commercial real estate loans originated by Jefferies LoanCore, we earned placement fees $1.6 million during the year ended November 30, 2014.
On derivative transactions with Jefferies LoanCore, we recognized $-0- during the year ended November 30, 2014, a net gain of $3.6 million for the nine months ended November 30, 2013, a net gain of $0.2 million during the three months ended February 28, 2013 and a net gain of $25.6 million during the year ended November 30, 2012, which are included in Principal transactions revenue on the Consolidated Statements of Earnings.
Knight Capital
On August 6, 2012, we entered into a Securities Purchase Agreement with Knight Capital Group, Inc., a publicly-traded global financial services firm, (the "Agreement"). Under the Agreement, we purchased preferred stock, which contained certain conversion options, in exchange for cash consideration of $125.0 million. On August 29, 2012, we exercised our conversion options and converted our holding of Series A Securities to common stock. On July 1, 2013, Knight Capital Group, Inc. merged with GETCO Holding Company, LLC (the merged company referred to as "KCG Holdings, Inc."). In connection with the consummation of the merger, we received cash consideration of $3.75 per share, or approximately $192.0 million, with respect to approximately 63% of our holdings in Knight Capital Group, Inc. and stock consideration of one third of a share of KCG Holdings, Inc. common stock for each share of Knight Capital Group Inc. common stock for the remainder of our holdings. At November 30, 2014, we owned approximately 19% of the outstanding common stock of Knight.
We elected to record our investment in Knight at fair value under the fair value option as the investment was acquired as part of our capital markets activities. The valuation of our investment at November 30, 2014 is based on the closing exchange price of Knight's common stock and included within Level 1 of the fair value hierarchy. Changes in the fair value of our investment of $(14.7) million for the year ended November 30, 2014, and $19.5 million, $26.5 million and $151.9 million, for the nine months ended November 30, 2013, the three months ended February 28, 2013 and for the year ended November 30, 2012, respectively, are recognized in Principal transactions revenues on the Consolidated Statement of Earnings.
116
The following is a summary of selected financial information for Knight at September 30, 2014, the most recently available public financial information for the company, and at December 31, 2013 (in millions):
| September 30, 2014 | December 31, 2013 | |||||||
Total assets | $ | 7,515.2 | $ | 6,997.0 | ||||
Total liabilities | 6,029.4 | 5,487.5 | ||||||
Total equity | 1,485.8 | 1,509.5 | ||||||
For the nine months ended September 30, 2014 and for the year ended December 31, 2013, Knight reported net income of $35.0 million and $141.7 million, respectively.
We have separately entered into securities lending transactions with Knight in the normal course of our capital markets activities. The balances of securities borrowed and securities loaned were $4.8 million and $9.5 million, respectively, at November 30, 2014 and $11.0 million and $22.7 million, respectively, at November 30, 2013.
Note 12. Goodwill and Other Intangible Assets
In connection with the Leucadia Transaction, goodwill of $1.7 billion was recorded on March 1, 2013. In addition, at March 1, 2013, certain existing intangible assets and new intangible assets were identified and recorded at their fair values. (See Note 4, Leucadia and Related Transactions for further information.)
Goodwill
Goodwill resulting from the Leucadia Transaction attributed to our reportable segments is as follows (in thousands):
| November 30, 2014 | November 30, 2013 | |||||||
Capital Markets | $ | 1,659,636 | $ | 1,717,246 | ||||
Asset Management | 3,000 | 5,100 | ||||||
|
|
|
| |||||
Total goodwill | $ | 1,662,636 | $ | 1,722,346 | ||||
|
|
|
| |||||
The following table is a summary of the changes to goodwill for the year ended November 30, 2014, the nine months ended November 30, 2013 and the three months ended February 28, 2013 (in thousands):
| Successor | Predecessor | |||||||||||
| Year Ended November 30, 2014 | Nine Months Ended November 30, 2013 | Three Months Ended February 28, 2013 | ||||||||||
Balance, at beginning of period | $ | 1,722,346 | $ | 1,720,380 | $ | 365,670 | ||||||
Less: Impairment loss | (54,000 | ) (1) | - | - | ||||||||
Less: Disposal | - | (5,700 | ) (2) | - | ||||||||
Add: Contingent consideration | - | - | 2,394 | (3) | ||||||||
Add: Translation adjustments | (5,710 | ) | 7,666 | (1,287 | ) | |||||||
|
|
|
|
|
| |||||||
Balance, at end of period | $ | 1,662,636 | $ | 1,722,346 | $ | 366,777 | (4) | |||||
|
|
|
|
|
| |||||||
| (1) | Activity represents impairment losses of $51.9 million related to the Futures reporting unit and $2.1 million related to our International Asset Management business. |
| (2) | As a result of a restructuring of our ownership interest in the commodities asset management business, we no longer hold a controlling interest and accordingly do not consolidate this business. In addition, we sold Jefferies International Management Limited to Leucadia. Goodwill associated with these entities was included in the net assets disposed of in the transactions. |
117
| (3) | Contingent consideration recorded during the three months ended February 28, 2013 relates to the lapse of certain conditions as specified in the purchase agreements associated with an acquisition in 2007. |
| (4) | Predecessor Company goodwill at February 28, 2013 was reduced to $-0- at March 1, 2013, as a result of purchase accounting adjustments. |
Goodwill Impairment Testing
Goodwill is allocated to related reporting units, which are determined based on financial information provided to management in connection with its management of the businesses and represent an operating segment or one level below an operating segment. The results of our annual goodwill impairment testing at August 1 did not indicate any impairment in any of our reporting units.
Allocated equity plus allocated goodwill and allocated intangible assets are used as a proxy for the carrying amount of each reporting unit. The amount of equity allocated to a reporting unit is based on our cash capital model deployed in managing our businesses, which seeks to approximate the capital a business would require if it were operating independently. Intangible assets are allocated to a reporting unit based on either specifically identifying a particular intangible asset as pertaining to a reporting unit or, if shared among reporting units, based on an assessment of the reporting unit's benefit from the intangible asset in order to generate results.
Estimating the fair value of a reporting unit requires management judgment. Estimated fair values for our reporting units were determined using a market valuation method that incorporate price-to-earnings and price-to-book multiples of comparable public companies, as well as discounted cash flow valuation methodologies. In addition, as the fair values determined under the market approach represent a noncontrolling interest, we applied a control premium to arrive at the estimated fair value of each reporting unit on a controlling basis. We engaged an independent valuation specialist to assist us in our valuation process at August 1, 2014.
During the fourth quarter of 2014, management decided to pursue alternative strategies for our Futures business (which constitutes a reporting unit), including possible divesture, given the recent operating performance and margin challenges of the business. In employing a discounted cash flow methodology to estimate the fair value of the reporting unit, a discount rate reflective of the uncertainty associated with achieving future performance targets was incorporated. Further, a fair value using a market valuation approach was also estimated and a multiple was calibrated from guideline companies, which is reflective of the business' now expected return on tangible equity. A goodwill impairment loss of $51.9 million was recognized in the Futures reporting unit at November 30, 2014 and the remaining goodwill allocated to the reporting unit is $-0-. In addition, during the fourth quarter of 2014, management decided to liquidate our International Asset Management business, which constitutes a reporting unit. Considering management's plans to liquidate this business within the next 12 months, future cash flows are not expected to be generated that will support its carrying value. A goodwill impairment loss of $2.1 million was recognized in the International Asset Management reporting unit at November 30, 2014 and the remaining goodwill allocated to the reporting unit is $-0-.
Substantially all of our remaining goodwill is allocated to our Investment Banking, Equities and Fixed Income reporting units for which the results of our assessment at August 1, 2014 indicated that these reporting units had a fair value substantially in excess of their carrying amounts based on current projections. Goodwill allocated to these reporting units is $1,659.6 million of total goodwill of $1,662.6 million at November 30, 2014.
Intangible Assets
The following tables present the gross carrying amount, impairment losses, accumulated amortization, net carrying amount and weighted average amortization period of identifiable intangible assets at November 30, 2014 and November 30, 2013 (in thousands):
118
| November 30, 2014 | ||||||||||||||||||||
| Gross cost | Impairment losses | Accumulated amortization | Net carrying amount | Weighted average remaining lives (years) | ||||||||||||||||
Customer relationships | $ | 135,926 | $ | (7,603 | ) (1) | $ | (26,402 | ) | $ | 101,921 | 13.7 | |||||||||
Trade name | 132,009 | - | (6,677 | ) | 125,332 | 33.3 | ||||||||||||||
Exchange and clearing organization membership interests and registrations | 14,706 | (178 | ) | - | 14,528 | N/A | ||||||||||||||
|
|
|
|
|
|
|
| |||||||||||||
| $ | 282,641 | $ | (7,781 | ) | $ | (33,079 | ) | $ | 241,781 | |||||||||||
|
|
|
|
|
|
|
| |||||||||||||
| (1) | Activity primarily represents impairment losses related to the Futures reporting unit. The impairment charge is included within Other expenses in the Consolidated Statements of Earnings. |
| November 30, 2013 | ||||||||||||||||||||
| Gross cost | Impairment losses | Accumulated amortization | Net carrying amount | Weighted average remaining lives (years) | ||||||||||||||||
Customer relationships | $ | 136,740 | $ | - | $ | (17,567 | ) | $ | 119,173 | 14.8 | ||||||||||
Trade name | 132,967 | - | (2,966 | ) | 130,001 | 34.3 | ||||||||||||||
Exchange and clearing organization membership interests and registrations | 15,294 | (378 | ) | - | 14,916 | N/A | ||||||||||||||
|
|
|
|
|
|
|
| |||||||||||||
| $ | 285,001 | $ | (378 | ) | $ | (20,533 | ) | $ | 264,090 | |||||||||||
|
|
|
|
|
|
|
| |||||||||||||
Impairment Testing
We performed our annual impairment testing of indefinite-life intangible assets, which consists of exchange and clearing organization membership interests and registrations, at August 1, 2014. We elected to perform a quantitative assessment of membership interests and registrations that have available quoted sales prices, and a qualitative assessment of the remainder of our intangible assets. In applying our quantitative assessment, we recognized an impairment loss of $178,000 on certain exchange memberships based on a decline in fair value at August 1, 2014 as observed based on quoted sales prices. With regard to our qualitative assessment of the remaining indefinite-life intangible assets, based on our assessment of market conditions, the utilization of the assets and the replacement costs associated with the assets, we have concluded that it was not more likely than not that the intangible assets were impaired. In applying our quantitative assessment at August 1, 2013 we recognized an impairment loss of $378,000 on certain exchange memberships based on a decline in fair value as observed based on quoted sales prices.
As a result of management's decisions during the fourth quarter of 2014 to pursue strategic alternatives for our Futures business and to liquidate our International Asset Management business, we performed additional impairment testing of indefinite- and finite-life intangible assets that are associated with those reporting units. Estimating the fair value of customer relationship intangible assets using a discounted cash flow methodology, we recognized impairment losses at November 30, 2014 of $7.5 million and $0.1 million in the Futures business and the International Asset Management business, respectively, which are recognized in Other expenses on the Consolidated Statement of Earnings.
Amortization Expense
For finite-life intangible assets, aggregate amortization expense amounted to $12.8 million for the year ended November 30, 2014, $20.5 million, $0.4 million and $2.3 million for the nine months ended November 30, 2013, the three months ended February 28, 2013 and for the year ended November 30, 2012, respectively. These expenses are included in Other expenses on the Consolidated Statements of Earnings.
119
The estimated future amortization expenses for the five succeeding fiscal years are as follows (in thousands):
Year ended November 30, 2015 | 12,198 | |||
Year ended November 30, 2016 | 12,198 | |||
Year ended November 30, 2017 | 12,198 | |||
Year ended November 30, 2018 | 12,198 | |||
Year ended November 30, 2019 | 12,198 |
Note 13. Short-Term Borrowings
Short-term borrowings include bank loans that are payable on demand, as well as borrowings under revolving credit facilities which must be repaid within one year or less. Bank loans are typically overnight loans used to finance financial instruments owned or clearing related balances, but are not part of our systemic funding model and generally bear interest at a spread over the federal funds rate. Short-term borrowings at November 30, 2014 and November 30, 2013 were $12.0 million and $12.0 million, respectively. At November 30, 2014, the interest rate on short-term borrowings outstanding is 0.63% per annum. Average daily short-term borrowings outstanding for the year ended November 30, 2014, the nine months ended November 30, 2013 and the three months ended February 28, 2013 were $81.7 million, $43.3 million and $110.0 million, respectively.
Note 14. Long-Term Debt
As a result of the Leucadia Transaction, we recorded our long-term debt at its fair value of $6.1 billion on the acquisition date, which included $536.5 million of excess of the fair value over the total principal amount of our debt at March 1, 2013, in aggregate. The premium is being amortized to interest expense using the effective yield method over the remaining lives of the underlying debt obligations. (See Note 4, Leucadia and Related Transactions for further information.)
The following summarizes our long-term debt carrying values (including unamortized discounts and premiums and valuation adjustment, where applicable) at November 30, 2014 and November 30, 2013 (in thousands):
| November 30, 2014 | November 30, 2013 | |||||||
Unsecured Long-Term Debt | ||||||||
5.875% Senior Notes, due June 8, 2014 (effective interest rate of 1.51%) | $ | - | $ | 255,676 | ||||
3.875% Senior Notes, due November 9, 2015 (effective interest rate of 2.17%) | 507,944 | 516,204 | ||||||
5.5% Senior Notes, due March 15, 2016 (effective interest rate of 2.52%) | 363,229 | 373,178 | ||||||
5.125% Senior Notes, due April 13, 2018 (effective interest rate of 3.46%) | 842,359 | 854,011 | ||||||
8.5% Senior Notes, due July 15, 2019 (effective interest rate of 4.00%) | 832,797 | 858,425 | ||||||
2.375% Euro Medium Term Notes, due May 20, 2020 (effective rate of 2.42%) | 620,725 | - | ||||||
6.875% Senior Notes, due April 15, 2021 (effective interest rate of 4.40%) | 853,091 | 866,801 | ||||||
2.25% Euro Medium Term Notes, due July 13, 2022 (effective rate of 4.08%) | 4,379 | 4,792 | ||||||
5.125% Senior Notes, due January 20, 2023 (effective interest rate of 4.55%) | 623,311 | 625,626 | ||||||
6.45% Senior Debentures, due June 8, 2027 (effective interest rate of 5.46%) | 381,515 | 383,224 | ||||||
3.875% Convertible Senior Debentures, due November 1, 2029 (effective interest rate of 3.50%) (1) | 349,261 | 359,281 | ||||||
6.25% Senior Debentures, due January 15, 2036 (effective interest rate of 6.03%) | 513,046 | 513,343 | ||||||
6.50% Senior Notes, due January 20, 2043 (effective interest rate of 6.09%) | 421,960 | 422,245 | ||||||
|
|
|
| |||||
| $ | 6,313,617 | $ | 6,032,806 | |||||
|
|
|
| |||||
Secured Long-Term Debt | ||||||||
Credit facility | 170,000 | 200,000 | ||||||
|
|
|
| |||||
| $ | 6,483,617 | $ | 6,232,806 | |||||
|
|
|
| |||||
120
| (1) | As a result of the Leucadia Transaction on March 1, 2013, the value of the 3.875% Convertible Senior debentures at November 30, 2014 and November 30, 2013, includes the fair value of the conversion feature of $0.7 million and $9.6 million, respectively. The change in fair value of the conversion feature is included within Principal transactions revenues in the Consolidated Statements of Earnings and amounted to a gain of $8.9 million and a gain of $6.9 million for the year ended November 30, 2014 and the nine months ended November 30, 2013, respectively. |
On May 20, 2014, under our $2.0 billion Euro Medium Term Note Program we issued senior unsecured notes with a principal amount of €500.0 million, due 2020, which bear interest at 2.375% per annum. Proceeds amounted to €498.7 million. On January 15, 2013, we issued $1.0 billion in senior unsecured long-term debt, comprising 5.125% Senior Notes, due 2023 and 6.5% Senior Notes, due 2043. The 5.125% Senior Notes were issued with a principal amount of $600.0 million and we received proceeds of $595.6 million. The 6.5% Senior Notes were issued with a principal amount of $400.0 million and we received proceeds of $391.7 million.
Our U.S. broker-dealer, from time to time, makes a market in our long-term debt securities ( i.e ., purchases and sells our long-term debt securities). During November and December 2011, there was extreme volatility in the price of our debt and a significant amount of secondary trading volume through our market-making desk. Given the volume of activity and significant price volatility, purchases and sales of our Senior Notes due 2018 and Convertible Senior Debentures due 2029 were treated as debt extinguishments and reissuances of debt, respectively. We recognized a gain of $9.9 million on debt extinguishment, which is reported in Other revenues for the year ended November 30, 2012.
Upon completion of the Leucadia Transaction on March 1, 2013, our 3.875% convertible debentures due 2029 (principal amount of $345.0 million) (the "debentures") remain issued and outstanding but are now convertible into common shares of Leucadia. Other than the conversion into Leucadia common shares, the terms of the debenture remain the same. At December 11, 2014, each $1,000 debenture is currently convertible into 22.1925 shares of Leucadia's common stock (equivalent to a conversion price of approximately $45.06 per share of Leucadia's common stock). The debentures are convertible at the holders' option any time beginning on August 1, 2029 and convertible at any time if: 1) Leucadia's common stock price is greater than or equal to 130% of the conversion price for at least 20 trading days in a period of 30 consecutive trading days; 2) if the trading price per debenture is less than 95% of the price of the common stock times the conversion ratio for any 10 consecutive trading days; 3) if the debentures are called for redemption; or 4) upon the occurrence of specific corporate actions. The debentures may be redeemed for par, plus accrued interest, on or after November 1, 2012 if the price of Leucadia's common stock is greater than 130% of the conversion price for at least 20 days in a period of 30 consecutive trading days and we may redeem the debentures for par, plus accrued interest, at our election any time on or after November 1, 2017. Holders may require us to repurchase the debentures for par, plus accrued interest, on November 1, 2017, 2019 and 2024. In addition to ordinary interest, commencing November 1, 2017, contingent interest will accrue at 0.375% if the average trading price of a debenture for 5 trading days ending on and including the third trading day immediately preceding a six-month interest period equals or exceed $1,200 per $1,000 debenture. At March 1, 2013, the conversion option to Leucadia common shares embedded within the debentures meets the definition of a derivative contract, does not qualify to be accounted for within member's equity and is not clearly and closely related to the economic interest rate or credit risk characteristics of our debt. Accordingly, the conversion option is accounted for on a standalone basis at fair value with changes in fair value recognized in Principal transactions revenues in the Consolidated Statements of Earnings and is presented within Long-term debt on the Consolidated Statement of Financial Condition.
Secured Long-Term Debt- On August 26, 2011, we entered into a committed senior secured revolving credit facility ("Credit Facility") with a group of commercial banks in U.S. dollars, Euros and Sterling, for an aggregate committed amount of $950.0 million with availability subject to one or more borrowing bases and of which $250.0 million can be borrowed by Jefferies Bache Limited without a borrowing base requirement. On June 26, 2014, we amended and restated the Credit Facility for three years and reduced the committed amount to $750.0 million. The borrowers under the Credit Facility are Jefferies Bache Financial Services, Inc., Jefferies Bache, LLC and Jefferies Bache Limited, with a guarantee from Jefferies Group LLC. On September 1, 2014, Jefferies Bache, LLC merged with and into Jefferies (a U.S. broker-dealer). Jefferies is the surviving entity, and therefore, a borrower under the Credit Facility. The Credit Facility contains certain financial covenants, including, but not limited to, restrictions on future indebtedness of our subsidiaries, minimum tangible net worth and liquidity requirements and minimum capital requirements. Interest is based on, in the case of U.S. dollar borrowings, the Federal funds rate or the London Interbank Offered Rate or, in
121
the case of Euro and Sterling borrowings, the Euro Interbank Offered Rate and the London Interbank Offered Rate, respectively. The obligations of each borrower under the Credit Facility are secured by substantially all the assets of such borrower, but none of the borrowers is responsible for any obligations of any other borrower. At November 30, 2014 and November 30, 2013, borrowings under the Credit Facility were denominated in U.S. dollars and we were in compliance with debt covenants under the Credit Facility.
Note 15. Mandatorily Redeemable Convertible Preferred Stock
As of February 28, 2013 and November 30, 2012, we had issued and outstanding 125,000 shares of 3.25% Series A Convertible Cumulative Preferred Stock, all of which were held by controlled affiliates of MassMutual. The preferred stock was callable beginning in 2016 at a price of $1,000 per share plus accrued interest and matured in 2036. Dividends paid on the Series A Convertible Cumulative Preferred Stock were recorded as a component of Interest expense as the preferred stock is treated as debt for accounting purposes. For tax purposes, the dividend is not tax-deductible because the Series A Convertible Cumulative Preferred Stock are considered "equity".
On March 1, 2013, pursuant to the Leucadia Transaction, the Series A Convertible Cumulative Preferred Stock was exchanged for a comparable series of convertible preferred shares of Leucadia. The assumption by Leucadia of our convertible cumulative preferred stock is considered part of the purchase price and resulted in an increase in member's equity. (See Note 4. Leucadia and Related Transactions for further details.)
122
Note 16. Noncontrolling Interests and Mandatorily Redeemable Preferred Interests of Consolidated Subsidiaries
Noncontrolling Interests
Noncontrolling interests represent equity interests in consolidated subsidiaries, comprised primarily of asset management entities and investment vehicles set up for the benefit of our employees, that are not attributable, either directly or indirectly, to us ( i.e. , minority interests). The following table presents noncontrolling interests at November 30, 2014 and November 30, 2013 (in thousands):
| November 30, 2014 | November 30, 2013 | |||||||
Jefferies Structured Alpha Fund B, LLC (1) | $ | - | $ | 115,958 | ||||
Global Equity Event Opportunity Fund, LLC (2) | 33,303 | - | ||||||
Other | 5,545 | 1,196 | ||||||
|
|
|
| |||||
Noncontrolling interests | $ | 38,848 | $ | 117,154 | ||||
|
|
|
| |||||
| (1) | During the first quarter of 2014, the Jefferies Structured Alpha Fund B, LLC was deconsolidated due to substantive investments in the entity by third parties. No gain or loss was recognized upon deconsolidation. At November 30, 2013, noncontrolling interests included $80.4 million attributed to Leucadia. |
| (2) | At November 30, 2014, $25.4 million of the total noncontrolling interests of $33.3 million are attributed to Leucadia. |
Noncontrolling ownership interests in consolidated subsidiaries are presented in the accompanying Consolidated Statements of Financial Condition within Equity as a component separate from Member's equity. Net Earnings in the accompanying Consolidated Statements of Earnings includes earnings attributable to both our equity investor and the noncontrolling interests.
Mandatorily Redeemable Preferred Interests of Consolidated Subsidiaries
Interests in consolidated subsidiaries that meet the definition of mandatorily redeemable financial instruments require liability classification and remeasurement at the estimated amount of cash that would be due and payable to settle such interests under the applicable entity's organization agreement. Changes to mandatorily redeemable financial instruments are reflected as Interest on mandatorily redeemable preferred interests of consolidated subsidiaries within Net revenues in our Consolidated Statements of Earnings.
On April 1, 2013, mandatorily redeemable financial instruments, representing Leucadia's member's equity interests in Jefferies High Yield Holdings, LLC ("JHYH"), were redeemed and subsequently contributed back to us by Leucadia as additional equity in Jefferies Group LLC. Prior to redemption, the mandatorily redeemable financial instruments represented interests held in JHYH.
123
Note 17. Benefit Plans
U.S. Pension Plan
We maintain a defined benefit pension plan, Jefferies Group LLC Employees' Pension Plan (the "U.S. Pension Plan"), which is subject to the provisions of the Employee Retirement Income Security Act of 1974, as amended, and covers certain of our employees. Under the U.S. Pension Plan, benefits to participants are based on years of service and the employee's career average pay. Effective December 31, 2005, benefits under the U.S. Pension Plan were frozen with no further benefit accruing to participants for future service after December 31, 2005.
Employer Contributions – Our funding policy is to contribute to the U.S. Pension Plan at least the minimum amount required for funding purposes under applicable employee benefit and tax laws. We did not make any contributions to the U.S. Pension Plan during the year ended November 30, 2014. We do not expect to make any contributions in the year ended November 30, 2015.
The following tables summarize the changes in the projected benefit obligation, the fair value of the assets and the funded status of the plan (in thousands):
| Year Ended November 30, | ||||||||
| 2014 | 2013 | |||||||
Change in projected benefit obligation: | ||||||||
Projected benefit obligation, beginning of period. | $ | 48,255 | $ | 53,433 | ||||
Service cost | 250 | 225 | ||||||
Interest cost | 2,429 | 2,201 | ||||||
Actuarial losses (gains) | 5,834 | (5,046 | ) | |||||
Administrative expenses paid | (196 | ) | (296 | ) | ||||
Benefits paid | (1,310 | ) | (2,262 | ) | ||||
|
|
|
| |||||
Projected benefit obligation, end of period | $ | 55,262 | $ | 48,255 | ||||
|
|
|
| |||||
Change in plan assets: | ||||||||
Fair value of assets, beginning of period | $ | 47,416 | $ | 39,902 | ||||
Employer contributions | - | 3,000 | ||||||
Benefit payments made | (1,310 | ) | (2,262 | ) | ||||
Administrative expenses paid | (196 | ) | (296 | ) | ||||
Actual return on plan assets | 5,175 | 7,072 | ||||||
|
|
|
| |||||
Fair value of assets, end of period | $ | 51,085 | $ | 47,416 | ||||
|
|
|
| |||||
Funded status at end of period | $ | (4,177 | ) | $ | (839 | ) | ||
|
|
|
| |||||
The amounts recognized in our Consolidated Statements of Financial Condition are as follows (in thousands):
| November 30, | ||||||||
| 2014 | 2013 | |||||||
Consolidated statements of financial condition: | ||||||||
Liabilities | $ | (4,177 | ) | $ | (839 | ) | ||
|
|
|
| |||||
Accumulated other comprehensive income (loss), before taxes: | ||||||||
Net gain (loss) | $ | 2,390 | $ | 6,268 | ||||
|
|
|
| |||||
124
The following tables summarize the components of net periodic pension cost and other amounts recognized in other comprehensive income excluding taxes (in thousands):
| Year Ended November 30, | ||||||||||||
| 2014 | 2013 | 2012 | ||||||||||
Components of net periodic pension cost: | ||||||||||||
Service cost | $ | 250 | $ | 225 | $ | 175 | ||||||
Interest cost on projected benefit obligation | 2,429 | 2,201 | 2,342 | |||||||||
Expected return on plan assets | (3,125 | ) | (2,698 | ) | (2,513 | ) | ||||||
Net amortization | (94 | ) | 326 | 1,334 | ||||||||
Settlement losses (1) | - | - | 1,051 | |||||||||
|
|
|
|
|
| |||||||
Net periodic pension cost | $ | (540 | ) | $ | 54 | $ | 2,389 | |||||
|
|
|
|
|
| |||||||
| (1) | Of the $2.4 million in net periodic pension cost for the year ended November 30, 2012, $1.1 million is due to previously unrecognized losses associated with the projected pension obligation as the cost of all settlements in fiscal 2012 for terminated employees exceeded current year interest and service costs. |
| 2014 | 2013 | 2012 | ||||||||||
Amounts recognized in other comprehensive income: | ||||||||||||
Net (gain) loss arising during the period | $ | 3,784 | $ | (9,419 | ) | $ | 1,498 | |||||
Amortization of net loss | 94 | (326 | ) | (1,334 | ) | |||||||
Settlements during the period | - | - | (1,051 | ) | ||||||||
|
|
|
|
|
| |||||||
Total recognized in Other comprehensive income | $ | 3,878 | $ | (9,745 | ) | $ | (887 | ) | ||||
|
|
|
|
|
| |||||||
Net amount recognized in net periodic benefit cost and Other comprehensive income | $ | 3,338 | $ | (9,691 | ) | $ | 1,502 | |||||
|
|
|
|
|
| |||||||
On a weighted average basis, the following are assumptions used to determine the actuarial present value of the projected benefit obligation and net periodic pension benefit cost:
| 2014 | 2013 | 2012 | ||||||||||
Discount rate | 4.30 | % | 5.10 | % | 4.00 | % | ||||||
Expected long-term rate of return on plan assets | 6.75 | % | 6.75 | % | 6.75 | % | ||||||
Expected Benefit Payments - Expected benefit payments for each of the next five fiscal years and in the aggregate for the five fiscal years thereafter are as follows (in thousands):
2015 | $ | 1,671 | ||
2016 | 2,849 | |||
2017 | 2,216 | |||
2018 | 2,126 | |||
2019 | 2,947 | |||
2020 through 2024 | 18,147 |
125
Plan Assets - The following table presents the fair value of plan assets at November 30, 2014 and November 30, 2013 by level within the fair value hierarchy (in thousands):
| At November 30, 2014 | ||||||||||||
| Level 1 | Level 2 | Total | ||||||||||
Plan assets (1): | ||||||||||||
Cash and cash equivalents | $ | 373 | $ | - | $ | 373 | ||||||
Listed equity securities (2) | 31,327 | - | 31,327 | |||||||||
Fixed income securities: | ||||||||||||
Corporate debt securities | - | 6,482 | 6,482 | |||||||||
Foreign corporate debt securities | - | 1,321 | 1,321 | |||||||||
U.S. government securities | 5,929 | - | 5,929 | |||||||||
Agency mortgage-backed securities | - | 3,883 | 3,883 | |||||||||
Commercial mortgage-backed securities. | - | 1,080 | 1,080 | |||||||||
Asset-backed securities | - | 690 | 690 | |||||||||
|
|
|
|
|
| |||||||
| $ | 37,629 | $ | 13,456 | $ | 51,085 | |||||||
|
|
|
|
|
| |||||||
| (1) | There are no plan assets classified within Level 3 of the fair value hierarchy. |
| (2) | Listed equity securities are diversified across a spectrum of primarily U.S. large-cap companies. |
| At November 30, 2013 | ||||||||||||
| Level 1 | Level 2 | Total | ||||||||||
Plan assets (1): | ||||||||||||
Cash and cash equivalents | $ | 931 | $ | - | $ | 931 | ||||||
Listed equity securities (2) | 27,663 | - | 27,663 | |||||||||
Fixed income securities: | ||||||||||||
Corporate debt securities | - | 7,743 | 7,743 | |||||||||
Foreign corporate debt securities | - | 1,140 | 1,140 | |||||||||
U.S. government securities | 4,055 | - | 4,055 | |||||||||
Agency mortgage-backed securities | - | 3,949 | 3,949 | |||||||||
Commercial mortgage-backed securities. | - | 1,280 | 1,280 | |||||||||
Asset-backed securities | - | 461 | 461 | |||||||||
Other | - | 194 | 194 | |||||||||
|
|
|
|
|
| |||||||
| $ | 32,649 | $ | 14,767 | $ | 47,416 | |||||||
|
|
|
|
|
| |||||||
| (1) | There are no plan assets classified within Level 3 of the fair value hierarchy. |
| (2) | Listed equity securities are diversified across a spectrum of primarily U.S. large-cap companies. |
Valuation technique and inputs - The following is a description of the valuation techniques and inputs used in measuring plan assets accounted for at fair value on a recurring basis:
| • | Cash equivalents are valued at cost, which approximates fair value and are categorized in Level 1 of the fair value hierarchy; |
| • | Listed equity securities are valued using the quoted prices in active markets for identical assets; |
| • | Fixed income securities: |
| • | Corporate debt, mortgage- and asset-backed securities and other securities valuations use data readily available to all market participants and use inputs available for substantially the full term of the security. Valuation inputs include benchmark yields, reported trades, broker dealer quotes, issuer spreads, two sided markets, benchmark securities, bids, offers, reference data, and industry and economic events; |
| • | U.S. government and agency securities valuations generally include quoted bid prices in active markets for identical or similar assets. |
Investment Policies and Strategies - Assets in the plan are invested under guidelines adopted by the Administrative Committee of the Plan. Because the Plan exists to provide a vehicle for funding future benefit obligations, the investment objectives of the portfolio take into account the nature and timing of future plan liabilities. The policy recognizes that the portfolio's long-term investment performance and its ability to meet the plan's overall objectives are dependent on the strategic asset allocation which includes adequate diversification among assets classes.
126
The target allocation of plan assets for 2015 is approximately 50% equities and 50% fixed income securities. The target asset allocation was determined based on the risk tolerance characteristics of the plan and, at times, may be adjusted to achieve the plan's investment objective and to minimize any concentration of investment risk. The Administrative Committee evaluates the asset allocation strategy and adjusts the allocation if warranted based upon market conditions and the impact of the investment strategy on future contribution requirements. The expected long-term rate of return assumption is based on an analysis of historical experience of the portfolio and the summation of prospective returns for each asset class in proportion to the fund's current asset allocation.
The equity portfolio may invest up to 5% of the market value of the portfolio in any one company and may invest up to 10% of the market value of the portfolio in any one sector or up to two times the percentage weighting of any one sector as defined by the S&P 500 or the Russell 1000 Value indices, whichever is higher. Permissible investments specified under the equity portfolio of the plan include equity securities of U.S. and non-U.S. incorporated entities and private placement securities issued pursuant to Rule 144A. At least 75% of the market value of the fixed income portfolio must be invested in investment grade securities rated BBB-/Baa3, including cash and cash equivalents. Permissible investments specified under the fixed income portfolio of the plan include: public or private debt obligations issued or guaranteed by U.S. or foreign issuers; preferred, hybrid, mortgage or asset-backed securities; senior loans; and derivatives and foreign currency exchange contracts.
German Pension Plan
In connection with the acquisition of Jefferies Bache from Prudential on July 1, 2011, we acquired a defined benefits pension plan located in Germany (the "German Pension Plan") for the benefit of eligible employees of Jefferies Bache in that territory. The German Pension Plan has no plan assets and is therefore unfunded. We have purchased insurance contracts from multi-national insurers held in the name of Jefferies Bache Limited to provide for the plan's future obligations. The investments in these insurance contracts are included in Financial Instruments owned – Investments at fair value in the Consolidated Statements of Financial Condition and have a fair value of $18.1 million and $19.7 million at November 30, 2014 and November 30, 2013, respectively. We expect to pay our pension obligations from the cash flows available to us under the insurance contracts. All costs relating to the plan (including insurance premiums and other costs as computed by the insurers) are paid by us. In connection with the acquisition, it was agreed with Prudential that any insurance premiums and funding obligations related to pre-acquisition date service will be reimbursed to us by Prudential.
The provisions and assumptions used in the German Pension Plan are based on local conditions in Germany. We did not contribute to the plan during the years ended November 30, 2014 and November 30, 2013.
The following tables summarize the changes in the projected benefit obligation and the components of net periodic pension cost (in thousands):
| Year Ended November 30, | ||||||||
| 2014 | 2013 | |||||||
Change in projected benefit obligation: | ||||||||
Projected benefit obligation, beginning of period | $ | 26,368 | $ | 24,509 | ||||
Service cost | 40 | 67 | ||||||
Interest cost | 801 | 902 | ||||||
Actuarial losses | 4,630 | 1,033 | ||||||
Benefits paid | (1,193 | ) | (1,245 | ) | ||||
Currency adjustment | (2,212 | ) | 1,102 | |||||
|
|
|
| |||||
Projected benefit obligation, end of period | $ | 28,434 | $ | 26,368 | ||||
|
|
|
| |||||
Funded status at end of period (1) | $ | (28,434 | ) | $ | (26,368 | ) | ||
|
|
|
| |||||
127
The amounts recognized in our Consolidated Statements of Financial Condition are as follows (in thousands):
| November 30, | ||||||||
| 2014 | 2013 | |||||||
Consolidated statements of financial condition: | ||||||||
Liabilities | $ | 28,434 | $ | 26,368 | ||||
|
|
|
| |||||
Accumulated other comprehensive income (loss), before taxes: | ||||||||
Net gain (loss) | $ | (5,281 | ) | $ | (894 | ) | ||
|
|
|
| |||||
The following tables summarize the components of net periodic pension cost and other amounts recognized in other comprehensive income excluding taxes (in thousands):
| Year Ended November 30, | ||||||||||||
| 2014 | 2013 | 2012 | ||||||||||
Components of net periodic pension cost: | ||||||||||||
Service cost | $ | 40 | $ | 67 | $ | 36 | ||||||
Interest cost on projected benefit obligation | 801 | 902 | 1,027 | |||||||||
Net amortization | 244 | 179 | - | |||||||||
|
|
|
|
|
| |||||||
Net periodic pension cost | $ | 1,085 | $ | 1,148 | $ | 1,063 | ||||||
|
|
|
|
|
| |||||||
| 2014 | 2013 | 2012 | ||||||||||
Amounts recognized in other comprehensive income: | ||||||||||||
Net (gain) loss arising during the period | 4,630 | $ | - | $ | - | |||||||
Amortization of net loss | (243 | ) | - | - | ||||||||
|
|
|
|
|
| |||||||
Total recognized in Other comprehensive income | 4,387 | $ | - | $ | - | |||||||
|
|
|
|
|
| |||||||
Net amount recognized in net periodic benefit cost and Other comprehensive income | 5,472 | $ | - | $ | - | |||||||
|
|
|
|
|
| |||||||
The following are assumptions used to determine the actuarial present value of the projected benefit obligation and net periodic pension benefit cost for the years ended November 30, 2014 and November 30, 2013:
| Year Ended November 30, | ||||||||
| 2014 | 2013 | |||||||
Projected benefit obligation | ||||||||
Discount rate | 2.10 | % | 3.40 | % | ||||
Rate of compensation increase | 3.00 | % | 3.00 | % | ||||
Net periodic pension benefit cost | ||||||||
Discount rate | 3.40 | % | 3.60 | % | ||||
Rate of compensation increase | 3.00 | % | 3.00 | % | ||||
Expected Benefit Payments - Expected benefit payments for each of the next five fiscal years and in the aggregate for the five fiscal years thereafter are as follows (in thousands):
2015 | $ | 1,308 | ||
2016 | 1,324 | |||
2017 | 1,304 | |||
2018 | 1,300 | |||
2019 | 1,275 | |||
2020 through 2024 | 6,776 |
128
Note 18. Compensation Plans
Prior to the Leucadia Transaction, we sponsored the following share-based compensation plans: incentive compensation plan, employee stock purchase plan and the deferred compensation plan. Subsequently, sponsorship of share-based compensation plans was transferred to Leucadia, with outstanding share-based awards relating to Leucadia common shares and future awards to relate to Leucadia common shares. The fair value of share-based awards is estimated on the date of grant based on the market price of the underlying common stock less the impact of selling restrictions subsequent to vesting, if any, and is amortized as compensation expense over the related requisite service periods. We are allocated costs associated with awards granted to our employees under such plans.
In addition, we sponsor non-share-based compensation plans. Non-share-based compensation plans sponsored by us include a profit sharing plan and other forms of restricted cash awards.
The components of total compensation cost associated with certain of our compensation plans are as follows (in millions):
| Successor | Predecessor | |||||||||||||||
| Year Ended November 30, 2014 | Nine Months Ended November 30, 2013 | Three Months Ended February 28, 2013 | Year Ended November 30, 2012 | |||||||||||||
Components of compensation cost: | ||||||||||||||||
Restricted cash awards | $ | 193.7 | $ | 164.4 | $ | 48.2 | $ | 194.4 | ||||||||
Restricted stock and RSUs (1) | 84.5 | 64.4 | 22.3 | 83.8 | ||||||||||||
Profit sharing plan | 6.1 | 3.2 | 2.6 | 5.7 | ||||||||||||
|
|
|
|
|
|
|
| |||||||||
Total compensation cost | $ | 284.3 | $ | 232.0 | $ | 73.1 | $ | 283.9 | ||||||||
|
|
|
|
|
|
|
| |||||||||
| (1) | Total compensation cost associated with restricted stock and RSUs includes the amortization of sign-on, retention and senior executive awards, less forfeitures and clawbacks. Additionally, we recognize compensation cost related to the discount provided to employees in electing to defer compensation in DCP shares. This compensation cost was approximately $268,000 for the year ended November 30, 2014, $111,000 and $72,000 for the nine months ended November 30, 2013 and three months ended February 28, 2013, respectively, and $197,000 for the year ended November 30, 2012. |
Remaining unamortized amounts related to certain compensation plans at November 30, 2014 is as follows:
| Remaining Unamortized Amounts | Weighted Average Vesting Period (in years) | |||||||
Non-vested share-based awards | $ | 95.4 | 1.9 | |||||
Restricted cash awards | 223.7 | 3 | ||||||
|
| |||||||
Total | $ | 319.1 | ||||||
|
| |||||||
The following are descriptions of the compensation plans.
Incentive Compensation Plan. The Incentive Compensation Plan ("Incentive Plan") allows for awards in the form of incentive stock options (within the meaning of Section 422 of the Internal Revenue Code), nonqualified stock options, stock appreciation rights, restricted stock, unrestricted stock, performance awards, restricted stock units, dividend equivalents or other share-based awards. RSUs give a participant the right to receive fully vested common shares at the end of a specified deferral period, allowing a participant to hold an interest tied to common stock on a tax deferred basis. Prior to settlement, RSUs carry no voting or dividend rights associated with the stock ownership, but dividend equivalents are accrued to the extent there are dividends declared on the underlying common shares as cash amounts or as deemed reinvestments in additional RSUs. In connection with the Leucadia Transaction, the Incentive Plan was amended to provide for awards to be issued relating to shares of Leucadia, our parent company at March 1, 2013. Share-based awards outstanding at March 1, 2013 were converted into awards for shares of Leucadia at the Exchange Ratio, with all such awards subject to the same terms and conditions that previously existed (except for the elimination of fractional shares).
129
Restricted stock and RSUs may be granted to new employees as "sign-on" awards, to existing employees as "retention" awards and to certain executive officers as awards for multiple years. Sign-on and retention awards are generally subject to annual ratable vesting over a four-year service period and are amortized as compensation expense on a straight line basis over the related four years. Restricted stock and RSUs are granted to certain senior executives with both performance and service conditions. These awards granted to senior executives are amortized over the service period as we have determined that it is probable that the performance condition will be achieved.
The fair values of outstanding restricted stock and RSUs with future service requirements were remeasured as part of acquisition accounting for the Leucadia transaction, resulting in an increase of approximately $45.1 million to the unrecognized compensation cost allocated to us at March 1, 2013.
Employee Stock Purchase Plan. There is also an Employee Stock Purchase Plan ("ESPP") which we consider noncompensatory effective January 1, 2007. The ESPP permits all regular full-time employees and employees who work part time over 20 hours per week to purchase, at a discount, Leucadia common shares (since the Leucadia Transaction) and permitted purchase of Jefferies Group, Inc. common stock (prior to the Leucadia Transaction). Annual employee contributions are limited to $21,250, are voluntary and made through payroll deduction. The stock purchase price is equal to 95% of the closing price of common stock on the last day of the applicable session (monthly).
Deferred Compensation Plan. There is also a Deferred Compensation Plan, which was established in 2001. Eligible employees are able to defer compensation on a pre-tax basis, with deferred amounts deemed invested at a discount in Leucadia common shares and, prior to the Leucadia Transaction, in Jefferies Group, Inc. common stock ("DCP shares"), or by allocating among any combination of other investment funds available under the Deferred Compensation Plan. In connection with the transaction with Leucadia on March 1, 2013, the Deferred Compensation Plan was amended and deferrals denominated as DCP shares became settleable by delivery of Leucadia common shares. We often invest directly, as a principal, in investments corresponding to the other investment funds, relating to our obligations to perform under the Deferred Compensation Plan. The compensation deferred by our employees is expensed in the period earned. The change in fair value of our investments in assets corresponding to the specified other investment funds are recognized in Principal transaction revenues and changes in the corresponding deferral compensation liability are reflected as Compensation and benefits expense in our Consolidated Statements of Earnings.
Profit Sharing Plan . We have a profit sharing plan, covering substantially all employees, which includes a salary reduction feature designed to qualify under Section 401(k) of the Internal Revenue Code.
Restricted Cash Awards. We provide compensation to new and existing employees in the form of loans and/or other cash awards which are subject to ratable vesting terms with service requirements. We amortize these awards to compensation expense over the relevant service period.
130
Note 19. Non-interest Expenses
The following table presents the components of noninterest expense (in thousands).
| Successor | Predecessor | |||||||||||||||
| Year Ended | Nine Months Ended | Three Months Ended | Year Ended | |||||||||||||
| November 30, 2014 | November 30, 2013 | February 28, 2013 | November 30, 2012 | |||||||||||||
Non-interest expenses: | ||||||||||||||||
Compensation and benefits | $ | 1,698,530 | $ | 1,213,908 | $ | 474,217 | $ | 1,770,798 | ||||||||
Non-compensation expenses: | ||||||||||||||||
Floor brokerage and clearning fees | 215,329 | 150,774 | 46,155 | 183,013 | ||||||||||||
Technology and communications | 268,212 | 193,683 | 59,878 | 244,511 | ||||||||||||
Occupancy and equipment rental | 107,767 | 86,701 | 24,309 | 97,397 | ||||||||||||
Business development | 106,984 | 63,115 | 24,927 | 95,330 | ||||||||||||
Professional services | 109,601 | 72,802 | 24,135 | 73,427 | ||||||||||||
Bad debt provision (1) | 55,355 | 179 | 1,945 | 1,152 | ||||||||||||
Goodwill impairment (2) | 54,000 | - | - | - | ||||||||||||
Intangible assets amortization and impairment (3) | 20,569 | 20,784 | 384 | 5,134 | ||||||||||||
Other | 50,770 | 71,072 | 12,146 | 56,212 | ||||||||||||
|
|
|
|
|
|
|
| |||||||||
Total non-compensation expenses | 988,587 | 659,110 | 193,879 | 756,176 | ||||||||||||
|
|
|
|
|
|
|
| |||||||||
Total non-interest expenses | $ | 2,687,117 | $ | 1,873,018 | $ | 668,096 | $ | 2,526,974 | ||||||||
|
|
|
|
|
|
|
| |||||||||
| (1) | During the fourth quarter of 2014, we recognized a bad debt provision, which primarily relates to a receivable of $52.3 million from a client to which we provided futures clearing and execution services, which declared bankruptcy. |
| (2) | A goodwill impairment loss of $51.9 million and $2.1 million was recognized in the Futures and International Asset Management reporting units at November 30, 2014, respectively. (See Note 12, Goodwill and Other Intangible Assets for further information.) |
| (3) | The amount for the year ended November 30, 2014 includes impairment losses at November 30, 2014 of $7.5 million and $0.1 million in the Futures business and the International Asset Management business, respectively. (See Note 12, Goodwill and Other Intangible Assets for further information.) |
Note 20. Earnings per Share
Earnings per share data is not provided for periods subsequent to March 1, 2013, the date we became a limited liability company and wholly-owned subsidiary of Leucadia. The following is a reconciliation of the numerators and denominators of the Basic and Diluted earnings per common share computations for the three months ended February 28, 2013 and the year ended November 30, 2012 (in thousands, except per share amounts):
131
| Predecessor | ||||||||
| Three Months Ended | Year Ended | |||||||
| February 28, 2013 | November 30, 2012 | |||||||
Earnings for basic earnings per common share: | ||||||||
Net earnings | $ | 90,842 | $ | 323,149 | ||||
Net earnings to noncontrolling interests | 10,704 | 40,740 | ||||||
|
|
|
| |||||
Net earnings to common shareholders | 80,138 | 282,409 | ||||||
Less: Allocation of earnings to participating securities (1) | 5,890 | 17,392 | ||||||
|
|
|
| |||||
Net earnings available to common shareholders | $ | 74,248 | $ | 265,017 | ||||
|
|
|
| |||||
Earnings for diluted earnings per common share: | ||||||||
Net earnings | $ | 90,842 | $ | 323,149 | ||||
Net earnings to noncontrolling interests | 10,704 | 40,740 | ||||||
|
|
|
| |||||
Net earnings to common shareholders | 80,138 | 282,409 | ||||||
Add: Mandatorily redeemable convertible preferred stock dividends | 1,016 | 4,063 | ||||||
Less: Allocation of earnings to participating securities (1) | 5,882 | 17,407 | ||||||
|
|
|
| |||||
Net earnings available to common shareholders | $ | 75,272 | $ | 269,065 | ||||
|
|
|
| |||||
Shares: | ||||||||
Average common shares used in basic computation | 213,732 | 215,989 | ||||||
Stock options | 2 | 2 | ||||||
Mandatorily redeemable convertible preferred stock | 4,110 | 4,110 | ||||||
Convertible debt | - | - | ||||||
|
|
|
| |||||
Average common shares used in diluted computation | 217,844 | 220,101 | ||||||
|
|
|
| |||||
Earnings per common share: | ||||||||
Basic | $ | 0.35 | $ | 1.23 | ||||
Diluted | $ | 0.35 | $ | 1.22 | ||||
| (1) | Represents dividends declared during the period on participating securities plus an allocation of undistributed earnings to participating securities. Net losses are not allocated to participating securities. Participating securities represent restricted stock and restricted stock units for which requisite service has not yet been rendered and amounted to weighted average shares of 16,756,000 and 14,123,000 for the three months ended February 28, 2013 and the year ended November 30, 2012, respectively. Dividends declared on participating securities during the three months ended February 28, 2013 and the year ended November 30, 2012 amounted to approximately $1.3 million and $4.3 million, respectively. Undistributed earnings are allocated to participating securities based upon their right to share in earnings if all earnings for the period had been distributed. |
Our ability to pay distributions to Leucadia is subject to the restrictions set forth in certain financial covenants associated with the Credit Facility as described in Note 14, Long-Term Debt and the governing provisions of the Delaware Limited Liability Company Act.
Dividends per share of common stock declared during the quarter are reflected below:
| 1 st Quarter | 2 nd Quarter | 3 rd Quarter | 4 th Quarter | |||||||||||||
2013 | $ | 0.075 | N/a | N/a | N/a | |||||||||||
2012 | $ | 0.075 | $ | 0.075 | $ | 0.075 | $ | 0.075 | ||||||||
Note 21. Income Taxes
Total income taxes for the year ended November 30, 2014, the nine months ended November 30, 2013, the three months ended February 28, 2013, and the year ended November 30, 2012 were allocated as follows (in thousands):
| Successor | Predecessor | |||||||||||||||
| Year Ended November 30, 2014 | Nine Months Ended November 30, 2013 | Three Months Ended February 28, 2013 | Year Ended November 30, 2012 | |||||||||||||
Income tax expense | $ | 142,061 | $ | 94,686 | $ | 48,645 | $ | 168,646 | ||||||||
Stockholders' equity, for compensation expense for tax purposes (in excess of)/less than amounts recognized for financial reporting purposes | $ | (1,276 | ) | $ | (2,873 | ) | $ | 17,965 | $ | (19,789 | ) | |||||
132
The provision for income tax expense consists of the following components (in thousands):
| Successor | Predecessor | |||||||||||||||
| Year Ended November 30, | Nine Months Ended November 30, | Three Months Ended February 28, | Year Ended November 30, | |||||||||||||
| 2014 | 2013 | 2013 | 2012 | |||||||||||||
Current: | ||||||||||||||||
U.S. Federal | $ | 4,335 | $ | 50,089 | $ | 22,936 | $ | 62,710 | ||||||||
U.S. state and local | 4,056 | 6,263 | (3,176 | ) | 18,520 | |||||||||||
Foreign | 11,475 | 7,050 | (1,950 | ) | 2,773 | |||||||||||
|
|
|
|
|
|
|
| |||||||||
| 19,866 | 63,402 | 17,810 | 84,003 | |||||||||||||
|
|
|
|
|
|
|
| |||||||||
Deferred: | ||||||||||||||||
U.S. Federal | 87,293 | 25,262 | 17,392 | 79,224 | ||||||||||||
U.S. state and local | 27,181 | 8,868 | 9,761 | 13,006 | ||||||||||||
Foreign | 7,721 | (2,846 | ) | 3,682 | (7,587 | ) | ||||||||||
|
|
|
|
|
|
|
| |||||||||
| 122,195 | 31,284 | 30,835 | 84,643 | |||||||||||||
|
|
|
|
|
|
|
| |||||||||
| $ | 142,061 | $ | 94,686 | $ | 48,645 | $ | 168,646 | |||||||||
|
|
|
|
|
|
|
| |||||||||
Income tax expense differed from the amounts computed by applying the U.S. Federal statutory income tax rate of 35% to earnings before income taxes as a result of the following (in thousands):
| Successor | Predecessor | |||||||||||||||||||||||||||||||
| Year Ended November 30, | Nine Months Ended November 30, | Three Months Ended February 28, | Year Ended November 30, | |||||||||||||||||||||||||||||
| 2014 | 2013 | 2013 | 2012 | |||||||||||||||||||||||||||||
| Amount | Percent | Amount | Percent | Amount | Percent | Amount | Percent | |||||||||||||||||||||||||
Computed expected income taxes | $ | 106,058 | 35.0 | % | $ | 92,504 | 35.0 | % | $ | 48,820 | 35.0 | % | $ | 172,128 | 35.0 | % | ||||||||||||||||
Increase (decrease) in income taxes resulting from: | ||||||||||||||||||||||||||||||||
State and city income taxes, net of Federal income tax benefit | 20,304 | 6.7 | 9,835 | 3.7 | 4,280 | 3.1 | 20,492 | 4.2 | ||||||||||||||||||||||||
Income alloacted to Noncontrolling interest, not subject to tax | (1,190 | ) | (0.4 | ) | (2,946 | ) | (1.1 | ) | (3,553 | ) | (2.5 | ) | (14,161 | ) | (2.9 | ) | ||||||||||||||||
Foreign rate differential | (9,024 | ) | (2.9 | ) | (4,750 | ) | (1.8 | ) | (2,993 | ) | (2.2 | ) | (7,528 | ) | (1.5 | ) | ||||||||||||||||
Tax exempt income | (6,746 | ) | (2.2 | ) | (3,742 | ) | (1.4 | ) | (1,003 | ) | (0.7 | ) | (3,979 | ) | (0.8 | ) | ||||||||||||||||
Non deductible settlements | 3,850 | 1.3 | 4,900 | 1.9 | - | - | - | - | ||||||||||||||||||||||||
Valuation allowance related to Futures business | 4,655 | 1.5 | - | - | - | - | - | - | ||||||||||||||||||||||||
Goodwill impairment | 13,619 | 4.5 | - | - | - | - | - | - | ||||||||||||||||||||||||
Other, net | 10,535 | 3.4 | (1,115 | ) | (0.5 | ) | 3,094 | 2.2 | 1,694 | 0.3 | ||||||||||||||||||||||
|
|
|
|
|
|
|
|
|
|
|
|
|
|
|
| |||||||||||||||||
Total income taxes | $ | 142,061 | 46.9 | % | $ | 94,686 | 35.8 | % | $ | 48,645 | 34.9 | % | $ | 168,646 | 34.3 | % | ||||||||||||||||
|
|
|
|
|
|
|
|
|
|
|
|
|
|
|
| |||||||||||||||||
133
The following table presents a reconciliation of gross unrecognized tax benefits (in thousands):
| Successor | Predecessor | |||||||||||||||
| Year Ended | Nine Months Ended | Three Months Ended | Year Ended | |||||||||||||
| November 30, 2014 | November 30, 2013 | February 28, 2013 | November 30, 2012 | |||||||||||||
Balance at beginning of period | $ | 126,844 | $ | 129,010 | $ | 110,539 | $ | 79,779 | ||||||||
Increases based on tax positions related to the current period | 4,831 | 8,748 | 7,185 | 30,671 | ||||||||||||
Increases based on tax positions related to prior periods | 1,624 | 7,383 | 15,356 | 7,549 | ||||||||||||
Decreases based on tax positions related to prior periods | (1,709 | ) | (18,297 | ) | (4,070 | ) | (5,893 | ) | ||||||||
Decreases related to settlements with taxing authorities | (4,928 | ) | - | - | (487 | ) | ||||||||||
Decreases related to a lapse of applicable statutes of limitation | - | - | - | (1,080 | ) | |||||||||||
|
|
|
|
|
|
|
| |||||||||
Balance at end of period | $ | 126,662 | $ | 126,844 | $ | 129,010 | $ | 110,539 | ||||||||
|
|
|
|
|
|
|
| |||||||||
The total amount of unrecognized benefit that, if recognized, would favorably affect the effective tax rate was $84.5 million and $85.5 million (net of federal benefits of taxes) at November 30, 2014 and November 30, 2013, respectively.
We recognize interest accrued related to unrecognized tax benefits in Interest expense. Penalties, if any, are recognized in Other expenses in the Consolidated Statements of Earnings. Net interest expense related to unrecognized tax benefits was $7.7 million and $5.8 million for year ended November 30, 2014 and the nine months ended November 30, 2013, respectively. For the three months ended February 28, 2013 and the year ended November 30, 2012, interest expense was $1.8 million and $4.5 million, respectively. At November 30, 2014 and November 30, 2013, we had interest accrued of approximately $30.6 million and $22.9 million, respectively, included in Accrued expenses and other liabilities in the Consolidated Statements of Financial Condition. No material penalties were accrued for the periods ended November 30, 2014 and November 30, 2013.
The cumulative tax effects of temporary differences that give rise to significant portions of the deferred tax assets and liabilities at November 30, 2014 and November 30, 2013 are presented below (in thousands):
| November 30, | November 30, | |||||||
| 2014 | 2013 | |||||||
Deferred tax assets: | ||||||||
Compensation and benefits | $ | 302,072 | $ | 373,964 | ||||
Net operating loss | 17,830 | 24,147 | ||||||
Long-term debt | 140,685 | 191,274 | ||||||
Accrued expenses & other | 89,273 | 86,336 | ||||||
|
|
|
| |||||
Sub-total | 549,860 | 675,721 | ||||||
Valuation allowance | (13,069 | ) | (11,140 | ) | ||||
|
|
|
| |||||
Total deferred tax assets | 536,791 | 664,581 | ||||||
|
|
|
| |||||
Deferred tax liabilities: | ||||||||
Amortization of intangibles | 97,268 | 98,798 | ||||||
Other | 26,454 | 30,842 | ||||||
|
|
|
| |||||
Total deferred tax liabilities | 123,722 | 129,640 | ||||||
|
|
|
| |||||
Net deferred tax asset, included in Other assets | $ | 413,069 | $ | 534,941 | ||||
|
|
|
| |||||
The valuation allowance represents the portion of our deferred tax assets for which it is more likely than not that the benefit of such items will not be realized. We believe that the realization of the net deferred tax asset of $413.1 million is more likely than not based on expectations of future taxable income in the jurisdictions in which we operate.
134
At November 30, 2014, we had gross net operating loss carryforwards in Asia, primarily Japan, and in Europe, primarily the United Kingdom ("U.K."), of approximately $85.9 million, in aggregate. The Japanese losses begin to expire in the year 2018 while the U.K. losses have an unlimited carryforward period. A deferred tax asset of $2.4 million related to net operating losses in Asia has been fully offset by a valuation allowance while a $5.8 million deferred tax asset related to net operating losses in Europe has been fully offset by a valuation allowance. The remaining valuation allowance is attributable to deferred tax assets related to compensation and benefits, capital losses, and tax credits in the U.K.
Pursuant to a tax sharing agreement entered into between us and Leucadia, payments are made between us and Leucadia to settle current tax assets and liabilities. At November 30, 2014, there is a net current tax receivable of $77.0 million, which includes a gross receivable from Leucadia of $58.6 million. The remaining balance reflects receivables, net of payables, from various taxing authorities.
At November 30, 2014 and November 30, 2013, we had approximately $171.0 million and $134.0 million, respectively, of earnings attributable to foreign subsidiaries for which no U.S. Federal income tax provision has been recorded. Except to the extent such earnings can be repatriated tax efficiently, they are permanently invested abroad. Accordingly, a deferred tax liability of approximately $46.0 million and $35.0 million has not been recorded with respect to these earnings at November 30, 2014 and November 30, 2013, respectively.
We are currently under examination by the Internal Revenue Service and other major tax jurisdictions. We do not expect that resolution of these examinations will have a material effect on our consolidated financial position, but could have a material impact on the consolidated results of operations for the period in which resolution occurs. It is reasonably possible that, within the next twelve months, statutes of limitation will expire which would have the effect of reducing the balance of unrecognized tax benefits by $5.5 million.
The table below summarizes the earliest tax years that remain subject to examination in the major tax jurisdictions in which we operate:
Jurisdiction | Tax Year | |||
United States | 2006 | |||
United Kingdom | 2013 | |||
California | 2006 | |||
Connecticut | 2006 | |||
New Jersey | 2007 | |||
New York State | 2001 | |||
New York City | 2003 | |||
135
Note 22. Commitments, Contingencies and Guarantees
Commitments
The following table summarizes our commitments associated with our capital market and asset management business activities at November 30, 2014 (in millions):
| Expected Maturity Date | ||||||||||||||||||||||||
| 2015 | 2016 | 2017 and 2018 | 2019 and 2020 | 2021 and Later | Maximum Payout | |||||||||||||||||||
Equity commitments (1) | $ | - | $ | 9.3 | $ | 0.8 | $ | - | $ | 216.3 | $ | 226.4 | ||||||||||||
Loan commitments (1) | 50.7 | 440.2 | 283.1 | 20.7 | 0.2 | 794.9 | ||||||||||||||||||
Mortgage-related and other purchase commitments | 1,058.5 | 1,165.8 | 117.6 | - | - | 2,341.9 | ||||||||||||||||||
Forward starting reverse repos and repos | 5,127.2 | - | - | - | - | 5,127.2 | ||||||||||||||||||
Other unfunded commitments (1) | 6.3 | - | - | - | 23.0 | 29.3 | ||||||||||||||||||
|
|
|
|
|
|
|
|
|
|
|
| |||||||||||||
| $ | 6,242.7 | $ | 1,615.3 | $ | 401.5 | $ | 20.7 | $ | 239.5 | $ | 8,519.7 | |||||||||||||
|
|
|
|
|
|
|
|
|
|
|
| |||||||||||||
| (1) | Equity, loan commitments and other unfunded commitments are presented by contractual maturity date. The amounts are however available on demand. |
The table below presents our credit exposure from our loan commitments, including funded amounts, summarized by period of expiration at November 30, 2014. Credit exposure is based on the external credit ratings of the underlyings or referenced assets of our loan commitments. Since commitments associated with these business activities may expire unused, they do not necessarily reflect the actual future cash funding requirements (in millions):
Credit Ratings | 2015 | 2016-2020 | 2021 and Later | Total Corporate Lending Exposure (1) | Corporate Lending Exposure at Fair Value (2) | Corporate Lending Commitments (3) | ||||||||||||||||||
Investment grade | $ | - | $ | 55.1 | $ | - | $ | 55.1 | $ | - | $ | 55.1 | ||||||||||||
Non-investment grade | - | 191.3 | - | 191.3 | 18.9 | 172.4 | ||||||||||||||||||
Unrated | 129.3 | 620.9 | 2.2 | 752.4 | 185.0 | 567.4 | ||||||||||||||||||
|
|
|
|
|
|
|
|
|
|
|
| |||||||||||||
Total | $ | 129.3 | $ | 867.3 | $ | 2.2 | $ | 998.8 | $ | 203.9 | $ | 794.9 | ||||||||||||
|
|
|
|
|
|
|
|
|
|
|
| |||||||||||||
| (1) | Total corporate lending exposure represents the potential loss assuming the fair value of funded loans and lending commitments were zero. |
| (2) | The corporate lending exposure at fair value includes $222.6 million of funded loans included in Financial instruments owned-Loans and Loans to and investments in related parties, and a $18.7 million net liability related to lending commitments recorded in Financial instruments sold, not yet purchased-Derivatives and Financial instruments owned-Derivatives in the Consolidated Statement of Financial Condition at November 30, 2014. |
| (3) | Represents the notional amount of unfunded lending commitments. |
Equity Commitments. Includes commitments to invest in our joint ventures, Jefferies Finance and Jefferies LoanCore, and commitments to invest in private equity funds and in Jefferies Capital Partners, LLC, the manager of the private equity funds, which consists of a team led by Brian P. Friedman, one of our directors and Chairman of the Executive Committee. At November 30, 2014, our outstanding commitments relating to Jefferies Capital Partners, LLC and its private equity funds was $30.5 million. (See Note 11, Investments for additional information regarding our investments in Jefferies Finance and Jefferies LoanCore.)
Additionally, At November 30, 2014, we had other outstanding equity commitments to invest up to $1.8 million in various other investments.
136
Loan Commitments. From time to time we make commitments to extend credit to investment banking and other clients in loan syndication, acquisition finance and securities transactions and to SPE sponsors in connection with the funding of CLO and other asset-backed transactions. These commitments and any related drawdowns of these facilities typically have fixed maturity dates and are contingent on certain representations, warranties and contractual conditions applicable to the borrower. At November 30, 2014, we had $444.9 million of outstanding loan commitments to clients.
Loan commitments outstanding at November 30, 2014, also include our portion of the outstanding secured revolving credit facility provided to Jefferies Finance, to support loan underwritings by Jefferies Finance.
Mortgage-Related and Other Purchase Commitments. We enter into forward contracts to purchase mortgage participation certificates, mortgage-backed securities and consumer loans. The mortgage participation certificates evidence interests in mortgage loans insured by the Federal Housing Administration and the mortgage-backed securities are insured or guaranteed by the FNMA (Fannie Mae), the Federal Home Loan Mortgage Corporation (Freddie Mac) or the GNMA (Ginnie Mae). We frequently securitize the mortgage participation certificates and mortgage-backed securities. The fair value of mortgage-related and other purchase commitments recorded in the Consolidated Statements of Financial Condition was $99.6 million at November 30, 2014.
Forward Starting Reverse Repos and Repos. We enter into commitments to take possession of securities with agreements to resell on a forward starting basis and to sell securities with agreements to repurchase on a forward starting basis that are primarily secured by U.S. government and agency securities.
Other Unfunded Commitments. Other unfunded commitments include obligations in the form of revolving notes to provide financing to asset-backed and CLO vehicles. Upon advancing funds, drawn amounts are collateralized by the assets of an entity.
Leases. As lessee, we lease certain premises and equipment under noncancelable agreements expiring at various dates through 2029 which are operating leases. At November 30, 2014, future minimum aggregate annual lease payments under such leases (net of subleases) for fiscal years ended November 30, 2015 through 2019 and the aggregate amount thereafter, are as follows (in thousands):
| Fiscal Year | Operating Leases | |||
2015 | $ | 42,697 | ||
2016 | 53,056 | |||
2017 | 56,089 | |||
2018 | 56,038 | |||
2019 | 54,785 | |||
Thereafter | 443,361 | |||
|
| |||
Total | $ | 706,026 | ||
|
| |||
The total minimum rentals to be received in the future under non-cancelable subleases at November 30, 2014 was $5.7 million.
Rental expense, net of subleases, amounted to $57.4 million, $43.2 million, $12.1 million, and $48.4 million for the year ended November 30, 2014, the nine months ended November 30, 2013, the three months ended February 28, 2013, and the year ended November 30, 2012, respectively.
During 2012, we entered into a master sale and leaseback agreement under which we sold and have leased back existing and additional new equipment supplied by the lessor. The transaction resulted in a gain of $2.0 million, which is being amortized into earnings in proportion to and is reflected net against the leased equipment. The lease may be terminated on September 30, 2017 for a termination cost of the present value of the remaining lease payments plus a residual value. If not terminated early, the lease term is approximately five years from the start of the supply of new and additional equipment, which commenced on various dates in 2013 and continues into 2014. At November 30, 2014, minimum future lease payments are as follows (in thousands):
137
| Fiscal Year | ||||
2015 | $ | 3,887 | ||
2016 | 3,887 | |||
2017 | 3,887 | |||
2018 | 1,583 | |||
2019 | 167 | |||
|
| |||
Net minimum lease payments | 13,411 | |||
Less amount representing interest | 927 | |||
|
| |||
Present value of net minimum lease payments | $ | 12,484 | ||
|
| |||
Contingencies
Seven class-action lawsuits had been filed in New York and Delaware on behalf of a class consisting of Jefferies Group's stockholders concerning the transaction through which Jefferies Group LLC became a wholly owned subsidiary of Leucadia National Corporation. The class actions named as defendants Leucadia, Jefferies Group, certain members of our board of directors, certain members of Leucadia's board of directors and, in certain of the actions, certain transaction-related subsidiaries. On October 31, 2014, the remaining defendants in the Delaware litigation entered into a settlement agreement with the plaintiffs in the Delaware litigation. The terms of that agreement, which are subject to court approval, provide for an aggregate payment of $70.0 million by Leucadia, who will bear the costs of the settlement, to certain former equity holders of Jefferies Group, other than the defendants and certain of their affiliates, along with attorneys' fees to be determined and approved by the court. The agreement further provides that the settlement will be paid, at Leucadia's option, in either cash or Leucadia common shares. If approved by the court, the settlement will resolve all of the class-action claims in Delaware, and release the claims brought in New York.
During the first quarter of 2014, we reached a non-prosecution agreement with the United States Attorney for the District of Connecticut and a settlement agreement with the SEC relating to an investigation of purchases and sales of mortgage-backed securities. That investigation arose from a matter that came to light in late 2011, at which time we terminated a mortgage-backed-securities trader who was then indicted by the United States Attorney for the District of Connecticut in January 2013 and separately charged in a civil complaint by the SEC. Those agreements include an aggregate $25.0 million in payments, of which approximately $11.0 million are payments to trading counterparties impacted by those activities, approximately $10.0 million of which is a fine payable to the U.S. Attorney's Office, and approximately $4.0 million of which is a fine payable to the SEC. All such amounts were recognized in our year-end 2013 financial statements. At November 30, 2014, the outstanding reserve with respect to remaining payments to be made under the agreements is approximately $1.9 million. Additionally, pursuant to an undertaking required by the SEC settlement, Jefferies has retained an Independent Compliance Consultant.
Guarantees
Derivative Contracts. As a dealer, we make markets and trade in a variety of derivative instruments. Certain derivative contracts that we have entered into meet the accounting definition of a guarantee under U.S. GAAP, including credit default swaps, written foreign currency options and written equity put options. On certain of these contracts, such as written interest rate caps and foreign currency options, the maximum payout cannot be quantified since the increase in interest or foreign exchange rates are not contractually limited by the terms of the contract. As such, we have disclosed notional values as a measure of our maximum potential payout under these contracts.
138
The following table summarizes the notional amounts associated with our derivative contracts meeting the definition of a guarantee under U.S. GAAP at November 30, 2014 (in millions):
| Expected Maturity Date | ||||||||||||||||||||||||
Guarantee Type: | 2017 and | 2019 and | 2021 and | Notional/ Maximum Payout | ||||||||||||||||||||
| 2015 | 2016 | 2018 | 2020 | Later | ||||||||||||||||||||
Derivative contracts-non-credit related | $ | 59,875.6 | $ | 229.6 | $ | 252.1 | $ | 721.8 | $ | 487.7 | $ | 61,566.8 | ||||||||||||
Written derivative contracts-credit related | - | - | - | 485.0 | - | 485.0 | ||||||||||||||||||
|
|
|
|
|
|
|
|
|
|
|
| |||||||||||||
Total derivative contracts | $ | 59,875.6 | $ | 229.6 | $ | 252.1 | $ | 1,206.8 | $ | 487.7 | $ | 62,051.8 | ||||||||||||
|
|
|
|
|
|
|
|
|
|
|
| |||||||||||||
At November 30, 2014 the external credit ratings of the underlyings or referenced assets for our credit related derivatives contracts (in millions):
| External Credit Rating | ||||||||||||||||||||||||||||
| AAA/ Aaa | AA/ Aa | A | BBB/ Baa | Below Investment Grade | Unrated | Notional/ Maximum Payout | ||||||||||||||||||||||
Credit related derivative contracts: | ||||||||||||||||||||||||||||
Index credit default swaps | $ | 480.0 | $ | - | $ | - | $ | - | $ | - | $ | - | $ | 480.0 | ||||||||||||||
Single name credit default swaps | $ | - | $ | - | $ | - | $ | 5.0 | $ | - | $ | - | $ | 5.0 | ||||||||||||||
The derivative contracts deemed to meet the definition of a guarantee under U.S. GAAP are before consideration of hedging transactions and only reflect a partial or "one-sided" component of any risk exposure. Written equity options and written credit default swaps are often executed in a strategy that is in tandem with long cash instruments ( e.g. , equity and debt securities). We substantially mitigate our exposure to market risk on these contracts through hedges, such as other derivative contracts and/or cash instruments, and we manage the risk associated with these contracts in the context of our overall risk management framework. We believe notional amounts overstate our expected payout and that fair value of these contracts is a more relevant measure of our obligations. At November 30, 2014, the fair value of derivative contracts meeting the definition of a guarantee is approximately $851.7 million.
Loan Guarantees . We have provided a guarantee to Jefferies Finance that matures in January 2021, whereby we are required to make certain payments to a SPE sponsored by Jefferies Finance in the event that Jefferies Finance is unable to meet its obligations to the SPE and a guarantee of a credit agreement with an indefinite term for a fund owned by employees. At November 30, 2014, the maximum amount payable under these guarantees is $31.0 million.
Stand by Letters of Credit. At November 30, 2014, we provided guarantees to certain counterparties in the form of standby letters of credit in the amount of $47.8 million, which expire within one year. Stand by letters of credit commit us to make payment to the beneficiary if the guaranteed party fails to fulfill its obligation under a contractual arrangement with that beneficiary. Since commitments associated with these collateral instruments may expire unused, the amount shown does not necessarily reflect the actual future cash funding requirement.
Other Guarantees. We are members of various exchanges and clearing houses. In the normal course of business we provide guarantees to securities clearinghouses and exchanges. These guarantees generally are required under the standard membership agreements, such that members are required to guarantee the performance of other members. Additionally, if a member becomes unable to satisfy its obligations to the clearinghouse, other members would be required to meet these shortfalls. To mitigate these performance risks, the exchanges and clearinghouses often require members to post collateral. Our obligations under such guarantees could exceed the collateral amounts posted. Our maximum potential liability under these arrangements cannot be quantified; however, the potential for us to be required to make payments under such guarantees is deemed remote. Accordingly no liability has been recognized for these arrangements.
Note 23. Net Capital Requirements
As broker-dealers registered with the SEC and member firms of the Financial Industry Regulatory Authority ("FINRA"), Jefferies and Jefferies Execution are subject to the SEC Uniform Net Capital Rule ("Rule 15c3-1"), which requires the maintenance of minimum net capital, and have elected to calculate minimum capital requirements under the alternative method permitted by Rule 15c3-1 in calculating net capital. On September 1, 2014, Jefferies Bache, LLC (an FCM) merged with and into Jefferies. Jefferies, as the surviving entity, registered as an FCM and is subject to Rule 1.17 of the CFTC, which sets forth minimum financial requirements. The minimum net capital requirement in determining excess net capital for a dually-registered U.S. broker-dealer and FCM is equal to the greater of the requirement under Rule 15c3-1 or CFTC Rule 1.17.
139
At November 30, 2014, Jefferies and Jefferies Execution's net capital and excess net capital were as follows (in thousands):
| Net Capital | Excess Net Capital | |||||||
Jefferies | $ | 1,025,113 | $ | 913,465 | ||||
Jefferies Execution | 6,150 | 5,900 | ||||||
FINRA is the designated self-regulatory organization ("DSRO") for our U.S. broker-dealers and the Chicago Mercantile Exchange is the DSRO for Jefferies as an FCM.
Certain other U.S. and non-U.S. subsidiaries are subject to capital adequacy requirements as prescribed by the regulatory authorities in their respective jurisdictions, including Jefferies International Limited and Jefferies Bache Limited, which are authorized and regulated by the Financial Conduct Authority in the U.K.
The regulatory capital requirements referred to above may restrict our ability to withdraw capital from our regulated subsidiaries.
Note 24. Segment Reporting
We operate in two principal segments – Capital Markets and Asset Management. The Capital Markets segment includes our securities, commodities, futures and foreign exchange brokerage trading activities and investment banking, which is comprised of underwriting and financial advisory activities. The Capital Markets reportable segment provides the sales, trading, origination and advisory effort for various fixed income, equity and advisory products and services. The Asset Management segment provides investment management services to investors in the U.S. and overseas.
Our reportable business segment information is prepared using the following methodologies:
| • | Net revenues and expenses directly associated with each reportable business segment are included in determining earnings before taxes. |
| • | Net revenues and expenses not directly associated with specific reportable business segments are allocated based on the most relevant measures applicable, including each reportable business segment's net revenues, headcount and other factors. |
| • | Reportable business segment assets include an allocation of indirect corporate assets that have been fully allocated to our reportable business segments, generally based on each reportable business segment's capital utilization. |
140
Our net revenues and expenses by segment are summarized below (in millions):
| Successor | Predecessor | |||||||||||||||
| Year Ended November 30, 2014 | Nine Months Ended November 30, 2013 | Three Months Ended February 28, 2013 | Year Ended November 30, 2012 | |||||||||||||
Capital Markets: | ||||||||||||||||
Net revenues | $ | 2,949.0 | $ | 2,074.1 | $ | 807.6 | $ | 3,034.7 | ||||||||
Expenses | $ | 2,652.0 | $ | 1,840.4 | $ | 660.6 | $ | 2,496.4 | ||||||||
Asset Management: | ||||||||||||||||
Net revenues | $ | 41.1 | $ | 66.6 | $ | 10.9 | $ | 27.0 | ||||||||
Expenses | $ | 35.1 | $ | 32.6 | $ | 7.5 | $ | 30.6 | ||||||||
Total: | ||||||||||||||||
Net revenues | $ | 2,990.1 | $ | 2,140.7 | $ | 818.5 | $ | 3,061.7 | ||||||||
Expenses | $ | 2,687.1 | $ | 1,873.0 | $ | 668.1 | $ | 2,527.0 | ||||||||
The following table summarizes our total assets by segment at November 30, 2014 and November 30, 2013 (in millions):
| November 30, 2014 | November 30, 2013 | |||||||
Segment assets: | ||||||||
Capital Markets | $ | 44,002.6 | $ | 39,276.8 | ||||
Asset Management | 515.0 | 900.2 | ||||||
|
|
|
| |||||
Total assets | $ | 44,517.6 | $ | 40,177.0 | ||||
|
|
|
| |||||
Net Revenues by Geographic Region
Net revenues for the Capital Market segment are recorded in the geographic region in which the position was risk-managed or, in the case of investment banking, in which the senior coverage banker is located. For Asset Management, net revenues are allocated according to the location of the investment advisor. Net revenues by geographic region were as follows (in thousands):
| Successor | Predecessor | |||||||||||||||
| Year Ended November 30, 2014 | Nine Months Ended November 30, 2013 | Three Months Ended February 28, 2013 | Year Ended November 30, 2012 | |||||||||||||
Americas (1) | $ | 2,261,683 | $ | 1,651,789 | $ | 663,588 | $ | 2,507,839 | ||||||||
Europe (2) | 634,358 | 441,795 | 133,104 | 450,823 | ||||||||||||
Asia | 94,097 | 47,097 | 21,852 | 102,990 | ||||||||||||
|
|
|
|
|
|
|
| |||||||||
Net revenues | $ | 2,990,138 | $ | 2,140,681 | $ | 818,544 | $ | 3,061,652 | ||||||||
|
|
|
|
|
|
|
| |||||||||
| (1) | Substantially all relates to U.S. results. |
| (2) | Substantially all relates to U.K. results. |
141
Note 25. Related Party Transactions
Jefferies Capital Partners and JEP IV Related Funds. We have loans to and/or equity investments in private equity funds and in Jefferies Capital Partners, LLC, the manager of the Jefferies Capital Partners funds, which are managed by a team led by Brian P. Friedman, one of our directors and our Chairman of the Executive Committee ("Private Equity Related Funds"). At November 30, 2014 and November 30, 2013, loans to and/or equity investments in Private Equity Related Funds were in aggregate $60.7 million and $61.7 million, respectively. The following table presents interest income earned on loans to Private Equity Related Funds and other revenues and investment income (loss) related to net gains and losses on our investment in Private Equity Related Funds (in thousands):
| Successor | Predecessor | |||||||||||||||
| Year Ended November 30, 2014 | Nine Months Ended November 30, 2013 | Three Months Ended February 28, 2013 | Year Ended November 30, 2012 | |||||||||||||
Interest income | $ | - | $ | 852 | $ | 516 | $ | 3,100 | ||||||||
Other revenues and investment income (loss) | (14,868 | ) | 9,294 | 947 | (8,500 | ) | ||||||||||
For further information regarding our commitments and funded amounts to Private Equity Related Funds, see Note 22, Commitments, Contingencies and Guarantees.
Berkadia Commercial Mortgage, LLC. At November 30, 2014 and November 30, 2013, we have commitments to purchase $344.8 million and $300.0 million, respectively, in agency commercial mortgage-backed securities from Berkadia Commercial Mortgage, LLC, which is partially owned by Leucadia.
Harbinger Group Inc. As part of our loan secondary trading activities we have unsettled purchases and sales of loans pertaining to portfolio companies within funds managed by Harbinger of $232.0 million.
National Beef Packaging Company, LLC ("National Beef"). We act as an FCM for National Beef, which is partially owned by Leucadia. At November 30, 2014, we had a customer payable to National Beef of $4.1 million and recognized commissions of $0.2 million during the year ended November 30, 2014.
Officers, Directors and Employees. At November 30, 2014 and November 30, 2013, we had $20.1 million and $13.9 million, respectively, of loans outstanding to certain of our employees (none of whom are executive officers or directors) that are included in Other assets on the Consolidated Statements of Financial Condition. Receivables from and payables to customers includes balances arising from officers, directors and employees individual security transactions. These transactions are subject to the same regulations as all customer transactions and are provided on substantially the same terms. During 2014, we sold private equity interests with a fair value of $4.0 million at their then fair value to a private equity fund owned by our employees and have also provided a guarantee of the fund's credit agreement.
The following is a description of related party transactions with Leucadia:
| • | Under a service agreement, we charge Leucadia for certain services which, for the year ended November 30, 2014 and nine months ended November 30, 2013 amounted to $22.3 million and $16.7 million, respectively. At November 30, 2014 and November 30, 2013, we had a receivable from Leucadia of $10.9 million and $2.3 million, respectively, which is included within Other assets on the Consolidated Statements of Financial Condition. At November 30, 2014 and November 30, 2013, we had a payable to Leucadia of $41.5 million and $6.7 million respectively, related to stock compensation arrangements and senior executive benefits provided by Leucadia, which is included within Other liabilities on the Consolidated Statements of Financial Condition. |
142
| • | We have a tax sharing agreement with Leucadia, for which any amounts outstanding are included in Other assets in the Consolidated Statements of Financial Condition. (See Note 21, Income Taxes) |
| • | During 2013, we sold 100% of our interests in Jefferies Management Limited ("JIML"), our special situations asset management business, to Leucadia for consideration of $2.3 million in the form of an intercompany loan receivable from Leucadia. The net assets of JIML that were transferred were $2.3 million, including goodwill of $400,000. No gain or loss was recognized on the sale. |
| • | At November 30, 2014 and November 30, 2013, $25.4 million and $80.5 million, respectively, of the total noncontrolling interests in asset management entities that are consolidated by us are attributed to Leucadia. |
| • | During the year ended November 30, 2014, we received investment banking revenues for providing advisory and debt capital market services to Leucadia and its' subsidiaries of $3.1 million, which is recorded in Investment banking revenues on the Consolidated Statement of Earnings. |
| • | On March 18, 2014, we sold our investment in Harbinger Group Inc., consisting of approximately 18.6 million shares, to Leucadia at the closing price on that date. In addition, on February 28, 2014, we sold our ownership interest in CoreCommodity Capital, LLC (formerly CoreCommodity Management, LLC, our commodity asset management business) to Leucadia at a fair value. |
For information regarding the transaction on March 1, 2013, see Note 4, Leucadia and Related Transactions and for information regarding other investments by Leucadia, see Note 16, Noncontrolling Interests and Mandatorily Redeemable Preferred Interests of Consolidated Subsidiaries.
For information on transactions with our equity method investees, see Note 11, Investments.
143
Note 26. Selected Quarterly Financial Data (Unaudited)
The following is a summary of unaudited quarterly statements of earnings for the year ended November 30, 2014, the nine months ended November 30, 2013 and the three months ended February 28, 2013 (in thousands, except per share amounts):
| Successor | ||||||||||||||||
| Three Months Ended | ||||||||||||||||
| November 30, 2014 | August 31, 2014 | May 31, 2014 | February 28, 2014 | |||||||||||||
Total revenues | $ | 723,004 | $ | 1,055,435 | $ | 970,786 | $ | 1,097,040 | ||||||||
Net revenues | 524,809 | 843,309 | 722,992 | 899,028 | ||||||||||||
Earnings (loss) before income taxes | (114,020 | ) | 135,635 | 99,137 | 182,269 | |||||||||||
Earnings (loss) attributable to Jefferies Group LLC | (99,759 | ) | 83,561 | 61,326 | 112,432 | |||||||||||
Earnings per common share: | ||||||||||||||||
Basic | N/a | N/a | N/a | N/a | ||||||||||||
|
|
|
|
|
|
|
| |||||||||
Diluted | N/a | N/a | N/a | N/a | ||||||||||||
|
|
|
|
|
|
|
| |||||||||
| Successor | Predecessor | |||||||||||||||
| Three Months Ended | ||||||||||||||||
| November 30, 2013 | August 31, 2013 | May 31, 2013 | February 28, 2013 | |||||||||||||
Total revenues | $ | 1,139,157 | $ | 710,682 | $ | 869,901 | $ | 1,021,960 | ||||||||
Net revenues | 950,548 | 531,695 | 658,438 | 818,544 | ||||||||||||
Earnings before income taxes | 175,660 | 23,382 | 65,253 | 139,487 | ||||||||||||
Earnings attributable to Jefferies Group LLC/common stockholders | 109,943 | 11,740 | 39,508 | 80,138 | ||||||||||||
Earnings per common share: | ||||||||||||||||
Basic | N/a | N/a | N/a | $ | 0.35 | |||||||||||
|
|
|
|
|
|
|
| |||||||||
Diluted | N/a | N/a | N/a | $ | 0.35 | |||||||||||
|
|
|
|
|
|
|
| |||||||||
144
JEFFERIES GROUP LLC AND SUBSIDIARIES
| Item 9. | Changes in and Disagreements with Accountants on Accounting and Financial Disclosure. |
None
| Item 9A. | Controls and Procedures. |
Disclosure Controls and Procedures
Our management, under the direction of our Chief Executive Officer and Chief Financial Officer, evaluated the effectiveness of our disclosure controls and procedures as of November 30, 2014. Based on that evaluation, our Chief Executive Officer and Chief Financial Officer concluded that our disclosure controls and procedures as of November 30, 2014 are functioning effectively to provide reasonable assurance that the information required to be disclosed by us in reports filed under the Securities Exchange Act of 1934 is (i) recorded, processed, summarized and reported within the time periods specified in the SEC's rules and forms and (ii) accumulated and communicated to our management, including our Chief Executive Officer and Chief Financial Officer, as appropriate to allow timely decisions regarding disclosure. A controls system cannot provide absolute assurance that the objectives of the controls system are met, and no evaluation of controls can provide absolute assurance that all control issues and instances of fraud, if any, within a company have been detected.
Internal Control over Financial Reporting
Management's annual report on internal control over financial reporting is contained in Part II, Item 8 of this Form 10-K.
Changes in Internal Control over Financial Reporting
No change in our internal control over financial reporting occurred during the quarter ended November 30, 2014 that has materially affected, or is reasonably likely to materially affect, our internal control over financial reporting.
| Item 9B. | Other Information. |
None
145
JEFFERIES GROUP LLC AND SUBSIDIARIES
PART III
| Item 10. | Directors, Executive Officers and Corporate Governance. |
Omitted pursuant to General Instruction I(2)(c) to Form 10-K.
| Item 11. | Executive Compensation. |
Omitted pursuant to General Instruction I(2)(c) to Form 10-K.
| Item 12. | Security Ownership of Certain Beneficial Owners and Management and Related Stockholder Matters. |
Omitted pursuant to General Instruction I(2)(c) to Form 10-K.
| Item 13. | Certain Relationships and Related Transactions, and Director Independence. |
Omitted pursuant to General Instruction I(2)(c) to Form 10-K.
| Item 14. | Principal Accountant Fees and Services. |
For the fiscal years ended November 30, 2014 and November 30, 2013, the fees for services provided by PricewaterhouseCoopers LLP were as follows:
| 2014 | 2013 | |||||||
Audit Fees | $ | 6,236,500 | $ | 5,800,000 | ||||
Audit-Related Fees | $ | 125,000 | $ | 0 | ||||
Tax Fees | $ | 179,950 | $ | 549,860 | ||||
All Other Fees | $ | 50,000 | $ | 0 | ||||
Total All Fees | $ | 6,591,450 | $ | 6,349,860 | ||||
Audit Fees - The Audit Fees reported above reflect fees for services provided during fiscal 2014 and 2013. These amounts include fees for professional services rendered as our principal accountant for the audit of our consolidated financial statements included in this Annual Report on Form 10-K, the audits of various affiliates and investment funds managed by Jefferies or its affiliates, the audit of internal controls over financial reporting required by Section 404 of Sarbanes-Oxley, reviews of the interim consolidated financial statements included in our quarterly reports on Form 10-Q, the issuance of comfort letters, consents and other services related to SEC and other regulatory filings, audit fees related to other services that are normally provided in connection with statutory and regulatory filings or engagements. The Audit Committee preapproves all auditing services and permitted non-audit services to be performed for us by our independent registered public accounting firm, which are approved by the Audit Committee prior to the completion of the audit. In 2014, the Audit Committee preapproved all auditing services performed for us by the independent registered public accounting firm.
Audit-Related Fees - The Audit-Related Fees reported above reflect fees for services provided during fiscal 2014. These amounts include fees for assurance and related services that are reasonably related to the performance of the audit or review of our financial statements and are not reported under "Audit Fees" above. Specifically, the Audit-Related services included the audit of our pension plan, preparation of our SAS 70 and/or SSAE-16 report, performing agreed upon procedures related to specific matters at our request, the audits of our employee benefit plans, accounting consultations, and other services that are normally provided in connection with statutory and regulatory filings or engagements.
146
JEFFERIES GROUP LLC AND SUBSIDIARIES
Tax Fees - Tax Fees includes fees for services provided during fiscal 2014 and 2013 related to tax compliance, tax advice and tax planning.
All Other Fees - Includes fees during fiscal 2014 for performing agreed upon procedures relating to structuring and placing certain funds. There were no fees in this category for fiscal 2013.
147
JEFFERIES GROUP LLC AND SUBSIDIARIES
PART IV
| Item 15. | Exhibits and Financial Statement Schedules. |
| Pages | ||||
(a)1. Financial Statements | ||||
Included in Part II of this report: | ||||
Management's Report on Internal Control over Financial Reporting | 59 | |||
Report of Independent Registered Public Accounting Firm | 60 | |||
Report of Independent Registered Public Accounting Firm | 61 | |||
Report of Independent Registered Public Accounting Firm | 62 | |||
Consolidated Statements of Financial Condition | 63 | |||
Consolidated Statements of Earnings | 64 | |||
Consolidated Statements of Comprehensive Income | 65 | |||
Consolidated Statements of Changes in Equity | 66 | |||
Consolidated Statements of Cash Flows | 67 | |||
Notes to Consolidated Financial Statements | 69 | |||
(a)2 . Financial Statement Schedules
All Schedules are omitted because they are not applicable or because the required information is shown in the Consolidated Financial Statements or notes thereto.
(a)3. Exhibits
| 3.1 | Certificate of Formation of Jefferies Group LLC, effective as of March 1, 2013 is incorporated by reference to Exhibit 3.2 of Registrant's Form 8-K filed on March 1, 2013. | |
| 3.2 | Certificate of Conversion of Jefferies Group LLC, effective as of March 1, 2013 is incorporated by reference to Exhibit 3.1 of Registrant's Form 8-K filed on March 1, 2013. | |
| 3.3 | Limited Liability Company Agreement of Jefferies Group LLC, dated as of March 1, 2013 is incorporated by reference to Exhibit 3.3 of Registrant's Form 8-K filed on March 1, 2013. | |
| 4 | Instruments defining the rights of holders of long-term debt securities of the Registrant and its subsidiaries are omitted pursuant to Item 601(b)(4)(iii) of Regulation S-K. Registrant hereby agrees to furnish copies of these instruments to the Commission upon request. | |
| 12* | Computation of Ratio of Earnings to Fixed Charges and to Combined Fixed Charges and Preferred Stock Dividends. | |
| 23.1* | Consent of PricewaterhouseCoopers LLP. | |
| 23.2* | Consent of Deloitte & Touche LLP. | |
| 23.3* | Consent of Deloitte & Touche LLP. | |
| 31.1* | Rule 13a-14(a)/15d-14(a) Certification by Chief Financial Officer. | |
| 31.2* | Rule 13a-14(a)/15d-14(a) Certification by Chief Executive Officer. | |
| 32* | Rule 13a-14(b)/15d-14(b) and Section 1350 of Title 18 U.S.C. Certification by the Chief Executive Officer and Chief Financial Officer. | |
| 101* | Interactive data files pursuant to Rule 405 of Regulation S-T: (i) the Consolidated Statements of Financial Condition as of November 30, 2014 and November 30, 2013; (ii) the Consolidated Statements of Earnings for the year ended November 30, 2014, the nine months ended November 30, 2013, the three months ended February 28, 2013, and for the year ended November 30, 2012 ; (iii) the Consolidated Statements of Comprehensive Income for the year ended November 30, 2014, the nine months ended November 30, 2013, the three months ended February 28, 2013, and for the year ended November 30, 2012; (iv) the Consolidated Statements of Changes in Equity for the year ended November 30, 2014, the nine months ended November 30, 2013, the three months ended February 28, 2013, and for the year ended November 30, 2012; (v) the Consolidated Statements of Cash Flows for the year ended November 30, 2014, the nine months ended November 30, 2013, the three months ended February 28, 2013, and for the year ended November 30, 2012; and (vi) the Notes to Consolidated Financial Statements. | |
| * | Filed herewith. |
148
JEFFERIES GROUP LLC AND SUBSIDIARIES
Exhibits 10.1 through 10.2 are management contracts or compensatory plans or arrangements.
| (c) | Financial Statement Schedules |
| Jefferies Finance LLC financial statements as of November 30, 2014 and 2013, and for the years ended November 30, 2014, 2013 and 2012 |
149
JEFFERIES GROUP LLC AND SUBSIDIARIES
SIGNATURES
Pursuant to the requirements of Section 13 or 15(d) of the Securities Exchange Act of 1934, the Registrant has duly caused this report to be signed on its behalf by the undersigned, thereunto duly authorized.
| JEFFERIES GROUP LLC |
/s/ RICHARD B. HANDLER |
| Richard B. Handler |
| Chairman of the Board of Directors, |
| Chief Executive Officer |
Dated: January 28, 2015
Pursuant to the requirements of the Securities Exchange Act of 1934, this report has been signed below by the following persons on behalf of the Registrant and in the capacities and on the dates indicated.
Name | Title | Date | ||||
/s/ | RICHARD B. HANDLER | Chairman of the Board of Directors, Chief Executive Officer | January 28, 2015 | |||
| Richard B. Handler | ||||||
/s/ | PEREGRINE C. BROADBENT | Executive Vice President and Chief Financial Officer (Principal Accounting Officer) | January 28, 2015 | |||
Peregrine C. Broadbent | ||||||
/s/ | BRIAN P. FRIEDMAN | Director and Chairman, Executive Committee | January 28, 2015 | |||
| Brian P. Friedman | ||||||
/s/ | W. PATRICK CAMPBELL | Director | January 28, 2015 | |||
| W. Patrick Campbell | ||||||
/s/ | BARRY J. ALPERIN | Director | January 28, 2015 | |||
| Barry J. Alperin | ||||||
/s/ | RICHARD G. DOOLEY | Director | January 28, 2015 | |||
| Richard G. Dooley | ||||||
/s/ | MARYANNE GILMARTIN | Director | January 28, 2015 | |||
| MaryAnne Gilmartin | ||||||
/s/ | JOSEPH S. STEINBERG | Director | January 28, 2015 | |||
| Joseph S. Steinberg | ||||||
150
Jefferies Finance LLC and Subsidiaries
Consolidated Balance Sheets as of November 30, 2014 and 2013 and
Related Statements of Earnings, Changes in Members' Equity and Cash Flows for
the Years Ended November 30, 2014, 2013 and 2012 and Independent Auditor's Report
JEFFERIES FINANCE LLC AND SUBSIDIARIES
Table of contents
| PAGE | ||||
Independent Auditors' Report | 1 | |||
CONSOLIDATED FINANCIAL STATEMENTS: | ||||
Consolidated Balance Sheets | 2 | |||
Consolidated Statements of Earnings | 4 | |||
Consolidated Statements of Changes in Members' Equity | 5 | |||
Consolidated Statements of Cash Flows | 6 | |||
Notes to Consolidated Financial Statements | 7 | |||
Independent Auditors' Report
To the Board of Directors of
Jefferies Finance LLC and Subsidiaries
New York, NY
We have audited the accompanying consolidated financial statements of Jefferies Finance LLC and Subsidiaries (the "Company"), which comprise the consolidated balance sheets as of November 30, 2014 and 2013, and the related consolidated statements of earnings, changes in members' equity, and cash flows for the years ended November 30, 2014, 2013 and 2012, and the related notes to the consolidated financial statements.
Management's Responsibility for the Consolidated Financial Statements
Management is responsible for the preparation and fair presentation of these consolidated financial statements in accordance with accounting principles generally accepted in the United States of America; this includes the design, implementation, and maintenance of internal control relevant to the preparation and fair presentation of consolidated financial statements that are free from material misstatement, whether due to fraud or error.
Auditors' Responsibility
Our responsibility is to express an opinion on these consolidated financial statements based on our audits. We conducted our audits in accordance with auditing standards generally accepted in the United States of America. Those standards require that we plan and perform the audit to obtain reasonable assurance about whether the consolidated financial statements are free from material misstatement.
An audit involves performing procedures to obtain audit evidence about the amounts and disclosures in the consolidated financial statements. The procedures selected depend on the auditor's judgment, including the assessment of the risks of material misstatement of the consolidated financial statements, whether due to fraud or error. In making those risk assessments, the auditor considers internal control relevant to the Company's preparation and fair presentation of the consolidated financial statements in order to design audit procedures that are appropriate in the circumstances, but not for the purpose of expressing an opinion on the effectiveness of the Company's internal control. Accordingly, we express no such opinion. An audit also includes evaluating the appropriateness of accounting policies used and the reasonableness of significant accounting estimates made by management, as well as evaluating the overall presentation of the consolidated financial statements.
We believe that the audit evidence we have obtained is sufficient and appropriate to provide a basis for our audit opinion.
Opinion
In our opinion, the consolidated financial statements referred to above present fairly, in all material respects, the financial position of Jefferies Finance LLC and Subsidiaries as of November 30, 2014 and 2013, and the results of their operations and their cash flows for the years ended November 30, 2014, 2013 and 2012 in accordance with accounting principles generally accepted in the United States of America.
/s/ DELOITTE & TOUCHE LLP
New York, NY
January 28, 2015
CONSOLIDATED FINANCIAL STATEMENTS
JEFFERIES FINANCE LLC AND SUBSIDIARIES
Consolidated Balance Sheets
As of November 30, 2014 and 2013
(Dollars in thousands)
| NOVEMBER 30, 2014 | NOVEMBER 30, 2013 | |||||||
ASSETS | ||||||||
Cash | $ | 576,222 | $ | 162,046 | ||||
Restricted cash | 670,015 | 77,954 | ||||||
Loans receivable, net of deferred loan fees | 3,280,933 | 2,018,999 | ||||||
Less allowance for loan losses | (27,970 | ) | (21,628 | ) | ||||
|
|
|
| |||||
Loans receivable, net | 3,252,963 | 1,997,371 | ||||||
Loans held for sale, net | 1,038,307 | 948,684 | ||||||
Accrued interest receivable | 28,554 | 22,548 | ||||||
Investments (includes restricted investments of $214,971 at November 30, 2014) | 235,106 | 5,225 | ||||||
Other assets | 152,896 | 58,049 | ||||||
|
|
|
| |||||
TOTAL ASSETS | $ | 5,954,063 | $ | 3,271,877 | ||||
|
|
|
| |||||
LIABILITIES AND MEMBERS' EQUITY | ||||||||
LIABILITIES: | ||||||||
Credit facilities | $ | 493,225 | $ | 796,554 | ||||
Secured notes payable, net | 2,826,517 | 986,224 | ||||||
Interest payable | 27,519 | 10,140 | ||||||
Other liabilities | 117,901 | 170,991 | ||||||
Due to affiliates | 46,566 | 33,072 | ||||||
Long-term debt | 1,450,000 | 600,000 | ||||||
|
|
|
| |||||
Total liabilities | 4,961,728 | 2,596,981 | ||||||
MEMBERS' EQUITY | 992,335 | 674,896 | ||||||
|
|
|
| |||||
TOTAL LIABILITIES AND MEMBERS' EQUITY | $ | 5,954,063 | $ | 3,271,877 | ||||
|
|
|
| |||||
See notes to consolidated financial statements.
(Continued)
1
JEFFERIES FINANCE LLC AND SUBSIDIARIES
Consolidated Balance Sheets (Continued)
As of November 30, 2014 and 2013
(Dollars in thousands)
The table below presents the carrying amount and classification of assets of consolidated variable interest entities ("VIEs") that can be used only to settle obligations of the consolidated VIEs and the liabilities of consolidated VIEs for which creditors (or beneficial interest holders) do not have recourse to our general credit. The assets and liabilities of these consolidated VIEs are included in the Consolidated Balance Sheets and are presented net of intercompany eliminations.
| NOVEMBER 30, 2014 | NOVEMBER 30, 2013 | |||||||
ASSETS | ||||||||
Restricted cash | $ | 633,778 | $ | 48,006 | ||||
Loans receivable, net of deferred loan fees | 2,429,487 | 1,083,443 | ||||||
Less allowance for loan losses | (20,400 | ) | (12,751 | ) | ||||
|
|
|
| |||||
Loans receivable, net | 2,409,087 | 1,070,692 | ||||||
Loans held for sale, net | 3,957 | 6,545 | ||||||
Accrued interest receivable | 13,761 | 6,607 | ||||||
Investments (includes restricted investments of $214,971 at November 30, 2014) | 225,534 | - | ||||||
Other assets | 78,701 | 25,327 | ||||||
|
|
|
| |||||
TOTAL ASSETS | $ | 3,364,818 | $ | 1,157,177 | ||||
|
|
|
| |||||
LIABILITIES | ||||||||
Secured notes payable, net | $ | 2,826,517 | $ | 986,224 | ||||
Interest payable | 2,156 | 1,971 | ||||||
Other liabilities | 38,219 | 29,238 | ||||||
Due to affiliates | 1,121 | 491 | ||||||
|
|
|
| |||||
TOTAL LIABILITIES | $ | 2,868,013 | $ | 1,017,924 | ||||
|
|
|
| |||||
See notes to consolidated financial statements.
2
JEFFERIES FINANCE LLC AND SUBSIDIARIES
Consolidated Statements of Earnings
For the Years Ended November 30, 2014, 2013 and 2012
(Dollars in thousands)
| NOVEMBER 30, 2014 | NOVEMBER 30, 2013 | NOVEMBER 30, 2012 | ||||||||||
NET INTEREST AND FEE INCOME: | ||||||||||||
Fee income, net | $ | 172,314 | $ | 139,447 | $ | 106,473 | ||||||
Interest income | 195,366 | 130,520 | 105,027 | |||||||||
|
|
|
|
|
| |||||||
Total interest and fee income | 367,680 | 269,967 | 211,500 | |||||||||
Interest expense | 144,928 | 74,003 | 55,232 | |||||||||
|
|
|
|
|
| |||||||
Net interest and fee income | 222,752 | 195,964 | 156,268 | |||||||||
Provision for (recovery of) loan losses | 7,979 | 7,346 | (4,681 | ) | ||||||||
|
|
|
|
|
| |||||||
Net interest and fee income after provision for (recovery of) loan losses | 214,773 | 188,618 | 160,949 | |||||||||
|
|
|
|
|
| |||||||
OTHER (LOSSES) GAINS, NET | (9,999 | ) | (7,898 | ) | 6,777 | |||||||
|
|
|
|
|
| |||||||
OTHER EXPENSES: | ||||||||||||
Compensation and benefits | 33,029 | 25,856 | 19,958 | |||||||||
General, administrative and other | 27,640 | 17,252 | 14,809 | |||||||||
|
|
|
|
|
| |||||||
Total other expenses | 60,669 | 43,108 | 34,767 | |||||||||
|
|
|
|
|
| |||||||
EARNINGS BEFORE INCOME TAX EXPENSE | 144,105 | 137,612 | 132,959 | |||||||||
INCOME TAX EXPENSE | 5,542 | 4,912 | 4,333 | |||||||||
|
|
|
|
|
| |||||||
NET EARNINGS | $ | 138,563 | $ | 132,700 | $ | 128,626 | ||||||
|
|
|
|
|
| |||||||
See notes to consolidated financial statements.
3
JEFFERIES FINANCE LLC AND SUBSIDIARIES
Consolidated Statements of Changes in Members' Equity
For the Years Ended November 30, 2014, 2013 and 2012
(Dollars in thousands)
| CLASS A MEMBERS | CLASS B MEMBERS | TOTAL MEMBERS' EQUITY | ||||||||||
BALANCE-November 30, 2011 | $ | 392,236 | $ | 21,334 | $ | 413,570 | ||||||
Net earnings | 109,807 | 18,819 | 128,626 | |||||||||
|
|
|
|
|
| |||||||
BALANCE-November 30, 2012 | $ | 502,043 | $ | 40,153 | $ | 542,196 | ||||||
Net earnings | 108,161 | 24,539 | 132,700 | |||||||||
|
|
|
|
|
| |||||||
BALANCE-November 30, 2013 | $ | 610,204 | $ | 64,692 | $ | 674,896 | ||||||
Contributions | 250,000 | - | 250,000 | |||||||||
Distributions | (56,899 | ) | (14,225 | ) | (71,124 | ) | ||||||
Net earnings | 110,852 | 27,711 | 138,563 | |||||||||
|
|
|
|
|
| |||||||
BALANCE-November 30, 2014 | $ | 914,157 | $ | 78,178 | $ | 992,335 | ||||||
|
|
|
|
|
| |||||||
See notes to consolidated financial statements.
4
JEFFERIES FINANCE LLC AND SUBSIDIARIES
Consolidated Statements of Cash Flows
For the Years Ended November 30, 2014, 2013 and 2012
(Dollars in thousands)
| NOVEMBER 30, 2014 | NOVEMBER 30, 2013 | NOVEMBER 30, 2012 | ||||||||||
CASH FLOWS FROM OPERATING ACTIVITIES: | ||||||||||||
Net earnings | $ | 138,563 | $ | 132,700 | $ | 128,626 | ||||||
Adjustments to reconcile net earnings to net cash provided by (used in) operating activities: | ||||||||||||
Amortization of deferred loan fees and discounts | (35,618 | ) | (27,423 | ) | (22,307 | ) | ||||||
Amortization of deferred structuring fees | 9,690 | 4,318 | 11,346 | |||||||||
Amortization of discount on secured notes | 3,763 | 1,616 | - | |||||||||
Provision for (recovery of) loan losses | 7,979 | 7,346 | (4,681 | ) | ||||||||
Realized (gain) loss on sale of loans held for sale | (5,429 | ) | 11,386 | (734 | ) | |||||||
Change in fair value of loans held for sale | 8,859 | (1,579 | ) | (1,904 | ) | |||||||
Realized loss (gain) on sales of investments | 114 | (1,873 | ) | (6,115 | ) | |||||||
Unrealized loss (gain) on investments | 6,455 | (225 | ) | (2,383 | ) | |||||||
Loss on loan receivables | - | 189 | 4,359 | |||||||||
Deferred income tax expense | 1,489 | 1,338 | 1,110 | |||||||||
(Increase) decrease in operating assets: | ||||||||||||
Origination of loans held for sale | (13,937,341 | ) | (8,750,447 | ) | (7,115,312 | ) | ||||||
Proceeds from sales of loans held for sale | 13,843,178 | 8,063,761 | 6,980,857 | |||||||||
Principal collections on loans held for sale | 13,610 | 92,785 | 74,236 | |||||||||
Accrued interest receivable | (6,005 | ) | (13,032 | ) | (2,192 | ) | ||||||
Other assets | (15,645 | ) | 6,158 | (26,266 | ) | |||||||
Increase (decrease) in operating liabilities: | ||||||||||||
Interest payable | 17,378 | 6,974 | 883 | |||||||||
Other liabilities | 11,044 | 11,920 | 79,418 | |||||||||
Due to affiliates | 13,494 | (7,888 | ) | 18,097 | ||||||||
|
|
|
|
|
| |||||||
Net cash provided by (used in) operating activities | 75,578 | (461,976 | ) | 117,038 | ||||||||
|
|
|
|
|
| |||||||
CASH FLOWS FROM INVESTING ACTIVITIES: | ||||||||||||
Origination and purchases of loans receivable | (3,658,903 | ) | (2,144,775 | ) | (1,520,031 | ) | ||||||
Principal collections of loans receivable | 1,936,162 | 1,080,917 | 1,165,966 | |||||||||
Proceeds from sales of loans held for sale | 369,983 | 239,932 | 296,172 | |||||||||
Net change in restricted cash | (592,060 | ) | (40,191 | ) | (23,577 | ) | ||||||
Purchases of investments | (589,117 | ) | (5,000 | ) | (54,682 | ) | ||||||
Proceeds from sales of investments | 352,998 | 1,873 | 85,419 | |||||||||
|
|
|
|
|
| |||||||
Net cash used in investing activities | (2,180,937 | ) | (867,244 | ) | (50,733 | ) | ||||||
|
|
|
|
|
| |||||||
CASH FLOWS FROM FINANCING ACTIVITIES: | ||||||||||||
Capital distributions | (71,124 | ) | - | - | ||||||||
Capital contributions | 250,000 | - | - | |||||||||
Repayments of secured notes payable | (89,028 | ) | (10,075 | ) | - | |||||||
Proceeds from sale of secured notes | 12,925 | 21,475 | - | |||||||||
Net proceeds from issuance of secured notes | 1,885,611 | 385,739 | 237,357 | |||||||||
Net proceeds from issuance of long-term debt | 832,552 | 585,363 | - | |||||||||
Proceeds from borrowings on credit facilities | 7,856,957 | 5,013,167 | 7,772,791 | |||||||||
Repayments on credit facilities | (8,158,358 | ) | (4,679,233 | ) | (7,988,650 | ) | ||||||
|
|
|
|
|
| |||||||
Net cash provided by financing activities | 2,519,535 | 1,316,436 | 21,498 | |||||||||
|
|
|
|
|
| |||||||
NET INCREASE (DECREASE) IN CASH | 414,176 | (12,784 | ) | 87,803 | ||||||||
CASH-Beginning of the year | 162,046 | 174,830 | 87,027 | |||||||||
|
|
|
|
|
| |||||||
CASH-End of the year | $ | 576,222 | $ | 162,046 | $ | 174,830 | ||||||
|
|
|
|
|
| |||||||
SUPPLEMENTAL INFORMATION: | ||||||||||||
Cash paid for interest | $ | 114,252 | $ | 64,640 | $ | 41,160 | ||||||
|
|
|
|
|
| |||||||
Cash paid for income taxes, net | $ | 2,570 | $ | 591 | $ | 4,828 | ||||||
|
|
|
|
|
| |||||||
See notes to consolidated financial statements.
5
JEFFERIES FINANCE LLC AND SUBSIDIARIES
Notes to Consolidated Financial Statements
November 30, 2014 and 2013
1. ORGANIZATION AND BASIS OF PRESENTATION
Organizational Structure -Jefferies Finance LLC ("JFIN"), a limited liability company, was organized under the laws of Delaware and commenced operations on October 7, 2004. JFIN will continue in perpetuity unless sooner dissolved as provided in the Amended and Restated Limited Liability Company Agreement, dated May 31, 2011, as amended, modified and/or supplemented from time to time, among JFIN and its members: Massachusetts Mutual Life Insurance Company ("Mass Mutual"), Babson Capital Management LLC ("BCM"), and Jefferies Group LLC ("JGL" and, together with Mass Mutual and BCM, the "Members").
JFIN is a commercial finance company that structures, underwrites and syndicates primarily senior secured loans to corporate borrowers. Our operations are primarily conducted through two business lines, Underwriting & Arrangement and Portfolio & Asset Management. JFIN also purchases performing loans in the syndicated markets. JFIN may also originate second lien term loans, bridge loans, mezzanine loans as well as related equity co-investments and purchase stressed and distressed loans in the secondary markets. In addition, JFIN acts as a portfolio manager for several collateralized loan funds and is registered with the Securities and Exchange Commission as a Registered Investment Adviser ("RIA") under the Investment Advisers Act of 1940 since March 1, 2012.
The accompanying consolidated financial statements refer to JFIN and all its subsidiaries (the "Company"), which includes all entities in which the Company has a controlling interest or is the primary beneficiary, including collateralized loan obligation funds ("CLOs"). See Note 8, Variable Interest Entities, for more information on the CLOs. JFIN Fund III LLC, JFIN Capital 2014 LLC, JFIN Fund IV 2014 LLC and JFIN Business Credit Fund I LLC are wholly owned subsidiaries created for the purpose of holding loans originated and purchased by JFIN which in general are subsequently securitized into CLOs.
JFIN's capital structure consists of Class A members and Class B members, owning 80% and 20% of JFIN, respectively. Net earnings are allocated first to Class A members in the form of a preferred return based on capital balances. Any residual is shared pro rata across all classes, respective of ownership. Losses are allocated ratably in respect to Members' ownership percentages unless the loss allocation would cause a negative capital account. Once a Member's capital account is equal to zero, the loss would be allocated to Members having sufficient capital to absorb the loss. Subsequent to March 1, 2013, net earnings and losses are allocated strictly on a pro rata basis across all Members, unless a loss allocation would cause a negative capital account.
Subsequent Events -The Company has evaluated events and transactions that occurred subsequent to November 30, 2014 through January 28, 2015, the date that these financial statements were issued. We have determined that there were no events or transactions, during such period that would require recognition or disclosure in these consolidated financial statements, except for the termination of the JFIN Capital 2014 LLC Credit Facility on December 1, 2014.
2. SUMMARY OF SIGNIFICANT ACCOUNTING POLICIES
Basis of Presentation and Use of Estimates -The preparation of the consolidated financial statements is in conformity with generally accepted accounting principles in the United States of America ("U.S. GAAP").
U.S. GAAP requires management to make estimates that affect the amounts reported in the consolidated financial statements and the accompanying notes. The most significant of these estimates relate to the allowance for loan losses, fair value measurements and income taxes. All of these estimates reflect management's best judgment about current economic and market conditions and their effects based on information available as of the date of these consolidated financial statements. Although these and other estimates and assumptions are based on the best available information, actual results could be materially different from these estimates.
Principles of Consolidation -The accompanying consolidated financial statements reflect the Company's consolidated accounts, including the subsidiaries and the related consolidated results of operations with all intercompany balances and transactions eliminated in consolidation. In addition, the Company consolidates entities which meet the definition of a variable interest entity for which we are the primary beneficiary. The primary beneficiary is the party who has the power to direct the activities of a variable interest entity that most significantly impact the entity's economic performance and who has an obligation to absorb losses of the entity or a right to receive benefits from the entity that could potentially be significant to the entity.
6
JEFFERIES FINANCE LLC AND SUBSIDIARIES
Notes to Consolidated Financial Statements
November 30, 2014 and 2013
Revenue Recognition Policies
Interest and Fee Income -Interest and fee income are recorded on an accrual basis to the extent that such amounts are earned and expected to be collected. Premiums and discounts are amortized into interest income using a level yield over the contractual life of the loan.
Deferred Loan Fees, Net -Direct loan underwriting fees, net of costs, are deferred and amortized using a level yield as adjustments to the related loan's yield over the contractual life of the loan. Direct loan underwriting fees, net of costs, related to revolving credit facilities are amortized on a straight-line basis as fee income when the revolving credit facilities become available to the borrowers.
Underwriting fees are recognized on a pro-rata basis as the corresponding loan is syndicated. If the Company retains a portion of the syndicated loan, a portion of the fee is deferred to produce a yield that is not less than the average yield on the portion of the syndicated loans that is held by the other syndicate members. In the event that a loan is prepaid before the scheduled maturity, all remaining deferred loan fees are recorded to interest income.
Cash and Restricted Cash -Cash represents overnight deposits. The Company maintained its cash and restricted cash balances of $1,246.2 million and $240.0 million at November 30, 2014 and 2013, respectively, at several financial institutions.
Restricted cash represents the amount of principal and interest on deposit in the Company's credit facilities and collateralized loan obligations ("CLOs"). The credit facilities limit the use of principal cash to fund or purchase additional eligible loans or reducing the debt of the related credit facilities. Cash on deposit in the interest account of the Company's credit facilities is limited to the payment of interest, servicing fees and other expenses of the Company's credit facilities at specific times outlined in the credit agreements.
Loans Receivable, Net -Loans receivable are recorded at cost, adjusted for unamortized premiums or discounts, net of unamortized deferred underwriting fees and net of allowance for loan losses. The Company intends to hold the majority of its loans until maturity. Loans for which the Company has the intent and ability to hold for the foreseeable future or until maturity are classified as held for investment.
Allowance for Loan Losses -The allowance for loan losses is a reserve established through a charge to provision for loan losses. The allowance, in the judgment of management, is necessary to reserve for estimated loan losses inherent in the loan portfolio. The allowance for loan losses includes reserves calculated in accordance with Financial Accounting Standards Board ("FASB") Accounting Standards Codification ("ASC") Topic 310, Receivables and allowance allocations calculated in accordance with ASC Topic 450, Contingencies . Further information regarding the Company's policies and methodology used to estimate the allowance for loan losses is presented in Note 4.
Loans Held for Sale, Net -The Company's business is the structuring and underwriting of loan products with the intent to syndicate the majority of the loan to third parties. The Company will typically invest in a percentage of the originated loan based upon the management of risk with respect to the entire portfolio. When the Company's position is larger than originally intended, the excess hold is classified to Loans held for sale, net, on the Consolidated Balance Sheets. In addition, during the primary syndication process, loans that have been committed to be purchased by third parties but not yet settled are also classified as Loans held for sale, net.
Syndication activities and sales of loans held for sale are accounted for as sales based on the Company's satisfaction of the criteria for such accounting which provides that, as transferor, among other requirements, the Company has surrendered control over the loans. The sale of loan transfers from loans receivable to loans held for sale are included in proceeds from sales of loans held for sale in investing activities in the Consolidated Statements of Cash Flows.
Loans held for sale, net are carried at the lower of cost or fair value, as determined on an individual loan basis, net of unamortized deferred underwriting fees and valuation allowances. Net unrealized losses or gains, if any, are recognized in a valuation allowance through charges to earnings in Other (losses) gains, net in the Consolidated Statements of Earnings.
Unamortized premiums, discounts, origination fees and direct costs on loans held for sale are recognized as a component of the gain or loss on sale. Gains and losses on sales of loans held for sale are recognized on trade dates and are determined by the difference between the sale proceeds and the carrying value of the loans and are recorded in Other (losses) gains, net, in the Consolidated Statements of Earnings.
7
JEFFERIES FINANCE LLC AND SUBSIDIARIES
Notes to Consolidated Financial Statements
November 30, 2014 and 2013
Investments -Investments are recorded on a trade date basis. Investments, including financial derivative instruments are recorded on the Consolidated Balance Sheets at fair value with changes in value recorded as a component of Other (losses) gains, net, in the Consolidated Statements of Earnings.
The Company has elected to carry its investments primarily at fair value under the fair value option election in accordance with ASC 825, Financial Instruments . The Company's election is done on an instrument-by-instrument basis. The election is made upon the acquisition of the eligible financial asset. The fair value election may not be revoked once an election is made.
The Company presents derivatives on the Consolidated Balance Sheets as assets or liabilities, with their resulting gains or losses recognized in Other (losses) gains, net. Fair value is based on dealer quotes, pricing models, discounted cash flow methodologies, or similar techniques for which the determination of fair value may require significant management judgment or estimation. Pricing information obtained from external data providers (including independent pricing services and brokers) may incorporate a range of market quotes from dealers, recent market transactions, benchmarking model derived prices to quoted market prices and trade data for comparable securities. External pricing data is subject to evaluation for reasonableness using a variety of means including comparisons of prices to those of similar product types, quality and maturities, consideration of the narrowness or wideness of the range of prices obtained, knowledge of recent market transactions and an assessment of the similarity in prices to comparable dealer offerings in a recent time period. Derivative contracts are valued using models, whose input reflect the assumption that we believe market participants would use in valuing the derivative in a current period transaction. Inputs to valuation models are appropriately calibrated to market data.
Deferred Structuring Fees -Deferred structuring fees on Credit facilities, Secured notes payable and Long-term debt are included in Other assets on the Consolidated Balance Sheets and are amortized to Interest expense in the Consolidated Statements of Earnings over the contractual term of the borrowing using a level yield.
Fair Value Hierarchy -In determining fair value, the Company maximizes the use of observable inputs and minimizes the use of unobservable inputs by requiring that observable inputs be used when available. Observable inputs are inputs that market participants would use in pricing the asset or liability based on market data obtained from independent sources.
If unobservable inputs are used, the Company will use assumptions that reflect the assumptions that market participants would use in pricing the asset or liability developed based on the best information available in the circumstances.
The Company applies a hierarchy to categorize its fair value measurements broken down into three levels based on the transparency of inputs as follows:
Level 1-Quoted prices are available in active markets for identical assets or liabilities as of the reported date.
Level 2-Pricing inputs are other than quoted prices in active markets, which are either directly or indirectly observable as of the reported date. The nature of these financial instruments include cash instruments, for which quoted prices are available but traded less frequently; derivative instruments whose fair values have been derived using a model where inputs to the model are directly observable in the market or can be derived principally from or corroborated by observable market data; and instruments that are fair valued using other financial instruments, the parameters of which can be directly observed.
Level 3-Instruments that have little to no pricing observability as of the reported date. These financial instruments are measured using management's best estimate of fair value, where the inputs into the determination of fair value require significant management judgment or estimation.
The valuation of financial instruments may include the use of valuation models and other techniques. Adjustments to valuations derived from valuation models may be made when, in management's judgment, the features of the financial instrument, such as its complexity or the market in which the financial instrument is traded and risk uncertainties about market conditions, require that an adjustment be made to the value derived from the models.
8
JEFFERIES FINANCE LLC AND SUBSIDIARIES
Notes to Consolidated Financial Statements
November 30, 2014 and 2013
The Company's fair value measurements involve third party pricing for the majority of its assets and liabilities. If third party pricing is unavailable, the Company may employ various valuation techniques and models, which involve inputs that are observable, when available. The Company's valuation policies and procedures are reviewed at least annually and are updated as necessary. Further, the Company tracks the fair values of significant assets and liabilities using a variety of methods including third party vendors, comparison to previous trades and an assessment for overall reasonableness. See Note 8 for further information on fair value measurements.
Income Taxes -Under current federal and state income tax laws and regulations, the Company is treated as a partnership for tax reporting purposes and is generally not subject to income taxes. Additionally, no provision has been made for federal, state, or local income taxes on the results of operations generated by partnership activities; as such taxes are the responsibility of its Members. However, the Company is subject to certain state and local entity level income taxes, including New York City Unincorporated Business Tax. Amounts provided for income taxes are based on income reported for financial statement purposes and do not necessarily represent amounts currently payable. Deferred tax assets and liabilities are recognized for the future tax consequences attributable to differences between the financial statement carrying amounts of existing assets and liabilities and their respective tax bases and for tax loss carry forwards. Deferred tax assets and liabilities are measured using enacted tax rates expected to apply to taxable income in the years in which those temporary differences are expected to be recovered or settled. The effect on deferred tax assets and liabilities of a change in tax rates is recognized in income in the period that includes the enactment date.
The realization of deferred tax assets is assessed and a valuation allowance is recorded to the extent that it is more likely than not that any portion of the deferred tax asset will not be realized. The Company follows the provisions of accounting for uncertainty in income taxes which prescribes a recognition threshold under which it is determined whether it is more likely than not that a tax position will be sustained on the basis of the technical merits of the position. For those tax positions that meet the more-likely-than-not recognition threshold, the largest amount of the tax benefit that is more than fifty percent likely to be realized upon ultimate settlement with the tax authority is recognized.
New Accounting Developments
Disclosure Requirement-In July 2010, the FASB issued an Accounting Standards Update ("ASU") No. 2010-20, Receivables (Topic 310): Disclosures about the Credit Quality of Financing Receivables and the Allowance for Credit Losses which requires an entity to provide enhanced and disaggregated disclosures about the credit quality of an entity's financing receivables and its allowance for credit losses. The objective of enhancing these disclosures is to improve financial statement users' understanding of both the nature of an entity's credit risk associated with its financing receivables and the entity's assessment of that risk in estimating its allowance for credit losses as well as changes in the allowance and the reason for those changes. The update is effective for the first annual period ending on or after December 15, 2011. The Company's adoption of FASB ASU 2010-20 in fiscal year 2012 did not have a material impact on the Company's consolidated financial condition, results of operations or cash flows as it is a disclosure standard.
Troubled Debt Restructurings ("TDRs") -In April 2011, the FASB issued ASU 2011-02, Receivables (Topic 310): A Creditor's Determination of whether a Restructuring is a Troubled Debt Restructuring , to clarify under what circumstances a creditor should classify a restructured receivable as a TDR. A receivable is a TDR if both a creditor has granted a concession to the debtor and the debtor is experiencing financial difficulties. The ASU clarifies that a creditor should consider all aspects of a restructuring when evaluating whether it has granted a concession, which include determining whether a debtor can obtain funds from another source at market rates and assessing the value of additional collateral and guarantees obtained at the time of restructuring. The ASU also provides factors a creditor should consider when determining if a debtor is experiencing financial difficulties, such as probability of payment default and bankruptcy declarations. The Company adopted this guidance starting fiscal year 2013. The adoption of this guidance did not have an impact on the Company's consolidated financial condition, results of operations or cash flows.
Fair Value Measurements and Disclosures-In May 2011, the FASB issued accounting updates to ASC 820, Fair Value Measurements-Amendments to Achieve Common Fair Value Measurement and Disclosure Requirements in U.S. GAAP and IFRSs , which provide clarifying guidance on how to measure fair value and additional disclosure requirements. The
9
JEFFERIES FINANCE LLC AND SUBSIDIARIES
Notes to Consolidated Financial Statements
November 30, 2014 and 2013
amendments prohibit the use of blockage factors at all levels of the fair value hierarchy and provide guidance on measuring financial instruments that are managed on a net portfolio basis. Additional disclosure requirements include transfers between Levels 1 and 2; and for Level 3 fair value measurements, a description of the Company's valuation processes and additional information about unobservable inputs impacting Level 3 measurements. The Company adopted this guidance in fiscal year 2012 and has reflected the new disclosures in the consolidated financial statements. The adoption of this guidance did not have an impact on the Company's consolidated financial condition, results of operations or cash flow.
Disclosures about Offsetting Assets and Liabilities -In December 2011, and clarified in January 2013, the FASB issued ASU, No. 2011-11 and ASU, No. 2013-1 respectively which amended guidance related to disclosures about offsetting assets and liabilities. The amended guidance requires the disclosure of both gross information and net information about financial instruments, including derivatives, and transactions eligible for offset in the Consolidated Balance Sheets as well as financial instruments and transactions subject to agreements similar to a master netting arrangement. The amended guidance was required to be applied retrospectively and was effective for fiscal years, and interim periods within those years, beginning on or after January 1, 2013. The Company adopted this guidance starting fiscal year 2014. The adoption of this guidance did not have an impact on the Company's consolidated financial condition, results of operations or cash flows.
Revenue Recognition -In May 2014, the FASB issued ASU, No. 2014-09, Revenue from Contracts with Customers which defines how companies report revenues from contracts with customers, and also require enhanced disclosures. The guidance is effective beginning in the first quarter of fiscal 2018. We are currently evaluating the impact of the new guidance on our consolidated financial statements.
3. RESTRICTED CASH
The following is a summary of restricted cash as of November 30, 2014 and 2013 (in thousands):
| 2014 | 2013 | |||||||
Principal and interest collections on loans held in credit facilities and CLOs | $ | 106,642 | $ | 76,863 | ||||
Reserves held in credit facilities and CLOs to support future commitments | 563,373 | 1,091 | ||||||
|
|
|
| |||||
Total restricted cash | $ | 670,015 | $ | 77,954 | ||||
|
|
|
| |||||
Certain CLOs holding restricted cash are within their reinvestment periods and in compliance with collateralization tests allowing the use of principal cash to purchase or fund eligible assets. The CLOs require the cash on deposit in interest accounts to be used to pay senior management fees, interest to note holders, subordinate management fees and any residual to the subordinate note holders, providing the structure is in compliance with the collateralization tests. In the event the CLOs were not in compliance with the collateralization tests, cash in the interest accounts would be used to pay senior management fees, interest to the note holders and the residual could be diverted to reduce the secured notes outstanding. See also Note 8, Variable Interest Entities for a discussion of restricted cash held by CLOs.
4. LOANS RECEIVABLE, NET
The Company's loan receivable portfolio consists primarily of senior secured loans in various industries. The portfolio is segmented into originated and secondary loans which reflect how the portfolio is managed. Originated is a designation that indicates that the Company has had a major role in underwriting the loan either as an arranger or other title. Secondary is a designation that indicates that the Company acquired the loans through primary syndications conducted by other arrangers or purchased in the open market.
10
JEFFERIES FINANCE LLC AND SUBSIDIARIES
Notes to Consolidated Financial Statements
November 30, 2014 and 2013
The following is a summary of outstanding loan balances as of November 30, 2014 and 2013 (in thousands):
| 2014 | 2013 | |||||||
Loans receivable: | ||||||||
Originated | $ | 1,853,438 | $ | 839,480 | ||||
Secondary | 1,549,371 | 1,252,917 | ||||||
|
|
|
| |||||
Total loans receivable | 3,402,809 | 2,092,397 | ||||||
Less: original issue discount | (40,920 | ) | (26,958 | ) | ||||
|
|
|
| |||||
Total loans receivable, net of original issue discount | 3,361,889 | 2,065,439 | ||||||
Less: deferred loan fees | (80,956 | ) | (46,440 | ) | ||||
|
|
|
| |||||
Total loans receivable, net of deferred loan fees | 3,280,933 | 2,018,999 | ||||||
Less: allowance for loan losses | (27,970 | ) | (21,628 | ) | ||||
|
|
|
| |||||
Total loans receivable, net | $ | 3,252,963 | $ | 1,997,371 | ||||
|
|
|
| |||||
As of November 30, 2014 there was $29.3 million and $11.6 million of original issue discount included in originated and secondary loans, respectively. As of November 30, 2013 there was $15.5 million and $11.4 million of original issue discount included in originated and secondary loans, respectively.
As of November 30, 2014 and 2013, $3.1 billion and $1.9 billion, respectively, of loans receivable were pledged as collateral against the Company's credit facilities and secured notes issued by the CLOs. See also Note 8, Variable Interest Entities for a discussion of loans receivable owned by CLOs.
Nonaccrual Loans -If a loan is 90 days or more past due or the borrower is not able to service its debt and other obligations, the loan is placed on nonaccrual status. When a loan is placed on nonaccrual status, interest previously recognized as interest income but not yet paid is reversed and the recognition of interest income on that loan will stop until factors indicating doubtful collection no longer exist and the loan has been brought current. Exceptions to this policy will be made if the loan is well secured and in the process of collection. Payments received on nonaccrual loans are first applied to the required principal payments due. On the date the borrower pays in full all overdue amounts, the borrower's loan will emerge from nonaccrual status and all overdue interest, including those from prior years, will be recognized as interest income in the current period.
The following is an analysis of past due loans at November 30, 2014 (in thousands):
| LOANS 30-89 DAYS PAST DUE | LOANS 90 OR MORE DAYS PAST DUE | TOTAL PAST DUE LOANS | CURRENT LOANS | TOTAL LOANS | ||||||||||||||||
Originated | $ | - | $ | - | $ | - | $ | 1,824,096 | $ | 1,824,096 | ||||||||||
Secondary | - | - | - | 1,537,793 | 1,537,793 | |||||||||||||||
|
|
|
|
|
|
|
|
|
| |||||||||||
Total | $ | - | $ | - | $ | - | $ | 3,361,889 | $ | 3,361,889 | ||||||||||
|
|
|
|
|
|
|
|
|
| |||||||||||
11
JEFFERIES FINANCE LLC AND SUBSIDIARIES
Notes to Consolidated Financial Statements
November 30, 2014 and 2013
The following is an analysis of past due loans as of November 30, 2013 (in thousands):
| LOANS 30-89 DAYS PAST DUE | LOANS 90 OR MORE DAYS PAST DUE | TOTAL PAST DUE LOANS | CURRENT LOANS | TOTAL LOANS | ||||||||||||||||
Originated | $ | - | $ | - | $ | - | $ | 823,963 | $ | 823,963 | ||||||||||
Secondary | 4,611 | - | 4,611 | 1,236,865 | 1,241,476 | |||||||||||||||
|
|
|
|
|
|
|
|
|
| |||||||||||
Total | $ | 4,611 | $ | - | $ | 4,611 | $ | 2,060,828 | $ | 2,065,439 | ||||||||||
|
|
|
|
|
|
|
|
|
| |||||||||||
Impaired Loans -Loans are considered impaired when, based on current information and events, it is probable the Company will be unable to collect all amounts due in accordance with the original contractual terms of the loan agreement, including scheduled principal and interest payments. Impairment is evaluated on an individual loan basis. If a loan is impaired, a specific valuation allowance is allocated, if necessary, so that the loan is reported net, at the present value of estimated future cash flows using the loan's effective rate or at the fair value of collateral if repayment is expected solely from the collateral.
Interest received on impaired loans are typically applied to principal outstanding unless collectability of the principal amount is reasonably assured, in which case interest is recognized on a cash basis. Loans will be charged off against the allowance when full collection of the principal from the sale of collateral, if applicable, or the enforcement of guarantees is remote. The Company does not necessarily wait until the final resolution of a loan to charge off the uncollectible balance.
The following is a summary of impaired loans as of November 30, 2014 (in thousands):
| RECORDED INVESTMENT | UNPAID PRINCIPAL BALANCE | RELATED ALLOWANCE | AVERAGE RECORDED INVESTMENT | |||||||||||||
With allowance recorded: | ||||||||||||||||
Originated | $ | 7,820 | $ | 7,820 | $ | 1,580 | $ | 6,324 | ||||||||
Secondary | 5,776 | 7,150 | 3,400 | 8,138 | ||||||||||||
|
|
|
|
|
|
|
| |||||||||
Total | $ | 13,596 | $ | 14,970 | $ | 4,980 | $ | 14,462 | ||||||||
|
|
|
|
|
|
|
| |||||||||
The following is a summary of impaired loans as of November 30, 2013 (in thousands):
| RECORDED INVESTMENT | UNPAID PRINCIPAL BALANCE | RELATED ALLOWANCE | AVERAGE RECORDED INVESTMENT | |||||||||||||
With allowance recorded: | ||||||||||||||||
Originated | $ | - | $ | - | $ | - | $ | 1,079 | ||||||||
Secondary | 11,712 | 13,087 | 5,096 | 10,342 | ||||||||||||
|
|
|
|
|
|
|
| |||||||||
Total | $ | 11,712 | $ | 13,087 | $ | 5,096 | $ | 11,421 | ||||||||
|
|
|
|
|
|
|
| |||||||||
The average recorded investment reflects the change in the balance of impaired loans throughout the years ended November 30, 2014 and 2013.
As of November 30, 2014 and 2013, each individual impaired loan had an allowance recorded.
Interest income was not recognized on impaired and nonaccrual loans during the years ended November 30, 2014, 2013 and 2012. If the impaired and nonaccrual loans had been performing, an additional $0.6 million, $0.5 million and $1.2 million of interest income would have been recorded for the years ended November 30, 2014, 2013 and 2012, respectively.
12
JEFFERIES FINANCE LLC AND SUBSIDIARIES
Notes to Consolidated Financial Statements
November 30, 2014 and 2013
Allowance for Loan Losses -The Company's allowance for loan losses reflects management's estimate of net loan losses inherent in the loan portfolio. The allowance for general loan losses is calculated as the aggregate loan loss reserve for losses inherent in the portfolio that have not yet been identified.
Reserve factors are assigned to the loans in the portfolio, which dictate the percentage of the total outstanding loan balance that is reserved. The loan portfolio information is regularly reviewed to determine whether it is necessary to revise the reserve factors.
The reserve factors used in the calculation are determined by analyzing the following elements:
| • | the types of loans; |
| • | the expected loss with regard to the loan type; |
| • | the internal credit rating assigned to the loans; and |
| • | type of industry for a given loan. |
The Company has a policy to reserve for impaired loans based on a comparison of the recorded carrying value of the loan to either the present value of the loan's expected cash flow or the estimated fair value of the underlying collateral where applicable. The Company considers market value of the loan in its determination of the loan losses for impaired loans. There is no threshold for collectively evaluating for impaired loans. Loans will be charged off against the allowance when full collection of the principal from the sale of collateral or the enforcement of guarantees is remote. The Company does not necessarily wait until the final resolution of a loan to charge off the uncollectible balance.
The Company regularly tests the allowance for loan losses for reasonableness. In determining reasonableness, trends in the elements analyzed in establishing the reserve factors described above are reviewed. In addition, the Company continues to monitor the market to corroborate the reserve levels on similar loan products. The Company also computes an allowance for unfunded lending commitments using a methodology that is similar to that used for loans. The table below summarizes the Company's reporting of its allowance for loan losses:
CONSOLIDATED BALANCE SHEETS | CONSOLIDATED STATEMENTS OF EARNINGS | |||
| Allowance for loan losses on: | ||||
Loans | Allowance for loan losses | Provision for loan losses | ||
Unfunded loan commitments | Other liabilities | General, administrative and other |
The following is a summary of the activity in the allowance for loan losses for the year ended November 30, 2014 (in thousands):
| ORIGINATED | SECONDARY | TOTAL | ||||||||||
Balance, November 30, 2013 | $ | 3,755 | $ | 17,873 | $ | 21,628 | ||||||
Provision for loan losses-general | 5,038 | 1,420 | 6,458 | |||||||||
Provision for (recovery of) loan losses-specific | 2,261 | (740 | ) | 1,521 | ||||||||
Transfers to loans held for sale, net | (681 | ) | (956 | ) | (1,637 | ) | ||||||
|
|
|
|
|
| |||||||
Balance, November 30, 2014 | 10,373 | 17,597 | 27,970 | |||||||||
|
|
|
|
|
| |||||||
Balance, end of period-general | $ | 8,793 | $ | 14,197 | $ | 22,990 | ||||||
|
|
|
|
|
| |||||||
Balance, end of period-specific | $ | 1,580 | $ | 3,400 | $ | 4,980 | ||||||
|
|
|
|
|
| |||||||
Loans receivable: | ||||||||||||
Loans collectively evaluated-general | $ | 1,816,276 | $ | 1,532,017 | $ | 3,348,293 | ||||||
Loans individually evaluated-specific | 7,820 | 5,776 | 13,596 | |||||||||
|
|
|
|
|
| |||||||
Total | $ | 1,824,096 | $ | 1,537,793 | $ | 3,361,889 | ||||||
|
|
|
|
|
| |||||||
13
JEFFERIES FINANCE LLC AND SUBSIDIARIES
Notes to Consolidated Financial Statements
November 30, 2014 and 2013
The following is a summary of the activity in the allowance for loan losses for the year ended November 30, 2013 (in thousands):
| ORIGINATED | SECONDARY | TOTAL | ||||||||||
Balance, November 30, 2012 | $ | 4,437 | $ | 11,237 | $ | 15,674 | ||||||
Provision for loan losses-general | 1,155 | 6,760 | 7,915 | |||||||||
Recovery of loan losses-specific | (1,837 | ) | 1,268 | (569 | ) | |||||||
Transfers to loans held for sale, net | - | (1,099 | ) | (1,099 | ) | |||||||
Charge-offs | - | (293 | ) | (293 | ) | |||||||
|
|
|
|
|
| |||||||
Balance, November 30, 2013 | 3,755 | 17,873 | 21,628 | |||||||||
|
|
|
|
|
| |||||||
Balance, end of period-general | $ | 3,755 | $ | 12,777 | $ | 16,532 | ||||||
|
|
|
|
|
| |||||||
Balance, end of period-specific | $ | - | $ | 5,096 | $ | 5,096 | ||||||
|
|
|
|
|
| |||||||
Loans receivable: | ||||||||||||
Loans collectively evaluated-general | $ | 823,963 | $ | 1,229,764 | $ | 2,053,727 | ||||||
Loans individually evaluated-specific | - | 11,712 | 11,712 | |||||||||
|
|
|
|
|
| |||||||
Total | $ | 823,963 | $ | 1,241,476 | $ | 2,065,439 | ||||||
|
|
|
|
|
| |||||||
The following is a summary of the activity in the allowance for loan losses for the year ended November 30, 2012 (in thousands):
| ORIGINATED | SECONDARY | TOTAL | ||||||||||
Balance, November 30, 2011 | $ | 7,942 | $ | 13,427 | $ | 21,369 | ||||||
Provision for loan losses-general | 412 | 678 | 1,090 | |||||||||
Recovery of loan losses-specific | (3,917 | ) | (1,854 | ) | (5,771 | ) | ||||||
Transfers to loans held for sale, net | - | (1,014 | ) | (1,014 | ) | |||||||
|
|
|
|
|
| |||||||
Balance, November 30, 2012 | $ | 4,437 | $ | 11,237 | $ | 15,674 | ||||||
|
|
|
|
|
| |||||||
Balance, end of year-general | $ | 2,600 | $ | 6,016 | $ | 8,616 | ||||||
|
|
|
|
|
| |||||||
Balance, end of year-specific | $ | 1,837 | $ | 5,221 | $ | 7,058 | ||||||
|
|
|
|
|
| |||||||
Loans receivable: | ||||||||||||
Loans collectively evaluated-general | $ | 544,317 | $ | 588,585 | $ | 1,132,902 | ||||||
Loans individually evaluated-specific | 4,305 | 11,896 | 16,201 | |||||||||
|
|
|
|
|
| |||||||
Total | $ | 548,622 | $ | 600,481 | $ | 1,149,103 | ||||||
|
|
|
|
|
| |||||||
The reserve balances related to loan losses on unfunded commitments were $3.5 million and $3.1 million as of November 30, 2014 and 2013, respectively. In addition, the Company increased the reserve related to loan losses on unfunded commitments by $0.4 million. $0.7 million and $0.6 million during the years ended November 30, 2014, 2013 and 2012, respectively. The changes in reserve were recognized in General, administrative and other in the Consolidated Statements of Earnings and the reserve was included in Other liabilities on the Consolidated Balance Sheets.
Credit Quality Indicators -As part of the on-going monitoring of the credit quality of the Company's loan portfolio, management tracks credit quality indicators. Management regularly reviews the performance of its loans receivable to evaluate the credit risk.
14
JEFFERIES FINANCE LLC AND SUBSIDIARIES
Notes to Consolidated Financial Statements
November 30, 2014 and 2013
The Company evaluates each loan using six weighted credit risk grade categories that have both qualitative and quantitative components that differentiate the level of risk. Credit risk categories are assigned weights based on the characteristics of issuers.
For each borrower, the Company evaluates the following credit risk categories:
| • | Industry segment |
| • | Position within the industry |
| • | Earnings / Operating Cash Flows |
| • | Asset / Liability values |
| • | Financial flexibility / debt capacity |
| • | Management and controls |
The Company utilizes a risk grading matrix to assign an internal credit grade ("ICG") to each of its loans. Loans are individually rated on a tiered scale of one to ten, with each rating further divided into three levels of .2, .5 and .8.
A description of the general characteristics of the ICGs is as follows:
| • | Grade 1-Issuers assigned this grade are characterized as substantially risk free and having an extremely strong capacity to meet all financial obligations. |
| • | Grade 2-Issuers assigned this grade are characterized as representing minimal risk. |
| • | Grade 3-Issuers assigned this grade are characterized as representing modest risk. |
| • | Grade 4-Issuers assigned this grade are characterized as representing better than average risk. |
| • | Grade 5-Issuers assigned this grade are characterized as representing average risk. |
| • | Grade 6-Issuers assigned this grade are characterized as representing acceptable risk. |
| • | Grade 7-Issuers assigned this grade are currently vulnerable to adverse business, financial and economic conditions and are characterized by increasing credit risk. They possess potential weakness that may, if not checked or corrected, weaken the asset or result in a likelihood of default at some future date. The increasing risk has or may result in discounted pricing levels or decreased trading liquidity. |
| • | Grade 8-Issuers assigned this grade are characterized by inadequate repayment capacity and / or recovery of the obligor or of the collateral pledged resulting in potential loss if deficiencies are not corrected. |
| • | Grade 9-Issuers assigned this grade are in (a) payment default at any level in its debt structure or (b) bankruptcy. In addition, asset weaknesses may make collection or liquidation in full, on the basis of existing facts, highly questionable and improbable. |
| • | Grade 10-Issuers assigned this grade are charged-off. |
The following is a summary of credit risk profile by ICG as of November 30, 2014 (in thousands):
ICG | ORIGINATED | SECONDARY | TOTAL | |||||||||
4.8 | $ | - | $ | 1,990 | $ | 1,990 | ||||||
5.2 | - | 40,135 | 40,135 | |||||||||
5.5 | - | 70,778 | 70,778 | |||||||||
5.8 | 24,987 | 185,938 | 210,925 | |||||||||
6.2 | 114,812 | 234,014 | 348,826 | |||||||||
6.5 | 1,084,586 | 489,818 | 1,574,404 | |||||||||
6.8 | 520,509 | 346,041 | 866,550 | |||||||||
7.2 | 23,623 | 116,293 | 139,916 | |||||||||
7.5 | 47,758 | 18,380 | 66,138 | |||||||||
7.8 | - | 19,297 | 19,297 | |||||||||
7.8 | - | 10,274 | 10,274 | |||||||||
8.5 | 7,821 | 4,835 | 12,656 | |||||||||
|
|
|
|
|
| |||||||
Total | $ | 1,824,096 | $ | 1,537,793 | $ | 3,361,889 | ||||||
|
|
|
|
|
| |||||||
15
JEFFERIES FINANCE LLC AND SUBSIDIARIES
Notes to Consolidated Financial Statements
November 30, 2014 and 2013
The following is a summary of credit risk profile by ICG as of November 30, 2013 (in thousands):
ICG | ORIGINATED | SECONDARY | TOTAL | |||||||||
5.2 | $ | - | $ | 22,398 | $ | 22,398 | ||||||
5.5 | - | 45,695 | 45,695 | |||||||||
5.8 | 93,725 | 93,177 | 186,902 | |||||||||
6.2 | 81,719 | 242,938 | 324,657 | |||||||||
6.5 | 384,472 | 351,796 | 736,268 | |||||||||
6.8 | 185,329 | 318,409 | 503,738 | |||||||||
7.2 | 72,772 | 153,136 | 225,908 | |||||||||
7.5 | 5,946 | 4,856 | 10,802 | |||||||||
7.8 | - | 3,287 | 3,287 | |||||||||
8.2 | - | 1,173 | 1,173 | |||||||||
9.8 | - | 4,611 | 4,611 | |||||||||
|
|
|
|
|
| |||||||
Total | $ | 823,963 | $ | 1,241,476 | $ | 2,065,439 | ||||||
|
|
|
|
|
| |||||||
Troubled Debt Restructurings -The Company periodically modifies the terms of a loan receivable in response to borrowers' difficulties. Modifications that include a significant financial concession(s) to the borrower that likely reflect a current view that the repayment on the original terms is unlikely are accounted for as TDRs. The Company uses a consistent methodology across all loans to determine if a modification granted to a borrower, determined to be in financial difficulty is a TDR.
The Company's policies on TDR identification include the following examples of indicators used to determine whether the borrower is in financial difficulty:
| • | Payment default of principal and interest |
| • | Bankruptcy declaration |
| • | Going concern opinion issued by accountants |
| • | Insufficient cash flow to service debt with low likelihood of turnaround in the short term |
| • | Securities (public) are de-listed |
| • | Refinancing sources are unlikely |
| • | Financial covenants breach is unlikely to be amended |
If the borrower is determined to be in financial difficulty, then the Company utilizes the following criteria to determine whether a concession has been granted to the borrower:
| • | Modification of interest rate below market rate |
| • | The borrower does not otherwise have access to funding for debt with similar risk characteristics in the market at the restructured rate and terms |
| • | Capitalization of interest |
| • | Delaying principal and/or interest for a period of year or more |
| • | Forgiveness of the principal balance |
16
JEFFERIES FINANCE LLC AND SUBSIDIARIES
Notes to Consolidated Financial Statements
November 30, 2014 and 2013
Below is a summary of the Company's loans which were classified as TDR as of November 30, 2014 (in thousands):
| PRE- MODIFICATION OUTSTANDING RECORDED INVESTMENT | POST- MODIFICATION OUTSTANDING RECORDED INVESTMENT | INVESTMENT IN TDR SUBSEQUENTLY DEFAULTED | ||||||||||
Secondary | $ | 972 | $ | 972 | $ | - | ||||||
|
|
|
|
|
| |||||||
Total | $ | 972 | $ | 972 | $ | - | ||||||
|
|
|
|
|
| |||||||
Below is a summary of the Company's loans which were classified as TDR as of November 30, 2013 (in thousands):
| PRE- MODIFICATION OUTSTANDING RECORDED INVESTMENT | POST- MODIFICATION OUTSTANDING RECORDED INVESTMENT | INVESTMENT IN TDR SUBSEQUENTLY DEFAULTED | ||||||||||
Secondary | $ | 2,245 | $ | 2,245 | $ | - | ||||||
|
|
|
|
|
| |||||||
Total | $ | 2,245 | $ | 2,245 | $ | - | ||||||
|
|
|
|
|
| |||||||
All restructured loans that remain outstanding are on non-accrual status. Because the loans were classified on non-accrual status both before and after restructuring, the modifications did not impact the Company's determination of the allowance for loan losses. There were no payment defaults on loans restructured in troubled debt restructurings during the years ended November 30, 2014 and 2013.
Modified loans that are classified as TDRs are individually evaluated and measured for impairment. Modified loans that meet the definition of a TDR are subject to the Company's standard impaired loan policy, namely that non-accrual loans are individually reviewed for impairment.
Other Assets and Other Liabilities -Included in Other assets are amounts receivable for sales of loans pending settlement. As of November 30, 2014 and 2013, there were $63.3 million and $15.2 million, respectively, of pending sales. Additionally, included in Other liabilities are amounts payable for loans pending settlement. As of November 30, 2014 and 2013 there were $70.6 million and $134.7 million, respectively, of pending purchases.
5. LOANS HELD FOR SALE, NET
Below is a summary of Loans held for sale, net, as of November 30, 2014 and 2013 (in thousands):
| 2014 | 2013 | |||||||
Loans held for sale | $ | 1,072,900 | $ | 965,097 | ||||
Less: original issue discount | (19,161 | ) | (11,805 | ) | ||||
|
|
|
| |||||
Total loans held for sale, net of original issue discount | 1,053,739 | 953,292 | ||||||
Less: | ||||||||
Valuation allowance | (10,208 | ) | - | |||||
Deferred loan fees, net | (5,224 | ) | (4,608 | ) | ||||
|
|
|
| |||||
Loans held for sale, net | $ | 1,038,307 | $ | 948,684 | ||||
|
|
|
| |||||
17
JEFFERIES FINANCE LLC AND SUBSIDIARIES
Notes to Consolidated Financial Statements
November 30, 2014 and 2013
Included in the Loans held for sale was $861.9 million and $950.1 million of loans that funded prior to but settled after November 30, 2014 and November 30, 2013, respectively. As of November 30, 2014 and November 30, 2013 loans held for sale of $4.0 million and $307.5 million were pledged as collateral against the Company's credit facilities and secured notes issued by CLOs, respectively. See Note 8, Variable Interest Entities for more information on loans held for sale owned by CLOs.
As of November 30, 2014 and 2013, the Company had no impaired or non-accrual loans in Loans held for sale, net.
6. INVESTMENTS
As of November 30, 2014, one of the consolidated CLOs held $215.0 million of U.S. Treasury Securities which have short-term maturities and are restricted under the terms as stated in the CLO indentures. Also, under the fair value option as of November 30, 2014 and 2013, the Company held investments of $20.1 million and $5.2 million, respectively in a corporate bond, interest rate swaps and other investments which were accounted for at fair value.
DERIVATIVE FINANCIAL INSTRUMENTS
As part of certain CLOs' risk management strategy to manage the effect of fluctuations in London Interbank Offered Rate ("LIBOR") rates associated with its loan commitments, interest rate swaps were purchased with an initial notional value of $777.5 million with maturities ranging from one to seven years. On August 14, 2014, JFIN entered into a Total Return Swap ("TRS") with Jefferies Financial Products, LLC ("JFP"), a wholly owned subsidiary of JGL, with a Variable Funding Note in the amount of $23.0 million of one of the consolidated CLOs as the underlying asset. The TRS has a remaining maturity of approximately 7 years.
As of November 30, 2014, the interest rate swaps and the TRS had a fair value of $10.5 million and were included within Investments on the Consolidated Balance Sheets. The net loss on the interest rate swaps and TRS was $6.2 million for the year ended November 30, 2014, and was included in Other (losses) gains, net in the Consolidated Statements of Earnings. As of November 30, 2014, the counterparty credit quality with respect to the interest rate swaps was between A+ and BBB.
The following table sets forth the remaining contract maturities of the interest rate swaps and total return swap at their notional value as of November 30, 2014 (in thousands):
| 3-5 YEARS | GREATER THAN 5 YEARS | TOTAL | ||||||||||
Interest rate swaps | $ | 709,500 | $ | 68,000 | $ | 777,500 | ||||||
Total return swap | $ | - | $ | 23,000 | $ | 23,000 | ||||||
7. FINANCIAL INSTRUMENTS AT FAIR VALUE
The following table presents the Company's assets and liabilities measured at fair value on a recurring and nonrecurring basis as of November 30, 2014 and 2013 by level within the fair value hierarchy (in thousands):
November 30, 2014 | LEVEL 1 | LEVEL 2 | LEVEL 3 | TOTAL | ||||||||||||
Assets, nonrecurring basis: | ||||||||||||||||
Loans held for sale, net of original issue discount | $ | - | $ | 1,043,531 | $ | - | $ | 1,043,531 | ||||||||
|
|
|
|
|
|
|
| |||||||||
Assets, recurring basis: | ||||||||||||||||
Investments | ||||||||||||||||
U.S. treasury securities | $ | 214,971 | $ | - | $ | - | $ | 214,971 | ||||||||
Bonds | - | 4,837 | - | 4,837 | ||||||||||||
Interest rate swaps | - | 10,505 | - | 10,505 | ||||||||||||
Other investments | - | 4,793 | - | 4,793 | ||||||||||||
|
|
|
|
|
|
|
| |||||||||
Total Investments | $ | 214,971 | $ | 20,135 | $ | - | $ | 235,106 | ||||||||
|
|
|
|
|
|
|
| |||||||||
18
JEFFERIES FINANCE LLC AND SUBSIDIARIES
Notes to Consolidated Financial Statements
November 30, 2014 and 2013
NOVEMBER 30, 2013 | LEVEL 1 | LEVEL 2 | LEVEL 3 | TOTAL | ||||||||||||
Assets, nonrecurring basis: | ||||||||||||||||
Loans held for sale, net of original issue discount | $ | - | $ | 953,292 | $ | - | $ | 953,292 | ||||||||
|
|
|
|
|
|
|
| |||||||||
Assets, recurring basis: | ||||||||||||||||
Investments | ||||||||||||||||
Bonds | - | 5,225 | - | 5,225 | ||||||||||||
|
|
|
|
|
|
|
| |||||||||
There were no transfers between Level 1, Level 2 and Level 3 of the fair value hierarchy for the years ended November 30, 2014 and 2013.
For loans held for sale, net of any deferred loan origination fees, the Company uses observable market data, including pricing on recent trades, third party pricing, or when appropriate, the underlying collateral. Included within loans held for sale balance are loans recorded at lower of cost or fair value, where cost approximates fair value.
For bonds, interest rate swaps and other investments, the Company uses broker quotes for non-exchange traded investments and, based upon the observability of the inputs.
U.S. Treasury Securities are measured based on quoted market prices.
Total Return Swap is measured based on the fair value of the underlying asset.
Below is a summary of financial instruments not measured at fair value on a recurring or non-recurring basis as of November 30, 2014 and 2013, but for which fair value is required to be disclosed (in thousands):
| NOVEMBER 30, 2014 | NOVEMBER 30, 2013 | |||||||||||||||
| CARRYING VALUE | FAIR VALUE | CARRYING VALUE | FAIR VALUE | |||||||||||||
Financial assets: | ||||||||||||||||
Cash | $ | 576,222 | $ | 576,222 | $ | 162,046 | $ | 162,046 | ||||||||
Restricted cash | 670,015 | 670,015 | 77,954 | 77,954 | ||||||||||||
Loans receivable, net | 3,252,963 | 3,334,757 | 1,997,371 | 2,075,939 | ||||||||||||
|
|
|
|
|
|
|
| |||||||||
Total | $ | 4,499,200 | $ | 4,567,208 | $ | 2,237,371 | $ | 2,315,939 | ||||||||
|
|
|
|
|
|
|
| |||||||||
Financial liabilities: | ||||||||||||||||
Credit facilities | $ | 493,225 | $ | 493,225 | $ | 796,554 | $ | 796,554 | ||||||||
Secured notes payable, net | 2,826,517 | 2,826,840 | 986,224 | 989,385 | ||||||||||||
Long-term debt | 1,450,000 | 1,390,875 | 600,000 | 610,500 | ||||||||||||
|
|
|
|
|
|
|
| |||||||||
Total | $ | 4,769,742 | $ | 4,710,940 | $ | 2,382,778 | $ | 2,396,439 | ||||||||
|
|
|
|
|
|
|
| |||||||||
Cash and restricted cash -The carrying value of cash and restricted cash approximates fair value and is considered Level 1 measurement.
Loans receivable, net -A significant portion of the Company's loans receivable are measured primarily using broker quotations and using pricing service data from external providers. When pricing data is unavailable and there are no observable inputs, valuations are based on models involving projected cash flows of the issuer and market prices for comparable issuers and are considered Level 2 measurements.
Credit facilities -Due to the adjustable rate nature of the borrowings, the fair value of the credit facilities are estimated to be their carrying values and are considered Level 2 measurements. Rates currently are comparable to those offered to the Company for similar debt instruments of comparable maturities by the Company's lenders. Amounts presented in the table above are gross of deferred structuring fees as described in Note 9, Credit Facilities.
19
JEFFERIES FINANCE LLC AND SUBSIDIARIES
Notes to Consolidated Financial Statements
November 30, 2014 and 2013
Secured notes payable, net -The Company uses broker quotes for non-exchange traded investments and are considered Level 2 measurements.
Long-term debt -Fair value of long-term debt is based on broker quotations, which are Level 2 inputs. When broker quotes are not available, values are estimated using a discounted cash flow analysis with a discount rate approximating current market rates for issuances of similar term debt.
8. VARIABLE INTEREST ENTITIES
Variable interest entities ("VIEs") are entities in which equity investors lack the characteristics of a controlling financial interest. VIEs are consolidated by the primary beneficiary. The primary beneficiary is the party who has both (1) the power to direct the activities of a variable interest entity that most significantly impact the entity's economic performance and (2) an obligation to absorb losses of the entity or a right to receive benefits from the entity that could potentially be significant to the entity.
Variable interests in VIEs include debt and equity interests, commitments and management and performance fees. Involvement with VIEs arises primarily from involvement as a portfolio manager of collateralized loan obligations ("CLOs"). The Company also acts as sponsor and funds the underlying loans prior to the close of a CLO and owns notes issued by the CLOs.
The Company determines whether it is the primary beneficiary of a VIE upon initial involvement with the VIE and reassess whether it is the primary beneficiary of a VIE on an ongoing basis. The determination of whether the Company is the primary beneficiary of a VIE is based upon the facts and circumstances for each VIE and requires significant judgment. Considerations in determining the VIE's most significant activities and whether the Company has the power to direct those activities include, but are not limited to, the VIE's purpose and design and the risks passed through to investors, the voting interests of the VIE, management, service and/or other agreements of the VIE, involvement in the VIE's initial design and the existence of explicit or implicit financial guarantees.
Variable interests in a VIE are assessed both individually and in aggregate to determine whether the Company has an obligation to absorb losses of or a right to receive benefits from the VIE that could potentially be significant to the VIE. The determination of whether the Company's variable interest is significant to the VIE requires significant judgment. In determining the significance of our variable interest, we consider the terms, characteristics and size of the variable interests, the design and characteristics of the VIE, our involvement in the VIE and our market-making activities related to the variable interests.
The following table presents information about the Company's consolidated VIEs at November 30, 2014 and November 30, 2013 (in thousands):
| NOVEMBER 30, 2014 | NOVEMBER 30, 2013 | |||||||
Restricted cash | $ | 633,778 | $ | 48,006 | ||||
Loans | 2,413,044 | 1,077,237 | ||||||
Investments | 225,534 | - | ||||||
Interest receivable and other assets | 92,462 | 31,934 | ||||||
|
|
|
| |||||
| $ | 3,364,818 | $ | 1,157,177 | |||||
|
|
|
| |||||
Secured notes payable | $ | 2,826,517 | $ | 986,224 | ||||
Other liabilities | 41,496 | 31,700 | ||||||
|
|
|
| |||||
| $ | 2,868,013 | $ | 1,017,924 | |||||
|
|
|
| |||||
20
JEFFERIES FINANCE LLC AND SUBSIDIARIES
Notes to Consolidated Financial Statements
November 30, 2014 and 2013
The Company is the primary beneficiary of CLOs to which the Company transferred bank loans, securities and participation interests in the form of senior secured loans, second lien loans, unsecured loans, senior secured bonds, senior secured floating notes, unsecured bonds and revolving credit loans backed by corporate credits and retained a portion of the notes issued by the CLO. In the creation of the CLO, the Company was involved in the decisions made during the establishment and design of the entity. The Company acts as the portfolio manager for the CLOs and holds variable interests consisting of the retained notes that could potentially be significant. The assets of the VIEs consist of the loans and bonds backed by corporate credits, which are available for the benefit of the vehicle's beneficial interest holders. The creditors of the VIEs do not have recourse to the general credit of the Company and the assets of the VIEs are not available to satisfy any other debt.
9. CREDIT FACILITIES
As of November 30, 2014 and 2013, the Company had secured credit facilities totaling $3.0 billion and $2.0 billion, respectively, which were used to fund eligible loans. The interest rates related to the credit facilities are primarily variable interest rates based on LIBOR plus a spread as stated in the respective agreements. The credit facilities are secured by the underlying loans funded with the proceeds of the respective facility.
During the years ended November 30, 2014, 2013 and 2012, the Company entered into revolving credit agreements for $1.7 billion, $0.8 billion and $0.4 million, respectively. During the years ended November 30, 2014, 2013 and 2012, $0.7 billion, $0.4 billion and $0.7 billion of outstanding commitments matured or terminated and any outstanding amounts were repaid.
Below is a summary of the Credit Facilities and Members' Fronting Line as of and for the year ended November 30, 2014 (in millions):
| JFIN CAPITAL 2014 LLC | THIRD PARTY FRONTING LINE | JFIN FUND IV 2014 LLC | JFIN FUND IV LLC | JFIN BUSINESS CREDIT FUND I LLC | JFIN CAPITAL 2013 LLC | JFIN FUND III LLC | MEMBERS' FRONTING LINE | TOTAL | ||||||||||||||||||||||||||||
Total availability under the facility | $ | 400.0 | $ | 750.0 | $ | 400.0 | $ | - | $ | 100.0 | $ | - | $ | 300.0 | $ | 1,000.0 | $ | 2,950.0 | ||||||||||||||||||
Outstanding balance | - | - | 279.2 | - | 14.1 | - | 199.9 | - | 493.2 | |||||||||||||||||||||||||||
|
|
|
|
|
|
|
|
|
|
|
|
|
|
|
|
|
| |||||||||||||||||||
Current availability | $ | 400.0 | $ | 750.0 | $ | 120.8 | $ | - | $ | 85.9 | $ | - | $ | 100.1 | $ | 1,000.0 | $ | 2,456.8 | ||||||||||||||||||
|
|
|
|
|
|
|
|
|
|
|
|
|
|
|
|
|
| |||||||||||||||||||
Principal balance of loans pledged as collateral | $ | - | $ | - | $ | 385.1 | $ | - | $ | 21.7 | $ | - | $ | 271.9 | $ | - | $ | 678.7 | ||||||||||||||||||
Largest outstanding amounts during the periods | - | 250.0 | 279.2 | 302.0 | 21.0 | 320.9 | 199.9 | 940.0 | 2,313.0 | |||||||||||||||||||||||||||
Interest expense incurred | - | 0.1 | 1.2 | 1.0 | 0.1 | 4.3 | 3.6 | 4.1 | 14.4 | |||||||||||||||||||||||||||
Undrawn facility fees incurred | 0.8 | 0.6 | - | - | 0.4 | 0.4 | 0.6 | 3.2 | 6.0 | |||||||||||||||||||||||||||
Variable interest rate based on LIBOR | - | 3.25 | % | 1.36 | % | 1.31 | % | 1.73 | % | 2.40 | % | 2.49 | % | 5.88 | % | - | ||||||||||||||||||||
Maturity date | 5-20-16 | 6-11-15 | (1) | 1-7-16 | Terminated | 9-12-18 | Terminated | 2-12-19 | 3-1-16 | (2) | - | |||||||||||||||||||||||||
| (1) | After June 11, 2015, the Third Party Fronting Line contains annual automatic one-year extensions, which may be cancelled by the lenders upon 60 days notice of non-renewal. From November 17, 2014 to December 31, 2014, the Third Party Fronting Line was temporarily increased to $750.0 million. |
| (2) | After March 1, 2016, the Members' Fronting Line contains annual automatic one-year extensions, absent a 60 day termination notice by either party. |
21
JEFFERIES FINANCE LLC AND SUBSIDIARIES
Notes to Consolidated Financial Statements
November 30, 2014 and 2013
Below is a summary of the Credit Facilities and Members' Fronting Line as of and for the year ended November 30, 2013 (in millions):
| JFIN FUND IV LLC | JFIN BUSINESS CREDIT FUND I LLC | JFIN CAPITAL 2013 LLC | JFIN CAPITAL LLC | JFIN FUND III LLC | MEMBERS' FRONTING LINE | TOTAL | ||||||||||||||||||||||
Total availability under the facility | $ | 320.0 | $ | 100.0 | $ | 400.0 | $ | - | $ | 150.0 | $ | 1,000.0 | $ | 1,970.0 | ||||||||||||||
Outstanding balance | 151.0 | - | 228.7 | - | 124.3 | 292.5 | 796.5 | |||||||||||||||||||||
|
|
|
|
|
|
|
|
|
|
|
|
|
| |||||||||||||||
Current availability | $ | 169.0 | $ | 100.0 | $ | 171.3 | $ | - | $ | 25.7 | $ | 707.5 | $ | 1,173.5 | ||||||||||||||
|
|
|
|
|
|
|
|
|
|
|
|
|
| |||||||||||||||
Principal balance of loans pledged as collateral | $ | 202.3 | $ | 12.0 | $ | 367.5 | $ | - | $ | 169.6 | $ | 292.5 | $ | 1,043.9 | ||||||||||||||
Largest outstanding amounts during the periods | 151.0 | - | 228.7 | 209.5 | 124.3 | 786.8 | 1,500.3 | |||||||||||||||||||||
Interest expense incurred | 0.2 | - | 1.7 | 0.9 | 2.3 | 11.5 | 16.6 | |||||||||||||||||||||
Undrawn facility fees incurred | - | 0.1 | 1.0 | 0.3 | 0.8 | 2.7 | 4.9 | |||||||||||||||||||||
Variable interest rate based on LIBOR | 1.32 | % | 1.74 | % | 2.41 | % | 2.54 | % | 2.55 | % | 8.28 | % | - | |||||||||||||||
Below is a summary of the Credit Facilities and Members' Fronting Line as of and for the year ended November 30, 2012 (in millions):
| JFIN FUND II LLC | JFIN FUNDING LLC | JFIN CAPITAL LLC | JFIN FUND III LLC | MEMBERS' FRONTING LINE | TOTAL | |||||||||||||||||||
Total availability under the facility | $ | - | $ | - | $ | 400.0 | $ | 150.0 | $ | 1,000.0 | $ | 1,550.0 | ||||||||||||
Outstanding balance | - | - | 136.9 | 75.7 | 250.0 | 462.6 | ||||||||||||||||||
|
|
|
|
|
|
|
|
|
|
|
| |||||||||||||
Current availability | $ | - | $ | - | $ | 263.1 | $ | 74.3 | $ | 750.0 | $ | 1,087.4 | ||||||||||||
|
|
|
|
|
|
|
|
|
|
|
| |||||||||||||
Principal balance of loans pledged as collateral | $ | - | $ | - | $ | 211.9 | $ | 108.3 | $ | 250.0 | $ | 570.2 | ||||||||||||
Largest outstanding amounts during the periods | 91.6 | 274.5 | 136.9 | 75.7 | 891.3 | 1,470.0 | ||||||||||||||||||
Interest expense incurred | 2.3 | 5.2 | 0.9 | 1.5 | 20.1 | 30.0 | ||||||||||||||||||
Undrawn facility fees incurred | - | 2.0 | 1.1 | 0.5 | 3.7 | 7.3 | ||||||||||||||||||
Variable interest rate based on LIBOR | 2.96 | % | 2.50 | % | 2.46 | % | 2.70 | % | 8.18 | % | - | |||||||||||||
Natixis LC Facility -On August 17, 2011, JFIN entered into a letter of credit and reimbursement agreement with Natixis for a $50.0 million letter of credit commitment (the "LC Facility"). The LC Facility was established for the purpose of issuing letters of credit to borrowers under credit facilities originated by JFIN. On June 3, 2014, the Company extended its availability under the Facility for another year to August 2015. Interest is charged on issued letters of credit at a rate of LIBOR plus a margin of 2.5%. Interest expense for the years ended November 30, 2014, 2013 and 2012 was $1.0 million, $0.5 million and $0.5 million, respectively, and is included in Interest expense in the Consolidated Statements of Earnings.
Deferred Structuring Fees -Deferred structuring fees in aggregate were $9.3 million and $5.7 million at November 30, 2014, and November 30, 2013, respectively, and are included in Other assets on the Consolidated Balance Sheets. Interest expense for the years ended November 30, 2014, 2013 and 2012 was $3.9 million, $2.0 million and $10.9 million, respectively, and is included in Interest expense in the Consolidated Statements of Earnings.
Undrawn Facility Fees -Undrawn facility fees in aggregate were $5.9 million, $5.0 million and $5.9 million as of and for the years ended November 30, 2014, 2013 and 2012, respectively, and are included in Interest expense in the Consolidated Statements of Earnings.
22
JEFFERIES FINANCE LLC AND SUBSIDIARIES
Notes to Consolidated Financial Statements
November 30, 2014 and 2013
10. SECURED NOTES PAYABLE, NET
CLOs consolidated by the Company are funded by the issuance of the notes, which are included in Secured notes payable, net on the Consolidated Financial Statements. All of the CLOs assets are pledged as collateral against the secured notes issued by the respective CLO. The cash held by the CLOs is used first to pay interest due to note holders or to be reinvested in loan assets as prescribed by the indentures. JFIN is entitled to the residual interest of all CLOs after all claims to note holders have been paid. See Note 8, Variable Interest Entities for more information on secured notes payable related to consolidated CLOs.
Following are the remaining maturities of the secured notes payable, net (in thousands):
| November 30, 2014 | November 30, 2013 | |||||||
Due in 2015 | $ | - | $ | - | ||||
Due in 2016 | - | - | ||||||
Due in 2017 | - | - | ||||||
Due in 2018 | - | - | ||||||
Due in 2019 | - | - | ||||||
Thereafter | 2,826,517 | 986,224 | ||||||
|
|
|
| |||||
Total | $ | 2,826,517 | $ | 986,224 | ||||
|
|
|
| |||||
Interest rates related to the secured notes are variable interest rates based on LIBOR plus a spread as stated in the respective note agreements ranging from 0.205% to 6.500%.
Deferred Structuring Fees -Deferred structuring fees in aggregate were $34.1 million and $10.1 million as of November 30, 2014 and November 30, 2013, respectively, and are included in Other assets on the Consolidated Balance Sheets. Deferred structuring fee expense was $2.7 million, $0.9 million and $0.4 million for the years ended November 30, 2014, 2013 and 2012, respectively, and is included in Interest expense in the Consolidated Statements of Earnings.
Original Issue Discount -The unamortized original issue discount of $50.7 million and $19.1 million as of November 30, 2014 and November 30, 2013, respectively, was included within Secured notes payable, net on the Consolidated Balance Sheets. The amortization of the original issue discount was $4.1 million, $1.6 million and $0.3 million for the years ended November 30, 2014, 2013 and 2012, respectively, and was included in Interest expense in the Consolidated Statements of Earnings.
11. LONG-TERM DEBT
In October 2014, the Company issued $425.0 million of senior unsecured notes ("2021 Notes") to third party investors intended to be used for general corporate purposes. The 2021 Notes bear interest at a rate of 7.5% per year payable semi-annually in arrears on April 15 and October 15 of each year, beginning on April 15, 2015. Payment of the full principal amount of the 2021 Notes will be due upon maturity on April 15, 2021. The 2021 Notes are not guaranteed by any of the Company's subsidiaries, however its subsidiaries may be required to guarantee the 2021 Notes in the future pursuant to certain covenants as defined in the 2021 Notes offering memorandum.
In March 2014, the Company issued $425.0 million of senior unsecured notes ("2022 Notes") to third party investors intended to be used for general corporate purposes. The 2022 Notes bear interest at a rate of 6.875% per year payable semi-annually in arrears on April 15 and October 15 of each year, beginning on October 15, 2014. Payment of the full principal amount of the 2022 Notes will be due upon maturity on April 15, 2022. The 2022 Notes are not guaranteed by any of the Company's subsidiaries, however its subsidiaries may be required to guarantee the 2022 Notes in the future pursuant to certain covenants as defined in the 2022 Notes offering memorandum.
23
JEFFERIES FINANCE LLC AND SUBSIDIARIES
Notes to Consolidated Financial Statements
November 30, 2014 and 2013
In March 2013, the Company issued $600.0 million of senior unsecured notes ("2020 Notes") to third party investors intended to be used for general corporate purposes. The 2020 Notes bear interest at a rate of 7.375% per year payable semi-annually in arrears on April 1 and October 1 of each year, beginning on October 1, 2013. Payment of the full principal amount of the 2020 Notes will be due upon maturity on April 1, 2020. The 2020 Notes are not guaranteed by any of the Company's subsidiaries, however its subsidiaries may be required to guarantee the 2020 Notes in the future pursuant to certain covenants as defined in the 2020 Notes offering memorandum.
Collectively, the 2020 Notes, 2021 Notes and the 2022 Notes are referred to as the "Senior Notes".
At any time prior to April 1, 2016, October 15, 2017 and April 15, 2017, the Company may redeem the Senior Notes, respectively, in whole or in part, at their option, at a redemption price equal to 100% of the principal amount of such Senior Notes, respectively, plus the relevant applicable premium as of, and accrued and unpaid interest, if any, to but not including the applicable redemption date.
The tables below summarize the redemption price and date for the Senior Notes:
| 2020 Notes | 2021 Notes | 2022 Notes | ||||||||||
YEAR | PERCENTAGE | |||||||||||
2016 | 105.531 | % | - | - | ||||||||
2017 | 103.688 | % | 105.625 | % | 105.156 | % | ||||||
2018 | 101.844 | % | 103.750 | % | 103.438 | % | ||||||
2019 | 100.000 | % | 101.875 | % | 101.719 | % | ||||||
2020 and thereafter | - | 100.000 | % | 100.000 | % | |||||||
At any time and from time to time prior to April 1, 2016, April 15, 2017 and October 15, 2017, the Company may redeem the Senior Notes, respectively, with the net cash proceeds received by the Company from any equity offering at a redemption price equal to 107.375%, 106.875% and 107.500%, respectively, plus accrued but unpaid interest, if any, to but not including the applicable redemption date, in an aggregate principal amount for all such redemptions not to exceed 35% of the original aggregate principal amount of the Senior Notes, respectively (including any additional notes); provided that (1) in each case the redemption takes place not later than 180 days after the consummation of the related equity offering; and (2) not less than 65% of the original aggregate principal amount of the Senior Notes, respectively (including any additional notes) issued under the indenture remains outstanding immediately after such redemption (excluding the aggregate principal amount of all Senior Notes, respectively then held by the Issuers or any of their restricted subsidiaries).
If a change of control occurs, the holders of the Senior Notes will have the right to require the Company to repurchase their Senior Notes, respectively, in whole or in part, at a purchase price of 101% of the principal amount of the Senior Notes, respectively, plus accrued and unpaid interest, if any, to the date of repurchase. If the Company sells certain assets and the net cash proceeds are not applied as permitted under the indenture governing the Senior Notes, the Company may have to use such proceeds to offer to purchase some of the Senior Notes, respectively at 100% of the principal, plus accrued and unpaid interest, if any, to the date of repurchase.
Interest expense was $67.9 million and $30.1 million for the years ended November 30, 2014 and 2013, respectively.
Deferred Structuring Fees -Deferred structuring fees in aggregate were $27.6 million and $13.2 million as of November 30, 2014 and November 30, 2013, respectively and are included in Other assets on the Consolidated Balance Sheets. Deferred structuring fee expense was $3.0 million and $1.4 million for the years ended November 30, 2014 and November 30, 2013, respectively, and was included in Interest expense in the Consolidated Statements of Earnings.
24
JEFFERIES FINANCE LLC AND SUBSIDIARIES
Notes to Consolidated Financial Statements
November 30, 2014 and 2013
12. FEE INCOME, NET
The Company presents fee income net of origination, syndication and deferred underwriting fees in the Consolidated Statements of Earnings. The following is a summary of the components of Fee income, net for the years ended November 30, 2014, 2013 and 2012 (in thousands):
| 2014 | 2013 | 2012 | ||||||||||
Underwriting fees | $ | 438,574 | $ | 364,203 | $ | 246,462 | ||||||
Administration fees | 5,307 | 4,552 | 3,621 | |||||||||
Other fees | 31,136 | 19,475 | 18,080 | |||||||||
|
|
|
|
|
| |||||||
| 475,017 | 388,230 | 268,163 | ||||||||||
Less: | ||||||||||||
Deferred underwriting fees | (80,822 | ) | (58,394 | ) | (17,617 | ) | ||||||
Fees paid to Jefferies LLC (1) | (198,349 | ) | (162,344 | ) | (122,843 | ) | ||||||
Fees paid to third parties | (23,532 | ) | (28,045 | ) | (21,230 | ) | ||||||
|
|
|
|
|
| |||||||
Fee income, net | $ | 172,314 | $ | 139,447 | $ | 106,473 | ||||||
|
|
|
|
|
| |||||||
| (1) | Jefferies LLC is a wholly owned subsidiary of JGL. |
13. OTHER (LOSSES) GAINS, NET
The following summarizes Other losses, net for the years ended November 30, 2014, 2013 and 2012 (in thousands):
| 2014 | 2013 | 2012 | ||||||||||
Loss on loans receivable | $ | - | $ | (189 | ) | $ | (4,359 | ) | ||||
Realized gain (loss) on sale of loans held for sale | 5,429 | (11,386 | ) | 734 | ||||||||
Unrealized (loss) gain of loans held for sale | (8,859 | ) | 1,579 | 1,904 | ||||||||
Realized (loss) gain on sales of investments | (114 | ) | 1,873 | 6,115 | ||||||||
Unrealized (loss) gain on investments | (6,455 | ) | 225 | 2,383 | ||||||||
|
|
|
|
|
| |||||||
Other (losses) gains, net | $ | (9,999 | ) | $ | (7,898 | ) | $ | 6,777 | ||||
|
|
|
|
|
| |||||||
14. INCOME TAXES
Income tax expense for years ended November 30, 2014, 2013 and 2012, consist of the following (in thousands):
| 2014 | 2013 | 2012 | ||||||||||
Current-local | $ | 7,032 | $ | 6,250 | $ | 3,224 | ||||||
Deferred-local | (1,490 | ) | (1,338 | ) | 1,109 | |||||||
|
|
|
|
|
| |||||||
Total income tax expense | $ | 5,542 | $ | 4,912 | $ | 4,333 | ||||||
|
|
|
|
|
| |||||||
Deferred income taxes are provided for temporary differences in reporting certain items, principally the allowance for loan losses and deferred loan fees. The Company had a net deferred tax asset of $4.9 million and $3.4 million at November 30, 2014 and 2013, respectively, included in Other assets on the Consolidated Balance Sheets. For the years ended November 30, 2014 and 2013, the Company concluded, based upon its assessment of positive and negative evidence, that it is more likely than not that the results of future operations will generate sufficient taxable income to realize its deferred tax assets. Accordingly, the Company did not record a valuation allowance at November 30, 2014 and 2013.
25
JEFFERIES FINANCE LLC AND SUBSIDIARIES
Notes to Consolidated Financial Statements
November 30, 2014 and 2013
The Company had a current income tax payable balance of $15.7 million and $11.2 million at November 30, 2014 and 2013, respectively, included in Other liabilities on the Consolidated Balance Sheets.
The Company's effective tax rate was 3.9%, 3.6% and 3.3% for the years ended November 30, 2014, 2013 and 2012, respectively. The Company's effective tax rate for the years ended November 30, 2014, 2013 and 2012 differed from the New York City statutory rate of 4.0%, primarily due to the exclusion of foreign income and losses not subject to tax in the United States and the apportioning of revenues for state tax purposes.
The balance of net unrecognized tax benefits as of November 30, 2014 and 2013 was approximately $18.6 million and $14.3 million, respectively. Interest related to unrecognized tax benefits is recognized in income tax expense in Consolidated Statements of Earnings. Penalties, if any, are recognized in other expenses in Consolidated Statements of Earnings. The Company has interest accrued of approximately $0.9 million and $0.3 million as of November 30, 2014 and 2013, respectively. No material penalties were accrued.
The Company is currently under examination by New York City for the years 2006 to 2009. The Company does not expect that the resolution of this examination will have a material impact on the Consolidated Financial Statements.
15. RELATED PARTY TRANSACTIONS
JGL -On March 1, 2013, the calculation of contributed capital was amended to include both contributed capital and retained earnings. During 2014, JGL contributed $125.0 million of capital to JFIN and JFIN distributed $35.6 million to JGL. The undrawn capital commitment available to JFIN from JGL at November 30, 2014 and 2013 was $103.8 million and $262.6 million, respectively.
JFIN owed JGL $0.9 million and $1.0 million as of November 30, 2014 and 2013, respectively related to interest payable on the Fronting Line, which was recorded in Due to affiliates on the Consolidated Balance Sheets.
JGL provides a guarantee to one of the consolidated CLOs, whereby Jefferies is required to make certain payments to the CLO in the event that JFIN is unable to meet its obligations. As of November 30, 2014, there was $1.2 million outstanding of the maximum amount payable under the guarantee of $21.0 million which matures in January 2021.
Mass Mutual -On March 1, 2013, the calculation of contributed capital was amended to include both contributed capital and retained earnings. During 2014, Mass Mutual contributed $125.0 million of capital to JFIN and JFIN distributed $32.0 million to Mass Mutual. The undrawn capital commitment available to JFIN from Mass Mutual at November 30, 2014 and 2013 was $103.8 million and $262.6 million, respectively.
JFIN owed Mass Mutual $0.9 million and $1.0 million as of November 30, 2014 and 2013, respectively, related to interest payable on the Fronting Line, which was recorded in Due to affiliates on the Consolidated Balance Sheets.
BCM -Under the Babson Service Agreement, JFIN is required to reimburse BCM for management fees. Management fees paid to BCM are based on a percentage of the consolidated portfolio, excluding the CLOs. BCM is the sub-advisor to the CLOs and is entitled to receive management fees underlined in the sub-advisor agreement. All management fees earned by BCM are included in General, administrative and other in the Consolidated Statements of Earnings.
Below is a summary of management fees earned by BCM for the years ended November 30, 2014, 2013 and 2012 (in thousands):
| 2014 | 2013 | 2012 | ||||||||||
Babson Service Agreement management fees | $ | 8,050 | $ | 4,435 | $ | 4,892 | ||||||
Collateral management fees | 6,158 | 3,115 | 1,806 | |||||||||
|
|
|
|
|
| |||||||
Total management fees charged by BCM | $ | 14,208 | $ | 7,550 | $ | 6,698 | ||||||
|
|
|
|
|
| |||||||
JFIN owed BCM approximately $4.8 million and $1.5 million at November 30, 2014 and November 30, 2013, respectively, which are recorded in Due to affiliates on the Consolidated Balance Sheets.
26
JEFFERIES FINANCE LLC AND SUBSIDIARIES
Notes to Consolidated Financial Statements
November 30, 2014 and 2013
In March of 2014, JFIN made a distribution to BCM in the amount of $3.6 million.
Jefferies LLC -Under the Jefferies Service Agreement, Jefferies LLC ("Jefferies"), a wholly owned subsidiary of JGL, is required to provide specifically identified staff for the benefit of the Company. Also, under the agreement, JFIN is required to reimburse Jefferies for administration, rent, taxes and origination fees as well as any other services performed in the support of loan origination activities.
Below is a summary of expenses paid by Jefferies on behalf of JFIN for the years ended November 30, 2014, 2013 and 2012 (in thousands):
| 2014 | 2013 | 2012 | ||||||||||
Compensation and benefits | $ | 32,165 | $ | 23,212 | $ | 17,386 | ||||||
Administration expenses | 4,440 | 3,091 | 2,071 | |||||||||
Occupancy expenses | 2,160 | 1,338 | 1,383 | |||||||||
New York City Unincorporated Business Tax | 2,637 | 2,231 | 5,860 | |||||||||
|
|
|
|
|
| |||||||
Expenses charged by Jefco | $ | 41,402 | $ | 29,872 | $ | 26,700 | ||||||
|
|
|
|
|
| |||||||
The Company's operating costs are paid by Jefferies and are included in Compensation and benefits and General, administrative and other in the Consolidated Statements of Earnings. Compensation and benefit costs include salaries, bonuses, retirement and medical insurance plan costs, of which certain amounts are deferred as direct loan origination costs.
All benefit plans that the employees participate in are provided by Jefferies. Therefore benefit plan expenses are determined based upon participation and are reflected through an allocation from Jefferies to the Company. Administration and occupancy expenses are included in General, administrative and other. The Company reimburses Jefferies for all compensation, administration, occupancy and other amounts paid by Jefferies on behalf of the Company on a monthly basis.
Under the Jefferies Service Agreement, JFIN is required to pay Jefferies fees on certain transactions originated by Jefferies. Origination fees charged by Jefferies were $198.3 million, $162.3 million and $122.8 million for the years ended November 30, 2014, 2013 and 2012, respectively, and are recorded in Fee income, net, in the Consolidated Statements of Earnings.
In the regular course of business, JFIN enters into agreements, related to specific transactions, with Jefferies and/or JGL to provide certain operational support, subsidies for loans, reimbursement of expenses, or to mitigate potential losses on transactions.
JFIN owed Jefferies $39.9 million and $29.7 million at November 30, 2014 and November 30, 2013, respectively, which were recorded in Due to affiliates on the Consolidated Balance Sheets.
Additionally, we have entered into a derivative contract with JFP whose underwriting is based on variable funding note. Refer to Note 6, Investments, and Note 7, Financial Instruments at Fair Value.
In connection with the issuance of the Senior Notes, Jefferies acted as underwriter. Jefferies also acted as a placement agent for certain CLOs.
The accompanying consolidated financial statements have been prepared from separate records maintained by the Company, which may not necessarily be indicative of the financial condition or the results of operations that would have existed if the Company had been operated as an unaffiliated company.
27
JEFFERIES FINANCE LLC AND SUBSIDIARIES
Notes to Consolidated Financial Statements
November 30, 2014 and 2013
16. LOAN COMMITMENTS
From time to time, the Company makes commitments to extend revolving lines of credit and delayed draw term loans to borrowers. These commitments are not recorded on the Consolidated Balance Sheets. Once drawn, these commitments can be pledged as collateral under the Company's credit facilities and funded. As of November 30, 2014 and November 30, 2013, the Company had undrawn commitments of $1,463.5 million and $807.0 million, respectively, in both the loans receivable and loans held for sale portfolios. Of the $807.0 million, there were approximately $95.0 million of commitments in loans held for sale awaiting syndication as of November 30, 2013. As of November 30, 2014, the Company through the consolidated CLOs had the capacity to fund $840.0 million of revolving commitments. In addition, the Company had $216.0 million of eligible revolving commitments outstanding, subject to one of the credit facility's equity requirements. As of November 30, 2014 and November 30, 2013, these commitments had maturity dates through October 2020 and August 2019, respectively. For the years ended November 30, 2014, 2013 and 2012, the Company earned accrued unfunded fees of $9.2 million, $5.1 million and $5.3 million, respectively. These amounts are included in Fee income in the Consolidated Statements of Earnings.
In addition, during the normal course of business, the Company extends commitments to underwrite credit facilities. As of November 30, 2014 and November 30, 2013, the Company had $4.2 billion and $2.1 billion, respectively of commitments to lend to such underwritings. As of November 30, 2014, JFIN had syndicated $1.5 billion of the $4.2 billion of underwriting commitments to third parties with the balance of the commitments scheduled to de-risk in subsequent periods. There can be no assurance as to the amount, timing, or if such commitments will be funded.
17. CONCENTRATIONS OF CREDIT RISK
In the normal course of business, the Company engages in commercial lending activities with borrowers primarily throughout the United States. As of November 30, 2014, there were four borrowers whose individual outstanding loan balances represented 11%, 4%, 3%, and 3% of all loan balances. As of November 30, 2013, there were four borrowers whose individual outstanding loan balances represented 8%, 7%, 7% and 6% of all loan balances. As of November 30, 2014, healthcare, finance and retail stores were the largest industry concentrations, which made up approximately 23%, 10% and 8%, respectively, of all loan balances. As of November 30, 2013, technology, industrials and healthcare were the largest industry concentrations, which made up approximately 18%, 14% and 13%, respectively, of all loan balances. Loans balances include both Loans receivable and Loans held for sale.
* * * * * *
28