UNITED STATES SECURITIES AND EXCHANGE COMMISSION
Washington, D.C. 20549
|
FORM 10-K
(Mark One)
x | ANNUAL REPORT PURSUANT TO SECTION 13 OR 15(d) OF THE SECURITIES EXCHANGE ACT OF 1934 |
| For the fiscal year ended December 30, 2017. |
| or |
¨ | TRANSITION REPORT PURSUANT TO SECTION 13 OR 15(d) OF THE SECURITIES EXCHANGE ACT OF 1934 |
| For the transition period from to . |
Commission File Number 000-06217
|

INTEL CORPORATION
(Exact name of registrant as specified in its charter)
Delaware |
| 94-1672743 |
State or other jurisdiction of incorporation or organization |
| (I.R.S. Employer Identification No.) |
|
|
|
2200 Mission College Boulevard, Santa Clara, California |
| 95054-1549 |
(Address of principal executive offices) |
| (Zip Code) |
Registrant's telephone number, including area code (408) 765-8080
Securities registered pursuant to Section 12(b) of the Act:
Title of each class |
| Name of each exchange on which registered |
Common stock, $0.001 par value |
| The Nasdaq Global Select Market* |
Securities registered pursuant to Section 12(g) of the Act:
None
|
Indicate by check mark if the registrant is a well-known seasoned issuer, as defined in Rule 405 of the Securities Act. Yes x No ¨
Indicate by check mark if the registrant is not required to file reports pursuant to Section 13 or Section 15(d) of the Act. Yes ¨ No x
Indicate by check mark whether the registrant (1) has filed all reports required to be filed by Section 13 or 15(d) of the Securities Exchange Act of 1934 during the preceding 12 months (or for such shorter period that the registrant was required to file such reports), and (2) has been subject to such filing requirements for the past 90 days. Yes x No ¨
Indicate by check mark whether the registrant has submitted electronically and posted on its corporate website, if any, every interactive data file required to be submitted and posted pursuant to Rule 405 of Regulation S-T (§ 232.405 of this chapter) during the preceding 12 months (or for such shorter period that the registrant was required to submit and post such files). Yes x No ¨
Indicate by check mark if disclosure of delinquent filers pursuant to Item 405 of Regulation S-K (§229.405 of this chapter) is not contained herein, and will not be contained, to the best of registrant's knowledge, in definitive proxy or information statements incorporated by reference in Part III of this Form 10-K or any amendment to this Form 10-K. x
Indicate by check mark whether the registrant is a large accelerated filer, an accelerated filer, a non-accelerated filer, a smaller reporting company, or an emerging growth company. See the definitions of "large accelerated filer," "accelerated filer," "smaller reporting company," and "emerging growth company" in Rule 12b-2 of the Exchange Act.
Large accelerated filer x | Accelerated filer ¨ | Non-accelerated filer ¨ | Smaller reporting company ¨ | Emerging growth company ¨ |
| | (Do not check if a smaller reporting company) |
|
|
If an emerging growth company, indicate by check mark if the registrant has elected not to use the extended transition period for complying with any new or revised financial accounting standards provided pursuant to Section 13(a) of the Exchange Act. ¨
Indicate by check mark whether the registrant is a shell company (as defined in Rule 12b-2 of the Act). Yes ¨ No x
Aggregate market value of voting and non-voting common equity held by non-affiliates of the registrant as of June 30, 2017 , based upon the closing price of the common stock as reported by the Nasdaq Global Select Market on such date, was $158.3 billion . 4,668 million shares of common stock were outstanding as of February 7, 2018 .
DOCUMENTS INCORPORATED BY REFERENCE
Portions of the registrant's proxy statement related to its 2018 Annual Stockholders' Meeting to be filed subsequently are incorporated by reference into Part III of this Annual Report on Form 10-K. Except as expressly incorporated by reference, the registrant's proxy statement shall not be deemed to be part of this report.
Table of contents
CHANGES TO OUR ANNUAL REPORT ON FORM 10-K
To improve readability and better present how we organize and manage our business, we have changed the order and presentation of content in our Annual Report on Form 10-K (Form 10-K). See "Form 10-K Cross-Reference Index" within the Consolidated Financial Statements and Supplemental Details for a cross-reference index to the traditional U.S. Securities and Exchange Commission (SEC) Form 10-K format.
We have included key metrics that we use to measure our business, some of which are non-GAAP measures. See these "Non-GAAP Financial Measures" within Other Key Information.
FUNDAMENTALS OF OUR BUSINESS |
| OTHER KEY INFORMATION | ||
2 | Business Introduction |
| 41 | Stock Performance Graph |
4 | A Year in Review |
| 42 | Selected Financial Data |
6 | How We Organize Our Business |
| 43 | Sales and Marketing |
7 | Capital Allocation |
| 44 | Competition |
8 | Our Strategy |
| 45 | Intellectual Property Rights and Licensing |
10 | Research and Development (R&D) and Manufacturing |
| 46 | Critical Accounting Estimates |
12 | Who Manages Our Business |
| 46 | Risk Factors |
13 | Human Capital |
| 53 | Non-GAAP Financial Measures |
14 | Corporate Responsibility and Sustainability |
| 55 | Properties |
|
|
| 55 | Market for Registrant's Common Equity |
MANAGEMENT'S DISCUSSION AND ANALYSIS (MD&A) - RESULTS OF OPERATIONS |
| 56 | Availability of Company Information | |
|
|
| ||
15 | Overview |
| CONSOLIDATED FINANCIAL STATEMENTS AND SUPPLEMENTAL DETAILS | |
16 | Revenue, Gross Margin, and Operating Expenses |
| ||
| Business Unit Trends and Results |
| 57 | Index to Financial Statements and Supplemental Details |
19 | Client Computing Group (CCG) |
| 58 | Auditor's Report |
22 | Data Center Group (DCG) |
| 60 | Consolidated Financial Statements |
25 | Internet of Things Group (IOTG) |
| 65 | Notes to the Consolidated Financial Statements |
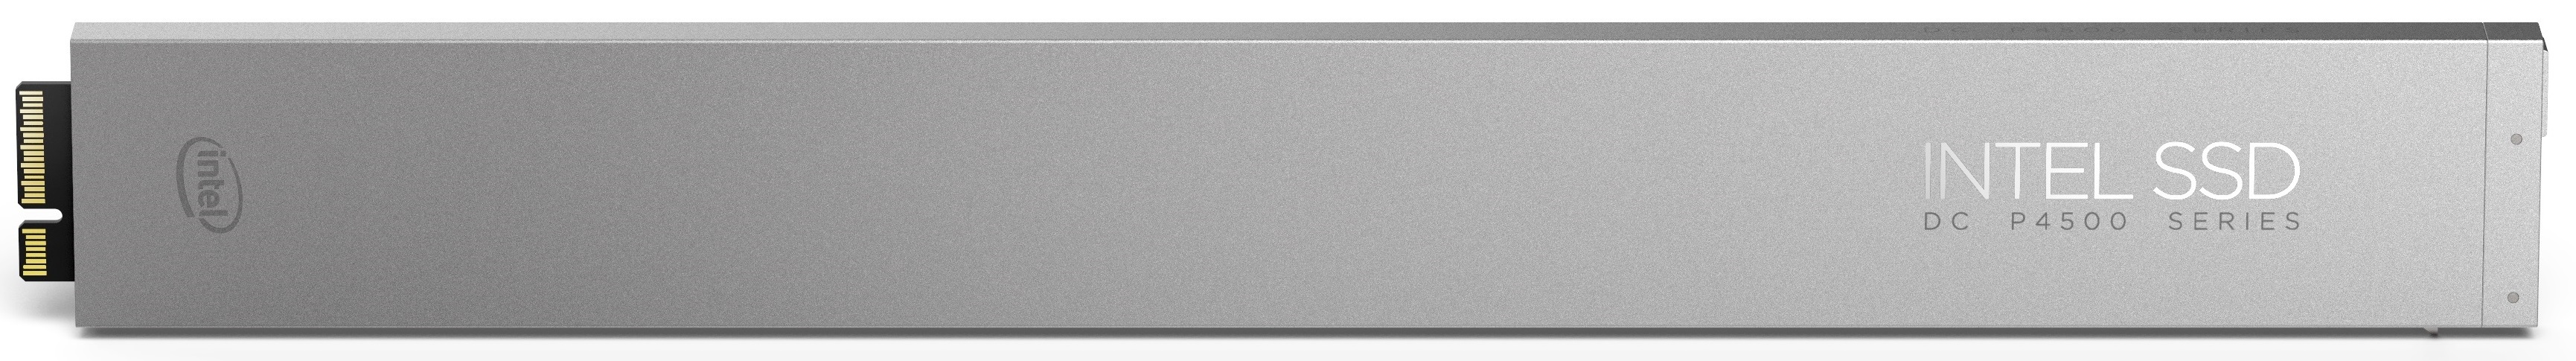
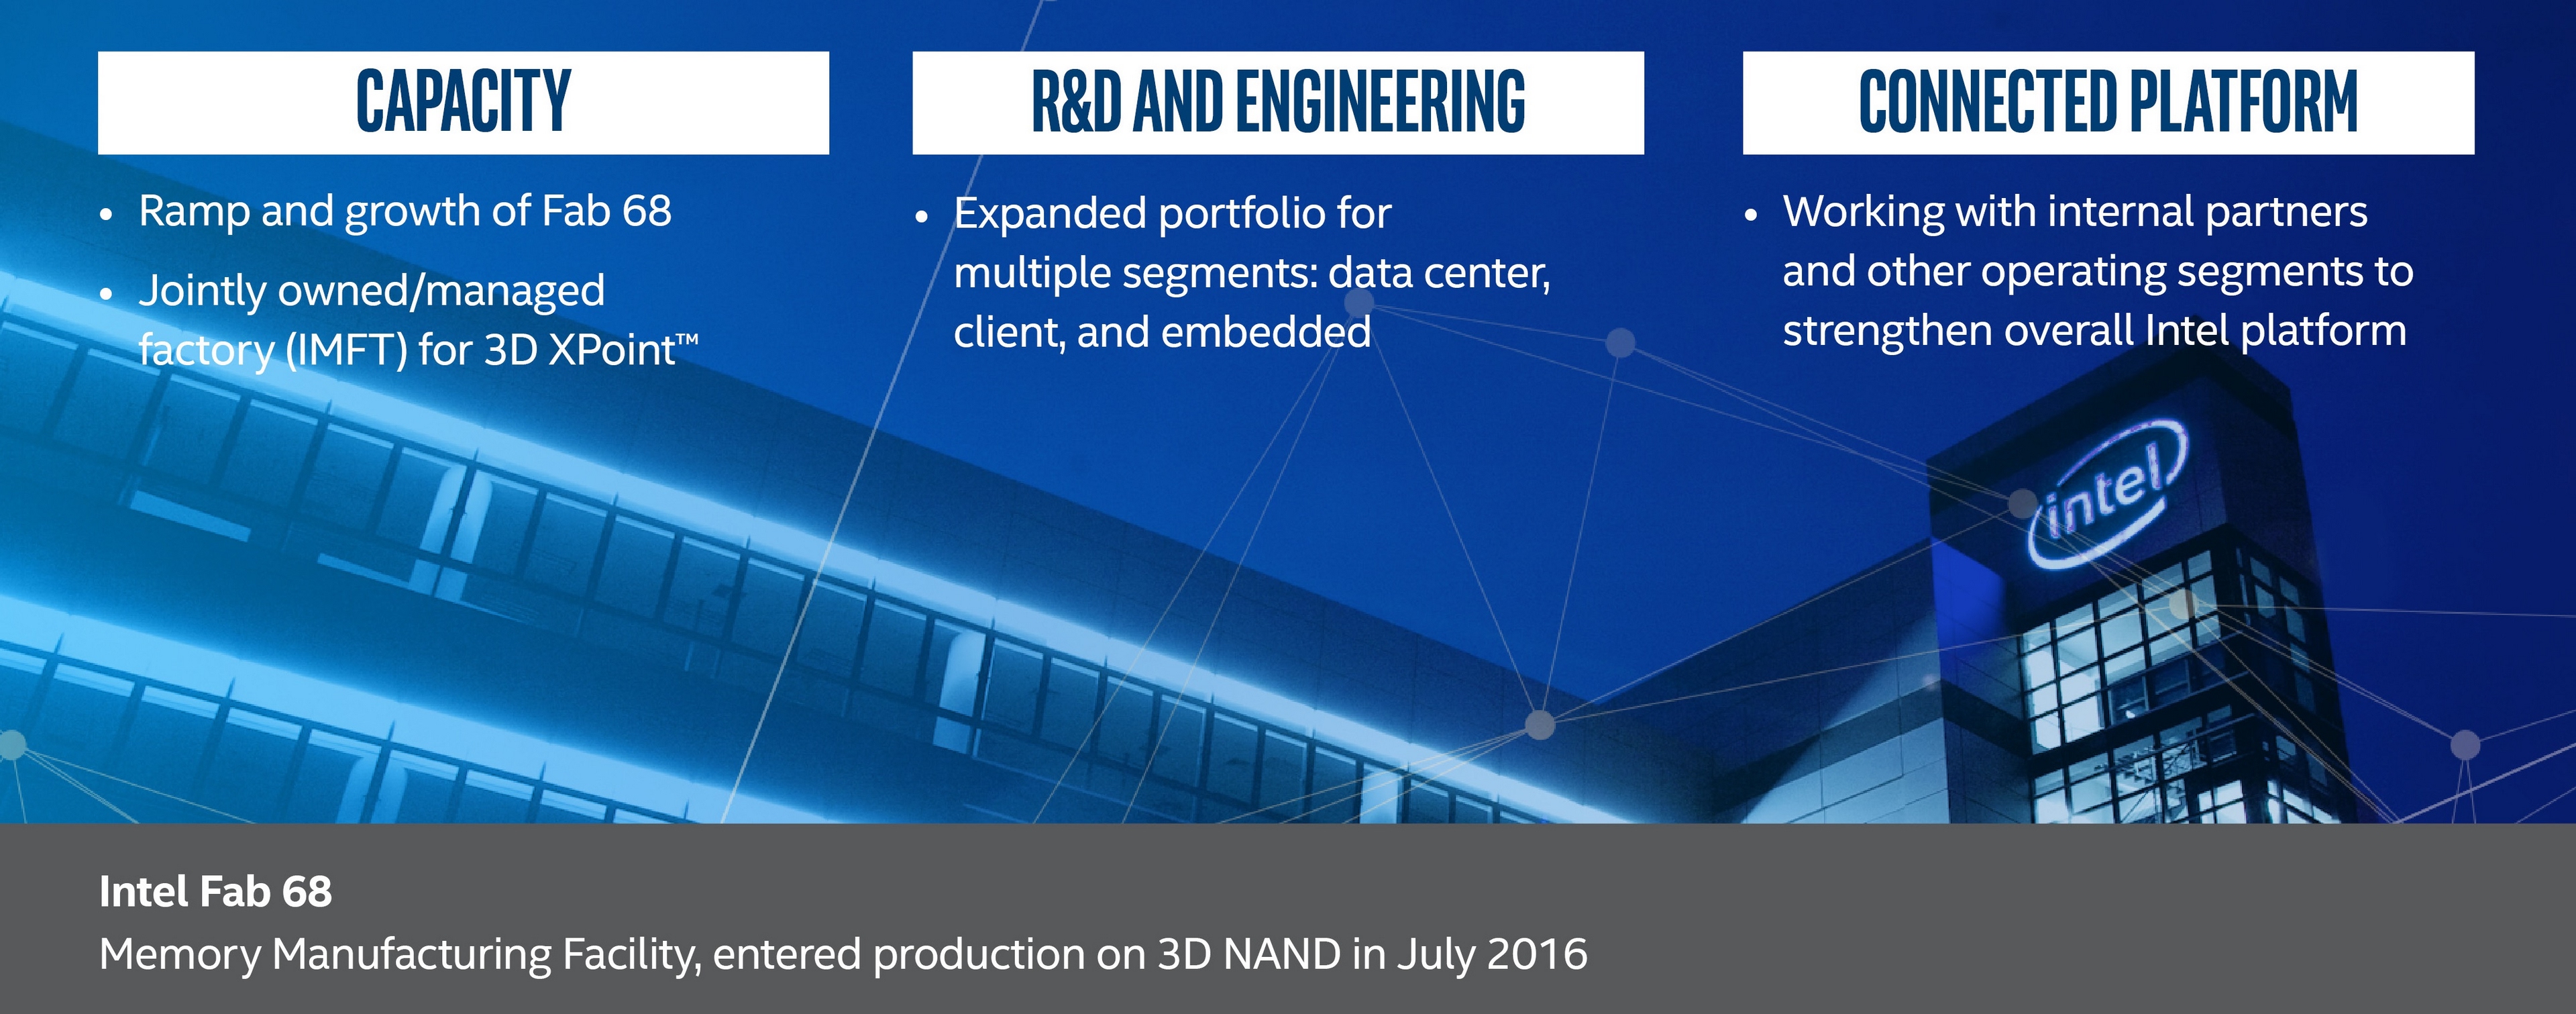
28 | Non-Volatile Memory Solutions Group (NSG) |
| 107 | Financial Information by Quarter |
31 | Programmable Solutions Group (PSG) |
| 108 | Controls and Procedures |
34 | Other Consolidated Results of Operations |
| 109 | Exhibits and Financial Statement Schedules |
35 | Liquidity and Capital Resources |
| 114 | Form 10-K Cross-Reference Index |
38 | Contractual Obligations |
|
|
|
39 | Quantitative and Qualitative Disclosures about Market Risk |
|
|
|
|
|
|
|
|
|
|
|
|
|
|
|
|
|
|
Table of Contents
Forward-Looking Statements
This Annual Report on Form 10-K contains forward-looking statements that involve a number of risks and uncertainties. Words such as "anticipates," "expects," "intends," "goals," "plans," "believes," "seeks," "estimates," "continues," "may," "will," "would," "should," "could," and variations of such words and similar expressions are intended to identify such forward-looking statements. In addition, any statements that refer to projections of our future financial performance, our anticipated growth and trends in our businesses, projected growth of markets relevant to our businesses, uncertain events or assumptions, and other characterizations of future events or circumstances are forward-looking statements. Such statements are based on management's expectations as of the date of this filing and involve many risks and uncertainties that could cause our actual results to differ materially from those expressed or implied in our forward-looking statements. Such risks and uncertainties include those described throughout this report and particularly in "Risk Factors" within Other Key Information. Given these risks and uncertainties, readers are cautioned not to place undue reliance on such forward-looking statements. Readers are urged to carefully review and consider the various disclosures made in this Form 10-K and in other documents we file from time to time with the SEC that disclose risks and uncertainties that may affect our business. The forward-looking statements in this Form 10-K do not reflect the potential impact of any divestitures, mergers, acquisitions, or other business combinations that had not been completed as of February 16, 2018 . In addition, the forward-looking statements in this Form 10-K are made as of the date of this filing, including expectations based on third-party information and projections that management believes to be reputable, and Intel does not undertake, and expressly disclaims any duty, to update such statements, whether as a result of new information, new developments, or otherwise, except to the extent that disclosure may be required by law.
Note Regarding Third-Party Information
This Annual Report on Form 10-K includes market data and certain other statistical information and estimates that are based on reports and other publications from industry analysts, market research firms, and other independent sources, as well as management's own good faith estimates and analyses. Intel believes these third-party reports to be reputable, but has not independently verified the underlying data sources, methodologies or assumptions. The reports and other publications referenced are generally available to the public and were not commissioned by Intel. Information that is based on estimates, forecasts, projections, market research or similar methodologies is inherently subject to uncertainties and actual events or circumstances may differ materially from events and circumstances reflected in this information.
Intel unique terms
We use specific terms throughout this document to describe our business and results. Below are key terms and how we define them:
PLATFORM PRODUCTS |
| A microprocessor (processor or central processing unit (CPU)) and chipset, a stand-alone System-on-Chip (SoC), or a multichip package. Platform products, or platforms, are primarily used in solutions sold through CCG, DCG, and IOTG segments. |
|
|
|
ADJACENT PRODUCTS |
| All of our non-platform products, for CCG, DCG, and IOTG like modem, ethernet and silicon photonics, as well as NSG, PSG, and Mobileye products. Combined with our platform products, adjacent products form comprehensive platform solutions to meet customer needs. |
|
|
|
PC-CENTRIC BUSINESS |
| Is made up of our CCG business, both platform and adjacent products. |
|
|
|
DATA-CENTRIC BUSINESSES |
| Includes our DCG, IOTG, NSG, PSG, and all other businesses. |
*Other names and brands may be claimed as the property of others. Radeon and the Radeon RX Vega logo are trademarks of Advanced Micro Devices, Inc.
Intel, the Intel logo, 3D XPoint, AnyWAN, Arria, Celeron, Cyclone, Enpirion, Intel Atom, Intel Core, Intel Inside, the Intel Inside logo, Intel Optane, Intel Xeon Phi, Itanium, MAX, Movidius, Myriad, Pentium, Puma, Quark, Stratix, Thunderbolt, Xeon, and XMM are trademarks of Intel Corporation or its subsidiaries in the U.S. and/or other countries.
|
| 1 |
Table of Contents

|
| 2 |
Table of Contents
 |
|
|
|
|
|
| |
| Introduction to our business |
| |
|
|
| |
| We are a world leader in the design and manufacturing of essential technologies that power the cloud and an increasingly smart, connected world. We offer computing, networking, data storage, and communications solutions to a broad set of customers spanning multiple industries. In 1968, Intel was incorporated in California (reincorporated in Delaware in 1989), in what became known as Silicon Valley, and our technology has been at the heart of computing breakthroughs ever since. |
| |
| We're now in the midst of a corporate transformation as we grow beyond our traditional PC and server businesses into data-rich markets addressing the explosive demands to process, analyze, store, and transfer data. The transformation is well underway, with our data-centric businesses representing an increasing share of our overall revenue. |
| |
| Our vision is to build a smart and connected world that runs on Intel® solutions. This vision is supported by our commitment to corporate responsibility and our relentless pursuit of Moore's Law. As we enter Intel's 50th year in business, we continue to follow the advice of Intel co-founder Bob Noyce: "Don't be encumbered by history, go off and do something wonderful." |
| |
|
|
| |
|
| 3 |
Table of Contents
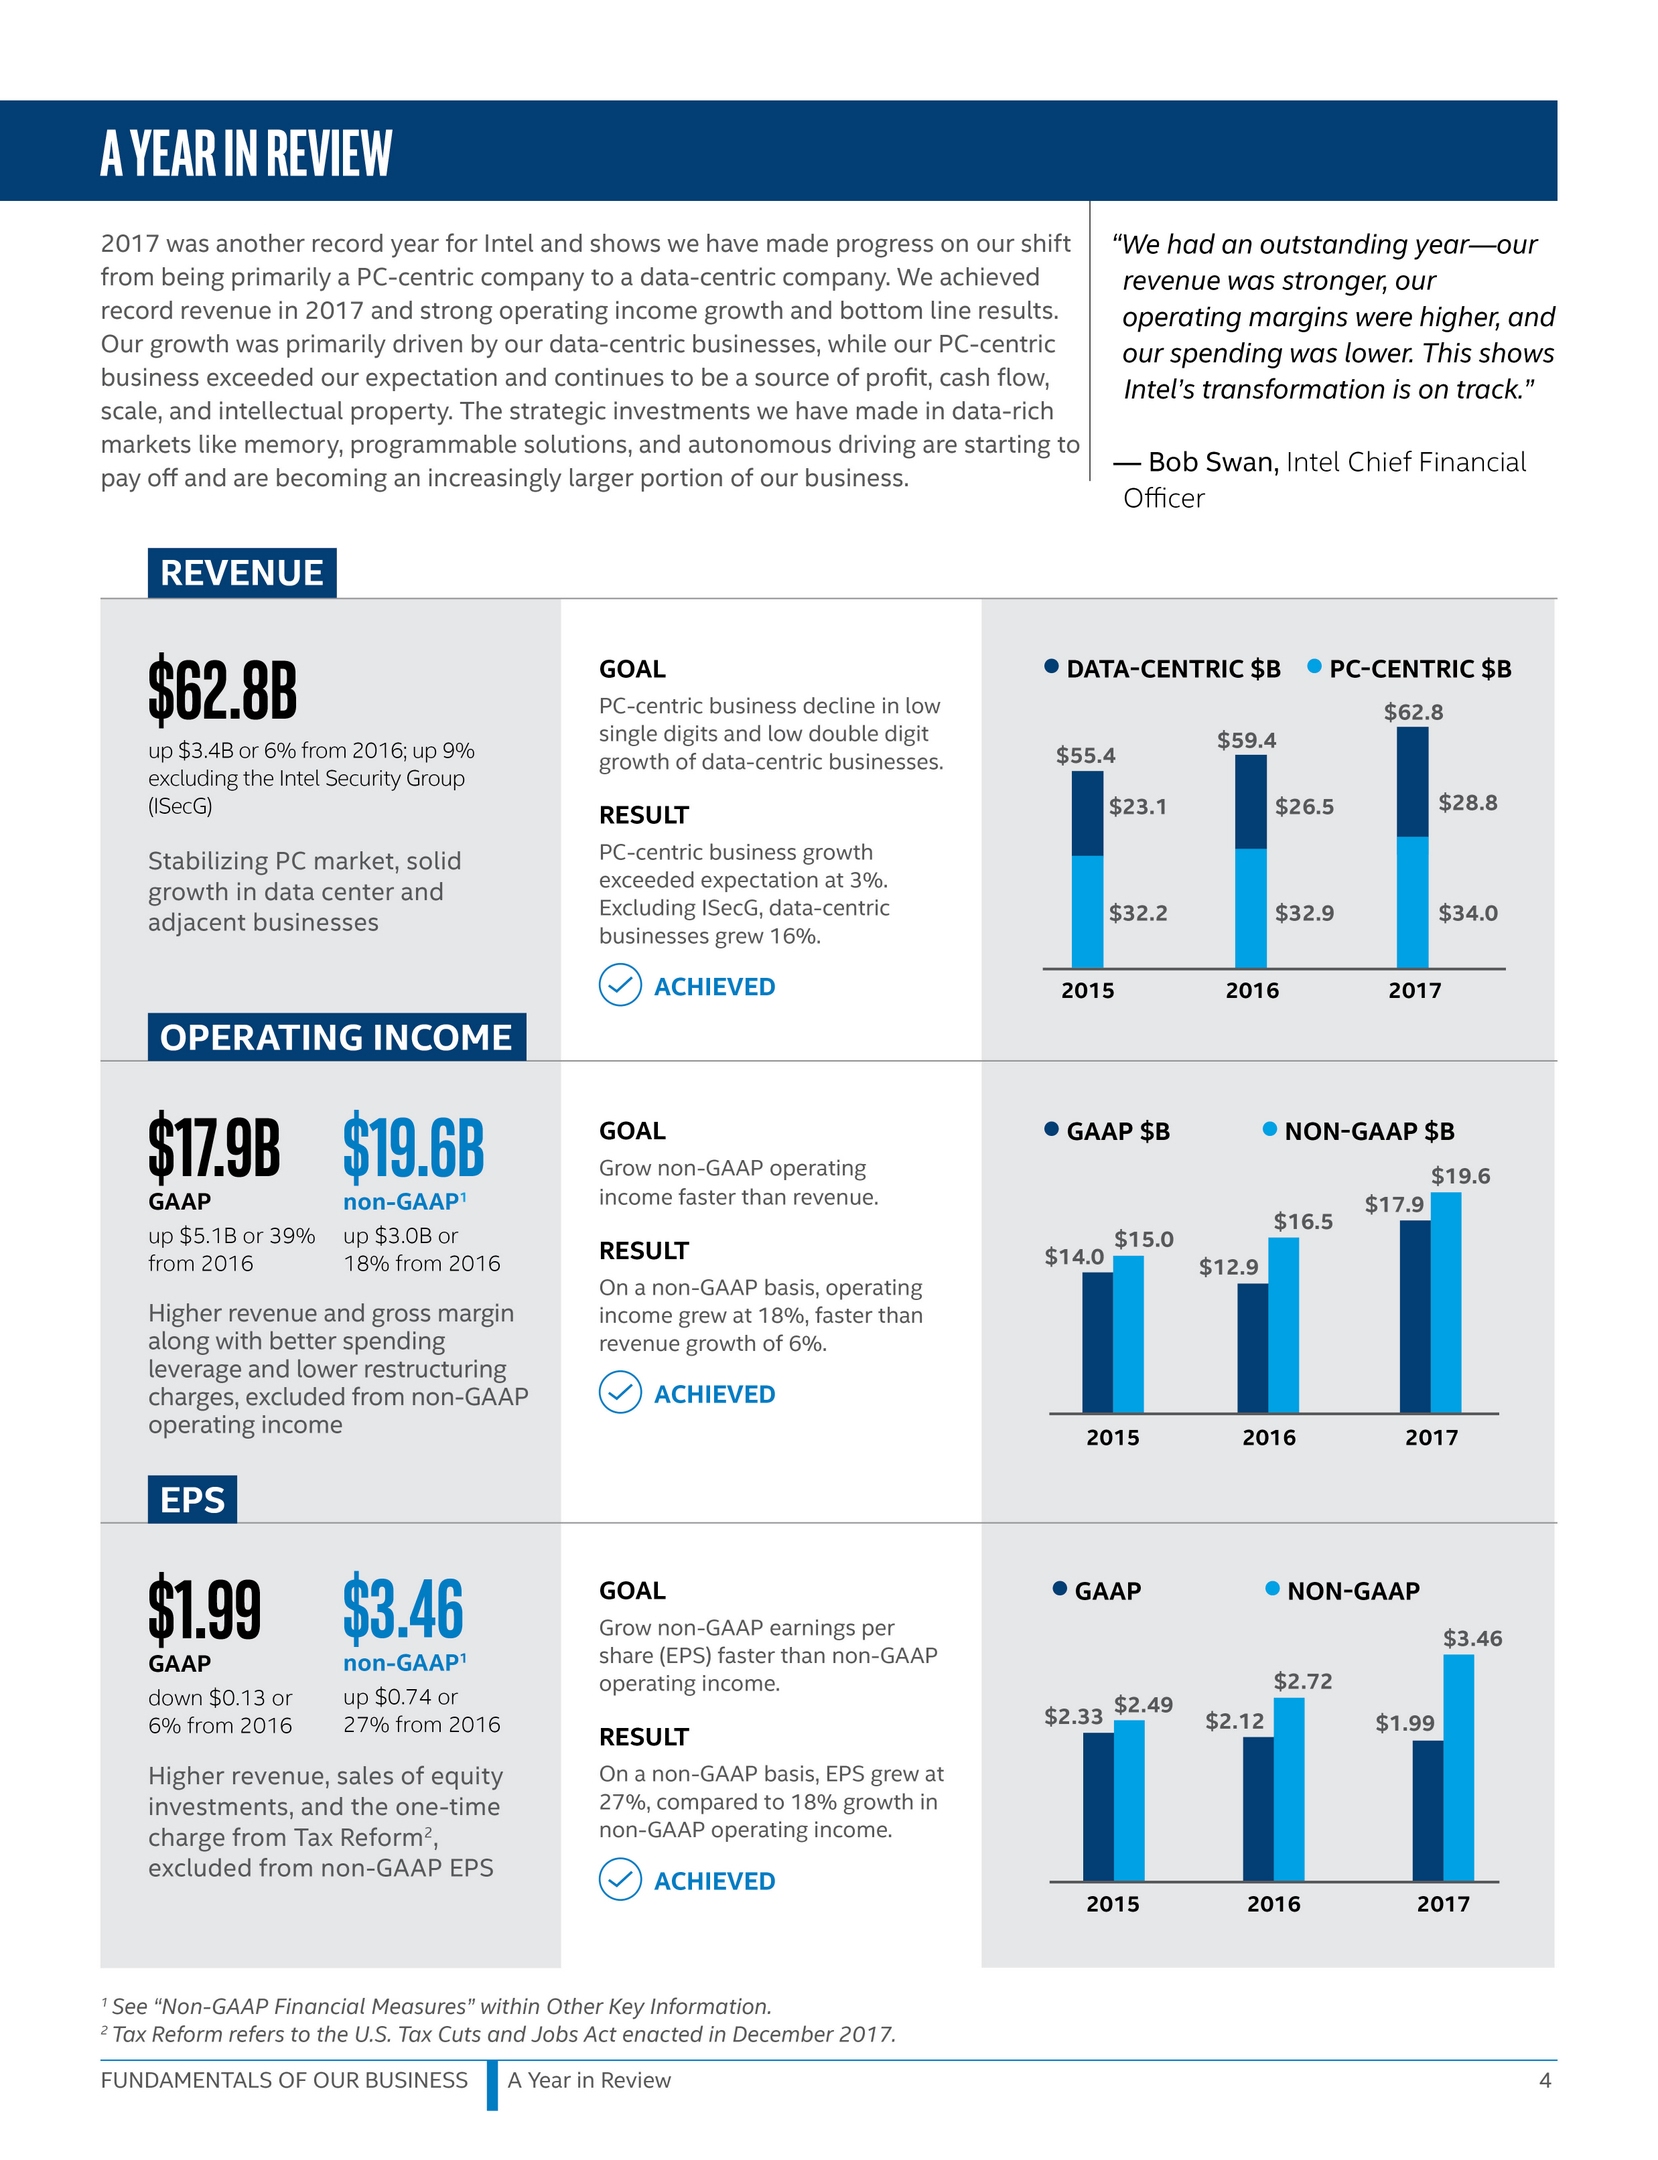
Table of Contents

Table of Contents
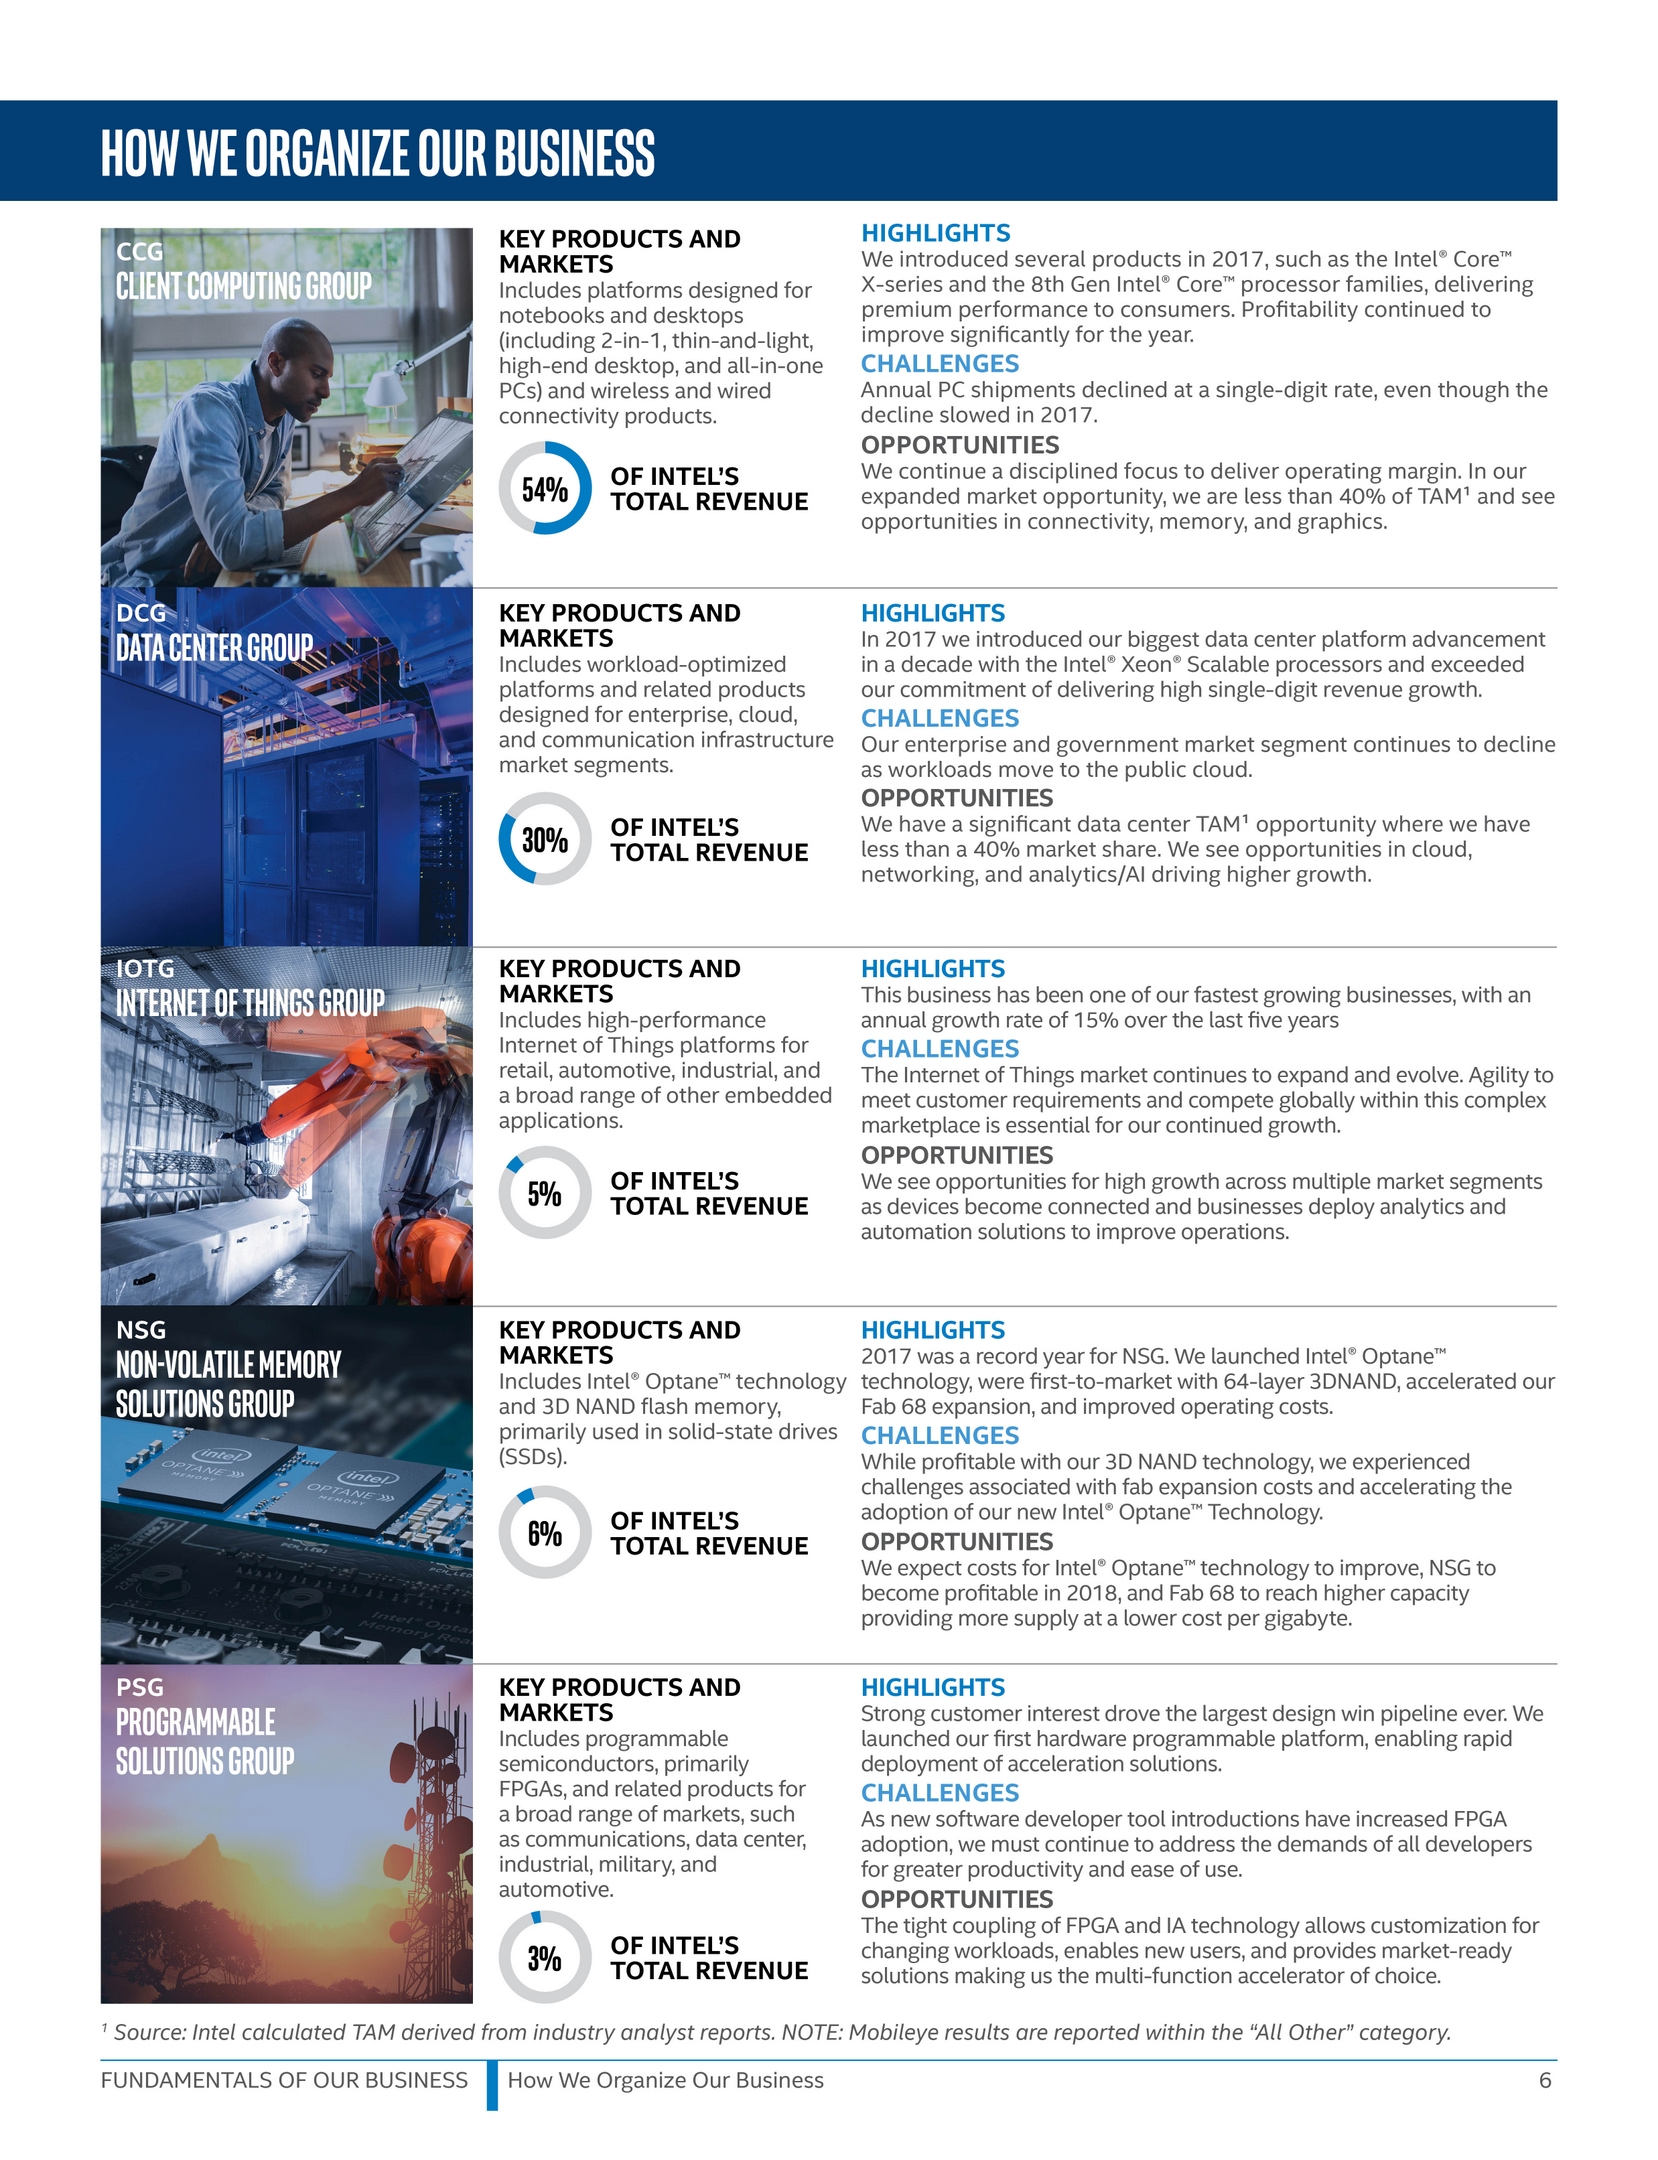
Table of Contents
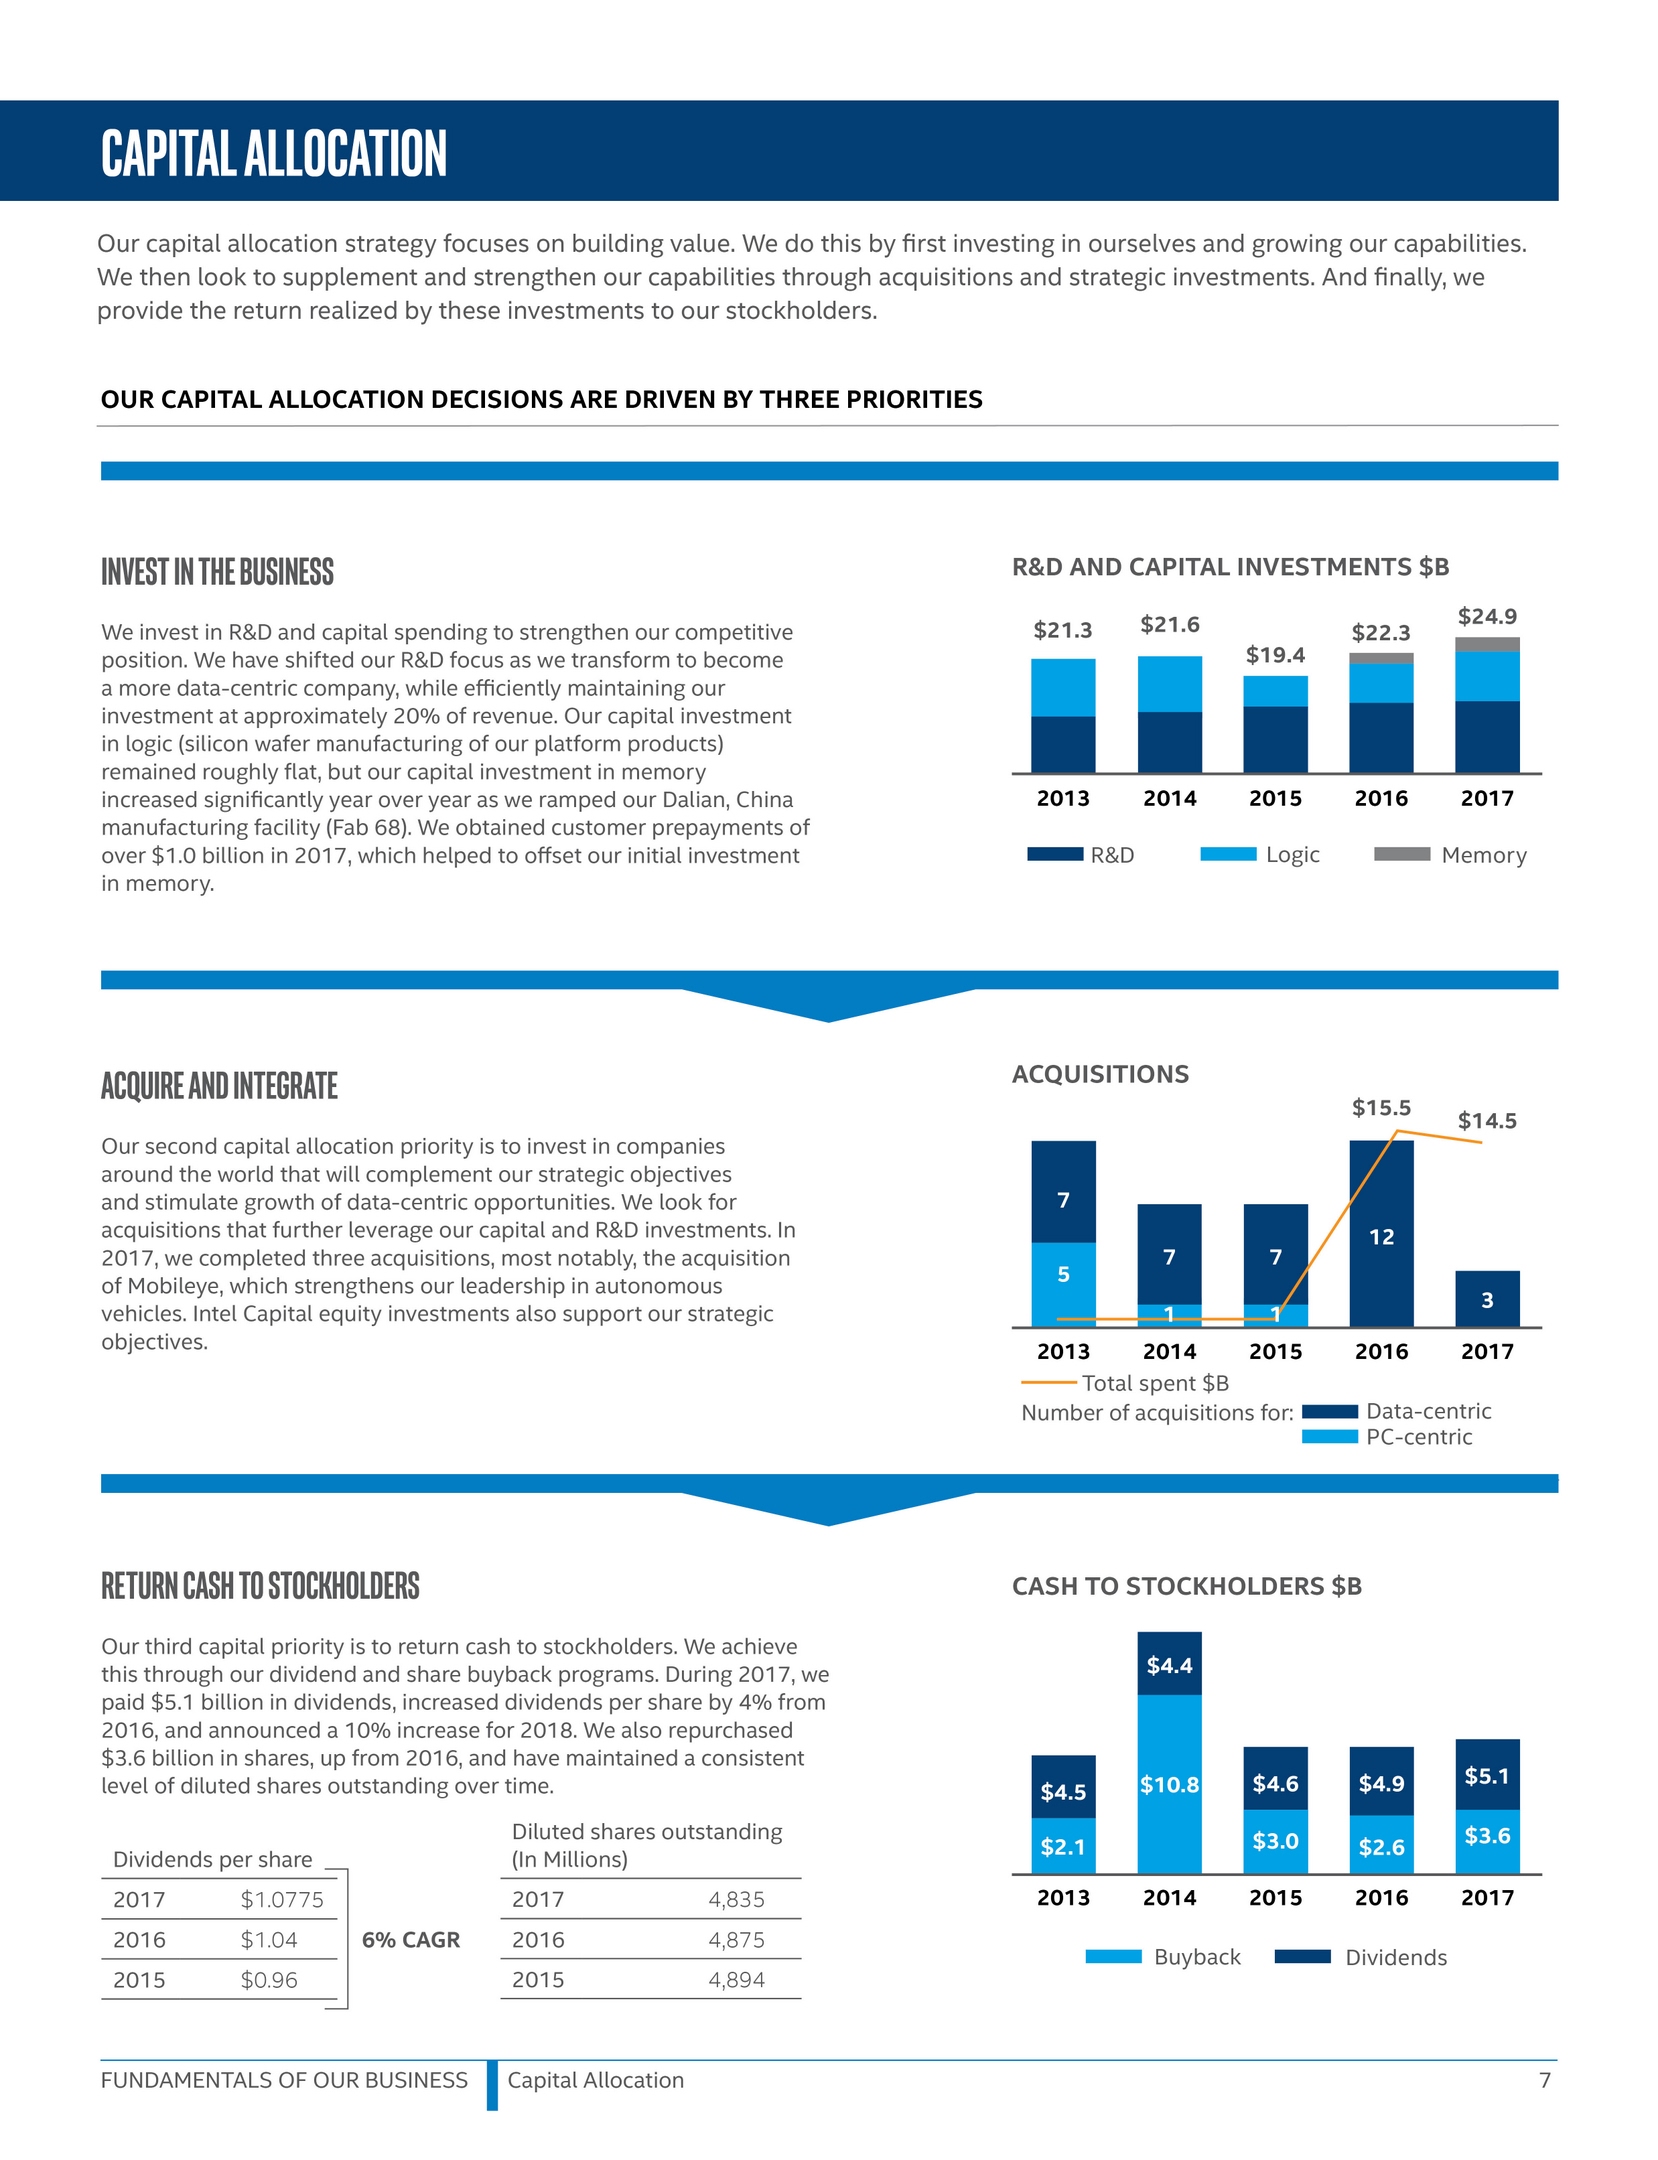
Table of Contents
Our Strategy |
Data is a significant force in society and will be essential in shaping the future of every person on the planet. From large complex applications in the cloud to small low-power mobile devices at the edge, our customers are looking for solutions that can process, analyze, store, and transfer data-turning it into actionable insights, amazing experiences, and competitive advantages. |
|
| "Intel's strategy is to provide the technological foundation of the new data world." -Brian Krzanich, Intel Chief Executive Officer |
We strive to unlock the power of data so people can ride in self-driving cars, experience virtual worlds, connect with each other over fast mobile networks, and be touched by computer-assisted intelligence in ways yet unimagined. |
|
| |
|
|
|
|
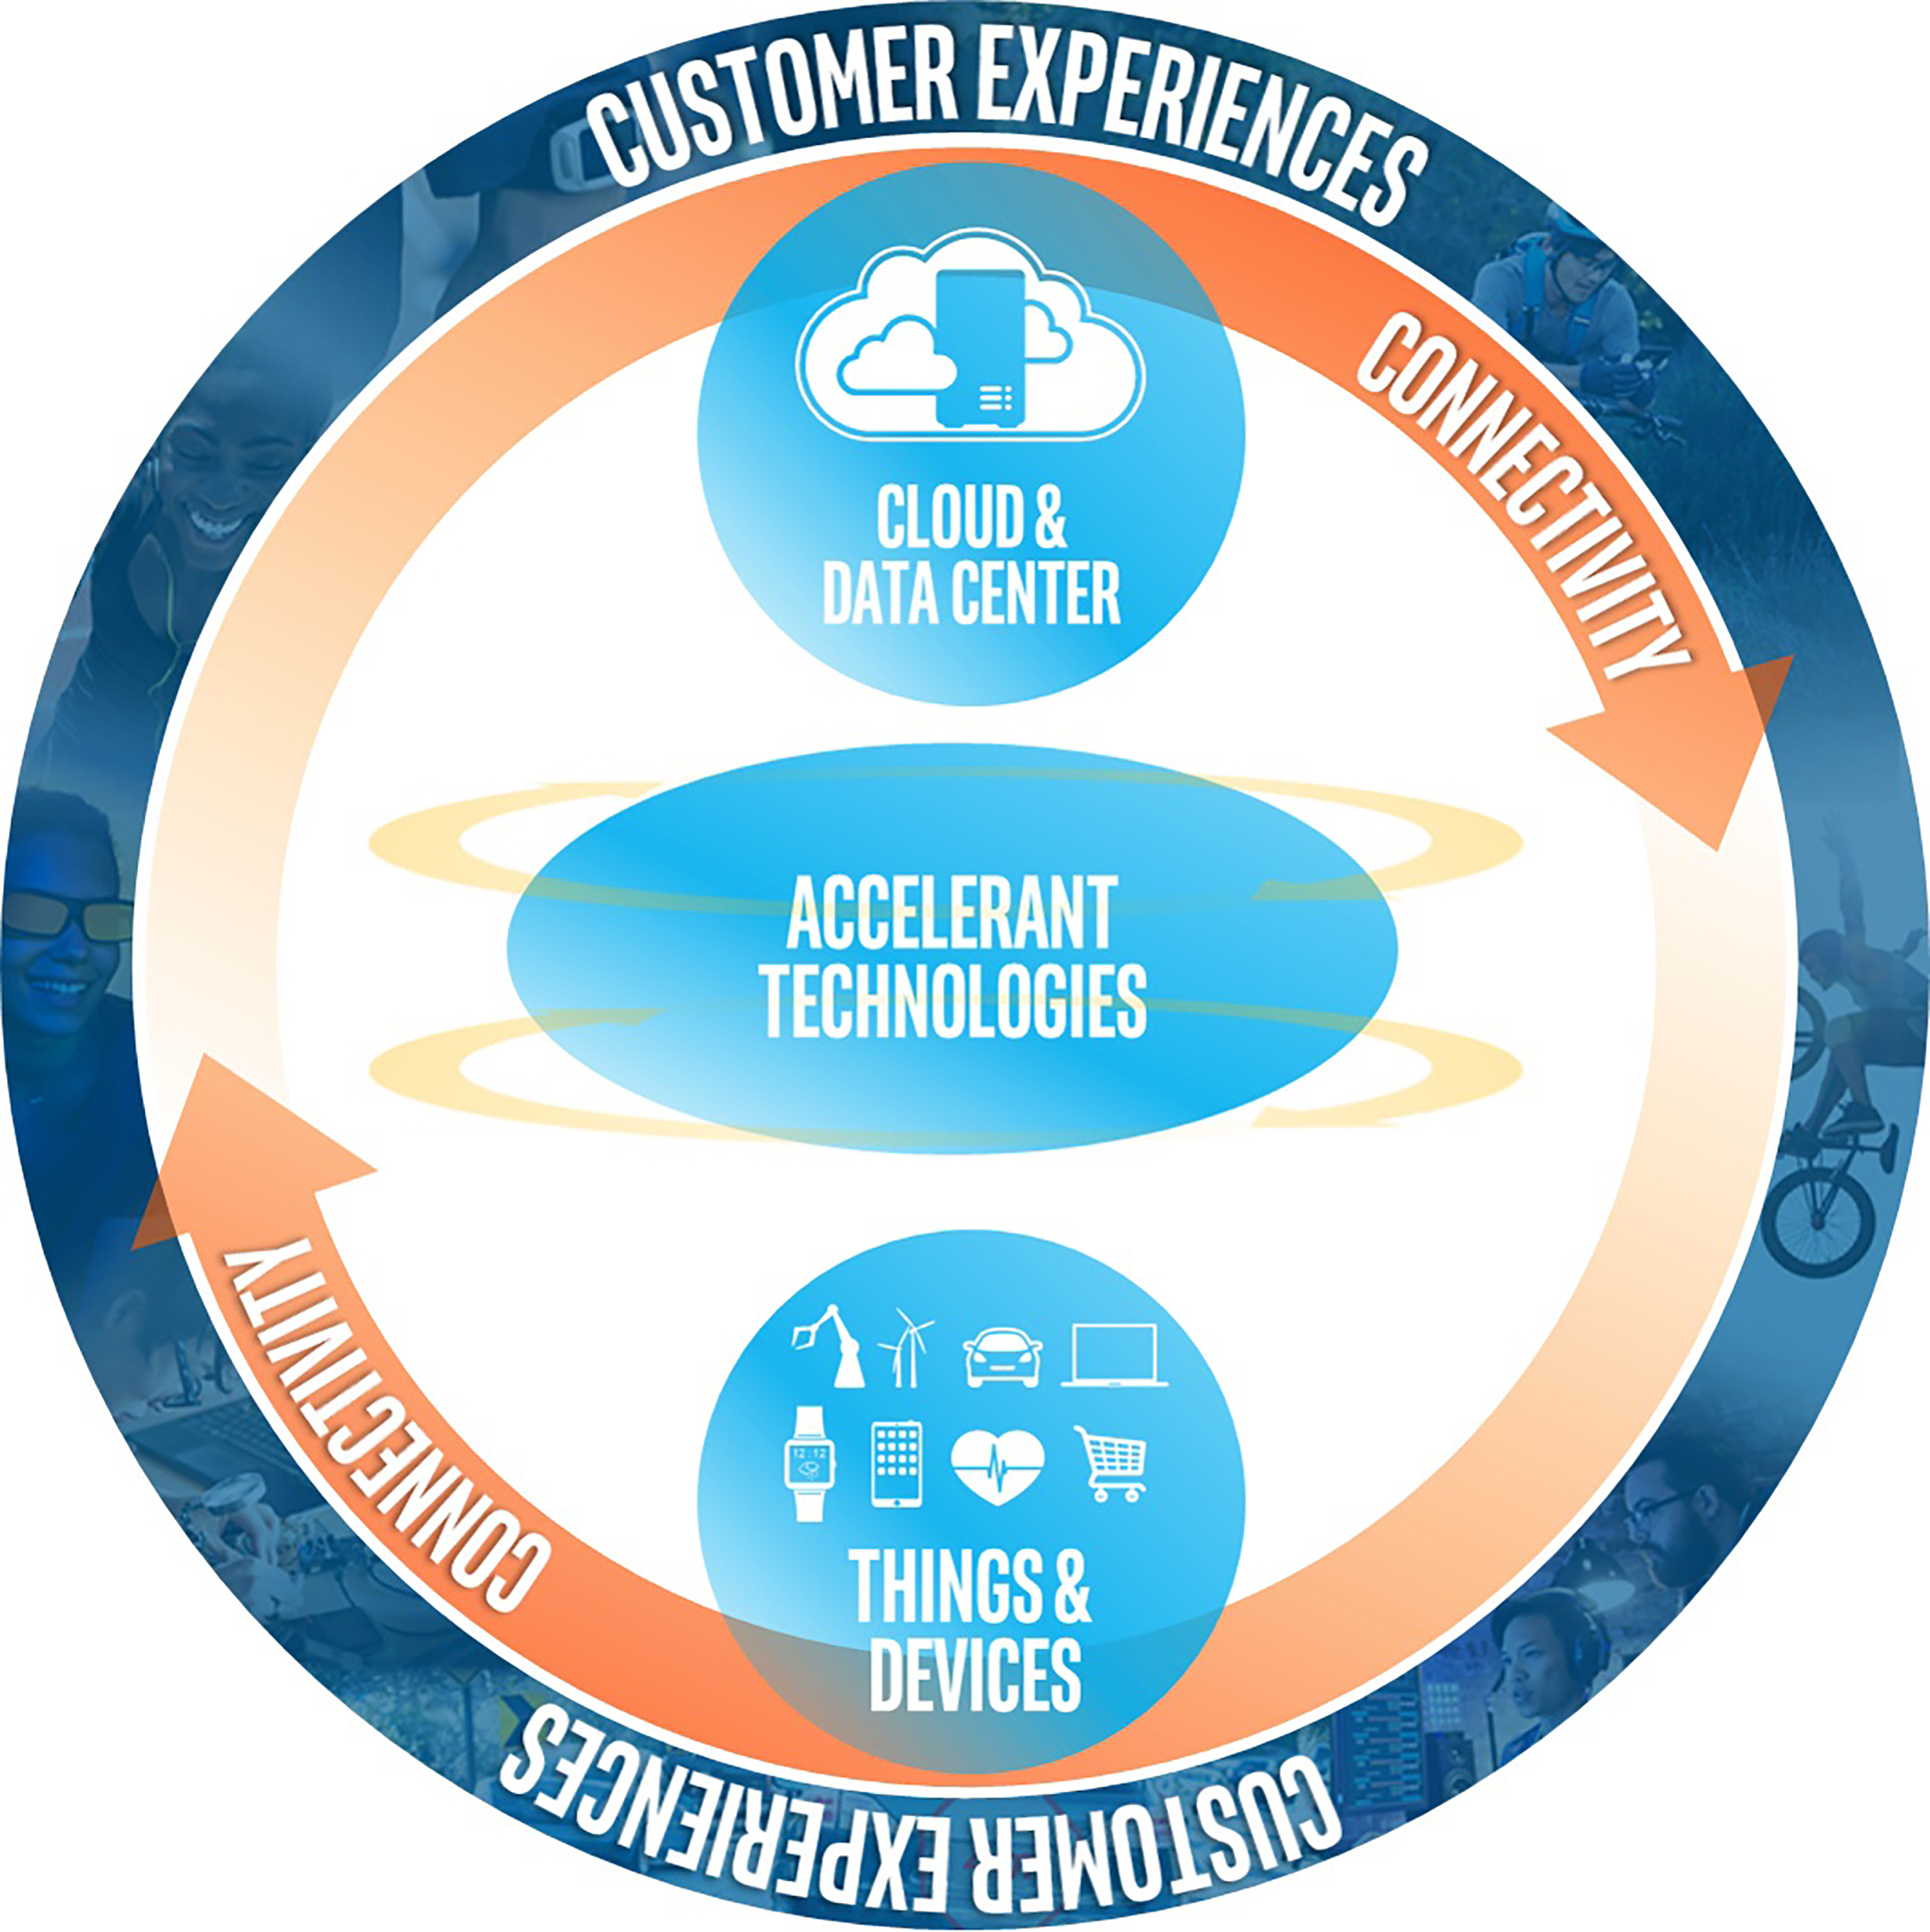
We are well-positioned to be the driving force of this data revolution. Intel technology powers the devices and infrastructure that power the data-centric world, from PCs and the cloud to telecommunications equipment and data centers. Our computing solutions from the cloud to the edge enable a Virtuous Cycle of Growth. Our strategy is to provide the technological foundation of the new data world-a world that is always learning, smarter and faster. | |||
COMPUTE PERFORMANCE FROM CLIENT TO CLOUD |
|  |
|
| |
|
| |
The most important trend shaping the future of the data- centric world is the cloud and its connection to billions of smart devices, including PCs, autonomous cars, and virtual reality systems. When smart devices are connected to the cloud, the data can be analyzed real-time, making these devices more useful. Our continuous innovation of client and Internet of Things products, designed to connect even more seamlessly, is shaping this trend. Our data center products are optimized to deliver industry-leading performance and best-in-class total cost of ownership for cloud workloads. We add new products and features to our portfolio to address emerging, high-growth workloads such as artificial intelligence, virtual reality systems, and the 5G network. |
| |
|
| |
ACCELERANT TECHNOLOGIES |
| |
|
| |
|
| |
Advancements in memory technology and programmable solutions, such as FPGAs, drive performance in smart devices as well as data centers. Intel's 3D XPoint ™ technology significantly improves access to large amounts of data. FPGAs can efficiently manage the changing demands of next-generation data centers and accelerate the performance in other applications. The combination of memory and FPGAs with client and cloud products enables new solutions such as deep learning acceleration engines. |
| |
|
| |
CONNECTIVITY |
| |
|
| |
|
| |
With our wireless, computing, and cloud capabilities, we are driving the development of technologies and collaborating on the rapid definition of open standards that will help define the 5G market. Our collaborations shape the connectivity ecosystem and enable new opportunities to meet the diverse connectivity needs of data. From smart devices to network infrastructure to the cloud and back, we aim to offer scale, innovation, and expertise to our customers.
|
| |
FUNDAMENTALS OF OUR BUSINESS | Our Strategy | 8 |
Table of Contents
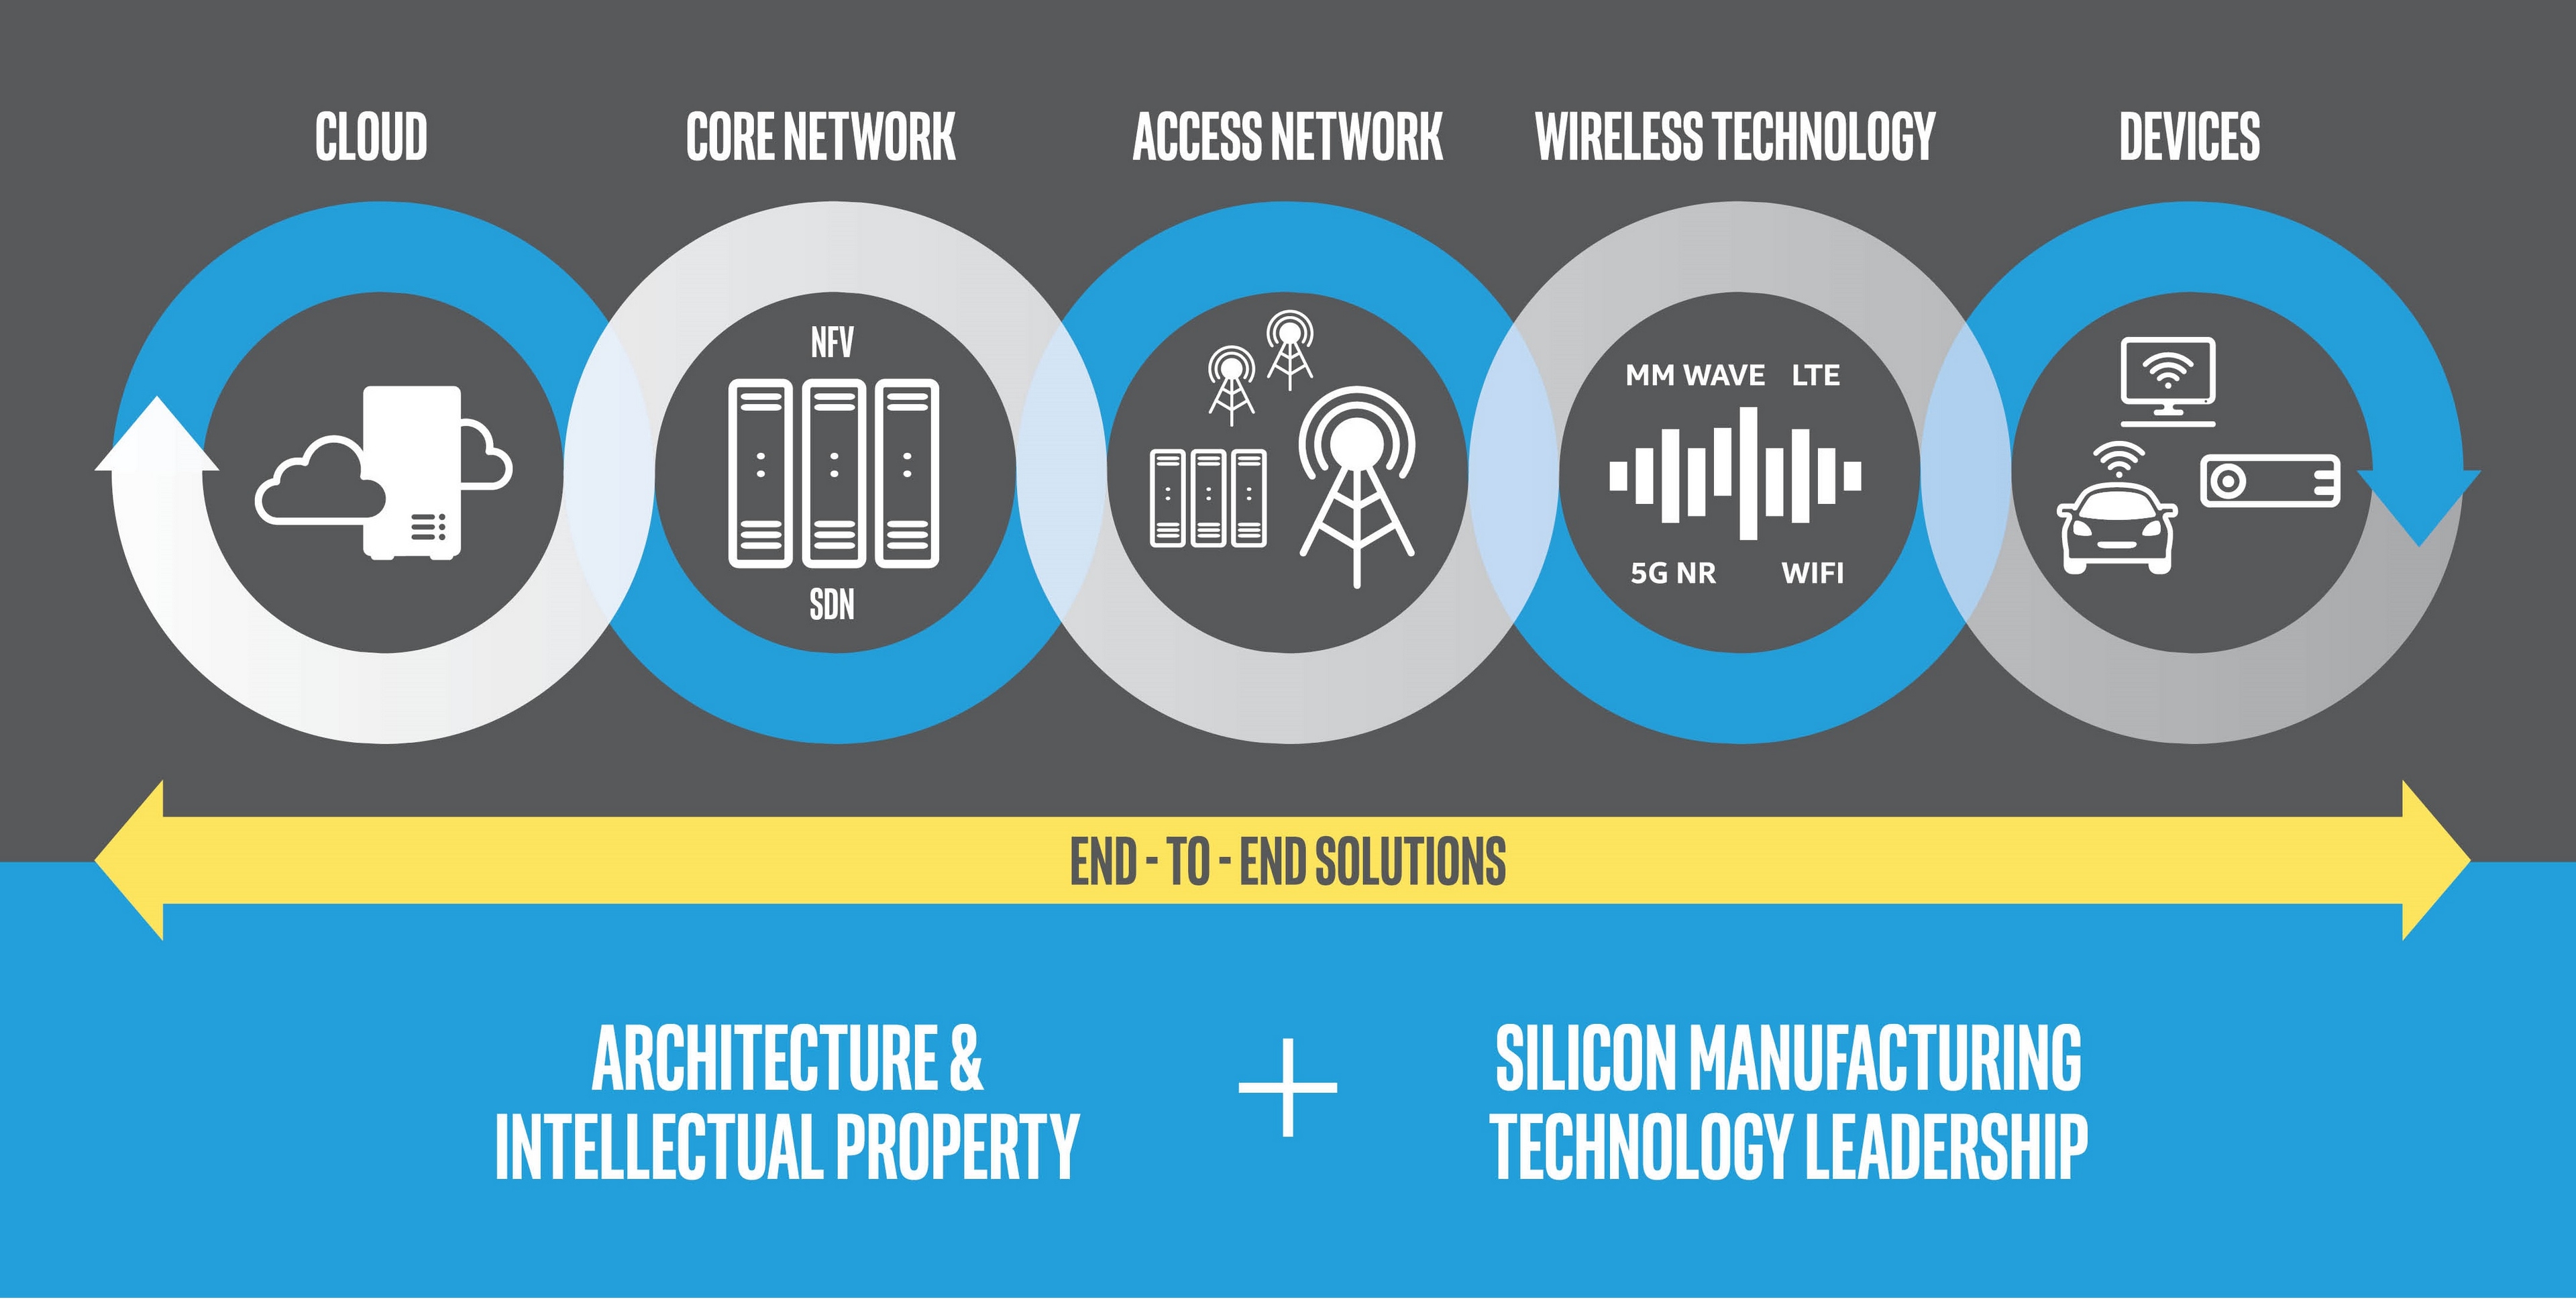
STRATEGIC ENABLERS |
|
We meet our customer needs with discrete platforms and platforms that are integrated with software and other technologies to provide end-to-end solutions. Our solutions are enabled by:
• | Shared architecture and intellectual property. We have developed a common architecture and intellectual property across our platforms. We continue to invest in improving our architecture and product platforms that deliver increasing value to our customers. Our proprietary technologies make it possible to integrate products and platforms that address evolving customer needs and expand the markets we serve. Sharing a common architecture and intellectual property enables us to spread our costs over a large manufacturing base of products, which reduces our costs and increases our return on capital. |
• | Silicon manufacturing technologies. We make significant investments and innovations in our silicon manufacturing technologies. Unlike many semiconductor companies, we primarily develop and manufacture our products in our own facilities using our proprietary process technologies. This competitive advantage enables us to optimize performance, shorten time-to-market for new product introduction, and more quickly scale products in high volume. |
• | Moore's Law. Intel's advancement of Moore's Law has driven significant computing power growth and better economics. Through Moore's Law we enable new devices and capabilities that meet our customers' needs for balancing performance, power efficiency, and cost. |
CORPORATE TRANSFORMATION |
|
We are in the midst of a corporate transformation. Over the last four years, we've grown outside our traditional PC and server businesses, where we had roughly 90% market share. By making key investments and decisions to enter data-rich markets, we have redefined our target market well beyond our traditional businesses and estimated a total addressable market (TAM) of $260 billion 1 , where we have greater opportunity to grow. The expanded TAM leverages our manufacturing technologies and intellectual properties and provides growth opportunities in our revenue and profit. We have evolved from a PC company with a server business to a data-centric company, and have begun the next phase of our journey-to build a world that runs on Intel.
1 Source: Intel calculated 2021 TAM derived from industry analyst reports and internal estimates.
FUNDAMENTALS OF OUR BUSINESS | Our Strategy | 9 |
Table of Contents
Research AND development (R&D) and Manufacturing |
We are committed to investing in R&D. Realizing the benefits from Moore's Law provides flexibility in balancing production costs and the increased functionality of our products. In addition, intellectual property that we have developed for our platforms reduces our costs, creates synergies across our businesses, and provides a higher return as we expand into new markets .
We design and manufacture silicon technology products. Unlike many other semiconductor companies, we primarily manufacture our products in our own manufacturing facilities. We see our in-house manufacturing as one of our most critical assets and advantages. This advantage is now expanding to our adjacent businesses, for example, FPGA, modem, and memory, which are enabling our transformation to a data-centric company.
Moore's Law - a law of economics
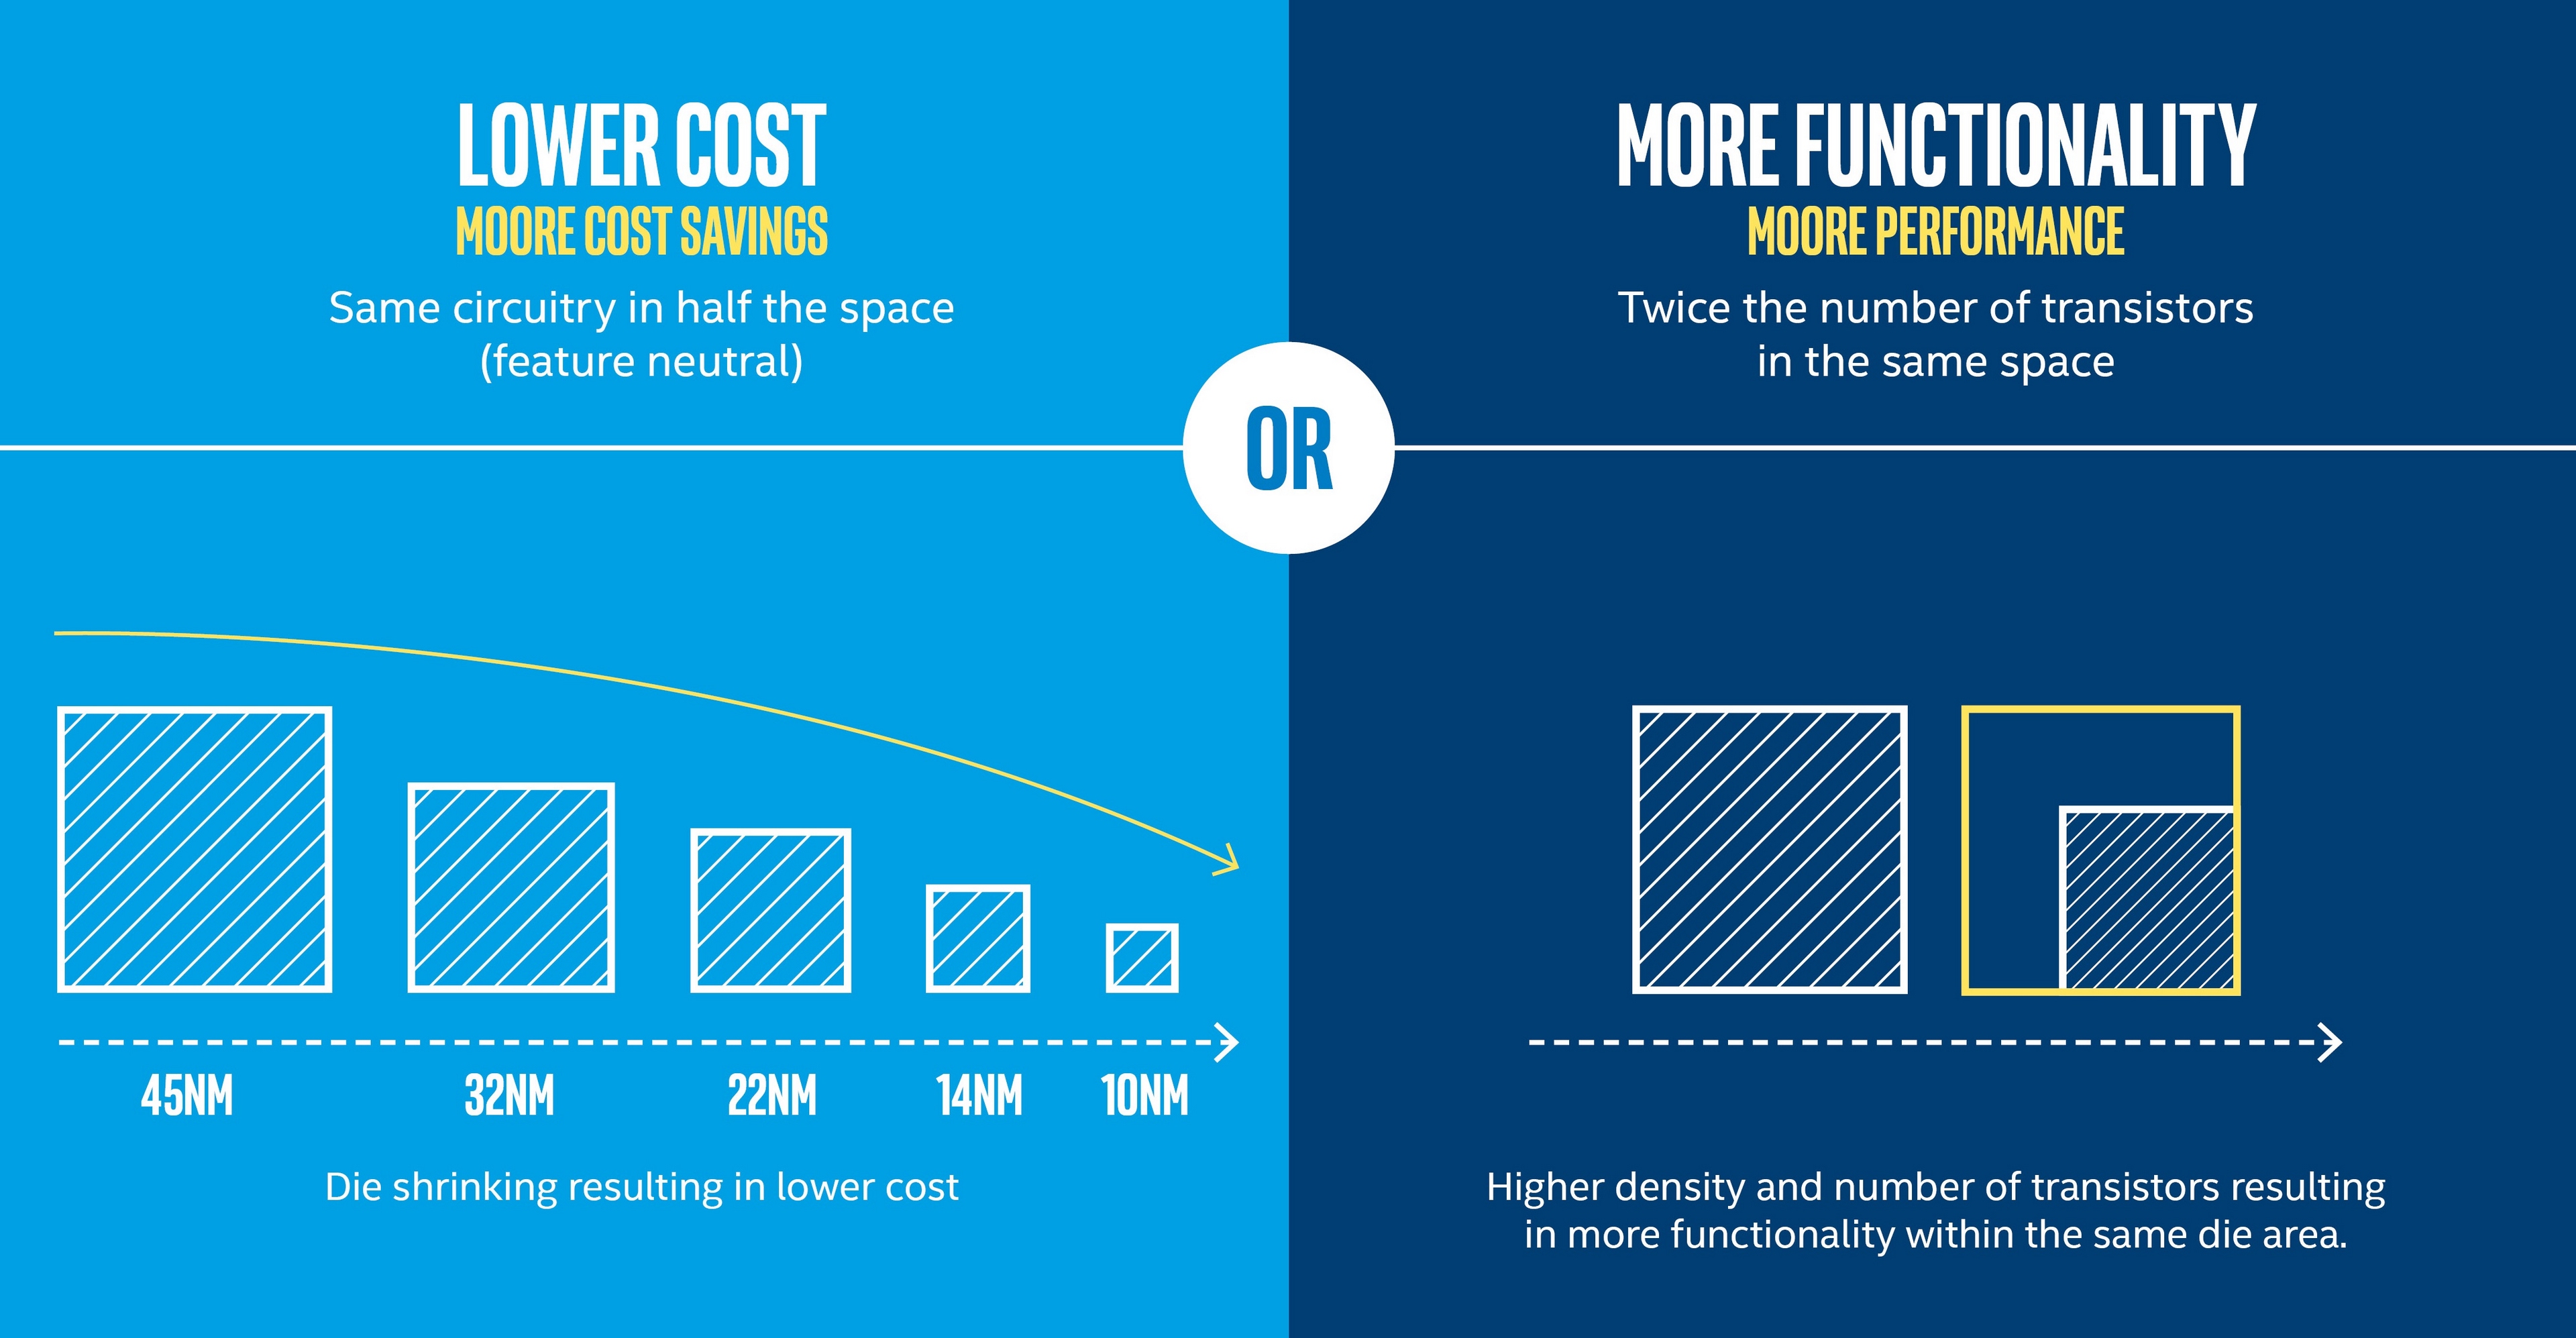
Moore's Law is not a law of physics, but instead a law of economics predicted by Intel's co-founder Gordon Moore 50 years ago. It is the keystone of our manufacturing advancement. We measure Moore's Law primarily using a quantitative transistor density metric (transistors per square millimeter). In addition, we are optimizing process technology within each node to enable an annual cadence of product improvements.
Realizing Moore's Law results in economic benefits as we are able to either reduce a chip's cost as we shrink its size, or increase functionality and performance of a chip while maintaining the same cost. At Intel, we continue to develop new generations of manufacturing process technology and realize the benefits from Moore's Law. This makes possible the innovation of new products with higher functionality while balancing power efficiency, cost, and size to meet customers' needs. As of the end of 2017, our platform products were manufactured on 300mm wafers, with the majority manufactured using our 14nm process node.
Research and Development
We focus our R&D activities on developing new microarchitectures, advancing our manufacturing process technology, delivering the next generation of products, ensuring our products and technologies are secure, and developing new solutions in emerging technologies, for example, artificial intelligence, 5G wireless connectivity, and autonomous vehicles.
In conjunction with our R&D efforts, we plan to introduce new microarchitectures for our various products on a regular cadence. We have lengthened the amount of time we are using our 14nm process node, further optimizing our technology and meeting the yearly market cadence for product introductions with multiple waves of product offerings. While we have lengthened our utilization of 14nm, we are accelerating transistor density improvement with hyper-scaling technology, resulting in the same density and cost improvements over time as predicted by Moore's Law. We expect the same trends to continue as we introduce our next-generation 10nm process node.
FUNDAMENTALS OF OUR BUSINESS | Research and Development (R&D) and Manufacturing | 10 |
Table of Contents
We centrally manage key cross-business group product initiatives to align and prioritize our R&D activities. In addition, we may augment our R&D initiatives by investing in companies or entering into agreements with companies that have similar R&D focus areas, as well as directly purchasing or licensing applicable technology. To drive innovation and gain efficiencies, we intend to utilize our investments in intellectual property and R&D across our platforms and businesses.
manufacturing footprint
In 2017, the majority of our wafer manufacturing was conducted within the U.S. We incur factory start-up costs as we ramp our facilities for new process technologies. In 2017 we continued to ramp the 10nm process node in our Oregon and Israel locations, began 10nm production in Oregon, and restarted construction on one of our Arizona wafer fabs, which is targeted for leading-edge process technologies. We ramped our first memory fab, Fab 68, with investments representing approximately 20% of total capital spending in 2017.
The map below marks our manufacturing facilities and their primary manufacturing functions as of the end of 2017, as well as the countries where we have a significant R&D or sales and marketing presence.
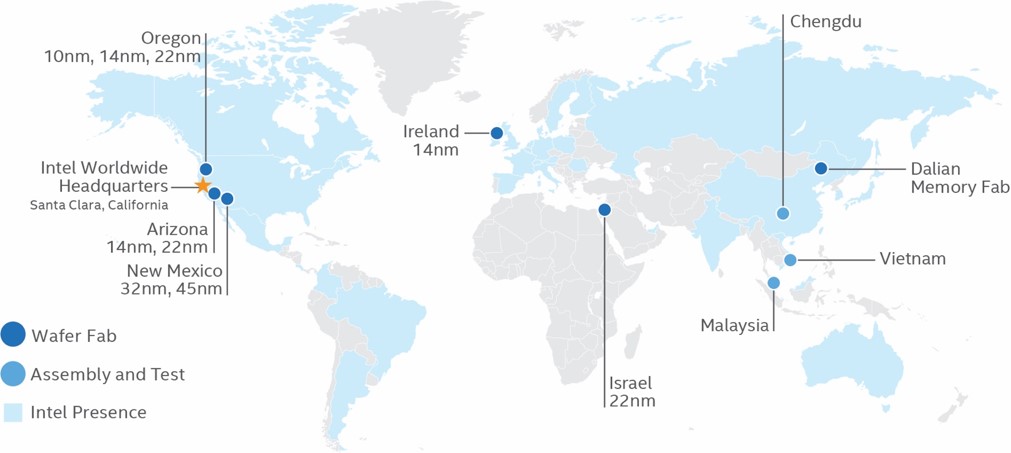
supply chain and factory network
Our manufacturing facilities are primarily used for silicon wafer manufacturing of our platform and memory products. These facilities are built following a "copy exactly" methodology, whereby new process technologies are transferred identically from a central development fab to each manufacturing facility. This enables fast ramp of the operation as well as better quality control. These wafer fabs operate in a network of manufacturing facilities integrated as one factory to provide the most flexible supply capacity, allowing us to better analyze our production costs and manage capacity.
We use third-party foundries to manufacture wafers for certain components, including communications, connectivity, networking, FPGA, and memory products. We also leverage subcontractors to augment capacity to perform assembly and test in addition to our in-house manufacturing, primarily for chipsets and adjacent products.
We use a multi-source strategy for our memory business to enable a robust and flexible supply chain. The ramping of Fab 68 in 2017 enabled us to maintain a cost-effective strategy to better serve our customers. We expect this expansion to continue to provide significant manufacturing capacity. As of the end of 2017, over half of the 3D NAND we supplied was manufactured in Fab 68. In addition to the memory we manufacture internally, we have a supplemental supply agreement with Micron Technology, Inc. (Micron), as well as capacity from our joint venture, IM Flash Technologies, LLC (IMFT) factory in Lehi, Utah.
FUNDAMENTALS OF OUR BUSINESS | Research and Development (R&D) and Manufacturing | 11 |
Table of Contents
who manages our business |
Executive Officers of the Registrant
NAME |
| AGE |
| OFFICE(S) |
Andy D. Bryant |
| 67 |
| Chairman of the Board |
Brian M. Krzanich |
| 57 |
| Chief Executive Officer |
Dr. Venkata S.M. Renduchintala |
| 52 |
| Executive Vice President; President, Client and Internet of Things Businesses and System Architecture Group |
Navin Shenoy |
| 44 |
| Executive Vice President; General Manager, Data Center Group |
Robert H. Swan |
| 57 |
| Executive Vice President, Chief Financial Officer |
Andy D. Bryant has been Chairman of our Board of Directors since May 2012. Mr. Bryant served as Vice Chairman of the Board of Directors of Intel from July 2011 to May 2012. From 2007 to 2012, Mr. Bryant served as Chief Administrative Officer. Mr. Bryant joined Intel in 1981 and served in a number of executive roles at the company. He was Executive Vice President, Technology, Manufacturing, and Enterprise Services from 2009 to 2012. Mr. Bryant previously served as Executive Vice President, Finance and Enterprise Services from 2007 to 2009; Executive Vice President, Chief Financial and Enterprise Services Officer from 2001 to 2007; Senior Vice President, Chief Financial and Enterprise Services Officer from 1999 to 2001; Senior Vice President, Chief Financial Officer from January 1999 to December 1999; and Vice President, Chief Financial Officer from 1994 to 1999. Mr. Bryant also serves on the board of directors of Columbia Sportswear and McKesson Corporation.
Brian M. Krzanich has been Chief Executive Officer and a member of our Board of Directors since May 2013. Mr. Krzanich served as Executive Vice President, Chief Operating Officer from 2012 to 2013. As CEO, his focus has been transforming Intel from a PC-centric company to a data-centric company, delivering the technology foundations for the new data economy. Mr. Krzanich joined Intel in 1982 and served in a number of executive roles prior to his appointment as CEO. From 2010 to 2012, he was Senior Vice President, General Manager of Manufacturing and Supply Chain. From 2006 to 2010, he was Vice President, General Manager of Assembly and Test. Prior to 2006, Mr. Krzanich held various senior leadership positions within Intel's manufacturing organization. Mr. Krzanich is also a member of Deere & Company's board of directors, and chairman of the board of directors of the Semiconductor Industry Association.
Dr. Venkata S.M. ("Murthy") Renduchintala joined Intel in November 2015. Since then, he has served as our Executive Vice President and President, Client and Internet of Things Businesses and System Architecture Group. In this role, Dr. Renduchintala oversees Intel's Platform Engineering, Client Computing, Internet of Things, Software and Services, and Design and Technology Solutions divisions. From 2004 to 2015, Dr. Renduchintala held various senior positions at Qualcomm Incorporated, most recently as Co-President of Qualcomm CDMA Technologies from June 2012 to November 2015 and Executive Vice President of Qualcomm Technologies Inc. from October 2012 to November 2015. Before joining Qualcomm, Dr. Renduchintala served as Vice President and General Manager of the Cellular Systems Division of Skyworks Solutions Inc./Conexant Systems Inc. and he spent a decade with Philips Electronics, where he held various positions, including Vice President of Engineering for its consumer communications business.
Navin Shenoy has been Executive Vice President and General Manager of the Data Center Group since May 2017. In this role, he oversees the strategy and product development of our data center platforms, a business that spans servers, networks, and storage across all customer segments. From May 2016 to May 2017, Mr. Shenoy was Senior Vice President and General Manager of the Client Computing Group. From April 2012 to April 2016, he served as General Manager of the Mobility Client Platform Division, as Vice President from April 2012 until December 2014 and Corporate Vice President from January 2015 to May 2016. From October 2007 to April 2012, Mr. Shenoy served as Vice President and General Manager of our Asia-Pacific business. Mr. Shenoy joined Intel in 1995.
Robert ("Bob") H. Swan has been our Executive Vice President, Chief Financial Officer since joining Intel in October 2016. He oversees Intel's global finance organization-including finance, accounting and reporting, tax, treasury, internal audit, and investor relations-IT, and the Corporate Strategy Office. From September 2015 to September 2016, Mr. Swan served as an Operating Partner at General Atlantic LLC, a private equity firm. He served as Senior Vice President, Finance and Chief Financial Officer of eBay Inc. from March 2006 to July 2015. Previously, Mr. Swan served as Executive Vice President, Chief Financial Officer of Electronic Data Systems Corporation, Executive Vice President, Chief Financial Officer of TRW Inc., as well as Chief Financial Officer, Chief Operating Officer, and Chief Executive Officer of Webvan Group, Inc. Mr. Swan began his career in 1985 at General Electric, serving for 15 years in numerous senior finance roles. Mr. Swan also serves on the board of directors of eBay.
FUNDAMENTALS OF OUR BUSINESS | Who Manages Our Business | 12 |
Table of Contents
human capital |
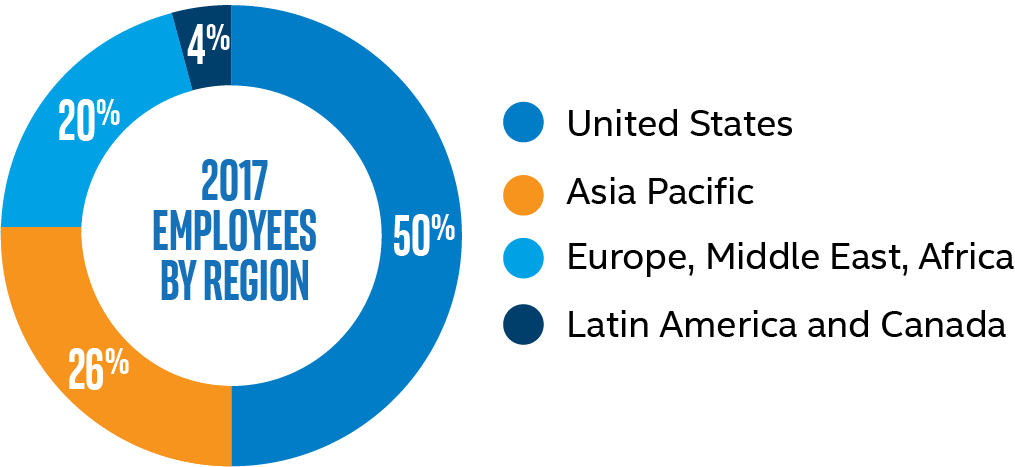
Given the highly technical nature of our business, our success depends on our ability to attract and retain talented and skilled employees. Our global workforce of 102,700 is highly educated, with approximately 87% of our people working in technical roles. |
|
| "Through a focused effort across Intel, we are building diverse and inclusive teams and embedding this capability in all that we do. We believe a more diverse and inclusive Intel provides a better work environment for our employees and enables better business results." -Leslie Culbertson, Senior Vice President and Director of Human Resources (2017) |
We invest in creating a diverse and inclusive environment where our employees can deliver their workplace best every day, and empower them to give back to the communities where we operate. |
|
| |
 |
|  |
| ||
GROWTH AND DEVELOPMENT |
We invest significant resources to develop the talent needed to keep the company at the forefront of innovation, delivering millions of hours of web-based and face-to-face training annually and providing rotational or temporary assignment development opportunities. Through our new "Managing at Intel" course, we are training every manager in the company in inclusive management practices and providing resources and tools to support them.
COMMUNICATION AND ENGAGEMENT |
We believe that our success depends on employees understanding how their work contributes to the company's overall strategy. We use a variety of communications channels to facilitate open and direct communication, including open forums with our executives, quarterly Organizational Health Polls, and engagement through 30 different employee resource groups, including the Women at Intel Network.
COMPENSATION AND BENEFITS |
We strive to provide benefits and services that help meet the varying needs of our employees-from working parents and those with eldercare responsibilities, to those in the military reserves. Our total rewards package provides highly competitive compensation, with the inclusion of stock grants, retirement benefits, generous paid time off, bonding leave, flexible work schedules, sabbaticals, on-site services, and more.
HEALTH, SAFETY, AND WELLNESS |
Our ultimate goal is to achieve zero injuries through continued investment in and focus on our core safety programs and injury-reduction initiatives. We provide access to a variety of innovative, flexible, and convenient employee health and wellness programs, including on-site health centers and fitness classes and facilities.
FUNDAMENTALS OF OUR BUSINESS | Human Capital | 13 |
Table of Contents
Corporate responsibility and sustainability |
Our commitment to corporate responsibility and sustainability-built on a strong foundation of transparency, governance, and ethics-creates value for Intel and our stockholders by helping us mitigate risks, reduce costs, build brand value, and identify new market opportunities. We set ambitious goals for our company and make strategic investments to advance progress in the areas of environmental sustainability, supply chain responsibility, diversity and inclusion, and social impact that benefit the environment and society. Through our technology we enable more people to harness the power of data to help address society's most complex issues-from climate change and energy efficiency, to economic empowerment and human rights.
We have established formal board-level oversight responsibility for corporate responsibility and, since 2008, have linked a portion of employee and executive pay to corporate responsibility factors. A foundational element of our approach to corporate responsibility is our commitment to transparency. For more information, read our most recent Corporate Responsibility Report and Diversity and Inclusion Report.
 |
| ENVIRONMENTAL SUSTAINABILITY |
|
|
|
| |
| Driving to the lowest environmental footprint possible helps us achieve efficiency, lower costs, and respond to the needs of our customers and community stakeholders. We invest in conservation projects and set company-wide environmental targets, seeking to drive reductions in greenhouse gas emissions, energy use, water use, and waste generation. Since 2012, we have invested more than $185 million in approximately 2,000 energy conservation projects, resulting in annual cost savings of approximately $120 million and cumulative energy savings of more than 3 billion kilowatt hours. We are also working with others to apply Internet of Things technologies to environmental challenges such as climate change and water conservation. | ||
|
|
| |
 |
| SUPPLY CHAIN RESPONSIBILITY |
|
|
|
| |
| Actively managing our supply chain creates business value for Intel and our customers by helping us reduce risks, improve product quality, achieve environmental and social goals, and raise the overall performance of our suppliers. Over the past five years, we have completed more than 450 supplier audits using the Responsible Business Alliance Code of Conduct standard and have expanded training and capacity building programs with our suppliers. We actively collaborate with others and lead industry initiatives on key issues such as advancing responsible minerals sourcing, addressing risks of forced and bonded labor, and improving transparency around climate and water impacts in the global electronics supply chain. | ||
|
|
| |
 |
| DIVERSITY AND INCLUSION |
|
|
|
| |
| Building an inclusive workforce, industry, and ecosystem is critical to helping us attract and retain the talent needed to advance innovation and drive our business forward. We have committed $300 million to advance diversity and inclusion in our workforce and in the technology industry, and are making progress toward our goal to achieve full representation of women and underrepresented minorities in our U.S. workforce by the end of 2018. We are increasing spending with diverse-owned suppliers with a goal of reaching $1.0 billion by 2020, and are investing in programs to create new career pathways into the technology industry. | ||
|
|
| |
 |
| SOCIAL IMPACT |
|
|
|
| |
| Empowering people through technology and advancing social impact initiatives helps build trust with key external stakeholders and engages and supports the interests of our employees. Our employees actively share their expertise and skills through technology-related volunteer initiatives, and over the past 10 years have contributed approximately 10 million hours of service in the communities where we operate. | ||
|
|
| |
FUNDAMENTALS OF OUR BUSINESS | Corporate Responsibility and Sustainability | 14 |
Table of Contents
Management's Discussion and analysis (md&A) - results of operations |
2017 was another record year for Intel and shows we have made progress on our shift from being primarily a PC-centric company to a data-centric company. We achieved record revenue in 2017 and strong operating income growth and bottom line results. Our growth was primarily driven by our data-centric businesses, while our PC-centric business exceeded our expectation and continues to be a source of profit, cash flow, scale, and intellectual property. The strategic investments we have made in data-rich markets like memory, programmable solutions, and autonomous driving are starting to pay off and are becoming an increasingly larger portion of our business. For a more comprehensive overview of the results of our operations, see "A Year in Review" within Fundamentals of Our Business.
Years Ended |
| December 30, 2017 |
| December 31, 2016 |
| December 26, 2015 | |||||||||||||||
| Dollars |
| % of Net Revenue |
| Dollars |
| % of Net Revenue |
| Dollars |
| % of Net Revenue | ||||||||||
Net revenue |
| $ | 62,761 | |
| 100.0 | % |
| $ | 59,387 | |
| 100.0 | % |
| $ | 55,355 | |
| 100.0 | % |
Cost of sales |
| 23,692 | |
| 37.7 | % |
| 23,196 | |
| 39.1 | % |
| 20,676 | |
| 37.4 | % | |||
Gross margin |
| 39,069 | |
| 62.3 | % |
| 36,191 | |
| 60.9 | % |
| 34,679 | |
| 62.6 | % | |||
Research and development |
| 13,098 | |
| 20.9 | % |
| 12,740 | |
| 21.5 | % |
| 12,128 | |
| 21.9 | % | |||
Marketing, general and administrative |
| 7,474 | |
| 11.9 | % |
| 8,397 | |
| 14.1 | % |
| 7,930 | |
| 14.3 | % | |||
Restructuring and other charges |
| 384 | |
| 0.6 | % |
| 1,886 | |
| 3.2 | % |
| 354 | |
| 0.6 | % | |||
Amortization of acquisition-related intangibles |
| 177 | |
| 0.3 | % |
| 294 | |
| 0.5 | % |
| 265 | |
| 0.5 | % | |||
Operating income |
| 17,936 | |
| 28.6 | % |
| 12,874 | |
| 21.7 | % |
| 14,002 | |
| 25.3 | % | |||
Gains (losses) on equity investments, net |
| 2,651 | |
| 4.2 | % |
| 506 | |
| 0.9 | % |
| 315 | |
| 0.6 | % | |||
Interest and other, net |
| (235 | ) |
| (0.4 | )% |
| (444 | ) |
| (0.8 | )% |
| (105 | ) |
| (0.2 | )% | |||
Income before taxes |
| 20,352 | |
| 32.4 | % |
| 12,936 | |
| 21.8 | % |
| 14,212 | |
| 25.7 | % | |||
Provision for taxes |
| 10,751 | |
| 17.1 | % |
| 2,620 | |
| 4.4 | % |
| 2,792 | |
| 5.1 | % | |||
Net income |
| $ | 9,601 | |
| 15.3 | % |
| $ | 10,316 | |
| 17.4 | % |
| $ | 11,420 | |
| 20.6 | % |
Earnings per share - Diluted |
| $ | 1.99 | |
|
|
| $ | 2.12 | |
|
|
| $ | 2.33 | |
|
| |||
MD&A - RESULTS OF OPERATIONS | Consolidated Results and Analysis | 15 |
Table of Contents
REVENUE
(Dollars in charts are shown in billions)
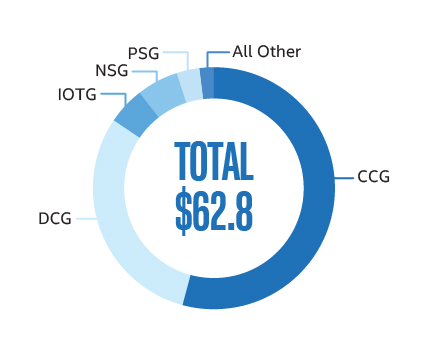
REVENUE |
| SEGMENT REVENUE |
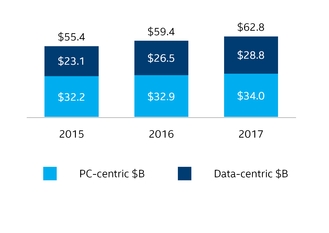
SEGMENT REVENUE WALK |
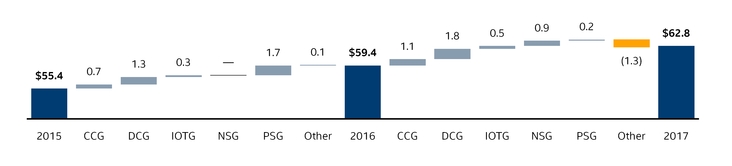
2017 vs. 2016 |
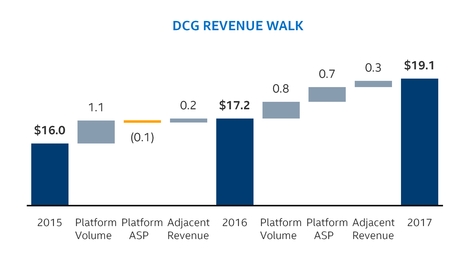
We have achieved record revenue two years in a row, with 2017 revenue of $62.8 billion , up $3.4 billion , or 6% , from 2016 . After adjusting for the Q2 2017 divestiture of ISecG, revenue grew 9% from 2016 . The increase in revenue was primarily driven by strong performance across our data-centric businesses, which collectively grew 16% year over year after adjusting for ISecG. We saw revenue growth across our DCG, IOTG, NSG, and PSG businesses, and 2017 revenue includes $210 million from our Mobileye business. The increase in revenue was partially offset by $1.6 billion from the divestiture of ISecG and by a change to the Intel Inside® program in 2017 .
We implemented a change to the Intel Inside program to make the program more efficient and effective, and to provide more flexibility to our customers. This change affects the way we classify our cooperative advertising costs and resulted in a reduction to 2017 revenue of approximately $500 million compared to 2016 , which would have been classified as marketing expenses prior to program changes.
2016 vs. 2015 |
In 2016, we achieved revenue of $59.4 billion , up $4.0 billion , or 7% , from 2015 . Our 2016 results reflected the inclusion of PSG and an extra workweek when compared to 2015 . In addition, our revenue growth in 2016 was driven by higher unit sales from our DCG platform and higher average selling prices (ASPs) for our notebook and desktop platforms.
MD&A - RESULTS OF OPERATIONS | Consolidated Results and Analysis | 16 |
Table of Contents
GROSS MARGIN
(Dollars in chart are shown in billions; percentages indicate gross margin as a percentage of total revenue)
GROSS MARGIN |
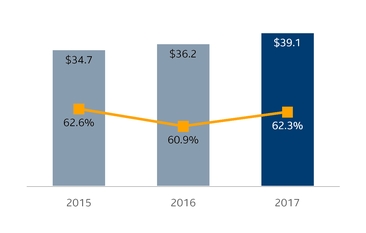
We derived most of our overall gross margin dollars from the sale of platform products in the CCG and DCG operating segments. Our overall gross margin dollars in 2017 increased by $2.9 billion , or 8% , compared to 2016 , and in 2016 increased by $1.5 billion , or 4% , compared to 2015 .
(In Millions) |
| GROSS MARGIN WALK | ||
$ | 39,069 | |
| 2017 Gross Margin |
2,380 | |
| Higher gross margin from platform revenue | |
1,010 | |
| Lower platform unit cost, primarily on 14nm cost improvement | |
420 | |
| Lower Altera and other acquisition-related charges | |
315 | |
| Lower period charges associated with product warranty and intellectual property agreements incurred in 2016 | |
(535 | ) |
| Higher factory start-up costs, primarily driven by the ramp of our 10nm process technology | |
(390 | ) |
| Impact of the ISecG divestiture, offset by higher gross margin from adjacent businesses | |
(275 | ) |
| Period charges primarily associated with engineering samples and higher initial production costs from our 10nm products | |
(47 | ) |
| Other | |
$ | 36,191 | |
| 2016 Gross Margin |
1,830 | |
| Higher gross margin from platform revenue | |
1,150 | |
| PSG gross margin from acquisition of Altera | |
935 | |
| Lower platform unit cost | |
(1,045 | ) |
| Altera and other acquisition-related charges | |
(690 | ) |
| Lower NSG gross margin | |
(645 | ) |
| Higher factory start-up costs, primarily driven by the ramp of our 10nm process technology | |
(315 | ) |
| Period charges associated with product warranty and intellectual property agreements | |
292 | |
| Other | |
$ | 34,679 | |
| 2015 Gross Margin |
MD&A - RESULTS OF OPERATIONS | Consolidated Results and Analysis | 17 |
Table of Contents
OPERATING EXPENSEs
(Dollars in charts are shown in billions; percentages indicate expenses as a percentage of total revenue)
RESEARCH AND DEVELOPMENT |
| MARKETING, GENERAL AND ADMINISTRATIVE |
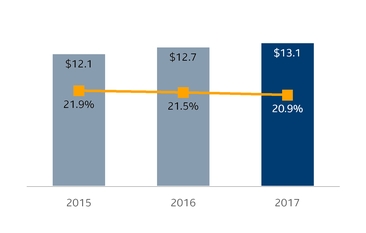
Total R&D and marketing, general and administrative (MG&A) for 2017 were $20.6 billion , down 3% from 2016 . These expenses represent 32.8% of revenue for 2017 and 35.6% of revenue for 2016 . We are making progress toward our goal to have annual R&D and MG&A be 30% of revenue by 2020, and are now expecting to meet this goal by 2019. See additional operating expense details within Restructuring and Other, below.
RESEARCH AND DEVELOPMENT
2017-2016 |
R&D spending increased by $358 million , or 3% , driven by the following:
+ | Investments in data-centric businesses, including the addition of Mobileye |
+ Process development costs for our 7nm process technology
+ | Profit-dependent compensation due to an increase in net income, excluding Tax Reform impacts |
- | Lower expenses due to the ISecG divestiture |
- | Cost savings from gained efficiencies |
2016-2015 |
R&D spending increased by $612 million , or 5% , driven by the following:
+ | Addition of PSG expenses from the acquisition of Altera Corporation (Altera) |
+ | Higher investment, net of 2016 restructuring program savings, in strategically important areas such as servers, Internet of Things, new devices, and memory |
+ | Higher process development costs for our 7nm process technology |
- | Lower depreciation expense due to a change at the beginning of fiscal year 2016 to the estimated useful life of the machinery and equipment in our wafer fabrication facilities |
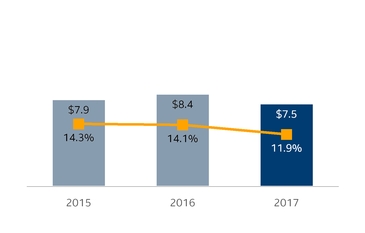
MARKETING, GENERAL AND ADMINISTRATIVE
2017-2016 |
MG&A expenses decreased by $923 million , or 11% , driven by the following:
- | Lower expenses due to the ISecG divestiture |
- | Change to the Intel Inside program |
+ | Profit-dependent compensation due to an increase in net income, excluding Tax Reform impacts |
2016-2015 |
MG&A expenses increased by $467 million , or 6% , primarily driven by PSG expenses due to the acquisition of Altera.
MD&A - RESULTS OF OPERATIONS | Consolidated Results and Analysis | 18 |
Table of Contents

Table of Contents
MARKET AND BUSINESS OVERVIEW
Market trends and strategy
Worldwide PC shipments have decreased over the last few years 1 . However, our CCG profitability has increased over 45% since 2013. The CCG business provides scale, funds intellectual property, and continues to generate a significant portion of our consolidated profit and cash flow.
The landscape of the client computing market is shifting, with new markets and devices, new consumer expectations, and new ways to connect to the cloud. We have focused our strategy on these growth opportunities by enhancing platforms and adjacent technologies to reinvigorate PC demand and provide new user experiences. Today, CCG spans a broader set of devices and a wider array of uses, such as smart homes, virtual reality, and video streaming.
As these new uses become mainstream in our daily lives, an increasing amount of data will flow between PCs or PC-like devices and the data center. While we are transforming from a PC-centric to a data-centric company, CCG continues to be a critical part of the Virtuous Cycle of Growth, generating significant amounts of data and driving the growth of new uses, as well as the need for continued expansion of the cloud and data center.

Products and competitiveness
To focus our business and better serve our customers, we have established an annual cadence of leadership product introductions. This year we launched the latest flagship product, the Intel® Core™ i9 processor family, and the 8th generation Intel Core processors. These platform products address a wide range of needs for rapidly growing markets, from notebook products such as 2 in 1 systems, thin-and-lights, and Chromebook* systems, to desktop products such as gaming systems and mini desktops.
Our platform products are enhanced by new adjacent technologies. During the year, we introduced our 5th generation LTE* modem, the Intel® XMM™ 7560 modem, built on Intel's 14nm process technology, and our first family of 5G NR multi-mode commercial modems, the Intel XMM 8000 series modems. In addition, we offer Intel Optane memory, an adaptive caching technology for accelerating system performance, and advanced connectivity like Thunderbolt™ technology.
To enable the smart and connected home, Intel delivers SoCs and Wi-Fi chipsets for home gateways, routers, modems, and personal assistants. Intel® Puma™ and Intel® AnyWAN™ SoCs enable high-performance connectivity that can keep up with increasing demands for bandwidth. Intel® Home Wi-Fi Chipsets enable home networks to scale for more connected devices and experiences and Intel Atom® SoCs enable a new class of premium personal assistant experiences for the smart home.

1 Source: Intel calculated PC shipment estimate derived from industry analyst reports.
MD&A - RESULTS OF OPERATIONS | Client Computing Group | 20 |
Table of Contents
FINANCIAL PERFORMANCE
(Dollars in charts are shown in billions)
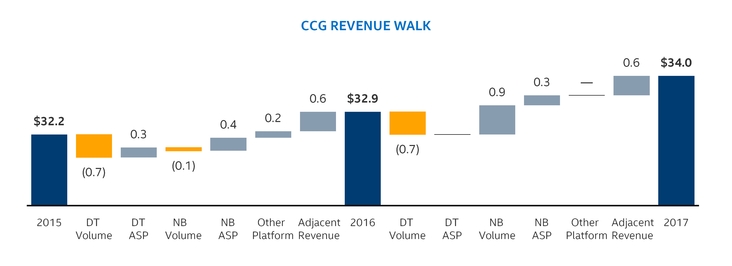
Revenue Summary |
| |
2017 vs. 2016 |
| |
+ | Growth in notebook (NB) from the strength in commercial and gaming and improving market conditions |
|
+ | Higher adjacent revenue, primarily from modem product ramp |
|
- | Continued desktop (DT) market decline and the impact from the change of Intel Inside program, partially offset by higher demand for high-performance processors |
|
|
|
|
2016 vs. 2015 |
| |
+ | Ramp of our adjacent products, primarily modem |
|
- | PC market decline, offset by mix of high-performance processors |
|
|
|
|
Key Revenue Metrics | ||||||
|
| 2017 vs. 2016 |
| 2016 vs. 2015 | ||
Desktop Platform |
|
|
|
|
| |
| Volume | down | (5)% |
| down | (6)% |
| ASP | flat | -% |
| up | 2% |
|
|
|
|
|
|
|
Notebook Platform |
|
|
|
|
| |
| Volume | up | 5% |
| down | (1)% |
| ASP | up | 2% |
| up | 2% |
|
|
|
|
|
|
|
Adjacent Products |
|
|
|
|
| |
| Revenue | up | 29% |
| up | 40% |
|
|
|
|
|
|
|
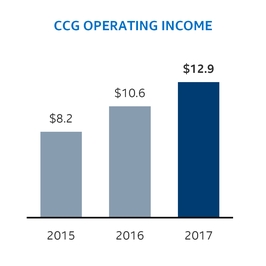
(In Millions) |
| CCG Operating Income Walk | ||
$ | 12,919 | |
| 2017 Operating Income |
1,135 | |
| Lower CCG platform unit cost, primarily on 14nm cost improvement | |
630 | |
| Lower CCG spending and share of technology development and MG&A costs | |
635 | |
| Higher gross margin from CCG platform revenue | |
(430 | ) |
| Period charges primarily associated with engineering samples and higher initial production costs from our 10nm products | |
303 | |
| Other | |
$ | 10,646 | |
| 2016 Operating Income |
1,250 | |
| Lower CCG platform unit cost | |
905 | |
| Lower CCG operating expense | |
625 | |
| Higher gross margin from CCG platform revenue | |
(645 | ) |
| Higher factory start-up costs, primarily driven by the ramp of our 10nm process technology | |
345 | |
| Other | |
$ | 8,166 | |
| 2015 Operating Income |
MD&A - RESULTS OF OPERATIONS | Client Computing Group | 21 |
Table of Contents
Table of Contents
MARKET AND BUSINESS OVERVIEW
Market trends and strategy
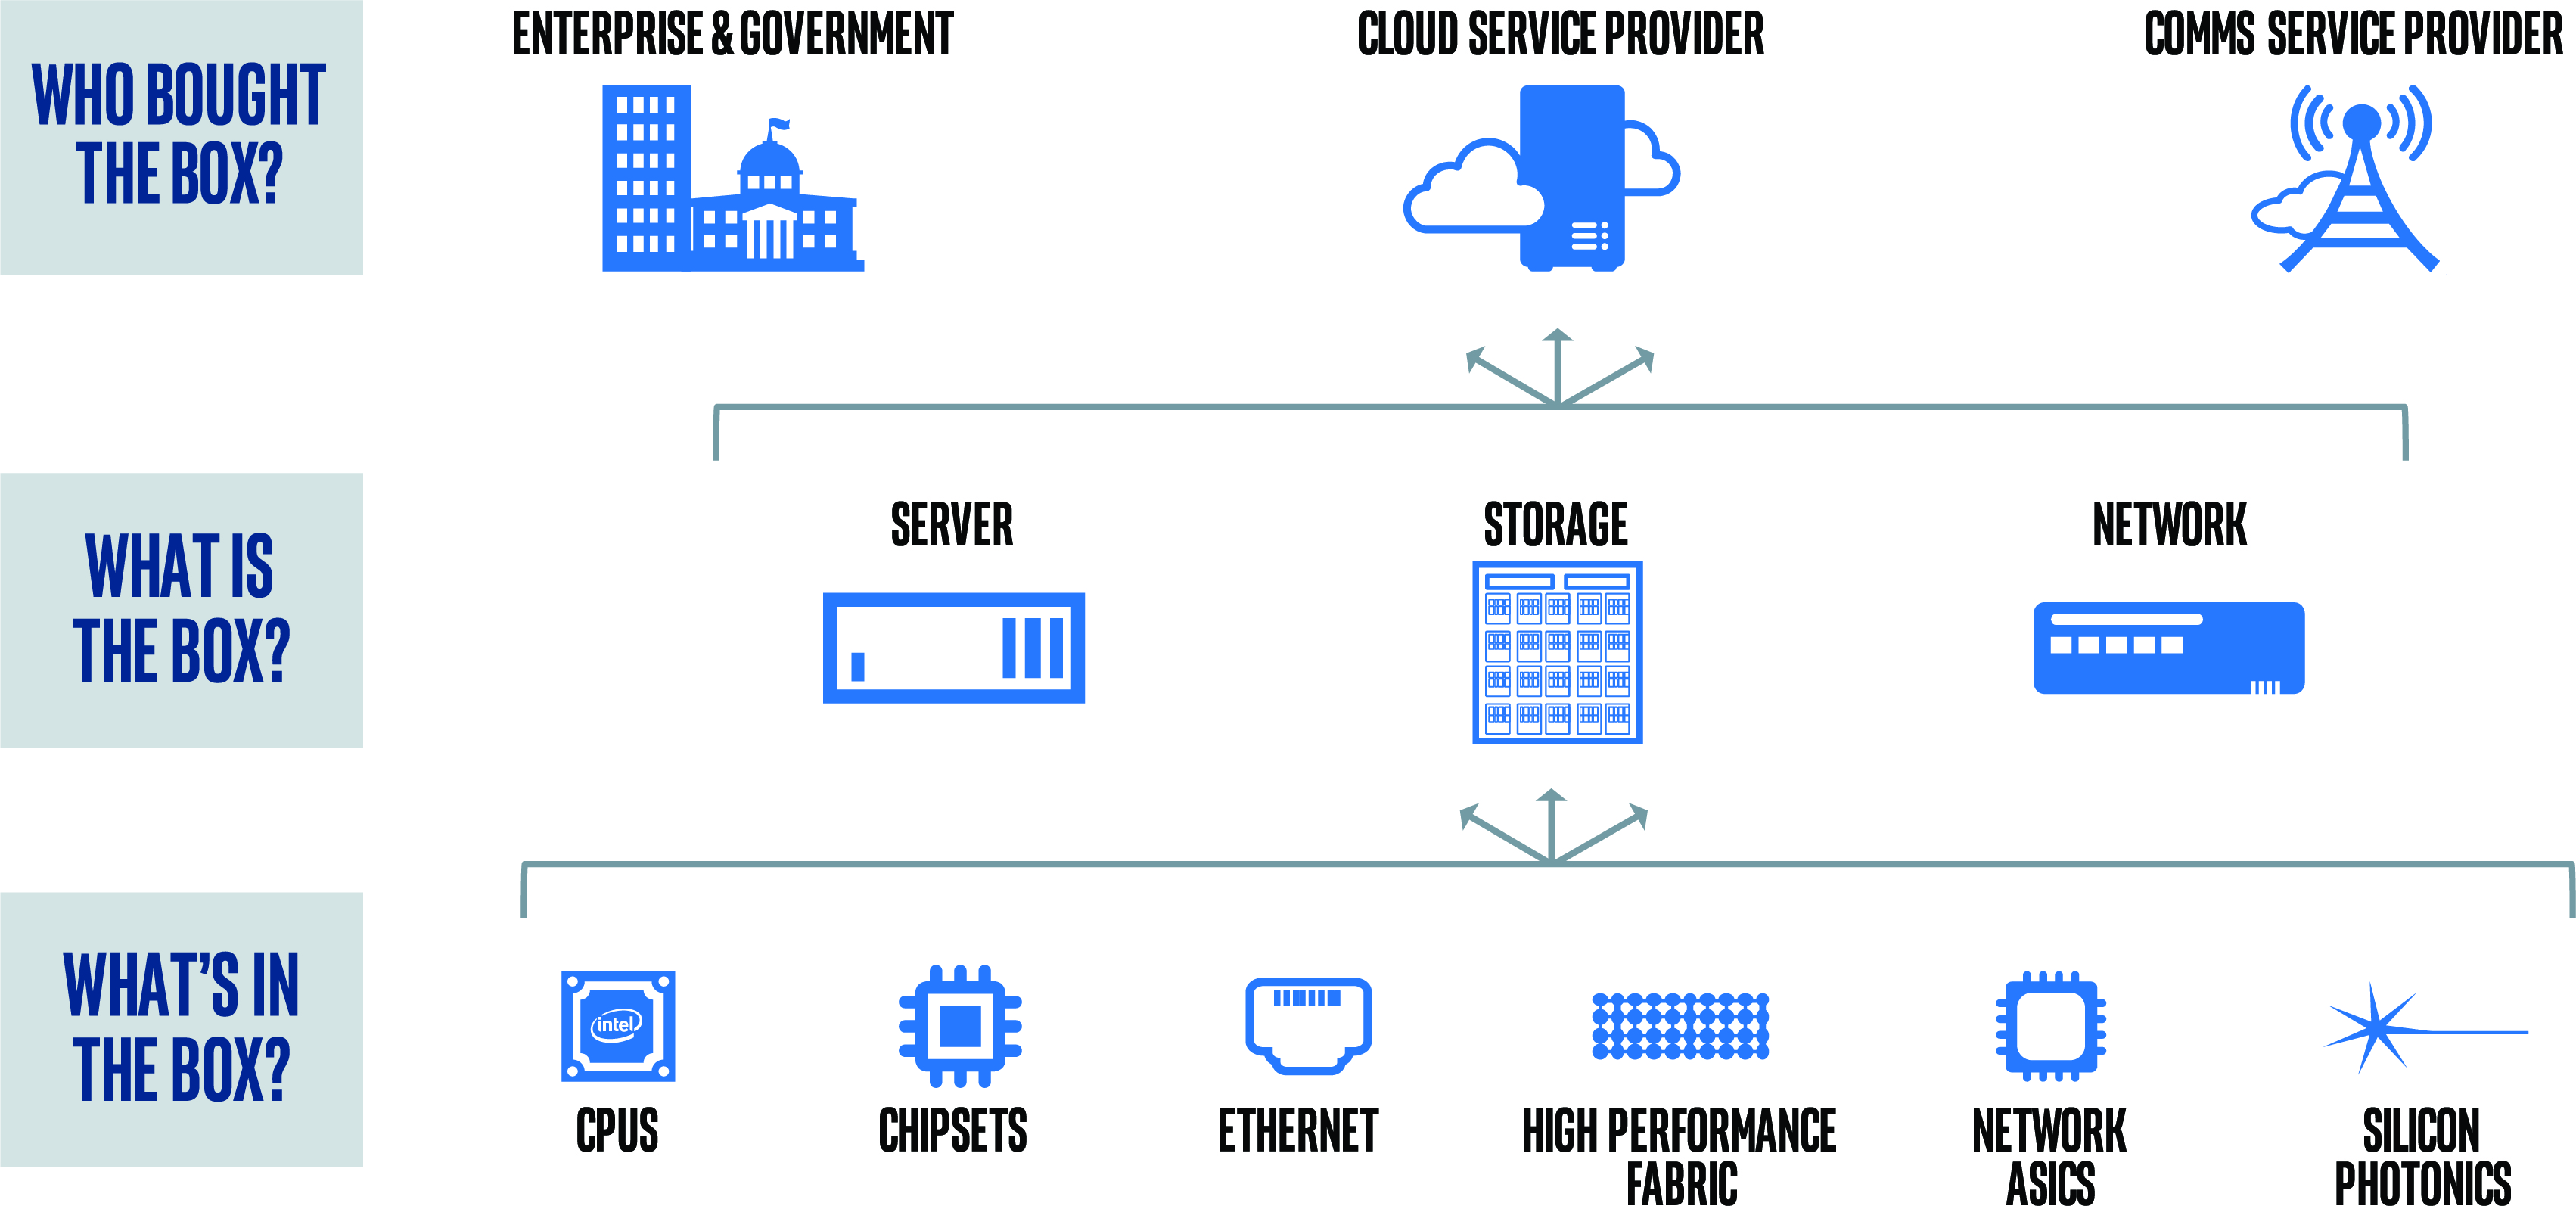
The infographic below illustrates multiple ways that we analyze the DCG business. The "What's in the box?" line shows all DCG products -for example, CPUs, and silicon photonics-that are integrated in the form of server, storage, and network ("What is the box?") and sold to DCG's end users ("Who bought the box?").
Data is a significant force in society today and data is generated by intelligent and connected machines. Data is the lifeblood for the future of technology innovation and actionable insights. Data is transmitted through network infrastructure, processed, and analyzed to become real-time information.
The data center TAM is expected to surpass $70 billion by 2022 1 . Currently, we have less than a 40% market share. We see significant opportunities in cloud, networking, and analytics/artificial intelligence and the chance to drive higher growth as we expand our product offerings with our adjacent products. The cloud and communications service provider market segments continue to grow significantly, while the enterprise and government market segment continues to decline as workloads move to the public cloud.
 |
| Products and competitiveness |
|
| |
| We offer a broad portfolio of platforms and technologies designed to provide workload-optimized performance across compute, storage, and network. These offerings span the full spectrum from the data center core to the network edge. In addition, DCG focuses on lowering the total cost of ownership and on other specific workload optimizations for the enterprise, cloud service provider, and communications service provider market segments with hardware-enhanced performance, security, and reliability. DCG's platform value can be extended through Intel adjacent products such as FPGAs and SSDs. | |
| In early Q3 2017, we launched the Intel Xeon Scalable processors, formerly code-named Skylake-SP. The new product delivers performance improvement over the prior generation on popular workloads, and was broadly available in more than 200 original equipment manufacturer (OEM) systems as of the end of 2017. | |
1 Source: Intel calculated Data Center TAM derived from industry analyst reports.
MD&A - RESULTS OF OPERATIONS | Data Center Group | 23 |
Table of Contents
FINANCIAL PERFORMANCE
(Dollars in charts are shown in billions)
Market Segment Revenue Growth 1 | |||||
| 2017 vs. 2016 |
| 2016 vs. 2015 | ||
Cloud Service Provider | up | 28% |
| up | 24% |
Enterprise and Government | down | (3)% |
| down | (3)% |
Communication Service Provider | up | 15% |
| up | 19% |
1 DCG platform products are sold across all three market segments. | |||||
Revenue Summary |
| |
2017 vs. 2016 |
| |
+ | Growth in server box type, primarily with cloud service providers and increased market share in network box type, and higher mix of our 14nm processors that have higher ASPs |
|
+ | Higher revenue across our adjacent products |
|
|
|
|
2016 vs. 2015 |
| |
+ | Growth in cloud and network, offset by mix of processors |
|
+ | Higher revenue across our adjacent products |
|
|
|
|
Key Revenue Metrics | ||||||
|
| 2017 vs. 2016 |
| 2016 vs. 2015 | ||
DCG Platform |
|
|
|
|
| |
| Volume | up | 5% |
| up | 8% |
| ASP | up | 4% |
| down | (1)% |
|
|
|
|
|
|
|
Adjacent Products |
|
|
|
|
| |
| Revenue | up | 21% |
| up | 19% |
|
|
|
|
|
|
|
(In Millions) |
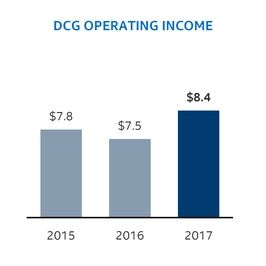
| DCG Operating Income Walk | ||
$ | 8,395 | |
| 2017 Operating Income |
1,450 | |
| Higher gross margin from DCG platform revenue | |
215 | |
| Lower period charges associated with product warranty and intellectual property agreements incurred in 2016 | |
(585 | ) |
| Higher factory start-up costs, primarily driven by the ramp of our 10nm process technology | |
(315 | ) |
| Higher DCG spending and share of technology development and MG&A costs | |
110 | |
| Other | |
$ | 7,520 | |
| 2016 Operating Income |
930 | |
| Higher gross margin from DCG platform revenue | |
(655 | ) |
| Higher DCG operating expense | |
(335 | ) |
| Higher DCG platform unit costs | |
(215 | ) |
| Period charges associated with product warranty and intellectual property agreements | |
(52 | ) |
| Other | |
$ | 7,847 | |
| 2015 Operating Income |
MD&A - RESULTS OF OPERATIONS | Data Center Group | 24 |
Table of Contents
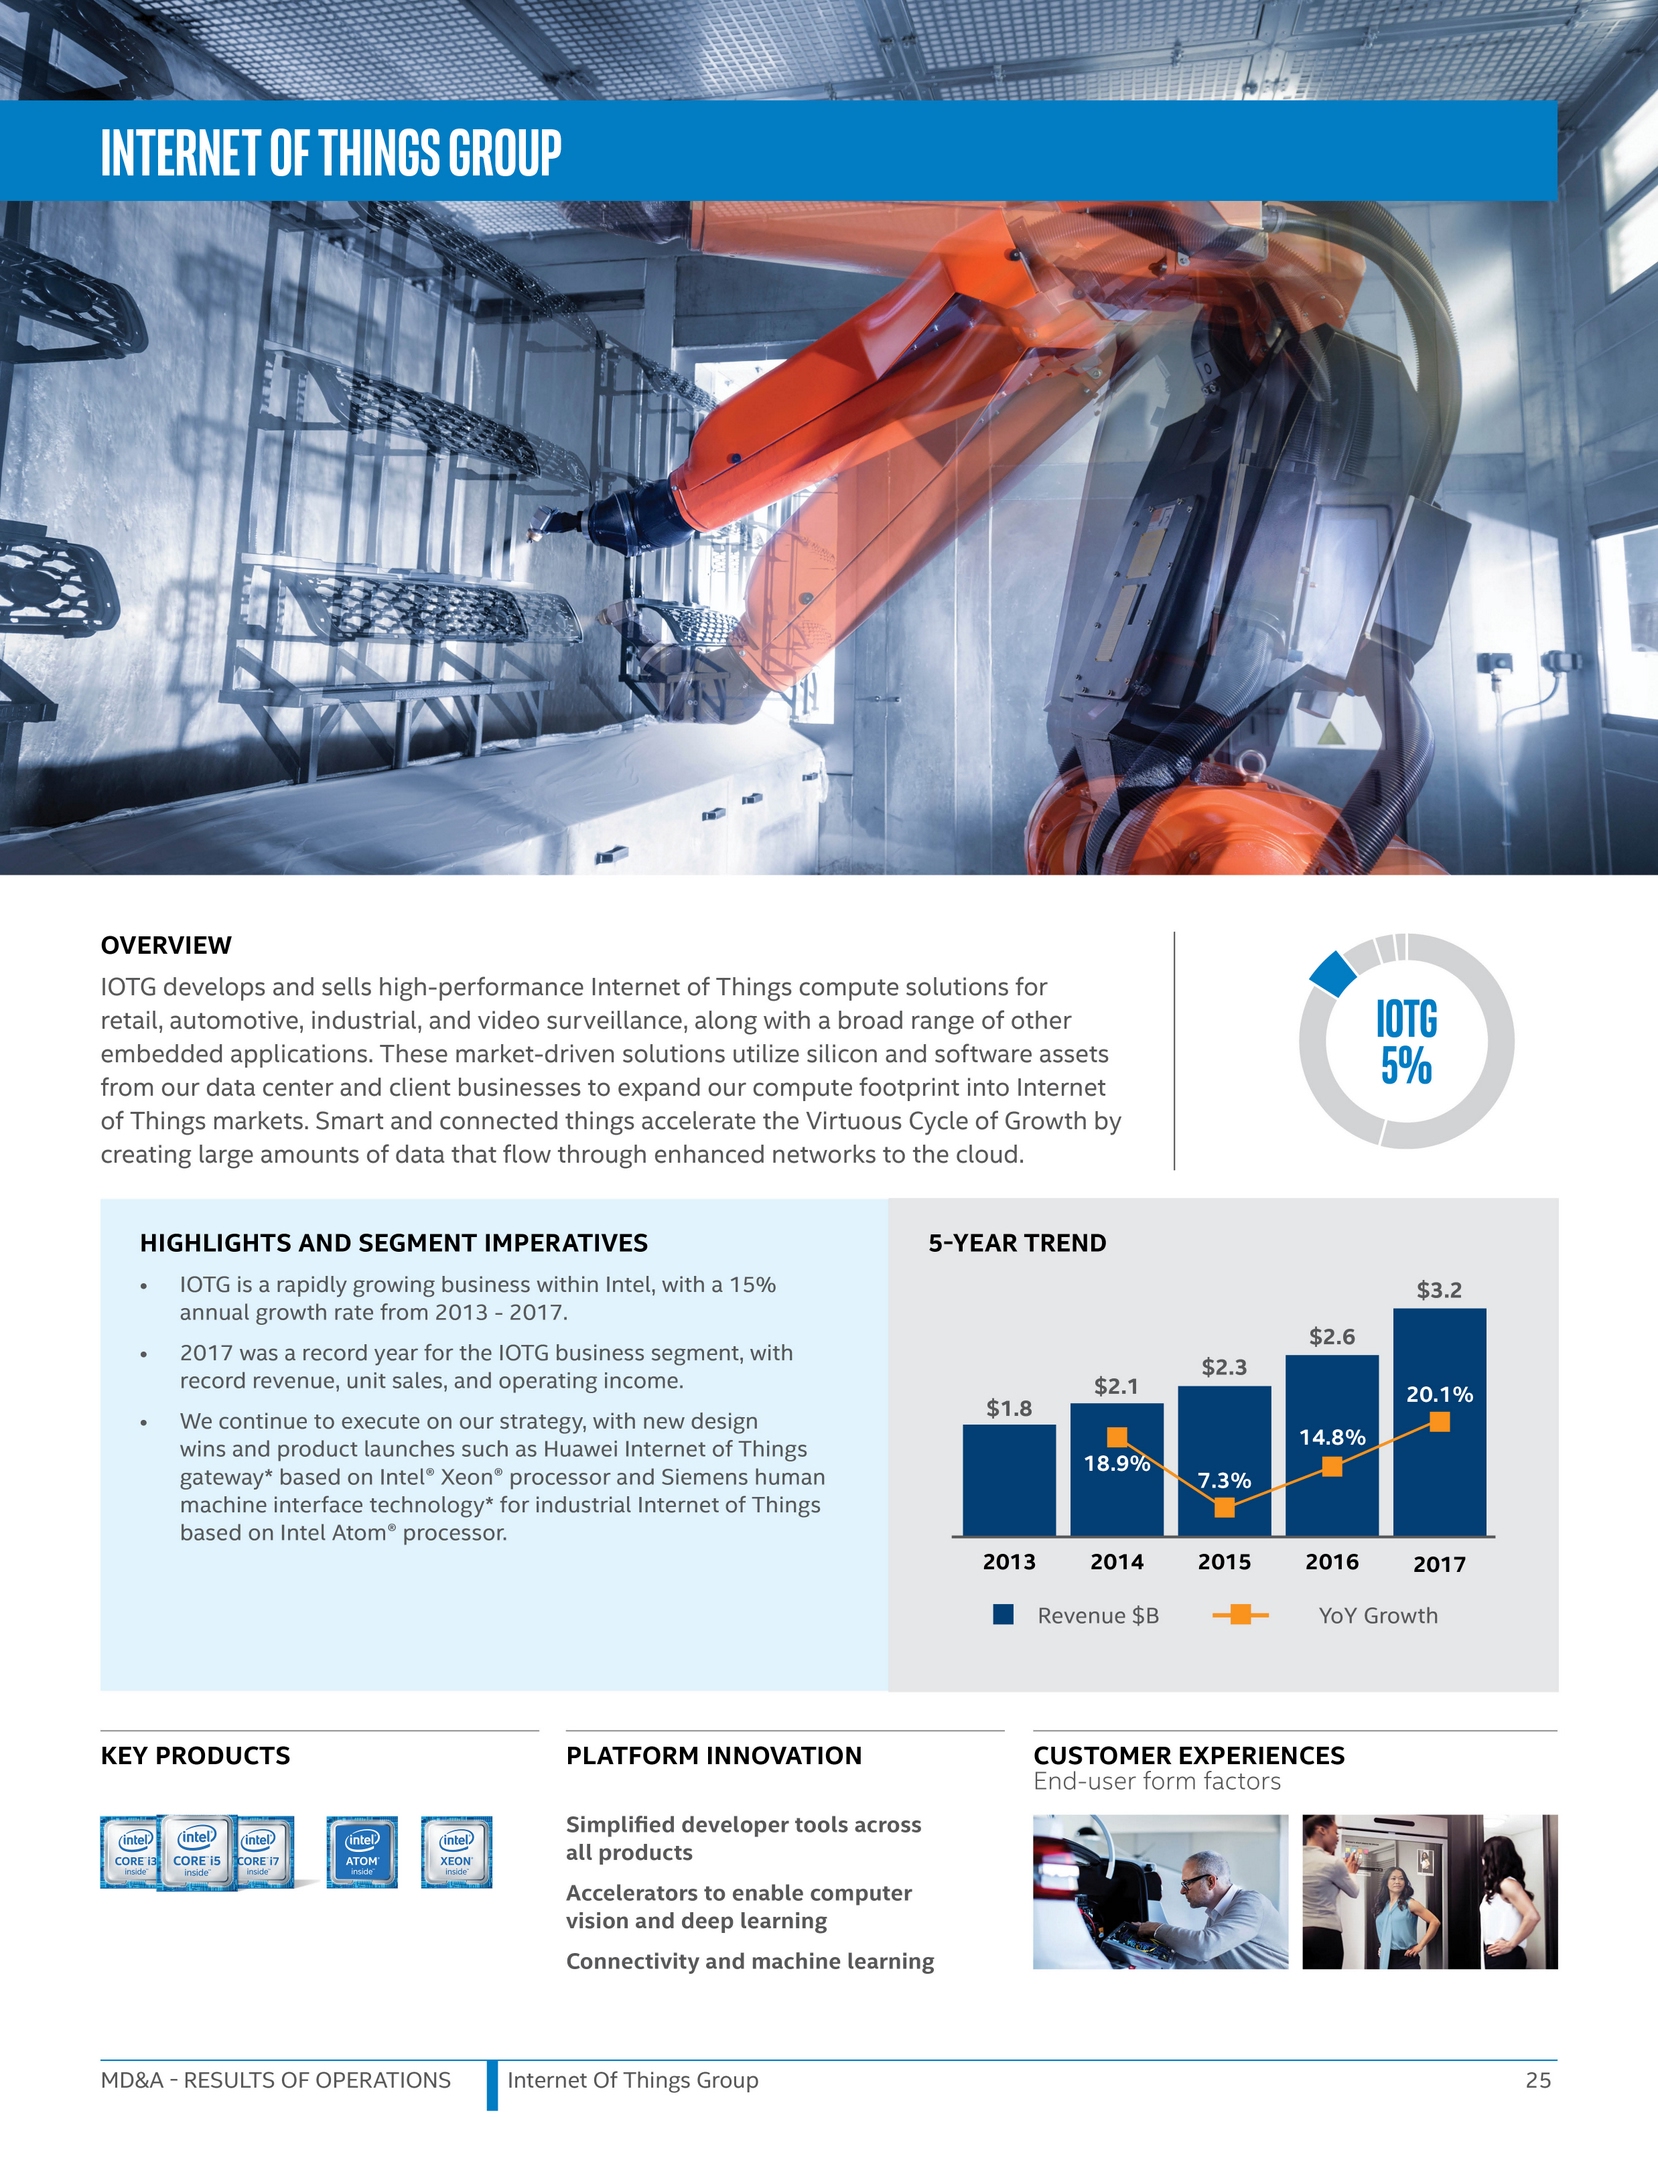
Table of Contents
MARKET AND BUSINESS OVERVIEW
Market trends and strategy
The world is becoming smarter, more connected, and more data driven, and the Internet of Things sits at the center of this global digital transformation. Through a robust network of devices, software, networks, and sensors the Internet of Things is transforming the way we live, connect, work, create, and conduct business-from smart cities, to smart and efficient manufacturing. Creating, transferring, and harnessing the power of data, Internet of Things-based solutions represent one of the fastest growing segments within the semiconductor industry, with 9% compound annual growth rate (CAGR) forecast from 2017 to 2022 1 . However, the Internet of Things is a highly fragmented market with a diverse collection of competitors, products, and vertical segments. As such, we are specifically focused on market sectors that align well with Intel's ability to provide high-performance computing solutions.

Intel's vision for this market revolves around powering the evolution of the smart and connected world by providing distributed compute from the edge through the network to the cloud. We focus our efforts partnering with industry leaders to lead the transition from connected to smart and eventually autonomous devices capable of creating learning systems.

Products and competitiveness
We are uniquely equipped to offer technologies that enable solutions that work across the entire Internet of Things-at the edge, in the network, or in the cloud-enabling businesses to extract the right insights, in the right place, at the right time. We offer end-to-end solutions with our wide spectrum of products, including Intel Atom to Intel Xeon processor-based computing, wireless connectivity, FPGAs, and Wind River * software. IOTG leverages adjacent product investments across Intel while making the investments needed to adapt products to the specific requirements for IOTG vertical segments. For example, applications in the industrial sector require technologies such as extended temperature ranges, functional safety, time-coordinated computing, and long-life support.
With IOTG, we enable a global ecosystem of industry partners, developers, and innovators to create solutions based on our products that accelerate return on investment and time-to-value for end customers. These Intel ® IoT Ready Solutions are vetted and tested in the market, commercially available, and fully supported through our ecosystem partners. One example is the Intel architecture-based Cisco* Connected Factory Network*, which improves factory operation efficiency and reduces costs by connecting factory automation and control systems to IT systems.
1 Source: Intel calculated Internet of Things CAGR derived from industry analyst reports.
MD&A - RESULTS OF OPERATIONS | Internet of Things Group | 26 |
Table of Contents
FINANCIAL PERFORMANCE
(Dollars in charts are shown in billions)
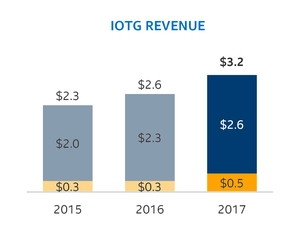
Revenue Summary
2017 vs. 2016 |
2016 vs. 2015 |
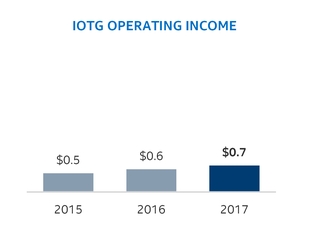
Operating Income Summary
2017 vs. 2016 |
2016 vs. 2015 |
MD&A - RESULTS OF OPERATIONS | Internet of Things Group | 27 |
Table of Contents
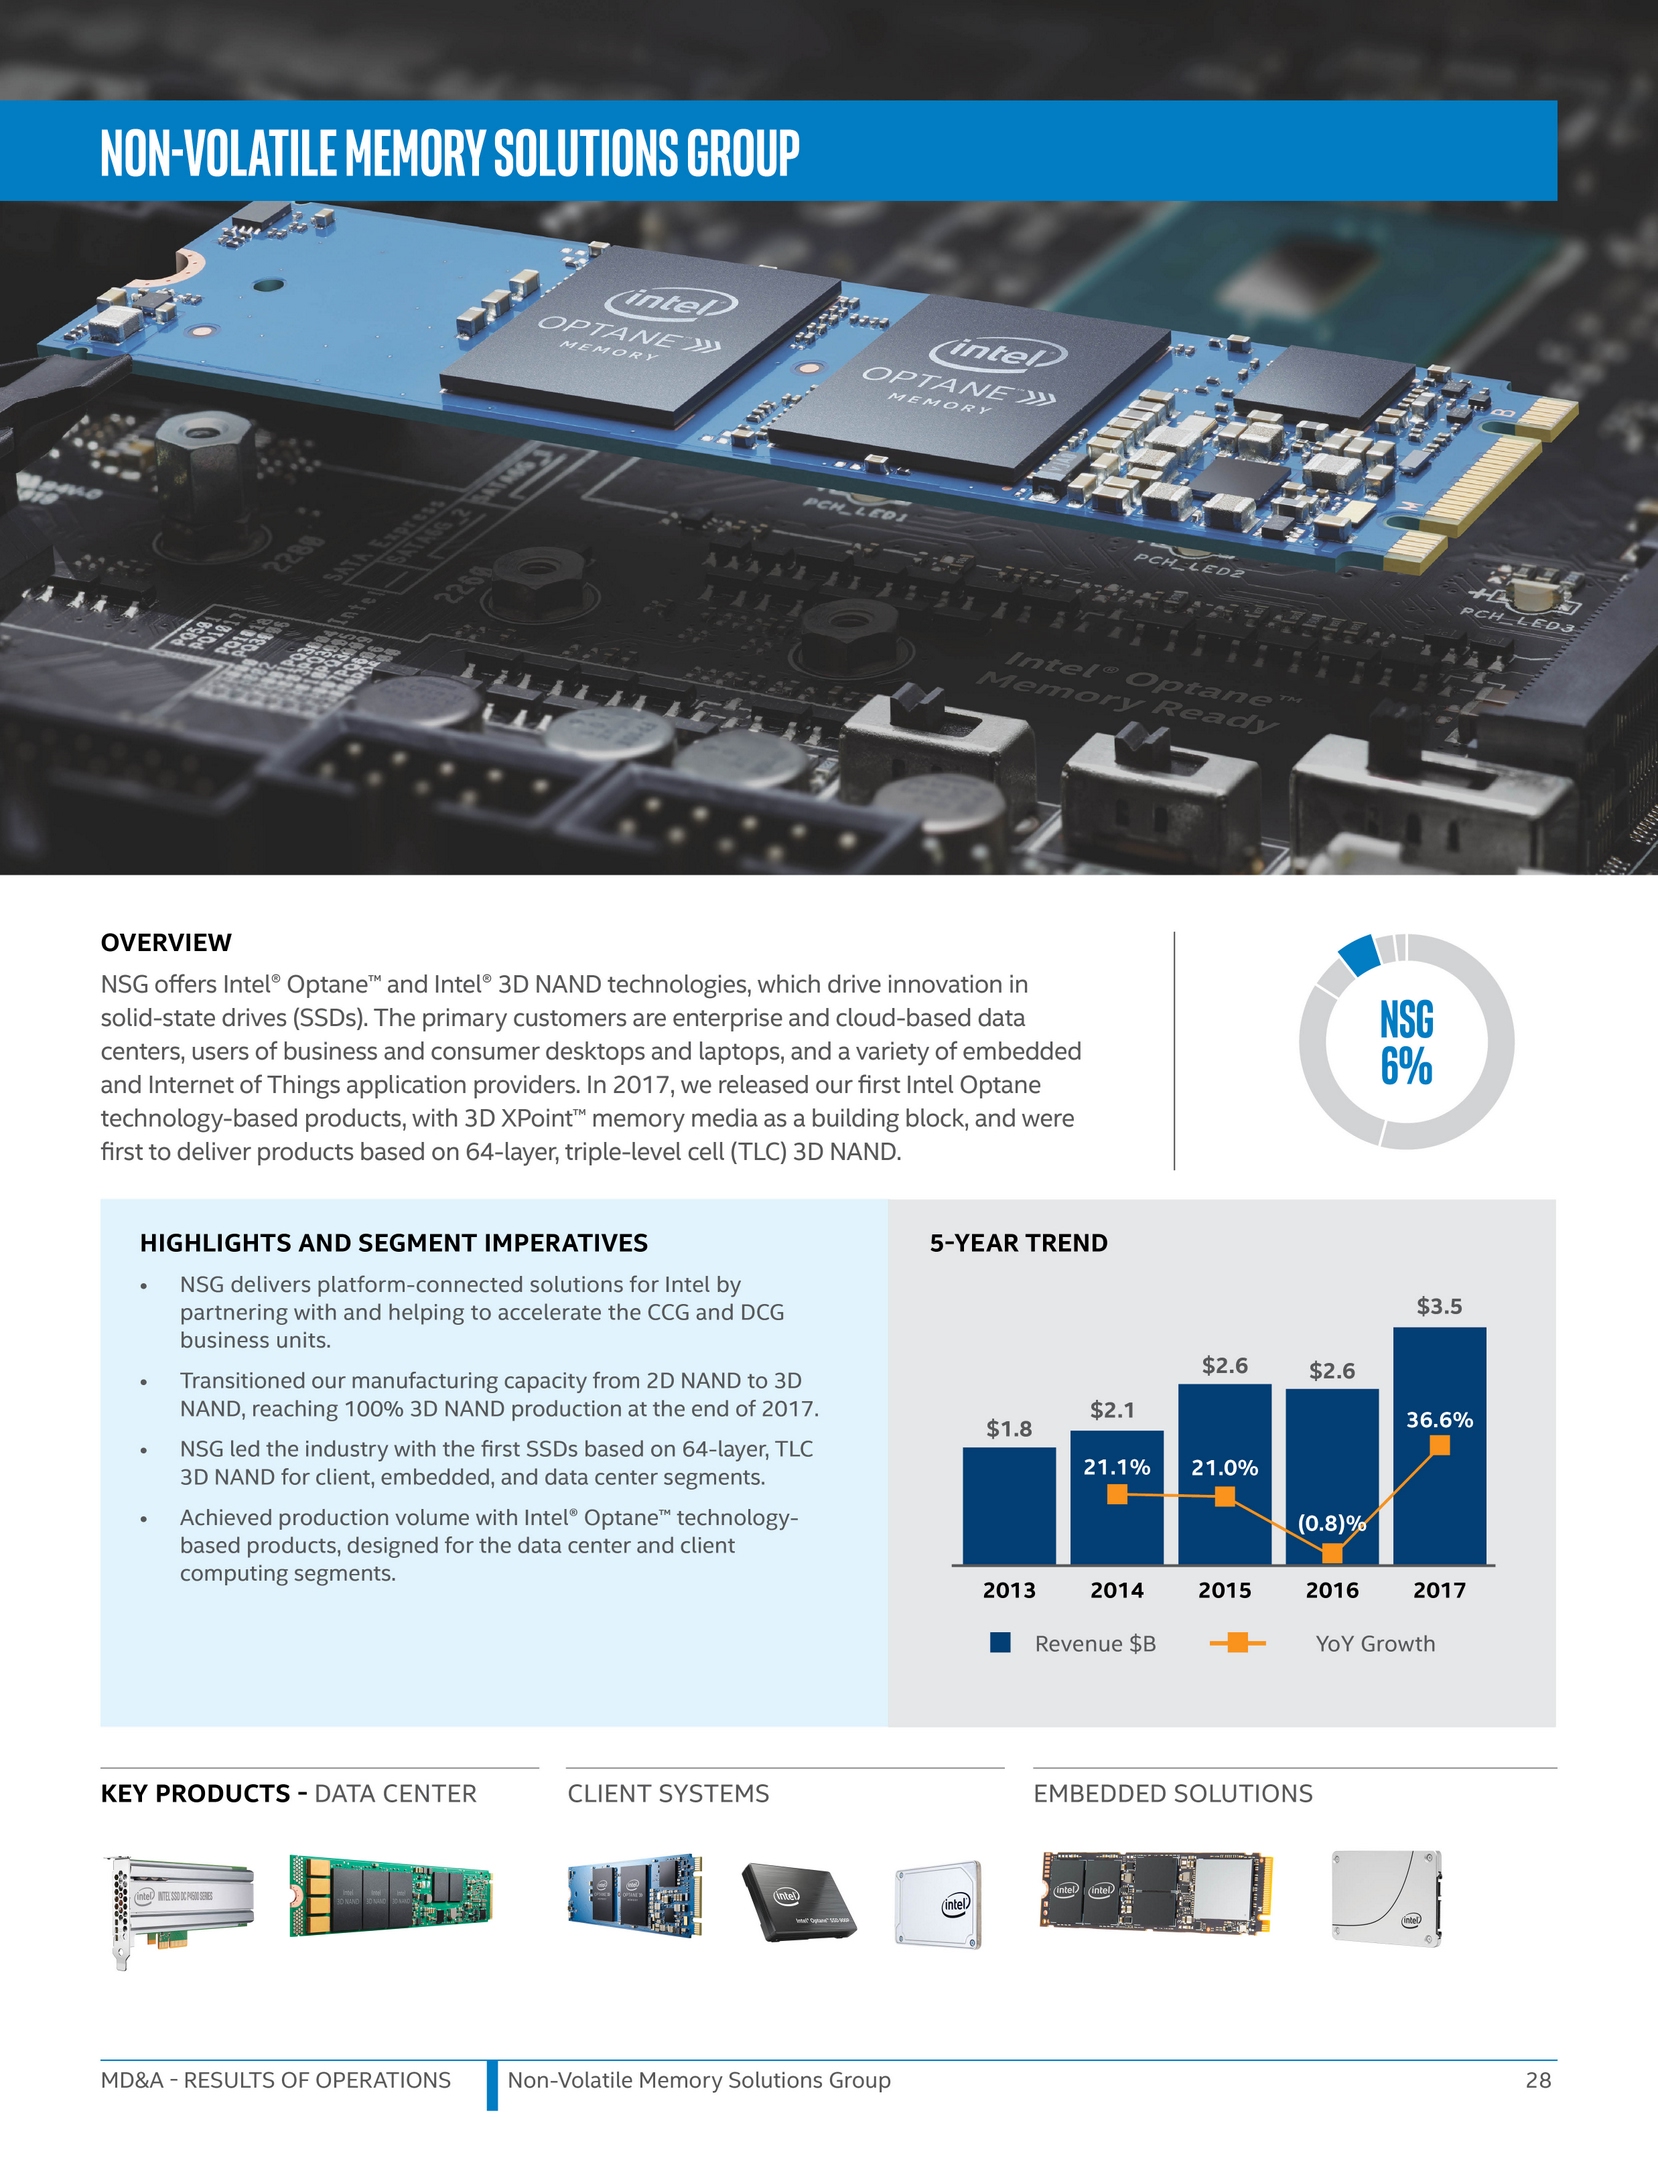
Table of Contents
MARKET AND BUSINESS OVERVIEW
Market trends and strategy
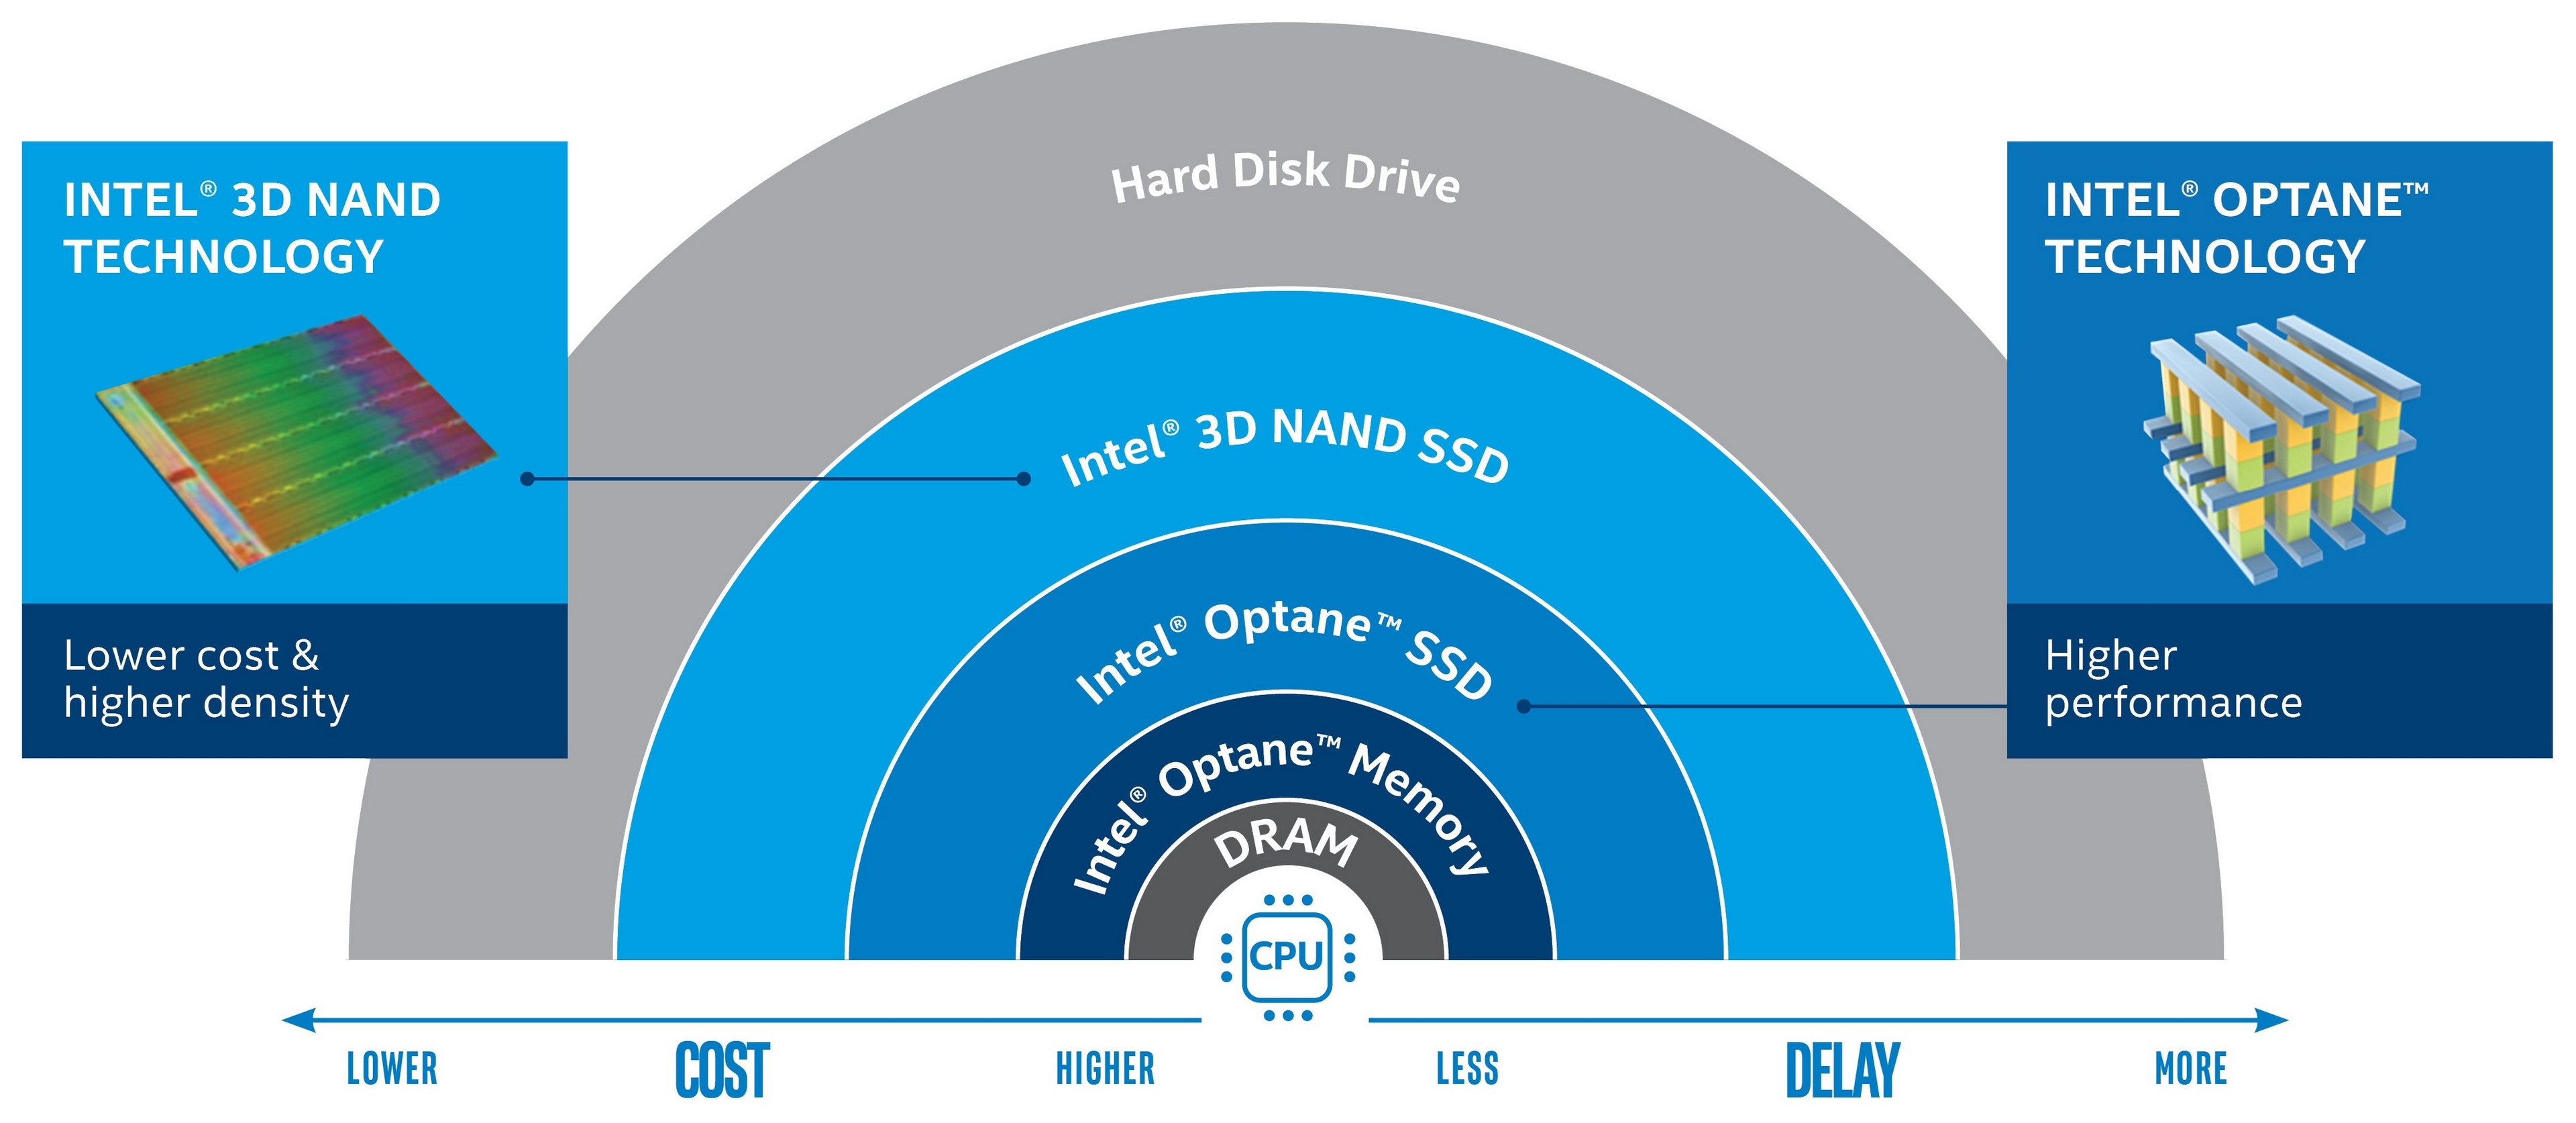
The world is grappling with increasing amounts of data created by such applications as social media, smart hospitals, airplanes, smart factories, and autonomous driving. This data all needs to be stored, accessed, and analyzed, easily and quickly. The TAM in 2017 for storage and memory is approximately $150 billion 1 . With our breadth of products, our focus is on segments that have a growing need for storage, including cloud service providers, financial services, high-performance computing, and Internet usage.
 | With data growth expanding, our customers face the challenge of getting critical, or "hot," data close to the CPU for rapid access. Intel's innovations in technology address the need for various storage tiers, based on different usages, while keeping a focus on performance and cost. As customers look to improve the performance of their storage and memory devices, we are seeing and leading a transition to the PCI Express* interface with Non-Volatile Memory Express* for SSDs. In the face of these growing volumes of data, Intel took on the exacting needs of data centers for growing capacity, easy serviceability, and thermal efficiency and announced our invention of the innovative "ruler" form factor that will solve customer requirements without the constraints of legacy form factors. The innovative ruler will enable up to one petabyte of storage in a single server rack unit. |
 | |
"Ruler" form factor | |
Products and competitiveness
Intel Optane technology is a major memory breakthrough with revolutionary performance profiles. This innovative technology combines the performance, density, power, non-volatility, and cost advantages of existing non-volatile memories with the attributes of conventional memories like DRAM. In 2017, we expanded our portfolio by delivering products based on Intel Optane technology, specifically Intel Optane memory, a PC system acceleration module, and highly responsive SSDs for both the data center and enthusiast markets.
Our Intel 3D NAND technology offers the highest density in the industry, enabling higher capacity media and more gigabytes per wafer. By transitioning our manufacturing capacity from a 2D NAND/3D NAND mix to 100% 3D NAND by the end of 2017, we helped drive a transformation in storage economics, with our cost-per-gigabyte approaching the cost of traditional hard disk drives. In 2017, we led the industry with the first 64-layer, TLC, 3D NAND SSDs for data center, client, and embedded segments.
1 Source: Storage and memory market opportunity is based on Forward Insights Q4'17 for Client and DC SSDs; DRAM Market Statistics, Worldwide, 2014-2021; Hard-Disk Drives, Worldwide, 2014-2021; NAND Flash Supply and Demand, Worldwide, 1Q16-4Q18. Note: DRAM and Hard-Disk Drives are excluded from Intel TAM of $260 billion in 2021.
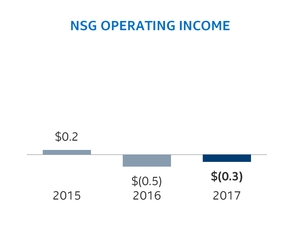
MD&A - RESULTS OF OPERATIONS | Non-Volatile Memory Solutions Group | 29 |
Table of Contents
Investing in the future
FINANCIAL PERFORMANCE
(Dollars in charts are shown in billions)
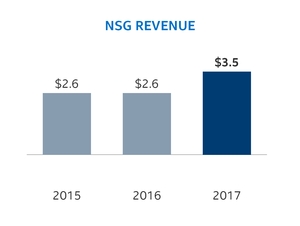
Revenue Summary
2017 vs. 2016 |
2016 vs. 2015 |
Operating Income Summary
2017 vs. 2016 |
2016 vs. 2015 |
MD&A - RESULTS OF OPERATIONS | Non-Volatile Memory Solutions Group | 30 |
Table of Contents
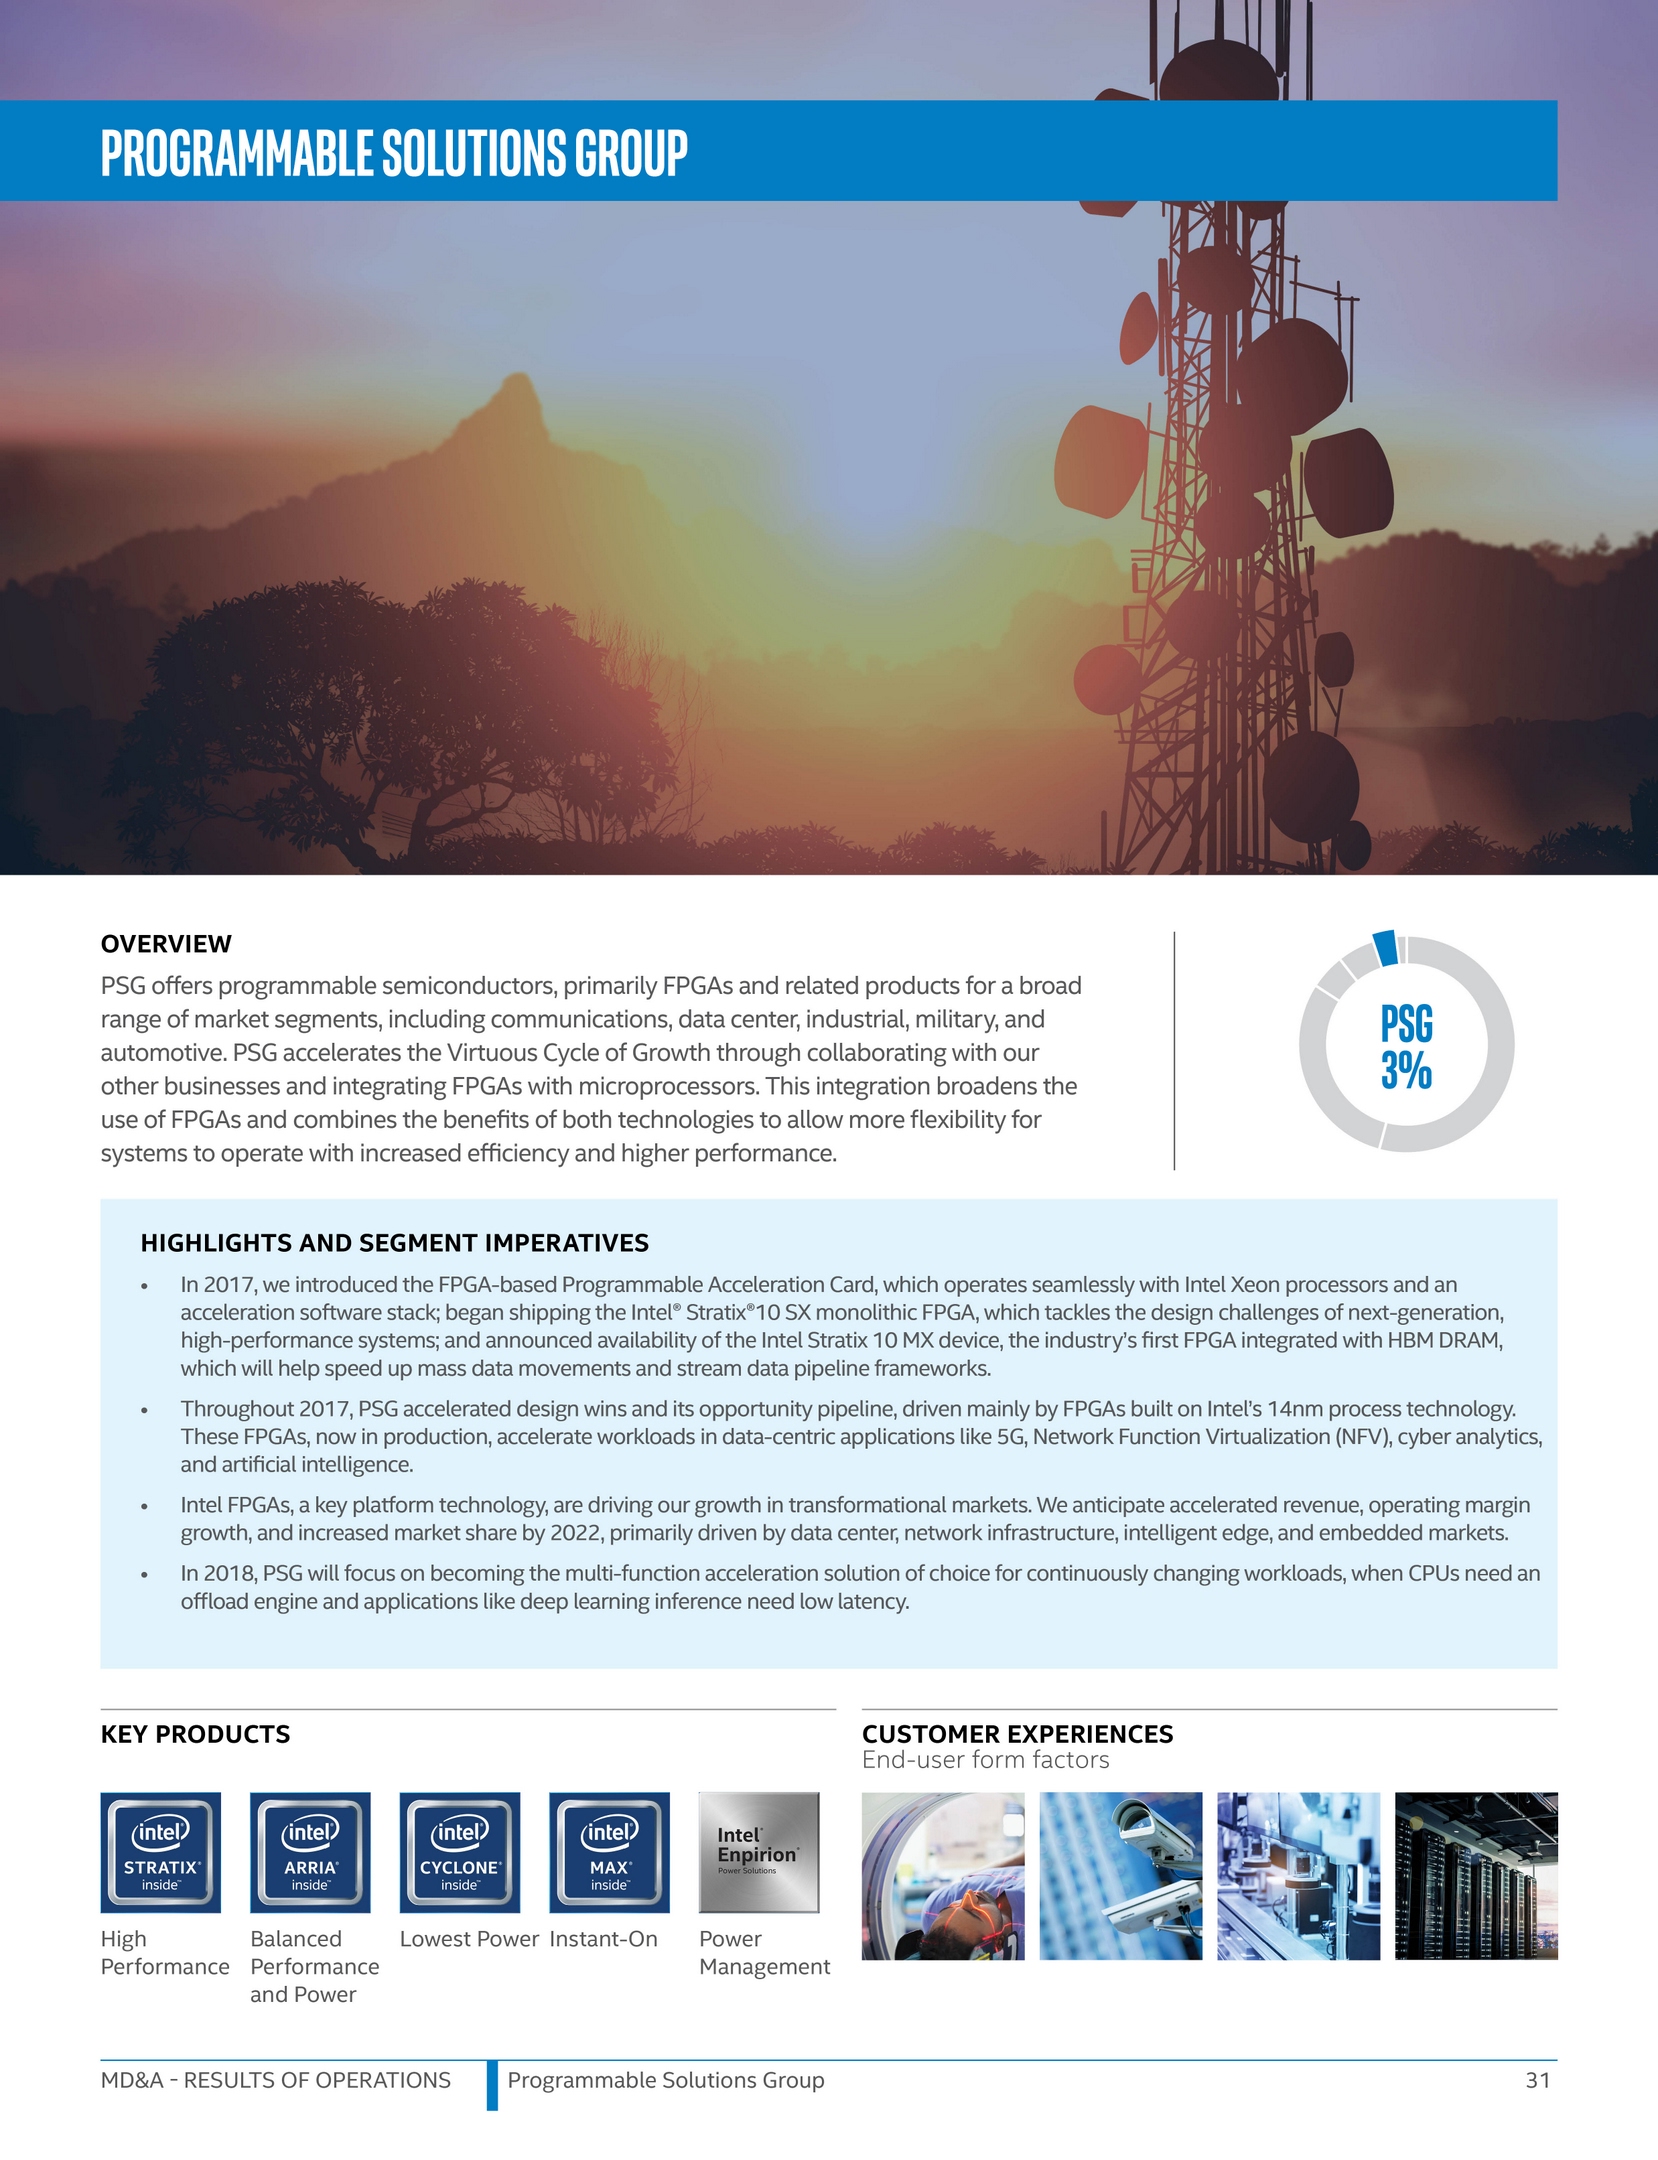
Table of Contents
MARKET AND BUSINESS OVERVIEW
Market trends and strategy
PSG delivers solutions in the programmable logic device (PLD) market, primarily FPGAs, to enable smarter and more connected systems. Our focus is on enabling a broad range of solutions, including in the data center, wireless, networking, automotive, military, medical, and industrial markets. We expect the PLD market to grow at 9% CAGR through 2021. 1 FPGAs are a key technology, enabling transformative applications such as AI, baseband processing and radio for 5G wireless connectivity, packet processing and virtual network functions offload for NFV, edge acceleration like video and vision for analytics and intelligence, and workload consolidation of things through fog computing for Industry 4.0.

Products and competitiveness
With the rise of pervasive connectivity and autonomous transactions, a vast network of devices and systems are linked from the edge through infrastructure to the cloud. The Intel ® FPGA portfolio enables this transformation with discrete FPGAs and software defined-hardware based multi-function acceleration cards that allow faster end-product development times, high performance, and power efficiency with overall lower total cost of ownership. In the cloud, where workloads shift dynamically and algorithms change, Intel FPGAs are the ideal solution for adapting to new demands through reconfigurability.
In 2017, PSG began shipping the industry's first high-density >1million logic elements ARM-based FPGA (Intel Stratix 10 SX FPGAs), which provide an ideal solution for 5G wireless communication, software defined radios, secure computing for military applications, NFV, and data center acceleration. In addition, we announced availability of the Intel Stratix 10 MX FPGA, the industry's first FPGA with integrated High Bandwidth Memory DRAM for high-performance computing, data centers, NFV, and broadcast applications. It enables the ability to compress and decompress data before or after mass data movements. To simplify and expedite the benefits of FPGA-accelerated solutions, PSG developed a combination of hardware platforms, a software acceleration stack, and ecosystem support in a compelling new approach and introduced the first in a family of Intel Programmable Acceleration Cards. These cards, when combined with an Acceleration Stack, plug easily into any Intel Xeon processor-based server and boost performance while minimizing power consumption for complex, data-intensive applications such as AI inference, video streaming analytics, database acceleration, and more.
1 Source: The PLD market growth is based on Gartner, Inc., 3Q17 Forecast Analysis; Electronics and Semiconductors, Worldwide, 2017-2021.
MD&A - RESULTS OF OPERATIONS | Programmable Solutions Group | 32 |
Table of Contents
FINANCIAL PERFORMANCE
(Dollars in charts are shown in billions)
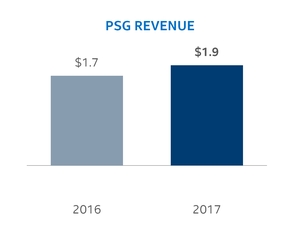
Revenue Summary
2017 vs. 2016 |
PSG revenue increased $233 million , driven by growth in industrial, military, and automotive market segments as well as in our advanced products and last-time buys of our legacy products. Also, in 2016 a one-time $99 million deferred revenue write-down due to the acquisition of Altera negatively impacted 2016 PSG revenue.
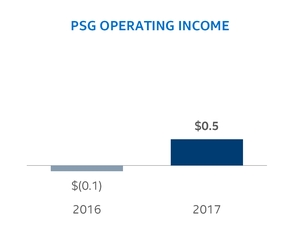
Operating Income Summary
2017 vs. 2016 |
PSG o perating income increased $562 million . Higher revenue and operational synergies contributed $111 million of the year over year increase. The remainder was due to one-time acquisition-related charges, including a $99 million deferred revenue write-down with a $64 million operating income impact and an inventory valuation adjustment of approximately $387 million.
MD&A - RESULTS OF OPERATIONS | Programmable Solutions Group | 33 |
Table of Contents
Restructuring and Other Charges
Years Ended |
| Dec 30, |
| Dec 31, |
| Dec 26, | ||||||
2016 Restructuring Program |
| $ | 135 | |
| $ | 1,823 | |
| $ | - | |
2015 and 2013 Restructuring Programs |
| - | |
| - | |
| 354 | | |||
ISecG separation costs and other charges |
| 249 | |
| 63 | |
| - | | |||
Total restructuring and other charges |
| $ | 384 | |
| $ | 1,886 | |
| $ | 354 | |
2016 RESTRUCTURING PROGRAM
We commenced the 2016 Restructuring Program in the second quarter of 2016. This program was completed in 2017.
Restructuring actions related to this program, which were approved in 2016, impacted approximately 16,000 employees. The charges incurred as part of the 2016 Restructuring Program resulted in net annual headcount savings of approximately $1.8 billion as we re-balanced our workforce. On an annual basis, $1.6 billion of these savings reduced our R&D and MG&A spending, and the remainder reduced our cost of sales. We began to realize these savings in Q2 2016 and most of these savings were realized by the end of 2017. We reallocated these savings to our growth segments, such as the data center and Internet of Things, and continue to invest in areas that extend our leadership in Moore's Law and expand market opportunities in areas such as memory and autonomous driving.
OTHER CHARGES
Other charges consist primarily of expenses associated with the divestiture of ISecG that was completed in Q2 2017.
For further information, see " Note 7: Restructuring and Other Charges " within the Consolidated Financial Statements.
Gains (Losses) on Equity Investments and Interest and Other, Net
Years Ended |
| Dec 30, |
| Dec 31, |
| Dec 26, | ||||||
Gains (losses) on equity investments, net |
| $ | 2,651 | |
| $ | 506 | |
| $ | 315 | |
Interest and other, net |
| $ | (235 | ) |
| $ | (444 | ) |
| $ | (105 | ) |
GAINS (LOSSES) ON EQUITY INVESTMENTS, NET
We recognized higher net realized gains on sales of a portion of our interest in ASML Holding N.V. (ASML) of $3.4 billion in 2017 compared to $407 million in 2016 . The higher net realized gains were partially offset by $833 million of impairment charges and our share of equity method investee losses in 2017.
We recognized higher net gains on equity investments in 2016 compared to 2015 primarily due to gains of $407 million related to sales of a portion of our interest in ASML.
INTEREST AND OTHER, NET
We recognized a lower net loss in interest and other in 2017 compared to 2016 primarily due to higher interest income in 2017.
We recognized a higher net loss in interest and other in 2016 compared to 2015 primarily due to higher interest expense from debt issued or acquired in 2015 and 2016, as well as lower capitalized interest due to lower eligible capital expenditures in 2016.
MD&A - RESULTS OF OPERATIONS | Consolidated Results and Analysis | 34 |
Table of Contents
Provision for Taxes
Years Ended |
| Dec 30, |
| Dec 31, |
| Dec 26, | ||||||
Income before taxes |
| $ | 20,352 | |
| $ | 12,936 | |
| $ | 14,212 | |
Provision for taxes |
| $ | 10,751 | |
| $ | 2,620 | |
| $ | 2,792 | |
Effective tax rate |
| 52.8 | % |
| 20.3 | % |
| 19.6 | % | |||
Substantially all of the increase in our effective tax rate in 2017 compared to 2016 was driven by the one-time provisional impacts from the U.S. Tax Cuts and Jobs Act (Tax Reform) that was enacted in December 2017, the 2017 ISecG divestiture, and a higher proportion of our income in higher tax rate jurisdictions. In addition to the one-time impacts from Tax Reform, we expect the new legislation will significantly lower our effective tax rate starting in 2018. For further information on Tax Reform and its impacts, see " Note 8: Income Taxes " within the Consolidated Financial Statements.
The majority of the increase in our effective tax rate in 2016 compared to 2015 was driven by one-time items and our 2015 decision to indefinitely reinvest some of our prior years' non-U.S. earnings, partially offset by a higher proportion of our income in lower tax jurisdictions.
Liquidity and Capital Resources
(Dollars in Millions) |
| Dec 30, |
| Dec 31, | ||||
Cash and cash equivalents, short-term investments, and trading assets |
| $ | 14,002 | |
| $ | 17,099 | |
Other long-term investments |
| $ | 3,712 | |
| $ | 4,716 | |
Loans receivable and other |
| $ | 1,097 | |
| $ | 996 | |
Reverse repurchase agreements with original maturities greater than three months |
| $ | 250 | |
| $ | 250 | |
Total debt |
| $ | 26,813 | |
| $ | 25,283 | |
Temporary equity |
| $ | 866 | |
| $ | 882 | |
Debt as a percentage of permanent stockholders' equity |
| 38.8 | % |
| 38.2 | % | ||
Cash generated by operations is our primary source of liquidity. We maintain a diverse investment portfolio that we continually analyze based on issuer, industry, and country. When assessing our sources of liquidity, we include investments as shown in the preceding table. Substantially all of our investments in debt instruments and financing receivables are in investment-grade securities.
Other potential sources of liquidity include our commercial paper program and our automatic shelf registration statement on file with the SEC, pursuant to which we may offer an unspecified amount of debt, equity, and other securities. Under our commercial paper program, we have an ongoing authorization from our Board of Directors to borrow up to $10.0 billion . This amount includes an increase of $5.0 billion in the authorization limit approved by our Board of Directors in April 2017. No commercial paper remained outstanding as of December 30, 2017 . During 2017, we issued a total of $7.7 billion aggregate principal amount of senior notes. Additionally, we redeemed our $1.0 billion , 4.90% senior notes due August 2045 . We used the net proceeds from the offerings of the notes to finance a portion of the redemption price of our 4.90% senior notes due August 2045 and for general corporate purposes. During 2017, we repaid $500 million of our 1.75% senior notes that matured in May 2017 , and $3.0 billion of our 1.35% senior notes that matured in December 2017 . In Q4 2017, we paid $2.8 billion in cash to convert our $1.6 billion 2.95% junior subordinated convertible debentures due 2035.
The enactment of Tax Reform in December 2017, imposes a tax on all previously untaxed earnings of non-U.S. subsidiaries of U.S. corporations. Future distributions of non-U.S. assets to the U.S. will no longer be subject to U.S. taxation. As a result, we recognized a one-time provisional transition tax expense of $6.1 billion . We expect to pay the tax over a period of eight years based on a defined payment schedule and believe that our current U.S. sources of cash and liquidity are sufficient to meet our tax liability.
As of December 30, 2017 , $8.4 billion of our $14.0 billion of cash and cash equivalents, short-term investments, and trading assets was held by our non-U.S. subsidiaries.
During Q3 2017, we acquired 97.3% of Mobileye's outstanding ordinary shares for $14.5 billion net cash. We funded the acquisition of shares, and expect to fund the acquisition of the remaining shares, with cash held by our non-U.S. subsidiaries.
MD&A - RESULTS OF OPERATIONS | Consolidated Results and Analysis | 35 |
Table of Contents
During Q2 2017, we completed the divestiture of our ISecG business for total consideration of $4.2 billion . The consideration included cash proceeds of $924 million and $2.2 billion in the form of promissory notes. During Q3 2017, McAfee and TPG VII Manta Holdings, L.P., now known as Manta Holdings, L.P. (TPG) repaid the $2.2 billion of promissory notes and McAfee paid us a $735 million dividend.
We believe we have sufficient financial resources to meet our business requirements in the next 12 months, including capital expenditures for worldwide manufacturing and assembly and test; working capital requirements; and potential dividends, common stock repurchases, acquisitions, and strategic investments.
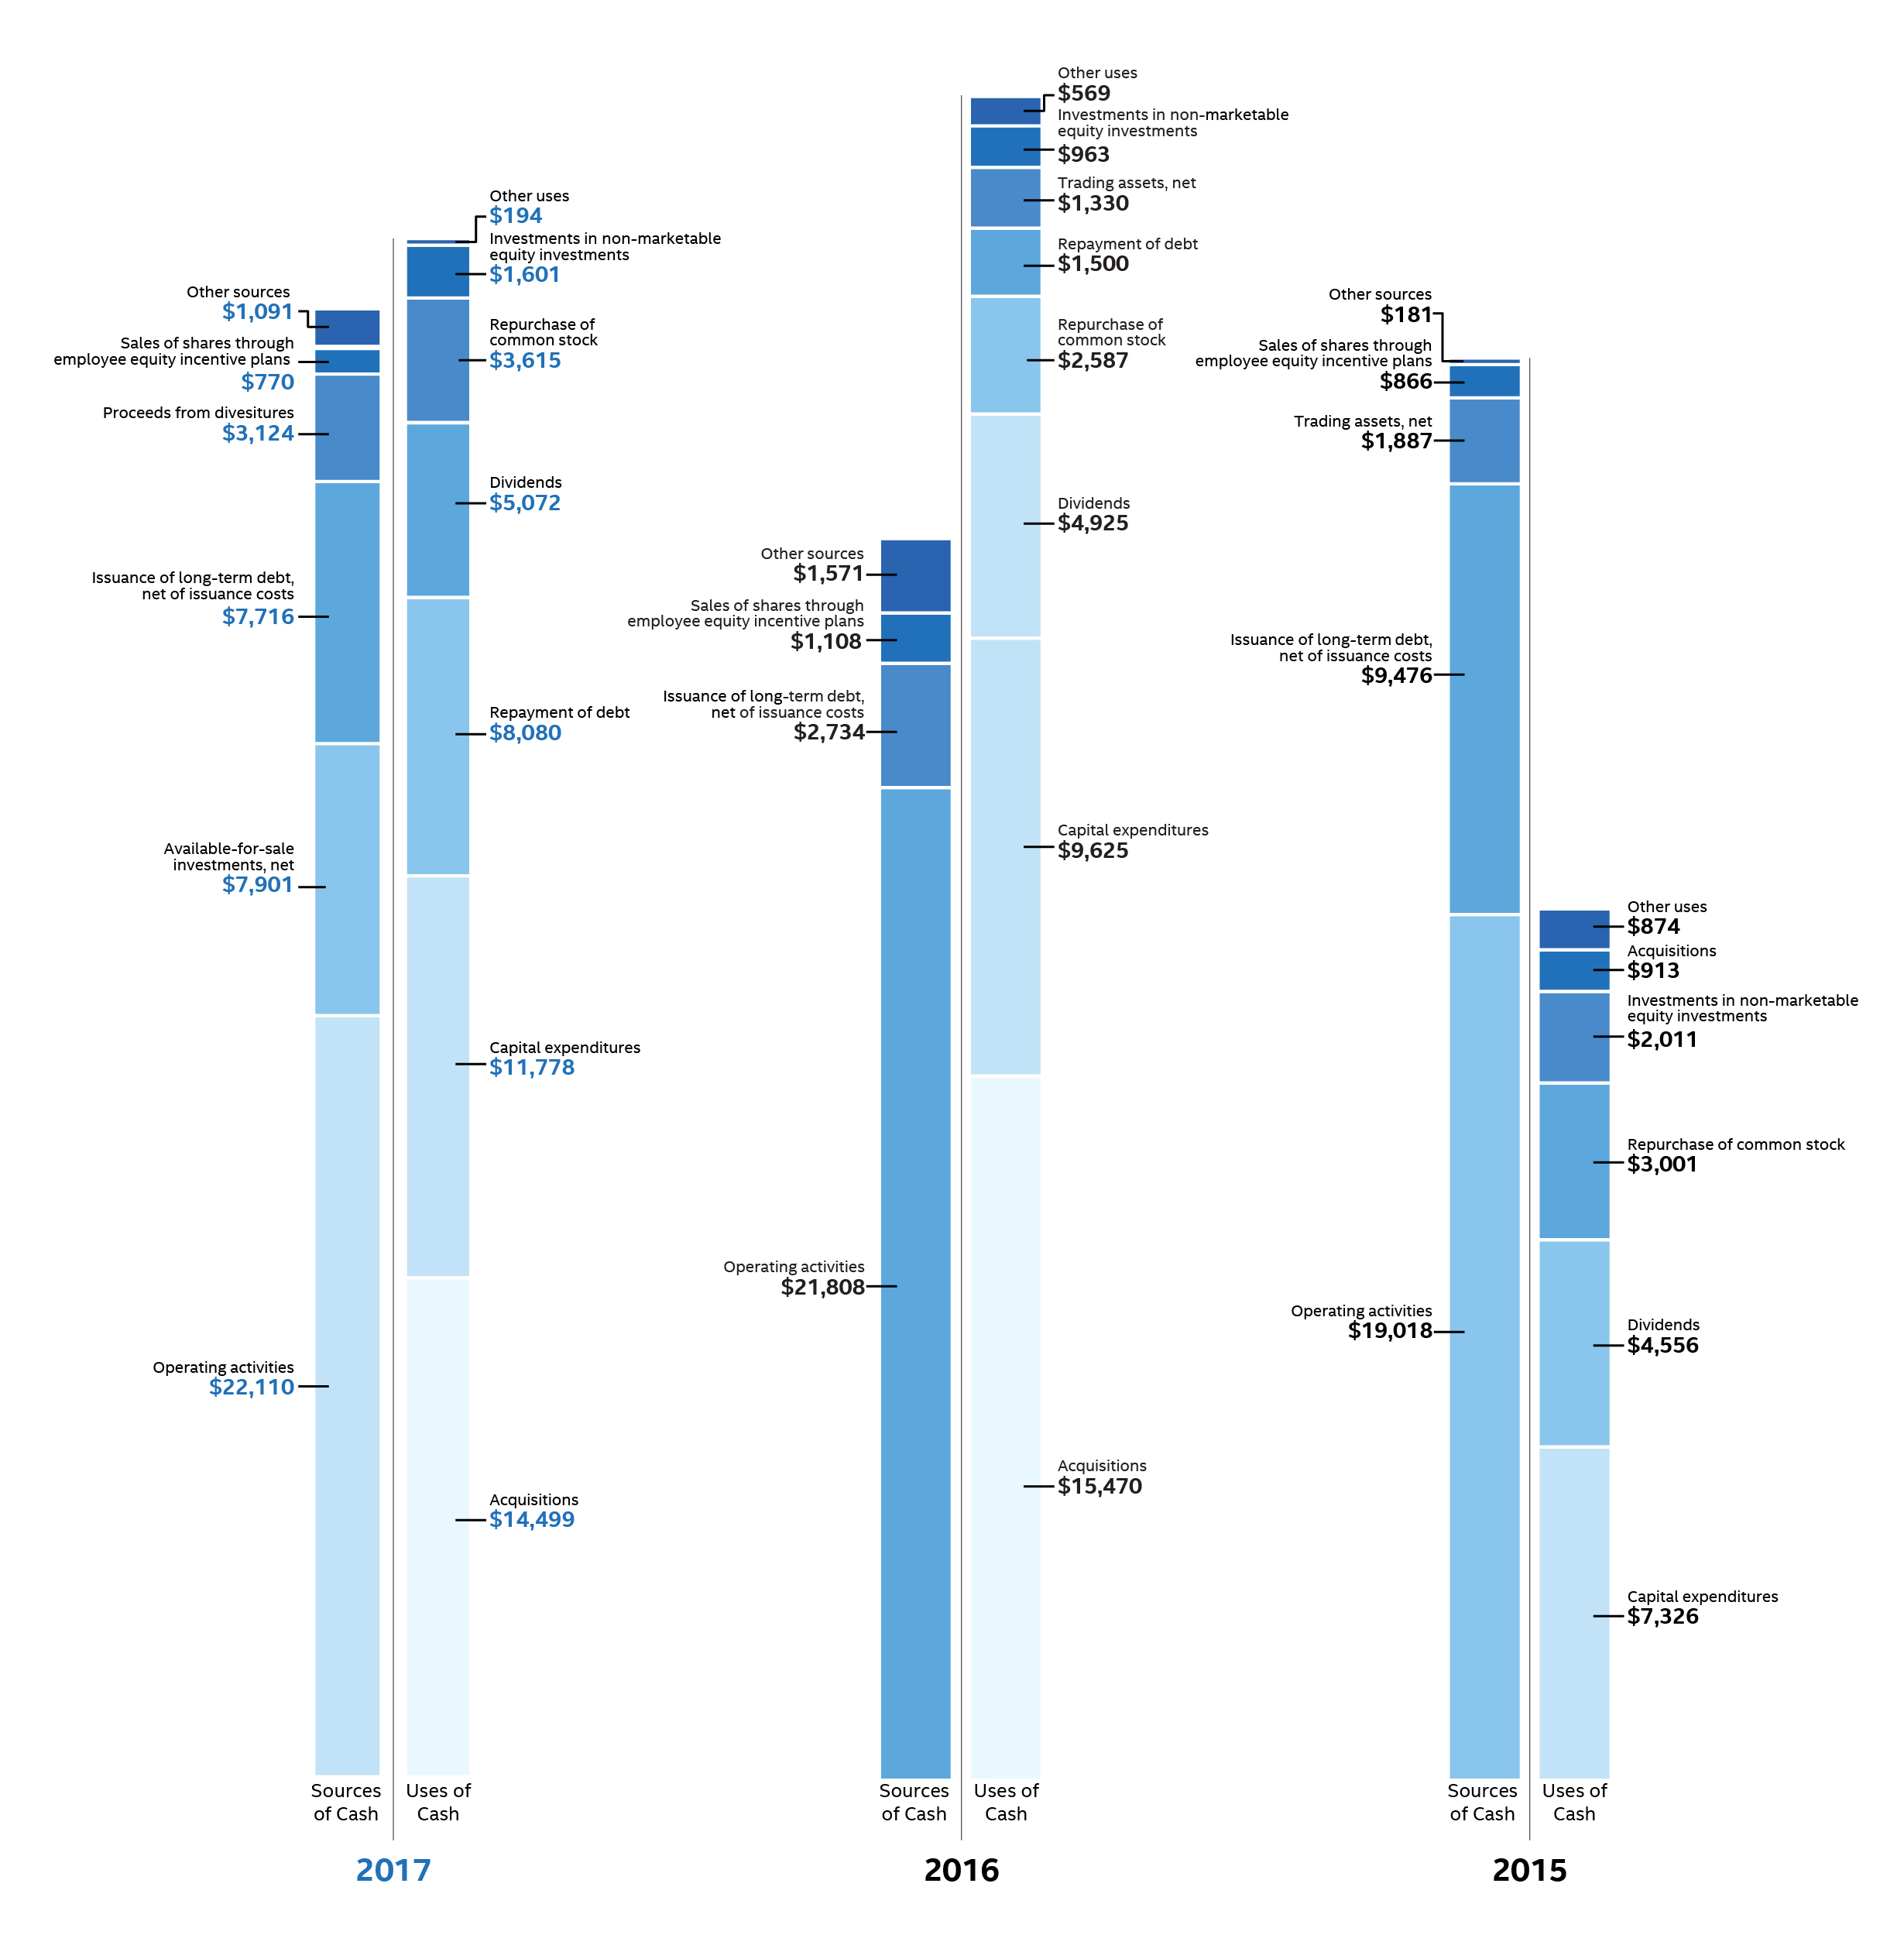
SOURCES AND USES OF CASH (In Millions) |
MD&A - RESULTS OF OPERATIONS | Consolidated Results and Analysis | 36 |
Table of Contents
Years Ended |
| Dec 30, |
| Dec 31, |
| Dec 26, | ||||||
Net cash provided by operating activities |
| $ | 22,110 | |
| $ | 21,808 | |
| $ | 19,018 | |
Net cash used for investing activities |
| (15,762 | ) |
| (25,817 | ) |
| (8,183 | ) | |||
Net cash provided by (used for) financing activities |
| (8,475 | ) |
| (5,739 | ) |
| 1,912 | | |||
Net increase (decrease) in cash and cash equivalents |
| $ | (2,127 | ) |
| $ | (9,748 | ) |
| $ | 12,747 | |
OPERATING ACTIVITIES
Cash provided by operating activities is net income adjusted for certain non-cash items and changes in assets and liabilities.
For 2017 compared to 2016 , the $302 million increase in cash provided by operating activities was due to changes to working capital partially offset by adjustments for non-cash items and lower net income. Tax Reform did not have an impact on our 2017 cash provided by operating activities. The increase in cash provided by operating activities was driven by increased income before taxes and $1.0 billion receipts of customer deposits. These increases were partially offset by increased inventory and accounts receivable. Income taxes paid, net of refunds, in 2017 compared to 2016 were $2.9 billion higher due to higher income before taxes, taxable gains on sales of ASML, and taxes on the ISecG divestiture. We expect approximately $2.0 billion of additional customer deposits in 2018.
For 2016 compared to 2015 , the $2.8 billion increase in cash provided by operating activities was due to adjustments for non-cash items and changes in working capital, partially offset by lower net income. The adjustments for non-cash items were higher in 2016 primarily due to restructuring and other charges and the change in deferred taxes, partially offset by lower depreciation.
INVESTING ACTIVITIES
Investing cash flows consist primarily of capital expenditures; investment purchases, sales, maturities, and disposals; and proceeds from divestitures and cash used for acquisitions. Our capital expenditures were $11.8 billion in 2017 ( $9.6 billion in 2016 and $7.3 billion in 2015 ).
The decrease in cash used for investing activities in 2017 compared to 2016 was primarily due to higher net activity of available-for sale-investments in 2017, proceeds from our divestiture of ISecG in 2017, and higher maturities and sales of trading assets in 2017. This activity was partially offset by higher capital expenditures in 2017.
The increase in cash used for investing activities in 2016 compared to 2015 was primarily due to our completed acquisition of Altera, net purchases of trading assets in 2016 compared to net sales of trading assets in 2015, and higher capital expenditures in 2016. This increase was partially offset by lower investments in non-marketable equity investments.
FINANCING ACTIVITIES
Financing cash flows consist primarily of repurchases of common stock, payment of dividends to stockholders, issuance and repayment of short-term and long-term debt, and proceeds from the sale of shares of common stock through employee equity incentive plans.
The increase in cash used for financing activities in 2017 compared to 2016 was primarily due to net long-term debt activity, which was a use of cash in 2017 compared to a source of cash in 2016. During 2017 , we repurchased $3.6 billion of common stock under our authorized common stock repurchase program, compared to $2.6 billion in 2016 . As of December 30, 2017 , $13.2 billion remained available for repurchasing common stock under the existing repurchase authorization limit. We base our level of common stock repurchases on internal cash management decisions, and this level may fluctuate. Proceeds from the sale of common stock through employee equity incentive plans totaled $770 million in 2017 compared to $1.1 billion in 2016 . Our total dividend payments were $5.1 billion in 2017 compared to $4.9 billion in 2016 . We have paid a cash dividend in each of the past 101 quarters. In January 2018 , our Board of Directors approved an increase to our cash dividend to $1.20 per share on an annual basis. The board has declared a quarterly cash dividend of $0.30 per share of common stock for Q1 2018 . The dividend is payable on March 1, 2018 to stockholders of record on February 7, 2018 .
Cash was used for financing activities in 2016 compared to cash provided by financing activities in 2015 , primarily due to fewer debt issuances and the repayment of debt in 2016. This activity was partially offset by repayment of commercial paper in 2015 and fewer common stock repurchases in 2016.
MD&A - RESULTS OF OPERATIONS | Consolidated Results and Analysis | 37 |
Table of Contents
Contractual Obligations
|
| Payments Due by Period | ||||||||||||||||||
(In Millions) |
| Total |
| Less Than 1 Year |
| 1–3 Years |
| 3–5 Years |
| More Than 5 Years | ||||||||||
Operating lease obligations |
| $ | 1,245 | |
| $ | 215 | |
| $ | 348 | |
| $ | 241 | |
| $ | 441 | |
Capital purchase obligations 1 |
| 12,068 | |
| 9,689 | |
| 2,266 | |
| 113 | |
| - | | |||||
Other purchase obligations and commitments 2 |
| 2,692 | |
| 1,577 | |
| 1,040 | |
| 55 | |
| 20 | | |||||
Tax obligations 3 |
| 6,120 | |
| 490 | |
| 979 | |
| 979 | |
| 3,672 | | |||||
Long-term debt obligations 4 |
| 42,278 | |
| 1,495 | |
| 5,377 | |
| 8,489 | |
| 26,917 | | |||||
Other long-term liabilities 5 |
| 1,544 | |
| 799 | |
| 422 | |
| 190 | |
| 133 | | |||||
Total 6 |
| $ | 65,947 | |
| $ | 14,265 | |
| $ | 10,432 | |
| $ | 10,067 | |
| $ | 31,183 | |
1 | Capital purchase obligations represent commitments for the construction or purchase of property, plant and equipment. They were not recorded as liabilities on our consolidated balance sheets as of December 30, 2017 , as we had not yet received the related goods nor taken title to the property. |
2 | Other purchase obligations and commitments include payments due under various types of licenses and agreements to purchase goods or services, as well as payments due under non-contingent funding obligations. |
3 | Tax obligations represent the future cash payments related to Tax Reform enacted in 2017 for the one-time provisional transition tax on our previously untaxed foreign earnings. For further information, see " Note 8: Income Taxes " within the Consolidated Financial Statements. |
4 | Amounts represent principal and interest cash payments over the life of the debt obligations, including anticipated interest payments that are not recorded on our consolidated balance sheets. Debt obligations are classified based on their stated maturity date, regardless of their classification on the consolidated balance sheet s. Any future settlement of convertible debt would impact our cash payments. |
5 | Amounts represent future cash payments to satisfy other long-term liabilities recorded on our consolidated balance sheets, including the short-term portion of these long-term liabilities. Derivative instruments are excluded from the preceding table, as they do not represent the amounts that may ultimately be paid. |
6 | Total excludes contractual obligations already recorded on our consolidated balance sheets as current liabilities, except for the short-term portions of long-term debt obligations and other long-term liabilities. |
The expected timing of payments of the obligations in the preceding table is estimated based on current information. Timing of payments and actual amounts paid may be different, depending on the time of receipt of goods or services, or changes to agreed-upon amounts for some obligations.
Contractual obligations for purchases of goods or services included in "Other purchase obligations and commitments" in the preceding table include agreements that are enforceable and legally binding on Intel and that specify all significant terms, including fixed or minimum quantities to be purchased; fixed, minimum, or variable price provisions; and the approximate timing of the transaction. For obligations with cancellation provisions, the amounts included in the preceding table were limited to the non-cancelable portion of the agreement terms or the minimum cancellation fee.
For the purchase of raw materials, we have entered into certain agreements that specify minimum prices and quantities based on a percentage of the total available market or based on a percentage of our future purchasing requirements. Due to the uncertainty of the future market and our future purchasing requirements, as well as the non-binding nature of these agreements, obligations under these agreements have been excluded from the preceding table. Our purchase orders for other products are based on our current manufacturing needs and are fulfilled by our vendors within short time horizons. In addition, some of our purchase orders represent authorizations to purchase rather than binding agreements.
Contractual obligations that are contingent upon the achievement of certain milestones have been excluded from the preceding table. Most of our milestone-based contracts are tooling related for the purchase of capital equipment. These arrangements are not considered contractual obligations until the milestone is met by the counterparty. As of December 30, 2017 , assuming that all future milestones are met, the additional required payments would be approximately $2.0 billion .
For the majority of restricted stock units (RSUs) granted, the number of shares of common stock issued on the date the RSUs vest is net of the minimum statutory withholding requirements that we pay in cash to the appropriate taxing authorities on behalf of our employees. The obligation to pay the relevant taxing authority is excluded from the preceding table, as the amount is contingent upon continued employment. In addition, the amount of the obligation is unknown, as it is based in part on the market price of our common stock when the awards vest.
MD&A - RESULTS OF OPERATIONS | Consolidated Results and Analysis | 38 |
Table of Contents
During 2014, we entered into a series of agreements with Tsinghua Unigroup Ltd. (Tsinghua Unigroup), an operating subsidiary of Tsinghua Holdings Co. Ltd., to, among other things, jointly develop Intel architecture and communications-based solutions for phones. Subject to regulatory approvals and other closing conditions, we have agreed to invest up to $9.0 billion Chinese yuan (approximately $1.5 billion as of the date of the agreement) for a minority stake of approximately 20% of Beijing UniSpreadtrum Technology Ltd. (UniSpreadtrum). During 2015, we invested $966 million to complete the first phase of the equity investment and the second phase of the investment will require additional funding of approximately $500 million ; however, as our obligation is contingent upon regulatory approvals and other closing conditions, it has been excluded from the preceding table.
QUANTITATIVE AND QUALITATIVE DISCLOSURES ABOUT MARKET RISK
We are affected by changes in currency exchange and interest rates, as well as equity and commodity prices. Our risk management programs reduce, but may not entirely eliminate, the impacts of these risks. All of the following potential changes are based on sensitivity analyses performed on our financial positions as of December 30, 2017 and December 31, 2016 . Actual results may differ materially.
CURRENCY EXCHANGE RATES
We are exposed to currency exchange risks of non-U.S.-dollar-denominated investments in debt instruments and loans receivable, and may economically hedge this risk with foreign currency contracts, such as currency forward contracts or currency interest rate swaps. Gains or losses on these non-U.S.-currency investments are generally offset by corresponding losses or gains on the related hedging instruments. We are exposed to currency exchange risks from our non-U.S.-dollar-denominated debt indebtedness and may use foreign currency contracts designated as cash flow hedges to manage this risk.
Substantially all of our revenue is transacted in U.S. dollars. However, a significant portion of our operating expenditures and capital purchases are incurred in other currencies, primarily the euro, the Japanese yen, the Israeli shekel, and the Chinese yuan . We have established currency risk management programs to protect against currency exchange rate risks associated with non-U.S. dollar forecasted future cash flows and existing non-U.S. dollar monetary assets and liabilities. We may also hedge currency risk arising from funding of foreign currency-denominated future investments. We may utilize foreign currency contracts, such as currency forwards or option contracts in these hedging programs. We considered the historical trends in currency exchange rates and determined that it was reasonably possible that a weighted average adverse change of 20% in currency exchange rates could be experienced in the near term. Such an adverse change, after taking into account balance sheet hedges only and offsetting recorded monetary asset and liability positions, would have resulted in an adverse impact on income before taxes of less than $95 million as of December 30, 2017 (less than $80 million as of December 31, 2016 ).
INTEREST RATES
We are exposed to interest rate risk related to our fixed-rate investment portfolio and outstanding debt. The primary objective of our investment policy is to preserve principal and the financial flexibility to fund our business while maximizing yields, which generally track the U.S. dollar three-month LIBOR. We generally enter into interest rate contracts to convert the returns on our fixed-rate debt investment with remaining maturities longer than six months into U.S. dollar three-month LIBOR-based returns. We may enter into swaps to convert fixed-rate coupon payments into floating-rate coupon payments for our existing indebtedness. Gains or losses on these instruments are generally offset by corresponding losses or gains on the related hedging instruments.
A hypothetical decrease in benchmark interest rates of up to 1.0% , after taking into account investment hedges, would have resulted in an increase in the fair value of our investment portfolio of approximately $100 million as of December 30, 2017 (an increase of approximately $100 million as of December 31, 2016 ). After taking into account interest rate and currency swaps, a hypothetical decrease in interest rates of up to 1.0% would have resulted in an increase in the fair value of our indebtedness of approximately $1.6 billion as of December 30, 2017 (an increase of approximately $1.3 billion as of December 31, 2016 ). The fluctuations in fair value of our investment portfolio and indebtedness reflect only the direct impact of the change in interest rates. Other economic variables, such as equity market fluctuations and changes in relative credit risk, could result in a significantly higher fluctuation in the fair value of our net investment position.
EQUITY PRICES
Our investments include marketable equity securities and equity derivative instruments. We typically do not attempt to reduce or eliminate our equity market exposure through hedging activities at the inception of our investments. In the event we do decide to enter into hedge arrangements, before doing so we evaluate legal, market, and economic factors, as well as the expected timing of disposal, to determine whether hedging is appropriate. Our equity market risk management program may include equity derivatives with or without hedge accounting designation that utilize warrants, equity options, or other equity derivatives.
We also utilize total return swaps to offset changes in liabilities related to the equity market risks of certain deferred compensation arrangements. Gains or losses from changes in fair value of these total return swaps are generally offset by the losses or gains on the related liabilities.
MD&A - RESULTS OF OPERATIONS | Consolidated Results and Analysis | 39 |
Table of Contents
As of December 30, 2017 , the fair value of our marketable equity investments and our equity derivative instruments, including hedging positions, was $4.2 billion ( $6.2 billion as of December 31, 2016 ). A substantial majority of our marketable equity investments portfolio as of December 30, 2017 was concentrated in our investment in ASML of $3.6 billion ( $6.1 billion as of December 31, 2016 ). Our marketable equity method investments are excluded from our analysis, as the carrying value does not fluctuate based on market price changes unless an impairment is deemed necessary. To determine reasonably possible decreases in the market value of our marketable equity investments, we have analyzed the historical market price sensitivity of our marketable equity investment portfolio. Assuming a decline of 25% in market prices, and after reflecting the impact of hedges and offsetting positions, the aggregate value of our marketable equity investments could decrease by approximately $1.1 billion , based on the value as of December 30, 2017 (a decrease in value of approximately $1.9 billion , based on the value as of December 31, 2016 using an assumed decline of 30% ). Beginning in 2018, as explained in " Note 3: Recent Accounting Standards " within the Consolidated Financial Statements, changes in the fair value of our marketable equity securities will be measured and recorded at fair value with changes in fair value recorded through the income statement.
Many of the same factors that could result in an adverse movement of equity market prices affect our non-marketable equity investments, although we cannot always quantify the impacts directly. Financial markets are volatile, which could negatively affect the prospects of the companies we invest in, their ability to raise additional capital, and the likelihood of our ability to realize value in our investments through liquidity events such as initial public offerings, mergers, and private sales. These types of investments involve a great deal of risk, and there can be no assurance that any specific company will grow or become successful; consequently, we could lose all or part of our investment. Our non-marketable cost method equity investments had a carrying amount of $2.6 billion as of December 30, 2017 ( $3.1 billion as of December 31, 2016 ) and included our investment in UniSpreadtrum of $658 million ( $966 million for UniSpreadtrum as of December 31, 2016 ). The carrying amount of our non-marketable equity method investments was $1.9 billion as of December 30, 2017 ( $1.3 billion as of December 31, 2016 ). A substantial majority of our non-marketable equity method investments balance as of December 30, 2017 was concentrated in our IMFT investment of $1.5 billion ( $849 million for IMFT as of December 31, 2016 ).
COMMODITY PRICE RISK
Although we operate facilities that consume commodities, we are not directly affected by commodity price risk to a material degree. We have established forecasted transaction risk management programs to protect against fluctuations in commodity prices. We may use commodity derivatives contracts, such as commodity swaps, in these hedging programs. In addition, we have sourcing plans in place that mitigate the risk of a potential supplier concentration for our key commodities.
MD&A - RESULTS OF OPERATIONS | Consolidated Results and Analysis | 40 |
Table of Contents
Other key information |
Stock Performance Graph
The graph and table that follow compare the cumulative total stockholder return on Intel's common stock with the cumulative total return of the Dow Jones U.S. Technology Index* and the Standard & Poor's 500 Stock Index (S&P 500 Index*) for the five years ended December 30, 2017 . The cumulative returns shown on the graph are based on Intel's fiscal year.
Comparison of Five-Year Cumulative Return for Intel,
The Dow Jones U.S. Technology Index*, and the S&P 500 Index*
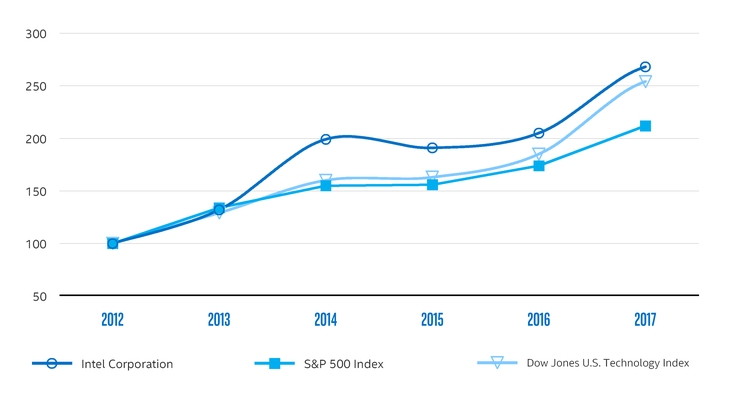
Years Ended |
| Dec 29, |
| Dec 28, |
| Dec 27, |
| Dec 26, |
| Dec 31, |
| Dec 30, | ||||||||||||
Intel Corporation |
| $ | 100 | |
| $ | 132 | |
| $ | 199 | |
| $ | 191 | |
| $ | 205 | |
| $ | 268 | |
Dow Jones U.S. Technology Index |
| $ | 100 | |
| $ | 129 | |
| $ | 160 | |
| $ | 163 | |
| $ | 185 | |
| $ | 254 | |
S&P 500 Index |
| $ | 100 | |
| $ | 134 | |
| $ | 155 | |
| $ | 156 | |
| $ | 174 | |
| $ | 212 | |
1 | The graph and table assume that $100 was invested on the last day of trading for the fiscal year December 29, 2012 in Intel's common stock, the Dow Jones U.S. Technology Index, and the S&P 500 Index, and that all dividends were reinvested. |
OTHER KEY INFORMATION |
| 41 |
Table of Contents
SELECTED FINANCIAL DATA
Years Ended |
| Dec 28, |
| Dec 27, |
| Dec 26, |
| Dec 31, |
| Dec 30, | ||||||||||
Net revenue |
| $ | 52,708 | |
| $ | 55,870 | |
| $ | 55,355 | |
| $ | 59,387 | |
| $ | 62,761 | |
Gross margin |
| $ | 31,521 | |
| $ | 35,609 | |
| $ | 34,679 | |
| $ | 36,191 | |
| $ | 39,069 | |
Gross margin percentage |
| 59.8 | % |
| 63.7 | % |
| 62.6 | % |
| 60.9 | % |
| 62.3 | % | |||||
Research and development (R&D) |
| $ | 10,611 | |
| $ | 11,537 | |
| $ | 12,128 | |
| $ | 12,740 | |
| $ | 13,098 | |
Marketing, general and administrative (MG&A) |
| $ | 8,088 | |
| $ | 8,136 | |
| $ | 7,930 | |
| $ | 8,397 | |
| $ | 7,474 | |
R&D and MG&A as a percentage of revenue |
| 35.5 | % |
| 35.2 | % |
| 36.2 | % |
| 35.6 | % |
| 32.8 | % | |||||
Operating income |
| $ | 12,291 | |
| $ | 15,347 | |
| $ | 14,002 | |
| $ | 12,874 | |
| $ | 17,936 | |
Net income 1 |
| $ | 9,620 | |
| $ | 11,704 | |
| $ | 11,420 | |
| $ | 10,316 | |
| $ | 9,601 | |
Effective tax rate 1 |
| 23.7 | % |
| 25.9 | % |
| 19.6 | % |
| 20.3 | % |
| 52.8 | % | |||||
Earnings per share 1 |
|
|
|
|
|
|
|
|
|
| ||||||||||
Basic |
| $ | 1.94 | |
| $ | 2.39 | |
| $ | 2.41 | |
| $ | 2.18 | |
| $ | 2.04 | |
Diluted |
| $ | 1.89 | |
| $ | 2.31 | |
| $ | 2.33 | |
| $ | 2.12 | |
| $ | 1.99 | |
Weighted average diluted shares of common stock outstanding |
| 5,097 | |
| 5,056 | |
| 4,894 | |
| 4,875 | |
| 4,835 | | |||||
Dividends per share of common stock, declared and paid |
| $ | 0.90 | |
| $ | 0.90 | |
| $ | 0.96 | |
| $ | 1.04 | |
| $ | 1.0775 | |
Net cash provided by operating activities |
| $ | 20,776 | |
| $ | 20,418 | |
| $ | 19,018 | |
| $ | 21,808 | |
| $ | 22,110 | |
Additions to property, plant and equipment |
| $ | 10,711 | |
| $ | 10,105 | |
| $ | 7,326 | |
| $ | 9,625 | |
| $ | 11,778 | |
Repurchase of common stock |
| $ | 2,147 | |
| $ | 10,792 | |
| $ | 3,001 | |
| $ | 2,587 | |
| $ | 3,615 | |
Payment of dividends to stockholders |
| $ | 4,479 | |
| $ | 4,409 | |
| $ | 4,556 | |
| $ | 4,925 | |
| $ | 5,072 | |
|
|
|
|
|
|
|
|
|
|
| ||||||||||
(Dollars in Millions) |
| Dec 28, |
| Dec 27, |
| Dec 26, |
| Dec 31, |
| Dec 30, | ||||||||||
Property, plant and equipment, net |
| $ | 31,428 | |
| $ | 33,238 | |
| $ | 31,858 | |
| $ | 36,171 | |
| $ | 41,109 | |
Total assets |
| $ | 89,789 | |
| $ | 90,012 | |
| $ | 101,459 | |
| $ | 113,327 | |
| $ | 123,249 | |
Debt |
| $ | 13,385 | |
| $ | 13,655 | |
| $ | 22,670 | |
| $ | 25,283 | |
| $ | 26,813 | |
Stockholders' equity |
| $ | 58,256 | |
| $ | 55,865 | |
| $ | 61,085 | |
| $ | 66,226 | |
| $ | 69,019 | |
Employees (in thousands) |
| 107.6 | |
| 106.7 | |
| 107.3 | |
| 106.0 | |
| 102.7 | | |||||
1 | In Q4 2017, we recognized a $5.4 billion higher income tax expense as a result of one-time impacts from Tax Reform. |
OTHER KEY INFORMATION |
| 42 |
Table of Contents
Sales and Marketing
CUSTOMERS
We sell our products primarily to original equipment manufacturers (OEMs) and original design manufacturers (ODMs). ODMs provide design and manufacturing services to branded and unbranded private-label resellers. In addition, our customers include other manufacturers and service providers, such as industrial and communication equipment manufacturers and cloud service providers, who buy our products through distributor, reseller, retail, and OEM channels throughout the world. For more information about our customers, including customers who accounted for greater than 10% of our net consolidated revenue, see " Note 4: Operating Segments " within the Consolidated Financial Statements.
Our worldwide reseller sales channel consists of thousands of indirect customers-systems builders that purchase Intel ® processors and other products from our distributors. We have incentive programs that allow distributors to sell our microprocessors and other products in small quantities to customers of systems builders. Our microprocessors and other products are also available in direct retail outlets.
SALES ARRANGEMENTS
Our products are sold through sales offices throughout the world. Sales of our products are frequently made via purchase order acknowledgments that contain standard terms and conditions covering matters such as pricing, payment terms, and warranties, as well as indemnities for issues specific to our products, such as patent and copyright indemnities. From time to time, we may enter into additional agreements with customers covering, for example, changes from our standard terms and conditions, new product development and marketing, and private-label branding. Our sales are routinely made using electronic and web-based processes that allow the customer to review inventory availability and track the progress of specific goods ordered. Pricing on particular products may vary based on volumes ordered and other factors. We also offer discounts, rebates, and other incentives to customers to increase acceptance of our products and technology.
Our products are generally shipped under terms that transfer title to the customer, even in arrangements for which the recognition of revenue and related cost of sales is deferred. Our standard terms and conditions of sale typically provide that payment is due at a later date, 30 days after shipment or delivery. We assess credit risk through quantitative and qualitative analysis. From this analysis, we establish shipping and credit limits, and determine whether we will seek to use one or more credit support protection devices, such as obtaining a parent guarantee, standby letter of credit, or credit insurance. Credit losses may still be incurred due to bankruptcy, fraud, or other failure of the customer to pay.
Our sales to distributors are typically made under agreements allowing for price protection on unsold merchandise and a right of return on stipulated quantities of unsold merchandise. Under the price protection program, we give distributors credits for the difference between the original price paid and the current price that we offer. Our products typically have no contractual limit on the amount of price protection, nor is there a limit on the time horizon under which price protection is granted. The right of return granted generally consists of a stock rotation program in which distributors are able to exchange certain products based on the number of qualified purchases made by the distributor.
DISTRIBUTION
Distributors typically handle a wide variety of products, including those that compete with our products, and fill orders for many customers. Customers may place orders directly with us or through distributors. We have several distribution warehouses that are located in proximity to key customers.
BACKLOG
Our customers generally operate with lean-inventory or just-in-time operations rather than maintaining larger inventories of our products. As our customers continue to lower their inventories, our processes to fulfill their orders have evolved to meet their needs. As a result, our manufacturing production is based on estimates and advance non-binding commitments from customers as to future purchases. Our order backlog as of any particular date is a mix of these commitments and specific firm orders that are primarily made pursuant to standard purchase orders for delivery of products. Only a small portion of our orders are non-cancelable, and the dollar amount associated with the non-cancelable portion is not significant.
SEASONAL TRENDS
Historically, our net revenue has typically been higher in the second half of the year than in the first half of the year, accelerating in the third quarter and peaking in the fourth quarter.
OTHER KEY INFORMATION |
| 43 |
Table of Contents
MARKETING
Our global marketing objectives are to build a strong, well-known, differentiated, and meaningful Intel corporate brand that drives preference with businesses and consumers, and to offer a limited number of meaningful and valuable brands in our portfolio to aid businesses and consumers in making informed choices about technology purchases. The Intel Core processor family and the Intel ® Quark™, Intel Atom®, Intel ® Celeron ® , Intel ® Pentium ® , Intel ® Xeon ® , Intel ® Xeon Phi™, and Intel ® Itanium ® trademarks make up our processor brands.
We promote brand awareness and preference, and generate demand through our own direct marketing, as well as through co-marketing programs. Our direct marketing activities primarily include advertising through digital and social media and television, as well as consumer and trade events, industry and consumer communications, and press relations. We market to consumer and business audiences, and focus on building awareness and generating demand for new form factors such as all-in-one devices and 2 in 1 systems powered by Intel technologies. Our key messaging focuses on increased performance, improved energy efficiency, and other capabilities such as connectivity and communications.
Purchases by customers often allow them to participate in cooperative advertising and marketing programs such as the Intel Inside program. This program broadens the reach of our brands beyond the scope of our own direct marketing. Through the Intel Inside program, certain customers are licensed to place Intel ® logos on computing devices containing our microprocessors and processor technologies, and to use our brands in their marketing activities. The program includes a market development component that accrues funds based on purchases and partially reimburses customers for marketing activities for products featuring Intel ® brands, subject to customers meeting defined criteria. These marketing activities primarily include advertising through digital and social media and television, as well as press relations. We have also entered into joint marketing arrangements with certain customers.
Competition
The computing industry continuously evolves with new and enhanced technologies and products from existing and new providers. The marketplace can change quickly in response to the introduction of such technologies and products and other factors such as changes in customer and end-user requirements, expectations, and preferences. As technologies evolve and new market segments emerge, the boundaries between the market segments that we compete in are also subject to change.
Intel faces significant competition in the development and market acceptance of our products in this environment. Our platforms, based on Intel architecture, are positioned to compete across the compute continuum, from low-power devices to the most powerful data center servers. These platforms have integrated hardware and software and offer our customers benefits such as ease of use, savings in total cost of ownership, and the ability to scale systems to accommodate increased usage.
COMPETITORS
We compete against other companies that make and sell platforms, other silicon components, and software to businesses that build and sell computing and communications systems to end users. Our competitors also include companies that sell goods and services to businesses that use them for their internal and/or customer-facing processes (e.g., businesses running large data centers). In addition, we face competition from OEMs, ODMs, and other industrial and communications equipment manufacturers that, to some degree, choose to vertically integrate their own proprietary semiconductor and software assets. By doing so, these competitors may be attempting to offer greater differentiation in their products and to increase their share of the profits for each finished product they sell. Continuing changes in industry participants through, for example, acquisitions or business collaborations could also have a significant impact on our competitive position.
In the PC market segment, we are a leading provider of platforms for notebooks, 2 in 1 systems, and desktops (including all-in-ones and high-end enthusiast PCs). We face existing and emerging competition in these product areas. Tablets, phones, and other mobile devices offered by numerous vendors are significant competitors to traditional PCs for many usages, and considerable blurring of system form factors currently exists in the marketplace. We face strong competition from vendors who use applications processors that are based on the ARM* architecture, feature low-power or long battery-life operation, and are built in SoC formats that integrate numerous functions on one chip.
In the data center market segment, we are a leading provider of data center platforms, and face competition from companies using ARM architecture or other technologies. Internet cloud computing, storage, and networking are areas of significant targeted growth for us in the data center segment, including as a result of increasing amounts of data created by artificial intelligence, autonomous driving, and other applications. We face strong competition in these market segments.
In the Internet of Things market segment, we have a long-standing position as a supplier of components and software for embedded products. This marketplace continues to expand significantly with increasing types and numbers of smart and connected devices for retail, automotive, industrial, and consumer uses, including smart video. As this market segment evolves, we face numerous large and small incumbent processor competitors, as well as new entrants that use ARM architecture and other operating systems and software. In addition, the Internet of Things requires a broad range of connectivity solutions and we face competition from companies providing traditional wireless solutions such as cellular, WiFi, and Bluetooth*, as well as several new entrants who are taking advantage of new focused communications protocols.
OTHER KEY INFORMATION |
| 44 |
Table of Contents
In the memory market segment, we compete against other providers of NAND flash memory products. We focus our efforts primarily on incorporating NAND flash memory into solution products, such as SSDs supporting enterprise and consumer applications. We believe that our memory offerings, including innovative developments such as Intel Optane technology, complement our product offerings in our other segments.
In the programmable solutions market segment, we are a leading provider of programmable semiconductors and related products, including FPGAs and SoC FPGAs. We face competition from other programmable logic companies, as well as companies that make other types of semiconductor products, such as application-specific integrated circuits, application-specific standard products, graphics processing units, digital signal processors, and CPUs. Targeted growth areas for our programmable solutions include communications, data center, and automotive applications. The FPGA life cycle is long relative to other Intel products-from the time that a design win is secured, it generally takes three or more years before a customer starts volume production and we receive the associated revenue from such design win.
Our products primarily compete based on performance, energy efficiency, integration, innovative design, features, price, quality, reliability, brand recognition, technical support, and availability. The importance of these factors varies by the type of end system for the products. For example, performance might be among the most important factors for our products for data center servers, while energy efficiency and price, as well as density and non-volatility, might be among the most important factors for our memory products.
COMPETITIVE ADVANTAGES
Our key competitive advantages include:
• | Well-positioned for growth in smart, connected world. We offer solutions across every segment of the smart, connected world-from the cloud, to the network, to devices-and believe that we are well-positioned for growth through our strategy of the Virtuous Cycle of Growth. The expansion and proliferation of the cloud and data center, Internet of Things, memory, and FPGAs-all of which are connected-help grow our business. As more devices connect to the cloud, we have increased opportunities for growth. We are uniquely positioned to meet customer needs with platform solutions that leverage our breadth of products. Our range of silicon products and associated software gives us an end-to-end capability supported by our manufacturing expertise and intellectual property. |
• | Transitions to next-generation technologies. We have a market lead in transitioning to the next-generation process technology and bringing products to market using such technology. In Q4 2017, we began to ship products utilizing our 10nm process technology and we are continuing to work on the development of our next-generation 7nm process technology. We believe that these advancements will offer significant improvements in one or more of the following areas: performance, new features, energy efficiency, and cost. |
• | Combination of our network of manufacturing and assembly and test facilities with our global architecture design teams. We have made significant capital and R&D investments into our integrated manufacturing network, which enables us to have more direct control over our design, development, and manufacturing processes; quality control; product cost; production timing; performance; power consumption; and manufacturing yield. The increased cost of constructing new fabrication facilities to support smaller transistor geometries and larger wafers has led to a reduced number of companies that can build and equip leading-edge manufacturing facilities. Most of our competitors rely on third-party foundries and subcontractors for manufacturing and assembly and test needs. We provide foundry services as an alternative to such foundries. |
Intellectual Property Rights and Licensing
Intel owns and develops significant intellectual property (IP) and related IP rights around the world that relate to our products, services, R&D, and other activities and assets. Our IP portfolio includes patents, copyrights, trade secrets, trademarks, trade dress rights, and maskwork rights. We actively seek to protect our global IP rights and to deter unauthorized use of our IP and other assets. Such efforts can be difficult, however, particularly in countries that provide less protection to IP rights and in the absence of harmonized international IP standards. While our IP rights are important to our success, our business as a whole is not significantly dependent on any single patent, copyright, or other IP right.
We have obtained patents in the U.S. and other countries. Because of the fast pace of innovation and product development, and the comparative pace of governments' patenting processes, our products are often obsolete before the patents related to them expire; in some cases, our products may be obsolete before the patents related to them are granted. As we expand our products into new industries, we also seek to extend our patent development efforts to patent such products. In addition to developing patents based on our own R&D efforts, we may purchase or license patents from third parties. Established competitors in existing and new industries, as well as companies that purchase and enforce patents and other IP, may already have patents covering similar products. There is no assurance that we will be able to obtain patents covering our own products, or that we will be able to obtain licenses from other companies on favorable terms or at all.
The software that we distribute, including software embedded in our component-level and platform products, is entitled to copyright and other IP protection. To distinguish our products from our competitors' products, we have obtained trademarks and trade names for our products, and we maintain cooperative advertising programs with customers to promote our brands and to identify products containing genuine Intel components. We also protect details about our processes, products, and strategies as trade secrets, keeping confidential the information that we believe provides us with a competitive advantage.
OTHER KEY INFORMATION |
| 45 |
Table of Contents
Critical Accounting Estimates
The methods, assumptions, and estimates that we use in applying our accounting policies may require us to apply judgments regarding matters that are inherently uncertain. We consider an accounting policy to be a critical estimate if: (1) we must make assumptions that were uncertain when the judgment was made, and (2) changes in the estimate assumptions, or selection of a different estimate methodology could have a significant impact on our financial position and the results that we report in our consolidated financial statements. While we believe that our estimates, assumptions, and judgments are reasonable, they are based on information available when the estimate was made.
Refer to " Note 2: Accounting Policies " within the Consolidated Financial Statements for further information on our critical accounting estimates and policies, which are as follows:
• | Inventories - the transition of manufacturing costs to inventory excluding factory excess capacity costs. Inventoried product reflected at the lower of cost or net realizable value considering future demand and market conditions; |
• | Property, plant and equipment - the useful life determination and the related timing of when depreciation begins; |
• | Long-lived assets - the valuation methods and assumptions used in assessing the impairment of property, plant and equipment, identified intangibles, and goodwill, including the determination of asset groupings and the identification and allocation of goodwill to reporting units; |
• | Non-marketable equity investments - the valuation estimates and assessment of other-than-temporary impairment; |
• | Business combinations - the assumptions used to allocate the purchase price paid for assets acquired and liabilities assumed in connection with our acquisitions; |
• | Income taxes - the identification and measurement of deferred tax assets and liabilities and the provisional estimates associated with Tax Reform; and |
• | Loss contingencies - the estimation of when a loss is probable and reasonably estimable. |
RISK FACTORS
The following risks could materially and adversely affect our business, financial condition, cash flows, and results of operations, and the trading price of our common stock could decline. These risk factors do not identify all risks that we face; our operations could also be affected by factors that are not presently known to us or that we currently consider to be immaterial to our operations. Due to risks and uncertainties, known and unknown, our past financial results may not be a reliable indicator of future performance, and historical trends should not be used to anticipate results or trends in future periods. Refer also to the other information set forth in this Annual Report on Form 10-K, including "MD&A - Results of Operations" and our financial statements and the related notes.
CHANGES IN PRODUCT DEMAND CAN ADVERSELY AFFECT OUR FINANCIAL RESULTS.
Demand for our products is variable and hard to predict. Our platform products are used across different market segments, and demand for our platforms may vary within or among our client computing, data center, Internet of Things, and other market segments. It is difficult to anticipate the impact of these changes, as demand may increase in one or more market segments while decreasing in others. Changes in the demand for our products, particularly in the client computing or data center market segments, may reduce our revenue, lower our gross margin, or require us to write down the value of our assets.
Important factors that could lead to variation in the demand for our products include changes in:
• | business conditions, including downturns in the market segments in which we operate, or in the global or regional economies; |
• | consumer confidence or income levels caused by changes in market conditions, including changes in government borrowing, taxation, or spending policies; the credit market; or expected inflation, employment, and energy or other commodity prices; |
• | the level of our customers' inventories; |
• | competitive and pricing pressures, including actions taken by competitors; |
• | customer order patterns, including order cancellations; |
• | failure to timely introduce competitive products; and |
• | market acceptance and industry support of our new and maturing products. |
Due to the complexity of our manufacturing operations, we may be unable to timely respond to fluctuations in demand and we may incur significant charges and costs . Because we own and operate high-tech fabrication facilities, our operations have high costs that are fixed or difficult to reduce in the short term, including our costs related to utilization of existing facilities, facility construction and equipment, R&D, and the employment and training of a highly skilled workforce. If product demand decreases or we fail to forecast demand accurately, we could be required to write off inventory or record excess capacity charges, which would lower our gross margin. If the demand decrease is prolonged, our manufacturing or assembly and test capacity could be underutilized, and we may be required to write down our long-lived assets, which would increase our expenses. We may also be required to shorten the useful lives of under-used facilities and equipment and accelerate depreciation. Conversely, if product demand increases, we may be unable to add capacity fast enough to meet market demand.
We face significant competition. The industry in which we operate is highly competitive and subject to rapid technological and market developments, changes in industry standards, changes in customer needs, and frequent product introductions and improvements. If we do not anticipate and respond to these developments, our competitive position may weaken, and our products or technologies might be uncompetitive or become obsolete. Additionally, a number of business combinations-including mergers, asset acquisitions, and strategic partnerships-in the semiconductor industry have occurred over the last several years, and more could occur in the future. Consolidation in the industry could lead to fewer customers, partners, or suppliers, any of which could negatively affect our financial results.
In recent years, in connection with our strategic transformation to a data-centric company, we have entered new areas and introduced adjacent products in programmable solutions, AI, and autonomous driving; we have also expanded our adjacent product offerings in client computing, the data center, the Internet of Things, and memory, with offerings such as modems, silicon photonics solutions, and 3D XPoint technology products. As a result, we face new sources of competition, including, in certain of these market segments, from incumbent competitors with established customer bases and greater brand recognition. These developing products and market segments may not grow as significantly as projected, or at all, or may utilize technologies that are different from the ones that we develop and manufacture. To be successful, we need to cultivate new industry relationships with customers and partners in these market segments. In addition, we must continually improve the cost, performance, integration, and energy efficiency of our products, as well as expand our software capabilities to provide customers with comprehensive computing solutions. Despite our ongoing efforts, there is no guarantee that we will achieve or maintain market demand or acceptance for our products and services in these various market segments.
OTHER KEY INFORMATION |
| 46 |
Table of Contents
To compete successfully, we must maintain a successful R&D effort, develop new products and production processes, and improve our existing products and processes ahead of competitors. For example, we invest substantially in our network of manufacturing and assembly and test facilities, including the construction of new fabrication facilities to support smaller transistor geometries and larger wafers. We do not expect all of our R&D investments to be successful. We may be unable to develop and market new products successfully, and the products and technologies we invest in and develop may not be well-received by customers. Our R&D investments may not contribute to our future operating results for several years, if at all, and such contributions may not meet our expectations or even cover the costs of such investments. Additionally, the products and technologies offered by others may affect demand for, or pricing of, our products.
If we are not able to compete effectively, our financial results will be adversely affected, including reduced revenue and gross margin, and we may be required to accelerate the write-down of the value of certain assets.
Changes in the mix of products sold may impact our financial results. Our pricing and margins vary across our products and market segments due in part to marketability of our products and differences in their features or manufacturing costs. For example, our platform product offerings range from lower-priced and entry-level platforms, such as those based on Intel Atom processors, to higher-end platforms based on Intel Xeon processors. If demand shifts from our higher-priced to lower-priced products in any of our market segments, our gross margin and revenue would decrease.
WE OPERATE GLOBALLY AND ARE SUBJECT TO SIGNIFICANT RISKS IN MANY JURISDICTIONS.
Global or regional conditions may harm our financial results. We have manufacturing, assembly and test, R&D, sales, and other operations in many countries, and some of our business activities may be concentrated in one or more geographic areas. Moreover, sales outside the U.S. accounted for approximately 83% of our revenue for the fiscal year ended December 30, 2017 . As a result, our operations and our financial results, including our ability to manufacture, assemble and test, design, develop, or sell products, may be adversely affected by a number of factors outside of our control, including:
• | global and regional economic conditions; |
• | geopolitical and security issues, such as armed conflict and civil or military unrest, political instability (including geopolitical uncertainty on the Korean peninsula), human rights concerns, and terrorist activity; |
• | natural disasters, public health issues, and other catastrophic events; |
• | inefficient infrastructure and other disruptions, such as supply chain interruptions and large-scale outages or unreliable provision of services from utilities, transportation, data hosting, or telecommunications providers; |
• | government restrictions on, or nationalization of our operations in any country, or restrictions on our ability to repatriate earnings from a particular country; |
• | differing employment practices and labor issues; |
• | formal or informal imposition of new or revised export and/or import and doing-business regulations, including trade sanctions and tariffs, which could be changed without notice; |
• | ineffective legal protection of our IP rights in certain countries; |
• | local business and cultural factors that differ from our current standards and practices; and |
• | continuing uncertainty regarding social, political, immigration, and tax and trade policies in the U.S. and abroad, including the United Kingdom's vote to withdraw from the European Union. |
We are subject to laws and regulations worldwide, which may differ among jurisdictions, affecting our operations in areas including, but not limited to: IP ownership and infringement; tax; import and export requirements; anti-corruption; foreign exchange controls and cash repatriation restrictions; data privacy requirements; competition; advertising; employment; product regulations; environment, health, and safety requirements; and consumer laws. Compliance with such requirements may be onerous and expensive, and may otherwise impact our business operations negatively. For example, unfavorable developments with evolving laws and regulations worldwide related to 5G technology may limit its global introduction and adoption, which could impede our modem strategy and negatively impact our long-term outlook. Although we have policies, controls, and procedures designed to help ensure compliance with applicable laws, there can be no assurance that our employees, contractors, suppliers, and/or agents will not violate such laws or our policies. Violations of these laws and regulations could result in fines; criminal sanctions against us, our officers, or our employees; prohibitions on the conduct of our business; and damage to our reputation.
We may be affected by fluctuations in currency exchange rates. We are potentially exposed to adverse as well as beneficial movements in currency exchange rates. Although most of our sales occur in U.S. dollars, expenses may be paid in local currencies. An increase in the value of the dollar could increase the real cost to our customers of our products in those markets outside the U.S. where we sell in dollars, and a weakened dollar could increase the cost of expenses such as payroll, utilities, tax, and marketing expenses, as well as overseas capital expenditures. We also conduct certain investing and financing activities in local currencies. Our hedging programs reduce, but do not eliminate, the impact of currency exchange rate movements; therefore, changes in exchange rates could harm our results of operations and financial condition.
OTHER KEY INFORMATION |
| 47 |
Table of Contents
Catastrophic events could have a material adverse effect on our operations and financial results. Our operations and business could be disrupted by natural disasters; industrial accidents; public health issues; cybersecurity incidents; interruptions of service from utilities, transportation, or telecommunications providers; or other catastrophic events. Such events could make it difficult or impossible to manufacture or deliver products to our customers, receive production materials from our suppliers, or perform critical functions, which could adversely affect our revenue and require significant recovery time and expenditures to resume operations. While we maintain business recovery plans that are intended to enable us to recover from natural disasters or other events that can be disruptive to our business, some of our systems are not fully redundant and we cannot be sure that our plans will fully protect us from all such disruptions.
We maintain a program of insurance coverage for a variety of property, casualty, and other risks. The types and amounts of insurance we obtain vary depending on availability, cost, and decisions with respect to risk retention. Some of our policies have large deductibles and broad exclusions. In addition, one or more of our insurance providers may be unable or unwilling to pay a claim. Losses not covered by insurance may be large, which could harm our results of operations and financial condition.
WE ARE VULNERABLE TO PRODUCT AND MANUFACTURING-RELATED RISKS.
We are subject to risks associated with the development and implementation of new manufacturing process technology. Production of integrated circuits is a complex process. Our strategy is significantly dependent upon the timely advancement of Moore's Law and we are continually engaged in the development of next-generation process technologies. We may not be successful or efficient in developing or implementing new process nodes and production processes. Our efforts to innovate involve significant expense and carry inherent risks, including difficulties in designing and developing such next-generation process technologies, and investments in manufacturing assets and facilities years in advance of the process node introduction.
Risks inherent in the development of next-generation process technologies include production timing delays, lower than anticipated manufacturing yields, and product defects and errata. Disruptions in the production process can also result from errors, defects in materials, delays in obtaining or revising operating permits and licenses, interruption in our supply of materials or resources, and disruptions at our fabrication and assembly and test facilities due to accidents, maintenance issues, or unsafe working conditions-all of which could affect the timing of production ramps and yields. Production issues can lead to increased costs and may affect our ability to meet product demand, which could adversely impact our business and the results of operations. In addition, if we face unexpected delays in the timing of our product introductions, our revenue and gross margin could be adversely affected because we incur significant costs up front in the product development stage and earn revenue to offset these costs over time.
We face supply chain risks. Thousands of suppliers provide materials and equipment that we use in production and other aspects of our business. Where possible, we seek to have several sources of supply. However, for certain materials, we may rely on a single or a limited number of suppliers, or upon suppliers in a single location. In addition, consolidation among suppliers could impact the nature, quality, availability, and pricing of the products and services available to us. The inability of suppliers to deliver necessary production materials or equipment could disrupt our production processes and make it more difficult for us to implement our business strategy. Production could be disrupted by the unavailability of resources, such as water, silicon, electricity, gases, and other materials. The unavailability or reduced availability of materials or resources may require us to reduce production or incur additional costs, which could harm our business and results of operations. Our manufacturing operations and ability to meet product demand may also be impacted by IP or other litigation between our suppliers, where an injunction against Intel or a supplier could interrupt the availability of goods or services supplied to Intel by others.
We also rely on third-party providers to manufacture and assemble and test certain components or products, particularly those related to networking, communications, programmable semiconductor solutions, and NAND flash memory. If any of these third parties are unable to perform these services on a timely or cost-effective basis, we may encounter supply delays or disruptions that could adversely affect our business and financial results.
In addition, increased regulation or stakeholder expectations regarding responsible sourcing practices could cause our compliance costs to increase or result in publicity that negatively affects our reputation. Moreover, given that we use many materials in the manufacturing of our products and rely on many suppliers to provide these materials, but do not directly control the procurement or employment practices of such suppliers, we could be subject to similar financial or reputational risks as a result of our suppliers' conduct.
OTHER KEY INFORMATION |
| 48 |
Table of Contents
We are subject to the risks of product defects, errata, or other product issues. Product defects and errata (deviations from published specifications) may result from problems in our product design or our manufacturing and assembly and test processes. Components and products we purchase or license from third-party suppliers, or attain through acquisitions, may also contain defects. We could face risks if products that we design, manufacture, or sell, or that include our technology, cause personal injury or property damage, even where the cause is unrelated to product defects or errata. These risks may increase as our products are introduced into new devices, market segments, technologies, or applications, including wearables, drones and transportation, health care and financial transactions, and other industrial and consumer uses. Costs from defects, errata, or other product issues could include:
• | writing off some or all of the value of inventory; |
• | recalling products that have been shipped; |
• | providing product replacements or modifications; |
• | reimbursing customers for certain costs they incur; |
• | defending against litigation and/or paying resulting damages; and |
• | paying fines imposed by regulatory agencies. |
These costs could be large and may increase expenses and lower gross margin, and result in delay or loss of revenue. Any product defects, errata, or other issues could also damage our reputation, negatively affect product demand, delay product releases, or result in legal liability. The announcement of product defects or errata could cause customers to purchase products from competitors. Any of these occurrences could harm our business and financial results. In addition, although we maintain liability insurance, our coverage has certain exclusions and/or may not adequately cover liabilities incurred. Our insurance providers may be unable or unwilling to pay a claim, and losses not covered by insurance could be large, which could harm our financial condition.
We are subject to risks associated with environmental, health, and safety regulations and climate change. The manufacturing and assembly and test of our products require the use of hazardous materials that are subject to a broad array of environmental, health, and safety laws and regulations. Our failure to comply with these laws or regulations could result in:
• | regulatory penalties, fines, and legal liabilities; |
• | suspension of production; |
• | alteration of our manufacturing and assembly and test processes; |
• | damage to our reputation; and |
• | restrictions on our operations or sales. |
Our failure to manage the use, transportation, emissions, discharge, storage, recycling, or disposal of hazardous materials could lead to increased costs or future liabilities. Our ability to expand or modify our manufacturing capability in the future may be impeded by environmental regulations, such as air quality and wastewater requirements. Environmental laws and regulations could also require us to acquire additional pollution abatement or remediation equipment, modify product designs, or incur other expenses. Many new materials that we are evaluating for use in our operations may be subject to regulation under environmental laws and regulations. These restrictions could harm our business and results of operations by increasing our expenses or requiring us to alter manufacturing and assembly and test processes.
Climate change may also pose regulatory and environmental risks that could harm our results of operations and affect the way we conduct business. For example, climate change regulation could result in increased manufacturing costs associated with air pollution control requirements, and increased or new monitoring, recordkeeping, and reporting of greenhouse gas emissions. We also see the potential for higher energy costs driven by climate change regulations if, for example, utility companies pass on their costs to their customers. Furthermore, many of our operations are located in semi-arid regions such as Arizona, New Mexico, and Israel that may become increasingly vulnerable to rising average temperatures or prolonged droughts due to climate change. Our fabrication facilities require significant water use and, while we recycle and reuse a portion of the water used, we may have difficulties obtaining sufficient water to fulfill our operational needs. In addition, climate change may pose physical and regulatory risks to our suppliers, including increased extreme weather events that could result in supply delays or disruptions.
WE ARE SUBJECT TO CYBERSECURITY AND PRIVACY RISKS.
Third parties regularly attempt to gain unauthorized access to our network, products, services, and infrastructure. We regularly face attempts by others to gain unauthorized access through the Internet or to introduce malicious software to our IT systems. Additionally, individuals or organizations, including malicious hackers or intruders into our physical facilities, may attempt to gain unauthorized access and corrupt the processes of hardware and software products that we manufacture and services we provide. Due to the widespread use of our products, we are a frequent target of computer hackers and organizations that intend to sabotage, take control of, or otherwise corrupt our manufacturing or other processes, products, and services. We are also a target of malicious attackers who attempt to gain access to our network or data centers or those of our customers or end users; steal proprietary information related to our business, products, employees, and customers; or interrupt our systems and services or those of our customers or others. We believe such attempts are increasing in number and in technical sophistication. As we become a more data-centric company, our processors may be used in more and different critical application areas and may be subject to increased cybersecurity and privacy risks.
From time to time, we encounter intrusions or unauthorized access to our network, products, services, or infrastructure. To date, none have resulted in any material adverse impact to our business or operations. Such incidents, whether or not successful, could result in our incurring significant costs related to, for example, rebuilding internal systems, writing down inventory value, implementing
OTHER KEY INFORMATION |
| 49 |
Table of Contents
additional threat protection measures, providing modifications to our products and services, defending against litigation, responding to regulatory inquiries or actions, paying damages, providing customers with incentives to maintain the business relationship, or taking other remedial steps with respect to third parties. In addition, these threats are constantly evolving, thereby increasing the difficulty of successfully defending against them or implementing adequate preventative measures. While we seek to detect and investigate all unauthorized attempts and attacks against our network, products, and services, and to prevent their recurrence where practicable through changes to our internal processes and tools and/or changes or updates to our products and services, we remain potentially vulnerable to additional known or unknown threats. In some instances, we, our customers, and the users of our products and services may be unaware of an incident or its magnitude and effects.
Security vulnerabilities may exist with respect to our processors and other products as well as the operating systems and workloads running on them. Mitigation techniques designed to address these security vulnerabilities, including software and firmware updates or other preventative measures, may not operate as intended or effectively resolve these vulnerabilities. In addition, we may be required to rely on third parties, including hardware, software, and services vendors, as well as end users, to develop and deploy mitigation techniques, and the effectiveness of mitigation techniques may depend solely or in part on the actions of these third parties. Security vulnerabilities and/or mitigation techniques, including software and firmware updates, may result in adverse performance, reboots, system instability, data loss or corruption, unpredictable system behavior, or the misappropriation of data by third parties, which could adversely impact our business and harm our reputation.
A side-channel exploit is a type of security vulnerability that has recently received attention as a result of the variants referred to as "Spectre" and "Meltdown." Information on these variants was prematurely reported publicly before mitigation techniques to address all vulnerabilities were made widely available, and certain of the mitigation techniques did not operate as intended. To date, we do not expect a material financial impact to our business or operations from these security vulnerabilities. However, subsequent events or new information could develop which changes our expectations, including additional information learned as we deploy updates, evaluate the competitiveness of existing and new products, address future warranty or other claims or customer satisfaction considerations, as well as developments in the course of responding to any litigation or investigations over these matters. The recent publicity regarding side-channel exploits may also result in increased attempts by third parties to identify additional variants. We will continue to reassess whether or not we expect to be exposed to a loss that could be material.
As a result of the foregoing risks, we have and may continue to face product claims, litigation, and adverse publicity and customer relations from security vulnerabilities and/or mitigation techniques. Publicity about security vulnerabilities and attempted or successful exploits, whether accurate or inaccurate, may result in increased attempts by third parties to identify additional vulnerabilities. This publicity could damage our reputation with customers or users and reduce demand for our products and services. In addition, future vulnerabilities and mitigation of those vulnerabilities may also adversely impact our results of operations, financial condition, customer relationships, and reputation. Moreover, we may be unable to anticipate the timing of the release of information by third parties regarding potential vulnerabilities of our products, which, in turn, has and could adversely impact our ability to timely introduce mitigation techniques and thereby harm our business and reputation.
We may be subject to theft, loss, or misuse of personal data about our employees, customers, or other third parties, which could increase our expenses, damage our reputation, or result in legal or regulatory proceedings. The theft, loss, or misuse of personal data collected, used, stored, or transferred by us to run our business could result in significantly increased business and security costs or costs related to defending legal claims. Global privacy legislation, enforcement, and policy activity in this area are rapidly expanding and creating a complex regulatory compliance environment. Costs to comply with and implement these privacy-related and data protection measures could be significant. In addition, even our inadvertent failure to comply with federal, state, or international privacy-related or data protection laws and regulations could result in proceedings against us by governmental entities or others.
WE ARE SUBJECT TO IP RISKS AND RISKS ASSOCIATED WITH LITIGATION AND REGULATORY PROCEEDINGS.
We may be unable to enforce or protect our IP rights. We regard our patents, copyrights, trade secrets, and other IP rights as important to the success of our business. We rely on IP law-as well as confidentiality and licensing agreements with our customers, employees, technology development partners, and others-to protect our IP rights. Our ability to enforce these rights is subject to general litigation risks, as well as uncertainty as to the enforceability of our IP rights in various countries. When we seek to enforce our rights, we may be subject to claims that our IP rights are invalid, not enforceable, or licensed to an opposing party. Our assertion of IP rights may result in another party seeking to assert claims against us, which could harm our business. Governments may adopt regulations-and governments or courts may render decisions-requiring compulsory licensing of IP rights, or governments may require products to meet standards that favor local companies. Our inability to enforce our IP rights under any of these circumstances may harm our competitive position and business. In addition, the theft or unauthorized use or publication of our trade secrets and other confidential business information could harm our competitive position and reduce acceptance of our products; as a result, the value of our investment in R&D, product development, and marketing could be reduced.
Our licenses with other companies and participation in industry initiatives may allow competitors to use our patent rights. Technology companies often bilaterally license patents between each other to settle disputes or as part of business agreements. Our competitors may have licenses to our patents, and under current case law, some of the licenses may exhaust our patent rights as to licensed product sales under some circumstances. Our participation in industry standards organizations or with other industry initiatives may require us to license our patents to companies that adopt industry-standard specifications. Depending on the rules of the organization, government regulations, or court decisions, we might have to grant licenses to our patents for little or no cost, and as a result, we may be unable to enforce certain patents against others, our costs of enforcing our licenses or protecting our patents may increase, and the value of our IP rights may be impaired.
OTHER KEY INFORMATION |
| 50 |
Table of Contents
Third parties may assert claims based on IP rights against us or our products, which could harm our business. We may face claims based on IP rights from individuals and companies, including claims from those who have aggregated patents acquired from multiple sources to form a new, larger portfolio to assert claims against us and other companies. Additionally, large patent portfolio owners may divest portions of their portfolios to more than one individual or company increasing the number of parties who own IP rights previously all held by a single party. We are typically engaged in a number of disputes involving IP rights. Claims that our products or processes infringe the IP rights of others, regardless of their merits, could cause us to incur large costs to respond to, defend, and resolve the claims, and they may divert the efforts and attention of our management and technical personnel from our business and operations. In addition, we may face claims based on the alleged theft or unauthorized use or disclosure of third-party trade secrets and other confidential information or end-user data that we obtain in conducting our business. Any such incidents and claims could severely disrupt our business, and we could suffer losses, including the cost of product recalls and returns, and reputational harm. Furthermore, we have agreed to indemnify customers for certain IP rights claims against them. As a result of IP rights claims, we could:
• | pay monetary damages, including payments to satisfy indemnification obligations; |
• | stop manufacturing, using, selling, offering to sell, or importing products or technology subject to claims; |
• | need to develop other products or technology not subject to claims, which could be time-consuming or costly; and/or |
• | enter into settlement and license agreements, which agreements may not be available on commercially reasonable terms. |
These IP rights claims could harm our competitive position, result in expenses, or require us to impair our assets. If we alter or stop production of affected items, our revenue could be harmed.
We rely on access to third-party IP, which may not be available to us on commercially reasonable terms or at all. Many of our products include third-party technology and/or implement industry standards, and may require licenses from third parties. Based on past experience and industry practice, we believe such licenses generally can be obtained on commercially reasonable terms. However, there is no assurance that the necessary licenses can be obtained on acceptable terms or at all. Failure to obtain the right to use third-party technology, or to license IP on commercially reasonable terms, could preclude us from selling certain products or otherwise have a material adverse impact on our financial condition and operating results.
We are subject to the risks associated with litigation and regulatory proceedings. We may face legal claims or regulatory matters involving stockholder, consumer, competition, and other issues on a global basis. As described in " Note 20: Commitments and Contingencies " within the Consolidated Financial Statements, we are engaged in a number of litigation and regulatory matters. Litigation and regulatory proceedings are inherently uncertain, and adverse rulings could occur, including monetary damages, or an injunction stopping us from manufacturing or selling certain products, engaging in certain business practices, or requiring other remedies, such as compulsory licensing of patents. An unfavorable outcome may result in a material adverse impact on our business, financial condition and results of operations. In addition, regardless of the outcome, litigation and regulatory proceedings can be costly, time-consuming, disruptive to our operations, and distracting to management.
WE MUST ATTRACT, RETAIN, AND MOTIVATE KEY EMPLOYEES.
To be competitive, we must attract, retain, and motivate executives and other key employees. Hiring and retaining qualified executives, scientists, engineers, technical staff, and sales representatives are critical to our business, and competition for experienced employees can be intense. To help attract, retain, and motivate qualified employees, we use share-based and other performance-based incentive awards such as RSUs and cash bonuses. Also key to our employee hiring and retention is our ability to build and maintain an inclusive business culture and be viewed as an employer of choice. If our share-based or other compensation programs and workplace culture cease to be viewed as competitive, our ability to attract, retain, and motivate employees could be weakened, which could harm our results of operations.
WE ARE SUBJECT TO RISKS ASSOCIATED WITH OUR STRATEGIC TRANSACTIONS.
We invest in companies for strategic reasons and may not realize a return on our investments. We make investments in public and private companies around the world to further our strategic objectives and support key business initiatives. Many of the instruments in which we invest are non-marketable at the time of our initial investment. Companies in which we invest range from early-stage companies still defining their strategic direction to mature companies with established revenue streams and business models. The success of our investment in any company is typically dependent on the company's access to additional funding on favorable terms, or a liquidity event, such as a public offering or acquisition. If any of the companies in which we invest fail, we could lose all or part of our investment.
Our acquisitions, divestitures, and other strategic transactions could fail to achieve our financial or strategic objectives, disrupt our ongoing business, and adversely impact our results of operations. In pursuing our business strategy, we routinely conduct discussions, evaluate opportunities, and enter into agreements for possible acquisitions, divestitures, and other strategic transactions. These transactions involve numerous risks, including:
• | the transaction may not advance our business strategy and its anticipated benefits may never materialize; |
• | we may experience disruption of our ongoing operations and our management's attention may be diverted; |
• | we may not realize a satisfactory return on our investment, potentially resulting in an impairment; |
• | we may be unable to retain key personnel of acquired businesses or may have difficulty integrating employees, business systems, and technology; |
OTHER KEY INFORMATION |
| 51 |
Table of Contents
• | we may not be able to identify opportunities in a timely manner or on terms acceptable to us; |
• | controls, processes, and procedures of acquired businesses may not adequately ensure compliance with laws and regulations, and we may fail to identify compliance issues or liabilities; |
• | we may be unable to effectively enter new market segments through our strategic transactions or retain customers and partners of acquired businesses; |
• | we may fail to identify the existence of unknown, underestimated, and/or undisclosed commitments or liabilities; and/or |
• | we may fail to complete a transaction in a timely manner, if at all, due to our inability to obtain required government or other approvals, IP disputes or other litigation, difficulty in obtaining financing on terms acceptable to us, or other unforeseen factors. |
Moreover, our resources are limited and our decision to pursue a transaction has opportunity costs; accordingly, if we pursue a particular transaction, we may need to forgo the prospect of entering into other transactions that could help us achieve our financial or strategic objectives.
Any of these risks could have a material adverse effect on our business, results of operations, financial condition, or cash flows, particularly in the case of a large acquisition or several concurrent acquisitions.
WE ARE SUBJECT TO SALES-RELATED RISKS.
We face risks related to sales through distributors and other third parties. We sell a significant portion of our products through third parties such as distributors, value-added resellers, and channel partners (collectively referred to as distributors), as well as OEMs, ODMs and Internet service providers. We depend on many distributors to help us create end-customer demand, provide technical support and other value-added services to customers, fill customer orders, and stock our products. We may rely on one or more key distributors for a product, and a material change in our relationship with one or more of these distributors or their failure to perform as expected could reduce our revenue. Our ability to add or replace distributors for some of our products may be limited. In addition, our distributors' expertise in the determination and stocking of acceptable inventory levels for some of our products may not be easily transferable to a new distributor; as a result, end customers may be hesitant to accept the addition or replacement of a distributor. Using third parties for distribution exposes us to many risks, including competitive pressure and concentration, credit, and compliance risks. Distributors and other third parties may sell products that compete with our products, and we may need to provide financial and other incentives to focus them on the sale of our products. They may face financial difficulties, including bankruptcy, which could harm our collection of accounts receivable and financial results. Violations of the Foreign Corrupt Practices Act or similar laws by distributors or other third-party intermediaries could have a material impact on our business. Failure to manage risks related to our use of distributors and other third parties may reduce sales, increase expenses, and weaken our competitive position.
We receive a significant portion of our revenue from a limited number of customers. Collectively, our three largest customers accounted for approximately 40% of our net revenue in 2017 and 38% of our net revenue in 2016. We expect a small number of customers will continue to account for a significant portion of our revenue in the foreseeable future. If one of our key customers stops purchasing from us, materially reduces its demand for our products, or delays its orders for our products, we may experience a reduction in revenue, which could harm our results of operations and financial condition. For more information about our customers, including customers who accounted for greater than 10% of our net consolidated revenue, see " Note 4: Operating Segments " within the Consolidated Financial Statements.
We face risks related to business transactions with U.S. government entities. We receive proceeds from services and products we provide to the U.S. government. U.S. government demand and payment may be affected by public sector budgetary cycles and funding authorizations. U.S. government contracts are subject to oversight, including special rules on accounting, IP rights, expenses, reviews, information handling, and security. Failure to comply with these rules could result in civil and criminal penalties and sanctions, including termination of contracts, fines, and suspensions, or debarment from future business with the U.S. government.
CHANGES IN OUR EFFECTIVE TAX RATE MAY REDUCE OUR NET INCOME.
A number of factors may increase our effective tax rates, which could reduce our net income, including:
• | changes in jurisdictions in which our profits are determined to be earned and taxed; |
• | the resolution of issues arising from tax audits; |
• | changes in the valuation of our deferred tax assets and liabilities, and in deferred tax valuation allowances; |
• | adjustments to income taxes upon finalization of tax returns; |
• | increases in expenses not deductible for tax purposes, including impairments of goodwill; |
• | changes in available tax credits; |
• | changes in our ability to secure new or renew existing tax holidays and incentives; |
• | changes in U.S. federal, state, or foreign tax laws or their interpretation, including changes in the U.S. to the taxation of manufacturing enterprises and of non-U.S. income and expenses; |
• | changes in accounting standards; and |
• | our decision to repatriate non-U.S. earnings for which we have not previously provided for local country withholding taxes incurred upon repatriation. |
OTHER KEY INFORMATION |
| 52 |
Table of Contents
WE MAY HAVE FLUCTUATIONS IN THE AMOUNT AND FREQUENCY OF OUR STOCK REPURCHASES.
The amount, timing, and execution of our stock repurchase program may fluctuate based on our priorities for the use of cash for other purposes-such as investing in our business, including operational spending, capital spending, and acquisitions, and returning cash to our stockholders as dividend payments-and because of changes in cash flows, tax laws, and the market price of our common stock.
non-GAAP Financial Measures
In addition to disclosing financial results in accordance with GAAP, this document contains references to the non-GAAP financial measures described below. We believe these non-GAAP financial measures provide investors with useful supplemental information about the financial performance of our business, enable comparison of financial results between periods where certain items may vary independent of business performance, and allow for greater transparency with respect to key metrics used by management in operating our business and measuring our performance.
Our non-GAAP operating income and diluted earnings per share reflect adjustments for the following items, as well as the related income tax effects. Income tax effects have been calculated using an appropriate tax rate for each adjustment.
Acquisition-related adjustments:
The non-GAAP financial measures disclosed by the company exclude certain business combination accounting adjustments and certain expenses related to acquisitions as follow:
• | Revenue and gross margin: Non-GAAP financial measures exclude the impact of the deferred revenue write-down, amortization of acquisition-related intangible assets that impact cost of sales, and the inventory valuation adjustment. |
OTHER KEY INFORMATION |
| 53 |
Table of Contents
◦ | Deferred revenue write-down: Sales to distributors are made under agreements allowing for subsequent price adjustments and returns, and are deferred until the products are resold by the distributor. Business combination accounting principles require us to write down to fair value the deferred revenue assumed in our acquisitions as we have limited performance obligations associated with this deferred revenue. Our GAAP revenues and related cost of sales for the subsequent reselling by distributors to end customers after an acquisition do not reflect the full amounts that would have been reported if the acquired deferred revenue was not written down to fair value. The non-GAAP adjustments made in Q1 2016 eliminate the effect of the deferred revenue write-down associated with our acquisition of Altera. We believe these adjustments are useful to investors as an additional means to reflect revenue and gross margin trends of our business. |
◦ | Inventory valuation adjustment: Business combination accounting principles require us to measure acquired inventory at fair value. The fair value of inventory reflects the acquired company's cost of manufacturing plus a portion of the expected profit margin. The non-GAAP adjustments to our cost of sales exclude the expected profit margin component that is recorded under business combination accounting principles associated with our acquisitions of Mobileye and Altera. We believe the adjustments are useful to investors as an additional means to reflect cost of sales and gross margin trends of our business. |
• | Amortization of acquisition-related intangible assets: Amortization of acquisition-related intangible assets consists of amortization of intangible assets such as developed technology, brands, and customer relationships acquired in connection with business combinations. We record charges related to the amortization of these intangibles within both cost of sales and operating expenses in our GAAP financial statements. Amortization charges for our acquisition-related intangible assets are inconsistent in size and are significantly impacted by the timing and valuation of our acquisitions. Consequently, our non-GAAP adjustments exclude these charges to facilitate an evaluation of our current operating performance and comparisons to our past operating performance. |
• | Other acquisition-related charges: Other acquisition-related charges exclude the impact of other charges associated with the acquisitions of Mobileye and Altera. These charges primarily include bankers' fees, compensation-related costs, and valuation charges for stock-based compensation incurred related to the acquisitions. We believe these adjustments are useful to investors as an additional means to reflect the spending trends of our business. |
Restructuring and other charges:
Restructuring charges are costs associated with a formal restructuring plan and are primarily related to employee severance and benefit arrangements. Other charges include asset impairments, pension charges, and costs associated with the ISecG divestiture. We exclude restructuring and other charges, including any adjustments to charges recorded in prior periods, for purposes of calculating certain non-GAAP measures. We believe that these costs do not reflect our current operating performance. Consequently, our non-GAAP adjustments exclude these charges to facilitate an evaluation of our current operating performance and comparisons to our past operating performance.
Gains or losses from divestiture:
We recognized a gain in Q2 2017 as a result of our divestiture of ISecG. We have excluded this gain for purposes of calculating certain non-GAAP measures. We believe making these adjustments facilitates a better evaluation of our current operating performance and comparisons to past operating results.
Tax Reform:
We recognized a higher income tax expense in Q4 2017 as a result of Tax Reform. We have excluded the one-time tax adjustment relating to the transition tax on our previously untaxed foreign earnings and the remeasurement of our deferred income taxes to the new U.S. statutory tax rate for purposes of calculating certain non-GAAP measures. We believe making these adjustments facilitates a better evaluation of our current operating performance and comparisons to past operating results.
Following are the reconciliations of our most comparable GAAP measures to our non-GAAP measures presented:
(In Millions) |
| Dec 30, |
| Dec 31, |
| Dec 26, | ||||||
Operating income |
| $ | 17,936 | |
| $ | 12,874 | |
| $ | 14,002 | |
Deferred revenue write-down, net of cost of sales |
| - | |
| 64 | |
| - | | |||
Inventory valuation |
| 55 | |
| 387 | |
| - | | |||
Amortization of acquisition-related intangibles |
| 1,089 | |
| 1,231 | |
| 608 | | |||
Restructuring and other charges |
| 384 | |
| 1,886 | |
| 354 | | |||
Other acquisition-related charges |
| 113 | |
| 100 | |
| - | | |||
Non-GAAP operating income |
| $ | 19,577 | |
| $ | 16,542 | |
| $ | 14,964 | |
OTHER KEY INFORMATION |
| 54 |
Table of Contents
|
| Dec 30, |
| Dec 31, |
| Dec 26, | ||||||
Earnings per share - Diluted |
| $ | 1.99 | |
| $ | 2.12 | |
| $ | 2.33 | |
Deferred revenue write-down, net of cost of sales |
| - | |
| 0.01 | |
| - | | |||
Inventory valuation |
| 0.01 | |
| 0.08 | |
| - | | |||
Amortization of acquisition-related intangibles |
| 0.22 | |
| 0.25 | |
| 0.13 | | |||
Restructuring and other charges |
| 0.08 | |
| 0.39 | |
| 0.07 | | |||
Other acquisition-related charges |
| 0.02 | |
| 0.02 | |
| - | | |||
(Gains)/Losses from divestiture |
| (0.08 | ) |
| - | |
| - | | |||
Tax Reform |
| 1.13 | |
| - | |
| - | | |||
Income tax effect |
| 0.09 | |
| (0.15 | ) |
| (0.04 | ) | |||
Non-GAAP Earnings per share - Diluted |
| $ | 3.46 | |
| $ | 2.72 | |
| $ | 2.49 | |
PROPERTIES
(Square Feet in Millions) |
| United States |
| Other Countries |
| Total | |||
Owned facilities |
| 31.3 | |
| 17.9 | |
| 49.2 | |
Leased facilities |
| 1.6 | |
| 6.3 | |
| 7.9 | |
Total facilities |
| 32.9 | |
| 24.2 | |
| 57.1 | |
Our principal executive offices are located in the U.S. and the majority of our wafer manufacturing activities in 2017 were also located in the U.S. In 2017, we restarted construction on one of our Arizona wafer fabrication facilities that was previously on hold and held in a safe state. For more information on our wafer fabrication and our assembly and test facilities, see "Research and Development (R&D) and Manufacturing" within Fundamentals of Our Business.
We believe that the facilities described above are suitable and adequate for our present purposes and that the productive capacity in our facilities is substantially being utilized or we have plans to utilize it.
We do not identify or allocate assets by operating segment as they are interchangeable in nature and used by multiple operating segments. For information on net property, plant and equipment by country, see " Note 6: Other Financial Statement Details " within the Consolidated Financial Statements.
MARKET FOR REGISTRANT'S COMMON EQUITY
The principal U.S. market on which Intel's common stock (symbol INTC) is traded is the Nasdaq Global Select Market. For information regarding the market price range of Intel common stock and dividend information, see "Financial Information by Quarter (Unaudited)" within the Consolidated Financial Statements.
As of February 7, 2018 , there were approximately 120,000 registered holders of record of Intel's common stock. A substantially greater number of holders of Intel common stock are "street name" or beneficial holders, whose shares of record are held by banks, brokers, and other financial institutions.
ISSUER PURCHASES OF EQUITY SECURITIES
We have an ongoing authorization, originally approved by our Board of Directors in 2005, and subsequently amended, to repurchase shares of our common stock in open market or negotiated transactions. As of December 30, 2017 , we were authorized to repurchase up to $75.0 billion , of which $13.2 billion remained available. This amount includes an increase of $10.0 billion in the authorization limit approved by our Board of Directors in April 2017.
OTHER KEY INFORMATION |
| 55 |
Table of Contents
Period |
| Total Number of Shares Purchased (In Millions) |
| Average Price Paid Per Share |
| Dollar Value of Shares That May Yet Be Purchased Under the Plans (In Millions) | |||||
January 1, 2017 - April 1, 2017 |
| 35.1 | |
| $ | 35.94 | |
| $ | 5,538 | |
April 2, 2017 - July 1, 2017 |
| 37.6 | |
| $ | 35.66 | |
| $ | 14,198 | |
July 2, 2017 - September 30, 2017 |
| 28.6 | |
| $ | 35.19 | |
| $ | 13,191 | |
October 1, 2017 - December 30, 2017 |
| - | |
| $ | - | |
| $ | 13,191 | |
Total |
| 101.3 | |
| | |
|
| |||
We issue RSUs as part of our equity incentive plans. In our consolidated financial statements, we treat shares of common stock withheld for tax purposes on behalf of our employees in connection with the vesting of RSUs as common stock repurchases because they reduce the number of shares that would have been issued upon vesting. These withheld shares of common stock are not considered common stock repurchases under our authorized common stock repurchase plan, and accordingly are not included in the common stock repurchase totals in the preceding table.
Availability of Company Information
Our Internet address is www.intel.com . We publish voluntary reports on our website that outline our performance with respect to corporate responsibility, including environmental, health, and safety compliance.
We use our Investor Relations website, www.intc.com , as a routine channel for distribution of important information, including news releases, analyst presentations, financial information, corporate governance practices, and corporate responsibility information. We post our filings at www.intc.com/sec the same day they are electronically filed with, or furnished to, the SEC, including our annual and quarterly reports on Forms 10-K and 10-Q and current reports on Form 8-K; our proxy statements; and any amendments to those reports or statements. We post our quarterly and annual earnings results at www.intc.com/results.cfm , and do not distribute our financial results via a news wire service. All such postings and filings are available on our Investor Relations website free of charge. In addition, our Investor Relations website allows interested persons to sign up to automatically receive e-mail alerts when we post financial information. The SEC's website, www.sec.gov , contains reports, proxy and information statements, and other information regarding issuers that file electronically with the SEC. The content on any website referred to in this Form 10-K is not incorporated by reference in this Form 10-K unless expressly noted.
OTHER KEY INFORMATION |
| 56 |
Table of Contents
Financial statements and supplemental DETAILS
INDEX TO CONSOLIDATED FINANCIAL STATEMENTS | Page |
Reports of Independent Registered Public Accounting Firm | 58 |
|
|
Consolidated Statements of Income | 60 |
Consolidated Statements of Comprehensive Income | 61 |
Consolidated Balance Sheets | 62 |
Consolidated Statements of Cash Flows | 63 |
Consolidated Statements of Stockholders' Equity | 64 |
|
|
Notes to Consolidated Financial Statements | 65 |
|
|
Basis |
|
Note 1: Basis of Presentation | 65 |
Note 2: Accounting Policies | 65 |
Note 3: Recent Accounting Standards | 71 |
Performance & Operations |
|
Note 4: Operating Segments | 74 |
Note 5: Earnings Per Share | 76 |
Note 6: Other Financial Statement Details | 76 |
Note 7: Restructuring and Other Charges | 78 |
Note 8: Income Taxes | 79 |
Investments, Long-term Assets & Debt |
|
Note 9: Investments | 82 |
Note 10: Acquisitions and Divestitures | 84 |
Note 11: Goodwill | 87 |
Note 12: Identified Intangible Assets | 88 |
Note 13: Other Long-Term Assets | 89 |
Note 14: Borrowings | 89 |
Note 15: Fair Value | 93 |
Risk Management & Other |
|
Note 16: Other Comprehensive Income (Loss) | 94 |
Note 17: Derivative Financial Instruments | 96 |
Note 18: Retirement Benefit Plans | 99 |
Note 19: Employee Equity Incentive Plans | 102 |
Note 20: Commitments and Contingencies | 104 |
|
|
INDEX TO SUPPLEMENTAL DETAILS |
|
Financial Information by Quarter | 107 |
Controls and Procedures | 108 |
Exhibits and Financial Statement Schedules | 109 |
Form 10-K Cross-Reference Index | 114 |
|
| 57 |
Table of Contents
report of independent registered public accounting firm |
To the stockholders and The Board of Directors of Intel Corporation
OPINION ON THE FINANCIAL STATEMENTS
We have audited the accompanying consolidated balance sheets of Intel Corporation (the Company) as of December 30, 2017 and December 31, 2016 , the related consolidated statements of income, comprehensive income, cash flows and stockholders' equity for each of the three years in the period ended December 30, 2017 , and the related notes and Schedule II - Valuation and Qualifying Accounts (collectively referred to as the "consolidated financial statements"). In our opinion, the consolidated financial statements present fairly, in all material respects, the financial position of the Company at December 30, 2017 and December 31, 2016 , and the results of its operations and its cash flows for each of the three years in the period ended December 30, 2017 , in conformity with U.S. generally accepted accounting principles.
We also have audited, in accordance with the standards of the Public Company Accounting Oversight Board (United States) (PCAOB), the Company's internal control over financial reporting as of December 30, 2017 , based on criteria established in Internal Control-Integrated Framework issued by the Committee of Sponsoring Organizations of the Treadway Commission (2013 framework) and our report dated February 16, 2018 expressed an unqualified opinion thereon.
BASIS FOR OPINION
These financial statements are the responsibility of the Company's management. Our responsibility is to express an opinion on the Company's financial statements based on our audits. We are a public accounting firm registered with the PCAOB and are required to be independent with respect to the Company in accordance with the U.S. federal securities laws and the applicable rules and regulations of the Securities and Exchange Commission and the PCAOB.
We conducted our audits in accordance with the standards of the PCAOB. Those standards require that we plan and perform the audit to obtain reasonable assurance about whether the financial statements are free of material misstatement, whether due to error or fraud. Our audits included performing procedures to assess the risks of material misstatement of the financial statements, whether due to error or fraud, and performing procedures that respond to those risks. Such procedures included examining, on a test basis, evidence regarding the amounts and disclosures in the financial statements. Our audits also included evaluating the accounting principles used and significant estimates made by management, as well as evaluating the overall presentation of the financial statements. We believe that our audits provide a reasonable basis for our opinion.
/s/ Ernst & Young LLP
We have served as the Company's auditor since 1968.
San Jose, California
February 16, 2018
AUDITOR'S REPORT |
| 58 |
Table of Contents
report of independent registered public accounting firm |
To the stockholders and The Board of Directors of Intel Corporation
OPINION ON INTERNAL CONTROL OVER FINANCIAL REPORTING
We have audited Intel Corporation's internal control over financial reporting as of December 30, 2017 , based on criteria established in Internal Control-Integrated Framework issued by the Committee of Sponsoring Organizations of the Treadway Commission (2013 framework) (the COSO criteria). In our opinion, Intel Corporation (the Company) maintained, in all material respects, effective internal control over financial reporting as of December 30, 2017 , based on the COSO criteria.
We also have audited, in accordance with the standards of the Public Company Accounting Oversight Board (United States) (PCAOB), the 2017 consolidated financial statements of the Company and our report dated February 16, 2018 expressed an unqualified opinion thereon.
BASIS FOR OPINION
The Company's management is responsible for maintaining effective internal control over financial reporting and for its assessment of the effectiveness of internal control over financial reporting included in the accompanying Management Report on Internal Control Over Financial Reporting. Our responsibility is to express an opinion on the Company's internal control over financial reporting based on our audit. We are a public accounting firm registered with the PCAOB and are required to be independent with respect to the Company in accordance with the U.S. federal securities laws and the applicable rules and regulations of the Securities and Exchange Commission and the PCAOB.
We conducted our audit in accordance with the standards of the PCAOB. Those standards require that we plan and perform the audit to obtain reasonable assurance about whether effective internal control over financial reporting was maintained in all material respects.
Our audit included obtaining an understanding of internal control over financial reporting, assessing the risk that a material weakness exists, testing and evaluating the design and operating effectiveness of internal control based on the assessed risk, and performing such other procedures as we considered necessary in the circumstances. We believe that our audit provides a reasonable basis for our opinion.
DEFINITION AND LIMITATIONS OF INTERNAL CONTROL OVER FINANCIAL REPORTING
A company‘s internal control over financial reporting is a process designed to provide reasonable assurance regarding the reliability of financial reporting and the preparation of financial statements for external purposes in accordance with generally accepted accounting principles. A company's internal control over financial reporting includes those policies and procedures that (1) pertain to the maintenance of records that, in reasonable detail, accurately and fairly reflect the transactions and dispositions of the assets of the company; (2) provide reasonable assurance that transactions are recorded as necessary to permit preparation of financial statements in accordance with generally accepted accounting principles, and that receipts and expenditures of the company are being made only in accordance with authorizations of management and directors of the company; and (3) provide reasonable assurance regarding prevention or timely detection of unauthorized acquisition, use, or disposition of the company's assets that could have a material effect on the financial statements.
Because of its inherent limitations, internal control over financial reporting may not prevent or detect misstatements. Also, projections of any evaluation of effectiveness to future periods are subject to the risk that controls may become inadequate because of changes in conditions, or that the degree of compliance with the policies or procedures may deteriorate.
/s/ Ernst & Young LLP
San Jose, California
February 16, 2018
AUDITOR'S REPORT |
| 59 |
Table of Contents
intel corporationconsolidated statements of income |
Years Ended |
| Dec 30, |
| Dec 31, |
| Dec 26, | ||||||
Net revenue |
| $ | 62,761 | |
| $ | 59,387 | |
| $ | 55,355 | |
Cost of sales |
| 23,692 | |
| 23,196 | |
| 20,676 | | |||
Gross margin |
| 39,069 | |
| 36,191 | |
| 34,679 | | |||
Research and development |
| 13,098 | |
| 12,740 | |
| 12,128 | | |||
Marketing, general and administrative |
| 7,474 | |
| 8,397 | |
| 7,930 | | |||
Restructuring and other charges |
| 384 | |
| 1,886 | |
| 354 | | |||
Amortization of acquisition-related intangibles |
| 177 | |
| 294 | |
| 265 | | |||
Operating expenses |
| 21,133 | |
| 23,317 | |
| 20,677 | | |||
Operating income |
| 17,936 | |
| 12,874 | |
| 14,002 | | |||
Gains (losses) on equity investments, net |
| 2,651 | |
| 506 | |
| 315 | | |||
Interest and other, net |
| (235 | ) |
| (444 | ) |
| (105 | ) | |||
Income before taxes |
| 20,352 | |
| 12,936 | |
| 14,212 | | |||
Provision for taxes |
| 10,751 | |
| 2,620 | |
| 2,792 | | |||
Net income |
| $ | 9,601 | |
| $ | 10,316 | |
| $ | 11,420 | |
Earnings per share - Basic |
| $ | 2.04 | |
| $ | 2.18 | |
| $ | 2.41 | |
Earnings per share - Diluted |
| $ | 1.99 | |
| $ | 2.12 | |
| $ | 2.33 | |
Weighted average shares of common stock outstanding: |
|
|
|
|
|
| ||||||
Basic |
| 4,701 | |
| 4,730 | |
| 4,742 | | |||
Diluted |
| 4,835 | |
| 4,875 | |
| 4,894 | | |||
See accompanying notes.
FINANCIAL STATEMENTS | Consolidated Statements of Income | 60 |
Table of Contents
Intel corporationconsolidated statements of comprehensive income |
Years Ended |
| Dec 30, |
| Dec 31, |
| Dec 26, | ||||||
Net income |
| $ | 9,601 | |
| $ | 10,316 | |
| $ | 11,420 | |
Changes in other comprehensive income, net of tax: |
|
|
|
|
|
| ||||||
Net unrealized holding gains (losses) on available-for-sale investments |
| (436 | ) |
| 415 | |
| (710 | ) | |||
Deferred tax asset valuation allowance |
| - | |
| (8 | ) |
| (18 | ) | |||
Net unrealized holding gains (losses) on derivatives |
| 365 | |
| 7 | |
| 157 | | |||
Actuarial valuation and other pension expenses |
| 317 | |
| (364 | ) |
| 135 | | |||
Net foreign currency translation adjustment |
| 510 | |
| (4 | ) |
| (170 | ) | |||
Other comprehensive income (loss) |
| 756 | |
| 46 | |
| (606 | ) | |||
Total comprehensive income |
| $ | 10,357 | |
| $ | 10,362 | |
| $ | 10,814 | |
See accompanying notes.
FINANCIAL STATEMENTS | Consolidated Statements of Comprehensive Income | 61 |
Table of Contents
intel corporationConsolidated balance sheets |
|
| Dec 30, |
| Dec 31, | ||||
Assets |
|
|
|
| ||||
Current assets: |
|
|
|
| ||||
Cash and cash equivalents |
| $ | 3,433 | |
| $ | 5,560 | |
Short-term investments |
| 1,814 | |
| 3,225 | | ||
Trading assets |
| 8,755 | |
| 8,314 | | ||
Accounts receivable, net of allowance for doubtful accounts of $25 ($37 in 2016) |
| 5,607 | |
| 4,690 | | ||
Inventories |
| 6,983 | |
| 5,553 | | ||
Assets held for sale |
| - | |
| 5,210 | | ||
Other current assets |
| 2,908 | |
| 2,956 | | ||
Total current assets |
| 29,500 | |
| 35,508 | | ||
|
|
|
|
| ||||
Property, plant and equipment, net |
| 41,109 | |
| 36,171 | | ||
Marketable equity securities |
| 4,192 | |
| 6,180 | | ||
Other long-term investments |
| 3,712 | |
| 4,716 | | ||
Goodwill |
| 24,389 | |
| 14,099 | | ||
Identified intangible assets, net |
| 12,745 | |
| 9,494 | | ||
Other long-term assets |
| 7,602 | |
| 7,159 | | ||
Total assets |
| $ | 123,249 | |
| $ | 113,327 | |
|
|
|
|
| ||||
Liabilities, temporary equity, and stockholders' equity |
|
|
|
| ||||
Current liabilities: |
|
|
|
| ||||
Short-term debt |
| $ | 1,776 | |
| $ | 4,634 | |
Accounts payable |
| 2,928 | |
| 2,475 | | ||
Accrued compensation and benefits |
| 3,526 | |
| 3,465 | | ||
Deferred income |
| 1,656 | |
| 1,718 | | ||
Liabilities held for sale |
| - | |
| 1,920 | | ||
Other accrued liabilities |
| 7,535 | |
| 6,090 | | ||
Total current liabilities |
| 17,421 | |
| 20,302 | | ||
|
|
|
|
| ||||
Long-term debt |
| 25,037 | |
| 20,649 | | ||
Long-term deferred tax liabilities |
| 3,046 | |
| 1,730 | | ||
Other long-term liabilities |
| 7,860 | |
| 3,538 | | ||
Commitments and Contingencies (Note 20) |
| |
| | ||||
Temporary equity |
| 866 | |
| 882 | | ||
Stockholders' equity: |
|
|
|
| ||||
Preferred stock, $0.001 par value, 50 shares authorized; none issued |
| - | |
| - | | ||
Common stock, $0.001 par value, 10,000 shares authorized; 4,687 shares issued and outstanding (4,730 issued and outstanding in 2016) and capital in excess of par value |
| 26,074 | |
| 25,373 | | ||
Accumulated other comprehensive income (loss) |
| 862 | |
| 106 | | ||
Retained earnings |
| 42,083 | |
| 40,747 | | ||
Total stockholders' equity |
| 69,019 | |
| 66,226 | | ||
Total liabilities, temporary equity, and stockholders' equity |
| $ | 123,249 | |
| $ | 113,327 | |
See accompanying notes.
FINANCIAL STATEMENTS | Consolidated Balance Sheets | 62 |
Table of Contents
intel corporationconsolidated statements of cash flows |
Years Ended |
| Dec 30, |
| Dec 31, |
| Dec 26, | ||||||
Cash and cash equivalents, beginning of period |
| $ | 5,560 | |
| $ | 15,308 | |
| $ | 2,561 | |
Cash flows provided by (used for) operating activities: |
|
|
|
|
|
| ||||||
Net income |
| 9,601 | |
| 10,316 | |
| 11,420 | | |||
Adjustments to reconcile net income to net cash provided by operating activities: |
|
|
|
|
|
| ||||||
Depreciation |
| 6,752 | |
| 6,266 | |
| 7,821 | | |||
Share-based compensation |
| 1,358 | |
| 1,444 | |
| 1,305 | | |||
Restructuring and other charges |
| 384 | |
| 1,886 | |
| 354 | | |||
Amortization of intangibles |
| 1,377 | |
| 1,524 | |
| 890 | | |||
(Gains) losses on equity investments, net |
| (2,583 | ) |
| (432 | ) |
| (263 | ) | |||
Loss on debt conversion and extinguishment |
| 476 | |
| - | |
| - | | |||
(Gains) losses on divestitures |
| (387 | ) |
| - | |
| - | | |||
Deferred taxes |
| 1,548 | |
| 257 | |
| (1,270 | ) | |||
Changes in assets and liabilities: 1 |
|
|
|
|
|
| ||||||
Accounts receivable |
| (781 | ) |
| 65 | |
| (355 | ) | |||
Inventories |
| (1,300 | ) |
| 119 | |
| (764 | ) | |||
Accounts payable |
| 191 | |
| 182 | |
| (312 | ) | |||
Accrued compensation and benefits |
| (73 | ) |
| (1,595 | ) |
| (711 | ) | |||
Income taxes payable and receivable |
| 5,230 | |
| 1,382 | |
| 386 | | |||
Other assets and liabilities |
| 317 | |
| 394 | |
| 517 | | |||
Total adjustments |
| 12,509 | |
| 11,492 | |
| 7,598 | | |||
Net cash provided by operating activities |
| 22,110 | |
| 21,808 | |
| 19,018 | | |||
Cash flows provided by (used for) investing activities: |
|
|
|
|
|
| ||||||
Additions to property, plant and equipment |
| (11,778 | ) |
| (9,625 | ) |
| (7,326 | ) | |||
Acquisitions, net of cash acquired |
| (14,499 | ) |
| (15,470 | ) |
| (913 | ) | |||
Purchases of available-for-sale investments |
| (2,764 | ) |
| (9,269 | ) |
| (8,259 | ) | |||
Sales of available-for-sale investments |
| 6,978 | |
| 3,852 | |
| 2,090 | | |||
Maturities of available-for-sale investments |
| 3,687 | |
| 5,654 | |
| 6,168 | | |||
Purchases of trading assets |
| (13,700 | ) |
| (12,237 | ) |
| (11,485 | ) | |||
Maturities and sales of trading assets |
| 13,975 | |
| 10,907 | |
| 13,372 | | |||
Investments in non-marketable equity investments |
| (1,601 | ) |
| (963 | ) |
| (2,011 | ) | |||
Proceeds from divestitures |
| 3,124 | |
| - | |
| - | | |||
Other investing |
| 816 | |
| 1,334 | |
| 181 | | |||
Net cash used for investing activities |
| (15,762 | ) |
| (25,817 | ) |
| (8,183 | ) | |||
Cash flows provided by (used for) financing activities: |
|
|
|
|
|
| ||||||
Issuance of long-term debt, net of issuance costs |
| 7,716 | |
| 2,734 | |
| 9,476 | | |||
Repayment of debt and debt conversion |
| (8,080 | ) |
| (1,500 | ) |
| - | | |||
Proceeds from sales of common stock through employee equity incentive plans |
| 770 | |
| 1,108 | |
| 866 | | |||
Repurchase of common stock |
| (3,615 | ) |
| (2,587 | ) |
| (3,001 | ) | |||
Payment of dividends to stockholders |
| (5,072 | ) |
| (4,925 | ) |
| (4,556 | ) | |||
Other financing |
| (194 | ) |
| (569 | ) |
| (873 | ) | |||
Net cash provided by (used for) financing activities |
| (8,475 | ) |
| (5,739 | ) |
| 1,912 | | |||
Net increase (decrease) in cash and cash equivalents |
| (2,127 | ) |
| (9,748 | ) |
| 12,747 | | |||
Cash and cash equivalents, end of period |
| $ | 3,433 | |
| $ | 5,560 | |
| $ | 15,308 | |
Supplemental disclosures: |
|
|
|
|
|
| ||||||
Acquisition of property, plant and equipment included in accounts payable and accrued liabilities |
| $ | 1,417 | |
| $ | 979 | |
| $ | 392 | |
Non-marketable equity investment in McAfee from divestiture |
| $ | 1,078 | |
| $ | - | |
| $ | - | |
Cash paid during the year for: |
|
|
|
|
|
| ||||||
Interest, net of capitalized interest and interest rate swap payments/receipts |
| $ | 624 | |
| $ | 682 | |
| $ | 186 | |
Income taxes, net of refunds |
| $ | 3,824 | |
| $ | 877 | |
| $ | 3,439 | |
1 | The impact of assets and liabilities reclassified as held for sale was not considered in the changes in assets and liabilities within cash flows from operating activities. See " Note 10: Acquisitions and Divestitures " for additional information. |
See accompanying notes.
FINANCIAL STATEMENTS | Consolidated Statements of Cash Flows | 63 |
Table of Contents
intel corporationconsolidated statements of stockholders' equity |
|
| Common Stock and Capital |
| Accumulated |
| Retained |
| Total | |||||||||||
|
| Number of |
| Amount |
| ||||||||||||||
Balance as of December 27, 2014 |
| 4,748 | |
| $ | 21,781 | |
| $ | 666 | |
| $ | 33,418 | |
| $ | 55,865 | |
Components of comprehensive income, net of tax: |
|
|
|
|
|
|
|
|
|
| |||||||||
Net income |
| - | |
| - | |
| - | |
| 11,420 | |
| 11,420 | | ||||
Other comprehensive income (loss) |
| - | |
| - | |
| (606 | ) |
| - | |
| (606 | ) | ||||
Total comprehensive income |
|
|
|
|
|
|
|
|
| 10,814 | | ||||||||
Proceeds from sales of common stock through employee equity incentive plans, net tax benefit, and other |
| 87 | |
| 1,091 | |
| - | |
| - | |
| 1,091 | | ||||
Share-based compensation |
| - | |
| 1,314 | |
| - | |
| - | |
| 1,314 | | ||||
Repurchase of common stock |
| (96 | ) |
| (453 | ) |
| - | |
| (2,548 | ) |
| (3,001 | ) | ||||
Restricted stock unit withholdings |
| (14 | ) |
| (322 | ) |
| - | |
| (120 | ) |
| (442 | ) | ||||
Cash dividends declared ($0.96 per share of common stock) |
| - | |
| - | |
| - | |
| (4,556 | ) |
| (4,556 | ) | ||||
Balance as of December 26, 2015 |
| 4,725 | |
| 23,411 | |
| 60 | |
| 37,614 | |
| 61,085 | | ||||
Components of comprehensive income, net of tax: |
|
|
|
|
|
|
|
|
|
| |||||||||
Net income |
| - | |
| - | |
| - | |
| 10,316 | |
| 10,316 | | ||||
Other comprehensive income (loss) |
| - | |
| - | |
| 46 | |
| - | |
| 46 | | ||||
Total comprehensive income |
|
|
|
|
|
|
|
|
| 10,362 | | ||||||||
Proceeds from sales of common stock through employee equity incentive plans, net excess tax benefit, and other |
| 101 | |
| 1,322 | |
| - | |
| - | |
| 1,322 | | ||||
Share-based compensation |
| - | |
| 1,438 | |
| - | |
| - | |
| 1,438 | | ||||
Repurchase of common stock |
| (81 | ) |
| (412 | ) |
| - | |
| (2,180 | ) |
| (2,592 | ) | ||||
Restricted stock unit withholdings |
| (15 | ) |
| (386 | ) |
| - | |
| (78 | ) |
| (464 | ) | ||||
Cash dividends declared ($1.04 per share of common stock) |
| - | |
| - | |
| - | |
| (4,925 | ) |
| (4,925 | ) | ||||
Balance as of December 31, 2016 |
| 4,730 | |
| 25,373 | |
| 106 | |
| 40,747 | |
| 66,226 | | ||||
Components of comprehensive income, net of tax: |
|
|
|
|
|
|
|
|
|
| |||||||||
Net income |
| - | |
| - | |
| - | |
| 9,601 | |
| 9,601 | | ||||
Other comprehensive income (loss) |
| - | |
| - | |
| 756 | |
| - | |
| 756 | | ||||
Total comprehensive income |
|
|
|
|
|
|
|
|
| 10,357 | | ||||||||
Proceeds from sales of common stock through employee equity incentive plans, net excess tax benefit, and other 1 |
| 70 | |
| 1,172 | |
| - | |
| (1 | ) |
| 1,171 | | ||||
Share-based compensation |
| - | |
| 1,296 | |
| - | |
| - | |
| 1,296 | | ||||
Convertible debt |
| - | |
| (894 | ) |
| - | |
| - | |
| (894 | ) | ||||
Repurchase of common stock |
| (101 | ) |
| (552 | ) |
| - | |
| (3,057 | ) |
| (3,609 | ) | ||||
Restricted stock unit withholdings |
| (12 | ) |
| (321 | ) |
| - | |
| (135 | ) |
| (456 | ) | ||||
Cash dividends declared ($1.0775 per share of common stock) |
| - | |
| - | |
| - | |
| (5,072 | ) |
| (5,072 | ) | ||||
Balance as of December 30, 2017 |
| 4,687 | |
| $ | 26,074 | |
| $ | 862 | |
| $ | 42,083 | |
| $ | 69,019 | |
1 | Includes approximately $ 375 million of noncontrolling interest activity due to our acquisition of Mobileye. |
See accompanying notes.
FINANCIAL STATEMENTS | Consolidated Statements of Stockholders' Equity | 64 |
Table of Contents
intel corporationnotes to consolidated financial statements |
Note 1: Basis of Presentation
We have a 52- or 53-week fiscal year that ends on the last Saturday in December. Fiscal year 2017 was a 52-week fiscal year, while fiscal year 2016 was a 53-week fiscal year with the first quarter of 2016 being a 14-week quarter. Fiscal year 2015 was a 52-week year. Our consolidated financial statements include the accounts of Intel Corporation (Intel) and our subsidiaries. We have eliminated intercompany accounts and transactions. We have reclassified certain prior period amounts to conform to current period presentation.
USE OF ESTIMATES
The preparation of consolidated financial statements in conformity with U.S. generally accepted accounting principles (U.S. GAAP) requires us to make estimates and judgments that affect the amounts reported in our consolidated financial statements and the accompanying notes. The actual results that we experience may differ materially from our estimates.
During our 2015 annual assessment of the useful lives of our property, plant and equipment, we determined that the estimated useful lives of machinery and equipment in our wafer fabrication facilities should be increased from 4 to 5 years because the lengthening of the process technology cadence resulted in longer node transitions on both 14 nanometer (nm) and 10nm products. We have also increased the re-use of machinery and tools across each generation of process technology. This change in estimate was applied prospectively, effective at the beginning of 2016. During 2016, this change increased our operating income by approximately $1.3 billion , our net income by approximately $950 million , and our diluted earnings per share by approximately $0.19 .
Note 2: Accounting Policies
REVENUE RECOGNITION
We recognize net product revenue when the earnings process is complete and the risks and rewards of product ownership have transferred to our customers, as evidenced by the existence of an agreement, delivery having occurred, pricing being deemed fixed, and collection being considered probable. We record pricing allowances, including discounts based on contractual arrangements with customers, when we recognize revenue as a reduction to both accounts receivable and net revenue. On sales made to distributors that allow for price protections or right of return until the distributor sells through the merchandise, we defer product revenue, and related costs of sales, due to sales price reductions and rapid technology obsolescence in our industry. The right of return granted generally consists of a stock rotation program in which distributors are able to exchange certain products based on the number of qualified purchases made by the distributor. Under the price protection program, we give distributors credits for the difference between the original price paid and the current price that we offer. We include shipping charges billed to customers in net revenue, and include the related shipping costs in cost of sales.
We make payments to our customers through cooperative advertising programs, such as our Intel Inside® program, for marketing activities for certain of our products. We accrue cooperative advertising obligations and record the costs at the same time that the related revenue is recognized. We record cooperative advertising costs as marketing, general and administrative (MG&A) expenses to the extent that an advertising benefit separate from the revenue transaction can be identified and the fair value of that advertising benefit received is determinable. We record any excess in cash paid to customers over the fair value of the advertising benefit we receive as a reduction in revenue.
During the first half of 2017, our cooperative advertising costs under the Intel Inside program met the criteria to be recorded as MG&A. During the second half of 2017, we transitioned customers from previous offerings under the Intel Inside program to cooperative advertising offerings more tailored to customers and their marketing audiences. In the second half of 2017, cooperative advertising costs were recorded as a reduction of revenue, as we no longer met the criteria for recording these expenses within MG&A.
FINANCIAL STATEMENTS | Notes to Financial Statements | 65 |
Table of Contents
INVENTORIES
We compute inventory cost on a first-in, first-out basis. Our process and product development life cycle corresponds with substantive engineering milestones. These engineering milestones are regularly and consistently applied in assessing the point at which our activities, and associated costs, change in nature from research and development (R&D) to cost of sales and when cost of sales can be capitalized as inventory.
For a product to be manufactured in high volumes and sold to our customers under our standard warranty, it must meet our rigorous technical quality specifications. This milestone is known as product release qualification (PRQ). We have identified PRQ as the point at which the costs incurred to manufacture our products are included in the valuation of inventory. Prior to PRQ, costs that do not meet the criteria for R&D are included in cost of sales in the period incurred. If the point at which we estimate that inventory meets PRQ criteria changes in the future, the timing and recognition of costs would shift between inventory, and R&D and costs of sales. A single PRQ has previously ranged up to $770 million and is dependent on product type.
The valuation of inventory includes determining which fixed production overhead costs can be included in inventory based on the normal capacity of our manufacturing and assembly and test facilities. We apply our historical loadings compared to our total available capacity in a statistical model to determine our normal capacity level. If the factory loadings are below the established normal capacity level, a portion of our fixed production overhead costs would not be included in the cost of inventory; instead, it would be recognized as cost of sales in that period. We refer to these costs as excess capacity charges. Excess capacity charges are insignificant in the years presented, charges in certain prior years have ranged from $46 million to $1.1 billion . The high end of the range would be $540 million when excluding the $1.1 billion charge taken in connection with the 2009 economic recession.
Inventory is valued at the lower of cost or net realizable value, based upon assumptions about future demand and market conditions. Product-specific facts and circumstances reviewed in the inventory valuation process include a review of our customer base, the stage of the product life cycle, and an assessment of selling price in relation to product cost. Inventory reserves increased by approximately $185 million in 2017 compared to 2016 .
The valuation of inventory also requires us to estimate obsolete and excess inventory, as well as inventory that is not of saleable quality. We use the demand forecast to develop our short-term manufacturing plans to enable consistency between inventory valuations and build decisions. We compare the estimate of future demand to work in process and finished goods inventory levels to determine the amount, if any, of obsolete or excess inventory. If our demand forecast for specific products is greater than actual demand and we fail to reduce manufacturing output accordingly, we could be required to write off inventory.
PROPERTY, PLANT AND EQUIPMENT
We compute depreciation using the straight-line method over the estimated useful life of assets. We also capitalize interest on borrowings related to eligible capital expenditures. Capitalized interest is added to the cost of qualified assets and depreciated together with that asset cost. We record capital-related government grants earned as a reduction to property, plant and equipment.
Annually, we evaluate the period over which we expect to recover the economic value of our property, plant and equipment, considering factors such as the process technology cadence between node transitions, changes in machinery and equipment technology, and re-use of machinery and tools across each generation of process technology. As we make manufacturing process conversions and other factory planning decisions, we use assumptions involving the use of management judgments regarding the remaining useful lives of assets, primarily process-specific semiconductor manufacturing tools and building improvements. When we determine that the useful lives of assets are shorter or longer than we had originally estimated, we adjust the rate of depreciation to reflect the assets' revised useful lives.
We assess property, plant and equipment for impairment when events or changes in circumstances indicate that the carrying value of the assets or the asset grouping may not be recoverable. Factors that we consider in deciding when to perform an impairment review include significant under-performance of a business or product line in relation to expectations, significant negative industry or economic trends, and significant changes or planned changes in our use of the assets. We measure the recoverability of assets that we will continue to use in our operations by comparing the carrying value of the asset grouping to our estimate of the related total future undiscounted net cash flows arising from the use of that asset grouping. If an asset grouping carrying value is not recoverable through the related undiscounted cash flows, the asset grouping is considered to be impaired. We measure the impairment by comparing the difference between the asset grouping carrying value and its fair value.
We may have certain facilities, included within construction in progress, being held in a safe state and not currently in use that we plan to place into service at a future date. The time at which these assets are placed into service depends on our existing manufacturing capacity, market demand for our products, and where we are in the transition of products on our roadmap. Management makes judgments about the timing of when these facilities will be readied for their intended use and placed into service for the manufacturing of our products. Depreciation is not recognized on these assets and they are not eligible for capitalized interest when construction is on hold.
FINANCIAL STATEMENTS | Notes to Financial Statements | 66 |
Table of Contents
FAIR VALUE
When determining fair value, we consider the principal or most advantageous market in which we would transact, as well as assumptions that market participants would use when pricing the asset or liability. Our financial assets are measured and recorded at fair value, except for cost method investments, cost method loans receivable, equity method investments, grants receivable, and reverse repurchase agreements with original maturities greater than three months.
The three levels of inputs that may be used to measure fair value are:
• | Level 1. Quoted prices in active markets for identical assets or liabilities. We evaluate security-specific market data when determining whether a market is active. |
• | Level 2. Observable inputs other than Level 1 prices, such as quoted prices for similar assets or liabilities, quoted prices in less active markets, or model-derived valuations. All significant inputs used in our valuations, such as discounted cash flows, are observable or can be derived principally from or corroborated with observable market data for substantially the full term of the assets or liabilities. We use LIBOR-based yield curves, currency spot and forward rates, and credit ratings as significant inputs in our valuations. Level 2 inputs also include non-binding market consensus prices as well as quoted prices that were adjusted for security-specific restrictions. When we use non-binding market consensus prices, we corroborate them with quoted market prices for similar instruments or compare them to output from internally developed pricing models such as discounted cash flow models. |
• | Level 3. Unobservable inputs to the valuation methodology that are significant to the measurement of the fair value of assets or liabilities. We monitor and review the inputs and results of these valuation models to help ensure the fair value measurements are reasonable and consistent with market experience in similar asset classes. Level 3 inputs also include non-binding market consensus prices or non-binding broker quotes that we were unable to corroborate with observable market data. |
CASH EQUIVALENTS
We consider all highly liquid debt investments with original maturities from the date of purchase of three months or less as cash equivalents. Cash equivalents can include investments such as corporate debt, financial institution instruments, government debt, and reverse repurchase agreements.
TRADING ASSETS
Marketable debt instruments are generally designated as trading assets when a market risk is economically hedged at inception with a related derivative instrument, or when the marketable debt instrument itself is used to economically hedge currency exchange rate risk from remeasurement. Investments designated as trading assets are reported at fair value. The gains or losses on these investments arising from changes in fair value due to interest rate and currency market fluctuations and credit market volatility, largely offset by losses or gains on the related derivative instruments and balance sheet remeasurement, are recorded in interest and other, net.
AVAILABLE-FOR-SALE INVESTMENTS
Available-for-sale investments are classified within cash and cash equivalents, short-term investments, marketable equity securities, or long-term investments based on the remaining maturity of the investment.
Investments designated as available-for-sale are reported at fair value, with unrealized gains or losses, net of tax, recorded in accumulated other comprehensive income (loss), except as noted in our other-than-temporary impairment policy. We determine the cost of the investment sold based on an average cost basis at the individual security level. Our available-for-sale investments include:
• | Marketable debt instruments when the interest rate and foreign currency risks are not hedged at the inception of the investment or when our criteria for designation as trading assets are not met. We record the interest income and realized gains or losses on the sale of these instruments in interest and other, net. |
• | Marketable equity securities when there is no plan to sell or hedge the investment at the time of original classification. We acquire these equity securities to promote business and strategic objectives. We record the realized gains or losses on the sale or exchange of marketable equity securities in gains (losses) on equity investments, net. |
NON-MARKETABLE AND EQUITY METHOD INVESTMENTS
We regularly invest in non-marketable equity instruments of private companies. We account for marketable and non-marketable equity securities as equity method investments when we have the ability to exercise significant influence but do not have control over the investee. Our proportionate share of the income or loss from equity method investments is recognized on a one-quarter lag and is recorded in gains (losses) on equity investments, net. Non-marketable equity investments over which we cannot exercise significant influence are accounted for as cost method investments.
The carrying value of our non-marketable equity investment portfolio totaled $4.5 billion as of December 30, 2017 ( $4.4 billion as of December 31, 2016 ), and is included in other long-term assets.
FINANCIAL STATEMENTS | Notes to Financial Statements | 67 |
Table of Contents
Our quarterly impairment analysis considers both qualitative and quantitative factors that may have a significant impact on the investee's fair value. Qualitative factors considered include industry and market conditions, the financial performance and near-term prospects of the investee, and other relevant events and factors affecting the investee. We prepare quarterly quantitative assessments of the fair value of our non-marketable equity investments using both the market and income approaches, which require judgment and the use of estimates, including discount rates, investee revenues and costs, and comparable market data of private and public companies, among others.
OTHER-THAN-TEMPORARY IMPAIRMENT
Our available-for-sale debt securities, marketable equity securities, and non-marketable equity investments are subject to periodic impairment reviews.
• | For available-for-sale debt securities , we consider whether it is more likely than not that we will be required to sell the security before recovery of its amortized cost basis, or whether recovery of the entire amortized cost basis of the security is unlikely because a credit loss exists. When we do not expect to recover the entire amortized cost basis of the security, we separate other-than-temporary impairments into amounts representing credit losses, which are recognized in interest and other, net, and amounts not related to credit losses, which are recognized in other comprehensive income (loss). |
• | For marketable equity securities , we consider the severity and duration of the decline in fair value below cost and our ability and intent to hold the security for a sufficient period of time to allow for recovery of value in the foreseeable future based on the financial health of, and business outlook for, the investee. |
• | For non-marketable equity investments , we consider the severity and duration of the impairment, the investee's financial condition and business outlook, industry and sector performance, market for technology, operational and financing cash flow factors, and changes in the investee's credit rating, among other qualitative and quantitative criteria. Impairments of non-marketable equity investments were $555 million in 2017 ( $184 million in 2016 and $166 million in 2015 ). |
We record other-than-temporary impairments for marketable equity securities, non-marketable cost method investments, and equity method investments in gains (losses) on equity investments, net.
DERIVATIVE FINANCIAL INSTRUMENTS
Our primary objective for holding derivative financial instruments is to manage currency exchange rate risk and interest rate risk, and, to a lesser extent, equity market risk, commodity price risk, and credit risk. We enter into master netting arrangements to mitigate credit risk in derivative transactions by permitting net settlement of transactions with the same counterparty. A master netting arrangement allows counterparties to net settle amounts owed to each other as a result of multiple, separate derivative transactions. We also enter into collateral security arrangements with certain of our counterparties to exchange cash collateral when the net fair value of certain derivative instruments fluctuates from contractually established thresholds. We record the collateral within current other assets and long-term other assets with a corresponding liability. For presentation on our consolidated balance sheets, we do not offset fair value amounts recognized for derivative instruments under master netting arrangements. Our derivative financial instruments are presented at fair value on a gross basis and are included in other current assets, other long-term assets, other accrued liabilities, or other long-term liabilities.
Cash Flow Hedges
We use foreign currency contracts, such as currency forwards and currency interest rate swaps, to hedge exposures for the following items:
• | Variability in the U.S.-dollar equivalent of non-U.S.-dollar-denominated cash flows associated with our forecasted operating and capital purchases spending; and |
• | Coupon and principal payments for our non-U.S.-dollar-denominated indebtedness. |
The after-tax gains or losses from the effective portion of a cash flow hedge is reported as a component of accumulated other comprehensive income (loss) and reclassified into earnings in the same period or periods in which the hedged transaction affects earnings, and in the same line item on the consolidated statements of income as the impact of the hedge transaction. For foreign currency contracts hedging our capital purchases, forward points are excluded from the hedge effectiveness assessment. Ineffective portions of cash flow hedges, as well as amounts excluded from the hedge effectiveness assessment, are recognized in earnings in interest and other, net. If the cash flow hedge transactions become probable not to occur, the corresponding amounts deferred in accumulated other comprehensive income (loss) would be immediately reclassified to interest and other, net. These derivatives are classified in the consolidated statements of cash flows in the same section as the underlying item.
Fair Value Hedges
We use interest rate contracts, such as interest rate swaps, to hedge against changes in the fair value on certain of our fixed-rate indebtedness attributable to changes in the benchmark interest rate. The gains or losses on these hedges, as well as the offsetting losses or gains related to the changes in the fair value of the underlying hedged item attributable to the hedged risk, are recognized in earnings in the current period, primarily in interest and other, net. These derivatives are classified in the consolidated statements of cash flows in the same section as the underlying item, primarily within cash flows from financing activities.
FINANCIAL STATEMENTS | Notes to Financial Statements | 68 |
Table of Contents
Non-Designated Hedges
We use foreign currency contracts to economically hedge the functional currency equivalent cash flows of recognized monetary assets and liabilities, non-U.S.-dollar-denominated debt instruments classified as trading assets, and non-U.S.-dollar-denominated loans receivables recognized at fair value. We also use interest rate contracts to hedge interest rate risk related to our U.S.-dollar-denominated fixed-rate debt instruments classified as trading assets.
The change in fair value of these derivatives is recorded through earnings in the line item on the consolidated statements of income to which the derivatives most closely relate, primarily in interest and other, net. Changes in the fair value of the underlying assets and liabilities associated with the hedged risk are generally offset by the changes in the fair value of the related derivatives.
LOANS RECEIVABLE
We elect the fair value option when the interest rate or foreign currency exchange rate risk is economically hedged at the inception of the loan with a related derivative instrument. When the fair value option is not elected, the loans are carried at amortized cost. We measure interest income for all loans receivable using the interest method, which is based on the effective yield of the loans rather than the stated coupon rate. We classify our loans within other current and long-term assets.
CREDIT RISK
Financial instruments that potentially subject us to concentrations of credit risk consist principally of investments in debt instruments, derivative financial instruments, loans receivable, reverse repurchase agreements, and trade receivables. We enter into master netting arrangements to mitigate credit risk in derivative transactions by permitting net settlement of transactions with the same counterparty.
We generally place investments with high-credit-quality counterparties and, by policy, we limit the amount of credit exposure to any one counterparty based on our analysis of that counterparty's relative credit standing. As required per our investment policy, substantially all of our investments in debt instruments and financing receivables are in investment-grade instruments. Credit-rating criteria for derivative instruments are similar to those for other investments. Due to master netting arrangements, the amounts subject to credit risk related to derivative instruments are generally limited to the amounts, if any, by which the counterparty's obligations exceed our obligations with that counterparty. As of December 30, 2017 , our total credit exposure to any single counterparty, excluding money market funds invested in U.S. treasury and U.S. agency securities and reverse repurchase agreements collateralized by treasury and agency securities, did not exceed $800 million . To further reduce credit risk, we obtain and secure available collateral from counterparties against obligations, including securities lending transactions, when we deem it appropriate.
A substantial majority of our trade receivables are derived from sales to original equipment manufacturers and original design manufacturers. We also have accounts receivable derived from sales to industrial and communications equipment manufacturers in the computing and communications industries. We believe that the net accounts receivable balances from our three largest customers ( 36% in 2017 ) do not represent a significant credit risk, based on cash flow forecasts, balance sheet analysis, and past collection experience. For more information about the customers that represent our accounts receivable balance, see " Note 4: Operating Segments ."
We have adopted credit policies and standards intended to accommodate industry growth and inherent risk. We believe that credit risks are moderated by the financial stability of our major customers. We assess credit risk through quantitative and qualitative analysis. From this analysis, we establish shipping and credit limits, and determine whether we will seek to use one or more credit support protection devices, such as obtaining a parent guarantee, standby letter of credit, or credit insurance.
BUSINESS COMBINATIONS
We allocate the purchase price paid for assets acquired and liabilities assumed in connection with our acquisitions based on their estimated fair values at the time of acquisition. This allocation involves a number of assumptions, estimates, and judgments that could materially affect the timing or amounts recognized in our financial statements. The most subjective areas include determining the fair value of the following:
• | intangible assets, including the valuation methodology, estimations of future cash flows, discount rates, market segment growth rates, our assumed market segment share, as well as the estimated useful life of intangible assets; |
• | deferred tax assets and liabilities, uncertain tax positions, and tax-related valuation allowances, which are initially estimated as of the acquisition date; |
• | inventory; property, plant and equipment; pre-existing liabilities or legal claims; deferred revenue; and contingent consideration, each as may be applicable; and |
• | goodwill as measured as the excess of consideration transferred over the net of the acquisition date fair values of the assets acquired and the liabilities assumed. |
Our assumptions and estimates are based upon comparable market data and information obtained from our management and the management of the acquired companies. We allocate goodwill to the reporting units of the business that are expected to benefit from the business combination.
FINANCIAL STATEMENTS | Notes to Financial Statements | 69 |
Table of Contents
GOODWILL
We perform an annual impairment assessment of goodwill at the reporting unit level in the fourth quarter of each year, or more frequently if indicators of potential impairment exist. The analysis may include both qualitative and quantitative factors to assess the likelihood of an impairment. The reporting unit's carrying value used in an impairment test represents the assignment of various assets and liabilities, excluding certain corporate assets and liabilities, such as cash, investments, and debt.
Qualitative factors include industry and market considerations, overall financial performance, and other relevant events and factors affecting the reporting unit. Additionally, as part of this assessment, we may perform a quantitative analysis to support the qualitative factors above by applying sensitivities to assumptions and inputs used in measuring a reporting unit's fair value.
Our quantitative impairment test considers both the income approach and the market approach to estimate a reporting unit's fair value. Significant estimates include market segment growth rates, our assumed market segment share, estimated costs, and discount rates based on a reporting unit's weighted average cost of capital.
We test the reasonableness of the inputs and outcomes of our discounted cash flow analysis against available market data. In the current year the fair value for all of our reporting units substantially exceeds their carrying value, and our annual qualitative assessment did not indicate that a more detailed quantitative analysis was necessary.
IDENTIFIED INTANGIBLE ASSETS
We amortize acquisition-related intangible assets that are subject to amortization over their estimated useful life. Acquisition-related in-process R&D assets represent the fair value of incomplete R&D projects that had not reached technological feasibility as of the date of acquisition; initially, these are classified as in-process R&D and are not subject to amortization. Once these R&D projects are completed, the asset balances are transferred from in-process R&D to acquisition-related developed technology and are subject to amortization from this point forward. The asset balances relating to projects that are abandoned after acquisition are impaired and expensed to R&D.
We perform a quarterly review of significant finite-lived identified intangible assets to determine whether facts and circumstances indicate that the carrying amount may not be recoverable. These reviews can be affected by various factors, including external factors such as industry and economic trends, and internal factors such as changes in our business strategy and our forecasts for specific product lines.
EMPLOYEE EQUITY INCENTIVE PLANS
We use the straight-line amortization method to recognize share-based compensation over the service period of the award net of estimated forfeitures. Upon exercise, cancellation, forfeiture, or expiration of stock options, or upon vesting or forfeiture of restricted stock units (RSUs), we eliminate deferred tax assets for options and RSUs with multiple vesting dates for each vesting period on a first-in, first-out basis as if each vesting period were a separate award.
INCOME TAXES
We compute the provision for income taxes using the asset and liability method, under which deferred tax assets and liabilities are recognized for the expected future tax consequences of temporary differences between the financial reporting and tax bases of assets and liabilities, and for operating losses and tax credit carryforwards. We measure deferred tax assets and liabilities using the currently enacted tax rates that apply to taxable income in effect for the years in which those tax assets are expected to be realized or settled.
We assess the likelihood that we will be able to recover our deferred tax assets. If recovery is not likely, we must increase our provision for taxes by recording a valuation allowance against the deferred tax assets that we estimate will not ultimately be recoverable. We believe that we will ultimately recover the deferred tax assets recorded on our consolidated balance sheets. Recovery of a portion of our deferred tax assets is affected by management's plans with respect to holding or disposing of certain investments; therefore, such changes could also affect our future provision for taxes.
We recognize tax benefits from uncertain tax positions only if (based on the technical merits of the position) it is more likely than not that the tax positions will be sustained on examination by the tax authority. The tax benefits recognized in the financial statements from such positions are measured based on the largest amount that is more than 50% likely to be realized upon ultimate settlement. We recognize interest and penalties related to unrecognized tax benefits within the provision for taxes on the consolidated statements of income.
We have recorded provisional estimates associated with the December 22, 2017 enactment of the U.S. Tax Cuts and Jobs Act (Tax Reform). The SEC has provided accounting and reporting guidance that allows us to report provisional amounts within a measurement period up to one year due to the complexities inherent in adopting the changes. We consider both the recognition of the transition tax and the remeasurement of deferred income taxes incomplete. New guidance from regulators, interpretation of the law, and refinement of our estimates from ongoing analysis of data and tax positions may change the provisional amounts.
FINANCIAL STATEMENTS | Notes to Financial Statements | 70 |
Table of Contents
The transition tax is based on our total post-1986 foreign earnings and profits that were previously deferred from U.S. taxation. We have not yet completed our substantiation of the underlying data and therefore our taxable base estimates may change. Our estimates of foreign tax credits may also change as we substantiate tax credits claimed. Further, the transition tax is based in part on the amount of foreign earnings held in cash and other liquid assets. The transition tax may change as we more precisely calculate amounts held in liquid and illiquid assets at the various measurement dates. If the final tax outcome of these matters is different than provisional amounts, its will impact the provision for income taxes and the effective tax rate in the period recorded. For more information about Tax Reform impacts, see " Note 8: Income Taxes ."
We recognize the tax impact of including certain foreign earnings in U.S. taxable income as a period cost. We have not recognized deferred income taxes for local country income and withholding taxes that could be incurred on distributions of certain non-U.S. earnings or for outside basis differences in our subsidiaries, because we plan to indefinitely reinvest such earnings and basis differences. Remittances of non-U.S. earnings are based on estimates and judgments of projected cash flow needs, as well as the working capital and investment requirements of our non-U.S. and U.S. operations. Material changes in our estimates of cash, working capital, and investment needs in various jurisdictions could require repatriation of indefinitely reinvested non-U.S. earnings, which could be subject to applicable non-U.S. income and withholding taxes.
LOSS CONTINGENCIES
We are subject to loss contingencies, including various legal and regulatory proceedings, asserted and potential claims, liabilities related to repair or replacement of parts in connection with product defects, as well as product warranties and potential asset impairments that arise in the ordinary course of business. An estimated loss from such contingencies is recognized as a charge to income if it is probable that a liability has been incurred and the amount of the loss can be reasonably estimated.
Note 3: Recent Accounting Standards
ACCOUNTING STANDARDS ADOPTED | ||
Standard/Description | Effective Date and Adoption Considerations | Effect on Financial Statements or Other Significant Matters |
Intangibles - Goodwill and Other - Simplifying the Test for Goodwill Impairment . This accounting standard update eliminates Step 2 from the existing guidance to simplify how goodwill impairment tests are performed. With the elimination of this step, a goodwill impairment test is performed by comparing the fair value of a reporting unit to its carrying value. An impairment charge is recognized for the amount by which the reporting unit's carrying value exceeds its fair value. | We elected to early adopt this accounting standard update in the second quarter of 2017 on a prospective basis. | We expect the adoption of this update to simplify our annual goodwill impairment testing process, by eliminating the need to estimate the implied fair value of a reporting unit's goodwill, if its respective carrying value exceeds fair value. |
FINANCIAL STATEMENTS | Notes to Financial Statements | 71 |
Table of Contents
ACCOUNTING STANDARDS NOT YET ADOPTED | ||
Standard/Description | Effective Date and Adoption Considerations | Effect on Financial Statements or Other Significant Matters |
Revenue Recognition - Contracts with Customers. This standard was issued to achieve a consistent application of revenue recognition within the U.S., resulting in a single revenue model to be applied by all companies. Under the new model, recognition of revenue occurs when a customer obtains control of promised goods or services in an amount that reflects the consideration to which the entity expects to be entitled in exchange for those goods or services. In addition, the new standard requires that companies disclose the nature, amount, timing, and uncertainty of revenue and cash flows arising from contracts with customers. | Effective in the first quarter of 2018. We plan to adopt the standard retrospectively with the cumulative effect of initially applying it recognized at the date of initial application ("modified retrospective" approach). | Our assessment has identified a change in revenue recognition timing on our component sales made to distributors. We expect to recognize revenue when we deliver to the distributor rather than deferring recognition until the distributor sells the components. On the date of initial application, we will remove the deferred income and related receivables on component sales made to distributors through a cumulative adjustment to retained earnings. We expect the revenue deferral, historically recognized in the following period, to be offset by the acceleration of revenue recognition as control of the product transfers to our customer. Our assessment has also identified a change in expense recognition timing related to payments we make to our customers for distinct services they perform as part of cooperative advertising programs, which were previously recorded as operating expenses. We expect to recognize the expense for cooperative advertising in the period the marketing activities occur. We currently recognize the expense in the period the customer is entitled to participate in the program, which coincides with the period of sale. On the date of initial adoption, we will capitalize the expense of cooperative advertising not performed through a cumulative adjustment to retained earnings. We have completed our assessment and implemented policies, processes, and controls to support the standards measurement and disclosure requirements. Refer to the table below, which summarizes the anticipated impacts of the changes discussed above to Intel's financial statements. This will be an adjustment to opening balances for the fiscal year beginning December 31, 2017. |
Financial Instruments - Recognition and Measurement. Requires changes to the accounting for financial instruments that primarily affect equity investments, financial liabilities measured using the fair value option, and the presentation and disclosure requirements for such instruments. | Effective in the first quarter of 2018. Changes to our marketable equity securities are required to be adopted using a modified retrospective approach through a cumulative effect adjustment to retained earnings for the fiscal year beginning December 31, 2017. Since management has elected to apply the measurement alternative to non-marketable equity securities, changes to these securities are being adopted prospectively. | Marketable equity securities previously classified as available-for-sale equity investments will be measured and recorded at fair value with changes in fair value recorded through the income statement. All non-marketable equity securities formerly classified as cost method investments will be measured and recorded using the measurement alternative upon adoption. Equity securities measured and recorded using the measurement alternative are recorded at cost minus impairment, if any, plus or minus changes resulting from qualifying observable price changes. Adjustments resulting from impairments and observable price changes will be recorded in the income statement. Beginning in the first quarter of 2018, in accordance with the standard, fair value disclosures will no longer be provided for equity securities measured using the measurement alternative. In addition, the existing impairment model will be replaced with a new one-step qualitative impairment model. No initial adoption adjustment will be recorded for these instruments since the standard is required to be applied prospectively for securities measured using the measurement alternative. We have completed our assessment and implemented policies, processes, and controls to support the standard's measurement and disclosure requirements. Refer to the table below, which summarizes the anticipated impacts, net of tax, of the changes discussed above to Intel's financial statements. This will be an adjustment to opening balances for the fiscal year beginning December 31, 2017. |
FINANCIAL STATEMENTS | Notes to Financial Statements | 72 |
Table of Contents
ACCOUNTING STANDARDS NOT YET ADOPTED | ||
Standard/Description | Effective Date and Adoption Considerations | Effect on Financial Statements or Other Significant Matters |
Compensation - Retirement Benefits - Improving the Presentation of Net Periodic Pension Cost and Net Periodic Postretirement Benefit Cost . This amended standard was issued to provide additional guidance on the presentation of net benefit cost in the income statement and on the components eligible for capitalization in assets. The service cost component of the net periodic benefit cost will continue to be reported within operating income on the consolidated income statement. All other non-service components are required to be presented separately outside operating income, and only service costs will be eligible for inventory capitalization. | Effective in the first quarter of 2018. Changes to the presentation of benefit costs are required to be adopted retrospectively, while changes to the capitalization of service costs into inventories are required to be adopted prospectively. The standard permits, as a practical expedient, use of the amounts disclosed in the Retirement Benefit Plans footnote for the prior comparative periods as the estimation basis for applying the retrospective presentation requirement. | We expect the adoption of the amended standard to result in the reclassification of approximately $115 million from non-service components above the subtotal of operating income to interest and other, net, for the year ended December 30, 2017 ($260 million for the year ended December 31, 2016). |
Leases . This new lease accounting standard requires that we recognize leased assets and corresponding liabilities on the balance sheet and provide enhanced disclosure of lease activity. | Effective in the first quarter of 2019. We plan to adopt the new standard using a modified retrospective transition approach. | We expect the valuation of our right-of-use assets and lease liabilities, previously described as operating leases, to approximate the present value of our forecasted future lease commitments. We are currently implementing process and system changes in order to comply with the measurement and disclosure requirements. |
|
|
|
| Adjustments from |
|
| ||||||||||
Fiscal Year Beginning (In Millions) |
| Dec 30, 2017 |
| Revenue Standard |
| Financial Instruments Update |
| Dec 31, 2017 As Adjusted | ||||||||
Assets: |
|
|
|
|
|
|
|
| ||||||||
Accounts receivable, net |
| $ | 5,607 | |
| $ | (530 | ) |
| $ | - | |
| $ | 5,077 | |
Inventories |
| $ | 6,983 | |
| $ | 47 | |
| $ | - | |
| $ | 7,030 | |
Other current assets |
| $ | 2,908 | |
| $ | 64 | |
| $ | - | |
| $ | 2,972 | |
Equity investments |
| $ | - | |
| $ | - | |
| $ | 8,579 | |
| $ | 8,579 | |
Marketable equity securities |
| $ | 4,192 | |
| $ | - | |
| $ | (4,192 | ) |
| $ | - | |
Other long-term assets |
| $ | 7,602 | |
| $ | - | |
| $ | (4,387 | ) |
| $ | 3,215 | |
|
|
|
|
|
|
|
|
| ||||||||
Liabilities: |
|
|
|
|
|
|
|
| ||||||||
Accounts payable |
| $ | 2,928 | |
| $ | 55 | |
| $ | - | |
| $ | 2,983 | |
Deferred income |
| $ | 1,656 | |
| $ | (1,356 | ) |
| $ | - | |
| $ | 300 | |
Other accrued liabilities |
| $ | 7,535 | |
| $ | 26 | |
| $ | - | |
| $ | 7,561 | |
Long-term deferred tax liabilities |
| $ | 3,046 | |
| $ | 191 | |
| $ | - | |
| $ | 3,237 | |
|
|
|
|
|
|
|
|
| ||||||||
Stockholders' equity: |
|
|
|
|
|
|
|
| ||||||||
Accumulated other comprehensive income (loss) |
| $ | 862 | |
| $ | - | |
| $ | (1,745 | ) |
| $ | (883 | ) |
Retained earnings |
| $ | 42,083 | |
| $ | 665 | |
| $ | 1,745 | |
| $ | 44,493 | |
FINANCIAL STATEMENTS | Notes to Financial Statements | 73 |
Table of Contents
Note 4: Operating Segments
We manage our business through the following operating segments:
• Client Computing Group (CCG) |
• Data Center Group (DCG) |
• Internet of Things Group (IOTG) |
• Non-Volatile Memory Solutions Group (NSG) |
• Programmable Solutions Group (PSG) |
• All other |
In the third quarter of 2017 , we completed our tender offer for the outstanding ordinary shares of Mobileye B.V. (Mobileye), formerly known as Mobileye N.V. In the second quarter of 2017 , we completed the planned divestiture of the Intel Security Group (ISecG). The results for both are reported within the "all other" category. For further information, see " Note 10: Acquisitions and Divestitures ."
The Chief Operating Decision Maker (CODM) is our Chief Executive Officer (CEO). The CODM allocates resources to and assesses the performance of each operating segment using information about its revenue and operating income (loss).
We offer platform products that incorporate various components and technologies, including a microprocessor and chipset, a stand-alone System-on-Chip (SoC), or a multichip package. A platform product may be enhanced by additional hardware, software, and services offered by Intel. Platform products are used in various form factors across our CCG, DCG, and IOTG operating segments. We derive a substantial majority of our revenue from platform products, which are our principal products and considered as one class of product.
CCG and DCG are our reportable operating segments. IOTG, NSG, and PSG do not meet the quantitative thresholds to qualify as reportable operating segments; however, we have elected to disclose the results of these non-reportable operating segments.
We have sales and marketing, manufacturing, engineering, finance, and administration groups. Expenses for these groups are generally allocated to the operating segments.
The "all other" category includes revenue and expenses such as:
• | results of operations from non-reportable segments not otherwise presented; |
• | historical results of operations from divested businesses; |
• | results of operations of start-up businesses that support our initiatives, including our foundry business; |
• | amounts included within restructuring and other charges; |
• | a portion of employee benefits, compensation, and other expenses not allocated to the operating segments; and |
• | acquisition-related costs, including amortization and any impairment of acquisition-related intangibles and goodwill. |
The CODM does not evaluate operating segments using discrete asset information and we do not identify or allocate assets by operating segments. Based on the interchangeable nature of our manufacturing and assembly and test assets, most of the related depreciation expense is not directly identifiable within our operating segments, as it is included in overhead cost pools and subsequently absorbed into inventory as each product passes through our manufacturing process. As our products are then sold across multiple operating segments, it is impracticable to determine the total depreciation expense included as a component of each operating segment's operating income (loss) results. Operating segments do not record inter-segment revenue. We do not allocate gains and losses from equity investments, interest and other income, or taxes to operating segments. Although the CODM uses operating income to evaluate the segments, operating costs included in one segment may benefit other segments. Except for these differences, the accounting policies for segment reporting are the same as for Intel as a whole.
FINANCIAL STATEMENTS | Notes to Financial Statements | 74 |
Table of Contents
Years Ended |
| Dec 30, |
| Dec 31, |
| Dec 26, | ||||||
Net revenue: |
|
|
|
|
|
| ||||||
Client Computing Group |
|
|
|
|
|
| ||||||
Platform | | $ | 31,226 | | | $ | 30,751 | | | $ | 30,680 | |
Adjacent | | 2,777 | | | 2,157 | | | 1,539 | | |||
|
| 34,003 | |
| 32,908 | |
| 32,219 | | |||
Data Center Group |
|
|
|
|
|
| ||||||
Platform |
| 17,439 | |
| 15,895 | |
| 14,856 | | |||
Adjacent |
| 1,625 | |
| 1,341 | |
| 1,125 | | |||
|
| 19,064 | |
| 17,236 | |
| 15,981 | | |||
Internet of Things Group |
|
|
|
|
|
| ||||||
Platform |
| 2,645 | |
| 2,290 | |
| 1,976 | | |||
Adjacent |
| 524 | |
| 348 | |
| 322 | | |||
|
| 3,169 | |
| 2,638 | |
| 2,298 | | |||
Non-Volatile Memory Solutions Group |
| 3,520 | |
| 2,576 | |
| 2,597 | | |||
Programmable Solutions Group |
| 1,902 | |
| 1,669 | |
| - | | |||
All other |
| 1,103 | |
| 2,360 | |
| 2,260 | | |||
Total net revenue |
| $ | 62,761 | |
| $ | 59,387 | |
| $ | 55,355 | |
|
|
|
|
|
|
| ||||||
Operating income (loss): |
|
|
|
|
|
| ||||||
Client Computing Group |
| $ | 12,919 | |
| $ | 10,646 | |
| $ | 8,166 | |
Data Center Group |
| 8,395 | |
| 7,520 | |
| 7,847 | | |||
Internet of Things Group |
| 650 | |
| 585 | |
| 515 | | |||
Non-Volatile Memory Solutions Group |
| (260 | ) |
| (544 | ) |
| 239 | | |||
Programmable Solutions Group |
| 458 | |
| (104 | ) |
| - | | |||
All other |
| (4,226 | ) |
| (5,229 | ) |
| (2,765 | ) | |||
Total operating income |
| $ | 17,936 | |
| $ | 12,874 | |
| $ | 14,002 | |
Disaggregated net revenue for each period was as follows:
Years Ended |
| Dec 30, |
| Dec 31, |
| Dec 26, | ||||||
Platform revenue |
|
|
|
|
|
| ||||||
Desktop platform |
| $ | 11,647 | |
| $ | 12,371 | |
| $ | 12,754 | |
Notebook platform |
| 19,414 | |
| 18,203 | |
| 17,945 | | |||
DCG platform |
| 17,439 | |
| 15,895 | |
| 14,856 | | |||
Other platform 1 |
| 2,810 | |
| 2,467 | |
| 1,957 | | |||
|
| 51,310 | |
| 48,936 | |
| 47,512 | | |||
|
|
|
|
|
|
| ||||||
Adjacent revenue 2 |
| 10,917 | |
| 8,290 | |
| 5,858 | | |||
ISecG divested business |
| 534 | |
| 2,161 | |
| 1,985 | | |||
Total revenue |
| $ | 62,761 | |
| $ | 59,387 | |
| $ | 55,355 | |
1 | Includes our tablet, phone, service provider, and IOTG platform revenue. |
2 | Includes all of our non-platform products for CCG, DCG, and IOTG like modem, ethernet, and silicon photonic, as well as NSG, PSG, and Mobileye products. |
In 2017 , our three largest customers accounted for 40% of our net revenue ( 38% in 2016 ), with Dell Inc. (Dell) accounting for 16% ( 15% in 2016 ), Lenovo Group Limited (Lenovo) accounting for 13% ( 13% in 2016 ), and HP Inc. accounting for 11% ( 10% in 2016 ). These three customers accounted for 36% of our accounts receivable as of December 30, 2017 ( 31% as of December 31, 2016 ). The Hewlett-Packard Company, HP Inc., and Hewlett Packard Enterprise Company collectively accounted for 18% in 2015 , Dell accounted for 15% in 2015 , and Lenovo accounted for 13% in 2015 . Substantially all of the revenue from these customers was from the sale of platforms and other components by the CCG and DCG operating segments.
FINANCIAL STATEMENTS | Notes to Financial Statements | 75 |
Table of Contents
Net revenue by country as presented below is based on the billing location of the customer. Revenue from unaffiliated customers for each period was as follows:
Years Ended (In Millions) |
| Dec 30, |
| Dec 31, |
| Dec 26, | ||||||
China (including Hong Kong) |
| $ | 14,796 | |
| $ | 13,977 | |
| $ | 11,679 | |
Singapore |
| 14,285 | |
| 12,780 | |
| 11,544 | | |||
United States |
| 12,543 | |
| 12,957 | |
| 11,121 | | |||
Taiwan |
| 10,518 | |
| 9,953 | |
| 10,661 | | |||
Other countries |
| 10,619 | |
| 9,720 | |
| 10,350 | | |||
Total net revenue |
| $ | 62,761 | |
| $ | 59,387 | |
| $ | 55,355 | |
Note 5: Earnings Per Share
We computed basic earnings per share of common stock based on the weighted average number of shares of common stock outstanding during the period. We computed diluted earnings per share of common stock based on the weighted average number of shares of common stock outstanding plus potentially dilutive shares of common stock outstanding during the period.
Years Ended |
| Dec 30, |
| Dec 31, |
| Dec 26, | ||||||
Net income available to common stockholders |
| $ | 9,601 | |
| $ | 10,316 | |
| $ | 11,420 | |
Weighted average shares of common stock outstanding-basic |
| 4,701 | |
| 4,730 | |
| 4,742 | | |||
Dilutive effect of employee incentive plans |
| 47 | |
| 53 | |
| 64 | | |||
Dilutive effect of convertible debt |
| 87 | |
| 92 | |
| 88 | | |||
Weighted average shares of common stock outstanding-diluted |
| 4,835 | |
| 4,875 | |
| 4,894 | | |||
Earnings per share - Basic |
| $ | 2.04 | |
| $ | 2.18 | |
| $ | 2.41 | |
Earnings per share - Diluted |
| $ | 1.99 | |
| $ | 2.12 | |
| $ | 2.33 | |
Potentially dilutive shares of common stock from employee incentive plans are determined by applying the treasury stock method to the assumed exercise of outstanding stock options, the assumed vesting of outstanding RSUs, and the assumed issuance of common stock under the stock purchase plan. Potentially dilutive shares of common stock for our junior subordinated convertible debentures due 2035 (2005 convertible) debentures are determined by applying the if-converted method. In December 2017, we paid cash to convert our 2035 debentures which we excluded from our diluted earnings per share computation in the fourth quarter and are no longer dilutive. For information on the conversion of the 2035 debentures, see " Note 14: Borrowings ." Our junior subordinated convertible debentures due 2039 (2009 debentures) require settlement of the principal amount of the debt in cash upon conversion, with the conversion premium paid in cash or stock at our option, potentially dilutive shares of common stock are determined by applying the treasury stock method.
In all years presented, potentially dilutive securities that would have been antidilutive are insignificant and are excluded from the computation of diluted earnings per share. In all years presented, we included our 2009 debentures in the calculation of diluted earnings per share of common stock because the average market price was above the conversion price. We could potentially exclude the 2009 debentures in the future if the average market price is below the conversion price.
Note 6: Other Financial Statement Details
INVENTORIES
(In Millions) |
| Dec 30, |
| Dec 31, | ||||
Raw materials |
| $ | 1,098 | |
| $ | 695 | |
Work in process |
| 3,893 | |
| 3,190 | | ||
Finished goods |
| 1,992 | |
| 1,668 | | ||
Total inventories |
| $ | 6,983 | |
| $ | 5,553 | |
FINANCIAL STATEMENTS | Notes to Financial Statements | 76 |
Table of Contents
PROPERTY, PLANT AND EQUIPMENT
(In Millions) |
| Dec 30, |
| Dec 31, | ||||
Land and buildings |
| $ | 27,391 | |
| $ | 26,627 | |
Machinery and equipment |
| 57,192 | |
| 52,608 | | ||
Construction in progress |
| 15,812 | |
| 10,870 | | ||
Total property, plant and equipment, gross |
| 100,395 | |
| 90,105 | | ||
Less: accumulated depreciation |
| 59,286 | |
| 53,934 | | ||
Total property, plant and equipment, net |
| $ | 41,109 | |
| $ | 36,171 | |
Substantially all of our depreciable property, plant and equipment assets were depreciated over the following estimated useful lives: machinery and equipme nt, 2 to 5 years, and buildings, 10 to 25 y ears. There are no construction in progress assets held in safe state as of December 30, 2017 (approximately $ 2.2 billion as of December 31, 2016 ).
Net property, plant and equipment by country at the end of each period was as follows:
(In Millions) |
| Dec 30, |
| Dec 31, |
| Dec 26, | ||||||
United States |
| $ | 24,459 | |
| $ | 23,598 | |
| $ | 22,611 | |
Israel |
| 6,501 | |
| 3,923 | |
| 1,661 | | |||
China |
| 4,275 | |
| 2,306 | |
| 537 | | |||
Ireland |
| 3,938 | |
| 4,865 | |
| 5,789 | | |||
Other countries |
| 1,936 | |
| 1,479 | |
| 1,260 | | |||
Total property, plant and equipment, net |
| $ | 41,109 | |
| $ | 36,171 | |
| $ | 31,858 | |
DEFERRED INCOME
|
| Dec 30, |
| Dec 31, | ||||
Deferred income on shipments of components to distributors |
| $ | 1,320 | |
| $ | 1,475 | |
Deferred income from software, services, and other |
| 336 | |
| 243 | | ||
Current deferred income |
| $ | 1,656 | |
| $ | 1,718 | |
OTHER ACCRUED LIABILITIES
Other accrued liabilities include deferred compensation liabilities of $1.7 billion as of December 30, 2017 ( $1.5 billion as of December 31, 2016 ).
ADVERTISING
Advertising costs, including direct marketing costs, recorded within MG&A expenses were $1.4 billion in 2017 ( $1.8 billion in 2016 and $1.8 billion in 2015 ).
GAINS (LOSSES) ON EQUITY INVESTMENTS, NET
Years Ended |
| Dec 30, |
| Dec 31, |
| Dec 26, | ||||||
Share of equity method investee losses, net |
| $ | (232 | ) |
| $ | (38 | ) |
| $ | (95 | ) |
Impairments |
| (833 | ) |
| (187 | ) |
| (185 | ) | |||
Gains on sales, net |
| 3,499 | |
| 562 | |
| 145 | | |||
Dividends |
| 68 | |
| 74 | |
| 52 | | |||
Other, net |
| 149 | |
| 95 | |
| 398 | | |||
Total gains (losses) on equity investments, net |
| $ | 2,651 | | | $ | 506 | | | $ | 315 | |
FINANCIAL STATEMENTS | Notes to Financial Statements | 77 |
Table of Contents
INTEREST AND OTHER, NET
Years Ended |
| Dec 30, |
| Dec 31, |
| Dec 26, | ||||||
Interest income |
| $ | 441 | |
| $ | 222 | |
| $ | 124 | |
Interest expense |
| (646 | ) |
| (733 | ) |
| (337 | ) | |||
Other, net |
| (30 | ) |
| 67 | |
| 108 | | |||
Total interest and other, net |
| $ | (235 | ) | | $ | (444 | ) | | $ | (105 | ) |
Interest expense in the preceding table is net of $313 million of interest capitalized in 2017 ( $135 million in 2016 and $258 million in 2015 ).
Note 7: Restructuring and Other Charges
Years Ended |
| Dec 30, |
| Dec 31, |
| Dec 26, | ||||||
2016 Restructuring Program |
| $ | 135 | |
| $ | 1,823 | |
| $ | - | |
2015 and 2013 Restructuring Programs |
| - | |
| - | |
| 354 | | |||
ISecG separation costs and other charges |
| 249 | |
| 63 | |
| - | | |||
Total restructuring and other charges |
| $ | 384 | |
| $ | 1,886 | |
| $ | 354 | |
2016 RESTRUCTURING PROGRAM
In the second quarter of 2016, management approved and commenced the 2016 Restructuring Program to accelerate our transformation from a PC company to one that powers the cloud and billions of smart, connected computing devices. Under this program, we closed certain facilities and reduced headcount globally to align our operations with evolving business needs by investing in our growth businesses and improving efficiencies. This program was completed in 2017.
Years Ended |
| Dec 30, |
| Dec 31, | ||||
Employee severance and benefit arrangements |
| $ | 70 | |
| $ | 1,737 | |
Pension settlement charges |
| 25 | |
| 57 | | ||
Asset impairment and other charges |
| 40 | |
| 29 | | ||
Total restructuring and other charges |
| $ | 135 | |
| $ | 1,823 | |
(In Millions) |
| Employee Severance and Benefits |
| Asset Impairments and Other |
| Total | ||||||
Accrued restructuring balance as of December 26, 2015 |
| $ | - | |
| $ | - | |
| $ | - | |
Additional accruals |
| 1,556 | |
| 29 | |
| 1,585 | | |||
Adjustments |
| 92 | |
| - | |
| 92 | | |||
Cash payments |
| (1,063 | ) |
| - | |
| (1,063 | ) | |||
Non-cash settlements |
| - | |
| (19 | ) |
| (19 | ) | |||
Accrued restructuring balance as of December 31, 2016 |
| 585 | |
| 10 | |
| 595 | | |||
Additional accruals |
| - | |
| 40 | |
| 40 | | |||
Adjustments |
| 70 | |
| - | |
| 70 | | |||
Cash payments |
| (352 | ) |
| (25 | ) |
| (377 | ) | |||
Non-cash settlements |
| - | |
| (3 | ) |
| (3 | ) | |||
Accrued restructuring balance as of December 30, 2017 |
| $ | 303 | |
| $ | 22 | |
| $ | 325 | |
FINANCIAL STATEMENTS | Notes to Financial Statements | 78 |
Table of Contents
2015 AND 2013 RESTRUCTURING PROGRAMS
During 2015 and 2013, management approved and commenced implementation of restructuring actions, including targeted workforce reductions and the exit of certain businesses and facilities, as we adjusted resources from areas of disinvestment to areas of investment. The 2013 restructuring program included the wind down of our 200mm wafer fabrication facility in Massachusetts and the closure of our assembly and test facility in Costa Rica. Both programs were completed in 2015.
Note 8: Income Taxes
Tax Reform was enacted in December 2017 and reduced the U.S. federal corporate tax rate from 35.0% to 21.0% starting in 2018, assessed a one-time transition tax on earnings of non-U.S. subsidiaries that have not been taxed previously in the U.S., and created new taxes on certain future foreign sourced earnings. We recorded a provisional income tax expense of $5.4 billion , net within our 2017 results related to Tax Reform. Our provisional estimates will be refined throughout 2018 from our ongoing analysis of data and tax positions along with new guidance from regulators and interpretation of the law. The components of the provisional income tax expense are as follows:
• | Recognition of the transition tax imposed on undistributed earnings from non-U.S. subsidiaries. We have previously asserted an intent to indefinitely reinvest our earnings and other basis differences in operations outside the U.S., and have not recognized U.S. deferred income taxes. Tax Reform imposes a one-time transition tax on all of our previously untaxed historical non-U.S. earnings and profits at various tax rates. We recognized a provisional tax expense of $6.1 billion in the fourth quarter of 2017. The move to a participation exemption system allows us to make distributions of non-U.S. earnings to the U.S. without incurring additional U.S. tax, however these distributions may be subject to applicable non-U.S. taxation. |
• | Remeasurement of deferred income taxes using the newly enacted statutory tax rate of 21.0% . The new statutory U.S. federal income tax rate is effective for the 2018 tax year. We remeasured our deferred tax assets and liabilities, including associated valuation allowances, with the new tax rate. We have recognized a provisional tax benefit of $676 million in the fourth quarter of 2017. |
INCOME TAX PROVISION
Years Ended |
| Dec 30, |
| Dec 31, |
| Dec 26, | ||||||
Income before taxes: |
|
|
|
|
|
| ||||||
U.S. |
| $ | 11,141 | |
| $ | 6,957 | |
| $ | 8,800 | |
Non-U.S. |
| 9,211 | |
| 5,979 | |
| 5,412 | | |||
Total income before taxes |
| 20,352 | |
| 12,936 | |
| 14,212 | | |||
Provision for taxes: |
|
|
|
|
|
| ||||||
Current: |
|
|
|
|
|
| ||||||
Federal |
| 10,207 | |
| 1,319 | |
| 2,828 | | |||
State |
| 27 | |
| 13 | |
| 40 | | |||
Non-U.S. |
| 899 | |
| 756 | |
| 842 | | |||
Total current provision for taxes |
| 11,133 | |
| 2,088 | |
| 3,710 | | |||
Deferred: |
|
|
|
|
|
| ||||||
Federal |
| (220 | ) |
| 658 | |
| (862 | ) | |||
Other |
| (162 | ) |
| (126 | ) |
| (56 | ) | |||
Total deferred provision for taxes |
| (382 | ) |
| 532 | |
| (918 | ) | |||
Total provision for taxes |
| $ | 10,751 | |
| $ | 2,620 | |
| $ | 2,792 | |
Effective tax rate |
| 52.8 | % |
| 20.3 | % |
| 19.6 | % | |||
FINANCIAL STATEMENTS | Notes to Financial Statements | 79 |
Table of Contents
Years Ended |
| Dec 30, |
| Dec 31, |
| Dec 26, | |||
Statutory federal income tax rate |
| 35.0 | % |
| 35.0 | % |
| 35.0 | % |
Increase (reduction) in rate resulting from: |
|
|
|
|
|
| |||
Non-U.S. income taxed at different rates |
| (7.6 | ) |
| (11.7 | ) |
| (7.9 | ) |
Research and development tax credits |
| (2.3 | ) |
| (2.3 | ) |
| (1.7 | ) |
Domestic manufacturing deduction benefit |
| (1.3 | ) |
| (1.4 | ) |
| (2.0 | ) |
Settlements, effective settlements, and related remeasurements |
| - | |
| (0.1 | ) |
| (2.9 | ) |
Tax Reform |
| 26.8 | |
| - | |
| - | |
ISecG divestiture |
| 3.3 | |
| - | |
| - | |
Other |
| (1.1 | ) |
| 0.8 | |
| (0.9 | ) |
Effective tax rate |
| 52.8 | % |
| 20.3 | % |
| 19.6 | % |
Substantially all of the increase in our effective tax rate in 2017 compared to 2016 was driven by the one-time provisional impacts from the Tax Reform enacted on December 22, 2017, the 2017 ISecG divestiture, and a higher proportion of our income in higher tax rate jurisdictions.
The majority of the increase in our effective tax rate in 2016 compared to 2015 was driven by one-time items and our 2015 decision to indefinitely reinvest some of our prior years' non-U.S. earnings, partially offset by a higher proportion of our income in lower tax jurisdictions.
We derive the effective tax rate benefit attributed to non-U.S. income taxed at different rates primarily from our operations in China, Hong Kong, Ireland, and Israel. The statutory tax rates in these jurisdictions range from 12.5% to 25.0% . In addition, we are subject to reduced tax rates in China and Israel as long as we conduct certain eligible activities and make certain capital investments. These conditional reduced tax rates expire at various dates through 2026 and we expect to apply for renewals upon expiration.
FINANCIAL STATEMENTS | Notes to Financial Statements | 80 |
Table of Contents
DEFERRED AND CURRENT INCOME TAXES
(In Millions) |
| Dec 30, |
| Dec 31, | ||||
Deferred tax assets: |
|
|
|
| ||||
Accrued compensation and other benefits |
| $ | 711 | |
| $ | 1,182 | |
Share-based compensation |
| 241 | |
| 373 | | ||
Deferred income |
| 211 | |
| 596 | | ||
Inventory |
| 675 | |
| 1,044 | | ||
State credits and net operating losses |
| 1,081 | |
| 846 | | ||
Other, net |
| 887 | |
| 1,187 | | ||
Gross deferred tax assets |
| 3,806 | |
| 5,228 | | ||
Valuation allowance |
| (1,171 | ) |
| (953 | ) | ||
Total deferred tax assets |
| 2,635 | |
| 4,275 | | ||
Deferred tax liabilities: |
|
|
|
| ||||
Property, plant and equipment |
| (943 | ) |
| (1,574 | ) | ||
Licenses and intangibles |
| (881 | ) |
| (1,036 | ) | ||
Convertible debt |
| (374 | ) |
| (1,098 | ) | ||
Unrealized gains on investments and derivatives |
| (421 | ) |
| (940 | ) | ||
Transition tax |
| (1,850 | ) |
| - | | ||
Other, net |
| (373 | ) |
| (450 | ) | ||
Total deferred tax liabilities |
| (4,842 | ) |
| (5,098 | ) | ||
Net deferred tax assets (liabilities) |
| (2,207 | ) |
| (823 | ) | ||
|
|
|
|
| ||||
Reported as: |
|
|
|
| ||||
Deferred tax assets |
| 840 | |
| 907 | | ||
Deferred tax liabilities |
| (3,046 | ) |
| (1,730 | ) | ||
Net deferred tax assets (liabilities) |
| $ | (2,207 | ) |
| $ | (823 | ) |
Deferred tax assets are included within other long-term assets on the consolidated balance sheets.
The valuation allowance as of December 30, 2017 included allowances related to unrealized state credit carryforwards of $1.1 billion and matters related to our non-U.S. subsidiaries of $99 million .
As of December 30, 2017 , our federal, state, and non-U.S. net operating loss carryforwards for income tax purposes were $264 million , $149 million , and $431 million , respectively. The majority of the non-U.S. net operating loss carryforwards have no expiration date. The remaining non-U.S. and U.S. federal and state net operating loss carryforwards expire at various dates through 2036 . A significant amount of the net operating loss carryforwards in the U.S. relates to acquisitions and, as a result, is limited in the amount that can be recognized in any one year. The non-U.S. net operating loss carryforwards include $249 million that is not likely to be recovered and has been reduced by a valuation allowance.
As of December 30, 2017 , we have not recognized deferred income tax on certain outside basis differences in our subsidiaries, because we have the intent and ability to indefinitely reinvest these basis differences. Determining the unrecognized deferred tax liability for these outside basis differences is not practicable.
Current income taxes receivable of $71 million as of December 30, 2017 ( $86 million as of December 31, 2016 ) are included in other current assets. Current income taxes payable of $1.4 billion as of December 30, 2017 ( $329 million as of December 31, 2016 ) are included in other accrued liabilities.
Long-term income taxes payable of $4.1 billion as of December 30, 2017 ( $125 million as of December 31, 2016 ) are included in other long-term liabilities, and include uncertain tax positions, reduced by the associated federal deduction for state taxes and non-U.S. tax credits, and may also include other long-term tax liabilities that are not uncertain but have not yet been paid, including the substantial majority of the transition tax from the Tax Reform, which is payable over the next eight years. The Tax Reform transition tax drove most of the increase in long-term income taxes payable from 2016.
FINANCIAL STATEMENTS | Notes to Financial Statements | 81 |
Table of Contents
UNCERTAIN TAX POSITIONS
Unrecognized tax benefits were $211 million as of December 30, 2017 ( $154 million as of December 31, 2016 and $101 million as of December 26, 2015 ). If the remaining balance of unrecognized tax benefits were recognized in a future period, it would result in a tax benefit of $139 million as of December 30, 2017 ( $87 million as of December 31, 2016 ) and a reduction in the effective tax rate. The related tax benefit for settlements, effective settlements, and remeasurements was insignificant for 2017 ( insignificant in 2016 and $419 million in 2015 ). Interest, penalties, and accrued interest related to unrecognized tax benefits were insignificant in the periods presented.
We comply with the laws, regulations, and filing requirements of all jurisdictions in which we conduct business. We regularly engage in discussions and negotiations with tax authorities regarding tax matters in various jurisdictions. Although the timing of the resolutions and/or closures of audits is highly uncertain, it is reasonably possible that certain U.S. federal and non-U.S. tax audits may be concluded within the next 12 months, which could significantly increase or decrease the balance of our gross unrecognized tax benefits. However, the estimated impact on income tax expense and net income is not expected to be significant.
We file federal, state, and non-U.S. tax returns. For non-U.S. tax returns, we are generally no longer subject to tax examinations for years prior to 2004 . For U.S. federal and state tax returns, we are no longer subject to tax examination for years prior to 2004 . We have filed petitions before the U.S. Tax Court relating to the treatment of stock-based compensation expense in an inter-company cost-sharing transaction for certain pre-acquisition Altera Corporation (Altera) tax years. The U.S. Tax Court ruled in favor of Altera and the U.S. Internal Revenue Service appealed the ruling to the U.S. Court of Appeals for the Ninth Circuit. During 2017, the U.S. Court of Appeals heard oral arguments and the outcome of those appeals is pending.
Note 9: Investments
AVAILABLE-FOR-SALE INVESTMENTS
|
| December 30, 2017 |
| December 31, 2016 | ||||||||||||||||||||||||||||
|
| Adjusted Cost |
| Gross Unrealized Gains |
| Gross Unrealized Losses |
| Fair Value |
| Adjusted Cost |
| Gross Unrealized Gains |
| Gross Unrealized Losses |
| Fair Value | ||||||||||||||||
Corporate debt |
| $ | 2,294 | |
| $ | 4 | |
| $ | (13 | ) |
| $ | 2,285 | |
| $ | 3,847 | |
| $ | 4 | |
| $ | (14 | ) |
| $ | 3,837 | |
Financial institution instruments |
| 3,387 | |
| 3 | |
| (9 | ) |
| 3,381 | |
| 6,098 | |
| 5 | |
| (11 | ) |
| 6,092 | | ||||||||
Government debt |
| 961 | |
| - | |
| (6 | ) |
| 955 | |
| 1,581 | |
| - | |
| (8 | ) |
| 1,573 | | ||||||||
Marketable equity securities |
| 1,507 | |
| 2,686 | |
| (1 | ) |
| 4,192 | |
| 2,818 | |
| 3,363 | |
| (1 | ) |
| 6,180 | | ||||||||
Total available-for-sale investments |
| $ | 8,149 | |
| $ | 2,693 | |
| $ | (29 | ) |
| $ | 10,813 | |
| $ | 14,344 | |
| $ | 3,372 | |
| $ | (34 | ) |
| $ | 17,682 | |
Government debt includes instruments such as non-U.S. government bonds and U.S. agency securities. Financial institution instruments include instruments issued or managed by financial institutions in various forms, such as commercial paper, fixed- and floating-rate bonds, money market fund deposits, and time deposits. Substantially all time deposits were issued by institutions outside the U.S. as of December 30, 2017 . Most time deposits were issued by institutions outside of the U.S. as of December 31, 2016 .
During 2017 , we sold available-for-sale investments for proceeds of $7.1 billion , ( $4.1 billion in 2016 and $2.2 billion in 2015 ). The gross realized gains on sales of available-for-sale investments were $3.5 billion in 2017 ( $538 million in 2016 and $133 million in 2015 ).
On April 28, 2017, Cloudera, Inc. (Cloudera) completed its initial public offering and we designated our previous equity and cost method investments in Cloudera as available-for-sale. During 2017, we determined we had an other-than-temporary decline in the fair value of our investment and recognized an impairment charge of $278 million . We recognized the impairment due to the duration and severity of the decline in the investment's fair value, which we determined was below cost based upon observable market prices after the initial public offering.
FINANCIAL STATEMENTS | Notes to Financial Statements | 82 |
Table of Contents
(In Millions) |
| Fair Value | ||
Due in 1 year or less |
| $ | 2,573 | |
Due in 1–2 years |
| 1,776 | | |
Due in 2–5 years |
| 1,866 | | |
Due after 5 years |
| 71 | | |
Instruments not due at a single maturity date |
| 335 | | |
Total |
| $ | 6,621 | |
EQUITY METHOD INVESTMENTS
|
| December 30, 2017 |
| December 31, 2016 | ||||||||||
(Dollars In Millions) |
| Carrying Value |
| Ownership Percentage |
| Carrying Value |
| Ownership Percentage | ||||||
IM Flash Technologies, LLC |
| $ | 1,505 | |
| 49 | % |
| $ | 849 | |
| 49 | % |
McAfee |
| 153 | |
| 49 | % |
| n/a | |
| n/a | | ||
Cloudera, Inc. |
| n/a | |
| n/a | |
| 225 | |
| 16 | % | ||
Other equity method investments |
| 229 | |
|
|
| 254 | |
|
| ||||
Total |
| $ | 1,887 | |
|
|
| $ | 1,328 | |
|
| ||
IM Flash Technologies, LLC
Since the inception of IM Flash Technologies, LLC (IMFT) in 2006, Micron Technology, Inc. (Micron) and Intel have jointly developed NAND flash memory and 3D XPoint technology products. Intel also purchases jointly developed products directly from Micron under certain supply agreements.
The IMFT operating agreement continues through 2024 unless terminated earlier, and provides for certain buy-sell rights of the joint venture. Intel has the right to cause Micron to buy our interest in IMFT and, if exercised, Micron could elect to receive financing from us for one to two years. Commencing in January 2019, Micron has the right to call our interest in IMFT with the closing date to be effective within one year.
IMFT is a variable interest entity, and all costs of IMFT are passed on to Micron and Intel through sale of products or services in proportional share of ownership. Our portion of IMFT costs was approximately $415 million in 2017 (approximately $400 million in 2016 and $400 million in 2015 ). In the event that IMFT has excess cash, IMFT will make payments to Micron and Intel in the form of dividends.
IMFT depends on Micron and Intel for any additional cash. In addition to making capital contributions throughout the year, during the fourth quarter of 2017, we extended $650 million in member debt financing (MDF) to IMFT to fund the ramp of 3D XPoint technology. The MDF balance may be converted to a capital contribution at our request, or may be repaid upon availability of funds. Our known maximum exposure to loss approximated the carrying value of our investment balance (which included the $650 million of MDF as of December 30, 2017 ). Our potential future losses could be higher than the carrying amount of our investment, as Intel and Micron are liable for other future operating costs or obligations of IMFT and future cash calls. In addition, because we are currently committed to purchasing 49% of IMFT's production output and production-related services, we may be required to purchase products at a cost in excess of realizable value.
We have determined that we do not have the characteristics of a consolidating investor in the variable interest entity, and therefore, we account for our interest in IMFT using the equity method of accounting.
McAfee
During the second quarter of 2017, we closed our divestiture of the ISecG business and retained a 49% interest in McAfee as partial consideration. Our investment is accounted for under the equity method of accounting and is classified within other long-term assets. During the third quarter of 2017, we received a $735 million dividend from McAfee. For further information related to the divestiture of the ISecG business, see " Note 10: Acquisitions and Divestitures ."
NON-MARKETABLE COST METHOD INVESTMENTS
The carrying value of our non-marketable cost method investments was $2.6 billion as of December 30, 2017 ( $3.1 billion as of December 31, 2016 ). In 2017 , we recognized impairments of $548 million on non-marketable cost method investments ( $178 million in 2016 and $164 million in 2015 ).
FINANCIAL STATEMENTS | Notes to Financial Statements | 83 |
Table of Contents
Beijing UniSpreadtrum Technology Ltd. (UniSpreadtrum)
During 2014, we entered into a series of agreements with Tsinghua Unigroup Ltd. (Tsinghua Unigroup), an operating subsidiary of Tsinghua Holdings Co. Ltd., to, among other things, jointly develop Intel architecture- and communications-based solutions for phones . During 2017, we reduced our expectation of the future operating performance for Beijing UniSpreadtrum Technology Ltd. (UniSpreadtrum) due to competitive pressures, which resulted in other-than-temporary impairment charges of $308 million . The carrying value of our investment was $658 million as of December 30, 2017 ( $966 million as of December 31, 2016).
TRADING ASSETS
Net gains related to trading assets still held at the reporting date were $414 million in 2017 (net losses of $295 million in 2016 and $152 million in 2015 ). Net losses on the related derivatives were $422 million in 2017 (net gains of $300 million in 2016 and $137 million in 2015 ).
Note 10: Acquisitions and Divestitures
2017 ACQUISITIONS
Mobileye
On August 21, 2017, we completed our tender offer for all of the outstanding ordinary shares of Mobileye, a global leader in the development of computer vision and machine learning, data analysis, localization, and mapping for advanced driver assistance systems and autonomous driving. This acquisition combines Mobileye's leading computer vision expertise with Intel's high-performance computing and connectivity expertise to create automated driving solutions from car to cloud. The combination is expected to accelerate innovation for the automotive industry and position Intel as a leading technology provider in the fast-growing market for highly and fully autonomous vehicles. The transaction also extends Intel's strategy to invest in data-intensive market opportunities that build on our strengths in computing and connectivity from the cloud, through the network, to the device.
As of the completion of the tender offer, we acquired substantially all of the outstanding ordinary shares of Mobileye. We acquired 84.4% of the outstanding shares on August 8, 2017 and 97.3% as of August 21, 2017, and we intend to acquire all remaining outstanding shares. We have reflected the acquisition of the additional outstanding shares and reduction to the noncontrolling interest by $1.8 billion in the tables below.
Total consideration to acquire Mobileye was $14.5 billion (net of $366 million of cash and cash equivalents acquired).
(In Millions) |
|
| ||
Short-term investments and marketable securities |
| $ | 370 | |
Tangible assets |
| 227 | | |
Goodwill |
| 10,278 | | |
Identified intangible assets |
| 4,482 | | |
Current liabilities |
| (69 | ) | |
Deferred tax liabilities and other |
| (418 | ) | |
Noncontrolling interest |
| (375 | ) | |
Total |
| $ | 14,495 | |
We assumed outstanding unvested Mobileye stock options and RSUs granted under two Mobileye equity plans. We will not grant additional equity awards under these two Mobileye equity plans. In connection with the acquisition, we recognized share-based compensation expense of $71 million for cash-settled awards.
The preliminary allocation of the purchase price was based upon estimates and assumptions that are subject to change within the one-year measurement period. The primary areas of the purchase price allocation that are not yet finalized are certain tax matters, identification of contingencies, and goodwill.
The fair value of the non-controlling interest was determined based on the quoted share price of Mobileye as of August 8, 2017, and the remaining outstanding shares that constitute the non-controlling interest. We recorded the non-controlling interest as a component of equity.
Goodwill of $10.3 billion arising from the acquisition is attributed to the expected synergies and other benefits that will be generated from the combination of Intel and Mobileye. Substantially all of the goodwill recognized is not expected to be deductible for tax purposes. The goodwill recognized from the acquisition is included within "all other."
FINANCIAL STATEMENTS | Notes to Financial Statements | 84 |
Table of Contents
|
| Fair Value |
| Weighted Average | ||
Developed technology |
| $ | 2,346 | |
| 9 |
Customer relationships |
| 713 | |
| 12 | |
Brands |
| 64 | |
| 10 | |
Identified intangible assets subject to amortization |
| 3,123 | |
|
| |
In-process research and development |
| 1,359 | |
|
| |
Identified intangible assets not subject to amortization |
| 1,359 | |
|
| |
Total identified intangible assets |
| $ | 4,482 | |
|
|
2016 ACQUISITIONS
Altera Corporation
On December 28, 2015, we completed the acquisition of Altera, a global semiconductor company that designs and sells programmable semiconductors and related products. We acquired all outstanding shares of Altera common stock and, subject to certain exceptions, each share of Altera common stock underlying vested stock option awards, RSUs, and performance-based RSU awards in exchange for cash. The acquired company operates as PSG and continues to design and sell programmable logic devices (PLDs), which incorporate field-programmable gate arrays (FPGAs) and complex programmable logic devices, and highly integrated SoC devices. This acquisition is expected to expand our reach within the compute continuum, as the combination of our leading-edge products and manufacturing process with Altera's leading FPGA technology enables new classes of platforms that meet customer needs in the data center and Internet of Things market segments. As we develop future platforms, the integration of PLDs into our platform solutions is expected to improve the overall performance and lower the cost of ownership for our customers. For further information, see " Note 4: Operating Segments ."
Total consideration to acquire Altera was $14.5 billion (net of $2.0 billion of cash and cash equivalents acquired).
(In Millions) |
|
| ||
Short-term investments |
| $ | 182 | |
Receivables |
| 368 | | |
Inventory |
| 555 | | |
Other current assets |
| 123 | | |
Property, plant and equipment |
| 312 | | |
Goodwill |
| 5,448 | | |
Identified intangible assets |
| 7,566 | | |
Other long-term investments and assets |
| 2,515 | | |
Deferred income |
| (351 | ) | |
Other liabilities |
| (283 | ) | |
Long-term debt |
| (1,535 | ) | |
Deferred tax liabilities |
| (449 | ) | |
Total |
| $ | 14,451 | |
The goodwill of $5.4 billion arising from the acquisition is attributed to the expected benefit and other benefits that will be generated by combining Intel and Altera. Substantially all of the goodwill recognized is not expected to be deductible for tax purposes. For further information on the assignment of goodwill for the acquisition, see " Note 11: Goodwill ."
FINANCIAL STATEMENTS | Notes to Financial Statements | 85 |
Table of Contents
|
| Fair Value (In Millions) |
| Weighted Average Estimated Useful Life (In Years) | ||
Developed technology |
| $ | 5,757 | |
| 9 |
Customer relationships |
| 1,121 | |
| 12 | |
Brands |
| 87 | |
| 6 | |
Identified intangible assets subject to amortization |
| 6,965 | |
|
| |
In-process research and development |
| 601 | |
|
| |
Identified intangible assets not subject to amortization |
| 601 | |
|
| |
Total identified intangible assets |
| $ | 7,566 | |
|
|
OTHER ACQUISITIONS
During 2017, in addition to the Mobileye acquisition, we completed two acquisitions qualifying as business combinations that were not material to Intel's operations.
In addition to the Altera acquisition, we completed 11 acquisitions qualifying as business combinations in 2016 and eight in 2015 for aggregate consideration of $1.1 billion and $1.0 billion , respectively. Consideration paid primarily consisted of cash and was net of cash acquired. For both periods, substantially all of the consideration was allocated to goodwill and identifiable intangible assets.
Other acquisitions completed in 2017, 2016, and 2015, both individually and in the aggregate, were not significant to our results of operations. For information on the assignment of goodwill to our operating segments, see " Note 11: Goodwill ," and for information on the classification of intangible assets, see " Note 12: Identified Intangible Assets ."
DIVESTITURE OF INTEL SECURITY GROUP
On April 3, 2017, we closed the transaction with TPG VII Manta Holdings, L.P., now known as Manta Holdings, L.P. (TPG), transferring certain assets and liabilities relating to ISecG to a newly formed, jointly owned, separate cybersecurity company called McAfee.
Total consideration received was $4.2 billion , consisting of $924 million in cash proceeds, $1.1 billion in the form of equity representing a 49% ownership interest in McAfee, and $2.2 billion in the form of promissory notes issued by McAfee and TPG. During the third quarter of 2017, McAfee and TPG repaid the $2.2 billion of promissory notes, which are included within proceeds from divestiture.
(In Millions) |
| Apr 1, | ||
Accounts receivable |
| $ | 317 | |
Goodwill |
| 3,601 | | |
Identified intangible assets |
| 965 | | |
Other assets |
| 276 | | |
Total assets |
| $ | 5,159 | |
|
|
| ||
|
| | ||
Deferred income |
| $ | 1,553 | |
Other liabilities |
| 276 | | |
Total liabilities |
| $ | 1,829 | |
As of the transaction close date, we recognized a pre-tax gain of $387 million within "Interest and other, net," which is net of $507 million of currency translation adjustment losses reclassified from accumulated other comprehensive income (loss) associated with currency charges on the carrying values of ISecG goodwill and identified intangible assets. In addition, we recognized a tax expense of $822 million .
FINANCIAL STATEMENTS | Notes to Financial Statements | 86 |
Table of Contents
Note 11: Goodwill
Goodwill activity for each period was as follows:
|
| Dec 31, |
| Acquisitions |
| Transfers |
| Other |
| Dec 30, | ||||||||||
Client Computing Group |
| $ | 4,356 | |
| $ | - | |
| $ | - | |
| $ | - | |
| $ | 4,356 | |
Data Center Group |
| 5,412 | |
| 9 | |
| - | |
| - | |
| 5,421 | | |||||
Internet of Things Group |
| 1,123 | |
| 3 | |
| - | |
| - | |
| 1,126 | | |||||
Programmable Solutions Group |
| 2,490 | |
| - | |
| - | |
| - | |
| 2,490 | | |||||
All other |
| 718 | |
| 10,278 | |
| - | |
| - | |
| 10,996 | | |||||
Total |
| $ | 14,099 | |
| $ | 10,290 | |
| $ | - | |
| $ | - | |
| $ | 24,389 | |
|
| Dec 26, |
| Acquisitions |
| Transfers |
| Other |
| Dec 31, | ||||||||||
Client Computing Group |
| $ | 4,078 | |
| $ | 65 | |
| $ | 213 | |
| $ | - | |
| $ | 4,356 | |
Data Center Group |
| 2,404 | |
| 2,831 | |
| 177 | |
| - | |
| 5,412 | | |||||
Internet of Things Group |
| 428 | |
| 659 | |
| 36 | |
| - | |
| 1,123 | | |||||
Intel Security Group |
| 3,599 | |
| - | |
| - | |
| (3,599 | ) |
| - | | |||||
Software and Services Group |
| 441 | |
| - | |
| (441 | ) |
| - | |
| - | | |||||
Programmable Solutions Group |
| - | |
| 2,490 | |
| - | |
| - | |
| 2,490 | | |||||
All other |
| 382 | |
| 321 | |
| 15 | |
| - | |
| 718 | | |||||
Total |
| $ | 11,332 | |
| $ | 6,366 | |
| $ | - | |
| $ | (3,599 | ) |
| $ | 14,099 | |
During the third quarter of 2016, ISecG goodwill was reclassified to assets held for sale. This reclassification of goodwill is presented within the "Other" column in the preceding table. For further information, see "Note 10: Acquisitions and Divestitures."
During the fourth quarters of 2017 , 2016 , and 2015 , we completed our annual impairment assessments and we concluded that goodwill was not impaired in any of these years. The accumulated impairment losses as of December 30, 2017 were $719 million : $365 million associated with CCG, $275 million associated with DCG, and $79 million associated with IOTG.
FINANCIAL STATEMENTS | Notes to Financial Statements | 87 |
Table of Contents
Note 12: Identified Intangible Assets
We recorded $4.5 billion of identified intangible assets from our acquisition of Mobileye during the third quarter of 2017. For further information about these acquired identified intangible assets, see "Note 10: Acquisitions and Divestitures."
|
| December 30, 2017 | ||||||||||
(In Millions) |
| Gross Assets |
| Accumulated Amortization |
| Net | ||||||
Acquisition-related developed technology |
| $ | 8,912 | |
| $ | (1,922 | ) |
| $ | 6,990 | |
Acquisition-related customer relationships |
| 2,052 | |
| (313 | ) |
| 1,739 | | |||
Acquisition-related brands |
| 143 | |
| (29 | ) |
| 114 | | |||
Licensed technology and patents |
| 3,104 | |
| (1,370 | ) |
| 1,734 | | |||
Identified intangible assets subject to amortization |
| 14,211 | |
| (3,634 | ) |
| 10,577 | | |||
In-process research and development |
| 2,168 | |
| - | |
| 2,168 | | |||
Identified intangible assets not subject to amortization |
| 2,168 | |
| - | |
| 2,168 | | |||
Total identified intangible assets |
| $ | 16,379 | |
| $ | (3,634 | ) |
| $ | 12,745 | |
|
| December 31, 2016 | ||||||||||
(In Millions) |
| Gross Assets |
| Accumulated Amortization |
| Net | ||||||
Acquisition-related developed technology |
| $ | 7,405 | |
| $ | (1,836 | ) |
| $ | 5,569 | |
Acquisition-related customer relationships |
| 1,449 | |
| (260 | ) |
| 1,189 | | |||
Acquisition-related brands |
| 87 | |
| (21 | ) |
| 66 | | |||
Licensed technology and patents |
| 3,285 | |
| (1,423 | ) |
| 1,862 | | |||
Identified intangible assets subject to amortization |
| 12,226 | |
| (3,540 | ) |
| 8,686 | | |||
In-process research and development |
| 808 | |
| - | |
| 808 | | |||
Identified intangible assets not subject to amortization |
| 808 | |
| - | |
| 808 | | |||
Total identified intangible assets |
| $ | 13,034 | |
| $ | (3,540 | ) |
| $ | 9,494 | |
|
| December 30, 2017 |
| December 31, 2016 | ||||||||
|
| Gross Assets (In Millions) |
| Estimated Useful Life (In Years) |
| Gross Assets (In Millions) |
| Estimated Useful Life (In Years) | ||||
Acquisition-related developed technology |
| $ | 2,346 | |
| 9 |
| $ | 5,842 | |
| 9 |
Acquisition-related customer relationships |
| $ | 713 | |
| 12 |
| $ | 1,148 | |
| 12 |
Acquisition-related brands |
| $ | 64 | |
| 10 |
| $ | 87 | |
| 6 |
Licensed technology and patents |
| $ | 162 | |
| 7 |
| $ | 342 | |
| 12 |
During 2017 , we acquired in-process R&D assets of $1.4 billion that were not subject to amortization.
(In Years) |
| Estimated Useful Life Range | ||
Acquisition-related developed technology |
| 5 | – | 9 |
Acquisition-related customer relationships |
| 7 | – | 12 |
Acquisition-related brands |
| 6 | – | 10 |
Licensed technology and patents |
| 2 | – | 17 |
FINANCIAL STATEMENTS | Notes to Financial Statements | 88 |
Table of Contents
Years Ended |
| Location |
| Dec 30, |
| Dec 31, |
| Dec 26, | ||||||
Acquisition-related developed technology |
| Cost of sales |
| $ | 912 | |
| $ | 937 | |
| $ | 343 | |
Acquisition-related customer relationships |
| Amortization of acquisition-related intangibles |
| 161 | |
| 270 | |
| 258 | | |||
Acquisition-related brands |
| Amortization of acquisition-related intangibles |
| 16 | |
| 24 | |
| 7 | | |||
Licensed technology and patents |
| Cost of sales |
| 288 | |
| 293 | |
| 282 | | |||
Total amortization expenses |
|
|
| $ | 1,377 | |
| $ | 1,524 | |
| $ | 890 | |
(In Millions) |
| 2018 |
| 2019 |
| 2020 |
| 2021 |
| 2022 | ||||||||||
Acquisition-related developed technology |
| $ | 1,045 | |
| $ | 1,043 | |
| $ | 1,011 | |
| $ | 976 | |
| $ | 937 | |
Acquisition-related customer relationships |
| 181 | |
| 180 | |
| 179 | |
| 179 | |
| 171 | | |||||
Acquisition-related brands |
| 20 | |
| 20 | |
| 20 | |
| 20 | |
| 6 | | |||||
Licensed technology and patents |
| 256 | |
| 243 | |
| 211 | |
| 195 | |
| 190 | | |||||
Total future amortization expenses |
| $ | 1,502 | |
| $ | 1,486 | |
| $ | 1,421 | |
| $ | 1,370 | |
| $ | 1,304 | |
Note 13: Other Long-Term Assets
|
| Dec 30, |
| Dec 31, | ||||
Equity method investments |
| $ | 1,887 | |
| $ | 1,328 | |
Non-marketable cost method investments |
| 2,613 | |
| 3,098 | | ||
Non-current deferred tax assets |
| 840 | |
| 907 | | ||
Pre-payments for property, plant and equipment |
| 714 | |
| 347 | | ||
Loans receivable |
| 860 | |
| 236 | | ||
Other |
| 688 | |
| 1,243 | | ||
Total other long-term assets |
| $ | 7,602 | |
| $ | 7,159 | |
Note 14: Borrowings
SHORT-TERM DEBT
|
| Dec 30, |
| Dec 31, | ||||
Drafts payable |
| $ | 37 | |
| $ | 25 | |
Current portion of long-term debt |
| 1,739 | |
| 4,609 | | ||
Total short-term debt |
| $ | 1,776 | |
| $ | 4,634 | |
Our current portion of long-term debt includes our 2009 junior subordinated convertible debentures due 2039, as well as debt classified as short-term based on contractual maturity.
We have an ongoing authorization from our Board of Directors to borrow up to $10.0 billion under our commercial paper program. This amount includes an increase of $5.0 billion in the authorization limit approved by our Board of Directors in April 2017.
FINANCIAL STATEMENTS | Notes to Financial Statements | 89 |
Table of Contents
LONG-TERM DEBT
|
| December 30, 2017 |
| December 31, 2016 | ||||||
(In Millions) |
| Effective Interest Rate |
| Amount |
| Amount | ||||
Floating-rate senior notes: |
|
|
|
|
|
| ||||
Three-month LIBOR plus 0.08%, due May 2020 |
| 1.40% |
| $ | 700 | |
| $ | - | |
Three-month LIBOR plus 0.35%, due May 2022 |
| 1.66% |
| 800 | |
| - | | ||
Fixed-rate senior notes: |
|
|
|
|
|
| ||||
1.75%, due May 2017 |
| n/a |
| - | |
| 500 | | ||
1.35%, due December 2017 |
| n/a |
| - | |
| 3,000 | | ||
2.50%, due November 2018 |
| 2.14% |
| 600 | |
| 600 | | ||
3.25%, due December 2019 1 |
| 2.19% |
| 194 | |
| 180 | | ||
1.85%, due May 2020 |
| 1.90% |
| 1,000 | |
| - | | ||
2.45%, due July 2020 |
| 2.50% |
| 1,750 | |
| 1,750 | | ||
1.70%, due May 2021 |
| 1.78% |
| 500 | |
| 500 | | ||
3.30%, due October 2021 |
| 2.69% |
| 2,000 | |
| 2,000 | | ||
2.35%, due May 2022 |
| 1.86% |
| 750 | |
| - | | ||
3.10%, due July 2022 |
| 2.50% |
| 1,000 | |
| 1,000 | | ||
4.00%, due December 2022 1 |
| 2.98% |
| 428 | |
| 396 | | ||
2.70%, due December 2022 |
| 2.08% |
| 1,500 | |
| 1,500 | | ||
4.10%, due November 2023 |
| 3.23% |
| 400 | |
| 400 | | ||
2.88%, due May 2024 |
| 2.36% |
| 1,250 | |
| - | | ||
2.70%, due June 2024 |
| 2.12% |
| 600 | |
| - | | ||
3.70%, due July 2025 |
| 3.20% |
| 2,250 | |
| 2,250 | | ||
2.60%, due May 2026 |
| 1.66% |
| 1,000 | |
| 1,000 | | ||
3.15%, due May 2027 |
| 2.82% |
| 1,000 | |
| - | | ||
4.00%, due December 2032 |
| 4.10% |
| 750 | |
| 750 | | ||
4.80%, due October 2041 |
| 4.86% |
| 802 | |
| 1,500 | | ||
4.25%, due December 2042 |
| 4.39% |
| 567 | |
| 925 | | ||
4.90%, due July 2045 |
| 4.92% |
| 772 | |
| 2,000 | | ||
4.90%, due August 2045 |
| n/a |
| - | |
| 1,007 | | ||
4.70%, due December 2045 |
| 2.49% |
| 915 | |
| 915 | | ||
4.10%, due May 2046 |
| 4.12% |
| 1,250 | |
| 1,250 | | ||
4.10%, due May 2047 |
| 4.13% |
| 1,000 | |
| - | | ||
4.10%, due August 2047 |
| 2.15% |
| 640 | |
| - | | ||
3.73%, due December 2047 |
| 3.74% |
| 1,967 | |
| - | | ||
Junior subordinated convertible debentures: |
|
|
|
|
|
| ||||
2.95%, due December 2035 |
| n/a |
| - | |
| 1,600 | | ||
3.25%, due August 2039 2 |
| 4.03% |
| 2,000 | |
| 2,000 | | ||
Total senior notes and other borrowings |
|
|
| 28,385 | |
| 27,023 | | ||
Unamortized premium/discount and issuance costs |
|
|
| (1,357 | ) |
| (1,581 | ) | ||
Hedge accounting fair value adjustments |
|
|
| (252 | ) |
| (184 | ) | ||
Long-term debt |
|
|
| 26,776 | |
| 25,258 | | ||
Current portion of long-term debt |
|
|
| (1,739 | ) |
| (4,609 | ) | ||
Total long-term debt |
|
|
| $ | 25,037 | |
| $ | 20,649 | |
1 | To manage foreign currency risk associated with the Australian-dollar-denominated notes issued in 2015, we entered into currency interest rate swaps with an aggregate notional amount of $577 million , which effectively converted these notes to U.S.-dollar-denominated notes. For further discussion on our currency interest rate swaps, see " Note 17: Derivative Financial Instruments ." Principal and unamortized discount/issuance costs for the Australian-dollar-denominated notes in the table above were calculated using foreign currency exchange rates as of December 30, 2017 and December 31, 2016 . |
2 | Effective interest rate for the year ended December 31, 2016 was 4.01% . |
FINANCIAL STATEMENTS | Notes to Financial Statements | 90 |
Table of Contents
In 2017, we began assessing fair value hierarchy levels for our short-term and long-term debt based on the underlying instrument type. The fair value of our convertible debentures is determined using discounted cash flow models with observable market inputs, and takes into consideration variables such as interest rate changes, comparable instruments, subordination discount, and credit-rating changes. As of December 30, 2017 and December 31, 2016 , the fair value of short-term debt (excluding drafts payable) was $2.4 billion and $5.1 billion , respectively, and the fair value of long-term debt, excluding the current portion of long-term debt, was $27.0 billion and $22.0 billion , respectively. These liabilities are classified as Level 2 within the fair value hierarchy based on the nature of the fair value inputs.
Senior Notes
During 2017, we issued a total of $7.7 billion aggregate principal amount of senior notes, which excludes the private placement of $2.0 billion of senior notes issued in December 2017 as discussed in the following paragraph. We used the net proceeds from the offerings of the notes for general corporate purposes, which included refinancing of outstanding debt and repurchase of shares of our common stock. Additionally, we redeemed our $1.0 billion , 4.90% senior notes due August 2045 .
In December 2017, we completed exchange and cash offers for our outstanding 4.80% senior notes due 2041, 4.25% senior notes due 2042, and 4.90% senior notes due 2045 (Old Notes). As a result of the exchange offer, we issued in a private placement $2.0 billion principal amount of 3.73% senior notes due 2047 and paid $293 million cash in exchange for $1.9 billion aggregate principal amount of the Old Notes. As a result of the cash offer, we paid $518 million to repurchase $425 million aggregate principal amount and recognized a $93 million loss on the extinguishment of the Old Notes.
During 2016, we issued a total of $2.8 billion aggregate principal amount of senior unsecured notes to refinance existing indebtedness, including our 1.95% senior notes due 2016 and a portion of our 1.35% senior notes due 2017. In connection with our completed acquisition of Altera, in the first quarter of 2016, we acquired a total of $1.5 billion aggregate principal amount of senior unsecured notes.
Our senior floating-rate notes pay interest quarterly and our senior fixed-rate notes pay interest semiannually. We may redeem the fixed-rate notes prior to their maturity at our option at specified redemption prices and subject to certain restrictions. The obligations under the notes rank equally in right of payment with all of our other existing and future senior unsecured indebtedness and will effectively rank junior to all liabilities of our subsidiaries.
Convertible Debentures
In December 2017, we paid $2.8 billion to convert our $1.6 billion 2.95% junior subordinated convertible debentures due 2035. We recognized a loss of $385 million in interest and other, net and $1.4 billion as a reduction to stockholders' equity related to the conversion feature.
In 2009, we issued junior subordinated convertible debentures due 2039 (2009 debentures), which pay a fixed rate of interest semiannually. The 2009 debentures have a contingent interest component that requires us to pay interest based on certain thresholds or for certain events, commencing on August 1, 2019. After such date, if the 10 -day average trading price of $1,000 principal amount of the bond immediately preceding any six -month interest period is less than or equal to $650 or greater than or equal to $1,500 , we are required to pay contingent 0.25% or 0.50% annual interest, respectively.
The 2009 debentures are convertible, subject to certain conditions. Holders can surrender the 2009 debentures for conversion if the closing price of Intel common stock has been at least 130% of the conversion price then in effect for at least 20 trading days during the 30 consecutive trading-day period ending on the last trading day of the preceding fiscal quarter. We will settle any conversion of the 2009 debentures in cash up to the face value, and any amount in excess of face value will be settled in cash or stock at our option. On or after August 5, 2019, we can redeem, for cash, all or part of the 2009 debentures for the principal amount, plus any accrued and unpaid interest, if the closing price of Intel common stock has been at least 150% of the conversion price then in effect for at least 20 trading days during any 30 consecutive trading-day period. In addition, if certain events occur in the future, the indenture governing the 2009 debentures provides that each holder of the debentures can, for a pre-defined period of time, require us to repurchase the holder's debentures for the principal amount plus any accrued and unpaid interest. The 2009 debentures are subordinated in right of payment to any existing and future senior debt and to the other liabilities of our subsidiaries. We have concluded that the 2009 debentures are not conventional convertible debt instruments and that the embedded stock conversion options qualify as derivatives. In addition, we have concluded that the embedded conversion options would be classified in stockholders' equity if they were freestanding derivative instruments and are not accounted for separately as derivative liabilities.
FINANCIAL STATEMENTS | Notes to Financial Statements | 91 |
Table of Contents
|
| 2009 Debentures | ||||||
(In Millions, Except Per Share Amounts) |
| Dec 30, |
| Dec 31, | ||||
Outstanding principal |
| $ | 2,000 | |
| $ | 2,000 | |
Equity component (including temporary equity) carrying amount |
| $ | 613 | |
| $ | 613 | |
Unamortized discount 1 |
| $ | 866 | |
| $ | 882 | |
Net debt carrying amount |
| $ | 1,134 | |
| $ | 1,118 | |
Conversion rate (shares of common stock per $1,000 principal amount of debentures) |
| 48.37 | |
| 47.72 | | ||
Effective conversion price (per share of common stock) |
| $ | 20.68 | |
| $ | 20.95 | |
1 | The unamortized discounts for the 2009 debentures are amortized over the remaining life of the debt. |
The conversion rate adjusts for certain events outlined in the indentures governing the 2009 debentures, such as quarterly dividend distributions in excess of $0.14 per share, but it does not adjust for accrued interest. In addition, the conversion rate will increase for a holder of the 2009 debentures who elects to convert the debentures in connection with certain share exchanges, mergers, or consolidations involving Intel.
Debt Maturities
(In Millions) |
| 2018 |
| 2019 |
| 2020 |
| 2021 |
| 2022 |
| 2023 and thereafter |
| Total | ||||||||||||||
|
| $ | 600 | |
| $ | 194 | |
| $ | 3,450 | |
| $ | 2,500 | |
| $ | 4,478 | |
| $ | 17,163 | |
| $ | 28,385 | |
In the preceding table, the 2009 debentures are classified based on their stated maturity date, regardless of their classification on the consolidated balance sheet .
FINANCIAL STATEMENTS | Notes to Financial Statements | 92 |
Table of Contents
Note 15: Fair Value
ASSETS AND LIABILITIES MEASURED AND RECORDED AT FAIR VALUE ON A RECURRING BASIS
|
| December 30, 2017 |
| December 31, 2016 | ||||||||||||||||||||||||||||
|
| Fair Value Measured and Recorded at Reporting Date Using |
| Total |
| Fair Value Measured and Recorded at Reporting Date Using |
| Total | ||||||||||||||||||||||||
(In Millions) |
| Level 1 |
| Level 2 |
| Level 3 |
| Level 1 |
| Level 2 |
| Level 3 |
| |||||||||||||||||||
Assets |
|
|
|
|
|
|
|
|
|
|
|
|
|
|
|
| ||||||||||||||||
Cash equivalents: |
|
|
|
|
|
|
|
|
|
|
|
|
|
|
|
| ||||||||||||||||
Corporate debt |
| $ | - | |
| $ | 30 | |
| $ | - | |
| $ | 30 | |
| $ | - | |
| $ | 498 | |
| $ | - | |
| $ | 498 | |
Financial institution instruments 1 |
| 335 | |
| 640 | |
| - | |
| 975 | |
| 1,920 | |
| 811 | |
| - | |
| 2,731 | | ||||||||
Government debt 2 |
| - | |
| 90 | |
| - | |
| 90 | |
| - | |
| 332 | |
| - | |
| 332 | | ||||||||
Reverse repurchase agreements |
| - | |
| 1,399 | |
| - | |
| 1,399 | |
| - | |
| 768 | |
| - | |
| 768 | | ||||||||
Short-term investments: |
|
|
|
|
|
|
|
|
|
|
|
|
|
|
|
| ||||||||||||||||
Corporate debt |
| - | |
| 672 | |
| 3 | |
| 675 | |
| - | |
| 1,332 | |
| 6 | |
| 1,338 | | ||||||||
Financial institution instruments 1 |
| - | |
| 1,009 | |
| - | |
| 1,009 | |
| - | |
| 1,603 | |
| - | |
| 1,603 | | ||||||||
Government debt 2 |
| - | |
| 130 | |
| - | |
| 130 | |
| - | |
| 284 | |
| - | |
| 284 | | ||||||||
Trading assets: |
|
|
|
|
|
|
|
|
|
|
|
|
|
|
|
| ||||||||||||||||
Asset-backed securities |
| - | |
| 2 | |
| - | |
| 2 | |
| - | |
| 87 | |
| - | |
| 87 | | ||||||||
Corporate debt |
| - | |
| 2,842 | |
| - | |
| 2,842 | |
| - | |
| 2,847 | |
| - | |
| 2,847 | | ||||||||
Financial institution instruments 1 |
| 59 | |
| 1,064 | |
| - | |
| 1,123 | |
| 36 | |
| 1,608 | |
| - | |
| 1,644 | | ||||||||
Government debt 2 |
| 30 | |
| 4,758 | |
| - | |
| 4,788 | |
| 32 | |
| 3,704 | |
| - | |
| 3,736 | | ||||||||
Other current assets: |
|
|
|
|
|
|
|
|
|
|
|
|
|
|
|
| ||||||||||||||||
Derivative assets |
| 2 | |
| 277 | |
| - | |
| 279 | |
| - | |
| 382 | |
| - | |
| 382 | | ||||||||
Loans receivable |
| - | |
| 30 | |
| - | |
| 30 | |
| - | |
| 326 | |
| - | |
| 326 | | ||||||||
Marketable equity securities |
| 4,148 | |
| 44 | |
| - | |
| 4,192 | |
| 6,180 | |
| - | |
| - | |
| 6,180 | | ||||||||
Other long-term investments: |
|
|
|
|
|
|
|
|
|
|
|
|
|
|
|
| ||||||||||||||||
Corporate debt |
| - | |
| 1,576 | |
| 4 | |
| 1,580 | |
| - | |
| 1,995 | |
| 6 | |
| 2,001 | | ||||||||
Financial institution instruments 1 |
| - | |
| 1,397 | |
| - | |
| 1,397 | |
| - | |
| 1,758 | |
| - | |
| 1,758 | | ||||||||
Government debt 2 |
| - | |
| 735 | |
| - | |
| 735 | |
| - | |
| 957 | |
| - | |
| 957 | | ||||||||
Other long-term assets: |
|
|
|
|
|
|
|
|
|
|
|
|
|
|
|
| ||||||||||||||||
Derivative assets |
| - | |
| 77 | |
| 7 | |
| 84 | |
| - | |
| 31 | |
| 9 | |
| 40 | | ||||||||
Loans receivable |
| - | |
| 610 | |
| - | |
| 610 | |
| - | |
| 236 | |
| - | |
| 236 | | ||||||||
Total assets measured and recorded at fair value |
| 4,574 | |
| 17,382 | |
| 14 | |
| 21,970 | |
| 8,168 | |
| 19,559 | |
| 21 | |
| 27,748 | | ||||||||
Liabilities |
|
|
|
|
|
|
|
|
|
|
|
|
|
|
|
| ||||||||||||||||
Other accrued liabilities: |
|
|
|
|
|
|
|
|
|
|
|
|
|
|
|
| ||||||||||||||||
Derivative liabilities |
| - | |
| 454 | |
| - | |
| 454 | |
| - | |
| 371 | |
| - | |
| 371 | | ||||||||
Other long-term liabilities: |
|
|
|
|
|
|
|
|
|
|
|
|
|
|
|
| ||||||||||||||||
Derivative liabilities |
| - | |
| 297 | |
| 6 | |
| 303 | |
| - | |
| 179 | |
| 33 | |
| 212 | | ||||||||
Total liabilities measured and recorded at fair value |
| $ | - | |
| $ | 751 | |
| $ | 6 | |
| $ | 757 | |
| $ | - | |
| $ | 550 | |
| $ | 33 | |
| $ | 583 | |
1 | Level 1 investments consist of money market funds. Level 2 investments consist primarily of commercial paper, certificates of deposit, time deposits, and notes and bonds issued by financial institutions. |
2 | Level 1 investments consist primarily of U.S. Treasury securities. Level 2 investments consist primarily of U.S. Agency notes and non-U.S. government debt. |
In the second quarter of 2017, we began assigning fair value hierarchy levels based on the underlying instrument type for our fixed-income portfolio. We have reclassified prior period amounts to conform to the current period presentation.
FAIR VALUE OPTION FOR LOANS RECEIVABLE
The fair value of our loans receivable for which we elected the fair value option did not significantly differ from the contractual principal balance as of December 30, 2017 and December 31, 2016 .
FINANCIAL STATEMENTS | Notes to Financial Statements | 93 |
Table of Contents
ASSETS MEASURED AND RECORDED AT FAIR VALUE ON A NON-RECURRING BASIS
Our non-marketable equity investments, marketable equity method investments, and non-financial assets-such as intangible assets and property, plant and equipment-are recorded at fair value only if an impairment is recognized.
We classified non-marketable equity investments as Level 3. Impairments recognized on non-marketable equity investments held as of December 30, 2017 were $537 million ( $153 million held as of December 31, 2016 and $160 million held as of December 26, 2015 ).
FINANCIAL INSTRUMENTS NOT RECORDED AT FAIR VALUE ON A RECURRING BASIS
Financial instruments not recorded at fair value on a recurring basis include non-marketable cost method investments, grants receivable, loans receivable, reverse repurchase agreements, and our short-term and long-term debt.
As of December 30, 2017 , the carrying amount and fair value of our non-marketable cost method investments was $2.6 billion and $3.6 billion , respectively ( $3.1 billion and $3.9 billion as of December 31, 2016 , respectively). These measures are classified as Level 3 within the fair value hierarchy based on the nature of the fair value inputs.
As of December 30, 2017 , the aggregate carrying value of grants receivable, loans receivable, and reverse repurchase agreements was $935 million (the aggregate carrying amount as of December 31, 2016 was $876 million ). The estimated fair value of these financial instruments approximates their carrying value and is categorized as Level 2 within the fair value hierarchy based on the nature of the fair value inputs.
For information related to the fair value of our short-term and long-term debt, see " Note 14: Borrowings ."
Note 16: Other Comprehensive Income (Loss)
The changes in accumulated other comprehensive income (loss) by component and related tax effects for each period were as follows:
(In Millions) |
| Unrealized Holding Gains (Losses) on Available-for-Sale Investments |
| Deferred Tax Asset Valuation Allowance |
| Unrealized Holding Gains (Losses) on Derivatives |
| Actuarial Valuation and Other Pension Expenses |
| Foreign Currency Translation Adjustment |
| Total | ||||||||||||
December 26, 2015 |
| $ | 1,749 | |
| $ | 8 | |
| $ | (266 | ) |
| $ | (916 | ) |
| $ | (515 | ) |
| $ | 60 | |
Other comprehensive income (loss) before reclassifications |
| 1,170 | |
| - | |
| (26 | ) |
| (680 | ) |
| (4 | ) |
| 460 | | ||||||
Amounts reclassified out of accumulated other comprehensive income (loss) |
| (530 | ) |
| - | |
| 38 | |
| 170 | |
| - | |
| (322 | ) | ||||||
Tax effects |
| (225 | ) |
| (8 | ) |
| (5 | ) |
| 146 | |
| - | |
| (92 | ) | ||||||
Other comprehensive income (loss) |
| 415 | |
| (8 | ) |
| 7 | |
| (364 | ) |
| (4 | ) |
| 46 | | ||||||
December 31, 2016 |
| 2,164 | |
| - | |
| (259 | ) |
| (1,280 | ) |
| (519 | ) |
| 106 | | ||||||
Other comprehensive income (loss) before reclassifications |
| 2,760 | |
| - | |
| 605 | |
| 275 | |
| 3 | |
| 3,643 | | ||||||
Amounts reclassified out of accumulated other comprehensive income (loss) |
| (3,431 | ) |
| - | |
| (69 | ) |
| 103 | |
| 507 | |
| (2,890 | ) | ||||||
Tax effects |
| 235 | |
| - | |
| (171 | ) |
| (61 | ) |
| - | |
| 3 | | ||||||
Other comprehensive income (loss) |
| (436 | ) |
| - | |
| 365 | |
| 317 | |
| 510 | |
| 756 | | ||||||
December 30, 2017 |
| $ | 1,728 | |
| $ | - | |
| $ | 106 | |
| $ | (963 | ) |
| $ | (9 | ) |
| $ | 862 | |
FINANCIAL STATEMENTS | Notes to Financial Statements | 94 |
Table of Contents
|
|
|
| Income Before Taxes Impact for Years Ended (In Millions) | ||||||||||
Comprehensive Income Components |
| Location |
| Dec 30, |
| Dec 31, |
| Dec 26, | ||||||
Unrealized holding gains (losses) 1 on available-for-sale investments: |
|
|
|
|
|
|
|
| ||||||
|
| Gains (losses) on equity investments, net |
| $ | 3,431 | |
| $ | 530 | |
| $ | 93 | |
|
|
|
| 3,431 | |
| 530 | |
| 93 | | |||
Unrealized holding gains (losses) on derivatives: |
|
|
|
|
|
|
|
| ||||||
Foreign currency contracts |
| Cost of sales |
| (65 | ) |
| (65 | ) |
| (290 | ) | |||
|
| Research and development |
| 45 | |
| 7 | |
| (177 | ) | |||
|
| Marketing, general and administrative |
| 7 | |
| 5 | |
| (46 | ) | |||
|
| Gains (losses) on equity investments, net |
| 57 | |
| 11 | |
| - | | |||
|
| Interest and other, net |
| 25 | |
| 4 | |
| (9 | ) | |||
|
|
|
| 69 | |
| (38 | ) |
| (522 | ) | |||
Amortization of pension and postretirement benefit components: |
|
|
|
|
|
|
|
| ||||||
Actuarial valuation and other pension expenses |
|
|
| (103 | ) |
| (170 | ) |
| (77 | ) | |||
|
|
|
| (103 | ) |
| (170 | ) |
| (77 | ) | |||
Currency translation adjustment |
| Interest and other, net |
| (507 | ) |
| - | |
| - | | |||
Total amounts reclassified out of accumulated other comprehensive income (loss) |
|
|
| $ | 2,890 | |
| $ | 322 | |
| $ | (506 | ) |
1 | We determine the cost of the investment sold based on an average cost basis at the individual security level. |
The amortization of pension and postretirement benefit components is included in the computation of net periodic benefit cost. For more information, see " Note 18: Retirement Benefit Plans ."
We estimate that we will reclassify approximately $108 million (before taxes) of net derivative gains included in accumulated other comprehensive income (loss) into earnings within the next 12 months.
During the second quarter of 2017, we reclassified $507 million (before taxes) of currency translation adjustment losses included in accumulated other comprehensive income (loss) into earnings as a result of our divestiture of ISecG. For more information, see " Note 10: Acquisitions and Divestitures ."
FINANCIAL STATEMENTS | Notes to Financial Statements | 95 |
Table of Contents
Note 17: Derivative Financial Instruments
VOLUME OF DERIVATIVE ACTIVITY
(In Millions) |
| Dec 30, |
| Dec 31, |
| Dec 26, | ||||||
Foreign currency contracts |
| $ | 19,958 | |
| $ | 17,960 | |
| $ | 16,721 | |
Interest rate contracts |
| 16,823 | |
| 14,228 | |
| 8,812 | | |||
Other |
| 1,636 | |
| 1,340 | |
| 1,122 | | |||
Total |
| $ | 38,417 | | | $ | 33,528 | | | $ | 26,655 | |
During the periods presented, we entered into $4.8 billion , $4.7 billion , and $4.4 billion , respectively, of interest rate swaps to hedge against changes in the fair value attributable to the benchmark interest rates related to our outstanding senior notes. These hedges were designated as fair value hedges. During 2015, we entered into $577 million of currency interest rate swaps to hedge against the variability in the U.S.-dollar equivalent of coupon and principal payments associated with our non-U.S.-dollar-denominated indebtedness. These hedges were designated as cash flow hedges.
During 2015, we discontinued cash flow hedge accounting treatment for $478 million of forward contracts related to our anticipated equity funding of the UniSpreadtrum investment since we could no longer assert that funding is probable to occur within the initially specified time frame. Hedge losses accumulated in other comprehensive income and subsequently released to interest and other, net, related to these de-designated forward contracts were insignificant.
FAIR VALUE OF DERIVATIVE INSTRUMENTS IN THE CONSOLIDATED BALANCE SHEETS
|
| December 30, 2017 |
| December 31, 2016 | ||||||||||||
(In Millions) |
| Assets 1 |
| Liabilities 2 |
| Assets 1 |
| Liabilities 2 | ||||||||
Derivatives designated as hedging instruments |
|
|
|
|
|
|
|
| ||||||||
Foreign currency contracts 3 |
| $ | 283 | |
| $ | 32 | |
| $ | 21 | |
| $ | 252 | |
Interest rate contracts |
| 1 | |
| 254 | |
| 3 | |
| 187 | | ||||
Total derivatives designated as hedging instruments |
| 284 | | | 286 | | | 24 | | | 439 | | ||||
Derivatives not designated as hedging instruments |
|
|
|
|
|
|
|
| ||||||||
Foreign currency contracts 3 |
| 52 | |
| 447 | |
| 374 | |
| 114 | | ||||
Interest rate contracts |
| 18 | |
| 24 | |
| 15 | |
| 30 | | ||||
Other |
| 9 | |
| - | |
| 9 | |
| - | | ||||
Total derivatives not designated as hedging instruments |
| 79 | | | 471 | | | 398 | | | 144 | | ||||
Total derivatives |
| $ | 363 | | | $ | 757 | | | $ | 422 | | | $ | 583 | |
1 | Derivative assets are recorded as other assets, current and non-current. |
2 | Derivative liabilities are recorded as other liabilities, current and non-current. |
3 | The majority of these instruments mature within 12 months . |
FINANCIAL STATEMENTS | Notes to Financial Statements | 96 |
Table of Contents
AMOUNTS OFFSET IN THE CONSOLIDATED BALANCE SHEETS
The gross amounts of our derivative instruments and reverse repurchase agreements subject to master netting arrangements with various counterparties, and cash and non-cash collateral posted under such agreements at the end of each period were as follows:
|
| December 30, 2017 | ||||||||||||||||||||||
|
|
|
|
|
|
|
| Gross Amounts Not Offset in the Balance Sheet |
|
| ||||||||||||||
(In Millions) |
| Gross Amounts Recognized |
| Gross Amounts Offset in the Balance Sheet |
| Net Amounts Presented in the Balance Sheet |
| Financial Instruments |
| Cash and Non-Cash Collateral Received or Pledged |
| Net Amount | ||||||||||||
Assets: |
|
|
|
|
|
|
|
|
|
|
|
| ||||||||||||
Derivative assets subject to master netting arrangements |
| $ | 350 | |
| $ | - | |
| $ | 350 | |
| $ | (206 | ) |
| $ | (130 | ) |
| $ | 14 | |
Reverse repurchase agreements |
| 1,649 | |
| - | |
| 1,649 | |
| - | |
| (1,649 | ) |
| - | | ||||||
Total assets |
| 1,999 | | | - | | | 1,999 | | | (206 | ) | | (1,779 | ) | | 14 | | ||||||
Liabilities: |
|
|
|
|
|
|
|
|
|
|
|
| ||||||||||||
Derivative liabilities subject to master netting arrangements |
| 745 | |
| - | |
| 745 | |
| (206 | ) |
| (504 | ) |
| 35 | | ||||||
Total liabilities |
| $ | 745 | | | $ | - | | | $ | 745 | | | $ | (206 | ) | | $ | (504 | ) | | $ | 35 | |
|
| December 31, 2016 | ||||||||||||||||||||||
|
|
|
|
|
|
|
| Gross Amounts Not Offset in the Balance Sheet |
|
| ||||||||||||||
(In Millions) |
| Gross Amounts Recognized |
| Gross Amounts Offset in the Balance Sheet |
| Net Amounts Presented in the Balance Sheet |
| Financial Instruments |
| Cash and Non-Cash Collateral Received or Pledged |
| Net Amount | ||||||||||||
Assets: |
|
|
|
|
|
|
|
|
|
|
|
| ||||||||||||
Derivative assets subject to master netting arrangements |
| $ | 433 | |
| $ | - | |
| $ | 433 | |
| $ | (368 | ) |
| $ | (42 | ) |
| $ | 23 | |
Reverse repurchase agreements |
| 1,018 | |
| - | |
| 1,018 | |
| - | |
| (1,018 | ) |
| - | | ||||||
Total assets |
| 1,451 | | | - | | | 1,451 | | | (368 | ) | | (1,060 | ) | | 23 | | ||||||
Liabilities: |
|
|
|
|
|
|
|
|
|
|
|
| ||||||||||||
Derivative liabilities subject to master netting arrangements |
| 588 | |
| - | |
| 588 | |
| (368 | ) |
| (201 | ) |
| 19 | | ||||||
Total liabilities |
| $ | 588 | | | $ | - | | | $ | 588 | | | $ | (368 | ) | | $ | (201 | ) | | $ | 19 | |
We obtain and secure available collateral from counterparties against obligations, including securities lending transactions and reverse repurchase agreements, when we deem it appropriate.
FINANCIAL STATEMENTS | Notes to Financial Statements | 97 |
Table of Contents
DERIVATIVES IN CASH FLOW HEDGING RELATIONSHIPS
The before-tax net gains or losses attributed to the effective portion of cash flow hedges, recognized in other comprehensive income (loss), were $605 million net gains in 2017 ( $26 million net losses in 2016 and $298 million net losses in 2015 ). Substantially all of our cash flow hedges are foreign currency contracts for all periods presented.
Hedge ineffectiveness and amounts excluded from effectiveness testing were insignificant during all periods presented.
For information on the unrealized holding gains (losses) on derivatives reclassified out of accumulated other comprehensive income into the consolidated statements of income, see " Note 16: Other Comprehensive Income (Loss) ."
DERIVATIVES IN FAIR VALUE HEDGING RELATIONSHIPS
The effects of derivative instruments designated as fair value hedges, recognized in interest and other, net for each period were as follows:
|
| Gains (Losses) Recognized in Statement of Income on Derivatives | ||||||||||
Years Ended |
| Dec 30, |
| Dec 31, |
| Dec 26, | ||||||
Interest rate contracts |
| $ | (68 | ) |
| $ | (171 | ) |
| $ | (13 | ) |
Hedged items |
| 68 | |
| 171 | |
| 13 | | |||
Total |
| $ | - | |
| $ | - | |
| $ | - | |
There was no ineffectiveness during all periods presented in the preceding table.
Line Item in the Consolidated Balance Sheet in Which the Hedged Item Is Included |
| Carrying Amount of the Hedged Item Asset/(Liabilities) |
| Cumulative Amount of Fair Value Hedging Adjustment Included in the Carrying Amount Assets/(Liabilities) | ||||||||||||
Years Ended |
| Dec 30, |
| Dec 31, |
| Dec 30, |
| Dec 31, | ||||||||
Long-Term Debt |
| $ | (12,653 | ) |
| $ | (8,879 | ) |
| $ | 252 | |
| $ | 184 | |
As of December 30, 2017 and December 31, 2016 , the total notional amount of pay variable/receive fixed-interest rate swaps was $12.9 billion and $9.1 billion , respectively.
DERIVATIVES NOT DESIGNATED AS HEDGING INSTRUMENTS
The effects of derivative instruments not designated as hedging instruments on the consolidated statements of income for each period were as follows:
Years Ended |
| Location of Gains (Losses) Recognized in Income on Derivatives |
| Dec 30, |
| Dec 31, |
| Dec 26, | ||||||
Foreign currency contracts |
| Interest and other, net |
| $ | (547 | ) |
| $ | 388 | |
| $ | 296 | |
Interest rate contracts |
| Interest and other, net |
| 9 | |
| 8 | |
| (8 | ) | |||
Other |
| Various |
| 203 | |
| 113 | |
| (38 | ) | |||
Total |
| $ | (335 | ) | | $ | 509 | | | $ | 250 | | ||
FINANCIAL STATEMENTS | Notes to Financial Statements | 98 |
Table of Contents
Note 18: Retirement Benefit Plans
DEFINED CONTRIBUTION PLANS
We provide tax-qualified defined contribution plans for the benefit of eligible employees, former employees, and retirees in the U.S. and certain other countries. The plans are designed to provide employees with an accumulation of funds for retirement on a tax-deferred basis. For the benefit of eligible U.S. employees, we also provide an unfunded non-tax-qualified supplemental deferred compensation plan for certain highly compensated employees.
We expensed $346 million for discretionary contributions to the U.S. qualified defined contribution and non-qualified deferred compensation plans in 2017 ( $326 million in 2016 and $337 million in 2015 ).
U.S. POSTRETIREMENT MEDICAL BENEFITS PLAN
Upon retirement, we provide benefits to eligible U.S. employees who were hired prior to 2014 under the U.S. Postretirement Medical Benefits Plan. The benefits can be used to pay all or a portion of the cost to purchase eligible coverage in a medical plan.
As of December 30, 2017 and December 31, 2016 , the projected benefit obligation was $567 million and $588 million , respectively, which used the discount rate of 3.8% and 4.2% , respectively. The December 30, 2017 and December 31, 2016 corresponding fair value of plan assets was $563 million and $409 million , respectively.
The investment strategy for U.S. Postretirement Medical Benefits Plan assets is to invest primarily in liquid assets, due to the level of expected future benefit payments. The assets are invested solely in a tax-aware global equity portfolio, which is actively managed by an external investment manager. The tax-aware global equity portfolio is composed of a diversified mix of equities in developed countries. For 2018 , the expected long-term rate of return for the U.S. Postretirement Medical Benefits Plan assets is 5.9% . As of December 30, 2017 , substantially all of the U.S. Postretirement Medical Benefits Plan assets were invested in exchange-traded equity securities and were measured at fair value using Level 1 inputs.
(In Millions) |
| 2018 |
| 2019 |
| 2020 |
| 2021 |
| 2022 |
| 2023-2027 | ||||||||||||
Postretirement Medical Benefits |
| $ | 28 | |
| $ | 29 | |
| $ | 30 | |
| $ | 31 | |
| $ | 32 | |
| $ | 179 | |
PENSION BENEFIT PLANS
We provide defined-benefit pension plans in certain countries, most significantly the U.S., Ireland, Germany, and Israel. The majority of the plans' benefits have been frozen.
FINANCIAL STATEMENTS | Notes to Financial Statements | 99 |
Table of Contents
BENEFIT OBLIGATION AND PLAN ASSETS FOR PENSION BENEFITS PLANS
|
| Dec 30, |
| Dec 31, | ||||
Changes in projected benefit obligation: |
|
|
|
| ||||
Beginning projected benefit obligation |
| $ | 3,640 | |
| $ | 3,130 | |
Service cost |
| 84 | |
| 130 | | ||
Interest cost |
| 117 | |
| 106 | | ||
Actuarial (gain) loss |
| 24 | |
| 575 | | ||
Currency exchange rate changes |
| 281 | |
| (80 | ) | ||
Plan curtailments |
| (162 | ) |
| 17 | | ||
Plan settlements |
| (101 | ) |
| (202 | ) | ||
Other |
| (41 | ) |
| (36 | ) | ||
Ending projected benefit obligation 1 |
| 3,842 | |
| 3,640 | | ||
|
|
|
|
| ||||
Changes in fair value of plan assets: |
|
|
|
| ||||
Beginning fair value of plan assets |
| 1,696 | |
| 1,638 | | ||
Actual return on plan assets |
| 136 | |
| 81 | | ||
Employer contributions |
| 471 | |
| 416 | | ||
Currency exchange rate changes |
| 124 | |
| (26 | ) | ||
Plan settlements |
| (101 | ) |
| (202 | ) | ||
Benefits paid to plan participants |
| (42 | ) |
| (84 | ) | ||
Other |
| 3 | |
| (127 | ) | ||
Ending fair value of plan assets 2 |
| 2,287 | |
| 1,696 | | ||
|
|
|
|
| ||||
Amounts recognized in the consolidated balance sheet 3 |
| $ | 1,555 | |
| $ | 1,944 | |
|
|
|
|
| ||||
Accumulated other comprehensive loss (income), before tax 4 |
| $ | 1,257 | |
| $ | 1,603 | |
|
|
|
|
| ||||
Accumulated benefit obligation 5 |
| $ | 3,423 | |
| $ | 2,976 | |
1 | The split between U.S. and non-U.S. in the projected benefit obligation was 38% and 62% , respectively, as of December 30, 2017 and December 31, 2016. |
2 | The split between the U.S. and non-U.S. in the fair value of plan assets was 49% and 51% , respectively, as of December 30, 2017 and 46% and 54% , respectively, as of December 31, 2016. |
3 | Substantially all amounts recognized in the consolidated balance sheet are recorded in other long-term liabilities for all periods presented. |
4 | The split between U.S. and non-U.S. in the accumulated other comprehensive loss (income), before tax, was 38% and 62% , respectively, as of December 30, 2017 and 34% and 66% , respectively, as of December 31, 2016. Substantially all amounts recognized in accumulated other comprehensive loss (income) are attributable to net actuarial gain or loss. |
5 | All plans had accumulated benefit obligations and projected benefit obligations in excess of plan assets for all periods presented. |
We use the corridor approach to amortize actuarial gains and losses. Under this approach, net actuarial gains or losses in excess of 10% of the larger of the projected benefit obligation or the fair value of plan assets are amortized on a straight-line basis.
FINANCIAL STATEMENTS | Notes to Financial Statements | 100 |
Table of Contents
ASSUMPTIONS FOR PENSION BENEFIT PLANS
|
| Dec 30, |
| Dec 31, | ||
Weighted average actuarial assumptions used to determine benefit obligations |
|
|
|
| ||
Discount rate |
| 3.0 | % |
| 3.2 | % |
Rate of compensation increase |
| 3.3 | % |
| 3.6 | % |
|
| 2017 |
| 2016 |
| 2015 | |||
Weighted average actuarial assumptions used to determine costs |
|
|
|
|
|
| |||
Discount rate |
| 3.2 | % |
| 3.3 | % |
| 3.1 | % |
Expected long-term rate of return on plan assets |
| 4.6 | % |
| 5.5 | % |
| 5.9 | % |
Rate of compensation increase |
| 3.6 | % |
| 3.8 | % |
| 3.9 | % |
We establish the discount rate for each pension plan by analyzing current market long-term bond rates and matching the bond maturity with the average duration of the pension liabilities.
We establish the long-term expected rate of return by developing a forward-looking, long-term return assumption for each pension fund asset class, taking into account factors such as the expected real return for the specific asset class and inflation. A single, long-term rate of return is then calculated as the weighted average of the target asset allocation percentages and the long-term return assumption for each asset class.
FUNDING
Policy. Our practice is to fund the various pension plans in amounts sufficient to meet the minimum requirements of applicable local laws and regulations. Additional funding may be provided as deemed appropriate. Funding for the U.S. Postretirement Medical Benefits Plan is discretionary under applicable laws and regulations; additional funding may be provided as deemed appropriate.
Funding Status. On a worldwide basis, our pension and postretirement benefit plans were 65% funded as of December 30, 2017 . The U.S. Intel Minimum Pension Plan, which accounts for 33% of the worldwide pension and postretirement benefit obligations, was 77% funded. Funded status is not indicative of our ability to pay ongoing pension benefits or of our obligation to fund retirement trusts. Required pension funding for U.S. retirement plans is determined in accordance with the Employee Retirement Income Security Act (ERISA), which sets required minimum contributions. Cumulative company funding to the U.S. Intel Minimum Pension Plan currently exceeds the minimum ERISA funding requirements.
NET PERIODIC BENEFIT COST
The net periodic benefit cost for pension benefits and U.S. postretirement medical benefits was $243 million in 2017 , ( $415 million in 2016 and $250 million in 2015 ). The service cost component of the corresponding net periodic benefit cost was $ 104 million in 2017 ($ 156 million in 2016 and $ 176 million in 2015).
The increase in the net periodic pension benefit cost in 2016 compared to 2015 was primarily attributed to plan settlements and remeasurement in conjunction with our 2016 Restructuring Program. For more information on the 2016 Restructuring Program, see " Note 7: Restructuring and Other Charges ."
PENSION PLAN ASSETS
|
| December 30, 2017 |
| Dec 31, | ||||||||||||||||
|
| Fair Value Measured at Reporting Date Using |
|
|
|
| ||||||||||||||
(In Millions) |
| Level 1 |
| Level 2 |
| Level 3 |
| Total |
| Total | ||||||||||
Equity securities |
| $ | 451 | |
| $ | - | |
| $ | 22 | |
| $ | 473 | |
| $ | 328 | |
Fixed income |
| 45 | |
| 326 | |
| 94 | |
| 465 | |
| 304 | | |||||
Other investments |
| 19 | |
| - | |
| - | |
| 19 | |
| - | | |||||
Assets measured by fair value hierarchy |
| $ | 515 | |
| $ | 326 | |
| $ | 116 | |
| $ | 957 | |
| $ | 632 | |
Assets measured at net asset value |
|
|
|
|
|
|
| 1,208 | |
| 1,044 | | ||||||||
Cash and cash equivalents |
|
|
|
|
|
|
| 122 | |
| 20 | | ||||||||
Total pension plan assets at fair value |
|
|
|
|
|
|
| $ | 2,287 | |
| $ | 1,696 | | ||||||
FINANCIAL STATEMENTS | Notes to Financial Statements | 101 |
Table of Contents
U.S. Plan Assets
The investment strategy for U.S. Intel Minimum Pension Plan assets is to maximize risk-adjusted returns, taking into consideration the investment horizon and expected volatility to help ensure that sufficient assets are available to pay pension benefits as they come due. The allocation to each asset class will fluctuate with market conditions, such as volatility and liquidity concerns, and will typically be rebalanced when outside the target ranges, which were 45% fixed income, 30% hedge funds, and 25% equity investments in 2017 . For 2018 , the expected long-term rate of return for the U.S. Intel Minimum Pension Plan assets is 5.1% .
Substantially all of the fixed-income investments in the U.S. plan assets are asset-backed securities, corporate debt, and government debt. Government debt includes instruments such as non-U.S. government securities, U.S. agency securities, and U.S. treasury securities.
The assets measured at net asset value are invested in common collective trust funds, limited partnerships, and limited liability companies.
Non-U.S. Plan Assets
The investments of the non-U.S. plans are managed by insurance companies, pension funds, or third-party trustees, consistent with regulations or market practice of the country where the assets are invested. The investment manager makes investment decisions within the guidelines set by Intel or local regulations. Investments managed by qualified insurance companies or pension funds under standard contracts follow local regulations, and we are not actively involved in their investment strategies. For the assets that we have discretion to set investment guidelines, the assets are invested in developed country equity investments and fixed-income investments, either through index funds or direct investment. In general, the investment strategy is designed to accumulate a diversified portfolio among markets, asset classes, or individual securities to reduce market risk and to help ensure that the pension assets are available to pay benefits as they come due. The target allocation of the non-U.S. plan assets that we have control over is approximately 45% equity, 35% fixed-income, and 20% hedge fund investments. For 2018 , the average expected long-term rate of return for the non-U.S. plan assets is 4.2% .
Most of the equity investments in the non-U.S. plan assets are invested in a diversified mix of equities of developed countries, including the U.S., and emerging markets throughout the world.
We have control over the investment strategy related to the majority of the assets measured at net asset value, which are invested in hedge funds, bond index, and equity index funds.
ESTIMATED FUTURE BENEFIT PAYMENTS FOR PENSION BENEFIT PLANS
(In Millions) |
| 2018 |
| 2019 |
| 2020 |
| 2021 |
| 2022 |
| 2023-2027 | ||||||||||||
Pension benefits |
| $ | 125 | |
| $ | 117 | |
| $ | 115 | |
| $ | 121 | |
| $ | 124 | |
| $ | 673 | |
Note 19: Employee Equity Incentive Plans
Our equity incentive plans are broad-based, long-term programs intended to attract and retain talented employees and align stockholder and employee interests. Our plans include our 2006 Equity Incentive Plan (the 2006 Plan) and our 2006 Stock Purchase Plan.
In May 2017, our stockholders approved an extension of the expiration date of the 2006 Plan to June 2020 and authorized an additional 33 million shares for issuance under the plan. Under the 2006 Plan, 786 million shares of common stock have been authorized for issuance as equity awards to employees and non-employee directors through June 2020. As of December 30, 2017 , 215 million shares of common stock remained available for future grant s.
Under the 2006 Plan, we grant RSUs and previously granted stock options. We grant RSUs with a service condition, as well as RSUs with both a market condition and a service condition (market-based RSUs), which we call outperformance stock units (OSUs), and which are granted to a group of senior officers, employees, and non-employee directors. For OSUs granted in 2017 , the number of shares of our common stock to be received at vesting will range from 0% to 200% of the target grant amount, based on total stockholder return (TSR) of our common stock measured against the benchmark TSR of the S&P 500 IT Sector Index over a three -year period. TSR is a measure of stock price appreciation plus any dividends paid in this performance period. As of December 30, 2017 , 9.2 million OSUs were outstanding. These OSUs generally vest three years and one month from the grant date, and OSUs granted prior to 2017 accrue dividend equivalents. Other RSU awards and option awards generally vest over four years from the grant date. Stock options generally expire seven years from the date of grant.
FINANCIAL STATEMENTS | Notes to Financial Statements | 102 |
Table of Contents
SHARE-BASED COMPENSATION
Share-based compensation recognized in 2017 was $1.4 billion ( $1.4 billion in 2016 and $1.3 billion in 2015), which includes $71 million of cash-settled awards in connection with the Mobileye acquisition.
The total share-based compensation cost capitalized as part of inventory as of December 30, 2017 was $49 million ( $44 million as of December 31, 2016 and $49 million as of December 26, 2015 ). During 2017 , the tax benefit that we realized for the tax deduction from share-based awards totaled $520 million ( $616 million in 2016 and $533 million in 2015 ).
We estimate the fair value of RSUs with a service condition using the value of our common stock on the date of grant, reduced by the present value of dividends expected to be paid on our shares of common stock prior to vesting. We estimate the fair value of OSUs using a Monte Carlo simulation model on the date of grant.
|
| RSUs and OSUs |
| Stock Purchase Plan | ||||||||||||||||||||
|
| Dec 30, |
| Dec 31, |
| Dec 26, |
| Dec 30, |
| Dec 31, |
| Dec 26, | ||||||||||||
Estimated values |
| $ | 35.30 | |
| $ | 29.76 | |
| $ | 31.63 | |
| $ | 7.20 | |
| $ | 6.70 | |
| $ | 6.56 | |
Risk-free interest rate |
| 1.4 | % |
| 0.9 | % |
| 0.6 | % |
| 1.0 | % |
| 0.5 | % |
| 0.1 | % | ||||||
Dividend yield |
| 2.9 | % |
| 3.3 | % |
| 2.9 | % |
| 2.9 | % |
| 3.2 | % |
| 3.1 | % | ||||||
Volatility |
| 23 | % |
| 23 | % |
| 27 | % |
| 19 | % |
| 22 | % |
| 25 | % | ||||||
Expected life (in years) |
| n/a | |
| n/a | |
| n/a | |
| 0.5 | |
| 0.5 | |
| 0.5 | | ||||||
We base the expected volatility for rights granted under the 2006 Stock Purchase Plan on implied volatility. We base expected volatility for OSUs on historical volatility.
RESTRICTED STOCK UNIT AWARDS
|
| Number of RSUs (In Millions) |
| Weighted Average Grant-Date Fair Value | |||
December 31, 2016 |
| 106.8 | |
| $ | 28.99 | |
Granted |
| 45.2 | |
| $ | 35.30 | |
Assumed in acquisition |
| 1.1 | |
| $ | 34.90 | |
Vested |
| (40.5 | ) |
| $ | 27.52 | |
Forfeited |
| (12.2 | ) |
| $ | 30.08 | |
December 30, 2017 |
| 100.4 | |
| $ | 32.36 | |
Expected to vest as of December 30, 2017 | 96.5 | |
| $ | 32.36 | | |
The aggregate fair value of awards that vested in 2017 was $1.6 billion ( $1.6 billion in 2016 and $1.5 billion in 2015 ), which represents the market value of our common stock on the date that the RSUs vested. The grant-date fair value of awards that vested in 2017 was $1.1 billion ( $1.3 billion in 2016 and $1.1 billion in 2015 ). The number of RSUs vested includes shares of common stock that we withheld on behalf of employees to satisfy the minimum statutory tax withholding requirements. RSUs that are expected to vest are net of estimated future forfeitures.
As of December 30, 2017 , unrecognized compensation costs related to RSUs granted under our equity incentive plans were $2.0 billion . We expect to recognize those costs over a weighted average period of 1.3 years .
STOCK PURCHASE PLAN
The 2006 Stock Purchase Plan allows eligible employees to purchase shares of our common stock at 85% of the value of our common stock on specific dates. Under the 2006 Stock Purchase Plan, 373 million shares of common stock are authorized for issuance through August 2021. As of December 30, 2017 , 150 million shares of common stock remained available for issuance.
Employees purchased 14.5 million shares of common stock in 2017 for $432 million under the 2006 Stock Purchase Plan ( 16.5 million shares of common stock for $415 million in 2016 and 15.8 million shares of common stock for $421 million in 2015 ). As of December 30, 2017 , unrecognized share-based compensation costs related to rights to acquire shares of common stock under our 2006 Stock Purchase Plan totaled $13 million . We expect to recognize those costs over a period of approximately two months .
FINANCIAL STATEMENTS | Notes to Financial Statements | 103 |
Table of Contents
Note 20: Commitments and Contingencies
COMMITMENTS
Leases
Portions of our real property and equipment are under operating leases that expire at various dates through 2058 . Rental expense was $264 million in 2017 ( $282 million in 2016 and $253 million in 2015 ).
(In Millions) |
| 2018 |
| 2019 |
| 2020 |
| 2021 |
| 2022 |
| 2023 and thereafter |
| Total | ||||||||||||||
Minimum rental commitments under all non-cancelable leases 1 |
| $ | 215 | |
| $ | 186 | |
| $ | 162 | |
| $ | 136 | |
| $ | 105 | |
| $ | 441 | |
| $ | 1,245 | |
1 | Includes leases with initial term in excess of one year. |
Other Commitments
Commitments for construction or purchase of property, plant and equipment totaled $12.1 billion as of December 30, 2017 ( $7.5 billion as of December 31, 2016 ), a substantial majority of which will be due within the next 12 months. Other purchase obligations and commitments totaled approximately $2.7 billion as of December 30, 2017 (approximately $3.0 billion as of December 31, 2016 ). Other purchase obligations and commitments include payments due under various types of licenses and agreements to purchase goods or services, as well as payments due under non-contingent funding obligations. In addition, we have various contractual commitments with IMFT. For further information on these contractual commitments, see " Note 9: Investments ."
LEGAL PROCEEDINGS
We are a party to various legal proceedings, including those noted in this section. Although management at present believes that the ultimate outcome of these proceedings, individually and in the aggregate, will not materially harm our financial position, results of operations, cash flows, or overall trends, legal proceedings and related government investigations are subject to inherent uncertainties, and unfavorable rulings or other events could occur. Unfavorable resolutions could include substantial monetary damages. In addition, in matters for which injunctive relief or other conduct remedies are sought, unfavorable resolutions could include an injunction or other order prohibiting us from selling one or more products at all or in particular ways, precluding particular business practices, or requiring other remedies. An unfavorable outcome may result in a material adverse impact on our business, results of operations, financial position, and overall trends. We might also conclude that settling one or more such matters is in the best interests of our stockholders, employees, and customers, and any such settlement could include substantial payments. Except as specifically described below, we have not concluded that settlement of any of the legal proceedings noted in this section is appropriate at this time.
European Commission Competition Matter
In 2001, the European Commission (EC) commenced an investigation regarding claims by Advanced Micro Devices, Inc. (AMD) that we used unfair business practices to persuade customers to buy our microprocessors. We received numerous requests for information and documents from the EC and we responded to each of those requests. The EC issued a Statement of Objections in July 2007 and held a hearing on that Statement in March 2008. The EC issued a Supplemental Statement of Objections in July 2008. In May 2009, the EC issued a decision finding that we had violated Article 82 of the EC Treaty and Article 54 of the European Economic Area Agreement. In general, the EC found that we violated Article 82 (later renumbered as Article 102 by a new treaty) by offering alleged "conditional rebates and payments" that required our customers to purchase all or most of their x86 microprocessors from us. The EC also found that we violated Article 82 by making alleged "payments to prevent sales of specific rival products." The EC imposed a fine in the amount of €1.1 billion ( $1.4 billion as of May 2009), which we subsequently paid during the third quarter of 2009, and ordered us to "immediately bring to an end the infringement referred to in" the EC decision.
The EC decision contained no specific direction on whether or how we should modify our business practices. Instead, the decision stated that we should "cease and desist" from further conduct that, in the EC's opinion, would violate applicable law. We took steps, which are subject to the EC's ongoing review, to comply with that decision pending appeal. We had discussions with the EC to better understand the decision and to explain changes to our business practices.
FINANCIAL STATEMENTS | Notes to Financial Statements | 104 |
Table of Contents
We appealed the EC decision to the Court of First Instance (which has been renamed the General Court) in July 2009. The hearing of our appeal took place in July 2012. In June 2014, the General Court rejected our appeal in its entirety. In August 2014, we filed an appeal with the European Court of Justice. In November 2014, Intervener Association for Competitive Technologies filed comments in support of Intel's grounds of appeal. The EC and interveners filed briefs in November 2014, we filed a reply in February 2015, and the EC filed a rejoinder in April 2015. The Court of Justice held oral argument in June 2016. In October 2016, Advocate General Wahl, an advisor to the Court of Justice, issued a non-binding advisory opinion that favored Intel on a number of grounds. The Court of Justice issued its decision in September 2017, setting aside the judgment of the General Court and sending the case back to the General Court to examine whether the rebates at issue were capable of restricting competition. The General Court has appointed a panel of five judges to consider our appeal of the EC's 2009 decision in light of the Court of Justice's clarifications of the law. In November 2017, the parties filed initial "Observations" about the Court of Justice's decision and the appeal, and have been invited by the General Court to offer supplemental comments to each other's "Observations" by March 2018. Pending the final decision in this matter, the fine paid by Intel has been placed by the EC in commercial bank accounts where it accrues interest.
Shareholder Derivative Litigation regarding In re High Tech Employee Antitrust Litigation
In March 2014, the Police Retirement System of St. Louis (PRSSL) filed a shareholder derivative action in the Superior Court of California in Santa Clara County against Intel, certain current and former members of our Board of Directors, and former officers. The complaint alleges that the defendants breached their duties to the company by participating in, or allowing, purported antitrust violations that were alleged in a now-settled antitrust class action lawsuit captioned In re High Tech Employee Antitrust Litigation claiming that Intel, Adobe Systems Incorporated, Apple Inc., Google Inc., Intuit Inc., Lucasfilm Ltd., and Pixar conspired to suppress their employees' compensation. In March 2014, a second plaintiff, Barbara Templeton, filed a substantially similar derivative suit in the same court. In May 2014, a third shareholder, Robert Achermann, filed a substantially similar derivative action in the same court. The court consolidated the three actions into one, which is captioned In re Intel Corporation Shareholder Derivative Litigation . Plaintiffs filed a consolidated complaint in July 2014. In August 2015, the court granted our motion to dismiss the consolidated complaint. The plaintiffs thereafter filed a motion for reconsideration and a motion for new trial, both of which the court denied in October 2015. In November 2015, plaintiffs PRSSL and Templeton appealed the court's decision. The appeal is fully briefed, and we are waiting on a hearing date from the appellate court.
In June 2015, the International Brotherhood of Electrical Workers (IBEW) filed a shareholder derivative action in the Chancery Court in Delaware against Intel, certain current and former members of our Board of Directors, and former officers. The lawsuit makes allegations substantially similar to those in the California shareholder derivative litigation described above, but additionally alleges breach of the duty of disclosure with respect to In re High Tech Employee Antitrust Litigation and that Intel's 2013 and 2014 proxy statements misrepresented the effectiveness of the Board's oversight of compliance issues at Intel and the Board's compliance with Intel's Code of Conduct and Board of Director Guidelines on Significant Corporate Governance Issues. In October 2015, the court stayed the IBEW lawsuit for six months pending further developments in the California case. In March 2016, Intel and IBEW entered into a stipulated dismissal pursuant to which IBEW dismissed its complaint but may re-file upon the withdrawal or final resolution of the appeal in the PRSSL California shareholder derivative litigation.
In April 2016, John Esposito filed a shareholder derivative action in the Superior Court of California in Santa Clara County against Intel, current members of our Board of Directors, and certain former officers and employees. Esposito made a demand on our Board in 2013 to investigate whether our officers or directors should be sued for their participation in the events described in In re High Tech Employee Antitrust Litigation . In November 2015, our Board decided not to take further action on Esposito's demand based on the recommendation of the Audit Committee of the Board after its investigation of relevant facts and circumstances. Esposito seeks to set aside such decision, and alleges that the Board was not disinterested in making that decision and that the investigation was inadequate. In November 2016, the court granted Intel's motion to dismiss the case, without leave to amend. In March 2017, plaintiff filed a motion for fees. The court denied plaintiff's fee motion in May 2017, and entered final judgment in this matter in June 2017. In August 2017, Esposito appealed the final judgment.
McAfee, Inc. Shareholder Litigation
On August 19, 2010, we announced that we had agreed to acquire all of the common stock of McAfee, Inc. (McAfee) for $48.00 per share. Four McAfee shareholders filed putative class-action lawsuits in Santa Clara County, California Superior Court challenging the proposed transaction. The cases were ordered consolidated in September 2010. Plaintiffs filed an amended complaint that named former McAfee board members, McAfee, and Intel as defendants, and alleged that the McAfee board members breached their fiduciary duties and that McAfee and Intel aided and abetted those breaches of duty. The complaint requested rescission of the merger agreement, such other equitable relief as the court may deem proper, and an award of damages in an unspecified amount. In June 2012, the plaintiffs' damages expert asserted that the value of a McAfee share for the purposes of assessing damages should be $62.08 .
FINANCIAL STATEMENTS | Notes to Financial Statements | 105 |
Table of Contents
In January 2012, the court certified the action as a class action, appointed the Central Pension Laborers' Fund to act as the class representative, and scheduled trial to begin in January 2013. In March 2012, defendants filed a petition with the California Court of Appeal for a writ of mandate to reverse the class certification order; the petition was denied in June 2012. In March 2012, at defendants' request, the court held that plaintiffs were not entitled to a jury trial and ordered a bench trial. In April 2012, plaintiffs filed a petition with the California Court of Appeal for a writ of mandate to reverse that order, which the court of appeal denied in July 2012. In August 2012, defendants filed a motion for summary judgment. The trial court granted that motion in November 2012, and entered final judgment in the case in February 2013. In April 2013, plaintiffs appealed the final judgment. The California Court of Appeal heard oral argument in October 2017, and in November 2017, affirmed the judgment as to McAfee's nine outside directors, reversed the judgment as to former McAfee director and chief executive officer David DeWalt, Intel, and McAfee, and affirmed the trial court's ruling that the plaintiffs are not entitled to a jury trial. No bench trial date has been set. Because the resolution of pretrial motions may materially impact the scope and nature of the proceeding, and because of uncertainties regarding theories that may be asserted at trial following the appellate court's remand of only certain claims in the proceeding and the extent of Intel's responsibility, if any, with respect to such claims, we are unable to make a reasonable estimate of the potential loss or range of losses, if any, arising from this matter. We dispute the class-action claims and intend to continue to defend the lawsuit vigorously.
Litigation related to Security Vulnerabilities
In June 2017, a Google research team notified us and other companies that it had identified security vulnerabilities (now commonly referred to as "Spectre" and "Meltdown") that affect many types of microprocessors, including our products. As is standard when findings like these are presented, we worked together with other companies in the industry to verify the research and develop and validate software and firmware updates for impacted technologies. On January 3, 2018, information on the security vulnerabilities was publicly reported, before software and firmware updates to address the vulnerabilities were made widely available. Numerous lawsuits have been filed against Intel and, in certain cases, our executives and directors, in U.S. federal and state courts and in certain courts in other countries relating to the Spectre and Meltdown security vulnerabilities.
As of February 15, 2018, 30 customer class action lawsuits and two securities class action lawsuits have been filed. The customer class action plaintiffs, who purport to represent various classes of end users of our products, generally claim to have been harmed by Intel's actions and/or omissions in connection with the security vulnerabilities and assert a variety of common law and statutory claims seeking monetary damages and equitable relief. The securities class action plaintiffs, who purport to represent classes of acquirers of Intel stock between July 27, 2017 and January 4, 2018, generally allege that Intel and certain officers violated securities laws by making statements about Intel's products and internal controls that were revealed to be false or misleading by the disclosure of the security vulnerabilities. Additional lawsuits and claims may be asserted on behalf of customers and shareholders seeking monetary damages or other related relief. We dispute the claims described above and intend to defend the lawsuits vigorously. Given the procedural posture and the nature of these cases, including that the proceedings are in the early stages, that alleged damages have not been specified, that uncertainty exists as to the likelihood of a class or classes being certified or the ultimate size of any class or classes if certified, and that there are significant factual and legal issues to be resolved, we are unable to make a reasonable estimate of the potential loss or range of losses, if any, that might arise from these matters.
In addition to these lawsuits, in January 2018, Joseph Tola, Joanne Bicknese, and Michael Kellogg each filed a shareholder derivative action in the Superior Court of the State of California in San Mateo County against certain members of our Board of Directors and certain officers. The complaints allege that the defendants breached their duties to Intel in connection with the disclosure of the security vulnerabilities and the failure to take action in relation to alleged insider trading. The complaints seek to recover damages from the defendants on behalf of Intel.
FINANCIAL STATEMENTS | Notes to Financial Statements | 106 |
Table of Contents
Intel CorporationFinancial Information by Quarter (unaudited) |
2017 for Quarter Ended |
| December 30 |
| September 30 |
| July 1 |
| April 1 | ||||||||
Net revenue |
| $ | 17,053 | |
| $ | 16,149 | |
| $ | 14,763 | |
| $ | 14,796 | |
Gross margin |
| $ | 10,767 | |
| $ | 10,057 | |
| $ | 9,098 | |
| $ | 9,147 | |
Net income (loss) 1 |
| $ | (687 | ) |
| $ | 4,516 | |
| $ | 2,808 | |
| $ | 2,964 | |
Earnings per share - Basic |
| $ | (0.15 | ) |
| $ | 0.96 | |
| $ | 0.60 | |
| $ | 0.63 | |
Earnings per share - Diluted |
| $ | (0.15 | ) |
| $ | 0.94 | |
| $ | 0.58 | |
| $ | 0.61 | |
Dividends per share of common stock: |
|
|
|
|
|
|
|
| ||||||||
Declared |
| $ | - | |
| $ | 0.5450 | |
| $ | - | |
| $ | 0.5325 | |
Paid |
| $ | 0.2725 | |
| $ | 0.2725 | |
| $ | 0.2725 | |
| $ | 0.2600 | |
Market price range common stock 2 : |
|
|
|
|
|
|
|
| ||||||||
High |
| $ | 47.56 | |
| $ | 38.08 | |
| $ | 37.43 | |
| $ | 37.98 | |
Low |
| $ | 39.04 | |
| $ | 33.46 | |
| $ | 33.54 | |
| $ | 35.04 | |
2016 for Quarter Ended |
| December 31 |
| October 1 |
| July 2 |
| April 2 | ||||||||
Net revenue |
| $ | 16,374 | |
| $ | 15,778 | |
| $ | 13,533 | |
| $ | 13,702 | |
Gross margin |
| $ | 10,105 | |
| $ | 9,983 | |
| $ | 7,973 | |
| $ | 8,130 | |
Net income |
| $ | 3,562 | |
| $ | 3,378 | |
| $ | 1,330 | |
| $ | 2,046 | |
Basic earnings per share of common stock |
| $ | 0.75 | |
| $ | 0.71 | |
| $ | 0.28 | |
| $ | 0.43 | |
Diluted earnings per share of common stock |
| $ | 0.73 | |
| $ | 0.69 | |
| $ | 0.27 | |
| $ | 0.42 | |
Dividends per share of common stock: |
|
|
|
|
|
|
|
| ||||||||
Declared |
| $ | - | |
| $ | 0.52 | |
| $ | - | |
| $ | 0.52 | |
Paid |
| $ | 0.26 | |
| $ | 0.26 | |
| $ | 0.26 | |
| $ | 0.26 | |
Market price range common stock 1 : |
|
|
|
|
|
|
|
| ||||||||
High |
| $ | 38.10 | |
| $ | 37.75 | |
| $ | 32.99 | |
| $ | 35.44 | |
Low |
| $ | 33.61 | |
| $ | 32.68 | |
| $ | 29.63 | |
| $ | 28.22 | |
1 | In Q4 2017, we recognized a $5.4 billion higher income tax expense as a result of one-time impacts from Tax Reform. |
2 | All stock prices are closing prices per the Nasdaq Global Select Market. |
SUPPLEMENTAL DETAILS |
| 107 |
Table of Contents
controls and procedures |
Evaluation of Disclosure Controls and Procedures
Based on management's evaluation (with the participation of our CEO and Chief Financial Officer (CFO)), as of the end of the period covered by this report, our CEO and CFO have concluded that our disclosure controls and procedures (as defined in Rules 13a-15(e) and 15d-15(e) under the Securities Exchange Act of 1934, as amended (the Exchange Act)), are effective to provide reasonable assurance that information required to be disclosed by us in reports that we file or submit under the Exchange Act is recorded, processed, summarized, and reported within the time periods specified in U.S. Securities and Exchange Commission (SEC) rules and forms, and is accumulated and communicated to management, including our principal executive officer and principal financial officer, as appropriate, to allow timely decisions regarding required disclosure.
Changes in Internal Control Over Financial Reporting
There were no changes to our internal control over financial reporting (as defined in Rules 13a-15(f) and 15d-15(f) under the Exchange Act) that occurred during the quarter ended December 30, 2017 that have materially affected, or are reasonably likely to materially affect, our internal control over financial reporting.
Management Report on Internal Control Over Financial Reporting
Our management is responsible for establishing and maintaining adequate internal control over financial reporting (as defined in Rules 13a-15(f) and 15d-15(f) under the Exchange Act) to provide reasonable assurance regarding the reliability of our financial reporting and the preparation of consolidated financial statements for external purposes in accordance with U.S. GAAP.
Management assessed our internal control over financial reporting as of December 30, 2017 . Management based its assessment on criteria established in Internal Control-Integrated Framework issued by the Committee of Sponsoring Organizations of the Treadway Commission ( 2013 framework ). Management's assessment included evaluation of elements such as the design and operating effectiveness of key financial reporting controls, process documentation, accounting policies, and our overall control environment.
Based on this assessment, management has concluded that our internal control over financial reporting was effective as of the end of the fiscal year to provide reasonable assurance regarding the reliability of financial reporting and the preparation of consolidated financial statements for external reporting purposes in accordance with U.S. GAAP. We reviewed the results of management's assessment with the Audit Committee of our Board of Directors.
Our independent registered public accounting firm, Ernst & Young LLP, independently assessed the effectiveness of the company's internal control over financial reporting, as stated in the firm's attestation report, which is included within the Consolidated Financial Statements.
Inherent Limitations on Effectiveness of Controls
Our management, including the CEO and CFO, does not expect that our disclosure controls and procedures or our internal control over financial reporting will prevent or detect all errors and all fraud. A control system, no matter how well-designed and operated, can provide only reasonable, not absolute, assurance that the control system's objectives will be met. The design of a control system must reflect the fact that there are resource constraints, and the benefits of controls must be considered relative to their costs. Further, because of the inherent limitations in all control systems, no evaluation of controls can provide absolute assurance that misstatements due to error or fraud will not occur or that all control issues and instances of fraud, if any, have been detected. The design of any system of controls is based in part on certain assumptions about the likelihood of future events, and there can be no assurance that any design will succeed in achieving its stated goals under all potential future conditions. Projections of any evaluation of the effectiveness of controls to future periods are subject to risks. Over time, controls may become inadequate because of changes in conditions or deterioration in the degree of compliance with policies or procedures.
SUPPLEMENTAL DETAILS |
| 108 |
Table of Contents
exhibits and financial statement schedules |
1. | Financial Statements: See "Index to Consolidated Financial Statements" within the Consolidated Financial Statements. |
2. | Financial Statement Schedule: See "Schedule II-Valuation and Qualifying Accounts" in this section of this Form 10-K. |
3. | Exhibits: The exhibits listed in the accompanying index to exhibits are filed, furnished, or incorporated by reference as part of this Form 10-K. |
Certain of the agreements filed as exhibits to this Form 10-K contain representations and warranties by the parties to the agreements that have been made solely for the benefit of the parties to the agreement. These representations and warranties:
• | may have been qualified by disclosures that were made to the other parties in connection with the negotiation of the agreements, which disclosures are not necessarily reflected in the agreements; |
• | may apply standards of materiality that differ from those of a reasonable investor; and |
• | were made only as of specified dates contained in the agreements and are subject to subsequent developments and changed circumstances. |
Accordingly, these representations and warranties may not describe the actual state of affairs as of the date that these representations and warranties were made or at any other time. Investors should not rely on them as statements of fact.
SUPPLEMENTAL DETAILS |
| 109 |
Table of Contents
SCHEDULE II-VALUATION AND QUALIFYING ACCOUNTS
Years Ended |
| Balance at Beginning of Year |
| Additions Charged to Expenses/ Other Accounts |
| Net (Deductions) Recoveries |
| Balance at End of Year | ||||||||
Valuation allowance for deferred tax assets |
|
|
|
|
|
|
|
| ||||||||
December 30, 2017 |
| $ | 953 | |
| $ | 237 | |
| $ | (19 | ) |
| $ | 1,171 | |
December 31, 2016 |
| $ | 701 | |
| $ | 261 | |
| $ | (9 | ) |
| $ | 953 | |
December 26, 2015 |
| $ | 595 | |
| $ | 190 | |
| $ | (84 | ) |
| $ | 701 | |
SUPPLEMENTAL DETAILS |
| 110 |
Table of Contents
Exhibit index
Exhibit Number |
|
|
| Incorporated by Reference |
| Filed or Furnished Herewith | |||||||
Exhibit Description |
| Form |
| File Number |
| Exhibit |
| Filing Date |
| ||||
2.1 † |
| Agreement and Plan of Merger among Intel Corporation, 615 Corporation and Altera Corporation, dated as of May 31, 2015 |
| 8-K |
| 000-06217 |
| 2.1 | |
| 6/1/2015 |
|
|
2.2 † |
| Purchase Agreement, dated as of March 12, 2017, by and among Intel Corporation, Cyclops Holdings, Inc. and Mobileye N.V. |
| 8-K |
| 000-06217 |
| 2.1 | |
| 3/13/2017 |
|
|
3.1 |
| Intel Corporation Third Restated Certificate of Incorporation of Intel Corporation dated May 17, 2006 |
| 8-K |
| 000-06217 |
| 3.1 | |
| 5/22/2006 |
|
|
3.2 |
| Intel Corporation Bylaws, as amended and restated on January 21, 2016 |
| 8-K |
| 000-06217 |
| 3.2 | |
| 1/26/2016 |
|
|
4.2.1 |
| Indenture dated as of March 29, 2006 between Intel Corporation and Wells Fargo Bank, National Association (as successor to Citibank N.A.) (the "Open-Ended Indenture") |
| S-3ASR |
| 333-132865 |
| 4.4 | |
| 3/30/2006 |
|
|
4.2.2 |
| First Supplemental Indenture to Open-Ended Indenture, dated as of December 3, 2007 |
| 10-K |
| 000-06217 |
| 4.2.4 | |
| 2/20/2008 |
|
|
4.2.3 |
| Indenture for the Registrant's 3.25% Junior Subordinated Convertible Debentures due 2039 between Intel Corporation and Wells Fargo Bank, National Association, dated as of July 27, 2009 |
| 10-Q |
| 000-06217 |
| 4.1 | |
| 11/2/2009 |
|
|
4.2.4 |
| Second Supplemental Indenture to Open-Ended Indenture for the Registrant's 1.95% Senior Notes due 2016, 3.30% Senior Notes due 2021, and 4.80% Senior Notes due 2041, dated as of September 19, 2011 |
| 8-K |
| 000-06217 |
| 4.01 | |
| 9/19/2011 |
|
|
4.2.5 |
| Third Supplemental Indenture to Open-Ended Indenture for the Registrant's 1.35% Senior Notes due 2017, 2.70% Senior Notes due 2022, 4.00% Senior Notes due 2032, and 4.25% Senior Notes due 2042, dated as of December 11, 2012 |
| 8-K |
| 000-06217 |
| 4.01 | |
| 12/11/2012 |
|
|
4.2.6 |
| Fourth Supplemental Indenture to Open-Ended Indenture for the Registrant's 4.25% Senior Notes due 2042, dated as of December 14, 2012 |
| 8-K |
| 000-06217 |
| 4.01 | |
| 12/14/2012 |
|
|
4.2.7 |
| Fifth Supplemental Indenture to Open-Ended Indenture, dated as of July 29, 2015, between Intel Corporation and Wells Fargo Bank, National Association, as successor trustee |
| 8-K |
| 000-06217 |
| 4.1 | |
| 7/29/2015 |
|
|
4.2.8 |
| Seventh Supplemental Indenture to Open-Ended Indenture, dated as of December 14, 2015, among Intel Corporation, Wells Fargo Bank, National Association, as successor trustee, and Elavon Financial Services Limited, UK Branch, as paying agent |
| 8-K |
| 000-06217 |
| 4.1 | |
| 12/14/2015 |
|
|
4.2.9 |
| Eighth Supplemental Indenture to Open-Ended Indenture, dated as of May 19, 2016, between Intel Corporation and Wells Fargo Bank, National Association, as successor trustee |
| 8-K |
| 000-06217 |
| 4.1 | |
| 5/19/2016 |
|
|
4.2.10 |
| Ninth Supplemental Indenture to Open-Ended Indenture, dated as of May 11, 2017, between Intel Corporation and Wells Fargo Bank, National Association, as successor trustee |
| 8-K |
| 000-06217 |
| 4.1 | |
| 5/11/2017 |
|
|
4.2.11 |
| Tenth Supplemental Indenture to Open-Ended Indenture, dated as of June 16, 2017, between Intel Corporation and Wells Fargo Bank, National Association, as successor trustee |
| 8-K |
| 000-06217 |
| 4.1 | |
| 6/16/2017 |
|
|
4.2.12 |
| Eleventh Supplemental Indenture to Open-Ended Indenture, dated as of August 14, 2017, among Intel Corporation, Wells Fargo Bank, National Association, as successor trustee, and Elavon Financial Services DAC, UK Branch, as paying agent |
| 8-K |
| 000-06217 |
| 4.1 | |
| 8/14/2017 |
|
|
SUPPLEMENTAL DETAILS |
| 111 |
Table of Contents
Exhibit Number |
|
|
| Incorporated by Reference |
| Filed or Furnished Herewith | |||||||
Exhibit Description |
| Form |
| File Number |
| Exhibit |
| Filing Date |
| ||||
4.2.13 |
| Twelfth Supplemental Indenture to Open-Ended Indenture, dated as of December 8, 2017, between Intel Corporation and Wells Fargo Bank, National Association, as successor trustee |
|
|
|
|
|
|
|
|
| X | |
4.2.14 |
| Guarantee dated December 28, 2015 by Intel Corporation in favor of U.S. Bank, National Association, as Trustee for the holders of Altera's 1.750% Senior Notes due 2017, 2.500% Senior Notes due 2018 and 4.100% Senior Notes due 2023 |
| 8-K |
| 000-06217 |
| 99.2 | |
| 12/28/2015 |
|
|
|
| Certain instruments defining the rights of holders of long-term debt of Intel Corporation are omitted pursuant to Item 601(b)(4)(iii) of Regulation S-K. Intel Corporation hereby agrees to furnish to the Securities and Exchange Commission, upon request, copies of such instruments. |
|
|
|
|
|
|
|
|
|
| |
10.1 †† |
| Intel Corporation 2006 Equity Incentive Plan, as amended and restated, effective May 18, 2017 |
| 10-Q |
| 000-06217 |
| 10.1 | |
| 7/27/2017 |
|
|
10.1.2 †† |
| Form of Notice of Grant - Restricted Stock Units |
| 10-Q |
| 000-06217 |
| 10.3 | |
| 8/3/2009 |
|
|
10.1.3 †† |
| Intel Corporation 2006 Equity Incentive Plan Standard Terms and Conditions Relating to Restricted Stock Units Granted on or after April 22, 2014 (under the Non-Management Committee Member Restricted Stock Unit Program) |
|
|
|
|
|
|
|
|
| X | |
10.1.4 †† |
| Intel Corporation Restricted Stock Unit Agreement under the 2006 Equity Incentive Plan (for RSUs granted on or after January 23, 2015 under the Executive RSU program) |
| 10-Q |
| 000-06217 |
| 10.3 | |
| 4/27/2015 |
|
|
10.1.5 †† |
| Intel Corporation Restricted Stock Unit Agreement under the 2006 Equity Incentive Plan (for RSUs granted to executives with annual vesting over 3 years) |
| 10-K |
| 000-06217 |
| 10.1.27 | |
| 2/17/2017 |
|
|
10.1.6 †† |
| Intel Corporation Restricted Stock Unit Agreement under the 2006 Equity Incentive Plan (for RSUs granted to executives with quarterly vesting over 2 years) |
|
|
|
|
|
|
|
|
| X | |
10.1.7 †† |
| Intel Corporation Restricted Stock Unit Agreement under the 2006 Equity Incentive Plan (for RSUs granted on or after January 23, 2015 under the Executive OSU program) |
| 10-Q |
| 000-06217 |
| 10.4 | |
| 4/27/2015 |
|
|
10.1.8 †† |
| Intel Corporation Restricted Stock Unit Agreement under the 2006 Equity Incentive Plan (for RSUs granted on or after February 1, 2017 under the Executive OSU program) |
| 10-Q |
| 000-06217 |
| 10.1 | |
| 4/27/2017 |
|
|
10.1.9 †† |
| Intel Corporation Non-Employee Director Restricted Stock Unit Agreement under the 2006 Equity Incentive Plan (for RSUs granted on or after January 23, 2015 under the Director RSU program) |
| 10-Q |
| 000-06217 |
| 10.1 | |
| 4/27/2015 |
|
|
10.1.10 †† |
| Intel Corporation Non-Employee Director Restricted Stock Unit Agreement under the 2006 Equity Incentive Plan (for RSUs granted on or after January 23, 2015 under the Director OSU program) |
| 10-Q |
| 000-06217 |
| 10.2 | |
| 4/27/2015 |
|
|
10.1.11 †† |
| Intel Corporation Non-Employee Director Restricted Stock Unit Agreement under the 2006 Equity Incentive Plan (for RSUs granted on or after February 1, 2017 under the Director OSU program) |
| 10-Q |
| 000-06217 |
| 10.2 | |
| 4/27/2017 |
|
|
10.2 †† |
| Intel Corporation 2006 Stock Purchase Plan, as amended and restated, effective January 1, 2017 |
| 10-K |
| 000-06217 |
| 10.7.5 | |
| 2/17/2017 |
|
|
10.3 †† |
| Intel Corporation 2014 Annual Performance Bonus Plan (amended and restated, effective January 1, 2014) |
| 10-K |
| 000-06217 |
| 10.9.2 | |
| 2/14/2014 |
|
|
10.4 †† |
| Form of Indemnification Agreement with Directors and Executive Officers |
| 10-K |
| 000-06217 |
| 10.15 | |
| 2/22/2005 |
|
|
SUPPLEMENTAL DETAILS |
| 112 |
Table of Contents
Exhibit Number |
|
|
| Incorporated by Reference |
| Filed or Furnished Herewith | |||||||
Exhibit Description |
| Form |
| File Number |
| Exhibit |
| Filing Date |
| ||||
10.5 †† |
| Form of Indemnification Agreement with Directors and Executive Officers (for Directors and Executive Officers who joined Intel after July 1, 2016) |
| 10-Q |
| 000-06217 |
| 10.2 | |
| 10/31/2016 |
|
|
10.6 †† |
| Intel Corporation Sheltered Employee Retirement Plan Plus, as amended and restated, effective January 1, 2009 |
| S-8 |
| 333-172024 |
| 99.1 | |
| 2/2/2011 |
|
|
10.7 †† |
| Intel Corporation 2006 Deferral Plan for Outside Directors, effective November 15, 2006 |
| 10-K |
| 000-06217 |
| 10.41 | |
| 2/26/2007 |
|
|
10.8 |
| Settlement Agreement Between Advanced Micro Devices, Inc. and Intel Corporation, dated November 11, 2009 |
| 8-K |
| 000-06217 |
| 10.1 | |
| 11/12/2009 |
|
|
10.9 ††† |
| Patent Cross License Agreement between NVIDIA Corporation and Intel Corporation, dated January 10, 2011 |
| 8-K |
| 000-06217 |
| 10.1 | |
| 1/10/2011 |
|
|
10.10 †† |
| Offer Letter by and between Intel Corporation and Dr. Venkata S.M. "Murthy" Renduchintala dated November 17, 2015 |
| 10-K |
| 000-06217 |
| 10.14 | |
| 2/12/2016 |
|
|
10.11 †† |
| Offer Letter by and between Intel Corporation and Robert H. Swan dated September 15, 2016 |
| 10-Q |
| 000-06217 |
| 10.1 | |
| 10/31/2016 |
|
|
10.12 †† |
| Confidential Retirement Agreement and General Release of Claims between Intel Corporation and Diane M. Bryant dated November 29, 2017 |
|
|
|
|
|
|
|
|
| X | |
10.13 †† |
| Retention Letter between Intel Corporation and Navin Shenoy dated December 12, 2017 |
|
|
|
|
|
|
|
|
| X | |
12.1 |
| Statement Setting Forth the Computation of Ratios of Earnings to Fixed Charges |
|
|
|
|
|
|
|
|
| X | |
21.1 |
| Intel Corporation Subsidiaries |
|
|
|
|
|
|
|
|
| X | |
23.1 |
| Consent of Ernst & Young LLP, Independent Registered Public Accounting Firm |
|
|
|
|
|
|
|
|
| X | |
31.1 |
| Certification of Chief Executive Officer pursuant to Rule 13a-14(a) of the Securities Exchange Act of 1934, as amended (the Exchange Act) |
|
|
|
|
|
|
|
|
| X | |
31.2 |
| Certification of Chief Financial Officer pursuant to Rule 13a-14(a) of the Exchange Act |
|
|
|
|
|
|
|
|
| X | |
32.1 |
| Certification of the Chief Executive Officer and the Chief Financial Officer pursuant to Rule 13a-14(b) of the Exchange Act and 18 U.S.C. Section 1350, as adopted pursuant to Section 906 of the Sarbanes-Oxley Act of 2002 |
|
|
|
|
|
|
|
|
| X | |
99.1 |
| Supplement to Present Required Information in Searchable Format |
|
|
|
|
|
|
|
|
| X | |
101.INS |
| XBRL Instance Document |
|
|
|
|
|
|
|
|
| X | |
101.SCH |
| XBRL Taxonomy Extension Schema Document |
|
|
|
|
|
|
|
|
| X | |
101.CAL |
| XBRL Taxonomy Extension Calculation Linkbase Document |
|
|
|
|
|
|
|
|
| X | |
101.DEF |
| XBRL Taxonomy Extension Definition Linkbase Document |
|
|
|
|
|
|
|
|
| X | |
101.LAB |
| XBRL Taxonomy Extension Label Linkbase Document |
|
|
|
|
|
|
|
|
| X | |
101.PRE |
| XBRL Taxonomy Extension Presentation Linkbase Document |
|
|
|
|
|
|
|
|
| X | |
† | Schedules and exhibits have been omitted pursuant to Item 601(b)(2) of Regulation S-K. Intel agrees to furnish supplementally a copy of any such schedule or exhibit to the SEC upon request. |
†† | Management contracts or compensation plans or arrangements in which directors or executive officers are eligible to participate. |
††† Portions of this exhibit have been omitted pursuant to an order granting confidential treatment.
SUPPLEMENTAL DETAILS |
| 113 |
Table of Contents
FORM 10-k cross-reference index |
Item Number | Item |
|
Part I |
|
|
Item 1. | Business: |
|
| General development of business | Pages 3-6 |
| Financial information about segments | Pages 19-33, 75 |
| Narrative description of business | Pages 3-15, 19-33, 43-45, 74-76 |
| Financial information about geographic areas | Pages 11, 47-48, 76, 77 |
| Available information | Page 56 |
Item 1A. | Risk Factors | Pages 46-53 |
Item 1B. | Unresolved Staff Comments | Not applicable |
Item 2. | Properties | Pages 11, 55 |
Item 3. | Legal Proceedings | Pages 104-106 |
Item 4. | Mine Safety Disclosures | Not applicable |
|
|
|
Part II |
|
|
Item 5. | Market for Registrant's Common Equity, Related Stockholder Matters and Issuer Purchases of Equity Securities | Pages 7, 41, 55-56 |
Item 6. | Selected Financial Data | Page 42 |
Item 7. | Management's Discussion and Analysis of Financial Condition and Results of Operations: |
|
| Results of operations | Pages 15-35 |
| Liquidity | Pages 35-37 |
| Capital resources | Pages 35-37 |
| Off balance sheet arrangements | (a) |
| Contractual obligations | Pages 38-39 |
Item 7A. | Quantitative and Qualitative Disclosures About Market Risk | Pages 39-40 |
Item 8. | Financial Statements and Supplementary Data | Pages 57-107 |
Item 9. | Changes in and Disagreements with Accountants on Accounting and Financial Disclosure | Not applicable |
Item 9A. | Controls and Procedures | Page 108 |
Item 9B. | Other Information | Not applicable |
|
|
|
Part III |
|
|
Item 10. | Directors, Executive Officers and Corporate Governance | Page 12, (b) |
Item 11. | Executive Compensation | (c) |
Item 12. | Security Ownership of Certain Beneficial Owners and Management and Related Stockholder Matters | (d) |
Item 13. | Certain Relationships and Related Transactions, and Director Independence | (e) |
Item 14. | Principal Accounting Fees and Services | (f) |
|
|
|
Part IV |
|
|
Item 15. | Exhibits and Financial Statement Schedules | Pages 109-113 |
Item 16. | Form 10-K Summary | Not applicable |
|
|
|
Signatures |
| Page 115 |
(a) | As of December 30, 2017, we did not have any significant off-balance-sheet arrangements, as defined in Item 303(a)(4)(ii) of SEC Regulation S-K. |
(b) | Incorporated by reference to "Proposal 1: Election of Directors," "Corporate Governance," "Code of Conduct," and "Other Matters-Section 16(a) Beneficial Ownership Reporting Compliance" in the 2018 Proxy Statement. The information under the heading "Executive Officers of the Registrant" within Fundamentals of Our Business is also incorporated by reference in this section. |
(c) | Incorporated by reference to "Director Compensation," "Compensation Discussion and Analysis," "Report of the Compensation Committee," and "Executive Compensation" in the 2018 Proxy Statement. |
(d) | Incorporated by reference to "Security Ownership of Certain Beneficial Owners and Management" and "Equity Compensation Plan Information" in the 2018 Proxy Statement. |
(e) | Incorporated by reference to "Corporate Governance" and "Certain Relationships and Related Transactions" in the 2018 Proxy Statement. |
(f) | Incorporated by reference to "Report of the Audit Committee" and "Proposal 2: Ratification of Selection of Independent Registered Public Accounting Firm" in the 2018 Proxy Statement. |
SUPPLEMENTAL DETAILS |
| 114 |
Table of Contents
signatures |
| INTEL CORPORATION Registrant | ||
|
|
|
|
| By: |
| /s/ R OBERT H . S WAN |
|
|
| Robert H. Swan |
|
|
| Executive Vice President, Chief Financial Officer and Principal Financial Officer |
|
|
| February 16, 2018 |
| / s / B RIAN M . K RZANICH |
|
| /s/ R OBERT H. S WAN |
| Brian M. Krzanich |
|
| Robert H. Swan |
| Chief Executive Officer, Director and Principal Executive Officer |
|
| Executive Vice President, Chief Financial Officer and Principal Financial Officer |
|
|
| ||
| February 16, 2018 |
|
| February 16, 2018 |
|
|
|
|
|
| /s/ K EVIN T. M C B RIDE |
|
|
|
| Kevin T. McBride |
|
|
|
| Vice President of Finance, Corporate Controller and Principal Accounting Officer |
|
|
|
|
|
|
| |
| February 16, 2018 |
|
|
|
| / s / C HARLENE B ARSHEFSKY |
|
| / s / D AVID S . P OTTRUCK |
| Charlene Barshefsky |
|
| David S. Pottruck |
| Director |
|
| Director |
| February 16, 2018 |
|
| February 16, 2018 |
|
|
|
|
|
| / s / A NEEL B HUSRI |
|
| / s / G REGORY D . S MITH |
| Aneel Bhusri |
|
| Gregory D. Smith |
| Director |
|
| Director |
| February 16, 2018 |
|
| February 16, 2018 |
|
|
|
|
|
| /s/ A NDY D . B RYANT |
|
| / s / A NDREW W ILSON |
| Andy D. Bryant |
|
| Andrew Wilson |
| Chairman of the Board and Director |
|
| Director |
| February 16, 2018 |
|
| February 16, 2018 |
|
|
|
|
|
| / s / R EED E . H UNDT |
|
| / s / F RANK D . Y EARY |
| Reed E. Hundt |
|
| Frank D. Yeary |
| Director |
|
| Director |
| February 16, 2018 |
|
| February 16, 2018 |
|
|
|
|
|
| / s / O MAR I SHRAK |
|
| / s / D AVID B . Y OFFIE |
| Omar Ishrak |
|
| David B. Yoffie |
| Director |
|
| Director |
| February 16, 2018 |
|
| February 16, 2018 |
|
|
|
|
|
| / s / D R. T SU- J AE K ING L IU |
|
|
|
| Dr. Tsu-Jae King Liu |
|
|
|
| Director |
|
|
|
| February 16, 2018 |
|
|
|
SUPPLEMENTAL DETAILS |
| 115 |