UNITED STATES SECURITIES AND
EXCHANGE COMMISSION
Washington, D.C. 20549
FORM 10-K
(Mark One)
| x | ANNUAL REPORT PURSUANT TO SECTION 13 OR 15(d) OF THE SECURITIES EXCHANGE ACT OF 1934 |
For the fiscal year ended December 26, 2009.
or
| o | TRANSITION REPORT PURSUANT TO SECTION 13 OR 15(d) OF THE SECURITIES EXCHANGE ACT OF 1934 |
For the transition period from to .
Commission File Number 000-06217

INTEL CORPORATION
(Exact name of registrant as specified in its charter)
| Delaware | 94-1672743 | |
| State or other jurisdiction of incorporation or organization | (I.R.S. Employer Identification No.) | |
| 2200 Mission College Boulevard, Santa Clara, California | 95054-1549 | |
(Address of principal executive offices) | (Zip Code) |
Registrant's telephone number, including area code (408) 765-8080
Securities registered pursuant to Section 12(b) of the Act:
Title of each class | Name of each exchange on which registered | |
Common stock, $0.001 par value | The NASDAQ Global Select Market* |
Securities registered pursuant to Section 12(g) of the Act:
None
Indicate by check mark if the registrant is a well-known seasoned issuer, as defined in Rule 405 of the Securities Act. Yes x No o
Indicate by check mark if the registrant is not required to file reports pursuant to Section 13 or Section 15(d) of the Act. Yes o No x
Indicate by check mark whether the registrant (1) has filed all reports required to be filed by Section 13 or 15(d) of the Securities Exchange Act of 1934 during the preceding 12 months (or for such shorter period that the registrant was required to file such reports), and (2) has been subject to such filing requirements for the past 90 days. Yes x No o
Indicate by check mark whether the registrant has submitted electronically and posted on its corporate Web site, if any, every Interactive Data File required to be submitted and posted pursuant to Rule 405 of Regulation S-T (§232.405 of this chapter) during the preceding 12 months (or for such shorter period that the registrant was required to submit and post such files). Yes x No o
Indicate by check mark if disclosure of delinquent filers pursuant to Item 405 of Regulation S-K (§229.405 of this chapter) is not contained herein, and will not be contained, to the best of registrant's knowledge, in definitive proxy or information statements incorporated by reference in Part III of this Form 10-K or any amendment to this Form 10-K. o
Indicate by check mark whether the registrant is a large accelerated filer, an accelerated filer, a non-accelerated filer, or a smaller reporting company. See the definitions of "large accelerated filer," "accelerated filer" and "smaller reporting company" in Rule 12b-2 of the Exchange Act.
Large accelerated filer x | Accelerated filer o | Non-accelerated
filer o (Do not check if a smaller reporting company) | Smaller reporting company o |
Indicate by check mark whether the registrant is a shell company (as defined in Rule 12b-2 of the Act). Yes o No x
Aggregate market value of voting and non-voting common equity held by non-affiliates of the registrant as of June 26, 2009, based upon the closing price of the common stock as reported by The NASDAQ Global Select Market* on such date, was
$91.1 billion
5,524 million shares of common stock outstanding as of February 5, 2010
DOCUMENTS INCORPORATED BY REFERENCE
Portions of the registrant's Proxy Statement related to its 2010 Annual Stockholders' Meeting to be filed subsequently-Part III of this Form 10-K.
INTEL
CORPORATION
FORM 10-K
FOR THE
FISCAL YEAR ENDED DECEMBER 26, 2009
INDEX
| Page | ||||
PART I | ||||
Item 1. | Business | 1 | ||
Item 1A. | Risk Factors | 15 | ||
Item 1B. | Unresolved Staff Comments | 21 | ||
Item 2. | Properties | 21 | ||
Item 3. | Legal Proceedings | 22 | ||
Item 4. | Submission of Matters to a Vote of Security Holders | 22 | ||
| PART II | ||||
Item 5. | Market for Registrant's Common Equity, Related Stockholder Matters and Issuer Purchases of Equity Securities | 22 | ||
Item 6. | Selected Financial Data | 24 | ||
Item 7. | Management's Discussion and Analysis of Financial Condition and Results of Operations | 25 | ||
Item 7A. | Quantitative and Qualitative Disclosures About Market Risk | 47 | ||
Item 8. | Financial Statements and Supplementary Data | 49 | ||
Item 9. | Changes in and Disagreements With Accountants on Accounting and Financial Disclosure | 114 | ||
Item 9A. | Controls and Procedures | 114 | ||
Item 9B. | Other Information | 115 | ||
| PART III | ||||
Item 10. | Directors, Executive Officers and Corporate Governance | 116 | ||
Item 11. | Executive Compensation | 116 | ||
Item 12. | Security Ownership of Certain Beneficial Owners and Management and Related Stockholder Matters | 116 | ||
Item 13. | Certain Relationships and Related Transactions, and Director Independence | 117 | ||
Item 14. | Principal Accounting Fees and Services | 117 | ||
| PART IV | ||||
Item 15. | Exhibits, Financial Statement Schedules | 118 | ||
PART I
| ITEM 1. | BUSINESS |
Industry
We are the world's largest semiconductor chip maker, based on revenue. We develop advanced integrated digital technology products, primarily integrated circuits, for industries such as computing and communications. Integrated circuits are semiconductor chips etched with interconnected electronic switches. We also develop platforms, which we define as integrated suites of digital computing technologies that are designed and configured to work together to provide an optimized user computing solution compared to components that are used separately. Our goal is to be the preeminent provider of semiconductor chips and platforms for the worldwide digital economy.
We were incorporated in California in 1968 and reincorporated in Delaware in 1989. Our Internet address is www.intel.com . On this web site, we publish voluntary reports, which we update annually, outlining our performance with respect to corporate responsibility, including environmental, health, and safety (EHS) compliance.
We use our Investor Relations web site, www.intc.com , as a routine channel for distribution of important information, including news releases, analyst presentations, and financial information. We post filings as soon as reasonably practicable after they are electronically filed with, or furnished to, the U.S. Securities and Exchange Commission (SEC), including our annual and quarterly reports on Forms 10-K and 10-Q (including related filings in XBRL format) and current reports on Form 8-K; our proxy statements; and any amendments to those reports or statements. All such postings and filings are available on our Investor Relations web site free of charge. In addition, our web site allows investors and other interested persons to sign up to automatically receive e-mail alerts when we post news releases and financial information. The SEC also maintains a web site, www.sec.gov , that contains reports, proxy and information statements, and other information regarding issuers that file electronically with the SEC. The content on any web site referred to in this Form 10-K is not incorporated by reference into this Form 10-K unless expressly noted.
Company Organization
At the end of 2009, we reorganized our business to better align our major product groups around the core competencies of Intel ® architecture and our manufacturing operations. After the reorganization, we have nine operating segments:
| • | PC Client Group. Delivering a high-quality computing and Internet experience through Intel architecture-based products and platforms, primarily for notebooks, netbooks, and desktops. | |
| • | Data Center Group. Delivering server, storage, and workstation platforms for small, medium, and large enterprises. | |
| • | Embedded and Communications Group. Delivering Intel architecture-based products as solutions for embedded applications through long life-cycle support, software and architectural scalability, and platform integration. | |
| • | Digital Home Group. Delivering Intel architecture-based products for next-generation consumer electronics devices with interactive Internet content and traditional broadcast programming. | |
| • | Ultra-Mobility Group. Building a business in the next-generation handheld market segment with low-power Intel architecture-based products. | |
| • | NAND Solutions Group. Delivering advanced NAND flash memory products for use in a variety of devices. | |
| • | Wind River Software Group. A wholly owned subsidiary delivering device software optimization products to the embedded and handheld market segments, serving a variety of hardware architectures. | |
| • | Software and Services Group. Delivering software products and services, in addition to promoting Intel architecture as the platform of choice for software development. | |
| • | Digital Health Group. Delivering technology-enabled products that are designed to reduce healthcare costs and connect people and information to improve patient care and safety. |
1
Products
We design and manufacture computing and communications components, such as microprocessors, chipsets, motherboards, and wireless and wired connectivity products, as well as platforms that incorporate these components. We strive to optimize the overall performance improvements of our products by balancing increased performance capabilities with improved energy efficiency. Increased performance can include faster processing performance and other improved capabilities, such as multithreading and multitasking. Performance can also be improved through enhanced connectivity, storage, security, manageability, utilization, reliability, ease of use, and interoperability among devices. Improved energy efficiency is achieved by lowering power consumption in relation to performance capabilities, which may extend utilization time for battery-powered form factors and reduce system heat output, thereby providing power savings and reducing the total cost of ownership.
We offer products at various levels of integration, to allow our customers flexibility in creating computing and communications systems. The substantial majority of our revenue is from the sale of microprocessors and chipsets.
Components
Microprocessors
A microprocessor-the central processing unit (CPU) of a computer system-processes system data and controls other devices in the system, acting as the "brains" of the computer. We offer microprocessors with one or multiple processor cores designed for notebooks, netbooks, desktops, servers, workstations, storage products, embedded applications, communications products, consumer electronics devices, and handhelds. The following are characteristics of our microprocessors:
| • | Multi-core microprocessors contain two or more processor cores, which can enable improved multitasking and energy-efficient performance by distributing computing tasks across multiple cores. | |
| • | Cache is memory that can be located directly on the microprocessor. Incorporating additional amounts and/or levels of cache can enable higher performance by permitting quicker access to frequently used data and instructions. | |
| • | Some of our microprocessors also include an integrated memory controller or an integrated memory controller and integrated graphics functionality. Both an integrated memory controller and integrated graphics functionality can increase the speed at which data is transferred between system components. |
Most of our microprocessors are based on the latest generation Intel ® Core tm microarchitecture and are manufactured using our 45-nanometer (nm) Hi-k metal gate silicon process technology (45nm process technology) or our 32nm second-generation Hi-k metal gate silicon process technology (32nm process technology). These technologies are the first to use Hi-k metal gate transistors, which increase performance while simultaneously reducing the leakage of currents. Microarchitecture refers to the layout, density, and logical design of a microprocessor. The latest generation Intel Core microarchitecture incorporates features designed to increase performance and energy efficiency, such as:
| • | Intel ® Turbo Boost Technology , which increases processor frequency when applications demand more performance; and | |
| • | Intel ® Hyper-Threading Technology , which allows each processor core to process two software tasks or threads simultaneously. |
We also offer, and are continuing to develop, System on Chip (SoC) products that integrate our core processing functionalities with other system components, such as graphics, audio, and video, onto a single chip to form a purpose-built solution. SoC products are designed to provide improved performance due to higher integration, lower power consumption, and smaller form factors.
Chipsets
The chipset operates as the "nervous system" in a PC or other computing device, sending data between the microprocessor and input, display, and storage devices, such as the keyboard, mouse, monitor, hard drive or solid-state drive, and CD, DVD, or Blu-ray* drive. We offer chipsets designed for notebooks, netbooks, desktops, servers, workstations, storage products, embedded applications, communications products, consumer electronics devices, and handhelds. Chipsets extend the audio, video, and other capabilities of many systems and perform essential logic functions, such as balancing the performance of the system and removing bottlenecks. Some chipsets may also include graphics functionality or graphics functionality and a memory controller, for use with our microprocessors that do not integrate those system components.
2
Motherboards
We offer motherboard products designed for our desktop, server, and workstation platforms. A motherboard is the principal board within a system, and typically contains the microprocessor, chipset, memory, and other components. The motherboard also has connectors for attaching devices to the bus, which is the subsystem that transfers data between various components of a computer.
Wireless and Wired Connectivity
We offer wireless and wired connectivity products, including network adapters and embedded wireless cards, based on industry-standard protocols used to translate and transmit data across networks. Wireless connectivity products based on WiFi technology allow users to wirelessly connect to high-speed local area networks, typically within a close range. We have also developed wireless connectivity products for both mobile and fixed networks based on WiMAX, a standards-based wireless technology providing high-speed broadband connectivity that can link users and networks up to several miles apart.
Platforms
A platform typically includes a microprocessor, chipset, and enabling software, and may include additional hardware, services, and support. In developing our platforms, we may include components made by other companies. Platforms based on our latest generation Intel Core microarchitecture using our 32nm process technology integrate a memory controller and graphics functionality into each microprocessor, and connect the microprocessor and other components with a high-speed interconnect. We refer to certain platform brands within our product offerings as processor technologies.
Microprocessor and Platform Technologies
We offer features to improve microprocessor and platform capabilities that can enhance system performance and user experience. For example, we offer technologies that can help information technology managers maintain, manage, and protect enabled systems that are plugged into a power source and connected to a network, even if a computer is turned off or has a failed hard drive or operating system. Additional features can enable virtualization, in which a single computer system can function as multiple virtual systems by running multiple operating systems and applications. Virtualization can consolidate workloads and provide increased security and management capabilities. To take advantage of these and other features that we offer, a computer system must have a microprocessor that supports a chipset and BIOS (basic input/output system) that use the technology, and software that is optimized for the technology. Performance will vary depending on the system hardware and software used.
Additional Product Offerings
NAND flash memory is a specialized type of memory component primarily used in portable memory storage devices, digital camera memory cards, solid-state drives, and other devices. NAND flash memory retains information even when the power is off, and provides faster access to data than traditional hard drives. Because flash memory does not have any moving parts, it tolerates bumps and shocks better than devices such as rapidly spinning disk drives.
Network processors are advanced, fully programmable processors used in networking equipment to rapidly manage and direct data moving across networks and the Internet.
Software products include operating systems, middleware, and tools used to develop, run, and manage a wide variety of enterprise, consumer, embedded, and handheld devices. In addition, we offer software development tools, designed to complement our latest hardware technologies, that help enable the creation of applications.
Healthcare products are technology-enabled devices for healthcare providers and personal healthcare that are designed to connect people and information to improve patient care and safety.
3
Revenue by Major Operating Segment
Net revenue for the PC Client Group (PCCG) operating segment, the Data Center Group (DCG) operating segment, and the other Intel architecture operating segments (Other IA) is presented as a percentage of our consolidated net revenue. Other IA includes the Embedded and Communications Group, the Digital Home Group, and the Ultra-Mobility Group operating segments.
Percentage
of Revenue
(Dollars
in Millions)
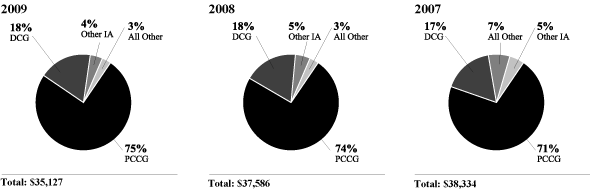
Revenue from sales of microprocessors within the PCCG operating segment represented 57% of our consolidated net revenue in 2009 (57% in 2008 and 55% in 2007), and revenue from sales of microprocessors within the DCG operating segment represented 15% of our consolidated net revenue in 2009 (14% in 2008 and 13% in 2007).
Below, we discuss the key products and processor technologies, including some key introductions, of our operating segments. For a discussion of our strategy, see "Strategy" in Part II, Item 7 of this Form 10-K.
PC Client Group
The PC Client Group (PCCG) offers microprocessors and related chipsets designed for the notebook, netbook, and desktop market segments. In addition, PCCG offers motherboards designed for the desktop market segment, and wireless connectivity products.
Notebooks and Netbooks
Our current notebook and netbook microprocessor offerings include the:
• Intel ® Core tm i7 processor Extreme Edition | • Intel ® Core tm 2 Duo mobile processor | |
• Intel ® Core tm i7 mobile processor | • Intel ® Core tm 2 Solo processor | |
• Intel ® Core tm i5 mobile processor | • Intel ® Celeron ® D processor | |
• Intel ® Core tm i3 mobile processor | • Intel ® Celeron ® M processor | |
• Intel ® Core tm 2 Extreme mobile processor | • Intel ® Celeron ® processor | |
• Intel ® Core tm 2 Quad mobile processor | • Intel ® Atom tm processor |
We offer microprocessors for notebooks at a variety of price and performance points, from the Intel Core i7 processor Extreme Edition-a quad-core processor based on our latest generation Intel Core microarchitecture designed for processor-intensive tasks in demanding multitasking environments-to the Intel Celeron processor, designed to provide value, quality, and reliability for basic computing needs. In addition, we offer the Intel Atom processor, designed for netbooks. We offer these processors in various packaging options, including ultra-low-voltage processors designed for ultra-thin laptop computers, giving our customers flexibility for a wide range of system designs for notebook PCs. The related chipsets for our notebook and netbook microprocessor offerings primarily include Mobile Intel ® 5 Series Express Chipsets, Mobile Intel ® 4 Series Express Chipsets, Mobile Intel ® 900 Series Express Chipsets, and the Intel ® NM10 Express Chipset. In addition, we offer wireless connectivity products based on WiFi and WiMAX technologies.
4
We also offer processor technologies designed to provide high performance with improved multitasking; and power-saving features to improve battery life, wireless network connectivity, and boot times, and to enable smaller form factors. The Intel ® Core tm i5 vPro tm processor and the Intel ® Core tm i7 vPro tm processor are designed to provide business notebook PCs with increased security, manageability, upgradeability, and energy-efficient performance.
Our new product offerings in 2009 and early 2010 include:
| • | Intel Core i7 mobile processors, Intel Core i5 mobile processors, and Intel Core i3 mobile processors, the latest of which are manufactured using our 32nm process technology and include integrated high-definition graphics functionality. These processors are supported by the new Mobile Intel 5 Series Express Chipset family. | |
| • | Intel ® Centrino ® Wireless adapters, designed to offer high-speed and reliable connectivity, and consistent coverage, while consuming minimal power. | |
| • | An Intel Atom processor with integrated graphics functionality designed to enable improved performance and smaller, more energy-efficient netbooks. This processor is supported by the new, low-power Intel NM10 Express Chipset. | |
| • | The Intel Core i7 processor Extreme Edition, based on our latest generation Intel Core microarchitecture, and designed for demanding applications such as high-performance gaming, high-definition content creation, and video encoding and editing. | |
| • | Ultra-low-voltage processors and a chipset designed for ultra-thin laptop computers. |
Desktops
Our current desktop microprocessor offerings include the:
• Intel ® Core tm i7 processor Extreme Edition | • Intel ® Core tm 2 Quad processor | |
• Intel ® Core tm i7 processor | • Intel ® Core tm 2 Duo processor | |
• Intel ® Core tm i5 processor | • Intel ® Pentium ® processor | |
• Intel ® Core tm i3 processor | • Intel ® Celeron ® processor | |
• Intel ® Core tm 2 Extreme processor | • Intel ® Atom tm processor |
We offer desktop microprocessors at a variety of price/performance points, from the high-end Intel Core i7 processor Extreme Edition-a quad-core processor based on our latest generation Intel Core microarchitecture, designed for processor-intensive tasks in demanding multitasking environments-to the Intel Celeron processor, designed to provide value, quality, and reliability for basic computing needs. In addition, we offer the Intel Atom processor, designed for low-power and affordable Internet-focused devices. The related chipsets for our desktop microprocessor offerings primarily include Intel ® 5 Series Express Chipsets, Intel ® 4 Series Express Chipsets, Intel ® 3 Series Express Chipsets, and the Intel ® NM10 Express Chipset.
We also offer processor technologies based on our microprocessors, chipsets, and motherboard products that are optimized for the desktop market segment. For business desktop PCs, we offer the Intel ® Core tm 2 Duo processor with vPro tm technology, the Intel ® Core tm 2 Quad processor with vPro tm technology, the Intel ® Core tm i5 vPro tm processor, and the Intel ® Core tm i7 vPro tm processor, which are designed to provide manageability, upgradeability, energy-efficient performance, increased security, and lower cost of ownership.
Our new product offerings in 2009 and early 2010 include:
| • | Intel Core i7 processors, Intel Core i5 processors, and Intel Core i3 processors, the latest of which are manufactured using our 32nm process technology and include integrated high-definition graphics functionality. These processors are supported by the new Intel 5 Series Express Chipset family. | |
| • | An Intel Atom processor with integrated graphics functionality designed to enable improved performance and smaller, more energy-efficient entry-level desktops. This processor is supported by the new, low-power Intel NM10 Express Chipset. |
Data Center Group
The Data Center Group (DCG) offers products that are incorporated into servers, storage, workstations, and other products that help make up the infrastructure for data center and cloud computing environments. DCG's products include microprocessors and related chipsets, and motherboards and wired connectivity devices.
5
Our current server, workstation, and storage microprocessor offerings include the Intel ® Xeon ® processor and the Intel ® Itanium ® processor. Our Intel Xeon processor family of products supports a range of entry-level to high-end technical and commercial computing applications such as Internet Protocol data centers. Compared to our Intel Xeon processor family, our Intel Itanium processor family generally supports an even higher level of reliability and computing performance for data processing, handling high transaction volumes, and other compute-intensive applications for enterprise-class servers, as well as supercomputing solutions. Servers, which usually have multiple microprocessors or cores working together, manage large amounts of data, direct data traffic, perform complex transactions, and control central functions in local and wide area networks and on the Internet. Workstations typically offer higher performance than standard desktop PCs and are used for applications such as engineering design, digital content creation, and high-performance computing. With the large growth in digital content, external storage systems, such as storage area network (SAN) and network-attached storage (NAS), require higher bandwidth and improved processing performance.
Our new product offerings in 2009 and early 2010 include:
| • | Quad-core Intel Itanium processors with enhanced scalability and reliability features, designed for mission-critical computing. | |
| • | Dual- and quad-core Intel Xeon processors based on our latest generation Intel Core microarchitecture, including multiple quad-core Intel Xeon processors designed for use in entry-level servers for small businesses and educational settings. | |
| • | Server motherboards that offer a higher degree of integrated components. |
Other Intel Architecture Operating Segments
Embedded and Communications Group
The Embedded and Communications Group (ECG) offers highly scalable microprocessors, including Intel Atom processors, and chipsets for a growing number of embedded applications across numerous market segments, including industrial, medical, and in-vehicle infotainment. In addition, ECG offers network processors.
Our new product offerings in 2009 and early 2010 include:
| • | Embedded Intel Core i7 processors, Intel Core i5 processors, and Intel Core i3 processors, all using our 32nm process technology and with integrated high-definition graphics functionality. These processors are supported by the new Mobile Intel 5 Series Express Chipset family. | |
| • | Low-power Intel Xeon processors based on our latest generation Intel Core microarchitecture, designed for use in thermally constrained environments common to communications infrastructure products such as wireline phones and fax machines. | |
| • | Intel Atom processors designed for in-vehicle infotainment systems, media phones, and other industrial applications. |
Ultra-Mobility Group
The Ultra-Mobility Group offers energy-efficient Intel Atom processors and related chipsets designed for mobile Internet devices (MIDs) within the handheld market segment.
Digital Home Group
The Digital Home Group offers products for use in consumer electronics devices designed to access and share Internet, broadcast, optical media (CD, DVD, or Blu-ray), and personal content through a variety of linked digital devices within the home. In addition, we offer components for consumer electronics devices such as digital TVs, high-definition media players, and set-top boxes, which receive, decode, and convert incoming data signals. In 2009, we introduced the Intel ® Atom tm processor CE4100, a SoC media processor designed to bring Internet content and services to digital televisions, DVD players, and advanced set-top boxes.
6
Other Operating Segments
NAND Solutions Group
The NAND Solutions Group offers NAND flash memory products primarily used in portable memory storage devices, digital camera memory cards, solid-state drives, and other devices. Our solid-state drives, available in densities ranging from 2 gigabytes (GB) to 160 GB, weigh less than standard hard disk drives and are designed to enable faster boot times, lower power consumption, increased reliability, and improved performance. Our NAND flash memory products are manufactured by IM Flash Technologies, LLC (IMFT). See "Note 11: Non-Marketable Equity Investments" in Part II, Item 8 of this Form 10-K. In 2009, we introduced 80-GB and 160-GB solid-state drives based on 34nm NAND flash technology, designed for laptop and desktop computers.
Wind River Software Group
The Wind River Software Group develops and licenses device software optimization products, including operating systems, for the needs of customers in the embedded and handheld market segments.
Manufacturing and Assembly and Test
As of December 26, 2009, 64% of our wafer fabrication, including microprocessors and chipsets, was conducted within the U.S. at our facilities in Arizona, Oregon, New Mexico, and Massachusetts. The remaining 36% of our wafer fabrication was conducted outside the U.S. at our facilities in Ireland and Israel.
As of December 26, 2009, we primarily manufactured our products in wafer fabrication facilities at the following locations:
| Products | Wafer Size | Process Technology | Locations | |||||
Microprocessors | 300mm | 32nm | Oregon | |||||
Microprocessors | 300mm | 45nm | Israel, New Mexico, Arizona | |||||
Chipsets and microprocessors | 300mm | 65nm | Arizona, Ireland | |||||
Chipsets and other products | 300mm | 90nm | Ireland | |||||
Chipsets and other products | 200mm | 130nm and above | Massachusetts, Oregon, Ireland | |||||
In addition to our current facilities, we are building a 300mm wafer fabrication facility in China that is expected to begin production on chipsets using our 65nm process technology in late 2010 or early 2011.
As of December 26, 2009, the substantial majority of our microprocessors were manufactured on 300mm wafers using our 45nm process technology. In the second half of 2009, we began manufacturing microprocessors using our 32nm process technology. As we move to each succeeding generation of manufacturing process technology, we incur significant start-up costs to prepare each factory for manufacturing. However, continuing to advance our process technology provides benefits that we believe justify these costs. The benefits of moving to each succeeding generation of manufacturing process technology can include using less space per transistor, reducing heat output from each transistor, and/or increasing the number of integrated features on each chip. These advancements can result in microprocessors that are higher performing, consume less power, and/or cost less to manufacture.
We use third-party manufacturing companies (foundries) to manufacture wafers for certain components, including networking and communications products. In addition, we primarily use subcontractors to manufacture board-level products and systems, and purchase certain communications networking products from external vendors in the Asia-Pacific region.
Our NAND flash memory products are manufactured by IMFT, a NAND flash memory manufacturing company that we formed with Micron Technology, Inc. Our NAND flash memory products are manufactured by IMFT using 34nm or 50nm process technology, and we expect to offer NAND flash memory products using 25nm process technology during the second quarter of 2010. We purchase 49% of the manufactured output of IMFT as of December 26, 2009. Assembly and test of NAND flash memory products is performed by Micron and other external subcontractors. See "Note 11: Non-Marketable Equity Investments" in Part II, Item 8 of this Form 10-K.
During 2008, we completed the divestiture of our NOR flash memory business in exchange for an ownership interest in Numonyx B.V. We are leasing a wafer fabrication facility located in Israel to Numonyx. That facility is not shown in our above listing of wafer fabrication facilities.
7
Following the manufacturing process, the majority of our components are subject to assembly and test. We perform our components assembly and test at facilities in Malaysia, China, and Costa Rica. We are building a new assembly and test facility in Vietnam that is expected to begin production in the second half of 2010. To augment capacity, we use subcontractors to perform assembly of certain products, primarily chipsets and networking and communications products.
Our employment practices are consistent with, and we expect our suppliers and subcontractors to abide by, local country law. In addition, we impose a minimum employee age requirement as well as progressive EHS requirements, regardless of local law.
We have thousands of suppliers, including subcontractors, providing our various materials and service needs. We set expectations for supplier performance and reinforce those expectations with periodic assessments. We communicate those expectations to our suppliers regularly and work with them to implement improvements when necessary. We seek, where possible, to have several sources of supply for all of these materials and resources, but we may rely on a single or limited number of suppliers, or upon suppliers in a single country. In those cases, we develop and implement plans and actions to reduce the exposure that would result from a disruption in supply. We have entered into long-term contracts with certain suppliers to ensure a portion of our silicon supply.
Our products are typically produced at multiple Intel facilities at various sites around the world, or by subcontractors who have multiple facilities. However, some products are produced in only one Intel or subcontractor facility, and we seek to implement actions and plans to reduce the exposure that would result from a disruption at any such facility. See "Risk Factors" in Part I, Item 1A of this Form 10-K.
Research and Development
We are committed to investing in world-class technology development, particularly in the design and manufacture of integrated circuits. Research and development (R&D) expenditures in 2009 were $5.7 billion ($5.7 billion in 2008 and $5.8 billion in 2007).
Our R&D activities are directed toward developing the technology innovations that we believe will deliver our next generation of products and platforms, which will in turn enable new form factors and new usage models for businesses and consumers. Our R&D activities range from designing and developing products, to developing and refining manufacturing processes, to researching future technologies and products.
We are focusing our R&D efforts on advanced computing technologies, developing new microarchitectures, advancing our silicon manufacturing process technology, delivering the next generation of microprocessors and chipsets, improving our platform initiatives, and developing software solutions and tools to support our technologies. Our R&D efforts enable new levels of performance and address areas such as energy efficiency, scalability for multi-core architectures, system manageability and security, and ease of use. We continue to make significant R&D investments in the development of SoCs to enable growth in areas such as handhelds (including MIDs and smartphones), embedded applications, and consumer electronics. In addition, we continue to make significant investments in graphics and wireless technologies.
As part of our R&D efforts, we plan to introduce a new microarchitecture for our notebook, desktop, and Intel Xeon processors approximately every two years and ramp the next generation of silicon process technology in the intervening years. We refer to this as our "tick-tock" technology development cadence. In 2009, we started manufacturing microprocessors using our new 32nm second-generation Hi-k metal gate silicon process technology, and we expect to introduce a new microarchitecture using our 32nm process technology in 2010. We are currently developing 22nm process technology, our next-generation process technology, and expect to begin manufacturing products using that technology in 2011. Our leadership in silicon technology has enabled us to make "Moore's Law" a reality. Moore's Law predicted that transistor density on integrated circuits would double about every two years. Our leadership in silicon technology has also helped expand on the advances anticipated by Moore's Law by bringing new capabilities into silicon and producing new products and platforms optimized for a wider variety of applications.
Our R&D model is based on a global organization that emphasizes a collaborative approach to identifying and developing new technologies, leading standards initiatives, and influencing regulatory policies to accelerate the adoption of new technologies. Our R&D initiatives are performed by various business groups within the company, and we centrally manage key cross-business group product initiatives to align and prioritize our R&D activities across these groups. In addition, we may augment our R&D initiatives by investing in companies or entering into agreements with companies that have similar R&D focus areas. For example, we have an agreement with Micron for joint development of NAND flash memory technologies.
8
Employees
As of December 26, 2009, we had 79,800 employees worldwide, with 55% of those employees located in the U.S.
Sales and Marketing
Customers
We sell our products primarily to original equipment manufacturers (OEMs) and original design manufacturers (ODMs). ODMs provide design and/or manufacturing services to branded and unbranded private-label resellers. In addition, we sell our products to other manufacturers, including makers of a wide range of industrial and communications equipment. Our customers also include PC and network communications products users who buy PC components and our other products through distributor, reseller, retail, and OEM channels throughout the world. In certain instances, we have entered into supply agreements to continue to manufacture and sell products of divested business lines to acquiring companies during certain transition periods.
Our worldwide reseller sales channel consists of thousands of indirect customers, systems builders that purchase Intel microprocessors and other products from our distributors. We have a boxed processor program that allows distributors to sell Intel microprocessors in small quantities to these systems-builder customers; boxed processors are also available in direct retail outlets.
In 2009, Hewlett-Packard Company accounted for 21% of our net revenue (20% in 2008 and 17% in 2007) and Dell Inc. accounted for 17% of our net revenue (18% in 2008 and 2007). No other customer accounted for more than 10% of our net revenue. For information about revenue and operating income by operating segment, and revenue from unaffiliated customers by geographic region/country, see "Results of Operations" in Part II, Item 7 and "Note 29: Operating Segment and Geographic Information" in Part II, Item 8 of this Form 10-K.
Sales Arrangements
Our products are sold or licensed through sales offices throughout the world. Sales of our products are typically made via purchase orders that contain standard terms and conditions covering matters such as pricing, payment terms, and warranties, as well as indemnities for issues specific to our products, such as patent and copyright indemnities. From time to time, we may enter into additional agreements with customers covering, for example, changes from our standard terms and conditions, new product development and marketing, private-label branding, and other matters. Most of our sales are made using electronic and web-based processes that allow the customer to review inventory availability and track the progress of specific goods ordered. Pricing on particular products may vary based on volumes ordered and other factors. We also offer discounts, rebates, and other incentives to customers to increase acceptance of our products and technology.
Our products are typically shipped under terms that transfer title to the customer, even in arrangements for which the recognition of revenue and related costs of sales is deferred. Our standard terms and conditions of sale typically provide that payment is due at a later date, generally 30 days after shipment or delivery. Our credit department sets accounts receivable and shipping limits for individual customers to control credit risk to Intel arising from outstanding account balances. We assess credit risk through quantitative and qualitative analysis, and from this analysis, we establish credit limits and determine whether we will seek to use one or more credit support devices, such as obtaining some form of third-party guaranty or standby letter of credit, or obtaining credit insurance for all or a portion of the account balance if necessary. Credit losses may still be incurred due to bankruptcy, fraud, or other failure of the customer to pay. For information about our allowance for doubtful receivables, see "Schedule II-Valuation and Qualifying Accounts" in Part IV of this Form 10-K.
Most of our sales to distributors are made under agreements allowing for price protection on unsold merchandise and a right of return on stipulated quantities of unsold merchandise. Under the price protection program, we give distributors credits for the difference between the original price paid and the current price that we offer. On most products, there is no contractual limit on the amount of price protection, nor is there a limit on the time horizon under which price protection is granted. The right of return granted generally consists of a stock rotation program in which distributors are able to exchange certain products based on the number of qualified purchases made by the distributor. Although we have the option to grant credit for, repair, or replace defective products, there is no contractual limit on the amount of credit granted to a distributor.
9
Distribution
Typically, distributors handle a wide variety of products, including those that compete with our products, and fill orders for many customers. We also utilize third-party sales representatives who generally do not offer directly competitive products but may carry complementary items manufactured by others. Sales representatives do not maintain a product inventory; instead, their customers place orders directly with us or through distributors. Several distribution warehouses are located in close proximity to key customers.
Backlog
We do not believe that backlog as of any particular date is meaningful, as our sales are made primarily pursuant to standard purchase orders for delivery of products. Only a small portion of our orders is non-cancelable, and the dollar amount associated with the non-cancelable portion is not significant.
Seasonal Trends
Our microprocessor sales generally have followed a seasonal trend. Historically, our sales have been higher in the second half of the year than in the first half of the year. Consumer purchases of PCs have historically been higher in the second half of the year, primarily due to back-to-school and holiday demand. In addition, purchases from businesses have also historically tended to be higher in the second half of the year.
Marketing
Our corporate marketing objectives are to build a strong Intel corporate brand that connects with consumers, and have a limited number of meaningful and valuable brands in our portfolio to aid businesses and consumers in making informed choices and to make technology purchase decisions easier for them. The Intel Core processor family and the Intel Atom, Intel Pentium, Intel Celeron, Intel Xeon, and Intel Itanium trademarks make up our processor brands.
We promote brand awareness and generate demand through our own direct marketing as well as co-marketing programs. Our direct marketing activities include television, print, and web-based advertising, as well as press relations, consumer and trade events, and industry and consumer communications. We market to consumer and business audiences, and focus on building awareness and generating demand for increased performance, power efficiency, and new capabilities.
Purchases by customers often allow them to participate in cooperative advertising and marketing programs such as the Intel Inside ® Program. This program broadens the reach of our brands beyond the scope of our own direct advertising. Through the Intel Inside Program, certain customers are licensed to place Intel logos on computers containing our microprocessors and processor technologies, and to use our brands in marketing activities. The program includes a market development component that accrues funds based on purchases and partially reimburses the OEMs for marketing activities for products featuring Intel brands, subject to the OEMs meeting defined criteria. These marketing activities primarily include television, print, and an increased focus on web-based marketing. We have also entered into joint marketing arrangements with certain customers.
Competition
The semiconductor industry is dynamic, characterized by rapid advances in technology and frequent product introductions. As unit volumes of a product grow, production experience is accumulated and costs typically decrease, further competition develops, and prices decline. The life cycle of our products is very short, sometimes less than a year. These short product life cycles and other factors lead to frequent negotiations with our OEM customers, which typically are large, sophisticated buyers who are also operating in very competitive environments. Our ability to compete depends on our ability to navigate this environment, by improving our products and processes faster than our competitors, anticipating changing customer requirements, developing and launching new products and platforms, pricing our products competitively, and reducing average unit costs. See "Risk Factors" in Part I, Item 1A of this Form 10-K.
Our products compete primarily based on performance, features, price, quality, reliability, brand recognition, and availability. We are focused on offering innovative products and worldwide support for our customers at competitive prices, including providing improved energy-efficient performance, enhanced security, manageability, and integrated solutions. We believe that our platform strategy provides us with a competitive advantage. We offer platforms that incorporate various components designed and configured to work together to provide an optimized user computing solution compared to components that are used separately.
10
We believe that our network of manufacturing facilities and assembly and test facilities gives us a competitive advantage. This network enables us to have more direct control over our processes, quality control, product cost, volume, timing of production, and other factors. These facilities require significant up-front capital spending and therefore make it difficult for us to reduce our costs in the short-term. Many of our competitors do not own such facilities because they may not be able to afford to do so or because their business models involve the use of third-party foundries and assembly and test subcontractors for manufacturing and assembly and test. The third-party foundries and subcontractors may also offer intellectual property, design services, and other goods and services to our competitors. These "fabless semiconductor companies" include Broadcom Corporation, NVIDIA Corporation, QUALCOMM Incorporated, and VIA Technologies, Inc. (VIA). Some of our competitors own portions of such facilities through investment or joint-venture arrangements with other companies.
We plan to continue to cultivate new businesses and work with the computing and communications industries through standards bodies, trade associations, OEMs, ODMs, and independent software and operating system vendors to help align the industry to offer products that take advantage of the latest market trends and usage models. We frequently participate in industry initiatives designed to discuss and agree upon technical specifications and other aspects of technologies that could be adopted as standards by standards-setting organizations. Our competitors may also participate in the same initiatives and specification development. Our participation does not ensure that any standards or specifications adopted by these organizations will be consistent with our product planning.
Microprocessors
We continue to be largely dependent on the success of our microprocessor business. Our ability to compete depends on our ability to deliver new microprocessor products with increased performance capabilities and improved energy-efficient performance at competitive prices. Some of our microprocessor competitors, such as Advanced Micro Devices, Inc. (AMD), market software-compatible products that compete with our processors. We also face competition from companies offering rival architecture designs, such as Cell Broadband Engine Architecture developed jointly by International Business Machines Corporation (IBM), Sony Corporation, and Toshiba Corporation; Power Architecture* offered by IBM; ARM* architecture developed by ARM Limited; and Scalable Processor Architecture (SPARC*) offered by Sun Microsystems, Inc. (a subsidiary of Oracle Corporation). In addition, NVIDIA is seeking to position its graphics processors to compete with microprocessors, by shifting some of a microprocessor's workload to its graphics processor.
While AMD has been our primary competitor in the market segments for microprocessors used in notebooks, desktops, and servers, QUALCOMM and other companies using ARM-based designs are our primary competitors in the growing market segment for microprocessors used in handhelds, including smartphones and MIDs. Our ability to compete with QUALCOMM and other competitors in this market segment depends on our ability to design and produce high-performance, energy-efficient microprocessors at competitive prices. It also requires us to develop a software ecosystem that appeals to end users and software developers. We have taken a number of steps to build this software ecosystem, including developing the Moblin tm -based operating system and subsequently combining it with Nokia Corporation's Maemo* software platform to create MeeGo*, a Linux-based software platform that will run on multiple hardware platforms; acquiring Wind River Systems, Inc.; and creating the Intel ® Atom tm Developer Program. In addition, in 2009 we entered into product development collaborations with LG Electronics, Inc. and Nokia.
The following is a list of our main microprocessor competitors by market segment:
| • | Notebook: AMD and VIA | |
| • | Netbook: AMD, NVIDIA, QUALCOMM, and VIA | |
| • | Desktop: AMD and VIA | |
| • | Server/Workstation: AMD, IBM, and Sun Microsystems | |
| • | Embedded: AMD, Freescale Semiconductor, Inc., and Texas Instruments Incorporated | |
| • | Handheld: QUALCOMM |
Chipsets
Our chipsets compete with chipsets produced by companies such as AMD (including chipsets marketed under the ATI Technologies, Inc. brand), Broadcom, NVIDIA, Silicon Integrated Systems Corporation, and VIA. We also compete with companies offering graphics components and other special-purpose products used in the notebook, netbook, desktop, and server market segments. One aspect of our business model is to incorporate improved performance and advanced properties into our microprocessors and chipsets, for which demand may increasingly be affected by competition from companies whose business models are based on dedicated chipsets and other components, such as graphics controllers.
11
Flash Memory
Our NAND flash memory products currently compete with NAND products primarily manufactured by Hynix Semiconductor Inc., Micron, Samsung Electronics Co., Ltd., SanDisk Corporation, and Toshiba.
Connectivity
We offer products designed for wireless and wired connectivity; the communications infrastructure, including network processors; and networked storage. Our WiFi and WiMAX products currently compete with products manufactured by Atheros Communications, Inc., Broadcom, QUALCOMM, and other smaller companies.
Competition Lawsuits and Government Matters
We are currently a party to a variety of lawsuits and government matters involving our competitive practices. See "Note 28: Contingencies" in Part II, Item 8 of this Form 10-K.
Acquisitions and Strategic Investments
During 2009, we completed the acquisition of Wind River Systems, Inc., a vendor of software for embedded devices. The objective of the acquisition of Wind River Systems was to enable the introduction of products for the embedded and handheld market segments, resulting in benefits for our existing operations. See "Note 15: Acquisitions" in Part II, Item 8 of this Form 10-K.
Intellectual Property and Licensing
Intellectual property rights that apply to our various products and services include patents, copyrights, trade secrets, trademarks, and maskwork rights. We maintain a program to protect our investment in technology by attempting to ensure respect for our intellectual property rights. The extent of the legal protection given to different types of intellectual property rights varies under different countries' legal systems. We intend to license our intellectual property rights where we can obtain adequate consideration. See "Competition" earlier in this section, "Risk Factors" in Part I, Item 1A, and "Note 28: Contingencies" in Part II, Item 8 of this Form 10-K.
We have filed and obtained a number of patents in the U.S. and other countries. While our patents are an important element of our success, our business as a whole is not significantly dependent on any one patent. We and other companies in the computing, telecommunications, and related high-technology fields typically apply for and receive, in the aggregate, tens of thousands of overlapping patents annually in the U.S. and other countries. We believe that the duration of the applicable patents that we are granted is adequate relative to the expected lives of our products. Because of the fast pace of innovation and product development, our products are often obsolete before the patents related to them expire, and sometimes are obsolete before the patents related to them are even granted. As we expand our product offerings into new industries, we also seek to extend our patent development efforts to patent such product offerings. Established competitors in existing and new industries, as well as companies that purchase and enforce patents and other intellectual property, may already have patents covering similar products. There is no assurance that we will be able to obtain patents covering our own products, or that we will be able to obtain licenses from such companies on favorable terms or at all.
The majority of the software that we distribute, including software embedded in our component- and system-level products, is entitled to copyright protection. To distinguish Intel products from our competitors' products, we have obtained certain trademarks and trade names for our products, and we maintain cooperative advertising programs with certain customers to promote our brands and to identify products containing genuine Intel components. We also protect certain details about our processes, products, and strategies as trade secrets, keeping confidential the information that we believe provides us with a competitive advantage. We have ongoing programs designed to maintain the confidentiality of such information.
Compliance with Environmental, Health, and Safety Regulations
Our compliance efforts focus on monitoring regulatory and resource trends and setting company-wide performance targets for key resources and emissions. These targets address several parameters, including product design; chemical, energy, and water use; climate change; waste recycling; and emissions.
12
Intel focuses on reducing natural resource use, the solid and chemical waste by-products of our manufacturing processes, and the environmental impact of our products. We currently use a variety of materials in our manufacturing process that have the potential to adversely impact the environment and are subject to a variety of EHS laws and regulations. For example, lead and halogenated materials (such as certain flame retardants and plastics) have been used by the electronics industry for decades. Finding suitable replacements has been a technical challenge for the industry, and we have worked for years with our suppliers and others in the industry to develop lead-free and halogen-free solutions.
We work with the U.S. Environmental Protection Agency (EPA), non-governmental organizations, OEMs, and retailers to help manage e-waste (which includes electronic products nearing the end of their useful lives) and promote recycling. The European Union (EU) requires producers of certain electrical and electronic equipment to develop programs that allow consumers to return products for recycling. Many states in the U.S. have similar e-waste take-back laws. The inconsistency of many e-waste take-back laws and the lack of local e-waste management options in many areas pose a challenge for our compliance efforts. To mitigate these problems, we communicate with our distributors to determine available options for complying with e-waste laws.
Intel seeks to reduce our global greenhouse gas emissions by investing in energy conservation projects in our factories and working with suppliers to improve energy efficiency. We take a holistic approach to power management, addressing the challenge at the silicon, package, circuit, micro/macro architecture, platform, and software levels. We recognize that climate change may cause general economic risk. For further information on the risks of climate change, see "Risk Factors" in Part I, Item 1A of this Form 10-K. We routinely monitor energy costs to understand the long-range impacts that rising costs may have on our business. We see the potential for higher energy costs driven by climate change regulations. This could include items applied to utilities that are passed along to customers, such as carbon taxes or costs associated with emission cap and trade programs or renewable portfolio standards. In particular, regulations associated with the Western Climate Initiative could have an impact on our company, because a number of our large manufacturing facilities are located in the western U.S. Proposed regulations by the EPA could impact our ability to obtain modifications in a timely manner for existing air permits at our manufacturing facilities in the U.S. Similarly, our operations in Ireland are already subject to the EU's mandatory cap and trade scheme for global-warming emissions. All of our sites also may be impacted by utility programs directed by legislation or regulatory or other pressures that are targeted to pass costs through to users.
We maintain business recovery plans that are intended to ensure our ability to recover from natural disasters or other events that can be disruptive to our business. Many of our operations are located in semi-arid regions, such as Israel and the southwestern U.S. Some climate change scenarios predict that such regions can become even more vulnerable to prolonged droughts. We have had an aggressive water conservation program in place for many years. We believe that our water conservation and recovery programs will help reduce our risk if water availability becomes more constrained in the future. We further maintain long-range plans to identify potential future water conservation actions that we can take.
We are committed to sustainability and take a leadership position in promoting voluntary environmental initiatives and working proactively with governments, environmental groups, and industry to promote global environmental sustainability. We believe that technology will be fundamental to finding solutions to the world's environmental challenges, and we are joining forces with industry, business, and governments to find and promote ways that technology can be used as a tool to combat climate change.
For several years, we have been evaluating "green" design standards and incorporating green building concepts and practices into the construction of our buildings. We are in the process of obtaining Leadership in Energy and Environmental Design (LEED) certification for an office building under construction in Israel and a newly constructed fabrication building in Arizona. We have been purchasing wind power and other forms of renewable energy at some of our major sites for several years. At the beginning of 2008, we announced plans to purchase renewable energy certificates under a multi-year contract. The purchase placed Intel at the top of the EPA's Green Power Partnership for 2008 and 2009. The purchase was intended to help stimulate the market for green power, leading to additional generating capacity and, ultimately, lower costs.
13
Executive Officers of the Registrant
The following sets forth certain information with regard to our executive officers as of February 22, 2010 (ages are as of December 26, 2009):
Robert J. Baker , age 54 | ||
• 2001 – present, | Senior VP, General Manager (GM), Technology and Manufacturing Group | |
• Joined Intel 1979 | ||
Andy D. Bryant , age 59 | ||
• 2009 – present, | Executive VP, Technology, Manufacturing, and Enterprise Services, Chief Administrative Officer | |
• 2007 – 2009, | Executive VP, Finance and Enterprise Services, Chief Administrative Officer | |
• 2001 – 2007, | Executive VP, Chief Financial and Enterprise Services Officer | |
• Member of Columbia Sportswear Company Board of Directors | ||
• Member of McKesson Corporation Board of Directors | ||
• Joined Intel 1981 | ||
William M. Holt , age 57 | ||
• 2006 – present, | Senior VP, GM, Technology and Manufacturing Group | |
• 2005 – 2006, | VP, Co-GM, Technology and Manufacturing Group | |
• 1999 – 2005, | VP, Director, Logic Technology Development | |
• Joined Intel 1974 | ||
Thomas M. Kilroy , age 52 | ||
• 2010 – present, | Senior VP, GM, Sales and Marketing Group | |
• 2009 – 2010, | VP, GM, Sales and Marketing Group | |
• 2005 – 2009, | VP, GM, Digital Enterprise Group | |
• 2003 – 2005, | VP, Sales and Marketing Group, Co-President of Intel Americas | |
• Joined Intel 1990 | ||
Sean M. Maloney , age 53 | ||
• 2009 – present, | Executive VP, GM, Intel Architecture Group | |
• 2008 – 2009, | Executive VP, Chief Sales and Marketing Officer | |
• 2006 – 2008, | Executive VP, GM, Sales and Marketing Group, Chief Sales and Marketing Officer | |
• 2005 – 2006, | Executive VP, GM, Mobility Group | |
• 2001 – 2005, | Executive VP, GM, Intel Communications Group | |
• Member of Autodesk, Inc. Board of Directors | ||
• Member of Clearwire Corporation Board of Directors | ||
• Joined Intel 1982 | ||
A. Douglas Melamed , age 64 | ||
• 2009 – present, | Senior VP, General Counsel | |
• 2001 – 2009, | Partner, Wilmer Cutler Pickering Hale and Dorr LLP | |
• Joined Intel 2009 | ||
Paul S. Otellini , age 59 | ||
• 2005 – present, | President, Chief Executive Officer | |
• 2002 – 2005, | President, Chief Operating Officer | |
• Member of Intel Board of Directors since 2002 | ||
• Member of Google, Inc. Board of Directors | ||
• Joined Intel 1974 | ||
David Perlmutter , age 56 | ||
• 2009 – present, | Executive VP, GM, Intel Architecture Group | |
• 2007 – 2009, | Executive VP, GM, Mobility Group | |
• 2005 – 2007, | Senior VP, GM, Mobility Group | |
• 2005 | VP, GM, Mobility Group | |
• 2000 – 2005, | VP, GM, Mobile Platforms Group | |
• Joined Intel 1980 | ||
Stacy J. Smith , age 47 | ||
• 2010 – present, | Senior VP, Chief Financial Officer | |
• 2007 – 2010, | VP, Chief Financial Officer | |
• 2006 – 2007, | VP, Assistant Chief Financial Officer | |
• 2004 – 2006, | VP, Finance and Enterprise Services, Chief Information Officer | |
• 2002 – 2004, | VP, Sales and Marketing Group, GM, Europe, Middle East, and Africa | |
• Joined Intel 1988 | ||
Arvind Sodhani , age 55 | ||
• 2007 – present, | Executive VP of Intel, President of Intel Capital | |
• 2005 – 2007, | Senior VP of Intel, President of Intel Capital | |
• 1990 – 2005, | VP, Treasurer | |
• Joined Intel 1981 | ||
14
| ITEM 1A. | RISK FACTORS |
Fluctuations in demand for our products may harm our financial results and are difficult to forecast.
If demand for our products fluctuates as a result of economic conditions or for other reasons, our revenue and profitability could be harmed. Important factors that could cause demand for our products to fluctuate include:
| • | changes in business and economic conditions, including downturns in the semiconductor industry and/or the overall economy; | |
| • | changes in consumer confidence caused by changes in market conditions, including changes in the credit market, expectations for inflation, and energy prices; | |
| • | changes in the level of customers' components inventories; | |
| • | competitive pressures, including pricing pressures, from companies that have competing products, chip architectures, manufacturing technologies, and marketing programs; | |
| • | changes in customer product needs; | |
| • | strategic actions taken by our competitors; and | |
| • | market acceptance of our products. |
If product demand decreases, our manufacturing or assembly and test capacity could be underutilized, and we may be required to record an impairment on our long-lived assets, including facilities and equipment as well as intangible assets, which would increase our expenses. In addition, if product demand decreases or we fail to forecast demand accurately, we could be required to write off inventory or record underutilization charges, which would have a negative impact on our gross margin. Factory-planning decisions may shorten the useful lives of long-lived assets, including facilities and equipment, and cause us to accelerate depreciation. In the long term, if product demand increases, we may not be able to add manufacturing or assembly and test capacity fast enough to meet market demand. These changes in demand for our products, and changes in our customers' product needs, could have a variety of negative effects on our competitive position and our financial results, and, in certain cases, may reduce our revenue, increase our costs, lower our gross margin percentage, or require us to recognize impairments of our assets.
Litigation or regulatory proceedings could harm our business.
We may be subject to legal claims or regulatory matters involving stockholder, consumer, competition, and other issues on a global basis. As described in "Note 28: Contingencies" in Part II, Item 8 of this Form 10-K, we are currently engaged in a number of litigation and regulatory matters, particularly with respect to competition. Litigation and regulatory proceedings are subject to inherent uncertainties, and unfavorable rulings could occur. An unfavorable ruling could include monetary damages or, in cases for which injunctive relief is sought, an injunction prohibiting us from manufacturing or selling one or more products, precluding particular business practices, or requiring other remedies, such as compulsory licensing of intellectual property. If we were to receive an unfavorable ruling in a matter, our business and results of operations could be materially harmed.
The semiconductor industry and our operations are characterized by a high percentage of costs that are fixed or difficult to reduce in the short term, and by product demand that is highly variable and subject to significant downturns that may harm our business, results of operations, and financial condition.
The semiconductor industry and our operations are characterized by high costs, such as those related to facility construction and equipment, R&D, and employment and training of a highly skilled workforce, that are either fixed or difficult to reduce in the short term. At the same time, demand for our products is highly variable and there have been downturns, often in connection with maturing product cycles as well as downturns in general economic market conditions. These downturns have been characterized by reduced product demand, manufacturing overcapacity and resulting underutilization charges, high inventory levels, and lower average selling prices. The combination of these factors may cause our revenue, gross margin, cash flow, and profitability to vary significantly in both the short and long term.
15
We operate in intensely competitive industries, and our failure to respond quickly to technological developments and incorporate new features into our products could harm our ability to compete.
We operate in intensely competitive industries that experience rapid technological developments, changes in industry standards, changes in customer requirements, and frequent new product introductions and improvements. If we are unable to respond quickly and successfully to these developments, we may lose our competitive position, and our products or technologies may become uncompetitive or obsolete. To compete successfully, we must maintain a successful R&D effort, develop new products and production processes, and improve our existing products and processes at the same pace or ahead of our competitors. Our R&D efforts are aimed at solving increasingly complex problems, and we do not expect that all of our projects will be successful. If our R&D efforts are unsuccessful, our future results of operations could be materially harmed. We may not be able to develop and market these new products successfully, the products we invest in and develop may not be well received by customers, and products developed and new technologies offered by others may affect demand for our products. These types of events could have a variety of negative effects on our competitive position and our financial results, such as reducing our revenue, increasing our costs, lowering our gross margin percentage, and requiring us to recognize impairments on our assets.
We invest in companies for strategic reasons and may not realize a return on our investments.
We make investments in companies around the world to further our strategic objectives and support our key business initiatives. Such investments include equity or debt instruments of public or private companies, and many of these instruments are non-marketable at the time of our initial investment. These companies range from early-stage companies that are often still defining their strategic direction to more mature companies with established revenue streams and business models. The success of these companies is dependent on product development, market acceptance, operational efficiency, and other key business factors. The companies in which we invest may fail because they may not be able to secure additional funding, obtain favorable investment terms for future financings, or take advantage of liquidity events such as public offerings, mergers, and private sales. If any of these private companies fail, we could lose all or part of our investment in that company. If we determine that an other-than-temporary decline in the fair value exists for an equity or debt investment in a public or private company in which we have invested, we write down the investment to its fair value and recognize the related write-down as an investment loss. We have significant investments in companies in the flash memory market segment, and declines in this market segment or changes in management's plans with respect to our investments in this market segment could result in significant impairment charges, impacting gains (losses) on equity method investments and gains (losses) on other equity investments.
Furthermore, when the strategic objectives of an investment have been achieved, or if the investment or business diverges from our strategic objectives, we may decide to dispose of the investment. Our non-marketable equity investments in private companies are not liquid, and we may not be able to dispose of these investments on favorable terms or at all. The occurrence of any of these events could harm our results. Additionally, for cases in which we are required under equity method accounting to recognize a proportionate share of another company's income or loss, such income or loss may impact our earnings. Gains or losses from equity securities could vary from expectations depending on gains or losses realized on the sale or exchange of securities, gains or losses from equity method investments, and impairment charges related to debt instruments as well as equity and other investments.
Our results of operations could vary as a result of the methods, estimates, and judgments that we use in applying our accounting policies.
The methods, estimates, and judgments that we use in applying our accounting policies have a significant impact on our results of operations (see "Critical Accounting Estimates" in Part II, Item 7 of this Form 10-K). Such methods, estimates, and judgments are, by their nature, subject to substantial risks, uncertainties, and assumptions, and factors may arise over time that lead us to change our methods, estimates, and judgments. Changes in those methods, estimates, and judgments could significantly affect our results of operations.
Fluctuations in the mix of products sold may harm our financial results.
Because of the wide price differences among and within notebook, netbook, desktop, and server microprocessors, the mix and types of performance capabilities of microprocessors sold affect the average selling price of our products and have a substantial impact on our revenue and gross margin. Our financial results also depend in part on the mix of other products that we sell, such as chipsets, flash memory, and other semiconductor products. In addition, more recently introduced products tend to have higher associated costs because of initial overall development and production ramp. Fluctuations in the mix and types of our products may also affect the extent to which we are able to recover the fixed costs and investments associated with a particular product, and as a result can harm our financial results.
16
Our global operations subject us to risks that may harm our results of operations and financial condition.
We have sales offices, R&D, manufacturing, and assembly and test facilities in many countries, and as a result, we are subject to risks that may limit our ability to manufacture, assemble and test, design, develop, or sell products in particular countries, which could, in turn, harm our results of operations and financial condition, including:
| • | security concerns, such as armed conflict and civil or military unrest, crime, political instability, and terrorist activity; | |
| • | health concerns; | |
| • | natural disasters; | |
| • | inefficient and limited infrastructure and disruptions, such as large-scale outages or interruptions of service from utilities or telecommunications providers and supply chain interruptions; | |
| • | differing employment practices and labor issues; | |
| • | local business and cultural factors that differ from our normal standards and practices; | |
| • | regulatory requirements and prohibitions that differ between jurisdictions; and | |
| • | restrictions on our operations by governments seeking to support local industries, nationalization of our operations, and restrictions on our ability to repatriate earnings. |
In addition, although substantially all of our products are sold in U.S. dollars, we incur a significant amount of certain types of expenses, such as payroll, utilities, tax, and marketing expenses, as well as conduct certain investing and financing activities, in local currencies. Our hedging programs reduce, but do not entirely eliminate, the impact of currency exchange rate movements, and therefore fluctuations in exchange rates could harm our results of operations and financial condition. In addition, changes in tariff and import regulations and in U.S. and non-U.S. monetary policies may harm our results of operations and financial condition by increasing our expenses and reducing our revenue. Varying tax rates in different jurisdictions could harm our results of operations and financial condition by increasing our overall tax rate.
We maintain a program of insurance coverage for various types of property, casualty, and other risks. We place our insurance coverage with various carriers in numerous jurisdictions. However, there is a risk that one or more of our insurance providers may be unable to pay a claim. The types and amounts of insurance that we obtain vary from time to time and from location to location, depending on availability, cost, and our decisions with respect to risk retention. The policies are subject to deductibles and exclusions that result in our retention of a level of risk on a self-insurance basis. Losses not covered by insurance may be substantial and may increase our expenses, which could harm our results of operations and financial condition.
Failure to meet our production targets, resulting in undersupply or oversupply of products, may harm our business and results of operations.
Production of integrated circuits is a complex process. Disruptions in this process can result from interruptions in our processes, errors, and difficulties in our development and implementation of new processes; defects in materials; disruptions in our supply of materials or resources; and disruptions at our fabrication and assembly and test facilities due to, for example, accidents, maintenance issues, or unsafe working conditions-all of which could affect the timing of production ramps and yields. We may not be successful or efficient in developing or implementing new production processes. The occurrence of any of the foregoing may result in our failure to meet or increase production as desired, resulting in higher costs or substantial decreases in yields, which could affect our ability to produce sufficient volume to meet specific product demand. The unavailability or reduced availability of certain products could make it more difficult to implement our platform strategy. We may also experience increases in yields. A substantial increase in yields could result in higher inventory levels and the possibility of resulting underutilization charges as we slow production to reduce inventory levels. The occurrence of any of these events could harm our business and results of operations.
We may have difficulties obtaining the resources or products we need for manufacturing, assembling and testing our products, or operating other aspects of our business, which could harm our ability to meet demand for our products and may increase our costs.
We have thousands of suppliers providing various materials that we use in the production of our products and other aspects of our business, and we seek, where possible, to have several sources of supply for all of those materials. However, we may rely on a single or a limited number of suppliers, or upon suppliers in a single country, for these materials. The inability of such suppliers to deliver adequate supplies of production materials or other supplies could disrupt our production processes or could make it more difficult for us to implement our business strategy. In addition, production could be disrupted by the unavailability of the resources used in production, such as water, silicon, electricity, and gases. Future environmental regulations could restrict the supply or increase the cost of certain of the materials that we currently use in our business. The unavailability or reduced availability of the materials or resources that we use in our business may require us to reduce production of products or may require us to incur additional costs in order to obtain an adequate supply of those materials or resources. The occurrence of any of these events could harm our business and results of operations.
17
Costs related to product defects and errata may harm our results of operations and business.
Costs associated with unexpected product defects and errata (deviations from published specifications) due to, for example, unanticipated problems in our manufacturing processes, include:
| • | writing off the value of inventory of defective products; | |
| • | disposing of defective products that cannot be fixed; | |
| • | recalling defective products that have been shipped to customers; | |
| • | providing product replacements for, or modifications to, defective products; and/or | |
| • | defending against litigation related to defective products. |
These costs could be substantial and may therefore increase our expenses and lower our gross margin. In addition, our reputation with our customers or users of our products could be damaged as a result of such product defects and errata, and the demand for our products could be reduced. These factors could harm our financial results and the prospects for our business.
We may be subject to claims of infringement of third-party intellectual property rights, which could harm our business.
Third parties may assert against us or our customers alleged patent, copyright, trademark, or other intellectual property rights to technologies that are important to our business. As described in "Note 28: Contingencies" in Part II, Item 8 of this Form 10-K, we are currently engaged in a number of litigation matters involving intellectual property rights. We may be subject to intellectual property infringement claims from certain individuals and companies who have acquired patent portfolios for the sole purpose of asserting such claims against other companies. Any claims that our products or processes infringe the intellectual property rights of others, regardless of the merit or resolution of such claims, could cause us to incur significant costs in responding to, defending, and resolving such claims, and may divert the efforts and attention of our management and technical personnel from our business. As a result of such intellectual property infringement claims, we could be required or otherwise decide that it is appropriate to:
| • | pay third-party infringement claims; | |
| • | discontinue manufacturing, using, or selling particular products subject to infringement claims; | |
| • | discontinue using the technology or processes subject to infringement claims; | |
| • | develop other technology not subject to infringement claims, which could be time-consuming and costly or may not be possible; and/or | |
| • | license technology from the third party claiming infringement, which license may not be available on commercially reasonable terms. |
The occurrence of any of the foregoing could result in unexpected expenses or require us to recognize an impairment of our assets, which would reduce the value of our assets and increase expenses. In addition, if we alter or discontinue our production of affected items, our revenue could be harmed.
We may not be able to enforce or protect our intellectual property rights, which may harm our ability to compete and harm our business.
Our ability to enforce our patents, copyrights, software licenses, and other intellectual property rights is subject to general litigation risks, as well as uncertainty as to the enforceability of our intellectual property rights in various countries. When we seek to enforce our rights, we are often subject to claims that the intellectual property right is invalid, is otherwise not enforceable, or is licensed to the party against whom we are asserting a claim. In addition, our assertion of intellectual property rights often results in the other party seeking to assert alleged intellectual property rights of its own or assert other claims against us, which could harm our business. If we are not ultimately successful in defending ourselves against these claims in litigation, we may not be able to sell a particular product or family of products due to an injunction, or we may have to pay damages that could, in turn, harm our results of operations. In addition, governments may adopt regulations, and governments or courts may render decisions, requiring compulsory licensing of intellectual property to others, or governments may require that products meet specified standards that serve to favor local companies. Our inability to enforce our intellectual property rights under these circumstances may harm our competitive position and our business.
18
We may be subject to intellectual property theft or misuse, which could result in third-party claims and harm our business and results of operations.
We regularly face attempts by others to gain unauthorized access through the Internet to our information technology systems by, for example, masquerading as authorized users or surreptitious introduction of software. These attempts, which might be the result of industrial or other espionage, or actions by hackers seeking to harm the company, its products, or end users, are sometimes successful. One recent and sophisticated incident occurred in January 2010 around the same time as the recently publicized security incident reported by Google. We seek to detect and investigate these security incidents and to prevent their recurrence, but in some cases we might be unaware of an incident or its magnitude and effects. The theft and/or unauthorized use or publication of our trade secrets and other confidential business information as a result of such an incident could adversely affect our competitive position and reduce marketplace acceptance of our products; the value of our investment in R&D, product development, and marketing could be reduced; and third parties might assert against us or our customers claims related to resulting losses of confidential or proprietary information or end-user data and/or system reliability. Our business could be subject to significant disruption, and we could suffer monetary and other losses, including the cost of product recalls and returns and reputational harm, in the event of such incidents and claims.
Our licenses with other companies and our participation in industry initiatives may allow other companies, including our competitors, to use our patent rights.
Companies in the semiconductor industry often rely on the ability to license patents from each other in order to compete. Many of our competitors have broad licenses or cross-licenses with us, and under current case law, some of the licenses may permit these competitors to pass our patent rights on to others. If one of these licensees becomes a foundry, our competitors might be able to avoid our patent rights in manufacturing competing products. In addition, our participation in industry initiatives may require us to license our patents to other companies that adopt certain industry standards or specifications, even when such organizations do not adopt standards or specifications proposed by us. As a result, our patents implicated by our participation in industry initiatives might not be available for us to enforce against others who might otherwise be deemed to be infringing those patents, our costs of enforcing our licenses or protecting our patents may increase, and the value of our intellectual property may be impaired.
Decisions about the scope of operations of our business could affect our results of operations and financial condition.
Changes in the business environment could lead to changes in our decisions about the scope of operations of our business, and these changes could result in restructuring and asset impairment charges. Factors that could cause actual results to differ materially from our expectations with regard to changing the scope of our operations include:
| • | timing and execution of plans and programs that may be subject to local labor law requirements, including consultation with appropriate work councils; | |
| • | changes in assumptions related to severance and postretirement costs; | |
| • | future divestitures; | |
| • | new business initiatives and changes in product roadmap, development, and manufacturing; | |
| • | changes in employment levels and turnover rates; | |
| • | changes in product demand and the business environment; and | |
| • | changes in the fair value of certain long-lived assets. |
Our acquisitions, divestitures, and other transactions could disrupt our ongoing business and harm our results of operations.
In pursuing our business strategy, we routinely conduct discussions, evaluate opportunities, and enter into agreements regarding possible investments, acquisitions, divestitures, and other transactions, such as joint ventures. Acquisitions and other transactions involve significant challenges and risks, including risks that:
| • | we may not be able to identify suitable opportunities at terms acceptable to us; | |
| • | the transaction may not advance our business strategy; | |
| • | we may not realize a satisfactory return on the investment we make; | |
| • | we may not be able to retain key personnel of the acquired business; or | |
| • | we may experience difficulty in integrating new employees, business systems, and technology. |
When we decide to sell assets or a business, we may encounter difficulty in finding or completing divestiture opportunities or alternative exit strategies on acceptable terms in a timely manner, and the agreed terms and financing arrangements could be renegotiated due to changes in business or market conditions. These circumstances could delay the accomplishment of our strategic objectives or cause us to incur additional expenses with respect to businesses that we want to dispose of, or we may dispose of a business at a price or on terms that are less favorable than we had anticipated, resulting in a loss on the transaction.
19
If we do enter into agreements with respect to acquisitions, divestitures, or other transactions, we may fail to complete them due to:
| • | failure to obtain required regulatory or other approvals; | |
| • | intellectual property or other litigation; | |
| • | difficulties that we or other parties may encounter in obtaining financing for the transaction; or | |
| • | other factors. |
Further, acquisitions, divestitures, and other transactions require substantial management resources and have the potential to divert our attention from our existing business. These factors could harm our business and results of operations.
In order to compete, we must attract, retain, and motivate key employees, and our failure to do so could harm our results of operations.
In order to compete, we must attract, retain, and motivate executives and other key employees. Hiring and retaining qualified executives, scientists, engineers, technical staff, and sales representatives are critical to our business, and competition for experienced employees in the semiconductor industry can be intense. To help attract, retain, and motivate qualified employees, we use share-based incentive awards such as employee stock options and non-vested share units (restricted stock units). If the value of such stock awards does not appreciate as measured by the performance of the price of our common stock, or if our share-based compensation otherwise ceases to be viewed as a valuable benefit, our ability to attract, retain, and motivate employees could be weakened, which could harm our results of operations.
Our failure to comply with applicable environmental laws and regulations worldwide could harm our business and results of operations.
The manufacturing and assembling and testing of our products require the use of hazardous materials that are subject to a broad array of EHS laws and regulations. Our failure to comply with any of those applicable laws or regulations could result in:
| • | regulatory penalties, fines, and legal liabilities; | |
| • | suspension of production; | |
| • | alteration of our fabrication and assembly and test processes; and | |
| • | curtailment of our operations or sales. |
In addition, our failure to manage the use, transportation, emissions, discharge, storage, recycling, or disposal of hazardous materials could subject us to increased costs or future liabilities. Existing and future environmental laws and regulations could also require us to acquire pollution abatement or remediation equipment, modify our product designs, or incur other expenses associated with such laws and regulations. Many new materials that we are evaluating for use in our operations may be subject to regulation under existing or future environmental laws and regulations that may restrict our use of one or more of such materials in our manufacturing, assembly and test processes, or products. Any of these restrictions could harm our business and results of operations by increasing our expenses or requiring us to alter our manufacturing and assembly and test processes.
Climate change poses both regulatory and physical risks that could harm our results of operations or affect the way we conduct our business.
In addition to the possible direct economic impact that climate change could have on us, climate change mitigation programs and regulations can increase our costs. For example, the cost of perfluorocompounds (PFCs), a gas that we use in our manufacturing, could increase over time under some climate-change-focused emissions trading programs that may be imposed by government regulation. If the use of PFCs is prohibited, we would need to obtain substitute materials that may cost more or be less available for our manufacturing operations. In addition, air quality permit requirements for our manufacturing operations could become more burdensome and cause delays in our ability to modify our facilities. We also see the potential for higher energy costs driven by climate change regulations. Our costs could increase if utility companies pass on their costs, such as those associated with carbon taxes, emission cap and trade programs, or renewable portfolio standards. While we maintain business recovery plans that are intended to allow us to recover from natural disasters or other events that can be disruptive to our business, we cannot be sure that our plans will fully protect us from all such disasters or events. Many of our operations are located in semi-arid regions, such as Israel and the southwestern U.S. Some scenarios predict that these regions may become even more vulnerable to prolonged droughts due to climate change.
20
Changes in our effective tax rate may harm our results of operations.
A number of factors may increase our future effective tax rates, including:
| • | the jurisdictions in which profits are determined to be earned and taxed; | |
| • | the resolution of issues arising from tax audits with various tax authorities; | |
| • | changes in the valuation of our deferred tax assets and liabilities, and changes in deferred tax valuation allowances; | |
| • | adjustments to income taxes upon finalization of various tax returns; | |
| • | increases in expenses not deductible for tax purposes, including write-offs of acquired in-process research and development and impairments of goodwill in connection with acquisitions; | |
| • | changes in available tax credits; | |
| • | changes in tax laws or the interpretation of such tax laws, and changes in U.S. generally accepted accounting principles; and | |
| • | our decision to repatriate non-U.S. earnings for which we have not previously provided for U.S. taxes. |
Any significant increase in our future effective tax rates could reduce net income for future periods.
Interest and other, net could be harmed by macroeconomic and other factors.
Factors that could cause interest and other, net in our consolidated statements of operations to fluctuate include:
| • | fixed-income, equity, and credit market volatility; | |
| • | fluctuations in foreign currency exchange rates; | |
| • | fluctuations in interest rates; | |
| • | changes in our cash and investment balances; and | |
| • | changes in our hedge accounting treatment. |
| ITEM 1B. | UNRESOLVED STAFF COMMENTS |
Not applicable.
| ITEM 2. | PROPERTIES |
As of December 26, 2009, our major facilities consisted of:
(Square Feet in Millions) | United States | Other Countries | Total | |||||||||
Owned facilities 1 | 25.8 | 18.7 | 44.5 | |||||||||
Leased facilities 2 | 1.7 | 2.8 | 4.5 | |||||||||
Total facilities | 27.5 | 21.5 | 49.0 | |||||||||
| 1 | Leases on portions of the land used for these facilities expire at varying dates through 2062. | |
| 2 | Leases expire at varying dates through 2028 and generally include renewals at our option. |
Our principal executive offices are located in the U.S. The majority of our wafer fabrication activities are also located in the U.S. Outside the U.S., we have wafer fabrication at our facilities in Ireland and Israel. In addition, we are building a new wafer fabrication facility in China that is expected to begin production in late 2010 or early 2011. Our assembly and test facilities are located in Malaysia, China, and Costa Rica. We are building a new assembly and test facility in Vietnam that is expected to begin production in the second half of 2010. In addition, we have sales and marketing offices worldwide. These facilities are generally located near major concentrations of users.
With the exception of certain facilities placed for sale and/or facilities included in our restructuring actions, we believe that our facilities detailed above are suitable and adequate for our present purposes (see "Note 19: Restructuring and Asset Impairment Charges" in Part II, Item 8 of this Form 10-K). Additionally, the productive capacity in our facilities is substantially being utilized or we have plans to utilize it.
We do not identify or allocate assets by operating segment. For information on net property, plant and equipment by country, see "Note 29: Operating Segment and Geographic Information" in Part II, Item 8 of this Form 10-K.
21
| ITEM 3. | LEGAL PROCEEDINGS |
For a discussion of legal proceedings, see "Note 28: Contingencies" in Part II, Item 8 of this Form 10-K.
| ITEM 4. | SUBMISSION OF MATTERS TO A VOTE OF SECURITY HOLDERS |
None.
PART II
| ITEM 5. | MARKET FOR REGISTRANT'S COMMON EQUITY, RELATED STOCKHOLDER MATTERS AND ISSUER PURCHASES OF EQUITY SECURITIES |
Information regarding the market price range of Intel common stock and dividend information may be found in "Financial Information by Quarter (Unaudited)" in Part II, Item 8 of this Form 10-K.
As of February 5, 2010, there were 175,000 registered holders of record of Intel's common stock. A substantially greater number of holders of Intel common stock are "street name" or beneficial holders, whose shares are held of record by banks, brokers, and other financial institutions.
Issuer Purchases of Equity Securities
We have an ongoing authorization, amended in November 2005, from our Board of Directors to repurchase up to $25 billion in shares of our common stock in open market or negotiated transactions. As of December 26, 2009, $5.7 billion remained available for repurchase under the existing repurchase authorization.
Common stock repurchases under our authorized plan in each quarter of 2009 were as follows (in millions, except per share amounts):
| Total Number of | ||||||||||||
| Shares Purchased | ||||||||||||
| Total Number of | Average Price | as Part of Publicly | ||||||||||
Period | Shares Purchased | Paid Per Share | Announced Plans | |||||||||
December 28, 2008–March 28, 2009 | - | $ | - | - | ||||||||
March 29, 2009–June 27, 2009 | - | $ | - | - | ||||||||
June 28, 2009–September 26, 2009 | 88.2 | $ | 18.95 | 88.2 | ||||||||
September 27, 2009–December 26, 2009 | - | $ | - | - | ||||||||
Total | 88.2 | $ | 18.95 | 88.2 | ||||||||
Our purchases in 2009 were executed in privately negotiated transactions.
For the majority of restricted stock units granted, the number of shares issued on the date the restricted stock units vest is net of the minimum statutory withholding requirements that we pay in cash to the appropriate taxing authorities on behalf of our employees. These withheld shares are not included in the common stock repurchase totals in the table above. For further discussion, see "Note 24: Common Stock Repurchases" in Part II, Item 8 of this Form 10-K.
22
Stock Performance Graph
The line graph below compares the cumulative total stockholder return on our common stock with the cumulative total return of the Dow Jones U.S. Technology Index* and the Standard & Poor's S&P 500* Index for the five years ended December 26, 2009. The graph and table assume that $100 was invested on December 23, 2004 (the last day of trading for the year ended December 25, 2004) in each of our common stock, the Dow Jones U.S. Technology Index, and the S&P 500 Index, and that all dividends were reinvested. Cumulative total stockholder returns for our common stock, the Dow Jones U.S. Technology Index, and the S&P 500 Index are based on our fiscal year.
Comparison
of Five-Year Cumulative Return for Intel,
the Dow Jones U.S. Technology Index*, and the S&P 500*
Index
| 2004 | 2005 | 2006 | 2007 | 2008 | 2009 | |||||||||||||||||||
Intel Corporation | $ | 100 | $ | 107 | $ | 89 | $ | 120 | $ | 65 | $ | 97 | ||||||||||||
Dow Jones U.S. Technology Index | $ | 100 | $ | 104 | $ | 114 | $ | 134 | $ | 73 | $ | 125 | ||||||||||||
S&P 500 Index | $ | 100 | $ | 105 | $ | 122 | $ | 129 | $ | 78 | $ | 103 | ||||||||||||
23
| ITEM 6. | SELECTED FINANCIAL DATA |
(In Millions, Except Per Share Amounts) | 2009 | 2008 | 2007 | 2006 | 2005 1 | |||||||||||||||
Net revenue | $ | 35,127 | $ | 37,586 | $ | 38,334 | $ | 35,382 | $ | 38,826 | ||||||||||
Gross margin | $ | 19,561 | $ | 20,844 | $ | 19,904 | $ | 18,218 | $ | 23,049 | ||||||||||
Research and development | $ | 5,653 | $ | 5,722 | $ | 5,755 | $ | 5,873 | $ | 5,145 | ||||||||||
Operating income | $ | 5,711 | $ | 8,954 | $ | 8,216 | $ | 5,652 | $ | 12,090 | ||||||||||
Net income | $ | 4,369 | $ | 5,292 | $ | 6,976 | $ | 5,044 | $ | 8,664 | ||||||||||
Earnings per common share | ||||||||||||||||||||
Basic | $ | 0.79 | $ | 0.93 | $ | 1.20 | $ | 0.87 | $ | 1.42 | ||||||||||
Diluted | $ | 0.77 | $ | 0.92 | $ | 1.18 | $ | 0.86 | $ | 1.40 | ||||||||||
Weighted average diluted common shares outstanding | 5,645 | 5,748 | 5,936 | 5,880 | 6,178 | |||||||||||||||
Dividends per common share | ||||||||||||||||||||
Declared | $ | 0.56 | $ | 0.5475 | $ | 0.45 | $ | 0.40 | $ | 0.32 | ||||||||||
Paid | $ | 0.56 | $ | 0.5475 | $ | 0.45 | $ | 0.40 | $ | 0.32 | ||||||||||
Net cash provided by operating activities | $ | 11,170 | $ | 10,926 | $ | 12,625 | $ | 10,632 | $ | 14,851 | ||||||||||
Additions to property, plant and equipment | $ | 4,515 | $ | 5,197 | $ | 5,000 | $ | 5,860 | $ | 5,871 | ||||||||||
(Dollars in Millions) | Dec. 26, 2009 | Dec. 27, 2008 2 | Dec. 29, 2007 2 | Dec. 30, 2006 2 | Dec. 31, 2005 2 | |||||||||||||||
Property, plant and equipment, net | $ | 17,225 | $ | 17,574 | $ | 16,938 | $ | 17,614 | $ | 17,114 | ||||||||||
Total assets | $ | 53,095 | $ | 50,472 | $ | 55,664 | $ | 48,372 | $ | 48,309 | ||||||||||
Long-term debt | $ | 2,049 | $ | 1,185 | $ | 1,269 | $ | 1,128 | $ | 1,377 | ||||||||||
Stockholders' equity | $ | 41,704 | $ | 39,546 | $ | 43,220 | $ | 37,210 | $ | 36,640 | ||||||||||
Employees (in thousands) | 79.8 | 83.9 | 86.3 | 94.1 | 99.9 | |||||||||||||||
| 1 | Beginning in 2006, we adopted new standards that changed the accounting for employee equity incentive plans requiring the recognition of share-based compensation. | |
| 2 | As adjusted due to changes to the accounting for convertible debt instruments. See "Note 3: Accounting Changes" in Part II, Item 8 of this Form 10-K. |
The ratio of earnings to fixed charges for each of the five years in the period ended December 26, 2009 was as follows:
| 2009 | 2008 | 2007 | 2006 | 2005 | ||||
44x | 51x | 72x | 50x | 169x |
Fixed charges consist of interest expense, capitalized interest, and the estimated interest component of rental expense.
24
| ITEM 7. | MANAGEMENT'S DISCUSSION AND ANALYSIS OF FINANCIAL CONDITION AND RESULTS OF OPERATIONS |
Our Management's Discussion and Analysis of Financial Condition and Results of Operations (MD&A) is provided in addition to the accompanying consolidated financial statements and notes to assist readers in understanding our results of operations, financial condition, and cash flows. MD&A is organized as follows:
| • | Overview. Discussion of our business and overall analysis of financial and other highlights affecting the company in order to provide context for the remainder of MD&A. | |
| • | Strategy. Overall strategy and the strategy for our major market segments. | |
| • | Critical Accounting Estimates. Accounting estimates that we believe are most important to understanding the assumptions and judgments incorporated in our reported financial results and forecasts. | |
| • | Results of Operations. Analysis of our financial results comparing 2009 to 2008 and comparing 2008 to 2007. At the end of 2009, we reorganized our business to better align our major product groups around the core competencies of Intel architecture and our manufacturing operations. The analysis of our major operating segments' financial results reflects this reorganization and prior-period analysis, and amounts have been adjusted retrospectively. | |
| • | Business Outlook. Our expectations for selected financial items for 2010. | |
| • | Liquidity and Capital Resources. An analysis of changes in our balance sheets and cash flows, and discussion of our financial condition and potential sources of liquidity. | |
| • | Fair Value of Financial Instruments. Discussion of the methodologies used in the valuation of our financial instruments. | |
| • | Contractual Obligations and Off-Balance-Sheet Arrangements. Overview of contractual obligations and contingent liabilities and commitments outstanding as of December 26, 2009, including expected payment schedule, and explanation of off-balance-sheet arrangements. |
The various sections of this MD&A contain a number of forward-looking statements. Words such as "expects," "goals," "plans," "believes," "continues," "may," "will," and variations of such words and similar expressions are intended to identify such forward-looking statements. In addition, any statements that refer to projections of our future financial performance, our anticipated growth and trends in our businesses, and other characterizations of future events or circumstances are forward-looking statements. Such statements are based on our current expectations and could be affected by the uncertainties and risk factors described throughout this filing and particularly in the "Business Outlook" section (see also "Risk Factors" in Part I, Item 1A of this Form 10-K). Our actual results may differ materially, and these forward-looking statements do not reflect the potential impact of any divestitures, mergers, acquisitions, or other business combinations that had not been completed as of February 22, 2010.
Overview
Our goal is to be the preeminent provider of semiconductor chips and platforms for the worldwide digital economy. Our primary component-level products include microprocessors, chipsets, and flash memory. To better align our major product groups around the core competencies of Intel architecture and our manufacturing operations, we completed the reorganization of our business in the fourth quarter of 2009. Net revenue, gross margin, operating income, and net income for the fourth and third quarters of 2009, and fiscal year 2009 and 2008 were as follows:
| Three Months Ended | Twelve Months Ended | |||||||||||||||
| Dec. 26, | Sept. 26, | Dec. 26, | Dec. 27, | |||||||||||||
(In Millions) | 2009 | 2009 | 2009 | 2008 | ||||||||||||
Net revenue | $ | 10,569 | $ | 9,389 | $ | 35,127 | $ | 37,586 | ||||||||
Gross margin | $ | 6,840 | $ | 5,404 | $ | 19,561 | $ | 20,844 | ||||||||
Operating income | $ | 2,497 | $ | 2,579 | $ | 5,711 | $ | 8,954 | ||||||||
Net income | $ | 2,282 | $ | 1,856 | $ | 4,369 | $ | 5,292 | ||||||||
We started the year in one of the deepest recessions in our history and emerged from it with better products and technology in a strengthening market. Compared to the first quarter of 2008, revenue was down 26% in the first quarter of 2009, with the second and third quarters down 15% and 8%, respectively, compared to the second and third quarters of 2008. However, our fourth quarter results reflected a strengthening demand across all regions and all product categories, driven primarily by the notebook market segment. Fourth quarter revenue of $10.6 billion was up 13% compared to the third quarter, nearly twice the seasonal average, and up 28% compared to the fourth quarter of 2008.
25
MANAGEMENT'S DISCUSSION AND ANALYSIS OF FINANCIAL CONDITION AND RESULTS OF OPERATIONS (Continued)
The launch of our microprocessor products using 32nm process technology was strong in the fourth quarter and was one of the contributors to the increase in our overall microprocessor average selling prices compared to the third quarter. Our server products also had a strong quarter, and we saw a demand shift toward higher end products, which also contributed to the increase in our average selling prices. Despite these fourth quarter increases, our microprocessor average selling prices in 2009 were lower than in 2008, driven primarily by decreases in average selling prices in the notebook and desktop market segments.
With the launch of our 32nm products and fourth quarter record shipments of microprocessor units, we are entering 2010 in a strong competitive position as we continue delivering improvements in our product offerings through the "tick-tock" manufacturing process technology and product development cadence. Additionally, our Intel Atom processors and related chipsets continue their strong ramp, with revenue having increased nearly $900 million in 2009 compared to 2008.
We believe our total inventory levels of $2.9 billion, though up compared to the third quarter of 2009, are appropriate based on our forecasts. We believe that OEM component inventories are roughly flat compared to the third quarter and below levels at the end of 2008. Additionally, our distributors' inventories are down compared to the third quarter.
Our fourth quarter gross margin percentage of 64.7% set a new quarterly record. The fourth quarter gross margin percentage compared to the third quarter was positively impacted by lower inventory write-offs, higher microprocessor average selling prices and unit sales, the lack of excess capacity charges, and improving unit costs. In the first quarter of 2010, we expect our gross margin percentage to decrease due to higher unit costs as we continue to ramp our 32nm products, as well as seasonally lower microprocessor unit sales and lower microprocessor average selling prices.
In the fourth quarter of 2009, we made a $1.25 billion payment to AMD as part of a settlement to end all outstanding litigation between the companies, including antitrust litigation and cross-license patent disputes. Also in the fourth quarter of 2009, the New York Attorney General and the U.S. Federal Trade Commission filed antitrust suits against Intel. For further information on our litigation matters, see "Note 28: Contingencies" in Part II, Item 8 of this Form 10-K.
From a financial condition perspective, we ended 2009 with an investment portfolio of $13.9 billion, consisting of cash and cash equivalents, debt instruments included in trading assets, and short-term investments. During 2009, we generated $11.2 billion in cash from operations despite paying the €1.06 billion ($1.447 billion) European Commission fine recorded in the second quarter of 2009, and the AMD settlement recorded in the fourth quarter of 2009. During 2009, we issued $2.0 billion of convertible debt and utilized the proceeds from the convertible debt to repurchase $1.7 billion of common stock through our common stock repurchase program. In addition, during 2009 we returned $3.1 billion to stockholders through dividends. In January 2010, our Board of Directors declared a dividend of $0.1575 per common share for the first quarter of 2010, an increase of 12.5% compared to our fourth quarter dividend.
In February 2010, we signed a definitive agreement with Micron and Numonyx under which Micron agreed to acquire Numonyx in an all-stock transaction. For further information, see "Note 11: Non-Marketable Equity Investments" in Part II, Item 8 of this Form 10-K.
26
MANAGEMENT'S DISCUSSION AND ANALYSIS OF FINANCIAL CONDITION AND RESULTS OF OPERATIONS (Continued)
Strategy
Our goal is to be the preeminent provider of semiconductor chips and platforms for the worldwide digital economy. As part of our overall strategy to compete in each relevant market segment, we use our core competencies in the design and manufacture of integrated circuits, as well as our financial resources, global presence, brand recognition, and software development. We believe that we have the scale, capacity, and global reach to establish new technologies and respond to customers' needs quickly.
Some of our key focus areas are listed below:
| • | Customer Orientation. Our strategy focuses on developing our next generation of products based on the needs and expectations of our customers. In turn, our products help enable the design and development of new form factors and usage models for businesses and consumers. We offer platforms that incorporate various components designed and configured to work together to provide an optimized computing solution compared to components that are used separately. | |
| • | Architecture and Platforms. We are focusing on improved energy-efficient performance for computing and communications systems and devices. Improved energy-efficient performance involves balancing improved performance with lower power consumption. We continue to develop multi-core microprocessors with an increasing number of cores, which enable improved multitasking and energy efficiency. In addition, to meet the demands of new and evolving netbook, consumer electronics, and various embedded market segments, we offer and are continuing to develop SoC products that are designed to provide improved performance due to higher integration, lower power consumption, and smaller form factors. | |
| • | Silicon and Manufacturing Technology Leadership. Our strategy for developing microprocessors with improved performance is to synchronize the introduction of a new microarchitecture with improvements in silicon process technology. We plan to introduce a new microarchitecture approximately every two years and ramp the next generation of silicon process technology in the intervening years. This coordinated schedule allows us to develop and introduce new products based on a common microarchitecture quickly, without waiting for the next generation of silicon process technology. We refer to this as our "tick-tock" technology development cadence. In keeping with this cadence, we expect to introduce a new microarchitecture using our 32nm process technology in 2010. | |
| • | Strategic Investments. We make investments in companies around the world that we believe will generate financial returns, further our strategic objectives, and support our key business initiatives. Our investments, including those made through our Intel Capital program, generally focus on investing in companies and initiatives to stimulate growth in the digital economy, create new business opportunities for Intel, and expand global markets for our products. Our current investments primarily focus on the following areas: advancing flash memory products, enabling mobile wireless devices, advancing the digital home, enhancing the digital enterprise, advancing high-performance communications infrastructures, and developing the next generation of silicon process technologies. | |
| • | Business Environment and Software. We believe that we are well positioned in the technology industry to help drive innovation, foster collaboration, and promote industry standards that will yield innovation and improved technologies for users. We plan to continue to cultivate new businesses and work to encourage the industry to offer products that take advantage of the latest market trends and usage models. We frequently participate in industry initiatives designed to discuss and agree upon technical specifications and other aspects of technologies that could be adopted as standards by standards-setting organizations. Through our Software and Services Group, we help enable and advance the computing ecosystem by providing development tools and support to help software developers create software applications and operating systems that take advantage of our platforms. Lastly, we believe that the software expertise of our Wind River Software Group in the embedded and handheld market segments will expedite our growth strategy in these market segments. |
We believe that the proliferation of the Internet, including user demand for premium content and rich media, drives the need for greater performance in PCs and servers. Older PCs are increasingly incapable of handling the tasks that businesses and individual consumers demand, such as streaming video, web conferencing, online gaming, and other memory-intensive applications. As these tasks become even more demanding and require more computing power, we believe that businesses and individual consumers will need and want to buy new PCs. We also believe that increased Internet traffic and the increasing use of cloud computing, in which a group of linked servers provide a variety of applications and data to users over the Internet, create a need for greater server infrastructure, including server products optimized for energy-efficient performance and virtualization.
27
MANAGEMENT'S DISCUSSION AND ANALYSIS OF FINANCIAL CONDITION AND RESULTS OF OPERATIONS (Continued)
We believe that the trend of mobile microprocessor unit growth outpacing the growth in desktop microprocessor units will continue and that the demand for mobile microprocessors will result in the increased development of products with form factors and uses that require low-power microprocessors. We also believe that these products will result in demand that is incremental to that of microprocessors designed for notebook and desktop computers, as a growing number of households have multiple devices for different computing functions. Our silicon and manufacturing technology leadership allows us to develop low-power microprocessors for these and other new uses and form factors. We believe that Intel Atom processors give us the ability to extend Intel architecture and drive growth in new market segments, including a growing number of products that require processors specifically designed for embedded applications, handhelds, consumer electronics devices, and netbooks. We expect that our Intel Atom Developer Program will spur new applications that run on products using Intel Atom processors, which will expedite our growth strategy in these new market segments. The common elements for products in these new market segments are low power consumption and the ability to access the Internet.
We are also focusing on the development of a new highly scalable, many-core architecture aimed at parallel processing, the simultaneous use of multiple cores to execute a computing task. This architecture will initially be used as a software development platform for graphics and throughput computing (the need for large amounts of computing performance consistently over a long period of time). Over time, this architecture may be utilized in the development of products for scientific and professional workstations as well as high-performance computing applications.
In addition, we offer, and are continuing to develop, advanced NAND flash memory products, focusing on system-level solutions for Intel architecture platforms such as solid-state drives. In support of our strategy to provide advanced flash memory products, we continue to focus on the development of innovative products designed to address the needs of customers for reliable, non-volatile, low-cost, high-density memory.
Strategy by Major Market Segment
The strategy for our PC Client Group operating segment is to offer products that are incorporated into notebook, netbook, and desktop computers for consumers and businesses. Our strategy for the notebook computing market segment is to offer notebook PC products designed to improve performance, battery life, and wireless connectivity, as well as to allow for the design of smaller, lighter, and thinner form factors. We are also increasing our focus on notebook products designed to offer technologies that provide increased manageability and security, and we continue to invest in the build-out of WiMAX. Our strategy for the netbook computing market segment is to offer products that enable affordable, Internet-focused devices with small form factors. Our strategy for the desktop computing market segment is to offer products that provide increased manageability, security, and energy-efficient performance while lowering total cost of ownership for businesses. For consumers in the desktop computing market segment, we also focus on the design of components for high-end enthusiast PCs and mainstream PCs with rich audio and video capabilities.
The strategy for our Data Center Group operating segment is to offer products that provide leading performance, energy-efficiency, and virtualization technology for server, workstation, and storage platforms. We are also increasing our focus on products designed for high-performance and mission-critical computing, cloud computing services, and emerging markets. In addition, we offer wired connectivity devices that are incorporated into products that make up the infrastructure for the Internet.
The strategies for our other Intel architecture operating segments include:
| • | driving Intel architecture as a solution for embedded applications by delivering long life-cycle support, software and architectural scalability, and platform integration; | |
| • | continuing to develop and offer products that enable handhelds to deliver digital content and the Internet to users in new ways; and | |
| • | offering products and solutions for use in consumer electronics devices designed to access and share Internet, broadcast, optical media, and personal content through a variety of linked digital devices within the home. |
28
MANAGEMENT'S DISCUSSION AND ANALYSIS OF FINANCIAL CONDITION AND RESULTS OF OPERATIONS (Continued)
Critical Accounting Estimates
The methods, estimates, and judgments that we use in applying our accounting policies have a significant impact on the results that we report in our consolidated financial statements. Some of our accounting policies require us to make difficult and subjective judgments, often as a result of the need to make estimates regarding matters that are inherently uncertain. Our most critical accounting estimates include:
| • | the valuation of non-marketable equity investments and the determination of other-than-temporary impairments, which impact gains (losses) on equity method investments, net, or gains (losses) on other equity investments, net when we record impairments; | |
| • | the assessment of recoverability of long-lived assets, which primarily impacts gross margin or operating expenses when we record asset impairments or accelerate their depreciation; | |
| • | the recognition and measurement of current and deferred income taxes (including the measurement of uncertain tax positions), which impact our provision for taxes; and | |
| • | the valuation of inventory, which impacts gross margin. |
Below, we discuss these policies further, as well as the estimates and judgments involved.
Non-Marketable Equity Investments
We regularly invest in non-marketable equity instruments of private companies, which range from early-stage companies that are often still defining their strategic direction to more mature companies with established revenue streams and business models. The carrying value of our non-marketable equity investment portfolio, excluding equity derivatives, totaled $3.4 billion as of December 26, 2009 ($4.1 billion as of December 27, 2008). The majority of this balance as of December 26, 2009 was concentrated in companies in the flash memory market segment. Our flash memory market segment investments include our investment in IMFT and IM Flash Singapore, LLP (IMFS) of $1.6 billion ($2.1 billion as of December 27, 2008). For further information, see "Note 11: Non-Marketable Equity Investments" in Part II, Item 8 of this Form 10-K.
Our non-marketable equity investments are recorded using adjusted cost basis or the equity method of accounting, depending on the facts and circumstances of each investment (see "Note 2: Accounting Policies" in Part II, Item 8 of this Form 10-K). Our non-marketable equity investments are classified in other long-term assets on the consolidated balance sheets.
Non-marketable equity investments are inherently risky, and a number of the companies in which we invest could fail. Their success is dependent on product development, market acceptance, operational efficiency, and other key business factors. Depending on their future prospects, the companies may not be able to raise additional funds when the funds are needed or they may receive lower valuations, with less favorable investment terms than in previous financings, and our investments would likely become impaired. Additionally, financial markets and credit markets are volatile, which could negatively affect the prospects of the companies we invest in, their ability to raise additional capital, and the likelihood of our being able to realize value in our investments through liquidity events such as initial public offerings, mergers, and private sales. For further information about our investment portfolio risks, see "Risk Factors" in Part I, Item 1A of this Form 10-K.
We determine the fair value of our non-marketable equity investments quarterly for disclosure purposes; however, the investments are recorded at fair value only when an impairment charge is recognized. We determine the fair value of our non-marketable equity investments using the market and income approaches. The market approach includes the use of financial metrics and ratios of comparable public companies, such as projected revenues, earnings, and comparable performance multiples. The selection of comparable companies requires management judgment and is based on a number of factors, including comparable companies' sizes, growth rates, industries, development stages, and other relevant factors. The income approach includes the use of a discounted cash flow model, which may include one or multiple discounted cash flow scenarios and requires the following significant estimates for the investee: revenue, based on assumed market segment size and assumed market segment share; expenses, capital spending, and other costs; and discount rates based on the risk profile of comparable companies. Estimates of market segment size, market segment share, expenses, capital spending, and other costs are developed by the investee and/or Intel using historical data and available market data. The valuation of our non-marketable investments also takes into account variables such as conditions reflected in the capital markets, recent financing activities by the investees, the investees' capital structure, and differences in seniority and rights associated with the investees' capital.
29
MANAGEMENT'S DISCUSSION AND ANALYSIS OF FINANCIAL CONDITION AND RESULTS OF OPERATIONS (Continued)
For non-marketable equity investments, the measurement of fair value requires significant judgment and includes quantitative and qualitative analysis of identified events or circumstances that impact the fair value of the investment, such as:
| • | the investee's revenue and earnings trends relative to pre-defined milestones and overall business prospects; | |
| • | the technological feasibility of the investee's products and technologies; | |
| • | the general market conditions in the investee's industry or geographic area, including adverse regulatory or economic changes; | |
| • | factors related to the investee's ability to remain in business, such as the investee's liquidity, debt ratios, and the rate at which the investee is using its cash; and | |
| • | the investee's receipt of additional funding at a lower valuation. |
If the fair value of an investment is below our carrying value, we determine if the investment is other than temporarily impaired based on our quantitative and qualitative analysis, which includes assessing the severity and duration of the impairment and the likelihood of recovery before disposal. If the investment is considered to be other than temporarily impaired, we write down the investment to its fair value. Impairments of non-marketable equity investments were $221 million in 2009. Over the past 12 quarters, including the fourth quarter of 2009, impairments of non-marketable equity investments ranged from $11 million to $896 million per quarter. This range included impairments of $896 million during the fourth quarter of 2008, primarily related to a $762 million impairment charge on our investment in Clearwire Communications, LLC (Clearwire LLC).
IMFT/IMFS
IMFT and IMFS are variable interest entities that are designed to manufacture and sell NAND products to Intel and Micron at manufacturing cost. We determine the fair value of our investment in IMFT/IMFS using the income approach based on a weighted average of multiple discounted cash flow scenarios of our NAND Solutions Group business, which requires the use of unobservable inputs. Unobservable inputs that require us to make our most difficult and subjective judgments are the estimates for projected revenue and discount rate. Changes in management estimates for these unobservable inputs have the most significant effect on the fair value determination. We did not have an other-than-temporary impairment on our investment in IMFT/IMFS in 2009, 2008, or 2007. It is reasonably possible that the estimates used in the fair value determination could change in the near term, which could result in an impairment of our investment.
Long-Lived Assets
We assess the impairment of long-lived assets when events or changes in circumstances indicate that the carrying value of the assets or the asset grouping may not be recoverable. Factors that we consider in deciding when to perform an impairment review include significant under-performance of a business or product line in relation to expectations, significant negative industry or economic trends, and significant changes or planned changes in our use of the assets. We measure the recoverability of assets that will continue to be used in our operations by comparing the carrying value of the asset grouping to our estimate of the related total future undiscounted net cash flows. If an asset grouping's carrying value is not recoverable through the related undiscounted cash flows, the asset grouping is considered to be impaired. The impairment is measured by comparing the difference between the asset grouping's carrying value and its fair value. Fair value is the price that would be received from selling an asset in an orderly transaction between market participants at the measurement date. Long-lived assets such as goodwill; intangible assets; and property, plant and equipment are considered non-financial assets, and are recorded at fair value only when an impairment charge is recognized.
Impairments of long-lived assets are determined for groups of assets related to the lowest level of identifiable independent cash flows. Due to our asset usage model and the interchangeable nature of our semiconductor manufacturing capacity, we must make subjective judgments in determining the independent cash flows that can be related to specific asset groupings. In addition, as we make manufacturing process conversions and other factory planning decisions, we must make subjective judgments regarding the remaining useful lives of assets, primarily process-specific semiconductor manufacturing tools and building improvements. When we determine that the useful lives of assets are shorter than we had originally estimated, we accelerate the rate of depreciation over the assets' new, shorter useful lives. Over the past 12 quarters, including the fourth quarter of 2009, impairments and accelerated depreciation of long-lived assets ranged from $40 million to $300 million per quarter. For further discussion on these asset impairment charges, see "Note 19: Restructuring and Asset Impairment Charges" in Part II, Item 8 of this Form 10-K.
30
MANAGEMENT'S DISCUSSION AND ANALYSIS OF FINANCIAL CONDITION AND RESULTS OF OPERATIONS (Continued)
Income Taxes
We must make estimates and judgments in determining income tax expense for financial statement purposes. These estimates and judgments occur in the calculation of tax credits, benefits, and deductions, and in the calculation of certain tax assets and liabilities that arise from differences in the timing of recognition of revenue and expense for tax and financial statement purposes, as well as the interest and penalties related to uncertain tax positions. Significant changes in these estimates may result in an increase or decrease to our tax provision in a subsequent period.
We must assess the likelihood that we will be able to recover our deferred tax assets. If recovery is not likely, we must increase our provision for taxes by recording a valuation allowance against the deferred tax assets that we estimate will not ultimately be recoverable. We believe that we will ultimately recover a majority of the deferred tax assets recorded on our consolidated balance sheets. However, should there be a change in our ability to recover our deferred tax assets, our tax provision would increase in the period in which we determined that the recovery was not likely. Recovery of a portion of our deferred tax assets is impacted by management's plans with respect to holding or disposing of certain investments; therefore, changes in management's plans with respect to holding or disposing of investments could affect our future provision for taxes.
The calculation of our tax liabilities involves dealing with uncertainties in the application of complex tax regulations. We recognize liabilities for uncertain tax positions based on a two-step process. The first step is to evaluate the tax position for recognition by determining if the weight of available evidence indicates that it is more likely than not that the position will be sustained on audit, including resolution of related appeals or litigation processes, if any. If we determine that a tax position will more likely than not be sustained on audit, the second step requires us to estimate and measure the tax benefit as the largest amount that is more than 50% likely to be realized upon ultimate settlement. It is inherently difficult and subjective to estimate such amounts, as we have to determine the probability of various possible outcomes. We re-evaluate these uncertain tax positions on a quarterly basis. This evaluation is based on factors such as changes in facts or circumstances, changes in tax law, new audit activity, and effectively settled issues. Determining whether an uncertain tax position is effectively settled requires judgment. Such a change in recognition or measurement would result in the recognition of a tax benefit or an additional charge to the tax provision.
Inventory
The valuation of inventory requires us to estimate obsolete or excess inventory as well as inventory that is not of saleable quality. The determination of obsolete or excess inventory requires us to estimate the future demand for our products. The estimate of future demand is compared to work-in-process and finished goods inventory levels to determine the amount, if any, of obsolete or excess inventory. As of December 26, 2009, we had total work-in-process inventory of $1,469 million and total finished goods inventory of $1,029 million. The demand forecast is included in the development of our short-term manufacturing plans to enable consistency between inventory valuation and build decisions. Product-specific facts and circumstances reviewed in the inventory valuation process include a review of the customer base, the stage of the product life cycle of our products, consumer confidence, and customer acceptance of our products, as well as an assessment of the selling price in relation to the product cost. If our demand forecast for specific products is greater than actual demand and we fail to reduce manufacturing output accordingly, we could be required to write off inventory, which would negatively impact our gross margin.
In order to determine what costs can be included in the valuation of inventory, we must determine normal capacity at our manufacturing and assembly and test facilities, based on historical loadings of wafers compared to total available capacity. If the factory loadings are below the established normal capacity level, a portion of our manufacturing overhead costs would not be included in the cost of inventory, and therefore would be recognized as cost of sales in that period, which would negatively impact our gross margin. We refer to these costs as excess capacity charges. Over the past 12 quarters, excess capacity charges ranged from zero to $680 million per quarter.
Accounting Changes and Recent Accounting Standards
For a description of accounting changes and recent accounting standards, including the expected dates of adoption and estimated effects, if any, on our consolidated financial statements, see "Note 3: Accounting Changes" and "Note 4: Recent Accounting Standards" in Part II, Item 8 of this Form 10-K.
31
MANAGEMENT'S DISCUSSION AND ANALYSIS OF FINANCIAL CONDITION AND RESULTS OF OPERATIONS (Continued)
Results of Operations
The following table sets forth certain consolidated statements of operations data as a percentage of net revenue for the periods indicated:
| 2009 | 2008 | 2007 | ||||||||||||||||||||||
| % of | % of | % of | ||||||||||||||||||||||
(Dollars in Millions, Except Per Share Amounts) | Dollars | Revenue | Dollars | Revenue | Dollars | Revenue | ||||||||||||||||||
Net revenue | $ | 35,127 | 100.0 | % | $ | 37,586 | 100.0 | % | $ | 38,334 | 100.0 | % | ||||||||||||
Cost of sales | 15,566 | 44.3 | % | 16,742 | 44.5 | % | 18,430 | 48.1 | % | |||||||||||||||
Gross margin | 19,561 | 55.7 | % | 20,844 | 55.5 | % | 19,904 | 51.9 | % | |||||||||||||||
Research and development | 5,653 | 16.1 | % | 5,722 | 15.2 | % | 5,755 | 15.0 | % | |||||||||||||||
Marketing, general and administrative | 7,931 | 22.6 | % | 5,452 | 14.6 | % | 5,401 | 14.1 | % | |||||||||||||||
Restructuring and asset impairment charges | 231 | 0.6 | % | 710 | 1.9 | % | 516 | 1.3 | % | |||||||||||||||
Amortization of acquisition-related intangibles | 35 | 0.1 | % | 6 | - | % | 16 | 0.1 | % | |||||||||||||||
Operating income | 5,711 | 16.3 | % | 8,954 | 23.8 | % | 8,216 | 21.4 | % | |||||||||||||||
Gains (losses) on equity method investments, net | (147 | ) | (0.4 | )% | (1,380 | ) | (3.7 | )% | 3 | - | % | |||||||||||||
Gains (losses) on other equity investments, net | (23 | ) | (0.1 | )% | (376 | ) | (1.0 | )% | 154 | 0.4 | % | |||||||||||||
Interest and other, net | 163 | 0.4 | % | 488 | 1.3 | % | 793 | 2.1 | % | |||||||||||||||
Income before taxes | 5,704 | 16.2 | % | 7,686 | 20.4 | % | 9,166 | 23.9 | % | |||||||||||||||
Provision for taxes | 1,335 | 3.8 | % | 2,394 | 6.3 | % | 2,190 | 5.7 | % | |||||||||||||||
Net income | $ | 4,369 | 12.4 | % | $ | 5,292 | 14.1 | % | $ | 6,976 | 18.2 | % | ||||||||||||
Diluted earnings per common share | $ | 0.77 | $ | 0.92 | $ | 1.18 | ||||||||||||||||||
The following graphs set forth revenue information of geographic regions for the periods indicated:
Geographic Breakdown of Revenue
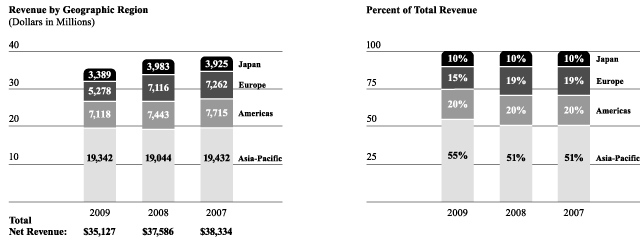
Our net revenue for 2009 decreased 7% compared to 2008. Average selling prices for microprocessors and chipsets decreased and microprocessor and chipset unit sales increased, compared to 2008, primarily due to the ramp of Intel Atom processors and chipsets, which generally have lower average selling prices than our other microprocessor and chipset products. Revenue from the sale of NOR flash memory products and communications products declined $740 million, primarily as a result of business divestitures. Additionally, an increase in revenue from the sale of NAND flash memory products was mostly offset by a decrease in revenue from the sale of wireless connectivity products.
32
MANAGEMENT'S DISCUSSION AND ANALYSIS OF FINANCIAL CONDITION AND RESULTS OF OPERATIONS (Continued)
Revenue in the Asia-Pacific region increased 2% compared to 2008, while revenue in the Europe, Japan, and Americas regions decreased by 26%, 15%, and 4%, respectively, compared to 2008.
Our overall gross margin dollars for 2009 decreased $1.3 billion, or 6%, compared to 2008. Our overall gross margin percentage increased slightly to 55.7% in 2009 from 55.5% in 2008. The slight increase in gross margin percentage was primarily attributable to the gross margin percentage increases in the NAND Solutions Group and Data Center Group operating segments offset by the gross margin percentage decrease in the PC Client Group operating segment. We derived a substantial majority of our overall gross margin dollars in 2009, and most of our overall gross margin dollars in 2008, from the sales of microprocessors in the PC Client Group and Data Center Group operating segments. See "Business Outlook" for a discussion of gross margin expectations.
Our net revenue for 2008 decreased 2% compared to 2007. Higher revenue from the sale of microprocessors and chipsets was more than offset by the impacts of divestitures and lower revenue from the sale of motherboards. Revenue from the sale of NOR flash memory and cellular baseband products declined $1.7 billion, primarily as a result of divestiture of these businesses. Revenue in the Americas region decreased 4% in 2008 compared to 2007. Revenue in the Asia-Pacific, Europe, and Japan regions remained approximately flat in 2008 compared to 2007.
Our overall gross margin dollars for 2008 were $20.8 billion, an increase of $940 million, or 5%, compared to 2007. Our overall gross margin percentage increased to 55.5% in 2008 from 51.9% in 2007. The increase in gross margin percentage was primarily attributable to the gross margin percentage increase in the PC Client Group operating segment and, to a lesser extent, the gross margin percentage increase in the Data Center Group operating segment. In addition, our gross margin percentage increased due to the divestiture of our NOR flash memory business. We derived most of our overall gross margin dollars in 2008 and 2007 from the sale of microprocessors in the PC Client Group and Data Center Group operating segments.
PC Client Group
The revenue and operating income for the PC Client Group (PCCG) for the three years ended December 26, 2009 were as follows:
(In Millions) | 2009 | 2008 | 2007 | |||||||||
Microprocessor revenue | $ | 19,914 | $ | 21,516 | $ | 21,053 | ||||||
Chipset, motherboard, and other revenue | 6,261 | 6,450 | 6,077 | |||||||||
Net revenue | $ | 26,175 | $ | 27,966 | $ | 27,130 | ||||||
Operating income | $ | 7,585 | $ | 9,419 | $ | 8,535 | ||||||
Net revenue for the PCCG operating segment decreased by $1.8 billion, or 6%, in 2009 compared to 2008. Microprocessors and chipsets within PCCG include those designed for the notebook, netbook, and desktop computing market segments. The decrease in microprocessor revenue was primarily due to lower notebook microprocessor average selling prices, and lower desktop microprocessor unit sales and average selling prices. These decreases were partially offset by a significant increase in netbook microprocessor unit sales due to the ramp of Intel Atom processors. The decrease in chipset, motherboard, and other revenue was primarily due to lower chipset average selling prices and lower unit sales of wireless connectivity products, partially offset by higher chipset unit sales.
Operating income decreased by $1.8 billion, or 19%, in 2009 compared to 2008. The decrease was primarily due to lower revenue and approximately $810 million of higher factory underutilization charges, partially offset by lower chipset and microprocessor unit costs.
For 2008, net revenue for the PCCG operating segment increased slightly by $836 million, or 3%, compared to 2007. The increase in microprocessor revenue was primarily due to significantly higher notebook microprocessor unit sales, partially offset by significantly lower notebook microprocessor average selling prices. In addition, lower desktop microprocessor unit sales were partially offset by the ramp of Intel Atom processors. The increase in chipset, motherboard, and other revenue was primarily due to higher chipset unit sales, partially offset by lower desktop motherboard unit sales.
Operating income increased by $884 million, or 10%, in 2008 compared to 2007. The increase in operating income was primarily due to lower microprocessor and chipset unit costs, partially offset by lower desktop microprocessor and chipset revenue and higher operating expenses. In addition, approximately $230 million of lower start-up costs were offset by sales in 2007 of desktop microprocessors that had previously been written off, and higher write-offs of desktop microprocessor inventory in 2008.
33
MANAGEMENT'S DISCUSSION AND ANALYSIS OF FINANCIAL CONDITION AND RESULTS OF OPERATIONS (Continued)
Data Center Group
The revenue and operating income for the Data Center Group (DCG) for the three years ended December 26, 2009 were as follows:
(In Millions) | 2009 | 2008 | 2007 | |||||||||
Microprocessor revenue | $ | 5,301 | $ | 5,126 | $ | 4,796 | ||||||
Chipset, motherboard, and other revenue | 1,149 | 1,464 | 1,659 | |||||||||
Net revenue | $ | 6,450 | $ | 6,590 | $ | 6,455 | ||||||
Operating income | $ | 2,299 | $ | 2,135 | $ | 2,105 | ||||||
Net revenue for the DCG operating segment decreased slightly by $140 million, or 2%, in 2009 compared to 2008. The increase in microprocessor revenue was due to higher microprocessor average selling prices, partially offset by lower microprocessor unit sales. The decrease in chipset, motherboard, and other revenue was primarily due to lower chipset average selling prices.
Operating income increased by $164 million, or 8%, in 2009 compared to 2008. The increase in operating income was primarily due to higher microprocessor revenue and lower operating expenses, partially offset by approximately $150 million of higher start-up costs as well as lower chipset revenue.
For 2008, net revenue for the DCG operating segment increased slightly by $135 million, or 2%, compared to 2007. The increase in microprocessor revenue was due to higher microprocessor average selling prices. The decrease in chipset, motherboard, and other revenue was primarily due to lower motherboard unit sales.
Operating income was flat in 2008 compared to 2007. Higher revenue was mostly offset by higher operating expenses.
Other Intel Architecture Operating Segments
The revenue and operating income for the other Intel architecture operating segments (Other IA) for the three years ended December 26, 2009 were as follows:
(In Millions) | 2009 | 2008 | 2007 | |||||||||
Net revenue | $ | 1,402 | $ | 1,763 | $ | 1,908 | ||||||
Operating income (loss) | $ | (179 | ) | $ | (63 | ) | $ | 47 | ||||
Net revenue for the Other IA operating segments decreased by $361 million, or 20%, in 2009 compared to 2008, and operating loss for the Other IA operating segments increased by $116 million in 2009 compared to 2008. The changes were primarily due to lower revenue from the sale of communications products within the Embedded and Communications Group (ECG), primarily as a result of business divestitures.
For 2008, net revenue for the Other IA operating segments decreased by $145 million, or 8%, compared to 2007. The decrease was primarily due to lower revenue from the sale of communications products within ECG, primarily as a result of business divestitures, partially offset by higher ECG microprocessor unit sales. Operating income (loss) decreased by $110 million in 2008 compared to 2007. The decrease was primarily due to higher operating expenses within the Ultra-Mobility Group and, to a lesser extent, within the Digital Home Group.
34
MANAGEMENT'S DISCUSSION AND ANALYSIS OF FINANCIAL CONDITION AND RESULTS OF OPERATIONS (Continued)
Operating Expenses
Operating expenses for the three years ended December 26, 2009 were as follows:
(In Millions) | 2009 | 2008 | 2007 | |||||||||
Research and development | $ | 5,653 | $ | 5,722 | $ | 5,755 | ||||||
Marketing, general and administrative | $ | 7,931 | $ | 5,452 | $ | 5,401 | ||||||
Restructuring and asset impairment charges | $ | 231 | $ | 710 | $ | 516 | ||||||
Amortization of acquisition-related intangibles | $ | 35 | $ | 6 | $ | 16 | ||||||
Research and Development. R&D spending was flat in 2009 compared to 2008, and was flat in 2008 compared to 2007. In 2009 compared to 2008, we had lower process development costs as we transitioned from R&D to manufacturing using our 32nm process technology. This decrease was offset by higher profit-dependent compensation expenses. In 2008 compared to 2007, we had lower product development expenses resulting from our divested businesses and slightly lower profit-dependent compensation. These decreases were offset by higher process development costs as we transitioned from manufacturing start-up costs related to our 45nm process technology to R&D of our 32nm process technology.
Marketing, General and Administrative. Marketing, general and administrative expenses increased $2.5 billion, or 45%, in 2009 compared to 2008, and were flat in 2008 compared to 2007. The increase in 2009 compared to 2008 was due to the charge of $1.447 billion incurred as a result of the fine imposed by the European Commission (EC) and the $1.25 billion payment to AMD as part of a settlement agreement (see "Note 28: Contingencies" in Part II, Item 8 of this Form 10-K). To a lesser extent, we had higher profit-dependent compensation expenses that were partially offset by lower advertising expenses, including cooperative advertising expenses. In 2008 compared to 2007, we had higher legal expenses that were offset by lower profit-dependent compensation and lower advertising expenses.
R&D, combined with marketing, general and administrative expenses, were 39% of net revenue in 2009, 30% of net revenue in 2008, and 29% of net revenue in 2007.
Restructuring and Asset Impairment Charges. The following table summarizes restructuring and asset impairment charges by plan for the three years ended December 26, 2009:
(In Millions) | 2009 | 2008 | 2007 | |||||||||
2009 restructuring program | $ | 215 | $ | - | $ | - | ||||||
2008 NAND plan | - | 215 | - | |||||||||
2006 efficiency program | 16 | 495 | 516 | |||||||||
Total restructuring and asset impairment charges | $ | 231 | $ | 710 | $ | 516 | ||||||
2009 Restructuring Program
In the first quarter of 2009, management approved plans to restructure some of our manufacturing and assembly and test operations. These plans included closing two assembly and test facilities in Malaysia, one facility in the Philippines, and one facility in China; stopping production at a 200mm wafer fabrication facility in Oregon; and ending production at our 200mm wafer fabrication facility in California. We do not expect significant future charges related to the 2009 plan. The following table summarizes charges for the 2009 restructuring plan during 2009:
(In Millions) | 2009 | |||
Employee severance and benefit arrangements | $ | 208 | ||
Asset impairments | 7 | |||
Total restructuring and asset impairment charges | $ | 215 | ||
35
MANAGEMENT'S DISCUSSION AND ANALYSIS OF FINANCIAL CONDITION AND RESULTS OF OPERATIONS (Continued)
The following table summarizes the restructuring and asset impairment activity for the 2009 restructuring plan during 2009:
| Employee | ||||||||||||
| Severance | Asset | |||||||||||
(In Millions) | and Benefits | Impairments | Total | |||||||||
Accrued restructuring balance as of December 27, 2008 | $ | - | $ | - | $ | - | ||||||
Additional accruals | 223 | 7 | 230 | |||||||||
Adjustments | (15 | ) | - | (15 | ) | |||||||
Cash payments | (182 | ) | - | (182 | ) | |||||||
Non-cash settlements | - | (7 | ) | (7 | ) | |||||||
Accrued restructuring balance as of December 26, 2009 | $ | 26 | $ | - | $ | 26 | ||||||
The net charges above include $208 million that relate to employee severance and benefit arrangements for 6,500 employees, of which 5,400 employees had left the company as of December 26, 2009. Most of these employee actions occurred within manufacturing.
We estimate that these employee severance and benefit charges will result in gross annual savings of approximately $290 million. The substantial majority of the savings will be realized within cost of sales.
2008 NAND Plan
In the fourth quarter of 2008, management approved a plan with Micron to discontinue the supply of NAND flash memory from the 200mm facility within the IMFT manufacturing network. The agreement resulted in a $215 million restructuring charge, primarily related to the IMFT 200mm supply agreement. The restructuring charge resulted in a reduction of our investment in IMFT/IMFS of $184 million, a cash payment to Micron of $24 million, and other cash payments of $7 million. The 2008 NAND plan was completed at the end of 2008.
2006 Efficiency Program
In the third quarter of 2006, management approved several actions as part of a restructuring plan designed to improve operational efficiency and financial results. The following table summarizes charges for the 2006 efficiency program for the three years ended December 26, 2009:
(In Millions) | 2009 | 2008 | 2007 | |||||||||
Employee severance and benefit arrangements | $ | 8 | $ | 151 | $ | 289 | ||||||
Asset impairments | 8 | 344 | 227 | |||||||||
Total restructuring and asset impairment charges | $ | 16 | $ | 495 | $ | 516 | ||||||
During 2006, as part of our assessment of our worldwide manufacturing capacity operations, we placed for sale our fabrication facility in Colorado Springs, Colorado. As a result of placing the facility for sale, in 2006 we recorded a $214 million impairment charge to write down to fair value the land, building, and equipment. We incurred $54 million in additional asset impairment charges as a result of market conditions related to the Colorado Springs facility during 2007 and additional charges in 2008. We sold the Colorado Springs facility in 2009.
In addition, during 2007 we recorded land and building write-downs related to certain facilities in Santa Clara, California. We also incurred $85 million in asset impairment charges related to assets that we sold in conjunction with the divestiture of our NOR flash memory business in 2007 and an additional $275 million in 2008. We determined the impairment charges based on the fair value, less selling costs, that we expected to receive upon completion of the divestiture in 2007, and determined the impairment charges using the revised fair value of the equity and note receivable that we received upon completion of the divestiture, less selling costs, in 2008. For further information on this divestiture, see "Note 16: Divestitures" in Part II, Item 8 of this Form 10-K.
36
MANAGEMENT'S DISCUSSION AND ANALYSIS OF FINANCIAL CONDITION AND RESULTS OF OPERATIONS (Continued)
The following table summarizes the restructuring and asset impairment activity for the 2006 efficiency program during 2008 and 2009:
| Employee | ||||||||||||
| Severance | Asset | |||||||||||
(In Millions) | and Benefits | Impairments | Total | |||||||||
Accrued restructuring balance as of December 29, 2007 | $ | 127 | $ | - | $ | 127 | ||||||
Additional accruals | 167 | 344 | 511 | |||||||||
Adjustments | (16 | ) | - | (16 | ) | |||||||
Cash payments | (221 | ) | - | (221 | ) | |||||||
Non-cash settlements | - | (344 | ) | (344 | ) | |||||||
Accrued restructuring balance as of December 27, 2008 | $ | 57 | $ | - | $ | 57 | ||||||
Additional accruals | 18 | 8 | 26 | |||||||||
Adjustments | (10 | ) | - | (10 | ) | |||||||
Cash payments | (65 | ) | - | (65 | ) | |||||||
Non-cash settlements | - | (8 | ) | (8 | ) | |||||||
Accrued restructuring balance as of December 26, 2009 | $ | - | $ | - | $ | - | ||||||
We recorded the additional accruals, net of adjustments, as restructuring and asset impairment charges. The 2006 efficiency plan is complete.
From the third quarter of 2006 through 2009, we incurred a total of $1.6 billion in restructuring and asset impairment charges related to this program. These charges included a total of $686 million related to employee severance and benefit arrangements for 11,300 employees. A substantial majority of these employee actions affected employees within manufacturing, information technology, and marketing. The restructuring and asset impairment charges also included $896 million in asset impairment charges.
We estimate that the total employee severance and benefit charges incurred as part of the 2006 efficiency program result in gross annual savings of approximately $1.1 billion. We are realizing these savings within marketing, general and administrative; cost of sales; and R&D.
Amortization of acquisition-related intangibles. The increase of $29 million was due to amortization of intangibles primarily related to the acquisition of Wind River Systems completed in the third quarter of 2009. See "Note 15: Acquisitions" in Part II, Item 8 of this Form 10-K.
Share-Based Compensation
Share-based compensation totaled $889 million in 2009, $851 million in 2008, and $952 million in 2007. Share-based compensation was included in cost of sales and operating expenses.
As of December 26, 2009, unrecognized share-based compensation costs and the weighted average periods over which the costs are expected to be recognized were as follows:
| Unrecognized | ||||||
| Share-Based | Weighted | |||||
| Compensation | Average | |||||
(Dollars in Millions) | Costs | Period | ||||
Stock options | $ | 282 | 1.3 years | |||
Restricted stock units | $ | 1,196 | 1.4 years | |||
Stock purchase plan | $ | 9 | 1 month | |||
37
MANAGEMENT'S DISCUSSION AND ANALYSIS OF FINANCIAL CONDITION AND RESULTS OF OPERATIONS (Continued)
Gains (Losses) on Equity Method Investments, Net
Gains (losses) on equity method investments, net were as follows:
(In Millions) | 2009 | 2008 | 2007 | |||||||||
Equity method losses, net | $ | (131 | ) | $ | (316 | ) | $ | (103 | ) | |||
Impairment charges | (42 | ) | (1,077 | ) | (28 | ) | ||||||
Other, net | 26 | 13 | 134 | |||||||||
Total gains (losses) on equity method investments, net | $ | (147 | ) | $ | (1,380 | ) | $ | 3 | ||||
Impairment charges in 2008 included a $762 million impairment charge recognized on our investment in Clearwire LLC and a $250 million impairment charge recognized on our investment in Numonyx. We recognized the impairment charge on our investment in Clearwire LLC to write down our investment to its fair value, primarily due to the fair value being significantly lower than the cost basis of our investment in the fourth quarter of 2008. The impairment charge on our investment in Numonyx was due to a general decline in 2008 in the NOR flash memory market segment. Our equity method losses were primarily related to Numonyx ($31 million in 2009 and $87 million in 2008), Clearwire LLC ($27 million in 2009), and Clearwire Corporation ($184 million in 2008 and $104 million in 2007). See "Note 11: Non-Marketable Equity Investments" in Part II, Item 8 of this Form 10-K. During 2007, we recognized $110 million of income due to the reorganization of one of our investments, included within "Other, net" in the table above.
Gains (Losses) on Other Equity Investments, Net
Gains (losses) on other equity investments, net were as follows:
(In Millions) | 2009 | 2008 | 2007 | |||||||||
Impairment charges | $ | (179 | ) | $ | (455 | ) | $ | (92 | ) | |||
Gains on sales, net | 55 | 60 | 204 | |||||||||
Other, net | 101 | 19 | 42 | |||||||||
Total gains (losses) on other equity investments, net | $ | (23 | ) | $ | (376 | ) | $ | 154 | ||||
Impairment charges in 2008 included a $176 million impairment charge recognized on our investment in Clearwire Corporation and $97 million of impairment charges on our investment in Micron. The impairment charge on our investment in Clearwire Corporation was due to the fair value being significantly lower than the cost basis of our investment at the end of the fourth quarter of 2008. The impairment charges on our investment in Micron reflected the difference between our cost basis and the fair value of our investment in Micron at the end of the second and third quarters of 2008. In addition, we recognized higher gains on equity derivatives in 2009 compared to 2008.
Interest and Other, Net
The components of interest and other, net were as follows:
(In Millions) | 2009 | 2008 | 2007 | |||||||||
Interest income | $ | 168 | $ | 592 | $ | 804 | ||||||
Interest expense | (1 | ) | (8 | ) | (15 | ) | ||||||
Other, net | (4 | ) | (96 | ) | 4 | |||||||
Total interest and other, net | $ | 163 | $ | 488 | $ | 793 | ||||||
We recognized lower interest income in 2009 compared to 2008 as a result of lower interest rates. The average interest rate earned during 2009 decreased by 2.4 percentage points compared to 2008. In addition, lower gains on divestitures (zero in 2009 and $59 million in 2008) were more than offset by $70 million of fair value gains in 2009 on our trading assets, compared to $130 million of fair value losses in 2008.
38
MANAGEMENT'S DISCUSSION AND ANALYSIS OF FINANCIAL CONDITION AND RESULTS OF OPERATIONS (Continued)
Interest and other, net decreased in 2008 compared to 2007 due to lower interest income and fair value losses that we experienced in 2008 on our trading assets. Interest income was lower in 2008 compared to 2007 as a result of lower interest rates, partially offset by higher average investment balances. The average interest rate earned during 2008 decreased by 1.9 percentage points compared to 2007.
Provision for Taxes
Our provision for taxes and effective tax rate were as follows:
(Dollars in Millions) | 2009 | 2008 | 2007 | |||||||||
Income before taxes | $ | 5,704 | $ | 7,686 | $ | 9,166 | ||||||
Provision for taxes | $ | 1,335 | $ | 2,394 | $ | 2,190 | ||||||
Effective tax rate | 23.4 | % | 31.1 | % | 23.9 | % | ||||||
We generated a higher percentage of our profits from lower tax jurisdictions in 2009 compared to 2008. In addition, the 2009 tax rate was positively impacted by the reversal of previously accrued taxes of $366 million on settlements, effective settlements, and related remeasurements of various uncertain tax positions compared to a reversal of $103 million for such matters in 2008. These impacts were partially offset by the recognition of the EC fine of $1.447 billion with no associated tax benefit. In addition, our 2008 effective tax rate was negatively impacted by the recognition of a valuation allowance on our deferred tax assets due to the uncertainty of realizing tax benefits related to impairments of our equity investments.
Our effective income tax rate increased in 2008 compared to 2007, primarily due to the recognition of a valuation allowance on our deferred tax assets due to the uncertainty of realizing tax benefits related to impairments of our equity investments. In addition, the rate increased in 2008 compared to 2007, due to the reversal of previously accrued taxes of $481 million (including $50 million of accrued interest) related to settlements with the U.S. Internal Revenue Service (IRS) in the first and second quarters of 2007.
Business Outlook
Our future results of operations and the topics of other forward-looking statements contained in this Form 10-K, including this MD&A, involve a number of risks and uncertainties-in particular:
| • | changes in business and economic conditions; | |
| • | revenue and pricing; | |
| • | gross margin and costs; | |
| • | pending legal proceedings; | |
| • | our effective tax rate (including changes in unrecognized tax positions); | |
| • | marketing, general and administrative expenses; | |
| • | our goals and strategies; | |
| • | new product introductions; |
| • | plans to cultivate new businesses; | |
| • | R&D expenses; | |
| • | divestitures or investments; | |
| • | net gains (losses) from equity investments; | |
| • | interest and other, net; | |
| • | capital spending; | |
| • | depreciation; and | |
| • | impairment of investments. |
In addition to the various important factors discussed above, a number of other important factors could cause actual results to differ materially from our expectations. See the risks described in "Risk Factors" in Part I, Item 1A of this Form 10-K.
Our expectations for 2010 are as follows:
| • | Gross Margin Percentage. 61%, plus or minus three points. The 61% midpoint is higher than our 2009 gross margin of 55.7%, primarily due to lower manufacturing period costs, mostly factory underutilization charges. In addition, we expect lower unit costs and higher unit sales, partially offset by lower average selling prices. | |
| • | Total Spending. We expect spending on R&D, plus marketing, general and administrative expenses, in 2010 to be approximately $11.8 billion, plus or minus $100 million, compared to $13.6 billion in 2009. Total spending in 2009 included charges of $1.447 billion incurred as a result of the fine imposed by the EC and $1.25 billion as a result of our legal settlement with AMD. | |
| • | Research and Development Spending. Approximately $6.2 billion compared to $5.7 billion in 2009. | |
| • | Capital Spending. Approximately $4.8 billion, plus or minus $100 million, compared to $4.5 billion in 2009. | |
| • | Depreciation. Approximately $4.4 billion, plus or minus $100 million, compared to $4.7 billion in 2009. | |
| • | Tax Rate. Approximately 30%, compared to 23% in 2009. The estimated effective tax rate is based on tax law in effect as of December 26, 2009 and expected income. |
39
MANAGEMENT'S DISCUSSION AND ANALYSIS OF FINANCIAL CONDITION AND RESULTS OF OPERATIONS (Continued)
Status of Business Outlook
We expect that our corporate representatives will, from time to time, meet privately with investors, investment analysts, the media, and others, and may reiterate the forward-looking statements contained in the "Business Outlook" section and elsewhere in this Form 10-K, including any such statements that are incorporated by reference in this Form 10-K. At the same time, we will keep this Form 10-K and our most current business outlook publicly available on our Investor Relations web site at www.intc.com . The public can continue to rely on the business outlook published on the web site as representing our current expectations on matters covered, unless we publish a notice stating otherwise. The statements in the "Business Outlook" section and other forward-looking statements in this Form 10-K are subject to revision during the course of the year in our quarterly earnings releases and SEC filings and at other times.
From the close of business on February 26, 2010 until our quarterly earnings release is published, presently scheduled for April 13, 2010, we will observe a "quiet period." During the quiet period, the "Business Outlook" section and other forward-looking statements first published in our Form 8-K filed on January 14, 2010, as reiterated or updated as applicable in this Form 10-K, should be considered historical, speaking as of prior to the quiet period only and not subject to update. During the quiet period, our representatives will not comment on our business outlook or our financial results or expectations. The exact timing and duration of the routine quiet period, and any others that we utilize from time to time, may vary at our discretion.
40
MANAGEMENT'S DISCUSSION AND ANALYSIS OF FINANCIAL CONDITION AND RESULTS OF OPERATIONS (Continued)
Liquidity and Capital Resources
(Dollars in Millions) | Dec. 26, 2009 | Dec. 27, 2008 | ||||||
Cash and cash equivalents, debt instruments included in trading assets, and short-term investments | $ | 13,920 | $ | 11,544 | ||||
Loans receivable and other long-term investments | $ | 4,528 | $ | 2,924 | ||||
Short-term and long-term debt | $ | 2,221 | $ | 1,287 | ||||
Debt as % of stockholders' equity | 5.3 | % | 3.3 | % | ||||
Sources
and Uses of Cash
(In
Millions)
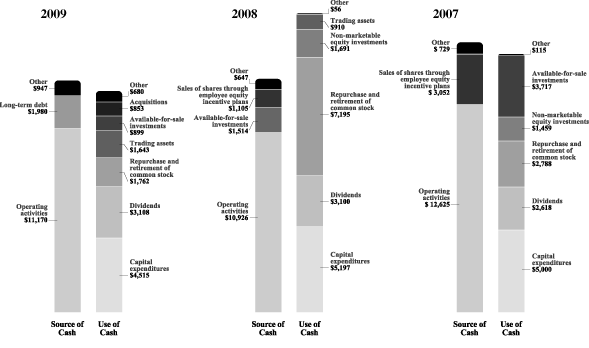
In summary, our cash flows were as follows:
(In Millions) | 2009 | 2008 | 2007 | |||||||||
Net cash provided by operating activities | $ | 11,170 | $ | 10,926 | $ | 12,625 | ||||||
Net cash used for investing activities | (7,965 | ) | (5,865 | ) | (9,926 | ) | ||||||
Net cash used for financing activities | (2,568 | ) | (9,018 | ) | (1,990 | ) | ||||||
Net increase (decrease) in cash and cash equivalents | $ | 637 | $ | (3,957 | ) | $ | 709 | |||||
41
MANAGEMENT'S DISCUSSION AND ANALYSIS OF FINANCIAL CONDITION AND RESULTS OF OPERATIONS (Continued)
Operating Activities
Cash provided by operating activities is net income adjusted for certain non-cash items and changes in certain assets and liabilities. For 2009 compared to 2008, the $244 million increase in cash provided by operating activities was primarily due to changes in assets and liabilities, partially offset by lower net income. Income taxes paid, net of refunds in 2009 compared to 2008 were $3.1 billion lower on lower income before taxes and timing of payments.
Changes in assets and liabilities for 2009 compared to 2008 included the following:
| • | Inventories decreased due to lower chipset and raw materials inventory. | |
| • | Accounts payable decreased due to timing of payments, despite higher production spending. | |
| • | Accounts receivable increased due to higher revenue and a higher proportion of sales at the end of the fourth quarter of 2009. | |
| • | Accrued compensation and benefits increased due to higher accrued profit-dependent compensation. |
For 2009 and 2008, our two largest customers accounted for 38% of our net revenue, with one of these customers accounting for 21% of our net revenue in 2009 (20% in 2008), and another customer accounting for 17% of our net revenue in 2009 (18% in 2008). These two largest customers accounted for 41% of our accounts receivable as of December 26, 2009 and December 27, 2008.
For 2008 compared to 2007, the $1.7 billion decrease in cash provided by operating activities was primarily due to the $1.7 billion decrease in net income, while total adjustments to reconcile net income to cash provided by operating activities, including net changes in assets and liabilities, were approximately flat. Effective 2008, cash flows related to marketable debt instruments classified as trading assets are included in investing activities.
Investing Activities
Investing cash flows consist primarily of capital expenditures, net investment purchases, maturities, disposals, and cash used for acquisitions.
The increase in cash used for investing activities in 2009 compared to 2008 was primarily due to an increase in net purchases of available-for-sale investments and trading assets, and higher cash paid for acquisitions. These increases were partially offset by a decrease in investments in non-marketable equity investments. Our investments in non-marketable equity investments in 2008 included $1.0 billion for an ownership interest in Clearwire LLC.
Our capital expenditures were $4.5 billion in 2009 ($5.2 billion in 2008 and $5.0 billion in 2007). Capital expenditures for 2010 are currently expected to be higher than our 2009 expenditures and are expected to be funded by cash flows from operating activities.
The decrease in cash used in investing activities in 2008 compared to 2007 was primarily due to a decrease in purchases of available-for-sale debt investments. In addition, the related cash flows for marketable debt instruments classified as trading assets were included in investing activities for 2008, and previously they had been included in operating activities.
Financing Activities
Financing cash flows consist primarily of repurchases and retirement of common stock, payment of dividends to stockholders, issuance of long-term debt, and proceeds from the sale of shares through employee equity incentive plans.
42
MANAGEMENT'S DISCUSSION AND ANALYSIS OF FINANCIAL CONDITION AND RESULTS OF OPERATIONS (Continued)
The decrease in cash used in financing activities in 2009 compared to 2008 was primarily due to a decrease in repurchases and retirement of common stock and the issuance of long-term debt, partially offset by lower proceeds from sales of shares through employee equity incentive plans. We used the majority of the proceeds from the 2009 issuance of long-term debt to repurchase and retire common stock. During 2009, we repurchased $1.8 billion of common stock compared to $7.2 billion in 2008. As of December 26, 2009, $5.7 billion remained available for repurchase under the existing repurchase authorization of $25 billion. We base our level of common stock repurchases on internal cash management decisions, and this level may fluctuate. Proceeds from the sale of shares through employee equity incentive plans totaled $400 million in 2009 compared to $1.1 billion in 2008 as a result of a lower volume of employee exercises of stock options. Our total dividend payments in 2009 remained flat from 2008 at $3.1 billion. We have paid a cash dividend in each of the past 69 quarters. In January 2010, our Board of Directors declared a cash dividend of $0.1575 per common share for the first quarter of 2010. The dividend is payable on March 1, 2010 to stockholders of record on February 7, 2010.
The higher cash used in financing activities in 2008 compared to 2007 was primarily due to an increase in repurchases and retirement of common stock, and lower proceeds from the sale of shares pursuant to employee equity incentive plans.
Liquidity
Cash generated by operations is used as our primary source of liquidity. As of December 26, 2009, cash and cash equivalents, debt instruments included in trading assets, and short-term investments totaled $13.9 billion. In addition to the $13.9 billion, we have $4.5 billion in loans receivable and other long-term investments that we include when assessing our investment portfolio.
The credit quality of our investment portfolio remains high, with credit-related other-than-temporary impairment losses on our available-for-sale debt instruments limited to less than $55 million cumulatively since the beginning of 2008. In addition, we continue to be able to invest in high-credit-quality investments. Substantially all of our investments in debt instruments are with A/A2 or better rated issuers, and a substantial majority of the issuers are rated AA-/Aa3 or better.
As of December 26, 2009, cumulative unrealized gains, net of corresponding hedging activities, related to debt instruments classified as trading assets, and cumulative unrealized gains related to debt instruments classified as available-for-sale, were insignificant. As of December 27, 2008, our cumulative unrealized losses, net of corresponding hedging activities, related to debt instruments classified as trading assets were $145 million. As of December 27, 2008, our cumulative unrealized losses related to debt instruments classified as available-for-sale were $215 million.
Our commercial paper program provides another potential source of liquidity. We have an ongoing authorization from our Board of Directors to borrow up to $3.0 billion, including through the issuance of commercial paper. Maximum borrowings under our commercial paper program during 2009 were $610 million, although no commercial paper remained outstanding as of December 26, 2009. Our commercial paper was rated A-1+ by Standard & Poor's and P-1 by Moody's as of December 26, 2009. We also have an automatic shelf registration statement on file with the SEC pursuant to which we may offer an unspecified amount of debt, equity, and other securities.
We believe that we have the financial resources needed to meet business requirements for the next 12 months, including capital expenditures for worldwide manufacturing and assembly and test, working capital requirements, and potential dividends, common stock repurchases, and acquisitions or strategic investments.
Fair Value of Financial Instruments
Fair value is the price that would be received from selling an asset or paid to transfer a liability in an orderly transaction between market participants at the measurement date. When determining fair value, we consider the principal or most advantageous market in which we would transact, and we consider assumptions that market participants would use when pricing the asset or liability. See "Note 5: Fair Value" in Part II, Item 8 of this Form 10-K.
Credit risk is factored into the valuation of financial instruments that we measure and record at fair value on a recurring basis. When fair value is determined using observable market prices, the credit risk is incorporated into the market price of the financial instrument. When fair value is determined using pricing models, such as a discounted cash flow model, the issuer's credit risk and/or Intel's credit risk is factored into the calculation of the fair value, as appropriate.
43
MANAGEMENT'S DISCUSSION AND ANALYSIS OF FINANCIAL CONDITION AND RESULTS OF OPERATIONS (Continued)
Marketable Debt Instruments
As of December 26, 2009, our assets measured and recorded at fair value on a recurring basis included $17.5 billion of marketable debt instruments. Of these instruments, $657 million was classified as Level 1, $15.8 billion as Level 2, and $1.1 billion as Level 3.
When available, we use observable market prices for identical securities to value our marketable debt instruments. If observable market prices are not available, we use non-binding market consensus prices that we seek to corroborate with observable market data, if available, or unobservable market data. When prices from multiple sources are available for a given instrument, we use observable market quotes to price our instruments, in lieu of prices from other sources.
Our balance of marketable debt instruments that are measured and recorded at fair value on a recurring basis and classified as Level 1 was classified as such due to the usage of observable market prices for identical securities that are traded in active markets. Marketable debt instruments in this category generally include certain of our corporate bonds, government bonds, and money market fund deposits. Management judgment was required to determine the levels at which sufficient volume and frequency of transactions are met for a market to be considered active. Our assessment of an active market for our marketable debt instruments generally takes into consideration activity during each week of the one-month period prior to the valuation date of each individual instrument, including the number of days each individual instrument trades and the average weekly trading volume in relation to the total outstanding amount of the issued instrument.
Approximately 10% of our balance of marketable debt instruments that are measured and recorded at fair value on a recurring basis and classified as Level 2 was classified as such due to the usage of observable market prices for identical securities that are traded in less active markets. When observable market prices for identical securities are not available, we price our marketable debt instruments using non-binding market consensus prices that are corroborated with observable market data; quoted market prices for similar instruments; or pricing models, such as a discounted cash flow model, with all significant inputs derived from or corroborated with observable market data. Non-binding market consensus prices are based on the proprietary valuation models of pricing providers or brokers. These valuation models incorporate a number of inputs, including non-binding and binding broker quotes; observable market prices for identical and/or similar securities; and the internal assumptions of pricing providers or brokers that use observable market inputs and, to a lesser degree, unobservable market inputs. We corroborate the non-binding market consensus prices with observable market data using statistical models when observable market data exists. The discounted cash flow model uses observable market inputs, such as LIBOR-based yield curves, currency spot and forward rates, and credit ratings. Approximately 40% of our balance of marketable debt instruments that are measured and recorded at fair value on a recurring basis and classified as Level 2 was classified as such due to the usage of non-binding market consensus prices that are corroborated with observable market data, and approximately 50% due to the usage of a discounted cash flow model. Marketable debt instruments classified as Level 2 generally include commercial paper, bank time deposits, municipal bonds, certain of our money market fund deposits, and a majority of corporate bonds and government bonds.
Our marketable debt instruments that are measured and recorded at fair value on a recurring basis and classified as Level 3 were classified as such due to the lack of observable market data to corroborate either the non-binding market consensus prices or the non-binding broker quotes. When observable market data is not available, we corroborate the non-binding market consensus prices and non-binding broker quotes using unobservable data, if available. Marketable debt instruments in this category generally include asset-backed securities and certain of our corporate bonds. All of our investments in asset-backed securities were classified as Level 3, and substantially all of them were valued using non-binding market consensus prices that we were not able to corroborate with observable market data due to the lack of transparency in the market for asset-backed securities.
Equity Securities
As of December 26, 2009, our portfolio of assets measured and recorded at fair value on a recurring basis included $773 million of marketable equity securities. Of these securities, $676 million was classified as Level 1 because the valuations were based on quoted prices for identical securities in active markets. Our assessment of an active market for our marketable equity securities generally takes into consideration activity during each week of the one-month period prior to the valuation date for each individual security, including the number of days each individual equity security trades and the average weekly trading volume in relation to the total outstanding shares of that security. The remaining marketable equity securities of $97 million were classified as Level 2 because their valuations were either based on quoted prices for identical securities in less active markets or adjusted for security-specific restrictions.
44
MANAGEMENT'S DISCUSSION AND ANALYSIS OF FINANCIAL CONDITION AND RESULTS OF OPERATIONS (Continued)
Contractual Obligations
The following table summarizes our significant contractual obligations as of December 26, 2009:
| Payments Due by Period | ||||||||||||||||||||
| Less Than | More Than | |||||||||||||||||||
(In Millions) | Total | 1 Year | 1–3 Years | 3–5 Years | 5 Years | |||||||||||||||
Operating lease obligations | $ | 349 | $ | 102 | $ | 149 | $ | 60 | $ | 38 | ||||||||||
Capital purchase obligations 1 | 1,836 | 1,760 | 76 | - | - | |||||||||||||||
Other purchase obligations and commitments 2 | 866 | 290 | 403 | 48 | 125 | |||||||||||||||
Long-term debt obligations 3 | 7,253 | 284 | 238 | 238 | 6,493 | |||||||||||||||
Other long-term liabilities 4, 5 | 593 | 230 | 153 | 97 | 113 | |||||||||||||||
Total 6 | $ | 10,897 | $ | 2,666 | $ | 1,019 | $ | 443 | $ | 6,769 | ||||||||||
| 1 | Capital purchase obligations represent commitments for the construction or purchase of property, plant and equipment. They were not recorded as liabilities on our consolidated balance sheets as of December 26, 2009, as we had not yet received the related goods or taken title to the property. Capital purchase obligations decreased from $2.9 billion as of December 27, 2008 to $1.8 billion as of December 26, 2009, primarily due to the timing of the ramp of our latest silicon process technology. | |
| 2 | Other purchase obligations and commitments include payments due under various types of licenses and agreements to purchase raw materials or other goods, as well as payments due under non-contingent funding obligations. Funding obligations include, for example, agreements to fund various projects with other companies. | |
| 3 | Amounts represent principal and interest cash payments over the life of the debt obligations, including anticipated interest payments that are not recorded on our consolidated balance sheets. Any future settlement of convertible debt would impact our cash payments. | |
| 4 | We are unable to reliably estimate the timing of future payments related to uncertain tax positions; therefore, $193 million of long-term income taxes payable has been excluded from the table above. However, long-term income taxes payable, included on our consolidated balance sheets, included these uncertain tax positions, reduced by the associated federal deduction for state taxes and U.S. tax credits arising from non-U.S. income. | |
| 5 | Amounts represent future cash payments to satisfy other long-term liabilities recorded on our consolidated balance sheets, including the short-term portion of these long-term liabilities. Expected contributions to our U.S. and non-U.S. pension plans and other postretirement benefit plans of $60 million to be made during 2010 are also included; however, funding projections beyond 2010 are not practical to estimate. | |
| 6 | Total generally excludes contractual obligations already recorded on our consolidated balance sheets as current liabilities. |
Contractual obligations for purchases of goods or services generally include agreements that are enforceable and legally binding on Intel and that specify all significant terms, including fixed or minimum quantities to be purchased; fixed, minimum, or variable price provisions; and the approximate timing of the transaction. The table above also includes agreements to purchase raw materials that have cancellation provisions requiring little or no payment. The amounts under such contracts are included in the table above because management believes that cancellation of these contracts is unlikely and expects to make future cash payments according to the contract terms or in similar amounts for similar materials. For other obligations with cancellation provisions, the amounts included in the table above were limited to the non-cancelable portion of the agreement terms and/or the minimum cancellation fee.
We have entered into certain agreements for the purchase of raw materials or other goods that specify minimum prices and quantities based on a percentage of the total available market or based on a percentage of our future purchasing requirements. Due to the uncertainty of the future market and our future purchasing requirements, obligations under these agreements are not included in the table above. We estimate our obligation under these agreements as of December 26, 2009 to be approximately as follows: less than one year-$364 million; one to three years-$3 million; more than three years-zero. Our purchase orders for other products are based on our current manufacturing needs and are fulfilled by our vendors within short time horizons. In addition, some of our purchase orders represent authorizations to purchase rather than binding agreements.
45
MANAGEMENT'S DISCUSSION AND ANALYSIS OF FINANCIAL CONDITION AND RESULTS OF OPERATIONS (Continued)
Contractual obligations that are contingent upon the achievement of certain milestones are not included in the table above. These obligations include contingent funding/payment obligations and milestone-based equity investment funding. These arrangements are not considered contractual obligations until the milestone is met by the third party. Assuming that all future milestones are met, additional required payments related to these obligations were not significant as of December 26, 2009.
For the majority of restricted stock units granted, the number of shares issued on the date the restricted stock units vest is net of the minimum statutory withholding requirements that we pay in cash to the appropriate taxing authorities on behalf of our employees. The obligation to pay the relative taxing authority is not included in the table above, as the amount is contingent upon continued employment. In addition, the amount of the obligation is unknown, as it is based in part on the market price of our common stock when the awards vest.
We have a contractual obligation to purchase the output of IMFT in proportion to our investments, 49% as of December 26, 2009. We also have several agreements with Micron related to intellectual property rights, and R&D funding related to NAND flash manufacturing and IMFT. The obligation to purchase our proportion of IMFT's inventory was $100 million as of December 26, 2009. See "Note 11: Non-Marketable Equity Investments" in Part II, Item 8 of this Form 10-K.
The expected timing of payments of the obligations above are estimates based on current information. Timing of payments and actual amounts paid may be different, depending on the time of receipt of goods or services, or changes to agreed-upon amounts for some obligations.
Off-Balance-Sheet Arrangements
As of December 26, 2009, with the exception of a guarantee for the repayment of $275 million in principal of the payment obligations of Numonyx under its senior credit facility, as well as accrued unpaid interest, expenses of the lenders, and penalties, we did not have any significant off-balance-sheet arrangements, as defined in Item 303(a)(4)(ii) of SEC Regulation S-K. In February 2010, we signed a definitive agreement with Micron and Numonyx under which Micron agreed to acquire Numonyx in an all-stock transaction. The senior credit facility that is supported by Intel's guarantee is expected to be repaid in full following the closing of this transaction. See "Note 11: Non-Marketable Equity Investments" in Part II, Item 8 of this Form 10-K.
46
| ITEM 7A. | QUANTITATIVE AND QUALITATIVE DISCLOSURES ABOUT MARKET RISK |
We use derivative financial instruments primarily to manage currency exchange rate and interest rate risk, and to a lesser extent, equity market and commodity price risk. All of the potential changes noted below are based on sensitivity analyses performed on our financial positions as of December 26, 2009 and December 27, 2008. Actual results may differ materially.
Currency Exchange Rates
We generally hedge currency risks of non-U.S.-dollar-denominated investments in debt instruments and loans receivable with offsetting currency forward contracts, currency options, or currency interest rate swaps. Gains and losses on these non-U.S.-currency investments would generally be offset by corresponding losses and gains on the related hedging instruments, resulting in a negligible net exposure to loss.
Substantially all of our revenue and a majority of our expense and capital purchasing activities are transacted in U.S. dollars. However, certain operating expenditures and capital purchases are incurred in or exposed to other currencies, primarily the Japanese yen, the euro, and the Israeli shekel. We have established balance sheet and forecasted transaction currency risk management programs to protect against fluctuations in fair value and the volatility of future cash flows caused by changes in exchange rates. We generally utilize currency forward contracts and, to a lesser extent, currency options in these hedging programs. Our hedging programs reduce, but do not always entirely eliminate, the impact of currency exchange rate movements (see "Risk Factors" in Part I, Item 1A of this Form 10-K). We considered the historical trends in currency exchange rates and determined that it was reasonably possible that a weighted average adverse change of 20% in currency exchange rates could be experienced in the near term. Such an adverse change, after taking into account hedges and offsetting positions, would have resulted in an adverse impact on income before taxes of less than $40 million as of December 26, 2009 (less than $55 million as of December 27, 2008).
Interest Rates
We are exposed to interest rate risk related to our investment portfolio and debt issuances. The primary objective of our investments in debt instruments is to preserve principal while maximizing yields. To achieve this objective, the returns on our investments in debt instruments are generally based on the U.S.-dollar three-month LIBOR. A hypothetical decrease in interest rates of 1.0% would have resulted in an increase in the fair value of our debt issuances of approximately $205 million as of December 26, 2009 (an increase of approximately $150 million as of December 27, 2008). A hypothetical decrease in interest rates of up to 1.0% would have resulted in an increase in the fair value of our investment portfolio of approximately $10 million as of December 26, 2009 (an increase of approximately $15 million as of December 27, 2008). These hypothetical decreases in interest rates, after taking into account hedges and offsetting positions, would have resulted in a decrease in the fair value of our net investment position of approximately $195 million as of December 26, 2009 and $135 million as of December 27, 2008. The fluctuations in fair value of our debt issuances and investment portfolio reflect only the direct impact of the change in interest rates. Other economic variables, such as equity market fluctuations and changes in relative credit risk, could result in a significantly higher decline in our net investment portfolio. For further information on how credit risk is factored into the valuation of our investment portfolio and debt issuances, see "Fair Value of Financial Instruments" in Part II, Item 7 of this Form 10-K.
Equity Prices
Our marketable equity investments include marketable equity securities and equity derivative instruments such as warrants and options. To the extent that our marketable equity securities have strategic value, we typically do not attempt to reduce or eliminate our equity market exposure through hedging activities; however, for our investments in strategic equity derivative instruments, including warrants, we may enter into transactions to reduce or eliminate the equity market risks. For securities that we no longer consider strategic, we evaluate legal, market, and economic factors in our decision on the timing of disposal and whether it is possible and appropriate to hedge the equity market risk.
We hold derivative instruments that seek to offset changes in liabilities related to the equity market risks of certain deferred compensation arrangements. The gains and losses from changes in fair value of these derivatives are designed to offset the gains and losses on the related liabilities, resulting in an insignificant net exposure to loss.
47
As of December 26, 2009, the fair value of our marketable equity securities and our equity derivative instruments, including hedging positions, was $805 million ($362 million as of December 27, 2008). Our marketable equity securities include our investments in Clearwire Corporation and Micron, carried at a fair market value of $250 million and $148 million, respectively, as of December 26, 2009. To determine reasonably possible decreases in the market value of our marketable equity investments, we analyzed the expected market price sensitivity of our marketable equity investment portfolio. Assuming a loss of 50% in market prices, and after reflecting the impact of hedges and offsetting positions, the aggregate value of our marketable equity investments could decrease by approximately $405 million, based on the value as of December 26, 2009 (a decrease in value of approximately $220 million, based on the value as of December 27, 2008 using an assumed loss of 60%). The decrease in the assumed loss percentage from December 27, 2008 to December 26, 2009 is due to lower expected overall equity market volatility.
Many of the same factors that could result in an adverse movement of equity market prices affect our non-marketable equity investments, although we cannot always quantify the impact directly. Financial markets and credit markets are volatile, which could negatively affect the prospects of the companies we invest in, their ability to raise additional capital, and the likelihood of our being able to realize value in our investments through liquidity events such as initial public offerings, mergers, and private sales. These types of investments involve a great deal of risk, and there can be no assurance that any specific company will grow or become successful; consequently, we could lose all or part of our investment. Our non-marketable equity investments, excluding investments accounted for under the equity method, had a carrying amount of $939 million as of December 26, 2009 ($1.0 billion as of December 27, 2008). As of December 26, 2009, the carrying amount of our non-marketable equity method investments was $2.5 billion ($3.0 billion as of December 27, 2008). A substantial majority of this balance as of December 26, 2009 was concentrated in companies in the flash memory market segment. Our flash memory market segment investments include our investment of $1.6 billion in IMFT/IMFS ($2.1 billion as of December 27, 2008) and $453 million in Numonyx ($484 million as of December 27, 2008).
In February 2010, we signed a definitive agreement with Micron and Numonyx under which Micron agreed to acquire Numonyx in an all-stock transaction. The value of the Micron common stock that we would receive upon the closing of the transaction is subject to equity market risk. For further information, see "Note 11: Non-Marketable Equity Investments" in Part II, Item 8 of this Form 10-K.
48
| ITEM 8. | FINANCIAL STATEMENTS AND SUPPLEMENTARY DATA |
INDEX TO CONSOLIDATED FINANCIAL STATEMENTS
| Page | ||
Consolidated Statements of Operations | 50 | |
Consolidated Balance Sheets | 51 | |
Consolidated Statements of Cash Flows | 52 | |
Consolidated Statements of Stockholders' Equity | 53 | |
Notes to Consolidated Financial Statements | 54 | |
Reports of Ernst & Young LLP, Independent Registered Public Accounting Firm | 111 | |
Supplemental Data: Financial Information by Quarter | 113 |
49
INTEL
CORPORATION
CONSOLIDATED STATEMENTS OF
OPERATIONS