UNITED STATES
SECURITIES AND EXCHANGE COMMISSION
Washington, DC 20549
FORM 10-K |
| x | ANNUAL REPORT PURSUANT TO SECTION 13 OR 15(d) OF THE SECURITIES EXCHANGE ACT OF 1934 |
For the fiscal year ended December 31, 2012
OR
o | TRANSITION REPORT PURSUANT TO SECTION 13 OR 15(d) OF THE SECURITIES EXCHANGE ACT OF 1934 |
For the transition period from ________ to ________.
Commission file number: 001-31989
INTERNAP NETWORK SERVICES CORPORATION |
(Exact Name of Registrant as Specified in Its Charter) |
Delaware | 91-2145721 | |
(State or Other Jurisdiction of | (I.R.S. Employer | |
Incorporation or Organization) | Identification No.) | |
One Ravinia Drive, Suite 1300 | ||
Atlanta, Georgia | 30346 | |
(Address of Principal Executive Offices) | (Zip Code) |
(404) 302-9700 | ||||
(Registrant's telephone number, including area code) | ||||
Securities registered pursuant to Section 12(b) of the Act: |
Title of each class | Name of exchange on which registered | |
Common Stock, $0.001 par value | The NASDAQ Stock Market LLC | |
(NASDAQ Global Market) |
Securities registered pursuant to Section 12(g) of the Act: None
Indicate by check mark if the registrant is a well-known seasoned issuer, as defined in Rule 405 of the Securities Act. Yes o No x
Indicate by check mark if the registrant is not required to file reports pursuant to Section 13 or Section 15(d) of the Act. Yes o No x
Indicate by check mark whether the registrant (1) has filed all reports required to be filed by Section 13 or 15(d) of the Securities Exchange Act of 1934 during the preceding 12 months (or for such shorter period that the registrant was required to file such reports), and (2) has been subject to such filing requirements for the past 90 days. Yes x No o
Indicate by check mark whether the registrant has submitted electronically and posted on its corporate Web site, if any, every Interactive Data File required to be submitted and posted pursuant to Rule 405 of Regulation S-T during the preceding 12 months (or for such shorter period that the registrant was required to submit and post such files). Yes x No o
Indicate by check mark if disclosure of delinquent filers pursuant to Item 405 of Regulation S-K (§229.405) is not contained herein, and will not be contained, to the best of registrant's knowledge, in definitive proxy or information statements incorporated by reference in Part III of this Form 10-K or any amendment to this Form 10-K. x
Indicate by check mark whether the registrant is a large accelerated filer, an accelerated filer, a non-accelerated filer, or a smaller reporting company. See the definitions of "large accelerated filer," "accelerated filer" and "smaller reporting company" in Rule 12b-2 of the Exchange Act. (Check one):
Large accelerated filer o | Accelerated filer x |
Non-accelerated filer o | Smaller reporting company o |
(Do not check if a smaller reporting company) |
Indicate by check mark whether the registrant is a shell company (as defined in Rule 12b-2 of the Act). Yes o No x
The aggregate market value of the registrant's outstanding common stock held by non-affiliates of the registrant was $304,278,552 based on a closing price of $6.51 on June 30, 2012, as quoted on the NASDAQ Global Market.
As of February 12, 2013, 53,514,415 shares of the registrant's common stock, par value $0.001 per share, were issued and outstanding.
DOCUMENTS INCORPORATED BY REFERENCE
Portions of the definitive proxy statement for the registrant's annual meeting of stockholders to be held May 16, 2013 are incorporated by reference into Part III of this report. Except as expressly incorporated by reference, the registrant's Proxy Statement shall not be deemed to be a part of this report on Form 10-K.
TABLE OF CONTENTS
Page | |||||
| PART I | ||||
ITEM 1. | BUSINESS | 1 | |||
ITEM 1A. | RISK FACTORS | 6 | |||
ITEM 1B. | UNRESOLVED STAFF COMMENTS | 18 | |||
ITEM 2. | PROPERTIES | 18 | |||
ITEM 3. | LEGAL PROCEEDINGS | 18 | |||
ITEM 4. | MINE SAFETY DISCLOSURES | 19 | |||
| PART II | ||||
ITEM 5. | MARKET FOR REGISTRANT'S COMMON EQUITY, RELATED STOCKHOLDER MATTERS AND ISSUER PURCHASES OF EQUITY SECURITIES | 19 | |||
ITEM 6. | SELECTED FINANCIAL DATA | 21 | |||
ITEM 7. | MANAGEMENT'S DISCUSSION AND ANALYSIS OF FINANCIAL CONDITION AND RESULTS OF OPERATIONS | 22 | |||
ITEM 7A. | QUANTITATIVE AND QUALITATIVE DISCLOSURES ABOUT MARKET RISK | 36 | |||
ITEM 8. | FINANCIAL STATEMENTS AND SUPPLEMENTARY DATA | 36 | |||
ITEM 9. | CHANGES IN AND DISAGREEMENTS WITH ACCOUNTANTS ON ACCOUNTING AND FINANCIAL DISCLOSURE | 36 | |||
ITEM 9A. | CONTROLS AND PROCEDURES | 36 | |||
ITEM 9B. | OTHER INFORMATION | 36 | |||
| PART III | ||||
ITEM 10. | DIRECTORS, EXECUTIVE OFFICERS AND CORPORATE GOVERNANCE | 37 | |||
ITEM 11. | EXECUTIVE COMPENSATION | 37 | |||
ITEM 12. | SECURITY OWNERSHIP OF CERTAIN BENEFICIAL OWNERS AND MANAGEMENT AND RELATED STOCKHOLDER MATTERS | 37 | |||
ITEM 13. | CERTAIN RELATIONSHIPS AND RELATED TRANSACTIONS, AND DIRECTOR INDEPENDENCE | 37 | |||
ITEM 14. | PRINCIPAL ACCOUNTANT FEES AND SERVICES | 37 | |||
| PART IV | ||||
ITEM 15. | EXHIBITS AND FINANCIAL STATEMENT SCHEDULES | 37 | |||
| SIGNATURES | 40 | |||
- i -
FORWARD-LOOKING STATEMENTS
This Annual Report on Form 10-K, particularly Management's Discussion and Analysis of Financial Condition and Results of Operations set forth below, and notes to our accompanying audited consolidated financial statements, contain "forward-looking statements" within the meaning of the Private Securities Litigation Reform Act of 1995. Forward-looking statements include statements regarding industry trends, our future financial position and performance, business strategy, revenues and expenses in future periods, projected levels of growth and other matters that do not relate strictly to historical facts. These statements are often identified by words such as "may," "will," "seeks," "anticipates," "believes," "estimates," "expects," "projects," "forecasts," "plans," "intends," "continue," "could," or "should," that an "opportunity" exists, that we are "positioned" for a particular result, or similar expressions or variations. These statements are based on the beliefs and expectations of our management team based on information currently available. Such forward-looking statements are not guarantees of future performance and are subject to risks and uncertainties that could cause actual results to differ materially from those contemplated by forward-looking statements. Important factors currently known to our management that could cause or contribute to such differences include, but are not limited to, those referenced in our Annual Report on Form 10-K under Item 1A "Risk Factors." We undertake no obligation to update any forward-looking statements as a result of new information, future events or otherwise.
As used herein, except as otherwise indicated by context, references to "we," "us," "our," "Internap" or the "Company" refer to Internap Network Services Corporation.
P ART I
I TEM 1. BUSINESS
Overview
We provide intelligent information technology ("IT") Infrastructure services that combine superior performance and platform flexibility to enable our customers to focus on their core business, improve service levels and lower the cost of IT operations.
Industry Background
The Transition to Outsourced Infrastructure Solutions
The growth in demand for IT infrastructure services (compute, storage, security and connectivity) is underpinned by enterprise and consumer dynamics. Enterprises are redesigning their IT operations models to take advantage of new, more cost-effective application delivery models leveraging hosting and cloud computing infrastructure services. These delivery models rely on the Internet as the primary means of communicating with both customers and users. The enterprise's customers and users expect similar, if not better, performance, availability and seamless delivery from their business applications in this new delivery model. From the consumer side, web 2.0 applications are growing, such as online video content, data-rich media, social networking and mobile applications, which continues to drive significant growth in Internet Protocol ("IP") traffic and place increasing demands on the underlying IT infrastructure services.
With the rapid growth of data, it is increasingly costly for businesses to store and manage data in-house. As companies look for ways to reduce real estate, power and labor costs, the option to outsource data center build-out and management to a third-party provider, such as colocation and managed hosting vendors, can become attractive. Technological advancements including compute power, storage density and virtualization technology have combined to enable not only a technical capability, but a financial justification for enterprises to increasingly outsource their IT infrastructure requirements. The costs associated with the design, build and operation of datacenters, as well as those of maintaining an IT employee base dedicated to the IT infrastructure services, is non-trivial for most enterprises. The IT infrastructure services provider can leverage economies of scale and scope to offload the increasingly complex IT infrastructure requirements from the typical enterprise client which enables both the enterprise and the IT infrastructure services provider to focus their resources on their respective core competencies.
Because the large majority of enterprise IT Infrastructure is still managed in-house and the demands for IT infrastructure continue to grow, we believe there is a long-term opportunity for growth as an outsourced IT Infrastructure services provider.
The Demand for Multiple Infrastructure Services to Support Enterprise IT Needs
Enterprises can leverage multiple deployment models to receive outsourced IT infrastructure services. The enterprise's lifecycle and its specific application workload requirements are the key components for its decision to outsource its IT infrastructure. Businesses in different lifecycle stages may leverage different services. An early-stage startup may lack sufficient capital to purchase the servers, storage and datacenter assets it requires to prove its business model. For this reason, early-stage companies often leverage on-demand, pay-per-use models to obtain their IT infrastructure services. These models provide the early-stage startup with the flexibility and scalability required to prove its their business model, while minimizing the initial capital requirement. On the other end of the spectrum, mature enterprises will often make decisions to outsource their IT infrastructure into a colocation or complex hosting environment. The mature enterprise decision process may be influenced by complex regulatory, security or compliance requirements for its IT infrastructure. In other cases, the mature enterprise may be influenced by a decision to focus limited corporate resources on areas that drive its competitive differentiation and will, therefore, choose to outsource compute, storage, security and network IT infrastructure services as non-core activities.
- 1 -
Beyond an enterprise's lifecycle stage, its specific application workload requirements will also influence the decision to outsource IT infrastructure and the decision as to which type of IT infrastructure to utilize: colocation, complex hosting and/or cloud services. Myriad application workload characteristics, including performance, security, availability and scalability, can influence the decision to outsource IT infrastructure.
The Problem of Inefficient Routing of Data Traffic on the Internet
An internet service provider ("ISP") only controls the routing of data within its network and its routing practices often compound the inefficiencies of the Internet. When an ISP receives a packet that is not destined for one of its own customers, it must route that packet to another ISP to complete the delivery of the packet. An ISP will often route the data from private connections, or peered data, to the nearest point of traffic exchange, in an effort to get the packet off its network and onto a competitor's network as quickly as possible. Once the origination traffic leaves the ISP's network, service level agreements ("SLAs") with that ISP typically do not apply since that carrier cannot control the quality of another ISP's network. Consequently, to complete a communication, data ordinarily passes through multiple networks and peering points without consideration for congestion or other factors that inhibit performance. This transfer can result in lost data, slower and more erratic transmission speeds and an overall lower quality of service. The quality of service can be further degraded by basic routing protocols that make assumptions about the "best" path or network on which to route traffic, without consideration of the performance of that network. Equally important, customers have no control over the transmission arrangements and have no single point of contact that they can hold accountable for degradation in service levels. As a result, it is virtually impossible for a single ISP to offer a high quality of service across disparate networks.
Our Business
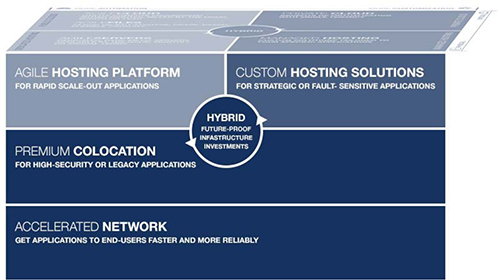
The cube below highlights our IT Infrastructure service offering, which combines platform flexibility with high performance. The bottom of the cube represents our IP services segment: high-performance networking solutions that leverage our proprietary technologies to enhance the performance of our customer's applications on a highly reliable infrastructure.
Building on the origins of our business, next up the stack are our premium datacenters from which we offer a range of services spanning colocation, hosting and cloud services. At the top, we describe two types of hosting solutions, our Agile hosting and custom hosting offerings, both of which we deliver from within our premium data centers utilizing our high-performance network. The top two layers of the cube represent our data center services segment. We engineer our Agile hosting offering for customers seeking speed of deployment, scalability, on-demand usage and self-provisioning capability. These solutions are application programming interface ("API") driven and are ideal for supporting rapid scale-out applications. We tailor our custom hosting offerings to meet very specific customer application workload requirements. We also offer hybridization capability across our colocation and hosting services to provide flexibility to build and deploy applications into the optimal combination of infrastructures to meet specific customer requirements.
- 2 -
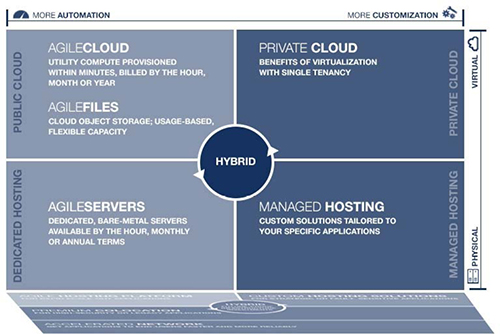
Below, we tip this cube forward to provide more granularity on our Agile and custom hosting solutions. The horizontal axis remains the split between Agile and custom, which represents a split between automation and customization. The vertical axis further divides each of the Agile and custom hosting solutions into physical and virtual offerings. Our Agile hosting platform is divided into a public cloud compute and storage offering, and the dedicated physical offering. For both services, the Agile platform provides seamless management tools that allow the provisioning and scaling of physical and virtual IT Infrastructure. Our Agile solution includes virtual and bare-metal configurations typically provisioned in minutes and available by the hour, month or year. With built-in hybridization, we offer a mix of virtual and physical servers to meet specific application requirements. Our custom hosting solutions on the right side of the cube include private cloud and managed hosting services. Our private cloud solution offers the levels of control and security inherent in a dedicated platform. We believe this range of Agile hosting, custom hosting and colocation services, with hybridization capability, all underpinned by our performance network and datacenter offerings, is a unique, compelling market offering.
All of our services are backed by SLAs and our team of dedicated support professionals.
- 3 -
Our Segments
Data Center Services Segment
As discussed more fully above, our data center services segment includes colocation, hosting and cloud services. Colocation involves providing physical space within data centers and associated services such as power, interconnection, environmental controls and security while allowing our customers to deploy and manage their servers, storage and other equipment in our secure data centers. Hosting and cloud services involve the provision and maintenance of customers' hardware, operating system software, data center infrastructure and interconnection, while allowing our customers to own and manage their software applications and content.
We sell our data center services at 43 data centers across North America, Europe and the Asia-Pacific region. We refer to 11 of these facilities as "company-controlled," meaning we control the data centers' operations, staffing and infrastructure and have negotiated long term leases for the facilities. For these company-controlled facilities, we have designed the datacenter infrastructure, procured the capital equipment, deployed the infrastructure and are responsible for the operation and maintenance of the facility. Our objective with the lease is to control the asset for its economic life, which is typically 15 to 25 years. We refer to the remaining 32 data centers as "partner" sites. In these locations, a third-party has designed and deployed the infrastructure and provides for the operation and maintenance of the facility. Our leases for partner sites have shorter term and, are often linked directly to our underlying customer contract terms for the facility. We typically choose to resell these partner facilities only when there is a strategic rationale, such as a customer requirement for a particular partner facility in combination with a requirement for significant Internap company-controlled datacenter services. As of December 31, 2012, we had 184,816 net-sellable square feet of company-controlled datacenter space and 63,921 net sellable square feet of partner datacenter space in the portfolio.
We believe the long-term demand for data center services will continue, and to address this long-term demand, we continue to incur capital expenditures to build and expand company-controlled data centers. During 2012, we opened a new company-controlled data center in Los Angeles, California and expanded our company-controlled data center in Atlanta, Georgia. In addition, in October 2012, we entered into a long-term lease for new company-controlled data center space to expand our existing services in the metro New York market. We will take possession of the space in 2013 when it is available according to the lease. All of these expansions will increase our company-controlled data center footprint by approximately 141,000 net sellable square feet when fully deployed.
IP Services Segment
Our IP services segment includes our patented Performance IP™ service, content delivery network ("CDN") services and IP routing hardware and software platform. By intelligently routing traffic with redundant, high-speed connections over multiple major Internet backbones, our IP services provide high-performance and highly-reliable delivery of content, applications and communications to end-users globally. We deliver our IP services through 84 IP service points around the world, which include 25 CDN points of presence ("POPs").
Our patented and patent-pending network route optimization technologies address inherent weaknesses of the Internet, allowing businesses to take advantage of the convenience, flexibility and reach of the Internet to connect to customers, suppliers and partners, and to adopt new IT delivery models, in a scalable, reliable and predictable manner. Our services and products take into account the unique performance requirements of each business application to ensure performance as designed, without unnecessary cost.
Our CDN services enable our customers to quickly and securely stream and distribute rich media and content, such as video, audio software and applications, to audiences across the globe through strategically-located POPs. Providing capacity-on-demand to handle large events and unanticipated traffic spikes, we deliver scalable high-quality content distribution and audience-analytic tools.
For more information regarding our operating segments, please see note 11 to our accompanying consolidated financial statements.
Data Centers, Network Access Points and Points of Presence
Our data centers and private network access points ("P-NAPs") feature multiple direct high-speed connections to major ISPs. We have data centers, P-NAPs and CDN POPs in the following markets, some of which have multiple sites:
Internap operated | Domestic sites operated under third party agreements | International sites operated under third party agreements | ||||
Atlanta | Atlanta | Orange County | Amsterdam | Paris | ||
Boston | Boston | San Diego | Frankfurt | Singapore | ||
Dallas | Chicago | Philadelphia | Hong Kong | Sydney | ||
Houston | Dallas | Phoenix | London | Tokyo (1) | ||
Los Angeles | Denver | San Francisco | Osaka (1) | Toronto | ||
New York metro | Los Angeles | San Jose | ||||
Santa Clara | Miami | Santa Clara | ||||
Seattle | New York metro | Seattle | ||||
Oakland | Washington DC | |||||
(1) | Through our joint venture in Internap Japan Co., Ltd. with NTT-ME Corporation and Nippon Telegraph and Telephone Corporation. |
- 4 -
Financial Information about Geographic Areas
For each of the three years ended December 31, 2012, we derived less than 10% of our total revenues from operations outside the United States.
Research and Development
Research and development costs, which include product development costs, are included in general and administrative costs and are expensed as incurred. These costs primarily relate to our development and enhancement of IP routing technology, acceleration and cloud technologies and network engineering costs associated with changes to the functionality of our proprietary services and network architecture. Research and development costs were $2.0 million, $0.2 million and $1.9 million during the years ended December 31, 2012, 2011 and 2010, respectively. These costs do not include $6.7 million , $9.8 million and $4.9 million of internal-use software costs capitalized during the years ended December 31, 2012, 2011 and 2010, respectively.
Customers
As of December 31, 2012, we had approximately 3,700 customers. We provide services to customers in a variety of industries, such as entertainment and media, including gaming; financial services; business services; software; hosting; health care and information technology infrastructure; and telecommunications. Our customer base, however, is not concentrated in any particular industry. In each of the past three years, no single customer accounted for 10% or more of our revenues.
Competition
The market for our services is intensely competitive and is characterized by technological change, the introduction of new products and services and price erosion. We believe that the principal factors of competition for service providers in our target markets include speed and reliability of connectivity, quality of facilities, breadth of product offering, level of customer service and technical support, price and brand recognition. We believe that we are able to compete effectively on the basis of these factors. Our current and potential competition primarily consists of:
| ● | colocation, hosting and cloud providers, including Equinix, Inc.; Rackspace, Inc.; Amazon; Telx Group, Inc.; CyrusOne; CenturyLink, Inc. and Softlayer; |
| ● | ISPs that provide connectivity services and storage solutions, including AT&T Inc.; Sprint Nextel Corporation; Verizon Communications Inc.; Level 3 Communications, Inc.; Akamai Technologies, Inc. and Limelight Networks, Inc. |
Competition will likely continue to result in price pressure on us. Our competitors may have longer operating histories or presence in key markets, greater name recognition, larger customer bases and greater financial, sales and marketing, distribution, engineering, technical and other resources than we have. As a result, these competitors may be able to introduce emerging technologies on a broader scale and adapt more quickly to changes in customer requirements, potentially at lower costs, or to devote greater resources to the promotion and sale of their services and products. In all of our markets, we also may face competition from newly established competitors, suppliers of services or products based on new or emerging technologies and customers that choose to develop their own network services or products. We also may encounter further consolidation in the markets in which we compete. Increased competition could result in additional pricing pressures, decreased gross margins and loss of market share, which may materially and adversely affect our business, consolidated financial condition, results of operations and cash flows.
Intellectual Property
Our success and ability to compete depend in part on our ability to develop and maintain the proprietary aspects of our IT Infrastructure services and operate without infringing on the proprietary rights of others. We rely on a combination of patent, trademark, trade secret and contractual restrictions to protect the proprietary aspects of our technology. As of December 31, 2012, we had 22 patents (17 issued in the United States and five issued internationally) that extend to various dates between 2017 and 2031 , and seven registered trademarks in the United States. Although we believe the protection afforded by our patents, trademarks and trade secrets has value, the rapidly changing technology in our industry and uncertainties in the legal process make our future success dependent primarily on the innovative skills, technological expertise and management abilities of our employees rather than on the protection afforded by patent, trademark and trade secret laws. We seek to limit disclosure of our intellectual property by requiring employees and consultants with access to our proprietary information to execute confidentiality agreements with us.
- 5 -
Employees
As of December 31, 2012, we had approximately 500 employees. None of our employees are represented by a labor union, and we have not experienced any work stoppages. We consider the relationships with our employees to be good.
Additional Information
We make available through our company web site, free of charge, our company filings with the Securities and Exchange Commission (the "SEC") as soon as reasonably practicable after we electronically file them with, or furnish them to, the SEC. These include our annual reports on Form 10-K, quarterly reports on Form 10-Q, current reports on Form 8-K, proxy statements, registration statements and any amendments to those documents. The company's web site is www.internap.com and the link to our SEC filings is http://ir.internap.com/financials.cfm. Our principal executive offices are located at One Ravinia Drive, Suite 1300, Atlanta, Georgia 30346, and our telephone number is (404) 302-9700. We incorporated in Washington in 1996 and reincorporated in Delaware in 2001. Our common stock trades on the Nasdaq Global Market under the symbol "INAP."
ITEM 1A. RISK FACTORS
We operate in a changing environment that involves numerous known and unknown risks and uncertainties that could have a materially adverse impact on our operations. The risks described below highlight some of the factors that have affected, and in the future could affect, our operations. You should carefully consider these risks. These risks are not the only ones we may face. Additional risks and uncertainties of which we are unaware or that we currently deem immaterial also may become important factors that affect us. If any of the events or circumstances described in the following risks occurs, our business, consolidated financial condition, results of operations, cash flows or any combination of the foregoing, could be materially and adversely affected.
Our risks are described in detail below; however, the more significant risks we face can be summarized into several broad categories, including:
The future evolution of the technology industries in which we operate is difficult to predict, highly competitive and requires continual innovation and development, strategic planning, capital investment, demand planning and space utilization management to remain viable. We face on-going challenges to develop new services and products to maintain current customers and obtain new ones, whether in a cost-effective manner or at all. In addition, technological advantages typically devalue rapidly creating constant pressure on pricing and cost structures and hindering our ability to maintain or increase margins.
We are dependent on numerous suppliers, vendors and other third-party providers across a wide spectrum of products and services to operate our business. These include real-estate, network capacity and access points, network equipment and supplies, power and other vendors. In many cases the suppliers of these products and services are not only vendors, they are also competitors. While we maintain contractual agreements with these suppliers, we have limited ability to guarantee they will meet their obligations, or that we will be able to continue to obtain the products and services necessary to operate our business in sufficient supply, or at an acceptable cost.
Our business model involves designing, deploying and maintaining a complex set of network infrastructures at considerable capital expense. We invest significant resources to help maintain the integrity of our infrastructure and support our customers; however, we face constant challenges related to our network infrastructure, including capital forecasting, demand planning, space utilization management, physical failures, obsolescence, maintaining redundancies, physical and electronic security breaches, power demand and other risks.
Our financial results have fluctuated over time and we have a history of losses, including in each of the past three years. We have also incurred significant charges related to impairments and restructuring efforts, which, along with other factors, may contribute to volatility in our stock price.
Risks Related to our Industries
We cannot predict with certainty the future evolution of the market for technology and products, and may be unable to respond effectively and on a timely basis to rapid technological change.
Our industry is characterized by rapidly changing technology, industry standards and customer needs, as well as by frequent new product and service introductions. As evidenced by our investment in and offering to our enterprise customers a full portfolio of cloud computing hosting solutions, innovative new technologies and evolving industry standards have the potential to become the "new normal," either replacing or providing efficient, potentially lower-cost alternatives to other, more traditional, services. The adoption of such new technologies or industry standards could render our existing services obsolete and unmarketable. Our failure to anticipate new technology trends that eventually may become the preferred technology choice of our customers, to adapt our technology to any changes in the prevailing industry standards (or, conversely, for there to be an absence of generally accepted standards) could materially and adversely affect our business. Our pursuit of and investment in necessary technological advances may require substantial time and expense, but will not guarantee that we can successfully adapt our network and services to alternative access devices and technologies. If the Internet backbone becomes subject to a form of central management or gatekeeping control, or if ISPs establish an economic settlement arrangement regarding the exchange of traffic between Internet networks that is passed on to Internet users, the demand for our IP and CDN services could be materially and adversely affected. Likewise, technological advances in computer processing, storage, capacity, component size or power management could result in a decreased demand for our data center and hosting services.
- 6 -
If we are unable to develop new and enhanced services and products that achieve widespread market acceptance, or if we are unable to improve the performance and features of our existing services and products or adapt our business model to keep pace with industry trends, our business and operating results could be adversely affected.
Our industry is constantly evolving. The process of expending research and development to create new services and products, and the technologies that support them, is expensive, time and labor intensive and uncertain. We may fail to understand the market demand for new services and products or not be able to overcome technical problems with new services. The demand for top research and development talent is high, and there is significant competition for these scarce resources.
Our future success may depend on our ability to respond to the rapidly changing needs of our customers by expending research and development in a cost-effective manner to acquire talent, develop and introduce new services, products and product upgrades on a timely basis. New product development and introduction involves a significant commitment of time and resources and is subject to a number of risks and challenges, including:
| ● | sourcing, identifying, obtaining and maintaining qualified research and development staff with the appropriate skill and expertise; |
| ● | managing the length of the development cycle for new products and product enhancements, which historically has been longer than expected; |
| ● | identifying and adapting to emerging and evolving industry standards and to technological developments by our competitors' and customers' services and products; |
| ● | developing or expanding efficient sales channels; |
| ● | entering into new or unproven markets where we have limited experience; |
| ● | managing new product and service strategies and integrating them with our existing services and products; |
| ● | incorporating acquired products and technologies; |
| ● | trade compliance issues affecting our ability to ship new products to international markets; and |
| ● | obtaining required technology licenses and technical access from operating system software vendors on reasonable terms to enable the development and deployment of interoperable products. |
In addition, if we cannot adapt our business models to keep pace with industry trends, our revenue could be negatively impacted. If we are not successful in managing these risks and challenges, or if our new services, products and product upgrades are not technologically competitive or do not achieve market acceptance, we may experience a decrease in our revenues and earnings.
Our capital investment strategy for data center and IT Infrastructure expansion may contain erroneous assumptions causing our return on invested capital to be materially lower than expected.
Our strategic decision to invest capital in expanding our data center and IT Infrastructure is based on, among other things, significant assumptions relative to expected growth of these markets, our competitors' plans and current and expected occupancy rates. We have no way of ensuring the data or models we use to deploy capital into existing markets, or to create new markets, has been or will be accurate. Errors or imprecision in these estimates, especially those related to customer demand, could cause actual results to differ materially from expected results and could adversely affect our business, consolidated financial condition, results of operations and cash flows.
We may experience difficulties in executing our capital investment strategy to expand our IT Infrastructure, upgrade existing facilities or establish new facilities, products, services or capabilities.
As part of our strategy, we may continue to expand our IT Infrastructure, particularly into new geographic markets. We expect that we may encounter challenges and difficulties in implementing our expansion plans. This could cause us to grow at a slower pace than projected in our capital investment modeling. These challenges and difficulties relate to our ability to:
| ● | identify and obtain the use of locations meeting our selection criteria on competitive terms; |
| ● | estimate costs and control delays; |
- 7 -
| ● | obtain necessary permits on a timely basis, if at all; |
| ● | generate sufficient cash flow from operations or through current or additional debt or equity financings to support these expansion plans; |
| ● | establish key relationships with IT Infrastructure providers; |
| ● | hire, train, retain and manage sufficient additional operational and technical employees and supporting personnel; |
| ● | obtain the necessary power density and supply from the local utility; |
| ● | avoid labor issues such as a strike; and |
| ● | identify and obtain contractors that will not default on the agreed upon contract performance. |
If we encounter greater than anticipated difficulties in implementing our expansion plans, are unable to deploy new IT Infrastructure or do not adequately control expenses associated with the deployment of new IT Infrastructure, it may be necessary to take additional actions, which could divert management's attention and strain our operational and financial resources. We may not successfully address any or all of these challenges, and our failure to do so would adversely affect our business, consolidated financial condition, results of operations and cash flows.
Our estimation of future data center space needs may be inaccurate, leading to missed sales opportunities or additional expenses through unnecessary carrying costs.
Adding data center space involves significant capital outlays well ahead of planned usage. Although we believe we can accurately project future space needs in particular markets, these plans require significant estimates and assumptions based on available market data. Errors or imprecision in these estimates or the data on which the estimates are based could result in either an oversupply or undersupply of space and cause actual results to differ materially from expected results and correspondingly have a material adverse impact on our business, consolidated financial condition, results of operations and cash flows.
Pricing pressure may continue to decrease our revenue for certain services such as Internet connectivity, data transit and/or data storage services.
Pricing for Internet connectivity, data transit and data storage services has declined significantly in recent years and may continue to decline, which would continue to impact our IP services segment. By bundling their services and reducing the overall cost of their service offerings, certain of our competitors may be able to provide customers with reduced costs in connection with their Internet connectivity, data transit and data storage services or private network services, thereby significantly increasing the pressure on us to decrease our prices. Increased price competition, significant price deflation and other related competitive pressures have eroded, and could continue to erode, our revenue and could materially and adversely affect our results of operations if we are unable to control or reduce our costs. Because we rely on ISPs to deliver our services and have agreed with some of these providers to purchase minimum amounts of service at predetermined prices, our profitability could be adversely affected by competitive price reductions to our customers even if accompanied with an increased number of customers.
The market in which we operate is highly competitive and is likely to consolidate, and we may lack the financial and other resources, expertise or capability necessary to capture increased market share or maintain our market share.
We compete in the IT Infrastructure services market. This market is rapidly evolving, highly competitive and likely to be characterized by overcapacity, industry consolidation and continued pricing pressure. Our competitors may consolidate with one another or acquire software-application vendors or technology providers, enabling them to more effectively compete with us. We believe that participants in this market must grow rapidly and achieve a significant presence to compete effectively. This consolidation could affect prices and other competitive factors in ways that would impede our ability to compete successfully in the IT infrastructure market. Further, our business is not as developed as that of many of our competitors. Many of our competitors have substantially greater financial, technical and market resources, greater name recognition and more established relationships in the industry. Many of our competitors may be able to:
| ● | develop and expand their IT infrastructure and service offerings more rapidly; |
| ● | adapt to new or emerging technologies and changes in customer requirements more quickly; |
| ● | take advantage of acquisitions and other opportunities more readily; or |
| ● | devote greater resources to the marketing and sale of their services and adopt more aggressive pricing policies than we can. |
In addition, ISPs may make technological advancements, such as the introduction of improved routing protocols to enhance the quality of their services, which could negatively impact the demand for our IT Infrastructure services. We also expect that we will face additional competition as we expand our product offerings, including competition from technology and telecommunications companies, and non-technology companies which are entering the market through leveraging their existing or expanded network services and cloud infrastructure. Further, the ability of some of these potential competitors to bundle other services and products with their network services could place us at a competitive disadvantage. Various companies also are exploring the possibility of providing, or are currently providing, high-speed, intelligent data services that use connections to more than one network or use alternative delivery methods, including the cable television infrastructure, direct broadcast satellites and wireless local loops.
- 8 -
We may lack the financial and other resources, expertise or capability necessary to maintain or capture increased market share in the future. Increased competition and technological advancements by our competitors could materially and adversely affect our business, consolidated financial condition, results of operations and cash flows.
Failure to retain existing customers or add new customers may cause declines in revenue.
In addition to adding new customers, we must sell additional services to existing customers and encourage them to increase their usage levels to increase our revenue. If our existing and prospective customers do not perceive our services to be of sufficiently high value and quality, we may not be able to retain our current customers or attract new customers. Our customers have no obligation to renew their agreements for our services after the expiration of their initial commitment, and these service agreements may not be renewed at the same price or level of service, if at all. Due to the significant upfront costs of implementing IT Infrastructure, if our customers fail to renew or cancel their agreements, we may not be able to recover the initial costs associated with bringing additional infrastructure on-line.
Our customers' renewal rates may decline or fluctuate as a result of a number of factors, including:
| ● | their satisfaction or dissatisfaction with our services; |
| ● | our ability to provide features and functionality demanded by our customers; |
| ● | the prices of our services as compared with those of our competitors; |
| ● | mergers and acquisitions affecting our customer base; and |
| ● | reduction in our customers' spending levels. |
If our customers do not renew their agreements with us or if they renew on less favorable terms, our revenue would decline and our business may suffer. Similarly, our customer agreements often provide for minimum commitments that may be significantly below our customers' historical usage levels. Consequently, these customers could significantly curtail their usage without incurring any incremental fees under our agreements. In this event, our revenue would be lower than expected and our operating results could suffer.
We have a long sales cycle for our IT Infrastructure services and the implementation efforts required by customers to activate them can be substantial.
Our IT Infrastructure services are complex and require substantial sales efforts and technical consultation to implement. A customer's decision to outsource some or all of its IT Infrastructure typically involves a significant commitment of resources. Some customers may be reluctant to purchase our IT Infrastructure services due to their inability to accurately forecast future demand, delay in decision-making or inability to obtain necessary internal approvals to commit resources. We may expend time and resources pursuing a particular sale or customer that does not result in revenue. Delays due to the length of our sales cycle may harm our ability to meet our forecasts and materially and adversely affect our revenues and operating results.
We may lose customers if they elect to develop or maintain some or all of their IT Infrastructure services internally.
Our customers and potential customers may decide to develop or maintain their own IT Infrastructure rather than outsource to services providers like us. These in-house IT Infrastructure services could be perceived to be superior or more cost effective compared to our services. If we fail to offer IT Infrastructure services that compete favorably with in-sourced services or if we fail to differentiate our IT Infrastructure services from them, we may lose customers or fail to attract customers that may consider pursuing this in-sourced approach, and our business, consolidated financial condition and results of operations would suffer as a result.
In addition, our customers' business models may change in ways that we do not anticipate and these changes could reduce or eliminate our customers' needs for our services. If this occurs, we could lose customers or potential customers, and our business and financial results would suffer. As a result of these or similar potential developments in the future, it is possible that competitive dynamics in our market may require us to reduce our prices, which could harm our revenue, gross margin and operating results.
If governments modify or increase regulation of the Internet, or goods or services necessary to operate the Internet or our IT Infrastructure, our services could become more costly.
International bodies and federal, state and local governments have adopted a number of laws and regulations that affect the Internet and are likely to continue to seek to implement additional laws and regulations. In addition, federal and state agencies have adopted or are actively considering regulation of various aspects of the Internet and/or IP services, including taxation of transactions, regulation of broadband providers and broadband Internet access, enhanced data privacy and retention legislation and various energy regulations. Additionally, potential laws and regulations not specifically directed at the Internet, but targeted at goods or services necessary to operate the Internet, could have a negative impact on us. Of specific concern are the legal, political and scientific developments regarding climate change. These factors may impact the delivery of our services by driving up the cost of power, which is a significant cost of operating our data centers and other service points.
- 9 -
We face the risk that the Federal Communications Commission ("FCC") may increase regulation or that Congress or one or more states will approve legislation significantly affecting our business. For example, in late 2011, the FCC adopted new Open Internet rules intended to preserve and promote the Internet's openness and the transparency of its protocols to encourage innovation by providers of content, applications, services and devices. While aimed primarily at regulating fixed, and to a lesser extent, mobile broadband Internet access service providers, such services are defined for purposes of the new rules as "mass-market retail service," meaning a service marketed and sold on a standardized basis to residential customers, small businesses and other end-user customers, such as schools and libraries. Mass market excludes enterprise service offerings provided to larger organizations through customized or individually-negotiated arrangements, which are the typical customers that we serve. Furthermore, the FCC declined to adopt specific policies targeting "specialized services" offered by broadband providers, such as facilities-based voice over IP and IP-video offerings. Instead, the FCC chose to closely monitor the capacity offered to consumers for broadband Internet access service to ensure it keeps pace with broadband providers' expanded offerings of specialized services. The FCC's Open Internet rules are the subject of pending petitions for review before the U.S. Court of Appeals for the DC Circuit which are challenging the FCC's authority to adopt such rules regulating broadband Internet access services. If the Open Internet rules are upheld, this could lead to expanded regulation of the Internet by the FCC that could impact our business. The adoption of any future laws or regulations, or modification of existing laws to include our company or services, might decrease demand for our services, impose taxes or other costly technical requirements, regulate the Internet, Internet access or IP services or otherwise increase the cost of doing business on the Internet. Also, our company or services could be reclassified so that we are covered by legislation not intended for our business, but which, because of the classification, we become subject to. Any of these actions could significantly harm our business.
In addition, laws relating to the liability of private network operators and information carried on or disseminated through their networks are unsettled, both in the U.S. and abroad. The nature of any new laws and regulations and the interpretation of applicability to the Internet of existing laws governing intellectual property ownership and infringement, copyright, trademark, trade secret, obscenity, libel, employment, personal privacy, consumer protection and other issues are uncertain and developing. We may become subject to legal claims such as defamation, invasion of privacy or copyright infringement in connection with content stored on or distributed through our network. We cannot predict the impact, if any, that future regulation or regulatory changes may have on our business.
In 2012, one of our subsidiaries began offering metro connect and metro connect extended ethernet data transmission services to customers colocated at our data centers to enable expanded connectivity at multiple locations. These are regulated telecommunications services, which require our subsidiary to apply for, obtain and maintain in good status a state certificate of public convenience and necessity in each state in which these services are offered. There are various regulatory compliance requirements to operate as a telecommunications carrier, such as the filing of tariffs, annual reports and universal service reports, all of which must be satisfied to continue to offer these services, and avoid any enforcement actions by federal or state regulators. We also must ensure that we are in compliance with state consumer protection laws in every state in which the subsidiary offers such services. Failure to comply with any of these requirements could negatively impact our business.
Risks Related to our Business
We depend on third-party suppliers for key elements of our IT Infrastructure. If we are unable to obtain these items on a cost-effective basis, or at all, or if such services are interrupted, limited or terminated, our growth prospects and business operations may be adversely affected.
In delivering our services, we rely on a number of Internet networks, many of which are built and operated by third parties. To provide high performance connectivity services through our network access points, we purchase connections from several ISPs. We can offer no assurances that these ISPs will continue to provide service to us on a cost-effective basis or on competitive terms, if at all, or that these providers will provide us with additional capacity to adequately meet customer demand or to expand our business. Consolidation among ISPs limits the number of vendors from which we obtain service, possibly resulting in higher network costs to us. We may be unable to establish and maintain relationships with other ISPs that may emerge or that are significant in geographic areas, such as Asia, India and Europe, in which we may locate our future network access points. Any of these situations could limit our growth prospects and materially and adversely affect our business.
We also depend on other companies to supply various key elements of our network infrastructure, including the network access loops between our network access points and our ISP, local loops between our network access points and our customers' networks and certain end-user access networks. Pricing for such network access loops and local loops has risen significantly over time and operators of these networks may take measures that could degrade, disrupt or increase the cost of our or our customers' access to certain of these end-user access networks by restricting or prohibiting the use of their networks to support or facilitate our services, or by charging increased fees. Some of our competitors have their own network access loops and local loops and are, therefore, not subject similar availability and pricing issues.
- 10 -
For data center and managed hosting facilities, we rely on a number of vendors to provide physical space, convert or build space to our specifications, provide power, internal cabling and wiring, climate control, physical security and system redundancy. We typically obtain physical space through long-term leases. We utilize multiple other vendors to perform leasehold improvements necessary to make the physical space available for occupancy. The demand for premium data center and managed hosting space in several key markets has outpaced supply over recent years and the imbalance is projected to continue over the near term. This has limited our physical space options and increased, and will continue to increase, our costs to add capacity. If we are not able to procure space through renewing our existing leases or entering new leases, or not able to contain cost for physical space, or are not able to pass these costs on to our customers, our results will be adversely affected.
In addition, we currently purchase infrastructure equipment such as servers, routers, switches and storage components from a limited number of vendors. We do not carry significant inventories of the products we purchase, and we have no guaranteed supply arrangements with our vendors. A loss of a significant vendor could delay any build-out of our infrastructure and increase our costs. If our limited source of suppliers fails to provide products or services that comply with evolving Internet standards or that interoperate with other products or services we use in our network infrastructure, we may be unable to meet all or a portion of our customer service commitments, which could materially and adversely affect our results.
Any failure of our physical IT infrastructure could lead to significant costs and disruptions that could harm our business reputation, consolidated financial condition, results of operations and cash flows.
Our business depends on providing customers with highly-reliable service. We must protect our IT Infrastructure and our customers' data and their equipment located in our data centers. The services we provide in each of our data centers are subject to failure resulting from numerous factors, including:
| ● | human error; |
| ● | physical or electronic security breaches; |
| ● | fire, earthquake, hurricane, flood, tornado and other natural disasters; |
| ● | improper maintenance of the buildings in which our data centers are located; |
| ● | water damage, extreme temperatures, fiber cuts; |
| ● | power loss or equipment failure; |
| ● | sabotage and vandalism; and |
| ● | failures experienced by underlying service providers upon which our business relies. |
Problems at one or more of our company-controlled facilities or our partner sites, whether or not within our control, could result in service interruptions or significant equipment damage. Most of our customers have SLAs that require us to meet minimum performance obligations and to provide service credits to customers if we do not meet those obligations. If a service interruption impacts a significant portion of our customer base, the amount of service credits we are required to provide could adversely impact our business and financial condition. Also, if we experience a service interruption and we fail to provide a service credit under an SLA, we could face claims related to such failures, which could adversely impact our business and financial condition. Because our data centers are critical to our customers' businesses, service interruptions or significant equipment damage in our data centers also could result in lost profits or other indirect or consequential damages to our customers. We cannot guarantee that a court would enforce any contractual limitations on our liability in the event that a customer brings a lawsuit against us as the result of a problem at one of our data centers.
Any loss of services, equipment damage or inability to meet performance obligations in our SLAs could reduce the confidence of our customers and could result in lost customers or an inability to attract new customers, which would adversely affect both our ability to generate revenues and our operating results.
Furthermore, we are dependent upon ISPs and telecommunications carriers in the U.S., Europe and Asia-Pacific region, some of whom have experienced significant system failures and electrical outages in the past. Users of our services may experience difficulties due to system failures unrelated to our systems and services. If, for any reason, these providers fail to provide the required services, our business, consolidated financial condition, results of operations and cash flows could be materially adversely impacted.
Our business operations depend on contracts with vendors and suppliers who may not meet their contractual obligations.
Tracking, monitoring and managing our contracts and vendor relationships is critical to our business operations; however, we have limited control over the vendors' performance of these contracts. Even if these contracts contain terms favorable to us in the event of a breach, there is no guarantee the damages due us under the contract would cover the losses suffered or would even be paid. Also, each contract contains specific terms and conditions that may change over time based on contract expiration, assignment, assumption or renegotiation. There is no guarantee that these changes would be favorable to us, and to the event they were not, our operations could be materially impacted.
- 11 -
These contracts may contain provisions that result in favorable or non-favorable impacts on us depending on actions taken, or not taken. While we intend to pursue all contractual provisions favorable to our business, the appropriate actions under a particular contract may require estimates, judgments and assumptions to be made concerning future events for which we have limited basis for estimation. We cannot guarantee that we will take the appropriate action under a particular contract to maximize the benefit to us, which could have a material adverse impact on operations.
In addition, we license intellectual property rights from third-party owners. If such owners do not properly maintain or enforce the intellectual property underlying such licenses, our competitive position and business prospects could be harmed. Our licensors may fail to maintain these patents or intellectual property registrations, may determine not to pursue litigation against other companies that are infringing these patents or intellectual property registrations or may pursue such litigation less aggressively than we would.
Our inability to renew our data center leases, or renew on favorable terms, could negatively impact our financial results.
Generally, our company-controlled data center leases provide us with the opportunity to renew the lease at our option for periods typically ranging from five to 10 years. Many of these options however, if renewed, provide that rent for the renewal period will be the fair market rental rate at the time of renewal. If the fair market rental rates are significantly higher than our current rental rates, we may be unable to offset these costs by charging more for our services, which could have a negative impact on our financial results. Conversely, if rental rates drop significantly in the near term, we would not be able to take advantage of the drop in rates until the expiration of the lease as we would be bound by the terms of the existing lease agreement.
In addition, for the leases that do not contain renewal options, or for which the option to renew has been exhausted or passed, we cannot guarantee the lessor will renew the lease, or will do so at a rate that will allow us to maintain profitability on that particular space. While we proactively monitor these leases, and conduct on-going negotiations with lessors, our ability to re-negotiate renewals is inherently limited by the original contract language, including option renewal clauses. If we are unable to renew, we may incur substantial costs to move our infrastructure and/or customers and to restore the property to its required conditon, there is no guarantee that our customers will move with us and we may not be able to find appropriate and sufficient space. The occurrence of any of these events could adversely impact our business, financial condition, results of operations and cash flows.
A failure in the redundancies in our network operations centers, network access points or computer systems could cause a significant disruption in Internet connectivity which could impact our ability to service our customers.
While we maintain multiple layers of redundancy in our operating facilities, if we experience a problem at our network operations centers, including the failure of redundant systems, we may be unable to provide Internet connectivity services to our customers, provide customer service and support or monitor our network infrastructure or network access points, any of which would seriously harm our business and operating results. Also, because we are obligated to provide continuous Internet availability under our SLAs, we may be required to issue a significant amount of service credits as a result of such interruptions in service. These credits could negatively affect our revenues and results of operations. In addition, interruptions in service to our customers could potentially harm our customer relations, expose us to potential lawsuits or necessitate additional capital expenditures.
A significant number of our network access points are located in facilities owned and operated by third parties. In many of those arrangements, we do not have property rights similar to those customarily possessed by a lessee or subtenant but instead have lesser rights of occupancy. In certain situations, the financial condition of those parties providing occupancy to us could have an adverse impact on the continued occupancy arrangement or the level of service delivered to us under such arrangements.
Our business could be harmed by prolonged electrical power outages or shortages, increased costs of energy or general availability of electrical resources.
Our IT Infrastructure is susceptible to regional costs and supply of power, electrical power shortages, planned or unplanned power outages and availability of adequate power resources. Power outages could harm our customers and our business. While we attempt to limit exposure to system downtime by using backup generators, uninterruptible power systems and other redundancies, we may not be able to limit our exposure entirely. Even with these protections in place we have experienced power outages in the past and may in the future. In addition, our energy costs have increased and may continue to increase for a variety of reasons including increased pressure on legislators to pass green legislation. As energy costs increase, we may not be able to pass on to our customers the increased cost of energy, which could harm our business and operating results.
In each of our markets, we rely on utility companies to provide a sufficient amount of power for current and future customers. We cannot ensure that these third parties will deliver such power in adequate quantities or on a consistent basis. At the same time, power and cooling requirements are growing on a per-unit basis. As a result, some customers are consuming an increasing amount of power per square foot of space utilized. Inability to increase power capacity to meet increased customer demands would limit our ability to grow our business, which could have a negative impact on our relationships with our customers and our consolidated financial condition, results of operations and cash flows.
- 12 -
Our network and software are subject to potential security breaches and similar threats that could result in liability and harm our reputation.
A number of widespread and disabling attacks on public and private networks have occurred. The number and severity of these attacks may increase in the future as network assailants take advantage of outdated software, security breaches or incompatibility between or among networks. Computer viruses, intrusions and similar disruptive problems could cause us to be liable for damages under agreements with our customers, and our reputation could suffer, thereby resulting in a loss of current customers and deterring potential customers from working with us. Security problems or other attacks caused by third parties could lead to interruptions and delays or to the cessation of service to our customers. Furthermore, inappropriate use of the network by third parties could also jeopardize the security of confidential information stored in our computer systems and in those of our customers and could expose us to liability under unsolicited commercial e-mail, or "spam," regulations. In the past, third parties have occasionally circumvented some of these industry-standard measures. We can offer no assurance that the measures we implement will not be circumvented. Our efforts to eliminate computer viruses and alleviate other security problems, or any circumvention of those efforts, may result in increased costs, interruptions, delays or cessation of service to our customers and negatively impact hosted customers' on-line business transactions. Affected customers might file claims against us under such circumstances, and our insurance may not be available or adequate to cover these claims.
The increased use of high-power density equipment may limit our ability to fully utilize our data centers.
Customers continue to increase their use of high-power density equipment, which has significantly increased the demand for power. The current demand for electrical power may exceed our designed capacity in these facilities. As electrical power, rather than space, is typically the primary factor limiting capacity in our data centers, our ability to fully utilize our data centers may be limited in these facilities. If we are unable to adequately utilize our data centers, our ability to grow our business cost-effectively could be materially and adversely affected.
Our business requires the continued development of effective and efficient business support systems to support our customer growth and related services.
The growth of our business depends on our ability to continue to develop effective and efficient business support policies, processes and internal systems. This is a complicated undertaking requiring significant resources and expertise. Business support systems are needed for:
| ● | sourcing, evaluating and targeting potential customers and managing existing customers; |
| ● | implementing customer orders for services; |
| ● | delivering these services; |
| ● | timely billing for these services; |
| ● | budgeting, forecasting, tracking and reporting our results of operations; and |
| ● | providing technical and operational support to customers and tracking the resolution of customer issues. |
If the number of customers that we serve or our services portfolio increases, we may need to develop additional business support systems on a schedule sufficient to meet proposed service rollout dates. The failure to continue to develop effective and efficient business support systems, and update or optimize these systems to a level commensurate with our competition, could harm our ability to implement our business plans, maintain competitiveness and meet our financial goals and objectives.
We depend upon our key employees and may be unable to attract or retain sufficient numbers of qualified personnel.
Our future performance depends upon the continued contributions of our executive management team and other key employees. To the extent we are able to expand our operations, we may need to increase our workforce. Accordingly, our future success depends on our ability to attract, hire, train and retain highly skilled management, technical, sales, research and development, marketing and customer support personnel. Competition for qualified employees is intense, and we compete for qualified employees with companies that may have greater financial resources than we have. We may not be successful in attracting, hiring and retaining the people we need, which would seriously impede our ability to implement our business strategy.
Additionally, changes in our senior management team during the past several years, both through voluntary and involuntary separation, have resulted in loss of valuable company intellectual capital and in paying significant severance and hiring costs. With reduced staffing, or staffing new to the organization, we may not be able to maintain an adequate separation of duties in key areas of monitoring, oversight and review functions and may not have adequate succession plans in place to mitigate the impact of future personnel losses. If we continue to experience similar levels of turnover in our senior management team, the execution of our corporate strategy could be affected and the costs and effects of such changes could negatively impact our operations.
- 13 -
Our international operations may not be successful.
We have limited experience operating internationally and have only recently begun to achieve some success in our international operations. We currently have network access points or CDN POPs in Amsterdam, Frankfurt, Hong Kong, London, Paris, Singapore, Sydney and Toronto. We also participate in a joint venture with NTT-ME Corporation and Nippon Telegraph and Telephone Corporation, which operates network access points in Tokyo and Osaka, Japan. We may develop or acquire network access points or complementary businesses in additional international markets. The risks associated with expansion of our international business operations include:
| ● | challenges in establishing and maintaining relationships with foreign customers and foreign ISPs and local vendors, including data center and local network operators; |
| ● | challenges in staffing and managing network operations centers and network access points across disparate geographic areas; |
| ● | potential loss of proprietary information due to misappropriation or laws that may be less protective of our intellectual property rights than the laws in the U.S.; |
| ● | challenges in reducing operating expense or other costs required by local laws, and longer accounts receivable payment cycles and difficulties in collecting accounts receivable; |
| ● | exposure to fluctuations in foreign currency exchange rates; |
| ● | costs of customizing network access points for foreign countries and customers; and |
| ● | compliance with requirements of foreign laws, regulations and other governmental controls, including trade and labor restrictions and related laws that may reduce the flexibility of our business operations or favor local competition. |
We may be unsuccessful in our efforts to address the risks associated with our international operations, which may limit our international sales growth and materially and adversely affect our business and results of operations.
We may acquire other businesses, and these acquisitions involve integration and other risks that could harm our business.
We may pursue acquisitions of complementary businesses, products, services and technologies to expand our geographic footprint, enhance our existing services, expand our service offerings or enlarge our customer base. If we complete future acquisitions, we may be required to incur or assume additional debt, make capital expenditures or issue additional shares of our common stock or securities convertible into our common stock as consideration, which would dilute our existing stockholders' ownership interest and may adversely affect our results of operations. If we fail to identify and acquire needed companies or assets, if we acquire the wrong companies or assets, if we fail to address the risks associated with integrating an acquired company or if we do not successfully integrate an acquired company, we would not be able to effectively manage our growth through acquisitions which could adversely affect our results.
Risks Related to our Capital Stock and Other Business Risks
We have a history of losses and may not sustain profitability.
For the years ended December 31, 2012, 2011 and 2010, we incurred net losses of $4.3 million, $1.7 million and $3.6 million, respectively. At December 31, 2012, our accumulated deficit was $1.0 billion. Given the competitive and evolving nature of the industry in which we operate, we may not be able to achieve or sustain profitability, and our failure to do so could materially and adversely affect our business, including our ability to raise additional funds.
Failure to sustain our revenues will cause our business and financial results to suffer.
We have considerable fixed expenses, and we expect to continue to incur significant expenses, particularly with the expansion of our data center facilities. We incur a substantial portion of these expenditures upfront, and are only able to recover these costs over time. We must, therefore, at least sustain revenues to maintain profitability. Although revenue from our data center services segment has generally been growing, this segment has lower margins than our IP services segment. If we are unable to sustain our margins in the data center services segment, our business may suffer.
Numerous factors could affect our ability to sustain revenue, either alone or in combination with other factors, including:
| ● | failure to sustain sales of our services; |
| ● | pricing pressures; |
| ● | significant increases in cost of goods sold or other operating expenses; |
| ● | failure of our services to operate as expected; |
| ● | loss of customers or inability to attract new customers or loss of existing customers at a rate greater than our increase in new customers; |
- 14 -
| ● | customers' failure to pay on a timely basis or at all or failure to continue to purchase our IT Infrastructure services in accordance with their contractual commitments; or |
| ● | network failures and any breach or unauthorized access to our network. |
Our results of operations have fluctuated in the past and likely will continue to fluctuate, which could negatively impact the price of our common stock.
We have experienced fluctuations in our results of operations on a quarterly and annual basis. Fluctuation in our operating results may cause the market price of our common stock to decline. We expect to experience continued fluctuations in our operating results in the foreseeable future due to a variety of factors, including:
| ● | competition and the introduction of new services by our competitors; |
| ● | continued pricing pressures; |
| ● | fluctuations in the demand and sales cycle for our services; |
| ● | fluctuations in the market for qualified sales and other personnel; |
| ● | the cost and availability of adequate public utilities, including power; |
| ● | our ability to obtain local loop connections to our network access points at favorable prices; |
| ● | general economic conditions; and |
| ● | any impairments or restructurings charges that we may incur in the future. |
In addition, fluctuations in our results of operations may arise from strategic decisions we have made or may make with respect to the timing and magnitude of capital expenditures such as those associated with the expansion of our data center facilities, the deployment of additional network access points, the terms of our network connectivity purchase agreements and the cost of servers, storage and other equipment necessary to deploy managed hosting and cloud services. A relatively large portion of our expenses are fixed in the short-term, particularly with respect to lease and personnel expense, depreciation and amortization and interest expense. Our results of operations, therefore, are particularly sensitive to fluctuations in revenue. We can offer no assurance that the results of any particular period are an indication of future performance in our business operations. Fluctuations in our results of operations could have a negative impact on our ability to raise additional capital and execute our business plan.
We may incur additional goodwill and other intangible asset impairment charges, restructuring charges or both.
The assumptions, inputs and judgments used in performing the valuation analysis and assessments of goodwill and other intangible assets are inherently subjective and reflect estimates based on known facts and circumstances at the time the valuation is performed. The use of different assumptions, inputs and judgments or changes in circumstances could materially affect the results of the valuation and assessments. Due to the inherent uncertainty involved in making these estimates, actual results could differ from our estimates.
When circumstances warrant, we may elect to exit certain business activities or change the manner in which we conduct ongoing operations. When we make such a change, we will estimate the costs to exit a business or restructure ongoing operations. The components of the estimates may include estimates and assumptions regarding the timing and costs of future events and activities that represent our best expectations based on known facts and circumstances at the time of estimation. Should circumstances warrant, we will adjust our previous estimates to reflect what we then believe to be a more accurate representation of expected future costs. Because our estimates and assumptions regarding impairment and restructuring charges include probabilities of future events, such as expected operating results, future economic conditions, the ability to find a sublease tenant within a reasonable period of time or the rate at which a sublease tenant will pay for the available space, such estimates are inherently vulnerable to changes due to unforeseen circumstances that could materially and adversely affect our results of operations. Adverse changes in any of these factors could result in an additional impairment and restructuring charges in the future.
Our stock price may be volatile.
The market for our equity securities has been extremely volatile. Our stock price could suffer in the future as a result of any failure to meet the expectations of public market analysts and investors about our results of operations from quarter to quarter. The following factors could cause the price of our common stock in the public market to fluctuate significantly:
| ● | actual or anticipated variations in our quarterly and annual results of operations; |
| ● | changes in market valuations of companies in the industries in which we may compete; |
| ● | changes in expectations of future financial performance or changes in estimates of securities analysts; |
- 15 -
| ● | fluctuations in stock market prices and volumes; |
| ● | future issuances of common stock or other securities; |
| ● | the addition or departure of key personnel; and |
| ● | announcements by us or our competitors of acquisitions, investments or strategic alliances. |
Our stockholders may experience significant dilution, which could depress the market price of our common stock.
Holders of our stock options may exercise those options to purchase our common stock, which would increase the number of shares of our common stock that are outstanding in the future. As of December 31, 2012, options to purchase an aggregate of 4.7 million shares of our common stock at a weighted average exercise price of $6.57 were outstanding. Also, the vesting of 1.2 million outstanding shares of restricted stock will increase the weighted average number of shares used for calculating diluted net loss per share. Greater than expected capital requirements could require us to obtain additional financing through the issuance of securities, which could be in the form of common stock or preferred stock or other securities having greater rights than our common stock. The issuance of our common stock or other securities, whether upon the exercise of options, the future vesting and issuance of stock awards to our executives and employees, in financing transactions or otherwise, could depress the market price of our common stock by increasing the number of shares of common stock or other securities outstanding on an absolute basis or as a result of the timing of additional shares of common stock becoming available on the market.
Our existing credit facility places certain limitations on us.
Our existing credit agreement requires us to meet certain financial covenants, including those that limit our ability to incur further indebtedness or make certain acquisitions or investments. In addition, these covenants require us to maintain minimum liquidity levels and senior leverage ratio and create liens on a majority our assets. If we do not satisfy these covenants, we would be in default under the credit agreement. Any defaults, if not waived, could result in our lenders ceasing to make loans or extending credit to us, accelerating or declaring all or any obligations immediately due or taking possession of or liquidating collateral. If any of these events occur, we may not be able to borrow sufficient funds to refinance the credit agreement on terms that are acceptable to us, or at all, which could materially and adversely impact our business, consolidated financial condition, results of operations and cash flows.
Finally, our ability to access the capital markets may be limited at a time when we would like or need to do so, which could have an impact on our flexibility to pursue expansion opportunities and maintain our desired level of revenue growth in the future.
Any failure to meet our debt obligations and other long-term commitments would damage our business.
As of December 31, 2012, our total debt, including capital leases, was $144.6 million. If we use more cash than we generate in the future, our level of indebtedness could adversely affect our future operations by increasing our vulnerability to adverse changes in general economic and industry conditions and by limiting or prohibiting our ability to obtain additional financing for future capital expenditures, acquisitions and general corporate and other purposes. In addition, if we are unable to make interest or principal payments when due, we would be in default under the terms of our long-term debt obligations, which would result in all principal and interest becoming due and payable which, in turn, would seriously harm our business.
We also have other long-term commitments for operating leases and service and purchase contracts totaling $165.2 million in the future with a minimum of $35.3 million payable in 2013. If we are unable to make payments when due, we would be in breach of contractual terms of the agreements, which may result in disruptions of our services which, in turn, would seriously harm our business.
Our ability to use U.S. net operating loss carryforwards might be limited.
As of December 31, 2012, we had net operating loss carryforwards of $186.3 million for U.S. federal tax purposes. These loss carryforwards expire between 2018 and 2032. To the extent these net operating loss carryforwards are available, we intend to use them to reduce the corporate income tax liability associated with our operations. Section 382 of the U.S. Internal Revenue Code generally imposes an annual limitation on the amount of net operating loss carryforwards that might be used to offset taxable income when a corporation has undergone significant changes in stock ownership. To the extent our use of net operating loss carryforwards is significantly limited, our income could be subject to corporate income tax earlier than it would if we were able to use net operating loss carryforwards, which could result in lower profits.
If we fail to adequately protect our intellectual property, we may lose rights to some of our most valuable assets.
We rely on a combination of patent, trademark, trade secret and other intellectual property law, nondisclosure agreements and other protective measures to protect our proprietary rights. We also utilize unpatented proprietary know-how and trade secrets and employ various methods to protect such intellectual property. We believe our intellectual property rights are significant and that the loss of all or a substantial portion of such rights could have a material adverse impact on our results of operations. We can offer no assurance that the steps we have taken to protect our intellectual property will be sufficient to prevent misappropriation of our technology, or that our trade secrets will not become known or be independently discovered by competitors. In addition, the laws of many foreign countries do not protect our intellectual property to the same extent as the laws of the U.S. From time-to-time, third parties have or may assert infringement claims against us or against our customers in connection with their use of our products or services.
- 16 -
In addition, we rely on the intellectual property of others. We may desire or be required to renew or to obtain licenses from these other parties to further develop and market commercially-viable products or services effectively. We can offer no assurance that any necessary licenses will be available on reasonable terms, or at all.
Changes to conform to new accounting principles and/or financial regulation may be costly and disrupt our current planning, analysis and reporting processes.
Accounting oversight bodies in the U.S. and internationally are actively contemplating and enacting a number of new accounting regulations. To comply with these changes, we may need to incur a significant amount of time and resources to adapt personnel, processes, reporting and systems. For example, changes proposed to lease accounting conventions in generally accepted accounting principles in the U.S. would require reclassification of most of our operating leases to capital lease treatment. This would significantly change the nature of our balance sheet. Likewise, International Financial Reporting Standards ("IFRS"), if adopted, would necessitate wholesale changes in our accounting processes and modification to our financial reporting and supporting systems. This would have a large impact on revenue recognition and fixed asset reporting.
In addition, laws relating to public company governance practices, such as the Dodd-Frank Act Wall Street Reform and Consumer Protection Act which is being implemented over time, have modified existing corporate governance practices and potentially increase liability related to stockholder actions, whistleblower claims and governmental enforcement actions.
While we have implemented internal practices to proactively review, assess and adapt to constantly changing regulations, we cannot predict with certainty the impact, if any, that future regulation or regulatory changes may have on our business or the potential costs we may incur related to compliance with new laws and regulations.
We may face litigation and liability due to claims of infringement of third-party intellectual property rights.
The infrastructure services industry is characterized by the existence of a large number of patents and frequent litigation based on allegations of patent infringement. From time-to-time, third parties may assert patent, copyright, trademark, trade secret and other intellectual property rights to technologies that are important to our business. Any claims that our IT Infrastructure services infringe or may infringe proprietary rights of third parties, with or without merit, could be time-consuming, result in costly litigation, divert the efforts of our technical and management personnel or require us to enter into royalty or licensing agreements, any of which could significantly impact our operating results. In addition, our customer agreements generally require us to indemnify our customers for expenses and liabilities resulting from claimed infringement of patents or copyrights of third parties, subject to certain limitations. If an infringement claim against us were to be successful, and we were not able to obtain a license to the relevant technology or a substitute technology on acceptable terms or redesign our services or products to avoid infringement, our ability to compete successfully in our market would be materially impaired.
We are currently subject to a securities class action lawsuit and a derivative action lawsuit, the unfavorable outcomes of which could have a material adverse impact on our financial condition, results of operations and cash flows.
In November 2008, a putative securities class action lawsuit was filed against us and our former chief executive officer and in November 2009, a putative derivative lawsuit was filed purportedly on our behalf against certain of our directors and officers. While we are, and will continue to, vigorously contest these lawsuits, we cannot determine the final resolution of these lawsuits or when they might be resolved. In addition to the expenses incurred in defending this litigation and any damages that may be awarded in the event of an adverse ruling, our management's efforts and attention will be diverted from the ordinary business operations to address these claims. Regardless of the outcome, this litigation may have a material adverse impact on our results because of defense costs, including costs related to our indemnification obligations, diversion of resources and other factors. We discuss these lawsuits further in Item 3 "Legal Proceedings" below.
We do not expect to pay dividends on our common stock, and investors would only be able to receive cash in respect of the shares of common stock upon the sale of their shares.
We have no intention in the foreseeable future to pay any cash dividends on our common stock, and the covenants in our credit agreement limit our ability to pay dividends. Therefore, an investor in our common stock may obtain an economic benefit from the common stock only after an increase in its trading price and only by selling the common stock.
Provisions of our charter documents and Delaware law may have anti-takeover effects that could prevent a change in control even if the change in control would be beneficial to our stockholders.
Provisions of our Certificate of Incorporation and Bylaws, and provisions of Delaware law, could discourage, delay or prevent a merger, acquisition or other change in control of our company. These provisions are intended to protect stockholders' interests by providing our board of directors a means to attempt to deny coercive takeover attempts or to negotiate with a potential acquirer in order to obtain more favorable terms. Such provisions include a board of directors that is classified so that only one-third of directors stand for election each year. These provisions could also discourage proxy contests and make it more difficult for stockholders to elect directors and take other corporate actions.
- 17 -
I TEM 1B. UNRESOLVED STAFF COMMENTS
None.
I TEM 2. PROPERTIES
Our principal executive offices are located in Atlanta, Georgia. Our Atlanta headquarters consists of 62,000 square feet under a lease agreement that expires in 2019.
Leased facilities in our top markets include Atlanta, Boston, Dallas, Houston, Los Angeles, New York metro area, Northern California and Seattle. We believe our existing facilities are adequate for our current needs and that suitable additional or alternative space will be available in the future on commercially reasonable terms as needed.
I TEM 3. LEGAL PROCEEDINGS
Securities Class Action Litigation. On November 12, 2008, a putative securities fraud class action lawsuit was filed against us and our former chief executive officer in the United States District Court for the Northern District of Georgia, captioned Catherine Anastasio and Stephen Anastasio v. Internap Network Services Corp. and James P. DeBlasio, Civil Action No. 1:08-CV-3462-JOF. The complaint alleges that we and the individual defendant violated Section 10(b) of the Securities Exchange Act of 1934 (the "Exchange Act") and that the individual defendant also violated Section 20(a) of the Exchange Act as a "control person" of Internap. Plaintiffs purport to bring these claims on behalf of a class of our investors who purchased our common stock between March 28, 2007 and March 18, 2008.
Plaintiffs allege generally that, during the putative class period, we made misleading statements and omitted material information regarding (a) integration of VitalStream, which we acquired in 2007, (b) customer issues and related credits due to services outages and (c) our previously reported 2007 revenue that we subsequently reduced in 2008 as announced on March 18, 2008. Plaintiffs assert that we and the individual defendant made these misstatements and omissions to maintain our share price. Plaintiffs seek unspecified damages and other relief.
On August 12, 2009, the Court granted plaintiffs leave to file an Amended Class Action Complaint ("Amended Complaint"). The Amended Complaint added a claim for violation of Section 14(a) of the Exchange Act based on alleged misrepresentations in our proxy statement in connection with our acquisition of VitalStream. The Amended Complaint also added our former chief financial officer as a defendant and lengthened the putative class period.
On September 11, 2009, we and the individual defendants filed motions to dismiss. On November 6, 2009, plaintiffs filed a Corrected Amended Class Action Complaint. On December 7, 2009, plaintiffs filed a motion for leave to file a Second Amended Class Action Complaint to add allegations regarding, inter alia, an alleged failure to conduct due diligence in connection with the VitalStream acquisition and additional statements from purported confidential witnesses.
On September 15, 2010, the Court granted our motion to dismiss and denied the individual defendants' motion to dismiss. The Court dismissed plaintiffs' claims under Section 14(a) of the Exchange Act. With respect to plaintiffs' claims under Section 10(b) of the Exchange Act, the Court held that the Amended Complaint failed to satisfy the pleading requirements of the Private Securities Litigation Reform Act, but allowed plaintiffs' one final opportunity to amend the complaint. On October 26, 2010, plaintiffs filed their Third Amended Class Action Complaint. On December 10, 2010, we filed a motion to dismiss this complaint. On September 30, 2011, the Court granted in large part the motion to dismiss. The two remaining claims involve certain alleged misstatements concerning the progress of the integration of VitalStream and the stability of our CDN platform.
Derivative Action Litigation. On November 12, 2009, stockholder Walter M. Unick filed a putative derivative action purportedly on behalf of Internap against certain of our directors and officers in the Superior Court of Fulton County, Georgia, captioned Unick v. Eidenberg, et al., Case No. 2009cv177627. This action is based upon substantially the same facts alleged in the securities class action litigation described above. The complaint seeks to recover damages in an unspecified amount. On January 28, 2010, the Court entered the parties' agreed order staying the matter until the motions to dismiss are resolved in the securities class action litigation. Given the developments in the securities class action described above, we intend to move to dismiss the derivative complaint.
While we will vigorously contest the securities class action and derivative action lawsuits, we cannot determine the final resolution of the lawsuits or when they might be resolved. In addition to the expenses incurred in defending this litigation and any damages that may be awarded in the event of an adverse ruling, our management's efforts and attention may be diverted from the ordinary business operations to address these claims. Regardless of the outcome, this litigation described above may have a material adverse impact on our financial results because of defense costs, including costs related to our indemnification obligations, diversion of resources and other factors.
- 18 -
As of December 31, 2012, we determined that we could not reasonably estimate the potential loss with respect to the litigation described above, and as a result, we have not recognized any accruals for loss related to such pending litigation and cannot estimate losses exceeding amounts previously recognized in connection with these matters, which consisted of expenses in the aggregate of $0.5 million in 2008 and 2009.
We are subject to other legal proceedings, claims and litigation arising in the ordinary course of business. Although the outcome of these matters is currently not determinable, we do not expect that the ultimate costs to resolve these matters will have a material adverse impact on our financial condition, results of operations or cash flows.
I TEM 4. MINE SAFETY DISCLOSURES
Not applicable.
P ART II
I TEM 5. MARKET FOR REGISTRANT'S COMMON EQUITY, RELATED STOCKHOLDER MATTERS AND ISSUER PURCHASES OF EQUITY SECURITIES
Our common stock is listed on the NASDAQ Global Market under the symbol "INAP." The following table presents, for the periods indicated, the range of high and low per share sales prices of our common stock, as reported on the NASDAQ Global Market. Our fiscal year ends on December 31.
Year Ended December 31, 2012: | High | Low | |||||||
Fourth Quarter | $ | 7.68 | $ | 5.52 | |||||
Third Quarter | 7.52 | 6.15 | |||||||
Second Quarter | 7.90 | 6.25 | |||||||
First Quarter | 7.96 | 5.55 | |||||||
| |||||||||
Year Ended December 31, 2011: | High | Low | |||||||
Fourth Quarter | $ | 6.45 | $ | 4.55 | |||||
Third Quarter | 7.52 | 4.35 | |||||||
Second Quarter | 8.56 | 6.58 | |||||||
First Quarter | 7.89 | 5.91 | |||||||
As of February 12, 2013, we had approximately 700 stockholders of record of our common stock.
We have never declared or paid any cash dividends on our capital stock, and we do not anticipate paying cash dividends in the foreseeable future. We are prohibited from paying cash dividends under covenants contained in our credit agreement. We currently intend to retain our earnings, if any, for future growth. Future dividends on our common stock, if any, will be at the discretion of our board of directors and will depend on, among other things, our operations, capital requirements and surplus, general financial condition, contractual restrictions and such other factors as our board of directors may deem relevant.
The following table provides information regarding our current equity compensation plans as of December 31, 2012 (shares in thousands):
Equity Compensation Plan Information | ||||||||||||
Plan category | Number of securities to be issued upon exercise of outstanding options, warrants and rights (a) | Weighted-average exercise price of outstanding options, warrants and rights (b) | Number of securities remaining available for future issuance under equity compensation plans (excluding securities reflected in column (a)) (c) | |||||||||
Equity compensation plans approved by security holders | 4,701 | $ | 6.57 | 3,837 | ||||||||
Equity compensation plans not approved by security holders | - | - | - | |||||||||
Total | 4,701 | $ | 6.57 | 3,837 | ||||||||
- 19 -
ISSUER PURCHASES OF EQUITY SECURITIES
The following table sets forth information regarding our repurchases of securities for each calendar month in the quarter ended December 31, 2012:
Period | Total Number of Shares | Average Price Paid | Total Number of | Maximum Number | ||||||||||||
October 1 to 31, 2012 | 1,833 | $ | 7.18 | - | - | |||||||||||
November 1 to 30, 2012 | 3,131 | 6.03 | - | - | ||||||||||||
December 1 to 31, 2012 | 14,060 | 6.83 | - | - | ||||||||||||
Total | 19,024 | $ | 6.73 | - | - | |||||||||||
(1) | Employees surrendered these shares to us as payment of statutory minimum payroll taxes due in connection with the vesting of restricted stock. |
- 20 -
ITEM 6. SELECTED FINANCIAL DATA
We have derived the selected financial data shown below for each of the five years in the period ended December 31, 2012 from our accompanying consolidated financial statements. The following data should be read in conjunction with the accompanying consolidated financial statements and related notes contained and "Management's Discussion and Analysis of Financial Condition and Results of Operations" included in this Annual Report on Form 10-K (in thousands, except per share data).
Year Ended December 31, | ||||||||||||||||||||
2012 | 2011 (1) | 2010 | 2009 (2) | 2008 (3) | ||||||||||||||||
Consolidated Statements of Operations and Comprehensive Loss Data: | ||||||||||||||||||||
Revenues | $ | 273,592 | $ | 244,628 | $ | 244,164 | $ | 256,259 | $ | 253,989 | ||||||||||
Operating costs and expenses: | ||||||||||||||||||||
Direct costs of network, sales and services, exclusive of depreciation and amortization, shown below | 130,954 | 120,310 | 127,423 | 143,016 | 135,877 | |||||||||||||||
Direct costs of customer support | 26,664 | 21,278 | 19,861 | 18,034 | 16,217 | |||||||||||||||
Direct costs of amortization of acquired technologies | 4,718 | 3,500 | 3,811 | 8,349 | 6,649 | |||||||||||||||
Sales and marketing | 31,343 | 29,715 | 29,232 | 28,131 | 30,888 | |||||||||||||||
General and administrative | 38,635 | 33,952 | 33,048 | 44,645 | 44,235 | |||||||||||||||
Depreciation and amortization | 36,147 | 36,926 | 30,158 | 28,282 | 23,865 | |||||||||||||||
(Gain) loss on disposals of property and equipment, net | (55 | ) | 37 | 116 | 26 | (16 | ) | |||||||||||||
Exit activities, restructuring and impairments | 1,422 | 2,833 | 1,411 | 54,698 | 101,441 | |||||||||||||||
Total operating costs and expenses | 269,828 | 248,551 | 245,060 | 325,181 | 359,156 | |||||||||||||||
Income (loss) from operations | 3,764 | (3,923 | ) | (896 | ) | (68,922 | ) | (105,167 | ) | |||||||||||
Non-operating expenses (income) | 7,849 | 3,866 | 2,170 | 461 | (245 | ) | ||||||||||||||
Loss before income taxes and equity in (earnings) of equity-method investment | (4,085 | ) | (7,789 | ) | (3,066 | ) | (69,383 | ) | (104,922 | ) | ||||||||||
Provision (benefit) for income taxes | 453 | (5,612 | ) | 952 | 357 | 174 | ||||||||||||||
Equity in (earnings) of equity-method investment, net of taxes | (220 | ) | (475 | ) | (396 | ) | (15 | ) | (283 | ) | ||||||||||
Net loss | $ | (4,318 | ) | $ | (1,702 | ) | $ | (3,622 | ) | $ | (69,725 | ) | $ | (104,813 | ) | |||||
Net loss per share: | ||||||||||||||||||||
Basic and diluted | $ | (0.09 | ) | $ | (0.03 | ) | $ | (0.07 | ) | $ | (1.41 | ) | $ | (2.13 | ) | |||||
December 31, | ||||||||||||||||||||
| 2012 | 2011 | 2010 | 2009 (2) | 2008 (3) | ||||||||||||||||
Consolidated Balance Sheets Data: | ||||||||||||||||||||
Cash and cash equivalents, investments in marketable securities and other related assets and restricted cash (4) | $ | 28,553 | $ | 29,772 | $ | 59,582 | $ | 80,926 | $ | 61,096 | ||||||||||
Total assets | 400,712 | 356,710 | 293,142 | 267,502 | 330,083 | |||||||||||||||
Credit facilities, due after one year, and capital lease obligations, less current portion | 136,555 | 94,673 | 37,889 | 23,217 | 23,244 | |||||||||||||||
Total stockholders' equity | 195,605 | 192,170 | 188,611 | 184,402 | 248,195 | |||||||||||||||
Year Ended December 31, | ||||||||||||||||||||
| 2012 | 2011 | 2010 | 2009 | 2008 | ||||||||||||||||
Other Financial Data: | ||||||||||||||||||||
Purchases of property and equipment | $ | 74,947 | $ | 68,542 | $ | 62,184 | $ | 17,278 | $ | 51,154 | ||||||||||
Net cash flows provided by operating activities | 43,742 | 28,630 | 39,602 | 37,520 | 37,951 | |||||||||||||||
Net cash flows used in investing activities | (79,697 | ) | (96,265 | ) | (55,184 | ) | (9,900 | ) | (41,690 | ) | ||||||||||
Net cash flows provided by (used in) financing activities | 34,571 | 37,901 | 1,224 | (598 | ) | (821 | ) | |||||||||||||
(1) | On December 30, 2011, we completed our acquisition of Voxel Holdings, Inc. ("Voxel"). We allocated the purchase price to Voxel's net tangible and intangible assets based on their estimated fair values as of December 30, 2011. We recorded the excess purchase price over the value of the net tangible and identifiable intangible assets as goodwill. In addition, as a result of our purchase price accounting, our net loss was reduced by a $6.1 million deferred tax benefit that offset our existing income tax expense of $0.5 million. |
- 21 -
(2) | We completed an assessment of goodwill and other intangible assets for impairment as of June 1, 2009, in connection with our decision to consolidate our business segments, which resulted in aggregate impairment charges of $51.5 million for goodwill and $4.1 million for other acquired intangible assets. |
(3) | As a result of our annual goodwill impairment test on August 1, 2008, we recorded a $99.7 million impairment charge to adjust goodwill in our former CDN services segment to its implied fair value. |
(4) | The following table provides a reconciliation of total cash and cash equivalents, investments in marketable securities and other related assets and restricted cash to the amounts reported in our audited consolidated balance sheets (in thousands): |
December 31, | ||||||||||||||||||||
2012 | 2011 | 2010 | 2009 | 2008 | ||||||||||||||||
Cash and cash equivalents | $ | 28,553 | $ | 29,772 | $ | 59,582 | $ | 73,926 | $ | 46,870 | ||||||||||
Investments in marketable securities and other related assets: | ||||||||||||||||||||
Short-term | - | - | - | 7,000 | 7,199 | |||||||||||||||
Long-term | - | - | - | - | 7,027 | |||||||||||||||
Restricted cash | - | - | - | - | - | |||||||||||||||
| $ | 28,553 | $ | 29,772 | $ | 59,582 | $ | 80,926 | $ | 61,096 | |||||||||||
I TEM 7. MANAGEMENT'S DISCUSSION AND ANALYSIS OF FINANCIAL CONDITION AND RESULTS OF OPERATIONS
The following discussion should be read in conjunction with the accompanying consolidated financial statements and notes provided under Part II, Item 8 of this Annual Report Form 10-K.
2012 Financial Highlights and Outlook
Data center services . Revenue increased $33.8 million during 2012 primarily due to net revenue growth in company-controlled colocation and hosting services, which includes revenue attributable to Voxel. We expect future revenue growth in the data center services segment to continue to be derived primarily from our company-controlled colocation and hosting services product offerings. We have expanded the number and size of the data center sites that we operate and have broadened our portfolio of hybridized and on-demand hosting services to provide continued platform flexibility for our customers.
We believe the long-term drivers of demand for enterprises to outsource their IT infrastructure services remain intact and that we remain positioned to benefit from this macro trend. To address this demand, we continue to incur capital expenditures to build and expand company-controlled data centers. During 2012, we opened a new company-controlled data center in Los Angeles, California and expanded our company-controlled data center in Atlanta, Georgia. In addition, we entered into a lease for new company-controlled data center space to expand our existing services in the metro New York market. This long term lease will increase our company-controlled data center footprint by approximately 55,000 net sellable square feet at full occupancy. We took possession of the space in January 2013 when it was available according to the lease. These three expansions will increase our company-controlled data center footprint by approximately 141,000 net sellable square feet at full occupancy.
During 2012, we increased the occupancy across our total data center footprint by approximately 14,000 square feet (over 13,000 square feet in company-controlled data centers), while we increased the total capacity in our data center footprint by approximately 29,000 net sellable square feet. This expansion of our data center footprint has contributed to total lower overall utilization of net sellable square feet as of December 31, 2012, compared to 2011. At December 31, 2012, we had approximately 249,000 net sellable square feet of data center space with a utilization rate of 63%, compared to approximately 220,000 net sellable square feet of data center space with a utilization rate of 65% at December 31, 2011. At December 31, 2012, 74% of our total net sellable square feet were in company-controlled data centers versus partner sites.
IP services . During 2012, revenue decreased $4.9 million while IP traffic increased approximately 36%, compared to 2011, calculated based on an average over the number of months in the respective periods. We continue to experience pricing pressure for our IP services, which has contributed to the decrease in IP services revenue year-over-year. Due to competitive forces, we have lowered pricing of our IP services, although this decrease in pricing has been offset by an increase in demand for our IP services. As our IP traffic continues to grow, we expect to obtain lower bandwidth rates and more opportunities to proactively manage network costs, such as utilization and traffic optimization among ISPs.
Credit Agreement
In August 2012, we amended our credit agreement (the "Amendment"), which increased the total availability by $20.0 million. We summarize the Amendment in "-Liquidity and Capital Resources-Capital Resources-Credit Agreement" and in note 10 to the accompanying consolidated financial statements. In addition, the quarterly payment on the term loan was increased from $750,000 to $875,000, the due date for the revolving credit facility and the term loan was extended to August 2015 and the minimum liquidity covenant was reduced from $30.0 million to $20.0 million.
- 22 -
Non-GAAP Financial Measure
We report our consolidated financial statements in accordance with accounting principles generally accepted in the U.S. ("GAAP"). However, the non-GAAP performance measure of adjusted EBITDA, defined as income (loss) from operations plus depreciation and amortization, gain (loss) on disposals of property and equipment, exit activities, restructuring and impairments and stock-based compensation, i s presented to enhance investors' ability to analyze trends in our business and evaluate our performance relative to other companies. We use this non-GAAP performance measure to assist us in explaining underlying performance trends in our business.
As a non-GAAP financial measure, adjusted EBITDA should not be considered in isolation of, or as a substitute for, net income (loss) or other GAAP measures as an indicator of operating performance. In addition, adjusted EBITDA should not be considered as an alternative to income (loss) from operations or net loss as a measure of operating performance. Our calculation of adjusted EBITDA may differ from others in our industry and is not necessarily comparable with similar titles used by other companies.
The following table reconciles adjusted EBITDA to income (loss) from operations as presented in our consolidated statements of operations and comprehensive loss:
Year Ended December 31, | ||||||||||||
2012 | 2011 | 2010 | ||||||||||
Income (loss) from operations | $ | 3,764 | $ | (3,923 | ) | $ | (896 | ) | ||||
Depreciation and amortization, including amortization of acquired technologies | 40,865 | 40,426 | 33,969 | |||||||||
(Gain) loss on disposals of property and equipment, net | (55 | ) | 37 | 116 | ||||||||
Exit activities, restructuring and impairments | 1,422 | 2,833 | 1,411 | |||||||||
Stock-based compensation | 5,858 | 3,983 | 4,631 | |||||||||
Adjusted EBITDA | $ | 51,854 | $ | 43,356 | $ | 39,231 | ||||||
Critical Accounting Policies and Estimates
This discussion and analysis of our financial condition and results of operations is based upon our consolidated financial statements, which we have prepared in accordance with GAAP. The preparation of these financial statements requires management to make estimates and judgments that affect the reported amounts of assets, liabilities, revenue and expense and related disclosure of contingent assets and liabilities. On an ongoing basis, we evaluate our estimates, including those summarized below. We base our estimates on historical experience and on various other assumptions that we believe to be reasonable under the circumstances; the results of which form the basis for making judgments about the carrying values of assets and liabilities that are not readily apparent from other sources. Actual results may differ materially from these estimates.
In addition to our significant accounting policies summarized in note 2 to our accompanying consolidated financial statements, we believe the following policies are the most sensitive to judgments and estimates in the preparation of our consolidated financial statements.
Revenue Recognition
We generate revenues primarily from the sale of data center services and IP services. Our revenues typically consist of monthly recurring revenues from contracts with terms of one year or more. We recognize the monthly minimum as revenue each month provided that we have entered into an enforceable contract, we have delivered the service to the customer, the fee for the service is fixed or determinable and collection is reasonably assured. We record installation fees as deferred revenue and recognize the revenue ratably over the estimated customer life.
We determine data center revenues by occupied square feet and both allocated and variable-based usage. Data center revenues include both physical space for hosting customers' network and other equipment plus associated services such as power and network connectivity, environmental controls and security.
- 23 -
We recognize IP services revenues on fixed- or usage-based pricing. IP service contracts usually have fixed minimum commitments based on a certain level of bandwidth usage with additional charges for any usage over a specified limit. If a customer's usage of our services exceeds the monthly minimum, we recognize revenue for such excess in the period of the usage.
We use contracts and sales or purchase orders as evidence of an arrangement. We test for availability or connectivity to verify delivery of our services. We assess whether the fee is fixed or determinable based on the payment terms associated with the transaction and whether the sales price is subject to refund or adjustment.
We also enter into multiple-element arrangements, or bundled services. When we enter into such arrangements, we account for each element separately over its respective service period provided that we have objective evidence of fair value for the separate elements. Objective evidence of fair value includes the price charged for the element when sold separately. If we cannot objectively determine the fair value of each element, we recognize the total value of the arrangement ratably over the entire service period to the extent that we have begun to provide the services, and we have satisfied other revenue recognition criteria.
In January 2011, we adopted new guidance which eliminates the residual method of allocation for multiple-deliverable revenue arrangements and requires that we allocate arrangement consideration at the inception of an arrangement to all deliverables using the relative selling price method. This new guidance also establishes a selling price hierarchy for determining the selling price of a deliverable, which includes (a) vendor-specific objective evidence, if available, (b) third-party evidence, if vendor-specific objective evidence is not available, and (c) best estimated selling price, if neither vendor-specific nor third-party evidence is available. Additionally, the guidance expands the disclosure requirements related to a vendor's multiple-deliverable revenue arrangements. Adoption of this guidance did not have a material impact on our consolidated financial statements.
Vendor-specific objective evidence is generally limited to the price charged when we sell the same or similar service separately. If we seldom sell a service separately, it is unlikely that we will determine vendor-specific objective evidence for the service. We define vendor-specific objective evidence as an average price of recent standalone transactions that we price within a narrow range as defined by us.
We determine third-party evidence based on the prices charged by our competitors for a similar deliverable when sold separately. It is difficult for us to obtain sufficient information on competitor pricing to substantiate third-party evidence and therefore we may not always be able to use this measure.
If we are unable to establish selling price using vendor-specific objective evidence or third-party evidence, and we receive or materially modify a sales order, we use best estimated selling price in our allocation of arrangement consideration. The objective of best estimated selling price is to determine the price at which we would transact if we sold the service on a standalone basis. Our determination of best estimated selling price involves a weighting of several factors including, but not limited to, pricing practices and market conditions.
We analyze the selling prices used in our allocation of arrangement consideration on an annual basis at a minimum. We will analyze selling prices on a more frequent basis if a significant change in our business necessitates a more timely analysis or if we experience significant variances in our selling prices.
We account for each deliverable within a multiple-deliverable revenue arrangement as a separate unit of accounting under the new guidance if both of the following criteria are met: (a) the delivered item or items have value to the customer on a standalone basis and (b) for an arrangement that includes a general right of return relative to the delivered item(s), we consider delivery or performance of the undelivered item(s) probable and substantially in our control. We consider a deliverable to have standalone value if we sell this item separately or if the item is sold by another vendor or could be resold by the customer. Further, our revenue arrangements generally do not include a right of return relative to delivered services.
We combine deliverables not meeting the criteria for being a separate unit of accounting with a deliverable that does meet that criterion. We then determine the appropriate allocation of arrangement consideration and recognition of revenue for the combined unit of accounting.
Deferred revenue consists of revenue for services to be delivered in the future and consists primarily of advance billings, which we amortize over the respective service period. We defer and amortize revenues associated with billings for installation of customer network equipment over the estimated life of the customer relationship, which was, on average, approximately five years for 2012 and four years for 2011 and 2010. We defer and amortize revenues for installation services because the installation service is integral to our primary service offering and does not have value to customers on a stand-alone basis. We also defer and amortize the associated incremental direct costs.
- 24 -
We routinely review the collectability of our accounts receivable and payment status of our customers. If we determine that collection of revenue is uncertain, we do not recognize revenue until collection is reasonably assured. Additionally, we maintain an allowance for doubtful accounts resulting from the inability of our customers to make required payments on accounts receivable. We base the allowance for doubtful accounts upon general customer information, which primarily includes our historical cash collection experience and the aging of our accounts receivable. We assess the payment status of customers by reference to the terms under which we provide services or goods, with any payments not made on or before their due date considered past-due. Once we have exhausted all collection efforts, we write the uncollectible balance off against the allowance for doubtful accounts. We routinely perform credit checks for new and existing customers and require deposits or prepayments for customers that we perceive as being a credit risk. In addition, we record a reserve amount for SLAs and other sales adjustments
Goodwill and Other Intangible and Long-lived Assets
Our annual assessment of goodwill for impairment includes comparing the fair value of each reporting unit to the carrying value, referred to as step one. We estimate fair value using a combination of discounted cash flow models and market approaches. If the fair value of a reporting unit exceeds its carrying value, goodwill is not impaired and no further testing is necessary. If the carrying value of a reporting unit exceeds its fair value, we perform a second test, referred to as step two, to measure the amount of impairment to goodwill, if any. To measure the amount of any impairment, we determine the implied fair value of goodwill in the same manner as if we were acquiring the affected reporting unit in a business combination. Specifically, we allocate the fair value of the affected reporting unit to all of the assets and liabilities of that unit, including any unrecognized intangible assets, in a hypothetical calculation that would yield the implied fair value of goodwill. If the implied fair value of goodwill is less than the goodwill recorded on our consolidated balance sheet, we record an impairment charge for the difference.
We base the impairment analysis of goodwill on estimated fair values. The assumptions, inputs and judgments used in performing the valuation analysis are inherently subjective and reflect estimates based on known facts and circumstances at the time we perform the valuation. These estimates and assumptions primarily include, but are not limited to, discount rates; terminal growth rates; projected revenues and costs; projected EBITDA for expected cash flows; market comparables and capital expenditures forecasts. The use of different assumptions, inputs and judgments, or changes in circumstances, could materially affect the results of the valuation. Due to the inherent uncertainty involved in making these estimates, actual results could differ from our estimates and could result in additional non-cash impairment charges in the future.
We perform our annual goodwill impairment test as of August 1 absent any impairment indicators or other changes that may cause more frequent analysis. We did not identify an impairment as a result of our annual August 1, 2012 impairment test and none of our reporting units were at risk of failing step one. In addition, we assess on a quarterly basis whether any events have occurred or circumstances have changed that would indicate an impairment could exist. We considered the likelihood of triggering events that might cause us to reassess goodwill on an interim basis and concluded that none had occurred subsequent to August 1, 2012.
Other intangible assets have finite lives and we record these assets at cost less accumulated amortization. We calculate amortization on a straight-line basis over the estimated economic useful life of the assets, which are five to eight years for acquired technologies and 10 years for customer relationships and trade names. We assess other intangible assets and long-lived assets on a quarterly basis whenever any events have occurred or circumstances have changed that would indicate impairment could exist. Our assessment is based on estimated future cash flows directly associated with the asset or asset group. If we determine that the carrying value is not recoverable, we may record an impairment charge, reduce the estimated remaining useful life or both.
During 2012, we concluded that no impairment indicators existed to cause us to reassess our other intangible assets. However, during 2012 and 2011, we concluded that an impairment indicator existed to cause us to reassess our internal-use developed software, which is included in "Property and equipment, net" on the accompanying consolidated balance sheets. Following the reassessment, further described in note 4, we recorded an impairment charge of $0.4 million and $0.5 million in 2012 and 2011, respectively, which is included in "Exit activities, restructuring and impairments" on the accompanying consolidated statements of operations and comprehensive loss.
Property and Equipment
We carry property and equipment at original acquisition cost less accumulated depreciation and amortization. We calculate depreciation and amortization on a straight-line basis over the estimated useful lives of the assets. As of January 1, 2012, estimated useful lives used for network equipment are generally five years; furniture, equipment and software are five to seven years; and leasehold improvements are 10 to 25 years or over the lease term, depending on the nature of the improvement. We capitalize additions and improvements that increase the value or extend the life of an asset. We expense maintenance and repairs as incurred. We charge gains or losses from disposals of property and equipment to operations.
- 25 -
During January 2012, we reassessed the estimated useful lives of certain assets included in our property and equipment, as we determined we were generally using these assets longer than originally anticipated. As a result, the estimated useful lives of these assets were affected as follows:
Estimated Useful Life (in years) | ||||||
Original | Revised | |||||
Network equipment | 3 | 5 | ||||
C Capitalized software | 3 | 5 | ||||
Leasehold improvements | 7 | 10-25 | ||||
Effective January 1, 2012, we accounted for the change in estimated useful lives as a change in accounting estimate on a prospective basis. For the year ended December 31, 2012, depreciation and amortization expense was $15.4 million less than it would have been under the previous estimated useful lives. The per share effect of this change was $0.30 for the year ended December 31, 2012.
The assessment for recognition of deferred tax assets based on the change in estimated useful lives is not reasonably determinable. We expect pretax book income to be larger in the future as a result of this change in accounting estimate. Accordingly, it is possible that we will recognize deferred tax assets in the future if there is evidence of profitable growth. We do not expect to recognize the deferred tax assets in the next 12 months; however, it is possible that we could achieve profitable growth in future periods.
Exit Activities and Restructuring
When circumstances warrant, we may elect to exit certain business activities or change the manner in which we conduct ongoing operations. If we make such a change, we will estimate the costs to exit a business or restructure ongoing operations. The components of the estimates may include estimates and assumptions regarding the timing and costs of future events and activities that represent our best expectations based on known facts and circumstances at the time of estimation. If circumstances warrant, we will adjust our previous estimates to reflect what we then believe to be a more accurate representation of expected future costs. Because our estimates and assumptions regarding exit activities and restructuring charges include probabilities of future events, such as our ability to find a sublease tenant within a reasonable period of time or the rate at which a sublease tenant will pay for the available space, such estimates are inherently vulnerable to changes due to unforeseen circumstances that could materially and adversely affect our results of operations. If the amount of time that we expect it to take to find sublease tenants in all of the vacant space already in restructuring were to increase by three months and assuming no other changes to the properties in restructuring, we would record an additional $0.2 million in restructuring charges in the consolidated statements of operations and comprehensive loss during the period in which the change in estimate occurred. We monitor market conditions at each period end reporting date and will continue to assess our key assumptions and estimates used in the calculation of our exit activities and restructuring accrual.
Income Taxes
We maintain a valuation allowance to reduce our deferred tax assets to their estimated realizable value. Although we consider the potential for future taxable income and ongoing prudent and feasible tax planning strategies in assessing the need for the valuation allowance, if we determine we would be able to realize our deferred tax assets in the future in excess of our net recorded amount, an adjustment to reduce the valuation allowance would increase net income in the period we made such determination. We may recognize deferred tax assets in future periods if and when we estimate them to be realizable and supported by historical trends of profitability and expectations of future profits within each tax jurisdiction.
Based on an analysis of our historic and projected future U.S. pre-tax income, we do not have sufficient positive evidence to expect a release of our valuation allowance against our U.S. deferred tax assets currently or within the next 12 months. Accordingly, we continue to maintain the full valuation allowance in the U.S. and all foreign jurisdictions, other than the United Kingdom ("U.K.").
Stock-Based Compensation
We measure stock-based compensation cost at the grant date based on the calculated fair value of the award. We recognize the expense over the employee's requisite service period, generally the vesting period of the award. The fair value of restricted stock is the market value on the date of grant. The fair value of stock options is estimated at the grant date using the Black-Scholes option pricing model with weighted average assumptions for the activity under our stock plans. Option pricing model input assumptions, such as expected term, expected volatility and risk-free interest rate, impact the fair value estimate. Further, the forfeiture rate impacts the amount of aggregate compensation. These assumptions are subjective and generally require significant analysis and judgment to develop.
The expected term represents the weighted average period of time that we expect granted options to be outstanding, considering the vesting schedules and our historical exercise patterns. Because our options are not publicly traded, we assume volatility based on the historical volatility of our stock. The risk-free interest rate is based on the U.S. Treasury yield curve in effect at the time of grant for periods corresponding to the expected option term. We have also used historical data to estimate option exercises, employee termination and stock option forfeiture rates. Changes in any of these assumptions could materially impact our results of operations in the period the change is made.
- 26 -
Capitalized Software Costs
We capitalize internal-use software development costs incurred during the application development stage. Amortization begins once the software is ready for its intended use and is computed based on the straight-line method over the economic life of the software product. Judgment is required in determining which software projects are capitalized and the resulting economic life.
Recent Accounting Pronouncements
Recent accounting pronouncements are summarized in note 2 to the accompanying consolidated financial statements. Currently, we do not expect any recent accounting pronouncements that we have not yet adopted to have a material impact on our consolidated financial statements.
Results of Operations
Revenues
We generate revenues primarily from the sale of data center services and IP services.
Direct Costs of Network, Sales and Services
Direct costs of network, sales and services are comprised primarily of:
| ● | costs for connecting to and accessing ISPs and competitive local exchange providers; |
| ● | facility and occupancy costs, including power and utilities, for hosting and operating our and our customers' network equipment; |
| ● | costs incurred for providing additional third party services to our customers; and |
| ● | royalties and costs of license fees for operating systems software. |
If a network access point is not colocated with the respective ISP, we may incur additional local loop charges on a recurring basis. Connectivity costs vary depending on customer demands and pricing variables while network access point facility costs are generally fixed. Direct costs of network, sales and services do not include compensation, depreciation or amortization.
Direct Costs of Customer Support
Direct costs of customer support consist primarily of compensation and other personnel costs for employees engaged in connecting customers to our network, installing customer equipment into network access point facilities and servicing customers through our network operations centers. In addition, direct costs of customer support include facilities costs associated with the network operations centers, including costs related to servicing our data center customers.
Direct Costs of Amortization of Acquired Technologies
Direct costs of amortization of acquired technologies are for technologies acquired through business combinations that are an integral part of the services we sell. We record amortization using the greater of (a) the ratio of current revenues to total and anticipated future revenues for the applicable technology or (b) the straight-line method over the remaining estimated economic life. We amortize the cost of the acquired technologies over their useful lives of five to eight years. The carrying value of the acquired technologies at December 31, 2012 was $14.1 million and the weighted average remaining life was approximately six years.
Sales and Marketing
Sales and marketing costs consist of compensation, commissions, bonuses and other costs for personnel engaged in marketing, sales and field service support functions, and advertising, online marketing, tradeshows, direct response programs, facility open houses, management of our external website and other promotional costs.
General and Administrative
General and administrative costs consist primarily of compensation and other expense for executive, finance, product development, human resources and administrative personnel, professional fees and other general corporate costs. General and administrative costs also include consultant fees and non-capitalized prototype costs related to the design, development and testing of our proprietary technology, enhancement of our network management software and development of internal systems. We capitalize costs associated with internal-use software when the software enters the application development stage until the software is ready for its intended use. We expense all other product development costs as incurred.
- 27 -
Results of Operations
The following table sets forth selected consolidated statements of operations and comprehensive loss data during the periods presented, including comparative information between the periods (dollars in thousands):
Year Ended December 31, | Increase | Increase | ||||||||||||||||||||||||||
2012 | 2011 | 2010 | Amount | Percent | Amount | Percent | ||||||||||||||||||||||
Revenues: | ||||||||||||||||||||||||||||
Data center services | $ | 167,286 | $ | 133,453 | $ | 128,200 | $ | 33,833 | 25 | % | $ | 5,253 | 4 | % | ||||||||||||||
IP services | 106,306 | 111,175 | 115,964 | (4,869 | ) | (4 | ) | (4,789 | ) | (4 | ) | |||||||||||||||||
Total revenues | 273,592 | 244,628 | 244,164 | 28,964 | 12 | 464 | - | |||||||||||||||||||||
Operating costs and expenses: | ||||||||||||||||||||||||||||
Direct costs of network, sales and services, exclusive of depreciation and | ||||||||||||||||||||||||||||
Data center services | 90,604 | 78,907 | 82,761 | 11,697 | 15 | (3,854 | ) | (5 | ) | |||||||||||||||||||
IP services | 40,350 | 41,403 | 44,662 | (1,053 | ) | (3 | ) | (3,259 | ) | (7 | ) | |||||||||||||||||
Direct costs of customer support | 26,664 | 21,278 | 19,861 | 5,386 | 25 | 1,417 | 7 | |||||||||||||||||||||
Direct costs of amortization of acquired technologies | 4,718 | 3,500 | 3,811 | 1,218 | 35 | (311 | ) | (8 | ) | |||||||||||||||||||
Sales and marketing | 31,343 | 29,715 | 29,232 | 1,628 | 5 | 483 | 2 | |||||||||||||||||||||
General and administrative | 38,635 | 33,952 | 33,048 | 4,683 | 14 | 904 | 3 | |||||||||||||||||||||
Depreciation and amortization | 36,147 | 36,926 | 30,158 | (779 | ) | (2 | ) | 6,768 | 22 | |||||||||||||||||||
(Gain) loss on disposal of property and equipment, net | (55 | ) | 37 | 116 | (92 | ) | (249 | ) | (79 | ) | (68 | ) | ||||||||||||||||
Exit activities, restructuring and impairments | 1,422 | 2,833 | 1,411 | (1,411 | ) | (50 | ) | 1,422 | 101 | |||||||||||||||||||
Total operating costs and expenses | 269,828 | 248,551 | 245,060 | 21,277 | 9 | 3,491 | 1 | |||||||||||||||||||||
Income (loss) from operations | $ | 3,764 | $ | (3,923 | ) | $ | (896 | ) | $ | 7,687 | 196 | $ | 3,027 | 338 | ||||||||||||||
Interest expense | $ | 7,566 | $ | 3,701 | $ | 2,170 | $ | 3,865 | 104 | $ | 1,531 | 71 | ||||||||||||||||
Provision (benefit) for income taxes | $ | 453 | $ | (5,612 | ) | $ | 952 | $ | 6,065 | 108 | % | $ | (6,564 | ) | (689 | )% | ||||||||||||
- 28 -
Segment Information
We operate in two business segments: data center services and IP services. Segment results for each of the three years ended December 31, 2012 are summarized as follows (in thousands):
Year Ended December 31, | ||||||||||||
2012 | 2011 | 2010 | ||||||||||
Revenues: | ||||||||||||
Data center services | $ | 167,286 | $ | 133,453 | $ | 128,200 | ||||||
IP services | 106,306 | 111,175 | 115,964 | |||||||||
Total revenues | 273,592 | 244,628 | 244,164 | |||||||||
Direct costs of network, sales and services, exclusive of depreciation and amortization: | ||||||||||||
Data center services | 90,604 | 78,907 | 82,761 | |||||||||
IP services | 40,350 | 41,403 | 44,662 | |||||||||
Total direct costs of network, sales and services, exclusive of depreciation and amortization | 130,954 | 120,310 | 127,423 | |||||||||
Segment profit: | ||||||||||||
Data center services | 76,682 | 54,546 | 45,439 | |||||||||
IP services | 65,956 | 69,772 | 71,302 | |||||||||
Total segment profit | 142,638 | 124,318 | 116,741 | |||||||||
Exit activities, restructuring and impairments | 1,422 | 2,833 | 1,411 | |||||||||
Other operating expenses, including direct costs of customer support, depreciation and amortization | 137,452 | 125,408 | 116,226 | |||||||||
Income (loss) from operations | 3,764 | (3,923 | ) | (896 | ) | |||||||
Non-operating expense | 7,849 | 3,866 | 2,170 | |||||||||
Loss before income taxes and equity in (earnings) of equity-method investment | $ | (4,085 | ) | $ | (7,789 | ) | $ | (3,066 | ) | |||
Segment profit is segment revenues less direct costs of network, sales and services, exclusive of depreciation and amortization and does not include direct costs of customer support, direct costs of amortization of acquired technologies or any other depreciation or amortization associated with direct costs. Segment profit is a supplemental financial measure that is not prepared in accordance with GAAP. We view direct costs of network, sales and services as generally less-controllable, external costs and we regularly monitor the margin of revenues in excess of these direct costs. We also view the costs of customer support to be an important component of costs of revenues but believe that the costs of customer support are more within our control and, to some degree, discretionary in that we can adjust those costs by managing personnel needs. We also have excluded depreciation and amortization from segment profit because it is based on estimated useful lives of tangible and intangible assets. Further, we base depreciation and amortization on historical costs incurred to build out our deployed network and the historical costs of these assets may not be indicative of current or future capital expenditures. Although we believe, for the foregoing reasons, that our presentation of segment profit non-GAAP financial measures provides useful supplemental information to investors regarding our results of operations, our non-GAAP financial measures should only be considered in addition to, and not as a substitute for, or superior to, any measure of financial performance prepared in accordance with GAAP.
Years Ended December 31, 2012 and 2011
Data Center Services
Revenues for data center services increased $33.8 million, or 25%, to $167.3 million for the year ended December 31, 2012, compared to $133.5 million for the same period in 2011. The increase in revenue was primarily due to net revenue growth in company-controlled colocation and hosting services, which includes revenue attributable to Voxel.
Direct costs of data center services, exclusive of depreciation and amortization, were $90.6 million for the year ended December 31, 2012, compared to $78.9 million for the same period in 2011. The increase in direct costs was primarily due to the revenue growth in hosting services and increased costs related to the opening of our Los Angeles, California and the expansion of our Atlanta, Georgia data centers, as well as $0.7 million in non-recurring expenses. These increases were partially offset by a $0.5 million nonrecurring settlement of past charges with a data center vendor.
- 29 -
Direct costs of data center services, exclusive of depreciation and amortization, have substantial fixed cost components, primarily rent for operating leases, but also significant demand-based pricing variables, such as utilities attributable to seasonal costs and customers' changing power requirements. Direct costs of data center services as a percentage of revenues vary with the mix of usage between company-controlled data centers and partner sites, and the utilization of total available space. Since we recognize some of the initial operating costs of company-controlled data centers in advance of revenues or in advance of sites being fully utilized, these sites are less profitable in the early years of operation compared to partner sites and would be expected to be more profitable as occupancy increases. Conversely, costs in partner sites are more demand-based and therefore are more closely associated with the recognition of revenues.
We will continue to focus on increasing revenues from company-controlled facilities as compared to partner sites. We also expect direct costs of data center services as a percentage of corresponding revenues to decrease as our new and recently-expanded company-controlled data centers continue to contribute to revenue and become more fully occupied. This is evidenced by the improvement in direct costs of data center services as a percentage of corresponding revenues of 54% during the year ended December 31, 2012, compared to 59% during the same period in 2011.
IP Services
Revenues for IP services decreased $4.9 million, or 4%, to $106.3 million for the year ended December 31, 2012, compared to $111.2 million for the same period in 2011. The decrease was driven by a decline in IP pricing for new and renewing customers and the loss of legacy contracts at higher effective prices, partially offset by an increase in overall traffic. IP traffic increased approximately 36% for the year ended December 31, 2012, compared to the same period in 2011, calculated based on an average over the number of months in the respective periods.
Direct costs of IP services, exclusive of depreciation and amortization, decreased $1.1 million, or 3%, to $40.4 million for the year ended December 31, 2012, compared to $41.4 million for the same period in 2011. This decrease was primarily due to renegotiation of vendor contracts and cost reduction efforts.
There have been ongoing industry-wide pricing declines over the last several years and this trend continued during the years ended December 31, 2012 and 2011. Technological improvements and excess capacity have been the primary drivers for lower pricing of IP services and the entrance of a large number of specialty service providers such as CDN vendors. We also continue to experience increasing traffic volume in our traditional IP services. The increase in IP traffic resulted from both new and existing customers using more applications and the nature of applications consuming greater amounts of bandwidth. We believe we remain well-positioned to benefit from reliance on the Internet as the medium for business applications, media distribution, communication and entertainment.
Other Operating Costs and Expenses
Compensation. Total compensation and benefits, including stock-based compensation, were $67.5 million and $56.7 million for the years ended December 31, 2012 and 2011, respectively.
Cash-based compensation and benefits increased $9.0 million to $61.7 million during the year ended December 31, 2012 from $52.7 million during the same period in 2011. The increase was primarily due to a $6.3 million increase related to a higher employee headcount and increased salary levels, a $0.5 million increase attributable to credits we recorded in 2011 related to prior years' Georgia Headquarters Tax Credit ("HQC"), a $1.1 million increase in insurance benefit costs and a $1.4 million increase in accrued bonus compensation, partially offset by a $0.4 million decrease in severance. The HQC is sponsored by the state of Georgia to incentivize companies to relocate corporate headquarters to and increase employment in Georgia. We record the HQC when approved by the Georgia Department of Revenue and are required to apply the credit against our state payroll liability.
Stock-based compensation, net of amount capitalized, increased to $5.9 million during the year ended December 31, 2012 from $4.0 million during the same period in 2011. The increase in the year ended December 31, 2012 was primarily due to stock-based compensation awarded in connection with the Voxel acquisition and forfeitures upon terminations of employment in the year ended December 31, 2011. The following table summarizes the amount of stock-based compensation, net of estimated forfeitures, included in the accompanying consolidated statements of operations and comprehensive loss (in thousands):
2012 | 2011 | |||||||
Direct costs of customer support | $ | 936 | $ | 659 | ||||
Sales and marketing | 929 | 835 | ||||||
General and administrative | 3,993 | 2,489 | ||||||
| $ | 5,858 | $ | 3,983 | |||||
Direct Costs of Customer Support . Direct costs of customer support increased 25% to $26.7 million during the year ended December 31, 2012 from $21.3 million during the same period in 2011. The increase was primarily due to a $4.6 million increase in cash-based compensation and payroll taxes and a $0.3 million increase in stock-based compensation, partially offset by a decrease of $0.4 million in facilities expense related to our corporate office move in March 2012.
- 30 -
Direct Costs of Amortization of Acquired Technologies . Direct costs of amortization of acquired technologies increased 35% to $4.7 million during the year ended December 31, 2012 from $3.5 million during the same period in 2011. The increase was primarily due to the amortization of intangible assets acquired from Voxel.
Sales and Marketing . Sales and marketing costs increased 5% to $31.3 million during the year ended December 31, 2012 from $29.7 million during the same period in 2011. The increase was primarily due to a $1.0 million increase in cash-based compensation and payroll taxes, a $0.7 million increase in commissions and a $0.4 million increase in marketing programs, partially offset by a decrease of $0.4 million in facilities expense related to our corporate office move in March 2012.
General and Administrative . General and administrative costs increased 14% to $38.6 million during the year ended December 31, 2012 from $34.0 million during the same period in 2011. The increase was primarily due to a $0.7 million increase in cash-based compensation costs and payroll taxes, a $1.4 million increase in accrued bonus compensation, a $1.5 million increase in stock-based compensation, a $0.5 million increase in insurance costs and a $0.3 million increase in outside professional fees primarily for recruiting and labor, partially offset by a $0.4 million decrease in severance and a decrease of $0.3 million in facilities expense related to our corporate office move in March 2012.
Depreciation and Amortization . Depreciation and amortization was $36.1 million and $36.9 million during the years ended December 31, 2012 and 2011, respectively. The decrease was primarily due to our change in estimated useful lives resulting in $15.4 million less expense than it would have been under the previous estimated useful lives on assets held at December 31, 2011, partially offset by the effects of expanding our company-controlled data centers, P-NAP infrastructure and capitalized software.
Exit Activities, Restructuring and Impairments . For the year ended December 31, 2012, exit activities, restructuring and impairments were $1.4 million during the year ended December 31, 2012, compared to $2.8 million during the same period in 2011.
Exit activities and restructuring charges were $1.0 million and $2.3 million during the years ended December 31, 2012 and 2011, respectively. The charges in both years primarily related to subsequent plan adjustments we made in sublease income assumptions for certain properties included in our previously-disclosed exit and restructuring plans. Due to current economic conditions, these adjustments extend the period during which we do not anticipate receiving sublease income from those properties given our expectation that it will take longer to find sublease tenants and the increased availability of space in each of these markets where we have unused space.
Impairment charges, related to developed software, were $0.4 million and $0.5 million during the years ended December 31, 2012 and 2011, respectively. While Voxel's products are complementary to our existing IT Infrastructure services, we will not use certain of our assets in the same manner as we would have used them had the acquisition not taken place. As such, we evaluated our suite of IT Infrastructure services for impairment. The evaluation resulted in an impairment charge for both years to developed software related to our cloud portal functionality, included in the data center services segment.
Interest Expense . Interest expense increased to $7.6 million during the year ended December 31, 2012, compared to $3.7 million during the same period in 2011. The increase in interest expense was primarily due to new capital lease obligations related to expanding our company-controlled data centers and the increase in our borrowings under our term loan and revolving credit facility.
Provision (Benefit) for Income Taxes . The provision for income taxes was $0.5 million during the year ended December 31, 2012, compared to a benefit for income taxes of $5.6 million during the same period in 2011. The variance was primarily due to a $6.1 million deferred tax benefit, recorded during 2011, resulting from Voxel purchase accounting.
Our effective income tax rate, as a percentage of pre-tax income, for the years ended December 31, 2012 and 2011 was 11% and (72%), respectively. The fluctuation in the effective income tax rate was attributable to recognition of income taxes in the U.K., permanent tax adjustment items, a change in valuation allowance primarily from Voxel purchase accounting during 2011 and state income taxes.
Years Ended December 31, 2011 and 2010
Data Center Services
Revenues for data center services increased $5.3 million, or 4%, to $133.5 million during the year ended December 31, 2011, compared to $128.2 million during the same period in 2010. The increase in revenue was primarily due to net revenue growth in company-controlled colocation and hosting services.
Direct costs of data center services, exclusive of depreciation and amortization, decreased $3.9 million, or 5%, to $78.9 million during the year ended December 31, 2011, compared to $82.8 during the same period in 2010. The decrease was primarily the result of the termination of partner leases related to our proactive churn program. Direct costs of data center services as a percentage of corresponding revenues was 59% during the year ended December 31, 2011, as compared to 65% during the same period in 2010.
- 31 -
IP Services
Revenues for IP services decreased $4.8 million, or 4%, to $111.2 million during the year ended December 31, 2011, compared to $116.0 million during the same period in 2010. The decrease was driven by a decline in IP pricing for new and renewing customers and the loss of legacy contracts at higher effective prices, partially offset by an increase in overall traffic. IP traffic increased approximately 19% during the year ended December 31, 2011, compared to the same period in 2010, calculated based on an average over the number of months in the respective periods.
Direct costs of IP services, exclusive of depreciation and amortization, decreased $3.3 million, or 7%, to $41.4 million during the year ended December 31, 2011, compared to $44.7 million during the same period in 2010. This decrease was due to lower connectivity costs, which vary based upon demand-based pricing variables. Costs for IP services are subject to ongoing negotiations for pricing and minimum commitments.
Other Operating Costs and Expenses
Compensation. Total compensation and benefits, including stock-based compensation, were $56.7 million and $56.2 million during the years ended December 31, 2011 and 2010, respectively.
Cash-based compensation and benefits increased $1.1 million to $52.7 million during the year ended December 31, 2011 from $51.6 million during the same period in 2010. The increase was primarily due to a $3.8 million increase in cash-based compensation and payroll taxes related to a higher employee headcount and increased salary levels, a $0.6 million increase in severance and a $0.8 million increase attributable to credits we recorded in 2010 related to prior years' HQC, partially offset by a $3.3 million decrease due to capitalized payroll costs and benefits related to software development in 2011 and a $0.5 million decrease in insurance expense.
Stock-based compensation decreased $0.6 million to $4.0 million during the year ended December 31, 2011 from $4.6 million during the same period in 2010. The decrease was primarily due to $0.4 million related to differences in vesting terms for grants in 2010 as compared to those in 2011 and $0.3 million for capitalized costs related to software development in 2011. The following table summarizes the amount of stock-based compensation, net of estimated forfeitures, included in the accompanying consolidated statements of operations and comprehensive loss (in thousands):
2011 | 2010 | |||||||
Direct costs of customer support | $ | 659 | $ | 755 | ||||
Sales and marketing | 835 | 944 | ||||||
General and administrative | 2,489 | 2,932 | ||||||
| $ | 3,983 | $ | 4,631 | |||||
Direct Costs of Customer Support . Direct costs of customer support increased 7% to $21.3 million during the year ended December 31, 2011 from $19.9 million during the same period in 2010. The increase was primarily due to a $1.3 million increase in cash-based compensation costs and a $0.4 million increase in professional services, offset by a $0.3 million decrease due to capitalized payroll costs related to software development in the year ended December 31, 2011.
Direct Costs of Amortization of Acquired Technologies . Direct costs of amortization of acquired technologies were $3.5 million and $3.8 million during the years ended December 31, 2011 and 2010, respectively.
Sales and Marketing . Sales and marketing costs increased 2% to $29.7 million during the year ended December 31, 2011 from $29.2 million during the same period in 2010. The increase was primarily due to a $0.9 million increase in cash-based compensation costs and a $0.5 million increase in sales training and conference costs, partially offset by a $0.4 million decrease in commissions and a $0.6 million decrease in professional services.
General and Administrative . General and administrative costs increased 3% to $34.0 million during the year ended December 31, 2011 from $33.0 million during the same period in 2010. The increase was primarily due to (a) a $1.3 million increase in cash-based compensation costs, (b) a $0.5 million increase attributable to credits we recorded in 2010 related to prior years' HQC, (c) a $0.6 million increase in severance, (d) a $0.6 million increase in non-capitalized software and support and (e) a $1.3 million increase in professional services, which included $0.6 million of Voxel acquisition costs, partially offset by (x) a $2.6 million decrease due to capitalized payroll costs related to software development during the year ended December 31, 2011, (y) a $0.4 million decrease in stock-based compensation and (z) a $0.3 million decrease in taxes, licenses and fees.
Depreciation and Amortization . Depreciation and amortization increased 22% to $36.9 million during the year ended December 31, 2011, compared to $30.2 million during the same period in 2010. The increase was primarily due to the effects of our expansion of company-controlled data centers and network infrastructure.
- 32 -
Exit Activities, Restructuring and Impairments . For the year ended December 31, 2011, exit activities, restructuring and impairments were $2.8 million during the year ended December 31, 2011, compared to $1.4 million during the same period in 2010.
Exit activities and restructuring charges were $2.3 million and $1.4 million during the years ended December 31, 2011 and 2010, respectively. The charges in both years primarily related to subsequent plan adjustments we made in sublease income assumptions for certain properties included in our previously-disclosed exit and restructuring plans.
Impairment charges were $0.5 million, related to developed software, and $0 during the years ended December 31, 2011 and 2010, respectively.
Interest Expense . Interest expense increased to $3.7 million during the year ended December 31, 2011, compared to $2.2 million during the same period in 2010. The increase in interest expense was primarily due to new capital lease obligations related to our expansion of company-controlled data centers.
(Benefit) Provision for Income Taxes . The benefit for income taxes was $5.6 million during the year ended December 31, 2011, compared to a provision of $1.0 million during the same period in 2010. The variance was primarily due to a $6.1 million deferred tax benefit resulting from Voxel purchase accounting that offset our existing income tax expense of $0.5 million. The $6.1 million deferred tax benefit lowered our consolidated net deferred tax asset and required a release of valuation allowance. Our effective income tax rate, as a percentage of pre-tax income, for the years ended December 31, 2011 and 2010 was (72%) and 31%, respectively. The fluctuation in the effective income tax rate was attributable to recognition of income taxes in the U.K., permanent tax adjustment items, a change in valuation allowance primarily from Voxel purchase accounting and state income taxes.
Liquidity and Capital Resources
Liquidity
We monitor and review our performance and operations in light of global economic conditions. The current economic environment may impact the ability of our customers to meet their obligations to us, which could result in delayed collection of accounts receivable and an increase in our provision for doubtful accounts.
We expect to meet our cash requirements for the next 12 months through a combination of net cash provided by operating activities, existing cash on hand and utilizing additional borrowings under our credit facility described below in "Capital Resources-Credit Agreement". Our capital requirements depend on a number of factors, including the continued market acceptance of our IT Infrastructure services and the ability to expand and retain our customer base. If our cash requirements vary materially from what we expect or if we fail to generate sufficient cash flows from selling our IT Infrastructure services, we may require additional financing sooner than anticipated. We can offer no assurance that we will be able to obtain additional financing on commercially favorable terms, or at all, and provisions in our credit agreement limit our ability to incur additional indebtedness. Our anticipated uses of cash include capital expenditures, working capital needs and required payments on our credit agreement and other commitments.
We have a history of quarterly and annual period net losses. During the year ended December 31, 2012, we had a net loss of $4.3 million. As of December 31, 2012, our accumulated deficit was $1.0 billion. We continue to analyze our business to control our costs, principally through making process enhancements and renegotiating network contracts for more favorable pricing and terms. We may not be able to sustain or increase profitability on a quarterly basis, and our failure to do so may adversely affect our business, including our ability to raise additional funds.
Capital Resources
Credit Agreement. In August 2012, we amended our credit agreement (the "Amendment"), which increased the revolving credit facility by $10.0 million, for a total revolving credit facility of $70.0 million, and increased the term loan by $10.0 million, for a total term loan of $67.3 million. In addition, the quarterly payment amount on the term loan was increased from $750,000 to $875,000, the due date for the revolving credit facility and the term loan was extended to August 2015 and the minimum liquidity covenant was reduced from $30.0 million to $20.0 million.
As of December 31, 2012, the revolving credit facility had an outstanding balance of $30.5 million and we issued $13.6 million letters of credit, resulting in $25.9 million in borrowing capacity. The term loan had an outstanding principal amount of $65.5 million, which we repay in $875,000 quarterly installments on the last day of each fiscal quarter, with the remaining unpaid balance due on August 30, 2015. As of December 31, 2012, the interest rate on the revolving credit facility and term loan was 3.7%. Subsequent to December 31, 2012, we relieved $5.0 million in letters of credit in conjunction with the settlement of our accrued contingent consideration. See note 9 to the accompanying consolidated financial statements for information on the accrued contingent consideration.
- 33 -
The credit agreement includes customary representations, warranties, negative and affirmative covenants, including certain financial covenants relating to minimum liquidity, fixed charge coverage ratio and senior leverage ratio. As of December 31 2012, we were in compliance with these covenants. We summarize the credit agreement in note 10 to the accompanying consolidated financial statements.
Capital Leases. During 2011, we entered into a capital lease for new corporate office space in Atlanta, Georgia due to our Atlanta data center expansion into our then-existing corporate office space. During March 2012, we took possession of the space when it was available according to terms of the lease and recorded the related property and corresponding capital lease obligation of $7.4 million. In addition, during 2012, we entered into a capital lease for network equipment for $2.7 million.
Our future minimum lease payments on all remaining capital lease obligations at December 31, 2012 were $48.6 million. We summarize our existing capital lease obligations in note 10 to the accompanying consolidated financial statements.
In addition, in October 2012, we entered into a lease for new company-controlled data center space to expand our existing services in the metro New York area. This long term lease will increase our company-controlled data center footprint by approximately 55,000 net sellable square feet over time. In January 2013, we took possession of the space when it was available according to the lease and recorded the related property and equipment and corresponding capital lease obligation of $9.4 million.
Commitments and Other Obligations. We have commitments and other obligations that are contractual in nature and will represent a use of cash in the future unless the agreements are modified. Service and purchase commitments primarily relate to IP, telecommunications and data center services. Our ability to improve cash provided by operations in the future would be negatively impacted if we do not grow our business at a rate that would allow us to offset the purchase and service commitments with corresponding revenue growth.
The following table summarizes our commitments and other obligations as of December 31, 2012 (in thousands):
Payments Due by Period | ||||||||||||||||||||
Total | Less than 1 year | 1-3 Years | 3-5 Years | More than 5 years | ||||||||||||||||
Revolving credit facility (1) | $ | 33,564 | $ | 1,150 | $ | 32,414 | $ | - | $ | - | ||||||||||
Term loan (1) | 71,653 | 5,921 | 65,732 | - | - | |||||||||||||||
Capital lease obligations, including interest | 69,833 | 8,710 | 18,299 | 16,227 | 26,597 | |||||||||||||||
Operating lease commitments | 149,476 | 29,030 | 49,143 | 36,177 | 35,126 | |||||||||||||||
Service and purchase commitments (2) | 15,710 | 6,304 | 7,035 | 1,942 | 429 | |||||||||||||||
| $ | 340,236 | $ | 51,115 | $ | 172,623 | $ | 54,346 | $ | 62,152 | |||||||||||
(1) | At December 31, 2012, the interest rate was 3.7% and the projected interest included in the debt payments above incorporates this rate. |
(2) | Subsequent to December 31, 2012, we signed a minimum purchase commitment for data center services of $36.0 million to be paid over three years starting March 2013. This commitment renews our relationship with an existing data center vendor. |
Cash Flows
Operating Activities
Year Ended December 31, 2012 . Net cash provided by operating activities during the year ended December 31, 2012 was $43.7 million. Our net loss, after adjustments for non-cash items, generated cash from operations of $43.9 million, while changes in operating assets and liabilities used cash from operations of $(0.2) million. We expect to use cash flows from operating activities to fund a portion of our capital expenditures and other requirements and to meet our other commitments and obligations, including outstanding debt.
The primary non-cash adjustment for the year ended December 31, 2012 was $40.9 million for depreciation and amortization, which included the effects of the expansion of our company-controlled data centers and P-NAP facilities. Non-cash adjustments also included $5.9 million for stock-based compensation expense. The changes in operating assets and liabilities included a $1.4 million increase in accounts receivable, a $2.4 million increase in accrued liabilities and a $1.7 million decrease in exit activities and restructuring liability.
- 34 -
Days sales outstanding at December 31, 2012 was 25 days, down from 27 days at December 31, 2011. Days sales outstanding are measured as of a point in time and may fluctuate based on a number of factors, including, among other things, changes in revenues, cash collections, allowance for doubtful accounts and the amount of revenues billed in advance.
Year Ended December 31, 2011 . Net cash provided by operating activities during the year ended December 31, 2011 was $28.6 million. Our net loss, after adjustments for non-cash items, generated cash from operations of $38.9 million, while changes in operating assets and liabilities used cash from operations of $10.3 million.
The primary non-cash adjustment for the year ended December 31, 2011 was $40.4 million for depreciation and amortization, including direct costs of amortization of acquired technologies, which included the effects of the expansion of our company-controlled data centers and P-NAP facilities. Non-cash adjustments also included $4.0 million for stock-based compensation expense. The changes in operating assets and liabilities included a $1.2 million increase in accounts receivable, a $2.3 million increase in prepaid expenses, deposits and other assets and a $5.2 million decrease in accounts payable. Days sales outstanding at December 31, 2011 were 27 days, up from 26 days at December 31, 2010.
Year Ended December 31, 2010 . Net cash provided by operating activities during the year ended December 31, 2010 was $39.6 million. Our net loss, after adjustments for non-cash items, generated cash from operations of $37.3 million, while changes in operating assets and liabilities generated cash from operations of $2.3 million.
The primary non-cash adjustment for the year ended December 31, 2010 was $34.0 million for depreciation and amortization, including direct costs of amortization of acquired technologies, which included the effects of the expansion of our company-controlled data centers and P-NAP facilities. Non-cash adjustments also included $4.6 million for stock-based compensation expense. The changes in operating assets and liabilities included a $8.1 million increase in accounts payable primarily due to expenses incurred as a result of the upgrade and expansion of our company-controlled data centers, which was offset by a $2.1 million decrease in accrued and other liabilities and deferred revenues and a $2.6 million increase in inventory, prepaid expenses, deposits and other assets. Days sales outstanding at December 31, 2010 were 26 days, down from 27 days at December 31, 2009.
Investing Activities
Year Ended December 31, 2012 . Net cash used in investing activities during the year ended December 31, 2012 was $79.7 million, primarily due to capital expenditures of $74.9 million. Capital expenditures related to the continued expansion and upgrade of our company-controlled data centers and network infrastructure. In addition, we paid $4.8 million in accrued contingent consideration for technology deliverables attributable to the Voxel acquisition.
Year Ended December 31, 2011 . Net cash used in investing activities during the year ended December 31, 2011 was $96.3 million, due to capital expenditures of $68.6 million and the Voxel acquisition, net of cash received, of $27.7 million. Capital expenditures related to the continued expansion and upgrade of our company-controlled data centers and network infrastructure.
Year Ended December 31, 2010 . Net cash used in investing activities during the year ended December 31, 2010 was $55.2 million, due to capital expenditures of $62.2 million, offset by maturities of investments in marketable securities of $7.0 million. Capital expenditures related to the continued expansion and upgrade of our company-controlled data centers and network infrastructure.
Financing Activities
Year Ended December 31, 2012 . Net cash provided by financing activities during the year ended December 31, 2012 was $34.6 million, primarily due to $40.4 million proceeds received on the credit agreement, partially offset by principal payments of $3.3 million each on the credit agreement and capital lease obligations.
Year Ended December 31, 2011 . Net cash provided by financing activities during the year ended December 31, 2011 was $37.9 million, primarily due to proceeds received on the credit agreement. We had a balance of $58.9 million outstanding under our credit agreement at December 31, 2011.
Year Ended December 31, 2010 . Net cash provided by financing activities during the year ended December 31, 2010 was $1.2 million, primarily due to cash received upon the exercise of stock options. We also repaid $78.8 million and re-borrowed $78.0 million on our credit facilities. As a result of these activities, we had a balance of $19.8 million on our term loan at December 31, 2010.
Off-Balance Sheet Arrangements
As of December 31, 2012, 2011 and 2010, we did not have any relationships with unconsolidated entities or financial partnerships, such as entities often referred to as structured finance or special purpose entities, which would have been established for the purpose of facilitating off-balance sheet arrangements or other contractually narrow or limited purposes. Other than our operating leases, we do not engage in off-balance sheet financial arrangements.
- 35 -
I TEM 7A. QUANTITATIVE AND QUALITATIVE DISCLOSURES ABOUT MARKET RISK
Other Investments
Prior to 2012, we invested $4.1 million in Internap Japan Co., Ltd., our joint venture with NTT-ME Corporation and NTT Holdings. We account for this investment using the equity method and we have recognized $2.0 million in equity-method losses over the life of the investment, representing our proportionate share of the aggregate joint venture losses and income. The joint venture investment is subject to foreign currency exchange rate risk.
Interest Rate Risk
Our objective in managing interest rate risk is to maintain favorable long-term fixed rate or a balance of fixed and variable rate debt within reasonable risk parameters. Although our current strategy for managing interest rate risk does not include the use of derivative securities, in the future we may utilize these securities solely for the management of interest rate risk. As of December 31, 2012, our long-term debt consisted of $65.5 million borrowed under our term loan and $30.5 million borrowed under our revolving credit facility. Interest on the term loan was 3.7% based on either (a) the Base Rate (as defined in the credit agreement) plus 3.50 percentage points, or (b) the LIBOR Rate (as defined in the credit agreement) plus 3.50 percentage points, as we elect from time to time. Interest on the revolving credit facility was 3.7% based on either (x) the Base Rate plus 1.75 percentage points or (y) the LIBOR Rate plus 3.50 percentage points, as we elect from time to time. We estimate that a change in the interest rate of 100 basis points would change our interest expense and payments by $1.0 million per year, assuming we do not increase our amount outstanding.
Foreign Currency Risk
Substantially all of our revenue is currently in U.S. dollars and from customers in the U.S. We do not believe, therefore, that we currently have any significant direct foreign currency exchange rate risk.
I TEM 8. FINANCIAL STATEMENTS AND SUPPLEMENTARY DATA
Our accompanying consolidated financial statements, financial statement schedule and the report of our independent registered public accounting firm appear in Part IV of this Form 10-K. Our report on internal controls over financial reporting appears in Item 9A of this Form 10-K.
I TEM 9. CHANGES IN AND DISAGREEMENTS WITH ACCOUNTANTS ON ACCOUNTING AND FINANCIAL DISCLOSURE
None.
I TEM 9A. CONTROLS AND PROCEDURES
Evaluation of Disclosure Controls and Procedures
Based on our management's evaluation (with the participation of our Chief Executive Officer and Chief Financial Officer), as of the end of the period covered by this report, our Chief Executive Officer and Chief Financial Officer have concluded that our disclosure controls and procedures (as defined in Rules 13a-15(e) and 15d-15(e) under the Securities Exchange Act of 1934, as amended (the "Exchange Act")) are effective to ensure that information required to be disclosed by us in reports that we file or submit under the Exchange Act is recorded, processed, summarized and reported within the time periods specified in SEC rules and forms and is accumulated and communicated to our management, including our Chief Executive Officer and Chief Financial Officer, as appropriate to allow timely decisions regarding required disclosure.
Report of Management on Internal Control Over Financial Reporting
Our management is responsible for establishing and maintaining adequate internal control over financial reporting, as such term is defined in Exchange Act Rule 13a-15(f). Under the supervision and with the participation of our management, including our Chief Executive Officer and Chief Financial Officer, we conducted an evaluation of the effectiveness of our internal control over financial reporting based on the framework in Internal Control-Integrated Framework issued by the Committee of Sponsoring Organizations of the Treadway Commission, or COSO.
Based on our evaluation under the framework in Internal Control - Integrated Framework issued by COSO, our management concluded that our internal control over financial reporting was effective as of December 31, 2012. The effectiveness of our internal control over financial reporting as of December 31, 2012 has been audited by PricewaterhouseCoopers LLP, an independent registered public accounting firm, as stated in their report which is included herein.
Changes in Internal Control over Financial Reporting
There was no change in our internal control over financial reporting that occurred during the quarter ended December 31, 2012 that has materially affected, or that is reasonably likely to materially affect, our internal control over financial reporting.
I TEM 9B. OTHER INFORMATION
None.
- 36 -
P ART III
I TEM 10. DIRECTORS, EXECUTIVE OFFICERS AND CORPORATE GOVERNANCE
We will include information regarding our directors and executive officers in our definitive proxy statement for our annual meeting of stockholders to be held in 2013, which we will file within 120 days after the end of the fiscal year covered by this Annual Report on Form 10-K. This information is incorporated herein by reference.
Code of Conduct
We have adopted a code of conduct that applies to our officers and all of our employees. A copy of the code of conduct is available on our website at www.internap.com . We will furnish copies without charge upon request at the following address: Internap Network Services Corporation, Attn: SVP, Legal Services, One Ravinia Drive, Suite 1300, Atlanta, Georgia 30346.
If we make any amendments to the code of conduct other than technical, administrative or other non-substantive amendments, or grant any waivers, including implicit waivers, from the addendum to this code, we will disclose the nature of the amendment or waiver, its effective date and to whom it applies on our website or in a current report on Form 8-K filed with the SEC.
I TEM 11. EXECUTIVE COMPENSATION
We will include information regarding executive compensation in our definitive proxy statement for our annual meeting of stockholders to be held in 2013, which we will file within 120 days after the end of the fiscal year covered by this Annual Report on Form 10-K. This information is incorporated herein by reference.
I TEM 12. SECURITY OWNERSHIP OF CERTAIN BENEFICIAL OWNERS AND MANAGEMENT AND RELATED STOCKHOLDER MATTERS
The information under the caption "Security Ownership of Certain Beneficial Owners and Management" contained in our definitive proxy statement for our annual meeting of stockholders to be held in 2013, which we will file within 120 days after the end of the fiscal year covered by this Annual Report on Form 10-K, is incorporated herein by reference.
I TEM 13. CERTAIN RELATIONSHIPS AND RELATED TRANSACTIONS, AND DIRECTOR INDEPENDENCE
The information under the caption "Certain Relationships and Related Transactions" contained in our definitive proxy statement for our annual meeting of stockholders to be held in 2013, which we will file within 120 days after the end of the fiscal year covered by this Annual Report on Form 10-K, is incorporated herein by reference.
I TEM 14. PRINCIPAL ACCOUNTANT FEES AND SERVICES
The information under the caption "Ratification of Appointment of Independent Registered Public Accounting Firm" in our definitive proxy statement for our annual meeting of stockholders to be held in 2013, which we will file within 120 days after the end of the fiscal year covered by this Annual Report on Form 10-K, is incorporated in this Form 10-K by reference.
P ART IV
I TEM 15. EXHIBITS AND FINANCIAL STATEMENT SCHEDULES
Item 15(a)(1). Financial Statements . The following consolidated financial statements are filed herewith:
Page | |
Report of Independent Registered Public Accounting Firm | F-1 |
Consolidated Statements of Operations and Comprehensive Loss | F-2 |
Consolidated Balance Sheets | F-3 |
Consolidated Statements of Stockholders' Equity | F-4 |
Consolidated Statements of Cash Flows | F-5 |
Notes to Consolidated Financial Statements | F-6 |
Item 15(a)(2). Financial Statement Schedules . The following financial statement schedule is filed herewith: | |
Page | |
Schedule II - Valuation and Qualifying Accounts for the Three Years Ended December 31, 2012 | S-1 |
Item 15(a)(3). Exhibits . The following exhibits are filed as part of this report:
- 37 -
Exhibit | ||||
Number | Description | |||
3.1 | Certificate of Elimination of the Series B Preferred Stock (incorporated herein by reference to Exhibit 3.1 to the Company's Annual Report on Form 10-K, filed March 2, 2010). | |||
3.2 | Restated Certificate of Incorporation of the Company (incorporated herein by reference to Exhibit 3.2 to the Company's Annual Report on Form 10-K, filed March 2, 2010). | |||
3.3 | Certificate of Amendment of Restated Certificate of Incorporation of the Company (incorporated herein by reference to Exhibit 3.1 to the Company's Current Report on Form 8-K, filed June 21, 2010). | |||
3.4 | Amended and Restated Bylaws of the Company (incorporated herein by reference to Exhibit 3.1 to the Company's Current Report on Form 8-K, filed March 29, 2011). | |||
10.1 | Amended and Restated Internap Network Services Corporation 1998 Stock Option/Stock Issuance Plan (incorporated herein by reference to Exhibit 10.1 to the Company's Annual Report on Form 10-K, filed March 13, 2009).+ | |||
10.2 | Internap Network Services Corporation 1999 Non-Employee Directors' Stock Option Plan (incorporated herein by reference to Exhibit 10.2 to the Company's Annual Report on Form 10-K, filed March 13, 2009).+ | |||
10.3 | First Amendment to the Internap Network Services Corporation 1999 Non-Employee Directors' Stock Option Plan (incorporated herein by reference to Exhibit 10.3 to the Company's Annual Report on Form 10-K, filed March 13, 2009).+ | |||
10.4 | Amended and Restated Internap Network Services Corporation 1999 Stock Incentive Plan for Non-Officers (incorporated herein by reference to Exhibit 10.5 to the Company's Annual Report on Form 10-K, filed March 13, 2009).+ | |||
10.5 | Amended Internap Network Services Corporation 1999 Equity Incentive Plan (incorporated herein by reference to Exhibit 10.7 to the Company's Registration Statement on Form S-1, File No. 333-95503 dated January 27, 2000).+ | |||
10.6 | Form of 1999 Equity Incentive Plan Stock Option Agreement (incorporated herein by reference to Exhibit 10.8 to the Company's Registration Statement on Form S-1, File No. 333-84035 dated July 29, 1999).+ | |||
10.7 | Internap Network Services Corporation 2000 Non-Officer Equity Incentive Plan (incorporated herein by reference to Exhibit 99.1 to the Company's Registration Statement on Form S-8, File No. 333-37400 dated May 19, 2000).+ | |||
10.8 | Internap Network Services Corporation 2002 Stock Compensation Plan (incorporated herein by reference to Exhibit 10.9 to the Company's Annual Report on Form 10-K, filed March 13, 2009).+ | |||
10.9 | Form of Nonstatutory Stock Option Agreement under the Internap Network Services Corporation 2002 Stock Compensation Plan (incorporated herein by reference to Exhibit 10.10 to the Company's Annual Report on Form 10-K, filed March 13, 2009).+ | |||
10.10 | Amended and Restated 2005 Incentive Stock Plan, dated June 16, 2011 (incorporated herein by reference to Appendix A to the Company's Definitive Proxy Statement, filed April 29, 2011).+ | |||
10.11 | Form of Stock Grant Certificate under the Amended and Restated Internap Network Services Corporation 2005 Incentive Stock Plan (incorporated herein by reference to Exhibit 10.14 to the Company's Annual Report on Form 10-K, filed March 2, 2010).+ | |||
10.12 | Form of Stock Option Certificate under the Amended and Restated Internap Network Services Corporation 2005 Incentive Stock Plan (incorporated herein by reference to Exhibit 10.15 to the Company's Annual Report on Form 10-K, filed March 2, 2010).+ | |||
10.13 * | Employment Security Plan dated November 14, 2007.+ | |||
10.14 | Form of Indemnity Agreement for directors and officers of the Company (incorporated herein by reference to Exhibit 10.1 to the Company's Current Report on Form 8-K, filed May 29, 2009).+ | |||
10.15 | Credit Agreement, dated as of November 2, 2010, by and among the Company, Wells Fargo Capital Finance, LLC, as Agent for the lenders and the other lenders identified on the signature pages thereto (incorporated herein by reference to Exhibit 10.1 to the Company's Current Report on Form 8-K, filed November 4, 2010)† | |||
10.16 | Security Agreement, dated as of November 2, 2010, among the Company, and certain of its subsidiaries party thereto from time to time, as Grantors, and Wells Fargo Capital Finance, LLC, as Agent (incorporated herein by reference to Exhibit 10.2 to the Company's Current Report on Form 8-K, filed November 4, 2010).† | |||
- 38 -
10.17 | General Continuing Guaranty, dated as of November 2, 2010, executed by CO Space, Inc.; CO Space Services, LLC; CO Space Services Texas, LP; CO Space Properties, LLC and CO Space Properties Texas, LP in favor of Wells Fargo Capital Finance, LLC, as Agent (incorporated herein by reference to Exhibit 10.3 to the Company's Current Report on Form 8-K, filed November 4, 2010).† | ||
| 10.18 | Joinder, Consent and First Amendment to Credit Agreement by and among the Company, Wells Fargo Capital Finance, LLC, Royal Bank of Canada, Fifth Third Bank, Sun Trust Bank and Silicon Valley Bank (incorporated herein by reference to Exhibit 10.1 to the Company's Current Report on Form 8-K, filed January 3, 2012).† | ||
10.19 | Fourth Amendment to Credit Agreement dated August 30, 2012 by and among the Company and Wells Fargo Capital Finance, LLC as agent for the Lenders (incorporated herein by reference to Exhibit 10.1 to the Company's Current Report on Form 8-K, filed September 4, 2012).† | ||
10.20 | Lease Agreement by and between Cousins Properties Incorporated and CO Space Services, LLC, originally dated January 10, 2000 and as amended through February 26, 2007 (incorporated herein by reference to Exhibit 10.20 to the Company's Annual Report on Form 10-K, filed February 24, 2011.†§ | ||
10.21 | Joinder Agreement to the Employment Security Plan executed by George E. Kilguss (incorporated herein by reference to Exhibit 99.1 to the Company's Current Report on Form 8-K, filed March 28, 2008).+ | ||
10.22 | Joinder Agreement to the Employment Security Plan executed by Steven A. Orchard (incorporated herein by reference to Exhibit 10.1 to the Company's Current Report on Form 8-K, filed May 6, 2010). + | ||
10.23 | Offer Letter between the Company and Eric Cooney, dated January 16, 2009 (incorporated herein by reference to Exhibit 10.1 to the Company's Current Report on Form 8-K, filed February 2, 2009).+ | ||
10.24 | Joinder Agreement to the Employment Security Plan executed by Eric Cooney (incorporated herein by reference to Exhibit 10.2 to the Company's Current Report on Form 8-K, filed February 2, 2009.+ | ||
10.25 | Employment Security Agreement executed by Kevin M. Dotts (incorporated herein by reference to Exhibit 10.1 to the Company's Current Report on Form 8-K, filed July 26, 2012).+ | ||
10.26 | Employment Security Agreement executed by Richard Shank (incorporated herein by reference to Exhibit 10.32 to the Company's Annual Report on Form 10-K, filed February 23, 2012).+ | ||
10.27 | 2012 Short Term Incentive Plan (incorporated herein by reference to Exhibit 10.31 to the Company's Annual Report on Form 10-K, filed February 23, 2012).+ | ||
21.1* | List of Subsidiaries. | ||
23.1* | Consent of PricewaterhouseCoopers LLP, Independent Registered Public Accounting Firm. | ||
31.1* | Rule 13a-14(a)/15d-14(a) Certification, executed by J. Eric Cooney, President, Chief Executive Officer and Director the Company. | ||
31.2* | Rule 13a-14(a)/15d-14(a) Certification, executed by Kevin M. Dotts, Chief Financial Officer of the Company. | ||
32.1* | Section 1350 Certification, executed by J. Eric Cooney, President, Chief Executive Officer and Director the Company. | ||
32.2* | Section 1350 Certification, executed by Kevin M. Dotts, Chief Financial Officer of the Company. |
* | Documents filed herewith. |
+ | Management contract and compensatory plan and arrangement. |
† | Schedules and exhibits have been omitted pursuant to Item 601(b)(2) of Regulation S-K. The Company hereby undertakes to furnish supplementally copies of any of the omitted schedules and exhibits upon request by the Securities and Exchange Commission. |
§ | Confidential treatment has been requested for this exhibit. The copy filed as an exhibit omits the information subject to the request for confidential treatment. |
- 39 -
S IGNATURES
Pursuant to the requirements of Section 13 or 15(d) of the Securities Exchange Act of 1934, as amended, the Company has duly caused this report to be signed on its behalf by the undersigned, thereunto duly authorized.
INTERNAP NETWORK SERVICES CORPORATION | |||
Date: February 21, 2013 | |||
By: | /s/ Kevin M. Dotts | ||
Kevin M. Dotts | |||
Chief Financial Officer | |||
(Principal Accounting Officer) | |||
Pursuant to the requirements of the Securities Exchange Act of 1934, as amended, this report has been signed below by the following persons on behalf of the Company and in the capacities and on the dates indicated:
Signature | Title | Date | ||
/s/ J. Eric Cooney | ||||
J. Eric Cooney | President, Chief Executive Officer and Director | February 21, 2013 | ||
(Principal Executive Officer) | ||||
/s/ Kevin M. Dotts | ||||
Kevin M. Dotts | Chief Financial Officer | February 21, 2013 | ||
(Principal Accounting Officer) | ||||
/s/ Daniel C. Stanzione | ||||
Daniel C. Stanzione | Non-Executive Chairman and Director | February 21, 2013 | ||
/s/ Charles B. Coe | ||||
Charles B. Coe | Director | February 21, 2013 | ||
/s/ Patricia L. Higgins | ||||
Patricia L. Higgins | Director | February 21, 2013 | ||
/s/ Kevin L. Ober | ||||
Kevin L. Ober | Director | February 21, 2013 | ||
/s/ Gary M. Pfeiffer | ||||
Gary M. Pfeiffer | Director | February 21, 2013 | ||
/s/ Michael A. Ruffolo | ||||
Michael A. Ruffolo | Director | February 21, 2013 | ||
/s/ Debora J. Wilson | ||||
Debora J. Wilson | Director | February 21, 2013 |
- 40 -
Internap Network Services Corporation
Index to Consolidated Financial Statements
Page | |
Report of Independent Registered Public Accounting Firm | F-1 |
Consolidated Statements of Operations and Comprehensive Loss | F-2 |
Consolidated Balance Sheets | F-3 |
Consolidated Statements of Stockholders' Equity | F-4 |
Consolidated Statements of Cash Flows | F-5 |
Notes to Consolidated Financial Statements | F-6 |
Financial Statement Schedule | S-1 |
i
Report of Independent Registered Public Accounting Firm
To the Board of Directors and Stockholders of Internap Network Services Corporation:
In our opinion, the consolidated financial statements listed in the index appearing under Item 15(a)(1) present fairly, in all material respects, the financial position of Internap Network Services Corporation and their subsidiaries at December 31, 2012 and December 31, 2011, and the results of their operations and their cash flows for each of the three years in the period ended December 31, 2012 in conformity with accounting principles generally accepted in the United States of America. In addition, in our opinion, the financial statement schedule appearing in Item 15(a)(2) presents fairly, in all material respects, the information set forth therein when read in conjunction with the related consolidated financial statements. Also in our opinion, the Company maintained, in all material respects, effective internal control over financial reporting as of December 31, 2012, based on criteria established in Internal Control - Integrated Framework issued by the Committee of Sponsoring Organizations of the Treadway Commission (COSO). The Company's management is responsible for these financial statements and financial statement schedule, for maintaining effective internal control over financial reporting and for its assessment of the effectiveness of internal control over financial reporting, included in the Report of Management on Internal Control Over Financial Reporting appearing under Item 9A. Our responsibility is to express opinions on these financial statements, on the financial statement schedule, and on the Company's internal control over financial reporting based on our integrated audits. We conducted our audits in accordance with the standards of the Public Company Accounting Oversight Board (United States). Those standards require that we plan and perform the audits to obtain reasonable assurance about whether the financial statements are free of material misstatement and whether effective internal control over financial reporting was maintained in all material respects. Our audits of the financial statements included examining, on a test basis, evidence supporting the amounts and disclosures in the financial statements, assessing the accounting principles used and significant estimates made by management, and evaluating the overall financial statement presentation. Our audit of internal control over financial reporting included obtaining an understanding of internal control over financial reporting, assessing the risk that a material weakness exists, and testing and evaluating the design and operating effectiveness of internal control based on the assessed risk. Our audits also included performing such other procedures as we considered necessary in the circumstances. We believe that our audits provide a reasonable basis for our opinions.
A company's internal control over financial reporting is a process designed to provide reasonable assurance regarding the reliability of financial reporting and the preparation of financial statements for external purposes in accordance with generally accepted accounting principles. A company's internal control over financial reporting includes those policies and procedures that (i) pertain to the maintenance of records that, in reasonable detail, accurately and fairly reflect the transactions and dispositions of the assets of the company; (ii) provide reasonable assurance that transactions are recorded as necessary to permit preparation of financial statements in accordance with generally accepted accounting principles, and that receipts and expenditures of the company are being made only in accordance with authorizations of management and directors of the company; and (iii) provide reasonable assurance regarding prevention or timely detection of unauthorized acquisition, use, or disposition of the company's assets that could have a material effect on the financial statements.
Because of its inherent limitations, internal control over financial reporting may not prevent or detect misstatements. Also, projections of any evaluation of effectiveness to future periods are subject to the risk that controls may become inadequate because of changes in conditions, or that the degree of compliance with the policies or procedures may deteriorate.
/s/ PricewaterhouseCoopers LLP
Atlanta, Georgia
February 21, 2013
F-1
INTERNAP NETWORK SERVICES CORPORATION AND SUBSIDIARIES
C ONSOLIDATED STATEMENTS OF OPERATIONS AND COMPREHENSIVE LOSS
(In thousands, except per share amounts)
Year Ended December 31, | ||||||||||||
2012 | 2011 | 2010 | ||||||||||
Revenues: | ||||||||||||
Data center services | $ | 167,286 | $ | 133,453 | $ | 128,200 | ||||||
Internet protocol (IP) services | 106,306 | 111,175 | 115,964 | |||||||||
Total revenues | 273,592 | 244,628 | 244,164 | |||||||||
Operating costs and expenses: | ||||||||||||
Direct costs of network, sales and services, exclusive of depreciation and amortization, shown below: | ||||||||||||
Data center services | 90,604 | 78,907 | 82,761 | |||||||||
IP services | 40,350 | 41,403 | 44,662 | |||||||||
Direct costs of customer support | 26,664 | 21,278 | 19,861 | |||||||||
Direct costs of amortization of acquired technologies | 4,718 | 3,500 | 3,811 | |||||||||
Sales and marketing | 31,343 | 29,715 | 29,232 | |||||||||
General and administrative | 38,635 | 33,952 | 33,048 | |||||||||
Depreciation and amortization | 36,147 | 36,926 | 30,158 | |||||||||
(Gain) loss on disposal of property and equipment, net | (55 | ) | 37 | 116 | ||||||||
Exit activities, restructuring and impairments | 1,422 | 2,833 | 1,411 | |||||||||
Total operating costs and expenses | 269,828 | 248,551 | 245,060 | |||||||||
Income (loss) from operations | 3,764 | (3,923 | ) | (896 | ) | |||||||
Non-operating expenses: | ||||||||||||
Interest expense | 7,566 | 3,701 | 2,170 | |||||||||
Other, net | 283 | 165 | - | |||||||||
Total non-operating expenses | 7,849 | 3,866 | 2,170 | |||||||||
Loss before income taxes and equity in (earnings) of equity-method investment | (4,085 | ) | (7,789 | ) | (3,066 | ) | ||||||
Provision (benefit) for income taxes | 453 | (5,612 | ) | 952 | ||||||||
Equity in (earnings) of equity-method investment, net of taxes | (220 | ) | (475 | ) | (396 | ) | ||||||
Net loss | (4,318 | ) | (1,702 | ) | (3,622 | ) | ||||||
Other comprehensive income (loss): | ||||||||||||
Foreign currency translation adjustment, net of taxes | 84 | 136 | (5 | ) | ||||||||
Comprehensive loss | $ | (4,234 | ) | $ | (1,566 | ) | $ | (3,627 | ) | |||
Basic and diluted net loss per share | $ | (0.09 | ) | $ | (0.03 | ) | $ | (0.07 | ) | |||
Weighted average shares outstanding used in computing basic and diluted net loss per share | 50,761 | 50,422 | 50,467 | |||||||||
The accompanying notes are an integral part of these consolidated financial statements.
F-2
INTERNAP NETWORK SERVICES CORPORATION AND SUBSIDIARIES
C ONSOLIDATED BALANCE SHEETS
(In thousands, except par value amounts)
December 31, | ||||||||
2012 | 2011 | |||||||
ASSETS | ||||||||
Current assets: | ||||||||
Cash and cash equivalents | $ | 28,553 | $ | 29,772 | ||||
Accounts receivable, net of allowance for doubtful accounts of $1,809 and $1,668, respectively | 19,035 | 18,539 | ||||||
Prepaid expenses and other assets | 13,438 | 13,270 | ||||||
Total current assets | 61,026 | 61,581 | ||||||
Property and equipment, net | 248,095 | 198,369 | ||||||
Investment in joint venture | 3,000 | 2,936 | ||||||
Intangible assets, net | 21,342 | 26,886 | ||||||
Goodwill | 59,605 | 59,471 | ||||||
Deposits and other assets | 5,735 | 5,371 | ||||||
Deferred tax asset, net | 1,909 | 2,096 | ||||||
Total assets | $ | 400,712 | $ | 356,710 | ||||
LIABILITIES AND STOCKHOLDERS' EQUITY | ||||||||
Current liabilities: | ||||||||
Accounts payable | $ | 22,158 | $ | 21,746 | ||||
Accrued liabilities | 11,386 | 9,152 | ||||||
Deferred revenues | 2,991 | 2,475 | ||||||
Revolving credit facility | - | 100 | ||||||
Capital lease obligations | 4,504 | 2,154 | ||||||
Term loan, less discount of $239 and $206, respectively | 3,261 | 2,794 | ||||||
Exit activities and restructuring liability | 2,508 | 2,709 | ||||||
Other current liabilities | 169 | 151 | ||||||
Total current liabilities | 46,977 | 41,281 | ||||||
Deferred revenues | 2,669 | 2,323 | ||||||
Capital lease obligations | 44,054 | 38,923 | ||||||
Revolving credit facility | 30,501 | - | ||||||
Term loan, less discount of $388 and $367, respectively | 61,612 | 55,383 | ||||||
Accrued contingent consideration | - | 4,626 | ||||||
Exit activities and restructuring liability | 3,365 | 4,884 | ||||||
Deferred rent | 15,026 | 16,100 | ||||||
Other long-term liabilities | 903 | 1,020 | ||||||
Total liabilities | 205,107 | 164,540 | ||||||
Commitments and contingencies (note 10) | ||||||||
Stockholders' equity: | ||||||||
Preferred stock, $0.001 par value, 20,000 shares authorized; no shares issued or outstanding | - | - | ||||||
Common stock, $0.001 par value; 120,000 shares authorized; 53,459 and 52,528 shares outstanding, respectively | 54 | 53 | ||||||
Additional paid-in capital | 1,243,801 | 1,235,554 | ||||||
Treasury stock, at cost, 267 and 231 shares, respectively | (1,845 | ) | (1,266 | ) | ||||
Accumulated deficit | (1,046,190 | ) | (1,041,872 | ) | ||||
Accumulated items of other comprehensive loss | (215 | ) | (299 | ) | ||||
Total stockholders' equity | 195,605 | 192,170 | ||||||
Total liabilities and stockholders' equity | $ | 400,712 | $ | 356,710 | ||||
The accompanying notes are an integral part of these consolidated financial statements.
F-3
INTERNAP NETWORK SERVICES CORPORATION AND SUBSIDIARIES
C ONSOLIDATED STATEMENTS OF STOCKHOLDERS' EQUITY
For the Three Years Ended December 31, 2012
(In thousands)
Common Stock | ||||||||||||||||||||||||||||
Shares | Par Value | Additional Paid-In Capital | Treasury Stock | Accumulated Deficit | Accumulated Items of Comprehensive (Loss) | Total Stockholders' Equity | ||||||||||||||||||||||
Balance, December 31, 2009 | 50,763 | $ | 51 | $ | 1,221,456 | $ | (127 | ) | $ | (1,036,548 | ) | $ | (430 | ) | $ | 184,402 | ||||||||||||
Net loss | - | - | - | - | (3,622 | ) | - | (3,622 | ) | |||||||||||||||||||
Foreign currency translation | - | - | - | - | - | (5 | ) | (5 | ) | |||||||||||||||||||
Stock-based compensation | - | - | 4,809 | - | - | - | 4,809 | |||||||||||||||||||||
Other activity of stock compensation plans | 1,254 | 1 | 3,419 | (393 | ) | - | - | 3,027 | ||||||||||||||||||||
Balance, December 31, 2010 | 52,017 | 52 | 1,229,684 | (520 | ) | (1,040,170 | ) | (435 | ) | 188,611 | ||||||||||||||||||
Net loss | - | - | - | - | (1,702 | ) | - | (1,702 | ) | |||||||||||||||||||
Foreign currency translation | - | - | - | - | - | 136 | 136 | |||||||||||||||||||||
Stock-based compensation | - | - | 4,499 | - | - | - | 4,499 | |||||||||||||||||||||
Other activity of stock compensation plans | 511 | 1 | 1,371 | (746 | ) | - | - | 626 | ||||||||||||||||||||
Balance, December 31, 2011 | 52,528 | 53 | 1,235,554 | (1,266 | ) | (1,041,872 | ) | (299 | ) | 192,170 | ||||||||||||||||||
Net loss | - | - | - | - | (4,318 | ) | - | (4,318 | ) | |||||||||||||||||||
Foreign currency translation | - | - | - | - | - | 84 | 84 | |||||||||||||||||||||
Stock-based compensation | - | - | 6,285 | - | - | - | 6,285 | |||||||||||||||||||||
Other activity of stock compensation plans | 931 | 1 | 1,962 | (579 | ) | - | - | 1,384 | ||||||||||||||||||||
Balance, December 31, 2012 | 53,459 | $ | 54 | $ | 1,243,801 | $ | (1,845 | ) | $ | (1,046,190 | ) | $ | (215 | ) | $ | 195,605 | ||||||||||||
The accompanying notes are an integral part of these consolidated financial statements.
F-4
INTERNAP NETWORK SERVICES CORPORATION AND SUBSIDIARIES
C ONSOLIDATED STATEMENTS OF CASH FLOWS
(In thousands)
Year Ended December 31, | ||||||||||||
2012 | 2011 | 2010 | ||||||||||
Cash Flows from Operating Activities: | ||||||||||||
Net loss | $ | (4,318 | ) | $ | (1,702 | ) | $ | (3,622 | ) | |||
Adjustments to reconcile net loss to net cash provided by operating activities: | ||||||||||||
Depreciation and amortization | 40,865 | 40,426 | 33,969 | |||||||||
(Gain) loss on disposal of property and equipment, net | (55 | ) | 37 | 116 | ||||||||
Impairment of capitalized software | 438 | 526 | - | |||||||||
Stock-based compensation expense, net of capitalized amount | 5,858 | 3,983 | 4,631 | |||||||||
Equity in (earnings) of equity-method investment | (220 | ) | (475 | ) | (396 | ) | ||||||
Provision for doubtful accounts | 932 | 1,082 | 1,253 | |||||||||
Non-cash change in capital lease obligations | 705 | 1,044 | 630 | |||||||||
Non-cash change in accrued contingent consideration | 124 | - | - | |||||||||
Non-cash change in deferred rent | (1,073 | ) | (555 | ) | 237 | |||||||
Deferred income taxes | 204 | (5,734 | ) | 471 | ||||||||
Other, net | 521 | 263 | - | |||||||||
Changes in operating assets and liabilities: | ||||||||||||
Accounts receivable | (1,428 | ) | (1,186 | ) | (156 | ) | ||||||
Prepaid expenses, deposits and other assets | (671 | ) | (2,282 | ) | (2,577 | ) | ||||||
Accounts payable | 413 | (5,209 | ) | 8,147 | ||||||||
Accrued and other liabilities | 2,304 | (247 | ) | (1,216 | ) | |||||||
Deferred revenues | 862 | (970 | ) | (907 | ) | |||||||
Exit activities and restructuring liability | (1,719 | ) | (371 | ) | (978 | ) | ||||||
Net cash flows provided by operating activities | 43,742 | 28,630 | 39,602 | |||||||||
Cash Flows from Investing Activities: | ||||||||||||
Purchases of property and equipment | (74,947 | ) | (68,542 | ) | (62,184 | ) | ||||||
Payment of accrued contingent consideration | (4,750 | ) | - | - | ||||||||
Voxel acquisition, net of cash received | - | (27,723 | ) | - | ||||||||
Maturities of investments in marketable securities | - | - | 7,000 | |||||||||
Net cash flows used in investing activities | (79,697 | ) | (96,265 | ) | (55,184 | ) | ||||||
Cash Flows from Financing Activities: | ||||||||||||
Proceeds from credit agreement | 40,401 | 39,853 | 78,036 | |||||||||
Principal payments on credit agreement | (3,250 | ) | (1,000 | ) | (78,750 | ) | ||||||
Payment of debt issuance costs | (543 | ) | (253 | ) | (518 | ) | ||||||
Payments on capital lease obligations | (3,303 | ) | (1,190 | ) | (446 | ) | ||||||
Proceeds from exercise of stock options | 2,469 | 1,372 | 3,420 | |||||||||
Tax withholdings related to net share settlements of restricted stock awards | (1,085 | ) | (746 | ) | (393 | ) | ||||||
Other, net | (118 | ) | (135 | ) | (125 | ) | ||||||
Net cash flows provided by financing activities | 34,571 | 37,901 | 1,224 | |||||||||
Effect of exchange rates on cash and cash equivalents | 165 | (76 | ) | 14 | ||||||||
Net decrease in cash and cash equivalents | (1,219 | ) | (29,810 | ) | (14,344 | ) | ||||||
Cash and cash equivalents at beginning of period | 29,772 | 59,582 | 73,926 | |||||||||
Cash and cash equivalents at end of period | $ | 28,553 | $ | 29,772 | $ | 59,582 | ||||||
Supplemental disclosure of cash flow information: | ||||||||||||
Cash paid for interest | $ | 7,646 | $ | 3,293 | $ | 2,058 | ||||||
Cash paid for income taxes | 189 | 267 | 395 | |||||||||
Non-cash acquisition of property and equipment under capital leases | 10,079 | 19,565 | 16,783 | |||||||||
Capitalized stock-based compensation | 427 | 516 | 178 | |||||||||
The accompanying notes are an integral part of these consolidated financial statements.
F-5
INTERNAP NETWORK SERVICES CORPORATION AND SUBSIDIARIES
N OTES TO CONSOLIDATED FINANCIAL STATEMENTS
1. | DESCRIPTION OF THE COMPANY AND NATURE OF OPERATIONS |
Internap Network Services Corporation ("we," "us," "our" or "Internap") provides intelligent information technology ("IT") Infrastructure services that combine superior performance and platform flexibility to enable our customers to focus on their core business, improve service levels and lower the cost of IT operations. We provide services at 43 data centers across North America, Europe and the Asia-Pacific region and through 84 Internet Protocol ("IP") service points, which include 25 content delivery network ("CDN") points of presence ("POPs").
The nature of our business subjects us to certain risks and uncertainties frequently encountered by rapidly evolving markets. These risks are described in "Risk Factors" in this Annual Report on Form 10-K.
We have a history of quarterly and annual period net losses, including for each of the three years in the period ended December 31, 2012. At December 31, 2012, our accumulated deficit was $1.0 billion. However, during the years ended December 31, 2012, 2011 and 2010, we generated net cash flows from operating activities of $43.7 million, $28.6 million and $39.6 million, respectively.
2. | SUMMARY OF SIGNIFICANT ACCOUNTING POLICIES |
Accounting Principles
We prepare our consolidated financial statements and accompanying notes in accordance with accounting principles generally accepted in the United States ("GAAP"). The consolidated financial statements include our accounts and those of our wholly-owned subsidiaries. We have eliminated significant inter-company transactions and balances in consolidation.
Estimates and Assumptions
The preparation of these financial statements requires us to make estimates and judgments that affect the reported amounts of assets, liabilities, revenue and expense and related disclosure of contingent assets and liabilities. On an ongoing basis, we evaluate our estimates, including those related to revenue recognition, doubtful accounts, goodwill and intangible assets, accruals, stock-based compensation, income taxes, restructuring charges, leases, long-term service contracts, contingencies and litigation. We base our estimates on historical experience and on various other assumptions that we believe to be reasonable under the circumstances, the results of which form the basis for making judgments about the carrying values of assets and liabilities that are not readily apparent from other sources. Actual results may differ materially from these estimates.
Cash and Cash Equivalents
We consider all highly-liquid investments purchased with an original maturity of three months or less at the date of purchase and money market mutual funds to be cash equivalents. We invest our cash and cash equivalents with major financial institutions and may at times exceed federally insured limits. We believe that the risk of loss is minimal. To date, we have not experienced any losses related to cash and cash equivalents.
Investment in Joint Venture
We account for investments that provide us with the ability to exercise significant influence, but not control, over an investee using the equity method of accounting. Significant influence, but not control, is generally deemed to exist if we have an ownership interest in the voting stock of the investee of between 20% and 50%, although we consider other factors, such as minority interest protections, in determining whether the equity method of accounting is appropriate. As of December 31, 2012, Internap Japan Co., Ltd. ("Internap Japan"), a joint venture with NTT-ME Corporation and Nippon Telegraph and Telephone Corporation ("NTT Holdings"), qualified for equity method accounting. We record our proportional share of the income and losses of Internap Japan one month in arrears on the accompanying consolidated balance sheets as a long-term investment and our share of Internap Japan's income and losses, net of taxes, as a separate caption in our accompanying consolidated statements of operations and comprehensive loss.
Fair Value of Financial Instruments
The carrying amounts of our financial instruments, including cash and cash equivalents, accounts receivable and other current liabilities, approximate fair value due to the short-term nature of these assets and liabilities. Due to the nature of our credit facility and variable interest rate, the fair value of our debt approximates the carrying value.
We measure and report certain financial assets and liabilities at fair value on a recurring basis, including cash equivalents.
F-6
The major categories of nonfinancial assets and liabilities that we measure at fair value include reporting units measured at fair value in step one of a goodwill impairment test.
Financial Instrument Credit Risk
Financial instruments that potentially subject us to a concentration of credit risk principally consist of cash, cash equivalents, marketable securities and trade receivables. We currently invest the majority of our cash and cash equivalents in money market funds. We have invested in previous years, in accordance with our formal investment policy, in high credit quality corporate debt securities, U.S. Treasury bills and commercial paper.
Property and Equipment
We carry property and equipment at original acquisition cost less accumulated depreciation and amortization. We calculate depreciation and amortization on a straight-line basis over the estimated useful lives of the assets. As of January 1, 2012, estimated useful lives used for network equipment are generally five years; furniture, equipment and software are five to seven years; and leasehold improvements are 10 to 25 years or over the lease term, depending on the nature of the improvement. We capitalize additions and improvements that increase the value or extend the life of an asset. We expense maintenance and repairs as incurred. We charge gains or losses from disposals of property and equipment to operations.
Leases
We record leases in which we have substantially all of the benefits and risks of ownership as capital leases and all other leases as operating leases. For leases determined to be capital leases, we record the assets held under capital lease and related obligations at the lesser of the present value of aggregate future minimum lease payments or the fair value of the assets held under capital lease. We amortize the assets over 10 years or over the lease term, depending on the nature of the improvement, but in no event beyond the expected lease term. The duration of lease obligations and commitments ranges from four years for office equipment to 25 years for facilities. For leases determined to be operating leases, we record lease expense on a straight-line basis over the lease term. Certain leases include renewal options that, at the inception of the lease, are considered reasonably assured of being renewed. The lease term begins when we control the leased property, which is typically before lease payments begin under the terms of the lease. We record the difference between the expense in our consolidated statements of operations and comprehensive loss and the amount we pay as deferred rent, which we include in our consolidated balance sheets.
Costs of Computer Software Development
We capitalize internal-use software development costs incurred during the application development stage. Amortization begins once the software is ready for its intended use and is computed based on the straight-line method over the economic life of the software product. Judgment is required in determining which software projects are capitalized and the resulting economic life. We capitalized $6.7 million, $9.8 million and $4.9 million in internal-use software costs during the years ended December 31, 2012, 2011 and 2010, respectively. As of December 31, 2012 and 2011, the balance of unamortized internal-use software costs was $16.7 million and $13.4 million, respectively, and during the years ended December 31, 2012 and 2011, amortization expense was $3.4 million and $2.1 million, respectively.
Valuation of Long-Lived Assets
We periodically evaluate the carrying value of our long-lived assets, including, but not limited to, property and equipment. We consider the carrying value of a long-lived asset impaired when the undiscounted cash flows from such asset are separately identifiable and we estimate them to be less than its carrying value. In that event, we would recognize a loss based on the amount by which the carrying value exceeds the fair value of the long-lived asset. We determine fair value based on either market quotes, if available, or discounted cash flows using a discount rate commensurate with the risk inherent in our current business model for the specific asset being valued. We would determine losses on long-lived assets to be disposed of in a similar manner, except that we would reduce fair values by the cost of disposal. We charge losses due to impairment of long-lived assets to operations during the period in which we identify the impairment. During 2012 and 2011, we concluded that an impairment indicator existed to cause us to reassess our developed software. Following the reassessment, further described in note 4, we recorded an impairment charge of $0.4 million and $0.5 million, in the years ended December 31, 2012 and 2011, respectively, which is included in "Exit activities, restructuring and impairments" on the accompanying consolidated statements of operations and comprehensive loss.
Goodwill and Other Intangible Assets
We perform our annual goodwill impairment test as of August 1 of each calendar year absent any impairment indicators or other changes that may cause more frequent analysis. We also assess on a quarterly basis whether any events have occurred or circumstances have changed that would indicate an impairment could exist.
For purposes of valuing our goodwill and other intangible assets, we have the following three reporting units: IP products, IP services and data center services. All reporting units have goodwill. We did not identify an impairment as a result of our annual impairment test and none of our reporting units were at risk of failing step one.
F-7
To determine the fair value of our reporting units, we utilize the discounted cash flow and market methods. We have consistently utilized both methods in our goodwill impairment tests and weight both results equally. We use both methods in our goodwill impairment tests as we believe both, in conjunction with each other, provide a reasonable estimate of the fair value of the reporting unit. The discounted cash flow method is specific to our anticipated future results of the reporting unit, while the market method is based on our market sector including our competitors.
We determined the assumptions supporting the discounted cash flow method, including the discount rate, using our best estimates as of the date of the impairment review. We have performed various sensitivity analyses on certain of the assumptions used in the discounted cash flow method, such as forecasted revenues and discount rate. We used reasonable judgment in developing our estimates and assumptions and there was no impairment indicated in our testing.
The assumptions, inputs and judgments used in performing the valuation analysis are inherently subjective and reflect estimates based on known facts and circumstances at the time we perform the valuation. These estimates and assumptions primarily include, but are not limited to, discount rates; terminal growth rates; projected revenues and costs; earnings before interest, taxes, depreciation and amortization for expected cash flows; market comparables and capital expenditure forecasts. The use of different assumptions, inputs and judgments, or changes in circumstances, could materially affect the results of the valuation. Due to inherent uncertainty involved in making these estimates, actual results could differ from our estimates and could result in additional non-cash impairment charges in the future.
Other intangible assets have finite lives and we record these assets at cost less accumulated amortization. We record amortization of acquired technologies using the greater of (a) the ratio of current revenues to total and anticipated future revenues for the applicable technology or (b) the straight-line method over the remaining estimated economic life. We amortize the cost of the acquired technologies over their useful lives of five to eight years and 10 years for customer relationships and trade names. We assess other intangible assets on a quarterly basis whenever any events have occurred or circumstances have changed that would indicate that impairment could exist. Our assessment is based on estimated future cash flows directly associated with the asset or asset group. If we determine that the carrying value is not recoverable, we may record an impairment charge, reduce the estimated remaining useful life or both. We concluded that no impairment indicators existed to cause us to reassess our other intangible assets during the year ended December 31, 2012.
Exit Activities and Restructuring
When circumstances warrant, we may elect to exit certain business activities or change the manner in which we conduct ongoing operations. If we make such a change, we will estimate the costs to exit a business or restructure ongoing operations. The components of the estimates may include estimates and assumptions regarding the timing and costs of future events and activities that represent our best expectations based on known facts and circumstances at the time of estimation. If circumstances warrant, we will adjust our previous estimates to reflect what we then believe to be a more accurate representation of expected future costs. Because our estimates and assumptions regarding exit activities and restructuring charges include probabilities of future events, such as our ability to find a sublease tenant within a reasonable period of time or the rate at which a sublease tenant will pay for the available space, such estimates are inherently vulnerable to changes due to unforeseen circumstances that could materially and adversely affect our results of operations. We monitor market conditions at each period end reporting date and will continue to assess our key assumptions and estimates used in the calculation of our exit activities and restructuring accrual.
Taxes
We account for income taxes under the liability method. We determine deferred tax assets and liabilities based on differences between financial reporting and tax bases of assets and liabilities, and we measure the tax assets and liabilities using the enacted tax rates and laws that will be in effect when we expect the differences to reverse. We maintain a valuation allowance to reduce our deferred tax assets to their estimated realizable value. We may recognize deferred tax assets in future periods if and when we estimate them to be realizable and supported by historical trends of profitability and future expectations within each tax jurisdiction.
We evaluate liabilities for uncertain tax positions and we recognized $0.3 million for associated liabilities during each of the years ended December 31, 2012 and 2011. We recorded nominal interest and penalties arising from the underpayment of income taxes in "General and administrative" expenses in our consolidated statements of operations and comprehensive loss.
As of December 31, 2012 and 2011, we accrued $48,000 for interest and penalties related to uncertain tax positions. No additional interest and penalties accrued during 2012.
We account for telecommunication, sales and other similar taxes on a net basis in "General and administrative" expense in our consolidated statements of operations and comprehensive loss.
F-8
Stock-Based Compensation
We measure stock-based compensation cost at the grant date based on the calculated fair value of the award. We recognize the expense over the employee's requisite service period, generally the vesting period of the award. The fair value of restricted stock is the market value on the date of grant. The fair value of stock options is estimated at the grant date using the Black-Scholes option pricing model with weighted average assumptions for the activity under our stock plans. Option pricing model input assumptions, such as expected term, expected volatility and risk-free interest rate, impact the fair value estimate. Further, the forfeiture rate impacts the amount of aggregate compensation. These assumptions are subjective and generally require significant analysis and judgment to develop.
The expected term represents the weighted average period of time that we expect granted options to be outstanding, considering the vesting schedules and our historical exercise patterns. Because our options are not publicly traded, we assume volatility based on the historical volatility of our stock. The risk-free interest rate is based on the U.S. Treasury yield curve in effect at the time of grant for periods corresponding to the expected option term. We have also used historical data to estimate option exercises, employee termination and stock option forfeiture rates. Changes in any of these assumptions could materially impact our results of operations in the period the change is made.
We do not recognize a deferred tax asset for unrealized tax benefits associated with the tax deductions in excess of the compensation recorded (excess tax benefit). We apply the "with and without" approach for utilization of tax attributes upon realization of net operating losses in the future. This method allocates stock-based compensation benefits last among other tax benefits recognized. In addition, we apply the "direct only" method of calculating the amount of windfalls or shortfalls.
Treasury Stock
As permitted by our stock-based compensation plans, we acquire shares of treasury stock as payment of statutory minimum payroll taxes due from employees for stock-based compensation. We no longer reissue shares of treasury stock acquired from employees after June 30, 2011.
Revenue Recognition
We generate revenues primarily from the sale of data center services and IP services. Our revenues typically consist of monthly recurring revenues from contracts with terms of one year or more. We recognize the monthly minimum as revenue each month provided that we have entered into an enforceable contract, we have delivered the service to the customer, the fee for the service is fixed or determinable and collection is reasonably assured. We record installation fees as deferred revenue and recognize the revenue ratably over the estimated customer life.
We determine data center revenues by occupied square feet and both allocated and variable-based usage. Data center revenues include both physical space for hosting customers' network and other equipment plus associated services such as power and network connectivity, environmental controls and security.
We recognize IP services revenues on fixed- or usage-based pricing. IP service contracts usually have fixed minimum commitments based on a certain level of bandwidth usage with additional charges for any usage over a specified limit. If a customer's usage of our services exceeds the monthly minimum, we recognize revenue for such excess in the period of the usage.
We use contracts and sales or purchase orders as evidence of an arrangement. We test for availability or connectivity to verify delivery of our services. We assess whether the fee is fixed or determinable based on the payment terms associated with the transaction and whether the sales price is subject to refund or adjustment.
We also enter into multiple-element arrangements, or bundled services. When we enter into such arrangements, we account for each element separately over its respective service period provided that we have objective evidence of fair value for the separate elements. Objective evidence of fair value includes the price charged for the element when sold separately. If we cannot objectively determine the fair value of each element, we recognize the total value of the arrangement ratably over the entire service period to the extent that we have begun to provide the services, and we have satisfied other revenue recognition criteria.
In January 2011, we adopted new guidance, which eliminates the residual method of allocation for multiple-deliverable revenue arrangements, and requires that we allocate arrangement consideration at the inception of an arrangement to all deliverables using the relative selling price method. This new guidance also establishes a selling price hierarchy for determining the selling price of a deliverable, which includes (a) vendor-specific objective evidence, if available, (b) third-party evidence, if vendor-specific objective evidence is not available, and (c) best estimated selling price, if neither vendor-specific nor third-party evidence is available. Additionally, the guidance expands the disclosure requirements related to a vendor's multiple-deliverable revenue arrangements. Adoption of this guidance did not have a material impact on our consolidated financial statements.
Vendor-specific objective evidence is generally limited to the price charged when we sell the same or similar service separately. If we seldom sell a service separately, it is unlikely that we will determine vendor-specific objective evidence for the service. We define vendor-specific objective evidence as an average price of recent standalone transactions that we price within a narrow range as defined by us.
F-9
We determine third-party evidence based on the prices charged by our competitors for a similar deliverable when sold separately. It is difficult for us to obtain sufficient information on competitor pricing to substantiate third-party evidence and therefore we may not always be able to use this measure.
If we are unable to establish selling price using vendor-specific objective evidence or third-party evidence, and we receive or materially modify a sales order after our implementation date of January 1, 2011, we use best estimated selling price in our allocation of arrangement consideration. The objective of best estimated selling price is to determine the price at which we would transact if we sold the service on a standalone basis. Our determination of best estimated selling price involves a weighting of several factors including, but not limited to, pricing practices and market conditions.
We analyze the selling prices used in our allocation of arrangement consideration on an annual basis at a minimum. We will analyze selling prices on a more frequent basis if a significant change in our business necessitates a more timely analysis or if we experience significant variances in our selling prices.
We account for each deliverable within a multiple-deliverable revenue arrangement as a separate unit of accounting under the new guidance if both of the following criteria are met: (a) the delivered item or items have value to the customer on a standalone basis and (b) for an arrangement that includes a general right of return relative to the delivered item(s), we consider delivery or performance of the undelivered item(s) probable and substantially in our control. We consider a deliverable to have standalone value if we sell this item separately or if the item is sold by another vendor or could be resold by the customer. Further, our revenue arrangements generally do not include a right of return relative to delivered services.
We combine deliverables not meeting the criteria for being a separate unit of accounting with a deliverable that does meet that criterion. We then determine the appropriate allocation of arrangement consideration and recognition of revenue for the combined unit of accounting.
Deferred revenue consists of revenue for services to be delivered in the future and consists primarily of advance billings, which we amortize over the respective service period. We defer and amortize revenues associated with billings for installation of customer network equipment over the estimated life of the customer relationship, which was, on average, approximately five years for 2012 and four years for 2011 and 2010. We defer and amortize revenues for installation services because the installation service is integral to our primary service offering and does not have value to customers on a stand-alone basis. We also defer and amortize the associated incremental direct costs.
We routinely review the collectability of our accounts receivable and payment status of our customers. If we determine that collection of revenue is uncertain, we do not recognize revenue until collection is reasonably assured. Additionally, we maintain an allowance for doubtful accounts resulting from the inability of our customers to make required payments on accounts receivable. We base the allowance for doubtful accounts upon general customer information, which primarily includes our historical cash collection experience and the aging of our accounts receivable. We assess the payment status of customers by reference to the terms under which we provide services or goods, with any payments not made on or before their due date considered past-due. Once we have exhausted all collection efforts, we write the uncollectible balance off against the allowance for doubtful accounts. We routinely perform credit checks for new and existing customers and require deposits or prepayments for customers that we perceive as being a credit risk. In addition, we record a reserve amount for service level agreements and other sales adjustments.
Research and Development Costs
Research and development costs, which include product development costs, are included in general and administrative costs and are expensed as incurred. These costs primarily relate to our development and enhancement of IP routing technology, acceleration and cloud technologies and network engineering costs associated with changes to the functionality of our proprietary services and network architecture. Research and development costs were $2.0 million, $0.2 million and $1.9 million during the years ended December 31, 2012, 2011 and 2010, respectively. These costs do not include $6.7 million , $9.8 million and $4.9 million of internal-use software costs capitalized during the years ended December 31, 2012, 2011 and 2010, respectively.
Advertising Costs
We expense all advertising costs as incurred. Advertising costs during the years ended December 31, 2012, 2011 and 2010 were $2.5 million, $2.1 million and $2.0 million, respectively.
F-10
Net Loss Per Share
We compute basic net loss per share by dividing net loss attributable to our common stockholders by the weighted average number of shares of common stock outstanding during the period. We exclude all outstanding options and unvested restricted stock as such securities are anti-dilutive for all periods presented.
Basic and diluted net loss per share is calculated as follows (in thousands, except per share amounts):
Year Ended December 31, | ||||||||||||
2012 | 2011 | 2010 | ||||||||||
Net loss and net loss available to common stockholders | $ | (4,318 | ) | $ | (1,702 | ) | $ | (3,622 | ) | |||
Weighted average shares outstanding, basic and diluted | 50,761 | 50,422 | 50,467 | |||||||||
Net loss per share, basic and diluted | $ | (0.09 | ) | $ | (0.03 | ) | $ | (0.07 | ) | |||
Anti-dilutive securities excluded from diluted net loss per share calculation for stock-based compensation plans | 5,909 | 5,816 | 5,750 | |||||||||
Segment Information
We use the management approach for determining which, if any, of our services and products, locations, customers or management structures constitute a reportable business segment. The management approach designates the internal reporting that management uses for making operating decisions and assessing performance as the source of any reportable segments. As described in note 11, we operate in two business segments: data center services and IP services.
We include the operations of Voxel Holdings, Inc. ("Voxel"), acquired in December 2011, in our data center services segment.
Recent Accounting Pronouncements
In February 2013, the Financial Accounting Standards Board ("FASB") issued new guidance to improve the transparency of reporting reclassifications out of accumulated other comprehensive income. The guidance requires an entity to (a) present (either on the face of the statement where net income is presented or in the notes to the financial statements) the effects on the line items of net income of significant amounts reclassified out of accumulated other comprehensive income, but only if the item reclassified is required under GAAP to be reclassified to net income in its entirety in the same reporting period and (b) cross-reference to other disclosures currently required under GAAP for other reclassification items (that are not required under GAAP) to be reclassified directly to net income in their entirety in the same reporting period. The guidance is effective for reporting periods after December 15, 2012. Because the guidance impacts presentation only, it will have no effect on our financial condition or results of operations.
In December 2011, FASB issued new guidance that requires entities to disclose both gross and net information about both instruments and transactions eligible for offset in the statement of financial position and instruments and transactions subject to an agreement similar to a master netting arrangement. In January 2013, FASB issued new guidance that applies to derivatives and securities borrowing or lending transactions subject to an agreement similar to a master netting arrangement. The guidance is effective for fiscal years beginning on or after January 1, 2013. Early adoption is not permitted, but this guidance will be applied retrospectively for any period presented that begins before the date of initial application. We do not expect adoption of this guidance to have a material impact on our financial statements.
During July 2012, FASB issued new accounting guidance that allows an entity to first assess qualitative factors to determine whether it is more likely than not that an indefinite-lived asset is impaired for determining whether it is necessary to perform the quantitative impairment test. The guidance is effective for annual and interim impairment tests performed for fiscal years beginning after September 15, 2012, with early adoption permitted. We do not expect adoption to have an impact on our financial condition or results of operations.
During January 2012, we adopted new accounting guidance related to convergence between GAAP and International Financial Reporting Standards ("IFRS"). The new guidance changes the wording used to describe many of the requirements in GAAP for measuring fair value and for disclosing information about fair value measurements to ensure consistency between GAAP and IFRS. The new guidance also expands the disclosures for fair value measurements that are estimated using significant unobservable (Level 3) inputs. The adoption had no impact on our financial condition or results of operations.
F-11
During January 2012, we adopted new accounting guidance which allows an entity to make a qualitative evaluation about the likelihood of goodwill impairment. We will be required to perform the two-step impairment test only if we conclude, based on a qualitative assessment, the fair value of a reporting unit is more likely than not to be less than its carrying value. We elected to apply the quantitative assessment for the annual impairment test for the year ended December 31, 2012. We may consider the qualitative assessment when performing our next annual test for impairment.
3. | FAIR VALUE MEASUREMENTS |
We account for certain assets and liabilities at fair value. The hierarchy below lists three levels of fair value based on the extent to which inputs used in measuring fair value are observable in the market. We categorize each of our fair value measurements in one of these three levels based on the lowest level input that is significant to the fair value measurement in its entirety. These levels are:
| ● | Level 1: Quoted prices in active markets for identical assets or liabilities; |
| ● | Level 2: Inputs other than Level 1 that are observable, either directly or indirectly, such as quoted prices for similar assets or liabilities; quoted prices in markets that are not active or other inputs that are observable or can be corroborated by observable market data for substantially the full term of the assets or liabilities; and |
| ● | Level 3: Unobservable inputs that are supported by little or no market activity and that are significant to the fair value of the assets or liabilities. |
The following table represents the fair value hierarchy for our financial assets (cash equivalents and investments in marketable securities) measured at fair value on a recurring basis (in thousands):
Level 1 | Level 2 | Level 3 | Total | |||||||||||||
December 31, 2012: | ||||||||||||||||
Available for sale securities: | ||||||||||||||||
Money market funds (1) | $ | 5,003 | $ | - | $ | - | $ | 5,003 | ||||||||
December 31, 2011: | ||||||||||||||||
Available for sale securities: | ||||||||||||||||
Money market funds (1) | $ | 9,237 | $ | - | $ | - | $ | 9,237 | ||||||||
Accrued contingent consideration (2) | $ | - | $ | - | $ | 4,626 | $ | 4,626 | ||||||||
(1) | Included in "Cash and cash equivalents" in the consolidated balance sheets as of December 31, 2012 and 2011 in addition to $23.6 million and $20.6 million, respectively, of cash. Unrealized gains and losses on money market funds were nominal due to the short-term nature of the investments. |
(2) | The fair value of accrued contingent consideration was calculated by discounting the known settlement amount of $5.0 million using the borrowing rate from our credit facility. |
The following table provides a summary of changes in our Level 3 financial asset, accrued contingent consideration, for the years ended December 31, 2011 and 2012 (in thousands):
Balance, January 1, 2011 | $ | - | ||
Accrued contingent consideration from Voxel purchase, less fair value adjustment | 4,626 | |||
Balance, December 31, 2011 | 4,626 | |||
Fair value adjustments | 374 | |||
Payment, gross of settlement adjustment of $250 (note 9) | (5,000 | ) | ||
Balance, December 31, 2012 | $ | - |
The fair value of our Level 3 liabilities, estimated using discount cash flow analysis based on incremental borrowing rates for similar types of borrowing arrangements, is as follows (in thousands):
December 31, | ||||||||||||||||
2012 | 2011 | |||||||||||||||
Carrying Amount | Fair Value | Carrying Amount | Fair Value | |||||||||||||
Term loan | $ | 65,500 | $ | 65,180 | $ | 58,750 | $ | 58,571 | ||||||||
Revolving credit facility | 30,501 | 30,342 | 100 | 100 | ||||||||||||
Other liabilities | 350 | 363 | 501 | 509 | ||||||||||||
F-12
4. | PROPERTY AND EQUIPMENT |
Property and equipment consisted of the following (in thousands):
December 31, | ||||||||
2012 | 2011 | |||||||
Network equipment | $ | 129,168 | $ | 121,477 | ||||
Network equipment under capital lease | 6,386 | 5,662 | ||||||
Furniture and equipment | 17,955 | 11,387 | ||||||
Software | 45,011 | 38,417 | ||||||
Leasehold improvements | 279,219 | 231,701 | ||||||
Buildings under capital lease | 43,325 | 36,030 | ||||||
Property and equipment, gross | 521,064 | 444,674 | ||||||
Less: accumulated depreciation and amortization ($11,351 and $6,353 related to capital leases at December 31, 2012 and 2011, respectively) | (272,969 | ) | (246,305 | ) | ||||
| $ | 248,095 | $ | 198,369 | |||||
During 2012 and 2011, we determined that we would not use certain items and recorded an impairment charge of $0.4 million and $0.5 million, respectively, to developed software related to products and product support software primarily in our data center services segment. We include the impairment charge in "Exit activities, restructuring and impairments" on the accompanying consolidated statements of operations and comprehensive loss for the year ended December 31, 2012.
During January 2012, we reassessed the estimated useful lives of certain assets included in our property and equipment, as we determined we were generally using these assets longer than originally anticipated. As a result, the estimated useful lives of these assets were affected as follows:
Estimated Useful Life (in years) | ||||||||
Original | Revised | |||||||
Network equipment | 3 | 5 | ||||||
C Capitalized software | 3 | 5 | ||||||
Leasehold improvements | 7 | 10-25 | ||||||
Effective January 1, 2012, we accounted for the change in estimated useful lives as a change in accounting estimate on a prospective basis. For the year ended December 31, 2012, depreciation and amortization expense was $15.4 million less than it would have been under the previous estimated useful lives. The per share effect of this change was $0.30 for the year ended December 31, 2012.
We summarize depreciation and amortization of property and equipment associated with direct costs of network, sales and services and other depreciation expense as follows (in thousands):
Year ended December 31, | ||||||||||||
2012 | 2011 | 2010 | ||||||||||
Direct costs of network, sales and services | $ | 33,019 | $ | 36,040 | $ | 26,930 | ||||||
Other depreciation and amortization | 3,128 | 886 | 3,228 | |||||||||
Subtotal | 36,147 | 36,926 | 30,158 | |||||||||
Amortization of acquired technologies | 4,718 | 3,500 | 3,811 | |||||||||
Total depreciation and amortization | $ | 40,865 | $ | 40,426 | $ | 33,969 | ||||||
We retired $8.5 million of assets with accumulated depreciation of $8.5 million during the year ended December 31, 2012, $12.8 million of assets with accumulated depreciation of $12.7 million during the year ended December 31, 2011 and $9.0 million of assets with accumulated depreciation of $8.9 million during the year ended December 31, 2010. We capitalized an immaterial amount of interest for each of the three years in the period ended December 31, 2012.
5. | INVESTMENT IN JOINT VENTURE |
We invested $4.1 million for a 51% ownership interest in Internap Japan, a joint venture with NTT-ME Corporation and NTT Holdings. We do not assert control over the joint venture's operational and financial policies and practices required to account for the joint venture as a subsidiary whose assets, liabilities, revenue and expense would be consolidated due to certain minority interest protections afforded to our joint venture partners. We are, however, able to assert significant influence over the joint venture and, therefore, account for our joint venture investment using the equity-method of accounting.
F-13
We include our investment activity in the joint venture in the IP services segment as summarized below (in thousands):
Year Ended December 31, | ||||||||
2012 | 2011 | |||||||
Investment balance, January 1 | $ | 2,936 | $ | 2,265 | ||||
Proportional share of net income | 220 | 475 | ||||||
Unrealized foreign currency translation (loss) gain, net | (156 | ) | 196 | |||||
Investment balance, December 31 | $ | 3,000 | $ | 2,936 | ||||
Audited summarized financial information for Internap Japan is as follows (in thousands):
Year Ended December 31, | ||||||||||||
2012 | 2011 | 2010 | ||||||||||
Current assets | $ | 5,192 | $ | 6,462 | $ | 5,372 | ||||||
Long-term assets | 1,819 | 712 | 658 | |||||||||
Current liabilities | 1,406 | 1,355 | 1,288 | |||||||||
Long-term liabilities | 24 | 26 | - | |||||||||
Net sales | 10,536 | 11,636 | 10,357 | |||||||||
Operating income | 651 | 850 | 836 | |||||||||
Net income | 372 | 787 | 813 | |||||||||
6. | GOODWILL AND OTHER INTANGIBLE ASSETS |
Goodwill
During the years ended December 31, 2012 and 2011, we did not identify an impairment as a result of our annual impairment test and none of our reporting units were at risk of failing step one. In addition, we considered the likelihood of triggering events that might cause us to reassess goodwill on an interim basis and concluded that none had occurred subsequent to our August 1, 2012 valuation date.
The carrying amount of goodwill for each of the two years ended December 31, 2012 is as follows (in thousands):
Data Center Services | IP Services | Total | ||||||||||
Balance, December 31, 2011: | ||||||||||||
Goodwill | $ | 20,007 | $ | 152,087 | $ | 172,094 | ||||||
Accumulated impairment losses | - | (112,623 | ) | (112,623 | ) | |||||||
Net | $ | 20,007 | $ | 39,464 | $ | 59,471 | ||||||
Balance, December 31, 2012: | ||||||||||||
Goodwill | $ | 20,141 | $ | 152,087 | $ | 172,228 | ||||||
Accumulated impairment losses | - | (112,623 | ) | (112,623 | ) | |||||||
Net | $ | 20,141 | $ | 39,464 | $ | 59,605 | ||||||
Other Intangible Assets
During the years ended December 31, 2012 and 2011, we concluded that no impairment indicators existed to cause us to reassess our other intangible assets.
The components of our amortizing intangible assets are as follows (in thousands):
| December 31, 2012 | December 31, 2011 | |||||||||||||||
Gross Carrying Amount | Accumulated Amortization | Gross Carrying Amount | Accumulated Amortization | |||||||||||||
Acquired technology | $ | 43,627 | $ | (29,561 | ) | $ | 43,627 | $ | (24,844 | ) | ||||||
Customer relationships and trade names | 32,247 | (24,971 | ) | 32,247 | (24,144 | ) | ||||||||||
| $ | 75,874 | $ | (54,532 | ) | $ | 75,874 | $ | (48,988 | ) | |||||||
F-14
Amortization expense for intangible assets during the years ended December 31, 2012, 2011 and 2010 was $5.5 million, $3.5 million and $6.1 million, respectively. As of December 31, 2012, remaining amortization expense is as follows (in thousands):
2013 | $ | 5,546 | ||
2014 | 5,546 | |||
2015 | 2,606 | |||
2016 | 2,018 | |||
2017 | 1,338 | |||
Thereafter | 4,288 | |||
$ | 21,342 |
7. | ACCRUED LIABILITIES |
Accrued liabilities consist of the following (in thousands):
| December 31, | ||||||||
2012 | 2011 | |||||||
Compensation and benefits payable | $ | 6,366 | $ | 4,723 | ||||
Telecommunications, sales, use and other taxes | 1,737 | 1,602 | ||||||
Customer credit balances | 1,584 | 1,273 | ||||||
Other | 1,699 | 1,554 | ||||||
| $ | 11,386 | $ | 9,152 | |||||
8. | EXIT ACTIVITIES AND RESTRUCTURING |
In prior years, we implemented exit activities and restructuring plans that resulted in substantial charges for our real estate obligations. In addition, during the year ended December 31, 2012, we recorded initial exit activity charges related to ceasing use of an office facility, as well as subsequent plan adjustments in sublease income assumptions for certain properties included in our previously-disclosed plans. We included these initial exit activity charges and subsequent plan adjustments in "Exit activities, restructuring and impairments" on the accompanying consolidated statements of operations and comprehensive loss.
The following table displays the transactions and balances for exit activities and restructuring charges during the years ended December 31, 2012 and 2011 (in thousands):
December 31, 2011 Exit and Restructuring Liability | Initial Restructuring Charges | Subsequent Plan Adjustments | Cash Payments | December 31, 2012 Exit and Restructuring Liability | ||||||||||||||||
Real estate obligations: | ||||||||||||||||||||
2012 exit activity | $ | - | $ | 61 | $ | (9 | ) | $ | (19 | ) | $ | 33 | ||||||||
2011 exit activity | 361 | - | (87 | ) | (161 | ) | 113 | |||||||||||||
2007 restructuring | 5,162 | - | 1,018 | (1,935 | ) | 4,245 | ||||||||||||||
2001 restructuring | 2,070 | - | 187 | (775 | ) | 1,482 | ||||||||||||||
| $ | 7,593 | $ | 61 | $ | 1,109 | $ | (2,890 | ) | $ | 5,873 | ||||||||||
December 31, 2010 Exit and Restructuring Liability | Initial Restructuring Charges | Subsequent Plan Adjustments | Cash Payments | December 31, 2011 Exit and Restructuring Liability | ||||||||||||||||
Real estate obligations: | ||||||||||||||||||||
2011 exit activity | $ | - | $ | 421 | $ | 60 | $ | (120 | ) | $ | 361 | |||||||||
2010 exit activity | 12 | - | - | (12 | ) | - | ||||||||||||||
2007 restructuring | 5,635 | - | 1,124 | (1,597 | ) | 5,162 | ||||||||||||||
2001 restructuring | 2,317 | - | 474 | (721 | ) | 2,070 | ||||||||||||||
| $ | 7,964 | $ | 421 | $ | 1,658 | $ | (2,450 | ) | $ | 7,593 | ||||||||||
F-15
9. | ACCRUED CONTINGENT CONSIDERATION |
In conjunction with our acquisition of Voxel in December 2011, we recorded a liability for accrued contingent consideration of $5.0 million, at its fair value of $4.6 million, to be paid, estimated in December 2013, if we received certain technology deliverables. In December 2012, the technology deliverables were received and a settlement was reached for an earlier and reduced payment of $4.8 million. For the year ended December 31, 2012, the net of the revised payment and fair value adjustments was $0.1 million and is included as a non-operating expense in "Other, net" on the accompanying consolidated statements of operations and comprehensive loss.
10. | COMMITMENTS, CONTINGENCIES AND LITIGATION |
Credit Agreement |
In August 2012, we amended our credit agreement (the "Amendment"), which increased the revolving credit facility by $10.0 million, for a total revolving credit facility of $70.0 million, and increased the term loan by $10.0 million, for a total term loan of $67.3 million. In addition, the quarterly payment amount on the term loan was increased from $750,000 to $875,000, the due date for the revolving credit facility and the term loan was extended to August 2015 and the minimum liquidity covenant was reduced from $30.0 million to $20.0 million.
The interest rate on the revolving credit facility will be either: (a) the Base Rate (as defined in the credit agreement) plus 1.75 percentage points or (b) the LIBOR Rate (as defined in the credit agreement) plus 3.50 percentage points, as we elect from time to time. The interest rate on the term loan facility will be either (x) the Base Rate plus 3.50 percentage points or (y) the LIBOR Rate plus 3.50 percentage points, as we elect from time to time.
The credit agreement includes customary representations, warranties, negative and affirmative covenants, including certain financial covenants relating to minimum liquidity, fixed charge coverage ratio and senior leverage ratio. As of December 31, 2012, we were in compliance with these covenants.
Our obligations are secured pursuant to a security agreement, under which we granted a security interest in substantially all of our assets, including the capital stock of our domestic subsidiaries and 65% of the capital stock of our foreign subsidiaries.
We recorded a debt discount of $0.3 million related to costs incurred for the amended term loan. In addition, since the recording of the Amendment was a modification of the credit agreement, we will continue to amortize the previously recorded debt discount over the new term. During the year ended December 31, 2012, we amortized $0.2 million of the debt discount, as interest expense, using the effective interest method over the life of the loan.
A summary of our credit agreement as of December 31, 2012 and December 31, 2011 is as follows (dollars in thousands):
December 31, | ||||||||
2012 | 2011 | |||||||
Credit limit: | ||||||||
Revolving credit facility | $ | 70,000 | $ | 60,000 | ||||
Term loan | 67,300 | 59,000 | ||||||
Outstanding balance on revolving credit facility, due August 2015 | 30,501 | 100 | ||||||
Outstanding principal balance on the term loan, less unamortized discount of $627 and $573, | 64,873 | 58,177 | ||||||
Letters of credit issued | 13,578 | 11,130 | ||||||
Borrowing capacity | 25,921 | 48,770 | ||||||
Interest rate – term loan | 3.7 | % | 3.8 | % | ||||
Interest rate – revolving credit facility | 3.7 | % | 5.0 | % | ||||
Maturities of the term loan are as follows: | ||||||||
2013 | $ | 3,500 | ||||||
2014 | 3,500 | |||||||
2015 | 58,500 | |||||||
| $ | 65,500 | |||||||
Capital Leases
We record capital lease obligations and leased property and equipment at the lesser of the present value of future lease payments based upon the terms of the related lease agreement or the fair value of the assets held under capital leases. As of December 31, 2012, our capital leases had expiration dates ranging from 2013 to 2023 .
F-16
During 2011, we entered into a capital lease for new corporate office space in Atlanta, Georgia due to our Atlanta data center expansion into our then-existing corporate office space. During March 2012, we took possession of the space when it was available according to terms of the lease and recorded the related property and corresponding capital lease obligation of $7.4 million. In addition, during 2012, we entered into a capital lease for network equipment for $2.7 million.
Future minimum capital lease payments and the present value of the minimum lease payments for all capital leases as of December 31, 2012, are as follows (in thousands):
2013 | $ | 8,710 | ||
2014 | 8,933 | |||
2015 | 9,366 | |||
2016 | 8,357 | |||
2017 | 7,870 | |||
Thereafter | 26,597 | |||
Remaining capital lease payments | 69,833 | |||
Less: amounts representing imputed interest | (21,275 | ) | ||
Present value of minimum lease payments | 48,558 | |||
Less: current portion | (4,504 | ) | ||
$ | 44,054 |
Operating Leases
We have entered into leases for data center, P-NAP and office space that are classified as operating leases. Initial lease terms range from three to 25 years and contain various periods of free rent and renewal options. However, we record rent expense on a straight-line basis over the initial lease term and any renewal periods that are reasonably assured. Certain leases require that we maintain letters of credit. Future minimum lease payments on non-cancelable operating leases having terms in excess of one year were as follows at December 31, 2012 (in thousands):
2013 | $ | 29,030 | ||
2014 | 28,412 | |||
2015 | 20,731 | |||
2016 | 20,825 | |||
2017 | 15,352 | |||
Thereafter | 35,126 | |||
$ | 149,476 |
Rent expense was $24.7 million, $23.2 million and $22.9 million during the years ended December 31, 2012, 2011 and 2010, respectively.
Other Commitments
We have entered into commitments primarily related to IP, telecommunications and data center services. Future minimum payments under these service commitments having terms in excess of one year were as follows at December 31, 2012 (in thousands):
2013 | $ | 6,304 | ||
2014 | 4,107 | |||
2015 | 2,928 | |||
2016 | 1,552 | |||
2017 | 390 | |||
Thereafter | 429 | |||
$ | 15,710 |
Concentrations of Risk
We participate in an industry that is characterized by relatively high volatility and strong competition for market share. We and others in the industry encounter aggressive pricing practices, evolving customer demands and continual technological developments. Our operating results could be negatively affected if we are not able to adequately address pricing strategies, customers' demands and technological advancements.
We depend on other companies to supply various key elements of our infrastructure including the network access local loops between our network access points and our Internet service providers and the local loops between our network access points and our customers' networks. In addition, a limited number of vendors currently supply the routers and switches used in our network. Furthermore, we do not carry significant inventories of the products and equipment that we purchase and use, and we have no guaranteed supply arrangements with our vendors. A loss of a significant vendor could delay maintenance or expansion of our infrastructure and increase our costs. If our limited number of suppliers fail to provide products or services that comply with evolving Internet standards or that interoperate with other products or services we use in our network infrastructure, we may be unable to meet all or a portion of our customer service commitments, which could adversely affect our business, results of operations and financial condition.
F-17
Litigation
Securities Class Action Litigation. On November 12, 2008, a putative securities fraud class action lawsuit was filed against us and our former chief executive officer in the United States District Court for the Northern District of Georgia, captioned Catherine Anastasio and Stephen Anastasio v. Internap Network Services Corp. and James P. DeBlasio, Civil Action No. 1:08-CV-3462-JOF. The complaint alleges that we and the individual defendant violated Section 10(b) of the Securities Exchange Act of 1934 (the "Exchange Act") and that the individual defendant also violated Section 20(a) of the Exchange Act as a "control person" of Internap. Plaintiffs purport to bring these claims on behalf of a class of our investors who purchased our common stock between March 28, 2007 and March 18, 2008.
Plaintiffs allege generally that, during the putative class period, we made misleading statements and omitted material information regarding (a) integration of VitalStream, which we acquired in 2007, (b) customer issues and related credits due to services outages and (c) our previously reported 2007 revenue that we subsequently reduced in 2008 as announced on March 18, 2008. Plaintiffs assert that we and the individual defendant made these misstatements and omissions to maintain our share price. Plaintiffs seek unspecified damages and other relief.
On August 12, 2009, the Court granted plaintiffs leave to file an Amended Class Action Complaint ("Amended Complaint"). The Amended Complaint added a claim for violation of Section 14(a) of the Exchange Act based on alleged misrepresentations in our proxy statement in connection with our acquisition of VitalStream. The Amended Complaint also added our former chief financial officer as a defendant and lengthened the putative class period.
On September 11, 2009, we and the individual defendants filed motions to dismiss. On November 6, 2009, plaintiffs filed a Corrected Amended Class Action Complaint. On December 7, 2009, plaintiffs filed a motion for leave to file a Second Amended Class Action Complaint to add allegations regarding, inter alia, an alleged failure to conduct due diligence in connection with the VitalStream acquisition and additional statements from purported confidential witnesses.
On September 15, 2010, the Court granted our motion to dismiss and denied the individual defendants' motion to dismiss. The Court dismissed plaintiffs' claims under Section 14(a) of the Exchange Act. With respect to plaintiffs' claims under Section 10(b) of the Exchange Act, the Court held that the Amended Complaint failed to satisfy the pleading requirements of the Private Securities Litigation Reform Act, but allowed plaintiffs' one final opportunity to amend the complaint. On October 26, 2010, plaintiffs filed their Third Amended Class Action Complaint. On December 10, 2010, we filed a motion to dismiss this complaint. On September 30, 2011, the Court granted in large part the motion to dismiss. The two remaining claims involve certain alleged misstatements concerning the progress of the integration of VitalStream and the stability of our CDN platform.
Derivative Action Litigation. On November 12, 2009, stockholder Walter M. Unick filed a putative derivative action purportedly on behalf of Internap against certain of our directors and officers in the Superior Court of Fulton County, Georgia, captioned Unick v. Eidenberg, et al., Case No. 2009cv177627. This action is based upon substantially the same facts alleged in the securities class action litigation described above. The complaint seeks to recover damages in an unspecified amount. On January 28, 2010, the Court entered the parties' agreed order staying the matter until the motions to dismiss are resolved in the securities class action litigation. Given the developments in the securities class action described above, we intend to move to dismiss the derivative complaint.
While we will vigorously contest the securities class action and derivative action lawsuits, we cannot determine the final resolution of the lawsuits or when they might be resolved. In addition to the expenses incurred in defending this litigation and any damages that may be awarded in the event of an adverse ruling, our management's efforts and attention may be diverted from the ordinary business operations to address these claims. Regardless of the outcome, this litigation described above may have a material adverse impact on our financial results because of defense costs, including costs related to our indemnification obligations, diversion of resources and other factors.
As of December 31, 2012, we determined that we could not reasonably estimate the potential loss with respect to the litigation described above, and as a result, we have not recognized any accruals for loss related to such pending litigation and cannot estimate losses exceeding amounts previously recognized in connection with these matters, which consisted of expenses in the aggregate of $0.5 million in 2008 and 2009.
We are subject to other legal proceedings, claims and litigation arising in the ordinary course of business. Although the outcome of these matters is currently not determinable, we do not expect that the ultimate costs to resolve these matters will have a material adverse impact on our financial condition, results of operations or cash flows.
F-18
11. | OPERATING SEGMENTS |
We operate in two business segments: data center services and IP services. The data center services segment includes colocation, hosting and cloud services. Colocation involves providing physical space within data centers and associated services such as power, interconnection, environmental controls and security while allowing our customers to deploy and manage their servers, storage and other equipment in our secure data centers. Hosting and cloud services involve the provision and maintenance of customers' hardware, operating system software, data center infrastructure and interconnection, while allowing our customers to own and manage their software applications and content. O ur IP services segment includes our patented Performance IP™ service, CDN services and IP routing and hardware and software platform.
The following table shows operating results for our business segments, along with reconciliations from segment profit to loss before income taxes and equity in (earnings) of equity-method investment:
Year Ended December 31, | ||||||||||||
2012 | 2011 | 2010 | ||||||||||
Revenues: | ||||||||||||
Data center services | $ | 167,286 | $ | 133,453 | $ | 128,200 | ||||||
IP services | 106,306 | 111,175 | 115,964 | |||||||||
Total revenues | 273,592 | 244,628 | 244,164 | |||||||||
Direct costs of network, sales and services, exclusive of depreciation and amortization: | ||||||||||||
Data center services | 90,604 | 78,907 | 82,761 | |||||||||
IP services | 40,350 | 41,403 | 44,662 | |||||||||
Total direct costs of network, sales and services, exclusive of depreciation and amortization | 130,954 | 120,310 | 127,423 | |||||||||
Segment profit: | ||||||||||||
Data center services | 76,682 | 54,546 | 45,439 | |||||||||
IP services | 65,956 | 69,772 | 71,302 | |||||||||
Total segment profit | 142,638 | 124,318 | 116,741 | |||||||||
Exit activities, restructuring and impairments | 1,422 | 2,833 | 1,411 | |||||||||
Other operating expenses, including direct costs of customer support, depreciation and amortization | 137,452 | 125,408 | 116,226 | |||||||||
Income (loss) from operations | 3,764 | (3,923 | ) | (896 | ) | |||||||
Non-operating expense | 7,849 | 3,866 | 2,170 | |||||||||
Loss before income taxes and equity in (earnings) of equity-method investment | $ | (4,085 | ) | $ | (7,789 | ) | $ | (3,066 | ) | |||
Total assets by segment are as follows (in thousands):
| December 31, | ||||||||
2012 | 2011 | |||||||
Data center services | $ | 233,727 | $ | 215,004 | ||||
IP services | 166,985 | 141,706 | ||||||
| $ | 400,712 | $ | 356,710 | |||||
For the years ended December 31, 2012, 2011 and 2010, revenues generated and long-lived assets located outside the U.S. were less than 10% of our total revenues and assets.
We present goodwill by segment in note 6, and as discussed in that note, we did not record an impairment charge during the years ended December 31, 2012 and 2011.
12. | STOCK-BASED COMPENSATION PLANS |
We have granted employees options to purchase shares of our common stock and issued shares of common stock subject to vesting. We measure stock-based compensation cost at the grant date based on the calculated fair value of the option or award. We recognize the expense over the employees' requisite service period, generally the vesting period of the option or award. We estimate the fair value of stock options at the grant date using the Black-Scholes option pricing model. Stock option pricing model input assumptions such as expected term, expected volatility and risk-free interest rate, impact the fair value estimate. Further, the forfeiture rate impacts the amount of aggregate compensation. These assumptions are subjective and generally require significant analysis and judgment to develop.
F-19
The following table summarizes the amount of stock-based compensation, net of estimated forfeitures, included in the consolidated statements of operations and comprehensive loss (in thousands):
Year Ended December 31, | ||||||||||||
2012 | 2011 | 2010 | ||||||||||
Direct costs of customer support | $ | 936 | $ | 659 | $ | 755 | ||||||
Sales and marketing | 929 | 835 | 944 | |||||||||
General and administrative | 3,993 | 2,489 | 2,932 | |||||||||
| $ | 5,858 | $ | 3,983 | $ | 4,631 | |||||||
We have not recognized any tax benefits associated with stock-based compensation due to our tax net operating losses. During the three years ended December 31, 2012, 2011 and 2010, we capitalized $0.4 million, $0.5 million and $0.2 million, respectively, of stock-based compensation.
The significant weighted average assumptions used for estimating the fair value of the option grants under our stock-based compensation plans during the years ended December 31, 2012, 2011 and 2010, were expected terms of 4.4, 4.2 and 4.2 years, respectively; historical volatilities of 78%, 78% and 80%, respectively; risk free interest rates of 0.7%, 1.6% and 1.9%, respectively and no dividend yield. The weighted average estimated fair value per share of our stock options at grant date was $4.51, $4.02 and $3.07 during the years ended December 31, 2012, 2011 and 2010, respectively. The expected term represents the weighted average period of time that the stock options are expected to be outstanding, giving consideration to the vesting schedules and our historical exercise patterns. Because our stock options are not publicly traded, assumed volatility is based on the historical volatility of our stock. The risk-free interest rate is based on the U.S. Treasury yield curve in effect at the time of grant for periods corresponding to the expected term of the options. We have also used historical data to estimate stock option exercises, employee terminations and forfeiture rates.
Under our Amended and Restated 2005 Incentive Stock Plan (the "2005 Plan"), we may issue stock options, stock appreciation rights, restricted stock and stock unit grants to eligible employees and directors. Our historical practice has been to grant only stock options and restricted stock.
The compensation committee of our board of directors administers the 2005 Plan. As of December 31, 2012, 3.8 million shares of stock were available for issuance.
For all stock-based compensation plans, the exercise price for each stock option may not be less than the fair market value of a share of our common stock on the grant date. Stock options generally have a maximum term of 10 years from the grant date. Stock options become exercisable as determined at the grant date by the compensation committee of our board of directors. Stock options generally vest 25% after one year and monthly or quarterly over the following three years. Conditions, if any, under which stock will be issued under stock grants or cash will be paid under stock unit grants and the conditions under which the interest in any stock that has been issued will become non-forfeitable are determined at the grant date by the compensation committee. All awards under the 2005 Plan are subject to minimum vesting requirements unless otherwise determined by the compensation committee: a minimum one-year vesting period for time-based stock option and stock appreciation rights and a minimum three-year vesting period for time-based stock grants, except as described below for non-employee directors. If awards are performance-based, then performance must be measured over a period of at least one year. The 2005 Plan limits the number of shares that may be granted as full value awards (that is, grants other than in the form of stock options or stock appreciate rights) to 50% of the total number of shares available for issuance. In general, when awards granted under the 2005 Plan expire or are canceled without having been fully exercised, the shares reserved for those awards will be returned to the share reserve and be available for future awards. However, shares of common stock that are delivered by the grantee or withheld by us as payment of the exercise price in connection with the exercise of an option or payment of the tax withholding obligation in connection with any award will not be returned to the share reserve. We have reserved sufficient common stock to satisfy stock option exercises with newly issued stock. However, we may also use treasury stock to satisfy stock option exercises.
During 2012 and 2011, the value of the equity grants receiv e d by non-employee directors was $77,000 and $75,000, respectively, in the form of restricted stock that vests on the date of our annual meeting of stockholders in the year following grant. In 2010, the value of the equity grants received by non-employee directors was $37,500 in the form of fully vested options and $37,500 of restricted stock that vests in three annual installments on the anniversary of grant. As of December 31, 2012, 0.3 million stock options granted to non-employee directors were outstanding.
F-20
Stock option activity during the year ended December 31, 2012 under all of our stock-based compensation plans was as follows (shares in thousands):
Shares | Weighted Average Exercise Price | |||||||
Balance, December 31, 2011 | 4,643 | $ | 6.13 | |||||
Granted | 1,632 | 7.64 | ||||||
Exercised | (516 | ) | 4.79 | |||||
Forfeitures and post-vesting cancellations | (1,058 | ) | 7.09 | |||||
Balance, December 31, 2012 | 4,701 | $ | 6.57 | |||||
Exercisable, December 31, 2012 | 2,532 | $ | 6.31 | |||||
Fully vested and exercisable stock options and stock options expected to vest as of December 31, 2012 are further summarized as follows (shares in thousands):
Fully Vested and Exercisable | Expected to Vest | |||||||
Total shares | 2,532 | 4,376 | ||||||
Weighted-average exercise price | $ | 6.31 | $ | 6.52 | ||||
Aggregate intrinsic value | $ | 4,921,295 | $ | 5,917,234 | ||||
Weighted-average remaining contractual term (in years) | 6.0 | 7.1 | ||||||
The total intrinsic value of stock options exercised was $1.2 million, $0.9 million and $1.2 million during the years ended December 31, 2012, 2011 and 2010, respectively. None of our stock options or the underlying shares is subject to any right to repurchase by us.
Restricted stock activity during the year ended December 31, 2012 was as follows (shares in thousands):
Shares | Weighted- Average Grant Date Fair Value | |||||||
Unvested balance, December 31, 2011 | 1,165 | $ | 5.10 | |||||
Granted | 772 | 7.10 | ||||||
Vested | (520 | ) | 3.85 | |||||
Forfeited | (210 | ) | 6.32 | |||||
Unvested balance, December 31, 2012 | 1,207 | $ | 4.96 | |||||
The total fair value of restricted stock vested during the years ended December 31, 2012, 2011 and 2010 was $3.7 million, $2.5 million and $1.7 million, respectively. The total intrinsic value at December 31, 2012 of all unvested restricted stock was $8.3 million.
Total unrecognized compensation costs related to unvested stock-based compensation as of December 31, 2012 was as follows (dollars in thousands):
Stock Options | Restricted Stock | Total | ||||||||||
Unrecognized compensation | $ | 6,113 | $ | 3,566 | $ | 9,679 | ||||||
Weighted-average remaining recognition period (in years) | 2.6 | 2.0 | 2.4 | |||||||||
13. | EMPLOYEE RETIREMENT PLAN |
We sponsor a defined contribution retirement savings plan that qualifies under Section 401(k) of the Internal Revenue Code. Plan participants may elect to have a portion of their pre-tax compensation contributed to the plan, subject to certain guidelines issued by the Internal Revenue Service. Employer contributions are discretionary and were $0.7 million, $0.7 million and $0.8 million during the years ended December 31, 2012, 2011 and 2010, respectively.
F-21
14. | INCOME TAXES |
The current and deferred income tax provision (benefit) was as follows (in thousands):
Year Ended December 31, | ||||||||||||
2012 | 2011 | 2010 | ||||||||||
Current: | ||||||||||||
Federal | $ | - | $ | 12 | $ | 194 | ||||||
State | 165 | 140 | 351 | |||||||||
Foreign | - | - | - | |||||||||
| 165 | 152 | 545 | ||||||||||
Deferred: | ||||||||||||
Federal | - | (6,002 | ) | - | ||||||||
State | - | - | 1 | |||||||||
Foreign | 288 | 238 | 406 | |||||||||
| 288 | (5,764 | ) | 407 | |||||||||
Net income tax provision (benefit) | $ | 453 | $ | (5,612 | ) | $ | 952 | |||||
A reconciliation of the effect of applying the federal statutory rate and the effective income tax rate on our income tax provision is as follows:
Year Ended December 31, | ||||||||||||
2012 | 2011 | 2010 | ||||||||||
Federal income tax at statutory rates | (34 | )% | (34 | )% | (34 | )% | ||||||
Foreign income tax (benefit) | - | 6 | (10 | ) | ||||||||
State income tax | (2 | ) | (3 | ) | 8 | |||||||
Other permanent differences | 3 | 4 | 2 | |||||||||
Statutory tax rate change | 4 | 2 | 3 | |||||||||
Compensation | 9 | 2 | 7 | |||||||||
Change in valuation allowance | 31 | (49 | ) | 55 | ||||||||
Effective tax rate | 11 | % | (72 | )% | 31 | % | ||||||
Temporary differences between the financial statement carrying amounts and tax bases of assets and liabilities that give rise to significant portions of deferred taxes related to the following (in thousands):
December 31, | ||||||||
2012 | 2011 | |||||||
Current deferred income tax assets: | ||||||||
Provision for doubtful accounts | $ | 2,457 | $ | 3,691 | ||||
Accrued compensation | 1,745 | 1,251 | ||||||
Other accrued expenses | 5 | 45 | ||||||
Deferred revenue | 1,097 | 758 | ||||||
Restructuring liability | 953 | 1,029 | ||||||
Other | 165 | 116 | ||||||
Current deferred income tax assets | 6,422 | 6,890 | ||||||
Less: valuation allowance | (6,422 | ) | (6,890 | ) | ||||
Net current deferred income tax assets | - | - | ||||||
Long-term deferred income tax assets: | ||||||||
Property and equipment | 38,340 | 36,093 | ||||||
Goodwill | 4,323 | 4,790 | ||||||
Intangible assets | (4,495 | ) | (2,605 | ) | ||||
Deferred revenue, less current portion | 909 | 779 | ||||||
Restructuring liability, less current portion | 1,279 | 1,856 | ||||||
Deferred rent | 5,777 | 6,304 | ||||||
Stock-based compensation | 2,387 | 1,660 | ||||||
U.S. net operating loss carryforwards | 62,313 | 60,972 | ||||||
Foreign net operating loss carryforwards, less current portion | 3,755 | 3,650 | ||||||
Capital loss carryforwards | 2,271 | 2,271 | ||||||
Tax credit carryforwards | 980 | 968 | ||||||
Other | 2,081 | 1,881 | ||||||
Long-term deferred income tax assets | 119,920 | 118,619 | ||||||
Less: valuation allowance | (118,011 | ) | (116,523 | ) | ||||
Net long-term deferred income tax assets | 1,909 | 2,096 | ||||||
Net deferred tax assets | $ | 1,909 | $ | 2,096 | ||||
F-22
As of December 31, 2012, we had U.S. net operating loss carryforwards for federal tax purposes of $186.3 million that will expire beginning 2018 through 2032. Of the total U.S. net operating loss carryforwards, $22.3 million of net operating losses related to the deduction of stock-based compensation that will be tax-effected and the benefit credited to additional paid-in capital when realized. In addition, we have alternative minimum tax and research and development tax credit carryforwards of approximately $1.0 million. Alternative minimum tax credits have an indefinite carryforward period while our research and development credits will begin to expire in 2026. Finally, we have foreign net operating loss carryforwards of $15.0 million that will begin to expire in 2013.
We determined that through December 31, 2012, no further ownership changes have occurred since 2001 pursuant to Section 382 of the Internal Revenue Code ("Section 382"). Therefore, as of December 31, 2012, no additional material limitations exist on the U.S. net operating losses related to Section 382. However, if we experience subsequent changes in stock ownership as defined by Section 382, we may have additional limitations on the future utilization of our U.S. net operating losses.
A deferred tax asset is also created by accelerated depreciable lives of fixed assets for financial reporting purposes compared to income tax purposes. Network equipment and leasehold improvements comprise the majority of the income tax basis differences. These assets are deductible over a shorter life for financial reporting than for income tax purposes. As we retire assets in the future, the income tax basis differences will reverse and become deductible for income taxes.
We periodically evaluate the recoverability of the deferred tax assets and the appropriateness of the valuation allowance. As of December 31, 2012, we established a valuation allowance of $120.5 million against the U.S. deferred tax asset and $3.9 million against the foreign deferred tax asset that we do not believe are more likely than not to be realized. We will continue to assess the requirement for a valuation allowance on a quarterly basis and, at such time when we determine that it is more likely than not that the deferred tax assets will be realized, we will reduce the valuation allowance accordingly.
Changes in our deferred tax asset valuation allowance are summarized as follows (in thousands):
| Year Ended December 31, | ||||||||||||
2012 | 2011 | 2010 | ||||||||||
Balance, January 1, | $ | 123,414 | $ | 138,693 | $ | 128,978 | ||||||
Increase (decrease) in deferred tax assets | 1,019 | (15,279 | ) | 9,715 | ||||||||
Balance, December 31, | $ | 124,433 | $ | 123,414 | $ | 138,693 | ||||||
We intend to reinvest future earnings indefinitely within each country. Accordingly, we have not recorded deferred taxes for the difference between our financial and tax basis investment in foreign entities. Based on negative cumulative earnings from foreign operations, we estimate that we will not incur incremental tax costs in the hypothetical instance of a repatriation and thus no deferred asset or liability would be recorded in our consolidated financial statements.
Our accounting for uncertainty in income taxes requires us to determine whether it is more likely than not that a tax position will be sustained upon examination based upon the technical merits of the position. If the more-likely-than-not threshold is met, we must measure the tax position to determine the amount to recognize in the financial statements.
Changes in our unrecognized tax benefits are summarized as follows (in thousands):
| Year Ended December 31, | ||||||||||||
2012 | 2011 | 2010 | ||||||||||
Unrecognized tax benefits balance, January 1, | $ | 283 | $ | - | $ | - | ||||||
Additions for tax positions of current year | 58 | 283 | - | |||||||||
Unrecognized tax benefits balance, December 31, | $ | 341 | $ | 283 | $ | - | ||||||
There were no changes in the liability for unrecognized tax benefits and thus had no impact on our effective income tax rate. We expect the total of $0.3 million of unrecognized tax benefits to reverse over the next 12 months.
We classify interest and penalties arising from the underpayment of income taxes in the consolidated statements of operations and comprehensive loss as a component of "General and administrative" expenses. As of December 31, 2012, 2011 and 2010, we had an accrual of $48,000, $48,000 and $0, respectively, for interest and penalties related to uncertain tax positions. No additional interest and penalties accrued during 2012.
Our federal income tax returns remain open to examination for the tax years 2009 through 2011; however, tax authorities have the right to adjust the net operating loss carryovers for years prior to 2009. Returns filed in other jurisdictions are subject to examination for years prior to 2009.
F-23
15. | RELATED PARTY TRANSACTIONS |
As discussed in note 5, we have a 51% ownership interest in Internap Japan, a joint venture that we account for using the equity method. Transactions with Internap Japan are summarized as follows (in thousands):
| Year Ended December 31, | ||||||||||||
2012 | 2011 | 2010 | ||||||||||
Revenues | $ | 109 | $ | 192 | $ | 157 | ||||||
Direct costs of network sales and services | 87 | 116 | 91 | |||||||||
| December 31, | ||||||||
2012 | 2011 | |||||||
Accounts receivable | $ | 29 | $ | 43 | ||||
Accounts payable | - | - | ||||||
16. | ACQUISITION |
On December 30, 2011, we completed the acquisition of Voxel and integrated its operations into our data center services segment. We acquired Voxel for a total purchase price of $33.3 million for all of its outstanding stock, which included accrued contingent consideration of $5.0 million, present valued at $4.6 million, to be paid if we received certain technology deliverables. See note 9 for information regarding the accrued contingent consideration. In addition, we incurred $0.6 million in acquisition-related expenses, which we expensed and included in "General and administrative" on the accompanying consolidated statements of operations and comprehensive loss. We funded the purchase price and acquisition costs by drawing-down our term loan.
Purchase Price Allocation
We allocated the aggregate purchase price for Voxel to the net tangible and intangible assets based upon their fair values as of December 30, 2011, set forth below. We recorded the excess of the purchase price over the net tangible and intangible assets as goodwill. We based the allocation of the purchase price upon a valuation for property and equipment and intangible assets and carrying value for the remaining assets and liabilities. Certain of our estimates and assumptions were subject to change within the measurement period (up to one year from the acquisition date). We expect that none of the goodwill will be deductible for tax purposes. Our purchase price allocation was as follows (in thousands):
Cash and cash equivalents | $ | 930 | ||
Account receivable and other current assets | 1,081 | |||
Property and equipment | 4,795 | |||
Goodwill | 20,007 | |||
Intangible assets | 15,700 | |||
Other assets | 336 | |||
Accounts payable and accrued expenses | (1,636 | ) | ||
Deferred revenue | (368 | ) | ||
Capital lease obligations | (1,288 | ) | ||
Other long-term liabilities | (137 | ) | ||
Deferred income tax liability | (6,140 | ) | ||
$ | 33,280 |
The intangible assets acquired were as follows (in thousands):
Fair Value | Weighted Average Useful Life | ||||
Customer relationships | $ | 7,800 | 10 years | ||
Internally used software | 3,400 | 5 years | |||
Acquired technology | 4,300 | 8 years | |||
Trade names | 200 | 10 years | |||
Total intangible assets | $ | 15,700 | |||
F-24
Unaudited Supplemental Financial Information
As the acquisition occurred on December 30, 2011 and was not material to our business, we did not record Voxel's revenue and expense from the date of acquisition for the year ended December 31, 2011.
Our unaudited pro forma results presented below, including Voxel, for the year ended December 31, 2011 and 2010 are presented as if the acquisition had been completed on January 1, 2010. The pro forma financial information is presented for informational purposes only and is not indicative of the results of operations that would have been achieved if the acquisition had taken place at the beginning of 2010.
(in thousands) | Year Ended December 31, | |||||||
2011 | 2010 | |||||||
Unaudited pro forma revenue | $ | 257,999 | $ | 254,409 | ||||
Unaudited pro forma net loss | (12,241 | ) | (2,820 | ) (1) | ||||
(1) | The 2010 unaudited pro forma net loss includes a nonrecurring deferred tax benefit recorded as a result of Voxel purchase accounting. The $6.1 million deferred tax liability resulted in a deferred tax benefit once consolidated with our balance sheet, as it lowered our consolidated net deferred tax asset resulting in the release of our valuation allowance. |
17. | SUBSEQUENT EVENTS |
During 2012, we entered into a lease for new company-controlled data center space to expand our existing services in the metro New York market. In January 2013, we took possession of the space when it was available according to the lease and recorded the related property and equipment and corresponding capital lease obligation of $9.4 million.
Also subsequent to December 31, 2012, we signed a minimum purchase commitment for data center services of $36.0 million to be paid over three years starting March 2013. This commitment renews our relationship with an existing data center vendor.
18. | UNAUDITED QUARTERLY RESULTS |
The following table sets forth selected unaudited quarterly data during the years ended December 31, 2012 and 2011. The quarterly operating results below are not necessarily indicative of those in future periods (in thousands, except for share data).
2012 Quarter Ended | ||||||||||||||||
March 31 | June 30 | September 30 | December 31 | |||||||||||||
Revenues | $ | 67,028 | $ | 68,687 | $ | 68,129 | $ | 69,748 | ||||||||
Direct costs of network, sales and services, exclusive of depreciation and amortization | 31,154 | 32,641 | 33,573 | 33,585 | ||||||||||||
Direct costs of customer support | 6,728 | 6,481 | 6,898 | 6,556 | ||||||||||||
Direct costs of amortization of acquired technologies | 1,179 | 1,179 | 1,179 | 1,179 | ||||||||||||
Exit activities, restructuring and impairments | 43 | 645 | 124 | 610 | ||||||||||||
Net income (loss) | 107 | (1,997 | ) | (2,450 | ) | 21 | ||||||||||
Basic and diluted net income (loss) per share | 0.00 | (0.04 | ) | (0.05 | ) | 0.00 | ||||||||||
2011 Quarter Ended | ||||||||||||||||
March 31 | June 30 | September 30 | December 31 | |||||||||||||
Revenues | $ | 59,404 | $ | 60,410 | $ | 62,014 | $ | 62,800 | ||||||||
Direct costs of network, sales and services, exclusive of depreciation and amortization | 29,030 | 30,569 | 30,787 | 29,924 | ||||||||||||
Direct costs of customer support | 5,110 | 5,374 | 5,407 | 5,387 | ||||||||||||
Direct costs of amortization of acquired technologies | 875 | 875 | 875 | 875 | ||||||||||||
Exit activities, restructuring and impairments | 189 | 1,304 | 123 | 1,217 | ||||||||||||
Net (loss) income | (1,500 | ) | (2,612 | ) | (1,788 | ) | 4,198 | |||||||||
Basic and diluted net (loss) income per share | (0.03 | ) | (0.05 | ) | (0.04 | ) | 0.08 | |||||||||
F-25
INTERNAP NETWORK SERVICES CORPORATION
F INANCIAL STATEMENT SCHEDULE
VALUATION AND QUALIFYING ACCOUNTS AND RESERVES (IN THOUSANDS)
Balance at Beginning of Fiscal Period | Charges to Costs and Expense | Deductions | Balance at End of Fiscal Period | |||||||||||||
Year ended December 31, 2010: | ||||||||||||||||
Allowance for doubtful accounts | $ | 1,953 | $ | 1,253 | $ | (1,323 | ) (1) | $ | 1,883 | |||||||
Year ended December 31, 2011: | ||||||||||||||||
Allowance for doubtful accounts | 1,883 | 1,082 | (1,297 | ) (1) | 1,668 | |||||||||||
Year ended December 31, 2012: | ||||||||||||||||
Allowance for doubtful accounts | 1,668 | 932 | (791 | ) (1) | 1,809 | |||||||||||
(1) | Deductions in the allowance for doubtful accounts represent write-offs of uncollectible accounts net of recoveries. |
S-1