UNITED STATES
SECURITIES AND EXCHANGE COMMISSION
WASHINGTON, D.C. 20549
FORM 10-K
(Mark One)
[X] | ANNUAL REPORT PURSUANT TO SECTION 13 OR 15(d) OF THE SECURITIES EXCHANGE ACT OF 1934 |
For the Fiscal Year Ended June 30, 2017
OR
[ ] | TRANSITION REPORT PURSUANT TO SECTION 13 OR 15(d) OF THE SECURITIES EXCHANGE ACT OF 1934 |
For the Transition Period From __________________ To __________________
Commission File Number 1-35593
HOMETRUST BANCSHARES, INC.
(Exact Name of Registrant as Specified in its Charter)
Maryland |
| 45-5055422 |
(State or Other Jurisdiction of Incorporation or Organization) |
| (I.R.S. Employer Identification No.) |
|
|
|
10 Woodfin Street, Asheville, North Carolina |
| 28801 |
(Address of Principal Executive Offices) |
| (Zip Code) |
Registrant's Telephone Number, Including Area Code: (828) 259-3939
Securities Registered Pursuant to Section 12(b) of the Act:
Title of Each Class |
| Name of Each Exchange on Which Registered |
Common Stock, par value $0.01 per share |
| The NASDAQ Stock Market LLC |
Securities Registered Pursuant to Section 12(g) of the Act:
Preferred Share Purchase Rights
Indicate by check mark if the registrant is a well-known seasoned issuer, as defined in Rule 405 of the Securities Act. Yes [ ] No [X]
Indicate by check mark if the registrant is not required to file reports pursuant to Section 13 or Section 15(d) of the Act. Yes [ ] No [X]
Indicate by check mark whether the registrant (1) has filed all reports required to be filed by Section 13 or 15(d) of the Securities Exchange Act of 1934 during the preceding 12 months (or for such shorter period that the registrant was required to file such reports), and (2) has been subject to such filing requirements for the past 90 days. Yes [X] No [ ].
Indicate by check mark whether the registrant has submitted electronically and posted on its corporate Web site, if any, every Interactive Data File required to be submitted and posted pursuant to Rule 405 of Regulation S-T (§ 232.405 of this chapter) during the preceding 12 months (or for such shorter period that the registrant was required to submit and post such files). Yes [X] No [ ].
Indicate by check mark if disclosure of delinquent filers pursuant to Item 405 of Regulation S-K is not contained herein, and will not be contained, to the best of the registrant's knowledge, in definitive proxy or information statements incorporated by reference in Part III of this Form 10-K or any amendment to this Form 10-K. [X]
Indicate by check mark whether the registrant is a large accelerated filer, an accelerated filer, a non-accelerated filer, a smaller reporting company, or an emerging growth company. See the definitions of "large accelerated filer," "accelerated filer," "smaller reporting company," "emerging growth company" in Rule 12b-2 of the Exchange Act.
Large Accelerated Filer [ ] |
| Accelerated Filer [X] |
Non-Accelerated Filer [ ] (Do not check if a smaller reporting company) |
| Smaller reporting company [ ] |
Emerging growth company [X] |
|
|
If an emerging growth company, indicate by check mark if the registrant has elected not to use the extended transition period for complying with any new or revised financial accounting standards provided pursuant to Section 13(a) of the Exchange Act. | [ ] |
Indicate by check mark whether the registrant is a shell company (as defined in Rule 12b-2 of the Exchange Act). Yes [ ] No [X].
As of September 5, 2017 , there were issued and outstanding 18,968,675 shares of the Registrant's Common Stock. The aggregate market value of the voting stock held by non-affiliates of the Registrant computed by reference to the closing price of such stock as of December 31, 2016, was $450.7 million. (The exclusion from such amount of the market value of the shares owned by any person shall not be deemed an admission by the Registrant that such person is an affiliate of the Registrant).
HOMETRUST BANCSHARES, INC.
FORM 10-K
FOR THE FISCAL YEAR ENDED JUNE 30, 2017
TABLE OF CONTENTS
|
| Page |
PART I | ||
Item 1 | Business | 4 |
Item 1A. | Risk Factors | 37 |
Item 1B. | Unresolved Staff Comments | 47 |
Item 2 | Properties | 47 |
Item 3 | Legal Proceedings | 47 |
Item 4 | Mine Safety Disclosures | 47 |
| ||
PART II | ||
Item 5 | Market for Registrant's Common Equity, Related Stockholder Matters, and Issuer Purchases of Equity Securities | 48 |
Item 6 | Selected Financial Data | 50 |
Item 7 | Management's Discussion and Analysis of Financial Condition and Results of Operations | 52 |
Item 7A. | Quantitative and Qualitative Disclosures About Market Risk | 69 |
Item 8 | Financial Statements and Supplementary Data | 70 |
Item 9 | Changes in and Disagreements with Accountants on Accounting and Financial Disclosure | 121 |
Item 9A. | Control and Procedures | 121 |
Item 9B. | Other Information | 122 |
| ||
PART III | ||
Item 10 | Directors, Executive Officers and Corporate Governance | 122 |
Item 11 | Executive Compensation | 122 |
Item 12 | Security Ownership of Certain Beneficial Owners and Management and Related Stockholder Matters | 122 |
Item 13 | Certain Relationships and Related Transactions, and Director Independence | 122 |
Item 14 | Principal Accountant Fees and Services | 122 |
| ||
PART IV | ||
Item 15 | Exhibits and Financial Statement Schedules | 123 |
| Signatures | 124 |
2
Forward-Looking Statements
Certain matters in this Form 10-K constitute forward-looking statements within the meaning of the Private Securities Litigation Reform Act of 1995. These statements relate to our financial condition, results of operations, plans, objectives, future performance or business. Forward-looking statements are not statements of historical fact, are based on certain assumptions and are generally identified by use of the words "believes," "expects," "anticipates," "estimates," "forecasts," "intends," "plans," "targets," "potentially," "probably," "projects," "outlook" or similar expressions or future or conditional verbs such as "may," "will," "should," "would," and "could." Forward-looking statements include statements with respect to our beliefs, plans, objectives, goals, expectations, assumptions, and statements about future economic performance and projections of financial items. These forward-looking statements are subject to known and unknown risks, uncertainties and other factors that could cause actual results to differ materially from the results anticipated or implied by our forward-looking statements, including, but not limited to: the credit risks of lending activities, including changes in the level and trend of loan delinquencies and write offs and changes in our allowance for loan losses and provision for loan losses that may be impacted by deterioration in the housing and commercial real estate markets; changes in general economic conditions, either nationally or in our market areas; changes in the levels of general interest rates, and the relative differences between short and long term interest rates, deposit interest rates, our net interest margin and funding sources; fluctuations in the demand for loans, the number of unsold homes, land and other properties and fluctuations in real estate values in our market areas; decreases in the secondary market for the sale of loans that we originate; results of examinations of us by the Board of Governors of the Federal Reserve System ("Federal Reserve"), the North Carolina Office of the Commissioner of Banks ("NCCOB"), or other regulatory authorities, including the possibility that any such regulatory authority may, among other things, require us to increase our allowance for loan losses, write-down assets, change our regulatory capital position or affect our ability to borrow funds or maintain or increase deposits, which could adversely affect our liquidity and earnings; legislative or regulatory changes that adversely affect our business including the effect of Dodd-Frank Wall Street Reform and Consumer Protection Act (the "Dodd-Frank Act"), changes in regulatory policies and principles, or the interpretation of regulatory capital or other rules, including as a result of Basel III; our ability to attract and retain deposits; management's assumptions in determining the adequacy of the allowance for loan losses; our ability to control operating costs and expenses, especially costs associated with our operation as a public company; the use of estimates in determining fair value of certain assets, which estimates may prove to be incorrect and result in significant declines in valuation; difficulties in reducing risks associated with the loans on our balance sheet; staffing fluctuations in response to product demand or the implementation of corporate strategies that affect our workforce and potential associated charges; computer systems on which we depend could fail or experience a security breach; our ability to retain key members of our senior management team; costs and effects of litigation, including settlements and judgments; our ability to successfully integrate any assets, liabilities, customers, systems, and management personnel we may in the future acquire into our operations and our ability to realize related revenue synergies and cost savings within expected time frames and any goodwill charges related thereto; increased competitive pressures among financial services companies; changes in consumer spending, borrowing and savings habits; the availability of resources to address changes in laws, rules, or regulations or to respond to regulatory actions; adverse changes in the securities markets; inability of key third-party providers to perform their obligations to us; statements with respect to our intentions regarding disclosure and other changes resulting from the Jumpstart Our Business Startups Act of 2012 ("JOBS Act"); changes in accounting policies and practices, as may be adopted by the financial institution regulatory agencies, the Public Company Accounting Oversight Board or the Financial Accounting Standards Board; and other economic, competitive, governmental, regulatory, and technological factors affecting our operations, pricing, products and services; and the other risks detailed from time to time in our filings with the Securities and Exchange Commission ("SEC"), including this report on Form 10-K.
Any of the forward-looking statements are based upon management's beliefs and assumptions at the time they are made. We undertake no obligation to publicly update or revise any forward-looking statements included in this report or to update the reasons why actual results could differ from those contained in such statements, whether as a result of new information, future events or otherwise. In light of these risks, uncertainties and assumptions, the forward-looking statements discussed in this report might not occur and you should not put undue reliance on any forward-looking statements.
As used throughout this report, the terms "we", "our", "us", "HomeTrust Bancshares" or the "Company" refer to HomeTrust Bancshares, Inc. and its consolidated subsidiaries, including HomeTrust Bank ("HomeTrust" or "Bank") unless the context indicates otherwise.
3
PART I
Item 1. Business
General
HomeTrust Bancshares, Inc., a Maryland corporation, was formed for the purpose of becoming the holding company for HomeTrust Bank in connection with HomeTrust Bank's conversion from mutual to stock form, which was completed on July 10, 2012 (the "Conversion"). As a bank holding company and financial holding company, HomeTrust Bancshares, Inc. is regulated by the Federal Reserve. At June 30, 2017, the Company had consolidated total assets of $3.2 billion, total deposits of $2.0 billion and stockholders' equity of $397.7 million. The Company has not engaged in any significant activity other than holding the stock of the Bank. Accordingly, the information set forth in this Annual Report on Form 10-K ("Form 10-K"), including the audited consolidated financial statements and related data, relates primarily to the Bank and its subsidiary. As a North Carolina state-chartered bank, and member of the Federal Reserve System, the Bank's primary regulators are the NCCOB and the Federal Reserve. The Bank's deposits are federally insured up to applicable limits by the Federal Deposit Insurance Corporation ("FDIC"). The Bank is a member of the Federal Home Loan Bank of Atlanta ("FHLB" or "FHLB of Atlanta"), which is one of the 12 regional banks in the Federal Home Loan Bank System ("FHLB System"). Our headquarters is located in Asheville, North Carolina.
The Bank was originally formed in 1926. Between fiscal years 1996 and 2011, HomeTrust Bank's board of directors and executive management expanded the Bank beyond its historical Asheville market and created a unique partnership through mergers between six established banks and one de novo bank located in Tryon, Shelby, Eden, Lexington, Cherryville and Forest City, North Carolina, through which hometown community banks could combine their financial resources to achieve a shared vision.
Starting in 2013, we entered six attractive markets through various acquisitions and new office openings, as well as expanded our product lines. New locations and markets included:
• | BankGreenville Financial Corporation ("BankGreenville") - one office in Greenville, South Carolina (acquired in July 2013) |
• | Jefferson Bancshares, Inc. ("Jefferson") - nine offices across East Tennessee (acquired in May 2014) |
• | Commercial loan production office ("LPO") in Roanoke, Virginia (opened in July 2014) |
• | Bank of Commerce - one office in Charlotte, North Carolina (acquired in July 2014) |
• | Ten Bank of America Branch Offices - nine in southwest Virginia, one in Eden, North Carolina (acquired in November 2014) |
• | Commercial LPO in Raleigh, North Carolina (opened in November 2014) and later converted into full service branch (converted in April 2017) |
• | United Financial of North Carolina, Inc. ("United Financial") - municipal lease company headquartered in Fletcher, North Carolina (acquired in December 2016) |
• | TriSummit Bancorp, Inc. ("TriSummit") - six offices in East Tennessee (acquired in January 2017) |
• | Commercial LPO Greensboro, North Carolina (opened in August 2017) |
By expanding our geographic footprint and hiring local experienced talent, we have built a foundation that allows us to focus on organic growth, while maintaining the community-focused, relationship style of exceptional customer service that has differentiated our brand and characterized our success to date.
Our mission is to create stockholder value by building relationships with our employees, customers, and communities. By building a platform that supports growth and profitability, we are continuing our transition toward becoming a high-performing community bank and helping our customers every day to be "Ready For What's Next."
Our principal business consists of attracting deposits from the general public and investing those funds, along with borrowed funds, in loans secured by first and second mortgages on one-to-four family residences including home equity loans, construction and land/lot loans, commercial real estate loans, construction and development loans, commercial and industrial loans, indirect automobile, and municipal leases. Municipal leases are secured primarily by a ground lease for a firehouse or an equipment lease for fire trucks and firefighting equipment to fire departments located throughout North and South Carolina. We also purchase investment securities consisting primarily of securities issued by United States Government agencies and government-sponsored enterprises, as well as, commercial paper and certificates of deposit insured by the FDIC.
We offer a variety of deposit accounts for individuals, businesses, and nonprofit organizations. Deposits are our primary source of funds for our lending and investing activities.
Market Areas
HomeTrust Bank operates in nine metropolitan statistical areas ("MSAs"): Asheville, NC, with a population of 452,000 as of June 2016; Charlotte-Concord-Gastonia, NC-SC, with a population of 2.5 million as of June 2016; Greenville-Anderson-Mauldin, SC, with a population of 885,000
4
as of June 2016; Johnson City, TN, with a population of 202,000 as of June 2016; Kingsport-Bristol-Bristol, TN-VA, with a population of 306,000 as of June 2016; Knoxville, TN, with a population of 869,000 as of June 2016; Morristown, TN, with a population of 117,000 as of June 2016; Roanoke, VA, with a population of 314,000 as of June 2016; and Raleigh, NC, with a population of 1.3 million as of June 2016 according to the United State Census Bureau.
Asheville is known for its natural beauty, scenic surroundings, and its vibrant cultural and arts community that parallels that of many larger cities in the United States. It is home to a number of historical attractions, the most prominent of which is the Biltmore Estate, a historic mansion with gardens and a winery that draws approximately one million tourists each year. Due to its scenic location and diverse cultural and historical offerings, the Asheville metropolitan area is a popular destination for tourists, which continues to positively impact our local economy. In addition, affordable housing prices, compared to many bigger cities, combined with the region's favorable climate have also made the Asheville metropolitan area an increasingly attractive destination for retirees seeking to relocate from other parts of the United States. The area has several major employers which include: Buncombe County Public Schools, City of Asheville, Mission Health System and Hospital, The Biltmore Company, Ingles Markets, Inc., and the VA Medical Center. Also supporting the economy is the Asheville Regional Airport that transports over 827,000 passengers a year as well as numerous colleges and universities, medical centers, and arts and entertainment facilities. HomeTrust Bank is the only community bank headquartered in this vibrant and growing market.
The Charlotte-Concord-Gastonia, NC-SC metropolitan area is located in both North and South Carolina, within and surrounding the city of Charlotte. Located in the Piedmont region of the Southeastern United States, the Charlotte metropolitan area is well known for its lower cost of living, diversified economy, national sports team, and thriving arts community that has led it to be one of the highest in-migration cities in the country according to the Charlotte Chamber. The region is headquarters to several Fortune 500 and Fortune 1000 companies, including Bank of America, Duke Energy, Sealed Air, Nucor Steel, Sonic Automotive, and Lowe's Home Improvement Stores. The Charlotte MSA is the largest in the Carolinas.
The Greenville-Anderson-Mauldin, SC metropolitan area is located in upstate South Carolina, in the foothills of the Blue Ridge Mountains. Major employment sectors for the MSA include services, manufacturing, and retail trade including major facilities for BMW, Michelin, Walgreens, and Lockheed Martin. Additional employers include Greenville Health System, Greenville County School District, and Bon Secours St. Francis Health System.
The Johnson City, TN metropolitan area is an economic hub largely fueled by East Tennessee State University and the medical "Med-Tech" corridor, anchored by the Johnson City Medical Center, Franklin Woods Community Hospital and affiliated facilities. The city's museums and historical sites include the Hands On! Museum and the Tipton-Haynes State Historic Site, which hosts the annual Bluegrass and Sorghum Making Festival, as well as other seasonal events.
The Kingsport-Bristol-Bristol, TN-VA MSA is home to the headquarters of Eastman Chemical Company as well as a diverse mix of manufacturing firms, technology companies, and small businesses. The major economic components in Kingsport are healthcare, manufacturing and educational services.
The Knoxville, TN metropolitan area is located where the French Broad and Holston Rivers converge to form the Tennessee River. It is the largest city in East Tennessee and ranks third largest in the state. It is located in a broad valley between the Cumberland Mountains to the northwest and the Great Smoky Mountains to the southeast. The Knoxville area is frequently cited in national surveys, including U.S. News Best Places To Live as a quality place in which to live. The University of Tennessee calls Knoxville home, with over 27,000 students, making an array of educational and cultural opportunities available to area residents. Affordable housing, health care costs below the national average, a low crime rate, and a pleasant climate and location with nearby lakes and mountains are factors which make Knoxville an attractive place to settle. Major employment sectors in the Knoxville area include government, education, and healthcare.
The Morristown, TN metropolitan area includes facilities for numerous Fortune 500 companies including General Electric, International Paper, Alcoa (Howmet), Coca-Cola, Lear Corporation, Pepsi Bottling, NCR Corporation and Colgate-Palmolive. Morristown also includes the facilities of a number of international companies from countries such as Germany, Japan, Sweden, United Kingdom, Italy, Canada and France. Local industries include furniture manufacturing, poultry processing, aircraft parts, healthcare products, and automotive parts. Agriculture including soybeans, corn, livestock and dairy are also significant economic components. Morristown's major job providing segments are healthcare, manufacturing, educational services, furniture and related products, transportation equipment, educational services, and accommodation and food services.
The Roanoke, VA metropolitan area is located in the Roanoke Valley of western Virginia in the midst of the Blue Ridge and Alleghany Mountains. This 1,874-square mile region is bordered on the west by West Virginia and along the east by the Blue Ridge Mountains. The area is strategically accessible to both the East Coast and Mid-West markets with Interstate 81 passing through the region, Interstate 64 directly north, and Interstate 77 nearby to the south. The Roanoke MSA is the transportation hub of the area with an integrated interstate highway, rail, and air transportation network. Roanoke has the most diverse economy in Virginia according to Virginia Business and is the cultural and business hub for western Virginia. The Roanoke MSA is home to several large regional banking offices, headquarters of the Fortune 500 retailer Advance Auto, and to several large advanced manufacturing operations, such as those owned by General Electric, ITT Exelis, Dynax America, and Optical Cable Corporation, among others. The Roanoke, VA MSA's major employment sectors include government, health care and social assistance, retail trade, and manufacturing.
The Raleigh, NC metropolitan area is located in the northeast central region of North Carolina and routinely ranks among the nation's highest in places to do business and obtain an education. Raleigh is the capital of North Carolina, home to North Carolina State University and central
5
to one of the fastest growing areas in the country - the Research Triangle Park. With its proximity to the Research Triangle Park and several major universities, including the University of North Carolina at Chapel Hill and Duke University, Raleigh has become known for its strengths in technology and innovation.
Unemployment data remains one of our most informative indicators of our local economy. Based on information from the U.S. Bureau of Labor Statistics we have set forth below information regarding the unemployment rates nationally and in our market areas.
|
| As of June 30, | ||
Location |
| 2017 |
| 2016 |
U.S. National |
| 4.5% |
| 4.9% |
North Carolina |
| 4.2% |
| 4.7% |
Asheville MSA |
| 3.4% |
| 4.1% |
Charlotte/Concord/Gastonia |
| 4.0% |
| 5.0% |
Raleigh |
| 3.7% |
| 4.4% |
South Carolina |
| 4.0% |
| 5.2% |
Greenville |
| 3.9% |
| 5.2% |
Tennessee |
| 3.6% |
| 4.3% |
Morristown |
| 4.4% |
| 5.4% |
Johnson City |
| 4.7% |
| 5.6% |
Kingsport-Bristol |
| 4.6% |
| 5.4% |
Knoxville |
| 4.1% |
| 4.7% |
Virginia |
| 3.7% |
| 3.7% |
Roanoke |
| 4.0% |
| 3.9% |
The Bank has built a strong foundation in the communities we serve and takes pride in the role we play. The directors and market presidents of each region work with their management team and employees to support local nonprofit and community organizations. Each location helps provide critical services to meet the financial needs of its customers and improve the quality of life for individuals and businesses in its community. Initiatives supporting our communities include affordable housing, education and financial education, and the arts. We support these initiatives through both financial and people resources in all of our communities. Collectively, bank employees volunteer thousands of hours annually in their local communities; from helping to build homes to teaching grade school youth how to start healthy savings habits, bank employees are making a positive difference in the lives of others every day.
Competition
We face strong competition in originating real estate and other loans and in attracting deposits. Competition in originating real estate loans comes primarily from other savings institutions, commercial banks, credit unions, life insurance companies, and mortgage bankers. Other savings institutions, commercial banks, credit unions, and finance companies provide vigorous competition in consumer lending. In addition, in indirect auto financings, we also compete with specialty consumer finance companies, including automobile manufacturers' captive finance companies. Commercial and industrial loan competition is primarily from local commercial banks. We believe that we compete effectively because we consistently deliver high-quality, personal service to our customers that results in a high level of customer satisfaction. Adding to our competitive advantage is commitment to technological resources, which has expanded our customer service capabilities and increased efficiencies in our lending process.
6
We attract our deposits through our branch office system. Competition for deposits is principally from other commercial banks, savings institutions, and credit unions located in the same communities, as well as mutual funds and other alternative investments. We believe that we compete for deposits by offering superior service and a variety of deposit accounts at competitive rates. We also have a highly competitive suite of cash management services, online/mobile banking, and internal support expertise specific to the needs of small to mid-sized commercial business customers. Based on the most recent branch deposit data, HomeTrust Bank's deposit market share was:
Location |
| Rank (1) |
| Deposit Market Share (1) |
North Carolina |
| 16th |
| 0.35% |
Asheville MSA |
| 5th |
| 7.33% |
Charlotte/Gastonia |
| 19th |
| 0.05% |
South Carolina |
| 78th |
| 0.05% |
Greenville |
| 22nd |
| 0.04% |
Tennessee (2) |
| 40th |
| 0.39% |
Morristown (2) |
| 1st |
| 24.98% |
Johnson City (2) |
| 4th |
| 8.92% |
Kingsport-Bristol (2) |
| 6th |
| 6.79% |
Knoxville |
| 25th |
| 0.20% |
Virginia (2) |
| 63rd |
| 0.11% |
Roanoke |
| 7th |
| 6.64% |
Bristol (2) |
| 5th |
| 5.50% |
___________________________________________________________________
(1) Source: FDIC data as of June 30, 2016
(2) Adjusted for TriSummit Bank acquisition
Overall, we distinguish ourselves from larger, national banks operating in our market areas by providing local decision-making and competitive customer-driven products with excellent service, responsiveness, and execution. In addition, our larger capital base and product mix enable us to compete effectively against smaller banks. Our bankers believe that strong relationships lead to great things and strive everyday to ensure our customers are "ready for what's next" in their financial future.
In addition, the way we create differentiation from our competition to fuel organic growth is by focusing on "HOW" we deliver our products and services. Many of our employees have been a part of HomeTrust Bank for decades, while a significant number of employees have more recently brought their industry knowledge and expertise to us through internal growth and acquisitions, reflecting their desire to be a part of a high performing team that works well together to make a difference for customers. We strive to create organizational clarity by adhering to our core values of caring and teamwork while continuing to reach for our aspirational values of customer satisfaction, accountability, continuous improvement, and humility. This "culture model" includes four key principles:
• | making a difference for customers every day is both fun and personally rewarding; |
• | success is built on relationships; |
• | we must continually add value to relationships with our customers and with each other; and |
• | we need to grow ourselves and our ability to make a difference and add value to relationships. |
In implementing these principles, the directors, management team, and employees work together as a team to meet the financial needs of our customers while supporting local nonprofit and community organizations to improve the quality of life for individuals and businesses in our communities. We support affordable housing and education initiatives to help build healthy communities through both financial assistance and employees volunteering thousands of hours annually in their local markets. We believe the opportunity to stay close to our customers gives us a unique position in the banking industry as compared to our larger competitors and we are committed to continuing to build strong relationships with our employees, customers, and communities for generations to come.
7
Lending Activities
The following table presents information concerning the composition of our loan portfolio in dollar amounts and in percentages (before deductions for deferred fees and allowances for losses) at the dates indicated.
| At June 30, | |||||||||||||||||||||||||||||||||
| 2017 |
| 2016 |
| 2015 |
| 2014 |
| 2013 | |||||||||||||||||||||||||
| Amount |
| Percent |
| Amount |
| Percent |
| Amount |
| Percent |
| Amount |
| Percent |
| Amount |
| Percent | |||||||||||||||
| (Dollars in thousands) | |||||||||||||||||||||||||||||||||
Retail consumer loans: |
|
|
|
|
|
|
|
|
|
|
|
|
|
|
|
|
|
|
| |||||||||||||||
One-to-four family | $ | 684,089 | |
| 29.08 | % |
| $ | 623,701 | |
| 34.04 | % |
| $ | 650,750 | |
| 38.61 | % |
| $ | 660,630 | |
| 44.09 | % |
| $ | 602,980 | |
| 51.69 | % |
Home equity - originated | 157,068 | |
| 6.68 | |
| 163,293 | |
| 8.91 | |
| 161,204 | |
| 9.56 | |
| 148,379 | |
| 9.90 | |
| 125,676 | |
| 10.77 | | |||||
Home equity - purchased | 162,407 | |
| 6.90 | |
| 144,377 | |
| 7.88 | |
| 72,010 | |
| 4.27 | |
| - | |
| - | |
| - | |
| - | | |||||
Construction and land/lots | 50,136 | |
| 2.13 | |
| 38,102 | |
| 2.08 | |
| 45,931 | |
| 2.73 | |
| 59,249 | |
| 3.95 | |
| 51,546 | |
| 4.42 | | |||||
Indirect auto finance | 140,879 | |
| 5.99 | |
| 108,478 | |
| 5.92 | |
| 52,494 | |
| 3.11 | |
| 8,833 | |
| 0.59 | |
| - | |
| - | | |||||
Consumer | 7,900 | |
| 0.34 | |
| 4,635 | |
| 0.25 | |
| 3,708 | |
| 0.22 | |
| 6,331 | |
| 0.42 | |
| 3,349 | |
| 0.29 | | |||||
Total retail consumer loans | 1,202,479 | |
| 51.12 | % |
| 1,082,586 | |
| 59.08 | % |
| 986,097 | |
| 58.50 | % |
| 883,422 | |
| 58.95 | % |
| 783,551 | |
| 67.17 | % | |||||
Commercial loans: |
| |
|
| |
|
| |
|
| |
|
| |
|
| |
|
| |
|
| |
|
| |
|
| | |||||
Commercial real estate | 730,408 | |
| 31.04 | % |
| 486,561 | |
| 26.55 | % |
| 441,620 | |
| 26.20 | % |
| 377,769 | |
| 25.21 | % |
| 231,086 | |
| 19.81 | % | |||||
Construction and development | 197,966 | |
| 8.42 | |
| 86,840 | |
| 4.74 | |
| 64,573 | |
| 3.83 | |
| 56,457 | |
| 3.78 | |
| 23,994 | |
| 2.06 | | |||||
Commercial and industrial | 120,387 | |
| 5.12 | |
| 73,289 | |
| 4.00 | |
| 84,820 | |
| 5.03 | |
| 74,435 | |
| 4.97 | |
| 11,452 | |
| 0.98 | | |||||
Municipal leases | 101,175 | |
| 4.30 | |
| 103,183 | |
| 5.63 | |
| 108,574 | |
| 6.44 | |
| 106,215 | |
| 7.09 | |
| 116,377 | |
| 9.98 | | |||||
Total commercial loans | 1,149,936 | |
| 48.88 | % |
| 749,873 | |
| 40.92 | % |
| 699,587 | |
| 41.50 | % |
| 614,876 | |
| 41.05 | % |
| 382,909 | |
| 32.83 | % | |||||
Total loans | 2,352,415 | |
| 100.00 | % |
| 1,832,459 | |
| 100.00 | % |
| 1,685,684 | |
| 100.00 | % |
| 1,498,298 | |
| 100.00 | % |
| 1,166,460 | |
| 100.00 | % | |||||
Less : |
| |
|
| |
|
| |
|
| |
|
| |
|
| |
|
| |
|
| |
|
| |
|
| | |||||
Deferred costs (fees), net | (945 | ) |
|
| |
| 372 | |
|
| |
| 23 | |
|
| |
| (1,340 | ) |
|
| |
| (2,277 | ) |
|
| | |||||
Allowance for losses | (21,151 | ) |
|
| |
| (21,292 | ) |
|
| |
| (22,374 | ) |
|
| |
| (23,429 | ) |
|
| |
| (32,073 | ) |
|
| | |||||
Total loans receivable, net | $ | 2,330,319 | |
|
| |
| $ | 1,811,539 | |
|
| |
| $ | 1,663,333 | |
|
| |
| $ | 1,473,529 | |
|
| |
| $ | 1,132,110 | |
|
| |
8
The following table shows the composition of our loan portfolio in dollar amounts and in percentages (before deductions for deferred fees and allowances for loan losses) at the dates indicated.
| At June 30, | |||||||||||||||||||
| 2017 |
| 2016 |
| 2015 | |||||||||||||||
| Amount |
| Percent |
| Amount |
| Percent |
| Amount |
| Percent | |||||||||
Fixed-rate loans: | (Dollars in thousands) | |||||||||||||||||||
Retail consumer loans: |
|
|
|
|
|
|
|
|
|
|
| |||||||||
One-to-four family | $ | 365,566 | |
| 15.5 | % |
| $ | 326,347 | |
| 17.8 | % |
| $ | 351,904 | |
| 20.9 | % |
Home equity - originated | 1,664 | |
| 0.1 | |
| 416 | |
| - | |
| - | |
| - | | |||
Construction and land/lots | 42,149 | |
| 1.8 | |
| 27,907 | |
| 1.5 | |
| 32,685 | |
| 1.9 | | |||
Indirect auto finance | 140,879 | |
| 6.0 | |
| 108,478 | |
| 5.9 | |
| 52,494 | |
| 3.1 | | |||
Consumer | 7,887 | |
| 0.3 | |
| 4,620 | |
| 0.3 | |
| 3,658 | |
| 0.2 | | |||
Commercial loans: |
| |
|
| |
|
| |
|
| |
|
| |
|
| | |||
Commercial real estate | 444,055 | |
| 18.9 | |
| 303,854 | |
| 16.6 | |
| 319,593 | |
| 19.0 | | |||
Construction and development | 50,231 | |
| 2.1 | |
| 29,204 | |
| 1.6 | |
| 36,962 | |
| 2.2 | | |||
Commercial and industrial | 73,600 | |
| 3.1 | |
| 42,874 | |
| 2.3 | |
| 46,126 | |
| 2.7 | | |||
Municipal leases | 101,175 | |
| 4.3 | |
| 103,183 | |
| 5.7 | |
| 108,574 | |
| 6.5 | | |||
Total fixed-rate loans | 1,227,206 | |
| 52.2 | % |
| 946,883 | |
| 51.7 | % |
| 951,996 | |
| 56.5 | % | |||
Adjustable-rate loans : |
| |
|
| |
|
| |
|
| |
|
| |
|
| | |||
Retail consumer loans: |
| |
|
| |
|
| |
|
| |
|
| |
|
| | |||
One-to-four family | 318,523 | |
| 13.5 | % |
| 297,354 | |
| 16.2 | % |
| 298,846 | |
| 17.7 | % | |||
Home equity - originated | 155,404 | |
| 6.6 | |
| 162,877 | |
| 8.9 | |
| 161,204 | |
| 9.6 | | |||
Home equity - purchased | 162,407 | |
| 6.9 | |
| 144,377 | |
| 7.9 | |
| 72,010 | |
| 4.3 | | |||
Construction and land/lots | 7,987 | |
| 0.3 | |
| 10,195 | |
| 0.6 | |
| 13,246 | |
| 0.8 | | |||
Consumer | 13 | |
| - | |
| 15 | |
| - | |
| 50 | |
| - | | |||
Commercial loans: |
| |
|
| |
|
| |
|
| |
|
| |
|
| | |||
Commercial real estate | 286,353 | |
| 12.2 | |
| 182,707 | |
| 10.0 | |
| 122,027 | |
| 7.2 | | |||
Construction and development | 147,735 | |
| 6.3 | |
| 57,636 | |
| 3.1 | |
| 27,611 | |
| 1.6 | | |||
Commercial and industrial | 46,787 | |
| 2.0 | |
| 30,415 | |
| 1.7 | |
| 38,694 | |
| 2.3 | | |||
Total adjustable-rate loans | 1,125,209 | |
| 47.8 | % |
| 885,576 | |
| 48.3 | % |
| 733,688 | |
| 43.5 | % | |||
Total loans | 2,352,415 | |
| 100.0 | % |
| 1,832,459 | |
| 100.0 | % |
| 1,685,684 | |
| 100.0 | % | |||
Less : |
| |
|
| |
|
| |
|
| |
|
| |
|
| | |||
Deferred costs (fees), net | (945 | ) |
|
| |
| 372 | |
|
| |
| 23 | |
|
| | |||
Allowance for losses | (21,151 | ) |
|
| |
| (21,292 | ) |
|
| |
| (22,374 | ) |
|
| | |||
Total loans receivable, net | $ | 2,330,319 | |
|
| |
| $ | 1,811,539 | |
|
| |
| $ | 1,663,333 | |
|
| |
The increase in loans since 2015 was primarily due to the $258.1 million in loans acquired from TriSummit and organic loan growth, especially the origination of indirect auto finance loans, commercial real estate, and construction and development loans as well as the purchase of home equity loans. Going forward, we plan to place more emphasis on certain lending products in order to increase commercial real estate, construction and development and commercial and industrial loans as a percentage of the total loan portfolio. For further discussion, see "Management's Discussion and Analysis of Financial Condition and Results of Operations" in Part II, Item 7 of this report.
9
Loan Maturity . The following table sets forth certain information at June 30, 2017 regarding the dollar amount of loans maturing in our portfolio based on their contractual terms to maturity, but does not include scheduled payments or potential prepayments. Loan balances do not include undisbursed loan proceeds, unearned discounts, unearned income and allowance for loan losses.
| Retail Consumer | ||||||||||||||||||||||||
| Due During Years Ending June 30, | ||||||||||||||||||||||||
| 2018 |
| 2019 |
| 2020 |
| 2021 to 2022 |
| 2023 to 2026 |
| 2027 to 2031 |
| 2032 and following |
| Total | ||||||||||
| (Dollars in thousands) |
|
| ||||||||||||||||||||||
One-to-four family |
|
|
|
|
|
|
|
|
|
|
|
|
|
|
| ||||||||||
Amount | $ | 14,427 | |
| 12,989 | |
| 12,215 | |
| 50,429 | |
| 53,000 | |
| 163,816 | |
| 377,213 | |
| $ | 684,089 | |
Weighted Average Rate | 4.97 | % |
| 4.73 | % |
| 4.63 | % |
| 4.23 | % |
| 4.43 | % |
| 3.66 | % |
| 4.08 | % |
| 4.06 | % | ||
Home equity - originated |
|
|
|
|
|
|
|
|
|
|
|
|
|
|
| ||||||||||
Amount | $ | 4,435 | |
| 6,190 | |
| 5,716 | |
| 15,807 | |
| 39,424 | |
| 20,618 | |
| 64,878 | |
| $ | 157,068 | |
Weighted Average Rate | 4.59 | % |
| 4.54 | % |
| 5.06 | % |
| 4.92 | % |
| 4.31 | % |
| 4.64 | % |
| 4.59 | % |
| 4.57 | % | ||
Home equity - purchased |
|
|
|
|
|
|
|
|
|
|
|
|
|
|
| ||||||||||
Amount | $ | - | |
| - | |
| - | |
| - | |
| - | |
| - | |
| 162,407 | |
| $ | 162,407 | |
Weighted Average Rate | - | % |
| - | % |
| - | % |
| - | % |
| - | % |
| - | % |
| 4.00 | % |
| 4.00 | % | ||
Construction and land/lots |
|
|
|
|
|
|
|
|
|
|
|
|
|
| | | |||||||||
Amount | $ | 214 | |
| 633 | |
| 179 | |
| 1,346 | |
| 4,126 | |
| 6,847 | |
| 36,791 | |
| $ | 50,136 | |
Weighted Average Rate | 6.22 | % |
| 6.31 | % |
| 6.13 | % |
| 5.05 | % |
| 5.99 | % |
| 5.58 | % |
| 3.60 | % |
| 4.16 | % | ||
Indirect auto finance |
|
|
|
|
|
|
|
|
|
|
|
|
|
|
| ||||||||||
Amount | $ | 118 | |
| 906 | |
| 4,832 | |
| 64,263 | |
| 70,760 | |
| - | |
| - | |
| $ | 140,879 | |
Weighted Average Rate | 3.25 | % |
| 3.67 | % |
| 3.76 | % |
| 3.06 | % |
| 3.32 | % |
| - | % |
| - | % |
| 3.22 | % | ||
Consumer |
|
|
|
|
|
|
|
|
|
|
|
|
|
|
| ||||||||||
Amount | $ | 277 | |
| 368 | |
| 522 | |
| 2,246 | |
| 789 | |
| 1,594 | |
| 2,104 | |
| $ | 7,900 | |
Weighted Average Rate | 6.50 | % |
| 5.45 | % |
| 4.62 | % |
| 4.36 | % |
| 4.26 | % |
| 4.49 | % |
| 7.89 | % |
| 5.43 | % | ||
| Commercial Loans | |||||||||||||||||||||||
| Due During Years Ending June 30, | |||||||||||||||||||||||
| 2018 |
| 2019 |
| 2020 |
| 2021 to 2022 |
| 2023 to 2026 |
| 2027 to 2031 |
| 2032 and following |
| Total | |||||||||
| (Dollars in thousands) |
|
| |||||||||||||||||||||
Commercial real estate |
|
|
|
|
|
|
|
|
|
|
|
|
|
|
| |||||||||
Amount | 45,271 | |
| 60,758 | |
| 81,880 | |
| 269,056 | |
| 182,948 | |
| 57,444 | |
| 33,051 | |
| $ | 730,408 | |
Weighted Average Rate | 4.69 | % |
| 4.33 | % |
| 3.99 | % |
| 3.94 | % |
| 3.68 | % |
| 4.09 | % |
| 4.22 | % |
| 3.99 | % | |
Construction and development |
|
|
|
|
|
|
|
|
|
|
|
|
|
|
| |||||||||
Amount | 60,180 | |
| 27,842 | |
| 15,277 | |
| 53,165 | |
| 30,634 | |
| 8,853 | |
| 2,015 | |
| $ | 197,966 | |
Weighted Average Rate | 4.65 | % |
| 4.37 | % |
| 4.27 | % |
| 3.98 | % |
| 3.62 | % |
| 4.03 | % |
| 3.56 | % |
| 4.20 | % | |
Commercial and industrial |
|
|
|
|
|
|
|
|
|
|
|
|
|
|
| |||||||||
Amount | 24,384 | |
| 11,904 | |
| 8,747 | |
| 44,080 | |
| 26,028 | |
| 2,735 | |
| 2,509 | |
| $ | 120,387 | |
Weighted Average Rate | 4.64 | % |
| 4.14 | % |
| 4.39 | % |
| 4.07 | % |
| 4.18 | % |
| 3.36 | % |
| 4.60 | % |
| 4.23 | % | |
Municipal leases (1) |
|
|
|
|
|
|
|
|
|
|
|
|
|
|
| |||||||||
Amount | 479 | |
| 1,901 | |
| 1,978 | |
| 6,377 | |
| 16,766 | |
| 39,047 | |
| 34,627 | |
| $ | 101,175 | |
Weighted Average Rate | 6.74 | % |
| 4.60 | % |
| 4.60 | % |
| 4.41 | % |
| 5.76 | % |
| 5.57 | % |
| 5.59 | % |
| 5.50 | % | |
10
| Total | |||||
| Amount |
| Weighted Average Rate | |||
| (Dollars in thousands) | |||||
Due During Years Ending June 30, |
|
|
| |||
2018 | $ | 149,785 | |
| 4.70 | % |
2019 | 123,491 | |
| 4.38 | | |
2020 | 131,346 | |
| 4.16 | | |
2021 to 2022 | 506,769 | |
| 3.92 | | |
2023 to 2026 | 424,475 | |
| 3.90 | | |
2027 to 2031 | 300,954 | |
| 4.12 | | |
2032 and following | 715,595 | |
| 4.18 | | |
Total | $ | 2,352,415 | |
| 4.11 | % |
_________________________________________________________
(1) | The weighted average rate of municipal loans is adjusted for a 34% federal income tax rate since the interest income from these leases is tax exempt. |
The total amount of loans due after June 30, 2018, which have predetermined interest rates is $1.03 billion, while the total amount of loans which have adjustable interest rates is $1.17 billion.
Lending Authority . Loan credit authority is granted to various officers of the Bank and approved at least annually by the Credit Risk Committee, which is made up of the Chief Banking Officer, Chief Credit Officer, and Chief Risk Officer. Generally, total credit exposure that exceeds the loan credit authority of each officer must be approved by the Senior Credit Officer or Chief Credit Officer. Loan relationships in excess of $7.5 million in total credit exposure must be approved by our Senior Loan Committee comprised of the Chief Banking Officer, Chief Credit Officer, two Senior Credit Officers, and two Commercial Relationship Managers. Loans in excess of $15.0 million in total credit exposure must be approved by the Executive Loan Committee comprised of the Chief Executive Officer, Chief Banking Officer, Chief Credit Officer and a Market President. Total credit exposure exceeding 60% of the Bank's legal lending limit must be approval by the Bank's board of directors.
Beginning in fiscal 2008, we implemented more stringent underwriting policies and procedures related to residential lending which we have maintained and continuously update to ensure originations meet both our investment and asset quality objectives. The additional emphasis on a borrower's ongoing ability to repay a loan by requiring lower debt to income ratios, higher credit scores, and lower loan to value ratios has increased our overall asset quality.
At June 30, 2017 , the maximum amount under federal regulation that we could lend to any one borrower and the borrower's related entities was approximately $49.0 million. Our five largest lending relationships are with commercial borrowers and totaled approximately $95.9 million in the aggregate, or 4.1% of our $2.4 billion loan portfolio at June 30, 2017. The largest lending relationship at June 30, 2017 consisted of three loans totaling approximately $24.6 million to a borrower in Charlotte, NC. The largest loan in this relationship had an outstanding balance of $11.6 million as of June 30, 2017 and was secured by a non-owner-occupied medical office property located in southeast Louisiana. The remaining relationship exposure consisted of two loans secured by non-owner-occupied medical office properties located in North Carolina and Georgia. At June 30, 2017, these loans were performing in accordance with their original repayment terms.
The second largest lending relationship at June 30, 2017 was approximately $20.0 million consisting of 18 loans. The largest loan in this relationship at June 30, 2017 had an outstanding balance of $5.5 million and was secured by a multi-family property located in Sullivan County, Tennessee. The remaining relationship exposure primarily consisted of various owner-occupied and non-owner-occupied retail, office, and industrial properties located in East Tennessee. At June 30, 2017 these loans were performing in accordance with their original repayment terms.
The third largest lending relationship at June 30, 2017 was approximately $19.7 million consisting of two loans, the largest of which had an outstanding balance of $13.5 million and was secured by business assets. The second loan was secured by an owner-occupied industrial property located in Buncombe County, North Carolina. At June 30, 2017, all loans in the relationship were performing in accordance with their original repayment terms.
The fourth largest lending relationship at June 30, 2017 was approximately $16.2 million consisting of seven loans, the largest of which had an outstanding balance of $4.8 million and was secured by a non-owner-occupied retail property in Union County, NC. The remaining relationship exposure was secured by various single tenant and multi-tenant retail properties located throughout five North Carolina counties. At June 30, 2017, all loans in the relationship were performing in accordance with their original repayment terms.
The fifth largest lending relationship at June 30, 2017 was approximately $15.4 million consisting of two loans, the largest of which had an outstanding balance of $14.3 million and was secured by the land and improvements of an assisted living property under construction in Greenville County, South Carolina. The remaining loan is secured by accounts receivable. As of June 30, 2017 these loans were performing in accordance with their original repayment terms.
11
Retail Consumer Loans
One-to-Four Family Real Estate Lending. We originate loans secured by first mortgages on one-to-four family residences typically for the purchase or refinance of owner-occupied primary or secondary residences located primarily in our market areas. We originate one-to-four family residential mortgage loans primarily through referrals from real estate agents, builders, and from existing customers. Walk-in customers are also important sources of loan originations. At June 30, 2017 , $684.1 million , or 29.1% , of our loan portfolio consisted of loans secured by one-to-four family residences.
We originate both fixed-rate loans and adjustable-rate loans. We generally originate mortgage loans in amounts up to 80% of the lesser of the appraised value or purchase price of a mortgaged property, but will also permit loan-to-value ratios of up to 95%. For loans exceeding an 80% loan-to-value ratio we generally require the borrower to obtain private mortgage insurance covering us for any loss on the amount of the loan in excess of 80% in the event of foreclosure.
The majority of our one-to-four family residential loans are originated with fixed rates and have terms of ten to 30 years. At June 30, 2017 our one-to-four family residential loan portfolio included $365.6 million in fixed rate loans, of which $36.4 million were ten year fixed rate loans. We generally originate fixed rate mortgage loans with terms greater than 15 years for sale to various secondary market investors on a servicing released basis. We also originate adjustable-rate mortgage, or ARM, loans which have interest rates that adjust annually to the yield on U.S. Treasury securities adjusted to a constant one-year maturity plus a margin. Most of our ARM loans are hybrid loans, which after an initial fixed rate period of one, five, seven, or ten years will convert to an annual adjustable interest rate for the remaining term of the loan. Our ARM loans have terms up to 30 years. Our pricing strategy for mortgage loans includes setting interest rates that are competitive with other local financial institutions and consistent with our asset/liability management objectives. Our ARM loans generally have a floor interest rate set at the initial interest rate, and a cap of two percentage points on rate adjustments during any one year and six percentage points over the life of the loan. As a consequence of using caps, the interest rates on these loans may not be as rate sensitive as is our cost of funds.
We generally retain ARM loans that we originate in our loan portfolio rather than selling them in the secondary market. The retention of ARM loans in our loan portfolio helps us reduce our exposure to changes in interest rates. There are, however, unquantifiable credit risks resulting from the potential of increased interest to be paid by the customer as a result of increases in interest rates. It is possible that during periods of rising interest rates the risk of default on ARM loans may increase as a result of repricing and the increased costs to the borrower. We attempt to reduce the potential for delinquencies and defaults on ARM loans by qualifying the borrower based on the borrower's ability to repay the ARM loan assuming that the maximum interest rate that could be charged at the first adjustment period remains constant during the loan term. Another consideration is that although ARM loans allow us to increase the sensitivity of our asset base due to changes in the interest rates, the extent of this interest sensitivity is limited by the periodic and lifetime interest rate adjustment limits. Because of these considerations, we have no assurance that yield increases on ARM loans will be sufficient to offset increases in our cost of funds.
Most of our loans are written using generally accepted underwriting guidelines, and are readily saleable to Freddie Mac, Fannie Mae, or other private investors. Our real estate loans generally contain a "due on sale" clause allowing us to declare the unpaid principal balance due and payable upon the sale of the security property. The average size of our one-to-four family residential loans was $114,504 at June 30, 2017 .
A majority of our loans are "non-conforming" because they are adjustable rate mortgages which contain interest rate floors or do not satisfy credit or other requirements due to personal and financial reasons (i.e. divorce, bankruptcy, length of time employed, etc.), conforming loan limits (i.e. jumbo mortgages), and other requirements, imposed by secondary market purchasers. Some of these borrowers have higher debt-to-income ratios, or the loans are secured by unique properties in rural markets for which there are no sales of comparable properties to support the value according to secondary market requirements. We may require additional collateral or lower loan-to-value ratios to reduce the risk of these loans. We believe that these loans satisfy a need in our local market areas. As a result, subject to market conditions, we intend to continue to originate these types of loans . Total non-conforming loans were $352.4 million at June 30, 2017.
Property appraisals on real estate securing our one-to-four family loans in excess of $250,000 that are not originated for sale are made by a state-licensed or state-certified independent appraiser approved by the board of directors. Appraisals are performed in accordance with applicable regulations and policies. For loans that are less than $250,000, we may use the tax assessed value, broker price opinions, and/or a property inspection in lieu of an appraisal. We generally require title insurance policies on all first mortgage real estate loans originated. Homeowners, liability, fire and, if required, flood insurance policies are also required for one-to-four family loans. We do not originate permanent one-to-four family mortgage loans with a negatively amortizing payment schedule, and currently do not offer interest-only mortgage loans. We have not typically originated stated income or low or no documentation one-to-four family loans. At June 30, 2017 , $11.2 million of our one-to-four family loans were interest-only of which $9.3 million served as collateral for commercial purpose loans. In connection with the new rules issued by the Consumer Financial Protection Bureau ("CFPB"), which includes a definition for "qualified mortgage" loans based on the borrower's ability to repay the loan, we believe that substantially all of the mortgage loans approved by us meet this standard.
At June 30, 2017 , $93.0 million of our one-to-four family loan portfolio consisted of loans secured by non-owner occupied residential properties. Loans secured by residential rental properties represent a unique credit risk to us and, as a result, we adhere to specific underwriting guidelines for such loans. Additionally, we have established specific loan portfolio concentration limits for loans secured by residential rental property to prevent excessive credit risk that could result from an elevated concentration of these loans. A primary risk factor in non-owner occupied residential real estate lending is the consistency of rental income of the property. Payments on loans secured by rental properties often depend on the successful operation and management of the properties, as well as, the ability of tenants to pay rent. As a result, repayment of such loans may be subject to adverse economic conditions and unemployment trends, and may be sensitive to changes in the supply and demand for such properties. We consider and review a rental income cash flow analysis of the borrower and consider the net operating income of the property,
12
the borrower's expertise, credit history and profitability, and the value of the underlying property. We generally require collateral on these loans to be a first mortgage along with an assignment of rents and leases. We periodically monitor the performance and cash flow sufficiency of certain residential rental property borrowers based on a number of factors such as loan performance, loan size, total borrower credit exposure, and risk grade.
Home Equity Lines of Credit. Our originated home equity lines of credit ("HELOCs"), consisting primarily of adjustable-rate lines of credit, have been one of the largest component of our retail loan portfolio over the past several years. At June 30, 2017 , HELOCs-originated totaled $157.1 million or 6.7% of our loan portfolio of which $77.2 million was secured by a first lien on owner-occupied residential property. The lines of credit may be originated in amounts, together with the amount of the existing first mortgage, typically up to 85% of the value of the property securing the loan (less any prior mortgage loans) with an adjustable-rate of interest based on The Wall Street Journal prime rate plus a margin. Currently, our home equity line of credit floor interest rate is dependent on the overall loan to value, and has a cap of 18% above the floor rate over the life of the loan. Originated HELOCs generally have up to a 15-year draw period and amounts may be reborrowed after payment at any time during the draw period. Once the draw period has lapsed, the payment is amortized over a 15-year period based on the loan balance at that time. At June 30, 2017 , unfunded commitments on these lines of credit totaled $182.0 million.
Our underwriting standards for originated HELOCs are similar to our one-to-four family loan underwriting standards and include a determination of the applicant's credit history and an assessment of the applicant's ability to meet existing obligations and payments on the proposed loan. The stability of the applicant's monthly income may be determined by verification of gross monthly income from primary employment, and additionally from any verifiable secondary income.
In December 2014, the Company began purchasing HELOCs originated by other financial institutions. At June 30, 2017, HELOCs-purchased totaled $162.4 million , or 6.9% of our loan portfolio. Unfunded commitments on these lines of credit were $28.2 million at June 30, 2017. The credit risk characteristics are different for these loans since they were not originated by the Company and the collateral is located outside the Company's market area, primarily in several western states. All of these loans were originated in 2012 or later and had an average FICO score of 740 and loan to values of less than 90% at origination. Losses in this portfolio since December 2014 have been less than $50,000. The Company will continue to monitor the performance of these loans and adjust the allowance for loan losses as necessary.
HELOCs generally entail greater risk than do one-to-four family residential mortgage loans where we are in the first lien position. For those home equity lines secured by a second mortgage, it is unlikely that we will be successful in recovering all or a portion of our loan proceeds in the event of default unless we are prepared to repay the first mortgage loan and such repayment and the costs associated with a foreclosure are justified by the value of the property.
Construction and Land/Lots. We have been an active originator of construction to permanent loans to homeowners building a residence. In addition, we originate land/lot loans predominately for the purchase or refinance of an improved lot for the construction of a residence to be occupied by the borrower. All of our construction and land/lot loans were made on properties located within our market area.
At June 30, 2017 , our construction and land/lot loan portfolio was $ 50.1 million compared to $ 38.1 million at June 30, 2016 . At June 30, 2017 , unfunded loan commitments totaled $42.4 million, compared to $27.9 million at June 30, 2016 . Construction-to-permanent loans are made for the construction of a one-to-four family property which is intended to be occupied by the borrower as either a primary or secondary residence. Construction-to-permanent loans are originated to the homeowner rather than the homebuilder and are structured to be converted to a first lien fixed- or adjustable-rate permanent loan at the completion of the construction phase. We do not originate construction phase only or junior lien construction-to-permanent loans. The permanent loan is generally underwritten to the same standards as our one-to-four family residential loans and may be held by us for portfolio investment or sold in the secondary market. At June 30, 2017 our construction-to-permanent loans totaled $34.9 million and the average loan size was $170,000. During the construction phase, which typically lasts for six to 12 months, we make periodic inspections of the construction site and loan proceeds are disbursed directly to the contractors or borrowers as construction progresses. Typically, disbursements are made in monthly draws during the construction period. Loan proceeds are disbursed based on a percentage of completion. Construction-to-permanent loans require payment of interest only during the construction phase. Prior to making a commitment to fund a construction loan, we require an appraisal of the property by an independent appraiser. Construction loans may be originated up to 95% of the cost or of the appraised value upon completion, whichever is less; however, we generally do not originate construction loans which exceed the lower of 80% loan to cost or appraised value without securing adequate private mortgage insurance or other form of credit enhancement such as the Federal Housing Administration or other governmental guarantee. We also require general liability, builder's risk hazard insurance, title insurance, and flood insurance (as applicable, for properties located or to be built in a designated flood hazard area) on all construction loans. At June 30, 2017 , the largest construction to permanent loan had an outstanding balance of $2.4 million and was performing according to the original repayment terms.
Included in our construction and land/lot loan portfolio are land/lot loans, which are typically loans secured by developed lots in residential subdivisions located in our market areas. We originate these loans to individuals intending to construct their primary or secondary residence on the lot within one year from the date of origination. This portfolio may also include loans for the purchase or refinance of unimproved land that is generally less than or equal to five acres, and for which the purpose is to commence the improvement of the land and construction of an owner-occupied primary or secondary residence within one year from the date of loan origination.
Land/lot loans are typically originated in an amount up to 70% of the lower of the purchase price or appraisal, are secured by a first lien on the property, for up to a 20-year term, require payments of interest only and are structured with an adjustable rate of interest on terms similar to our one-to-four family residential mortgage loans. At June 30, 2017 , our land/lot loans totaled $15.2 million and the average land/lot loan size was
13
$52,000. At June 30, 2017 , the largest land/lot loan had an outstanding balance of $522,000 and was performing according to the original repayment terms.
Construction and land/lot lending affords us the opportunity to achieve higher interest rates and fees with shorter terms to maturity than the rates and fees generated by our one-to-four family permanent mortgage lending. Construction/permanent loans, however, generally involve a higher degree of risk than our one-to-four family permanent mortgage lending. If our appraisal of the value of the completed residence proves to be overstated, we may have inadequate security for the repayment of the loan upon completion of construction and may incur a loss. Land/lot loans also pose additional risk because of the lack of income being produced by the property and the potential illiquid nature of the collateral. These risks can also be significantly impacted by supply and demand conditions.
Indirect Auto Finance. During the middle of fiscal year 2014, we added the origination of indirect auto finance loans to our lending products. As of June 30, 2017 , our indirect auto finance installment contracts totaled $140.9 million , or 6.0% of our total loan portfolio. Going forward, the Company expects to maintain the current size of this portfolio as a percentage of the total loan portfolio. As an indirect lender, we market to automobile dealerships, both manufacturer franchised dealerships and independent dealerships, who utilize our origination platform to provide automotive financing through installment contracts on new and used vehicles. As of June 30, 2017, we worked with 60 auto dealerships located in western North Carolina and upstate South Carolina. Working with strong dealerships within our market area provides us with the opportunity to actively deepen customer relationships through cross-selling opportunities, as 85.0% of our indirect auto finance loans are originated to noncustomers.
The dealers are compensated via an industry standard commission, known as dealer reserve, on marked-up interest rates or from flat rate commission amounts. Our auto finance sales team uses purchased industry data to provide quantitative analysis of dealer sales history to target strong dealerships as the starting point of building long lasting, successful relationships. Local, quick decisions, broad hour coverage, personalized customer service, and prompt contract funding are keys to our success in this competitive line of business. Additionally, our process has been designed to integrate with existing dealership practices, utilize an industry leading decision engine, which provides our internal underwriters with the tools needed to respond quickly to loans meeting our credit policy criteria.
Our underwriting guidelines for indirect auto loans adhere to no specific loan-to-value ratio because the primary focus is on the ability of the borrower to repay the loan rather than the value of the underlying collateral. Our underwriting procedures for indirect auto loans include an evaluation of an applicant's credit profile along with certain applicant specific characteristics to arrive at an estimate of the associated credit risk. Additionally, internal underwriters may also verify an applicant's employment income and/or residency or where appropriate, verify an applicant's payment history directly with the applicant's creditors. We will also generally verify receipt of the automobile and other information directly with the borrower.
Indirect auto finance customers receive a fixed rate loan in an amount and at an interest rate that is commensurate to their FICO credit score, consumer payment credit history, loan term, and based on our underwriting procedures. The amount financed by us will generally be up to the full sales price of the vehicle plus sales tax, dealer preparation fees, license fees and title fees, plus the cost of service and warranty contracts and "GAP" insurance coverage obtained in connection with the vehicle or the financing (such amounts in addition to the sales price, collectively the "Additional Vehicle Costs"). Accordingly, the amount financed by us generally may exceed, depending on the credit score and applicant's profile, in the case of new vehicles, the manufacturer's suggested retail price of the financed vehicle and the Additional Vehicle Costs. In the case of used vehicles, if the applicant meets our creditworthiness criteria, the amount financed may exceed the vehicle's value as assigned by the NADA Official Used Car Guide, our primary reference source of used cars and the Additional Vehicle Costs.
Our indirect auto portfolio at June 30, 2017, consisted of 7,346 installment loan contracts with a weighted-average contract rate of 4.22%, an average FICO credit score of 740, and an average loan to value ratio of 107.46% based on wholesale dealer invoice on new cars and the NADA Official Used Car Guide for used cars. Approximately 96% were originated through manufacturer franchised dealerships and approximately 4% were originated through independent dealerships; 45% were contracts on new vehicles and 55% were contracts on used vehicles. The loan term is averaging 69 months which is comparable to national auto industry data.
Because our primary focus for indirect auto loans is on the credit quality of the customer rather than the value of the collateral, the collectability of an indirect auto loan is more likely than a single-family first mortgage loan to be affected by adverse personal circumstances. We rely on the borrower's continuing financial stability, rather than on the value of the vehicle, for the repayment of an indirect auto loan. Because automobiles usually rapidly depreciate in value, it is unlikely that a repossessed vehicle will cover repayment of the outstanding loan balance.
Consumer Lending. Our consumer loans consist of loans secured by deposits accounts or personal property such as automobiles, boats, and motorcycles, as well as unsecured consumer debt. At June 30, 2017 , our consumer loans totaled $7.9 million , or 0.3% of our loan portfolio. We originate our consumer loans primarily in our market areas.
Consumer loans generally have shorter terms to maturity, which reduces our exposure to changes in interest rates. In addition, management believes that offering consumer loan products helps to expand and create stronger ties to our existing customer base by increasing the number of customer relationships and providing cross-marketing opportunities.
Our underwriting standards for consumer loans include a determination of the applicant's credit history and an assessment of the applicant's ability to meet existing obligations and payments on the proposed loan. The stability of the applicant's monthly income may be determined by verification of gross monthly income from primary employment, and additionally from any verifiable secondary income.
14
Consumer loans generally entail greater risk than do one-to-four family residential mortgage loans, particularly in the case of consumer loans that are unsecured or secured by rapidly depreciable assets, such as automobiles. In these cases, any repossessed collateral for a defaulted loan may not provide an adequate source of repayment of the outstanding loan balance. As a result, consumer loan collections are dependent on the borrower's continuing financial stability and thus are more likely to be adversely affected by job loss, divorce, illness or personal bankruptcy.
Commercial Loans
Commercial Real Estate Lending. We originate commercial real estate loans, including loans secured by office buildings, retail/wholesale facilities, hotels, industrial facilities, medical and professional buildings, churches, and multifamily residential properties located primarily in our market areas. As of June 30, 2017 , $ 730.4 million or 31.0% of our total loan portfolio was secured by commercial real estate property, including multifamily loans totaling $93.7 million, or 4.0% of our total loan portfolio. Of the remaining amount, $208.8 million was identified as owner occupied commercial real estate, and $427.9 million was secured by income producing, or non-owner-occupied commercial real estate. Commercial real estate loans generally are priced at a higher rate of interest than one-to-four family residential loans. Typically, these loans have higher loan balances, are more difficult to evaluate and monitor, and involve a greater degree of risk than one-to-four family residential loans. Often payments on loans secured by commercial or multi-family properties are dependent on the successful operation and management of the property; therefore, repayment of these loans may be affected by adverse conditions in the real estate market or the economy. We generally require and obtain loan guarantees from financially capable parties based upon the review of personal financial statements. If the borrower is a corporation, we generally require and obtain personal guarantees from the corporate principals based upon a review of their personal financial statements and individual credit reports.
The average outstanding loan size in our commercial real estate portfolio was $556,000 as of June 30, 2017 . Given the Bank's recent expansions into new mid-sized metropolitan areas, the Bank's commercial focus is on developing and fostering strong banking relationships with small to mid-size clients within our market area. At June 30, 2017 , the largest commercial real estate loan in our portfolio was to a local borrower in Charlotte, NC for $11.6 million, secured by a non-owner occupied medical office in Southeastern Louisiana. Our largest multi-family loan as of June 30, 2017 was a 95 unit townhouse complex on approximately 7.25 acres in Morristown, Tennessee with an outstanding balance of $5.5 million. Both of these loans were performing according to their original repayment terms as of June 30, 2017 .
We offer both fixed- and adjustable-rate commercial real estate loans. Our commercial real estate mortgage loans generally include a balloon maturity of five years or less. Amortization terms are generally limited to 20 years. Adjustable rate based loans typically include a floor and ceiling interest rate and are indexed to The Wall Street Journal prime rate, or the one-month London Interbank Offered Rate ("LIBOR"), plus or minus an interest rate margin and rates generally adjust daily. The maximum loan to value ratio for commercial real estate loans is generally up to 80% on purchases and refinances. We require appraisals of all non-owner occupied commercial real estate securing loans in excess of $250,000, and all owner-occupied commercial real estate securing loans in excess of $500,000, performed by independent appraisers. For loans less than these amounts, we may use the tax assessed value, broker price opinions, and/or a property inspection in lieu of an appraisal.
If we foreclose on a commercial real estate loan, our holding period for the collateral typically is longer than for one-to-four family residential mortgage loans because there are fewer potential purchasers of the collateral. Further, our commercial real estate loans generally have relatively large balances to single borrowers or related groups of borrowers. Accordingly, if we make any errors in judgment in the collectability of our commercial real estate loans, any resulting charge-offs may be larger on a per loan basis than those incurred with our retail loan portfolios.
Construction and Development Lending. We originate residential construction and development loans for the construction of single-family residences, condominiums, townhouses, and residential developments. Our commercial construction development loans are for the development of business properties, including multi-family, retail, office/warehouse and office buildings. Our land, lots, and development loans are predominately for the purchase or refinance of unimproved land held for future residential development, improved residential lots held for speculative investment purposes and for the future construction of speculative one-to-four family or commercial real estate.
Recently, our expansion into larger metro markets over the last three years combined with the hiring of experienced commercial real estate relationship managers, credit officers, and the development of a construction risk management group to better manage construction risk, has led to a significant increase in and conscience effort to grow the construction and development portfolio. At June 30, 2017, our construction and development loans totaled $198.0 million , or 8.4% of our total loan portfolio. At June 30, 2017, $61.0 million or 30.8% of our construction and development loans required interest-only payments. A minimal amount of these construction loans provide for interest payments to be paid out of an interest reserve, which is established in connection with the origination of the loan pursuant to which we will fund the borrower's monthly interest payments and add the payments to the outstanding principal balance of the loan. Unfunded commitments at June 30, 2017 totaled $116.0 million compared to $97.3 million at June 30, 2016. Land acquisition and development loans are included in the construction and development loan portfolio, and represent loans made to developers for the purpose of acquiring raw land and/or for the subsequent development and sale of residential lots. Such loans typically finance land purchase and infrastructure development of properties (i.e. roads, utilities, etc.) with the aim of making improved lots ready for subsequent sale to consumers or builders for ultimate construction of residential units. The primary source of repayment is generally the cash flow from developer sale of lots or improved parcels of land, secondary sources and personal guarantees, which may provide an additional measure of security for such loans.
Land acquisition and development loans are generally secured by property in our primary market areas. In addition, these loans are secured by a first lien on the property, are generally limited up to 65% of the lower of the acquisition price or the appraised value of the land and generally have a maximum amortization term of ten years with a balloon maturity of up to three years. We require title insurance and, if applicable, a hazardous waste survey reporting that the land is free of hazardous or toxic waste. At June 30, 2017, our land acquisition and development loans in our commercial construction and development portfolio totaled $62.3 million. The largest land acquisition and development loan had an
15
outstanding balance at June 30, 2017 of $3.9 million and was performing according to its repayment terms. The subject loan is secured by undeveloped land located in Wake County, NC. At June 30, 2017, 11 land acquisition and development loans totaling $1.8 million were classified as nonaccruing.
Part of our land, lot, and development portfolio consists of speculative construction loans for homes. These homes typically have an average price ranging from $200,000 to $500,000. Speculative construction loans are made to home builders and are termed "speculative" because the home builder does not have, at the time of loan origination, a signed contract with a home buyer who has a commitment for permanent financing with either us or another lender for the finished home. The home buyer may be identified either during or after the construction period, with the risk that the builder will have to fund the debt service on the speculative construction loan and finance real estate taxes and other carrying costs of the completed home for a significant period of time after the completion of construction, until a home buyer is identified. Loans to finance the construction of speculative single-family homes and subdivisions are generally offered to experienced builders with proven track records of performance, are qualified using the same standards as other commercial loan credits, and require cash reserves to carry projects through construction completions and sale of the project. These loans require payment of interest-only during the construction phase. At June 30, 2017, loans for the speculative construction of single family properties totaled $44.9 million compared to $20.3 million at June 30, 2016. At June 30, 2017, we had ten borrowers with an aggregate outstanding loan balance over $1.0 million which comprise 65.7% of the total balance for the speculative construction of single family properties and secured by properties located in our market areas. At June 30, 2017, no speculative construction loans were classified as nonaccruing. Unfunded commitments at June 30, 2017 totaled $30.1 million compared to $17.8 million at June 30, 2016.
Commercial construction and construction to permanent loans are offered on an adjustable interest rate or fixed interest rate basis. Adjustable interest rate based loans typically include a floor and ceiling interest rate and are indexed to The Wall Street Journal prime rate, plus or minus an interest rate margin. The initial construction period is generally limited to 12 to 24 months from the date of origination, and amortization terms are generally limited to 20 years; however, amortization terms of up to 25 years may be available for certain property types based on elevated underwriting and qualification criteria. Construction to permanent loans generally include a balloon maturity of five years or less; however, balloon maturities of greater than five years are allowed on a limited basis depending on factors such as property type, amortization term, lease terms, pricing, or the availability of credit enhancements. Construction loan proceeds are disbursed commensurate with the percentage of completion of work in place, as documented by periodic internal or third party inspections. The maximum loan-to-value limit applicable to these loans is generally 80% of the appraised post-construction value. Disbursement of funds is at our sole discretion and is based on the progress of construction. At June 30, 2017 we had $90.8 million of non-residential construction loans included in our commercial construction and development loan portfolio.
We require all real estate securing construction and development loans to be appraised by an independent Bank-approved state-licensed or state-certified real estate appraiser. General liability, builder's risk hazard insurance, title insurance, and flood insurance (as applicable, for properties located or to be built in a designated flood hazard area) are also required on all construction and development loans.
Construction and development lending affords us the opportunity to achieve higher interest rates and fees with shorter terms to maturity than the rates and fees generated by our single-family permanent mortgage lending.
For the reasons set forth below, construction and development lending involves additional risks when compared with permanent residential lending. Our construction and development loans are based upon estimates of costs in relation to values associated with the completed project. Funds are advanced upon the collateral for the project based on an estimate of costs that will produce a future value at completion. Because of the uncertainties inherent in estimating construction costs, as well as the market value of the completed project and the effects of governmental regulation on real property, it is relatively difficult to evaluate accurately the total funds required to complete a project and the completed project loan-to-value ratio. Changes in the demand, such as for new housing, and higher than anticipated building costs may cause actual results to vary significantly from those estimated. This type of lending also typically involves higher loan principal amounts and is often concentrated with a small number of builders. These loans often involve the disbursement of funds with repayment substantially dependent on the success of the ultimate project and the ability of the borrower to sell or lease the property or obtain permanent take-out financing, rather than the ability of the borrower or guarantor to repay principal and interest. If our appraisal of the value of a completed project proves to be overstated, we may have inadequate security for the repayment of the loan upon completion of construction of the project and may incur a loss. Because construction loans require active monitoring of the building process, including cost comparisons and on-site inspections, these loans are more difficult and costly to monitor. Increases in market rates of interest may have a more pronounced effect on construction loans by rapidly increasing the end-purchasers' borrowing costs, thereby reducing the overall demand for the project. Properties under construction are often difficult to sell and typically must be completed in order to be successfully sold which also complicates the process of working out problem construction loans. This may require us to advance additional funds and/or contract with another builder to complete construction and assume the market risk of selling the project at a future market price, which may or may not enable us to fully recover unpaid loan funds and associated construction and liquidation costs. Furthermore, in the case of speculative construction loans, there is the added risk associated with identifying an end-purchaser for the finished project.
Commercial and Industrial Loans. We typically offer commercial and industrial loans to small businesses located in our primary market areas. These loans are primarily originated as conventional loans to business borrowers, which include lines of credit, term loans, and letters of credit. These loans are typically secured by collateral and are used for general business purposes, including working capital financing, equipment financing, capital investment, and general investments. Loan terms vary from typically one to five years. The interest rates on such loans are either fixed rate or adjustable rate indexed to The Wall Street Journal prime rate plus a margin. Inherent with our extension of business credit is the business deposit relationship which frequently includes multiple accounts and related services from which we realize low cost deposits plus service and ancillary fee income.
16
Commercial and industrial loans typically have shorter maturity terms and higher interest rates than real estate loans, but generally involve more credit risk because of the type and nature of the collateral. We are focusing our efforts on small- to medium-sized, privately-held companies with local or regional businesses that operate in our market areas. At June 30, 2017 , commercial and industrial loans totaled $ 120.4 million , which represented 5.1% of our total loan portfolio. Our commercial and industrial lending policy includes credit file documentation and analysis of the borrower's background, capacity to repay the loan, the adequacy of the borrower's capital and collateral, as well as an evaluation of other conditions affecting the borrower. Analysis of the borrower's past, present and future cash flows is also an important aspect of our credit analysis. We generally obtain personal guarantees on our commercial business loans.
Subsequent to June 30, 2017, we began commercial business loan originations made under the U.S. Small Business Administration ("SBA") 7(a) and United States Department of Agriculture Business & Industry ("USDA B&I") programs to small businesses located throughout the Southeast. We originate these loans utilizing a third party service provider that facilitates processing and origination services for these loans based on the Bank's underwriting and pricing criteria as well as the servicing of these loans. Loans made by the Bank under the SBA 7(a) and USDA B&I programs generally are made to small businesses to provide working capital needs, to refinance existing debt or to provide funding for the purchase of businesses, real estate, machinery, and equipment. These loans generally are secured by a combination of assets that may include receivables, inventory, furniture, fixtures, equipment, business real property, commercial real estate and sometimes additional collateral such as an assignment of life insurance and a lien on personal real estate owned by the guarantor(s). The terms of these loans vary by use of funds. The loans are primarily underwritten on the basis of the borrower's ability to service the loan from qualifying business income. Under the SBA 7(a) and USDA B&I loan program the loans carry a government guaranty up to 90% of the loan in some cases. Typical maturities for this type of loan vary up to twenty-five years and can be thirty years in some circumstances. SBA 7(a) and USDA B&I loans will normally be adjustable rate loans based upon the Wall Street Journal prime lending rate. Under the loan programs, we will typically sell in the secondary market the guaranteed portion of these loans to generate noninterest income and retain the related unguaranteed portion of these loans; loan servicing will be handled by the third party loan service provider for a fee paid for by the purchaser of the guaranteed loan portion. We generally offer SBA 7(a) loans up to $5.0 million and USDA B&I loans up to $10.0 million.
Repayment of our commercial and industrial loans is often dependent on the cash flows of the borrower, which may be unpredictable, and the collateral securing these loans may fluctuate in value. Our commercial and industrial loans are originated primarily based on the identified cash flow of the borrower and secondarily on the underlying collateral provided by the borrower. Most often, this collateral consists of equipment, inventory or accounts receivable. Credit support provided by the borrower for most of these loans and the probability of repayment is based on the liquidation of the pledged collateral and enforcement of a personal guarantee, if any. As a result, in the case of loans secured by accounts receivable, the availability of funds for the repayment of these loans may be substantially dependent on the ability of the borrower to collect amounts due from its customers. The collateral securing other loans may depreciate over time, may be difficult to appraise and may fluctuate in value based on the success of the business.
Municipal Leases. We offer ground and equipment lease financing to fire departments located primarily throughout North Carolina and, to a lesser extent, South Carolina. Municipal leases are secured primarily by a ground lease in our name with a sublease to the borrower for a fire station or an equipment lease for fire trucks and firefighting equipment. Prior to December 31, 2016, we originated these loans primarily through a third party that assigned the lease to us after we funded the loan. On December 31, 2016, we acquired the third party originator, United Financial of North Carolina, Inc., and now all originations and underwriting is performed directly by us prior to funding. These leases are at a fixed rate of interest and may have a term to maturity of up to 20 years.
At June 30, 2017 , municipal leases totaled $ 101.2 million , which represented 4.3% of our total loan portfolio. At that date, $33.8 million, or 33.4% of our municipal leases were secured by fire trucks, $26.2 million, or 25.9%, were secured by firehouses, $39.6 million or 39.1%, were secured by both, with the remaining $1.6 million or 1.6% secured by miscellaneous firefighting equipment. At June 30, 2017 , the average outstanding municipal lease size was $483,000. These loans are our highest yielding loans since the interest earned is tax-exempt, and this portfolio has the lowest delinquency rate of any of our loan types.
Repayment of our municipal leases is often dependent on the tax revenues collected by the county/municipality on behalf of the fire department. Although a municipal lease does not constitute a general obligation of the county/municipality for which the county/municipality's taxing power is pledged, a municipal lease is ordinarily backed by the county/municipality's covenant to budget for, appropriate and pay the tax revenues to the fire department. However, certain municipal leases contain "non-appropriation" clauses which provide that the municipality has no obligation to make lease or installment purchase payments in future years unless money is appropriated for such purpose on a yearly basis. In the case of a "non-appropriation" lease, our ability to recover under the lease in the event of non-appropriation or default will be limited solely to the repossession of the leased property, without recourse to the general credit of the lessee, and disposition or releasing of the property might prove difficult. At June 30, 2017 , $2.4 million of our municipal leases contained a non-appropriation clause.
17
Loan Originations, Purchases, Sales, Repayments and Servicing
We originate both fixed-rate and adjustable-rate loans. Our ability to originate loans, however, is dependent upon customer demand for loans in our market area. Demand is affected by competition and the interest rate environment. During the past few years, we, like many other financial institutions, have experienced significant prepayments on loans due to the low interest rate environment prevailing in the United States. In periods of economic uncertainty, the ability of financial institutions, including us, to originate large dollar volumes of real estate loans may be substantially reduced or restricted, with a resultant decrease in interest income. We do not generally purchase loans or loan participations except for certain HELOCs. We actively sell the majority of our long-term fixed-rate residential first mortgage loans to the secondary market at the time of origination and retain our adjustable-rate residential mortgages and certain fixed-rate mortgages with terms to maturity less than or equal to 15 years and other consumer and commercial loans. During the years ended June 30, 2017 and 2016 we sold $135.7 million and $ 92.5 million , respectively, of predominantly one-to-four family loans to the secondary market. We release the servicing on the loans we sell into the secondary market. Loans are generally sold on a non-recourse basis.
In addition to interest earned on loans and loan origination fees, we receive fees for loan commitments, late payments and other miscellaneous services. The fees vary from time to time, generally depending on the supply of funds and other competitive conditions in the market.
18
The following table shows our loan origination, purchase, sale and repayment activities for the periods indicated.
| Years Ended June 30, | ||||||||||
| 2017 |
| 2016 |
| 2015 | ||||||
Originations: (1) |
|
|
|
|
| ||||||
Retail consumer: | (In thousands) | ||||||||||
One-to-four family | $ | 233,478 | |
| $ | 173,540 | |
| $ | 163,652 | |
Home equity - originated | 47,072 | |
| 50,406 | |
| 46,728 | | |||
Construction and land/lots | 71,674 | |
| 42,493 | |
| 49,689 | | |||
Indirect auto finance | 84,707 | |
| 87,844 | |
| 53,010 | | |||
Consumer | 2,722 | |
| 4,192 | |
| 3,113 | | |||
Commercial loans: |
|
|
| |
|
| | ||||
Commercial real estate | 238,870 | |
| 137,660 | |
| 112,349 | | |||
Construction and development | 192,803 | |
| 164,945 | |
| 47,955 | | |||
Commercial and industrial | 92,591 | |
| 22,933 | |
| 34,583 | | |||
Municipal leases | 8,278 | |
| - | |
| - | | |||
Total loans originated | $ | 972,195 | |
| $ | 684,013 | |
| $ | 511,079 | |
Purchases: |
| |
|
| |
|
| | |||
Retail consumer: |
|
|
|
|
| ||||||
Home equity - purchased | $ | 77,000 | |
| $ | 109,045 | |
| $ | 79,039 | |
Commercial loans: |
|
|
| |
|
| | ||||
Commercial real estate | 930 | |
| 489 | |
| 648 | | |||
Municipal leases | 8,973 | |
| 11,118 | |
| 15,282 | | |||
Loans acquired through business combination | 258,059 | |
| - | |
| 87,529 | | |||
Total loans purchased or acquired | $ | 344,962 | |
| $ | 120,652 | |
| $ | 182,498 | |
Sales and repayments: |
| |
|
| |
|
| | |||
Retail consumer: |
|
|
|
|
| ||||||
One-to-four family | $ | 135,365 | |
| $ | 92,054 | |
| $ | 73,474 | |
Home equity - originated | - | |
| 15 | |
| - | | |||
Consumer | - | |
| 1 | |
| - | | |||
Commercial loans: |
|
|
|
|
| ||||||
Commercial real estate | 2,781 | |
| 89 | |
| 6,386 | | |||
Construction and development | - | |
| 44 | |
| 805 | | |||
Commercial and industrial | - | |
| 287 | |
| 594 | | |||
Total sales | 138,146 | |
| 92,490 | |
| 81,259 | | |||
Principal repayments | 660,548 | |
| 565,142 | |
| 420,232 | | |||
Total reductions | $ | 798,694 | |
| $ | 657,632 | |
| $ | 501,491 | |
Net increase | $ | 518,463 | |
| $ | 147,033 | |
| $ | 192,086 | |
________________________________________________
(1) | Originations include one-to-four loans originated for sale of $134.3 million, $92.0 million, and $74.4 million for years ended June 30, 2017 , 2016 , and 2015 , respectively. |
Asset Quality
Loan Delinquencies and Collection Procedure. When a borrower fails to make a required payment on a residential real estate loan, we attempt to cure the delinquency by contacting the borrower. A late notice is sent 15 days after the due date, and the borrower may also be contacted by phone at this time. If the delinquency continues, subsequent efforts are made to contact the delinquent borrower and additional collection notices and letters are sent. When a loan is 90 days delinquent, we may commence repossession or a foreclosure action. Reasonable attempts are made to collect from borrowers prior to referral to an attorney for collection. In certain instances, we may modify the loan or grant a limited moratorium on loan payments to enable the borrower to reorganize their financial affairs, and we attempt to work with the borrower to establish a repayment schedule to cure the delinquency.
19
Delinquent consumer loans are handled in a similar manner, except that late notices are sent within 30 days after the due date. Our procedures for repossession and sale of consumer collateral are subject to various requirements under the applicable consumer protection laws, as well as, other applicable laws and the determination by us that it would be beneficial from a cost basis.
Delinquent commercial loans are initially handled by the relationship manager of the loan, who is responsible for contacting the borrower. Larger problem commercial loans are transferred to the Bank's Special Assets Department for resolution or collection activities. The Special Assets Department may work with the commercial relationship managers to see that the necessary steps are taken to collect delinquent loans, while ensuring that standard default notices and letters are mailed to the borrower. If a commercial loan becomes more problematic, or goes 90 days past the due date, a Special Assets officer will take over the loan for further collection activities including any legal action that may be necessary. If an acceptable workout or disposition plan of a delinquent commercial loan cannot be reached, we generally initiate foreclosure or repossession proceedings on any collateral securing the loan.
The following table sets forth our loan delinquencies by type, by amount and by percentage of type at June 30, 2017 .
| Loans Delinquent For: | ||||||||||||||||||||||||||||
|
|
|
|
|
|
|
|
|
|
|
|
| Total Loans Delinquent | ||||||||||||||||
| 30-89 Days |
| 90 Days and Over |
| 30 Days or More | ||||||||||||||||||||||||
| Number |
| Amount |
| Percent of Loan Category |
| Number |
| Amount |
| Percent of Loan Category |
| Number |
| Amount |
| Percent of Loan Category | ||||||||||||
| (Dollars in thousands) | ||||||||||||||||||||||||||||
Retail consumer loans: |
|
|
|
|
|
|
|
|
|
|
|
|
|
|
|
|
| ||||||||||||
One-to-four family | 54 | |
| $ | 3,496 | |
| 0.51 | % |
| 47 | |
| $ | 3,990 | |
| 0.58 | % |
| 101 | |
| $ | 7,486 | |
| 1.09 | % |
Home equity - originated | 14 | |
| 1,037 | |
| 0.66 | |
| 9 | |
| 274 | |
| 0.17 | |
| 23 | |
| 1,311 | |
| 0.83 | | |||
Construction and land/lots | 5 | |
| 132 | |
| 0.26 | |
| 5 | |
| 129 | |
| 0.26 | |
| 10 | |
| 261 | |
| 0.52 | | |||
Indirect auto finance | 9 | |
| 96 | |
| 0.07 | |
| - | |
| - | |
| - | |
| 9 | |
| 96 | |
| 0.07 | | |||
Consumer | 6 | |
| 5 | |
| 0.06 | |
| 5 | |
| 14 | |
| 0.18 | |
| 11 | |
| 19 | |
| 0.24 | | |||
Commercial loans: |
| |
|
| |
|
| |
|
| |
|
| |
|
| |
|
| |
|
| |
|
| | |||
Commercial real estate | 8 | |
| 809 | |
| 0.11 | |
| 14 | |
| 3,100 | |
| 0.42 | |
| 22 | |
| 3,909 | |
| 0.54 | | |||
Construction and development | 3 | |
| 385 | |
| 0.19 | |
| 9 | |
| 887 | |
| 0.45 | |
| 12 | |
| 1,272 | |
| 0.64 | | |||
Commercial and industrial | 2 | |
| 37 | |
| 0.03 | |
| 37 | |
| 831 | |
| 0.69 | |
| 39 | |
| 868 | |
| 0.72 | | |||
Total | 101 | |
| $ | 5,997 | |
| 0.25 | % |
| 126 | |
| $ | 9,225 | |
| 0.39 | % |
| 227 | |
| $ | 15,222 | |
| 0.65 | % |
Nonperforming Assets. Nonperforming assets were $20.0 million , or 0.62% of total assets at June 30, 2017 , compared to $24.5 million, or 0.90%, at June 30, 2016 .
Over the past several years we have significantly improved our risk profile by aggressively managing and reducing our problem assets. We continue to believe our level of nonperforming assets is manageable, and we believe that we have sufficient capital and human resources to manage the collection of our nonperforming assets in an orderly fashion. However, our operating results could be adversely impacted if we are unable to significantly manage our nonperforming assets.
Loans are placed on nonaccrual status when the collection of principal and/or interest becomes doubtful or other factors involving the loan warrant placing the loan on nonaccrual status. Troubled debt restructurings are loans which have renegotiated loan terms to assist borrowers who are unable to meet the original terms of their loans. Such modifications to loan terms may include a lower interest rate, a reduction in principal, or a longer term to maturity. During the fiscal year ended June 30, 2017 , 41 loans for $4.9 million were modified from their original terms and were identified in our asset quality reports as a troubled debt restructuring. This compares to 55 loans for $6.1 million that were modified in the fiscal year ended June 30, 2016 . As of June 30, 2017 , the outstanding balance of troubled debt restructured loans was $32.7 million, comprised of 361 loans as compared to $33.7 million comprised of 366 loans at June 30, 2016 .
Once a nonaccruing troubled debt restructuring has performed according to its modified terms for six months and the collection of principal and interest under the revised terms is deemed probable, the troubled debt restructuring is removed from nonaccrual status. At June 30, 2017 , $4.7 million of troubled debt restructurings were classified as nonaccrual, including $1.6 million of construction and development loans, the largest of which was $1.0 million as discussed below. As of June 30, 2017 , $27.0 million, or 82.6% of the restructured loans have a current payment status as compared to $28.3 million, or 84.0% at June 30, 2016 . Performing troubled debt restructurings decreased $1.2 million , or 4.3% , from June 30, 2016 to June 30, 2017. The table below sets forth the amounts and categories of nonperforming assets.
20
|
| At June 30, | ||||||||||||||||||
|
| 2017 |
| 2016 |
| 2015 |
| 2014 |
| 2013 | ||||||||||
Nonaccruing loans: (1) Retail consumer loans: |
| (In thousands) | ||||||||||||||||||
One-to-four family |
| $ | 6,453 | |
| $ | 9,192 | |
| $ | 10,523 | |
| $ | 14,917 | |
| $ | 29,811 | |
Home equity - originated |
| 1,291 | |
| 1,026 | |
| 1,856 | |
| 2,749 | |
| 3,793 | | |||||
Home equity - purchased |
| 192 | |
| - | |
| - | |
| - | |
| - | | |||||
Construction and land/lots |
| 245 | |
| 188 | |
| 465 | |
| 443 | |
| 2,172 | | |||||
Indirect auto finance |
| 1 | |
| 20 | |
| - | |
| - | |
| - | | |||||
Consumer |
| 29 | |
| 15 | |
| 49 | |
| 27 | |
| 42 | | |||||
Commercial loans: |
|
| |
|
|
|
| |
|
| |
|
| | ||||||
Commercial real estate |
| 2,756 | |
| 3,222 | |
| 5,103 | |
| 12,953 | |
| 21,149 | | |||||
Construction and development |
| 1,766 | |
| 1,417 | |
| 3,461 | |
| 5,697 | |
| 10,172 | | |||||
Commercial and industrial |
| 827 | |
| 3,019 | |
| 3,081 | |
| 1,134 | |
| 1,422 | | |||||
Municipal leases |
| 106 | |
| 419 | |
| 316 | |
| - | |
| - | | |||||
Total nonaccruing loans |
| 13,666 | |
| 18,518 | |
| 24,854 | |
| 37,920 | |
| 68,561 | | |||||
Real Estate Owned assets: |
|
| |
|
| |
|
| |
|
| |
|
| | |||||
Retail consumer loans: |
|
| |
|
| |
|
| |
|
| |
|
| | |||||
One-to-four family |
| 990 | |
| 794 | |
| 1,613 | |
| 3,876 | |
| 4,276 | | |||||
Home equity - originated |
| 45 | |
| 30 | |
| 20 | |
| 627 | |
| 642 | | |||||
Home equity - purchased |
| - | |
| - | |
| - | |
| - | |
| - | | |||||
Construction and land/lots |
| 690 | |
| 846 | |
| 1,096 | |
| 1,613 | |
| 1,861 | | |||||
Indirect auto finance |
| - | |
| - | |
| - | |
| - | |
| - | | |||||
Consumer |
| - | |
| - | |
| - | |
| - | |
| - | | |||||
Commercial loans: |
|
| |
|
| |
|
| |
|
| |
|
| | |||||
Commercial real estate |
| 2,736 | |
| 1,211 | |
| 978 | |
| 3,820 | |
| 2,016 | | |||||
Construction and development |
| 1,857 | |
| 3,075 | |
| 3,317 | |
| 4,725 | |
| 2,943 | | |||||
Commercial and industrial |
| - | |
| - | |
| - | |
| - | |
| - | | |||||
Municipal leases |
| - | |
| - | |
| - | |
| - | |
| - | | |||||
Total foreclosed assets |
| 6,318 | |
| 5,956 | |
| 7,024 | |
| 14,661 | |
| 11,738 | | |||||
Total nonperforming assets |
| $ | 19,984 | |
| $ | 24,474 | |
| $ | 31,878 | |
| $ | 52,581 | |
| $ | 80,299 | |
Total nonperforming assets as a percentage of total assets |
| 0.62 | % |
| 0.90 | % |
| 1.15 | % |
| 2.53 | % |
| 5.07 | % | |||||
Performing Troubled Debt Restructurings |
| $ | 27,043 | |
| $ | 28,263 | |
| $ | 21,891 | |
| $ | 22,179 | |
| $ | 14,012 | |
_______________________________________
(1) | Purchased-credit impaired ("PCI") loans totaling $ 6,664 at June 30, 2017 , $6,607 at June 30, 2016 , $8,158 at June 30, 2015, and $9,091 at June 30, 2014 are excluded from nonaccruing loans due to the accretion of discounts established in accordance with the acquisition method of accounting for business combinations. There were no PCI loans prior to 2014. |
For the years ended June 30, 2017 and 2016 , gross interest income which would have been recorded had the nonaccruing loans been current in accordance with their original terms amounted to $897,000 and $1.2 million, respectively. The amount that was included in interest income on such loans was $1.0 million and $1.1 million, respectively. At June 30, 2017 , $20.9 million in impaired loans were individually evaluated for impairment; $1.5 million of the allowance for loan losses was allocated to these individually impaired loans at period-end. A loan is impaired when it is probable, based on current information and events, that we will be unable to collect all contractual principal and interest payments due in accordance with the terms of the loan agreements. Troubled debt restructurings are also considered impaired. Impaired loans are measured on an individual basis for individually significant loans based on the present value of expected future cash flows discounted at the loan's effective interest rate or, as a practical expedient, at the loan's observable market price or the fair value of the collateral if the loan is collateral dependent. The amount of impairment, if any, and any subsequent changes are included in the allowance for loan losses.
We record real estate owned ("REO") (property acquired through a lending relationship) at fair value less cost to sell on a non-recurring basis. All REO properties are recorded at amounts which are equal to the lower of the related loan balance or the fair value of the properties based on independent appraisals (reduced by estimated selling costs) upon transfer of the loans to REO. From time to time, non-recurring fair value adjustments to REO are recorded to reflect partial write-downs based on an observable market price or current appraised value of property. The individual carrying values of these assets are reviewed for impairment at least annually and any additional impairment charges are expensed to operations. For the years ended June 30, 2017 and 2016 , we recognized $292,000 and $318,000 , respectively, of REO impairment charges.
21
Within our nonaccruing loans, as of June 30, 2017 we had one nonaccrual lending relationship with aggregate loan exposure in excess of $1.0 million, or 7.5% of our total nonaccruing loans. This loan is a $1.0 million troubled debt restructuring for construction and development loan secured by improved land zoned for commercial purposes located in Buncombe County, NC. At June 30, 2017 , we had $6.3 million of REO, the largest of which had a book value of $768,000 and is related to a commercial real estate condominium project located in Bristol, VA. The second and third largest REO properties at June 30, 2017 consist of commercial real estate located in Boiling Springs, NC and undeveloped land located in Anderson County, TN with book values of $648,000 and $602,800, respectively. At June 30, 2017 all other REO properties have individual book values of less than $450,000.
REO increased $362,000 , to $6.3 million at June 30, 2017 primarily due to the $2.4 million in transfers from loans and $1.5 million acquired through the TriSummit acquisition, partially offset by $3.3 million in sales of REO. The total balance of REO included $2.5 million in land, construction and development projects (both residential and commercial), $2.7 million in commercial real estate, and $1.1 million in single-family homes at June 30, 2017.
In fiscal 2017 , we liquidated $4.4 million in REO based on contractual loan values at the time of foreclosure, realizing $3.2 million in net proceeds, or 72.6%, of the foreclosed contractual loan balances. As of June 30, 2017, the book value of our REO, expressed as a percentage of the related contractual loan balances at the time the properties were transferred to REO was 40.0%.
Other Loans of Concern. In addition to the nonperforming assets set forth in the table above, as of June 30, 2017 , there were 473 accruing loans totaling $48.7 million with respect to which known information about the possible credit problems of the borrowers have caused management to have concerns as to the ability of the borrowers to comply with present loan repayment terms and which may result in the future inclusion of such items in the nonperforming asset categories. These loans have been considered in management's determination of our allowance for loan losses.
Classified Assets. Loans and other assets, such as debt and equity securities considered to be of lesser quality, are classified as "substandard," "doubtful" or "loss." An asset is considered "substandard" if it is inadequately protected by the current net worth and paying capacity of the obligor or of the collateral pledged, if any. "Substandard" assets include those characterized by the "distinct possibility" that the insured institution will sustain "some loss" if the deficiencies are not corrected. Assets classified as "doubtful" have all of the weaknesses in those classified "substandard," with the added characteristic that the weaknesses present make "collection or liquidation in full," on the basis of currently existing facts, conditions and values, "highly questionable and improbable." Assets classified as "loss" are those considered "uncollectible" and of such little value that their continuance as assets without the establishment of a specific loss reserve is not warranted.
When we classify a problem asset as either substandard or doubtful, we may establish a specific allowance for loan losses in an amount deemed prudent by management. When we classify problem assets as "loss," we either establish a specific allowance for losses equal to 100% of that portion of the asset so classified or charge off such amount. Our determination as to the classification of our assets and the amount of our valuation allowances is subject to review by our bank regulators, which may order the establishment of additional general or specific loss allowances. Assets which do not currently expose us to sufficient risk to warrant classification in one of the aforementioned categories but possess weakness are designated by us as "special mention."
We regularly review the problem assets in our portfolio to determine whether any assets require classification in accordance with applicable regulations. On the basis of management's review of our assets, at June 30, 2017 , our classified assets (consisting of $ 43.9 million of loans and $ 6.3 million of REO) totaled $50.2 million , or 1.57%, of our assets, of which $13.7 million was included in nonaccruing loans. The aggregate amounts of our classified assets and special mention loans at the dates indicated (as determined by management), were as follows:
|
| At June 30, | ||||||
|
| 2017 |
| 2016 | ||||
Classified Assets: | (In thousands) | |||||||
Loss | $ | 28 | |
| $ | 48 | | |
Doubtful | 1,560 | |
| 1,375 | | |||
Substandard | – performing | 29,436 | |
| 33,826 | | ||
| – nonaccruing | 12,869 | |
| 17,704 | | ||
Total classified loans | 43,893 | |
| 52,953 | | |||
REO | 6,318 | |
| 5,956 | | |||
Total classified assets | 50,211 | |
| 58,909 | | |||
Special mention loans | 18,481 | |
| 25,144 | | |||
Total classified assets and special mention loans | $ | 68,692 | |
| $ | 84,053 | | |
Allowance for Loan Losses. The allowance for loan losses is a valuation account that reflects our estimation of the losses in our loan portfolio to the extent they are reasonable to estimate. The allowance is maintained through provisions for loan losses that are charged to earnings in the period they are established. We charge losses on loans against the allowance for loan losses when we believe the collection of loan principal is unlikely. Recoveries on loans previously charged off are added back to the allowance.
22
In recent years, home and lot sales activity and real estate values have improved along with general economic conditions in our market areas resulting in materially lower loan charge-offs and nonaccruing loans than in prior fiscal years. Proactively managing our loan portfolio and aggressively resolving troubled assets has been and will continue to be a primary focus for us. As a result, our nonperforming assets declined substantially over the last several years. At June 30, 2017 , our nonaccruing loans decreased to $13.7 million as compared to $18.5 million at June 30, 2016 , and $24.9 million at June 30, 2015 . At June 30, 2017 , $6.6 million, or 48.0%, of our total nonaccruing loans were current on their loan payments as compared to $8.1 million, or 43.7%, of total nonaccruing loans at June 30, 2016. During fiscal 2017 classified assets decreased $8.7 million, or 14.8%, to $50.2 million and delinquent loans (loans delinquent 30 days or more) decreased $4.3 million, or 21.9%, to $15.2 million at June 30, 2017 . There were $141,000 and $1.1 million in net loan charge-offs during the fiscal years ended June 30, 2017 and 2016 , respectively. There was no provision for loan losses during fiscal 2017 or 2016. We did not record a loan loss provision in either fiscal year as our improved risk profile, as indicated by the improvement in our key credit quality metrics, offset any additional allowance that might have been required to cover loan growth. Although we continue to actively engage our borrowers in resolving remaining problem assets, future additions to our allowance for loan losses will be meaningfully influenced by the course of economic conditions in our primary market areas as well as the national economy.
At June 30, 2017 , our allowance for loan losses was $21.2 million , or 0.9% , of our total loan portfolio, and 154.8% of total nonaccruing loans. Excluding loans acquired, which have been recorded at fair value with an appropriate credit discount, the allowance for loan losses was 1.0% of total loans at June 30, 2017 . Management's estimation of an appropriate allowance for loan losses is inherently subjective as it requires estimates and assumptions that are susceptible to significant revisions as more information becomes available or as future events change. The level of allowance is based on estimates and the ultimate losses may vary from these estimates. Large groups of smaller balance homogeneous loans, such as residential real estate, small commercial real estate, home equity and consumer loans, are evaluated in the aggregate using historical loss factors adjusted for current economic conditions. Assessing the allowance for loan losses is inherently subjective as it requires making material estimates, including the amount and timing of future cash flows expected to be received. In the opinion of management, the allowance, when taken as a whole, reflects estimated loan losses in our loan portfolio.
A loan is considered impaired when, based on current information and events, it is probable that we will be unable to collect the scheduled payments of principal or interest when due. Factors considered by management in determining impairment include payment status, collateral value, and the probability of collecting scheduled principal and interest payments when due. Loans that experience insignificant payment delays and payment shortfalls generally are not classified as impaired. Management determines the significance of payment delays and payment shortfalls on a case-by-case basis, taking into consideration all of the circumstances surrounding the loan and the borrower, including the length of the delay, the reasons for the delay, the borrower's prior payment record, and the amount of the shortfall in relation to the principal and interest owed.
Future additions to the allowance for loan losses may be necessary if economic and other conditions in the future differ substantially from the current operating environment. In addition, the Federal Reserve and the NCCOB as an integral part of their examination process periodically review our loan and REO portfolios and the related allowance for loan losses and valuation allowance for foreclosed real estate. The regulators may require the allowance for loan losses or the valuation allowance for foreclosed real estate to be increased based on their review of information available at the time of the examination, which would negatively affect our earnings.
23
The following table summarizes the distribution of the allowance for loan losses by loan category at the dates indicated.
| At June 30, | |||||||||||||||||||||||||||||||||
| 2017 |
| 2016 |
| 2015 |
| 2014 |
| 2013 | |||||||||||||||||||||||||
| Amount |
| Percent of loans in each category to total loans |
| Amount |
| Percent of loans in each category to total loans |
| Amount |
| Percent of loans in each category to total loans |
| Amount |
| Percent of loans in each category to total loans |
| Amount |
| Percent of loans in each category to total loans | |||||||||||||||
| (Dollars in thousands) | |||||||||||||||||||||||||||||||||
Allocated at end of period to: |
|
|
|
|
|
|
|
|
|
|
|
|
|
|
|
|
|
|
| |||||||||||||||
Retail consumer loans: |
|
|
|
|
|
|
|
|
|
|
|
|
|
|
|
|
|
|
| |||||||||||||||
One-to-four family | $ | 4,476 | |
| 29.08 | % |
| $ | 6,595 | |
| 34.04 | % |
| $ | 7,990 | |
| 38.61 | % |
| $ | 10,527 | |
| 44.09 | % |
| $ | 15,098 | |
| 51.69 | % |
Home equity - originated | 1,384 | |
| 6.68 | |
| 1,997 | |
| 8.91 | |
| 1,777 | |
| 9.56 | |
| 2,487 | |
| 9.90 | |
| 3,827 | |
| 10.77 | | |||||
Home equity - purchased | 838 | |
| 6.90 | |
| 558 | |
| 7.88 | |
| 432 | |
| 4.27 | |
| - | |
| - | |
| - | |
| - | | |||||
Construction and land/lots | 977 | |
| 2.13 | |
| 1,344 | |
| 2.08 | |
| 1,822 | |
| 2.73 | |
| 2,420 | |
| 3.95 | |
| 2,890 | |
| 4.42 | | |||||
Indirect auto finance | 881 | |
| 5.99 | |
| 1,016 | |
| 5.92 | |
| 464 | |
| 3.11 | |
| 113 | |
| 0.59 | |
| - | |
| - | | |||||
Consumer | 57 | |
| 0.34 | |
| 61 | |
| 0.25 | |
| 128 | |
| 0.22 | |
| 184 | |
| 0.42 | |
| 138 | |
| 0.29 | | |||||
Commercial loans: |
| |
|
|
|
|
|
| |
|
| |
|
| |
|
| |
|
| |
|
| |
|
| | |||||||
Commercial real estate | 7,351 | |
| 31.04 | |
| 6,430 | |
| 26.55 | |
| 6,339 | |
| 26.20 | |
| 5,439 | |
| 25.21 | |
| 6,583 | |
| 19.81 | | |||||
Construction and development | 3,166 | |
| 8.42 | |
| 1,908 | |
| 4.74 | |
| 1,581 | |
| 3.83 | |
| 1,241 | |
| 3.78 | |
| 2,399 | |
| 2.06 | | |||||
Commercial and industrial | 1,524 | |
| 5.12 | |
| 721 | |
| 4.00 | |
| 1,104 | |
| 5.03 | |
| 249 | |
| 4.97 | |
| 156 | |
| 0.98 | | |||||
Municipal leases | 497 | |
| 4.30 | |
| 662 | |
| 5.63 | |
| 737 | |
| 6.44 | |
| 769 | |
| 7.09 | |
| 982 | |
| 9.98 | | |||||
Total loans | $ | 21,151 | |
| 100.00 | % |
| $ | 21,292 | |
| 100.00 | % |
| $ | 22,374 | |
| 100.00 | % |
| $ | 23,429 | |
| 100.00 | % |
| $ | 32,073 | |
| 100.00 | % |
24
The following table sets forth an analysis of our allowance for loan losses at the dates and for the periods indicated.
| Years Ended June 30, | ||||||||||||||||||
| 2017 |
| 2016 |
| 2015 |
| 2014 |
| 2013 | ||||||||||
| (Dollars in thousands) | ||||||||||||||||||
Balance at beginning of period: | $ | 21,292 | |
| $ | 22,374 | |
| $ | 23,429 | |
| $ | 32,073 | |
| $ | 35,100 | |
Provision for (recovery of) loan losses | - | |
| - | |
| 150 | |
| (6,300 | ) |
| 1,100 | | |||||
Charge-offs: |
| |
|
| |
|
| |
|
| |
|
| | |||||
Retail consumer loans: |
| |
|
| |
|
| |
|
| |
|
| | |||||
One-to-four family | 439 | |
| 799 | |
| 1,878 | |
| 3,269 | |
| 1,855 | | |||||
Home equity - originated | 18 | |
| 94 | |
| 551 | |
| 330 | |
| 1,023 | | |||||
Home equity - purchased | 48 | |
| - | |
| - | |
| - | |
| - | | |||||
Construction and land/lots | 165 | |
| 321 | |
| 483 | |
| 804 | |
| 770 | | |||||
Indirect auto finance | 531 | |
| 281 | |
| 107 | |
| - | |
| - | | |||||
Consumer | 18 | |
| 168 | |
| 274 | |
| 33 | |
| 67 | | |||||
Total retail consumer loans | 1,219 | |
| 1,663 | |
| 3,293 | |
| 4,436 | |
| 3,715 | | |||||
Commercial loans: |
| |
|
| |
|
| |
|
| |
|
| | |||||
Commercial real estate | 139 | |
| 200 | |
| 704 | |
| 413 | |
| 1,624 | | |||||
Construction and development | 21 | |
| 259 | |
| 368 | |
| 377 | |
| 1,568 | | |||||
Commercial and industrial | 1,171 | |
| 1,582 | |
| 495 | |
| 110 | |
| 84 | | |||||
Municipal leases | - | |
| - | |
| - | |
| - | |
| - | | |||||
Total commercial loans | 1,331 | |
| 2,041 | |
| 1,567 | |
| 900 | |
| 3,276 | | |||||
Total charge-offs | 2,550 | |
| 3,704 | |
| 4,860 | |
| 5,336 | |
| 6,991 | | |||||
Recoveries: |
| |
|
| |
|
| |
|
| |
|
| | |||||
Retail consumer loans: |
| |
|
| |
|
| |
|
| |
|
| | |||||
One-to-four family | 181 | |
| 683 | |
| 758 | |
| 875 | |
| 617 | | |||||
Home equity - originated | 231 | |
| 157 | |
| 231 | |
| 153 | |
| 95 | | |||||
Construction and land/lots | 487 | |
| 44 | |
| 95 | |
| 624 | |
| 137 | | |||||
Indirect auto finance | 122 | |
| 58 | |
| 34 | |
| - | |
| - | | |||||
Consumer | 63 | |
| 292 | |
| 91 | |
| 10 | |
| 5 | | |||||
Total retail consumer loans | 1,084 | |
| 1,234 | |
| 1,209 | |
| 1,662 | |
| 854 | | |||||
Commercial loans: |
| |
|
| |
|
| |
|
| |
|
| | |||||
Commercial real estate | 58 | |
| 883 | |
| 479 | |
| 120 | |
| 252 | | |||||
Construction and development | 539 | |
| 265 | |
| 1,311 | |
| 1,052 | |
| 1,656 | | |||||
Commercial and industrial | 728 | |
| 240 | |
| 656 | |
| 159 | |
| 102 | | |||||
Municipal leases | - | |
| - | |
| - | |
| - | |
| - | | |||||
Total commercial loans | 1,325 | |
| 1,388 | |
| 2,446 | |
| 1,331 | |
| 2,010 | | |||||
Total recoveries | 2,409 | |
| 2,622 | |
| 3,655 | |
| 2,993 | |
| 2,864 | | |||||
Net charge-offs | 141 | |
| 1,082 | |
| 1,205 | |
| 2,343 | |
| 4,127 | | |||||
Balance at end of period | $ | 21,151 | |
| $ | 21,292 | |
| $ | 22,374 | |
| $ | 23,429 | |
| $ | 32,073 | |
Net charge-offs during the period to average loans outstanding during the period | 0.01 | % |
| 0.06 | % |
| 0.07 | % |
| 0.19 | % |
| 0.34 | % | |||||
Net charge-offs during the period to average non-performing assets | 0.67 | % |
| 3.77 | % |
| 2.89 | % |
| 3.40 | % |
| 4.99 | % | |||||
Allowance as a percentage of nonperforming assets | 105.84 | % |
| 87.00 | % |
| 70.19 | % |
| 44.56 | % |
| 39.94 | % | |||||
Allowance as a percentage of total loans (1) | 0.90 | % |
| 1.16 | % |
| 1.33 | % |
| 1.56 | % |
| 2.75 | % | |||||
______________
(1) | Excluding loans acquired, which have been recorded at fair value with an appropriate credit discount, the allowance for loan losses was 1.03%, 1.32%, 1.58%, and 2.05% of total loans at June 30, 2017 , 2016 , 2015 , and 2014, respectively. |
25
Investment Activities
The Bank invests in various securities based on investment policies that have been approved by our board of directors and adhere to bank regulations. These securities include: United States Treasury obligations, securities of various federal agencies, including mortgage-backed securities, callable agency securities, certain certificates of deposit of insured banks and savings institutions, repurchase agreements, municipal bonds, investment grade corporate bonds and commercial paper, federal funds, and limited types of equity securities. See "How We Are Regulated - HomeTrust Bank" for a discussion of additional restrictions on our investment activities.
Our chief executive officer and chief financial officer have the basic responsibility for the management of our investment portfolio, subject to the direction and guidance of the board of directors. These officers consider various factors when making decisions, including the marketability, maturity, and tax consequences of the proposed investment. The maturity structure of investments will be affected by various market conditions, including the current and anticipated slope of the yield curve, the level of interest rates, the trend of new deposit inflows, and the anticipated demand for funds via deposit withdrawals and loan originations and purchases.
The general objectives of our investment portfolio are to provide liquidity when loan demand is high, to assist in maintaining earnings when loan demand is low and to optimize earnings while satisfactorily managing risk, including credit risk, reinvestment risk, liquidity risk, and interest rate risk. At June 30, 2017 , our $199.7 million securities portfolio consisted primarily of U.S. government agency securities and mortgage-backed securities, all held as available for sale. We currently do not have any investments held to maturity or for trading.
These securities are of high quality, possess minimal credit risk, and have an aggregate market value in excess of total amortized cost as of June 30, 2017 . For more information, please see Item 7 "Management's Discussion and Analysis of Financial Condition and Results of Operations - Asset/Liability Management" and Note 3 of the Notes to Consolidated Financial Statements contained in Item 8 in this report.
The Company began purchasing commercial paper during fiscal 2015 in conjunction with its short-term leverage strategy, to take advantage of higher returns with relatively low risk, yet remain highly liquid. The commercial paper balance at June 30, 2017 was $149.9 million . For more information, please see Item 7 "Management's Discussion and Analysis of Financial Condition and Results of Operations - Comparison of Financial Condition at June 30, 2017 and June 30, 2016."
We do not currently participate in hedging programs, stand-alone contracts for interest rate caps, floors or swaps, or other activities involving the use of off-balance sheet derivative financial instruments and have no present intention to do so. Further, we do not invest in securities which are not rated investment grade.
As a member of the FHLB of Atlanta, we had $32.1 million in stock of the FHLB of Atlanta at June 30, 2017 . For the years ended June 30, 2017 and 2016 , we received $1.3 million and $1.1 million, respectively, in dividends from the FHLB of Atlanta. As a member bank of the Federal Reserve, the Bank is required to maintain stock in the Federal Reserve Bank of Richmond ("FRB"). At June 30, 2017 we had $7.3 million in FRB stock. For the years ended June 30, 2017 and 2016 , we received $383,000 and $370,000, respectively, in dividends from the FRB.
The following table sets forth the composition of our securities portfolio and other investments at the dates indicated. All securities at the dates indicated have been classified as available for sale. At June 30, 2017 , our securities portfolio did not contain securities of any issuer with an aggregate book value in excess of 10% of our equity capital, excluding those issued by the United States government or its agencies or United States government sponsored entities.
| At June 30, | ||||||||||||||||||||||
| 2017 |
| 2016 |
| 2015 | ||||||||||||||||||
| Book Value |
| Fair Value |
| Book Value |
| Fair Value |
| Book Value |
| Fair Value | ||||||||||||
| (In thousands) | ||||||||||||||||||||||
Securities available for sale: |
|
|
|
|
|
|
|
|
|
|
| ||||||||||||
U.S. government agencies | $ | 65,947 | |
| $ | 65,830 | |
| $ | 77,356 | |
| $ | 77,980 | |
| $ | 115,683 | |
| $ | 116,071 | |
Mortgage-backed securities | 92,841 | |
| 92,971 | |
| 95,668 | |
| 97,408 | |
| 120,294 | |
| 120,809 | | ||||||
Municipal bonds | 34,135 | |
| 34,510 | |
| 16,242 | |
| 17,234 | |
| 16,359 | |
| 16,678 | | ||||||
Corporate bonds | 6,267 | |
| 6,293 | |
| 7,773 | |
| 7,967 | |
| 3,889 | |
| 3,985 | | ||||||
Equity securities | 63 | |
| 63 | |
| 63 | |
| 63 | |
| 63 | |
| 63 | | ||||||
Total securities available for sale | 199,253 | |
| 199,667 | |
| 197,102 | |
| 200,652 | |
| 256,288 | |
| 257,606 | | ||||||
FHLB stock | 32,071 | |
| 32,071 | |
| 23,304 | |
| 23,304 | |
| 22,541 | |
| 22,541 | | ||||||
FRB stock | 7,284 | |
| 7,284 | |
| 6,182 | |
| 6,182 | |
| 6,170 | |
| 6,170 | | ||||||
Total securities | $ | 238,608 | |
| $ | 239,022 | |
| $ | 226,588 | |
| $ | 230,138 | |
| $ | 284,999 | |
| $ | 286,317 | |
26
The composition and contractual maturities of our investment securities portfolio as of June 30, 2017 , excluding equity securities, FHLB, and FRB stock, are indicated in the following table. Maturities are based on the final contractual payment dates, and do not reflect the impact of prepayments or early redemptions that may occur.
| June 30, 2017 | ||||||||||||||||||
| 1 year or less |
| Over 1 year to 5 years |
| Over 5 to 10 years |
| Over 10 years |
| Total | ||||||||||
Securities available for sale: | (Dollars in thousands) | ||||||||||||||||||
U.S. government agencies: |
|
|
|
|
|
|
|
|
| ||||||||||
Amortized cost | $ | - | |
| $ | 60,568 | |
| $ | 5,379 | |
| $ | - | |
| $ | 65,947 | |
Fair value | - | |
| 60,348 | |
| 5,482 | |
| - | |
| 65,830 | | |||||
Weighted average yield | - | % |
| 1.26 | % |
| 2.54 | % |
| - | % |
| 1.36 | % | |||||
Mortgage-backed securities |
|
|
|
|
|
|
|
|
| ||||||||||
Amortized cost | 1 | |
| 4,832 | |
| 20,969 | |
| 67,039 | |
| 92,841 | | |||||
Fair value | 1 | |
| 4,817 | |
| 20,919 | |
| 67,234 | |
| 92,971 | | |||||
Weighted average yield | 1.34 | % |
| 1.50 | % |
| 1.87 | % |
| 2.28 | % |
| 2.15 | % | |||||
Municipal bonds |
|
|
|
|
|
|
|
|
| ||||||||||
Amortized cost | 1,429 | |
| 12,896 | |
| 9,451 | |
| 10,359 | |
| 34,135 | | |||||
Fair value | 1,429 | |
| 12,963 | |
| 9,692 | |
| 10,426 | |
| 34,510 | | |||||
Weighted average yield | 1.54 | % |
| 2.22 | % |
| 3.28 | % |
| 3.05 | % |
| 2.80 | % | |||||
Corporate bonds |
|
|
|
|
|
|
|
|
| ||||||||||
Amortized cost | - | |
| 1,561 | |
| 4,706 | |
| - | |
| 6,267 | | |||||
Fair value | - | |
| 1,638 | |
| 4,655 | |
| - | |
| 6,293 | | |||||
Weighted average yield | - | % |
| 3.88 | % |
| 2.57 | % |
| - | % |
| 3.12 | % | |||||
Total securities |
|
|
|
|
|
|
|
|
| ||||||||||
Amortized cost | $ | 1,430 | | | $ | 79,857 | | | $ | 40,505 | | | $ | 77,398 | | | $ | 199,190 | |
Fair value | $ | 1,430 | | | $ | 79,766 | | | $ | 40,748 | | | $ | 77,660 | | | $ | 199,604 | |
Weighted average yield | 1.54 | % |
| 1.48 | % |
| 2.37 | % |
| 2.38 | % |
| 2.03 | % | |||||
Sources of Funds
General. Our sources of funds are primarily deposits, borrowings, payments of principal and interest on loans, and funds provided from operations. Deposits increased $245.8 million, or 13.7%, to $2.0 billion at June 30, 2017 as compared to $1.8 billion at June 30, 2016, mainly as a result of the TriSummit acquisition, which increased deposits by $280.2 million.
Deposits. We offer a variety of deposit accounts with a wide range of interest rates and terms to both consumers and businesses. Our deposits consist of savings, money market and demand accounts, and certificates of deposit ("CDs"). We solicit deposits primarily in our market areas. At June 30, 2017 , 2016 and 2015 , we had $16.8 million, $13.6 million, and $14.5 million in brokered deposits, respectively, which included certificates of deposit made under our participation in the Certificate of Deposit Account Registry Service® ("CDARS"). Through CDARS, we can provide a depositor the ability to place up to $50.0 million on deposit with us while receiving FDIC insurance on the entire deposit by placing customer funds in excess of the FDIC deposit limits with other financial institutions in the CDARS network. In return, these financial institutions place customer funds with us on a reciprocal basis. As of June 30, 2017 , core deposits, which we define as our non-certificate or non-time deposit accounts, represented approximately 77.4% of total deposits.
We primarily rely on competitive pricing policies, marketing, and customer service to attract and retain deposits. The flow of deposits is influenced significantly by general economic conditions, changes in money market and prevailing interest rates and competition. The variety of deposit accounts we offer has allowed us to be competitive in obtaining funds and to respond with flexibility to changes in consumer demand. We have become more susceptible to short-term fluctuations in deposit flows as customers have become more interest rate conscious. We try to manage the pricing of our deposits in keeping with our asset/liability management, liquidity and profitability objectives, subject to competitive factors. Based on our experience, we believe that our deposits are relatively stable sources of funds. Despite this stability, our ability to attract and maintain these deposits and the rates paid on them has been and will continue to be significantly affected by market conditions.
Approximately 22.6% of our total deposits are comprised of CDs. Our liquidity could be reduced if a significant amount of CDs, maturing within a short period of time, were not renewed. Historically, a significant portion of our CDs remain with us after they mature and we believe that this will continue. However, the need to retain these time deposits could result in an increase in our cost of funds.
27
The following table sets forth our deposit flows during the periods indicated.
| Years Ended June 30, | ||||||||||
(Dollars in thousands) | 2017 |
| 2016 |
| 2015 | ||||||
Beginning balance | $ | 1,802,696 | |
| $ | 1,872,126 | |
| $ | 1,583,047 | |
Deposits acquired from business combination | 280,234 | |
| - | |
| 422,596 | | |||
Net deposits withdrawals | (39,067 | ) |
| (73,961 | ) |
| (138,409 | ) | |||
Interest credited | 4,588 | |
| 4,531 | |
| 4,892 | | |||
Ending balance | $ | 2,048,451 | |
| $ | 1,802,696 | |
| $ | 1,872,126 | |
Net increase (decrease) | $ | 245,755 | |
| $ | (69,430 | ) |
| $ | 289,079 | |
Percent increase (decrease) | 13.63 | % |
| (3.71 | )% |
| 18.26 | % | |||
The following table sets forth the dollar amount of deposits in the various types of deposit programs offered by us at the dates indicated.
| 2017 |
| 2016 |
| 2015 | |||||||||||||||
| Amount |
| Percent of Total |
| Amount |
| Percent of Total |
| Amount |
| Percent of Total | |||||||||
(Dollars in thousands) |
| |||||||||||||||||||
Transaction and Savings Deposits: |
|
|
|
|
|
|
|
|
|
|
| |||||||||
Interest-bearing checking | $ | 469,377 | |
| 22.91 | % |
| $ | 403,574 | |
| 22.39 | % |
| $ | 387,379 | |
| 20.69 | % |
Noninterest-bearing checking | 310,172 | |
| 15.14 | |
| 225,336 | |
| 12.50 | |
| 204,050 | |
| 10.90 | | |||
Savings | 237,149 | |
| 11.58 | |
| 210,817 | |
| 11.69 | |
| 221,674 | |
| 11.84 | | |||
Money market | 569,607 | |
| 27.81 | |
| 520,320 | |
| 28.86 | |
| 481,948 | |
| 25.74 | | |||
Total non-certificates | $ | 1,586,305 | |
| 77.44 | % |
| $ | 1,360,047 | |
| 75.45 | % |
| $ | 1,295,051 | |
| 69.18 | % |
Certificates: |
| |
|
| |
|
| |
|
| |
|
| |
|
| | |||
0.00-0.99% | $ | 360,449 | |
| 17.60 | % |
| $ | 385,342 | |
| 21.38 | % |
| $ | 473,539 | |
| 25.29 | % |
1.00-1.99% | 89,279 | |
| 4.36 | |
| 40,841 | |
| 2.27 | |
| 64,126 | |
| 3.43 | | |||
2.00-2.99% | 2,755 | |
| 0.13 | |
| 2,760 | |
| 0.15 | |
| 24,915 | |
| 1.33 | | |||
3.00-3.99% | 5,234 | |
| 0.26 | |
| 9,275 | |
| 0.51 | |
| 10,065 | |
| 0.54 | | |||
4.00-4.99% | 4,427 | |
| 0.22 | |
| 4,427 | |
| 0.25 | |
| 4,426 | |
| 0.24 | | |||
5.00% and over | 2 | |
| - | |
| 4 | |
| - | |
| 4 | |
| - | | |||
Total certificates | $ | 462,146 | |
| 22.56 | % |
| $ | 442,649 | |
| 24.55 | % |
| $ | 577,075 | |
| 30.82 | % |
Total deposits | $ | 2,048,451 | |
| 100.00 | % |
| $ | 1,802,696 | |
| 100.00 | % |
| $ | 1,872,126 | |
| 100.00 | % |
28
The following table shows rate and maturity information for our CDs at June 30, 2017.
| 0.00- 0.99% |
| 1.00- 1.99% |
| 2.00- 2.99% |
| 3.00- 3.99% |
| 4.00- 4.99% |
| 5.00% or greater |
| Total |
| Percent of Total | |||||||||||||||
| (In thousands) | |||||||||||||||||||||||||||||
Quarter ending: |
|
|
|
|
|
|
|
|
|
|
|
|
|
|
| |||||||||||||||
September 30, 2017 | $ | 142,528 | |
| $ | 26,071 | |
| $ | - | |
| $ | 3 | |
| $ | - | |
| $ | - | |
| $ | 168,602 | |
| 36.6 | % |
December 31, 2017 | 54,153 | |
| 6,400 | |
| - | |
| - | |
| - | |
| - | |
| 60,553 | |
| 13.1 | | |||||||
March 31, 2018 | 40,810 | |
| 7,606 | |
| - | |
| 94 | |
| - | |
| - | |
| 48,510 | |
| 10.5 | | |||||||
June 30, 2018 | 32,979 | |
| 23,065 | |
| - | |
| 53 | |
| 12 | |
| - | |
| 56,109 | |
| 12.1 | | |||||||
September 30, 2018 | 16,205 | |
| 3,770 | |
| - | |
| 98 | |
| - | |
| - | |
| 20,073 | |
| 4.3 | | |||||||
December 31, 2018 | 12,594 | |
| 1,503 | |
| 4 | |
| - | |
| - | |
| - | |
| 14,101 | |
| 3.1 | | |||||||
March 31, 2019 | 7,810 | |
| 2,499 | |
| - | |
| - | |
| - | |
| - | |
| 10,309 | |
| 2.2 | | |||||||
June 30, 2019 | 7,189 | |
| 4,504 | |
| - | |
| - | |
| - | |
| - | |
| 11,693 | |
| 2.5 | | |||||||
September 30, 2019 | 5,398 | |
| 2,493 | |
| - | |
| 2,746 | |
| 69 | |
| - | |
| 10,706 | |
| 2.3 | | |||||||
December 31, 2019 | 5,606 | |
| 3,377 | |
| - | |
| 1,408 | |
| - | |
| - | |
| 10,391 | |
| 2.2 | | |||||||
March 31, 2020 | 5,369 | |
| 1,538 | |
| - | |
| 812 | |
| - | |
| - | |
| 7,719 | |
| 1.7 | | |||||||
June 30, 2020 | 6,393 | |
| 451 | |
| 643 | |
| 20 | |
| - | |
| - | |
| 7,507 | |
| 1.6 | | |||||||
Thereafter | 23,415 | |
| 6,002 | |
| 2,108 | |
| - | |
| 4,346 | |
| 2 | |
| 35,873 | |
| 7.8 | | |||||||
Total | $ | 360,449 | |
| $ | 89,279 | |
| $ | 2,755 | |
| $ | 5,234 | |
| $ | 4,427 | |
| $ | 2 | |
| $ | 462,146 | |
| 100.0 | % |
Percent of total | 78.0 | % |
| 19.3 | % |
| 0.6 | % |
| 1.1 | % |
| 1.0 | % |
| - | % |
| 100.0 | % |
|
| ||||||||
The following table indicates the amount of our CDs by time remaining until maturity as of June 30, 2017 .
| Maturity |
|
| ||||||||||||||||
| 3 Months or Less |
| Over 3 to 6 Months |
| Over 6 to 12 Months |
| Over 12 Months |
| Total | ||||||||||
| (In thousands) | ||||||||||||||||||
CDs less than $100,000 | $ | 86,048 | |
| $ | 30,237 | |
| $ | 51,025 | |
| $ | 70,795 | |
| $ | 238,105 | |
CDs of $100,000 or more | 76,393 | |
| 27,017 | |
| 48,740 | |
| 56,371 | |
| 208,521 | | |||||
Public funds (1) | 6,161 | |
| 3,299 | |
| 4,854 | |
| 1,206 | |
| 15,520 | | |||||
Total certificates of deposit | $ | 168,602 | |
| $ | 60,553 | |
| $ | 104,619 | |
| $ | 128,372 | |
| $ | 462,146 | |
_______________________________
(1) | Deposits from government and other public entities. |
Borrowings . Although deposits are our primary source of funds, we may utilize borrowings to manage interest rate risk or as a cost-effective source of funds when they can be invested at a positive interest rate spread for additional capacity to fund loan demand according to our asset/liability management goals. Our borrowings consist of advances from the FHLB of Atlanta. In November 2014, management made a strategic decision to increase our borrowings of low-cost FHLB funds to generate additional net interest income with the proceeds, as well as dividend income from the required purchase of additional FHLB stock.
We may obtain advances from the FHLB of Atlanta upon the security of certain of our mortgage loans and mortgage-backed and other securities. These advances may be made pursuant to several different credit programs, each of which has its own interest rate, range of maturities and call features, and all long-term advances are required to provide funds for residential home financing. As of June 30, 2017 , we had $696.5 million in FHLB advances outstanding and the ability to borrow an additional $22.3 million. In addition to FHLB advances, at June 30, 2017 we had a $105.5 million line of credit with the FRB, subject to qualifying collateral, and $60.0 million available through lines of credit with three unaffiliated banks, none of which was outstanding at June 30, 2017. See Note 10 of the Notes to Consolidated Financial Statements included in Item 8 of this Form 10-K for more information about our borrowings.
29
The following tables set forth information regarding our borrowings at the end of and during the periods indicated.
| Year ended June 30, | ||||||||||
| 2017 |
| 2016 |
| 2015 | ||||||
| (Dollars in thousands) | ||||||||||
Maximum balance: |
| ||||||||||
Federal Home Loan Bank advances | $ | 696,500 | |
| $ | 507,000 | |
| $ | 475,000 | |
Average balances: |
|
|
|
|
| ||||||
Federal Home Loan Bank advances | $ | 576,749 | |
| $ | 482,576 | |
| $ | 245,464 | |
Weighted average interest rate: |
|
|
|
|
| ||||||
Federal Home Loan Bank advances | 0.63 | % |
| 0.31 | % |
| 0.20 | % | |||
| At June 30, | ||||||||||
| 2017 |
| 2016 |
| 2015 | ||||||
| (Dollars in thousands) | ||||||||||
Balance outstanding at end of period: |
|
|
|
|
| ||||||
Federal Home Loan Bank advances | $ | 696,500 | |
| $ | 491,000 | |
| $ | 475,000 | |
Weighted average interest rate: |
| |
|
| |
|
| | |||
Federal Home Loan Bank advances | 1.13 | % |
| 0.42 | % |
| 0.20 | % | |||
Subsidiary and Other Activities
HomeTrust Bank has one operating subsidiary, Western North Carolina Service Corporation ("WNCSC"), whose primary purpose is to own several office buildings in Asheville, North Carolina which are leased to HomeTrust Bank. Our capital investment in WNCSC as of June 30, 2017 was $931,000.
Employees
At June 30, 2017 , we had a total of 446 full-time employees and 40 part-time employees. Our employees are not represented by any collective bargaining group. Management considers its employee relations to be good. Management also considers our employees to be a great team of highly engaged, competent and caring people who ensure every day that our customers are "Ready For What's Next" in their financial life. Their performance creates word-of-mouth referrals that result in the growth of new customers and expanded customer relationships.
Internet Website
We maintain a website with the address www.hometrustbancshares.com. The information contained on our website is not included as a part of, or incorporated by reference into, this Annual Report on Form 10-K. Other than an investor's own Internet access charges, we make available free of charge through our website our Annual Report on Form 10-K, quarterly reports on Form 10-Q and current reports on Form 8-K, and amendments to these reports, as soon as reasonably practicable after we have electronically filed such material with, or furnished such material to, the SEC.
HOW WE ARE REGULATED
General. HomeTrust Bancshares, Inc. is subject to examination and supervision by, and is required to file certain reports with, the Federal Reserve. HomeTrust Bancshares, Inc. is also subject to the rules and regulations of the SEC under the federal securities laws.
The Bank is subject to examination and regulation primarily by the NCCOB and the Federal Reserve. This system of regulation and supervision establishes a comprehensive framework of activities in which the Bank may engage and is intended primarily for the protection of depositors and the FDIC deposit insurance fund. The Bank is periodically examined by the NCCOB and the Federal Reserve to ensure that it satisfies applicable standards with respect to its capital adequacy, assets, management, earnings, liquidity and sensitivity to market interest rates. The NCCOB and the Federal Reserve also regulates the branching authority of the Bank. The Bank's relationship with its depositors and borrowers is regulated by federal consumer protection laws. The CFPB issues regulations under those laws that the Bank must comply with. The Bank's relationship with its depositors and borrowers is also regulated by state laws with respect to certain matters, including the enforceability of loan documents.
On August 25, 2014, the Bank converted from a federal savings bank to a national bank. In connection with the conversion of the Bank, HomeTrust Bancshares, Inc. changed from a savings and loan holding company to a bank holding company, regulated under the Bank Holding Company Act ("BHCA"). On December 31, 2015, the Bank converted from a national bank to a North Carolina state-chartered bank and remained a member of the Federal Reserve System. Prior to December 31, 2015, the Bank was regulated by the Office of the Comptroller of the Currency. In connection with the charter change, the Company elected to be treated as a financial holding company by the Federal Reserve.
30
The following is a brief description of certain laws and regulations applicable to HomeTrust Bancshares, Inc. and the Bank. Descriptions of laws and regulations here and elsewhere in this report do not purport to be complete and are qualified in their entirety by reference to the actual laws and regulations. Legislation is introduced from time to time in the United States Congress that may affect the operations of HomeTrust Bancshares and the Bank. In addition, the regulations that govern us may be amended from time to time. Any such legislation or regulatory changes in the future could adversely affect our operations and financial condition.
Financial Regulatory Reform. The Dodd-Frank Act, which was enacted in July 2010, imposed new restrictions and an expanded framework of regulatory oversight for financial entities, including depository institutions and their holding companies.
The following summarizes significant aspects of the Dodd-Frank Act that may materially affect the operations and condition of HomeTrust Bank and HomeTrust Bancshares:
• | Dodd-Frank Act established the CFPB and empowered it to exercise broad regulatory, supervisory and enforcement authority with respect to both new and existing consumer financial protection laws. HomeTrust Bank is subject to consumer protection regulations issued by the CFPB, but as a smaller financial institution, HomeTrust Bank is generally subject to Federal Reserve supervision and enforcement with respect to its compliance with federal consumer financial protection laws and CFPB regulations. |
• | Bank holding companies are required to serve as a source of strength for their banking subsidiaries. |
• | The federal banking agencies were required to promulgate new rules on regulatory capital, for both depository institutions, and their holding companies. These are described below. |
• | The prohibition on payment of interest on demand deposits was repealed. |
• | Deposit insurance was permanently increased to $250,000. |
• | The deposit insurance assessment base for FDIC insurance became the depository institution's total average assets minus the sum of its average tangible equity during the assessment period, rather than the level of deposits. |
• | The minimum reserve ratio of the FDIC deposit insurance fund increased to 1.35% of estimated annual insured deposits or assessment base; however, the FDIC is directed to "offset the effect" of the increased reserve ratio for insured depository institutions with total consolidated assets of less than $10.0 billion. |
Regulation of HomeTrust Bank
The Bank is subject to regulation and oversight by the NCCOB and the Federal Reserve extending to all aspects of its operations, including but not limited to requirements concerning an allowance for loan losses, lending and mortgage operations, interest rates received on loans and paid on deposits, the payment of dividends to the Company, loans to officers and directors, mergers and acquisitions, capital, and the opening and closing of branches. See "- Current Capital Requirements for HomeTrust Bank," "-Limitations on Dividends and Other Capital Distributions" and "-New Capital Rules" for additional details.
As a state-chartered institution, the Bank is subject to periodic examinations by the NCCOB and the Federal Reserve. During these examinations, the examiners assess compliance with state banking regulations and the safety and soundness standards on such matters as loan underwriting and documentation, asset quality, earnings standards, internal controls and audit systems, interest rate risk exposure, and employee compensation and benefits. Any institution that fails to comply with these standards must submit a compliance plan.
The Bank is subject to a statutory lending limit on aggregate loans to one person or a group of persons combined because of certain relationships and common interests. That limit is generally equal to 15% of unimpaired capital and surplus, which was $49.0 million as of June 30, 2017. The limit is increased to 25% for loans fully secured by readily marketable collateral . The Bank has no lending relationships in excess of its lending limit.
The NCCOB and the Federal Reserve have enforcement responsibility over the Bank and the authority to bring actions against the Bank and certain institution-affiliated parties, including officers, directors, and employees, for violations of laws or regulations and for engaging in unsafe and unsound practices. Formal enforcement actions include the issuance of a capital directive or cease and desist order, civil money penalties, removal of officers and/or directors, and receivership or conservatorship of the institution.
Pursuant to the Dodd-Frank Act, federal banking and securities regulators issued final rules to implement Section 619 of the Dodd-Frank Act (the "Volcker Rule"). These rules became effective April 15, 2014, with a conformance period for certain features lasting until July 21, 2015. Generally, subject to a transition period and certain exceptions, the Volcker Rule restricts insured depository institutions and their affiliates from engaging in short-term proprietary trading of certain securities, investing in funds not registered with the SEC with collateral not entirely comprised of loans, and from engaging in hedging activities that do not hedge a specific identified risk.
Insurance of Accounts and Regulation by the FDIC. The deposit insurance fund of the FDIC insures deposit accounts in HomeTrust Bank up to $250,000 per separately insured deposit ownership right or category.
Under the FDIC's risk-based assessment system, insured institutions are assigned to one of four risk categories based on supervisory evaluations, regulatory capital levels and certain other risk factors. Rates are based on each institution's risk category and certain specified risk adjustments,
31
whereby stronger institutions pay lower rates while riskier institutions pay higher rates. Currently, assessment rates (inclusive of certain possible adjustments) range from 1.5 to 40.0 basis points of each institution's total average consolidated assets less average tangible equity (subject to upward adjustment for certain debt). The FDIC has authority to increase insurance assessments, and any significant increases would have an adverse effect on the operating expenses and results of operations of the Company. Management cannot predict what assessment rates will be in the future.
Insurance of deposits may be terminated by the FDIC upon a finding that an institution has engaged in unsafe or unsound practices, is in an unsafe or unsound condition to continue operations or has violated any applicable law, regulation, rule, order or condition imposed by the FDIC. We do not currently know of any practice, condition, or violation that may lead to termination of our deposit insurance.
Transactions with Related Parties. Federal laws strictly limit the ability of banks to engage in certain transactions with their affiliates, including their bank holding companies. Transactions between the Bank and its affiliates are required to be on terms as favorable to the Bank as transactions with non-affiliates. Certain of these transactions, such as loans to an affiliate, are restricted to a percentage of the Bank's capital, and loans to affiliates require eligible collateral in specified amounts. HomeTrust Bancshares, Inc is an affiliate of the Bank.
Federal law generally prohibits loans by HomeTrust Bancshares to its executive officers and directors, but there is a specific exception for loans made by HomeTrust Bank to its executive officers and directors in compliance with federal banking laws. However, HomeTrust Bank's authority to extend credit to its executive officers, directors and 10% shareholders ("insiders"), as well as entities those insiders control, is limited. The individual and aggregate amounts of loans that HomeTrust Bank may make to insiders are based, in part, on HomeTrust Bank's capital level and require that certain board approval procedures be followed. Such loans are required to be made on terms substantially the same as those offered to unaffiliated individuals and not involve more than the normal risk of repayment. There is an exception for loans made pursuant to a benefit or compensation program that is widely available to all employees of the institution and does not give preference to insiders over other employees. Loans to executive officers are subject to additional limitations based on the type of loan involved.
Current Capital Requirements for HomeTrust Bank. The Bank is required to maintain specified levels of regulatory capital under federal banking regulations. The capital adequacy requirements are quantitative measures established by regulation that require the Bank to maintain minimum amounts and ratios of capital. Failure to meet minimum capital requirements can initiate certain mandatory and possibly additional discretionary actions by bank regulators that, if undertaken, could have a direct material effect on the Company's financial statements.
Institutions that are not well capitalized are subject to certain restrictions on brokered deposits and interest rates on deposits. Under certain circumstances, regulators are required to take certain actions against banks that fail to meet the minimum ratios for an "adequately capitalized institution." Any such institution must submit a capital restoration plan and, until such plan is approved may not increase its assets, acquire another depository institution, establish a branch or engage in any new activities, or make capital distributions.
Effective January 1, 2015 (with some changes transitioned into full effectiveness by January 2019), the Bank became subject to new capital regulations adopted by the Federal Reserve and adopted by the NCCOB, which created a new required ratio for common equity Tier 1 ("CET1") capital, increased the minimum leverage and Tier 1 capital ratios, changed the risk-weightings of certain assets for purposes of the risk-based capital ratios, created an additional capital conservation buffer over the required capital ratios, and changed what qualifies as capital for purposes of meeting the capital requirements. These regulations implement the regulatory capital reforms required by the Dodd Frank Act and the "Basel III" requirements.
Under the new capital regulations, the minimum capital level requirements applicable to the Company and the Bank are (i) a CETI capital ratio of 4.5%; (ii) a Tier 1 capital ratio of 6.0%; (iii) a total capital ratio of 8.0%; and (iv) a Tier 1 leverage ratio of 4.0% for all financial institutions. CET1 generally consists of common stock and retained earnings. Tier 1 capital generally consists of CET1 and noncumulative perpetual preferred stock. Tier 2 capital generally consists of other preferred stock and subordinated debt meeting certain conditions plus an amount of the allowance for loan and lease losses up to 1.25% of assets. Total capital is the sum of Tier 1 and Tier 2 capital.
In addition to the capital requirements, there are a number of changes in what constitutes regulatory capital, subject to a certain transition period. These changes include the phasing-out of certain instruments as qualifying capital. At June 30, 2017 the Bank did not have any of these instruments. Mortgage servicing and deferred tax assets over designated percentages of CET1 are deducted from capital, subject to a transition period ending December 31, 2017. Because of our asset size, we are not considered an advanced approaches banking organization and have elected to permanently opt-out of the inclusion of unrealized gains and losses on available for sale debt and equity securities in our capital calculations.
For purposes of determining risk-based capital, assets and certain off-balance sheet items are risk-weighted from 0% to 1,250%, depending on the risk characteristics of the asset or item. The new regulations make certain changes in the risk-weighting of assets to better reflect credit risk and other risk exposure compared to the earlier capital rules. These include a 150% risk weight (up from 100%) for certain high volatility commercial real estate acquisition, development and construction loans and for non residential mortgage loans that are 90 days past due or otherwise in nonaccrual status; a 20% (up from 0%) credit conversion factor for the unused portion of a commitment with an original maturity of one year or less that is not unconditionally cancellable (currently set at 0%); and a 250% risk weight (up from 100%) for mortgage servicing and deferred tax assets that are not deducted from capital.
As noted above, in addition to the minimum CET1, Tier 1 and total capital ratios, the Bank must maintain a capital conservation buffer consisting of additional CET1 capital greater than 2.5% of risk-weighted assets above the required minimum levels in order to avoid limitations on paying dividends, engaging in share repurchases, and paying discretionary bonuses based on percentages of eligible retained income that could be utilized for such actions. This new capital conservation buffer requirement began to be phased in starting in January 2016 at 0.625% of risk-
32
weighted assets and will increase each year until fully implemented to an amount equal to 2.5% of risk-weighted assets in January 2019. As of June 30, 2017, the conservation buffer was 1.25%.
To be consider "well capitalized," a depository institution must have a Tier 1 risk-based capital ratio of at least 8%, a total risk-based capital ratio of at least 10%, a CET1 capital ratio of at least 6.5% and a leverage ratio of at least 5% and not be subject to an individualized order, directive or agreement under which its primary federal banking regulator requires it to maintain a specific capital level. As of June 30, 2017, HomeTrust Bank met the requirements to be "well capitalized" and met the fully phased-in capital conservation buffer requirement. For additional information regarding the Bank's required and actual capital levels at June 30, 2017, see Note 18 of the Notes to Consolidated Financial Statements included in contained in Item 8 in this report.
Federal Home Loan Bank System. HomeTrust Bank is a member of the FHLB of Atlanta, one of 11 regional FHLBs that administer the home financing credit function of financial institutions. The FHLBs are subject to the oversight of the Federal Housing Finance Agency ("FHFA") and each FHLB serves as a reserve or central bank for its members within its assigned region. The FHLBs are funded primarily from proceeds derived from the sale of consolidated obligations of the FHLB System and makes loans or advances to members in accordance with policies and procedures established by the Board of Directors of the FHLB, which are subject to the oversight of the FHFA. All advances from the FHLB are required to be fully secured by sufficient collateral as determined by the FHLB. In addition, all long-term advances are required to provide funds for residential home financing. See "Business -Sources of Funds - Borrowings."
At June 30, 2017, the Bank held $32.1 million in FHLB stock that was in compliance with the holding requirements. The FHLB pays dividends quarterly, and HomeTrust Bank received $1.3 million in dividends during the year ended June 30, 2017.
The FHLBs continue to contribute to low- and moderately-priced housing programs through direct loans or interest subsidies on advances targeted for community investment and low- and moderate-income housing projects. These contributions have adversely affected the level of FHLB dividends paid and could continue to do so in the future. These contributions could also have an adverse effect on the value of FHLB stock in the future. A reduction in value of the Bank's FHLB stock may result in a decrease in net income and possibly capital.
Commercial Real Estate Lending Concentrations. The federal banking agencies have issued guidance on sound risk management practices for concentrations in commercial real estate lending. The particular focus is on exposure to commercial real estate loans that are dependent on the cash flow from the real estate held as collateral and that are likely to be sensitive to conditions in the commercial real estate market (as opposed to real estate collateral held as a secondary source of repayment or as an abundance of caution). The purpose of the guidance is not to limit a bank's commercial real estate lending but to guide banks in developing risk management practices and capital levels commensurate with the level and nature of real estate concentrations. The guidance directs the Federal Reserve and other bank regulatory agencies to focus their supervisory resources on institutions that may have significant commercial real estate loan concentration risk. A bank that has experienced rapid growth in commercial real estate lending, has notable exposure to a specific type of commercial real estate loan, or is approaching or exceeding the following supervisory criteria may be identified for further supervisory analysis with respect to real estate concentration risk:
• | Total reported loans for construction, land development and other land represent 100% or more of the bank's total regulatory capital; or |
• | Total commercial real estate loans (as defined in the guidance) represent 300% or more of the bank's total regulatory capital and the outstanding balance of the bank's commercial real estate loan portfolio has increased 50% or more during the prior 36 months. |
The guidance provides that the strength of an institution's lending and risk management practices with respect to such concentrations will be taken into account in supervisory guidance on evaluation of capital adequacy. As of June 30, 2017, HomeTrust Bank's aggregate recorded loan balances for construction, land development and land loans were 75.2% of regulatory capital. In addition, at June 30, 2017, HomeTrust Bank's loans on commercial real estate, as defined by the guidance, were 233.5% of regulatory capital.
Community Reinvestment and Consumer Protection Laws. In connection with its deposit-taking, lending and other activities, the Bank is subject to a number of federal laws designed to protect consumers and promote lending to various sectors of the economy and population. The CFPB issues regulations and standards under these federal consumer protection laws, which include the Equal Credit Opportunity Act, the Truth-in-Lending Act, the Home Mortgage Disclosure Act, the Real Estate Settlement Procedures Act and others. The CFPB has promulgated a number of proposed and final regulations under these laws that will affect our consumer businesses. Among these regulatory initiatives, are final regulations setting "ability to repay" and "qualified mortgage" standards for residential mortgage loans and establishing new mortgage loan servicing and loan originator compensation standards. In addition, customer privacy regulations limit the ability of the Bank to disclose nonpublic consumer information to non-affiliated third parties. These regulations require disclosure of privacy policies and allow consumers to prevent certain personal information from being shared with non-affiliated parties.
The CRA requires that the Federal Reserve assess the Bank's record in meeting the credit needs of the communities it serves, especially low and moderate income neighborhoods. Under the CRA, institutions are assigned a rating of "outstanding," "satisfactory," "needs to improve," or "substantial non-compliance." The Bank received an "outstanding" rating in its most recent CRA evaluation.
Bank Secrecy Act / Anti-Money Laundering Laws. The Bank is subject to the Bank Secrecy Act and other anti-money laundering laws and regulations, including the USA PATRIOT Act of 2001. These laws and regulations require the Bank to implement policies, procedures, and controls to detect, prevent, and report money laundering and terrorist financing and to verify the identity of their customers. Violations of these requirements can result in substantial civil and criminal sanctions. In addition, provisions of the USA PATRIOT Act require the federal financial institution regulatory agencies to consider the effectiveness of a financial institution's anti-money laundering activities when reviewing mergers and acquisitions.
33
Limitations on Dividends. NCCOB and the Federal Reserve regulations impose various restrictions on the ability of the Bank to pay dividends. The Bank generally may pay dividends during any calendar year in an amount up to 100% of net income for the year-to-date plus retained net income for the two preceding years, without the approval of the Federal Reserve. If the Bank proposes to pay a dividend that will exceed this limitation, it must obtain the Federal Reserve's prior approval. The Federal Reserve may object to a proposed dividend based on safety and soundness concerns. No insured depository institution may pay a dividend if, after paying the dividend, the institution would be undercapitalized. In addition, as noted above, if the Bank does not have the required capital conservation buffer, its ability to pay dividends to HomeTrust Bancshares, Inc. will be limited.
Holding Company Regulation
As a bank holding company under the BHCA, HomeTrust Bancshares, Inc. is subject to regulation, supervision, and examination by the Federal Reserve. The Federal Reserve has enforcement authority with respect to HomeTrust Bancshares, Inc. similar to its enforcement authority over the Bank. We are required to file quarterly reports with the Federal Reserve and provide additional information as the Federal Reserve may require. The Federal Reserve may examine us, and any of our subsidiaries, and charge us for the cost of the examination. The Federal Reserve also has extensive enforcement authority over bank holding companies, including, among other things, the ability to assess civil money penalties, to issue cease and desist or removal orders and to require that a holding company divest subsidiaries (including its bank subsidiaries). In general, enforcement actions may be initiated for violations of law and regulations and unsafe or unsound practices. HomeTrust Bancshares, Inc. is also required to file certain reports with, and otherwise comply with the rules and regulations of the SEC.
The Bank Holding Company Act. Under the BHCA, we are supervised by the Federal Reserve. The Federal Reserve has a policy that a bank holding company is required to serve as a source of financial and managerial strength to its subsidiary banks and may not conduct its operations in an unsafe or unsound manner. In addition, the Dodd-Frank Act and earlier Federal Reserve policy provide that a bank holding company should serve as a source of strength to its subsidiary banks by having the ability to provide financial assistance to its subsidiary banks during periods of financial distress to the banks. A bank holding company's failure to meet its obligation to serve as a source of strength to its subsidiary banks will generally be considered by the Federal Reserve to be an unsafe and unsound banking practice or a violation of the Federal Reserve's regulations or both. No regulations have yet been proposed by the Federal Reserve to implement the source of strength doctrine required by the Dodd-Frank Act. HomeTrust Bancshares, Inc. and any subsidiaries that it may control are considered "affiliates" within the meaning of the Federal Reserve Act, and transactions between HomeTrust Bancshares, Inc. and affiliates are subject to numerous restrictions. With some exceptions, HomeTrust Bancshares, Inc. and its subsidiaries are prohibited from tying the provision of various services, such as extensions of credit, to other services offered by HomeTrust Bancshares, Inc. or by its affiliates.
Permissible Activities. The business activities of HomeTrust Bancshares, Inc. are generally limited to those activities permissible for bank holding companies under Section 4(c)(8) of the BHCA, those permitted for a financial holding company under Section 4(f) of the BHCA, and certain additional activities authorized by regulation. The BHCA generally prohibits a financial holding company from acquiring direct or indirect ownership or control of more than 5% of the voting shares of any company which is not a bank or bank holding company. A bank holding company must obtain Federal Reserve approval before acquiring directly or indirectly, ownership or control of any voting shares of another bank or bank holding company if, after such acquisition, it would own or control more than 5% of such shares (unless it already owns or controls the majority of such shares).
Capital Requirements for HomeTrust Bancshares. As a bank holding company, HomeTrust Bancshares, Inc. is subject to the minimum regulatory capital requirements established by the Federal Reserve regulation, which generally are the same as the capital requirements for the Bank. These capital requirements include provisions that might impact the ability of the Company to pay dividends to its stockholders or repurchase its shares. For a description of the capital regulations, see " Regulation of HomeTrust Bank-Current Capital Requirements for HomeTrust Bank" and Note 18 of the Notes to Consolidated Financial Statements included in contained in Item 8 in this report.
At June 30, 2017, the HomeTrust Bancshares, Inc. exceeded its minimum regulatory capital requirements under Federal Reserve regulations.
Federal Securities Law. The stock of HomeTrust Bancshares, Inc. is registered with the SEC under the Securities Exchange Act of 1934, as amended (the "Exchange Act"). HomeTrust Bancshares, Inc. is subject to the information, proxy solicitation, insider trading restrictions, and other requirements of the SEC under the Exchange Act.
The SEC has adopted regulations and policies applicable to a registered company under the Exchange Act that seek to increase corporate responsibility, provide for enhanced penalties for accounting and auditing improprieties and protect investors by improving the accuracy and reliability of corporate disclosures in SEC filings. These regulations and policies include very specific additional disclosure requirements and mandate corporate governance practices.
On April 5, 2012, the JOBS Act was signed into law, which contains provisions that, among other things, reduce certain reporting requirements for qualifying public companies. We are an "emerging growth company," as defined in Section 2(a) of the Securities Act of 1933, (the "Securities Act"), as modified by the JOBS Act. We are eligible to take advantage of certain exemptions from various reporting requirements that are applicable to other public companies that are not emerging growth companies, including, but not limited to, an exemption from the requirement of holding a non-binding advisory vote on executive compensation. In addition, we will not be subject to certain requirements of Section 404 of the Sarbanes-Oxley Act of 2002 (the "Sarbanes Oxley Act"), including the additional level of review of our internal control over financial reporting as may occur when outside auditors attest as to our internal control over financial reporting. As a result, our stockholders may not have access to certain information they may deem important. Further, we are eligible to delay adoption of new or revised accounting standards applicable to public companies and we may take advantage of the benefits of this extended transition period, although to date we have not done
34
so. Accordingly, our financial statements may not be comparable to companies that comply with such new or revised accounting standards. These exemptions will apply for a period of five years following the completion of our initial public offering or until we are no longer an "emerging growth company," whichever is earlier. The five year exemption period will expire on June 30, 2018.
On October 28, 2015, the Auditing Standards Board of the American Institute of Certified Public Accountants ("AICPA") issued Statement on Auditing Standards ("SAS") No. 130 - An Audit of Internal Control Over Financial Reporting That Is Integrated With an Audit of Financial Statement. Under SAS 130, our auditors are required to opine on the effectiveness of internal controls over financial reporting for the fiscal year ended June 30, 2017. Prior to SAS 130 and our status as an emerging growth company, our auditors had the option to examine and report on management's assertion about the effectiveness of internal control over financial reporting.
Dividends. The Federal Reserve has issued a policy statement on the payment of cash dividends by bank holding companies, which expresses its view that although there are no specific regulations restricting dividend payments by bank holding companies other than state corporate laws, a bank holding company must maintain an adequate capital position and generally should not pay cash dividends unless the company's net income for the past year is sufficient to fully fund the cash dividends and that the prospective rate of earnings appears consistent with the company's capital needs, asset quality, and overall financial condition. The Federal Reserve policy statement also indicates that it would be inappropriate for a company experiencing serious financial problems to borrow funds to pay dividends. As described above under "Regulation of HomeTrust Bank-Current Capital Requirements for HomeTrust Bank," the capital conservation buffer requirement can also restrict HomeTrust Bancshares, Inc. and the Bank's ability to pay dividends.
Stock Repurchases. A bank holding company, except for certain "well-capitalized" and highly rated bank holding companies, is required to give the Federal Reserve prior written notice of any purchase or redemption of its outstanding equity securities if the gross consideration for the purchase or redemption, when combined with the net consideration paid for all such purchases or redemptions during the preceding twelve months, is equal to 10% or more of its consolidated net worth. The Federal Reserve may disapprove such a purchase or redemption if it determines that the proposal would constitute an unsafe or unsound practice or would violate any law, regulation, Federal Reserve order or any condition imposed by, or written agreement with, the Federal Reserve.
Legislative and Regulatory Proposals. Any changes in the extensive regulatory scheme to which the HomeTrust Bancshares, Inc. or the Bank is and will be subject, whether by any of the federal banking agencies or Congress, or the North Carolina legislature or NCCOB, could have a material effect on the Company or HomeTrust Bank, and HomeTrust Bancshares, Inc. and the Bank cannot predict what, if any, future actions may be taken by legislative or regulatory authorities or what impact such actions may have.
Federal Taxation
General . HomeTrust Bancshares Inc. and the Bank are subject to federal income taxation in the same general manner as other corporations, with some exceptions discussed below. The following discussion of federal taxation is intended only to summarize material federal income tax matters and is not a comprehensive description of the tax rules applicable to HomeTrust Bancshares and HomeTrust.
Method of Accounting . For federal income tax purposes, the Company currently reports its income and expenses on the accrual method of accounting and uses a fiscal year ending on June 30th for filing its federal income tax return. The Small Business Protection Act of 1996 eliminated the use of the reserve method of accounting for bad debt reserves by savings institutions, effective for taxable years beginning after 1995.
Minimum Tax . The Internal Revenue Code ("IRC") imposes an alternative minimum tax at a rate of 20% on a base of regular taxable income plus certain tax preferences, called alternative minimum taxable income. The alternative minimum tax is payable to the extent such alternative minimum taxable income is in excess of the regular tax. Net operating losses can offset no more than 90% of alternative minimum taxable income. Certain payments of alternative minimum tax may be used as credits against regular tax liabilities in future years. At June 30, 2017 , we had alternative minimum tax credit carryforwards of approximately $4.4 million.
Net Operating Loss Carryovers . A financial institution may carryback net operating losses to the preceding two taxable years and forward to the succeeding 20 taxable years. This provision applies to losses incurred in taxable years beginning after August 6, 1997. In 2009, IRC 172 (b) (1) was amended to allow businesses to carry back losses incurred in 2008 and 2009 for up to five years to offset 50% of the available income from the fifth year and 100% of the available income for the other four years. At June 30, 2017 , we had $62.4 million of net operating loss carryforwards for federal income tax purposes.
Corporate Dividends-Received Deduction. HomeTrust Bancshares, Inc. will elect to file a consolidated return with the Bank. As a result, any dividends HomeTrust Bancshares, Inc. receives from the Bank will not be included as income to HomeTrust Bancshares, Inc. The corporate dividends-received deduction is 100%, or 80% in the case of dividends received from corporations with which a corporate recipient does not file a consolidated tax return, depending on the level of stock ownership of the payer of the dividend.
State Taxation
North Carolina. On July 24, 2013, The Tax Simplification and Reduction Act of 2013 was signed into law. With this act, corporate income tax rates in North Carolina were reduced as net General Fund tax collection revenues goals were met. For tax years beginning on or after January 1, 2017, 2016, and 2015 the tax rate was 3%, 4%, and 5%, respectively. In June 2017, the state announced an additional reduction in the tax rate to 2.5% beginning on January 1, 2019. This rate reduction is not contingent on any revenue goals. The decrease in the North Carolina corporate tax rate will continue to decrease the deferred tax assets currently recorded on our balance sheet with a corresponding increase to our income tax provision, as temporary tax differences are reversed at lower state tax rates.
35
If a corporation in North Carolina does business in North Carolina and in one or more other states, North Carolina taxes a fraction of the corporation's income based on the amount of sales, payroll, and property it maintains within North Carolina. North Carolina franchise tax is levied on business corporations at the rate of $1.50 per $1,000 of the largest of the following three alternate bases: (i) the amount of the corporation's capital stock, surplus, and undivided profits apportionable to the state; (ii) 55% of the appraised value of the corporation's property in the state subject to local taxation; or (iii) the book value of the corporation's real and tangible personal property in the state less any outstanding debt that was created to acquire or improve real property in the state.
Any cash dividends, in excess of a certain exempt amount, that would be paid with respect to HomeTrust Bancshares common stock to a shareholder (including a partnership and certain other entities) who is a resident of North Carolina will be subject to the North Carolina income tax. Any distribution by a corporation from earnings according to percentage ownership is considered a dividend, and the definition of a dividend for North Carolina income tax purposes may not be the same as the definition of a dividend for federal income tax purposes. A corporate distribution may be treated as a dividend for North Carolina income tax purposes if it is paid from funds that exceed the corporation's earned surplus and profits under certain circumstances.
South Carolina. The state of South Carolina requires banks to file a bank tax return. As a multi-state bank, we pay taxes on the portion of revenue generated within the state. In 2017 and 2016 the tax rate was 4.5%.
Tennessee . The state of Tennessee requires banks to file a franchise and excise tax form for financial institutions. The franchise tax is based on the portion of revenue generated in the state, the net worth of the Bank, and the applicable franchise tax, which was $0.25 per $100 in 2017 and 2016. The excise tax is based on the taxable income (as defined by the state), the portion of revenue generated in the state, and the applicable excise tax, which was 6.5% in 2017 and 2016.
Virginia . The state of Virginia requires banks to file a bank franchise tax. The tax is based on the portion of capital deployed within the state and county level (as defined by the state) and taxed at $1 per $100 of taxable value. New banks are prorated based on the number of quarters in operation in the state during the year.
EXECUTIVE OFFICERS
The following individuals are executive officers of HomeTrust Bancshares and HomeTrust Bank and hold the offices set forth below opposite their names.
Name |
| Age (1) |
| Position |
Dana L. Stonestreet |
| 63 |
| Chairman, President and Chief Executive Officer |
Tony J. VunCannon |
| 52 |
| Executive Vice President, Chief Financial Officer and Treasurer |
Howard L. Sellinger |
| 64 |
| Executive Vice President and Chief Information Officer |
C. Hunter Westbrook |
| 54 |
| Executive Vice President and Chief Banking Officer |
Teresa White |
| 60 |
| Executive Vice President, Chief Administration Officer and Corporate Secretary |
Keith Houghton |
| 55 |
| Executive Vice President and Chief Credit Officer |
Parrish Little |
| 49 |
| Executive Vice President and Chief Risk Officer |
_________________________
(1) | As of June 30, 2017. |
Biographical Information. Set forth below is certain information regarding the executive officers of HomeTrust Bancshares and HomeTrust Bank. There are no family relationships among or between the executive officers.
Dana L. Stonestreet, Chairman and Chief Executive Officer . As part of the CEO succession plan for HomeTrust Bancshares, Inc. and the Bank, Mr. Stonestreet, who had been serving as President and Chief Operating Officer and as a director of HomeTrust Bank since 2008 and as President and Chief Operating Officer of HomeTrust Bancshares, Inc. since HomeTrust Bank's mutual-to-stock conversion, became co-Chief Executive Officer of HomeTrust Bancshares, Inc. and the Bank in 2013. Mr. Stonestreet became President, Chairman and Chief Executive Officer of HomeTrust Bancshares, Inc. and the Bank effective at the annual meeting in November 2013. Mr. Stonestreet joined HomeTrust Bank in 1989 as its Chief Financial Officer and was promoted to Chief Operating Officer in 2003. Mr. Stonestreet began his career with Hurdman & Cranston (an accounting firm that was later merged into KPMG) as a certified public accountant. Mr. Stonestreet serves as a director of the HUB Community Economic Development Alliance Board. In addition, Mr. Stonestreet has served as Chairman of the Asheville Chamber of Commerce and as a director for RiverLink, the YMCA, United Way, the North Carolina Bankers Association and other community organizations. In July 2017, Mr. Stonestreet was appointed to the North Carolina Banking Commission for a four-year term. Mr. Stonestreet's 28 years of service with HomeTrust Bank gives him in-depth knowledge of nearly all aspects of its operations. Mr. Stonestreet's accounting background and prior service as HomeTrust Bank's Chief Financial Officer also provide him with a strong understanding of the various financial matters brought before the Board.
Tony J. VunCannon, Executive Vice President, Chief Financial Officer, and Treasurer. Mr. VunCannon has served as HomeTrust Bank's Chief Financial Officer since July 2006. Mr. VunCannon joined the Bank in April 1992 as Controller; later becoming the Treasurer in March 1997 until July 2006 when he was named Chief Financial Officer. Prior to joining the Bank, Mr. VunCannon worked as an auditor in KPMG's Charlotte
36
office where his focus was in the community banking sector. Mr. VunCannon is a graduate of the University of North Carolina at Chapel Hill with a Bachelor of Science Degree in Business Administration/Accounting. He is also a Certified Public Accountant.
Howard L. Sellinger, Executive Vice President and Chief Information Officer . Mr. Sellinger has served as Chief Information Officer of HomeTrust Bank since July 1997. Mr. Sellinger joined HomeTrust Bank in 1975 as a management trainee. Mr. Sellinger became the Office Manager of the Skyland office from 1976 until 1978. His experience also includes being the Head of Mortgage Loan Operations with loan approval authority, the Head of Loan Servicing with workout approval authority, and was responsible for regulatory compliance in Lending and Deposit Operations for many years. In 1988, he was named Operations Manager and was promoted to Vice President and Chief Information Officer in 1997.
C. Hunter Westbrook, Executive Vice President and Chief Banking Officer . Mr. Westbrook joined HomeTrust Bank in June 2012 as our Chief Banking Officer. He began his career in banking with TCF Bank in Minneapolis and later joined TCF National Bank Illinois as Senior Vice President of Finance. In 2004 he was promoted to Executive Vice President of Retail Banking for Illinois, Wisconsin and Indiana markets that included 250 branches and $4 billion in deposits. He also served as President and Chief Executive Officer of First Community Bancshares in Texas, from 2006 to 2008, where he was responsible for repositioning the bank's retail operating model and implemented the bank's retail and corporate lending product offerings. In his most recent role, Mr. Westbrook served as President and Chief Executive Officer of Second Federal Savings and Loan Association of Chicago, from 2010 to 2012, where he significantly grew core operating revenue, net checking account balances, and repositioned the bank's entire product line.
Teresa White, Executive Vice President and Chief Administration Officer . Ms. White joined HomeTrust Bank in May 2011 as our Chief Administration Officer. Ms. White was also appointed as Corporate Secretary of HomeTrust Bank in December 2011. Prior to joining HomeTrust Bank, since 2006, Ms. White served as Senior Vice President, Chief of Human Resources and Training Officer for Capital Bank, Raleigh, North Carolina, a publicly held community bank with approximately $1.7 billion in assets. From 2005 to 2006, Ms. White served as Director, Corporate Human Resources, for Nash Finch Company, Edina, Minnesota, a leading food retail and distribution company. From 2002 to 2005, Ms. White served as Director of Human Resources for ConAgra Foods Snack Foods Group, Edina, Minnesota, a division of ConAgra Foods.
Keith Houghton, Executive Vice President and Chief Credit Officer. Mr. Houghton joined HomeTrust Bank in March of 2014 as our Chief Credit Officer. Mr. Houghton has more than 30 years of experience in the banking industry. For nearly 17 years, he held a variety of senior positions in the credit and lending areas with StellarOne Corporation, a Charlottesville, VA-based bank holding company with approximately $3 billion in assets, and its predecessors, until the sale of StellarOne to another bank in January 2014. The most recent of those positions was Chief Credit Risk Officer, which Mr. Houghton held since 2007.
Parrish Little, Executive Vice President and Chief Risk Officer. Mr. Little joined HomeTrust Bank in March 2015 as our Chief Risk Officer. Prior to joining HomeTrust Bank, Mr. Little served as Senior Vice President, Director of Risk Management from 2008 to 2013 and Chief Audit Executive in 2014 for First Citizens Bank and Trust, Columbia, South Carolina. From 1997 to 2007, he served in several leadership roles with Bank of America in the areas of internal audit and risk management.
Item 1A. Risk Factors
An investment in our common stock is subject to risks inherent in our business. Before making an investment decision, you should carefully consider the risks and uncertainties described below together with all of the other information included in this report. In addition to the risks and uncertainties described below, other risks and uncertainties not currently known to us or that we currently deem to be immaterial also may materially and adversely affect our business, financial condition and results of operations. The value or market price of our common stock could decline due to any of these identified or other risks, and you could lose all or part of your investment.
Risks Related to Our Business
Adverse economic conditions in the market areas we serve could adversely impact our earnings and could increase the credit risk associated with our loan portfolio.
Our primary market areas are concentrated in North Carolina (including the Asheville metropolitan area, the "Piedmont" region, Charlotte, Raleigh), South Carolina (Greenville), East Tennessee (including Kingsport/Johnson City/Bristol, Knoxville, and Morristown) and the Roanoke Valley area of Virginia. Adverse economic conditions in our market areas can reduce our rate of growth, affect our customers' ability to repay loans and adversely impact our financial condition and earnings. General economic conditions, including inflation, unemployment and money supply fluctuations, also may affect our profitability adversely.
While real estate values and unemployment rates have recently improved, deterioration in economic conditions, particularly within our primary market areas could result in the following consequences, among others, any of which could materially hurt our business:
• | loan delinquencies, problem assets and foreclosures may increase; |
• | demand for our products and services may decline, possibly resulting in a decrease in our total loans or assets; |
• | collateral for loans made may decline further in value, exposing us to increased risk of loss on existing loans and reducing customers' borrowing power; |
• | the net worth and liquidity of loan guarantors may decline, impairing their ability to honor commitments to us; and |
• | the amount of our deposits may decrease and the composition of our deposits may be adversely affected. |
37
At June 30, 2017, the most significant portion of our loans located outside of our primary market areas was HELOCs-purchased totaling $162.4 million, or 6.9% of our loan portfolio, secured by one-to-four family properties located primarily in several western states. As a result, our financial condition and results of operations will be subject to general economic conditions and the real estate conditions prevailing in the markets in which the underlying properties securing these loans are located, as well as the conditions in our primary market areas. If economic conditions or if the real estate market declines in the areas in which these properties are located, we may suffer decreased net income or losses associated with higher default rates and decreased collateral values on our existing portfolio. Further, because of their geographical diversity, these loans can be more difficult to oversee than loans in our market areas in the event of delinquency.
A decline in economic conditions may have a greater effect on our earnings and capital than on the earnings and capital of larger financial institutions whose real estate loan portfolios are geographically diverse. If we are required to liquidate a significant amount of collateral during a period of reduced real estate values, our financial condition and profitability could be adversely affected.
A continued weak economic recovery or a return to recessionary conditions could increase our level of nonperforming assets, lower real estate values in our market and reduce demand for loans, which would result in increased loan losses and lower earnings.
A return of recessionary conditions and/or negative developments in the domestic and international credit markets may significantly affect the markets in which we do business, the value of our loans and investments, and our ongoing operations, costs and profitability. Declines in real estate values and sales volumes and high unemployment levels may result in higher than expected loan delinquencies and a decline in demand for our products and services. These negative events may cause us to incur losses and may adversely affect our capital, liquidity, and financial condition.
Our business may be adversely affected by credit risk associated with residential property.
At June 30, 2017, $684.1 million, or 29.1% of our total loan portfolio, was secured by first liens on one-to-four family residential loans. In addition, at June 30, 2017, our home equity lines of credit totaled $319.5 million or 13.6% of our total loan portfolio. These types of loans are generally sensitive to regional and local economic conditions that significantly impact the ability of borrowers to meet their loan payment obligations, making loss levels difficult to predict. A decline in residential real estate values resulting from a downturn in the housing market may reduce the value of the real estate collateral securing these types of loans and increase our risk of loss if borrowers default on their loans. Recessionary conditions or declines in the volume of real estate sales and/or the sales prices coupled with elevated unemployment rates may result in higher than expected loan delinquencies or problem assets, and a decline in demand for our products and services. These potential negative events may cause us to incur losses, adversely affect our capital and liquidity, and damage our financial condition and business operations. In addition, a majority of our loans are "non-conforming" because they are adjustable rate mortgages which contain interest rate floors or do not satisfy credit or other requirements due to personal and financial reasons (i.e. divorce, bankruptcy, length of time employed, etc.), conforming loan limits (i.e. jumbo mortgages), and other requirements, imposed by secondary market purchasers. Some of these borrowers have higher debt-to-income ratios, or the loans are secured by unique properties in rural markets for which there are no sales of comparable properties to support the value according to secondary market requirements. We may require additional collateral or lower loan-to-value ratios to reduce the risk of these loans. We believe that these loans satisfy a need in our local market areas. As a result, subject to market conditions, we intend to continue to originate these types of loans. Total non-conforming loans were $352.4 million at June 30, 2017, including $95.8 million of jumbo one- to four-family residential loans which may also expose us to increased risk because of their larger balances.
High loan-to-value ratios on a portion of our residential mortgage loan portfolio exposes us to greater risk of loss.
Many of our one-to-four family loans and home equity lines of credit are secured by liens on mortgage properties in which the borrowers have little or no equity because of these declines in home values in our market areas. Residential loans with high combined loan-to-value ratios will be more sensitive to declining property values than those with lower combined loan-to-value ratios and therefore may experience a higher incidence of default and severity of losses. In addition, if the borrowers sell their homes, they may be unable to repay their loans in full from the sale. Further, the majority of our home equity lines of credit consist of second mortgage loans. For those home equity lines secured by a second mortgage, it is unlikely that we will be successful in recovering all or a portion of our loan proceeds in the event of default unless we are prepared to repay the first mortgage loan and such repayment and the costs associated with a foreclosure are justified by the value of the property. For these reasons, we may experience higher rates of delinquencies, defaults and losses.
Our non-owner-occupied real estate loans may expose us to increased credit risk.
At June 30, 2017 , $93.0 million , or 13.6%, of our one-to-four family loans and 4.0% of our total loan portfolio, consisted of loans secured by non-owner-occupied residential properties. Loans secured by non-owner-occupied properties generally expose a lender to greater risk of non-payment and loss than loans secured by owner-occupied properties because repayment of such loans depend primarily on the tenant's continuing ability to pay rent to the property owner, who is our borrower, or, if the property owner is unable to find a tenant, the property owner's ability to repay the loan without the benefit of a rental income stream. In addition, the physical condition of non-owner-occupied properties is often below that of owner-occupied properties due to lax property maintenance standards, which has a negative impact on the value of the collateral properties. Furthermore, some of our non-owner-occupied residential loan borrowers have more than one loan outstanding with HomeTrust Bank which may expose us to a greater risk of loss compared to an adverse development with respect to an owner-occupied residential mortgage loan.
38
Our construction and development loans and construction and land/lot loans have a higher risk of loss than residential or commercial real estate loans.
At June 30, 2017 , construction and land/lot loans in our retail consumer loan portfolio was $50.1 million , or 2.1% , of our total loan portfolio, and consists primarily of construction to permanent loans to homeowners building a residence or developing lots in residential subdivisions intending to construct a residence within one year. Construction and development loans in our commercial loan portfolio at June 30, 2017 , totaled $198.0 million , or 8.4% , of our total loan portfolio, and consists of loans to contractors and builders primarily to finance the construction of single and multi-family homes, subdivisions, as well as commercial properties. We originate these loans whether or not the collateral property underlying the loan is under contract for sale.
Construction and development lending generally involves additional risks because funds are advanced upon estimates of costs in relation to values associated with the completed project. Construction and development lending involves additional risks when compared with permanent residential lending because funds are advanced upon the collateral for the project based on an estimate of costs that will produce a future value at completion. Because of the uncertainties inherent in estimating construction costs, as well as the market value of the complete project and the effects of governmental regulation on real property, it is relatively difficult to evaluate accurately the total funds required to complete a project and the completed project loan-to-value ratio. Changes in demand for new housing and higher than anticipated building costs, may cause actual results to vary significantly from those estimated. For these reasons, this type of lending also typically involves higher loan principal amounts and is often concentrated with a small number of builders. A downturn in housing, or the real estate market, could increase loan delinquencies, defaults and foreclosures, and significantly impair the value of our collateral and our ability to sell the collateral upon foreclosure. Some of the builders we deal with have more than one loan outstanding with us. Consequently, an adverse development with respect to one loan or one credit relationship can expose us to a significantly greater risk of loss.
In addition, during the term of some of our construction and development loans, no payment from the borrower is required since the accumulated interest is added to the principal of the loan through an interest reserve. As a result, these loans often involve the disbursement of funds with repayment substantially dependent on the success of the ultimate project and the ability of the borrower to sell or lease the property or obtain permanent take-out financing, rather than the ability of the borrower or guarantor to repay principal and interest. If our appraisal of the value of a completed project proves to be overstated, we may have inadequate security for the repayment of the loan upon completion of construction of the project and may incur a loss. Because construction loans require active monitoring of the building process, including cost comparisons and on-site inspections, these loans are more difficult and costly to monitor. Increases in market rates of interest may have a more pronounced effect on construction loans by rapidly increasing the end-purchasers' borrowing costs, thereby reducing the overall demand for the project. Properties under construction are often difficult to sell and typically must be completed in order to be successfully sold which also complicates the process of working out problem construction loans. This may require us to advance additional funds and/or contract with another builder to complete construction and assume the market risk of selling the project at a future market price, which may or may not enable us to fully recover unpaid loan funds and associated construction and liquidation costs. Furthermore, in the case of speculative construction loans, there is the added risk associated with identifying an end-purchaser for the finished project. At June 30, 2017 , $44.9 million of our construction and development loans were for speculative construction loans and none were classified as nonaccruing.
Loans on land under development or held for future construction as well as lot loans made to individuals for the future construction of a residence also pose additional risk because the length of time from financing to completion of a development project is significantly longer than for a traditional construction loan, which makes them more susceptible to declines in real estate values, declines in overall economic conditions which may delay the development of the land and changes in the political landscape that could affect the permitted and intended use of the land being financed, and the potential illiquid nature of the collateral. In addition, during this long period of time from financing to completion, the collateral often does not generate any cash flow to support the debt service.
Our commercial real estate loans involve higher principal amounts than other loans and repayment of these loans may be dependent on factors outside our control or the control of our borrowers.
While commercial real estate lending may potentially be more profitable than single-family residential lending, it is generally more sensitive to regional and local economic conditions, making loss levels more difficult to predict. Collateral evaluation and financial statement analysis in these types of loans require a more detailed analysis at the time of loan underwriting and on an ongoing basis. At June 30, 2017 , commercial real estate loans were $ 730.4 million , or 31.0% of our total loan portfolio, including multifamily loans totaling $93.7 million or 4.0% of our total loan portfolio. These loans typically involve higher principal amounts than other types of loans and some of our commercial borrowers have more than one loan outstanding with us. Consequently, an adverse development with respect to one loan or one credit relationship can expose us to a significantly greater risk of loss compared to an adverse development with respect to a one-to-four family residential mortgage loan. Repayment of these loans is dependent upon income being generated from the property securing the loan in amounts sufficient to cover operating expenses and debt service, which may be adversely affected by changes in the economy or local market conditions. Commercial real estate loans also expose a lender to greater credit risk than loans secured by one-to-four family residential real estate because the collateral securing these loans typically cannot be sold as easily as residential real estate. In addition, many of our commercial real estate loans are not fully amortizing and contain large balloon payments upon maturity. Such balloon payments may require the borrower to either sell or refinance the underlying property in order to make the payment, which may increase the risk of default or non-payment. At June 30, 2017 , commercial real estate loans that were nonperforming were $2.8 million, or 20.2% of our total nonperforming loans.
39
A secondary market for most types of commercial real estate loans is not readily available, so we have less opportunity to mitigate credit risk by selling part or all of our interest in these loans. As a result of these characteristics, if we foreclose on a commercial real estate loan, our holding period for the collateral typically is longer than for one-to-four family residential loans because there are fewer potential purchasers of the collateral. Accordingly, charge-offs on commercial real estate loans may be larger on a per loan basis than those incurred with our residential and consumer loan portfolios.
The level of our commercial real estate loan portfolio may subject us to additional regulatory scrutiny.
The FDIC, the Federal Reserve Board and the Office of the Comptroller of the Currency have promulgated joint guidance on sound risk management practices for financial institutions with concentrations in commercial real estate lending. Under this guidance, a financial institution that, like us, is actively involved in commercial real estate lending should perform a risk assessment to identify concentrations. A financial institution may have a concentration in commercial real estate lending if, among other factors (i) total reported loans for construction, land development, and other land represent 100% or more of total capital, or (ii) total reported loans secured by multifamily and non-farm residential properties, loans for construction, land development and other land, and loans otherwise sensitive to the general commercial real estate market, including loans to commercial real estate related entities, represent 300% or more of total capital. Based on the criteria, the Bank has a concentration in commercial real estate lending as total loans for multifamily, non-farm/non-residential, construction, land development and other land represented 233.5% of total risk-based capital at June 30, 2017. The particular focus of the guidance is on exposure to commercial real estate loans that are dependent on the cash flow from the real estate held as collateral and that are likely to be at greater risk to conditions in the commercial real estate market (as opposed to real estate collateral held as a secondary source of repayment or as an abundance of caution). The purpose of the guidance is to guide banks in developing risk management practices and capital levels commensurate with the level and nature of real estate concentrations. The guidance states that management should employ heightened risk management practices including board and management oversight and strategic planning, development of underwriting standards, risk assessment and monitoring through market analysis and stress testing. While we believe we have implemented policies and procedures with respect to our loan portfolio consistent with this guidance, bank regulators could require us to implement additional policies and procedures consistent with their interpretation of the guidance that may result in additional costs to us.
Our increased auto finance lending increases our exposure to increased lending risks.
At June 30, 2017 , $140.9 million, or 6.0%, of our total loan portfolio consisted of indirect auto finance loans originated by us. Indirect auto finance loans are inherently risky as they are secured by assets that depreciate rapidly. In some cases, repossessed collateral for a defaulted automobile loan may not provide an adequate source of repayment for the outstanding loan and the remaining deficiency may not warrant further substantial collection efforts against the borrower. Automobile loan collections depend on the borrower's continuing financial stability, and therefore, are more likely to be adversely affected by job loss, divorce, illness, or personal bankruptcy. In addition, o ur ability to originate loans is reliant on our relationships with automotive dealers. In particular, our automotive finance operations depend in large part upon our ability to establish and maintain relationships with reputable automotive dealers that direct customers to our offices or originate loans at the point-of-sale. Although we have relationships with certain automotive dealers, none of our relationships are exclusive and any may be terminated at any time. If our existing dealer base experiences decreased sales we may experience decreased loan volume in the future, which may have an adverse effect on our business, results of operations, and financial condition.
Repayment of our municipal leases is dependent on the fire department receiving tax revenues from the county/municipality.
At June 30, 2017 , municipal leases were $ 101.2 million , or 4.3% , of our total loan portfolio. We offer ground and equipment lease financing to fire departments located throughout North Carolina and, to a lesser extent, South Carolina. Repayment of our municipal leases is often dependent on the tax revenues collected by the county/municipality on behalf of the fire department. Although a municipal lease does not constitute a general obligation of the county/municipality for which the county/municipality's taxing power is pledged, a municipal lease is ordinarily backed by the county/municipality's covenant to budget for, appropriate and pay the tax revenues to the fire department. However, certain municipal leases contain "non-appropriation" clauses which provide that the municipality has no obligation to make lease or installment purchase payments in future years unless money is appropriated for that purpose on a yearly basis. In the case of a "non-appropriation" lease, our ability to recover under the lease in the event of non-appropriation or default will be limited solely to the repossession of the leased property, without recourse to the general credit of the lessee, and disposition or releasing of the property might prove difficult. At June 30, 2017 , $2.4 million of our municipal leases contained a non-appropriation clause.
Our allowance for loan losses may prove to be insufficient to absorb losses in our loan portfolio.
Lending money is a substantial part of our business and each loan carries a certain risk that it will not be repaid in accordance with its terms, or that any underlying collateral will not be sufficient to assure repayment. This risk is affected by, among other things:
• | cash flow of the borrower and/or the project being financed; |
• | the changes and uncertainties as to the future value of the collateral, in the case of a collateralized loan; |
• | the duration of the loan; |
• | the character and creditworthiness of a particular borrower; and |
• | changes in economic and industry conditions. |
40
We maintain an allowance for loan losses, which we believe is an appropriate reserve to provide for probable losses in our loan portfolio. The allowance is funded by provisions for loan losses charged to expense. The amount of this allowance is determined by our management through periodic reviews and consideration of several factors, including, but not limited to:
• | our general reserve, based on our historical default and loss experience, certain macroeconomic factors, and management's expectations of future events; |
• | our specific reserve, based on our evaluation of nonaccruing loans and their underlying collateral; and |
• | an unallocated reserve to provide for other credit losses inherent in our portfolio that may not have been contemplated in the other loss factors. |
We make various assumptions and judgments about the collectability of our loan portfolio, including the creditworthiness of our borrowers and the value of the real estate and other assets serving as collateral for the repayment of many of our loans. In determining the amount of the allowance for loan losses, we review our loans and our loss and delinquency experience, and we evaluate economic conditions. If our assumptions are incorrect, our allowance for loan losses may not be sufficient to cover probable incurred losses in our loan portfolio, resulting in additions to our allowance for loan losses through the provision for losses on loans which is charged against income.
Additionally, pursuant to our growth strategy, management recognizes that significant new growth in loan portfolios, new loan products and the refinancing of existing loans can result in portfolios comprised of unseasoned loans that may not perform in a historical or projected manner and will increase the risk that our allowance may be insufficient to absorb losses without significant additional provisions. Further, the Financial Accounting Standards Board has adopted a new accounting standard that will be effective for our fiscal year beginning July 1, 2020. This standard, referred to as Current Expected Credit Loss ("CECL") will require financial institutions to determine periodic estimates of lifetime expected credit losses on loans, and recognize the expected credit losses as allowances for credit losses. This will change the current method of providing allowances for credit losses that are probable, which may require us to increase our allowance for loan losses, and may greatly increase the types of data we would need to collect and review to determine the appropriate level of the allowance for credit losses. In addition, bank regulatory agencies periodically review our allowance for loan losses and may require an increase in the provision for possible loan losses or the recognition of further loan charge-offs, based on judgments different than those of management. If charge-offs in future periods exceed the allowance for loan losses, we will need additional provisions to replenish the allowance for loan losses. Any additional provisions will result in a decrease in net income and possibly capital, and may have a material adverse effect on our financial condition and results of operations.
If our nonperforming assets increase, our earnings will be adversely affected.
Our nonperforming assets (which consist of nonaccruing loans and REO) were $ 20.0 million , or 0.6% , of total assets at June 30, 2017 , compared to $ 24.5 million , or 0.9% of total assets, and $31.9 million, or 1.2% of total assets, at June 30, 2016 and 2015 , respectively. Our nonperforming assets adversely affect our net income in various ways:
• | we record interest income only on a cash basis for nonaccrual loans and any nonperforming investment securities; and do not record interest income for REO; |
• | we must provide for probable loan losses through a current period charge to the provision for loan losses; |
• | noninterest expense increases when we write down the value of properties in our REO portfolio to reflect changing market values or recognize other-than-temporary impairment ("OTTI") on nonperforming investment securities; |
• | there are legal fees associated with the resolution of problem assets, as well as, carrying costs, such as taxes, insurance, and maintenance fees related to our REO; and |
• | the resolution of nonperforming assets requires the active involvement of management, which can distract them from more profitable activity. |
If additional borrowers become delinquent and do not pay their loans and we are unable to successfully manage our nonperforming assets, our losses and troubled assets could increase significantly, which could have a material adverse effect on our financial condition and results of operations. We have also classified $27.0 million in loans as performing troubled debt restructurings at June 30, 2017 .
41
To meet our growth objectives we may originate or purchase loans outside of our market areas which could affect the level of our net interest margin and nonperforming loans.
In order to achieve our desired loan portfolio growth, we opportunistically purchase loans outside of our primary market areas either individually, through participations, or in bulk or "pools". We perform certain due diligence procedures and may re-underwrite these loans to our underwriting standards prior to purchase, and anticipate acquiring loans subject to customary limited indemnities, however, we may be exposed to a greater risk of loss as we acquire loans of a type or in geographic areas where management may not have substantial prior experience and which may be more difficult for us to monitor. During the years ended June 30, 2017 , 2016 and 2015 we purchased $345.0 million , $120.6 million and $95.0 million of loans, respectively. Loan pools purchased in the past three years consisted primarily of home equity loans secured by single family residential properties located in several western states, most of which are still in our loan portfolio. When determining the purchase price we are willing to pay to acquire loans, management will make certain assumptions about, among other things, if and how much borrowers will prepay their loans, the real estate market and our ability to collect loans successfully and, if necessary, when and how to dispose of any real estate that may be acquired through foreclosure. To the extent that our underlying assumptions prove to be inaccurate or the basis for those assumptions change (such as an unanticipated decline in the real estate market), the purchase price paid may prove to have been excessive, resulting in a lower yield or a loss of some or all of the loan principal. Our success in increasing our loan portfolio through loan purchases will depend on our ability to price the loans properly and on general economic conditions in the geographic areas where the underlying properties or collateral for the loans acquired are located. Inaccurate estimates or declines in economic conditions or real estate values in the markets where we purchase loans could significantly adversely affect the level of our nonperforming loans and our results of operations.
If our REO is not properly valued or sufficiently reserved to cover actual losses, or if we are required to increase our valuation reserves, our earnings could be reduced.
We obtain updated valuations in the form of appraisals and broker price opinions when a loan has been foreclosed and the property taken in as REO and at certain other times during the asset's holding period. Our net book value ("NBV") in the loan at the time of foreclosure and thereafter is compared to the updated market value of the foreclosed property less estimated selling costs (fair value). A charge-off is recorded for any excess in the asset's NBV over its fair value. If our valuation process is incorrect, or if property values decline, the fair value of our REO may not be sufficient to recover our carrying value in such assets, resulting in the need for additional charge-offs.
Significant charge-offs to our REO could have a material adverse effect on our financial condition and results of operations.
In addition, bank regulators periodically review our REO and may require us to recognize further charge-offs. Any increase in our charge-offs may have a material adverse effect on our financial condition and results of operations.
Our securities portfolio may be negatively impacted by fluctuations in market value and interest rates.
Our securities portfolio may be impacted by fluctuations in market value, potentially reducing accumulated other comprehensive income and/or earnings. Fluctuations in market value may be caused by changes in market interest rates, lower market prices for securities and limited investor demand. Our securities portfolio is evaluated for OTTI. If this evaluation shows impairment to the actual or projected cash flows associated with one or more securities, a potential loss to earnings may occur. Changes in interest rates can also have an adverse effect on our financial condition, as our available-for-sale securities are reported at their estimated fair value, and therefore are impacted by fluctuations in interest rates. We increase or decrease our shareholders' equity by the amount of change in the estimated fair value of the available-for-sale securities, net of taxes. There can be no assurance that the declines in market value will not result in other-than-temporary impairments of these assets, which would lead to accounting charges that could have a material adverse effect on our net income and capital levels.
An increase in interest rates, change in the programs offered by governmental sponsored entities ("GSE") or our ability to qualify for such programs may reduce our mortgage revenues, which would negatively impact our noninterest income.
Our mortgage banking operations provide a significant portion of our noninterest income. We generate mortgage revenues primarily from gains on the sale of single-family mortgage loans pursuant to programs currently offered by Fannie Mae, Freddie Mac, Ginnie Mae and non-GSE investors. These entities account for a substantial portion of the secondary market in residential mortgage loans. Any future changes in these programs, our eligibility to participate in such programs, the criteria for loans to be accepted or laws that significantly affect the activity of such entities could, in turn, materially adversely affect our results of operations. Mortgage banking is generally considered a volatile source of income because it depends largely on the level of loan volume which, in turn, depends largely on prevailing market interest rates. In a rising or higher interest rate environment, our originations of mortgage loans may decrease, resulting in fewer loans that are available to be sold to investors. This would result in a decrease in mortgage banking revenues and a corresponding decrease in noninterest income. In addition, our results of operations are affected by the amount of noninterest expense associated with mortgage banking activities, such as salaries and employee benefits, occupancy, equipment and data processing expense and other operating costs. During periods of reduced loan demand, our results of operations may be adversely affected to the extent that we are unable to reduce expenses commensurate with the decline in loan originations. In addition, although we sell loans into the secondary market without recourse, we are required to give customary representations and warranties about the loans to the buyers. If we breach those representations and warranties, the buyers may require us to repurchase the loans and we may incur a loss on the repurchase.
42
Fluctuating interest rates can adversely affect our profitability.
Our earnings and cash flows are largely dependent upon our net interest income. Interest rates are highly sensitive to many factors that are beyond our control, including general economic conditions and policies of various governmental and regulatory agencies and, in particular, the Federal Reserve Board. In an attempt to help the overall economy, the Federal Reserve Board has kept interest rates low through its targeted Fed Funds rate. Beginning in December 2016, the Federal Reserve Board has increased the Fed Funds rate by 75 basis points to a range of 1.00% to 1.25% in June 2017 and indicated a likelihood for further increases during 2017 subject to economic conditions. As the Federal Reserve Board increases the Fed Funds rate, overall interest rates will likely rise, which may negatively impact both the housing markets by reducing refinancing activity and new home purchases and the U.S. economic recovery.
Changes in monetary policy, including changes in interest rates, could influence not only the interest we receive on loans and investments and the amount of interest we pay on deposits and borrowings, but these changes could also affect (i) our ability to originate loans and obtain deposits, (ii) the fair value of our financial assets and liabilities, which could negatively impact shareholders' equity, and our ability to realize gains from the sale of such assets; (iii) our ability to obtain and retain deposits in competition with other available investment alternatives; (iv) the ability of our borrowers to repay adjustable or variable rate loans; and (v) the average duration of our mortgage-backed securities portfolio and other interest-earning assets. If the interest rates paid on deposits and borrowings increase at a faster rate than the interest rates received on loans and other investments, our net interest income, and therefore earnings, could be adversely affected.
Changes in interest rates could also have a negative impact on our results of operations by reducing the ability of borrowers to repay their current loan obligations or by reducing our margins and profitability. Our net interest margin is the difference between the yield we earn on our assets and the interest rate we pay for deposits and our other sources of funding. Changes in interest rates-up or down-could adversely affect our net interest margin and, as a result, our net interest income. Although the yield we earn on our assets and our funding costs tend to move in the same direction in response to changes in interest rates, one can rise or fall faster than the other, causing our net interest margin to expand or contract. Our liabilities tend to be shorter in duration than our assets, so they may adjust faster in response to changes in interest rates. As a result, when interest rates rise, our funding costs may rise faster than the yield we earn on our assets, causing our net interest margin to contract until the yields on interest-earning assets catch up. Changes in the slope of the "yield curve", or the spread between short-term and long-term interest rates-could also reduce our net interest margin. Normally, the yield curve is upward sloping, meaning short-term rates are lower than long-term rates. Because our liabilities tend to be shorter in duration than our assets, when the yield curve flattens or even inverts, we could experience pressure on our net interest margin as our cost of funds increases relative to the yield we can earn on our assets. Also, interest rate decreases can lead to increased prepayments of loans and mortgage-backed securities as borrowers refinance their loans to reduce borrowing costs. Under these circumstances, we are subject to reinvestment risk as we may have to redeploy such repayment proceeds into lower yielding investments, which would likely hurt our income.
A sustained increase in market interest rates could adversely affect our earnings. As a result of the exceptionally low interest rate environment, an increasing percentage of our deposits have been comprised of deposits bearing no or a relatively low rate of interest and having a shorter duration than our assets. At June 30, 2017 , we had $333.8 million in certificates of deposit that mature within one year and $1.6 billion in checking, savings, and money market accounts. If the interest rates paid on deposits and other borrowings increase at a faster rate than the interest rates received on loans and other investments, our net interest income, and therefore earnings, could be adversely affected.
In addition, a substantial amount of our loans have adjustable interest rates. As a result, these loans may experience a higher rate of default in a rising interest rate environment. Further, a significant portion of our adjustable rate loans have interest rate floors below which the loan's contractual interest rate may not adjust. As of June 30, 2017 , our loans with interest rate floors totaled approximately $633.8 million or 27.0% of our total loan portfolio and had a weighted average floor rate of 4.00%. At that date, $192.6 million of these loans were at their floor rate, of which $148.0 million, or 76.9%, had yields that would begin floating again once prime rates increase at least 200 basis points. The inability of our loans to adjust downward can contribute to increased income in periods of declining interest rates, although this result is subject to the risks that borrowers may refinance these loans during periods of declining interest rates. Also, when loans are at their floors, there is a further risk that our interest income may not increase as rapidly as our cost of funds during periods of increasing interest rates which could have a material adverse effect on our results of operations.
Changes in interest rates also affect the value of our interest-earning assets and in particular our securities portfolio. Generally, the fair value of fixed-rate securities fluctuates inversely with changes in interest rates. Unrealized gains and losses on securities available for sale are reported as a separate component of equity, net of tax. Decreases in the fair value of securities available for sale resulting from increases in interest rates could have an adverse effect on stockholders' equity.
Any substantial, unexpected, prolonged change in market interest rates could have a material adverse effect on our financial condition, liquidity and results of operations. Also, our interest rate risk modeling techniques and assumptions may not fully predict or capture the impact of actual interest rate changes on our balance sheet or projected operating results. For further discussion of how changes in interest rates could impact us, see "Part II, Item 7A. Quantitative and Qualitative Disclosures About Market Risk" for additional information about our interest rate risk management.
43
Liquidity risk could impair our ability to fund operations and jeopardize our financial condition.
Liquidity is essential to our business. We rely on a number of different sources in order to meet our potential liquidity demands. Our primary sources of liquidity are increases in deposit accounts, cash flows from loan payments and our securities portfolio. Borrowings also provide us with a source of funds to meet liquidity demands. An inability to raise funds through deposits, borrowings, the sale of loans or investment securities and other sources could have a substantial negative effect on our liquidity. Our access to funding sources in amounts adequate to finance our activities or on terms which are acceptable to us could be impaired by factors that affect us specifically, or the financial services industry or economy in general. Factors that could detrimentally impact our access to liquidity sources include a decrease in the level of our business activity as a result of a downturn in the North Carolina, South Carolina, Virginia, and/or Tennessee markets in which our loans are concentrated or adverse regulatory action against us. Our ability to borrow could also be impaired by factors that are not specific to us, such as a disruption in the financial markets or negative views and expectations about the prospects for the financial services industry or deterioration in credit markets. In particular, our liquidity position could be significantly constrained if we are unable to access funds from the FHLB Atlanta or other wholesale funding sources, or if adequate financing is not available at acceptable interest rates. Finally, if we are required to rely more heavily on more expensive funding sources, our revenues may not increase proportionately to cover our costs. In this case, our results of operations and financial condition would be negatively affected.
Our strategy of pursuing acquisitions exposes us to financial, execution and operational risks that could adversely affect us.
We are implementing a strategy of supplementing organic growth by acquiring other financial institutions or their businesses that we believe will help us fulfill our strategic objectives and enhance our earnings. There are risks associated with this strategy, however, including the following:
• | We may be exposed to potential asset quality issues or unknown or contingent liabilities of the banks, businesses, assets and liabilities we acquire. If these issues or liabilities exceed our estimates, our results of operations and financial condition may be materially negatively affected; |
• | Prices at which future acquisitions can be made may not be acceptable to us; |
• | Our growth initiatives may require us to recruit experienced personnel to assist in such initiatives. The failure to identify and retain such personnel would place significant limitations on our ability to execute our growth strategy; |
• | Our strategic efforts may divert resources or management's attention from ongoing business operations and may subject us to additional regulatory scrutiny; |
• | The acquisition of other entities generally requires integration of systems, procedures and personnel of the acquired entity into our company to make the transaction economically successful. This integration process is complicated and time consuming and can also be disruptive to the customers of the acquired business. If the integration process is not conducted successfully and with minimal effect on the acquired business and its customers, we may not realize the anticipated economic benefits of particular acquisitions within the expected time frame, and we may lose customers or employees of the acquired business. We may also experience greater than anticipated customer losses even if the integration process is successful; |
• | To finance a future acquisition, we may borrow funds, thereby increasing our leverage and diminishing our liquidity, or raise additional capital, which could dilute the interests of our existing shareholders; |
• | We have completed four mergers during the past four fiscal years that enhanced our rate of growth. We may not be able to continue to sustain our past rate of growth or to grow at all in the future; and |
• | We expect our net income will increase following our acquisitions, however, we also expect our general and administrative expenses and consequently our efficiency rates will also increase. Ultimately, we would expect our efficiency ratio to improve; however, if we are not successful in our integration process, this may not occur, and our acquisitions or branching activities may not be accretive to earnings in the short or long-term. |
The required accounting treatment of loans we acquire through acquisitions, including purchase credit impaired loans, could result in higher net interest margins and interest income in current periods and lower net interest margins and interest income in future periods.
Under U.S. Generally Accepted Accounting Principles ("GAAP"), we are required to record loans acquired through acquisitions, including purchase credit impaired loans, at fair value. Estimating the fair value of such loans requires management to make estimates based on available information and facts and circumstances as of the acquisition date. Actual performance could differ from management's initial estimates. If these loans outperform our original fair value estimates, the difference between our original estimate and the actual performance of the loan (the "discount") is accreted into net interest income. Thus, our net interest margins may initially increase due to the discount. We expect the yields on our loans to decline as our acquired loan portfolio pays down or matures and the discount decreases, and we expect downward pressure on our interest income to the extent that the runoff on our acquired loan portfolio is not replaced with comparable high-yielding loans. This could result in higher net interest margins and interest income in current periods and lower net interest rate margins and lower interest income in future periods.
44
The financial services market is undergoing rapid technological changes, and if we are unable to stay current with those changes, we will not be able to effectively compete.
The financial services market, including banking services, is undergoing rapid changes with frequent introductions of new technology-driven products and services. Our future success will depend, in part, on our ability to keep pace with the technological changes and to use technology to satisfy and grow customer demand for our products and services and to create additional efficiencies in our operations. We expect that we will need to make substantial investments in our technology and information systems to compete effectively and to stay current with technological changes. Some of our competitors have substantially greater resources to invest in technological improvements and will be able to invest more heavily in developing and adopting new technologies, which may put us at a competitive disadvantage. We may not be able to effectively implement new technology-driven products and services or be successful in marketing these products and services to our customers. As a result, our ability to effectively compete to retain or acquire new business may be impaired, and our business, financial condition or results of operations may be adversely affected.
New or changing tax, accounting, and regulatory rules and interpretations could significantly impact strategic initiatives, results of operations, cash flows, and financial condition.
The banking industry is extensively regulated. Federal banking regulations are designed primarily to protect the deposit insurance funds and consumers, not to benefit a company's shareholders. These regulations may sometimes impose significant limitations on operations. The significant federal and state banking regulations that affect us are described in this report under the heading "Item 1. Business-Regulation." These regulations, along with the currently existing tax, accounting, securities, insurance, and monetary laws, regulations, rules, standards, policies, and interpretations control the methods by which financial institutions conduct business, implement strategic initiatives and tax compliance, and govern financial reporting and disclosures. These laws, regulations, rules, standards, policies, and interpretations are constantly evolving and may change significantly over time. Any new regulations or legislation, change in existing regulations or oversight, whether a change in regulatory policy or a change in a regulator's interpretation of a law or regulation, could have a material impact on our operations, increase our costs of regulatory compliance and of doing business and or otherwise adversely affect us and our profitability. Further, changes in accounting standards can be both difficult to predict and involve judgment and discretion in their interpretation by us and our independent registered public accounting firm. These changes could materially impact, potentially even retroactively, how we report our financial condition and results of our operations as could our interpretation of those changes.
Non-compliance with the USA PATRIOT Act, Bank Secrecy Act, or other laws and regulations could result in fines or sanctions and limit our ability to get regulatory approval of acquisitions.
The USA PATRIOT and Bank Secrecy Acts require financial institutions to develop programs to prevent financial institutions from being used for money laundering and terrorist activities. If such activities are detected, financial institutions are obligated to file suspicious activity reports with the U.S. Treasury's Office of Financial Crimes Enforcement Network. These rules require financial institutions to establish procedures for identifying and verifying the identity of customers seeking to open new financial accounts. Failure to comply with these regulations could result in fines or sanctions and limit our ability to get regulatory approval of acquisitions. Recently several banking institutions have received large fines for non-compliance with these laws and regulations. While we have developed policies and procedures designed to assist in compliance with these laws and regulations, no assurance can be given that these policies and procedures will be effective in preventing violations of these laws and regulations.
We are subject to potentially significant litigation and our legal related costs might increase.
The Company is involved in several litigation matters in the ordinary course of business. In the current economic environment, our involvement in litigation has increased, primarily as a result of defaulted borrowers asserting claims to defeat or delay foreclosure proceedings. These proceedings and the associated legal claims are often contested and the outcome of individual matters is not always predictable. These claims and counter claims typically arise during the course of collection efforts on problem loans or with respect to actions to enforce liens on properties in which the Company holds a security interest. There can be no assurance that loan workouts and other activities will not expose the Company to additional legal actions, including lender liability or environmental claims. Therefore, the Company may be exposed to substantial liabilities, which could adversely affect its results of operations and financial condition. Moreover, the expenses of legal proceedings will adversely affect its results of operations until they are resolved. The Company is not a party to any pending legal proceedings that management believes would have a material adverse effect on the Company's financial condition or results of operations.
45
Our framework for managing risks may not be effective in mitigating risk and loss to us.
We have established processes and procedures intended to identify measure, monitor, report, analyze and control the types of risk to which we are subject. These risks include liquidity risk, credit risk, market risk, interest rate risk, operational risk, legal and compliance risk, and reputational risk, among others. We also maintain a compliance program to identify, measure, assess, and report on our adherence to applicable laws, policies and procedures. While we assess and improve these programs on an ongoing basis, there can be no assurance that our risk management or compliance programs, along with other related controls, will effectively mitigate all risk and limit losses in our business. As with any risk management framework, there are inherent limitations to our risk management strategies as there may exist, or develop in the future, risks that we have not appropriately anticipated or identified. If our risk management framework proves ineffective, we could suffer unexpected losses which could have a material adverse effect on our financial condition and results of operations.
We are subject to certain risks in connection with our use of technology.
Our security measures may not be sufficient to mitigate the risk of a cyber attack. Communications and information systems are essential to the conduct of our business, as we use such systems to manage our customer relationships, our general ledger and virtually all other aspects of our business. Our operations rely on the secure processing, storage, and transmission of confidential and other information in our computer systems and networks. Although we take protective measures and endeavor to modify them as circumstances warrant, the security of our computer systems, software, and networks may be vulnerable to breaches, unauthorized access, misuse, computer viruses, or other malicious code and cyber attacks that could have a security impact. If one or more of these events occur, this could jeopardize our or our customers' confidential and other information processed and stored in, and transmitted through, our computer systems and networks, or otherwise cause interruptions or malfunctions in our operations or the operations of our customers or counterparties. We may be required to expend significant additional resources to modify our protective measures or to investigate and remediate vulnerabilities or other exposures, and we may be subject to litigation and financial losses that are either not insured against or not fully covered through any insurance maintained by us. We could also suffer significant reputational damage.
Security breaches in our internet banking activities could further expose us to possible liability and damage our reputation. Any compromise of our security also could deter customers from using our internet banking services that involve the transmission of confidential information. We rely on standard internet security systems to provide the security and authentication necessary to effect secure transmission of data. These precautions may not protect our systems from compromises or breaches of our security measures, and could result in significant legal liability and significant damage to our reputation and our business.
Our security measures may not protect us from system failures or interruptions. While we have established policies and procedures to prevent or limit the impact of systems failures and interruptions, there can be no assurance that such events will not occur or that they will be adequately addressed if they do. In addition, we outsource certain aspects of our data processing and other operational functions to certain third-party providers. If our third-party providers encounter difficulties, or if we have difficulty in communicating with them, our ability to adequately process and account for transactions could be affected, and our business operations could be adversely impacted. Threats to information security also exist in the processing of customer information through various other vendors and their personnel.
The occurrence of any failures or interruptions may require us to identify alternative sources of such services, and we cannot assure you that we could negotiate terms that are as favorable to us, or could obtain services with similar functionality as found in our existing systems without the need to expend substantial resources, if at all. Further, the occurrence of any systems failure or interruption could damage our reputation and result in a loss of customers and business, could subject us to additional regulatory scrutiny, or could expose us to legal liability. Any of these occurrences could have a material adverse effect on our financial condition and results of operations.
Managing reputational risk is important to attracting and maintaining customers, investors and employees.
Threats to our reputation can come from many sources, including adverse sentiment about financial institutions generally, unethical practices, employee misconduct, failure to deliver minimum standards of service or quality, compliance deficiencies, and questionable or fraudulent activities of our customers. We have policies and procedures in place to protect our reputation and promote ethical conduct, but these policies and procedures may not be fully effective. Negative publicity regarding our business, employees, or customers, with or without merit, may result in the loss of customers, investors and employees, costly litigation, a decline in revenues and increased governmental regulation.
We may experience future goodwill impairment.
In accordance with GAAP, we record assets acquired and liabilities assumed at their fair value, and, as such, acquisitions typically result in recording goodwill. We perform a goodwill evaluation at least annually to test for goodwill impairment. As part of its testing, the Company first assesses qualitative factors to determine whether it is more likely than not that the fair value of a reporting unit is less than its carrying amount. If the Company determines the fair value of a reporting unit is less than its carrying amount using these qualitative factors, the Company then compares the fair value of goodwill with its carrying amount, and then measures impairment loss by comparing the implied fair value of goodwill with the carrying amount of that goodwill. Adverse conditions in our business climate, including a significant decline in future operating cash flows, a significant change in our stock price or market capitalization, or a deviation from our expected growth rate and performance may significantly affect the fair value of our goodwill and may trigger additional impairment losses, which could be materially adverse to our operating results and financial position.
We cannot provide assurance that we will not be required to take an impairment charge in the future. Any impairment charge has an adverse effect on our results of shareholders' equity and financial results and could cause a decline in our stock price.
46
Our net operating loss carryforwards could be substantially limited if we experience an ownership change as defined in the Internal Revenue Code.
As of June 30, 2017 we had approximately $62.4 million of federal net operating losses ("NOLs"). The majority of these NOLs will expire for federal tax purposes from 2024 through 2036. Our ability to use our NOLs and other pre-ownership change losses (collectively, "Pre-Change Losses") to offset future taxable income will be limited if we experience an "ownership change" as defined in Section 382 of the Internal Revenue Code of 1986, as amended from time to time (the "Code"). In general, an ownership change occurs if, among other things, the shareholders (or specified groups of shareholders) who own or have owned, directly or indirectly, 5% or more of a corporation's common stock or are otherwise treated as 5% shareholders under Section 382 and U.S. Treasury regulations promulgated thereunder increase their aggregate percentage ownership of that corporation's stock by more than 50 percentage points over the lowest percentage of the stock owned by these shareholders over a rolling three-year period. If we experience an ownership change our Pre-Change Losses will be subject to an annual limitation on their use, which is generally equal to the fair market value of our outstanding stock immediately before the ownership change multiplied by the long-term tax-exempt rate, which was 2.09% for ownership changes occurring in June 2017. Depending on the size of the annual limitation (which is in part a function of our market capitalization at the time of the ownership change) and the remaining carryforward period for our Pre-Change Losses (U.S. federal net operating losses generally may be carried forward for a period of 20 years), we could realize a permanent loss of some or all of our Pre-Change Losses, which could have a material adverse effect on our results of operations and financial condition.
In September 2012, we adopted a shareholder rights plan (the "Rights Plan"), which provides an economic disincentive for any person or group to become an owner, for relevant tax purposes, of 4.99% or more of our stock. While adoption of the Rights Plan should reduce the likelihood that future transactions in our stock will result in an ownership change under Section 382, there can be no assurance that the Rights Plan will be effective to deter a shareholder from increasing its ownership interests beyond the limits set by the Rights Plan or that an ownership change will not occur in the future.
We rely on dividends from the Bank for substantially all of our revenue at the holding company level.
We are an entity separate and distinct from our principal subsidiary, HomeTrust Bank, and derive substantially all of our revenue at the holding company level in the form of dividends from that subsidiary. Accordingly, we are, and will be, dependent upon dividends from the Bank to pay the principal of and interest on our indebtedness, to satisfy our other cash needs and to pay dividends on our common stock, if desired. HomeTrust Bank's ability to pay dividends is subject to its ability to earn net income and to meet certain regulatory requirements. In the event the Bank is unable to pay dividends to us, we may not be able to pay dividends on our common stock when desired or continue stock repurchases. Also, our right to participate in a distribution of assets upon a subsidiary's liquidation or reorganization is subject to the prior claims of the subsidiary's creditors.
Item 1B. Unresolved Staff Comments
None.
Item 2. Properties
We maintain our administrative office, which is owned by us, in Asheville, North Carolina. In total, as of June 30, 2017 , we have 42 locations, which include: North Carolina (including the Asheville metropolitan area, the "Piedmont" region, Charlotte, and Raleigh), Upstate South Carolina (Greenville), East Tennessee (including Kingsport/Johnson City/Bristol, Knoxville, and Morristown) and Southwest Virginia (including the Roanoke Valley).
Of those offices, eight are leased facilities. We also own an operations center located in Asheville, North Carolina. We lease additional space, which is adjacent to the facility we own, for administrative and operations personnel. The lease terms for our branch offices, operations center and other offices are not individually material. Lease expirations range from one to five years. In the opinion of management, all properties are adequately covered by insurance, are in a good state of repair and are appropriately designed for their present and future use. See Footnotes 5 and 11 in the Notes to the Consolidated Financial Statements included in Item 8 of this Form 10-K for additional information.
We maintain depositor and borrower customer files on an online basis, utilizing a telecommunications network, portions of which are leased. Management has a disaster recovery plan in place with respect to the data processing system, as well as our operations as a whole.
Item 3. Legal Proceedings
The "Litigation" section of Note 17 to the Notes to Consolidated Financial Statements included in Item 8 of this Form 10-K is incorporated herein by reference.
Item 4. Mine Safety Disclosures.
Not applicable.
47
PART II
Item 5. Market for Registrant's Common Equity, Related Stockholder Matters and Issuer Purchases of Equity Securities.
The Company's common stock is listed on the Nasdaq Global Market under the symbol "HTBI." The common stock was issued at a price of $10.00 per share in connection with the Conversion. The Conversion was completed on July 10, 2012 and the Company's common stock commenced trading on the Nasdaq Global Market on July 11, 2012. As of the close of business on September 5, 2017 , there were 18,968,675 shares of common stock outstanding held by 1,349 holders of record. Certain shares are held in "nominee" or "street" name and accordingly, the number of beneficial owners of such shares is not known or included in the foregoing number. The following table presents quarterly market information for the Company's common stock for the year ended June 30, 2017 and 2016 .
|
| Year Ended June 30, | ||||||||||||||
|
| 2017 |
| 2016 | ||||||||||||
|
| High |
| Low |
| High |
| Low | ||||||||
First quarter |
| $ | 19.41 | |
| $ | 17.28 | |
| $ | 18.79 | |
| $ | 16.71 | |
Second quarter |
| 27.05 | |
| 18.00 | |
| 20.98 | |
| 17.50 | | ||||
Third quarter |
| 26.30 | |
| 21.80 | |
| 19.99 | |
| 16.97 | | ||||
Fourth quarter |
| 25.73 | |
| 22.90 | |
| 19.73 | |
| 17.62 | | ||||
The Company did not declare any dividends on its common stock during the fiscal years ended June 30, 2017 or 2016 . The timing and amount of cash dividends paid depends on our earnings, capital requirements, financial condition and other relevant factors. We also have the ability to receive dividends or capital distributions from HomeTrust Bank, our wholly owned subsidiary. There are regulatory restrictions on the ability of HomeTrust Bank to pay dividends. See Item 1, "Business-How We Are Regulated," for more information regarding the restrictions on the Company's and the Bank's abilities to pay dividends.
Unregistered Sales of Equity Securities and Use of Proceeds
The Company has periodically repurchased shares of its common stock as authorized by our Board of Directors.
On November 19, 2014, the Company announced that its Board of Directors had authorized the repurchase of up to 1,023,266 shares of the Company's common stock, representing 5% of the Company's outstanding shares. We completed this stock repurchase program during the first fiscal quarter of 2016 at an average price of $15.93 per share.
On July 1, 2015, the Company announced that its Board of Directors had authorized the repurchase of up to 971,271 shares of the Company's common stock, representing 5% of the Company's outstanding shares. We completed this stock repurchase program during the second fiscal quarter of 2016 at an average price of $18.62 per share.
On December 15, 2015, the Company announced that its Board of Directors had authorized the repurchase of up to 922,855 shares of the Company's common stock, representing 5% of the Company's outstanding shares. As of June 30, 2017, 479,700 shares had been repurchased at an average price of $18.00 per share. There were no shares repurchased during the year ended June 30, 2017.
The Company has repurchased a total of 5,351,065 shares of common stock since its Conversion in July 2012 at an average price of $16.63.
Equity Compensation Plans
The equity compensation plan information presented under Part III, Item 12 of this report is incorporated herein by reference.
48
Shareholder Return Performance Graph Presentation
The performance graph below compares the Company's cumulative shareholder return on its common stock since the inception of trading on July 11, 2012 to the cumulative total return of the Nasdaq Composite, and the Nasdaq Bank Index for the periods indicated. The information presented below assumes $100 was invested on July 11, 2012, in the Company's common stock and in each of the indices and assumes the reinvestment of all dividends. Historical stock price performance is not necessarily indicative of future stock price performance. Total return assumes the reinvestment of all dividends and that the value of Common Stock and each index was $100 on July 11, 2012.
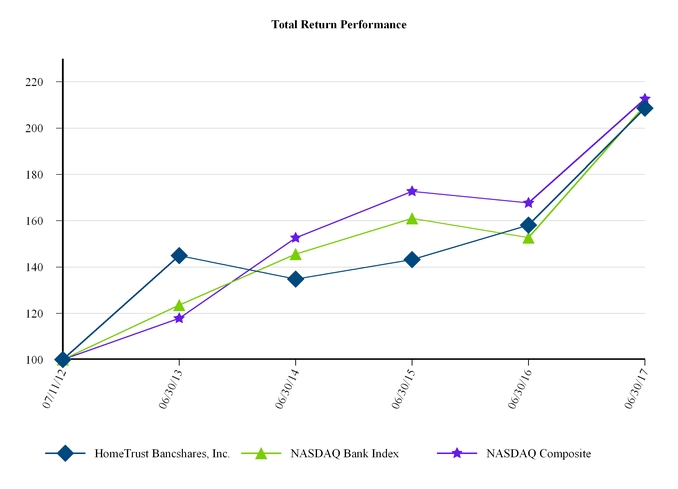
| Period Ended | ||||||||||
| 2012 | 2013 | 2014 | 2015 | 2016 | 2017 | |||||
| 7/11 |
| 6/30 |
| 6/30 |
| 6/30 |
| 6/30 |
| 6/30 |
HomeTrust Bancshares, Inc. | 100.00 |
| 144.96 |
| 134.79 |
| 143.25 |
| 158.12 |
| 208.55 |
NASDAQ Bank Index | 100.00 |
| 123.55 |
| 145.58 |
| 161.06 |
| 152.74 |
| 209.82 |
NASDAQ Composite | 100.00 |
| 117.84 |
| 152.64 |
| 172.68 |
| 167.68 |
| 212.62 |
49
Item 6. Selected Financial and Other Data.
The summary information presented below under "Selected Financial Condition Data" and "Selected Operations Data" for the years ended June 30, 2017 , 2016 and 2015 are derived in part from the audited consolidated financial statements that appear in this annual report. The following information is only a summary and you should read it in conjunction with "Management's Discussion and Analysis of Financial Condition and Results of Operations" under Item 7 of this report and "Financial Statements and Supplementary Data" under Item 8 of this report below.
| At June 30, | ||||||||||||||||||
| 2017 |
| 2016 |
| 2015 |
| 2014 |
| 2013 | ||||||||||
| (In thousands) | ||||||||||||||||||
Selected Financial Condition Data: |
|
|
|
|
|
|
|
|
| ||||||||||
Total assets | $ | 3,206,533 | |
| $ | 2,717,677 | |
| $ | 2,783,114 | |
| $ | 2,074,454 | |
| $ | 1,583,323 | |
Loans receivable, net (1) | 2,330,319 | |
| 1,811,539 | |
| 1,663,333 | |
| 1,473,529 | |
| 1,132,110 | | |||||
Allowance for loan losses | 21,151 | |
| 21,292 | |
| 22,374 | |
| 23,429 | |
| 32,073 | | |||||
Certificates of deposit in other banks | 132,274 | |
| 161,512 | |
| 210,629 | |
| 163,780 | |
| 136,617 | | |||||
Securities available for sale, at fair value | 199,667 | |
| 200,652 | |
| 257,606 | |
| 168,774 | |
| 24,750 | | |||||
FHLB and FRB stock (2) | 39,355 | |
| 29,486 | |
| 28,711 | |
| 3,697 | |
| 1,854 | | |||||
Deposits | 2,048,451 | |
| 1,802,696 | |
| 1,872,126 | |
| 1,583,047 | |
| 1,154,750 | | |||||
Borrowings | 696,500 | |
| 491,000 | |
| 475,000 | |
| 50,000 | |
| - | | |||||
Stockholders' equity | 397,647 | |
| 359,976 | |
| 371,050 | |
| 377,151 | |
| 367,515 | | |||||
| Years Ended June 30, | ||||||||||||||||||
| 2017 |
| 2016 |
| 2015 |
| 2014 |
| 2013 | ||||||||||
| (In thousands) | ||||||||||||||||||
Selected Operations Data: |
|
|
|
|
|
|
|
|
| ||||||||||
Total interest and dividend income | $ | 99,436 | |
| $ | 87,747 | |
| $ | 85,156 | |
| $ | 60,281 | |
| $ | 60,389 | |
Total interest expense | 8,245 | |
| 6,040 | |
| 5,390 | |
| 5,432 | |
| 7,255 | | |||||
Net interest income | 91,191 | |
| 81,707 | |
| 79,766 | |
| 54,849 | |
| 53,134 | | |||||
Provision for (recovery of ) loan losses | - | |
| - | |
| 150 | |
| (6,300 | ) |
| 1,100 | | |||||
Net interest income after provision for (recovery of) loan losses | 91,191 | |
| 81,707 | |
| 79,616 | |
| 61,149 | |
| 52,034 | | |||||
Service charges and fees on deposit accounts | 7,042 | |
| 6,680 | |
| 5,930 | |
| 2,783 | |
| 2,589 | | |||||
Mortgage banking income and fees | 3,645 | |
| 3,069 | |
| 2,989 | |
| 3,218 | |
| 5,107 | | |||||
Bank owned life insurance income | 2,088 | |
| 1,643 | |
| 1,651 | |
| 1,484 | |
| 1,553 | | |||||
Gain on sale of securities | 22 | |
| - | |
| 61 | |
| 10 | |
| - | | |||||
Gain on sale of fixed assets | 385 | |
| 10 | |
| - | |
| - | |
| - | | |||||
Other noninterest income | 2,258 | |
| 2,101 | |
| 1,888 | |
| 1,243 | |
| 1,138 | | |||||
Total noninterest income | 15,440 | |
| 13,503 | |
| 12,519 | |
| 8,738 | |
| 10,387 | | |||||
Total noninterest expense | 89,592 | |
| 78,853 | |
| 81,552 | |
| 55,032 | |
| 51,393 | | |||||
Income before provision (benefit) for income taxes | 17,039 | |
| 16,357 | |
| 10,583 | |
| 14,855 | |
| 11,028 | | |||||
Income tax expense (benefit) | 5,192 | |
| 4,901 | |
| 2,558 | |
| 4,513 | |
| 1,975 | | |||||
Net income | $ | 11,847 | |
| $ | 11,456 | |
| $ | 8,025 | |
| $ | 10,342 | |
| $ | 9,053 | |
Per Share Data: |
| |
|
| |
|
| |
|
| |
|
| | |||||
Net income per common share: |
| |
|
| |
|
| |
|
| |
|
| | |||||
Basic | $ | 0.66 | |
| $ | 0.65 | |
| $ | 0.42 | |
| $ | 0.54 | |
| $ | 0.45 | |
Diluted | $ | 0.65 | |
| $ | 0.65 | |
| $ | 0.42 | |
| $ | 0.54 | |
| $ | 0.45 | |
50
| At or For the Years Ended June 30, | |||||||||||||
| 2017 |
| 2016 |
| 2015 |
| 2014 |
| 2013 | |||||
Selected Financial Ratios and Other Data: |
|
|
|
|
|
|
|
|
| |||||
Performance ratios: |
|
|
|
|
|
|
|
|
| |||||
Return on assets (ratio of net income to average total assets) | 0.40 | % |
| 0.42 | % |
| 0.32 | % |
| 0.62 | % |
| 0.56 | % |
Return on equity (ratio of net income to average equity) | 3.14 | |
| 3.16 | |
| 2.12 | |
| 2.86 | |
| 2.48 | |
Tax equivalent yield on earning assets (3) | 3.79 | |
| 3.62 | |
| 3.88 | |
| 4.15 | |
| 4.30 | |
Rate paid on interest-bearing liabilities | 0.37 | |
| 0.29 | |
| 0.29 | |
| 0.46 | |
| 0.65 | |
Tax equivalent average interest rate spread (3) | 3.42 | |
| 3.33 | |
| 3.59 | |
| 3.69 | |
| 3.65 | |
Tax equivalent net interest margin (3)(4) | 3.49 | |
| 3.37 | |
| 3.64 | |
| 3.79 | |
| 3.81 | |
Noninterest expense to average total assets | 3.04 | |
| 2.88 | |
| 3.25 | |
| 3.29 | |
| 3.21 | |
Average interest-earning assets to average interest-bearing liabilities | 120.26 | |
| 119.25 | |
| 120.61 | |
| 130.20 | |
| 132.54 | |
Efficiency ratio | 84.02 | |
| 82.82 | |
| 88.37 | |
| 86.55 | |
| 80.91 | |
Efficiency ratio - adjusted (5) | 75.33 | |
| 80.27 | |
| 79.78 | |
| 78.50 | |
| 72.24 | |
Asset quality ratios: |
| |
|
| |
|
| |
|
| |
|
| |
Nonperforming assets to total assets (6) | 0.62 | % |
| 0.90 | % |
| 1.15 | % |
| 2.53 | % |
| 5.07 | % |
Nonaccruing loans to total loans (6) | 0.58 | |
| 1.01 | |
| 1.47 | |
| 2.53 | |
| 5.88 | |
Total classified assets to total assets | 1.57 | |
| 2.17 | |
| 2.92 | |
| 4.51 | |
| 7.43 | |
Allowance for loan losses to nonaccruing loans (6) | 154.77 | |
| 114.98 | |
| 90.02 | |
| 61.79 | |
| 46.78 | |
Allowance for loan losses to total loans | 0.90 | |
| 1.16 | |
| 1.33 | |
| 1.56 | |
| 2.75 | |
Net charge-offs to average loans | 0.01 | |
| 0.06 | |
| 0.07 | |
| 0.19 | |
| 0.34 | |
Capital ratios: |
|
|
|
|
|
|
|
|
| |||||
Equity to total assets at end of period | 12.40 | % |
| 13.25 | % |
| 13.33 | % |
| 18.18 | % |
| 23.21 | % |
Average equity to average assets | 12.80 | |
| 13.24 | |
| 15.11 | |
| 21.62 | |
| 23.09 | |
Dividend payout to common shareholders | - | |
| - | |
| - | |
| - | |
| - | |
(1) | Net of allowances for loan losses, loans in process and deferred loan fees. |
(2) | FRB stock was first purchased as part of membership requirements in fiscal year 2015. |
(3) | The weighted average rate for municipal leases is adjusted for a 34% federal income tax rate since the interest from these leases is tax exempt. |
(4) | Net interest income divided by average interest earning assets. |
51
(5) | As presented, this is a non-GAAP measure calculated by dividing total noninterest expense, net of FHLB advance prepayment penalties, merger-related expenses, and impairment charges for branch consolidation by the sum of net interest income, total noninterest income and the tax equivalent adjustment, net of realized gain/loss on securities, and the gain on sale of fixed assets. See Part II, Item 7 - "Non-GAAP Financial Measures" for additional details. Non-GAAP efficiency table is set forth below: |
|
| ||||||||||||||||||
| 2017 |
| 2016 |
| 2015 |
| 2014 |
| 2013 | ||||||||||
Noninterest expense | $ | 89,592 | |
| $ | 78,853 | |
| $ | 81,552 | |
| $ | 55,032 | |
| $ | 51,393 | |
Less FHLB advance prepayment expense | - | |
| - | |
| - | |
| - | |
| 3,069 | | |||||
Less merger-related expenses | 7,805 | |
| - | |
| 5,417 | |
| 2,708 | |
| - | | |||||
Less impairment charges for branch consolidation | - | |
| 400 | |
| 375 | |
| - | |
| - | | |||||
Noninterest expense – as adjusted | $ | 81,787 | |
| $ | 78,453 | |
| $ | 75,760 | |
| $ | 52,324 | |
| $ | 48,324 | |
Net interest income | 91,191 | |
| 81,707 | |
| 79,766 | |
| 54,849 | |
| 53,134 | | |||||
Plus noninterest income | 15,440 | |
| 13,503 | |
| 12,519 | |
| 8,738 | |
| 10,387 | | |||||
Plus tax equivalent adjustment | 2,354 | |
| 2,537 | |
| 2,736 | |
| 3,076 | |
| 3,371 | | |||||
Less realized gain/loss on securities | 22 | |
| - | |
| 61 | |
| 10 | |
| - | | |||||
Less gain on sale of fixed assets | 385 | |
| 10 | |
| - | |
| - | |
| - | | |||||
Net interest income plus noninterest income – as adjusted | $ | 108,578 | |
| $ | 97,737 | |
| $ | 94,960 | |
| $ | 66,653 | |
| $ | 66,892 | |
Efficiency ratio - adjusted | 75.33 | % |
| 80.27 | % |
| 79.78 | % |
| 78.50 | % |
| 72.24 | % | |||||
Efficiency ratio (without adjustments) | 84.02 | % |
| 82.82 | % |
| 88.37 | % |
| 86.55 | % |
| 80.91 | % | |||||
(6) | Nonperforming assets include nonaccruing loans including certain restructured loans and real estate owned. At June 30, 2017 , there were $4.7 million of restructured loans included in nonaccruing loans and $6.6 million, or 48.0%, of nonaccruing loans were current on their loan payments. |
Item 7. Management's Discussion and Analysis of Financial Condition and Results of Operations
This discussion and analysis reviews our consolidated financial statements and other relevant statistical data and is intended to enhance your understanding of our financial condition and results of operations. The information in this section has been derived from the Consolidated Financial Statements and footnotes thereto, which are included in Item 8 of this Form 10-K. You should read the information in this section in conjunction with the business and financial information regarding us as provided in this Form 10-K.
Overview
Our principal business consists of attracting deposits from the general public and investing those funds, along with borrowed funds in loans secured by first and second mortgages on one-to-four family residences, including home equity loans and construction and land/lot loans, commercial real estate loans, construction and development loans, commercial and industrial loans, indirect automobile loans, and municipal leases. Municipal leases are secured primarily by a ground lease for a firehouse or an equipment lease for fire trucks and firefighting equipment to fire departments located throughout North and South Carolina. We also purchase investment securities consisting primarily of securities issued by United States Government agencies and government-sponsored enterprises, as well as, commercial paper and certificates of deposit insured by the FDIC.
We offer a variety of deposit accounts for individuals, businesses, and nonprofit organizations. Deposits and borrowings are our primary source of funds for our lending and investing activities.
We are significantly affected by prevailing economic conditions, as well as, government policies and regulations concerning, among other things, monetary and fiscal affairs, housing and financial institutions. Deposit flows are influenced by a number of factors, including interest rates paid on competing time deposits, other investments, account maturities, and the overall level of personal income and savings. Lending activities are influenced by the demand for funds, the number and quality of lenders, and regional economic cycles.
Our primary source of pre-tax income is net interest income. Net interest income is the difference between interest income, which is the income that we earn on our loans and investments, and interest expense, which is the interest that we pay on our deposits and borrowings. Changes in levels of interest rates affect our net interest income. A secondary source of income is noninterest income, which includes revenue we receive from providing products and services, including service charges on deposit accounts, mortgage banking income, and gains and losses from sales of securities.
An offset to net interest income is the provision for loan losses which is required to establish the allowance for loan losses at a level that adequately provides for probable losses inherent in our loan portfolio. As a loan's risk rating improves, property values increase, or recoveries of amounts previously charged off are received, a recapture of previously recognized provision for loan losses may be added to net interest income.
Our noninterest expenses consist primarily of salaries and employee benefits, expenses for occupancy, marketing and computer services, and FDIC deposit insurance premiums. Salaries and benefits consist primarily of the salaries and wages paid to our employees, payroll taxes, expenses for retirement and other employee benefits. Occupancy expenses, which are the fixed and variable costs of buildings and equipment, consist primarily of lease payments, property taxes, depreciation charges, maintenance and costs of utilities.
52
In recent years, we have expanded our geographic footprint into six additional markets through strategic acquisitions as well as three de novo commercial loan offices. Looking forward, we believe opportunities currently exist within our market areas to grow our franchise. We anticipate organic growth as the local economy and loan demand strengthens, through our marketing efforts and as a result of the opportunities being created as a result of the consolidation of financial institutions occurring in our market areas. We may also seek to expand our franchise through the selective acquisition of individual branches, loan purchases and, to a lesser degree, whole bank transactions that meet our investment and market objectives. We will continue to be disciplined as it pertains to future expansion focusing primarily on organic growth in our current market areas.
At June 30, 2017, we had 42 locations in North Carolina (including the Asheville metropolitan area, the "Piedmont" region, Charlotte, and a loan production office in Raleigh), Upstate South Carolina (Greenville), East Tennessee (including Kingsport/Johnson City/Bristol, Knoxville, and Morristown) and Southwest Virginia (including the Roanoke Valley).
Merger, Acquisition, and Consolidation Activity
On January 1, 2017, the Company completed its acquisition of TriSummit pursuant to an Agreement and Plan of Merger, dated as of September 20, 2016, under which TriSummit merged with and into HomeTrust with HomeTrust as the surviving corporation in the Merger. Immediately following the Merger, TriSummit's wholly owned subsidiary bank, TriSummit Bank, merged with and into the Bank. TriSummit had seven offices throughout the East Tennessee market. The acquisition added approximately $258.0 million in loans and $280.0 million in deposits.
On December 31, 2016, the Bank acquired United Financial of North Carolina, Inc. ("United Financial"), a municipal lease company headquartered in Fletcher, North Carolina that specializes in providing financing for fire departments and municipalities for the purchase of fire trucks and related equipment as well as the construction of fire stations and other municipal buildings across the Carolinas and other southeastern states. United Financial underwrites and originates these municipal leases and then sells them to HomeTrust and other financial institutions. Beginning January 1, 2017, United Financial has conducted business under the name United Financial, a division of HomeTrust Bank.
On October 30, 2015, the Bank consolidated six branch offices located in North Carolina and Tennessee. The closures were the result of a review of customer banking preferences and the current branch network. The Company had a nonrecurring impairment charge of $400,000 and $375,000 for the quarters ended June 30, 2016 and 2015, respectively in relation to the consolidation of these offices.
On November 14, 2014, we completed the acquisition of ten branch banking locations in Virginia and North Carolina from Bank of America Corporation (the "Branch Acquisition"). Six of the branches are located in Roanoke Valley, two in Danville, one in Martinsville, Virginia, and one in Eden, North Carolina. The acquisition added approximately $1.0 million in loans and $329.2 million in deposits.
On July 31, 2014, HomeTrust Bank completed its acquisition of Bank of Commerce headquartered in Charlotte, North Carolina. The acquisition of one office in midtown Charlotte added approximately $86.5 million in loans and $93.4 million in deposits.
On May 31, 2014, we completed our acquisition of Jefferson Bancshares, Inc., the holding company for Jefferson Federal Bank, ("Jefferson") headquartered in Morristown, Tennessee. Jefferson had twelve offices located across East Tennessee. The acquisition added approximately $329.9 million in loans and $377.4 million in deposits.
On July 31, 2013, we completed our acquisition of BankGreenville Financial Corporation ("BankGreenville") with one office located in Greenville, South Carolina. The acquisition added approximately $47.8 million in loans and $89.1 million in deposits.
Business and Operating Strategy and Goals
Our primary objective is to continue to operate and grow HomeTrust Bank as a well-capitalized, profitable, independent, community banking organization. Our mission is to create stockholder value by building relationships with our employees, customers, and communities in our primary markets in North Carolina (including the Asheville metropolitan area, the "Piedmont" region, Charlotte, and Raleigh), Upstate South Carolina (Greenville), East Tennessee (including Kingsport/Johnson City/Bristol, Knoxville, and Morristown) and Southwest Virginia (including the Roanoke Valley) through exceptional service and helping our customers every day to be "Ready For What's Next" in their financial lives. We will also need to continue providing our employees with the tools necessary to effectively deliver our products and services to customers in order to compete effectively with other financial institutions operating in our market areas.
Continuing to originate residential and commercial real estate loans and municipal leases. Our primary lending focus has been, and will continue to be, on operating as a residential and commercial mortgage lender. We originate both fixed and adjustable-rate residential and commercial mortgage loans. Most of the long term fixed-rate residential mortgage loans that we originate are sold into the secondary market with servicing released, while most of the residential adjustable rate mortgages and fixed rate mortgages with terms to maturity of 15 years or less, all commercial real estate loans, and all municipal leases that we originate, are retained in our portfolio. We intend to continue to emphasize these lending activities particularly in the larger attractive markets we have added in the past several years.
53
Expanding our lines of businesses. In our commitmen t to sound and profitable organic growth, we continuously focus on enhancing our lines of businesses. During fiscal year 2017, we added ten additional mortgage loan officers and 12 new commercial market presidents/relationship managers primarily in the six new metro markets we recently entered to further expand our commercial and industrial lending, as well as our knowledge of the growing markets. Commercial loan originations for the years ended June 30, 2017, 2016, 2015 were $532.5 million, $325.5 million, and $194.9 million, respectively. Fiscal year 2017 marked the third full year of our indirect auto finance line of business, which serves automobile dealerships, its owners, and consumers buying automobiles from these dealerships throughout western North Carolina and upstate South Carolina. Our focus on working with strong dealerships affords us the opportunity to expand into additional market areas and to actively deepen relationships through cross-selling opportunities, while building a strong reputation. Indirect auto loans grew to $140.9 million at June 30, 2017 from $108.5 million at June 30, 2016.
Building on the momentum we have generated, we opened a new Commercial LPO in Greensboro, North Carolina in August 2017; announced a new SBA 7(a) loan program and equipment finance line of business, both of which began during the first quarter of fiscal year 2018; and plan to open a de novo branch in Cary, North Carolina during the fourth quarter of fiscal year 2018. Beginning in the first quarter of fiscal 2018, we introduced a new consumer lending and HELOC origination platform that will further streamline our process as well as increase customer convenience and satisfaction.
Creating efficiencies and focusing on expense management. During fiscal year 2017, the Bank continued its disciplined approach to managing expenses. In addition to the consolidation of six overlapping branches in fiscal 2016, we consolidated an additional four branches related to the TriSummit acquisition, which aided in the 50% in cost savings from the TriSummit acquisition achieved beginning in the fourth quarter. Recommendations stemming from the 2016 branch optimization study were implemented in 2017 resulting in $375,000 in cost savings on an annual basis. Our change in health care providers at the beginning of the fiscal year saved the Bank $700,000 in premium increases.
Disciplined franchise expansion . We believe opportunities currently exist within our new market areas to grow our franchise as illustrated by 88% of our commercial loan originations in fiscal year 2017 were originated by commercial relationship managers located in market areas we entered into subsequent to our Conversion. We anticipate organic growth as the local economy and loan demand strengthens, through our marketing efforts and as a result of the opportunities being created as a result of the consolidation of financial institutions occurring in our market areas. We may also seek to expand our franchise through the selective acquisition of individual branches, loan purchases and, to a lesser degree, whole bank transactions that meet our investment and market objectives. We will continue to be disciplined as it pertains to future expansion focusing primarily on organic growth in our current market areas.
Maintaining and improving asset quality. The Company believes that strong asset quality is a key to long-term financial success. The percentage of nonperforming loans to total loans was 0.58% and 1.01% for June 30, 2017 and 2016, respectively. The Company's percentage of nonperforming assets to total assets at June 30, 2017 was 0.62% compared to 0.90% at June 30, 2016. The Company has actively managed the delinquent loans and nonperforming assets by aggressively pursuing the collection of consumer debts and marketing saleable properties upon foreclosure or repossession, work-outs of classified assets and loan charge-offs. In the past several years, the Company has applied more conservative and stringent underwriting practices to new loans, including, among other things, an increased emphasis on a borrower's ongoing ability to repay a loan by requiring lower debt to income ratios, higher credit scores and lower loan to value ratios than our previous lending policies had required. Although the Company intends to grow the commercial loan portfolio by expanding commercial real estate and commercial and industrial lending, the Company intends to manage credit exposures through the use of experienced bankers in this area and a conservative approach to lending.
Emphasizing lower cost core deposits to manage the funding costs of our loan growth. We offer personal checking, savings and money-market accounts, which generally are lower-cost sources of funds than certificates of deposit and are less sensitive to withdrawal when interest rates fluctuate. To build our core deposit base, over the past several years, we have sought to reduce our dependence on traditional higher cost deposits in favor of stable lower cost demand deposits. We have utilized additional product offerings, technology and a focus on customer service in working toward this goal. In addition, we intend to increase demand deposits by growing business banking relationships through a recently expanded product line tailored to our target business customers' needs. We are also pursuing a number of strategies that include enhancing our online and mobile banking platform, including improvements to online account opening and sales promotions on money market and checking accounts to encourage the growth of lower cost deposits.
Improving profitability through customer growth and balance sheet management. We are continuing to focus significant efforts on creating brand awareness, offering competitive products and employing a strong and experienced workforce. In order to deepen the relationships with our customers and increase individual customer profitability, we have continued our cross-marketing program, which allows us to better identify lending opportunities and services for customers when a new account is opened. In addition, we have targeted our direct mail campaigns to take advantage of competitor mergers and/or branch closures to acquire new customer core deposits. We believe these initiatives have positioned us well to implement a strategy focused on improving revenue growth and noninterest income.
Hiring and retaining experienced employees with a customer service focus. We have been successful in attracting and retaining banking professionals with strong community relationships and significant knowledge of our markets, through both individual hires and business combinations, which is central to our business strategy. Exceptional service, local involvement and timely decision-making are integral parts of our business strategy, and we continue to seek additional highly qualified and motivated individuals. We believe that by focusing on experienced bankers who are established in their communities, we enhance our market position and add profitable growth opportunities. Our compensation and incentive systems are aligned with our strategies to grow core deposits and our loan portfolio as the economy improves, while improving asset quality. We have a strong corporate culture based on personal accountability, high ethical standards and significant training opportunities, which is supported by our commitment to career development and promotion from within the organization.
54
Critical Accounting Policies
Certain of our accounting policies are important to the portrayal of our financial condition, since they require management to make difficult, complex or subjective judgments, some of which may relate to matters that are inherently uncertain. Estimates associated with these policies are susceptible to material changes as a result of changes in facts and circumstances. Facts and circumstances which could affect these judgments include, but are not limited to, changes in interest rates, changes in the performance of the economy and changes in the financial condition of borrowers.
On April 5, 2012, the JOBS Act was signed into law. The JOBS Act contains provisions that, among other things, reduce certain reporting requirements for qualifying public companies. As an "emerging growth company" we may delay adoption of new or revised accounting pronouncements applicable to public companies until such pronouncements are made applicable to private companies. We intend to take advantage of the benefits of this extended transition period, although we have not done so to date. Accordingly, our financial statements may not be comparable to companies that comply with such new or revised accounting standards or disclosures.
The following represent our critical accounting policies:
Allowance for Loan Losses. The allowance for loan losses is the amount estimated by management as necessary to cover losses inherent in the loan portfolio at the balance sheet date. The allowance is established through the provision for loan losses, which is charged to income. Determining the amount of the allowance for loan losses necessarily involves a high degree of judgment. Among the material estimates required to establish the allowance are: loss exposure at default; the amount and timing of future cash flows on impaired loans; value of collateral; and determination of loss factors to be applied to the various elements of the portfolio. All of these estimates are susceptible to significant change. Management reviews the level of the allowance quarterly and establishes the provision for loan losses based upon an evaluation of the portfolio, past loss experience, current economic conditions, and other factors related to the collectability of the loan portfolio. Although we believe that we use the best information available to establish the allowance for loan losses, future adjustments to the allowance may be necessary if economic or other conditions differ substantially from the assumptions used in making the evaluation. In addition, bank regulators, as an integral part of their examination process, periodically review our allowance for loan losses and may require us to recognize adjustments to the allowance based on their judgments about information available to them at the time of their examination. A large loss could deplete the allowance and require increased provisions to replenish the allowance, which would adversely affect earnings.
Business Combinations and Acquired Loans. We use the acquisition method of accounting for all business combinations. The acquisition method of accounting requires us as acquirer to recognize the fair value of assets acquired and liabilities assumed at the acquisition date, as well as, recognize goodwill or a gain from a bargain purchase, if appropriate. Any acquisition-related costs and restructuring costs are recognized as period expenses as incurred.
We account for purchased performing loans acquired in business combinations using the contractual cash flows method of recognizing discount accretion based on the acquired loans' contractual cash flows. We record purchased performing loans at fair value, including a credit discount. The fair value discount is accreted as an adjustment to yield over the estimated lives of the loans. We do not establish any allowance for loan losses for purchased performing loans, however we will record a provision for loan losses for any further deterioration in these loans subsequent to the acquisition.
We consider loans purchased with evidence of credit deterioration and for which it is probable that all contractually required payments will not be collected as purchased credit-impaired ("PCI") loans. Evidence of credit quality deterioration as of the purchase date may include the internal loan risk grade, delinquent and nonaccrual status, recent credit scores, and recent loan-to-value percentages. We initially record PCI loans at fair value, which includes estimated future credit losses expected to be incurred over the life of the loan. Thus, we do not establish any allowance for loan losses for PCI loans. We estimate the cash flows expected to be collected at the purchase date using specific credit reviews of certain loans and quantitative models incorporating credit risk, prepayment assumptions, and various other factors. These estimates require significant judgment given the impact of real estate prices, changing loss estimates, prepayment assumptions, and other relevant factors. The excess of cash flows expected to be collected over the estimated fair value is the accretable yield and is recognized in interest income over the remaining life of the loan. The difference between the contractually required payments and the cash flows expected to be collected at the purchase date, considering the impact of prepayments, is the nonaccretable difference and is available to absorb future loan chargeoffs.
Real Estate Owned ("REO"). REO represents real estate acquired as a result of customers' loan defaults. At the time of foreclosure, REO is recorded at fair value less costs to sell, which becomes the property's new basis. Any write-downs based on the asset's fair value at the date of acquisition are charged to the allowance for loan losses. After foreclosure, management periodically performs valuations such that the real estate is carried at the lower of its new cost basis or fair value, net of estimated costs to sell. Revenue and expenses from operations and subsequent valuation adjustments to the carrying amount of the property are included in noninterest expense in the consolidated statements of income. In some instances, we may make loans to facilitate the sales of REO. Management reviews all sales for which it is the lending institution for compliance with sales treatment under provisions established by Accounting Standards Codification ("ASC") Topic 360, "Accounting for Sales of Real Estate." Any gains related to sales of REO may be deferred until the buyer has a sufficient initial and continuing investment in the property.
Goodwill and Intangibles. Goodwill is reviewed for potential impairment on an annual basis during the fourth quarter, or more often if events or circumstances indicate there may be impairment. In testing goodwill for impairment, we have the option to assess either qualitative or quantitative factors to determine whether the existence of events or circumstances leads to a determination that it is more likely than not that the estimated fair value of a reporting unit is less than its carrying amount. If we elect to perform a qualitative assessment and determine that an
55
impairment is more likely than not, we are then required to perform a quantitative impairment test, otherwise no further analysis is required. Under the quantitative impairment test, the evaluation involves comparing the current fair value of each reporting unit to its carrying value, including goodwill. If the estimated fair value of a reporting unit exceeds its carrying value, goodwill is considered not to be impaired. If the carrying value exceeds estimated fair value an impairment charge is recognized for the difference, but limited by the amount of goodwill allocated to that reporting unit. Other identifiable intangible assets are evaluated for impairment if events or changes in circumstances indicate a possible impairment.
Deferred Tax Assets. We use the asset and liability method of accounting for income taxes. Under this method, deferred tax assets and liabilities are recognized for the future tax consequences attributable to differences between the financial statement carrying amounts of existing assets and liabilities and their respective tax bases. Deferred tax assets and liabilities are measured using enacted tax rates expected to apply to taxable income in the years in which those temporary differences are expected to be recovered or settled. Deferred tax assets are reduced by a valuation allowance when it is more likely than not that some portion of the deferred tax asset will not be realized. We exercise significant judgment in evaluating the amount and timing of recognition of the resulting tax liabilities and assets. These judgments require us to make projections of future taxable income. The judgments and estimates we make in determining our deferred tax assets, which are inherently subjective, are reviewed on a continual basis as regulatory and business factors change. Any reduction in estimated future taxable income may require us to record a valuation allowance against our deferred tax assets.
Non-GAAP Financial Measures
In addition to results presented in accordance with GAAP, this Form10-K contains certain non-GAAP financial measures, which include: the efficiency ratio; the ratio of the allowance for loan losses to total loans excluding acquired loans; tangible book value; tangible book value per share; and tangible equity to tangible assets ratio. The Company believes these non-GAAP financial measures and ratios as presented are useful for both investors and management to understand the effects of certain items and provides an alternative view of the Company's performance over time and in comparison to the Company's competitors.
Management elected to obtain additional FHLB borrowings beginning in November 2014 as part of a short term leveraging strategy to generate additional net interest income with the proceeds, as well as dividend income from the required purchase of additional FHLB stock. The Company believes that showing the effects of the additional borrowings on net interest income and net interest margins is useful to both management and investors as these measures are commonly used to measure financial institutions performance and performance against peers.
The Company believes these measures facilitate comparison of the quality and composition of the Company's capital and earnings ability over time and in comparison to its competitors. These non-GAAP measures have inherent limitations, are not required to be uniformly applied and are not audited. They should not be considered in isolation or as a substitute for total stockholders' equity or operating results determined in accordance with GAAP. These non-GAAP measures may not be comparable to similarly titled measures reported by other companies.
Set forth below is a reconciliation to GAAP of our efficiency ratio:
|
| Year Ended | ||||||||||||||||||
(Dollars in thousands) |
| June 30, | ||||||||||||||||||
|
| 2017 |
| 2016 |
| 2015 |
| 2014 |
| 2013 | ||||||||||
Noninterest expense |
| $ | 89,592 | |
| $ | 78,853 | |
| $ | 81,552 | |
| $ | 55,032 | |
| $ | 51,393 | |
Less merger-related expenses |
| 7,805 | |
| - | |
| 5,417 | |
| 2,708 | |
| - | | |||||
Less impairment charge for branch consolidations |
| - | |
| 400 | |
| 375 | |
| - | |
| - | | |||||
Less FHLB advance prepayment penalty |
| - | |
| - | |
| - | |
| - | |
| 3,069 | | |||||
Noninterest expense – as adjusted |
| $ | 81,787 | |
| $ | 78,453 | |
| $ | 75,760 | |
| $ | 52,324 | |
| $ | 48,324 | |
|
|
|
|
|
|
|
|
|
|
| ||||||||||
Net interest income |
| $ | 91,191 | |
| $ | 81,707 | |
| $ | 79,766 | |
| $ | 54,849 | |
| $ | 53,134 | |
Plus noninterest income |
| 15,440 | |
| 13,503 | |
| 12,519 | |
| 8,738 | |
| 10,387 | | |||||
Plus tax equivalent adjustment |
| 2,354 | |
| 2,537 | |
| 2,736 | |
| 3,076 | |
| 3,371 | | |||||
Less gain on sale of fixed assets |
| 385 | |
| 10 | |
| - | |
| - | |
| - | | |||||
Less realized gain on securities |
| 22 | |
| - | |
| 61 | |
| 10 | |
| - | | |||||
Net interest income plus noninterest income – as adjusted |
| $ | 108,578 | |
| $ | 97,737 | |
| $ | 94,960 | |
| $ | 66,653 | |
| $ | 66,892 | |
Efficiency ratio |
| 75.33 | % |
| 80.27 | % |
| 79.78 | % |
| 78.50 | % |
| 72.24 | % | |||||
Efficiency ratio (without adjustments) |
| 84.02 | % |
| 82.82 | % |
| 88.37 | % |
| 86.55 | % |
| 80.91 | % | |||||
56
Set forth below is a reconciliation to GAAP of tangible book value and tangible book value per share:
(Dollars in thousands, except per share data) |
| At June 30, | ||||||||||||||||||
|
| 2017 |
| 2016 |
| 2015 |
| 2014 |
| 2013 | ||||||||||
Total stockholders' equity |
| $ | 397,647 | |
| $ | 359,976 | |
| $ | 371,050 | |
| $ | 377,151 | |
| $ | 367,515 | |
Less: goodwill, core deposits intangibles, net of taxes |
| (30,157 | ) |
| (17,169 | ) |
| (19,000 | ) |
| (12,344 | ) |
| (76 | ) | |||||
Tangible book value |
| $ | 367,490 | |
| $ | 342,807 | |
| $ | 352,050 | |
| $ | 364,807 | |
| $ | 367,439 | |
Common shares outstanding |
| 18,967,875 | |
| 17,998,750 | |
| 19,488,449 | |
| 20,632,008 | |
| 20,824,900 | | |||||
Tangible book value per share (1) |
| $ | 19.37 | |
| $ | 19.05 | |
| $ | 18.06 | |
| $ | 17.68 | |
| $ | 17.64 | |
Book value per share |
| $ | 20.96 | |
| $ | 20.00 | |
| $ | 19.04 | |
| $ | 18.28 | |
| $ | 17.65 | |
Set forth below is a reconciliation to GAAP of tangible equity to tangible assets:
|
| At June 30, | ||||||
(Dollars in thousands) |
| 2017 |
| 2016 | ||||
Tangible book value (1) |
| $ | 367,490 | |
| $ | 342,807 | |
Total assets |
| 3,206,533 | |
| 2,717,677 | | ||
Less: goodwill, core deposit intangibles, net of taxes |
| (30,157 | ) |
| (17,169 | ) | ||
Total tangible assets (2) |
| $ | 3,176,376 | |
| $ | 2,700,508 | |
Tangible equity to tangible assets |
| 11.57 | % |
| 12.69 | % | ||
_________________________________________________________________
(1) | Tangible book value is equal to total shareholders' equity less goodwill and core deposit intangibles, net of related deferred tax liabilities. |
(2) | Total tangible assets is equal to total assets less goodwill and core deposit intangibles, net of related deferred tax liabilities. |
Set forth below is a reconciliation to GAAP net interest income and net interest margin as adjusted to exclude additional FHLB borrowings and proceeds from such borrowings:
|
| Year Ended June 30, 2017 |
| Year Ended June 30, 2016 | ||||||||||||||||||
|
| Average Balance Outstanding |
| Interest Earned / Paid |
| Yield/ Rate |
| Average Balance Outstanding |
| Interest Earned / Paid |
| Yield/ Rate | ||||||||||
Interest-earning assets |
| $ | 2,683,956 | |
| $ | 101,790 | |
| 3.79 | % |
| $ | 2,496,449 | |
| $ | 90,283 | |
| 3.62 | % |
Less: Interest-earning assets funded by additional FHLB borrowings (1) |
| 318,000 | |
| 3,640 | |
| 1.14 | % |
| 409,250 | |
| 3,312 | |
| 0.81 | % | ||||
Interest-earning assets - adjusted |
| $ | 2,365,956 | |
| $ | 98,150 | |
| 4.15 | % |
| $ | 2,087,199 | |
| $ | 86,971 | |
| 4.17 | % |
|
|
|
|
|
|
|
|
|
|
|
|
| ||||||||||
Interest-bearing liabilities |
| $ | 2,231,759 | |
| $ | 8,245 | |
| 0.37 | % |
| $ | 2,093,527 | |
| $ | 6,040 | |
| 0.29 | % |
Additional FHLB borrowings |
| 318,000 | |
| 1,856 | |
| 0.58 | % |
| 409,250 | |
| 1,262 | |
| 0.31 | % | ||||
Interest-bearing liabilities - adjusted |
| $ | 1,913,759 | |
| $ | 6,389 | |
| 0.33 | % |
| $ | 1,684,277 | |
| $ | 4,778 | |
| 0.28 | % |
|
|
|
|
|
|
|
|
|
|
|
|
| ||||||||||
Net interest income and net interest margin |
|
|
| $ | 93,545 | |
| 3.49 | % |
|
|
| $ | 84,243 | |
| 3.37 | % | ||||
Net interest income and net interest margin - adjusted |
|
|
| 91,762 | |
| 3.88 | % |
|
|
| 82,194 | |
| 3.94 | % | ||||||
Difference |
|
|
| $ | 1,783 | |
| (0.39 | )% |
|
|
| $ | 2,049 | |
| (0.57 | )% | ||||
_________________________________________________________________________________
(1) | Proceeds from the additional borrowings were invested in various interest-earning assets including: deposits with the FRB, FHLB stock, certificates of deposits in other banks, and commercial paper. |
57
Set forth below is a reconciliation to GAAP net income, ROA, ROE, and EPS as adjusted to exclude merger-related expenses, nonrecurring state tax expense, and impairment charges for branch consolidation:
|
| Three Months Ended |
| Year Ended | ||||||||||||||||||||||||
(Dollars in thousands, except per share data) |
| June 30, |
| June 30, | ||||||||||||||||||||||||
|
| 2017 |
| 2016 |
| 2017 |
| 2016 |
| 2015 |
| 2014 |
| 2013 | ||||||||||||||
Merger-related expenses |
| $ | 69 | |
| $ | - | |
| $ | 7,805 | |
| $ | - | |
| $ | 5,417 | |
| $ | 2,708 | |
| $ | - | |
Nonrecurring state tax expense |
| - | |
| - | |
| 490 | |
| 526 | |
| - | |
| - | |
| - | | |||||||
Gain on sale of premises and equipment |
| - | |
| (10 | ) |
| (385 | ) |
| (10 | ) |
| - | |
| - | |
| - | | |||||||
Impairment charges for branch consolidation |
| - | |
| 400 | |
| - | |
| 400 | |
| 374 | |
| - | |
| - | | |||||||
Provision/(recovery) of loan losses (1) |
|
|
|
|
| N/A | |
| N/A | |
| (150 | ) |
| (6,300 | ) |
| 1,100 | | |||||||||
Total adjustments |
| 69 | |
| 390 | |
| 7,910 | |
| 916 | |
| 5,641 | |
| (3,592 | ) |
| 1,100 | | |||||||
Tax effect |
| (26 | ) |
| (144 | ) |
| (2,646 | ) |
| (144 | ) |
| (1,882 | ) |
| 1,506 | |
| (407 | ) | |||||||
Total adjustments, net of tax |
| 43 | |
| 246 | |
| 5,264 | |
| 772 | |
| 3,759 | |
| (2,086 | ) |
| 693 | | |||||||
|
|
|
|
|
|
|
|
|
|
|
|
|
|
| ||||||||||||||
Net income (GAAP) |
| 4,766 | |
| 3,302 | |
| 11,847 | |
| 11,456 | |
| 8,025 | |
| 10,342 | |
| 9,053 | | |||||||
|
|
|
|
|
|
|
|
|
|
|
|
|
|
| ||||||||||||||
Net income (non-GAAP) |
| $ | 4,809 | |
| $ | 3,548 | |
| $ | 17,111 | |
| $ | 12,228 | |
| $ | 11,784 | |
| $ | 8,256 | |
| $ | 9,746 | |
|
|
|
|
|
|
|
|
|
|
|
|
|
|
| ||||||||||||||
Per Share Data |
|
|
|
|
|
|
|
|
|
|
|
|
|
| ||||||||||||||
Average shares outstanding - basic |
| 17,936,511 | |
| 16,918,916 | |
| 17,379,487 | |
| 17,417,046 | |
| 19,038,098 | |
| 18,630,744 | |
| 19,922,283 | | |||||||
Average shares outstanding - diluted |
| 18,568,587 | |
| 17,136,806 | |
| 18,014,778 | |
| 17,606,689 | |
| 19,117,902 | |
| 18,715,669 | |
| 19,941,687 | | |||||||
|
|
|
|
|
|
|
|
|
|
|
|
|
|
| ||||||||||||||
Basic EPS |
|
|
|
|
|
|
|
|
|
|
|
|
|
| ||||||||||||||
EPS (GAAP) |
| $ | 0.26 | |
| $ | 0.19 | |
| $ | 0.66 | |
| $ | 0.65 | |
| $ | 0.42 | |
| $ | 0.54 | |
| $ | 0.45 | |
Non-GAAP adjustment |
| - | |
| 0.02 | |
| 0.30 | |
| 0.05 | |
| 0.19 | |
| (0.10 | ) |
| 0.04 | | |||||||
EPS (non-GAAP) |
| $ | 0.26 | |
| $ | 0.21 | |
| $ | 0.96 | |
| $ | 0.70 | |
| $ | 0.61 | |
| $ | 0.44 | |
| $ | 0.49 | |
|
|
|
|
|
|
|
|
|
|
|
|
|
|
| ||||||||||||||
Diluted EPS |
|
|
|
|
|
|
|
|
|
|
|
|
|
| ||||||||||||||
EPS (GAAP) |
| $ | 0.25 | |
| $ | 0.19 | |
| $ | 0.65 | |
| $ | 0.65 | |
| $ | 0.42 | |
| $ | 0.54 | |
| $ | 0.45 | |
Non-GAAP adjustment |
| - | |
| 0.02 | |
| 0.29 | |
| 0.05 | |
| 0.19 | |
| (0.10 | ) |
| 0.04 | | |||||||
EPS (non-GAAP) |
| $ | 0.25 | |
| $ | 0.21 | |
| $ | 0.94 | |
| $ | 0.70 | |
| $ | 0.61 | |
| $ | 0.44 | |
| $ | 0.49 | |
|
|
|
|
|
|
|
|
|
|
|
|
|
|
| ||||||||||||||
Average Balances |
|
|
|
|
|
|
|
|
|
|
|
|
|
| ||||||||||||||
Average assets |
| $ | 3,133,998 | |
| $ | 2,735,256 | |
| $ | 2,945,365 | |
| $ | 2,741,188 | |
| $ | 2,510,296 | |
| $ | 1,673,267 | |
| $ | 1,603,514 | |
Average equity |
| $ | 394,527 | |
| $ | 358,545 | |
| $ | 376,970 | |
| $ | 362,916 | |
| $ | 379,316 | |
| $ | 361,727 | |
| $ | 365,750 | |
|
|
|
|
|
|
|
|
|
|
|
|
|
|
| ||||||||||||||
ROA |
|
|
|
|
|
|
|
|
|
|
|
|
|
| ||||||||||||||
ROA (GAAP) |
| 0.61 | % |
| 0.48 | % |
| 0.40 | % |
| 0.42 | % |
| 0.32 | % |
| 0.62 | % |
| 0.56 | % | |||||||
Non-GAAP adjustment |
| - | % |
| 0.04 | % |
| 0.18 | % |
| 0.03 | % |
| 0.15 | % |
| (0.13 | )% |
| 0.05 | % | |||||||
ROA (non-GAAP) |
| 0.61 | % |
| 0.52 | % |
| 0.58 | % |
| 0.45 | % |
| 0.47 | % |
| 0.49 | % |
| 0.61 | % | |||||||
|
|
|
|
|
|
|
|
|
|
|
|
|
|
| ||||||||||||||
ROE |
|
|
|
|
|
|
|
|
|
|
|
|
|
| ||||||||||||||
ROE (GAAP) |
| 4.83 | % |
| 3.68 | % |
| 3.14 | % |
| 3.16 | % |
| 2.12 | % |
| 2.86 | % |
| 2.48 | % | |||||||
Non-GAAP adjustment |
| 0.05 | % |
| 0.28 | % |
| 1.40 | % |
| 0.21 | % |
| 0.99 | % |
| (0.58 | )% |
| 0.19 | % | |||||||
ROE (non-GAAP) |
| 4.88 | % |
| 3.96 | % |
| 4.54 | % |
| 3.37 | % |
| 3.11 | % |
| 2.28 | % |
| 2.67 | % | |||||||
(1) Beginning in fiscal 2016, the Provision/(recovery) of loan losses was no longer included in this calculation.
|
|
|
|
|
|
|
|
|
58
Set forth below is a reconciliation to GAAP of the allowance for loan losses to total loans and the allowance for loan losses as adjusted to exclude loans acquired through business combinations:
| As of | ||||||
(Dollars in thousands) | June 30, 2017 |
| June 30, 2016 | ||||
Total gross loans receivable (GAAP) | $ | 2,352,415 | |
| $ | 1,832,831 | |
Less: acquired loans | (374,538 | ) |
| (220,891 | ) | ||
Adjusted loans (non-GAAP) | $ | 1,977,877 | |
| $ | 1,611,940 | |
|
|
|
| ||||
Allowance for loan losses (GAAP) | $ | 21,151 | |
| $ | 21,292 | |
Less: allowance for loan losses on acquired loans | (727 | ) |
| (361 | ) | ||
Adjusted allowance for loan losses | 20,424 | |
| 20,931 | | ||
Allowance for loan losses / Adjusted loans (non-GAAP) | 1.03 | % |
| 1.30 | % | ||
Comparison of Financial Condition at June 30, 2017 and June 30, 2016
General. Total assets increased $488.9 million, or 18.0% to $3.2 billion at June 30, 2017 from $2.7 billion at June 30, 2016. This increase was largely due to the TriSummit acquisition which closed on January 1, 2017. Net loans receivable increased $518.8 million, or 28.6% at June 30, 2017 to $2.3 billion from $1.8 billion at June 30, 2016, primarily due to $258.1 million in loans acquired from TriSummit, $242.5 million in net organic loan growth, and $18.1 million in purchased HELOCs, net of repayments. The increase in borrowings of $205.5 million, or 41.9% and the cumulative decrease of $74.8 million, or 16.9% in cash and cash equivalents, commercial paper and certificates of deposit in other banks during fiscal 2017 were mainly used to fund the TriSummit acquisition, higher yielding loan originations, and purchases of HELOCs. The $9.9 million increase in other investments at cost was a result of additional FHLB stock purchases as required to support additional FHLB borrowings. We continue to utilize our leveraging strategy, where additional short-term FHLB borrowings are invested in various short-term liquid assets to generate additional net interest income, as well as increased dividend income from the required purchase of additional FHLB stock. The cumulative increase of $31.8 million, or 15.3% in premises and equipment, deferred income taxes, bank-owned life insurance, goodwill, and core deposit intangibles were all a direct result of the TriSummit acquisition.
Cash, cash equivalents, and commercial paper. Total cash and cash equivalents increased $34.4 million, or 65.4%, to $87.0 million at June 30, 2017 from $52.6 million at June 30, 2016. The increase was primarily due to funds received from the TriSummit acquisition and additional funds held at the Federal Reserve Bank. In conjunction with our leveraging strategy, we purchase commercial paper to take advantage of higher returns with relatively low risk while remaining highly liquid. The commercial paper balance decreased $59.9 million, or 34.8% to $149.9 million at June 30, 2017 from $229.9 million at June 30, 2016. As part of the Company's liquidity strategy, we also invest a portion of our excess cash in certificates of deposit in other banks which have a higher yield than cash held in interest-earning accounts in order to increase earnings. All of the certificates of deposit in other banks are fully insured by the FDIC. At June 30, 2017, certificates of deposits in other banks totaled $132.3 million compared to $161.5 million at June 30, 2016. The Company has reduced its liquidity position in order to fund recent loan growth.
Investments. Securities available for sale decreased $1.0 million, to $199.7 million at June 30, 2017 compared to $200.7 million at June 30, 2016. During fiscal 2017, securities available for sale of $58.5 million were acquired from the TriSummit acquisition and $15.1 million were purchased which were offset by $27.1 million in investment securities maturities and $43.2 million in sales and repayments. The securities purchased during this period were primarily short- to intermediate-term U.S. government agency notes and, to a lesser extent, intermediate-term taxable municipal securities. We evaluate individual investment securities quarterly for other-than-temporary declines in market value. We do not believe that there are any other-than-temporary impairments at June 30, 2017; therefore, no impairment losses have been recorded for fiscal 2017. Other investments include FHLB and FRB stock. FHLB stock increased $8.8 million, to $32.1 million over the last fiscal year to support increased borrowings related to our leveraging strategy. As a member of the Federal Reserve System, the Bank is required to own FRB stock, which requirement increased $1.1 million to $7.3 million as of June 30, 2017 compared to $6.2 million in the prior fiscal year.
Loans. Net loans receivable increased $518.8 million , or 28.6% , to $2.3 billion at June 30, 2017 compared to $1.8 billion at June 30, 2016 , primarily due to $258.1 million in loans acquired from TriSummit, $242.5 million in net organic loan growth, and $18.1 million in purchased HELOCs, net of repayments.
For fiscal year 2017, the retail loan segment portfolio originations increased from $266.5 million to $305.4 million, or 14.6%, compared to the previous year. The commercial loan segment portfolio originations increased from $336.7 million to $541.5 million, or 60.9%, compared to the previous year. Organic net loan growth for the year ended June 30, 2017, which excludes loans acquired through acquisitions and purchases of HELOCs, was $242.5 million, or 14.4%, compared to $74.8 million, or 4.4% for the year ended June 30, 2016.
59
|
|
|
|
|
|
|
|
| Percent of total | |||||||||||
| June 30, |
| June 30, |
| Change |
| June 30, |
| June 30, | |||||||||||
| 2017 |
| 2016 |
| $ |
| % |
| 2017 |
| 2016 | |||||||||
Retail consumer loans: |
|
|
|
|
|
|
|
|
|
|
| |||||||||
One-to-four family | $ | 684,089 | |
| $ | 623,701 | |
| $ | 60,388 | |
| 9.7 | % |
| 29.1 | % |
| 34.0 | % |
HELOCs - originated | 157,068 | |
| 163,293 | |
| (6,225 | ) |
| (3.8 | ) |
| 6.7 | |
| 8.9 | | |||
HELOCs - purchased | 162,407 | |
| 144,377 | |
| 18,030 | |
| 12.5 | |
| 6.9 | |
| 7.9 | | |||
Construction and land/lots | 50,136 | |
| 38,102 | |
| 12,034 | |
| 31.6 | |
| 2.1 | |
| 2.1 | | |||
Indirect auto finance | 140,879 | |
| 108,478 | |
| 32,401 | |
| 29.9 | |
| 6.0 | |
| 5.9 | | |||
Consumer | 7,900 | |
| 4,635 | |
| 3,265 | |
| 70.4 | |
| 0.3 | |
| 0.3 | | |||
Total retail consumer loans | 1,202,479 | |
| 1,082,586 | |
| 119,893 | |
| 11.1 | |
| 51.1 | |
| 59.1 | | |||
Commercial loans: |
| |
|
| |
|
|
|
|
|
|
|
| |||||||
Commercial real estate | 730,408 | |
| 486,561 | |
| 243,847 | |
| 50.1 | |
| 31.0 | |
| 26.6 | | |||
Construction and development | 197,966 | |
| 86,840 | |
| 111,126 | |
| 128.0 | |
| 8.4 | |
| 4.7 | | |||
Commercial and industrial | 120,387 | |
| 73,289 | |
| 47,098 | |
| 64.3 | |
| 5.1 | |
| 4.0 | | |||
Municipal leases | 101,175 | |
| 103,183 | |
| (2,008 | ) |
| (1.9 | ) |
| 4.3 | |
| 5.6 | | |||
Total commercial loans | 1,149,936 | |
| 749,873 | |
| 400,063 | |
| 53.4 | |
| 48.9 | |
| 40.9 | | |||
Total loans | $ | 2,352,415 | |
| $ | 1,832,459 | |
| $ | 519,956 | |
| 28.4 | % |
| 100.0 | % |
| 100.0 | % |
Asset Quality . The Company continues to see improvements across all asset quality metrics. Nonperforming assets decreased 18.3% to $20.0 million, or 0.62% of total assets, at June 30, 2017 , compared to $24.5 million, or 0.90% of total assets, at June 30, 2016 . Nonperforming assets included $13.7 million in nonaccruing loans and $6.3 million in REO at June 30, 2017 , compared to $18.5 million and $6.0 million, in nonaccruing loans and REO, respectively, at June 30, 2016 . Included in nonperforming loans are $4.7 million of loans restructured from their original terms of which $3.8 million were current with respect to their modified payment terms. The decrease in nonaccruing loans was primarily due to continued improvements in credit quality throughout the loan portfolio and loans returning to performing status as payment history and the borrower's financial status improved. At June 30, 2017 , $6.6 million, or 48.0%, of nonaccruing loans were current on their required loan payments. Purchased impaired loans aggregating $6.7 million acquired from prior acquisitions are excluded from nonaccruing loans due to the accretion of discounts established in accordance with the acquisition method of accounting for business combinations. Nonperforming loans to total loans decreased to 0.58% at June 30, 2017 from 1.01% at June 30, 2016.
The ratio of classified assets to total assets decreased to 1.57% at June 30, 2017 from 2.17% at June 30, 2016 . Classified assets decreased 14.8% to $50.2 million at June 30, 2017 compared to $58.9 million at June 30, 2016 . Delinquent loans (loans delinquent 30 days or more) at June 30, 2016 were $15.2 million , or 0.6% of total loans compared to $19.5 million, or 1.1% of total loans at June 30, 2016.
As of June 30, 2017 , impaired loans decreased to $43.0 million from $44.1 million at June 30, 2016. Our impaired loans are comprised of loans on non-accrual status and all TDRs, whether performing or on non-accrual status under their restructured terms. Impaired loans may be evaluated for reserve purposes using either a specific impairment analysis or on a collective basis as part of homogeneous pools. For more information on these impaired loans, see Note 4 of the Notes to Consolidated Financial Statements included in Item 8 of this Form 10-K.
Allowance for loan losses. We establish an allowance for loan losses by charging amounts to the loan provision at a level required to reflect estimated credit losses in the loan portfolio. In evaluating the level of the allowance for loans losses, management considers, among other factors, historical loss experience, the types of loans and the amount of loans in the loan portfolio, adverse situations that may affect borrowers' ability to repay, estimated value of any underlying collateral, prevailing economic conditions and current risk factors specifically related to each loan type. See "Critical Accounting Policies – Allowance for Loan Losses" for a description of the manner in which the provision for loan losses is established.
Our allowance for loan losses at June 30, 2017 was $21.2 million , or 0.90% of total loans, compared to $21.3 million , or 1.16% of total loans at June 30, 2016 . The allowance for loan losses was 1.03% of gross loans at June 30, 2017 , excluding acquired loans from the allowance for loan losses in accordance with the acquisition method of accounting for business combinations, as compared to 1.30% at June 30, 2016. The Company recorded these loans at fair value, which includes a credit discount, therefore, no allowance for loan losses is established for these loans at the time of acquisition. Any subsequent deterioration in credit quality will result in a provision for loan losses. The allowance for our acquired loans at June 30, 2017 was $727,000 compared to $361,000 at June 30, 2016. There was no provision for loan losses for the years ended June 30, 2017 and 2016 reflecting continued improvements in our asset quality, offset by the additional allowance required for our loan growth. Net loan charge-offs decreased to $141,000 for the year ended June 30, 2017 from $1.1 million for fiscal 2016. Net charge-offs as a percentage of average loans decreased to 0.01% for the year ended June 30, 2017 from 0.06% for last fiscal year. The allowance as a percentage of nonaccruing loans increased to 154.77% at June 30, 2017 , compared to 114.98% a year earlier.
We believe that the allowance for loan losses as of June 30, 2017 was adequate to absorb the known and inherent risks of loss in the loan portfolio at that date. While we believe the estimates and assumptions used in our determination of the adequacy of the allowance are reasonable, there can be no assurance that such estimates and assumptions will not be proven incorrect in the future, or that the actual amount of future provisions
60
will not exceed the amount of past provisions or that any increased provisions that may be required will not adversely impact our financial condition and results of operations. In addition, the determination of the amount of the allowance for loan losses is subject to review by bank regulators as part of the routine examination process, which may result in the establishment of additional reserves based upon their judgment of information available to them at the time of their examination.
Real estate owned. REO increased $362,000 , to $6.3 million at June 30, 2017 primarily due to $2.4 million in transfers from foreclosed loans and $1.5 million from the TriSummit acquisition, which were partially offset by $3.3 million in sales of REO. The total balance of REO included $2.5 million in land, construction and development projects (both residential and commercial), $2.7 million in commercial real estate, and $1.1 million in single-family homes at June 30, 2017 .
Deferred income taxes. Deferred income taxes increased $3.2 million, or 6.0%, to $57.4 million at June 30, 2017 from $54.2 million at June 30, 2016. The TriSummit acquisition added $7.2 million in deferred taxes which were partially offset by a $4.9 million realization of deferred tax assets due to higher taxable income.
Deposits. Deposits increased $245.8 million , or 13.6% , to $2.0 billion at June 30, 2017 from $1.8 billion at June 30, 2016 . The increase was primarily due to the TriSummit acquisition, which increased total deposits by $280.3 million and was partially offset by a managed run off of $56.3 million in higher cost certificates of deposit.
Borrowings. Borrowings increased to $696.5 million at June 30, 2017 from $491.0 million at June 30, 2016 as a result of a $205.5 million increase in FHLB advances. This increase was used to provide funds for the acquisition of TriSummit, partially fund the increase in total loans and to provide funds for our leveraging strategy. All FHLB advances have maturities of less than 90 days with a weighted average interest rate of 1.13% at June 30, 2017 .
Equity. Stockholders' equity at June 30, 2017 increased to $397.6 million from $360.0 million at June 30, 2016 . The increase was primarily driven by $20.0 million in equity consideration paid in the TriSummit acquisition, $11.8 million in net income, $4.2 million representing stock-based compensation, and $3.1 million in exercised stock options. These increases were partially offset by a $2.1 million decrease in accumulated other comprehensive income representing a decrease in unrealized gains on securities available for sale, net of tax. Tangible book value per share increased $0.32, or 1.7% to $19.37 as of June 30, 2017 compared to $19.05 at June 30, 2016. This increase was reduced due to the intangible assets recorded as part of the TriSummit acquisition.
61
Average Balances, Interest and Average Yields/Cost
The following table sets forth for the periods indicated, information regarding average balances of assets and liabilities, as well as, the total dollar amounts of interest income from average interest-earning assets and interest expense on average interest-bearing liabilities, related yields, interest rate spread, net interest margin (otherwise known as net yield on interest-earning assets), and the ratio of average interest-earning assets to average interest-bearing liabilities. All average balances are daily average balances. Nonaccruing loans have been included in the table as loans carrying a zero yield.
| Years Ended June 30, | |||||||||||||||||||||||||||||||
| 2017 |
| 2016 |
| 2015 | |||||||||||||||||||||||||||
| Average |
| Interest |
| Yield/ |
| Average |
| Interest |
| Yield/ |
| Average |
| Interest |
| Yield/ | |||||||||||||||
| (Dollars in thousands) | |||||||||||||||||||||||||||||||
Interest-earning assets: |
|
|
|
|
|
|
|
|
|
|
|
|
|
|
|
|
| |||||||||||||||
Loans receivable (1) | $ | 2,080,490 | |
| $ | 92,423 | |
| 4.44 | % |
| $ | 1,764,229 | |
| $ | 80,974 | |
| 4.59 | % |
| $ | 1,628,067 | |
| $ | 80,611 | |
| 4.95 | % |
Deposits in other financial institutions | 177,753 | |
| 1,900 | |
| 1.07 | % |
| 213,011 | |
| 1,974 | |
| 0.93 | % |
| 332,703 | |
| 2,323 | |
| 0.70 | % | ||||||
Investment securities | 202,866 | |
| 3,983 | |
| 1.96 | % |
| 229,287 | |
| 4,161 | |
| 1.81 | % |
| 200,772 | |
| 3,659 | |
| 1.82 | % | ||||||
Other (3) | 222,847 | |
| 3,484 | |
| 1.56 | % |
| 289,922 | |
| 3,174 | |
| 1.09 | % |
| 105,831 | |
| 1,299 | |
| 1.23 | % | ||||||
Total interest-earning assets | 2,683,956 | |
| 101,790 | |
| 3.79 | % |
| 2,496,449 | |
| 90,283 | |
| 3.62 | % |
| 2,267,373 | |
| 87,892 | |
| 3.88 | % | ||||||
Interest-bearing liabilities: |
|
|
|
|
|
|
|
|
|
|
|
|
|
|
|
|
| |||||||||||||||
Interest-bearing checking accounts | 430,527 | |
| 772 | |
| 0.18 | % |
| 389,027 | |
| 581 | |
| 0.15 | % |
| 349,599 | |
| 442 | |
| 0.13 | % | ||||||
Money market accounts | 541,030 | |
| 1,405 | |
| 0.26 | % |
| 501,871 | |
| 1,112 | |
| 0.22 | % |
| 453,056 | |
| 1,027 | |
| 0.23 | % | ||||||
Savings accounts | 228,360 | |
| 308 | |
| 0.13 | % |
| 215,584 | |
| 289 | |
| 0.13 | % |
| 209,782 | |
| 304 | |
| 0.14 | % | ||||||
Certificate accounts | 453,994 | |
| 2,103 | |
| 0.46 | % |
| 504,469 | |
| 2,549 | |
| 0.51 | % |
| 621,943 | |
| 3,119 | |
| 0.50 | % | ||||||
Borrowings | 577,848 | |
| 3,657 | |
| 0.63 | % |
| 482,576 | |
| 1,510 | |
| 0.31 | % |
| 245,464 | |
| 498 | |
| 0.20 | % | ||||||
Total interest-bearing liabilities | 2,231,759 | |
| 8,245 | |
| 0.37 | % |
| 2,093,527 | |
| 6,041 | |
| 0.29 | % |
| 1,879,844 | |
| 5,390 | |
| 0.29 | % | ||||||
Tax equivalent net interest income |
|
| $ | 93,545 | |
|
|
|
|
| $ | 84,242 | |
|
|
|
|
| $ | 82,502 | |
|
| |||||||||
Tax equivalent interest rate spread |
|
|
|
| 3.42 | % |
|
|
|
|
| 3.33 | % |
|
|
|
|
| 3.59 | % | ||||||||||||
Net earning assets | $ | 452,197 | |
|
|
|
|
| $ | 402,922 | |
|
|
|
|
| $ | 387,529 | |
|
|
|
| |||||||||
Tax equivalent net interest margin (4) |
|
|
|
| 3.49 | % |
|
|
|
|
| 3.37 | % |
|
|
|
|
| 3.64 | % | ||||||||||||
Average interest-earning assets to average interest-bearing liabilities | 120.26 | % |
|
|
|
|
| 119.25 | % |
|
|
|
|
| 120.61 | % |
|
|
|
| ||||||||||||
(1) | Average loans receivable include loans held for sale and nonaccruing loans. |
(2) | Interest income used in the average interest/earned and yield calculation includes the tax equivalent adjustment of $2.4 million, $2.5 million, and $2.7 million for fiscal years ended June 30, 2017 , 2016 , and 2015 , respectively, calculated based on a federal income tax rate of 34%. |
(3) | The average other assets consists of FRB stock, FHLB stock, and commercial paper. See Comparison of Results of Operation for the Year Ended June 30, 2017 and June 30, 2016 for discussion of our leveraging strategy. |
(4) Net interest income divided by average interest-earning assets.
62
Rate/Volume Analysis
The following schedule presents the dollar amount of changes in interest income and interest expense for major components of interest-earning assets and interest-bearing liabilities. It distinguishes between the changes related to outstanding balances and that due to the changes in interest rates. For each category of interest-earning assets and interest-bearing liabilities, information is provided on changes attributable to (i) changes in volume (i.e., changes in volume multiplied by old rate) and (ii) changes in rate (i.e., changes in rate multiplied by old volume). For purposes of this table, changes attributable to both rate and volume, which cannot be segregated, have been allocated proportionately to the change due to volume and the change due to rate.
| Years Ended June 30, |
| Years Ended June 30, | ||||||||||||||||||||
| 2017 vs. 2016 |
| 2016 vs. 2015 | ||||||||||||||||||||
| Increase/ |
| Total |
| Increase/ |
| Total | ||||||||||||||||
(Dollars in thousands) | Volume |
| Rate |
| Volume |
| Rate |
| |||||||||||||||
Interest-earning assets: |
|
|
|
|
|
|
|
|
|
|
| ||||||||||||
Loans receivable | $ | 14,515 | |
| $ | (3,066 | ) |
| $ | 11,449 | |
| $ | 6,742 | |
| $ | (6,379 | ) |
| $ | 363 | |
Deposits in other financial institutions | (327 | ) |
| 253 | |
| (74 | ) |
| (836 | ) |
| 487 | |
| (349 | ) | ||||||
Investment securities | (479 | ) |
| 301 | |
| (178 | ) |
| 520 | |
| (18 | ) |
| 502 | | ||||||
Other | (734 | ) |
| 1,044 | |
| 310 | |
| 2,260 | |
| (385 | ) |
| 1,875 | | ||||||
Total interest-earning assets | 12,975 | |
| (1,468 | ) |
| 11,507 | |
| 8,686 | |
| (6,295 | ) |
| 2,391 | | ||||||
Interest-bearing liabilities: |
|
|
|
|
|
|
|
|
|
|
| ||||||||||||
Interest-bearing checking accounts | $ | 62 | |
| $ | 129 | |
| $ | 191 | |
| $ | 49 | |
| $ | 90 | |
| $ | 139 | |
Money market accounts | 86 | |
| 207 | |
| 293 | |
| 111 | |
| (26 | ) |
| 85 | | ||||||
Savings accounts | 17 | |
| 2 | |
| 19 | |
| 9 | |
| (24 | ) |
| (15 | ) | ||||||
Certificate accounts | (255 | ) |
| (191 | ) |
| (446 | ) |
| (589 | ) |
| 19 | |
| (570 | ) | ||||||
Borrowings | 298 | |
| 1,849 | |
| 2,147 | |
| 481 | |
| 531 | |
| 1,012 | | ||||||
Total interest-bearing liabilities | $ | 208 | |
| $ | 1,996 | |
| $ | 2,204 | |
| $ | 61 | |
| $ | 590 | |
| $ | 651 | |
Net increase in tax equivalent interest income |
|
|
|
| $ | 9,303 | |
|
|
|
|
| $ | 1,740 | | ||||||||
Comparison of Results of Operations for the Years Ended June 30, 2017 and June 30, 2016
General. During 2017 , we had net income of $11.8 million , a $391,000 or 3.4% increase compared to net income of $11.5 million earned in 2016. The Company's diluted earnings per share were $0.65 for both years ended June 30, 2017 and 2016. The leading factors in the increase of net income for both periods ended June 30, 2017 were an increase in net interest income from organic loan growth and the acquisition of TriSummit, which outpaced all merger-related expenses. The Company's earnings per share were impacted by the issuance of 765,277 new common shares in conjunction with the TriSummit acquisition on January 1, 2017.
Net Interest Income. Net interest income for 2017 was $91.2 million , a $9.5 million, or 11.6% increase from $81.7 million in 2016. During 2017, average interest-earning assets increased $187.5 million, or 7.5% to $2.7 billion compared to $2.5 billion for 2016. The $316.3 million, or 17.9% increase in average balance of loan receivables for 2017 was due to the TriSummit acquisition and increased organic loan growth, which was mainly funded by the cumulative decrease of $128.8 million, or 17.6% in average interest-earning deposits with banks, securities available for sale, and other interest-earning assets and an increase in average FHLB borrowings of $95.3 million, or 19.7%.
Net interest margin (on a fully taxable-equivalent basis) for 2017 increased 12 basis points to 3.49% from 3.37% for last year. During 2017, our leveraging strategy produced an additional $3.6 million in interest income at an average yield of 1.14%, while the average cost of the borrowings was 0.58%, resulting in approximately $1.8 million in net interest income. Our leveraging strategy produced an additional $3.3 million in interest income at an average yield of 0.81% during 2016, while the average cost of the borrowings was 0.31%, resulting in approximately $2.0 million in net interest income. Excluding the effects of the leveraging strategy, the net interest margin would have decreased five basis points to 3.88% for 2017 compared to 3.93% for 2016.
Interest Income. Total interest income for 2017 was $99.4 million, compared to $87.7 million for 2016, an increase of $11.7 million, or 13.3%.The increase was primarily driven by an $11.6 million, or 14.8% increase in loan interest income and a $196,000, or 13.4% increase in other investment income, which were partially offset by a $178,000, or 4.3% decrease in interest from securities available for sale. The additional loan interest income was due to the increase in the average balance of loans receivable and a $1.6 million increase in the accretion of purchase discounts on acquired loans to $6.1 million for 2017 from $4.5 million for 2016, as a result of early prepayments. Net interest margin is enhanced by the amortization of purchase accounting discounts on purchased loans and certificates of deposit received in recent acquisitions, which is accreted into net interest income. This additional income stems from the discount established at the time these loan portfolios were acquired and the related impact of prepayments on purchased loans. Each quarter, the Company analyzes the cash flow assumptions on loan pools purchased and, at least semi-annually, the Company updates loss estimates, prepayment speeds, and other variables when analyzing cash flows. In addition to
63
this accretion income, which is recognized over the estimated life of the loans pools, if a loan is removed from a pool due to payoff or foreclosure, the unaccreted discount in excess of losses is recognized as an accretion gain in interest income. As a result, income from loan pools can be volatile from quarter to quarter as well as year over year.
Average loan yields decreased 15 basis points to 4.44% for the year ended June 30, 2017 from 4.59% in fiscal 2016. For the years ended June 30, 2017 and 2016, the average loan yields included 29 and 26 basis points, respectively, from the accretion of purchase discounts on acquired loans.
Due to a significant number of adjustable-rate loans in the loan portfolio with interest rate floors below which the loans' contractual interest rate may not adjust, net interest income will be negatively impacted in a rising interest rate environment until such time as the current rate exceeds these interest rate floors. As of June 30, 2017, our loans with interest rate floors totaled approximately $633.8 million or 27.0% of our total loan portfolio and had a weighted average floor rate of 4.00%, $192.6 million of these loans were at their floor rate, of which $148.0 million, or 76.9%, had yields that would begin floating again once prime rates increase at least 200 basis points.
Interest Expense. Total interest expense was $8.2 million in 2017, a $2.2 million, or 36.5% increase from $6.0 million in 2016. The increase was primarily due to a 32 basis point increase in the average cost of borrowings increasing interest expense on borrowings by $2.1 million to $3.7 million for 2017 as compared to $1.5 million in 2016. In addition, average borrowings increased by $95.3 million to $577.8 million to partially fund the increase in total loans and to provide funds for the TriSummit acquisition and our leveraging strategy. The TriSummit acquisition was the leading factor for the $298.6 million increase in the average balance of interest-bearing deposits. The overall average cost of funds increased eight basis points to 0.37% for 2017 compared to 0.29% for 2016 primarily due to the impact of the recent increases in the federal funds rate on our borrowings.
Provision for Loan Losses. During 2017 and 2016, there was no provision for loan losses reflecting the decline in our required provision loan losses due to the continued improvements in our asset quality outpacing the additional provision otherwise required due to our loan growth. The provision for loan losses reflects the amount required to maintain the allowance for losses at an appropriated level based upon management's evaluation of the adequacy of general and specific loss reserves, trends in delinquencies and net charge-offs and current economic conditions.
See "Comparison of Financial Condition at June 30, 2017 and 2016 - Asset Quality and Allowance for Loan Losses" for additional details.
Noninterest Income. Noninterest income was $15.4 million for 2017 compared to $13.5 million for 2016. The $1.9 million, or 14.3% increase was primarily due to a $576,000, or 18.8% increase in mortgage banking income and fees from increases in originations of loans held for sale, a $445,000, or 27.1% increase in BOLI income, and a $385,000 gain on the sale of a previously closed branch office building. In addition, service charges on deposit accounts increased $362,000, or 5.4%, reflecting the increase in deposit accounts from the TriSummit acquisition.
Noninterest Expense. Noninterest expense was $89.6 million in 2017, a $10.7 million, or 13.6% increase from $78.9 million in 2016. The overall increase was primarily due to $7.8 million of merger-related expenses related to the TriSummit acquisition. Salaries and employee benefits expense increased $3.9 million, or 9.3% as a result of the TriSummit acquisition and an increase in stock-based compensation expense primarily driven by the increase in the Company's stock price. As a result of management's continued commitment to reduce operating expenses and the consolidation of six branches during the second quarter of 2016, there was a cumulative decrease of $773,000, or 5.4% in net occupancy expense; marketing and advertising; and telephone, postage, and supplies. This decrease was offset by an $837,000, or 14.4% increase in computer services as a result of the TriSummit acquisition. In addition, deposit insurance premiums decreased $607,000, or 30.6% due to a decline in the rates charged by the FDIC that occurred during the first quarter of fiscal 2017. REO-related expenses decreased $385,000 as a result of a $234,000 decrease in writedowns and net losses on the sale of REO properties and a $151,000 decrease in REO expenses.
Income Taxes. The provision for income taxes was $5.2 million for fiscal 2017, representing an effective tax rate of 30.5%, as compared to $4.9 million and an effective tax rate of 30.0% in 2016, as a result of higher income before taxes. During 2017 and 2016, the Company incurred a charge of $490,000 and $526,000, respectively, which related to the decrease in value of our deferred tax assets based on recent decreases in North Carolina's corporate tax rate. The rate was reduced to 4.0% in August 2015 and to 3.0% in August 2016 once certain state revenue triggers were achieved. For more information on income taxes and deferred taxes, see Note 12 of the Notes to the Consolidated Financial Statements included in Item 8 of this Form 10-K.
Comparison of Results of Operation for the Year Ended June 30, 2016 and 2015
General. During 2016, we had net income of $11.5 million a $3.4 million, or 42.8% increase compared to net income of $8.0 million earned in 2015. The Company's basic and diluted earnings per share increased to $0.65 from $0.42 per share for fiscal year 2016 compared to 2015.
Net Interest Income. Net interest income for 2016 was $81.7 million a $1.9 million, or 2.4% increase from $79.8 million in 2015. Average interest-earning assets increased $229.1 million, or 10.1% to $2.5 billion for 2016 compared to $2.3 billion in 2015, mainly from organic loan growth, purchased HELOCs, and our leveraging strategy. During 2016, the average balance of loans receivable increased $136.2 million, or 8.4% and the average interest-earning deposits with banks for 2016, decreased $119.7 million, or 36.0% as compared to 2015 as we reallocated funds to higher yielding assets. Average interest-earning deposits with other financial institutions for the year ended June 30, 2016, decreased $119.7 million, or 36.0% as compared to last year as we redeployed a substantial portion of these funds into higher yielding assets. We continue to utilize our leveraging strategy, where additional FHLB borrowings are invested in various short-term liquid assets to generate additional net interest income, as well as increased dividend income from the required purchase of additional FHLB stock. As a result, average other interest-earning assets, consisting of FRB stock, FHLB stock, and commercial paper, increased $184.1 million or 173.9% during the year ended June 30, 2016, as compared to last year.
64
Net interest margin (on a fully taxable-equivalent basis) for 2016 decreased 27 basis points to 3.37% from 3.64% for the prior year primarily due to the $237.1 million increase in average borrowings consisting of short-term FHLB borrowings and the 25 basis point increase in the federal funds rate in December 2015. During 2016, our leveraging strategy produced an additional $3.3 million in interest income at an average yield of 81 basis points, while the average cost of the borrowings was 31 basis points, resulting in approximately $2.0 million in net interest income. In comparison, our leveraging strategy produced an additional $1.3 million in interest income at an average yield of 58 basis points, while the average cost of the borrowings was 20 basis points, resulting in approximately $819,000 in net interest income for 2015. Excluding the effects of the leveraging strategy, the net interest margin would have decreased four basis points to 3.94% for 2016 compared to 3.98% for 2015.
Interest Income. Interest income for 2016 was $87.7 million, compared to $85.2 million for 2015, an increase of $2.6 million, or 3.0%. The $562,000, or 0.7% increase in interest income from loans in 2016 was a result of average loan receivables increasing $136.2 million to $1.8 billion which offset a 36 basis point decrease in the average loan yields compared to 2015. Net interest margin is enhanced by the amortization of purchase accounting discounts on purchased loans and certificates of deposit received in recent acquisitions, which is accreted into net interest income. This additional income stems from the discount established at the time these loan portfolios were acquired and the related impact of prepayments on purchased loans. Each quarter, the Company analyzes the cash flow assumptions on loan pools purchased and, at least semi-annually, the Company updates loss estimates, prepayment speeds, and other variables when analyzing cash flows. In addition to this accretion income, which is recognized over the estimated life of the loans pools, if a loan is removed from a pool due to payoff or foreclosure, the unaccreted discount in excess of losses is recognized as an accretion gain in interest income. As a result, income from loan pools can be volatile from quarter to quarter as well as year over year. Interest income on loans included $4.5 million, or 26 basis points and $5.4 million, or 33 basis points in accretion of purchase discounts on acquired loans for 2016 and 2015, respectively. Interest income from our leveraging strategy increased $2.1 million and interest income from securities available for sale increased $502,000 for 2016 compared to 2015. Partially offsetting increases in loan, leveraging, and securities available for sale interest income was a $349,000 decrease in interest income from certificates of deposit and other interest-bearing deposits.
Due to a significant number of adjustable-rate loans in the loan portfolio with interest rate floors below which the loans' contractual interest rate may not adjust, net interest income will be negatively impacted in a rising interest rate environment until such time as the current rate exceeds these interest rate floors. As of June 30, 2016, our loans with interest rate floors totaled approximately $577.0 million and had a weighted average floor rate of 4.05% of which $263.0 million, or 45.4%, had yields that would begin floating again once prime rates increase at least 200 basis points.
Interest Expense. Interest expense was $6.0 million in 2016, a $650,000, or 12.1% increase from $5.4 million in 2015. The increase was primarily due to average borrowings, increasing by $237.1 million to $482.6 million as a result of our leveraging strategy, as well as an 11 basis point increase in the average cost of borrowings increasing interest expense by $1.0 million for 2016 as compared to 2015. In addition, our deposit composition changed during the year as we continued to utilize excess liquidity to reduce higher-cost deposits. The average balance of certificates of deposit decreased $117.5 million to $504.5 million as a result of our previously mentioned managed run off, which primarily led to the $361,000 net decrease in interest expense on deposits. Partially offsetting the decline in certificates of deposit was an $88.2 million increase in average money market and checking accounts.
Provision for Loan Losses. During 2016, there was no provision for loan losses compared to $150,000 in the previous year reflecting continued improvements in our asset quality, offset by loan growth. The provision for loan losses reflects the amount required to maintain the allowance for losses at an appropriated level based upon management's evaluation of the adequacy of general and specific loss reserves, trends in delinquencies and net charge-offs and current economic conditions.
Noninterest Income. Noninterest income was $13.5 million for 2016 compared to $12.5 million for 2015. The $984,000, or 7.9% increase was primarily driven by a $750,000, or 12.6% increase in service charges on core deposit accounts corresponding to the increase in deposit accounts from prior acquisitions, an $80,000, or 2.7% increase in mortgage banking income and fees as a result of increases in brokered loan production, and a $215,000, or 6.1% increase in other noninterest income. The increase in other noninterest income was a result of having a full year of operations from our 2014 branch acquisition, which was partially offset by a $37,000 decrease in bank owned life insurance income.
Noninterest Expense. Noninterest expense was $78.9 million in 2016, a $2.7 million, or 3.3% decrease from $81.6 million 2015. The overall decrease was a result of the absence of merger-related expenses in 2016, which totaled $5.4 million in 2015, partially offset by a $1.2 million, or 3.0% increase in salaries and employee benefits, a $471,000, or 5.5% increase in net occupancy expense, a $360,000, or 14.1% increase in amortization of core deposit intangibles, and a $605,000, or 7.1% increase in other expenses, all of which were primarily related to our branch acquisition in November 2014. REO-related expenses increased $126,000 primarily as a result of a $506,000 increase in loss on sale and impairment of REO primarily due to $216,000 in net losses on REO sales for fiscal year 2016, compared to $378,000 in net gains in fiscal year 2015, partially offset by an $88,000 decrease in post-foreclosure REO impairments. Partially offsetting this increase, REO expense declined $380,000, reflecting the overall decline in the number of REO properties.
Income Taxes. The provision for income taxes was $4.9 million for fiscal 2016, representing an effective tax rate of 30.0%, as compared to $2.6 million and an effective tax rate of 24.2% in 2015. This increase was due to higher income before taxes, as well as a nonrecurring $526,000 charge incurred in the first quarter of fiscal 2016 related to the decline in value of our deferred tax assets based on decreases in North Carolina's state corporate tax rates. North Carolina's corporate tax rate decreased to 4.0% in 2016 from 5.0% and 6.0% in 2015 and 2014, respectively. In August 2016, the state announced the revenue goals had been met and the new rate for 2017 would be 3.0%.
65
Asset/Liability Management
Our Risk When Interest Rates Change. The rates of interest we earn on assets and pay on liabilities generally are established contractually for a period of time. Market interest rates change over time. Our loans generally have longer maturities than our deposits. Accordingly, our results of operations, like those of other financial institutions, are impacted by changes in interest rates and the interest rate sensitivity of our assets and liabilities. The risk associated with changes in interest rates and our ability to adapt to these changes is known as interest rate risk and is our most significant market risk. If interest rates rise, our net interest income could be reduced because interest paid on interest-bearing liabilities, including deposits and borrowings, could increase more quickly than interest received on interest-earning assets, including loans and other investments. In addition, rising interest rates may hurt our income because they may reduce the demand for loans.
How We Measure Our Risk of Interest Rate Changes. As part of our process to manage our exposure to changes in interest rates and comply with applicable regulations, we monitor our interest rate risk. In monitoring interest rate risk we continually analyze and manage assets and liabilities based on market conditions, their payment streams and interest rates, the timing of their maturities, their sensitivity to actual or potential changes in market interest rates, and interest rate sensitivities of the Company's non-maturity deposits with respect to interest rates paid and the level of balances. The board of directors sets the asset and liability policy of HomeTrust Bank, which is implemented by management and an asset/liability committee whose members include certain members of senior management.
The purpose of this committee is to communicate, coordinate and control asset/liability management consistent with our business plan and board approved policies. The committee establishes and monitors the volume and mix of assets and funding sources taking into account relative costs and spreads, interest rate sensitivity and liquidity needs. The objectives are to manage assets and funding sources to produce results that are consistent with liquidity, capital adequacy, growth, risk, and profitability goals.
The committee generally meets on a quarterly basis to review, among other things, economic conditions and interest rate outlook, current and projected liquidity needs and capital position, anticipated changes in the volume and mix of assets and liabilities and interest rate risk exposure limits versus current projections pursuant to net present value of portfolio equity analysis and income simulations. The committee recommends appropriate strategy changes based on this review. The committee is responsible for reviewing and reporting on the effects of the policy implementations and strategies to the board of directors at least quarterly.
Among the techniques we use to manage interest rate risk are: (i) increasing our portfolio of hybrid and adjustable-rate one-to-four family residential loans and commercial loans; (ii) maintaining a strong capital position, which provides for a favorable level of interest-earning assets relative to interest-bearing liabilities; and (iii) emphasizing less interest rate sensitive and lower-costing "core deposits." We also maintain a portfolio of short-term or adjustable-rate assets and use fixed-rate FHLB advances and brokered deposits to extend the term to repricing of our liabilities.
We consider the relatively short duration of our deposits in our overall asset/liability management process. Should short-term rates increase, we have assets and liabilities that will increase with the market. This is reflected in the small change in our present value equity ("PVE") when rates increase (see the table below). PVE is defined as the net present value of our existing assets and liabilities. In addition, we have historically demonstrated an ability to maintain retail deposits through various interest rate cycles. If local retail deposit rates increase dramatically, we also have access to wholesale funding through our lines of credit with the FHLB and FRB, as well as through the brokered deposit market to replace retail deposits, as needed.
Depending on the level of general interest rates, the relationship between long- and short-term interest rates, market conditions and competitive factors, the committee may in the future determine to increase our interest rate risk position somewhat in order to maintain or increase our net interest margin. In particular, we believe that the increased net interest income resulting from a mismatch in the maturity of our assets and liabilities portfolios can, during periods of stable or declining interest rates, provide high enough returns to justify increased exposure to sudden and unexpected increases in interest rates. As a result of this philosophy, our results of operations and the economic value of our equity will remain vulnerable to increases in interest rates and to declines due to differences between long- and short-term interest rates.
The committee regularly reviews interest rate risk by forecasting the impact of alternative interest rate environments on net interest income and our PVE. The committee also valuates these impacts against the potential changes in net interest income and market value of our portfolio equity that are monitored by the board of directors of HomeTrust Bank generally on a quarterly basis.
Our asset/liability management strategy sets limits on the change in PVE given certain changes in interest rates. The table presented here, as of June 30, 2017 , is forward-looking information about our sensitivity to changes in interest rates. The table incorporates data from an independent service, as it relates to maturity repricing and repayment/withdrawal of interest-earning assets and interest-bearing liabilities. Interest rate risk is measured by changes in PVE for instantaneous parallel shifts in the yield curve up and down 400 basis points. Given the relatively low level of market interest rates, a PVE calculation for a decrease of greater than 100 basis points has not been prepared. An increase in rates would slightly increase our PVE because the repricing of nonmaturing deposits tend to lag behind the increase in market rates. This positive impact is partially offset by the negative effect from our loans with interest rate floors which will not adjust until such time as a loan's current interest rate adjusts to an increase in market rates which exceeds the interest rate floor. Conversely, in a falling interest rate environment these interest rate floors will assist in maintaining our net interest income. As of June 30, 2017 , our loans with interest rate floors totaled approximately $633.8 million or 27.0% of our total loan portfolio and had a weighted average floor rate of 4.00%, $192.6 million of these loans were at their floor rate, of which $148.0 million, or 76.9%, had yields that would begin floating again once prime rates increase at least 200 basis points.
66
June 30, 2017 | ||||||||||||||
Change in Interest Rates in |
| Present Value Equity |
| PVE | ||||||||||
Basis Points |
| Amount |
| $ Change |
| % Change |
| Ratio | ||||||
(Dollars in Thousands) | ||||||||||||||
+ 400 |
| $ | 634,443 | |
| $ | (12,059 | ) |
| (2 | )% |
| 22 | % |
+ 300 |
| 642,843 | |
| (3,659 | ) |
| (1 | ) |
| 22 | | ||
+ 200 |
| 648,508 | |
| 2,006 | |
| - | |
| 21 | | ||
+ 100 |
| 649,758 | |
| 3,256 | |
| 1 | |
| 21 | | ||
Base |
| 646,502 | |
| - | |
| - | |
| 21 | | ||
- 100 |
| 607,819 | |
| (38,683 | ) |
| (6 | ) |
| 19 | | ||
In evaluating our exposure to interest rate movements, certain shortcomings inherent in the method of analysis presented in the foregoing table must be considered. For example, although certain assets and liabilities may have similar maturities or repricing periods, they may react in different degrees to changes in market interest rates. Also, the interest rates on certain types of assets and liabilities may fluctuate in advance of changes in market interest rates, while interest rates on other types may lag behind changes in interest rates. Additionally, certain assets, such as adjustable rate mortgages, have features which restrict changes in interest rates on a short-term basis and over the life of the asset. Further, in the event of a significant change in interest rates, prepayment and early withdrawal levels would likely deviate significantly from those assumed above. Finally, the ability of many borrowers to service their debt may decrease in the event of an interest rate increase. We consider all of these factors in monitoring our exposure to interest rate risk.
The board of directors and management of HomeTrust Bank believe that certain factors afford HomeTrust Bank the ability to operate successfully despite its exposure to interest rate risk. HomeTrust Bank may manage its interest rate risk by originating and retaining adjustable rate loans in its portfolio, by borrowing from the FHLB to match the duration of our funding to the duration of originated fixed rate one-to-four family and commercial loans held in portfolio and by selling on an ongoing basis certain currently originated longer term fixed rate one-to-four family real estate loans.
Liquidity
Management maintains a liquidity position that it believes will adequately provide funding for loan demand and deposit run-off that may occur in the normal course of business. We rely on a number of different sources in order to meet our potential liquidity demands. The primary sources are increases in deposit accounts and cash flows from loan payments and the securities portfolio.
In addition to these primary sources of funds, management has several secondary sources available to meet potential funding requirements. As of June 30, 2017 , HomeTrust Bank had an additional borrowing capacity of $22.3 million with the FHLB of Atlanta, a $105.5 million line of credit with the FRB, and three lines of credit with three unaffiliated banks totaling $60.0 million. At June 30, 2017 , we had $696.5 million in FHLB advances outstanding as part of the previously discussed leveraging strategy. Additionally, the Company classifies its securities portfolio as available for sale, providing an additional source of liquidity. Management believes that our security portfolio is of high quality and the securities would therefore be marketable. In addition, we have historically sold fixed-rate mortgage loans in the secondary market to reduce interest rate risk and to create still another source of liquidity. From time to time we also utilize brokered time deposits to supplement our other sources of funds. Brokered time deposits are obtained by utilizing an outside broker that is paid a fee. This funding requires advance notification to structure the type of deposit desired by us. Brokered deposits can vary in term from one month to several years and have the benefit of being a source of longer-term funding. We also utilize brokered deposits to help manage interest rate risk by extending the term to repricing of our liabilities, enhance our liquidity and fund asset growth. Brokered deposits are typically from outside our primary market areas, and our brokered deposit levels may vary from time to time depending on competitive interest rate conditions and other factors. At June 30, 2017 , brokered deposits totaled $16.8 million or 0.82% of total deposits.
Liquidity management is both a daily and long-term function of business management. Excess liquidity is generally invested in short-term investments, such as overnight deposits and federal funds. On a longer term basis, we maintain a strategy of investing in various lending products and investment securities, including mortgage-backed securities. The Company on a stand-alone level is a separate legal entity from HomeTrust Bank and must provide for its own liquidity and pay its own operating expenses. The Company's primary source of funds consists of the net proceeds retained by the Company from the Conversion. We also have the ability to receive dividends or capital distributions from HomeTrust Bank, although there are regulatory restrictions on the ability of HomeTrust Bank to pay dividends. At June 30, 2017 , the Company (on an unconsolidated basis) had liquid assets of $18.3 million.
We use our sources of funds primarily to meet our ongoing commitments, pay maturing deposits and fund withdrawals, and to fund loan commitments. At June 30, 2017 , the total approved loan commitments and unused lines of credit outstanding amounted to $202.1 million and $414.4 million , respectively, as compared to $164.8 million and $340.4 million , respectively, as of June 30, 2016. Certificates of deposit scheduled to mature in one year or less at June 30, 2017 , totaled $333.8 million . It is management's policy to manage deposit rates that are competitive with other local financial institutions. Based on this management strategy, we believe that a majority of maturing deposits will remain with us.
67
During fiscal 2017 , cash and cash equivalents increased $34.4 million , or 65.4% , from $52.6 million as of June 30, 2016 to $87.0 million as of June 30, 2017 primarily due to the increase in borrowings to partially fund the increase in total loans, and to provide funds for the TriSummit acquisition and our leveraging strategy. Cash provided by operating activities of $15.1 million and financing activities of $126.0 million was partially offset by cash used in investing activities of $106.8 million . Primary sources of cash for the year ended June 30, 2017 included proceeds from an increase in borrowings of $158.0 million, the maturities and sales of investment securities of $46.4 million, the maturities of commercial paper, net of purchases, of $81.0 million, the maturities of certificates of deposit in other banks, net of purchases, of $29.5 million, and principal repayments of mortgage-backed securities of $23.9 million. Primary uses of cash during the period included, the purchase of securities available for sale of $15.1 million, a $34.5 million decrease in net deposits, an increase in portfolio loans of $255.9 million, a $2.8 million increase in fixed asset purchases, and $10.6 million for the TriSummit acquisition, net of cash received. All sources and uses of cash reflect our cash management strategy to increase our amount of higher yielding investments and loans, reducing our holdings in lower yielding investments and increasing our lower costing deposits.
During fiscal 2016, cash and cash equivalents decreased $63.6 million, or 54.7%, from $116.2 million as of June 30, 2015 to $52.6 million as of June 30, 2016 primarily due to management's decision to reduce excess cash by redeploying it to fund higher yielding loan growth and by reducing higher cost certificates of deposit. Cash provided by operating activities of $28.7 million was offset by cash used in investing activities of $10.9 million and financing activities of $81.4 million. Primary sources of cash for the year ended June 30, 2016 included proceeds from an
increase in borrowings of $16.0 million, the maturities of investment securities of $100.8 million, the maturities of commercial paper, net of purchases, of $28.0 million, the maturities of certificates of deposit in other banks, net of purchases, of $49.1 million, and proceeds from the sale of REO of $2.8 million. Primary uses of cash during the period included, the purchase of securities available for sale of $66.0 million, a $69.4 million decrease in net deposits, $27.7 million used to repurchase common stock, and an increase in portfolio loans of $147.6 million. All
sources and uses of cash reflect our cash management strategy to increase our amount of higher yielding investments and loans, reducing our holdings in lower yielding investments and increasing our lower costing deposits.
Contractual Obligations
The following table presents the Company's significant contractual obligations at June 30, 2017 (in thousands):
| 1 Year or Less |
| Over 1 to 3 Years |
| Over 3 to 5 Years |
| More Than 5 Years |
| Total | ||||||||||
Borrowings | $ | 696,500 | |
| $ | - | |
| $ | - | |
| $ | - | |
| $ | 696,500 | |
Capital lease | 123 | |
| 400 | |
| 412 | |
| 1,995 | |
| 2,930 | | |||||
Operating leases | 1,697 | |
| 2,195 | |
| 757 | |
| 1,293 | |
| 5,942 | | |||||
Total contractual obligations | $ | 698,320 | |
| $ | 2,595 | |
| $ | 1,169 | |
| $ | 3,288 | |
| $ | 705,372 | |
Off-Balance Sheet Activities
In the normal course of operations, we engage in a variety of financial transactions that are not recorded in our financial statements. These transactions involve varying degrees of off-balance sheet credit, interest rate and liquidity risks. These transactions are used primarily to manage customers' requests for funding and take the form of loan commitments and lines of credit. For the year ended June 30, 2017 , we engaged in no off-balance sheet transactions likely to have a material effect on our financial condition, results of operations or cash flows.
A summary of our off-balance sheet commitments to extend credit at June 30, 2017 , is as follows (in thousands):
Undisbursed portion of construction loans |
| $ | 158,380 | |
Commitments to make loans |
| 43,730 | | |
Unused lines of credit |
| 414,373 | | |
Unused letters of credit |
| 5,164 | | |
Total loan commitments |
| $ | 577,917 | |
Capital Resources
At June 30, 2017 , equity totaled $397.6 million. Management monitors the capital levels of the Company to provide for current and future business opportunities and to ensure HomeTrust Bank meets regulatory guidelines for "well-capitalized" institutions.
HomeTrust Bancshares, Inc. is a bank holding company and a financial holding company subject to regulation by the Federal Reserve. As a bank holding company, we are subject to capital adequacy requirements of the Federal Reserve under the BHCA and the regulations of the Federal Reserve. Our subsidiary, the Bank, an FDIC-insured, North Carolina state-chartered bank and a member of the Federal Reserve System, is supervised and regulated by the Federal Reserve and the NCCOB and is subject to minimum capital requirements applicable to state member banks established by the Federal Reserve that are calculated in the same manner to those applicable to bank holding companies.
HomeTrust Bancshares, Inc. and the Bank are required to maintain specified levels of regulatory capital under federal banking regulations. The capital adequacy requirements are quantitative measures established by regulation that require HomeTrust Bancshares, Inc. and the Bank to
68
maintain minimum amounts and ratios of capital. HomeTrust Bancshares, Inc.'s and the Bank's capital amounts and classification are also subject to qualitative judgments by the regulators about components, risk weightings and other factors. Failure to meet minimum capital requirements can initiate certain mandatory and possibly additional discretionary actions by bank regulators that, if undertaken, could have a direct material effect on the Company's financial statements. At June 30, 2017 , HomeTrust Bancshares, Inc. and the Bank each exceeded all regulatory capital requirements.
Consistent with our goals to operate a sound and profitable organization, our policy is for the Bank to maintain a "well-capitalized" status under the regulatory capital categories of the Federal Reserve. As of June 30, 2017 , the Bank was considered "well capitalized" in accordance with its regulatory capital guidelines and exceeded all regulatory capital requirements with Common Equity Tier 1, Tier 1 Risk-Based, Total Risk-Based, and Tier 1 Leverage capital ratios of 11.68% , 11.68% , 12.50% , and 9.97% , respectively. As of June 30, 2016, Common Equity Tier 1, Tier 1 Risk-Based, Total Risk-Based, and Tier 1 Leverage capital ratios were 12.80% , 12.80% , 13.79% , and 10.50% , respectively.
As of June 30, 2017 , HomeTrust Bancshares, Inc. exceeded all regulatory capital requirements with Common Equity Tier 1, Tier 1 Risk-Based, Total Risk-Based, and Tier 1 Leverage capital ratios of 13.07% , 13.07% , 13.89% , and 11.13% , respectively. As of June 30, 2016, Common Equity Tier 1, Tier 1 Risk-Based, Total Risk-Based, and Tier 1 Leverage capital ratios were 14.39% , 14.39% , 15.38% , and 11.78% , respectively.
See Item 1, "Business-How We are Regulated," and Note 18 of the Notes to the Consolidated Financial Statements included in Item 8 of this Form 10-K for additional details on the Company's capital requirements.
Impact of Inflation
The Consolidated Financial Statements and related financial data presented herein have been prepared in accordance with accounting principles generally accepted in the United States of America. These principles generally require the measurement of financial position and operating results in terms of historical dollars, without considering changes in the relative purchasing power of money over time due to inflation.
Unlike most industrial companies, virtually all the assets and liabilities of a financial institution are monetary in nature. The primary impact of inflation is reflected in the increased cost of our operations. As a result, interest rates generally have a more significant impact on a financial institution's performance than do general levels of inflation. Interest rates do not necessarily move in the same direction or to the same extent as the prices of goods and services. In a period of rapidly rising interest rates, the liquidity and maturity structures of our assets and liabilities are critical to the maintenance of acceptable performance levels.
The principal effect of inflation on earnings, as distinct from levels of interest rates, is in the area of noninterest expense. Expense items such as employee compensation, employee benefits, and occupancy and equipment costs may be subject to increases as a result of inflation. An additional effect of inflation is the possible increase in dollar value of the collateral securing loans that we have made. Our management is unable to determine the extent, if any, to which properties securing loans have appreciated in dollar value due to inflation.
Recent Accounting Pronouncements
For a discussion of recent accounting pronouncements, see Note 1 of the Notes to the Consolidated Financial Statements included in Item 8 of this Form 10-K for additional details on the Company's capital requirements.
Item 7A. Quantitative and Qualitative Disclosures About Market Risk
Market risk is the risk of loss from adverse changes in market prices and rates. Our market risk arises principally from interest rate risk inherent in our lending, investing, deposit and borrowings activities. Management actively monitors and manages its interest rate risk exposure. In addition to other risks that we manage in the normal course of business, such as credit quality and liquidity, management considers interest rate risk to be a significant market risk that could have a potentially material effect on our financial condition and result of operations. The information contained in Item 7, "Management's Discussion and Analysis of Financial Condition and Results of Operations – Asset Liability Management" in this Form 10-K is incorporated herein by reference.
69
Item 8. Financial Statements and Supplementary Data
INDEX TO CONSOLIDATED FINANCIAL STATEMENTS
| Page |
Report of Independent Registered Public Accounting Firm | 71 |
Consolidated Balance Sheets, June 30, 2017 and 2016 | 72 |
Consolidated Statements of Income for the Years Ended June 30, 2017, 2016 and 2015 | 73 |
Consolidated Statements of Comprehensive Income for the Years Ended June 30, 2017, 2016 and 2015 | 74 |
Consolidated Statements of Changes in Stockholders' Equity for the Years Ended June 30, 2017, 2016 and 2015 | 75 |
Consolidated Statements of Cash Flows for the Years Ended June 30, 2017, 2016 and 2015 | 76 |
Notes to Consolidated Financial Statements for the Years Ended June 30, 2017, 2016 and 2015 | 78 |
** | This annual report does not include an attestation report of the Company's independent registered public accounting firm regarding internal control over financial reporting. As an emerging growth company, management's report was not subject to attestation by the Company's independent registered public accounting firm in accordance with the JOBS Act. |
70

Report of Independent Registered Public Accounting Firm
To the Stockholders and the Board of Directors
HomeTrust Bancshares, Inc. and Subsidiary
We have audited the accompanying consolidated balance sheets of HomeTrust Bancshares, Inc. and Subsidiary (the Company) as of June 30, 2017 and 2016, and the related consolidated statements of income, comprehensive income, changes in stockholders' equity and cash flows for each of the years in the three-year period ended June 30, 2017. These consolidated financial statements are the responsibility of the Company's management. Our responsibility is to express an opinion on these financial statements based on our audits.
We conducted our audits in accordance with the standards of the Public Company Accounting Oversight Board (United States). Those standards require that we plan and perform the audit to obtain reasonable assurance about whether the financial statements are free of material misstatement. An audit includes examining, on a test basis, evidence supporting the amounts and disclosures in the financial statements. An audit also includes assessing the accounting principles used and significant estimates made by management, as well as evaluating the overall financial statement presentation. We believe that our audits provide a reasonable basis for our opinion.
In our opinion, the consolidated financial statements referred to above present fairly, in all material respects, the financial position of HomeTrust Bancshares, Inc. and its Subsidiary as of June 30, 2017 and 2016, and the results of their operations and their cash flows for each of the years in the three-year period ended June 30, 2017 in conformity with accounting principles generally accepted in the United States of America.
/s/ DIXON HUGHES GOODMAN LLP
Asheville, North Carolina
September 12, 2017
71
HOMETRUST BANCSHARES, INC. AND SUBSIDIARY
Consolidated Balance Sheets
(Dollars in thousands, except per share data)
| June 30, | ||||||
| 2017 |
| 2016 | ||||
Assets |
|
|
| ||||
Cash | $ | 41,982 | |
| $ | 29,947 | |
Interest-bearing deposits | 45,003 | |
| 22,649 | | ||
Cash and cash equivalents | 86,985 | |
| 52,596 | | ||
Commercial paper | 149,863 | |
| 229,859 | | ||
Certificates of deposit in other banks | 132,274 | |
| 161,512 | | ||
Securities available for sale, at fair value | 199,667 | |
| 200,652 | | ||
Other investments, at cost | 39,355 | |
| 29,486 | | ||
Loans held for sale | 5,607 | |
| 5,783 | | ||
Total loans, net of deferred loan fees | 2,351,470 | |
| 1,832,831 | | ||
Allowance for loan losses | (21,151 | ) |
| (21,292 | ) | ||
Net loans | 2,330,319 | |
| 1,811,539 | | ||
Premises and equipment, net | 63,648 | |
| 54,231 | | ||
Accrued interest receivable | 8,758 | |
| 7,405 | | ||
Real estate owned (REO) | 6,318 | |
| 5,956 | | ||
Deferred income taxes | 57,387 | |
| 54,153 | | ||
Bank owned life insurance (BOLI) | 85,981 | |
| 79,858 | | ||
Goodwill | 25,638 | |
| 12,673 | | ||
Core deposit intangibles | 7,173 | |
| 7,136 | | ||
Other assets | 7,560 | |
| 4,838 | | ||
Total Assets | $ | 3,206,533 | |
| $ | 2,717,677 | |
Liabilities and Stockholders' Equity |
| |
|
| | ||
Liabilities |
| |
|
| | ||
Deposits | $ | 2,048,451 | |
| $ | 1,802,696 | |
Borrowings | 696,500 | |
| 491,000 | | ||
Capital lease obligations | 1,937 | |
| 1,958 | | ||
Other liabilities | 61,998 | |
| 62,047 | | ||
Total liabilities | 2,808,886 | |
| 2,357,701 | | ||
Stockholders' Equity |
| |
|
| | ||
Preferred stock, $0.01 par value, 10,000,000 shares authorized, none issued or outstanding | - | |
| - | | ||
Common stock, $0.01 par value, 60,000,000 shares authorized, 18,967,875, shares issued and outstanding at June 30, 2017; 17,998,750 at June 30, 2016 | 190 | |
| 180 | | ||
Additional paid in capital | 213,459 | |
| 186,104 | | ||
Retained earnings | 191,660 | |
| 179,813 | | ||
Unearned Employee Stock Ownership Plan (ESOP) shares | (7,935 | ) |
| (8,464 | ) | ||
Accumulated other comprehensive income | 273 | |
| 2,343 | | ||
Total stockholders' equity | 397,647 | |
| 359,976 | | ||
Total Liabilities and Stockholders' Equity | $ | 3,206,533 | |
| $ | 2,717,677 | |
The accompanying notes are an integral part of these consolidated financial statements.
72
HOMETRUST BANCSHARES, INC. AND SUBSIDIARY
Consolidated Statements of Income
(Dollars in thousands, except per share data)
| June 30, | ||||||||||
| 2017 |
| 2016 |
| 2015 | ||||||
Interest and Dividend Income |
|
|
|
|
| ||||||
Loans | $ | 90,069 | |
| $ | 78,437 | |
| $ | 77,875 | |
Securities available for sale | 3,983 | |
| 4,161 | |
| 3,659 | | |||
Certificates of deposit and other interest-bearing deposits | 3,725 | |
| 3,686 | |
| 2,747 | | |||
Other investments | 1,659 | |
| 1,463 | |
| 875 | | |||
Total interest and dividend income | 99,436 | |
| 87,747 | |
| 85,156 | | |||
Interest Expense |
| |
|
| |
|
| | |||
Deposits | 4,588 | |
| 4,531 | |
| 4,892 | | |||
Borrowings | 3,657 | |
| 1,509 | |
| 498 | | |||
Total interest expense | 8,245 | |
| 6,040 | |
| 5,390 | | |||
Net Interest Income | 91,191 | |
| 81,707 | |
| 79,766 | | |||
Provision for Loan Losses | - | |
| - | |
| 150 | | |||
Net Interest Income after Provision for Loan Losses | 91,191 | |
| 81,707 | |
| 79,616 | | |||
Noninterest Income |
| |
|
| |
|
| | |||
Service charges and fees on deposit accounts | 7,042 | |
| 6,680 | |
| 5,930 | | |||
Mortgage banking income and fees | 3,645 | |
| 3,069 | |
| 2,989 | | |||
BOLI income | 2,088 | |
| 1,643 | |
| 1,651 | | |||
Gain from sale of premises and equipment | 385 | |
| 10 | |
| - | | |||
Gain from sales of securities available for sale | 22 | |
| - | |
| 61 | | |||
Other, net | 2,258 | |
| 2,101 | |
| 1,888 | | |||
Total noninterest income | 15,440 | |
| 13,503 | |
| 12,519 | | |||
Noninterest Expense |
| |
|
| |
|
| | |||
Salaries and employee benefits | 46,446 | |
| 42,491 | |
| 41,265 | | |||
Net occupancy expense | 9,121 | |
| 9,106 | |
| 8,635 | | |||
Marketing and advertising | 1,670 | |
| 2,037 | |
| 2,048 | | |||
Telephone, postage, and supplies | 2,732 | |
| 3,153 | |
| 3,141 | | |||
Deposit insurance premiums | 1,378 | |
| 1,985 | |
| 1,922 | | |||
Computer services | 6,650 | |
| 5,813 | |
| 5,972 | | |||
Loss on sale and impairment of REO | 300 | |
| 534 | |
| 28 | | |||
REO expense | 1,114 | |
| 1,265 | |
| 1,645 | | |||
Core deposit intangible amortization | 2,823 | |
| 2,907 | |
| 2,547 | | |||
Merger-related expenses | 7,805 | |
| - | |
| 5,417 | | |||
Impairment charges for branch consolidation | - | |
| 400 | |
| 375 | | |||
Other | 9,553 | |
| 9,162 | |
| 8,557 | | |||
Total noninterest expense | 89,592 | |
| 78,853 | |
| 81,552 | | |||
Income Before Income Taxes | 17,039 | |
| 16,357 | |
| 10,583 | | |||
Income Tax Expense | 5,192 | |
| 4,901 | |
| 2,558 | | |||
Net Income | $ | 11,847 | |
| $ | 11,456 | |
| $ | 8,025 | |
Per Share Data: |
| |
|
| |
|
| | |||
Net income per common share: |
| |
|
| |
|
| | |||
Basic | $ | 0.66 | |
| $ | 0.65 | |
| $ | 0.42 | |
Diluted | $ | 0.65 | |
| $ | 0.65 | |
| $ | 0.42 | |
Average shares outstanding: |
| |
|
| |
|
| | |||
Basic | 17,379,487 | |
| 17,417,046 | |
| 19,038,098 | | |||
Diluted | 17,956,443 | |
| 17,606,689 | |
| 19,117,902 | | |||
The accompanying notes are an integral part of these consolidated financial statements.
73
HOMETRUST BANCSHARES, INC. AND SUBSIDIARY
Consolidated Statements of Comprehensive Income
(Dollars in thousands)
| June 30, | ||||||||||
| 2017 |
| 2016 |
| 2015 | ||||||
Net Income | $ | 11,847 | |
| $ | 11,456 | |
| $ | 8,025 | |
Other Comprehensive Income (Loss) |
| |
|
| |
|
| | |||
Unrealized holding gains (losses) on securities available for sale |
| |
|
| |
|
| | |||
Gains (losses) arising during the period | $ | (3,113 | ) |
| $ | 2,233 | |
| $ | 1,002 | |
Deferred income tax benefit (expense) | 1,058 | |
| (760 | ) |
| (340 | ) | |||
Reclassification of securities gains recognized in net income | (22 | ) |
| - | |
| (57 | ) | |||
Deferred income tax expense | 7 | |
| - | |
| 20 | | |||
Total other comprehensive income (loss) | $ | (2,070 | ) |
| $ | 1,473 | |
| $ | 625 | |
Comprehensive Income | $ | 9,777 | |
| $ | 12,929 | |
| $ | 8,650 | |
The accompanying notes are an integral part of these consolidated financial statements.
74
HOMETRUST BANCSHARES, INC. AND SUBSIDIARY
Consolidated Statements of Changes in Stockholders' Equity
(Dollars in thousands)
| Common Stock |
| Additional Paid In Capital |
| Retained Earnings |
| Unearned ESOP Shares |
| Accumulated Other Comprehensive Income (Loss) |
| Total Stockholders' Equity | |||||||||||||||
| Shares |
| Amount |
|
|
|
|
| ||||||||||||||||||
Balance at June 30, 2014 | 20,632,008 | |
| $ | 207 | |
| $ | 225,889 | |
| $ | 160,332 | |
| $ | (9,522 | ) |
| $ | 245 | |
| $ | 377,151 | |
Net income | - | |
| - | |
| - | |
| 8,025 | |
| - | |
| - | |
| 8,025 | | ||||||
Stock repurchased | (1,147,927 | ) |
| (12 | ) |
| (18,458 | ) |
| - | |
| - | |
| - | |
| (18,470 | ) | ||||||
Granted restricted stock | - | |
| - | |
| - | |
| - | |
| - | |
| - | |
| - | | ||||||
Forfeited restricted stock | (1,600 | ) |
| - | |
| - | |
| - | |
| - | |
| - | |
| - | | ||||||
Retired stock | (12,032 | ) |
| | |
| (188 | ) |
| | |
| | |
| | |
| (188 | ) | ||||||
Exercised stock options | 18,000 | |
| - | |
| 259 | |
| - | |
| - | |
| - | |
| 259 | | ||||||
Stock option expense | - | |
| - | |
| 1,394 | |
| - | |
| - | |
| - | |
| 1,394 | | ||||||
Restricted stock expense | - | |
| - | |
| 1,427 | |
| - | |
| - | |
| - | |
| 1,427 | | ||||||
ESOP shares allocated | - | |
| - | |
| 298 | |
| - | |
| 529 | |
| - | |
| 827 | | ||||||
Other comprehensive income | - | |
| - | |
| - | |
| - | |
| - | |
| 625 | |
| 625 | | ||||||
Balance at June 30, 2015 | 19,488,449 | |
| $ | 195 | |
| $ | 210,621 | |
| $ | 168,357 | |
| $ | (8,993 | ) |
| $ | 870 | |
| $ | 371,050 | |
Net income | - | |
| - | |
| - | |
| 11,456 | |
| - | |
| - | |
| 11,456 | | ||||||
Stock repurchased | (1,510,994 | ) |
| (15 | ) |
| (27,719 | ) |
| - | |
| - | |
| - | |
| (27,734 | ) | ||||||
Granted restricted stock | 34,500 | |
| - | |
| - | |
| - | |
| - | |
| - | |
| - | | ||||||
Forfeited restricted stock | (2,550 | ) |
| - | |
| - | |
| - | |
| - | |
| - | |
| - | | ||||||
Retired stock | (12,855 | ) |
|
|
| (223 | ) |
|
|
|
|
|
|
| (223 | ) | ||||||||||
Exercised stock options | 2,200 | |
| - | |
| 32 | |
| - | |
| - | |
| - | |
| 32 | | ||||||
Stock option expense | - | |
| - | |
| 1,512 | |
| - | |
| - | |
| - | |
| 1,512 | | ||||||
Restricted stock expense | - | |
| - | |
| 1,427 | |
| - | |
| - | |
| - | |
| 1,427 | | ||||||
ESOP shares allocated | - | |
| - | |
| 454 | |
| - | |
| 529 | |
| - | |
| 983 | | ||||||
Other comprehensive income | - | |
| - | |
| - | |
| - | |
| - | |
| 1,473 | |
| 1,473 | | ||||||
Balance at June 30, 2016 | 17,998,750 | |
| $ | 180 | |
| $ | 186,104 | |
| $ | 179,813 | |
| $ | (8,464 | ) |
| $ | 2,343 | |
| $ | 359,976 | |
Net income | - | |
| - | |
| - | |
| 11,847 | |
| - | |
| - | |
| 11,847 | | ||||||
Granted restricted stock | 47,500 | |
| - | |
| - | |
| - | |
| - | |
| - | |
| - | | ||||||
Forfeited restricted stock | (6,000 | ) |
| - | |
| - | |
| - | |
| - | |
| - | |
| - | | ||||||
Retired stock | (22,794 | ) |
| - | |
| (569 | ) |
| - | |
| - | |
| - | |
| (569 | ) | ||||||
Exercised stock options | 185,142 | |
| 3 | |
| 3,065 | |
| - | |
| - | |
| - | |
| 3,068 | | ||||||
Shares issued for TriSummit Bancorp, Inc. merger | 765,277 | |
| 7 | |
| 20,036 | |
| - | |
| - | |
| - | |
| 20,043 | | ||||||
Stock option expense | - | |
| - | |
| 2,627 | |
| - | |
| - | |
| - | |
| 2,627 | | ||||||
Restricted stock expense | - | |
| - | |
| 1,539 | |
| - | |
| - | |
| - | |
| 1,539 | | ||||||
ESOP shares allocated | - | |
| - | |
| 657 | |
| - | |
| 529 | |
| - | |
| 1,186 | | ||||||
Other comprehensive income | - | |
| - | |
| - | |
| - | |
| - | |
| (2,070 | ) |
| (2,070 | ) | ||||||
Balance at June 30, 2017 | 18,967,875 | |
| $ | 190 | |
| $ | 213,459 | |
| $ | 191,660 | |
| $ | (7,935 | ) |
| $ | 273 | |
| $ | 397,647 | |
The accompanying notes are an integral part of these consolidated financial statements.
75
HOMETRUST BANCSHARES, INC. AND SUBSIDIARY
Consolidated Statements of Cash Flows
(Dollars in thousands)
| June 30, | ||||||||||
| 2017 |
| 2016 |
| 2015 | ||||||
Operating Activities: |
|
|
|
|
| ||||||
Net income | $ | 11,847 | |
| $ | 11,456 | |
| $ | 8,025 | |
Adjustments to reconcile net income to net cash provided by operating activities: |
|
|
| |
|
| | ||||
Provision for loan losses | - | |
| - | |
| 150 | | |||
Depreciation | 3,816 | |
| 4,035 | |
| 3,776 | | |||
Deferred income tax expense | 4,947 | |
| 4,581 | |
| 2,286 | | |||
Net amortization and accretion | (6,658 | ) |
| (3,986 | ) |
| (4,806 | ) | |||
Gain on sale of premises and equipment | (385 | ) |
| (10 | ) |
| - | | |||
Loss on sale and impairment of REO | 300 | |
| 534 | |
| 28 | | |||
BOLI income | (2,088 | ) |
| (1,643 | ) |
| (1,651 | ) | |||
Gain from sales of securities available for sale | (22 | ) |
| - | |
| (61 | ) | |||
Gain on sale of loans held for sale | (2,674 | ) |
| (1,643 | ) |
| (1,651 | ) | |||
Origination of loans held for sale | (134,258 | ) |
| (91,963 | ) |
| (74,353 | ) | |||
Proceeds from sales of loans held for sale | 137,108 | |
| 93,697 | |
| 72,667 | | |||
Decrease in deferred loan fees, net | (1,317 | ) |
| (349 | ) |
| (1,363 | ) | |||
Decrease (increase) in accrued interest receivable and other assets | (2,727 | ) |
| 8,295 | |
| (1,343 | ) | |||
Core deposit intangible amortization | 2,823 | |
| 2,907 | |
| 2,547 | | |||
ESOP compensation expense | 1,186 | |
| 983 | |
| 827 | | |||
Restricted stock and stock option expense | 4,166 | |
| 2,939 | |
| 2,821 | | |||
Increase in other liabilities | (949 | ) |
| (912 | ) |
| (5,685 | ) | |||
Net cash provided by operating activities | 15,115 | |
| 28,921 | |
| 2,214 | | |||
Investing Activities: |
| |
|
| |
|
| | |||
Purchase of securities available for sale | (15,082 | ) |
| (66,000 | ) |
| (135,830 | ) | |||
Proceeds from sales of securities available for sale | 19,279 | |
| - | |
| 10,387 | | |||
Proceeds from maturities of securities available for sale | 27,145 | |
| 100,836 | |
| 41,340 | | |||
Maturities (purchase) of commercial paper, net | 81,821 | |
| 28,004 | |
| (255,727 | ) | |||
Purchase of certificates of deposit in other banks | (41,988 | ) |
| (49,638 | ) |
| (101,904 | ) | |||
Maturities of certificates of deposit in other banks | 71,476 | |
| 98,755 | |
| 55,055 | | |||
Principal repayments of mortgage-backed securities | 23,919 | |
| 24,165 | |
| 19,447 | | |||
Net purchases of Federal Home Loan Bank and Federal Reserve Bank Stock | (7,255 | ) |
| (775 | ) |
| (24,223 | ) | |||
Net increase in loans | (255,853 | ) |
| (147,586 | ) |
| (106,588 | ) | |||
Purchase of BOLI | (273 | ) |
| (4,481 | ) |
| (260 | ) | |||
Proceeds from redemption of BOLI | - | |
| 3,620 | |
| 707 | | |||
Purchase of premises and equipment | (2,821 | ) |
| (801 | ) |
| (4,937 | ) | |||
Proceeds from sale of premises and equipment | 395 | |
| 69 | |
| - | | |||
Capital improvements to REO | (11 | ) |
| (99 | ) |
| (94 | ) | |||
Proceeds from sale of REO | 3,277 | |
| 2,822 | |
| 9,741 | | |||
Acquisition of United Financial of North Carolina, Inc. | (200 | ) |
| - | |
| - | | |||
Acquisition of TriSummit Bancorp, Inc., net of cash received | (10,585 | ) |
| - | |
| - | | |||
Acquisition of Bank of Commerce, net of cash received | - | |
| - | |
| (7,759 | ) | |||
Acquisition of Bank of America branches, net of cash paid | - | |
| - | |
| 310,868 | | |||
Net cash used in investing activities | (106,756 | ) |
| (11,109 | ) |
| (189,777 | ) | |||
76
HOMETRUST BANCSHARES, INC. AND SUBSIDIARY
Consolidated Statements of Cash Flows (continued)
(Dollars in thousands)
| June 30, | ||||||||||
| 2017 |
| 2016 |
| 2015 | ||||||
Financing Activities: |
| |
|
| |
|
| | |||
Net decrease in deposits | (34,479 | ) |
| (69,430 | ) |
| (133,517 | ) | |||
Net increase in borrowings | 158,031 | |
| 16,000 | |
| 409,828 | | |||
Common stock repurchased | - | |
| (27,734 | ) |
| (18,470 | ) | |||
Retired stock | (569 | ) |
| (223 | ) |
| (188 | ) | |||
Stock options exercised | 3,068 | |
| 32 | |
| 259 | | |||
Decrease in capital lease obligations | (21 | ) |
| (21 | ) |
| (19 | ) | |||
Net cash provided by (used in) financing activities | 126,030 | |
| (81,376 | ) |
| 257,893 | | |||
Net Increase (Decrease) in Cash and Cash Equivalents | 34,389 | |
| (63,564 | ) |
| 70,330 | | |||
Cash and Cash Equivalents at Beginning of Period | 52,596 | |
| 116,160 | |
| 45,830 | | |||
Cash and Cash Equivalents at End of Period | $ | 86,985 | |
| $ | 52,596 | |
| $ | 116,160 | |
| June 30, | ||||||||||
| 2017 |
| 2016 |
| 2015 | ||||||
Supplemental Disclosures: |
|
|
|
|
| ||||||
Cash paid during the period for: |
|
|
|
|
| ||||||
Interest | $ | 7,980 | |
| $ | 6,468 | |
| $ | 4,964 | |
Income taxes | 383 | |
| 428 | |
| 222 | | |||
Noncash transactions: |
| |
|
| |
|
| | |||
Unrealized gain (loss) in value of securities available for sale, net of income taxes | (2,070 | ) |
| 1,473 | |
| 625 | | |||
Transfers of loans to REO | 2,417 | |
| 2,189 | |
| 2,288 | | |||
Transfers of loans to loans sold (included in other assets) | - | |
| - | |
| 9,139 | | |||
Loans originated to finance the sale of REO | - | |
| - | |
| 460 | | |||
Business Combinations: |
| |
|
| |
|
| | |||
Assets acquired | 364,504 | |
| - | |
| 463,959 | | |||
Liabilities assumed | 328,378 | |
| - | |
| 444,154 | | |||
Net assets acquired | 36,126 | |
| - | |
| 19,805 | | |||
The accompanying notes are an integral part of these consolidated financial statements.
77
HOMETRUST BANCSHARES, INC. AND SUBSIDIARY
Notes to Consolidated Financial Statements
(Dollars in thousands, except per share data)
1. Summary of Significant Accounting Policies
Business
The consolidated financial statements presented in this report include the accounts of HomeTrust Bancshares, Inc., a Maryland corporation ("HomeTrust"), and its wholly-owned subsidiary, HomeTrust Bank (the "Bank"). As used throughout this report, the term the "Company" refers to HomeTrust and its consolidated subsidiary, unless the context otherwise requires. HomeTrust is a bank holding company primarily engaged in the business of planning, directing, and coordinating the business activities of the Bank. The Bank is a North Carolina state chartered bank and provides a wide range of retail and commercial banking products within its geographic footprint, which includes: North Carolina (the Asheville metropolitan area, the "Piedmont" region, Charlotte, and Raleigh), Upstate South Carolina (Greenville), East Tennessee (Kingsport/Johnson City/Bristol, Knoxville, and Morristown) and Southwest Virginia (the Roanoke Valley). The Bank operates under a single set of corporate policies and procedures and is recognized as a single banking segment for financial reporting purposes.
Accounting Principles
The accounting and reporting policies of the Company conform to accounting principles generally accepted in the United States ("US GAAP").
Principles of Consolidation and Subsidiary Activities
The accompanying consolidated financial statements include the accounts of HomeTrust, the Bank, and its wholly-owned subsidiary, Western North Carolina Service Corporation ("WNCSC") at or for the years ended June 30, 2017 , 2016 , and 2015 . WNCSC owns office buildings in Asheville, North Carolina that are leased to the Bank. All intercompany items have been eliminated.
Reclassifications
Certain amounts reported in prior periods' consolidated financial statements have been reclassified to conform to the current presentation. Such reclassifications had no effect on previously reported cash flows, stockholders' equity or net income.
Use of Estimates in Financial Statements
The preparation of financial statements in conformity with US GAAP requires management to make estimates and assumptions that affect the reported amounts of assets and liabilities and disclosure of contingent assets and liabilities at the date of the financial statements and the reported amounts of revenues and expenses during the reporting period. Actual results could differ from those estimates.
Cash and Cash Equivalents
Cash and cash equivalents include cash and interest-bearing deposits with initial terms to maturity of 90 days or less.
Commercial Paper
Commercial paper includes highly liquid short-term debt of investment graded corporations with maturities less than 270 days. These instruments are typically purchased at a discount based on prevailing interest rates and do not exceed $ 10.0 million per issuer.
Securities
The Company classifies investment securities as trading, available for sale, or held to maturity.
Securities available for sale are carried at fair value. These securities are used to execute asset/liability management strategies, manage liquidity, and leverage capital, and therefore may be sold prior to maturity. Adjustments for unrealized gains or losses, net of the income tax effect, are made to accumulated other comprehensive income, a separate component of total stockholders' equity.
Securities held to maturity are stated at cost, net of unamortized balances of premiums and discounts. When these securities are purchased, the Company intends to and has the ability to hold such securities until maturity.
Declines in the fair value of individual securities available for sale or held to maturity below their cost that are other-than-temporary result in write-downs of the individual securities to their fair value. The related write-downs are included in earnings as realized losses. In estimating other-than-temporary impairment losses, the Company considers among other things, (i) the length of time and the extent to which the fair value has been less than cost, (ii) the financial condition and near-term prospects of the issuer, and (iii) the intent and ability of the Company to retain its investment in the issuer for a period of time sufficient to allow for any anticipated recovery of the unrealized loss, and in the case of debt securities, whether it is more likely than not that the Company will be required to sell the security prior to a recovery.
Premiums and discounts are amortized or accreted over the life of the security as an adjustment to yield. Dividend and interest income are recognized when earned. Gains or losses on the sale of securities are recognized on a specific identification, trade date basis.
78
HOMETRUST BANCSHARES, INC. AND SUBSIDIARY
Notes to Consolidated Financial Statements
(Dollars in thousands, except per share data)
Loans
Portfolio loans are carried at their outstanding principal amount, less unearned income and deferred nonrefundable loan fees, net of certain origination costs. Interest income is recorded as earned on an accrual basis based on the contractual rate and the outstanding balance, except for nonaccruing loans where interest is recorded as earned on a cash basis. Net deferred loan origination fees/costs are deferred and amortized to interest income over the life of the related loan.
Acquired Loans
Purchased loans are recorded at their fair value at the acquisition date. Credit discounts are included in the determination of fair value; therefore, an allowance for loan and lease losses is not recorded at the acquisition date. Acquired loans are evaluated upon acquisition and classified as either purchased impaired or purchased non-impaired. Purchased impaired loans reflect credit deterioration since origination such that it is probable at acquisition that the Company will be unable to collect all contractually required payments.
The cash flows expected to be received over the life of the loans were estimated by management. These cash flows were provided to third party analysts to calculate carrying values of the loans, book yields, effective interest income and impairment, if any, based on actual and projected events. Default rates, loss severity, and prepayment speed assumptions will be periodically reassessed to update our expectation of future cash flows. The excess of the cash flows expected to be collected over a loan's carrying value is considered to be the accretable yield and is recognized as interest income over the estimated life of the loan using the effective yield method. The accretable yield may change due to changes in the timing and amounts of expected cash flows. Changes in the accretable yield are disclosed quarterly.
The excess of the undiscounted contractual balances due over the cash flows expected to be collected is considered to be the nonaccretable difference. The nonaccretable difference represents our estimate of the credit losses expected to occur and was considered in determining the fair value of the loans as of the acquisition date. Subsequent to the acquisition date, any increases in expected cash flows over those expected at purchase date in excess of fair value are adjusted through a change to the accretable yield on a prospective basis. Any subsequent decreases in expected cash flows attributable to credit deterioration are recognized by recording a provision for loan losses. The purchased impaired loans acquired are and will continue to be subject to the Company's internal and external credit review and monitoring.
For purchased non-impaired loans, the difference between the fair value and unpaid principal balance of the loan at the acquisition date is amortized or accreted to interest income over the life of the loans.
Loan Segments and Classes
The Company's loan portfolio is grouped into two segments (retail consumer loans and commercial loans) and into various classes within each segment. The Company originates, services, and manages its loans based on these segments and classes. The Company's portfolio segments and classes within those segments are subject to risks that could have an adverse impact on the credit quality of the loan portfolio. Management identified the risks described below as significant risks that are generally similar among the loan segments and classes.
Retail Consumer loan segment
The Company underwrites its retail consumer loans using automated credit scoring and analysis tools. These credit scoring tools take into account factors such as payment history, credit utilization, length of credit history, types of credit currently in use, and recent credit inquiries. To the extent that the loan is secured by collateral, the value of the collateral is also evaluated. Common risks to each class of retail consumer loans include general economic conditions within the Company's markets, such as unemployment and potential declines in collateral values, and the personal circumstances of the borrowers. In addition to these common risks for the Company's retail consumer loans, various retail consumer loan classes may also have certain risks specific to them.
One-to-four family and construction and land/lot loans are to individuals and are typically secured by one-to-four family residential property, undeveloped land, and partially developed land in anticipation of pending construction of a personal residence. Significant and rapid declines in real estate values can result in residential mortgage loan borrowers having debt levels in excess of the current market value of the collateral, which can lead to higher levels of foreclosures. Construction and land/lot loans may experience delays in completion and cost overruns that exceed the borrower's financial ability to complete the project. Such cost overruns can result in foreclosure of partially completed and unmarketable collateral.
Originated home equity lines of credit ("HELOCs") are often secured by second liens on residential real estate, thereby making such loans particularly susceptible to declining collateral values. A substantial decline in collateral value could render the Company's second lien position to be effectively unsecured. Additional risks include lien perfection inaccuracies and disputes with first lien holders that may further weaken collateral positions. Further, the open-end structure of these loans creates the risk that customers may draw on the lines in excess of the collateral value if there have been significant declines since origination. In December 2014, the Company began purchasing HELOCs from a third party. The credit risk characteristics are different for these loans since they were not originated by the Company and the collateral is located outside the Company's market area, primarily in several western states. These loans have an average FICO score of 740 and loan to values of less than 90% . The Company established an allowance for loan losses based on the historical losses of the portfolio. The Company monitors the performance of these loans and adjusts the allowance for loan losses as necessary.
Indirect auto finance loans are primarily for new and used personal automobiles originated by franchised and independent auto dealers within the Company's geographic footprint. The bank-dealer relationship is governed by contract, which provides warranties and
79
HOMETRUST BANCSHARES, INC. AND SUBSIDIARY
Notes to Consolidated Financial Statements
(Dollars in thousands, except per share data)
representations, payment schedules, and rights and remedies upon breach. The underwriting process and standards are maintained by the Company and implemented via an automated decision tool, which incorporates the borrower's credit score, loan to value ratio, and terms of the loan to determine the borrower's creditworthiness.
Consumer loans include loans secured by deposit accounts or personal property such as automobiles, boats, and motorcycles, as well as unsecured consumer debt. The value of underlying collateral within this class is especially volatile due to potential rapid depreciation in values since date of loan origination in excess of principal repayment.
Commercial loan segment
The Company's commercial loans are centrally underwritten based primarily on the customer's ability to generate the required cash flow to service the debt in accordance with the contractual terms and conditions of the loan agreement. The Company's commercial lenders and underwriters work to understand the borrower's businesses and management experiences. The majority of the Company's commercial loans are secured by collateral, so collateral values are important to the transaction. In commercial loan transactions where the principals or other parties provide personal guarantees, the Company's commercial lenders and underwriters analyze the relative financial strength and liquidity of each guarantor. Risks that are common to the Company's commercial loan classes include general economic conditions, demand for the borrowers' products and services, the personal circumstances of the principals, and reductions in collateral values. In addition to these common risks for the Company's commercial loans, the various commercial loan classes also have certain risks specific to them.
Construction and development loans are highly dependent on the supply and demand for commercial real estate in the Company's markets as well as the demand for the newly constructed residential and commercial properties and lots being developed by the Company's commercial loan customers. Prolonged deterioration in demand could result in significant decreases in the underlying collateral values and make repayment of the outstanding loans more difficult for the Company's commercial borrowers.
Commercial real estate and commercial and industrial loans are primarily dependent on the ability of the Company's commercial loan customers to achieve business results consistent with those projected at loan origination resulting in cash flow sufficient to service the debt. To the extent that a borrower's actual business results significantly underperform the original projections, the ability of that borrower to service the Company's loan on a basis consistent with the contractual terms may be at risk. While these loans and leases are generally secured by real property, personal property, or business assets such as inventory or accounts receivable, it is possible that the liquidation of the collateral will not fully satisfy the obligation.
Municipal leases are primarily made to volunteer fire departments and depend on the tax revenues received from the county or municipality. These leases are mainly secured by vehicles, fire stations, land, or equipment. The underwriting of the municipal leases is based on the cash flows of the fire department as well as projections of future income.
Credit Quality Indicators
Loans are monitored for credit quality on a recurring basis and the composition of the loans outstanding by credit quality indicator is provided below. Loan credit quality indicators are developed through review of individual borrowers on an ongoing basis. Generally, loans are monitored for performance on a quarterly basis with the credit quality indicators adjusted as needed. The indicators represent the rating for loans as of the date presented based on the most recent assessment performed. These credit quality indicators are defined as follows:
Pass -A pass rated asset is not adversely classified because it does not display any of the characteristics for adverse classification.
Special Mention -A special mention asset has potential weaknesses that deserve management's close attention. If left uncorrected, such potential weaknesses may result in deterioration of the repayment prospects or collateral position at some future date. Special mention assets are not adversely classified and do not warrant adverse classification.
Substandard -A substandard asset is inadequately protected by the current net worth and paying capacity of the obligor, or of the collateral pledged, if any. Assets classified as substandard generally have a well-defined weakness, or weaknesses, that jeopardize the liquidation of the debt. These assets are characterized by the distinct possibility of loss if the deficiencies are not corrected.
Doubtful -An asset classified doubtful has all the weaknesses inherent in an asset classified substandard with the added characteristic that the weaknesses make collection or liquidation in full highly questionable and improbable, on the basis of currently existing facts, conditions, and values.
Loss -Assets classified loss are considered uncollectible and of such little value that their continuing to be carried as an asset is not warranted. This classification is not necessarily equivalent to no potential for recovery or salvage value, but rather that it is not appropriate to defer a full write-off even though partial recovery may be effected in the future.
Loans Held for Sale
Loans held for sale are residential mortgages and are valued at the lower of cost or fair value less estimated costs to sell as determined by outstanding commitments from investors on a "best efforts" basis or current investor yield requirements, calculated on the aggregate loan basis. Loans sold are generally sold at par value and with servicing released.
80
HOMETRUST BANCSHARES, INC. AND SUBSIDIARY
Notes to Consolidated Financial Statements
(Dollars in thousands, except per share data)
Allowance for Loan Losses
The allowance for loan losses is management's estimate of probable credit losses that are inherent in the Company's loan portfolios at the balance sheet date. The allowance increases when the Company provides for loan losses through charges to operating earnings and when the Company recovers amounts from loans previously written down or charged off. The allowance decreases when the Company writes down or charges off loan amounts that are deemed uncollectible.
Management determines the allowance for loan losses based on periodic evaluations that are inherently subjective and require substantial judgment because the evaluations require the use of material estimates that are susceptible to significant change. The Company generally uses two allowance methodologies that are primarily based on management's determination as to whether or not a loan is considered to be impaired.
All classified loans above a certain threshold meeting certain criteria are evaluated for impairment on a loan-by-loan basis and are considered impaired when it is probable, based on current information, that the borrower will be unable to pay contractual interest or principal as required by the loan agreement. Impaired loans below the threshold are evaluated as a pool with additional adjustments to the allowance for loan losses. Loans that experience insignificant payment delays and payment shortfalls are not necessarily considered impaired. Management determines the significance of payment delays and payment shortfalls on a case-by-case basis, taking into consideration all of the circumstances surrounding the loan and the borrower, including the length of the delay, the reasons for the delay, the borrower's prior payment history, and the amount of the shortfall relative to the principal and interest owed. Impaired loans are measured at their estimated net realizable value based on either the value of the loan's expected future cash flows discounted at the loan's effective interest rate or on the collateral value, net of the estimated costs of disposal, if the loan is collateral dependent. For loans considered impaired, an individual allowance for loan losses is recorded when the loan principal balance exceeds the estimated net realizable value.
For loans not considered impaired, management determines the allowance for loan losses based on estimated loss percentages that are determined by and applied to the various classes of loans that comprise the segments of the Company's loan portfolio. The estimated loss percentages by loan class are based on a number of factors that include by class (i) average historical losses over the past two years, (ii) levels and trends in delinquencies, impairments, and net charge-offs, (iii) trends in the volume, terms, and concentrations, (iv) trends in interest rates, (v) effects of changes in the Company's risk tolerance, underwriting standards, lending policies, procedures, and practices, and (vi) national and local business and economic conditions.
Future material adjustments to the allowance for loan losses may be necessary due to changing economic conditions or declining collateral values. In addition, bank regulatory agencies, as an integral part of their examination process, periodically review the Company's allowance for loan losses and may require the Company to make adjustments to the allowance for loan losses based upon judgments that differ significantly from those of management.
Nonperforming Assets
Nonperforming assets can include loans that are past due 90 days or more based on the loan's contractual terms and continue to accrue interest, loans on which interest is not being accrued, and REO.
Loans Past Due 90 Days or More, Nonaccruing, Impaired, or Restructured
The Company's policies related to when loans are placed on nonaccruing status conform to guidelines prescribed by bank regulatory authorities. Generally, the Company suspends the accrual of interest on loans (i) that are maintained on a cash basis because of the deterioration of the financial condition of the borrower, (ii) for which payment in full of principal or interest is not expected (impaired loans), or (iii) on which principal or interest has been in default for a period of 90 days or more, unless the loan is both well secured and in the process of collection. Under the Company's cost recovery method, interest income is subsequently recognized only to the extent cash payments are received in excess of principal due. Loans are returned to accruing status when all principal and interest amounts contractually due are brought current and concern no longer exists as to the future collectability of principal and interest, which is generally confirmed when the loan demonstrates performance for six consecutive months or payment cycles.
Restructured loans to borrowers who are experiencing financial difficulty, and on which the Company has granted concessions that modify the terms of the loan, are accounted for as troubled debt restructurings ("TDRs"). These loans remain as TDRs until the loan has been paid in full, modified to its original terms, or charged off. The Company may place these loans on accrual or nonaccrual status depending on the individual facts and circumstances of the borrower. Generally, these loans are put on nonaccrual status until there is adequate performance that evidences the ability of the borrower to make the contractual payments. This period of performance is normally at least six months, and may include performance immediately prior to or after the modification, depending on the specific facts and circumstances of the borrower.
81
HOMETRUST BANCSHARES, INC. AND SUBSIDIARY
Notes to Consolidated Financial Statements
(Dollars in thousands, except per share data)
Loan Charge-offs
The Company charges off loan balances, in whole or in part to fair market value, when available, verifiable, and documentable information confirms that specific loans, or portions of specific loans, are uncollectible or unrecoverable. For unsecured loans, losses are confirmed when it can be determined that the borrower, or any guarantors, are unwilling or unable to pay the amounts as agreed. When the borrower, or any guarantor, is unwilling or unable to pay the amounts as agreed on a loan secured by collateral and any recovery will be realized upon the sale of the collateral, the loan is deemed to be collateral dependent. Repayments or recoveries for collateral dependent loans are directly affected by the value of the collateral at liquidation. As such, loan repayment can be affected by factors that influence the amount recoverable, the timing of the recovery, or a combination of the two. Such factors include economic conditions that affect the markets in which the loan or its collateral is sold, bankruptcy, repossession and foreclosure laws, and consumer banking regulations. Losses are also confirmed when the loan, or a portion of the loan, is classified as loss resulting from loan reviews conducted by the Company or its bank regulatory examiners.
Charge-offs of loans in the commercial loan segment are recognized when the uncollectibility of the loan balance and the inability to recover sufficient value from the sale of any collateral securing the loan is confirmed. The uncollectibility of the loan balance is evidenced by the inability of the commercial borrower to generate cash flows sufficient to repay the loan as agreed causing the loan to become delinquent. For collateral dependent commercial loans, the Company determines the net realizable value of the collateral based on appraisals, current market conditions, and estimated costs to sell the collateral. For collateral dependent commercial loans where the loan balance, including any accrued interest, net deferred fees or costs, and unamortized premiums or discounts, exceeds the net realizable value of the collateral securing the loan, the deficiency is identified as unrecoverable, is deemed to be a confirmed loss, and is charged off.
Charge-offs of loans in the retail consumer loan segment are generally confirmed and recognized in a manner similar to loans in the commercial loan segment. Secured retail consumer loans that are identified as uncollectible and are deemed to be collateral dependent are confirmed as loss to the extent the net realizable value of the collateral is insufficient to recover the loan balance. Consumer loans not secured by real estate that become 90 days past due are charged off to the extent that the fair value of any collateral, less estimated costs to sell the collateral, is insufficient to recover the loan balance. Consumer loans secured by real estate that become 120 days past due are charged off to the extent that the fair value of the real estate securing the loan, less estimated costs to sell the collateral, is insufficient to recover the loan balance. Loans to borrowers in bankruptcy are subject to modification by the bankruptcy court and are charged off to the extent that the fair value of any collateral securing the loan, less estimated costs to sell the collateral, is insufficient to recover the loan balance, unless the Company expects repayment is likely to occur. Such loans are charged off within 60 days of the receipt of notification from a bankruptcy court or when the loans become 120 days past due, whichever is shorter.
Real Estate Owned
REO consists of real estate acquired as a result of customers' loan defaults. REO is stated at the lower of the related loan balance or the fair value of the property net of the estimated costs of disposal with a charge to the allowance for loan losses upon foreclosure. Any write-downs subsequent to foreclosure are charged against operating earnings. To the extent recoverable, costs relating to the development and improvement of property are capitalized, whereas those costs relating to holding the property are charged to expense.
Premises and Equipment
Premises and equipment are stated at cost less accumulated depreciation. Depreciation is computed using the 150% declining balance and the straight-line method over the estimated useful lives. Leasehold improvements are amortized over the lives of the respective leases or the estimated useful life of the leasehold improvement, whichever is less. Maintenance and repair costs are expensed as incurred. Capitalized leases are amortized using the same methods as premises and equipment over the estimated useful lives or lease terms, whichever is less. Obligations under capital leases are amortized using the interest method to allocate payments between principal reduction and interest expense.
Federal Home Loan Bank and Federal Reserve Bank Stock
As a requirement for membership, the Bank invests in stock of the Federal Home Loan Bank of Atlanta ("FHLB") and the Federal Reserve Bank of Richmond ("Federal Reserve Bank"). These investments are carried at cost due to the redemption provisions of these entities and the restricted nature of the securities. Management reviews for impairment based on the ultimate recoverability of the cost basis of these stocks. Our investments in these stocks are maintained in "other investments, at cost" on our balance sheet.
Business Combinations
The Company uses the acquisition method of accounting, formerly referred to as the purchase method, for all business combinations. An acquirer must be identified for each business combination, and the acquisition date is the date the acquirer achieves control. The acquisition method of accounting requires the Company as acquirer to recognize the fair value of assets acquired and liabilities assumed at the acquisition date as well as recognize goodwill or a gain from a bargain purchase, if appropriate. Any acquisition-related costs and restructuring costs are recognized as period expenses as incurred.
Goodwill
Goodwill represents the excess of the purchase price over the sum of the estimated fair values of the tangible and identifiable intangible assets acquired less the estimated fair value of the liabilities assumed in a business combination. Goodwill has an indefinite useful life and is evaluated
82
HOMETRUST BANCSHARES, INC. AND SUBSIDIARY
Notes to Consolidated Financial Statements
(Dollars in thousands, except per share data)
for impairment annually in the fourth quarter or more frequently if events and circumstances indicate that the asset might be impaired. An impairment loss is recognized to the extent that the carrying amount exceeds the asset's fair value.
In testing goodwill for impairment, we have the option to assess either qualitative or quantitative factors to determine whether the existence of events or circumstances leads to a determination that it is more likely than not that the estimated fair value of a reporting unit is less than its carrying amount. If we elect to perform a qualitative assessment and determine that an impairment is more likely than not, we are then required to perform a quantitative impairment test, otherwise no further analysis is required.
Under the quantitative impairment test, the evaluation involves comparing the current fair value of each reporting unit to its carrying value, including goodwill. If the estimated fair value of a reporting unit exceeds its carrying value, goodwill is considered not to be impaired. If the carrying value exceeds estimated fair value an impairment charge is recognized for the difference, but limited by the amount of goodwill allocated to that reporting unit. The Company uses a combination of the market and income approaches to estimate the fair value of its reporting unit. All inputs are evaluated by management at the evaluation date of April 1st and reviewed again at year end to ensure no significant changes occurred that could indicate impairment. Subsequent reversal of goodwill impairment losses is not permitted.
Core Deposit Intangibles
Core deposit intangibles represents the estimated value of long-term deposit relationships acquired in business combinations. These core deposit premiums are amortized using an accelerated method over the estimated useful lives of the related deposits typically between five and ten years. The estimated useful lives are periodically reviewed for reasonableness.
Income Taxes
The Company accounts for income taxes using the asset and liability method. Deferred tax assets and liabilities are recognized for the future tax consequences attributable to differences between the financial statement carrying amounts of existing assets and liabilities and their respective tax bases and operating loss and tax credit carryforwards. Deferred tax assets and liabilities are measured using enacted tax rates expected to apply to taxable income in the years in which those temporary differences are expected to be recovered or settled. The effect on deferred tax assets and liabilities of a change in tax rates is recognized in income in the period that includes the enactment date. Deferred tax assets are reduced, if necessary, by the amount of such benefits that are not expected to be realized based upon available evidence. See footnote 12 for additional information.
The Company recognizes interest and penalties accrued relative to unrecognized tax benefits in its respective federal or state income taxes accounts. As of June 30, 2017 and 2016 , there were no accruals for uncertain tax positions and no accruals for interest and penalties. The Company is no longer subject to examination for federal and state purposes for tax years prior to 2013.
Employee Stock Ownership Plan
In connection with the conversion from a mutual to a stock form of organization in July 2012, the Bank established an ESOP for the benefit of all of its eligible employees. Full-time employees of the Company and the Bank who have been credited with at least 1000 hours of service during a 12 -month period and who have attained age 21 are eligible to participate in the ESOP. Shares released are allocated to each eligible participant based on the ratio of each participant's compensation, as defined in the ESOP, to the total compensation of all eligible plan participants. Forfeited shares shall be reallocated among other participants in the Plan. At the discretion of the Bank, cash dividends, when paid on allocated shares, will be distributed to participants' accounts, paid in cash to the participants, or used to repay the principal and interest on the ESOP loan used to acquire Company stock on which dividends were paid. Cash dividends on unallocated shares will be used to repay the outstanding debt of the ESOP.
It is anticipated that the Bank will make contributions to the ESOP in amounts necessary to amortize the ESOP loan payable to the Company over a 20 -year period.
Unearned ESOP shares are shown as a reduction of stockholders' equity. Dividends on unearned ESOP shares, if paid, will be considered to be compensation expense. The Company recognizes compensation expense equal to the fair value of the Company's ESOP shares during the periods in which they become committed to be released. To the extent that the fair value of the Company's ESOP shares differs from the cost of such shares, the differential is recognized as additional paid in capital. The Company recognizes a tax deduction equal to the cost of the shares released. Because the ESOP is internally leveraged through a loan from the Company to the ESOP, the loan receivable by the Company from the ESOP is not reported as an asset nor is the debt of the ESOP shown as a liability in the consolidated financial statements.
As of July 1, 2015, the ESOP and the HomeTrust Bank 401(k) Plan was combined to form the HomeTrust Bank KSOP Plan. See footnote 13 for additional information.
83
HOMETRUST BANCSHARES, INC. AND SUBSIDIARY
Notes to Consolidated Financial Statements
(Dollars in thousands, except per share data)
Equity Incentive Plan
The Company issues restricted stock and stock options under the HomeTrust Bancshares, Inc. 2013 Omnibus Incentive Plan ("2013 Omnibus Incentive Plan") to key officers and outside directors. In accordance with the requirements of the Financial Accounting Standards Board (the "FASB") Accounting Standards Codification ("ASC") 718, Compensation – Stock Compensation, the Company has adopted a fair value based method of accounting for employee stock compensation plans, whereby compensation cost is measured based on the fair value of the award as of the grant date and recognized over the vesting period. The Company estimates forfeitures when recognizing compensation expense and this estimate is adjusted over the requisite service period or vesting schedule based on the extent to which actual forfeitures differ from such estimate. Changes in estimated forfeitures in future periods are recognized through a cumulative catch-up adjustment, which is recognized in the period of change and also will affect the amount of estimated unamortized compensation expense to be recognized in future periods.
Comprehensive Income
Comprehensive income consists of net income and net unrealized gains (losses) on securities available for sale and is presented in the consolidated statements of comprehensive income.
Derivative Instruments and Hedging
The Company recognizes all derivatives as either assets or liabilities in the balance sheet, and measures those instruments at fair value. Changes in the fair value of those derivatives are reported in current earnings or other comprehensive income depending on the purpose for which the derivative is held and whether the derivative qualifies for hedge accounting. Loan commitments related to the origination or acquisition of mortgage loans that will be held for sale must be accounted for as derivative instruments. The Company enters into commitments to originate loans whereby the interest rate on the loan is determined prior to funding (rate lock commitments). The Company also enters into forward sales commitments for the mortgage loans underlying the rate lock commitments. The fair values of these two derivative financial instruments are collectively insignificant to the consolidated financial statements.
Net Income Per Share
Per the provisions of ASC 260, Earnings Per Share, basic earnings per share are computed by dividing net income by the weighted-average number of common shares outstanding for the year, less the average number of nonvested restricted stock awards. Diluted earnings per share reflect the potential dilution from the issuance of additional shares of common stock caused by the exercise of stock options and restricted stock awards. In addition, nonvested share-based payment awards that contain nonforfeitable rights to dividends or dividend equivalents are considered participating securities and are included in the computation of earnings per share pursuant to the two-class method. The two-class method is an earnings allocation formula that determines earnings per share for each class of common stock and participating security according to dividends declared (or accumulated) and participation rights in undistributed earnings. ESOP shares are considered outstanding for basic and diluted earnings per share when the shares are committed to be released.
Net income is allocated between the common stock and participating securities pursuant to the two-class method, based on their rights to receive dividends, participate in earnings, or absorb losses. See Note 15 for further discussion on the Company's earnings per share.
Recent Accounting Pronouncements
In August 2015, the Financial Accounting Standards Board ("FASB") issued ASU No. 2015-14, "Revenue from Contracts with Customers (Topic 606)", which defers the effective date of Accounting Standard Update ("ASU") No. 2014-09 one year. ASU No. 2014-09 created Topic 606 and supersedes Topic 605, Revenue Recognition. The core principle of Topic 606 is that an entity recognizes revenue to depict the transfer of promised goods or services to customers in an amount that reflects the consideration to which the entity expects to be entitled in exchange for those goods or services. In general, the new guidance requires companies to use more judgment and make more estimates than under current guidance, including identifying performance obligations in the contract, estimating the amount of variable consideration to include in the transaction price and allocating the transaction price to each separate performance obligation. In May 2016, the FASB issued ASU No. 2016-12, Revenue from Contracts with Customers (Topic 606): Narrow-Scope Improvements and Practical Expedients, which provides clarifying guidance in certain narrow areas and adds some practical expedients, but does not change the core revenue recognition principle in Topic 606. ASU No. 2015-14 is effective for interim and annual periods beginning after December 15, 2017; early adoption is permitted for interim and annual periods beginning after December 15, 2016. For financial reporting purposes, the standard allows for either full retrospective adoption, meaning the standard is applied to all of the periods presented, or modified retrospective adoption, meaning the standard is applied only to the most current period presented in the financial statements with the cumulative effect of initially applying the standard recognized at the date of initial application. A significant amount of the Company's revenues are derived from net interest income on financial assets and liabilities, which are excluded from the scope of the amended guidance. With respect to noninterest income, the Company is in its preliminary stages of identifying and evaluating the revenue streams and underlying revenue contracts within the scope of the guidance. The Company is expecting to begin developing processes and procedures during 2017 to ensure it is fully compliant with these amendments. To date, the Company has not yet identified any significant changes in the timing of revenue recognition when considering the amended accounting guidance; however, the Company's implementation efforts are ongoing and such assessments may change prior to the July 1, 2018 implementation date.
In August 2015, the FASB issued ASU No. 2015-15, "Interest-Imputation of Interest (Subtopic 835-30): Presentation and Subsequent Measurement of Debt Issuance Costs Associated with Line-of-Credit Arrangements." This ASU provides guidance regarding debt issuance related to line-of-credit arrangements. The amendments in this ASU allows an entity to present debt issuance costs as an asset and subsequently amortize the deferred debt issuance costs over the term of the line-of-credit arrangement, regardless if there are any outstanding borrowings on the line-of-
84
HOMETRUST BANCSHARES, INC. AND SUBSIDIARY
Notes to Consolidated Financial Statements
(Dollars in thousands, except per share data)
credit arrangement. This ASU was effective for annual periods beginning after December 15, 2015. The adoption of ASU No. 2015-15 did not have a material impact on the Company's Consolidated Financial Statements.
In September 2015, the FASB issued ASU No. 2015-16, "Business Combinations (Topic 805): Simplifying the Accounting for Measurement-Period Adjustments." The ASU simplifies the accounting for measurement period adjustments. The amendments in this ASU require that an acquirer recognize adjustments to provisional amounts that are identified during the measurement period in the reporting period when the adjustment amounts are determined. The acquirer is required to record in the same period's financial statements the effect on earnings from changes in depreciation, amortization, or other income effects resulting from the change to provisional amounts, calculated as if the accounting had been completed at the acquisition date. The acquirer must present separately on the income statement, or disclose in the notes, the amount recorded in current-period earnings that would have been recorded in previous reporting periods if the provisional amount had been recognized at the acquisition date. This ASU was effective for interim and annual periods beginning after December 15, 2015. The adoption of ASU No. 2015-16 did not have a material impact on the Company's Consolidated Financial Statements.
In January 2016, the FASB issued ASU 2016-01, "Financial Instruments-Overall (Subtopic 825-10): Recognition and Measurement of Financial Assets and Financial Liabilities." The ASU amends the guidance in GAAP on the classification and measurement of financial instruments. The ASU includes the following changes: i) equity investments (except those accounted for under the equity method of accounting, or those that result in consolidation of the investee) to be measured at fair value with changes in fair value recognized in net income; (ii) requires the use of exit price notion when measuring the fair value of financial instruments for disclosure purposes; (iii) requires separate presentation of financial assets and financial liabilities by measurement category and form of financial asset (i.e. securities or loans and receivables) on the balance sheet or the accompanying notes to the financial statements; (iv) allows an equity investment that does not have readily determinable fair values, to be measured at cost minus impairment (if any), plus or minus changes resulting from observable price changes in orderly transactions for the identical or a similar investment of the same issuer; (v) eliminates the requirement to disclose the method(s) and significant assumptions used to estimate the fair value that is required to be disclosed for financial instruments measured at amortized cost on the balance sheet, and requires a reporting organization to present separately in other comprehensive income the portion of the total change in the fair value of a liability resulting from a change in the instrument-specific credit risk (also referred to as "own credit") when the organization has elected to measure the liability at fair value in accordance with the fair value option for financial instruments; (vi) requires separate presentation of financial assets and financial liabilities by measurement category and form of financial asset (i.e. securities or loans and receivables) on the balance sheet or in the accompanying notes to the financial statements; and (vii) clarifies that a valuation allowance on a deferred tax asset related to available-for-sale securities should be evaluated in combination with the organization's other deferred tax assets. This ASU is effective for interim and annual periods beginning after December 15, 2017. The adoption of ASU No. 2016-01 is not expected to have a material impact on the Company's Consolidated Financial Statements.
In February 2016, the FASB issued ASU 2016-02, "Leases (ASC 842)." The guidance in this ASU requires most leases to be recognized on the balance sheet as a right-of-use asset and a lease liability. It will be critical to identify leases embedded in a contract to avoid misstating the lessee's balance sheet. For income statement purposes, the FASB retained a dual model, requiring leases to be classified as either operating or finance. Classification will be based on criteria that are largely similar to those applied in current lease accounting, but without explicit bright lines. This ASU is effective for interim and annual periods beginning after December 15, 2018. We are currently evaluating the impact of this guidance on our Consolidated Financial Statements and the timing of adoption. The Company will compile an inventory of all leased assets to determine the impact of ASU 2016-02 on its financial condition and results of operations. Once adopted, we expect to report higher assets and liabilities on our Consolidated Balance Sheets as a result of including right-of-use assets and lease liabilities related to certain banking offices and certain equipment under noncancelable operating lease agreements, which currently are not reflected in our Consolidated Balance Sheets. We do not expect the guidance to have a material impact on the Consolidated Statements of Income or the Consolidated Statements of Changes in Stockholders' Equity.
In March 2016, the FASB issued ASU 2016-09, "Compensation-Stock Compensation (Topic 718): Improvements to Employee Share-Based Payment Accounting." The ASU changes the accounting for certain aspects of share-based payments to employees. The guidance requires the recognition of the income tax effects of awards in the income statement when the awards vest or are settled, thus eliminating additional paid in capital pools. The guidance also allows for the employer to repurchase more of an employee's shares for tax withholding purposes without triggering liability accounting. In addition, the guidance allows for a policy election to account for forfeitures as they occur rather than on an estimated basis. This ASU is effective for annual periods beginning after December 15, 2016, and interim periods within those annual periods. We are currently evaluating the impact of this guidance on our Consolidated Financial Statements and the timing of adoption. Once adopted, we will elect to account for forfeitures of stock-based awards as they occur. We expect the adoption of this ASU will create some volatility in our reported income tax expense related to the excess tax benefits for employee stock-based transactions, however, the actual amounts recognized will be dependent on the amount of employee stock-based transactions and the stock price at the time of vesting.
In June 2016, the FASB issued ASU No. 2016-13, "Financial Instruments-Credit Losses (Topic 326): Measurement of Credit Losses on Financial Instruments." The ASU significantly changes the impairment model for most financial assets that are measured at amortized cost and certain other instruments from an incurred loss model to an expected loss model. This ASU is effective for interim and annual reporting periods beginning after December 15, 2019. Early adoption is permitted for all entities beginning after December 15, 2018, including interim periods within those fiscal years. The Company is in the process of identifying required changes to the loan loss estimation models and processes and evaluating the impact of this new guidance. Once adopted, we expect our allowance for loan losses to increase, however, until our evaluation is complete the magnitude of the increase will be unknown.
In August 2016, the FASB issued ASU No. 2016-15, "Statement of Cash Flows (Topic 230): Classification of Certain Cash Receipts and Cash Payments." The ASU amends the guidance on the classification of certain cash receipts and payments in the statement of cash flows and is
85
HOMETRUST BANCSHARES, INC. AND SUBSIDIARY
Notes to Consolidated Financial Statements
(Dollars in thousands, except per share data)
intended to reduce the diversity in practice. This ASU is effective for interim and annual reporting periods beginning after December 15, 2017. Early adoption is permitted for all entities beginning after December 15, 2017, including interim periods within those fiscal years. The Company is currently evaluating the impact of the pending adoption of the ASU on its Consolidated Financial Statements.
In December 2016, FASB issued ASU No. 2016-19, "Technical Corrections and Improvements" and ASU 2016-20, "Technical Corrections and Improvements to Topic 606: Revenue from Contracts with Customers." On November 10, 2010 FASB added a standing project that will facilitate the FASB Accounting Standards Codification ("Codification") updates for technical corrections, clarifications, and improvements. These amendments are referred to as Technical Corrections and Improvements. Maintenance updates include non-substantive corrections to the Codification, such as editorial corrections, various link-related changes, and changes to source fragment information. These updates contain amendments that will affect a wide variety of Topics in the Codification. The amendments in these ASUs will apply to all reporting entities within the scope of the affected accounting guidance and generally fall into one of four categories: amendments related to differences between original guidance and the Codification, guidance clarification and reference corrections, simplification, and minor improvements. In summary, the amendments represent changes to clarify the Codification, correct unintended application of guidance, or make minor improvements to the Codification that are not expected to have a significant effect on current accounting practice. Transition guidance varies based on the amendments in the ASUs. The amendments that require transition guidance are effective for fiscal years and interim reporting periods after December 15, 2016. Early adoption is permitted including adoption in an interim period. All other amendments are effective upon the issuance of these ASUs. Neither ASU 2016-19 nor ASU 2016-20 had a material impact on the Company's Consolidated Financial Statements.
In January 2017, FASB issued ASU 2017-03, "Accounting Changes and Error Corrections (Topic 250) and Investments-Equity Method and Joint Ventures (Topic 323)." The ASU amends the Codification for SEC staff announcements made at recent Emerging Issues Task Force (EITF) meetings. The SEC guidance that specifically relates to our Consolidated Financial Statements was from the September 2016 meeting, where the SEC staff expressed their expectations about the extent of disclosures registrants should make about the effects of the new FASB guidance as well as any amendments issued prior to adoption, on revenue (ASU 2014-09), leases (ASU 2016-02) and credit losses on financial instruments (ASU 2016-13) in accordance with SAB Topic 11.M. Registrants are required to disclose the effect that recently issued accounting standards will have on their financial statements when adopted in a future period. In cases where a registrant cannot reasonably estimate the impact of the adoption, then additional qualitative disclosures should be considered. The ASU incorporates these SEC staff views into ASC 250 and adds references to that guidance in the transition paragraphs of each of the three new standards. The Company has adopted the amendments in this ASU and appropriate disclosures have been included in this Note for each recently issued accounting standard.
In January 2017, FASB issued ASU 2017-04, "Intangibles-Goodwill and Other (Topic 350): Simplifying the Test for Goodwill Impairment." The ASU removes the requirement to compare the implied fair value of goodwill with its carrying value as required in Step 2 of the goodwill impairment test. Under the ASU, registrants would perform their goodwill impairment test and recognize an impairment charge for any amount the carrying value exceeds the reporting unit's fair value, but limited by the amount of goodwill allocated to that reporting unit. This ASU is effective for interim and annual reporting periods beginning after December 15, 2019. Early adoption is permitted for all entities after January 1, 2017. The Company did early adopt this ASU and adoption did not have a material effect on the Company's Consolidated Financial Statements.
In March 2017, FASB issued ASU 2017-08, "Receivables-Nonrefundable Fees and Other Costs (Subtopic 310-20): Premium Amortization on Purchased Callable Debt Securities." The ASU requires entities to amortize the premium on certain purchased callable debt securities to the earliest call date, which more closely aligns the amortization period of premiums and discounts to expectations incorporated in the market prices. Entities will no longer recognize a loss in earnings upon the debtor's exercise of a call on a purchased debt security held at a premium. The ASU does not require any accounting change for debt securities held at a discount, therefore the discount will continue to be amortized as an adjustment of yield over the contractual life of the investment. This ASU is effective for interim and annual reporting periods beginning after December 15, 2018. Early adoption is permitted for all entities. The adoption of ASU No. 2017-08 is not expected to have a material impact on the Company's Consolidated Financial Statements.
In May 2017, the FASB issued ASU 2017-09, Compensation-Stock Compensation (Topic 718): Scope of Modification Accounting. This ASU provides clarity on the guidance related to stock compensation when there have been changes to the terms or conditions of a share-based payment award to which an entity would be required to apply modification accounting under ASC 718. The ASU provides the three following criteria must be met in order to not account for the effect of the modification of terms or conditions: the fair value, the vesting conditions and the classification as an equity or liability instrument of the modified award is the same as the original award immediately before the original award is modified. The amendments in this ASU are effective for annual periods, and interim periods within those annual periods, beginning after December 15, 2017. Early adoption is permitted. The adoption of ASU No. 2017-09 is not expected to have a material impact on the Company's Consolidated Financial Statements.
2. Business Combinations
All business combinations are accounted for using the acquisition method of accounting and, accordingly, assets acquired, liabilities assumed and consideration exchanged were recorded at acquisition date fair values. Fair values are preliminary and subject to refinement for up to one year after the closing date of the acquisition as additional information regarding the closing date fair values becomes available.
United Financial of North Carolina, Inc.
On December 31, 2016, the Bank acquired United Financial of North Carolina, Inc. ("United Financial"), a municipal lease company headquartered in Fletcher, North Carolina that specializes in providing financing for fire departments and municipalities for the purchase of fire trucks and related equipment as well as the construction of fire stations and other municipal buildings across the Carolinas and other southeastern states.
86
HOMETRUST BANCSHARES, INC. AND SUBSIDIARY
Notes to Consolidated Financial Statements
(Dollars in thousands, except per share data)
United Financial underwrites and originates these municipal leases and then sells them to HomeTrust and other financial institutions. Beginning January 1, 2017, United Financial has conducted business under the name United Financial, a division of HomeTrust Bank.
The total consideration paid by the Bank in the United Financial acquisition was $425 . Per the merger agreement, a cash payment of $200 was paid on the acquisition date with an additional $225 due in the third quarter of fiscal 2018; all of which was allocated to goodwill.
TriSummit Bancorp. Inc.
On January 1, 2017, HomeTrust completed its acquisition of TriSummit Bancorp, Inc., ("TriSummit") pursuant to an Agreement and Plan of Merger, dated as of September 20, 2016, under which TriSummit merged with and into HomeTrust (the "Merger") with HomeTrust as the surviving corporation in the Merger. Immediately following the Merger, TriSummit's wholly owned subsidiary bank, TriSummit Bank, merged with and into the Bank (together with the Merger, the "TriSummit Merger").
Pursuant to the Merger Agreement, each share of the common stock of TriSummit and each share of Series A Preferred Stock of TriSummit issued and outstanding immediately prior to the Merger (on an as converted basis to a share of TriSummit common stock) was converted into the right to receive $4.40 in cash and .2099 shares of HomeTrust common stock, with cash paid in lieu of fractional share interests. At the Merger date, 50% of outstanding options granted by TriSummit were canceled. The remaining options were assumed by HomeTrust and converted into options to purchase 86,185 shares of HomeTrust Common Stock. In addition, TriSummit's $7,222 Series B, Series C and Series D TARP preferred stock (all held by private shareholders) was redeemed in connection with the closing of the merger.
The total consideration paid by HomeTrust in the TriSummit Merger approximates $36,126 . The total number of HomeTrust shares issued was 765,277 shares. HomeTrust paid aggregate cash consideration of approximately $16,083 .
87
HOMETRUST BANCSHARES, INC. AND SUBSIDIARY
Notes to Consolidated Financial Statements
(Dollars in thousands, except per share data)
| As Recorded by TriSummit |
| Fair Value and Other Merger Related Adjustments |
| As Recorded by the Company | ||||||
Consideration Paid: |
|
|
|
|
| ||||||
Cash paid including cash in lieu of fractional shares |
|
|
|
| $ | 16,083 | | ||||
Fair value of HomeTrust common stock at $25.90 per share |
|
|
|
| 20,043 | | |||||
Total consideration |
|
|
|
| $ | 36,126 | | ||||
Assets: |
|
|
|
|
| ||||||
Cash and cash equivalents | $ | 5,498 | |
| $ | - | |
| $ | 5,498 | |
Certificates of deposit in other banks | 250 | |
| - | |
| 250 | | |||
Investment securities | 58,728 | |
| (203 | ) |
| 58,525 | | |||
Other investments, at cost | 2,614 | |
| - | |
| 2,614 | | |||
Loans, net | 261,926 | |
| (3,867 | ) |
| 258,059 | | |||
Premises and equipment, net | 12,841 | |
| (2,419 | ) |
| 10,422 | | |||
REO | 1,633 | |
| (122 | ) |
| 1,511 | | |||
Deferred income taxes | 2,653 | |
| 4,462 | |
| 7,115 | | |||
Bank owned life insurance | 3,762 | |
| - | |
| 3,762 | | |||
Core deposit intangibles | 1,285 | |
| 1,575 | |
| 2,860 | | |||
Other assets | 1,453 | |
| (105 | ) |
| 1,348 | | |||
Total assets acquired | $ | 352,643 | |
| $ | (679 | ) |
| $ | 351,964 | |
|
|
|
|
|
| ||||||
Liabilities: |
|
|
|
|
| ||||||
Deposits | $ | 279,647 | |
| $ | 587 | |
| 280,234 | | |
Borrowings | 47,453 | |
| 16 | |
| 47,469 | | |||
Other liabilities | 675 | |
| - | |
| 675 | | |||
Total liabilities assumed | $ | 327,775 | |
| $ | 603 | |
| $ | 328,378 | |
Net identifiable assets acquired over liabilities assumed | $ | 24,868 | |
| $ | (1,282 | ) |
| $ | 23,586 | |
Goodwill | |
|
|
| $ | 12,540 | | ||||
| Purchased Performing |
| PCI |
| Total Loans | ||||||
Retail Consumer Loans: |
|
|
|
|
| ||||||
One-to-four family | $ | 75,179 | |
| $ | 3,753 | |
| $ | 78,932 | |
HELOCs | 6,479 | |
| 2 | |
| 6,481 | | |||
Construction and land/lots | 15,591 | |
| - | |
| 15,591 | | |||
Consumer | 1,686 | |
| 17 | |
| 1,703 | | |||
Commercial: |
|
|
| |
| | | ||||
Commercial real estate | 107,880 | |
| 3,494 | |
| 111,374 | | |||
Construction and development | 15,253 | |
| 142 | |
| 15,395 | | |||
Commercial and industrial | 28,295 | |
| 288 | |
| 28,583 | | |||
Total | $ | 250,363 | |
| $ | 7,696 | |
| $ | 258,059 | |
88
HOMETRUST BANCSHARES, INC. AND SUBSIDIARY
Notes to Consolidated Financial Statements
(Dollars in thousands, except per share data)
The following table presents the performing loans receivable purchased from TriSummit at January 1, 2017, the acquisition date:
Contractually required principal payments receivable | $ | 255,852 | |
Adjustment for credit, interest rate, and liquidity | 5,489 | | |
Balance of purchased loans receivable | $ | 250,363 | |
Contractually required principal and interest payments receivable | $ | 11,474 | |
Amounts not expected to be collected - nonaccretable difference | 2,490 | | |
Estimated payments expected to be received | 8,984 | | |
Accretable yield | 1,288 | | |
Fair value of PCI loans | $ | 7,696 | |
The following table discloses the impact of the acquisition of TriSummit since the effective date of January 1, 2017 through June 30, 2017. In addition, the table presents certain pro forma information as if TriSummit had been acquired on July 1, 2015. Although, this pro forma information combines the historical results from each company, it is not indicative of what would have occurred had the acquisition taken place on the assumed date. Adjustments were made for the estimated impact of certain fair value adjustments and other acquisition-related activity. The pro forma earnings were adjusted to exclude merger-related expenses for the year ended June 30, 2017, but were included in the year ended June 30, 2016. Furthermore, any projected cost savings or other anticipated benefits of the merger were not included.
| Actual |
| Pro Forma |
| Pro Forma | ||||||
| Year Ended |
| Year Ended |
| Year Ended | ||||||
| June 30, 2017 |
| June 30, 2017 |
| June 30, 2016 | ||||||
Total revenues* | $ | 106,631 | |
| $ | 107,330 | |
| $ | 109,217 | |
Net income | 11,847 | |
| 16,881 | |
| 9,753 | | |||
* Net interest income plus noninterest income
Bank of America
On November 14, 2014, the Bank completed its acquisition of ten branch banking operations in Southwest Virginia and Eden, North Carolina from Bank of America Corporation (the "Branch Acquisition"). Under the terms of the agreement, the Bank paid a deposit premium of $ 9,805 equal to 2.86% of the average daily deposits for the 30 calendar day period prior to the acquisition date. In addition, the Bank acquired approximately $1,045 in loans and all related premises and equipment valued at $ 8,993 .
89
HOMETRUST BANCSHARES, INC. AND SUBSIDIARY
Notes to Consolidated Financial Statements
(Dollars in thousands, except per share data)
The following table presents the consideration paid by the Bank in the acquisition of these Bank of America branches and the assets acquired and liabilities assumed as of November 14, 2014:
| As Recorded |
| Fair Value and |
| As | ||||||
Consideration Paid |
|
|
|
|
| ||||||
Cash paid as deposit premium |
|
|
|
| $ | 9,805 | | ||||
Total consideration |
|
|
|
| $ | 9,805 | | ||||
Assets |
|
|
|
|
| | |||||
Cash and cash equivalents | $ | 320,673 | |
| $ | - | |
| $ | 320,673 | |
Loans, net of allowance | 1,045 | |
| - | |
| 1,045 | | |||
Premises and equipment, net | 6,303 | |
| 2,690 | |
| 8,993 | | |||
Accrued interest receivable | 3 | |
| - | |
| 3 | | |||
Deferred income taxes | - | |
| 353 | |
| 353 | | |||
Core deposit intangibles | - | |
| 7,936 | |
| 7,936 | | |||
Total assets acquired | $ | 328,024 | |
| $ | 10,979 | |
| $ | 339,003 | |
Liabilities |
| |
|
| |
|
| | |||
Deposits | $ | 328,007 | |
| $ | 1,174 | |
| $ | 329,181 | |
Other liabilities | 17 | |
| - | |
| 17 | | |||
Total liabilities assumed | $ | 328,024 | |
| $ | 1,174 | |
| $ | 329,198 | |
Net identifiable assets acquired over liabilities assumed | $ | - | |
| $ | 9,805 | |
| $ | 9,805 | |
Goodwill |
| |
|
| |
| $ | - | | ||
90
HOMETRUST BANCSHARES, INC. AND SUBSIDIARY
Notes to Consolidated Financial Statements
(Dollars in thousands, except per share data)
Bank of Commerce
On July 31, 2014, the Bank completed its acquisition of Bank of Commerce in accordance with the terms of the Agreement and Plan of Share Exchange dated March 3, 2014. Under the terms of the agreement, Bank of Commerce shareholders received $6.25 per share in cash consideration, representing approximately $10,000 of aggregate deal consideration. In addition, all $3,200 of Bank of Commerce's preferred stock was redeemed.
The excess of the merger consideration over the fair value of Bank of Commerce's net assets was allocated to goodwill. The book value as of July 31, 2014, of assets acquired was $122,530 and liabilities assumed was $ 114,672 . The Company recorded $ 1,922 in goodwill related to the acquisition.
The following table presents the consideration paid by the Bank in the acquisition of Bank of Commerce and the assets acquired and liabilities assumed as of July 31, 2014:
| As Recorded By Bank of Commerce |
| Fair Value and Other Merger Related Adjustments |
| As Recorded by the Company | ||||||
Consideration Paid |
|
|
|
|
| ||||||
Cash paid |
|
|
|
| $ | 10,000 | | ||||
Total consideration |
|
|
|
| $ | 10,000 | | ||||
Assets |
|
|
|
|
| | |||||
Cash and cash equivalents | $ | 2,241 | |
| $ | - | |
| $ | 2,241 | |
Securities available for sale | 24,228 | |
| - | |
| 24,228 | | |||
Loans, net of allowance | 89,339 | |
| (2,855 | ) |
| 86,484 | | |||
FHLB Stock | 791 | |
| - | |
| 791 | | |||
REO | 224 | |
| (14 | ) |
| 210 | | |||
Premises and equipment, net | 135 | |
| - | |
| 135 | | |||
Accrued interest receivable | 355 | |
| (100 | ) |
| 255 | | |||
Deferred income taxes | 286 | |
| 2,839 | |
| 3,125 | | |||
Core deposit intangibles | - | |
| 640 | |
| 640 | | |||
Other assets | 4,931 | |
| (6 | ) |
| 4,925 | | |||
Total assets acquired | $ | 122,530 | |
| $ | 504 | |
| $ | 123,034 | |
Liabilities |
| |
|
| |
|
| | |||
Deposits | $ | 93,303 | |
| $ | 112 | |
| $ | 93,415 | |
Borrowings | 15,000 | |
| 172 | |
| 15,172 | | |||
Other liabilities | 6,369 | |
| - | |
| 6,369 | | |||
Total liabilities assumed | $ | 114,672 | |
| $ | 284 | |
| $ | 114,956 | |
Net identifiable assets acquired over liabilities assumed | $ | 7,858 | |
| $ | 220 | |
| $ | 8,078 | |
Goodwill |
| |
|
| |
| $ | 1,922 | | ||
91
HOMETRUST BANCSHARES, INC. AND SUBSIDIARY
Notes to Consolidated Financial Statements
(Dollars in thousands, except per share data)
During the fourth quarter of fiscal 2015, adjustments were made to various assets to better reflect their fair values as of the acquisition date. These adjustments resulted in a net decrease to goodwill of $ 2,031 .
The carrying amount of acquired loans from Bank of Commerce as of July 31, 2014 consisted of purchased performing loans and PCI loans as detailed in the following table:
| Purchased Performing |
| PCI |
| Total Loans | ||||||
Retail Consumer Loans: |
|
|
|
|
| ||||||
One-to-four family | $ | 2,717 | |
| $ | 2,979 | |
| $ | 5,696 | |
Home equity lines of credit | 8,823 | |
| 317 | |
| 9,140 | | |||
Consumer | 37 | |
| 15 | |
| 52 | | |||
Commercial: |
|
|
|
|
| ||||||
Commercial real estate | 29,048 | |
| 30,047 | |
| 59,095 | | |||
Construction and development | 202 | |
| 3,020 | |
| 3,222 | | |||
Commercial and industrial | 5,402 | |
| 3,877 | |
| 9,279 | | |||
Total | $ | 46,229 | |
| $ | 40,255 | |
| $ | 86,484 | |
3. Securities Available for Sale
Securities available for sale consist of the following at the dates indicated:
| June 30, 2017 | ||||||||||||||
| Amortized Cost |
| Gross Unrealized Gains |
| Gross Unrealized Losses |
| Estimated Fair Value | ||||||||
U.S. Government Agencies | $ | 65,947 | |
| $ | 184 | |
| $ | (301 | ) |
| $ | 65,830 | |
Residential Mortgage-backed Securities of U.S. Government Agencies and Government-Sponsored Enterprises | 92,841 | |
| 411 | |
| (281 | ) |
| 92,971 | | ||||
Municipal Bonds | 34,135 | |
| 403 | |
| (28 | ) |
| 34,510 | | ||||
Corporate Bonds | 6,267 | |
| 114 | |
| (88 | ) |
| 6,293 | | ||||
Equity Securities | 63 | |
| - | |
| - | |
| 63 | | ||||
Total | $ | 199,253 | |
| $ | 1,112 | |
| $ | (698 | ) |
| $ | 199,667 | |
| June 30, 2016 | ||||||||||||||
| Amortized Cost |
| Gross Unrealized Gains |
| Gross Unrealized Losses |
| Estimated Fair Value | ||||||||
U.S. Government Agencies | $ | 77,356 | |
| $ | 624 | |
| $ | - | |
| $ | 77,980 | |
Residential Mortgage-backed Securities of U.S. Government Agencies and Government-Sponsored Enterprises | 95,668 | |
| 1,824 | |
| (84 | ) |
| 97,408 | | ||||
Municipal Bonds | 16,242 | |
| 992 | |
| - | |
| 17,234 | | ||||
Corporate Bonds | 7,773 | |
| 194 | |
| - | |
| 7,967 | | ||||
Equity Securities | 63 | |
| - | |
| | |
| $ | 63 | | |||
Total | $ | 197,102 | |
| $ | 3,634 | |
| $ | (84 | ) |
| $ | 200,652 | |
92
HOMETRUST BANCSHARES, INC. AND SUBSIDIARY
Notes to Consolidated Financial Statements
(Dollars in thousands, except per share data)
Debt securities available for sale by contractual maturity at the dates indicated are shown below. Mortgage-backed securities are not included in the maturity categories because the borrowers in the underlying pools may prepay without penalty; therefore, it is unlikely that the securities will pay at their stated maturity schedule.
| June 30, 2017 | ||||||
| Amortized Cost |
| Estimated Fair Value | ||||
Due within one year | $ | 1,430 | |
| $ | 1,430 | |
Due after one year through five years | 75,025 | |
| 74,949 | | ||
Due after five years through ten years | 19,535 | |
| 19,828 | | ||
Due after ten years | 10,359 | |
| 10,426 | | ||
Mortgage-backed securities | 92,841 | |
| 92,971 | | ||
Total | $ | 199,190 | |
| $ | 199,604 | |
| June 30, 2016 | ||||||
| Amortized Cost |
| Estimated Fair Value | ||||
Due within one year | $ | 407 | |
| $ | 411 | |
Due after one year through five years | 79,724 | |
| 80,290 | | ||
Due after five years through ten years | 18,278 | |
| 19,257 | | ||
Due after ten years | 2,962 | |
| 3,223 | | ||
Mortgage-backed securities | 95,668 | |
| 97,408 | | ||
Total | $ | 197,039 | |
| $ | 200,589 | |
Gross proceeds and gross realized gains and losses from sales of securities recognized in net income follow:
| June 30, | ||||||||||
| 2017 |
| 2016 |
| 2015 | ||||||
Gross proceeds from sales of securities | $ | 19,279 | |
| $ | - | |
| $ | 10,387 | |
Gross realized gains from sales of securities | 70 | |
| - | |
| 74 | | |||
Gross realized losses from sales of securities | (48 | ) |
| - | |
| (13 | ) | |||
Securities available for sale with costs totaling $156,592 and $151,359 with market values of $154,264 and $154,132 at June 30, 2017 and June 30, 2016 , respectively, were pledged as collateral to secure various public deposits and borrowings.
The gross unrealized losses and the fair value for securities available for sale aggregated by the length of time that individual securities have been in a continuous unrealized loss position as of June 30, 2017 and June 30, 2016 were as follows:
| June 30, 2017 | ||||||||||||||||||||||
| Less than 12 Months |
| 12 Months or More |
| Total | ||||||||||||||||||
| Fair Value |
| Unrealized Losses |
| Fair Value |
| Unrealized Losses |
| Fair Value |
| Unrealized Losses | ||||||||||||
U.S. Government Agencies | $ | 46,767 | |
| $ | (222 | ) |
| $ | 6,921 | |
| $ | (79 | ) |
| $ | 53,688 | |
| $ | (301 | ) |
Residential Mortgage-backed Securities of U.S. Government Agencies and Government-Sponsored Enterprises | 42,921 | |
| (240 | ) |
| 3,970 | |
| (41 | ) |
| 46,891 | |
| (281 | ) | ||||||
Municipal Bonds | 9,153 | |
| (28 | ) |
| - | |
| - | |
| 9,153 | |
| (28 | ) | ||||||
Corporate Bonds | 3,734 | |
| (88 | ) |
| - | |
| - | |
| 3,734 | |
| (88 | ) | ||||||
Total | $ | 102,575 | |
| $ | (578 | ) |
| $ | 10,891 | |
| $ | (120 | ) |
| $ | 113,466 | |
| $ | (698 | ) |
93
HOMETRUST BANCSHARES, INC. AND SUBSIDIARY
Notes to Consolidated Financial Statements
(Dollars in thousands, except per share data)
| June 30, 2016 | ||||||||||||||||
| Less than 12 Months |
| 12 Months or More |
| Total | ||||||||||||
| Fair Value |
| Unrealized Losses |
| Fair Value |
| Unrealized Losses |
| Fair Value |
| Unrealized Losses | ||||||
Residential Mortgage-backed Securities of U.S. Government Agencies and Government-Sponsored Enterprises | 1,970 | |
| (20 | ) |
| 6,040 | |
| (64 | ) |
| 8,010 | |
| (84 | ) |
The total number of securities with unrealized losses at June 30, 2017 , and June 30, 2016 were 136 and 44 , respectively. Unrealized losses on securities have not been recognized in income because management has the intent and ability to hold the securities for the foreseeable future, and has determined that it is not more likely than not that the Company will be required to sell the securities prior to a recovery in value. The decline in fair value was largely due to increases in market interest rates. The Company had no other than temporary impairment losses during the years ended June 2017 , 2016 or 2015 .
As a requirement for membership, the Bank invests in stock of the FHLB and the Federal Reserve Bank. No ready market exists for these stocks and the carrying value approximates its fair value based on the redemption provisions of the FHLB and the Federal Reserve Bank.
4. Loans
Loans consist of the following at the dates indicated:
| June 30, |
| June 30, | ||||
Retail consumer loans: |
|
|
| ||||
One-to-four family | $ | 684,089 | |
| $ | 623,701 | |
HELOCs - originated | 157,068 | |
| 163,293 | | ||
HELOCs - purchased | 162,407 | |
| 144,377 | | ||
Construction and land/lots | 50,136 | |
| 38,102 | | ||
Indirect auto finance | 140,879 | |
| 108,478 | | ||
Consumer | 7,900 | |
| 4,635 | | ||
Total retail consumer loans | 1,202,479 | |
| 1,082,586 | | ||
Commercial loans: |
|
|
| ||||
Commercial real estate | 730,408 | |
| 486,561 | | ||
Construction and development | 197,966 | |
| 86,840 | | ||
Commercial and industrial | 120,387 | |
| 73,289 | | ||
Municipal leases | 101,175 | |
| 103,183 | | ||
Total commercial loans | 1,149,936 | |
| 749,873 | | ||
Total loans | 2,352,415 | |
| 1,832,459 | | ||
Deferred loan costs (fees), net | (945 | ) |
| 372 | | ||
Total loans, net of deferred loan fees and discount | 2,351,470 | |
| 1,832,831 | | ||
Allowance for loan and lease losses | (21,151 | ) |
| (21,292 | ) | ||
Net loans | $ | 2,330,319 | |
| $ | 1,811,539 | |
All qualifying one-to-four family first mortgage loans, HELOCs, commercial real estate loans, and FHLB Stock are pledged as collateral by a blanket pledge to secure outstanding FHLB advances.
Loans are made to the Company's executive officers and directors and their associates during the ordinary course of business. The aggregate amount of loans to related parties totaled approximately $338 and $837 at June 30, 2017 and 2016, respectively. In relation to these loans are unfunded commitments that totaled approximately $750 and $872 at June 30, 2016 and 2015, respectively.
94
HOMETRUST BANCSHARES, INC. AND SUBSIDIARY
Notes to Consolidated Financial Statements
(Dollars in thousands, except per share data)
The Company's total non-purchased and purchased performing loans by segment, class, and risk grade at the dates indicated follow:
| Pass |
| Special Mention |
| Substandard |
| Doubtful |
| Loss |
| Total | ||||||||||||
June 30, 2017 |
|
|
|
|
|
|
|
|
|
|
| ||||||||||||
Retail consumer loans: |
|
|
|
|
|
|
|
|
|
|
| ||||||||||||
One-to-four family | $ | 655,424 | |
| $ | 4,715 | |
| $ | 14,769 | |
| $ | 1,101 | |
| $ | 11 | |
| $ | 676,020 | |
HELOCs - originated | 153,676 | |
| 809 | |
| 2,100 | |
| 188 | |
| 7 | |
| 156,780 | | ||||||
HELOCs - purchased | 162,215 | |
| - | |
| 192 | |
| - | |
| - | |
| 162,407 | | ||||||
Construction and land/lots | 48,728 | |
| 479 | |
| 341 | |
| 60 | |
| - | |
| 49,608 | | ||||||
Indirect auto finance | 140,780 | |
| - | |
| 97 | |
| 1 | |
| 1 | |
| 140,879 | | ||||||
Consumer | 7,828 | |
| 12 | |
| 34 | |
| - | |
| 8 | |
| 7,882 | | ||||||
Commercial loans: |
|
|
|
|
|
|
|
|
|
|
| ||||||||||||
Commercial real estate | 700,060 | |
| 5,847 | |
| 7,118 | |
| - | |
| - | |
| 713,025 | | ||||||
Construction and development | 192,025 | |
| 992 | |
| 2,320 | |
| - | |
| - | |
| 195,337 | | ||||||
Commercial and industrial | 113,923 | |
| 883 | |
| 2,954 | |
| - | |
| 1 | |
| 117,761 | | ||||||
Municipal leases | 99,811 | |
| 1,258 | |
| 106 | |
| - | |
| - | |
| 101,175 | | ||||||
Total loans | $ | 2,274,470 | |
| $ | 14,995 | |
| $ | 30,031 | |
| $ | 1,350 | |
| $ | 28 | |
| $ | 2,320,874 | |
| Pass |
| Special Mention |
| Substandard |
| Doubtful |
| Loss |
| Total | ||||||||||||
June 30, 2016 |
|
|
|
|
|
|
|
|
|
|
| ||||||||||||
Retail consumer loans: |
|
|
|
|
|
|
|
|
|
|
| ||||||||||||
One-to-four family | $ | 587,440 | |
| $ | 7,800 | |
| $ | 20,129 | |
| $ | 1,283 | |
| $ | 11 | |
| $ | 616,663 | |
HELOCs - originated | 159,275 | |
| 678 | |
| 2,997 | |
| 55 | |
| 10 | |
| 163,015 | | ||||||
HELOCs - purchased | 144,377 | |
| - | |
| - | |
| - | |
| - | |
| 144,377 | | ||||||
Construction and land/lots | 36,298 | |
| 542 | |
| 679 | |
| 9 | |
| - | |
| 37,528 | | ||||||
Indirect auto finance | 108,432 | |
| 14 | |
| 21 | |
| 11 | |
| - | |
| 108,478 | | ||||||
Consumer | 4,390 | |
| 1 | |
| 224 | |
| 2 | |
| 9 | |
| 4,626 | | ||||||
Commercial loans: |
|
|
|
|
|
|
|
|
|
|
| ||||||||||||
Commercial real estate | 448,188 | |
| 7,817 | |
| 9,232 | |
| 1 | |
| - | |
| 465,238 | | ||||||
Construction and development | 79,005 | |
| 480 | |
| 4,208 | |
| - | |
| - | |
| 83,693 | | ||||||
Commercial and industrial | 63,299 | |
| 1,032 | |
| 5,361 | |
| - | |
| 2 | |
| 69,694 | | ||||||
Municipal leases | 100,867 | |
| 1,651 | |
| 665 | |
| - | |
| - | |
| 103,183 | | ||||||
Total loans | $ | 1,731,571 | |
| $ | 20,015 | |
| $ | 43,516 | |
| $ | 1,361 | |
| $ | 32 | |
| $ | 1,796,495 | |
The Company's total PCI loans by segment, class, and risk grade at the dates indicated follow:
| Pass |
| Special Mention |
| Substandard |
| Doubtful |
| Loss |
| Total | ||||||||||||
June 30, 2017 |
|
|
|
|
|
|
|
|
|
|
| ||||||||||||
Retail consumer loans: |
|
|
|
|
|
|
|
|
|
|
| ||||||||||||
One-to-four family | $ | 3,115 | |
| $ | 1,129 | |
| $ | 3,615 | |
| $ | 210 | |
| $ | - | |
| $ | 8,069 | |
HELOCs - originated | 258 | |
| - | |
| 30 | |
| - | |
| - | |
| 288 | | ||||||
Construction and land/lots | 487 | |
| - | |
| 41 | |
| - | |
| - | |
| 528 | | ||||||
Consumer | 4 | |
| 14 | |
| - | |
| - | |
| - | |
| 18 | | ||||||
Commercial loans: |
|
|
|
|
|
|
|
|
|
|
| ||||||||||||
Commercial real estate | 8,909 | |
| 2,299 | |
| 6,175 | |
| - | |
| - | |
| 17,383 | | ||||||
Construction and development | 338 | |
| - | |
| 2,291 | |
| - | |
| - | |
| 2,629 | | ||||||
Commercial and industrial | 2,460 | |
| 44 | |
| 122 | |
| - | |
| - | |
| 2,626 | | ||||||
Total loans | $ | 15,571 | |
| $ | 3,486 | |
| $ | 12,274 | |
| $ | 210 | |
| $ | - | |
| $ | 31,541 | |
95
HOMETRUST BANCSHARES, INC. AND SUBSIDIARY
Notes to Consolidated Financial Statements
(Dollars in thousands, except per share data)
| Pass |
| Special Mention |
| Substandard |
| Doubtful |
| Loss |
| Total | ||||||||||||
June 30, 2016 |
|
|
|
|
|
|
|
|
|
|
| ||||||||||||
Retail consumer loans: |
|
|
|
|
|
|
|
|
|
|
| ||||||||||||
One-to-four family | $ | 5,039 | |
| $ | 377 | |
| $ | 1,593 | |
| $ | 14 | |
| $ | 15 | |
| $ | 7,038 | |
HELOCs - originated | 258 | |
| - | |
| 20 | |
| - | |
| - | |
| 278 | | ||||||
Construction and land/lots | 522 | |
| - | |
| 52 | |
| - | |
| - | |
| 574 | | ||||||
Consumer | 8 | |
| - | |
| - | |
| - | |
| 1 | |
| 9 | | ||||||
Commercial loans: |
|
|
|
|
|
|
|
|
|
|
| ||||||||||||
Commercial real estate | 12,594 | |
| 4,266 | |
| 4,463 | |
| - | |
| - | |
| 21,323 | | ||||||
Construction and development | 1,136 | |
| 292 | |
| 1,719 | |
| - | |
| - | |
| 3,147 | | ||||||
Commercial and industrial | 3,234 | |
| 194 | |
| 167 | |
| - | |
| - | |
| 3,595 | | ||||||
Total loans | $ | 22,791 | |
| $ | 5,129 | |
| $ | 8,014 | |
| $ | 14 | |
| $ | 16 | |
| $ | 35,964 | |
The Company's total loans by segment, class, and delinquency status at the dates indicated follows:
| Past Due |
|
|
| Total | ||||||||||||||
| 30-89 Days |
| 90 Days+ |
| Total |
| Current |
| Loans | ||||||||||
June 30, 2017 |
|
|
|
|
|
|
|
|
| ||||||||||
Retail consumer loans: |
|
|
|
|
|
|
|
|
| ||||||||||
One-to-four family | $ | 3,496 | |
| $ | 3,990 | |
| $ | 7,486 | |
| $ | 676,603 | |
| $ | 684,089 | |
HELOCs - originated | 1,037 | |
| 274 | |
| 1,311 | |
| 155,757 | |
| 157,068 | | |||||
HELOCs - purchased | - | |
| - | |
| - | |
| 162,407 | |
| 162,407 | | |||||
Construction and land/lots | 132 | |
| 129 | |
| 261 | |
| 49,875 | |
| 50,136 | | |||||
Indirect auto finance | 96 | |
| - | |
| 96 | |
| 140,783 | |
| 140,879 | | |||||
Consumer | 5 | |
| 14 | |
| 19 | |
| 7,881 | |
| 7,900 | | |||||
Commercial loans: |
|
|
|
|
|
|
|
|
| ||||||||||
Commercial real estate | 809 | |
| 3,100 | |
| 3,909 | |
| 726,499 | |
| 730,408 | | |||||
Construction and development | 385 | |
| 887 | |
| 1,272 | |
| 196,694 | |
| 197,966 | | |||||
Commercial and industrial | 37 | |
| 831 | |
| 868 | |
| 119,519 | |
| 120,387 | | |||||
Municipal leases | - | |
| - | |
| - | |
| 101,175 | |
| 101,175 | | |||||
Total loans | $ | 5,997 | |
| $ | 9,225 | |
| $ | 15,222 | |
| $ | 2,337,193 | |
| $ | 2,352,415 | |
| Past Due |
|
|
| Total | ||||||||||||||
| 30-89 Days |
| 90 Days+ |
| Total |
| Current |
| Loans | ||||||||||
June 30, 2016 |
|
|
|
|
|
|
|
|
| ||||||||||
Retail consumer loans: |
|
|
|
|
|
|
|
|
| ||||||||||
One-to-four family | $ | 3,514 | |
| $ | 5,476 | |
| $ | 8,990 | |
| $ | 614,711 | |
| $ | 623,701 | |
HELOCs - originated | 220 | |
| 377 | |
| 597 | |
| 162,696 | |
| 163,293 | | |||||
HELOCs - purchased | - | |
| - | |
| - | |
| 144,377 | |
| 144,377 | | |||||
Construction and land/lots | 100 | |
| 119 | |
| 219 | |
| 37,883 | |
| 38,102 | | |||||
Indirect auto finance | 182 | |
| - | |
| 182 | |
| 108,296 | |
| 108,478 | | |||||
Consumer | 4 | |
| 4 | |
| 8 | |
| 4,627 | |
| 4,635 | | |||||
Commercial loans: |
|
|
|
|
|
|
|
|
| ||||||||||
Commercial real estate | 1,436 | |
| 3,353 | |
| 4,789 | |
| 481,772 | |
| 486,561 | | |||||
Construction and development | 371 | |
| 1,296 | |
| 1,667 | |
| 85,173 | |
| 86,840 | | |||||
Commercial and industrial | 216 | |
| 2,819 | |
| 3,035 | |
| 70,254 | |
| 73,289 | | |||||
Municipal leases | - | |
| - | |
| - | |
| 103,183 | |
| 103,183 | | |||||
Total loans | $ | 6,043 | |
| $ | 13,444 | |
| $ | 19,487 | |
| $ | 1,812,972 | |
| $ | 1,832,459 | |
96
HOMETRUST BANCSHARES, INC. AND SUBSIDIARY
Notes to Consolidated Financial Statements
(Dollars in thousands, except per share data)
The Company's recorded investment in loans, by segment and class that are not accruing interest or are 90 days or more past due and still accruing interest at the dates indicated follow:
| June 30, 2017 |
| June 30, 2016 | ||||||||||||
| Nonaccruing |
| 90 Days + & still accruing |
| Nonaccruing |
| 90 Days + & still accruing | ||||||||
Retail consumer loans: |
|
|
|
|
|
|
| ||||||||
One-to-four family | $ | 6,453 | |
| $ | - | |
| $ | 9,192 | |
| $ | - | |
HELOCs - originated | 1,291 | |
| - | |
| 1,026 | |
| - | | ||||
HELOCs - purchased | 192 | |
| - | |
| - | |
| - | | ||||
Construction and land/lots | 245 | |
| - | |
| 188 | |
| - | | ||||
Indirect auto finance | 1 | |
| - | |
| 20 | |
| - | | ||||
Consumer | 29 | |
| - | |
| 15 | |
| - | | ||||
Commercial loans: |
|
|
|
|
|
|
| ||||||||
Commercial real estate | 2,756 | |
| - | |
| 3,222 | |
| - | | ||||
Construction and development | 1,766 | |
| - | |
| 1,417 | |
| - | | ||||
Commercial and industrial | 827 | |
| - | |
| 3,019 | |
| - | | ||||
Municipal leases | 106 | |
| - | |
| 419 | |
| - | | ||||
Total loans | $ | 13,666 | |
| $ | - | |
| $ | 18,518 | |
| $ | - | |
PCI loans totaling $ 6,664 at June 30, 2017 and $6,607 at June 30, 2016 are excluded from nonaccruing loans due to the accretion of discounts established in accordance with the acquisition method of accounting for business combinations.
TDRs are loans which have renegotiated loan terms to assist borrowers who are unable to meet the original terms of their loans. Such modifications to loan terms may include a lower interest rate, a reduction in principal, or a longer term to maturity. Additionally, all TDRs are considered impaired.
The Company's loans that were performing under the payment terms of TDRs that were excluded from nonaccruing loans above at the dates indicated follow:
| June 30, 2017 |
| June 30, 2016 | ||||
Performing TDRs included in impaired loans | $ | 27,043 | |
| $ | 28,263 | |
An analysis of the allowance for loan losses by segment for the periods shown is as follows:
| June 30, 2017 | ||||||||||||||
| PCI |
| Retail Consumer |
| Commercial |
| Total | ||||||||
Balance at beginning of period | $ | 361 | |
| $ | 11,549 | |
| $ | 9,382 | |
| $ | 21,292 | |
Provision for (recovery of) loan losses | 366 | |
| (2,829 | ) |
| 2,463 | |
| - | | ||||
Charge-offs | - | |
| (1,219 | ) |
| (1,331 | ) |
| (2,550 | ) | ||||
Recoveries | - | |
| 1,084 | |
| 1,325 | |
| 2,409 | | ||||
Balance at end of period | $ | 727 | |
| $ | 8,585 | |
| $ | 11,839 | |
| $ | 21,151 | |
| June 30, 2016 | ||||||||||||||
| PCI |
| Retail Consumer |
| Commercial |
| Total | ||||||||
Balance at beginning of period | $ | 401 | |
| $ | 12,575 | |
| $ | 9,398 | |
| $ | 22,374 | |
Provision for (recovery of) loan losses | (40 | ) |
| (597 | ) |
| 637 | |
| - | | ||||
Charge-offs | - | |
| (1,663 | ) |
| (2,041 | ) |
| (3,704 | ) | ||||
Recoveries | - | |
| 1,234 | |
| 1,388 | |
| 2,622 | | ||||
Balance at end of period | $ | 361 | |
| $ | 11,549 | |
| $ | 9,382 | |
| $ | 21,292 | |
97
HOMETRUST BANCSHARES, INC. AND SUBSIDIARY
Notes to Consolidated Financial Statements
(Dollars in thousands, except per share data)
| June 30, 2015 | ||||||||||||||
| PCI |
| Retail Consumer |
| Commercial |
| Total | ||||||||
Balance at beginning of period | $ | - | |
| $ | 15,731 | |
| $ | 7,698 | |
| $ | 23,429 | |
Provision for (recovery of) loan losses | 1,053 | |
| (1,258 | ) |
| 355 | |
| 150 | | ||||
Charge-offs | (652 | ) |
| (3,107 | ) |
| (1,101 | ) |
| (4,860 | ) | ||||
Recoveries | - | |
| 1,209 | |
| 2,446 | |
| 3,655 | | ||||
Balance at end of period | $ | 401 | |
| $ | 12,575 | |
| $ | 9,398 | |
| $ | 22,374 | |
The Company's ending balances of loans and the related allowance, by segment and class, at the dates indicated follows:
| Allowance for Loan Losses |
| Total Loans Receivable | ||||||||||||||||||||||||||||
| PCI |
| Loans individually evaluated for impairment |
| Loans Collectively Evaluated |
| Total |
| PCI |
| Loans individually evaluated for impairment |
| Loans Collectively Evaluated |
| Total | ||||||||||||||||
June 30, 2017 |
|
|
|
|
|
|
|
|
|
|
|
|
|
|
| ||||||||||||||||
Retail consumer loans: |
|
|
|
|
|
|
|
|
|
|
|
|
|
|
| ||||||||||||||||
One-to-four family | $ | 28 | |
| $ | 863 | |
| $ | 3,585 | |
| $ | 4,476 | |
| $ | 8,069 | |
| $ | 10,305 | |
| $ | 665,715 | |
| $ | 684,089 | |
HELOCs - originated | - | |
| 44 | |
| 1,340 | |
| 1,384 | |
| 288 | |
| 12 | |
| 156,768 | |
| 157,068 | | ||||||||
HELOCs - purchased | - | |
| - | |
| 838 | |
| 838 | |
| - | |
| - | |
| 162,407 | |
| 162,407 | | ||||||||
Construction and land/lots | - | |
| 88 | |
| 889 | |
| 977 | |
| 528 | |
| 634 | |
| 48,974 | |
| 50,136 | | ||||||||
Indirect auto finance | - | |
| 1 | |
| 880 | |
| 881 | |
| - | |
| 1 | |
| 140,878 | |
| 140,879 | | ||||||||
Consumer | - | |
| 8 | |
| 49 | |
| 57 | |
| 18 | |
| 8 | |
| 7,874 | |
| 7,900 | | ||||||||
Commercial loans: |
|
|
|
|
|
|
|
|
|
|
|
|
|
|
| ||||||||||||||||
Commercial real estate | 512 | |
| 239 | |
| 6,600 | |
| 7,351 | |
| 17,383 | |
| 6,284 | |
| 706,741 | |
| 730,408 | | ||||||||
Construction and development | 171 | |
| 13 | |
| 2,982 | |
| 3,166 | |
| 2,629 | |
| 2,184 | |
| 193,153 | |
| 197,966 | | ||||||||
Commercial and industrial | 16 | |
| 287 | |
| 1,221 | |
| 1,524 | |
| 2,626 | |
| 1,514 | |
| 116,247 | |
| 120,387 | | ||||||||
Municipal leases | - | |
| - | |
| 497 | |
| 497 | |
| - | |
| - | |
| 101,175 | |
| 101,175 | | ||||||||
Total | $ | 727 | |
| $ | 1,543 | |
| $ | 18,881 | |
| $ | 21,151 | |
| $ | 31,541 | |
| $ | 20,942 | |
| $ | 2,299,932 | |
| $ | 2,352,415 | |
June 30, 2016 |
|
|
|
|
|
|
|
|
|
|
|
|
|
|
| ||||||||||||||||
Retail consumer loans: |
|
|
|
|
|
|
|
|
|
|
|
|
|
|
| ||||||||||||||||
One-to-four family | $ | 23 | |
| $ | 187 | |
| $ | 6,385 | |
| $ | 6,595 | |
| $ | 7,038 | |
| $ | 12,411 | |
| $ | 604,252 | |
| $ | 623,701 | |
HELOCs - originated | - | |
| 288 | |
| 1,709 | |
| 1,997 | |
| 278 | |
| 1,145 | |
| 161,870 | |
| 163,293 | | ||||||||
HELOCs - purchased | - | |
| - | |
| 558 | |
| 558 | |
| - | |
| - | |
| 144,377 | |
| 144,377 | | ||||||||
Construction and land/lots | - | |
| 198 | |
| 1,146 | |
| 1,344 | |
| 574 | |
| 392 | |
| 37,136 | |
| 38,102 | | ||||||||
Indirect auto finance | - | |
| - | |
| 1,016 | |
| 1,016 | |
| - | |
| - | |
| 108,478 | |
| 108,478 | | ||||||||
Consumer | - | |
| 10 | |
| 51 | |
| 61 | |
| 9 | |
| - | |
| 4,626 | |
| 4,635 | | ||||||||
Commercial loans: |
|
|
|
|
|
|
|
|
|
|
|
|
|
|
| ||||||||||||||||
Commercial real estate | 288 | |
| - | |
| 6,142 | |
| 6,430 | |
| 21,323 | |
| 5,376 | |
| 459,862 | |
| 486,561 | | ||||||||
Construction and development | 17 | |
| - | |
| 1,891 | |
| 1,908 | |
| 3,147 | |
| 1,789 | |
| 81,904 | |
| 86,840 | | ||||||||
Commercial and industrial | 33 | |
| 3 | |
| 685 | |
| 721 | |
| 3,595 | |
| 2,927 | |
| 66,767 | |
| 73,289 | | ||||||||
Municipal leases | - | |
| - | |
| 662 | |
| 662 | |
| - | |
| 305 | |
| 102,878 | |
| 103,183 | | ||||||||
Total | $ | 361 | |
| $ | 686 | |
| $ | 20,245 | |
| $ | 21,292 | |
| $ | 35,964 | |
| $ | 24,345 | |
| $ | 1,772,150 | |
| $ | 1,832,459 | |
Loans acquired from acquisitions are initially excluded from the allowance for loan losses in accordance with the acquisition method of accounting for business combinations. The Company records these loans at fair value, which includes a credit discount, therefore, no allowance for loan losses are established for these acquired loans at acquisition. A provision for loan losses is recorded for any further deterioration in these acquired loans subsequent to the acquisition.
98
HOMETRUST BANCSHARES, INC. AND SUBSIDIARY
Notes to Consolidated Financial Statements
(Dollars in thousands, except per share data)
The Company's impaired loans and the related allowance, by segment and class, at the dates indicated follows:
| Total Impaired Loans | ||||||||||||||||||
| Unpaid Principal Balance |
| With a Recorded Allowance |
| With No Recorded Allowance |
| Total |
| Related Recorded Allowance | ||||||||||
June 30, 2017 |
|
|
|
|
|
|
|
|
| ||||||||||
Retail consumer loans: |
|
|
|
|
|
|
|
|
| ||||||||||
One-to-four family | $ | 28,469 | |
| $ | 17,353 | |
| $ | 7,773 | |
| $ | 25,126 | |
| $ | 881 | |
HELOCs - originated | 4,070 | |
| 2,270 | |
| 532 | |
| 2,802 | |
| 49 | | |||||
HELOCs - purchased | 192 | |
| | |
| 192 | |
| 192 | |
| - | | |||||
Construction and land/lots | 2,817 | |
| 1,310 | |
| 468 | |
| 1,778 | |
| 88 | | |||||
Indirect auto finance | 22 | |
| - | |
| 1 | |
| 1 | |
| 1 | | |||||
Consumer | 552 | |
| 15 | |
| 27 | |
| 42 | |
| 8 | | |||||
Commercial loans: |
|
|
|
|
|
|
|
|
| ||||||||||
Commercial real estate | 8,307 | |
| 4,721 | |
| 3,186 | |
| 7,907 | |
| 253 | | |||||
Construction and development | 3,768 | |
| 1,024 | |
| 1,617 | |
| 2,641 | |
| 16 | | |||||
Commercial and industrial | 7,757 | |
| 845 | |
| 1,231 | |
| 2,076 | |
| 288 | | |||||
Municipal leases | 400 | |
| 106 | |
| 294 | |
| 400 | |
| - | | |||||
Total impaired loans | $ | 56,354 | |
| $ | 27,644 | |
| $ | 15,321 | |
| $ | 42,965 | |
| $ | 1,584 | |
June 30, 2016 |
|
|
|
|
|
|
|
|
| ||||||||||
Retail consumer loans: |
|
|
|
|
|
|
|
|
| ||||||||||
One-to-four family | $ | 29,053 | |
| $ | 12,348 | |
| $ | 13,375 | |
| $ | 25,723 | |
| $ | 281 | |
HELOCs - originated | 4,486 | |
| 1,999 | |
| 1,178 | |
| 3,177 | |
| 305 | | |||||
Construction and land/lots | 2,890 | |
| 764 | |
| 693 | |
| 1,457 | |
| 209 | | |||||
Indirect auto finance | 45 | |
| 20 | |
| - | |
| 20 | |
| - | | |||||
Consumer | 514 | |
| 9 | |
| 13 | |
| 22 | |
| 10 | | |||||
Commercial loans: |
|
|
|
|
|
|
|
|
| ||||||||||
Commercial real estate | 7,433 | |
| 857 | |
| 5,776 | |
| 6,633 | |
| 13 | | |||||
Construction and development | 3,556 | |
| 600 | |
| 1,929 | |
| 2,529 | |
| 14 | | |||||
Commercial and industrial | 9,710 | |
| 1,197 | |
| 2,930 | |
| 4,127 | |
| 17 | | |||||
Municipal leases | 419 | |
| 114 | |
| 305 | |
| 419 | |
| 1 | | |||||
Total impaired loans | $ | 58,106 | |
| $ | 17,908 | |
| $ | 26,199 | |
| $ | 44,107 | |
| $ | 850 | |
Impaired loans above excludes $13,425 at June 30, 2017 and $2,541 at June 30, 2016 in PCI loans due to the accretion of discounts established in accordance with the acquisition method of accounting for business combinations.
During the year ended June 30, 2017, impaired loans with a recorded allowance increased $9,148 primarily due to the change in methodology of measuring impairment during the first quarter of fiscal 2017 from the collateral method to the present value of future cash flows method to better reflect the anticipated repayments of these loans.
The table above includes $22,023 and $19,762 of impaired loans that were not individually evaluated at June 30, 2017 and June 30, 2016 , respectively, because these loans did not meet the Company's threshold for individual impairment evaluation. The recorded allowance above includes $41 and $164 related to these loans that were not individually evaluated at June 30, 2017 and June 30, 2016 , respectively.
99
HOMETRUST BANCSHARES, INC. AND SUBSIDIARY
Notes to Consolidated Financial Statements
(Dollars in thousands, except per share data)
The Company's average recorded investment in loans individually evaluated for impairment as of the dates indicated below, and interest income recognized on impaired loans for the year ended as follows:
| June 30, 2017 |
| June 30, 2016 |
| June 30, 2015 | ||||||||||||||||||
| Average Recorded Investment |
| Interest Income Recognized |
| Average Recorded Investment |
| Interest Income Recognized |
| Average Recorded Investment |
| Interest Income Recognized | ||||||||||||
Retail consumer loans: |
|
|
|
|
|
|
|
|
|
|
| ||||||||||||
One-to-four family | $ | 25,814 | |
| $ | 1,229 | |
| $ | 28,479 | |
| $ | 1,477 | |
| $ | 30,089 | |
| $ | 1,696 | |
HELOCs - originated | 2,555 | |
| 157 | |
| 3,593 | |
| 200 | |
| 4,373 | |
| 238 | | ||||||
HELOCs - purchased | 48 | |
| 12 | |
| - | |
| - | |
| - | |
| - | | ||||||
Construction and land/lots | 1,734 | |
| 139 | |
| 1,787 | |
| 135 | |
| 2,074 | |
| 158 | | ||||||
Indirect auto finance | 106 | |
| 2 | |
| 7 | |
| 2 | |
| - | |
| - | | ||||||
Consumer | 35 | |
| 20 | |
| 55 | |
| 23 | |
| 46 | |
| 24 | | ||||||
Commercial loans: |
|
|
|
|
|
|
|
|
|
|
| ||||||||||||
Commercial real estate | 8,035 | |
| 346 | |
| 8,506 | |
| 440 | |
| 14,718 | |
| 243 | | ||||||
Construction and development | 2,622 | |
| 98 | |
| 3,469 | |
| 84 | |
| 5,654 | |
| 167 | | ||||||
Commercial and industrial | 2,737 | |
| 125 | |
| 4,379 | |
| 155 | |
| 2,496 | |
| 188 | | ||||||
Municipal leases | 406 | |
| 18 | |
| 452 | |
| 22 | |
| 303 | |
| 24 | | ||||||
Total loans | $ | 44,092 | |
| $ | 2,146 | |
| $ | 50,727 | |
| $ | 2,538 | |
| $ | 59,753 | |
| $ | 2,738 | |
A summary of changes in the accretable yield for PCI loans at the dates indicated below:
| Year Ended June 30, 2017 |
| Year Ended June 30, 2016 | ||||
Accretable yield, beginning of period | $ | 9,532 | |
| $ | 11,096 | |
Addition from TriSummit acquisition | 1,288 | |
| - | | ||
Reclass from nonaccretable yield (1) | 1,537 | |
| 1,452 | | ||
Other changes, net (2) | (427 | ) |
| 1,436 | | ||
Interest income | (4,850 | ) |
| (4,452 | ) | ||
Accretable yield, end of period | $ | 7,080 | |
| $ | 9,532 | |
______________________________
(1) | Represents changes attributable to expected losses assumptions. |
(2) | Represents changes in cash flows expected to be collected due to the impact of modifications, changes in prepayment assumptions, and changes in interest rates. |
The following table presents carrying values and unpaid principal balances for PCI loans at the dates indicated below:
| June 30, 2017 |
| June 30, 2016 | ||||
Carrying value of PCI loans | $ | 31,541 | |
| $ | 35,964 | |
Unpaid principal balance of PCI loans | $ | 37,955 | |
| $ | 43,398 | |
100
HOMETRUST BANCSHARES, INC. AND SUBSIDIARY
Notes to Consolidated Financial Statements
(Dollars in thousands, except per share data)
The following table presents a breakdown of the types of concessions made on TDRs by loan class:
| Year Ended June 30, 2017 |
| Year Ended June 30, 2016 | ||||||||||||||||||
| Number of Loans |
| Pre Modification Outstanding Recorded Investment |
| Post Modification Outstanding Recorded Investment |
| Number of Loans |
| Pre Modification Outstanding Recorded Investment |
| Post Modification Outstanding Recorded Investment | ||||||||||
Below market interest rate: |
|
|
|
|
|
|
|
|
|
|
| ||||||||||
Retail consumer: |
|
|
|
|
|
|
|
|
|
|
| ||||||||||
One-to-four family | 3 | |
| $ | 288 | |
| $ | 285 | |
| 5 | |
| $ | 234 | |
| $ | 238 | |
Construction and land/lots | 2 | |
| 80 | |
| 79 | |
| - | |
| - | |
| - | | ||||
Commercial: |
|
|
|
|
|
|
|
|
|
|
| ||||||||||
Commercial real estate | - | |
| $ | - | |
| $ | - | |
| 1 | |
| $ | 590 | |
| 578 | | |
Total | 5 | |
| $ | 368 | |
| $ | 364 | |
| 6 | |
| $ | 824 | |
| $ | 816 | |
Extended payment terms: |
|
|
|
|
|
|
|
|
|
|
| ||||||||||
Retail consumer: |
|
|
|
|
|
|
|
|
|
|
| ||||||||||
One-to-four family | 5 | |
| $ | 186 | |
| $ | 179 | |
| 5 | |
| $ | 142 | |
| $ | 147 | |
HELOCs - originated | 1 | |
| 37 | |
| 37 | |
| 2 | |
| 28 | |
| 25 | | ||||
Construction and land/lots | 1 | |
| 280 | |
| 264 | |
| - | |
| - | |
| - | | ||||
Consumer | 2 | |
| 11 | |
| 11 | |
| - | |
| - | |
| - | | ||||
Commercial: |
|
|
|
|
|
|
|
|
|
|
| ||||||||||
Commercial real estate | - | |
| - | |
| - | |
| 1 | |
| 286 | |
| 284 | | ||||
Construction and development | 1 | |
| 439 | |
| 439 | |
| 1 | |
| 128 | |
| 128 | | ||||
Commercial and industrial | 2 | |
| 52 | |
| 50 | |
| 2 | |
| 164 | |
| $ | 155 | | |||
Total | 12 | |
| $ | 1,005 | |
| $ | 980 | |
| 11 | |
| $ | 748 | |
| $ | 739 | |
Other TDRs: |
|
|
|
|
|
|
|
|
|
|
| ||||||||||
Retail consumer: |
|
|
|
|
|
|
|
|
|
|
| ||||||||||
One-to-four family | 13 | |
| $ | 525 | |
| $ | 517 | |
| 30 | |
| $ | 2,890 | |
| $ | 2,498 | |
HELOCs - originated | 2 | |
| 33 | |
| 31 | |
| 4 | |
| 228 | |
| 227 | | ||||
Construction and land/lots | 4 | |
| 404 | |
| 318 | |
| - | |
| - | |
| - | | ||||
Consumer | - | |
| - | |
| - | |
| 1 | |
| 2 | |
| 1 | | ||||
Commercial: |
|
|
|
|
|
|
|
|
|
|
| ||||||||||
Commercial real estate | 3 | |
| 2,349 | |
| 2,035 | |
| - | |
| - | |
| - | | ||||
Construction and development | - | |
| - | |
| - | |
| 2 | |
| 386 | |
| 371 | | ||||
Commercial and industrial | 2 | |
| $ | 231 | |
| $ | 227 | |
| 1 | |
| $ | 997 | |
| $ | 957 | |
Total | 24 | |
| $ | 3,542 | |
| $ | 3,128 | |
| 38 | |
| $ | 4,503 | |
| $ | 4,054 | |
Total | 41 | |
| $ | 4,915 | |
| $ | 4,472 | |
| 55 | |
| $ | 6,075 | |
| $ | 5,609 | |
101
HOMETRUST BANCSHARES, INC. AND SUBSIDIARY
Notes to Consolidated Financial Statements
(Dollars in thousands, except per share data)
The following table presents loans that were modified as TDRs within the previous 12 months and for which there was a payment default during the years ended June 30, 2017 and 2016 .
| Year Ended June 30, 2017 |
| Year Ended June 30, 2016 | ||||||||||
| Number of Loans |
| Recorded Investment |
| Number of Loans |
| Recorded Investment | ||||||
Below market interest rate: |
|
|
|
|
|
|
| ||||||
Retail consumer: |
|
|
|
|
|
|
| ||||||
One-to-four family | - | |
| $ | - | |
| 2 | |
| $ | 63 | |
Total | - | |
| $ | - | |
| 2 | |
| $ | 63 | |
Extended payment terms: |
|
|
|
|
|
|
| ||||||
Retail consumer: |
|
|
|
|
|
|
| ||||||
One-to-four family | - | |
| $ | - | |
| 2 | |
| $ | 43 | |
Total | - | |
| $ | - | |
| 2 | |
| $ | 43 | |
Other TDRs: |
|
|
|
|
|
|
| ||||||
Retail consumer: |
|
|
|
|
|
|
| ||||||
One-to-four family | 2 | |
| $ | 27 | |
| 11 | |
| $ | 529 | |
HELOCs - originated | - | |
| - | |
| 1 | |
| 8 | | ||
Construction and land/lots | 1 | |
| 19 | |
| - | |
| - | | ||
Commercial: |
|
|
|
|
|
|
| ||||||
Construction and development | - | |
| - | |
| 2 | |
| 371 | | ||
Total | 3 | |
| $ | 46 | |
| 14 | |
| $ | 908 | |
Total | 3 | |
| $ | 46 | |
| 18 | |
| $ | 1,014 | |
Other TDRs include TDRs that have a below market interest rate and extended payment terms. The Company does not typically forgive principal when restructuring troubled debt.
In the determination of the allowance for loan losses, management considers TDRs for all loan classes, and the subsequent nonperformance in accordance with their modified terms, by measuring impairment on a loan-by-loan basis based on either the value of the loan's expected future cash flows discounted at the loan's original effective interest rate or on the collateral value, net of the estimated costs of disposal, if the loan is collateral dependent.
5. Premises and Equipment
Premises and equipment consist of the following:
| June 30, | ||||||
| 2017 |
| 2016 | ||||
Land | $ | 20,148 | |
| $ | 15,833 | |
Land held under capital lease | 2,052 | |
| 2,052 | | ||
Office buildings | 56,765 | |
| 49,852 | | ||
Furniture, fixtures and equipment | 14,877 | |
| 16,179 | | ||
Total | 93,842 | |
| 83,916 | | ||
Less accumulated depreciation | (30,194 | ) |
| (29,685 | ) | ||
Premises and equipment, net | $ | 63,648 | |
| $ | 54,231 | |
102
HOMETRUST BANCSHARES, INC. AND SUBSIDIARY
Notes to Consolidated Financial Statements
(Dollars in thousands, except per share data)
6. Accrued Interest Receivable
Accrued interest receivable consists of the following:
| June 30, | ||||||
| 2017 |
| 2016 | ||||
Loans | $ | 7,349 | |
| $ | 6,299 | |
Securities available for sale | 880 | |
| 676 | | ||
Other | 529 | |
| 430 | | ||
Total | $ | 8,758 | |
| $ | 7,405 | |
7. Real Estate Owned
| June 30, | ||||||
| 2017 |
| 2016 | ||||
Balance at beginning of period | $ | 5,956 | |
| $ | 7,024 | |
Transfers from loans | 2,417 | |
| 2,189 | | ||
Acquired through mergers | 1,511 | |
| - | | ||
Sales, net of loss | (3,285 | ) |
| (3,038 | ) | ||
Writedowns | (292 | ) |
| (318 | ) | ||
Capital improvements | 11 | |
| 99 | | ||
Balance at end of period | $ | 6,318 | |
| $ | 5,956 | |
At June 30, 2017 and 2016 , the Bank had $ 1,015 and $824 , respectively, of foreclosed residential real estate property in REO. The recorded investment in consumer mortgage loans collateralized by residential real estate in the process of foreclosure totaled $2,230 and $1,681 for June 30, 2017 and 2016 , respectively.
8. Goodwill and Core Deposit Intangibles
The changes in the carrying amount of the Company's goodwill are as follows:
| Goodwill | ||
Balance, June 30, 2015 | $ | 12,673 | |
Additions | - | | |
Balance, June 30, 2016 | $ | 12,673 | |
Additions | 12,965 | | |
Balance, June 30, 2017 | $ | 25,638 | |
During 2017, the Company recorded $12,965 in goodwill as a result of the United Financial and TriSummit acquisitions. See footnote 2 for more details regarding these acquisitions.
The Company added $2,860 in core deposit intangibles during 2017 related to TriSummit. Amortization expense related to core deposit intangibles was $2,823 , $2,907 , and $2,547 for the years ended June 30, 2017 , 2016 , and 2015 , respectively.
103
HOMETRUST BANCSHARES, INC. AND SUBSIDIARY
Notes to Consolidated Financial Statements
(Dollars in thousands, except per share data)
Estimated amortization expense for each of the next five years and thereafter is as follows:
| June 30, 2017 | ||
2018 | $ | 2,645 | |
2019 | 2,029 | | |
2020 | 1,414 | | |
2021 | 741 | | |
2022 | 251 | | |
Thereafter | 93 | | |
Total | $ | 7,173 | |
9. Deposit Accounts
Deposit accounts consist of the following:
|
|
| Weighted Average Interest Rates | ||||||||||
| June 30, |
| June 30, | ||||||||||
| 2017 |
| 2016 |
| 2017 |
| 2016 | ||||||
Noninterest-bearing accounts | $ | 310,172 | |
| $ | 225,336 | |
| - | % |
| - | % |
NOW accounts | 469,377 | |
| 403,574 | |
| 0.08 | % |
| 0.08 | % | ||
Money market accounts | 569,607 | |
| 520,320 | |
| 0.27 | % |
| 0.29 | % | ||
Savings accounts | 237,149 | |
| 210,817 | |
| 0.13 | % |
| 0.12 | % | ||
Certificates of deposit | 462,146 | |
| 442,649 | |
| 0.60 | % |
| 0.53 | % | ||
Total | $ | 2,048,451 | |
| $ | 1,802,696 | |
| 0.24 | % |
| 0.27 | % |
Deposits received from executive officers and directors and their associates totaled approximately $4,408 and $4,365 at June 30, 2017 and 2016 , respectively.
Maturities of certificates of deposit are as follows:
| June 30, 2017 | ||
2018 | $ | 333,774 | |
2019 | 56,176 | | |
2020 | 36,323 | | |
2021 | 17,534 | | |
2022 | 15,105 | | |
Thereafter | 3,234 | | |
Total | $ | 462,146 | |
Certificates of deposit with balances of $250 or greater totaled $53,893 and $45,796 at June 30, 2017 and 2016 , respectively. Generally, deposit amounts in excess of $250 are not federally insured.
Interest expense on deposits consists of the following:
| June 30, | ||||||||||
| 2017 |
| 2016 |
| 2015 | ||||||
NOW accounts | $ | 772 | |
| $ | 581 | |
| $ | 442 | |
Money market accounts | 1,405 | |
| 1,112 | |
| 1,027 | | |||
Savings accounts | 308 | |
| 289 | |
| 304 | | |||
Certificates of deposit | 2,103 | |
| 2,549 | |
| 3,119 | | |||
Total | $ | 4,588 | |
| $ | 4,531 | |
| $ | 4,892 | |
104
HOMETRUST BANCSHARES, INC. AND SUBSIDIARY
Notes to Consolidated Financial Statements
(Dollars in thousands, except per share data)
10. Borrowings
| June 30, | ||||||||||||
| 2017 |
| 2016 | ||||||||||
| Balance |
| Weighted Average Rate |
| Balance |
| Weighted Average Rate | ||||||
FHLB advances maturing: |
|
|
|
|
|
|
| ||||||
90 days or less | $ | 696,500 | |
| 1.13 | % |
| $ | 491,000 | |
| 0.42 | % |
Total | $ | 696,500 | |
| 1.13 | % |
| $ | 491,000 | |
| 0.42 | % |
All qualifying one-to-four family first mortgage loans, HELOCs, commercial real estate loans, FHLB Stock, and certain investment securities were pledged as collateral to secure the FHLB advances.
At June 30, 2017 and 2016, the Company had the ability to borrow $22,300 and $63,700 , respectively, in additional FHLB advances. These advances are secured by certain mortgage loans and mortgage-backed and other securities. At June 30, 2017 and 2016, the Company had an unused line of credit with the FRB for $105,500 and $186,500 , respectively. At June 30, 2017 and 2016, the Company had unused lines of credit with three unaffiliated banks for $60,000 .
11. Leases
The Company leases certain real property under long-term operating lease agreements. Rent expense under operating leases was $1,583 , $1,361 , and $1,282 for the years ended June 30, 2017 , 2016 , and 2015 , respectively.
The following schedule summarizes aggregate future minimum lease payments under these operating leases at June 30, 2017 .
Fiscal year ending: | June 30, | ||
2018 | $ | 1,697 | |
2019 | 1,119 | | |
2020 | 698 | | |
2021 | 378 | | |
2022 | 305 | | |
Thereafter | 1,745 | | |
Total of future minimum payments | $ | 5,942 | |
The Company currently leases land for one of its retail office locations under a capital lease. Leases that meet the criteria for capitalization are recorded as assets and the related obligations are reflected as capital lease obligations on the accompanying balance sheets, because the lease has been deemed to have a bargain purchase option. Included in premises and equipment at June 30, 2017 and June 30, 2016 is $2,052 as the capitalized cost of the leased land.
Aggregate future minimum lease payments due under this capital lease obligation are as follows:
Fiscal year ending: | June 30, | ||
2018 | $ | 123 | |
2019 | 133 | | |
2020 | 133 | | |
2021 | 134 | | |
2022 | 93 | | |
2023-2030 | 2,314 | | |
Total minimum lease payments | 2,930 | | |
Less: amount representing interest | (993 | ) | |
Present value of net minimum lease payments | $ | 1,937 | |
105
HOMETRUST BANCSHARES, INC. AND SUBSIDIARY
Notes to Consolidated Financial Statements
(Dollars in thousands, except per share data)
12. Income Taxes
Income tax expense consists of:
| June 30, | ||||||||||
| 2017 |
| 2016 |
| 2015 | ||||||
Current: |
|
|
|
|
| ||||||
Federal | $ | 191 | |
| $ | 266 | |
| $ | 219 | |
State | 54 | |
| 54 | |
| 53 | | |||
Total current expense | 245 | |
| 320 | |
| 272 | | |||
Deferred: |
|
|
|
|
| ||||||
Federal | 4,561 | |
| 4,038 | |
| 1,966 | | |||
State | 386 | |
| 543 | |
| 320 | | |||
Total deferred expense | 4,947 | |
| 4,581 | |
| 2,286 | | |||
Total income tax expense | $ | 5,192 | |
| $ | 4,901 | |
| $ | 2,558 | |
Income tax expense differed from the amounts computed by applying the U.S. federal income tax rate of 34% to pretax income from continuing operations before income taxes as a result of the following:
| Year Ended June 30, | |||||||||||||||||||
| 2017 |
| 2016 |
| 2015 | |||||||||||||||
| $ |
| Rate |
| $ |
| Rate |
| $ |
| Rate | |||||||||
Tax at federal income tax rate | $ | 5,793 | |
| 34 | % |
| $ | 5,561 | |
| 34 | % |
| $ | 3,598 | |
| 34 | % |
Increase (decrease) resulting from: |
|
|
|
|
|
|
|
|
|
|
| |||||||||
Tax exempt income | (1,391 | ) |
| (8 | )% |
| (1,486 | ) |
| (9 | )% |
| (1,575 | ) |
| (15 | )% | |||
Nondeductible merger expenses | 91 | |
| 1 | % |
| - | |
| - | % |
| 40 | |
| - | % | |||
Change in valuation allowance for deferred tax assets, allocated to income tax expense | (327 | ) |
| (2 | )% |
| (459 | ) |
| (3 | )% |
| (2 | ) |
| - | % | |||
State tax, net of federal benefit | 290 | |
| 2 | % |
| 394 | |
| 2 | % |
| 246 | |
| 2 | % | |||
Other | 736 | |
| 4 | % |
| 891 | |
| 6 | % |
| 251 | |
| 2 | % | |||
Total | $ | 5,192 | |
| 31 | % |
| $ | 4,901 | |
| 30 | % |
| $ | 2,558 | |
| 23 | % |
106
HOMETRUST BANCSHARES, INC. AND SUBSIDIARY
Notes to Consolidated Financial Statements
(Dollars in thousands, except per share data)
The sources and tax effects of temporary differences that give rise to significant portions of the deferred tax assets (liabilities) at June 30, 2017 and 2016 are presented below:
| June 30, | ||||||
| 2017 |
| 2016 | ||||
Deferred tax assets: |
|
|
| ||||
Alternative minimum tax credit | $ | 4,418 | |
| $ | 4,156 | |
Allowance for loan losses | 7,452 | |
| 7,451 | | ||
Deferred compensation and post-retirement benefits | 16,055 | |
| 15,579 | | ||
Accrued vacation and sick leave | 29 | |
| 29 | | ||
Impairments on real estate owned | 1,337 | |
| 1,334 | | ||
Other than temporary impairment on investments | 3,617 | |
| 3,635 | | ||
Net operating loss carryforward | 21,443 | |
| 21,647 | | ||
Discount from business combination | 3,645 | |
| 4,856 | | ||
Stock compensation plans | 2,884 | |
| 1,644 | | ||
Other | 2,687 | |
| 1,735 | | ||
Total gross deferred tax assets | 63,567 | |
| 62,066 | | ||
Less valuation allowance | (238 | ) |
| (553 | ) | ||
Deferred tax assets | 63,329 | |
| 61,513 | | ||
Deferred tax (liabilities): |
| |
|
| | ||
Depreciable basis of fixed assets | (670 | ) |
| (1,787 | ) | ||
Deferred loan fees | (493 | ) |
| (488 | ) | ||
FHLB stock, book basis in excess of tax | (143 | ) |
| (142 | ) | ||
Unrealized gain on securities available for sale | (152 | ) |
| (1,249 | ) | ||
Other | (4,484 | ) |
| (3,694 | ) | ||
Total gross deferred tax liabilities | (5,942 | ) |
| (7,360 | ) | ||
Net deferred tax assets | $ | 57,387 | |
| $ | 54,153 | |
The Company had federal net operating loss ("NOL") carry forwards of $62,368 and $62,041 as of June 30, 2017 and June 30, 2016 , respectively, with a recorded tax benefit of $21,443 and $21,647 included in deferred tax assets. The majority of these NOLs will expire for federal tax purposes from 2024 through 2036.
The Company adjusted its net deferred tax asset as a result of additional reductions in the North Carolina corporate income tax rates that were enacted July 23, 2013, and effective January 1, 2014 through 2017. The lower corporate income tax rate resulted in a reduction in the deferred tax assets as of June 30, 2017 and June 30, 2016 and an increase in the current period income tax expense for the years ended June 30, 2017 and June 30, 2016.
The valuation allowance for deferred tax assets as of June 30, 2017 and 2016 was $238 and $553 , respectively. The net decrease in the total valuation allowance for June 30, 2017 and 2016 was $315 and $459 , respectively, which relates to North Carolina state income taxes due to limitations on state net operating loss carry forwards. In assessing the realizability of deferred tax assets, management considers whether it is more likely than not that some portion or all of the deferred tax assets will not be realized. The ultimate realization of deferred tax assets is dependent upon the generation of future taxable income during the periods in which those temporary differences become deductible. Management performed a robust evaluation of the Company's deferred tax assets at June 30, 2017 and June 30, 2016 . Management considered all available positive and negative evidence including the possibility of future reversals of existing taxable temporary differences, projected future taxable income, tax planning strategies, and recent financial performance in making this assessment. Based upon this evaluation, management believes there is more positive evidence than negative evidence and it is more likely than not the Company will realize the benefits of these deductible differences, net of the existing valuation allowances at June 30, 2017 and June 30, 2016 . The amount of the deferred tax asset considered realizable, however, could be reduced in the near term if negative trends occur with credit quality and earnings during the carryforward period.
Retained earnings at June 30, 2017 and 2016 include $19,570 representing pre-1988 tax bad debt reserve base year amounts for which no deferred tax liability has been provided since these reserves are not expected to reverse and may never reverse. Circumstances that would require an accrual of a portion or all of this unrecorded tax liability are a failure to meet the definition of a bank, dividend payments in excess of current year or accumulated earnings and profits, or other distributions in dissolution or liquidation of the Bank. The Company is no longer subject to examination for federal and state purposes for tax years prior to 2013.
13. Employee Benefit Plans
Effective July 1, 2015, the Bank established the HomeTrust Bank KSOP Plan ("KSOP") by combining the existing HomeTrust Bank 401(k) Plan and the ESOP. The KSOP is comprised of two components, the 401(k) Plan and the ESOP. The KSOP benefits employees with at least 1000 hours of service during a 12 -month period and who have attained age 21 . Under the 401(k), the Company matches employee contributions at
107
HOMETRUST BANCSHARES, INC. AND SUBSIDIARY
Notes to Consolidated Financial Statements
(Dollars in thousands, except per share data)
50% of employee deferrals up to 6% of each employee's compensation. The Company may also make discretionary profit sharing contributions for the benefit of all eligible participants as long as total contributions do not exceed applicable limitations. Employees become fully vested in the Company's contributions after six years of service. Under the ESOP, the amount of the Bank's annual contribution is discretionary, however it must be sufficient to pay the annual loan payment to the Company.
The Company's expense for 401(k) contributions to this plan was $ 450 , $583 , and $1,298 for the years ended June 30, 2017 , 2016 , and 2015 , respectively. The Company's expense related to the ESOP for the fiscal year ended June 30, 2017 , 2016 , and 2015 was $ 1,186 , $ 983 , and $ 827 , respectively.
Shares held by the ESOP include the following:
| June 30, | ||||||
| 2017 |
| 2016 | ||||
Unallocated ESOP shares | 793,500 | |
| 846,400 | | ||
Allocated ESOP shares | 211,600 | |
| 158,700 | | ||
ESOP shares committed to be released | 52,900 | |
| 52,900 | | ||
Total ESOP shares | 1,058,000 | |
| 1,058,000 | | ||
Fair value of unallocated ESOP shares | $ | 19,361 | |
| $ | 15,658 | |
Post-retirement health care benefits are provided to certain key officers under the Company's Executive Medical Care Plan ("EMCP"). The EMCP is unfunded and is not qualified under the Internal Revenue Code ("IRC"). Plan expense for the years ended June 30, 2017 , 2016 , and 2015 was $135 , $224 , and $238 , respectively. Total accrued expenses related to this plan included in other liabilities were $5,156 and $5,227 , respectively, as of June 30, 2017 and 2016 .
14. Deferred Compensation Agreements
The Company's Director Emeritus Plans ("Plans") provide certain benefits to Emeritus Directors for providing current advisory services to the Company. The Plans are unfunded and are not qualified under the IRC. Plan benefits vary by participant and are payable to a designated beneficiary in the event of death. The Company records an expense based on the present value of expected future benefits. Plan expenses for the years ended June 30, 2017 , 2016 , and 2015 were $419 , $489 , and $468 , respectively. Total accrued expenses related to these plans included in other liabilities were $9,225 and $9,443 , respectively, as of June 30, 2017 and 2016 .
The Company has deferred compensation agreements with certain members of the Company's Board of Directors. The future payments related to these agreements are to be funded with life insurance contracts which are payable to the Company in the event of the director's death. For the years ended June 30, 2017 , 2016 , and 2015 deferred compensation expense was $34 , $41 , and $63 , respectively.
The net cash surrender value of the related life insurance policies and deferred compensation liability are detailed below:
| June 30, | ||||||
| 2017 |
| 2016 | ||||
Net cash surrender value of life insurance, related to deferred compensation | $ | 7,096 | |
| $ | 6,206 | |
Deferred compensation liability, included in other liabilities | $ | 1,229 | |
| $ | 1,414 | |
Long term deferred compensation and supplemental retirement plans are provided to certain key current and former officers. These plans are unfunded and are not qualified under the IRC. The benefits will vary by participant and are payable to a designated beneficiary in the event of death. Plan expenses for the years ended June 30, 2017 , 2016 , and 2015 were $1,253 , $826 , and $629 , respectively. Total accrued expenses related to these plans included in other liabilities were $20,785 and $20,391 , as of June 30, 2017 and 2016 , respectively.
In addition, the Company has a deferred compensation plan provided to certain officers and directors. The plan allows the participants to defer any of their annual compensation, including bonus payments, up to the maximum allowed for each participant. The plan is unfunded and is not qualified under the IRC. Plan expenses for the years ended June 30, 2017 , 2016 , and 2015 were $197 , $199 , and $223 , respectively. The total deferred compensation plan payable included in other liabilities was $5,832 and $5,851 , respectively as of June 30, 2017 and 2016 .
108
HOMETRUST BANCSHARES, INC. AND SUBSIDIARY
Notes to Consolidated Financial Statements
(Dollars in thousands, except per share data)
15. Net Income per Share
The following is a reconciliation of the numerator and denominator of basic and diluted net income per share of common stock:
| June 30, | ||||||||||
| 2017 |
| 2016 |
| 2015 | ||||||
Numerator: |
|
|
|
|
| ||||||
Net income | $ | 11,847 | |
| $ | 11,456 | |
| $ | 8,025 | |
Allocation of earnings to participating securities | (125 | ) |
| (161 | ) |
| (129 | ) | |||
Numerator for basic EPS - Net income available to common stockholders | $ | 11,722 | |
| $ | 11,295 | |
| $ | 7,896 | |
Effect of dilutive securities: |
|
|
|
|
| ||||||
Dilutive effect to participating securities | 4 | |
| 1 | |
| - | | |||
Numerator for diluted EPS | $ | 11,726 | |
| $ | 11,296 | |
| $ | 7,896 | |
Denominator: |
|
|
|
|
| ||||||
Weighted-average common shares outstanding - basic | 17,379,487 | |
| 17,417,046 | |
| 19,038,098 | | |||
Effect of dilutive shares | 576,956 | |
| 189,643 | |
| 79,804 | | |||
Weighted-average common shares outstanding - diluted | 17,956,443 | |
| 17,606,689 | |
| 19,117,902 | | |||
Net income per share - basic | $ | 0.66 | |
| $ | 0.65 | |
| $ | 0.42 | |
Net income per share - diluted | $ | 0.65 | |
| $ | 0.65 | |
| $ | 0.42 | |
There were 60,500 and 56,500 outstanding stock options that were anti-dilutive for the years ended June 30, 2017 and 2016 , respectively.
16. Equity Incentive Plan
The Company provides stock-based awards through the 2013 Omnibus Incentive Plan which provides for awards of restricted stock, restricted stock units, stock options, stock appreciation rights, and cash awards to directors, emeritus directors, officers, employees, and advisory directors. The cost of equity-based awards under the 2013 Omnibus Incentive Plan generally is based on the fair value of the awards on their grant date. The maximum number of shares that may be utilized for awards under the plan is 2,962,400 , including 2,116,000 for stock options and stock appreciation rights and 846,400 for awards of restricted stock and restricted stock units.
Shares of common stock issued under the 2013 Omnibus Incentive Plan may be authorized but unissued shares or, in the case of restricted stock awards, may be repurchased shares. As of June 30, 2013, the Company had repurchased all 846,400 shares on the open market for issuance under the 2013 Omnibus Incentive Plan, for $13,297 , at an average cost of $15.71 per share.
Share based compensation expense related to stock options and restricted stock recognized for the fiscal year ended June 30, 2017 , 2016 , and 2015 were $4,166 , $2,939 , and $2,821 , respectively, before the related tax benefit of $1,541 , $1,087 , and $1,044 , respectively.
109
HOMETRUST BANCSHARES, INC. AND SUBSIDIARY
Notes to Consolidated Financial Statements
(Dollars in thousands, except per share data)
The table below presents stock option activity and related information:
| Options |
| Weighted- average exercise price |
| Remaining contractual life (years) |
| Aggregate Intrinsic Value | ||||||
Options outstanding at June 30, 2014 | 1,513,500 | |
| 14.40 | |
| 8.6 | |
| $ | 2,077 | | |
Granted | 10,000 | |
| 16.08 | |
| - | |
| - | | ||
Exercised | 18,000 | |
| 14.37 | |
| - | |
| - | | ||
Forfeited | 7,500 | |
| 14.37 | |
| - | |
| - | | ||
Expired | - | |
| - | |
| - | |
| - | | ||
Options outstanding at June 30, 2015 | 1,498,000 | |
| $ | 14.41 | |
| 7.7 | |
| $ | 3,519 | |
Exercisable at June 30, 2015 | 548,550 | |
| $ | 14.39 | |
|
|
|
| |||
Granted | 46,500 | |
| 17.35 | |
| - | |
| - | | ||
Exercised | 2,200 | |
| 14.37 | |
| - | |
| - | | ||
Forfeited | 13,000 | |
| 14.37 | |
| - | |
| - | | ||
Expired | - | |
| - | |
| - | |
| - | | ||
Options outstanding at June 30, 2016 | 1,529,300 | |
| $ | 14.50 | |
| 6.8 | |
| $ | 6,117 | |
Exercisable at June 30, 2016 | 829,400 | |
| $ | 14.40 | |
|
|
|
| |||
Granted | 60,500 | |
| 24.95 | |
| - | |
| - | | ||
Granted, TriSummit acquisition | 86,185 | |
| 23.82 | |
| - | |
| - | | ||
Exercised | 185,142 | |
| 16.56 | |
| - | |
| - | | ||
Forfeited | 19,000 | |
| 14.53 | |
| - | |
| - | | ||
Expired | 1,800 | |
| 14.37 | |
| - | |
| - | | ||
Options outstanding at June 30, 2017 | 1,470,043 | |
| $ | 15.22 | |
| 5.8 | |
| $ | 13,533 | |
Exercisable at June 30, 2017 | 1,033,943 | |
| $ | 14.82 | |
| | |
|
| ||
The fair value of each option is estimated on the date of grant using the Black-Scholes-Merton option pricing model. The weighted average fair value of each option granted in fiscal 2017 and 2016 was $7.76 and $4.53 , respectively. Assumptions used for grants were as follows:
Assumptions in Estimating Option Values | |||||
| 2017 |
| 2016 | ||
Weighted-average volatility | 16.69 | % |
| 15.30 | % |
Expected dividend yield | - | % |
| - | % |
Risk-free interest rate | 2.36 | % |
| 1.63 | % |
Expected life (years) | 6.5 | |
| 6.5 | |
At June 30, 2017 , the Company had $1,526 of unrecognized compensation expense related to 1,470,043 stock options scheduled to vest over five - and seven -year vesting periods. The weighted average period over which compensation cost related to non-vested awards is expected to be recognized was 1.2 years at June 30, 2017 . At June 30, 2016 , the Company had $2,396 of unrecognized compensation expense related to 1,529,300 stock options schedule to vest over five - and seven -year vesting periods. The weighted average period over which compensation cost related to non-vested awards is expected to be recognized was 1.4 years at June 30, 2016 . All unexercised options expire ten years after the grant date.
110
HOMETRUST BANCSHARES, INC. AND SUBSIDIARY
Notes to Consolidated Financial Statements
(Dollars in thousands, except per share data)
The table below presents restricted stock award activity for the year ended June 30, 2017 :
| Restricted stock awards |
| Weighted- average grant date fair value |
| Aggregate Intrinsic Value | |||||
Non-vested at June 30, 2014 | 403,965 | |
| $ | 14.39 | |
| $ | 6,770 | |
Granted | - | |
| - | |
| - | | ||
Vested | 91,895 | |
| 14.39 | |
| - | | ||
Forfeited | 1,600 | |
| 14.37 | |
| - | | ||
Non-vested at June 30, 2015 | 310,470 | |
| $ | 14.40 | |
| $ | 5,203 | |
Granted | 34,500 | |
| 17.35 | |
| - | | ||
Vested | 93,670 | |
| 14.39 | |
| - | | ||
Forfeited | 2,550 | |
| 14.37 | |
| - | | ||
Non-vested at June 30, 2016 | 248,750 | |
| $ | 14.81 | |
| $ | 4,602 | |
Granted | 47,500 | |
| 24.70 | |
| - | | ||
Vested | 104,620 | |
| 14.58 | |
| - | | ||
Forfeited | 6,000 | |
| 15.07 | |
| - | | ||
Non-vested at June 30, 2017 | 185,630 | |
| $ | 17.46 | |
| $ | 3,419 | |
At June 30, 2017 , unrecognized compensation expense was $2,493 related to 185,630 shares of restricted stock scheduled to vest over five- and seven-year vesting periods . The weighted average period over which compensation cost related to non-vested awards is expected to be recognized was 1.6 years at June 30, 2017 . At June 30, 2016 , unrecognized compensation expense was $4,015 related to 248,750 shares of restricted stock scheduled to vest over five- and seven-year vesting periods . The weighted average period over which compensation cost related to non-vested awards is expected to be recognized was 1.5 years at June 30, 2016 .
17. Commitments and Contingencies
Loan Commitments
Legally binding commitments to extend credit are agreements to lend to a customer as long as there is no violation of any condition established in the contract. Commitments generally have fixed expiration dates or other termination clauses and may require payment of a fee. Since many commitments may expire without being drawn upon, the total commitment amounts do not necessarily represent future cash requirements. In the normal course of business, there are various outstanding commitments to extend credit that are not reflected in the consolidated financial statements. At June 30, 2017 and June 30, 2016 , respectively, loan commitments (excluding $158,380 and $125,157 of undisbursed portions of construction loans) totaled $43,730 and $39,609 of which $21,221 and $9,932 were variable rate commitments and $22,509 and $29,677 were fixed rate commitments. The fixed rate loans had interest rates ranging from 1.95% to 6.25% at June 30, 2017 and 2.02% to 7.99% at June 30, 2016 , and terms ranging from 3 to 30 years. Pre-approved but unused lines of credit (principally second mortgage home equity loans and overdraft protection loans) totaled $414,373 and $340,397 at June 30, 2017 and 2016 , respectively. These amounts represent the Company's exposure to credit risk, and in the opinion of management have no more than the normal lending risk that the Company commits to its borrowers. The Company has two types of commitments related to loans held for sale: rate lock commitments and forward loan sale commitments. Rate lock commitments are commitments to extend credit to a customer that has an interest rate lock and are considered derivative instruments. The rate lock commitments do not qualify for hedge accounting. In order to mitigate the risk from interest rate fluctuations, we enter into forward loan sale commitments on a "best efforts" basis, which do not meet the definition of a derivative instrument. The fair value of these commitments was not material at June 30, 2017 or June 30, 2016 .
The Company grants construction and permanent loans collateralized primarily by residential and commercial real estate to customers throughout its primary market area. In addition, the Company grants municipal leases to customers throughout North and South Carolina. The Company's loan portfolio can be affected by the general economic conditions within these market areas. Management believes that the Company has no significant concentration of credit in the loan portfolio.
Restrictions on Cash
The Bank is required by regulation to maintain a varying cash reserve balance with the Federal Reserve System. The daily average calculated cash reserve required as of June 30, 2017 and 2016 was $2,152 , and $2,346 , respectively, which was satisfied by vault cash and balances held at the Federal Reserve Bank.
Guarantees
Standby letters of credit obligate the Company to meet certain financial obligations of its customers, if, under the contractual terms of the agreement, the customers are unable to do so. The financial standby letters of credit issued by the Company are irrevocable and payment is only guaranteed upon the borrower's failure to perform its obligations to the beneficiary. Total commitments under standby letters of credit as of June
111
HOMETRUST BANCSHARES, INC. AND SUBSIDIARY
Notes to Consolidated Financial Statements
(Dollars in thousands, except per share data)
30, 2017 and 2016 were $5,164 and $2,326 , respectively. There was no liability recorded for these letters of credit at June 30, 2017 or June 30, 2016 .
Litigation
The Company is involved in several litigation matters in the ordinary course of business. These proceedings and the associated legal claims are often contested and the outcome of individual matters is not always predictable. These claims and counter claims typically arise during the course of collection efforts on problem loans or with respect to actions to enforce liens on properties in which the Company holds a security interest. There can be no assurance that loan workouts and other activities will not expose the Company to additional legal actions, including lender liability or environmental claims. Therefore, the Company may be exposed to substantial liabilities, which could adversely affect its results of operations and financial condition. Moreover, the expenses of legal proceedings will adversely affect its results of operations until they are resolved. The Company is not a party to any pending legal proceedings that management believes would have a material adverse effect on the Company's financial condition or results of operations.
18. Capital
At June 30, 2017 , stockholder's equity totaled $397,647 . HomeTrust Bancshares, Inc. is a bank holding company subject to regulation by the Board of Governors of the Federal Reserve System ("Federal Reserve"). As a bank holding company, we are subject to capital adequacy requirements of the Federal Reserve under the Bank Holding Company Act of 1956, as amended and the regulations of the Federal Reserve. Our subsidiary, the Bank, an FDIC-insured, North Carolina state-chartered bank and a member of the Federal Reserve System, is supervised and regulated by the Federal Reserve and the North Carolina Commissioner of Banks ("NCCOB") and is subject to minimum capital requirements applicable to state member banks established by the Federal Reserve that are calculated in a manner similar to those applicable to bank holding companies. Failure to meet minimum capital requirements can initiate certain mandatory and possibly additional discretionary actions by bank regulators that, if undertaken, could have a direct material effect on the Company's financial statements.
Under capital adequacy guidelines and the regulatory framework for prompt corrective action, the Bank must meet specific capital guidelines that involve quantitative measures of the Bank's assets, liabilities and certain off-balance-sheet items as calculated under regulatory accounting practices. The Bank's capital amounts and classification are also subject to qualitative judgments by the regulators about components, risk weightings and other factors.
At June 30, 2017 , HomeTrust Bancshares, Inc. and the Bank each exceeded all regulatory capital requirements as of that date. Consistent with our goals to operate a sound and profitable organization, our policy is for the Bank to maintain a "well-capitalized" status under the regulatory capital categories of the Federal Reserve. The Bank was categorized as "well-capitalized" at June 30, 2017 under applicable regulatory requirements.
112
HOMETRUST BANCSHARES, INC. AND SUBSIDIARY
Notes to Consolidated Financial Statements
(Dollars in thousands, except per share data)
HomeTrust Bancshares, Inc. and the Bank's actual and required minimum capital amounts and ratios are as follows:
|
|
| Regulatory Requirements | |||||||||||||||||
| Actual |
| Minimum for Capital Adequacy Purposes |
| Minimum to Be Well Capitalized | |||||||||||||||
| Amount |
| Ratio |
| Amount |
| Ratio |
| Amount |
| Ratio | |||||||||
HomeTrust Bancshares, Inc. |
|
|
|
|
|
|
|
|
|
|
| |||||||||
As of June 30, 2017 |
|
|
|
|
|
|
|
|
|
|
| |||||||||
Common Equity Tier I Capital (to Risk-weighted Assets) | $ | 342,664 | |
| 13.07 | % |
| $ | 118,024 | |
| 4.50 | % |
| $ | 170,478 | |
| 6.50 | % |
Tier I Capital (to Total Adjusted Assets) | $ | 342,664 | |
| 11.13 | % |
| $ | 123,149 | |
| 4.00 | % |
| $ | 153,936 | |
| 5.00 | % |
Tier I Capital (to Risk-weighted Assets) | $ | 342,664 | |
| 13.07 | % |
| $ | 157,365 | |
| 6.00 | % |
| $ | 209,820 | |
| 8.00 | % |
Total Risk-based Capital (to Risk-weighted Assets) | $ | 364,269 | |
| 13.89 | % |
| $ | 209,820 | |
| 8.00 | % |
| $ | 262,275 | |
| 10.00 | % |
|
|
|
|
|
|
|
|
|
|
|
| |||||||||
As of June 30, 2016 |
| |
|
| |
|
| |
|
| |
|
| |
|
| | |||
Common Equity Tier I Capital (to Risk-weighted Assets) | $ | 317,258 | |
| 14.39 | % |
| $ | 99,197 | |
| 4.50 | % |
| $ | 143,285 | |
| 6.50 | % |
Tier I Capital (to Total Adjusted Assets) | $ | 317,258 | |
| 11.78 | % |
| $ | 107,687 | |
| 4.00 | % |
| $ | 134,609 | |
| 5.00 | % |
Tier I Capital (to Risk-weighted Assets) | $ | 317,258 | |
| 14.39 | % |
| $ | 132,263 | |
| 6.00 | % |
| $ | 176,350 | |
| 8.00 | % |
Total Risk-based Capital (to Risk-weighted Assets) | $ | 339,005 | |
| 15.38 | % |
| $ | 176,350 | |
| 8.00 | % |
| $ | 220,438 | |
| 10.00 | % |
|
|
|
|
|
|
|
|
|
|
|
| |||||||||
HomeTrust Bank: |
| |
|
| |
|
| |
|
| |
|
| |
|
| | |||
As of June 30, 2017 |
| |
|
| |
|
| |
|
| |
|
| |
|
| | |||
Common Equity Tier I Capital (to Risk-weighted Assets) | $ | 305,216 | |
| 11.68 | % |
| $ | 117,560 | |
| 4.50 | % |
| $ | 169,809 | |
| 6.50 | % |
Tier I Capital (to Total Adjusted Assets) | $ | 305,216 | |
| 9.97 | % |
| $ | 122,453 | |
| 4.00 | % |
| $ | 153,066 | |
| 5.00 | % |
Tier I Capital (to Risk-weighted Assets) | $ | 305,216 | |
| 11.68 | % |
| $ | 156,747 | |
| 6.00 | % |
| $ | 208,996 | |
| 8.00 | % |
Total Risk-based Capital (to Risk-weighted Assets) | $ | 326,635 | |
| 12.50 | % |
| $ | 208,996 | |
| 8.00 | % |
| $ | 261,245 | |
| 10.00 | % |
|
|
|
|
|
|
|
|
|
|
|
| |||||||||
As of June 30, 2016 |
| |
|
| |
|
| |
|
| |
|
| |
|
| | |||
Common Equity Tier I Capital (to Risk-weighted Assets) | $ | 280,598 | |
| 12.80 | % |
| $ | 98,634 | |
| 4.50 | % |
| $ | 142,471 | |
| 6.50 | % |
Tier I Capital (to Total Adjusted Assets) | $ | 280,598 | |
| 10.50 | % |
| $ | 106,852 | |
| 4.00 | % |
| $ | 133,565 | |
| 5.00 | % |
Tier I Capital (to Risk-weighted Assets) | $ | 280,598 | |
| 12.80 | % |
| $ | 131,512 | |
| 6.00 | % |
| $ | 175,349 | |
| 8.00 | % |
Total Risk-based Capital (to Risk-weighted Assets) | $ | 302,271 | |
| 13.79 | % |
| $ | 175,349 | |
| 8.00 | % |
| $ | 219,187 | |
| 10.00 | % |
___________________________________
In addition to the minimum common equity Tier 1 ("CET1"), Tier 1 and total capital ratios, HomeTrust Bancshares, Inc. and the Bank now have to maintain a capital conservation buffer consisting of additional CET1 capital above the required minimum levels in order to avoid limitations on paying dividends, engaging in share repurchases, and paying discretionary bonuses based on percentages of eligible retained income that could be utilized for such actions. This new capital conservation buffer requirement was phased in starting in January 2016 at 0.625% of risk-weighted assets and will increase each year until fully implemented to an amount equal to 2.5% of risk-weighted assets in January 2019. As of June 30, 2017, the conservation buffer was 1.25%.
113
HOMETRUST BANCSHARES, INC. AND SUBSIDIARY
Notes to Consolidated Financial Statements
(Dollars in thousands, except per share data)
A reconciliation of HomeTrust Bancshares, Inc.'s stockholders' equity under US GAAP and regulatory capital amounts follows:
| June 30, | ||||||
| 2017 |
| 2016 | ||||
Total stockholders' equity under US GAAP | $ | 397,647 | |
| $ | 359,976 | |
Accumulated other comprehensive income, net of tax | (273 | ) |
| (2,343 | ) | ||
Investment in nonincludable subsidiary | (881 | ) |
| (926 | ) | ||
Disallowed deferred tax assets | (24,576 | ) |
| (24,079 | ) | ||
Disallowed goodwill and other disallowed intangible assets | (29,253 | ) |
| (15,370 | ) | ||
Tier I Capital | 342,664 | |
| 317,258 | | ||
Allowable portion of allowance for loan losses | 21,605 | |
| 21,747 | | ||
Total Risk-based Capital | $ | 364,269 | |
| $ | 339,005 | |
19. Parent Company Financial Information
The Company's principal asset is its investment in its subsidiary, the Bank. The following tables present condensed financial information of the Company:
Condensed balance sheet
| June 30, |
| June 30, | ||||
Assets: |
|
|
| ||||
Cash and equivalents | $ | 11,078 | |
| $ | 6,579 | |
Certificates of deposit in other banks | 7,211 | |
| 8,456 | | ||
Other securities | 63 | |
| 63 | | ||
Total loans | 5,345 | |
| 7,938 | | ||
Allowance for loan losses | (186 | ) |
| (74 | ) | ||
Net loans | 5,159 | |
| 7,864 | | ||
REO | 1,462 | |
| 1,124 | | ||
Investment in bank subsidiary | 363,603 | |
| 326,648 | | ||
ESOP loan receivable | 8,368 | |
| 8,830 | | ||
Other assets | 790 | |
| 760 | | ||
Total Assets | $ | 397,734 | |
| $ | 360,324 | |
Liabilities and Stockholders' Equity: |
|
|
| ||||
Other liabilities | 87 | |
| 348 | | ||
Stockholders' Equity | 397,647 | |
| 359,976 | | ||
Total Liabilities and Stockholders' Equity | $ | 397,734 | |
| $ | 360,324 | |
114
HOMETRUST BANCSHARES, INC. AND SUBSIDIARY
Notes to Consolidated Financial Statements
(Dollars in thousands, except per share data)
Condensed statement of income
| June 30, |
| June 30, |
| June 30, | ||||||
Income: |
|
|
|
|
| ||||||
Interest income | $ | 565 | |
| $ | 716 | |
| $ | 969 | |
Other income | 1 | |
| - | |
| 1 | | |||
Equity earnings in Bank subsidiary | 12,003 | |
| 11,284 | |
| 6,848 | | |||
Total income | 12,569 | |
| 12,000 | |
| 7,818 | | |||
Expense: |
|
|
|
|
| ||||||
Management fee expense | 354 | |
| 317 | |
| 290 | | |||
REO expense | 62 | |
| 71 | |
| 136 | | |||
Loss (gain) on sale and impairment of REO | 39 | |
| 115 | |
| (83 | ) | |||
Provision for (recovery of) loan losses | 90 | |
| (275 | ) |
| (1,025 | ) | |||
Other expense | 177 | |
| 166 | |
| 152 | | |||
Total expense | 722 | |
| 394 | |
| (530 | ) | |||
Income Before Income Taxes | 11,847 | |
| 11,606 | |
| 8,348 | | |||
Income Tax Expense | - | |
| 150 | |
| 323 | | |||
Net Income | $ | 11,847 | |
| $ | 11,456 | |
| $ | 8,025 | |
115
HOMETRUST BANCSHARES, INC. AND SUBSIDIARY
Notes to Consolidated Financial Statements
(Dollars in thousands, except per share data)
Condensed statement of cash flows
| June 30, |
| June 30, |
| June 30, | ||||||
Operating Activities: |
|
|
|
|
| ||||||
Net income | $ | 11,847 | |
| $ | 11,456 | |
| $ | 8,025 | |
Adjustments to reconcile net income to net cash provided by operating activities: |
|
|
|
|
| ||||||
Provision for (recovery of) loan losses | 90 | |
| (275 | ) |
| (1,025 | ) | |||
Loss (gain) on sale and impairment of REO | 39 | |
| 115 | |
| (83 | ) | |||
Decrease (increase) in accrued interest receivable and other assets | (30 | ) |
| 1,799 | |
| (1,649 | ) | |||
Equity in undistributed income of Bank | (12,003 | ) |
| (11,284 | ) |
| (6,848 | ) | |||
ESOP compensation expense | 1,186 | |
| 983 | |
| 827 | | |||
Restricted stock and stock option expense | 4,166 | |
| 2,939 | |
| 2,821 | | |||
Increase (decrease) in other liabilities | (260 | ) |
| (774 | ) |
| 60 | | |||
Net cash provided by operating activities | 5,035 | |
| 4,959 | |
| 2,128 | | |||
Investing Activities: |
|
|
|
|
| ||||||
Purchase of certificates of deposit in other banks | - | |
| (996 | ) |
| (995 | ) | |||
Maturities of certificates of deposit in other banks | 1,245 | |
| 2,487 | |
| 1,244 | | |||
Purchase of equity securities | - | |
| - | |
| (63 | ) | |||
Repayment of loans | 2,176 | |
| 3,024 | |
| 4,835 | | |||
Capital improvements to REO | - | |
| - | |
| (49 | ) | |||
Increase in investment in Bank subsidiary | (3,408 | ) |
| (982 | ) |
| (827 | ) | |||
Dividend from subsidiary | 10,291 | |
| 7,952 | |
| 25,000 | | |||
ESOP principal payments received | 462 | |
| 450 | |
| 442 | | |||
Proceeds from sale of REO | 61 | |
| 496 | |
| 302 | | |||
Acquisition of TriSummit Bancorp, Inc. | (13,862 | ) |
| - | |
| - | | |||
Net cash provided by (used in) investing activities | (3,035 | ) |
| 12,431 | |
| 29,889 | | |||
Financing Activities: |
|
|
|
|
| ||||||
Common stock repurchased | - | |
| (27,734 | ) |
| (18,470 | ) | |||
Retired stock | (569 | ) |
| (223 | ) |
| (188 | ) | |||
Exercised stock options | 3,068 | |
| 32 | |
| 259 | | |||
Net cash provided by (used in) financing activities | 2,499 | |
| (27,925 | ) |
| (18,399 | ) | |||
Net Increase (Decrease) in Cash and Cash Equivalents | 4,499 | |
| (10,535 | ) |
| 13,618 | | |||
Cash and Cash Equivalents at Beginning of Period | 6,579 | |
| 17,114 | |
| 3,496 | | |||
Cash and Cash Equivalents at End of Period | $ | 11,078 | |
| $ | 6,579 | |
| $ | 17,114 | |
20. Fair Value of Financial Instruments
The Company utilizes fair value measurements to record fair value adjustments to certain assets and to determine fair value disclosures. Securities available for sale are recorded at fair value on a recurring basis. Additionally, from time to time, the Company may be required to record at fair value other assets on a nonrecurring basis, such as impaired loans. These nonrecurring fair value adjustments typically involve application of lower of cost or market accounting or write-downs of individual assets.
Fair Value Hierarchy
The Company groups assets at fair value in three levels, based on the markets in which the assets are traded and the reliability of the assumptions used to determine fair value. These levels are:
Level 1:Valuation is based upon quoted prices for identical instruments traded in active markets.
Level 2:Valuation is based upon quoted prices for similar instruments in active markets, quoted prices for identical or similar instruments in markets that are not active, and model-based valuation techniques for which all significant assumptions are observable in the market.
Level 3:Valuation is generated from model-based techniques that use at least one significant assumption not observable in the market. These unobservable assumptions reflect estimates of assumptions that market participants would use in pricing the asset. Valuation techniques include use of option pricing models, discounted cash flow models and similar techniques.
116
HOMETRUST BANCSHARES, INC. AND SUBSIDIARY
Notes to Consolidated Financial Statements
(Dollars in thousands, except per share data)
Following is a description of valuation methodologies used for assets recorded at fair value. The Company does not have any liabilities recorded at fair value.
Investment Securities Available for Sale
Securities available for sale are valued on a recurring basis at quoted market prices where available. If quoted market prices are not available, fair values are based on quoted prices of comparable securities. Level 1 securities include those traded on an active exchange, such as the New York Stock Exchange or U.S. Treasury securities that are traded by dealers or brokers in active over-the-counter markets and money market funds. Level 2 securities include mortgage-backed securities and debentures issued by government sponsored enterprises, municipal bonds, and corporate debt securities. Level 3 securities did include one community bank corporate bond that is thinly traded. The community bank corporate bond was acquired as part of a bank acquisition and was carried at book value, which approximates fair value. The bond was called during the second quarter of fiscal 2017.
Loans
The Company does not record loans at fair value on a recurring basis. From time to time, however, a loan is considered impaired and an allowance for loan losses is established. Loans for which it is probable that payment of interest and principal will not be made in accordance with the contractual terms of the loan agreement are considered impaired. Once a loan is identified as individually impaired, the fair value is estimated using one of several methods, including collateral value, market value of similar debt, enterprise value, liquidation value and discounted cash flows. The Company reviews all impaired loans each quarter to determine if an allowance is necessary. Those impaired loans not requiring an allowance represent loans for which the fair value of the expected repayments or collateral exceed the recorded investments in such loans.
The fair value of impaired loans is estimated in one of two ways, which include collateral value and discounted cash flows. Loans are considered collateral dependent if repayment is expected solely from the collateral. For these collateral dependent impaired loans, the Company obtains updated appraisals at least annually. These appraisals are reviewed for appropriateness and then discounted for estimated closing costs to determine if an allowance is necessary. As part of the quarterly review of impaired loans, the Company reviews these appraisals to determine if any additional discounts to the fair value are necessary. If a current appraisal is not obtained, the Company determines whether a discount is needed to the value from the original appraisal based on the decline in value of similar properties with recent appraisals. For loans that are not collateral dependent, estimated fair value is based on the present value of expected future cash flows using the interest rate implicit in the original agreement. Impaired loans where a charge-off has occurred or an allowance is established during the period being reported require classification in the fair value hierarchy. The Company records such impaired loans as a nonrecurring Level 3 in the fair value hierarchy.
Loans Held for Sale
Loans held for sale are adjusted to lower of cost or fair value. Fair value is based upon investor pricing. The Company considers all loans held for sale carried at fair value as nonrecurring Level 3.
Real Estate Owned
REO is considered held for sale and is adjusted to fair value less estimated selling costs upon transfer of the loan to foreclosed assets. Fair value is based upon independent market prices, appraised value of the collateral or management's estimation of the value of the collateral. The Company considers all REO that has been charged off or received an allowance during the period as nonrecurring Level 3.
Financial Assets Recorded at Fair Value on a Recurring Basis
The following table presents financial assets measured at fair value on a recurring basis at the dates indicated:
| June 30, 2017 | ||||||||||||||
Description | Total |
| Level 1 |
| Level 2 |
| Level 3 | ||||||||
U.S Government Agencies | $ | 65,830 | |
| $ | - | |
| $ | 65,830 | |
| $ | - | |
Residential Mortgage-backed Securities of U.S. Government Agencies and Government sponsored Enterprises | 92,971 | |
| - | |
| 92,971 | |
| - | | ||||
Municipal Bonds | 34,510 | |
| - | |
| 34,510 | |
| - | | ||||
Corporate Bonds | 6,293 | |
| - | |
| 6,293 | |
| - | | ||||
Equity Securities | 63 | |
| - | |
| 63 | |
|
| |||||
Total | $ | 199,667 | |
| $ | - | |
| $ | 199,667 | |
| $ | - | |
117
HOMETRUST BANCSHARES, INC. AND SUBSIDIARY
Notes to Consolidated Financial Statements
(Dollars in thousands, except per share data)
| June 30, 2016 | ||||||||||||||
Description | Total |
| Level 1 |
| Level 2 |
| Level 3 | ||||||||
U.S Government Agencies | $ | 77,980 | |
| $ | - | |
| $ | 77,980 | |
| $ | - | |
Residential Mortgage-backed Securities of U.S. Government Agencies and Government sponsored Enterprises | 97,408 | |
| - | |
| 97,408 | |
| - | | ||||
Municipal Bonds | 17,234 | |
| - | |
| 17,234 | |
| - | | ||||
Corporate Bonds | 7,967 | |
| - | |
| 6,967 | |
| 1,000 | | ||||
Equity Securities | 63 | |
| - | |
| 63 | |
| | | ||||
Total | $ | 200,652 | |
| $ | - | |
| $ | 199,652 | |
| $ | 1,000 | |
Financial Assets Recorded at Fair Value on a Nonrecurring Basis
The following table presents financial assets measured at fair value on a non-recurring basis during the periods indicated:
| Year Ended June 30, 2017 | ||||||||||||||
Description | Total |
| Level 1 |
| Level 2 |
| Level 3 | ||||||||
Impaired loans | $ | 9,156 | |
| $ | - | |
| $ | - | |
| $ | 9,156 | |
REO | 4,044 | |
| - | |
| - | |
| 4,044 | | ||||
Total | $ | 13,200 | |
| $ | - | |
| $ | - | |
| $ | 13,200 | |
| Year Ended June 30, 2016 | ||||||||||||||
Description | Total |
| Level 1 |
| Level 2 |
| Level 3 | ||||||||
Impaired loans | $ | 4,239 | |
| $ | - | |
| $ | - | |
| $ | 4,239 | |
REO | 1,117 | |
| - | |
| - | |
| 1,117 | | ||||
Total | $ | 5,356 | |
| $ | - | |
| $ | - | |
| $ | 5,356 | |
Quantitative information about Level 3 fair value measurements during the period ended June 30, 2017 is shown in the table below:
| Fair Value at June 30, 2017 |
| Valuation Techniques |
| Unobservable Input |
| Range |
| Weighted Average | |||
Nonrecurring measurements: |
|
|
|
|
|
|
|
|
| |||
Impaired loans, net | $ | 9,156 | |
| Discounted appraisals and discounted cash flows |
| Collateral discounts |
| 6% - 10% |
| 3 | % |
REO | $ | 4,044 | |
| Discounted Appraisals |
| Collateral discounts |
| 10% - 20% |
| 14 | % |
118
HOMETRUST BANCSHARES, INC. AND SUBSIDIARY
Notes to Consolidated Financial Statements
(Dollars in thousands, except per share data)
The stated carrying value and estimated fair value amounts of financial instruments as of June 30, 2017 and June 30, 2016 , are summarized below:
| June 30, 2017 | ||||||||||||||||||
| Carrying Value |
| Fair Value |
| Level 1 |
| Level 2 |
| Level 3 | ||||||||||
Cash and interest-bearing deposits | $ | 86,985 | |
| $ | 86,985 | |
| $ | 86,985 | |
| $ | - | |
| $ | - | |
Commercial paper | 149,863 | |
| 149,863 | |
| 149,863 | |
| - | |
| - | | |||||
Certificates of deposit in other banks | 132,274 | |
| 132,274 | |
| - | |
| 132,274 | |
| - | | |||||
Securities available for sale | 199,667 | |
| 199,667 | |
| - | |
| 199,667 | |
| - | | |||||
Loans, net | 2,330,319 | |
| 2,230,683 | |
| - | |
| - | |
| 2,230,683 | | |||||
Loans held for sale | 5,607 | |
| 5,719 | |
| - | |
| - | |
| 5,719 | | |||||
FHLB stock | 32,071 | |
| 32,071 | |
| 32,071 | |
| - | |
| - | | |||||
FRB stock | 7,284 | |
| 7,284 | |
| 7,284 | |
| - | |
| - | | |||||
Accrued interest receivable | 8,758 | |
| 8,758 | |
| 331 | |
| 1,078 | |
| 7,349 | | |||||
Noninterest-bearing and NOW deposits | 779,549 | |
| 779,549 | |
| - | |
| 779,549 | |
| - | | |||||
Money market accounts | 569,607 | |
| 569,607 | |
| - | |
| 569,607 | |
| - | | |||||
Savings accounts | 237,149 | |
| 237,149 | |
| - | |
| 237,149 | |
| - | | |||||
Certificates of deposit | 462,146 | |
| 458,818 | |
| - | |
| 458,818 | |
| - | | |||||
Borrowings | 696,500 | |
| 696,500 | |
| - | |
| 696,500 | |
| - | | |||||
Accrued interest payable | 512 | |
| 512 | |
| - | |
| 512 | |
| - | | |||||
| June 30, 2016 | ||||||||||||||||||
| Carrying Value |
| Fair Value |
| Level 1 |
| Level 2 |
| Level 3 | ||||||||||
Cash and interest-bearing deposits | $ | 52,596 | |
| $ | 52,596 | |
| $ | 52,596 | |
| $ | - | |
| $ | - | |
Commercial paper | 229,859 | |
| 229,859 | |
| 229,859 | |
| - | |
| - | | |||||
Certificates of deposit in other banks | 161,512 | |
| 161,512 | |
| - | |
| 161,512 | |
| - | | |||||
Securities available for sale | 200,652 | |
| 200,652 | |
| - | |
| 199,652 | |
| 1,000 | | |||||
Loans, net | 1,811,539 | |
| 1,761,926 | |
| - | |
| - | |
| 1,761,926 | | |||||
Loans held for sale | 5,783 | |
| 5,876 | |
| - | |
| - | |
| 5,876 | | |||||
FHLB stock | 23,304 | |
| 23,304 | |
| 23,304 | |
| - | |
| - | | |||||
FRB stock | 6,182 | |
| 6,182 | |
| 6,182 | |
| - | |
| - | | |||||
Accrued interest receivable | 7,405 | |
| 7,405 | |
| 271 | |
| 835 | |
| 6,299 | | |||||
Noninterest-bearing and NOW deposits | 628,910 | |
| 628,910 | |
| - | |
| 628,910 | |
| - | | |||||
Money market accounts | 520,320 | |
| 520,320 | |
| - | |
| 520,320 | |
| - | | |||||
Savings accounts | 210,817 | |
| 210,817 | |
| - | |
| 210,817 | |
| - | | |||||
Certificates of deposit | 442,649 | |
| 442,203 | |
| - | |
| 442,203 | |
| - | | |||||
Borrowings | 491,000 | |
| 491,000 | |
| - | |
| 491,000 | |
| - | | |||||
Accrued interest payable | 246 | |
| 246 | |
| - | |
| 246 | |
| - | | |||||
The Company had off-balance sheet financial commitments, which include approximately $616,483 and $505,163 of commitments to originate loans, undisbursed portions of interim construction loans, and unused lines of credit at June 30, 2017 and June 30, 2016 (see Note 17). Since these commitments are based on current rates, the carrying amount approximates the fair value.
Estimated fair values were determined using the following methods and assumptions:
Cash and interest-bearing deposits – The stated amounts approximate fair values as maturities are less than 90 days.
Commercial paper – The stated amounts approximate fair value due to the short-term nature of these investments. Commercial paper values are based on broker quotes that utilize observable market inputs at the time of purchase.
Certificates of deposit in other banks – The stated amounts approximate fair values.
Securities available for sale – Fair values are based on quoted market prices where available. If quoted market prices are not available, fair values are based on quoted market prices of comparable instruments.
119
HOMETRUST BANCSHARES, INC. AND SUBSIDIARY
Notes to Consolidated Financial Statements
(Dollars in thousands, except per share data)
Loans, net – Fair values for loans are estimated by segregating the portfolio by type of loan and discounting scheduled cash flows using current market interest rates for loans with similar terms and credit quality. A prepayment assumption is used as an estimate of the portion of loans that will be repaid prior to their scheduled maturity. Both the carrying value and estimated fair value amounts are shown net of the allowance for loan losses and purchase discounts.
Loans held for sale - The fair value of loans held for sale is determined by outstanding commitments from investors on a "best efforts" basis or current investor yield requirements, calculated on the aggregate loan basis.
FHLB and FRB stock – No ready market exists for these stocks and they have no quoted market value. However, redemption of these stocks has historically been at par value. Accordingly, cost is deemed to be a reasonable estimate of fair value.
Deposits – Fair values for demand deposits, money market accounts, and savings accounts are the amounts payable on demand as of June 30, 2017 and June 30, 2016 . The fair value of certificates of deposit is estimated by discounting the contractual cash flows using current market interest rates for accounts with similar maturities.
Borrowings – The fair value of advances from the FHLB is estimated based on current rates for borrowings with similar terms.
Accrued interest receivable and payable – The stated amounts of accrued interest receivable and payable approximate the fair value.
Limitations – Fair value estimates are made at a specific point in time, based on relevant market information and information about the financial instrument. These estimates do not reflect any premium or discount that could result from offering for sale at one time the Company's entire holdings of a particular financial instrument. Because no market exists for a significant portion of the Company's financial instruments, fair value estimates are based on judgments regarding future expected loss experience, current economic conditions, risk characteristics of various financial instruments, and other factors. These estimates are subjective in nature and involve uncertainties and matters of significant judgment and therefore cannot be determined with precision. Changes in assumptions could significantly affect the estimates.
Fair value estimates are based on existing on-and-off balance sheet financial instruments without attempting to estimate the value of anticipated future business and the value of assets and liabilities that are not considered financial instruments. For example, a significant asset not considered a financial asset is premises and equipment. In addition, tax ramifications related to the realization of the unrealized gains and losses can have a significant effect on fair value estimates and have not been considered in any of the estimates.
21. Unaudited Interim Financial Information
The unaudited statements of income for each of the quarters during the fiscal years ended June 30, 2017 and 2016 are summarized below:
| Three months ended | ||||||||||||||
| June 30, |
| March 31, 2017 |
| December 31, 2016 |
| September 30, 2016 | ||||||||
Interest and dividend income | $ | 27,291 | |
| $ | 27,291 | |
| $ | 22,063 | |
| $ | 22,791 | |
Interest expense | 2,724 | |
| 2,219 | |
| 1,648 | |
| 1,654 | | ||||
Net interest income | 24,567 | |
| 25,072 | |
| 20,415 | |
| 21,137 | | ||||
Provision for loan losses | - | |
| - | |
| - | |
| - | | ||||
Net interest income after provision for loan losses | 24,567 | |
| 25,072 | |
| 20,415 | |
| 21,137 | | ||||
Noninterest income | 4,059 | |
| 3,538 | |
| 3,767 | |
| 4,076 | | ||||
Noninterest expense | 21,660 | |
| 28,661 | |
| 20,306 | |
| 18,965 | | ||||
Net income (loss) before provision for income taxes | 6,966 | |
| (51 | ) |
| 3,876 | |
| 6,248 | | ||||
Income tax expense (benefit) | 2,200 | |
| (325 | ) |
| 893 | |
| 2,424 | | ||||
Net income | $ | 4,766 | |
| $ | 274 | |
| $ | 2,983 | |
| $ | 3,824 | |
Net income per common share: |
| |
|
| |
|
| |
|
| | ||||
Basic | $ | 0.26 | |
| $ | 0.01 | |
| $ | 0.17 | |
| $ | 0.22 | |
Diluted | $ | 0.25 | |
| $ | 0.01 | |
| $ | 0.17 | |
| $ | 0.22 | |
120
HOMETRUST BANCSHARES, INC. AND SUBSIDIARY
Notes to Consolidated Financial Statements
(Dollars in thousands, except per share data)
| Three months ended | ||||||||||||||
| June 30, |
| March 31, 2016 |
| December 31, 2015 |
| September 30, 2015 | ||||||||
Interest and dividend income | $ | 22,375 | |
| $ | 21,797 | |
| $ | 21,566 | |
| $ | 22,009 | |
Interest expense | 1,609 | |
| 1,577 | |
| 1,416 | |
| 1,438 | | ||||
Net interest income | 20,766 | |
| 20,220 | |
| 20,150 | |
| 20,571 | | ||||
Provision for loan losses | - | |
| - | |
| - | |
| - | | ||||
Net interest income after provision for loan losses | 20,766 | |
| 20,220 | |
| 20,150 | |
| 20,571 | | ||||
Noninterest income | 3,745 | |
| 3,384 | |
| 3,005 | |
| 3,369 | | ||||
Noninterest expense | 19,803 | |
| 19,373 | |
| 19,842 | |
| 19,835 | | ||||
Net income before provision for income taxes | 4,708 | |
| 4,231 | |
| 3,313 | |
| 4,105 | | ||||
Income tax expense | 1,406 | |
| 1,090 | |
| 864 | |
| 1,541 | | ||||
Net income | $ | 3,302 | |
| $ | 3,141 | |
| $ | 2,449 | |
| $ | 2,564 | |
Net income per common share: |
| |
|
| |
|
| |
|
| | ||||
Basic | $ | 0.19 | |
| $ | 0.18 | |
| $ | 0.14 | |
| $ | 0.14 | |
Diluted | $ | 0.19 | |
| $ | 0.18 | |
| $ | 0.14 | |
| $ | 0.14 | |
Item 9. Changes In and Disagreements With Accountants on Accounting and Financial Disclosure
None.
Item 9A. Controls and Procedures
Evaluation of Disclosure Controls and Procedures An evaluation of the Company's disclosure controls and procedures (as defined in Section 13a-15(e) of the Securities Exchange Act of 1934 (the "Act")) was carried out under the supervision and with the participation of the Company's Chief Executive Officer, Chief Financial Officer and several other members of the Company's senior management as of the end of the period covered by this report. The Company's Chief Executive Officer and Chief Financial Officer concluded that the Company's disclosure controls and procedures as of June 30, 2017 were effective in ensuring that the information required to be disclosed by the Company in the reports it files or submits under the Act is (i) accumulated and communicated to the Company's management (including the Chief Executive Officer and Chief Financial Officer) in a timely manner, and (ii) recorded, processed, summarized and reported within the time periods specified in the SEC's rules and forms.
Report of Management on Internal Control over Financial Reporting The management of the Company is responsible for establishing and maintaining adequate internal control over financial reporting. The internal control process has been designed under our supervision to provide reasonable assurance regarding the reliability of financial reporting and the preparation of the Company's financial statements for external reporting purposes in accordance with accounting principles generally accepted in the United States of America.
Management conducted an assessment of the effectiveness of the Company's internal control over financial reporting as of June 30, 2017 , utilizing the framework established in Internal Control – Integrated Framework 2013 issued by the Committee of Sponsoring Organizations of the Treadway Commission ("COSO"). Based on this assessment, management has determined that the Company's internal control over financial reporting as of June 30, 2017 was effective.
Our internal control over financial reporting includes policies and procedures that pertain to the maintenance of records that accurately and fairly reflect, in reasonable detail, transactions and dispositions of assets; and provide reasonable assurances that: (1) transactions are recorded as necessary to permit preparation of financial statements in accordance with accounting principles generally accepted in the United States; (2) receipts and expenditures are being made only in accordance with authorizations of management and the directors of the Company; and (3) unauthorized acquisition, use, or disposition of the Company's assets that could have a material effect on the Company's financial statements are prevented or timely detected.
All internal control systems, no matter how well designed, have inherent limitations. Therefore, even those systems determined to be effective can provide only reasonable assurance with respect to financial statement preparation and presentation. Also, projections of any evaluation of effectiveness to future periods are subject to the risk that controls may become inadequate because of changes in conditions, or that the degree of compliance with the policies or procedures may deteriorate.
This annual report does not include an attestation report of the Company's independent registered public accounting firm regarding internal control over financial reporting. As an emerging growth company, management's report was not subject to attestation by the Company's independent registered public accounting firm in accordance with the JOBS Act of 2012.
Changes in Internal Controls There have been no changes in the Company's internal control over financial reporting during the quarter ended June 30, 2017 that have materially affected, or are reasonably likely to materially affect, the Company's internal control over financial reporting.
121
The Company intends to continually review and evaluate the design and effectiveness of its disclosure controls and procedures and to improve its controls and procedures over time and to correct any deficiencies that it may discover in the future. The goal is to ensure that senior management has timely access to all material financial and non-financial information concerning the Company's business. While the Company believes the present design of its disclosure controls and procedures is effective to achieve its goal, future events affecting its business may cause the Company to modify its disclosure controls and procedures. The Company does not expect that its disclosure controls and procedures and internal control over financial reporting will prevent every error or instance of fraud. A control procedure, no matter how well conceived and operated, can provide only reasonable, not absolute, assurance that the objectives of the control procedure are met. Because of the inherent limitations in all control procedures, no evaluation of controls can provide absolute assurance that all control issues and instances of fraud, if any, within the Company have been detected. These inherent limitations include the realities that judgments in decision-making can be faulty, and that breakdowns in controls or procedures can occur because of simple error or mistake. Additionally, controls can be circumvented by the individual acts of some persons, by collusion of two or more people, or by management override of the control. The design of any control procedure is based in part upon certain assumptions about the likelihood of future events, and there can be no assurance that any design will succeed in achieving its stated goals under all potential future conditions; over time, controls become inadequate because of changes in conditions, or the degree of compliance with the policies or procedures may deteriorate. Because of the inherent limitations in a cost-effective control procedure, misstatements due to error or fraud may occur and not be detected.
Item 9B. Other Information
None.
PART III
Item 10. Directors, Executive Officers and Corporate Governance
Directors and Executive Officers The information concerning our directors required by this item is incorporated herein by reference from our definitive proxy statement for our Annual Meeting of Shareholders being held on November 27, 2017 , a copy of which will be filed with the Securities and Exchange Commission not later than 120 days after the end of our fiscal year. Information required by this item regarding the audit committee of the Company's Board of Directors, including information regarding the audit committee financial expert serving on the audit committee, is incorporated herein by reference from our definitive proxy statement for our Annual Meeting of Shareholders being held on November 27, 2017 , a copy of which will be filed with the Securities and Exchange Commission not later than 120 days after the end of our fiscal year. Information about our executive officers is contained under the caption "Executive Officers" in Part I of this Form 10-K, and is incorporated herein by this reference.
Section 16(a) Beneficial Ownership Reporting Compliance The information concerning compliance with the reporting requirements of Section 16(a) of the Securities Exchange Act of 1934 by our directors, officers and ten percent shareholders required by this item is incorporated herein by reference from our definitive proxy statement for our Annual Meeting of Shareholders being held on November 27, 2017 , a copy of which will be filed with the Securities and Exchange Commission not later than 120 days after the end of our fiscal year.
Code of Ethics We have adopted a code of ethics that applies to our principal executive officer, principal financial officer, principal accounting officer, and persons performing similar functions, and to all of our other employees and our directors. A copy of our code of ethics is available on our Internet website address, http://www.hometrustbancshares.com.
Item 11. Executive Compensation
The information concerning compensation required by this item is incorporated herein by reference from our definitive proxy statement for our Annual Meeting of Shareholders being held on November 27, 2017 , a copy of which will be filed with the Securities and Exchange Commission not later than 120 days after the end of our fiscal year.
Item 12. Security Ownership of Certain Beneficial Owners and Management and Related Shareholder Matters
The information concerning security ownership of certain beneficial owners and management and our equity incentive plan required by this item is incorporated herein by reference from our definitive proxy statement for our Annual Meeting of Shareholders being held on November 27, 2017 , a copy of which will be filed with the Securities and Exchange Commission not later than 120 days after the end of our fiscal year.
Item 13. Certain Relationships and Related Transactions, and Director Independence
The information concerning certain relationships and related transactions and director independence required by this item is incorporated herein by reference from our definitive proxy statement for our Annual Meeting of Shareholders being held on November 27, 2017 , a copy of which will be filed with the Securities and Exchange Commission not later than 120 days after the end of our fiscal year.
Item 14. Principal Accountant Fees and Services
The information concerning principal accountant fees and services is incorporated herein by reference from our definitive proxy statement for our Annual Meeting of Shareholders being held on November 27, 2017 , a copy of which will be filed with the Securities and Exchange Commission not later than 120 days after the end of our fiscal year.
122
PART IV
Item 15. Exhibits and Financial Statement Schedules
(a)(1) Financial Statements: See Part II--Item 8. Financial Statements and Supplementary Data.
(a)(2) Financial Statement Schedules: All financial statement schedules have been omitted as the information is not required under the related instructions or is not applicable.
(a)(3) Exhibits: See Exhibit Index.
(b) Exhibits: See Exhibit Index.
123
SIGNATURES
Pursuant to the requirements of Section 13 or 15(d) of the Securities Exchange Act of 1934, the Registrant has duly caused this report to be signed on its behalf by the undersigned, thereunto duly authorized.
| HOMETRUST BANCSHARES, INC. | |
|
|
|
Date: September 12, 2017 | By: | /s/ Dana L. Stonestreet |
|
| Dana L. Stonestreet |
|
| Chairman of the Board, |
|
| President, and Chief Executive Officer |
124
Pursuant to the requirements of the Securities Exchange Act of 1934, this report has been signed below by the following persons on behalf of the Registrant and in the capacities and on the dates indicated.
Signature |
| Title |
| Date |
|
|
|
|
|
/s/ Dana L. Stonestreet |
| Chairman of the Board, President and Chief Executive Officer |
| September 12, 2017 |
Dana L. Stonestreet |
| (Principal Executive Officer) |
|
|
|
|
|
|
|
/s/ Tony J. VunCannon |
| Executive Vice President, Chief Financial Officer and Treasurer |
| September 12, 2017 |
Tony J. VunCannon |
| (Principal Financial and Accounting Officer) |
|
|
|
|
|
|
|
/s/ Sidney A. Biesecker |
| Director |
| September 12, 2017 |
Sidney A. Biesecker |
|
|
|
|
|
|
|
|
|
/s/ Robert G. Dinsmore, Jr. |
| Director |
| September 12, 2017 |
Robert G. Dinsmore, Jr. |
|
|
|
|
|
|
|
|
|
/s/ J. Steven Goforth |
| Director |
| September 12, 2017 |
J. Steven Goforth |
|
|
|
|
|
|
|
|
|
/s/ Robert E. James |
| Director |
| September 12, 2017 |
Robert E. James |
|
|
|
|
|
|
|
|
|
/s/ Laura C. Kendall |
| Director |
| September 12, 2017 |
Laura C. Kendall |
|
|
|
|
|
|
|
|
|
/s/ Craig C. Koontz |
| Director |
| September 12, 2017 |
Craig C. Koontz |
|
|
|
|
|
|
|
|
|
/s/ Larry S. McDevitt |
| Director |
| September 12, 2017 |
Larry S. McDevitt |
|
|
|
|
|
|
|
|
|
/s/ F.K. McFarland, III |
| Director |
| September 12, 2017 |
F.K. McFarland, III |
|
|
|
|
|
|
|
|
|
/s/ Peggy C. Melville |
| Director |
| September 12, 2017 |
Peggy C. Melville |
|
|
|
|
|
|
|
|
|
/s/ Richard T. Williams |
| Director |
| September 12, 2017 |
Richard T. Williams |
|
|
|
|
125
EXHIBIT INDEX
Regulation S-K Exhibit Number | Document | Reference to Prior Filing or Exhibit Number Attached Hereto |
|
|
|
2.1 | Agreement and Plan of Merger, dated as of September 20, 2016, by and between HomeTrust Bancshares, Inc. and TriSummit Bancorp, Inc. | (a) |
2.2 | Purchase and Assumption Agreement, dated as of June 9, 2014, between Bank of America, National Association and HomeTrust Bank | (b) |
2.3 | Agreement and Plan of Merger, dated as of January 22, 2014, by and between HomeTrust Bancshares, Inc. and Jefferson Bancshares, Inc. | (c) |
3.1 | Charter of HomeTrust Bancshares, Inc. | (d) |
3.2 | Articles Supplementary to the Charter of HomeTrust Bancshares, Inc. for HomeTrust Bancshares, Inc.'s Junior Participating Preferred Stock, Series A | (e) |
3.3 | Bylaws of HomeTrust Bancshares, Inc. | (f) |
4.1 | Tax Benefits Preservation Plan, dated as of September 25, 2012, between HomeTrust Bancshares, Inc. and Computershare Trust Company, N.A., as successor rights agent to Registrar and Transfer Company | (e) |
4.2 | Amendment No. 1, dated as of August 31, 2015, to Tax Benefits Preservation Plan, dated as of September 25, 2012, between HomeTrust Bancshares, Inc. and Computershare Trust Company, N.A., as successor rights agent to Registrar and Transfer Company | (o) |
10.1 | Reserved |
|
10.2 | Amended and Restated Employment Agreement entered into between HomeTrust Bancshares, Inc. and Dana L. Stonestreet | (g) |
10.3 | Employment Agreement entered into between HomeTrust Bancshares, Inc. and each of Tony J. VunCannon and Howard L. Sellinger | (d) |
10.4 | Employment Agreement entered into between HomeTrust Bancshares, Inc. and C. Hunter Westbrook | (h) |
10.5 | Employment Agreement between HomeTrust Bank and Sidney A. Biesecker | (d) |
10.6 | Employment Agreement between HomeTrust Bank and Stan Allen | (d) |
10.7 | HomeTrust Bank Executive Supplemental Retirement Income Master Agreement ("SERP") | (d) |
10.7A | SERP Joinder Agreement for F. Edward Broadwell, Jr. | (d) |
10.7B | SERP Joinder Agreement for Dana L. Stonestreet | (d) |
10.7C | SERP Joinder Agreement for Tony J. VunCannon | (d) |
10.7D | SERP Joinder Agreement for Howard L. Sellinger | (d) |
10.7E | SERP Joinder Agreement for Stan Allen | (d) |
10.7F | SERP Joinder Agreement for Sidney A. Biesecker | (d) |
10.7G | SERP Joinder Agreement for Peggy C. Melville | (d) |
10.7H | SERP Joinder Agreement for William T. Flynt | (d) |
10.7I | Amended and Restated Supplemental Income Agreement between HomeTrust Bank, as successor to Industrial Federal Savings Bank, and Sidney Biesecker | (i) |
10.8 | HomeTrust Bank Director Emeritus Plan ("Director Emeritus Plan") | (d) |
10.8A | Director Emeritus Plan Joinder Agreement for William T. Flynt | (d) |
10.8B | Director Emeritus Plan Joinder Agreement for J. Steven Goforth | (d) |
10.8C | Director Emeritus Plan Joinder Agreement for Craig C. Koontz | (d) |
10.8D | Director Emeritus Plan Joinder Agreement for Larry S. McDevitt | (d) |
10.8E | Director Emeritus Plan Joinder Agreement for F.K. McFarland, III | (d) |
10.8F | Director Emeritus Plan Joinder Agreement for Peggy C. Melville | (d) |
10.8G | Director Emeritus Plan Joinder Agreement for Robert E. Shepherd, Sr. | (d) |
10.9 | HomeTrust Bank Defined Contribution Executive Medical Care Plan | (d) |
10.10 | HomeTrust Bank 2005 Deferred Compensation Plan | (d) |
10.11 | HomeTrust Bank Pre-2005 Deferred Compensation Plan | (d) |
126
10.12 | HomeTrust Bancshares, Inc. Strategic Operating Committee Incentive Plan | (r) |
10.13 | HomeTrust Bancshares, Inc. 2013 Omnibus Incentive Plan ("Omnibus Incentive Plan") | (j) |
10.14 | Form of Incentive Stock Option Award Agreement under Omnibus Incentive Plan | (k) |
10.15 | Form of Non-Qualified Stock Option Award Agreement under Omnibus Incentive Plan | (k) |
10.16 | Form of Stock Appreciation Right Award Agreement under Omnibus Incentive Plan | (k) |
10.17 | Form of Restricted Stock Award Agreement under Omnibus Incentive Plan | (k) |
10.18 | Form of Restricted Stock Unit Award Agreement under Omnibus Incentive Plan | (k) |
10.19 | Fully Restated Employment Agreement between HomeTrust Bank and Anderson L. Smith | (l) |
10.20 | Amended and Restated Jefferson Federal Bank Supplemental Executive Retirement Plan | (m) |
10.21 | Money Purchase Deferred Compensation Agreement, dated as of September 1, 1987, between HomeTrust Bank and F. Edward Broadwell, Jr. | (n) |
10.22 | Retirement Payment Agreement, dated as of September 1, 1987, between HomeTrust Bank and F. Edward Broadwell, Jr., as amended | (n) |
10.23 | Retirement Payment Agreement, dated as of September 1, 1987, between HomeTrust Bank and Larry S. McDevitt, as amended | (n) |
10.24 | Retirement Payment Agreement, dated as of September 1, 1987, between HomeTrust Bank and Peggy C. Melville, as amended | (n) |
10.25 | Retirement Payment Agreement, dated as of August 1, 1988, between HomeTrust Bank and Robert E. Shepherd, Sr., as amended | (n) |
10.26 | Retirement Payment Agreement, dated as of May 1, 1991, between HomeTrust Bank and William T. Flynt, as amended | (n) |
10.27 | Offer Letter between HomeTrust Bank and Keith J. Houghton | (p) |
10.28 | Form of Relocation Repayment Agreement between HomeTrust Bank and Keith J. Houghton | (p) |
10.29 | Form of Change in Control Severance Agreement between HomeTrust Bancshares, Inc. and each of Keith J. Houghton, R. Parrish Little, and Teresa White | (q) |
21.0 | Subsidiaries of the Registrant | 21.0 |
23.0 | Consent of Dixon Hughes Goodman LLP | 23.0 |
31.1 | Certification of Chief Executive Officer pursuant to Securities Exchange Act Rules 13a-14(a) and 15d-14(a) as adopted pursuant to Section 302 of the Sarbanes-Oxley Act of 2002 | 31.1 |
31.2 | Certification of Chief Financial Officer pursuant to Securities Exchange Act Rules 13a-14(a) and 15d-14(a) as adopted pursuant to Section 302 of the Sarbanes-Oxley Act of 2002 | 31.2 |
32.0 | Certificate of Chief Executive Officer and Chief Financial Officer pursuant to Section 906 of the Sarbanes-Oxley Act of 2002 | 32.0 |
101 | The following materials from HomeTrust Bancshares' Annual Report on Form 10-K for the year ended June 30, 2017, formatted in Extensible Business Reporting Language (XBRL): (a) Consolidated Balance Sheets; (b) Consolidated Statements of Income; (c) Consolidated Statements of Comprehensive Income; (d) Consolidated Statements of Changes in Stockholders' Equity; (e) Consolidated Statements of Cash Flows; and (f) Notes to Consolidated Financial Statements. | 101 |
(a) | Attached as Appendix A to the proxy statement/prospectus filed by HomeTrust Bancshares on November 2, 2016 pursuant to Rule 424(b) of the Securities Act of 1933. |
(b) | Filed as an exhibit to HomeTrust Bancshares's Current Report on Form 8-K filed on June 10, 2014 (File No. 001-35593). |
(c) | Attached as Appendix A to the joint proxy statement/prospectus filed by HomeTrust Bancshares on April 28, 2014 pursuant to Rule 424(b) of the Securities Act of 1933. |
(d) | Filed as an exhibit to HomeTrust Bancshares's Registration Statement on Form S-1 (File No. 333-178817) filed on December 29, 2011. |
(e) | Filed as an exhibit to HomeTrust Bancshares's Current Report on Form 8-K filed on September 25, 2012 (File No. 001-35593). |
(f) | Filed as an exhibit to HomeTrust Bancshares's Current Report on Form 8-K filed on January 29, 2014 (File No. 001-35593). |
(g) | Filed as an exhibit to HomeTrust Bancshares's Current Report on Form 8-K filed on November 27, 2013 (File No. 001-35593). |
(h) | Filed as an exhibit to HomeTrust Bancshares's Annual Report on Form 10-K for the fiscal year ended June 30, 2012 (File No. 001-35593). |
(i) | Filed as an exhibit to Amendment No. One to HomeTrust Bancshares's Registration Statement on Form S-1 (File No. 333-178817) filed on March 9, 2012. |
(j) | Attached as Appendix A to HomeTrust Bancshares's definitive proxy statement filed on December 5, 2012 (File No. 001-35593). |
(k) | Filed as an exhibit to HomeTrust Bancshares's Registration Statement on Form S-8 (File No. 333-186666) filed on February 13, 2013. |
(l) | Filed as an exhibit to HomeTrust Bancshares's Current Report on Form 8-K filed on June 3, 2014 (File No. 001-35593). |
(m) | Filed as an exhibit to Jefferson Bancshares, Inc.'s Quarterly Report on Form 10-Q for the quarter ended December 31, 2008 (File No. 000-50347). |
(n) | Filed as an exhibit to HomeTrust Bancshare's Annual Report on Form 10-K for the fiscal year ended June 30, 2014 (File No. 001-35593). |
127
(o) | Filed as an exhibit to HomeTrust Bancshares's Current Report on Form 8-K filed on August 31, 2015 (File No. 001-35593). |
(p) | Filed as an exhibit to HomeTrust Bancshare's Annual Report on Form 10-K for the fiscal year ended June 30, 2015 (File No. 001-35593). |
(q) | Filed as an exhibit to HomeTrust Bancshares's Current Report on Form 8-K filed on January 29, 2016 (File No. 001-35593). |
(r) | Filed as an exhibit to HomeTrust Bancshare's Annual Report on Form 10-K for the fiscal year ended June 30, 2016 (File No. 001-35593). |
128