UNITED STATES
SECURITIES AND EXCHANGE COMMISSION
WASHINGTON, D.C. 20549
FORM 10-K
| (Mark One) |
[X] | ANNUAL REPORT PURSUANT TO SECTION 13 OR 15(d) OF THE SECURITIES EXCHANGE ACT OF 1934 |
For the Fiscal Year Ended June 30, 2014
OR
[ ] | TRANSITION REPORT PURSUANT TO SECTION 13 OR 15(d) OF THE SECURITIES EXCHANGE ACT OF 1934 |
For the Transition Period From __________________ To __________________
Commission File Number 1-35593
HOMETRUST BANCSHARES, INC.
(Exact Name of Registrant as Specified in its Charter)
Maryland | 45-5055422 | |
(State or Other Jurisdiction of Incorporation or Organization) | (I.R.S. Employer Identification No.) | |
10 Woodfin Street, Asheville, North Carolina | 28801 | |
(Address of Principal Executive Offices) | (Zip Code) |
Registrant's Telephone Number, Including Area Code: (828) 259-3939
Securities Registered Pursuant to Section 12(b) of the Act:
Title of Each Class | Name of Each Exchange on Which Registered | |
Common Stock, par value $0.01 per share | The NASDAQ Stock Market LLC |
Securities Registered Pursuant to Section 12(g) of the Act:
Preferred Share Purchase Rights
Indicate by check mark if the registrant is a well-known seasoned issuer, as defined in Rule 405 of the Securities Act. Yes [ ] No [X]
Indicate by check mark if the registrant is not required to file reports pursuant to Section 13 or Section 15(d) of the Act. Yes [ ] No [X]
Indicate by check mark whether the registrant (1) has filed all reports required to be filed by Section 13 or 15(d) of the Securities Exchange Act of 1934 during the preceding 12 months (or for such shorter period that the registrant was required to file such reports), and (2) has been subject to such filing requirements for the past 90 days. Yes [X] No [ ].
Indicate by check mark whether the registrant has submitted electronically and posted on its corporate Web site, if any, every Interactive Data File required to be submitted and posted pursuant to Rule 405 of Regulation S-T (§ 232.405 of this chapter) during the preceding 12 months (or for such shorter period that the registrant was required to submit and post such files). Yes [X] No [ ].
Indicate by check mark if disclosure of delinquent filers pursuant to Item 405 of Regulation S-K is not contained herein, and will not be contained, to the best of the registrant's knowledge, in definitive proxy or information statements incorporated by reference in Part III of this Form 10-K or any amendment to this Form 10-K. [X]
Indicate by check mark whether the registrant is a large accelerated filer, an accelerated filer, a non-accelerated filer or a smaller reporting company. See the definitions of "large accelerated filer," "accelerated filer" and "smaller reporting company" in Rule 12b-2 of the Exchange Act.
Large Accelerated Filer [ ] | Accelerated Filer [X] | |
Non-Accelerated Filer [ ] (Do not check if a smaller reporting company) | Smaller reporting company [ ] |
Indicate by check mark whether the registrant is a shell company (as defined in Rule 12b-2 of the Exchange Act). Yes [ ] No [X].
As of September 5, 2014, there were issued and outstanding 20,512,248 shares of the Registrant's Common Stock. The aggregate market value of the voting stock held by non-affiliates of the Registrant computed by reference to the closing price of such stock as of December 31, 2013, was $300.2 million. (The exclusion from such amount of the market value of the shares owned by any person shall not be deemed an admission by the Registrant that such person is an affiliate of the Registrant.)
HOMETRUST BANCSHARES, INC.
FORM 10-K
FOR THE FISCAL YEAR ENDED JUNE 30, 2014
TABLE OF CONTENTS
|
| Page |
PART I | ||
Item 1 | Business | 4 |
Item 1A. | Risk Factors | 47 |
Item 1B. | Unresolved Staff Comments | 57 |
Item 2 | Properties | 57 |
Item 3 | Legal Proceedings | 57 |
Item 4 | Mine Safety Disclosures | 57 |
PART II | ||
Item 5 | Market for Registrant's Common Equity, Related Stockholder Matters, and Issuer Purchases of Equity Securities |
58 |
Item 6 | Selected Financial Data | 60 |
Item 7 | Management's Discussion and Analysis of Financial Condition and Results of Operations | 63 |
Item 7A. | Quantitative and Qualitative Disclosures About Market Risk | 81 |
Item 8 | Financial Statements and Supplementary Data | 82 |
Item 9 | Changes in and Disagreements with Accountants on Accounting and Financial Disclosure | 126 |
Item 9A. | Control and Procedures | 126 |
Item 9B. | Other Information | 127 |
PART III | ||
Item 10 | Directors, Executive Officers and Corporate Governance | 128 |
Item 11 | Executive Compensation | 128 |
Item 12 | Security Ownership of Certain Beneficial Owners and Management and Related Stockholder Matters | 128 |
Item 13 | Certain Relationships and Related Transactions, and Director Independence | 128 |
Item 14 | Principal Accountant Fees and Services | 128 |
PART IV | ||
Item 15 | Exhibits and Financial Statement Schedules | 129 |
Signatures | 130 | |
2
Forward-Looking Statements
Certain matters in this Form 10-K constitute forward-looking statements within the meaning of the Private Securities Litigation Reform Act of 1995. These statements relate to our financial condition, results of operations, plans, objectives, future performance or business. Forward-looking statements are not statements of historical fact, are based on certain assumptions and are generally identified by use of the words "believes," "expects," "anticipates," "estimates," "forecasts," "intends," "plans," "targets," "potentially," "probably," "projects," "outlook" or similar expressions or future or conditional verbs such as "may," "will," "should," "would" and "could." Forward-looking statements include statements with respect to our beliefs, plans, objectives, goals, expectations, assumptions and statements about future economic performance and projections of financial items. These forward-looking statements are subject to known and unknown risks, uncertainties and other factors that could cause actual results to differ materially from the results anticipated or implied by our forward-looking statements, including, but not limited to: the credit risks of lending activities, including changes in the level and trend of loan delinquencies and write offs and changes in our allowance for loan losses and provision for loan losses that may be impacted by deterioration in the housing and commercial real estate markets; changes in general economic conditions, either nationally or in our market areas; changes in the levels of general interest rates, and the relative differences between short and long term interest rates, deposit interest rates, our net interest margin and funding sources; fluctuations in the demand for loans, the number of unsold homes, land and other properties and fluctuations in real estate values in our market areas; decreases in the secondary market for the sale of loans that we originate; results of examinations of us by the Office of the Comptroller of the Currency ("OCC") or other regulatory authorities, including the possibility that any such regulatory authority may, among other things, require us to increase our allowance for loan losses, write-down assets, change our regulatory capital position or affect our ability to borrow funds or maintain or increase deposits, which could adversely affect our liquidity and earnings; legislative or regulatory changes that adversely affect our business including the effect of Dodd-Frank Wall Street Reform and Consumer Protection Act (the "Dodd-Frank Act"), changes in regulatory policies and principles, or the interpretation of regulatory capital or other rules, including as a result of Basel III; our ability to attract and retain deposits; increases in premiums for deposit insurance; management's assumptions in determining the adequacy of the allowance for loan losses; our ability to control operating costs and expenses, especially costs associated with our operation as a public company; the use of estimates in determining fair value of certain of our assets, which estimates may prove to be incorrect and result in significant declines in valuation; difficulties in reducing risks associated with the loans on our balance sheet; staffing fluctuations in response to product demand or the implementation of corporate strategies that affect our workforce and potential associated charges; computer systems on which we depend could fail or experience a security breach; our ability to retain key members of our senior management team; costs and effects of litigation, including settlements and judgments; our ability to successfully integrate any assets, liabilities, customers, systems, and management personnel we have acquired or may in the future acquire into our operations and our ability to realize related revenue synergies and cost savings within expected time frames and any goodwill charges related thereto; increased competitive pressures among financial services companies; changes in consumer spending, borrowing and savings habits; the availability of resources to address changes in laws, rules, or regulations or to respond to regulatory actions; adverse changes in the securities markets; inability of key third-party providers to perform their obligations to us; statements with respect to our intentions regarding disclosure and other changes resulting from the Jumpstart Our Business Startups Act of 2012 ("JOBS Act"); changes in accounting policies and practices, as may be adopted by the financial institution regulatory agencies, the Public Company Accounting Oversight Board or the Financial Accounting Standards Board; and other economic, competitive, governmental, regulatory, and technological factors affecting our operations, pricing, products and services; and the other risks detailed from time to time in our filings with the Securities and Exchange Commission, including this report on Form 10-K.
Any of the forward-looking statements are based upon management's beliefs and assumptions at the time they are made. We undertake no obligation to publicly update or revise any forward-looking statements included in this report or to update the reasons why actual results could differ from those contained in such statements, whether as a result of new information, future events or otherwise. In light of these risks, uncertainties and assumptions, the forward-looking statements discussed in this report might not occur and you should not put undue reliance on any forward-looking statements.
As used throughout this report, the terms "we", "our", "us", "HomeTrust Bancshares" or the "Company" refer to HomeTrust Bancshares, Inc. and its consolidated subsidiaries, including HomeTrust Bank ("HomeTrust") unless the context indicates otherwise.
3
PART I
Item 1. Business
General
HomeTrust Bancshares, Inc., a Maryland corporation, was formed for the purpose of becoming the savings and loan holding company for HomeTrust Bank in connection with HomeTrust Bank's conversion from mutual to stock form, which was completed on July 10, 2012 (the "Conversion"). In connection with the Conversion, HomeTrust Bancshares issued an aggregate of 21,160,000 shares of common stock at an offering price of $10.00 per share for gross proceeds of $211.6 million. HomeTrust Bancshares received $208.4 million in net proceeds from the stock offering of which $104.2 million or 50% of the net proceeds were contributed to HomeTrust Bank upon completion of the Conversion. HomeTrust Bancshares' business activities generally are limited to passive investment activities and oversight of its investment in HomeTrust Bank. HomeTrust Bank is the eighth largest community bank headquartered in North Carolina based on asset size. Our headquarters is located in Asheville, North Carolina.
As of August 25, 2014, HomeTrust Bancshares converted from a savings and loan holding company to a bank holding company and is subject to regulation by the Board of Governors of the Federal Reserve System ("Federal Reserve"), as a result of HomeTrust Bank converting from a federal savings bank to a national bank with the title, "HomeTrust Bank, National Association." HomeTrust Bank is regulated by the OCC, its primary federal regulator, and by the Federal Deposit Insurance Corporation ("FDIC"), the insurer of its deposits. HomeTrust Bank is a member of the Federal Home Loan Bank of Atlanta ("FHLB" or "FHLB of Atlanta"), which is one of the 12 regional banks in the Federal Home Loan Bank System ("FHLB System"). At June 30, 2014, HomeTrust Bank had total assets of $2.07 billion, total deposits of $1.58 billion and total stockholders' equity of $377.2 million.
HomeTrust Bank was originally chartered in 1926, in Clyde, North Carolina, as Clyde Building & Loan Association. We expanded our product offerings over the years and changed our name to Clyde Savings Bank. As we continued to grow beyond a single market area, on July 22, 2003, we rebranded by changing our name to HomeTrust Bank.
In 1996, HomeTrust Bank's board of directors and executive management implemented their vision of a new banking partnership which is branded as the HomeTrust Banking Partnership. Our mission has been to create a unique partnership, where hometown community banks could combine their financial resources to achieve our shared vision. Together, we can better respond to the continuous changes in the banking industry and offer all the products, services and technology needed to be relevant and competitive in all of our communities- while better preserving our hometown values and culture focused on building caring relationships with our employees, customers and communities while delivering on our brand promise that "It's Just Better Here."
Between fiscal years 1996 and 2011, five mutual saving banks joined the HomeTrust Banking Partnership. In addition, in 2007 we formed a de novo branch, known as the Rutherford County Bank, as another partner. Each now operates as a banking division of HomeTrust Bank with a local management team, board of directors and employees. HomeTrust Bank and its banking divisions, which we sometimes refer to as "partner banks", are set forth below:
| · | HomeTrust Bank, since 1926, Asheville, North Carolina |
| · | Tryon Federal Bank, since 1935, Tryon, North Carolina |
| · | Shelby Savings Bank, since 1905, Shelby, North Carolina |
| · | Home Savings Bank, since 1909, Eden, North Carolina |
| · | Industrial Federal Bank, since 1929, Lexington, North Carolina |
| · | Cherryville Federal Bank, since 1912, Cherryville, North Carolina |
| · | Rutherford County Bank, since 2007, Forest City, North Carolina |
4
Brought together by shared values, trust and mutual respect, these partner banks have combined their resources to build a technology and operations center, develop new products and services for retail and business customers and seek to achieve organic growth by attracting new loan customers and related core deposits in the communities they serve. Through the HomeTrust Banking Partnership, we created a more efficient operating structure with greater capabilities to compete with larger, out of town competitors.
We intend to expand through organic growth and through the acquisition of other community financial institutions and/or bank branches. Our goal is to continue to enhance our franchise value and earnings through strategic, planned growth in our banking operations, while maintaining the community-focused, relationship style of exceptional customer service that has differentiated our brand and characterized our success to date. As part of this strategy, On July 31, 2013, we completed our first acquisition as a public company, by acquiring BankGreenville Financial Corporation ("BankGreenville") with one office in Greenville, South Carolina. On May 31, 2014, we completed our acquisition of Jefferson Bancshares, Inc. ("Jefferson"), the holding company for Jefferson Federal Bank, with twelve branch office locations across East Tennessee. Additionally, on July 31, 2014, we completed our acquisition of Bank of Commerce with one office in Charlotte, North Carolina.
At June 30, 2014 we had 34 banking offices in North Carolina (including the Asheville metropolitan area and the "Piedmont" region), South Carolina (Greenville), and East Tennessee (including Kingsport/Johnson City, Knoxville, and Morristown).
Our principal business consists of attracting deposits from the general public and investing those funds, along with borrowed funds, in loans secured primarily by first and second mortgages on one- to four-family residences including home equity loans and construction and land/lot loans, commercial real estate loans, construction and development loans, and municipal leases. Municipal leases are secured primarily by a ground lease for a firehouse or an equipment lease for fire trucks and firefighting equipment to fire departments located throughout North and South Carolina. We also purchase investment securities consisting primarily of mortgage-backed securities issued by United States Government agencies and government-sponsored enterprises.
We offer a variety of deposit accounts for individuals, businesses and nonprofit organizations. Deposits are our primary source of funds for our lending and investing activities.
Recent Developments (activity after the fiscal year end)
On July 21, 2014, the HomeTrust Bank opened a commercial loan production office ("LPO") in downtown Roanoke, Virginia.
On July 31, 2014, HomeTrust Bank completed its acquisition of Bank of Commerce. Bank of Commerce shareholders were paid $6.25 per share in cash consideration, representing approximately $10.1 million of aggregate deal consideration. In addition, all $3.2 million of Bank of Commerce's preferred stock was redeemed. Bank of Commerce had total assets of $122.8 million, total deposits of $92.8 million, and stockholders' equity of $12.3 million at June 30, 2014.
On August 13, 2014, the Bank received approval from the Office of the Comptroller of the Currency to purchase the branch banking operations of ten locations in Virginia and North Carolina from Bank of America Corporation. Six of the branches are located in Roanoke Valley, two in Danville, one in Martinsville, Virginia, and one in Eden, North Carolina. The acquisition will add approximately $504 million of deposits. In addition to the branches, the Bank will acquire a small amount of loans as part of the transaction. The Bank expects the purchase to be effective Monday, November 17, 2014, following satisfaction of customary closing conditions.
On August 25, 2014, HomeTrust Bank converted from a federal savings bank charter to a national bank charter. Additionally, HomeTrust Bancshares, Inc. converted to a bank holding company.
Market Areas
HomeTrust Bank operates in eight metropolitan statistical areas: Asheville, NC; Charlotte-Concord-Gastonia, NC-SC; Greenville-Anderson-Mauldin, SC; Johnson City, TN; Kingsport-Bristol-Bristol, TN-VA; Knoxville, TN; Morristown, TN and Roanoke, VA.
5
Asheville is known for its natural beauty and scenic surroundings. In addition, the Asheville metropolitan area has a vibrant cultural and arts community that parallels that of many larger cities in the United States and is home to a number of historical attractions, the most prominent of which is the Biltmore Estate, a historic mansion with gardens and a winery that draws approximately one million tourists each year. Due to its scenic location and diverse cultural and historical offerings, the Asheville metropolitan area has become a popular destination for tourists, which has historically positively impacted our local economy. In addition, affordable housing prices compared to many bigger cities, combined with the region's favorable climate, scenic surroundings and cultural attractions, have also made the Asheville metropolitan area an increasingly attractive destination for retirees seeking to relocate from other parts of the United States.
Not unlike many areas across the country, the recent economic recession has caused the Asheville metropolitan area to experience a decline in tourism and a reduced influx of retirees from other parts of the country. In addition, the recent economic recession has also resulted in increased job losses in the manufacturing services sector. Over the course of the past three years, the tourism industry in the Asheville metropolitan area has largely recovered, which has positively impacted the economy in a number of our local markets, such as Buncombe and Henderson Counties, which directly benefit from this industry. Based on information from the North Carolina Association of Realtors, the average existing home price in the Asheville metropolitan area in June 2014 was $290,530, a 12% increase from June 2013 and a 1% increase from June 2012. Existing home sales in the Asheville metropolitan area for June 2014 increased by 22% and 13% as compared to June 2013 and 2012, respectively. The average unemployment rate in the Asheville metropolitan area in 2013 was 6.3%, a decrease from 7.7% in 2012, and a decrease from 8.1% in 2011.
The Charlotte-Concord-Gastonia, NC-SC metropolitan area is located in both North and South Carolina, within and surrounding the city of Charlotte. Located in the Piedmont region of the Southeastern United States, the Charlotte metropolitan area is well known for its auto racing history (especially NASCAR). The region is headquarters to 8 Fortune 500 and 7 Fortune 1000 companies, including Bank of America, Duke Energy, Nucor Steel, and Lowe's Home Improvement Stores. Additional headquarters include Harris Teeter, Food Lion, Cheerwine and Sundrop. The Charlotte MSA is the largest in the Carolinas. Based on information from the North Carolina Association of Realtors, the average existing home price in the Charlotte-Concord-Gastonia, NC-SC metropolitan area in June 2014 was $257,854, an 8% increase from June 2013 and a 23.5% increase from June 2012. The Charlotte-Concord-Gastonia, NC-SC metropolitan area had a 2013 total population of 2.3 million, which is unchanged from 2012 and 2011. The average unemployment rate in the Charlotte-Concord-Gastonia, NC-SC metropolitan area in 2013 was 8.1%, a decrease from 9.3% in 2012, and a decrease from 10.7% in 2011.
The Greenville-Anderson-Mauldin, SC metropolitan area is located in upstate South Carolina, in the foothills of the Blue Ridge Mountains. The MSA had a 2013 total population of 850,047, an increase of 3.1% from 2010, and an increase of 14.6% from 2000. Major employment sectors for the MSA include services, manufacturing, and retail trade comprising 45.4%, 19.8%, and 12.6% of all jobs, respectively. The average unemployment rate in the Greenville-Anderson-Mauldin, SC MSA in 2013 was 6.2%, a decrease from 7.5% in 2012, and a decrease from 8.5% in 2011.
The Johnson City, TN metropolitan area is an economic hub largely fueled by East Tennessee State University and the medical "Med-Tech" corridor, anchored by the Johnson City Medical Center, Franklin Woods Community Hospital and affiliated facilities. The city's museums and historical sites include the Hands On! Museum and the Tipton-Haynes State Historic Site, which hosts the annual Bluegrass and Sorghum Making Festival, as well as other seasonal events. The average unemployment rate in the Johnson City, TN metropolitan area in 2013 was 7.8%, a slight increase from 7.6% in 2012, and a decrease from 8.6% in 2011.
The Kingsport-Bristol-Bristol, TN-VA metropolitan statistical area is home to the headquarters of Eastman Chemical Company. The major economic components in Kingsport are healthcare, manufacturing and educational services. The average unemployment rate in the Kingsport-Bristol-Bristol, TN-VA metropolitan statistical area in 2013 was 7.5%, a decrease from 7.6% in 2012, and a decrease from 8.3% in 2011.
The Knoxville, TN metropolitan area is located where the French Broad and Holston Rivers converge to form the Tennessee River. It is the largest city in East Tennessee and ranks third largest in the state. It is located in a broad valley between the Cumberland Mountains to the northwest and the Great Smoky Mountains to the southeast. The Knoxville area is frequently cited in national surveys as a quality place in which to live. The University of
6
| Tennessee calls Knoxville home, with over 27,000 students, making an array of educational and cultural opportunities available to area residents. Affordable housing, health care costs below the national average, a low crime rate, and a pleasant climate with lakes and mountains nearby are factors which make Knoxville an attractive place to settle. Major employment sectors in the Knoxville area include government, education, and healthcare. The estimated population of the Knoxville, TN MSA in 2013 was 852,715, an increase of 21.0% from 2011. The average unemployment rate in the Knoxville, TN metropolitan area in 2013 was 6.9%, a slight increase from 6.7% in 2012, and a decrease from 7.5% in 2011. |
The Morristown, TN metropolitan area includes facilities for numerous Fortune 500 companies including General Electric, International Paper, Alcoa (Howmet), Coca-Cola, Lear Corporation, Pepsi Bottling, NCR Corporation and Arvin Meritor, Inc. Morristown also includes the facilities of a number of international companies from countries such as Germany, Japan, Sweden, United Kingdom, Italy, Canada and France. Local industries include furniture manufacturing, poultry processing, aircraft parts, healthcare products and automotive parts. Agriculture including soybeans, corn, livestock and dairy are also significant economic components. Morristown's major job providing segments are healthcare, manufacturing, educational services, furniture and related products, transportation equipment, educational services, and accommodation and food services. T he average unemployment rate in the Morristown, TN metropolitan area in 2013 was 9.5%, a decrease from 9.8% in 2012, and a decrease from 11.0% in 2011.
The Roanoke, VA metropolitan area is located in the Roanoke Valley of western Virginia in the midst of the Blue Ridge and Alleghany Mountains. This 1,874-square mile region is bordered on the west by West Virginia and along the east by the Blue Ridge Mountains. The area is strategically accessible to both the East Coast and Mid-West markets with Interstate 81 passing through the region, Interstate 64 directly north, and Interstate 77 nearby to the south. The Roanoke MSA is the transportation hub of the area with an integrated interstate highway, rail, and air transportation network. Roanoke has the most diverse economy in Virginia and is the cultural and business hub for western Virginia. The Roanoke MSA is home to several large regional banking offices, headquarters of the Fortune 500 retailer Advance Auto, and to several large advanced manufacturing operations, such as those owned by General Electric, ITT Exelis, Dynax America, and Optical Cable Corporation, among others. The Roanoke, VA MSA's major employment sectors include government, health care and social assistance, retail trade, and manufacturing. The average unemployment rate in the Roanoke, VA metropolitan area in 2013 was 5.8%, a decrease from 6.1% in 2012, and a decrease from 6.8% in 2011.
There are indications over the past year that the U.S. job market is improving. In June 2014, the national unemployment rate was 6.1%. Additionally in June 2014, the state unemployment rates for North Carolina, South Carolina, Tennessee and Virginia were 6.5%, 5.7%, 7.4%, and 5.4%, respectively. The national unemployment rate was 7.5% and 8.2% as of June 2013 and 2014, respectively. The state unemployment rates for North Carolina, South Carolina, Tennessee and Virginia as of June 2013 and 2014 were 8.6% and 9.6%, 8.3% and 9.5%, and 8.9% and 8.7%, and 6.0% and 6.2%, respectively.
Through the HomeTrust Banking Partnership, we have built a strong foundation in the communities we serve. The directors of each partner bank work with their management team and employees to support local nonprofit and community organizations. Each partner bank helps provide critical services to meet the financial needs of its customers and improve the quality of life for individuals and businesses in its community. Initiatives supporting the core business include affordable housing, education and financial education and building healthy communities. We support these initiatives through both financial and people resources in all of our communities. Collectively, partner bank employees volunteer thousands of hours annually in their local communities; from helping to build homes to teaching grade school youth how to start healthy savings habits, partner bank employees are making a positive difference in the lives of others every day.
Competition
We face strong competition in originating real estate and other loans and in attracting deposits. Competition in originating real estate loans comes primarily from other savings institutions, commercial banks, credit unions, life insurance companies and mortgage bankers. Other savings institutions, commercial banks, credit unions and finance companies provide vigorous competition in consumer lending. Commercial and industrial loan competition is primarily from local commercial banks. We believe that we compete effectively because we
7
consistently deliver high-quality, personal service to our customers that results in a high level of customer satisfaction. We recently added significant technology resources to expand our capabilities and increase our efficiencies in residential lending.
We attract our deposits through our branch office system. Competition for deposits is principally from other savings institutions, commercial banks and credit unions located in the same communities, as well as mutual funds and other alternative investments. We believe that we compete for deposits by offering superior service and a variety of deposit accounts at competitive rates. We also have a highly competitive suite of cash management services, technology solutions, and internal support expertise specific to the needs of small to mid-sized commercial business customers. Based on the most recent branch deposit data provided by the FDIC, HomeTrust Bank was third, twentieth, twenty-fourth, eighth, twentieth, thirty-fifth, and second in share of deposits in the Asheville, NC; Charlotte-Concord-Gastonia, NC-SC; Greenville-Anderson-Mauldin, SC; Johnson City, TN; Kingsport-Bristol-Bristol, TN-VA; Knoxville, TN; and Morristown, TN Metropolitan Statistical Areas, respectively. HomeTrust Bank was fourth, seventeenth, and eighth in deposit share in the nine North Carolina, one South Carolina, and four Tennessee counties in which we operate, respectively. Finally, HomeTrust Bank had a deposit market share of 0.38%, 0.13%, and 0.34% of all banks and thrifts in North Carolina, South Carolina, and Tennessee, respectively.
Overall, we believe that we distinguish ourselves from larger, national banks operating in our market areas by offering quicker decision-making in the delivery of our products and services and competitive customer-driven products with excellent service and responsiveness, and by providing customer access to our senior managers. In addition, our larger capital base and product mix enable us to compete effectively against smaller banks. Our lending staff is experienced and knowledgeable about local lending in our markets, enabling us to build on the relationship-style banking that is our hallmark.
In addition, the way we create differentiation from our competition to fuel organic growth is by focusing on "HOW" we deliver our products and services. When we promise our customers that ‘It's Just Better Here', more than anything, it refers to the care and responsiveness our employees provide to each and every customer. Teamwork is key to our success. Many of our employees have been a part of the HomeTrust Banking Partnership for decades, while a significant number of employees have more recently brought their industry knowledge and expertise to us through internal growth and acquisition, reflecting their desire to be a part of a high performing team that works well together to make a difference for customers. Our culture includes relationship training and coaching with respect to banking and adding value to our customers. This "culture model" includes four key principles:
· making a difference for customers every day is fun and rewarding;
· success is built on relationships;
· we must continually add value to relationships with our customers and with each other; and
· we need to grow ourselves and our ability to make a difference and add value to relationships.
In implementing these principles, the directors, management team and employees of each partner bank work to support local nonprofit and community organizations and strive to provide critical services to meet the financial needs of its customers and improve the quality of life for individuals and businesses in our communities. We support affordable housing and education initiatives to help build healthy communities where our partner banks do business through both financial assistance and employees volunteering thousands of hours annually in their local communities. We believe the opportunity to stay close to our customers gives us a unique position in the banking industry as compared to our larger competitors and we are committed to continuing to build strong relationships with our employees, customers and communities for generations to come.
8
Lending Activities
The following table presents information concerning the composition of our loan portfolio in dollar amounts and in percentages (before deductions for deferred fees and allowances for losses) at the dates indicated.
At June 30, | ||||||||||||||||||||||||||||||||||||||||
2014 | 2013 | 2012 | 2011 | 2010 | ||||||||||||||||||||||||||||||||||||
Amount | Percent | Amount | Percent | Amount | Percent | Amount | Percent | Amount | Percent | |||||||||||||||||||||||||||||||
(Dollars in thousands) | ||||||||||||||||||||||||||||||||||||||||
Retail consumer loans: | ||||||||||||||||||||||||||||||||||||||||
One- to four-family | $ | 660,200 | 44.08 | % | $ | 602,980 | 51.69 | % | $ | 620,486 | 50.36 | % | $ | 610,528 | 45.88 | % | $ | 509,464 | 39.50 | % | ||||||||||||||||||||
Home equity | 148,379 | 9.91 | 125,676 | 10.77 | 143,052 | 11.61 | 156,720 | 11.78 | 157,050 | 12.18 | ||||||||||||||||||||||||||||||
Construction and land/lots | 59,249 | 3.96 | 51,546 | 4.42 | 53,572 | 4.35 | 68,199 | 5.12 | 79,007 | 6.13 | ||||||||||||||||||||||||||||||
Consumer | 15,164 | 1.01 | 3,349 | 0.29 | 3,819 | 0.31 | 4,265 | 0.32 | 3,769 | 0.29 | ||||||||||||||||||||||||||||||
Total retail consumer loans | 882,992 | 58.95 | 783,551 | 67.17 | 820,2929 | 66.63 | 839,712 | 63.10 | 749,290 | 58.09 | ||||||||||||||||||||||||||||||
Commercial loans: | ||||||||||||||||||||||||||||||||||||||||
Commercial real estate | 377,769 | 25.22 | 231,086 | 19.81 | 238,644 | 19.37 | 269,449 | 20.24 | 270,272 | 20.95 | ||||||||||||||||||||||||||||||
Construction and development | 56,457 | 3.77 | 23,994 | 2.06 | 42,362 | 3.44 | 79,458 | 5.97 | 127,054 | 9.85 | ||||||||||||||||||||||||||||||
Commercial and industrial | 74,435 | 4.97 | 11,452 | 0.98 | 14,578 | 1.18 | 19,250 | 1.45 | 20,117 | 1.56 | ||||||||||||||||||||||||||||||
Municipal leases | 106,215 | 7.09 | 116,377 | 9.98 | 115,516 | 9.38 | 122,921 | 9.24 | 123,099 | 9.54 | ||||||||||||||||||||||||||||||
Total commercial loans | 614,876 | 41.05 | 382,909 | 32.83 | 411,100 | 33.37 | 491,078 | 36.90 | 540,542 | 41.91 | ||||||||||||||||||||||||||||||
Total loans | 1,497,868 | 100.00 | % | 1,166,460 | 100.00 | % | 1,232,029 | 100.00 | % | 1,330,790 | 100.00 | % | 1,289,832 | 100.00 | % | |||||||||||||||||||||||||
Less : | ||||||||||||||||||||||||||||||||||||||||
Deferred fees | (1,340 | ) | (2,277 | ) | (2,984 | ) | (4,273 | ) | (4,509 | ) | ||||||||||||||||||||||||||||||
Allowance for losses | (23,429 | ) | (32,073 | ) | (35,100 | ) | (50,140 | ) | (41,713 | ) | ||||||||||||||||||||||||||||||
Total loans receivable, net | $ | 1,473,099 | $ | 1,132,110 | $ | 1,193,945 | $ | 1,276,377 | $ | 1,243,610 | ||||||||||||||||||||||||||||||
9
The following table shows the composition of our loan portfolio in dollar amounts and in percentages (before deductions for deferred fees and allowances for loan losses) at the dates indicated.
At June 30, | ||||||||||||||||||||||||
2014 | 2013 | 2012 | ||||||||||||||||||||||
Amount | Percent | Amount | Percent | Amount | Percent | |||||||||||||||||||
(Dollars in thousands) | ||||||||||||||||||||||||
Fixed-rate loans : | ||||||||||||||||||||||||
Retail consumer loans: | ||||||||||||||||||||||||
One- to four-family | $ | 350,725 | 23.42 | % | $ | 340,399 | 29.18 | % | $ | 329,171 | 26.72 | % | ||||||||||||
Home equity | - | - | 711 | 0.06 | 201 | 0.02 | ||||||||||||||||||
Construction and land/lots | 37,484 | 2.50 | 30,163 | 2.59 | 24,652 | 2.00 | ||||||||||||||||||
Consumer | 14,911 | 1.00 | 3,327 | 0.29 | 3,797 | 0.31 | ||||||||||||||||||
Commercial loans: | ||||||||||||||||||||||||
Commercial real estate | 258,272 | 17.24 | 167,168 | 14.33 | 157,209 | 12.76 | ||||||||||||||||||
Construction and development | 36,070 | 2.41 | 15,933 | 1.37 | 21,566 | 1.75 | ||||||||||||||||||
Commercial and industrial | 40,606 | 2.71 | 8,732 | 0.75 | 8,660 | 0.70 | ||||||||||||||||||
Municipal leases | 106,215 | 7.09 | 116,377 | 9.98 | 115,516 | 9.38 | ||||||||||||||||||
Total fixed-rate loans | 844,283 | 56.37 | 682,810 | 58.54 | 660,772 | 53.63 | ||||||||||||||||||
Adjustable-rate loans : | ||||||||||||||||||||||||
Retail consumer loans: | ||||||||||||||||||||||||
One- to four-family | 309,475 | 20.66 | 262,581 | 22.51 | 291,315 | 23.65 | ||||||||||||||||||
Home equity | 148,379 | 9.91 | 124,965 | 10.71 | 142,851 | 11.59 | ||||||||||||||||||
Construction and land/lots | 21,765 | 1.45 | 21,383 | 1.83 | 28,920 | 2.35 | ||||||||||||||||||
Consumer | 253 | 0.02 | 22 | - | 22 | - | ||||||||||||||||||
Commercial loans: | ||||||||||||||||||||||||
Commercial real estate | 119,497 | 7.98 | 63,918 | 5.48 | 81,435 | 6.61 | ||||||||||||||||||
Construction and development | 20,387 | 1.36 | 8,061 | 0.69 | 20,796 | 1.69 | ||||||||||||||||||
Commercial and industrial | 33,829 | 2.26 | 2,720 | 0.23 | 5,918 | 0.48 | ||||||||||||||||||
Municipal leases | - | - | - | - | - | - | ||||||||||||||||||
Total adjustable-rate loans | 653,585 | 43.63 | 483,650 | 41.46 | 571,257 | 46.37 | ||||||||||||||||||
Total loans | 1,497,868 | 100.00 | % | 1,166,460 | 100.00 | % | 1,232,029 | 100.00 | % | |||||||||||||||
Less : | ||||||||||||||||||||||||
Deferred fees | (1,340 | ) | (2,277 | ) | (2,984 | ) | ||||||||||||||||||
Allowance for losses | (23,429 | ) | (32,073 | ) | (35,100 | ) | ||||||||||||||||||
Total loans receivable, net | $ | 1,473,099 | $ | 1,132,110 | $ | 1,193,945 | ||||||||||||||||||
The increase in loans during 2014 was primarily driven by the $329.3 million in loans obtained as part of our acquisition of Jefferson effective May 31, 2014. These loans are accounted for under Accounting Standards Codification ("ASC") Topic 310, Receivables, which requires purchased loans to be recorded at fair value on the acquisition dated with no separate allowance for loan losses. For further discussion of the Company's acquisition accounting for loans, see Note 1-Summary of Significant Accounting Polices, Note 2-Business Combinations, and Note 4-Loans in the consolidated financial statements.
10
Loan Maturity . The following table sets forth certain information at June 30, 2014 regarding the dollar amount of loans maturing in our portfolio based on their contractual terms to maturity, but does not include scheduled payments or potential prepayments. Loan balances do not include undisbursed loan proceeds, unearned discounts, unearned income and allowance for loan losses.
Retail Consumer | ||||||||||||||||||||||||||||||||
One- to Four-Family | Home Equity | Construction and land/lots | Consumer | |||||||||||||||||||||||||||||
Amount | Weighted Average Rate | Amount | Weighted Average Rate | Amount | Weighted Average Rate | Amount | Weighted Average Rate | |||||||||||||||||||||||||
(Dollars in thousands) | ||||||||||||||||||||||||||||||||
Due During Years Ending June 30, | ||||||||||||||||||||||||||||||||
2015 | $ | 15,788 | 5.58 | % | $ | 1,577 | 4.55 | % | $ | 1,997 | 6.37 | % | $ | 1,876 | 3.15 | % | ||||||||||||||||
2016 | 8,120 | 5.56 | 2,632 | 4.17 | 2,207 | 5.91 | 793 | 5.00 | ||||||||||||||||||||||||
2017 | 9,009 | 5.75 | 4,838 | 3.96 | 1,412 | 6.66 | 1,114 | 5.55 | ||||||||||||||||||||||||
2018 and 2019 | 30,156 | 5.14 | 21,139 | 4.10 | 1,646 | 6.53 | 2,809 | 4.80 | ||||||||||||||||||||||||
2020 to 2023 | 99,745 | 4.08 | 61,603 | 4.37 | 4,016 | 5.83 | 7,499 | 4.67 | ||||||||||||||||||||||||
2024 to 2028 | 106,033 | 4.16 | 44,174 | 3.94 | 11,309 | 5.88 | 276 | 4.50 | ||||||||||||||||||||||||
2029 and following | 391,349 | 4.14 | 12,416 | 2.87 | 36,662 | 4.09 | 797 | 14.14 | ||||||||||||||||||||||||
Total | $ | 660,200 | 4.25 | % | $ | 148,379 | 4.04 | % | $ | 59,249 | 4.82 | % | $ | 15,164 | 4.93 | % | ||||||||||||||||
Commercial Loans | ||||||||||||||||||||||||||||||||
Commercial Real Estate | Construction and Development | Commercial and Industrial | Municipal Leases (1) | |||||||||||||||||||||||||||||
Amount | Weighted Average Rate | Amount | Weighted Average Rate | Amount | Weighted Average Rate | Amount | Weighted Average Rate | |||||||||||||||||||||||||
(Dollars in thousands) | ||||||||||||||||||||||||||||||||
Due During Years Ending June 30, | ||||||||||||||||||||||||||||||||
2015 | $ | 51,314 | 5.22 | % | $ | 25,562 | 4.94 | % | $ | 37,811 | 4.62 | % | $ | 1,254 | 5.97 | % | ||||||||||||||||
2016 | 22,574 | 5.36 | 4,942 | 4.64 | 4,614 | 4.54 | 1,534 | 6.95 | ||||||||||||||||||||||||
2017 | 34,302 | 4.96 | 5,955 | 4.61 | 5,280 | 4.89 | 2,227 | 7.42 | ||||||||||||||||||||||||
2018 and 2019 | 150,813 | 4.31 | 12,556 | 4.43 | 16,474 | 4.30 | 8,178 | 6.38 | ||||||||||||||||||||||||
2020 to 2023 | 81,675 | 4.40 | 4,941 | 3.97 | 5,443 | 4.14 | 14,895 | 7.06 | ||||||||||||||||||||||||
2024 to 2028 | 28,168 | 4.53 | 2,249 | 4.29 | 4,111 | 4.92 | 38,659 | 7.34 | ||||||||||||||||||||||||
2029 and following | 8,923 | 3.17 | 252 | 6.16 | 702 | 5.81 | 39,468 | 7.31 | ||||||||||||||||||||||||
Total | $ | 377,769 | 4.50 | % | $ | 56,457 | 4.68 | % | $ | 74,435 | 4.55 | % | $ | 106,215 | 7.19 | % | ||||||||||||||||
Total | ||||||||
Amount | Weighted Average Rate | |||||||
(Dollars in thousands) | ||||||||
Due During Years Ending June 30, | ||||||||
2015 | $ | 137,179 | 5.06 | % | ||||
2016 | 47,416 | 5.24 | ||||||
2017 | 64,137 | 5.09 | ||||||
2018 and 2019 | 243,770 | 4.49 | ||||||
2020 to 2023 | 279,817 | 4.43 | ||||||
2024 to 2028 | 234,980 | 4.78 | ||||||
2029 and following | 490,569 | 4.29 | ||||||
Total | $ | 1,497,868 | 4.56 | % | ||||
(1) | The weighted average rate of municipal loans is adjusted for a 34% federal tax rate since the interest income from these leases is tax exempt. |
11
The total amount of loans due after June 30, 2015, which have predetermined interest rates is $771.9 million, while the total amount of loans due after such dates which have adjustable interest rates is $588.2 million.
Lending Authority. Residential real estate loans up to $750,000 may be approved at varying levels by certain officers of HomeTrust Bank. Our Chief Credit Officer may approve loans up to $5.0 million. Loan relationships in excess of $5.0 million in total credit exposure must be approved by our Senior Loan Committee. Loans outside our general underwriting guidelines generally must be approved by the Chief Credit Officer, Chief Banking Officer, a Senior Credit Officer, or Mortgage Fulfilment Manager for residential loans. Certain other bank officers may approve loans outside of our general underwriting guidelines on a limited basis and generally at a lower amount. Lending authority is also granted to certain other bank officers at lower amounts, generally up to $500,000 in total credit exposure for real estate secured loan relationships, provided the loan does not have a Criticized or Classified risk grade.
Beginning in fiscal year 2008, we implemented continuously more stringent underwriting policies and procedures related to residential lending as the economy and housing market continued to deteriorate, which included an increased emphasis on a borrower's ongoing ability to repay a loan by requiring lower debt to income ratios, higher credit scores and lower loan to value ratios than our previous lending policies had required. As a result, the percentage of one-to four-family residential loans and home equity lines of credit made to borrowers with a credit score greater than 675 has increased from 78.6% during fiscal 2007 to 93.7% during fiscal 2014. This has also resulted in a reduced percentage of loans approved as compared to loan applications, from 83.9% during fiscal 2007 to 67.9% in fiscal 2014.
At June 30, 2014, the maximum amount under federal regulation that we could lend to any one borrower and the borrower's related entities was approximately $43.2 million. Our five largest lending relationships are with commercial borrowers and totaled approximately $48.6 million in the aggregate, or 3.2% of our $1.50 billion net loan portfolio at June 30, 2014. The largest lending relationship at June 30, 2014 consisted of approximately $19.9 million in twenty-six loans. The largest loan in this relationship had an outstanding balance of $2.9 million as of June 30, 2014 and was secured by a non-owner-occupied retail property located in Buncombe County. The remaining relationship exposure primarily consisted of various non-owner-occupied commercial real estate properties located throughout Buncombe County, and owner-occupied residential property located in Buncombe County, NC. At June 30, 2014 these loans were performing in accordance with their original repayment terms.
The second largest lending relationship at June 30, 2014 was approximately $11.7 million to a local borrower in East Tennessee consisting of three loans, the largest of which is a $4.4 million loan secured by a nursing home located in Sacramento, California. The remaining loans are secured by a nursing home and medical facility also located in California. As of June 30, 2014, all loans in the relationship were performing in accordance with their original repayment terms.
The third largest lending relationship at June 30, 2014 was approximately $6.6 million consisting of two leases, the largest of which was a $3.5 million lease secured by two fire substations, two fire trucks and affiliated machinery and equipment, land, and two squad trucks. The remaining lease is secured by three fire station buildings, a heavy rescue vehicle, two fire trucks, and affiliated machinery and equipment. All collateral is located in Chatham County, NC. As of June 30, 2014 these leases were performing in accordance with their original repayment terms.
The fourth largest lending relationship at June 30, 2014 was approximately $5.2 million consisting of eight loans. The largest loan in the relationship was a $2.2 million loan secured by three non-owner-occupied retail buildings and land. The remaining loans are secured by additional liens on the above mentioned collateral, an owner-occupied residence, a multi-unit retail center, and cash. All properties securing the loans are located in Buncombe County, NC. At June 30, 2014 these loans were performing in accordance with their original repayment terms.
The fifth largest lending relationship at June 30, 2014 was $5.1 million, consisting of four loans secured by several hotels in Morristown, TN. As of June 30, 2014 these loans were performing in accordance with its original repayment terms.
At June 30, 2014, we had 48 additional relationships that exceeded $2.0 million, for a total of $145.0 million.
12
Retail Consumer Loans
One-to Four-Family Real Estate Lending. We originate loans secured by first mortgages on one-to four-family residences typically for the purchase or refinance of owner-occupied primary or secondary residences located primarily in our market areas. We originate one-to four-family residential mortgage loans primarily through referrals from real estate agents, builders and from existing customers. Walk-in customers are also important sources of loan originations. At June 30, 2014, $660.2 million, or 44.1%, of our loan portfolio consisted of loans secured by one-to four-family residences.
We originate both fixed-rate loans and adjustable-rate loans. We generally originate mortgage loans in amounts up to 80% of the lesser of the appraised value or purchase price of a mortgaged property, but will also permit loan-to-value ratios of up to 95%. For loans exceeding an 80% loan-to-value ratio we generally require the borrower to obtain private mortgage insurance covering us for any loss on the amount of the loan in excess of 80% in the event of foreclosure.
The majority of our one-to four-family residential loans are originated with fixed rates and have terms of ten to 30 years. At June 30, 2014 our one-to four-family residential loan portfolio included $350.7 million in fixed rate loans, of which $82.4 million were ten year fixed rate loans. We generally originate fixed rate mortgage loans with terms greater than fifteen years for sale to various secondary market investors on a servicing released basis. We also originate adjustable-rate mortgage, or ARM, loans which have interest rates that adjust annually to the yield on U.S. Treasury securities adjusted to a constant one-year maturity plus a margin. Most of our ARM loans are hybrid loans, which after an initial fixed rate period of one, five or seven years will convert to an annual adjustable interest rate for the remaining term of the loan. Our ARM loans have terms up to 30 years. Our pricing strategy for mortgage loans includes setting interest rates that are competitive with other local financial institutions and consistent with our asset/liability management objectives. Our ARM loans generally have a floor interest rate set at the initial interest rate, and a cap of two percentage points on rate adjustments during any one year and six percentage points over the life of the loan. As a consequence of using caps, the interest rates on these loans may not be as rate sensitive as is our cost of funds.
We generally retain ARM loans that we originate in our loan portfolio rather than selling them in the secondary market. The retention of ARM loans in our loan portfolio helps us reduce our exposure to changes in interest rates. There are, however, unquantifiable credit risks resulting from the potential of increased interest to be paid by the customer as a result of increases in interest rates. It is possible that during periods of rising interest rates the risk of default on ARM loans may increase as a result of repricing and the increased costs to the borrower. We attempt to reduce the potential for delinquencies and defaults on ARM loans by qualifying the borrower based on the borrower's ability to repay the ARM loan assuming that the maximum interest rate that could be charged at the first adjustment period remains constant during the loan term. Another consideration is that although ARM loans allow us to increase the sensitivity of our asset base due to changes in the interest rates, the extent of this interest sensitivity is limited by the periodic and lifetime interest rate adjustment limits. Because of these considerations, we have no assurance that yield increases on ARM loans will be sufficient to offset increases in our cost of funds.
Most of our loans are written using generally accepted underwriting guidelines, and are readily saleable to Freddie Mac, Fannie Mae, or other private investors. Our real estate loans generally contain a "due on sale" clause allowing us to declare the unpaid principal balance due and payable upon the sale of the security property. The average size of our one-to four-family residential loans was $104,000 at June 30, 2014.
A portion of our loans are "non-conforming" because they do not satisfy credit or other requirements due to personal and financial reasons (i.e. divorce, bankruptcy, length of time employed, etc.), and other requirements, imposed by secondary market purchasers. Many of these borrowers have higher debt-to-income ratios, or the loans are secured by unique properties in rural markets for which there are no sales of comparable properties to support the value according to secondary market requirements. We may require additional collateral or lower loan-to-value ratios to reduce the risk of these loans. We believe that these loans satisfy a need in our local market areas. As a result, subject to market conditions, we intend to continue to originate these types of loans .
Property appraisals on real estate securing our one-to four-family loans in excess of $250,000 that are not originated for sale are made by a state-licensed or state-certified independent appraiser approved by the board of directors. Appraisals are performed in accordance with applicable regulations and policies. For loans that are less
13
than $250,000, we may use the tax assessed value, broker price opinions, and/or a property inspection in lieu of an appraisal. We generally require title insurance policies on all first mortgage real estate loans originated. Homeowners, liability, fire and, if required, flood insurance policies are also required for one-to four-family loans. We do not originate permanent one-to four- family mortgage loans with a negatively amortizing payment schedule, and currently do not offer interest-only mortgage loans. We have not typically originated stated income or low or no documentation one-to four- family loans. At June 30, 2014, $3.3 million of our one-to four-family loans were interest-only.
At June 30, 2014, $78.0 million of our one-to four-family loan portfolio consisted of loans secured by non-owner occupied residential properties. Loans secured by residential rental properties represent a unique credit risk to us and, as a result, we adhere to specific underwriting guidelines for such loans. Additionally, we have established specific loan portfolio concentration limits for loans secured by residential rental property to prevent excessive credit risk that could result from an elevated concentration of these loans. A primary risk factor in non-owner occupied residential real estate lending is the consistency of rental income of the property. Payments on loans secured by rental properties often depend on the successful operation and management of the properties, as well as, the ability of tenants to pay rent. As a result, repayment of such loans may be subject to adverse economic conditions and unemployment trends, and may be sensitive to changes in the supply and demand for such properties. We consider and review a rental income cash flow analysis of the borrower and consider the net operating income of the property, the borrower's expertise, credit history and profitability, and the value of the underlying property. We generally require collateral on these loans to be a first mortgage along with an assignment of rents and leases. We periodically monitor the performance and cash flow sufficiency of certain residential rental property borrowers based on a number of factors such as loan performance, loan size, total borrower credit exposure, and risk grade.
Home Equity Lines of Credit. Our home equity loans, consisting of adjustable-rate lines of credit, have been the second largest component of our retail loan portfolio over the past several years. At June 30, 2014, home equity lines of credit totaled $148.4 million or 9.9% of our loan portfolio of which $40.5 million was secured by a first lien on owner-occupied residential property. The lines of credit may be originated in amounts, together with the amount of the existing first mortgage, typically up to 85% of the value of the property securing the loan (less any prior mortgage loans). Home equity lines of credit are originated with an adjustable-rate of interest, based on The Wall Street Journal prime rate plus a margin. Currently, our home equity line of credit floor interest rate is dependent on the overall loan to value, and has a cap of 18% above the floor rate over the life of the loan. Home equity lines of credit generally have up to a fifteen-year draw period and amounts may be reborrowed after payment at any time during the draw period. Once the draw period has lapsed, the payment is amortized over a fifteen year period based on the loan balance at that time. At June 30, 2014, unfunded commitments on these lines of credit totaled $138.4 million.
Our underwriting standards for home equity lines of credit are similar to our one-to four-family loan underwriting standards and include a determination of the applicant's credit history and an assessment of the applicant's ability to meet existing obligations and payments on the proposed loan. The stability of the applicant's monthly income may be determined by verification of gross monthly income from primary employment, and additionally from any verifiable secondary income.
Home equity lines of credit generally entail greater risk than do one-to four-family residential mortgage loans where we are in the first lien position. For those home equity lines secured by a second mortgage, it is unlikely that we will be successful in recovering all or a portion of our loan proceeds in the event of default unless we are prepared to repay the first mortgage loan and such repayment and the costs associated with a foreclosure are justified by the value of the property.
Construction and Land/Lots. We have been an active originator of construction to permanent loans to homeowners building a residence. In addition, we originate land/lot loans predominately for the purchase or refinance of an improved lot for the construction of a residence to be occupied by the borrower. All of our construction and land/lot loans were made on properties located within our market area.
At June 30, 2014, our construction and land/lot loan portfolio was $59.2 million compared to $51.5 million at June 30, 2013 and $53.6 million at June 30, 2012. At June 30, 2014, unfunded loan commitments totaled $25.2 million, compared to $24.7 million at June 30, 2013. Construction-to-permanent loans are made for the construction of a one-to four-family property which is intended to be occupied by the borrower as either a primary or secondary
14
residence. Construction-to-permanent loans are originated to the homeowner rather than the homebuilder and are structured to be converted to a first lien fixed or adjustable rate permanent loan at the completion of the construction phase. We do not originate construction phase only or junior lien construction-to-permanent loans. The permanent loan is generally underwritten to the same standards as our one-to four-family residential loans and may be held by us for portfolio investment or sold in the secondary market. At June 30, 2014 our construction-to-permanent loans totaled $30.4 million and the average loan size was $155,000. During the construction phase, which typically lasts for six to twelve months, we make periodic inspections of the construction site and loan proceeds are disbursed directly to the contractors or borrowers as construction progresses. Typically, disbursements are made in monthly draws during the construction period. Loan proceeds are disbursed based on a percentage of completion. Construction-to-permanent loans require payment of interest only during the construction phase. Prior to making a commitment to fund a construction loan, we require an appraisal of the property by an independent appraiser. Construction loans may be originated up to 95% of the cost or of the appraised value upon completion, whichever is less; however, we generally do not originate construction loans which exceed the lower of 80% loan to cost or appraised value without securing adequate private mortgage insurance or other form of credit enhancement such as the Federal Housing Administration or other governmental guarantee. We also require general liability, builder's risk hazard insurance, title insurance, and flood insurance (as applicable, for properties located or to be built in a designated flood hazard area) on all construction loans. Subject to market conditions, we expect this type of lending to continue and grow as the economy improves. At June 30, 2014, the largest construction to permanent loan had an outstanding balance of $690,000 and was performing according to the original repayment terms.
Included in our construction and land/lot loan portfolio are land/lot loans, which are typically loans secured by developed lots in residential subdivisions located in our market areas. We originate these loans to individuals intending to construct their primary or secondary residence on the lot within one year from the date of origination. This portfolio may also include loans for the purchase or refinance of unimproved land that is generally less than or equal to five acres, and for which the purpose is to commence the improvement of the land and construction of an owner-occupied primary or secondary residence within one year from the date of loan origination. We do not currently originate interest-only land loans or loans for the speculative purchase or investment in land or lots.
Land/lot loans are typically originated in an amount up to 70% of the lower of the purchase price or appraisal, are secured by a first lien on the property, for up to a 20 year term, require payments of interest only and are structured with an adjustable rate of interest on terms similar to our one-to four-family residential mortgage loans. At June 30, 2014, our land/lot loans totaled $29.2 million and the average land/lot loan size was $63,000. At June 30, 2014, the largest land/lot loan had an outstanding balance of $837,000 and was performing according to the original repayment terms.
Construction and land/lot lending affords us the opportunity to achieve higher interest rates and fees with shorter terms to maturity than the rates and fees generated by our one-to four-family permanent mortgage lending. Construction/permanent loans, however, generally involve a higher degree of risk than our one-to four-family permanent mortgage lending. If our appraisal of the value of the completed residence proves to be overstated, we may have inadequate security for the repayment of the loan upon completion of construction and may incur a loss. Land/lot loans also pose additional risk because of the lack of income being produced by the property and the potential illiquid nature of the collateral. These risks can also be significantly impacted by supply and demand conditions.
Consumer Lending. Our consumer loans consist principally of automobile loans; however, we also originate loans secured by savings deposits and other consumer loans. At June 30, 2014, our consumer loans totaled $15.2 million, or 1.0% of our loan portfolio. We originate our consumer loans primarily in our market areas.
During the middle of fiscal year 2014, we added an indirect auto finance line of business, working with 19 select auto dealerships in western North Carolina and upstate South Carolina. The dealers are compensated via an industry standard commission, known as dealer reserve, on marked-up interest rates or from flat rate commission amounts. Our auto finance sales team uses purchased industry data to provide quantitative analysis of dealer sales history to target strong dealerships as the starting point of building long lasting, successful relationships. Local, quick decisions, broad hour coverage, personalized customer service, and prompt contract funding are keys to our success in this competitive line of business. Additionally, our process has been designed to integrate with existing dealership practices, utilize an industry leading decision engine, and leverage consumer credit data which provides our internal underwriters with the tools needed to respond quickly to loans meeting our credit policy criteria.
15
Consumer loans generally have shorter terms to maturity, which reduces our exposure to changes in interest rates. In addition, management believes that offering consumer loan products helps to expand and create stronger ties to our existing customer base by increasing the number of customer relationships and providing cross-marketing opportunities.
Our underwriting standards for consumer loans include a determination of the applicant's credit history and an assessment of the applicant's ability to meet existing obligations and payments on the proposed loan. The stability of the applicant's monthly income may be determined by verification of gross monthly income from primary employment, and additionally from any verifiable secondary income.
Consumer loans generally entail greater risk than do one- to four-family residential mortgage loans, particularly in the case of consumer loans that are unsecured or secured by rapidly depreciable assets, such as automobiles. In these cases, any repossessed collateral for a defaulted loan may not provide an adequate source of repayment of the outstanding loan balance. As a result, consumer loan collections are dependent on the borrower's continuing financial stability and thus are more likely to be adversely affected by job loss, divorce, illness or personal bankruptcy.
Commercial Loans
Commercial Real Estate Lending. We originate commercial real estate loans, including loans secured by hotels, office space, office/warehouse, retail strip centers, vehicle dealerships, mini-storage facilities, medical and professional buildings, retail sites and churches located in our market areas. As of June 30, 2014, $377.8 million or 25.2% of our total loan portfolio was secured by commercial real estate property, including multifamily loans totaling $36.4 million, or 2.4% of our total loan portfolio. Of that amount, $166.3 million was identified as owner occupied commercial real estate, and the remainder of $211.5 million was secured by income producing, or non-owner-occupied commercial real estate. Commercial real estate loans generally are priced at a higher rate of interest than one- to four-family residential loans. Typically, these loans have higher loan balances, are more difficult to evaluate and monitor, and involve a greater degree of risk than one- to four-family residential loans. Often payments on loans secured by commercial or multi-family properties are dependent on the successful operation and management of the property; therefore, repayment of these loans may be affected by adverse conditions in the real estate market or the economy. We generally require and obtain loan guarantees from financially capable parties based upon the review of personal financial statements. If the borrower is a corporation, we generally require and obtain personal guarantees from the corporate principals based upon a review of their personal financial statements and individual credit reports.
The average outstanding loan size in our commercial real estate portfolio was $328,000 as of June 30, 2014. Given the Bank's recent acquisition and expansion into mid-metro markets, the Bank's commercial focus will be to develop and foster strong banking relationships with small to mid-size clients within our local market area. At June 30, 2014, the largest commercial real estate loan in our portfolio was to a local borrower in East Tennessee for $4.4 million, secured by a renovated nursing home located in Sacramento, California. Our largest multi-family loan as of June 30, 2014 was a brick townhouse complex on approximately 11 acres in Morristown, Tennessee with an outstanding balance of $4.5 million. Both of these loans were performing according to their original repayment terms as of June 30, 2014.
We offer both fixed and adjustable rate commercial real estate loans. Our commercial real estate mortgage loans generally include a balloon maturity of five years or less. Amortization terms are generally limited to 20 years. Adjustable rate based loans typically include a floor and ceiling interest rate and are indexed to The Wall Street
16
Journal prime rate, plus or minus an interest rate margin and rates generally adjust daily. The maximum loan to value ratio for commercial real estate loans is generally up to 80% on purchases and refinances. We require appraisals of all non-owner occupied commercial real estate securing loans in excess of $250,000, and all owner-occupied commercial real estate securing loans in excess of $500,000, performed by independent appraisers. For loans less than these amounts, we may use the tax assessed value, broker price opinions, and/or a property inspection in lieu of an appraisal.
If we foreclose on a commercial real estate loan, our holding period for the collateral typically is longer than for one- to four-family residential mortgage loans because there are fewer potential purchasers of the collateral. Further, our commercial real estate loans generally have relatively large balances to single borrowers or related groups of borrowers. Accordingly, if we make any errors in judgment in the collectability of our commercial real estate loans, any resulting charge-offs may be larger on a per loan basis than those incurred with our retail loan portfolios.
Construction and Development Lending. For many years, we had been an active originator of commercial real estate construction loans in our market areas to builders; however, as housing markets weakened in recent years we significantly reduced our origination of new construction and development loans. Our construction and development loans are predominately for the purchase or refinance of unimproved land held for future residential development, improved residential lots held for speculative investment purposes and for the future construction of speculative one-to-four-family or commercial real estate. We also originate construction loans for the development of business properties and multi-family dwellings.
Over the past five years, we have worked diligently to manage and reduce our exposure to construction and development loans. Through the BankGreenville and Jefferson mergers, we acquired $31.6 million in construction and development loans, which increased this portfolio to $56.5 million at June 30, 2014 compared to $24.0 million at June 30, 2013. At June 30, 2014, $11.1 million or 19.7% of our construction and development loans required interest-only payments. Unfunded commitments at June 30, 2014 totaled $1.9 million compared to $2.3 million at June 30, 2013 and $1.4 million at June 30, 2012. We have reduced the origination of new speculative construction and development loans related to residential properties to select borrowers with whom we have long-standing lending relationships. Currently, only the board of directors and certain senior officers are authorized to approve speculative one-to-four-family construction loans or loans for the development of land into residential lots.
Since fiscal 2009 we have not originated a significant amount of builder construction loans to fund the speculative construction of one- to four-family residential properties. These homes typically have an average price ranging from $200,000 to $500,000. Speculative construction loans are made to home builders and are termed "speculative" because the home builder does not have, at the time of loan origination, a signed contract with a home buyer who has a commitment for permanent financing with either us or another lender for the finished home. The home buyer may be identified either during or after the construction period, with the risk that the builder will have to fund the debt service on the speculative construction loan and finance real estate taxes and other carrying costs of the completed home for a significant period of time after the completion of construction, until a home buyer is identified. Loans to finance the construction of speculative single-family homes and subdivisions were generally offered to experienced builders in our primary market areas. All builders are qualified using the same standards as other commercial loan credits, requiring minimum debt service coverage ratios and established cash reserves to carry projects through construction completion and sale of the project. These loans require payment of interest-only during the construction phase. At June 30, 2014, loans for the speculative construction of single family properties totaled $5.1 million compared to $4.8 million at June 30, 2013 and $15.9 million at June 30, 2012. At June 30, 2014, we had one borrower with an aggregate outstanding loan balance of $1.5 million and secured by properties located in our market areas. At June 30, 2014, four speculative construction loans totaling $1.2 million were on non-accrual status.
Land acquisition and development loans are included in the construction and development loan portfolio, and represent loans made to developers for the purpose of acquiring raw land and/or for the subsequent development and sale of residential lots. Such loans typically finance land purchase and infrastructure development of properties (i.e. roads, utilities, etc.) with the aim of making improved lots ready for subsequent sale to consumers or builders for ultimate construction of residential units. The primary source of repayment is generally the cash flow from developer sale of lots or improved parcels of land, secondary sources and personal guarantees, which may provide an additional measure of security for such loans. Strong demand for housing led to loan growth in this category in
17
recent years. However, the recent downturn in real estate has slowed lot and home sales within our market areas. This has impacted certain developers by lengthening the marketing period of their projects and negatively affecting borrower's liquidity and collateral values.
Land acquisition and development loans are generally secured by property in our primary market areas. In addition, these loans are secured by a first lien on the property, are generally limited up to 65% of the lower of the acquisition price or the appraised value of the land and generally have a maximum amortization term of 10 years with a balloon maturity of up to three years. We require title insurance and, if applicable, a hazardous waste survey reporting that the land is free of hazardous or toxic waste. At June 30, 2014, our land acquisition and development loans in our commercial construction and development portfolio totaled $39.5 million. The largest land acquisition and development loan had an outstanding balance at June 30, 2014 of $3.5 million and was performing according to its repayment terms. The subject loan is secured by property located in Morristown, TN. At June 30, 2014, 33 land acquisition and development loans totaling $5.1 million were on non-accrual status.
We have made construction loans for commercial development projects. These projects include multi-family, apartment, retail, office/warehouse and office buildings. We generally do not originate commercial real estate construction loans without a satisfactory permanent financing ("take-out") commitment or non-contingent arm's length purchase contract from a reputable lender or qualified purchaser. Commercial construction and construction to permanent loans are offered on an adjustable interest rate or fixed interest rate basis. Adjustable interest rate based loans typically include a floor and ceiling interest rate and are indexed to The Wall Street Journal prime rate, plus or minus an interest rate margin. The initial construction period is generally limited to twelve months from the date of origination, and amortization terms are generally limited to 20 years; however, amortization terms of up to 25 years may be available for certain property types based on elevated underwriting and qualification criteria. Construction to permanent loans generally include a balloon maturity of five years or less; however, balloon maturities of greater than five years are allowed on a limited basis depending on factors such as property type, amortization term, lease terms, pricing, or the availability of credit enhancements. Construction loan proceeds are disbursed commensurate with the percentage of completion of work in place, as documented by periodic internal or third party inspections. The maximum loan-to-value limit applicable to these loans is generally 80% of the appraised post-construction value. Disbursement of funds is at our sole discretion and is based on the progress of construction. At June 30, 2014 we had $14.9 million of non-residential construction loans included in our commercial construction and development loan portfolio.
We require all real estate securing construction and development loans to be appraised by an independent HomeTrust Bank-approved state-licensed or state-certified real estate appraiser. General liability, builder's risk hazard insurance, title insurance, and flood insurance (as applicable, for properties located or to be built in a designated flood hazard area) are also required on all construction and development loans.
Construction and development lending affords us the opportunity to achieve higher interest rates and fees with shorter terms to maturity than the rates and fees generated by its single-family permanent mortgage lending. Construction lending, however, generally involves a higher degree of risk than single-family permanent mortgage lending because of the inherent difficulty in estimating both a property's value at completion of the project and the estimated cost of the project, as well as the time needed to sell the property at completion. The nature of these loans is such that they are generally more difficult to evaluate and monitor. Because of the uncertainties inherent in estimating construction costs, as well as, the market value of the completed project and the effects of governmental regulation of real property, it is relatively difficult to evaluate accurately the total funds required to complete a project and the related loan-to-value ratio. This type of lending also typically involves higher loan principal amounts and is often concentrated with a small number of builders. Land acquisition and development loans also pose additional risk because of the lack of income being produced by the property and the potential illiquid nature of the collateral. These risks can be significantly impacted by the supply and demand conditions. As a result, construction loans often involve the disbursement of substantial funds with repayment dependent, in part, on the success of the ultimate project and the ability of the borrower to sell or lease the property or refinance the indebtedness, rather than the ability of the borrower or guarantor to repay principal and interest. If our appraisal of the value of the completed project proves to be overstated, we may have inadequate security for the repayment of the loan upon completion of construction of the project and may incur a loss.
Commercial and Industrial Loans. We typically offer commercial and industrial loans to small businesses located in our primary market areas. These loans are primarily originated as conventional loans to business
18
borrowers, which include lines of credit, term loans and letters of credit. These loans are typically secured by collateral and are used for general business purposes, including working capital financing, equipment financing, capital investment and general investments. Loan terms vary from typically one to five years. The interest rates on such loans are either fixed rate or adjustable rate indexed to The Wall Street Journal prime rate plus a margin. Inherent with our extension of business credit is the business deposit relationship which frequently includes multiple accounts and related services from which we realize low cost deposits plus service and ancillary fee income.
Commercial and industrial loans typically have shorter maturity terms and higher interest rates than real estate loans, but generally involve more credit risk because of the type and nature of the collateral. We are focusing our efforts on small- to medium-sized, privately-held companies with local or regional businesses that operate in our market areas. At June 30, 2014, commercial and industrial loans totaled $74.4 million, which represented 5.0% of our total loan portfolio. We acquired $59.2 million in commercial and industrial loans from the Jefferson merger. Our commercial business lending policy includes credit file documentation and analysis of the borrower's background, capacity to repay the loan, the adequacy of the borrower's capital and collateral, as well as an evaluation of other conditions affecting the borrower. Analysis of the borrower's past, present and future cash flows is also an important aspect of our credit analysis. We generally obtain personal guarantees on our commercial business loans.
Repayment of our commercial and industrial loans is often dependent on the cash flows of the borrower, which may be unpredictable, and the collateral securing these loans may fluctuate in value. Our commercial business loans are originated primarily based on the identified cash flow of the borrower and secondarily on the underlying collateral provided by the borrower. Most often, this collateral consists of equipment, inventory or accounts receivable. Credit support provided by the borrower for most of these loans and the probability of repayment is based on the liquidation of the pledged collateral and enforcement of a personal guarantee, if any. As a result, in the case of loans secured by accounts receivable, the availability of funds for the repayment of these loans may be substantially dependent on the ability of the borrower to collect amounts due from its customers. The collateral securing other loans may depreciate over time, may be difficult to appraise and may fluctuate in value based on the success of the business.
Municipal Leases. We offer ground and equipment lease financing to fire departments located primarily throughout North Carolina and, to a lesser extent, South Carolina. Municipal leases are secured primarily by a ground lease in our name with a sublease to the borrower for a firehouse or an equipment lease for fire trucks and firefighting equipment. We originate these loans primarily through a third party that assigns the lease to us after we fund the loan. All leases are underwritten directly by us prior to funding. These leases are at a fixed rate of interest and may have a term to maturity of up to 20 years.
At June 30, 2014, municipal leases totaled $106.2 million, which represented 7.1% of our total loan portfolio. At that date, $56.3 million, or 54.3% of our municipal leases were secured by fire trucks, $17.4 million, or 16.8%, were secured by firehouses, $25.3 million or 24.3%, were secured by both, with the remaining $4.8 million or 4.6% secured by miscellaneous firefighting equipment. At June 30, 2014, the average outstanding municipal lease size was $322,000. These loans are our highest yielding loans since the interest earned is tax-exempt, and this portfolio has the lowest delinquency rate of any of our loan types.
Repayment of our municipal leases is often dependent on the tax revenues collected by the county/municipality on behalf of the fire department. Although a municipal lease does not constitute a general obligation of the county/municipality for which the county/municipality's taxing power is pledged, a municipal lease is ordinarily backed by the county/municipality's covenant to budget for, appropriate and pay the tax revenues to the fire department. However, certain municipal leases contain "non-appropriation" clauses which provide that the municipality has no obligation to make lease or installment purchase payments in future years unless money is appropriated for such purpose on a yearly basis. In the case of a "non-appropriation" lease, our ability to recover under the lease in the event of non-appropriation or default will be limited solely to the repossession of the leased property, without recourse to the general credit of the lessee, and disposition or releasing of the property might prove difficult. At June 30, 2014, $3.0 million of our municipal leases contained a non-appropriation clause.
19
Loan Originations, Purchases, Sales, Repayments and Servicing
We originate both fixed-rate and adjustable-rate loans. Our ability to originate loans, however, is dependent upon customer demand for loans in our market area. Demand is affected by competition and the interest rate environment. During the past few years, we, like many other financial institutions, have experienced significant prepayments on loans due to the low interest rate environment prevailing in the United States. In periods of economic uncertainty, the ability of financial institutions, including us, to originate large dollar volumes of real estate loans may be substantially reduced or restricted, with a resultant decrease in interest income. We do not generally purchase loans or loan participations except for leases. We actively sell the majority of our long-term fixed-rate residential first mortgage loans to the secondary market at the time of origination and retain our adjustable rate residential mortgages and fixed rate mortgages with terms to maturity less than 15 years and other consumer and commercial loans. During the years ended June 30, 2014 and 2013 we sold $73.5 million and $227.1 million, respectively, in whole loans to the secondary market. We release the servicing on the loans we sell into the secondary market. Loans are generally sold on a non-recourse basis.
In addition to interest earned on loans and loan origination fees, we receive fees for loan commitments, late payments and other miscellaneous services. The fees vary from time to time, generally depending on the supply of funds and other competitive conditions in the market.
20
The following table shows our loan origination, purchase, sale and repayment activities for the periods indicated.
Years Ended June 30, | ||||||||||||
2014 | 2013 | 2012 | ||||||||||
(In thousands) | ||||||||||||
Originations by type: | ||||||||||||
Retail consumer: | ||||||||||||
One- to four-family | $ | 141,743 | $ | 347,925 | $ | 330,106 | ||||||
Home equity | 30,030 | 13,716 | 17,782 | |||||||||
Construction and land/lots | 49,455 | 35,907 | 33,668 | |||||||||
Consumer | 12,892 | 2,123 | 2,963 | |||||||||
Commercial loans: | ||||||||||||
Commercial real estate | 35,773 | 28,649 | 16,008 | |||||||||
Construction and development | 13,389 | 3,971 | 1,636 | |||||||||
Commercial and industrial | 18,960 | 4,013 | 2,993 | |||||||||
Total loans originated | $ | 302,242 | $ | 436,304 | $ | 405,156 | ||||||
Purchases: | ||||||||||||
Commercial loans: | ||||||||||||
Commercial real estate | $ | 330 | $ | 205 | $ | 580 | ||||||
Municipal leases | 15,814 | 23,540 | 16,428 | |||||||||
Loans acquired through business combination | 377,093 | - | - | |||||||||
Total loans purchased or acquired | $ | 393,237 | $ | 23,745 | $ | 17,008 | ||||||
Sales and repayments: | ||||||||||||
Retail consumer: One- to four-family sales | $ | 4,095 | $ | 227,117 | $ | 192,383 | ||||||
Home equity | 117 | 141 | 95 | |||||||||
Construction and land/lots | 219 | - | - | |||||||||
Consumer | 27 | - | - | |||||||||
Commercial loans: Commercial real estate | 427 | 827 | 534 | |||||||||
Construction and development | 213 | 500 | 6,273 | |||||||||
Total sales | 5,098 | 228,585 | 199,285 | |||||||||
Principal repayments | 366,276 | 297,033 | 315,423 | |||||||||
Total reductions | $ | 371,374 | $ | 525,618 | $ | 514,708 | ||||||
Net increase (decrease) | $ | 324,105 | $ | (65,569 | ) | $ | (92,544 | ) | ||||
Asset Quality
Loan Delinquencies and Collection Procedure. When a borrower fails to make a required payment on a residential real estate loan, we attempt to cure the delinquency by contacting the borrower. A late notice is sent 15 days after the due date, and the borrower may also be contacted by phone at this time. If the delinquency continues, subsequent efforts are made to contact the delinquent borrower and additional collection notices and letters are sent. When a loan is 90 days delinquent, we may commence repossession or a foreclosure action. Reasonable attempts are made to collect from borrowers prior to referral to an attorney for collection. In certain instances, we may modify the loan or grant a limited moratorium on loan payments to enable the borrower to reorganize their financial affairs, and we attempt to work with the borrower to establish a repayment schedule to cure the delinquency.
Delinquent consumer loans are handled in a similar manner, except that late notices are sent at 30 days after the due date. Our procedures for repossession and sale of consumer collateral are subject to various requirements
21
under the applicable consumer protection laws, as well as, other applicable laws and the determination by us that it would be beneficial from a cost basis.
Delinquent commercial loans are initially handled by the loan officer in charge of the loan, who is responsible for contacting the borrower. The collections department also works with the commercial loan officers to see that the necessary steps are taken to collect delinquent loans, while ensuring that standard delinquency notices and letters are mailed to the borrower. No later than 90 days past the due date, a collection officer takes over the loan for further collection activities. In addition, we have a management loan committee that meets as needed and reviews past due and classified commercial real estate loans, as well as, other loans that management believes may present possible collection problems. If an acceptable workout of a delinquent commercial loan cannot be reached, we generally initiate foreclosure or repossession proceedings on any collateral securing the loan.
The following table sets forth our loan delinquencies by type, by amount and by percentage of type at June 30, 2014.
Loans Delinquent For: | ||||||||||||||||||||||||||||||||||||
Total Loans Delinquent | ||||||||||||||||||||||||||||||||||||
30-89 Days | 90 Days and Over | 30 Days or More | ||||||||||||||||||||||||||||||||||
Percent of | Percent of | Percent of | ||||||||||||||||||||||||||||||||||
Loan | Loan | Loan | ||||||||||||||||||||||||||||||||||
Number | Amount | Category | Number | Amount | Category | Number | Amount | Category | ||||||||||||||||||||||||||||
(Dollars in thousands) | ||||||||||||||||||||||||||||||||||||
Retail consumer loans: | ||||||||||||||||||||||||||||||||||||
One-to four-family | 62 | $ | 4,929 | 0.75 | % | 64 | $ | 8,208 | 1.24 | % | 126 | $ | 13,137 | 1.99 | % | |||||||||||||||||||||
Home equity | 9 | 400 | 0.27 | % | 24 | 939 | 0.63 | % | 33 | 1,339 | 0.90 | % | ||||||||||||||||||||||||
Construction and land/lots | 6 | 508 | 0.86 | % | 5 | 122 | 0.20 | % | 11 | 630 | 1.06 | % | ||||||||||||||||||||||||
Consumer | 8 | 34 | 0.18 | % | 14 | 16 | 0.15 | % | 22 | 50 | 0.33 | % | ||||||||||||||||||||||||
Commercial loans: | ||||||||||||||||||||||||||||||||||||
Commercial real estate | 2 | 306 | 0.08 | % | 19 | 6,729 | 1.78 | % | 21 | 7,035 | 1.86 | % | ||||||||||||||||||||||||
Construction and development | 5 | 1,165 | 2.06 | % | 14 | 3,789 | 6.71 | % | 19 | 4,954 | 8.77 | % | ||||||||||||||||||||||||
Commercial and industrial | 4 | 183 | 0.25 | % | 14 | 576 | 0.77 | % | 18 | 759 | 1.02 | % | ||||||||||||||||||||||||
Municipal leases | 0 | - | - | % | 0 | - | - | % | 0 | - | - | % | ||||||||||||||||||||||||
Total | 96 | $ | 7,525 | 0.50 | % | 154 | $ | 20,379 | 1.36 | % | 250 | $ | 27,904 | 1.86 | % | |||||||||||||||||||||
Non-performing Assets. Non-performing assets were $62.7 million, or 3.02%, of total assets at June 30, 2014, compared to $80.3 million, or 5.07%, and $80.3 million, or 4.67%, of total assets at June 30, 2013 and 2012, respectively. Slow sales and excess inventory in most housing markets, along with declines in property values, have been the primary cause of the elevated levels of delinquencies and foreclosures in recent years, particularly for construction and development loans, which, including related real estate owned and other foreclosed assets ("REO"), represented $15.7 million, or 25.1% of our non-performing assets at June 30, 2014. At June 30, 2014, $23.9 million, or 50.9%, of total non-accruing loans were current on their loan payments.
Although economic conditions have improved since the recent recession resulting in a material decrease in our provision for loan losses in recent periods, the pace of recovery has been modest and uneven and ongoing stress in the economy, reflected in high unemployment, tepid consumer spending, modest loan demand and very low interest rates, will likely continue to create a challenging operating environment going forward. Nonetheless, over the past year we have significantly improved our risk profile by aggressively managing and reducing our problem assets, and our total construction and development loans outstanding have declined substantially. We continue to believe our level of non-performing assets is manageable, and we believe that we have sufficient capital and human resources to manage the collection of our one- to four-family residential construction and related land and land development loans and other non-performing assets in an orderly fashion. However, our operating results will continue to be adversely impacted until we are able to significantly reduce the level of our non-performing assets.
Loans are placed on nonaccrual status when the collection of principal and/or interest becomes doubtful or other factors involving the loan warrant placing the loan on nonaccrual status. Troubled debt restructurings are loans which have renegotiated loan terms to assist borrowers who are unable to meet the original terms of their loans. Such modifications to loan terms may include a lower interest rate, a reduction in principal, or a longer term to maturity. During the fiscal year ended June 30, 2014, 37 loans for $3.3 million were modified from their original
22
terms and were identified in our asset quality reports as a troubled debt restructuring. This compares to 149 loans for $11.7 million that were modified in the fiscal year ended June 30, 2013. As of June 30, 2014, the outstanding balance of troubled debt restructured loans was $37.8 million, comprised of 296 loans as compared to $44.1 million comprised of 341 loans at June 30, 2013. Although economic conditions have improved since the recent recession resulting in a material decrease in our provision for loan losses in recent periods, the pace of recovery has been modest and uneven and ongoing stress in the economy, reflected in high unemployment, tepid consumer spending, modest loan demand and very low interest rates, will likely continue to create a challenging operating environment going forward.
Once a non-accruing troubled debt restructuring has performed according to its modified terms for six months and the collection of principal and interest under the revised terms is deemed probable, the troubled debt restructuring is removed from nonaccrual status. At June 30, 2014, $15.5 million of troubled debt restructurings were classified as nonaccrual, including $3.7 million of construction and development loans. As of June 30, 2014, $22.2 million or 58.7% of the restructured loans have a current payment status as compared to $14.0 million or 31.7% at June 30, 2013. Performing troubled debt restructurings increased $8.2 million, or 58.6%, from June 30, 2013 to June 30, 2014. The table below sets forth the amounts and categories of non-performing assets.
At June 30, | ||||||||||||||||||||
2014 | 2013 | 2012 | 2011 | 2010 | ||||||||||||||||
(In thousands) | ||||||||||||||||||||
Non-accruing loans: Retail consumer loans: | ||||||||||||||||||||
One-to four-family | $ | 17,967 | $ | 29,811 | $ | 27,659 | $ | 17,821 | $ | 9,076 | ||||||||||
Home equity | 3,114 | 3,793 | 4,781 | 2,536 | 4,059 | |||||||||||||||
Construction and land/lots | 688 | 2,172 | 3,437 | 2,766 | 2,549 | |||||||||||||||
Consumer | 27 | 42 | 76 | 23 | 28 | |||||||||||||||
Commercial loans: | ||||||||||||||||||||
Commercial real estate | 16,941 | 21,149 | 15,008 | 8,197 | 12,097 | |||||||||||||||
Construction and development | 6,270 | 10,172 | 12,583 | 16,620 | 18,005 | |||||||||||||||
Commercial and industrial | 2,004 | 1,422 | 637 | 40 | - | |||||||||||||||
Municipal leases | - | - | - | 474 | 486 | |||||||||||||||
Total non-accruing loans | 47,011 | 68,561 | 64,181 | 48,477 | 46,300 | |||||||||||||||
REO assets: | ||||||||||||||||||||
Retail consumer loans: | ||||||||||||||||||||
One-to four-family | 3,876 | 4,276 | 7,297 | 4,299 | 6,764 | |||||||||||||||
Home equity | 627 | 642 | - | 32 | 268 | |||||||||||||||
Construction and land/lots | 1,613 | 1,861 | 1,616 | 1,326 | 416 | |||||||||||||||
Consumer | - | - | - | - | - | |||||||||||||||
Commercial loans: | ||||||||||||||||||||
Commercial real estate | 4,884 | 2,016 | 2,449 | 2,023 | 4,095 | |||||||||||||||
Construction and development | 4,725 | 2,943 | 4,768 | 6,177 | 5,744 | |||||||||||||||
Commercial and industrial | - | - | - | - | - | |||||||||||||||
Municipal leases | - | - | - | - | - | |||||||||||||||
Total foreclosed assets | 15,725 | 11,738 | 16,130 | 13,857 | 17,287 | |||||||||||||||
Total non-performing assets | $ | 62,736 | $ | 80,299 | $ | 80,311 | $ | 62,334 | $ | 63,587 | ||||||||||
Total non-performing assets as a percentage of total assets | 3.02 | % | 5.07 | % | 4.67 | % | 3.81 | % | 3.87 | % | ||||||||||
Performing Troubled Debt Restructurings | $ | 22,179 | $ | 14,012 | $ | 20,588 | $ | 49,379 | $ | 28,655 | ||||||||||
For the years ended June 30, 2014 and 2013, gross interest income which would have been recorded had the non-accruing loans been current in accordance with their original terms amounted to $3.2 million and $3.6 million, respectively. The amount that was included in interest income on such loans was $8.2 million and $6.4 million, respectively. The amount included in interest income during fiscal years 2014 and 2013 exceeds the amount of foregone interest in fiscal year 2014 and 2013 due to interest payments received in fiscal year 2014 and 2013 that related to prior periods. At June 30, 2014, $50.4 million in non-accruing loans were individually evaluated for impairment; $1.1 million of the allowance for loan losses was allocated to these individually impaired loans at
23
period-end. A loan is impaired when it is probable, based on current information and events, that we will be unable to collect all contractual principal and interest payments due in accordance with the terms of the loan agreements. Troubled debt restructurings are also considered impaired. Impaired loans are measured on an individual basis for individually significant loans based on the present value of expected future cash flows discounted at the loan's effective interest rate or, as a practical expedient, at the loan's observable market price or the fair value of the collateral if the loan is collateral dependent. The amount of impairment, if any, and any subsequent changes are included in the allowance for loan losses.
We record REO (acquired through a lending relationship) at fair value less cost to sell on a non-recurring basis. All REO properties are recorded at amounts which are equal to the lower of the related loan balance or the fair value of the properties based on independent appraisals (reduced by estimated selling costs) upon transfer of the loans to REO. From time to time, non-recurring fair value adjustments to REO are recorded to reflect partial write-downs based on an observable market price or current appraised value of property. The individual carrying values of these assets are reviewed for impairment at least annually and any additional impairment charges are expensed to operations. For the years ended June 30, 2014 and 2013, we recognized $581,000 and $1.2 million, respectively, of impairment charges related to these types of assets.
Within our non-accruing loans, as of June 30, 2014 we had a total of 7 nonaccrual lending relationships, each with aggregate loan exposures in excess of $1.0 million that collectively comprised $8.5 million, or 18.00% of our total non-accruing loans. The single largest relationship was $1.4 million at that date. Our non-accruing loan exposures in excess of $1.0 million are included in the following table (dollars in thousands):
Amount | Percent of Total Non-Accruing Loans | Collateral Securing the Indebtedness | Geographic Location | |||||
| $ | 1,372 | 2.92 | % | 1 st Lien on 1-4 Family Residential Real Estate | Buncombe County, NC | |||
| 1,368 | 2.91 | 1 st Lien on 1-4 Family Residential Real Estate | Buncombe County, NC | |||||
| 1,357 | 2.89 | 1 st Lien on Non Owner Occupied Medical Office Commercial Real Estate | Cleveland County, NC | |||||
| 1,144 | 2.43 | 1 st Lien on Improved Land for Commercial Development | Buncombe County, NC | |||||
| 1,104 | 2.35 | 1 st Lien on 1-4 Family Residential Real Estate | Polk County, NC | |||||
| 1,101 | 2.34 | 1 st Lien on Non Owner Occupied RV Campground Commercial Real Estate | Sullivan County, TN | |||||
| 1,016 | 2.16 | 1 st Lien on Owner Occupied Industrial Warehouse Commercial Real Estate | Hamblen County, TN | |||||
| $ | 8,462 | 18.00 | % | |||||
At June 30, 2014, we had $15.7 million of REO, the most significant of which is $2.9 million of commercial real estate located in Buncombe County. The second and third largest REO properties are undeveloped land in Anderson County, TN and Spartanburg County, SC with book values of $1.5 million and $877,000, respectively. At June 30, 2014 all other REO properties have individual book values of less than $654,000.
REO increased $4.0 million, or 34.0%, to $15.7 million at June 30, 2014 from $11.7 million at June 30, 2013. $3.3 million in REO was added in connection with the Jefferson acquisition and $2.1 million was added in connection with the BankGreenville acquisition. The proceeds from the sale of REO for the fiscal year ended June 30, 2014 decreased to $10.6 million compared to $11.1 million for the fiscal year ended June 30, 2013. This represented a decrease of $500,000 or 0.45%. The loss on sale and impairment of REO was $646,000 for the year ended June 30, 2014 compared to $951,000 for the year ended June 30, 2013. The decrease of $305,000, or 32.1%, was due to fewer REO write-downs during fiscal year 2014 offset by a $65,000 net loss on sales during fiscal year 2014 compared to a net gain on sales of $235,000 during fiscal year 2013.
In fiscal 2014, we liquidated $25.7 million in REO based on contractual loan values at the time of foreclosure, realizing $10.7 million in net proceeds, or 41.6%, of the foreclosed contractual loan balances. As of
24
June 30, 2014, the book value of our REO, expressed as a percentage of the related contractual loan balances at the time the properties were transferred to REO was 48.3%. During the year ended June 30, 2014, we disposed of $11.8 million of REO in construction and development, and realized $3.8 million, which equated to 32.2% of the related contractual loan balances at the time of foreclosure.
Other Loans of Concern. In addition to the nonperforming assets set forth in the table above, as of June 30, 2014, there were 616 accruing loans in special mention or worse totaling $77.8 million with respect to which known information about the possible credit problems of the borrowers have caused management to have concerns as to the ability of the borrowers to comply with present loan repayment terms and which may result in the future inclusion of such items in the nonperforming asset categories. These loans have been considered in management's determination of our allowance for loan losses.
Classified Assets. Loans and other assets, such as debt and equity securities considered to be of lesser quality, are classified as "substandard," "doubtful" or "loss." An asset is considered "substandard" if it is inadequately protected by the current net worth and paying capacity of the obligor or of the collateral pledged, if any. "Substandard" assets include those characterized by the "distinct possibility" that the insured institution will sustain "some loss" if the deficiencies are not corrected. Assets classified as "doubtful" have all of the weaknesses in those classified "substandard," with the added characteristic that the weaknesses present make "collection or liquidation in full," on the basis of currently existing facts, conditions and values, "highly questionable and improbable." Assets classified as "loss" are those considered "uncollectible" and of such little value that their continuance as assets without the establishment of a specific loss reserve is not warranted.
When we classify a problem asset as either substandard or doubtful, we may establish a specific allowance for loan losses in an amount deemed prudent by management. When we classify problem assets as "loss," we either establish a specific allowance for losses equal to 100% of that portion of the asset so classified or charge off such amount. Our determination as to the classification of our assets and the amount of our valuation allowances is subject to review by our bank regulators, which may order the establishment of additional general or specific loss allowances. Assets which do not currently expose us to sufficient risk to warrant classification in one of the aforementioned categories but possess weakness are designated by us as "special mention."
We regularly review the problem assets in our portfolio to determine whether any assets require classification in accordance with applicable regulations. On the basis of management's review of our assets, at June 30, 2014, our classified assets (consisting of $78.9 million of loans and $15.7 million of REO) totaled $94.6 million, or 4.6%, of our assets, of which $47.0 million was included in non-accruing loans. The aggregate amounts of our classified assets and special mention loans at the dates indicated (as determined by management), were as follows:
At June 30, | ||||||||
2014 | 2013 | |||||||
(In thousands) | ||||||||
Classified Assets: | ||||||||
Loss | $ | 18 | $ | 43 | ||||
Doubtful | 5,967 | 9,159 | ||||||
Substandard – performing | 31,374 | 36,710 | ||||||
– non-accruing | 41,531 | 59,911 | ||||||
Total Classified Loans | 78,890 | 105,823 | ||||||
Real Estate Owned | 15,725 | 11,738 | ||||||
Total Classified Assets | 94,615 | 117,561 | ||||||
Special Mention loans | 45,927 | 41,402 | ||||||
Total Classified Assets and Special Mention Loans | $ | 140,542 | $ | 158,963 | ||||
Allowance for Loan Losses. The allowance for loan losses is a valuation account that reflects our estimation of the losses in our loan portfolio to the extent they are reasonable to estimate. The allowance is maintained through provisions for loan losses that are charged to earnings in the period they are established. We
25
charge losses on loans against the allowance for loan losses when we believe the collection of loan principal is unlikely. Recoveries on loans previously charged off are added back to the allowance.
Beginning in fiscal year 2009 and continuing throughout much of fiscal year 2012, housing markets deteriorated in many of our market areas and we experienced significantly higher levels of delinquencies and non-performing assets, primarily in our construction and land development loan portfolios. During this period, home and lot sales activity was exceptionally slow, causing stress on builders' and developers' cash flows and their ability to service debt, which was reflected in our increased non-performing asset totals. Further, property values generally declined, reducing the value of the collateral securing loans. In addition, other non-housing-related segments of the loan portfolio developed signs of stress and increasing levels of non-accruing loans as the effects of the recessionary economy became more evident and the pace of the recovery remained slow. As a result, during these periods our provision for loan losses was significantly higher than historical levels and our normal expectations. This higher than normal level of delinquencies and non-accruals also had a material adverse effect on operating income as a result of foregone interest revenues, increased loan collection costs and carrying costs and valuation adjustments for REO. During fiscal 2013 and 2014, home and lot sales activity and real estate values have modestly improved along with general economic conditions resulting in materially lower loan charge-offs. At June 30, 2014, our non-accruing loans decreased to $47.0 million as compared to $68.6 million at June 30, 2013. At June 30, 2014, $23.9 million, or 50.9%, of our total non-accruing loans were current on their loan payments as compared to $39.6 million, or 57.7%, of total non-accruing loans at June 30, 2013. During fiscal 2014 classified assets decreased $22.9 million, or 19.5%, to $94.7 million and delinquent loans (loans delinquent 30 days or more) declined $7.5 million, or 21.3%, to $27.9 million at June 30, 2014. Our provision for loan losses decreased during fiscal 2014 primarily due to improving asset quality due to lower non-accruing and classified loans, as well as, lower loan charge-offs. Although we continue to actively engage our borrowers in resolving remaining problem assets, future additions to our allowance for loan losses will be meaningfully influenced by the course of recovery from the recent economic recession.
There were $2.3 million and $4.1 million in net loan charge-offs during the fiscal years ended June 30, 2014 and 2013, respectively. During the year ended June 30, 2012 we charged-off specific reserves totaling $16.7 million related to impaired loans in accordance with regulatory guidance. In addition, during fiscal 2012 we reclassified $25.7 million of impaired loans from impaired loans still accruing interest to non-accruing loans pursuant to regulatory guidance. Generally, these loans were paying as agreed, except that liquidation of the underlying collateral has been significantly delayed as compared to the schedule contemplated in our initial underwriting. We evaluated the decline in collateral value for each of these loans and recorded no additional reserves related to these loans during the year ended June 30, 2013.
At June 30, 2014, our allowance for loan losses was $23.4 million, or 1.56%, of our total loan portfolio, and 49.8% of total non-accruing loans. Excluding the loans acquired from Jefferson and BankGreenville, which have been recorded at fair value with an appropriate credit discount, the allowance for loan losses was 2.08% of total loans at June 30, 2014. Management's estimation of an appropriate allowance for loan losses is inherently subjective as it requires estimates and assumptions that are susceptible to significant revisions as more information becomes available or as future events change. The level of allowance is based on estimates and the ultimate losses may vary from these estimates. Large groups of smaller balance homogeneous loans, such as residential real estate, small commercial real estate, home equity and consumer loans, are evaluated in the aggregate using historical loss factors adjusted for current economic conditions. Assessing the allowance for loan losses is inherently subjective as it requires making material estimates, including the amount and timing of future cash flows expected to be received. In the opinion of management, the allowance, when taken as a whole, reflects estimated loan losses in our loan portfolio.
During the year ended June 30, 2012, we revised our calculation for the allowance for loan losses to better reflect the risks within each loan class. These enhancements included: (1) dividing the land loan category previously used by HomeTrust Bank into two classes: retail consumer construction and land/lots loans and commercial construction and development loans; (2) adding new concentration adjustments for Cherryville and Industrial pre-combination loans; and (3) adjusting the qualitative factors on most of the loan classes to better reflect the overall risk in each class as a result of changes in the quantitative factors based on net historical charge-offs. In addition, as noted above we charged-off $16.7 million of specific reserves related to impaired loans in accordance with regulatory guidance which decreased the allowance for loan losses for loans individually evaluated for impairment as of June 30, 2012.
26
A loan is considered impaired when, based on current information and events, it is probable that we will be unable to collect the scheduled payments of principal or interest when due. Factors considered by management in determining impairment include payment status, collateral value, and the probability of collecting scheduled principal and interest payments when due. Loans that experience insignificant payment delays and payment shortfalls generally are not classified as impaired. Management determines the significance of payment delays and payment shortfalls on a case-by-case basis, taking into consideration all of the circumstances surrounding the loan and the borrower, including the length of the delay, the reasons for the delay, the borrower's prior payment record, and the amount of the shortfall in relation to the principal and interest owed.
Future additions to the allowance for loan losses may be necessary if economic and other conditions in the future differ substantially from the current operating environment. In addition, the OCC as an integral part of its examination process periodically reviews our loan and foreclosed real estate portfolios and the related allowance for loan losses and valuation allowance for foreclosed real estate. The OCC may require the allowance for loan losses or the valuation allowance for foreclosed real estate to be increased based on its review of information available at the time of the examination, which would negatively affect our earnings.
27
The following table summarizes the distribution of the allowance for loan losses by loan category at the dates indicated.
At June 30, | ||||||||||||||||||||||||||||||||||||||||
2014 | 2013 | 2012 | 2011 | 2010 | ||||||||||||||||||||||||||||||||||||
Amount | Percent of loans in each category to total loans | Amount | Percent of loans in each category to total loans | Amount | Percent of loans in each category to total loans | Amount | Percent of loans in each category to total loans | Amount | Percent of loans in each category to total loans | |||||||||||||||||||||||||||||||
(Dollars in thousands) | ||||||||||||||||||||||||||||||||||||||||
Allocated at end of period to: | ||||||||||||||||||||||||||||||||||||||||
Retail consumer loans: | ||||||||||||||||||||||||||||||||||||||||
One- to four-family | $ | 10,527 | 44.08 | % | $ | 15,098 | 51.69 | % | $ | 14,557 | 50.36 | % | $ | 14,108 | 45.88 | % | $ | 9,188 | 39.50 | % | ||||||||||||||||||||
Home equity | 2,487 | 9.91 | 3,827 | 10.77 | 3,531 | 11.61 | 3,710 | 11.78 | 3,251 | 12.18 | ||||||||||||||||||||||||||||||
Construction and land/lots | 2,420 | 3.96 | 2,890 | 4.42 | 2,955 | 4.35 | 5,507 | 5.12 | 2,177 | 6.13 | ||||||||||||||||||||||||||||||
Consumer | 297 | 1.01 | 138 | 0.29 | 129 | 0.31 | 213 | 0.32 | 132 | 0.29 | ||||||||||||||||||||||||||||||
Commercial loans: | ||||||||||||||||||||||||||||||||||||||||
Commercial real estate | 5,439 | 25.22 | 6,583 | 19.81 | 6,454 | 19.37 | 9,427 | 20.24 | 10,668 | 20.95 | ||||||||||||||||||||||||||||||
Construction and | ||||||||||||||||||||||||||||||||||||||||
development | 1,241 | 3.77 | 2,399 | 2.06 | 6,253 | 3.44 | 15,599 | 5.97 | 14,648 | 9.85 | ||||||||||||||||||||||||||||||
Commercial and industrial | 249 | 4.97 | 156 | 0.98 | 315 | 1.18 | 453 | 1.45 | 411 | 1.56 | ||||||||||||||||||||||||||||||
Municipal leases | 769 | 7.09 | 982 | 9.98 | 906 | 9.38 | 1,123 | 9.24 | 1,238 | 9.54 | ||||||||||||||||||||||||||||||
Total loans | $ | 23,429 | 100.00 | % | $ | 32,073 | 100.00 | % | $ | 35,100 | 100.00 | % | $ | 50,140 | 100.00 | % | $ | 41,713 | 100.00 | % | ||||||||||||||||||||
28
The following table sets forth an analysis of our allowance for loan losses at the dates and for the periods indicated.
Years Ended June 30, | ||||||||||||||||||||
2014 | 2013 | 2012 | 2011 | 2010 | ||||||||||||||||
(Dollars in thousands) | ||||||||||||||||||||
Balance at beginning of period: | $ | 32,073 | $ | 35,100 | $ | 50,140 | $ | 41,713 | $ | 24,996 | ||||||||||
Provision for (recovery of) loan losses | (6,300 | ) | 1,100 | 15,600 | 42,800 | 38,600 | ||||||||||||||
Charge-offs: | ||||||||||||||||||||
Retail consumer loans: | ||||||||||||||||||||
One- to four-family | 3,269 | 1,855 | 9,355 | 3,572 | 8,450 | |||||||||||||||
Home equity | 330 | 1,023 | 3,573 | 743 | 1,473 | |||||||||||||||
Construction and land/lots | 804 | 770 | 3,690 | 2,510 | 3,275 | |||||||||||||||
Consumer | 33 | 67 | 131 | 10 | 71 | |||||||||||||||
Total retail consumer loans | 4,436 | 3,715 | 16,749 | 6,835 | 13,269 | |||||||||||||||
Commercial loans: | ||||||||||||||||||||
Commercial real estate | 413 | 1,624 | 3,083 | 6,736 | 4,978 | |||||||||||||||
Construction and development | 377 | 1,568 | 12,770 | 21,629 | 3,574 | |||||||||||||||
Commercial and industrial | 110 | 84 | 210 | 130 | 299 | |||||||||||||||
Municipal leases | - | - | - | - | - | |||||||||||||||
Total commercial loans | 900 | 3,276 | 16,063 | 28,495 | 8,851 | |||||||||||||||
Total charge-offs | 5,336 | 6,991 | 32,812 | 35,330 | 22,120 | |||||||||||||||
Recoveries: | ||||||||||||||||||||
Retail consumer loans: | ||||||||||||||||||||
One-to four-family | 875 | 617 | 120 | 189 | 156 | |||||||||||||||
Home equity | 153 | 95 | 59 | 31 | - | |||||||||||||||
Construction and land/lots | 625 | 137 | 183 | 1 | - | |||||||||||||||
Consumer | 10 | 5 | - | - | 27 | |||||||||||||||
Total retail consumer loans | 1,663 | 854 | 362 | 221 | 183 | |||||||||||||||
Commercial loans: | ||||||||||||||||||||
Commercial real estate | 120 | 252 | 1,202 | 581 | 13 | |||||||||||||||
Construction and development | 1,051 | 1,656 | 516 | 48 | - | |||||||||||||||
Commercial and industrial | 159 | 102 | 92 | 107 | 41 | |||||||||||||||
Municipal leases | - | - | - | - | - | |||||||||||||||
Total commercial loans | 1,330 | 2,010 | 1,810 | 736 | 54 | |||||||||||||||
Total recoveries | 2,993 | 2,864 | 2,172 | 957 | 237 | |||||||||||||||
Net charge-offs | 2,343 | 4,127 | 30,640 | 34,373 | 21,883 | |||||||||||||||
Balance at end of period | $ | 23,429 | $ | 32,073 | $ | 35,100 | $ | 50,140 | $ | 41,713 | ||||||||||
Net charge-offs during the period to average loans outstanding during the period | 0.19 | % | 0.34 | % | 2.34 | % (1) | 2.59 | % | 1.71 | % | ||||||||||
Net charge-offs during the period to average non-performing assets | 3.40 | % | 4.99 | % | 38.73 | % (1) | 54.59 | % | 46.33 | % | ||||||||||
Allowance as a percentage of non- performing assets | 49.84 | % | 39.94 | % | 43.71 | % | 80.44 | % | 65.60 | % | ||||||||||
Allowance as a percentage of total loans (end of period) | 1.56 | % (2) | 2.75 | % | 2.85 | % | 3.77 | % | 3.23 | % | ||||||||||
______________
(1) In accordance with regulatory guidance, we charged-off $16.7 million related to impaired loans for which we previously had recorded valuation allowances.
(2) Excluding the loans acquired from Jefferson and BankGreenville, which have been recorded at fair value with an appropriate credit discount, the allowance for loan losses was 2.08% of total loans at June 30, 2014.
29
Investment Activities
Federal savings banks have the authority to invest in various types of liquid assets, including United States Treasury obligations, securities of various federal agencies, including mortgage-backed securities, callable agency securities, certain certificates of deposit of insured banks and savings institutions, certain bankers' acceptances, repurchase agreements and federal funds. Subject to various restrictions, federal savings banks may also invest their assets in investment grade commercial paper and corporate debt securities and mutual funds whose assets conform to the investments that the institution is otherwise authorized to make directly. See "How We Are Regulated - HomeTrust Bank" for a discussion of additional restrictions on our investment activities.
Our chief executive officer and chief financial officer have the basic responsibility for the management of our investment portfolio, subject to the direction and guidance of the board of directors. These officers consider various factors when making decisions, including the marketability, maturity and tax consequences of the proposed investment. The maturity structure of investments will be affected by various market conditions, including the current and anticipated slope of the yield curve, the level of interest rates, the trend of new deposit inflows, and the anticipated demand for funds via deposit withdrawals and loan originations and purchases.
The general objectives of our investment portfolio are to provide liquidity when loan demand is high, to assist in maintaining earnings when loan demand is low and to optimize earnings while satisfactorily managing risk, including credit risk, reinvestment risk, liquidity risk and interest rate risk. At June 30, 2014, our investment portfolio consisted primarily of U.S. government agency securities and mortgage-backed securities all held as available for sale. We currently do not have any investments held to maturity or for trading.
These securities are of high quality, possess minimal credit risk and have an aggregate market value in excess of total amortized cost as of June 30, 2014. For more information, please see Note 3 of the Notes to Consolidated Financial Statements contained in Item 8 and Item 7 "Management's Discussion and Analysis of Financial Condition and Results of Operations - Asset/Liability Management" in this report.
We do not currently participate in hedging programs, stand-alone contracts for interest rate caps, floors or swaps, or other activities involving the use of off-balance sheet derivative financial instruments and have no present intention to do so. Further, we do not invest in securities which are not rated investment grade.
As a member of the FHLB of Atlanta, we had $3.7 million in stock of the FHLB of Atlanta at June 30, 2014. For the years ended June 30, 2014 and 2013, we received $79,000 and $83,000, respectively, in dividends from the FHLB of Atlanta.
The following table sets forth the composition of our securities portfolio and other investments at the dates indicated. All securities at the dates indicated have been classified as available for sale. At June 30, 2014, our securities portfolio did not contain securities of any issuer with an aggregate book value in excess of 10% of our equity capital, excluding those issued by the United States government or its agencies or United States government sponsored entities.
At June 30, | ||||||||||||||||||||||||
2014 | 2013 | 2012 | ||||||||||||||||||||||
Book Value | Fair Value | Book Value | Fair Value | Book Value | Fair Value | |||||||||||||||||||
(In thousands) | ||||||||||||||||||||||||
Securities available for sale: | ||||||||||||||||||||||||
U.S. government and federal agency | $ | 38,085 | $ | 38,093 | $ | 6,000 | $ | 6,002 | $ | 6,102 | $ | 6,102 | ||||||||||||
Mortgage-backed securities | 111,430 | 111,411 | 18,794 | 18,748 | 24,958 | 25,233 | ||||||||||||||||||
Municipal bonds | 15,951 | 16,220 | - | - | - | - | ||||||||||||||||||
Corporate bonds | 2,912 | 3,025 | - | - | - | - | ||||||||||||||||||
Total securities available for sale | 168,378 | 168,749 | 24,794 | 24,750 | 31,060 | 31,335 | ||||||||||||||||||
Federal Home Loan Bank stock | 3,697 | 3,697 | 1,854 | 1,854 | 6,300 | 6,300 | ||||||||||||||||||
Total securities | $ | 172,075 | $ | 172,446 | $ | 26,648 | $ | 26,604 | $ | 37,360 | $ | 37,635 | ||||||||||||
30
The composition and contractual maturities of the investment securities portfolio as of June 30, 2014, excluding Federal Home Loan Bank stock, are indicated in the following table. Maturities are based on the final contractual payment dates, and do not reflect the impact of prepayments or early redemptions that may occur.
June 30, 2014 | ||||||||||||||||||||||||||||||||||||||||||||
1 year or less | Over 1 year to 5 years | Over 5 to 10 years | Over 10 years | Total Securities | ||||||||||||||||||||||||||||||||||||||||
Amortized Cost | Weighted Average Yield | Amortized Cost | Weighted Average Yield | Amortized Cost | Weighted Average Yield | Amortized Cost | Weighted Average Yield | Amortized Cost | Weighted Average Yield | Fair Value | ||||||||||||||||||||||||||||||||||
(Dollars in thousands) | ||||||||||||||||||||||||||||||||||||||||||||
Securities available for sale: | ||||||||||||||||||||||||||||||||||||||||||||
U.S. government and federal agency | $ | 8,021 | 0.26 | % | $ | 18,215 | 0.79 | % | $ | 10,918 | 1.96 | % | $ | 931 | 3.66 | % | $ | 38,085 | 1.09 | % | $ | 38,093 | ||||||||||||||||||||||
Mortgage-backed securities | - | - | % | 1,578 | 1.98 | % | 9,732 | 1.45 | % | 100,120 | 1.88 | % | 111,430 | 1.85 | % | 111,411 | ||||||||||||||||||||||||||||
Municipal bonds | 534 | 0.81 | % | 2,358 | 1.70 | % | 8,921 | 3.31 | % | 4,138 | 3.18 | % | 15,951 | 2.94 | % | 16,220 | ||||||||||||||||||||||||||||
Corporate bonds | - | - | % | 428 | 2.65 | % | 2,484 | 3.35 | % | - | - | % | 2,912 | 3.25 | % | 3,025 | ||||||||||||||||||||||||||||
Total investment securities | $ | 8,555 | 0.29 | % | $ | 22,579 | 1.00 | % | $ | 32,055 | 2.27 | % | $ | 105,189 | 1.95 | % | $ | 168,378 | 1.80 | % | $ | 168,749 | ||||||||||||||||||||||
31
Sources of Funds
General. Our sources of funds are primarily deposits, borrowings, payments of principal and interest on loans and funds provided from operations.
Deposits. We offer a variety of deposit accounts with a wide range of interest rates and terms to both consumers and businesses. Our deposits consist of savings, money market and demand accounts and certificates of deposit. We solicit deposits primarily in our market areas. At June 30, 2014, 2013 and 2012, we had $14.9 million, $16.6 million, and $34.6 million in brokered deposits, respectively, which included certificates of deposit made under our participation in the Certificate of Deposit Account Registry Service® ("CDARS"). Through CDARS, we can provide a depositor the ability to place up to $50.0 million on deposit with us while receiving FDIC insurance on the entire deposit by placing customer funds in excess of the FDIC deposit limits with other financial institutions in the CDARS network. In return, these financial institutions place customer funds with us on a reciprocal basis. As of June 30, 2014, core deposits, which we define as our non-certificate or non-time deposit accounts, represented approximately 59.9% of total deposits.
We primarily rely on competitive pricing policies, marketing, and customer service to attract and retain deposits. The flow of deposits is influenced significantly by general economic conditions, changes in money market and prevailing interest rates and competition. The variety of deposit accounts we offer has allowed us to be competitive in obtaining funds and to respond with flexibility to changes in consumer demand. We have become more susceptible to short-term fluctuations in deposit flows as customers have become more interest rate conscious. We try to manage the pricing of our deposits in keeping with our asset/liability management, liquidity and profitability objectives, subject to competitive factors. Based on our experience, we believe that our deposits are relatively stable sources of funds. Despite this stability, our ability to attract and maintain these deposits and the rates paid on them has been and will continue to be significantly affected by market conditions.
A large percentage of our deposits are in certificates of deposit. Our liquidity could be reduced if a significant amount of certificates of deposit, maturing within a short period of time, were not renewed. Historically, a significant portion of the certificates of deposit remain with us after they mature and we believe that this will continue. However, the need to retain these time deposits could result in an increase in our cost of funds.
The following table sets forth our deposit flows during the periods indicated.
Years Ended June 30, | ||||||||||||
2014 | 2013 | 2012 | ||||||||||
Beginning balance | $ | 1,154,750 | $ | 1,466,175 | $ | 1,264,585 | ||||||
Deposits acquired from business combination | 466,463 | - | - | |||||||||
Net deposits (withdrawals) | (43,430 | ) | (318,392 | ) | 191,199 | |||||||
Interest credited | 5,264 | 6,967 | 10,391 | |||||||||
Ending balance | $ | 1,583,047 | $ | 1,154,750 | $ | 1,466,175 | ||||||
Net increase (decrease) | $ | 428,297 | $ | (311,425 | ) | $ | 201,590 | |||||
Percent increase (decrease) | 37.09 | % | (21.24 | )% | 15.94 | % | ||||||
32
The following table sets forth the dollar amount of savings deposits in the various types of deposit programs offered by us at the dates indicated.
At June 30, | |||||||||||||||||||||||||
2014 | 2013 | 2012 | |||||||||||||||||||||||
Amount | Percent of Total | Amount | Percent of Total | Amount | Percent of Total | ||||||||||||||||||||
(Dollars in thousands) | |||||||||||||||||||||||||
Transactions and Savings Deposits: | |||||||||||||||||||||||||
Interest-bearing checking | $ | 295,386 | 18.66 | % | $ | 195,659 | 16.94 | % | $ | 173,574 | 11.84 | % | |||||||||||||
Noninterest-bearing checking | 123,285 | 7.79 | 60,828 | 5.27 | 57,109 | 3.90 | |||||||||||||||||||
Savings | 175,974 | 11.12 | 82,158 | 7.11 | 347,669 | (1) | 23.71 | ||||||||||||||||||
Money market | 354,247 | 22.38 | 275,718 | 23.88 | 257,865 | 17.59 | |||||||||||||||||||
Total non-certificates | $ | 948,892 | 59.94 | % | $ | 614,363 | 53.20 | % | $ | 836,217 | 57.03 | % | |||||||||||||
Certificates: | |||||||||||||||||||||||||
0.00-0.99% | $ | 480,437 | 30.35 | % | $ | 351,093 | 30.40 | % | $ | 320,476 | 21.86 | % | |||||||||||||
1.00-1.99% | 107,730 | 6.81 | 126,914 | 10.99 | 205,728 | 14.03 | |||||||||||||||||||
2.00-2.99% | 33,660 | 2.13 | 44,245 | 3.83 | 75,766 | 5.17 | |||||||||||||||||||
3.00-3.99% | 7,900 | 0.50 | 10,815 | 0.94 | 13,688 | 0.93 | |||||||||||||||||||
4.00-4.99% | 4,428 | 0.28 | 6,498 | 0.56 | 13,263 | 0.90 | |||||||||||||||||||
5.00% and over | - | - | 822 | 0.07 | 1,037 | 0.07 | |||||||||||||||||||
Total certificates | $ | 634,155 | 40.06 | % | $ | 540,387 | 46.80 | % | $ | 629,958 | 42.97 | % | |||||||||||||
Total deposits | $ | 1,583,047 | 100.00 | % | $ | 1,154,750 | 100.00 | % | $ | 1,466,175 | 100.00 | % | |||||||||||||
_________________________
(1) Includes $264.2 million of deposits held in escrow pending the close of the Conversion.
33
The following table shows rate and maturity information for our certificates of deposit at June 30, 2014.
0.00- 0.99% | 1.00- 1.99% | 2.00- 2.99% | 3.00- 3.99% | 4.00- 4.99% | 5.00% or greater | Total | Percent of Total | ||||||||||||||||||||
(Dollars in thousands) | |||||||||||||||||||||||||||
Certificate accounts maturing | |||||||||||||||||||||||||||
in quarter ending: | |||||||||||||||||||||||||||
September 30, 2014 | $ | 213,322 | $ | 18,993 | $ | 2,408 | $ | 102 | $ | 13 | $ | - | $ | 234,838 | 37.03 | % | |||||||||||
December 31, 2014 | 68,813 | 16,026 | 2,775 | 91 | - | - | 87,705 | 13.83 | |||||||||||||||||||
March 31, 2015 | 57,321 | 10,826 | 2,383 | - | - | - | 70,530 | 11.12 | |||||||||||||||||||
June 30, 2015 | 49,413 | 4,902 | 3,688 | - | - | - | 58,003 | 9.15 | |||||||||||||||||||
September 30, 2015 | 21,411 | 6,578 | 5,314 | 578 | - | - | 33,881 | 5.34 | |||||||||||||||||||
December 31, 2015 | 16,566 | 2,419 | 10,057 | - | - | - | 29,042 | 4.58 | |||||||||||||||||||
March 31, 2016 | 9,099 | 5,731 | 3,419 | - | - | - | 18,249 | 2.88 | |||||||||||||||||||
June 30, 2016 | 9,084 | 1,742 | 2,920 | - | - | - | 13,746 | 2.17 | |||||||||||||||||||
September 30, 2016 | 6,251 | 6,896 | 694 | 3,995 | - | - | 17,836 | 2.81 | |||||||||||||||||||
December 31, 2016 | 6,676 | 6,687 | 2 | - | - | - | 13,365 | 2.11 | |||||||||||||||||||
March 31, 2017 | 6,244 | 4,462 | - | - | - | - | 10,706 | 1.69 | |||||||||||||||||||
June 30, 2017 | 6,997 | 4,005 | - | - | - | - | 11,002 | 1.73 | |||||||||||||||||||
Thereafter | 9,240 | 18,462 | - | 3,135 | 4,415 | - | 35,252 | 5.56 | |||||||||||||||||||
Total | $ | 480,437 | $ | 107,729 | $ | 33,660 | $ | 7,901 | $ | 4,428 | $ | - | $ | 634,155 | 100.00 | % | |||||||||||
Percent of total | 75.76 | % | 16.99 | % | 5.31 | % | 1.25 | % | 0.70 | % | - | % | 100.00 | % | |||||||||||||
34
The following table indicates the amount of our certificates of deposit and other deposits by time remaining until maturity as of June 30, 2014.
Maturity | ||||||||||||||||||||
3 Months or Less | Over 3 to 6 Months | Over 6 to 12 Months | Over 12 Months | Total | ||||||||||||||||
(In thousands) | ||||||||||||||||||||
Certificates of deposit less than $100,000 | $ | 107,308 | $ | 36,457 | $ | 47,822 | $ | 91,920 | $ | 283,507 | ||||||||||
Certificates of deposit of $100,000 or more | 109,519 | 44,565 | 67,279 | 83,797 | 305,160 | |||||||||||||||
Public funds (1) | 18,012 | 6,684 | 13,432 | 7,360 | 45,488 | |||||||||||||||
Total certificates of deposit | $ | 234,839 | $ | 87,706 | $ | 128,533 | $ | 183,077 | $ | 634,155 | ||||||||||
_______________________________
(1) Deposits from government and other public entities.
Borrowings . Although deposits are our primary source of funds, we may utilize borrowings to manage interest rate risk or as a cost-effective source of funds when they can be invested at a positive interest rate spread for additional capacity to fund loan demand according to our asset/liability management goals. Our borrowings consist primarily of advances from the FHLB of Atlanta and retail repurchase agreements.
We may obtain advances from the FHLB of Atlanta upon the security of certain of our mortgage loans and mortgage-backed and other securities. These advances may be made pursuant to several different credit programs, each of which has its own interest rate, range of maturities and call features, and all long-term advances are required to provide funds for residential home financing. As of June 30, 2014, we had $50.0 million in FHLB advances outstanding as part of the liabilities assumed from the Jefferson acquisition and the ability to borrow $253.4 million. In addition to FHLB advances, at June 30, 2014 we had a $140.2 million line of credit with the Federal Reserve Bank of Richmond, subject to qualifying collateral, and a $5.0 million line of credit with another unaffiliated bank. See Note 9 of the Notes to Consolidated Financial Statements contained in Item 8 of this report for more information about FHLB advances, and other borrowings.
The following tables set forth information regarding our borrowing at the end of and during the periods indicated. The tables include both long- and short-term borrowings.
Years ended June 30, | ||||||||||||
2014 | 2013 | 2012 | ||||||||||
(Dollars in thousands) | ||||||||||||
Maximum balance: | ||||||||||||
Federal Home Loan Bank advances | $ | 55,939 | $ | 15,080 | $ | 111,082 | ||||||
Securities sold under agreements to repurchase | - | 8,475 | 8,190 | |||||||||
Federal Reserve Bank | - | - | 5,000 | |||||||||
Average balances: | ||||||||||||
Federal Home Loan Bank advances | $ | 6,109 | $ | 5,378 | $ | 85,521 | ||||||
Securities sold under agreements to repurchase | - | 5,015 | 6,772 | |||||||||
Federal Reserve Bank | - | - | 13 | |||||||||
Weighted average interest rate: | ||||||||||||
Federal Home Loan Bank advances | 0.20 | % | 4.93 | % | 1.77 | % | ||||||
Securities sold under agreements to repurchase | - | 0.24 | 0.35 | |||||||||
Federal Reserve Bank | - | - | 0.75 | |||||||||
35
At June 30, | ||||||||||||
2014 | 2013 | 2012 | ||||||||||
(Dollars in thousands) | ||||||||||||
Balance outstanding at end of period: | ||||||||||||
Federal Home Loan Bank advances | $ | 50,000 | $ | - | $ | 15,080 | ||||||
Securities sold under agreements to repurchase | - | - | 7,185 | |||||||||
Federal Reserve Bank | - | - | - | |||||||||
Weighted average interest rate of: | ||||||||||||
Federal Home Loan Bank advances | 0.20 | % | - | % | 4.94 | % | ||||||
Securities sold under agreements to repurchase | - | - | 0.24 | |||||||||
Federal Reserve Bank | - | - | - | |||||||||
Subsidiary and Other Activities
As a federally chartered savings bank, HomeTrust Bank is permitted by OCC regulations to invest up to 2% of its assets, or $41.0 million at June 30, 2014, in the stock of, or unsecured loans to, service corporation subsidiaries. We may invest an additional 1% of our assets in service corporations where such additional funds are used for inner-city or community development purposes. HomeTrust Bank has one operating subsidiary, Western North Carolina Service Corporation ("WNCSC"), whose primary purpose is to own several office buildings in Asheville, North Carolina which are leased to HomeTrust Bank and other tenants. Our capital investment in WNCSC as of June 30, 2014 was $1.1 million.
Employees
At June 30, 2014, we had a total of 441 full-time employees and 30 part-time employees. Our employees are not represented by any collective bargaining group. Management considers its employee relations to be good. Management also considers our employees to be a great team of highly engaged, competent and caring people who effectively deliver our brand promise to customers every day that "It's Just Better Here." Their performance creates word-of-mouth referrals that result in the growth of new customers and expanded customer relationships.
Internet Website
We maintain a website with the address www.hometrustbancshares.com. The information contained on our website is not included as a part of, or incorporated by reference into, this Annual Report on Form 10-K. Other than an investor's own Internet access charges, we make available free of charge through our website our Annual Report on Form 10-K, quarterly reports on Form 10-Q and current reports on Form 8-K, and amendments to these reports, as soon as reasonably practicable after we have electronically filed such material with, or furnished such material to, the Securities and Exchange Commission.
36
HO W WE ARE REGULATED
General. HomeTrust Bancshares is subject to examination and supervision by, and is required to file certain reports with, the Federal Reserve. HomeTrust Bancshares is also subject to the rules and regulations of the SEC under the federal securities laws.
HomeTrust Bank is subject to examination and regulation primarily by the OCC and, to a lesser extent, by the FDIC. This system of regulation and supervision establishes a comprehensive framework of activities in which HomeTrust Bank may engage and is intended primarily for the protection of depositors and the FDIC deposit insurance fund. HomeTrust Bank is periodically examined by the OCC to ensure that it satisfies applicable standards with respect to its capital adequacy, assets, management, earnings, liquidity and sensitivity to market interest rates. The OCC also regulates the branching authority of HomeTrust Bank, which generally permits nationwide branching de novo and branching by acquisition where allowed by applicable state law. HomeTrust Bank's relationship with its depositors and borrowers is regulated by federal consumer protection laws. The Consumer Financial Protection Bureau ("CFPB") issues regulations under those laws that HomeTrust Bank must comply with. HomeTrust Bank also is regulated to a lesser extent by the Federal Reserve, which governs the reserves to be maintained against deposits and other matters. HomeTrust Bank's relationship with its depositors and borrowers is regulated by state laws with respect to certain matters, including the enforceability of loan documents.
On August 25, 2014, HomeTrust Bank converted from a federal savings bank to a national bank with the title "HomeTrust Bank, National Association." In connection with the conversion of the Bank, HomeTrust Bancshares changed from a savings and loan holding company to a bank holding company, regulated under the Bank Holding Company Act.
The following is a brief description of certain laws and regulations applicable to HomeTrust Bancshares and HomeTrust Bank. Descriptions of laws and regulations here and elsewhere in this report do not purport to be complete and are qualified in their entirety by reference to the actual laws and regulations. Legislation is introduced from time to time in the United States Congress that may affect the operations of HomeTrust Bancshares and HomeTrust Bank. In addition, the regulations governing us may be amended from time to time. Any such legislation or regulatory changes in the future could adversely affect our operations and financial condition.
Financial Regulatory Reform. The Dodd-Frank Act, which was enacted in July 2010, imposed new restrictions and an expanded framework of regulatory oversight for financial entities, including depository institutions and their holding companies.
The following summarizes significant aspects of the Dodd-Frank Act that may materially affect the operations and condition of HomeTrust Bank and HomeTrust Bancshares:
· | Dodd-Frank Act established the CFPB and empowered it to exercise broad regulatory, supervisory and enforcement authority with respect to both new and existing consumer financial protection laws. HomeTrust Bank is subject to consumer protection regulations issued by the CFPB, but as a smaller financial institution, HomeTrust Bank is generally subject to OCC supervision and enforcement with respect to its compliance with consumer financial protection laws and CFPB regulations. |
· | Bank holding companies and savings and loan holding companies are required to serve as a source of strength for their banking subsidiaries. |
· | The federal banking agencies must promulgate new rules on regulatory capital, for both depository institutions and their holding companies. These are described below. |
· | The prohibition on payment of interest on demand deposits was repealed. |
37
· | State consumer financial protection laws are preempted only if they would have a discriminatory effect on a federal savings association or are specifically preempted by any federal law. The OCC must make a preemption determination with respect to a state consumer financial protection law on a case-by-case basis with respect to a particular state law or other state law with substantively equivalent terms. |
· | Deposit insurance was permanently increased to $250,000. |
· | The deposit insurance assessment base for FDIC insurance became the depository institution's total average assets minus the sum of its average tangible equity during the assessment period, rather than being based on the level of deposits. |
· | The minimum reserve ratio of the FDIC deposit insurance fund increased to 1.35% of estimated annual insured deposits or assessment base; however, the FDIC is directed to "offset the effect" of the increased reserve ratio for insured depository institutions with total consolidated assets of less than $10.0 billion. |
Regulation of HomeTrust Bank
HomeTrust Bank is subject to regulation and oversight by the OCC extending to all aspects of its operations. HomeTrust Bank is required to maintain minimum levels of regulatory capital and is subject to some limitations on the payment of dividends to HomeTrust Bancshares. See "- Current Capital Requirements for HomeTrust Bank," "-Limitations on Dividends and Other Capital Distributions" and "-New Capital Rules." HomeTrust Bank also is subject to some regulation and examination by the FDIC, which insures the deposits of HomeTrust Bank to the maximum extent permitted by law.
Office of the Comptroller of the Currency. The investment and lending authority of HomeTrust Bank is prescribed by federal laws and OCC regulations, and HomeTrust Bank is prohibited from engaging in any activities not permitted by such laws and regulations. As a federal savings bank, HomeTrust Bank was subject to a 35% of total assets limit on consumer loans, commercial paper and corporate debt securities, a 20% limit on commercial loans, a 10% limit on certain leases, and a 400% of total capital limit on non-residential real property loans. At June 30, 2014, HomeTrust Bank had 0.9% of its assets in consumer loans, commercial paper and corporate debt securities, 3.0% of its assets in commercial loans, 5.2% of its assets in leases subject to the 10% limit, and 146.0% of its total capital in non-residential real property loans. These limits do not apply to HomeTrust Bank as a national bank.
As a federal savings association, HomeTrust Bank was required to meet a qualified thrift lender ("QTL") test. This test required HomeTrust Bank to have at least 65% of its portfolio assets, as defined by regulation, in qualified thrift investments on a monthly average for nine out of every 12 months on a rolling basis. As of June 30, 2014, HomeTrust Bank met the QTL test. The QTL test does not apply to HomeTrust Bank as a national bank.
HomeTrust Bank is subject to a statutory lending limit on aggregate loans to one person or a group of persons combined because of certain relationships and common interests. That limit is generally equal to 15% of HomeTrust Bank's unimpaired capital and surplus, which was $43.1 million. The limit is increased to 25% for loans fully secured by readily marketable collateral . HomeTrust Bank has no lending relationships in excess of our lending limit.
HomeTrust Bank is subject to periodic examinations by the OCC. During these examinations, the examiners may require the Bank to provide for higher general or specific loan loss reserves, which can impact our capital and earnings. HomeTrust Bank is subject to a semi-annual assessment based upon its total assets and regulatory risk to fund the operations of the OCC.
The OCC has adopted guidelines establishing safety and soundness standards on such matters as loan underwriting and documentation, asset quality, earnings standards, internal controls and audit systems, interest rate risk exposure and employee compensation and benefits. Any institution that fails to comply with these standards must submit a compliance plan.
38
The OCC has primary enforcement responsibility over HomeTrust Bank and has authority to bring actions against HomeTrust Bank and certain institution-affiliated parties, including officers, directors and employees, for violations of laws or regulations and for engaging in unsafe and unsound practices. Formal enforcement actions include the issuance of a capital directive or cease and desist order, civil money penalties, removal of officers and/or directors and receivership or conservatorship of the institution. Civil penalties cover a wide range of violations and can amount to $25,000 per day, or even $1 million per day in especially egregious cases. The FDIC has the authority to recommend to the OCC that enforcement action be taken with respect to a particular institution. If action is not taken by the OCC, the FDIC has authority to take such action under certain circumstances. Federal law also establishes criminal penalties for certain violations or improper conduct.
Pursuant to the Dodd-Frank Act, federal banking and securities regulators issued final rules to implement Section 619 of the Dodd-Frank Act (the "Volcker Rule"). These rules became effective April 15, 2014, with a conformance period for certain features lasting until July 21, 2015. Generally, subject to a transition period and certain exceptions, the Volcker Rule restricts insured depository institutions and their affiliated companies from engaging in short-term proprietary trading of certain securities, investing in funds with collateral comprised of less than 100% loans that are not registered with the SEC and from engaging in hedging activities that do not hedge a specific identified risk.
Insurance of Accounts and Regulation by the FDIC. The deposit insurance fund of the FDIC insures deposit accounts in HomeTrust Bank up to $250,000 per separately insured deposit ownership right or category. The FDIC may initiate an action for termination of deposit insurance, if it is deemed warranted based on violations or other unsafe and unsound conduct at the institution.
The Dodd-Frank Act requires that FDIC deposit insurance assessments be based on assets instead of deposits. The FDIC has issued rules for this purpose, under which the assessment base for an institution is average total assets minus Tier 1 capital. The FDIC assesses deposit insurance premiums on each FDIC-insured institution quarterly based on annualized rates for one of four risk categories applied to its deposits, subject to certain adjustments. Each institution is assigned to one of four risk categories based on its capital, supervisory ratings and other factors. Well capitalized institutions that are financially sound with only a few minor weaknesses are assigned to Risk Category I. Risk Categories II, III and IV involve progressively greater risks to the deposit insurance fund, due to weaknesses at the insured institution. For an institution with assets of less than $18 billion, assessments are as follows. For Risk Category I, initial base assessment rates are 5 to 9 basis points, and after adjustments for unsecured debt issued by an institution, total base assessment rates would be 2.5 to 9 basis points, subject to increases for institutions that hold unsecured debt of other FDIC-insured institutions. For Risk Categories II to IV, initial base assessment rates are 14 to 35 basis points, subject to adjustments for unsecured debt issued by an institution and brokered deposits, such that total base assessment rates are 9 to 45 basis points, subject to increases for institutions that hold unsecured debt of other FDIC-insured institutions. The FDIC may change assessment rates or revise its risk-based assessment system if deemed necessary to maintain an adequate reserve ratio for the fund.
Transactions with Related Parties. Transactions between HomeTrust Bank and its affiliates are required to be on terms as favorable to HomeTrust Bank as transactions with non-affiliates. Certain of these transactions, such as loans to an affiliate, are restricted to a percentage of HomeTrust Bank's capital, and loans to affiliates require eligible collateral in specified amounts. In addition, HomeTrust Bank may not lend to any affiliate engaged in activities not permissible for a bank holding company or acquire the securities of most affiliates. HomeTrust Bancshares is an affiliate of HomeTrust Bank.
Federal law generally prohibits loans by HomeTrust Bancshares to its executive officers and directors, but there is a specific exception for loans made by HomeTrust Bank to its executive officers and directors in compliance with federal banking laws. However, HomeTrust Bank's authority to extend credit to its executive officers, directors and 10% shareholders ("insiders"), as well as entities those insiders control, is limited. The individual and aggregate amounts of loans that HomeTrust Bank may make to insiders are based, in part, on HomeTrust Bank's capital level and require that certain board approval procedures be followed. Such loans are required to be made on terms substantially the same as those offered to unaffiliated individuals and not involve more than the normal risk of repayment. There is an exception for loans made pursuant to a benefit or compensation program that is widely available to all employees of the institution and does not give preference to insiders over other employees. Loans to executive officers are subject to additional limitations based on the type of loan involved.
39
Current Capital Requirements for HomeTrust Bank. HomeTrust Bank is required to maintain specified levels of regulatory capital under regulations of the OCC. OCC regulations state that to be "adequately capitalized," HomeTrust Bank must have a leverage ratio of at least 4.0%, a Tier 1 capital ratio of at least 4.0% and a total capital ratio of at least 8.0%. To be "well capitalized" under current regulations, HomeTrust Bank must have a leverage ratio of at least 5.0%, a Tier 1 risk-based capital ratio of at least 6.0% and a total risk-based capital ratio of at least 10.0%. At June 30, 2014, HomeTrust Bank was considered a "well-capitalized" institution under OCC regulations.
The term "leverage ratio" means the ratio of Tier 1 capital to adjusted total assets. The term "Tier 1 capital ratio" means the ratio of Tier 1 capital to risk-weighted assets. The term "total capital ratio" means the ratio of total capital to risk-weighted assets.
The term "Tier 1 capital" generally consists of common shareholders' equity and retained earnings and certain noncumulative perpetual preferred stock and related earnings, excluding most intangible assets. At June 30, 2014, HomeTrust Bank had $13.8 million of intangible assets, $58.4 million of deferred tax assets and $1.1 million of other assets excluded from Tier 1 capital.
"Total capital" consists of the sum of an institution's Tier 1 capital and the amount of its Tier 2 capital up to the amount of its Tier 1 capital. Tier 2 capital consists generally of certain cumulative and other perpetual preferred stock, certain subordinated debt and other maturing capital instruments, the amount of the institution's allowance for loan and lease losses up to 1.25% of risk-weighted assets and certain unrealized gains on equity securities.
Risk-weighted assets are determined under the OCC capital regulations that assign to every asset, including certain off-balance sheet items, a risk weight generally ranging from 0% to 100% based on the inherent risk of the asset. The OCC is authorized to require HomeTrust Bank to maintain an additional amount of total capital to account for concentrations of credit risk, levels of interest rate risk, equity investments in non-financial companies and the risks of non-traditional activities or other supervisory concerns.
Institutions that are not well capitalized are subject to certain restrictions on brokered deposits and interest rates on deposits. The OCC is authorized and, under certain circumstances, required to take certain actions against savings associations that fail to meet the minimum ratios for an "adequately capitalized institution." Any such institution must submit a capital restoration plan and, until such plan is approved by the OCC, may not increase its assets, acquire another depository institution, establish a branch or engage in any new activities, or make capital distributions. The OCC is authorized to impose the additional restrictions on savings associations that are less than adequately capitalized.
OCC regulations state that an institution that fails to comply with its capital plan or has Tier 1 or leverage ratio of less than 3.0% or a total capital ratio of less than 6.0% is considered "significantly undercapitalized" and must be made subject to one or more additional specified actions and operating restrictions that may cover all aspects of its operations and may include a forced merger or acquisition of the institution. An institution with tangible equity to total assets of less than 2.0% is "critically undercapitalized" and becomes subject to further mandatory restrictions on its operations. The OCC generally is authorized to reclassify an institution into a lower capital category and impose the restrictions applicable to such category if the institution is engaged in unsafe or unsound practices or is in an unsafe or unsound condition. The imposition by the OCC of any of these measures on HomeTrust Bank may have a substantial adverse effect on our operations and profitability. In general, the FDIC must be appointed receiver for a critically undercapitalized institution whose capital is not restored within the time provided. When the FDIC as receiver liquidates an insured institution, the claims of depositors and the FDIC as their successor (for deposits covered by FDIC insurance) have priority over other unsecured claims against the institution.
New Capital Rules. Effective January 1, 2015 (with some changes transitioned into full effectiveness over two to four years), HomeTrust Bank will be subject to new capital requirements adopted by the OCC, which create a new required ratio for common equity Tier 1 ("CET1") capital, increases the leverage and Tier 1 capital ratios, changes the risk-weightings of certain assets for purposes of the risk-based capital ratios, creates an additional capital conservation buffer over the required capital ratios and changes what qualifies as capital for purposes of meeting these various capital requirements. HomeTrust Bank will be required to maintain additional levels of Tier 1
40
common equity over the minimum risk-based capital levels before it may pay dividends, repurchase shares or pay discretionary bonuses.
When these new requirements become effective, to meet its minimum capital requirements, HomeTrust Bank must have a ratio of common equity Tier 1 capital (CET1 capital) to total risk-weighted assets the ("CET1 risk-based ratio") of 4.5%, a Tier 1 capital ratio of 6.0%, a total capital ratio of 8.0% and a leverage ratio of 4.0%.
For all of these capital requirements, there are a number of changes in what constitutes regulatory capital, subject to a two-year transition period. These changes include the phasing-out of certain instruments as qualifying capital. HomeTrust Bank does not have any of these instruments. Mortgage servicing and deferred tax assets over designated percentages of CET1 will be deducted from capital, subject to a two-year transition period. CET1 will consist of Tier 1 capital less all capital components that are not considered common equity. In addition, Tier 1 capital will include accumulated other comprehensive income, which includes all unrealized gains and losses on available for sale debt and equity securities, subject to a two-year transition period . Because of its asset size, HomeTrust Bank has the one-time option of deciding in the first quarter of 2015 whether to permanently opt-out of the inclusion of unrealized gains and losses on available for sale debt and equity securities in its capital calculations. HomeTrust Bank is considering whether to take advantage of this opt-out to reduce the impact of market volatility on its regulatory capital levels.
The new requirements also include changes in the risk-weighting of assets to better reflect credit risk and other risk exposure. These include a 150% risk weight (up from 100%) for certain high volatility commercial real estate acquisition, development and construction loans and for non-residential mortgage loans that are 90 days past due or otherwise in nonaccrual status; a 20% (up from 0%) credit conversion factor for the unused portion of a commitment with an original maturity of one year or less that is not unconditionally cancellable (currently set at 0%); and a 250% risk weight (up from 100%) for mortgage servicing and deferred tax assets that are not deducted from capital.
In addition to the minimum CET1, Tier 1 and total capital ratios, HomeTrust Bank will have to maintain a capital conservation buffer consisting of additional CET1 capital equal to 2.5% of risk-weighted assets above the required minimum levels in order to avoid limitations on paying dividends, engaging in share repurchases, and paying discretionary bonuses based on percentages of eligible retained income that could be utilized for such actions. This new capital conservation buffer requirement is to be phased in beginning in January 2016 at 0.625% of risk-weighted assets and increasing each year until fully implemented in January 2019.
The OCC's prompt corrective action framework changes when these new capital ratios become effective. Under the new standards, in order to be considered well-capitalized, HomeTrust Bank would have to have a CET1 risk-based ratio of 6.5% (new), a Tier 1 risk-based ratio of 8% (increased from 6%), a total risk-based capital ratio of 10% (unchanged) and a leverage ratio of 5% (unchanged).
HomeTrust Bank has conducted a pro forma analysis of the application of these new capital requirements as of June 30, 2014. We have determined that HomeTrust Bank meets all these new requirements, including the full 2.5% capital conservation buffer, and remains well-capitalized, if these new requirements had been in effect on that date.
Community Reinvestment and Consumer Protection Laws. In connection with its deposit-taking, lending and other activities, HomeTrust Bank is subject to a number of federal laws designed to protect consumers and promote lending to various sectors of the economy and population. The CFPB issues regulations and standards under these federal consumer protection laws, which include the Equal Credit Opportunity Act, the Truth-in-Lending Act, the Home Mortgage Disclosure Act and the Real Estate Settlement Procedures Act. Through its rulemaking authority, the CFPB has promulgated a number of proposed and final regulations under these laws that will affect our consumer businesses. Among these regulatory initiatives, are final regulations setting "ability to repay" and "qualified mortgage" standards for residential mortgage loans and establishing new mortgage loan servicing and loan originator compensation standards. HomeTrust Bank is evaluating these recent CFPB regulations and proposals and devotes substantial compliance, legal and operational business resources to ensure compliance with these consumer protection standards. In addition, the OCC has enacted customer privacy regulations that limit the ability of HomeTrust Bank to disclose nonpublic consumer information to non-affiliated third parties. The
41
regulations require disclosure of privacy policies and allow consumers to prevent certain personal information from being shared with non-affiliated parties.
The Community Reinvestment Act ("CRA") requires that the OCC assess HomeTrust Bank's record in meeting the credit needs of the communities it serves, especially low and moderate income neighborhoods. Under the CRA, institutions are assigned a rating of "outstanding," "satisfactory," "needs to improve," or "substantial non-compliance." HomeTrust Bank received an "outstanding" rating in its most recent CRA evaluation.
Bank Secrecy Act / Anti-Money Laundering Laws. HomeTrust Bank is subject to the Bank Secrecy Act and other anti-money laundering laws and regulations, including the USA PATRIOT Act of 2001. These laws and regulations require HomeTrust Bank to implement policies, procedures, and controls to detect, prevent, and report money laundering and terrorist financing and to verify the identity of their customers. Violations of these requirements can result in substantial civil and criminal sanctions. In addition, provisions of the USA PATRIOT Act require the federal financial institution regulatory agencies to consider the effectiveness of a financial institution's anti-money laundering activities when reviewing mergers and acquisitions.
Limitations on Dividends. OCC regulations impose various restrictions on the ability of HomeTrust Bank to pay dividends. HomeTrust Bank generally may pay dividends during any calendar year in an amount up to 100% of net income for the year-to-date plus retained net income for the two preceding years, so long as it is well-capitalized after the distribution. If HomeTrust Bank proposes to pay a dividend when it does not meet its capital requirements or that will exceed these limitations, it must obtain the OCC's prior approval prior. The OCC may object to a proposed dividend based on safety and soundness concerns. No insured depository institution may pay a dividend if, after paying the dividend, the institution would be undercapitalized. In addition, as noted above, beginning in 2016, if HomeTrust Bank does not have the required capital conservation buffer, its ability to pay dividends to HomeTrust Bancshares will be limited.
Holding Company Regulation
HomeTrust Bancshares was a savings and loan holding company until August 25, 2014, and is now a bank holding company, subject to regulation, supervision and examination by the Federal Reserve. The Federal Reserve has enforcement authority with respect to HomeTrust Bancshares similar to that of the OCC over HomeTrust Bank. Applicable federal law and regulations limit the activities of HomeTrust Bancshares and require the approval of the Federal Reserve for any acquisition of a subsidiary, including another financial institution or holding company thereof, or a merger or acquisition of HomeTrust Bancshares. HomeTrust Bancshares must serve as a source of strength for HomeTrust Bank, maintaining the ability to provide financial assistance if HomeTrust Bank suffers financial distress. These and other Federal Reserve policies may restrict HomeTrust Bancshares' ability to pay dividends. In addition, dividends from HomeTrust Bancshares may depend, in part, upon its receipt of dividends from HomeTrust Bank. As noted below, beginning in 2016, if HomeTrust Bancshares does not have the required capital conservation buffer or otherwise meet its new capital requirements, its ability to pay dividends to its stockholders will be limited.
A bank holding company is required to give the Federal Reserve prior written notice of any purchase or redemption of its outstanding equity securities if the gross consideration for the purchase or redemption, when combined with the net consideration paid for all such purchases or redemption during the preceding 12 months, is equal to 10% or more of the company's consolidated net worth. The Federal Reserve may disapprove such a purchase or redemption if it determines that the proposal would constitute an unsafe or unsound practice or would violate any law, regulation, Federal Reserve order, or any condition imposed by, or written agreement with, the Federal Reserve. This notification requirement does not apply to any company that meets the well-capitalized standard for bank holding companies, is well-managed, and is not subject to any unresolved supervisory issues.
Permissible Activities. The business activities of HomeTrust Bancshares are generally limited to those activities permissible for bank holding companies under Section 4(c)(8) of the Bank Holding Company Act and certain additional activities authorized by the Federal Reserve regulations. The Bank Holding Company Act generally prohibits a bank holding company from acquiring direct or indirect ownership or control of more than 5% of the voting shares of any company which is not a bank or bank holding company. A bank holding company must obtain Federal Reserve Board approval before acquiring directly or indirectly, ownership or control of any voting
42
shares of another bank or bank holding company if, after such acquisition, it would own or control more than 5% of such shares (unless it already owns or controls the majority of such shares).
Capital Requirements for HomeTrust Bancshares. Effective with its conversion to a bank holding company on August 25, 2014, HomeTrust Bancshares is subject to the minimum regulatory capital requirements established by the Federal Reserve, and meets the standards for a well-capitalized bank holding company, which require a ratio of total capital ratio of at least 10.0% and a ratio of Tier 1 capital ratio of at least 6.0%, on a consolidated basis. Effective January 1, 2015, HomeTrust Bancshares will be subject to new regulatory capital requirements adopted by the Federal Reserve, which are the same as the new capital requirements for HomeTrust Bank. These new capital requirements include provisions such as the capital conservation buffer requirement that can limit the ability of HomeTrust Bancshares to pay dividends to its stockholders or repurchase its shares. For a description of these capital requirements, see "Regulation of HomeTrust Bank – New Capital Rules." HomeTrust Bancshares will be subject to the same capital conservation buffer requirement as described above for HomeTrust Bank.
HomeTrust Bancshares has conducted a pro forma analysis of the application of these new capital requirements as of June 30, 2014. We have determined that HomeTrust Bancshares, Inc. meets all these new requirements, including the full 2.5% capital conservation buffer, and remains well-capitalized, as if these new requirements had been effect on that date.
Federal Securities Law. The stock of HomeTrust Bancshares is registered with the SEC under the Securities Exchange Act of 1934, as amended (the "Exchange Act"). HomeTrust Bancshares is subject to the information, proxy solicitation, insider trading restrictions and other requirements of the SEC under the Exchange Act.
The SEC has adopted regulations and policies applicable to a registered company under the Exchange Act that seek to increase corporate responsibility, provide for enhanced penalties for accounting and auditing improprieties and protect investors by improving the accuracy and reliability of corporate disclosures in SEC filings. These regulations and policies include very specific additional disclosure requirements and mandate new corporate governance practices.
On April 5, 2012, the Jumpstart Our Business Startups Act of 2012 (the "JOBS Act") was signed into law. The JOBS Act contains provisions that, among other things, reduce certain reporting requirements for qualifying public companies. We are an "emerging growth company," as defined in Section 2(a) of the Securities Act of 1933, (the "Securities Act"), as modified by the JOBS Act. We are eligible to take advantage of certain exemptions from various reporting requirements that are applicable to other public companies that are not emerging growth companies, including, but not limited to, an exemption from the requirement of holding a non-binding advisory vote on executive compensation. In addition, we will not be subject to certain requirements of Section 404 of the Sarbanes-Oxley Act of 2002 (the "Sarbanes Oxley Act"), including the additional level of review of our internal control over financial reporting as may occur when outside auditors attest as to our internal control over financial reporting. As a result, our stockholders may not have access to certain information they may deem important. Further, we are eligible to delay adoption of new or revised accounting standards applicable to public companies and we may take advantage of the benefits of this extended transition period, although to date we have not done so. Accordingly, our financial statements may not be comparable to companies that comply with such new or revised accounting standards. These exemptions will apply for a period of five years following the completion of our initial public offering or until we are no longer an "emerging growth company," whichever is earlier.
Federal Taxation
General . HomeTrust Bancshares and HomeTrust Bank are subject to federal income taxation in the same general manner as other corporations, with some exceptions discussed below. The following discussion of federal taxation is intended only to summarize material federal income tax matters and is not a comprehensive description of the tax rules applicable to HomeTrust Bancshares and HomeTrust.
Method of Accounting . For federal income tax purposes, HomeTrust Bank currently reports its income and expenses on the accrual method of accounting and uses a fiscal year ending on June 30th for filing its federal
43
income tax return. The Small Business Protection Act of 1996 eliminated the use of the reserve method of accounting for bad debt reserves by savings institutions, effective for taxable years beginning after 1995.
Minimum Tax . The Internal Revenue Code imposes an alternative minimum tax at a rate of 20% on a base of regular taxable income plus certain tax preferences, called alternative minimum taxable income. The alternative minimum tax is payable to the extent such alternative minimum taxable income is in excess of the regular tax. Net operating losses can offset no more than 90% of alternative minimum taxable income. Certain payments of alternative minimum tax may be used as credits against regular tax liabilities in future years. At June 30, 2014, HomeTrust had alternative minimum tax credit carryforwards of approximately $3.8 million.
Net Operating Loss Carryovers . A financial institution may carryback net operating losses to the preceding two taxable years and forward to the succeeding 20 taxable years. This provision applies to losses incurred in taxable years beginning after August 6, 1997. In 2009, Internal Revenue Code Section 172 (b) (1) was amended to allow businesses to carry back losses incurred in 2008 and 2009 for up to five years to offset 50% of the available income from the fifth year and 100% of the available income for the other four years. At June 30, 2014, we had $64.2 million of net operating loss carryforwards for federal income tax purposes.
Corporate Dividends-Received Deduction. HomeTrust Bancshares will elect to file a consolidated return with HomeTrust Bank. As a result, any dividends HomeTrust Bancshares receives from HomeTrust Bank will not be included as income to HomeTrust Bancshares. The corporate dividends-received deduction is 100%, or 80% in the case of dividends received from corporations with which a corporate recipient does not file a consolidated tax return, depending on the level of stock ownership of the payer of the dividend.
State Taxation
North Carolina. On July 24, 2013, The Tax Simplification and Reduction Act of 2013 was signed into law. With this act, corporate income tax rates in North Carolina will be reduced. For tax years beginning on or after January 1, 2014, the tax rate will decrease from 6.9% to 6%. For tax years beginning on or after January 1, 2015, the tax rate will decrease to 5%. The statutory tax rate will continue to decrease in 1% increments to 4% in 2016 and 3% in 2017, if declared net General Fund tax collection revenue goals are met based on projected economic growth. Therefore, the decrease in the North Carolina corporate tax rate reduced the deferred tax assets currently recorded on our balance sheet with a corresponding increase to our income tax provision, as temporary tax differences are reversed at lower state tax rates.
If a corporation in North Carolina does business in North Carolina and in one or more other states, North Carolina taxes a fraction of the corporation's income based on the amount of sales, payroll and property it maintains within North Carolina. North Carolina franchise tax is levied on business corporations at the rate of $1.50 per $1,000 of the largest of the following three alternate bases: (i) the amount of the corporation's capital stock, surplus and undivided profits apportionable to the state; (ii) 55% of the appraised value of the corporation's property in the state subject to local taxation; or (iii) the book value of the corporation's real and tangible personal property in the state less any outstanding debt that was created to acquire or improve real property in the state.
Any cash dividends, in excess of a certain exempt amount, that would be paid with respect to HomeTrust Bancshares common stock to a shareholder (including a partnership and certain other entities) who is a resident of North Carolina will be subject to the North Carolina income tax. Any distribution by a corporation from earnings according to percentage ownership is considered a dividend, and the definition of a dividend for North Carolina income tax purposes may not be the same as the definition of a dividend for federal income tax purposes. A corporate distribution may be treated as a dividend for North Carolina income tax purposes if it is paid from funds that exceed the corporation's earned surplus and profits under certain circumstances.
44
EXECUTIVE OFFICERS
The following individuals are executive officers of HomeTrust Bancshares and HomeTrust Bank and hold the offices set forth below opposite their names.
Name | Age (1) | Position | |||
Dana L. Stonestreet | 60 | Chairman, President and Chief Executive Officer | |||
Tony J. VunCannon | 49 | Senior Vice President, Chief Financial Officer and Treasurer | |||
Howard L. Sellinger | 61 | Senior Vice President and Chief Information Officer | |||
C. Hunter Westbrook | 51 | Senior Vice President and Chief Banking Officer | |||
Teresa White | 57 | Senior Vice President, Chief Administration Officer and Corporate Secretary | |||
Keith Houghton | 52 | Senior Vice President and Chief Credit Officer | |||
_________________________
(1) | As of June 30, 2014. |
Biographical Information. Set forth below is certain information regarding the executive officers of HomeTrust Bancshares and HomeTrust Bank. There are no family relationships among or between the executive officers.
Dana L. Stonestreet . As part of the CEO succession plan for HomeTrust Bancshares and HomeTrust Bank, Mr. Stonestreet, who had been serving as President and Chief Operating Officer and as a director of HomeTrust Bank since 2008 and as President and Chief Operating Officer of HomeTrust Bancshares since HomeTrust Bank's mutual-to-stock conversion, became co-Chief Executive Officer of HomeTrust Bancshares and HomeTrust Bank in 2013. Mr. Stonestreet became President, Chairman and Chief Executive Officer of HomeTrust Bancshares and HomeTrust Bank effective at the annual meeting in November 2013. Mr. Stonestreet joined HomeTrust Bank in 1989 as its Chief Financial Officer and was promoted to Chief Operating Officer in 2003. Mr. Stonestreet began his career with Hurdman & Cranston (an accounting firm that was later merged into KPMG) as a certified public accountant. Mr. Stonestreet also serves as a director and chairman for the Asheville Area Chamber of Commerce, a director of United Way and a director of the HUB Community Economic Development Alliance Board. In addition, Mr. Stonestreet has served as a director for RiverLink, the YMCA, the North Carolina Bankers Association and other community organizations. Mr. Stonestreet's 24 years of service with HomeTrust Bank gives him in-depth knowledge of nearly all aspects of its operations. Mr. Stonestreet's accounting background and prior service as HomeTrust Bank's Chief Financial Officer also provide him with a strong understanding of the various financial matters brought before the Board.
Tony J. VunCannon . Mr. VunCannon is a certified public accountant and has served as Senior Vice President, Chief Financial Officer, and Treasurer of HomeTrust Bank since July 2006. From March 1997 to June 2006, Mr. VunCannon served as Vice President and Treasurer of HomeTrust Bank and from April 1992 to February 1997, Mr. VunCannon served as Controller of HomeTrust Bank. In addition, Mr. VunCannon has served as Senior Vice President, Chief Financial Officer and Treasurer of HomeTrust Bancshares since HomeTrust Bank's mutual-to-stock conversion. Previously, Mr. VunCannon was employed by KPMG in Charlotte, North Carolina.
Howard L. Sellinger . Mr. Sellinger has served as Senior Vice President and Chief Information Officer of HomeTrust Bank since July 2006. Mr. Sellinger joined HomeTrust Bank in 1975 as a management trainee. Mr. Sellinger became the Office Manager of the Skyland office from 1976 till 1978. His experience also includes being the Head of Mortgage Loan Operations with loan approval authority, the Head of Loan Servicing with workout approval authority, and was responsible for regulatory compliance in Lending and deposit Operations for many years. In 1988, he was named Operations Manager and was promoted to Vice President and Chief Information Officer in 1997.
C. Hunter Westbrook . Mr. Westbrook joined HomeTrust Bank in June 2012 as Senior Vice President and Chief Banking Officer. Mr. Westbrook also holds these positions with HomeTrust Bancshares. He began his career
45
Teresa White . Ms. White joined HomeTrust Bank in May 2011 as Senior Vice President and Chief Administration Officer. Ms. White was also appointed as Corporate Secretary of HomeTrust Bank in December 2011. In addition, Ms. White has served as Senior Vice President, Chief Administration Officer and Corporate Secretary of HomeTrust Bancshares since HomeTrust Bank's mutual-to-stock conversion. Prior to joining HomeTrust Bank, since 2006, Ms. White served as Senior Vice President, Chief of Human Resources and Training Officer for Capital Bank, Raleigh, North Carolina, a publicly held community bank with approximately $1.7 billion in assets. From 2005 to 2006, Ms. White served as Director, Corporate Human Resources, for Nash Finch Company, Edina, Minnesota, a leading food retail and distribution company. From 2002 to 2005, Ms. White served as Director of Human Resources for ConAgra Foods Snack Foods Group, Edina, Minnesota, a division of ConAgra Foods.
Keith Houghton. Mr. Houghton joined HomeTrust Bank in March of 2014 as Senior Vice President and Chief Credit Officer. Mr. Houghton has more than 25 years of experience in the banking industry. For nearly 17 years, he held a variety of senior positions in the credit and lending areas with StellarOne Corporation, a Charlottesville, VA-based bank holding company with approximately $3 billion in assets, and its predecessors, until the sale of StellarOne to another bank in January of this year. The most recent of those positions was Chief Credit Risk Officer, which Mr. Houghton held since 2007.
46
Item 1A. Risk Factors
An investment in our common stock is subject to risks inherent in our business. Before making an investment decision, you should carefully consider the risks and uncertainties described below together with all of the other information included in this report. In addition to the risks and uncertainties described below, other risks and uncertainties not currently known to us or that we currently deem to be immaterial also may materially and adversely affect our business, financial condition and results of operations. The value or market price of our common stock could decline due to any of these identified or other risks, and you could lose all or part of your investment.
Risks Related to Our Business
Changes in economic conditions, particularly a further economic slowdown in our primary market areas, could hurt our business.
Our primary market areas are concentrated in North Carolina (including the Asheville metropolitan area, the "Piedmont" region, and Charlotte), South Carolina (Greenville), East Tennessee (including Kingsport/Johnson City, Knoxville, and Morristown) and the Roanoke Valley area of Virginia. Adverse economic conditions in our market areas can reduce our rate of growth, affect our customers' ability to repay loans and adversely impact our financial condition and earnings. General economic conditions, including inflation, unemployment and money supply fluctuations, also may affect our profitability adversely. Weak economic conditions and ongoing strains in the financial and housing markets have resulted in higher levels of loan and lease delinquencies, problem assets and foreclosures and a decline in the values of the collateral securing our loans.
Although the U.S. economy and housing market, including in our market areas, appears to be improving, further deterioration in economic conditions, particularly within our primary market areas could result in the following consequences, among others, any of which could materially hurt our business:
| · | loan delinquencies may increase; |
| · | problem assets and foreclosures may increase; |
| · | demand for our products and services may decline; |
| · | collateral for our loans may decline in value, in turn reducing a customer's borrowing power and reducing the value of collateral securing our loans; and |
| · | the net worth and liquidity of loan guarantors may decline, impairing their ability to honor commitments to us. |
A continued weak economic recovery or a return to recessionary conditions could increase our level of nonperforming assets, lower real estate values in our market and reduce demand for loans, which would result in increased loan losses and lower earnings.
Our markets have been adversely impacted by the severe national economic recession of 2008 and 2009, and the weak economic recovery has resulted in continued uncertainty in the financial markets and the expectation of weak general economic conditions continuing through calendar year 2014. Furthermore, the Board of Governors of the Federal Reserve System, in an attempt to help the overall economy, has, among other things, kept interest rates low through its targeted federal funds rate and the purchase of mortgage-backed securities. If the Federal Reserve increases the federal funds rate, overall interest rates will likely rise, which may negatively impact the housing markets and the U.S. economic recovery. While it is impossible to predict how long these conditions may exist, the current economic weaknesses could present substantial risks for some time for the banking industry and for us. A continued weak recovery or a return to recessionary conditions would result in higher than expected nonperforming assets, decreased real estate values in our market, and a decrease in demand for our products and services. These negative events would lead to higher loan losses and lower earnings, and could adversely impact our capital, liquidity and financial condition.
47
Declines in property values have increased loan-to-value ratios on a significant portion of our one- to four-family loans and home equity lines of credit, which exposes us to greater risk of loss.
Many of our one- to four-family loans and home equity lines of credit are secured by liens on mortgage properties in which the borrowers have little or no equity because of these declines in home values in our market areas. Residential loans with high combined loan-to-value ratios will be more sensitive to declining property values than those with lower combined loan-to-value ratios and therefore may experience a higher incidence of default and severity of losses. In addition, if the borrowers sell their homes, they may be unable to repay their loans in full from the sale. Further, the majority of our home equity lines of credit consist of second mortgage loans. For those home equity lines secured by a second mortgage, it is unlikely that we will be successful in recovering all or a portion of our loan proceeds in the event of default unless we are prepared to repay the first mortgage loan and such repayment and the costs associated with a foreclosure are justified by the value of the property. For these reasons, we may experience higher rates of delinquencies, defaults and losses.
Our non-owner-occupied real estate loans may expose us to increased credit risk.
At June 30, 2014, $78.0 million, or 11.8%, of our one-to four-family loans and 5.2% of our total loan portfolio, consisted of loans secured by non-owner-occupied residential properties. Loans secured by non-owner-occupied properties generally expose a lender to greater risk of non-payment and loss than loans secured by owner-occupied properties because repayment of such loans depend primarily on the tenant's continuing ability to pay rent to the property owner, who is our borrower, or, if the property owner is unable to find a tenant, the property owner's ability to repay the loan without the benefit of a rental income stream. In addition, the physical condition of non-owner-occupied properties is often below that of owner-occupied properties due to lax property maintenance standards, which has a negative impact on the value of the collateral properties. Furthermore, some of our non-owner-occupied residential loan borrowers have more than one loan outstanding with HomeTrust Bank which may expose us to a greater risk of loss compared to an adverse development with respect to an owner-occupied residential mortgage loan.
Our construction and development loans and construction and land/lot loans have a higher risk of loss than residential or commercial real estate loans.
At June 30, 2014, construction and land/lot loans in our retail consumer loan portfolio was $59.2 million, or 4.0%, of our total loan portfolio. At that date, construction and development loans in our commercial loan portfolio totaled $56.5 million, or 3.8%, of our total loan portfolio. Construction and development lending includes the inherent difficulty in estimating both a property's value at completion of the project and the estimated cost (including interest) of the project. If the estimate of construction cost proves to be inaccurate, we may advance funds beyond the amount originally committed to permit completion of the project. If the estimate of value upon completion proves to be inaccurate, we may be confronted at, or prior to, the maturity of the loan with a project the value of which is insufficient to assure full repayment. In addition, speculative construction loans to a builder are for homes that are not pre-sold, and thus pose a greater potential risk to us than construction loans to individuals on their personal residences. Loans on land under development or held for future construction as well as lot loans made to individuals for the future construction of a residence also pose additional risk because of the lack of income being produced by the property and the potential illiquid nature of the collateral. These risks can be significantly impacted by supply and demand conditions. As a result, this type of lending often involves the disbursement of substantial funds with repayment dependent on the success of the ultimate project and the ability of the borrower to sell the property, rather than the ability of the borrower or guarantor to independently repay principal and interest. While our origination of construction and development loans has decreased significantly over the last four years, we continue to have significant levels of construction and development loan balances as a result of recent merger activity. Most of our construction loans are for the construction of single family residences. Reflecting the current slowdown in the residential market, the secondary market for construction and development loans is depressed, so we have less opportunity to mitigate our credit risk by selling part or all of our interest in these loans. If we foreclose on a construction and development loan, our holding period for the collateral typically may be longer than we have historically experienced because there are fewer potential purchasers of the collateral. The decline in the number of potential purchasers has contributed to the decline in the value of these loans. Accordingly, charge-offs on construction and development loans have recently been and may continue to be larger than those incurred by other segments of our loan portfolio. At June 30, 2014, $5.1 million of our construction and development loans were for
48
speculative construction loans. Also at June 30, 2014, $688,000 or 1.2%, of our total construction and land/lot loans and $6.3 million or 11.1%, of our construction and development loans were non-accruing.
Our commercial real estate loans involve higher principal amounts than other loans and repayment of these loans may be dependent on factors outside our control or the control of our borrowers.
At June 30, 2014, commercial real estate loans were $377.8 million, or 25.2% of our total loan portfolio. These loans typically involve higher principal amounts than other types of loans. Repayment is dependent upon income being generated from the property securing the loan in amounts sufficient to cover operating expenses and debt service, which may be adversely affected by changes in the economy or local market conditions. Commercial real estate loans may expose us to greater credit risk than loans secured by residential real estate because the collateral securing these loans may not be sold as easily as residential real estate. In addition, many of our commercial real estate loans are not fully amortizing and contain large balloon payments upon maturity. Balloon payments may require the borrower to either sell or refinance the underlying property in order to make the payment, which may increase the risk of default or non-payment.
Repayment of our municipal leases is dependent on the fire department receiving tax revenues from the county/municipality.
At June 30, 2014, municipal leases were $106.2 million, or 7.1%, of our total loan portfolio. We offer ground and equipment lease financing to fire departments located throughout North Carolina and, to a lesser extent, South Carolina. Repayment of our municipal leases is often dependent on the tax revenues collected by the county/municipality on behalf of the fire department. Although a municipal lease does not constitute a general obligation of the county/municipality for which the county/municipality's taxing power is pledged, a municipal lease is ordinarily backed by the county/municipality's covenant to budget for, appropriate and pay the tax revenues to the fire department. However, certain municipal leases contain "non-appropriation" clauses which provide that the municipality has no obligation to make lease or installment purchase payments in future years unless money is appropriated for that purpose on a yearly basis. In the case of a "non-appropriation" lease, our ability to recover under the lease in the event of non-appropriation or default will be limited solely to the repossession of the leased property, without recourse to the general credit of the lessee, and disposition or releasing of the property might prove difficult. At June 30, 2014, $3.0 million of our municipal leases contained a non-appropriation clause.
Our provision for loan losses and net loan charge-offs increased significantly in 2012 and we may be required to make further increases in our provision for loan losses and to charge-off additional loans in the future, which could adversely affect our results of operations.
For the year ended June 30, 2014, we recorded a provision for (recovery of) loan losses of ($6.3) million, as compared to $1.1 million and $15.6 million for the years ended June 30, 2013 and 2012, respectively. We also recorded net loan charge-offs of $2.3 million for the year ended June 30, 2014 compared to net loan charge-offs of $4.1 million and $30.6 million, for the years ended June 30, 2013 and 2012, respectively. We are still experiencing elevated levels of loan delinquencies and credit losses as compared to historical standards. At June 30, 2014, our non-performing assets totaled $62.7 million compared to $80.3 million at June 30, 2013. If current weak conditions in the housing and real estate markets continue, we expect that we will continue to experience further delinquencies and credit losses. As a result, we may be required to make further increases in our provision for loan losses and to charge off additional loans in the future, which could materially adversely affect our financial condition and results of operations.
Our allowance for loan losses may prove to be insufficient to absorb losses in our loan portfolio.
Lending money is a substantial part of our business and each loan carries a certain risk that it will not be repaid in accordance with its terms, or that any underlying collateral will not be sufficient to assure repayment. This risk is affected by, among other things:
| · | cash flow of the borrower and/or the project being financed; |
| · | the changes and uncertainties as to the future value of the collateral, in the case of a collateralized loan; |
| · | the duration of the loan; |
| · | the character and creditworthiness of a particular borrower; and |
49
| · | changes in economic and industry conditions. |
We maintain an allowance for loan losses, which we believe is an appropriate reserve to provide for probable losses in our loan portfolio. The allowance is funded by provisions for loan losses charged to expense. The amount of this allowance is determined by our management through periodic reviews and consideration of several factors, including, but not limited to:
| · | our general reserve, based on our historical default and loss experience, certain macroeconomic factors, and management's expectations of future events; |
| · | our specific reserve, based on our evaluation of non-accruing loans and their underlying collateral; and |
| · | an unallocated reserve to provide for other credit losses inherent in our portfolio that may not have been contemplated in the other loss factors. |
The determination of the appropriate level of the allowance for loan losses inherently involves a high degree of subjectivity and requires us to make significant estimates of current credit risks and future trends, all of which may undergo material changes. Continuing deterioration in economic conditions affecting borrowers, new information regarding existing loans, identification of additional problem loans and other factors, both within and outside of our control, may require an increase in the allowance for loan losses. In addition, bank regulatory agencies periodically review our allowance for loan losses and may require an increase in the provision for possible loan losses or the recognition of further loan charge-offs, based on judgments different than those of management. In addition, if charge-offs in future periods exceed the allowance for loan losses we will need additional provisions to replenish the allowance for loan losses. Any additional provisions will result in a decrease in net income and possibly capital, and may have a material adverse effect on our financial condition and results of operations.
If our nonperforming assets increase, our earnings will be adversely affected.
Our nonperforming assets (which consist of non-accruing loans and REO) were $62.7 million, or 3.02%, of total assets at June 30, 2014, while remaining unchanged at $80.3 million, or 5.1% and 4.7% of total assets, at June 30, 2013 and 2012, respectively. Our nonperforming assets adversely affect our net income in various ways:
| · | we record interest income only on a cash basis for nonaccrual loans and any nonperforming investment securities; and do not record interest income for REO; |
| · | we must provide for probable loan losses through a current period charge to the provision for loan losses; |
| · | non-interest expense increases when we write down the value of properties in our REO portfolio to reflect changing market values or recognize other-than-temporary impairment ("OTTI") on nonperforming investment securities; |
| · | there are legal fees associated with the resolution of problem assets, as well as, carrying costs, such as taxes, insurance, and maintenance fees related to our REO; and |
| · | the resolution of nonperforming assets requires the active involvement of management, which can distract them from more profitable activity. |
If additional borrowers become delinquent and do not pay their loans and we are unable to successfully manage our nonperforming assets, our losses and troubled assets could increase significantly, which could have a material adverse effect on our financial condition and results of operations. We have also classified $22.2 million in loans as performing troubled debt restructurings at June 30, 2014.
If our REO is not properly valued or sufficiently reserved to cover actual losses, or if we are required to increase our valuation reserves, our earnings could be reduced.
We obtain updated valuations in the form of appraisals and broker price opinions when a loan has been foreclosed and the property taken in as REO and at certain other times during the asset's holding period. Our net book value ("NBV") in the loan at the time of foreclosure and thereafter is compared to the updated market value of the foreclosed property less estimated selling costs (fair value). A charge-off is recorded for any excess in the asset's NBV over its fair value. If our valuation process is incorrect, or if property values decline, the fair value of our REO may not be sufficient to recover our carrying value in such assets, resulting in the need for additional charge-offs.
50
Significant charge-offs to our REO could have a material adverse effect on our financial condition and results of operations.
In addition, bank regulators periodically review our REO and may require us to recognize further charge-offs. Any increase in our charge-offs may have a material adverse effect on our financial condition and results of operations.
Impairment of our investment securities or deferred tax assets could require charges to earnings, which could result in a negative impact on our results of operations.
In assessing the impairment of investment securities, we consider the length of time and extent to which the fair value has been less than cost, the financial condition and near-term prospects of the issuers, whether the decline in market value was affected by macroeconomic conditions and whether we have the intent to sell the security or will be required to sell the security before its anticipated recovery. There can be no assurance that future declines in market value of our investment securities will not result in OTTI of these assets, which would lead to accounting charges that could have a material adverse effect on our net income and capital levels.
Deferred tax assets are only recognized to the extent it is more likely than not they will be realized. Should our management determine it is not more likely than not that the deferred tax assets will be realized, a valuation allowance with a charge to earnings would be reflected in the period. At June 30, 2014, our net deferred tax asset was $58.4 million, all of which was disallowed for regulatory capital purposes. Based on the levels of taxable income in prior years, our current year profitability, and management's expectation of profitability in future years, management has determined that no additional valuation allowance was required at June 30, 2014. If we are required in the future to take an additional valuation allowance with respect to our deferred tax asset, our financial condition and results of operations would be negatively affected.
Decreased volumes and lower gains on sales of mortgage loans sold could adversely impact our non-interest income.
We originate and sell one- to four-family mortgage loans. Our mortgage banking income is a significant portion of our non-interest income. We generate gains on the sale of one- to four-family mortgage loans pursuant to programs currently offered by investors other than governmental sponsored entities such as Fannie Mae or Freddie Mac. These investors account for a substantial portion of the secondary market in residential mortgage loans. Any future changes in their programs, our eligibility to participate in such programs, the criteria for loans to be accepted or laws that significantly affect the activity of such investors could, in turn, materially adversely affect our results of operations. Further, in a rising or higher interest rate environment, our originations of mortgage loans may decrease, resulting in fewer loans that are available to be sold to investors. This would result in a decrease in mortgage banking revenues and a corresponding decrease in non-interest income.
Historically low interest rates may adversely affect our net interest income and profitability.
During the past six years it has been the policy of the Board of Governors of the Federal Reserve System to maintain interest rates at historically low levels through its targeted federal funds rate and the purchase of mortgage-backed securities. As a result, yields on securities we have purchased, and to a lesser extent, market rates on the loans we have originated, have been at levels lower than were available prior to 2008. Consequently, the average yield on our interest earning assets has decreased during the recent low interest rate environment. As a general matter, our interest-bearing liabilities reprice or mature more quickly than our interest-earning assets, which has resulted in increases in net interest income (the difference between interest income earned on assets and interest expense paid on liabilities) in the short term. However, our ability to lower our interest expense is limited at these interest rate levels, while the average yield on our interest-earning assets may continue to decrease. Our interest rate spread for fiscal 2014 increased to 3.69% from 3.65% for fiscal 2013.
The Board of Governors of the Federal Reserve System has indicated its intention to maintain low interest rates in the near future. Accordingly, our net interest income may decrease, which may have an adverse effect on our profitability. For information with respect to changes in interest rates, see "-We are subject to interest rate risk." below.
51
We are subject to interest rate risk.
Our earnings and cash flows are largely dependent upon our net interest income. Interest rates are highly sensitive to many factors that are beyond our control, including general economic conditions and policies of various governmental and regulatory agencies and, in particular, the Federal Reserve. Changes in monetary policy, including changes in interest rates, could influence not only the interest we receive on loans and investments and the amount of interest we pay on deposits and borrowings, but these changes could also affect (i) our ability to originate loans and obtain deposits, (ii) the fair value of our financial assets and liabilities and (iii) the average duration of our mortgage-backed securities portfolio and other interest-earning assets. If the interest rates paid on deposits and other borrowings increase at a faster rate than the interest rates received on loans and other investments, our net interest income, and therefore earnings, could be adversely affected. As a result of the relatively low interest rate environment, an increasing percentage of our deposits have been comprised of short-term certificates of deposit and other deposits yielding no or a relatively low rate of interest. At June 30, 2014, we had $451.1 million in certificates of deposit that mature within one year and $948.9 million in checking, savings and money market accounts. We would incur a higher cost of funds to retain these deposits in a rising interest rate environment. Earnings could also be adversely affected if the interest rates received on loans and other investments fall more quickly than the interest rates paid on deposits and other borrowings. In addition, a substantial amount of our residential mortgage loans and home equity lines of credit have adjustable interest rates. As a result, these loans may experience a higher rate of default in a rising interest rate environment.
Although management believes it has implemented effective asset and liability management strategies to reduce the potential effects of changes in interest rates on our results of operations, any substantial, unexpected or prolonged change in market interest rates could have a material adverse effect on our financial condition and results of operations. Also, our interest rate risk modeling techniques and assumptions likely may not fully predict or capture the impact of actual interest rate changes on our balance sheet.
Liquidity risk could impair our ability to fund operations and jeopardize our financial condition.
Liquidity is essential to our business. An inability to raise funds through deposits, borrowings, the sale of loans or other sources could have a substantial negative effect on our liquidity. Our access to funding sources in amounts adequate to finance our activities or the terms of which are acceptable to us could be impaired by factors that affect us specifically or the financial services industry or economy in general. Factors that could detrimentally impact our access to liquidity sources include a decrease in the level of our business activity as a result of a downturn in the North Carolina, South Carolina, and/or Tennessee markets in which our loans are concentrated or adverse regulatory action against us. Our ability to borrow could also be impaired by factors that are not specific to us, such as a disruption in the financial markets or negative views and expectations about the prospects for the financial services industry. Deposit flows, calls of investment securities and wholesale borrowings, and the prepayment of loans and mortgage-related securities are also strongly influenced by such external factors as the direction of interest rates, whether actual or perceived, and competition for deposits and loans in the markets we serve. Furthermore, changes to the FHLB's underwriting guidelines for wholesale borrowings or lending policies may limit or restrict our ability to borrow, and could therefore have a significant adverse impact on our liquidity. In addition, the need to replace funds in the event of large-scale withdrawals of brokered deposits could require us to pay significantly higher interest rates on retail deposits or other wholesale funding sources, which would have an adverse impact on our net interest income and net income. A decline in available funding could adversely impact our ability to originate loans, invest in securities, meet our expenses, or to fulfill such obligations as repaying our borrowings or meeting deposit withdrawal demands.
Our strategy of pursuing acquisitions exposes us to financial, execution and operational risks that could adversely affect us.
We are implementing a strategy of supplementing organic growth by acquiring other financial institutions or their businesses that we believe will help us fulfill our strategic objectives and enhance our earnings. There are risks associated with this strategy, however, including the following:
| · | We may be exposed to potential asset quality issues or unknown or contingent liabilities of the banks, businesses, assets and liabilities we acquire. If these issues or liabilities exceed our estimates, our results of operations and financial condition may be materially negatively affected; |
52
| · | Prices at which future acquisitions can be made may not be acceptable to us; |
| · | Our growth initiatives may require us to recruit experienced personnel to assist in such initiatives. The failure to identify and retain such personnel would place significant limitations on our ability to execute our growth strategy; |
| · | Our strategic efforts may divert resources or management's attention from ongoing business operations and may subject us to additional regulatory scrutiny; |
| · | The acquisition of other entities generally requires integration of systems, procedures and personnel of the acquired entity into our company to make the transaction economically successful. This integration process is complicated and time consuming and can also be disruptive to the customers of the acquired business. If the integration process is not conducted successfully and with minimal effect on the acquired business and its customers, we may not realize the anticipated economic benefits of particular acquisitions within the expected time frame, and we may lose customers or employees of the acquired business. We may also experience greater than anticipated customer losses even if the integration process is successful; |
| · | To finance a future acquisition, we may borrow funds, thereby increasing our leverage and diminishing our liquidity, or raise additional capital, which could dilute the interests of our existing shareholders; |
| · | We have completed five mergers during the past five fiscal years that enhanced our rate of growth. We may not be able to continue to sustain our past rate of growth or to grow at all in the future; and |
| · | We expect our net income will increase following our acquisitions, however, we also expect our general and administrative expenses and consequently our efficiency rates will also increase. Ultimately, we would expect our efficiency ratio to improve; however, if we are not successful in our integration process, this may not occur, and our acquisitions or branching activities may not be accretive to earnings in the short or long-term. |
We operate in a highly competitive industry and market areas.
We face substantial competition in all phases of our operations from a variety of different competitors. Our future growth and success will depend on our ability to compete effectively in this highly competitive environment. To date, we have been competitive by focusing on our business lines in our market areas and emphasizing the high level of service and responsiveness desired by our customers. We compete for loans, deposits and other financial services with other commercial banks, thrifts, credit unions, brokerage houses, mutual funds, insurance companies and specialized finance companies. Many of our competitors offer products and services which we do not offer, and many have substantially greater resources and lending limits, name recognition and market presence that benefit them in attracting business. In addition, larger competitors may be able to price loans and deposits more aggressively than we do, and newer competitors may also be more aggressive in terms of pricing loan and deposit products than we are in order to obtain a share of the market. Some of the financial institutions and financial services organizations with which we compete are not subject to the same degree of regulation as is imposed on bank holding companies, federally insured state-chartered banks and national banks and federal savings banks. As a result, these nonbank competitors have certain advantages over us in accessing funding and in providing various services.
Our ability to compete successfully depends on a number of factors including the following:
| · | the ability to develop, maintain and build upon long-term customer relationships based on top-quality service, high ethical standards and safe, sound assets; |
| · | the ability to expand our market position; |
| · | the scope, relevance and pricing of products and services offered to meet customer needs and demands; |
| · | the rate at which we introduce new products and services relative to our competitors; |
| · | customer satisfaction with our level of service; and |
| · | industry and general economic trends. |
Failure to perform in any of these areas could significantly weaken our competitive position, which could adversely affect our growth and profitability, which, in turn, could have a material adverse effect on our financial condition and results of operations.
53
We operate in a highly regulated environment and may be adversely affected by changes in federal and state laws and regulations that are expected to increase our costs of operations.
The financial services industry is extensively regulated. HomeTrust Bank is currently subject to extensive examination, supervision and comprehensive regulation by the OCC, our primary federal regulator, and the FDIC, as insurer of our deposits. A s a bank holding company, HomeTrust Bancshares is subject to examination, supervision and regulation by the Federal Reserve. Such regulation and supervision governs the activities in which an institution and its holding company may engage, and are intended primarily for the protection of the deposit insurance fund and consumers and not to benefit our shareholders. These regulatory authorities have extensive discretion in connection with their supervisory and enforcement activities, including the ability to impose restrictions on our operations, the classification of our assets, and the determination of the level of our allowance for loan losses and level of deposi t insurance premiums assessed. Additionally, actions by regulatory agencies or significant litigation against us could require us to devote significant time and resources to defending our business and may lead to penalties that materially affect us. These regulations, along with the currently existing tax, accounting, securities, insurance, and monetary laws, regulations, rules, standards, policies, and interpretations control the methods by which financial institutions conduct business, implement strategic initiatives and tax compliance, and govern financial reporting and disclosures. Any change in such regulation and oversight, whether in the form of regulatory policy, regulations, legislation or supervisory action, may have a material impact on our operations.
As discussed under "Business-How We are Regulated-Financial Regulatory Reform" in Item I of this Form 10-K, the Dodd-Frank Act has significantly changed the bank regulatory structure and will affect the lending, deposit, investment, trading and operating activities of financial institutions and their holding companies. The Dodd-Frank Act requires various federal agencies to adopt a broad range of new implementing rules and regulations, and to prepare numerous studies and reports for Congress. The federal agencies are given significant discretion in drafting and implementing rules and regulations, and consequently, many of the details and much of the impact of the Dodd-Frank Act may not be known for many months or years. It is difficult at this time to predict when or how any new standards will ultimately be applied to us or what specific impact the Dodd-Frank Act and the yet to be written implementing rules and regulations will have on community banks. However, it is expected that at a minimum they will increase our operating and compliance costs and could increase our interest expense.
The short-term and long-term impact of the changing regulatory capital requirements and new capital rules is uncertain.
As discussed under "Business-How We are Regulated-Regulation of HomeTrust Bank-New Capital Rules" in Item I of this Form 10-K, effective January 1, 2015, HomeTrust Bancshares and HomeTrust Bank will be subject to new capital requirements under regulations adopted by the federal banking regulators to implement the Basel III regulatory capital reforms and changes required by the Dodd-Frank Act. These new requirements establish the following minimum capital ratios: (1) a common equity Tier 1 ("CET1") capital ratio of 4.5% of risk-weighted assets; (2) a Tier 1 capital ratio of 6.0% of risk-weighted assets; (3) a total capital ratio of 8.0% of risk-weighted assets; and (4) a leverage ratio of 4.0%. In addition, there is a new requirement to maintain a capital conservation buffer, comprised of CET1 capital, in an amount greater than 2.5% of risk-weighted assets over the minimum capital required by each of the minimum risk-based capital ratios in order to avoid limitations on the organization's ability to pay dividends, repurchase shares or pay discretionary bonuses. The capital conservation buffer requirement will be phased in, beginning January 1, 2016, requiring during 2016 a buffer amount greater than 0.625% in order to avoid these limitations, and increasing the amount each year until beginning January 1, 2019, the buffer amount must be greater than 2.5% in order to avoid the limitation.
The new regulations also change what qualifies as capital for purposes of meeting these various capital requirements, as well as the risk-weights of certain assets for purposes of the risk-based capital ratios.
Under the new regulations, in order to be considered well-capitalized for prompt corrective action purposes, HomeTrust Bank will be required to maintain the following ratios: (1) a CET1 ratio of at least 6.5% of risk-weighted assets; (2) a Tier 1 capital ratio of at least 8.0% of risk-weighted assets; (3) a total capital ratio of at least 10.0% of risk-weighted assets; and (4) a leverage ratio of at least 5.0%.
We have conducted a pro forma analysis of these new requirements as of June 30, 2014. We have determined that if these requirements were in effect on that date, HomeTrust Bancshares and HomeTrust Bank
54
would be considered well-capitalized and HomeTrust Bancshares and HomeTrust Bank each would have a capital conservation buffer greater than 2.5%.
The application of these more stringent capital requirements could, among other things, result in lower returns on invested capital, over time require the raising of additional capital, and result in regulatory actions if we were to be unable to comply with such requirements. Implementation of changes to asset risk weightings for risk based capital calculations, items included or deducted in calculating regulatory capital and/or additional capital conservation buffers could result in management modifying its business strategy and could limit our ability to make distributions, including paying out dividends or buying back shares. Furthermore, the imposition of liquidity requirements in connection with the implementation of Basel III could result in our having to lengthen the term of our funding, restructure our business models, and/or increase our holdings of liquid assets. Any additional changes in our regulation and oversight, in the form of new laws, rules and regulations could make compliance more difficult or expensive or otherwise materially adversely affect our business, financial condition or prospects.
We are subject to potentially significant litigation and our legal related costs might increase.
We are currently involved in several litigation matters in the ordinary course of business. One matter, originally filed in March 2012, involves claims of $12.5 million in compensatory damages and a request for additional punitive treble damages resulting from the purported failure of HomeTrust Bank and a third party brokerage firm to discover a Ponzi scheme conducted by a customer holding accounts at each entity. HomeTrust Bank believes that the lawsuit is without merit and intends to defend itself vigorously. Management, after review with its legal counsel, is of the opinion that this litigation should not have a material effect on HomeTrust Bank's financial position or results of operations, although new developments could result in management modifying its assessment. There can be no assurance that we will successfully defend or resolve this litigation matter.
We are also subject to a variety of other legal matters that have arisen in the ordinary course of our business. In the current economic environment, our involvement in litigation has increased significantly, primarily as a result of defaulted borrowers asserting claims to defeat or delay foreclosure proceedings. There can be no assurance that our loan workout and other activities will not expose us to additional legal actions, including lender liability or environmental claims. Therefore, we may be exposed to substantial liabilities, which could adversely affect our results of operations and financial condition. Moreover, the expenses of legal proceedings will adversely affect our results of operations until they are resolved.
Our exposure to operational risks may adversely affect us.
Similar to other financial institutions, we are exposed to many types of operational risk, including reputational risk, legal and compliance risk, the risk of fraud or theft by employees or outsiders, the risk that sensitive customer or Company data is compromised, unauthorized transactions by employees or operational errors, including clerical or record-keeping errors. Nationally, reported incidents of fraud and other financial crimes have increased. We have also experienced an increase in losses due to apparent fraud and other financial crimes. While we have policies and procedures designed to prevent such losses, there can be no assurance that such losses will not occur. If any of these risks occur, it could result in material adverse consequences for us.
We rely on communications, information, operating and financial control systems technology from third-party service providers, and we may suffer an interruption in those systems.
We rely heavily on third-party service providers for much of our communications, information, operating and financial control systems technology, including our internet banking services and data processing systems. Any failure or interruption of these services or systems or breaches in security of these systems could result in failures or interruptions in our customer relationship management, general ledger, deposit, servicing and/or loan origination systems. The occurrence of any failures or interruptions may require us to identify alternative sources of such services, and we cannot assure you that we could negotiate terms that are as favorable to us, or could obtain services with similar functionality as found in our existing systems without the need to expend substantial resources, if at all.
55
Our net operating loss carryforwards could be substantially limited if we experience an ownership change as defined in the Internal Revenue Code.
As of June 30, 2014 we had approximately $64.2 million of federal net operating losses ("NOLs"). Our ability to use our NOLs and other pre-ownership change losses (collectively, "Pre-Change Losses") to offset future taxable income will be limited if we experience an "ownership change" as defined in Section 382 of the Internal Revenue Code of 1986, as amended from time to time (the "Code"). In general, a n ownership change occurs if, among other things, the shareholders (or specified groups of shareholders) who own or have owned, directly or indirectly, 5% or more of a corporation's common stock or are otherwise treated as 5% shareholders under Section 382 and U.S. Treasury regulations promulgated thereunder increase their aggregate percentage ownership of that corporation's stock by more than 50 percentage points over the lowest percentage of the stock owned by these shareholders over a rolling three-year period. If we experience an ownership change our Pre-Change Losses will be subject to an annual limitation on their use, which is generally equal to the fair market value of our outstanding stock immediately before the ownership change multiplied by the long-term tax-exempt rate, which was 3.32% for ownership changes occurring in June 2014. Depending on the size of the annual limitation (which is in part a function of our market capitalization at the time of the ownership change) and the remaining carryforward period for our Pre-Change Losses (U.S. federal net operating losses generally may be carried forward for a period of 20 years), we could realize a permanent loss of some or all of our Pre-Change Losses, which could have a material adverse effect on our results of operations and financial condition.
In September 2012, we adopted a shareholder rights plan (the "Rights Plan"), which provides an economic disincentive for any person or group to become an owner, for relevant tax purposes, of 4.99% or more of our stock. While adoption of the Rights Plan should reduce the likelihood that future transactions in our stock will result in an ownership change under Section 382, there can be no assurance that the Rights Plan will be effective to deter a shareholder from increasing its ownership interests beyond the limits set by the Rights Plan or that an ownership change will not occur in the future.
We are an emerging growth company within the meaning of the Securities Act, and if we decide to take advantage of certain exemptions from various reporting requirements applicable to emerging growth companies, our common stock could be less attractive to investors.
We are an "emerging growth company," as defined in Section 2(a) of the Securities Act of 1933, (the "Securities Act"), as modified by the Jumpstart Our Business Startups Act of 2012 ( the "JOBS Act"). We are eligible to take advantage of certain exemptions from various reporting requirements that are applicable to other public companies that are not emerging growth companies, including, but not limited to, an exemption from the requirement of holding a non-binding advisory vote on executive compensation. In addition, we will not be subject to certain requirements of Section 404 of the Sarbanes-Oxley Act of 2002 (the "Sarbanes Oxley Act"), including the additional level of review of our internal control over financial reporting as may occur when outside auditors attest as to our internal control over financial reporting. As a result, our stockholders may not have access to certain information they may deem important. Further, we are eligible to delay adoption of new or revised accounting standards applicable to public companies and we may take advantage of the benefits of this extended transition period, although to date we have not done so. Accordingly, our financial statements may not be comparable to companies that comply with such new or revised accounting standards. We could remain an "emerging growth company" for up to five years, or until the earliest of (a) the last day of the first fiscal year in which our annual gross revenues exceed $1 billion, (b) the date that we become a "large accelerated filer" as defined in Rule 12b-2 under the Exchange Act, which would occur if the market value of our common stock that is held by non-affiliates exceeds $700 million as of the last business day of our most recently completed second fiscal quarter, or (c) the date on which we have issued more than $1 billion in non-convertible debt during the preceding three-year period. If we take advantage of any of these exemptions, we do not know if some investors will find our common stock less attractive as a result. The result may be a less active trading market for our common stock and our stock price may be more volatile.
56
Item 1B. Unresolved Staff Comments
None.
Item 2. Properties
We maintain our administrative office, which is owned by us, in Asheville, North Carolina. In total, as of June 30, 2014, we have 34 branch offices located in North Carolina (including the Asheville metropolitan area and the "Piedmont" region), South Carolina (Greenville), and East Tennessee (including Kingsport/Johnson City, Knoxville, and Morristown). Of those offices, four are leased facilities. We also own an operations center located in Asheville, North Carolina. We lease additional space, which is adjacent to the facility we own, for administrative and operations personnel. The lease terms for our branch offices, operations center and other offices are not individually material. Lease expirations range from one to five years. In the opinion of management, all properties are adequately covered by insurance, are in a good state of repair and are appropriately designed for their present and future use. See Notes 5 and 10 in the Notes to the Consolidated Financial Statements included under Item 8: Financial Statements and Supplementary Data for additional information.
We maintain depositor and borrower customer files on an on-line basis, utilizing a telecommunications network, portions of which are leased. The book value of all data processing and computer equipment utilized by us at June 30, 2014 was $438,000. Management has a disaster recovery plan in place with respect to the data processing system, as well as our operations as a whole.
Item 3. Legal Proceedings
On March 14, 2012, a civil suit was filed (which was amended on April 25, 2012) in the County of Buncombe, North Carolina, Civil Superior Court Division, Twenty-Eighth Judicial Circuit, case number 2012CV-01206, by Leslie A. Whittington and 20 other plaintiffs against HomeTrust Bank and a third party brokerage firm. The plaintiffs seek actual damages of $12.5 million and additional treble or such other punitive damages as determined by the court. The suit alleges that the defendants should have been aware of the Ponzi scheme perpetrated by Mr. William Bailey through his company, Southern Financial Services, as a result of the transactions into and from the accounts at HomeTrust Bank and the brokerage firm. The suit further alleges that the defendants were negligent and reckless in not monitoring, discovering and reporting the unlawful conduct of Mr. Bailey, including that he was kiting checks and converting funds for his own use. In addition, the suit claims the defendants were unjustly enriched by the fees they received from their business relationship with Mr. Bailey. Mr. Bailey pled guilty to federal criminal charges of securities fraud, mail fraud and filing false income taxes related to this matter in February 2011 and was sentenced on February 27, 2013.
The Company believes that the lawsuit is without merit and intends to defend itself vigorously; however, there can be no assurance that the Company will successfully defend or resolve this litigation matter. Based on the information available to the Company's litigation counsel at this time, they believe that the claims in this case are legally and factually without merit. Because this lawsuit is still in discovery, such counsel is unable to give an opinion at this time as to the likely outcome. Management, after review with its legal counsel, is of the opinion that this litigation should not have a material effect on the Company's financial position or results of operations, although new developments could result in management modifying its assessment.
Apart from the foregoing, from time to time we are involved as plaintiff or defendant in various legal actions arising in the normal course of business. We do not anticipate incurring any material liability as a result of any such litigation.
Item 4. Mine Safety Disclosures.
Not applicable.
57
PART II
Item 5. Market for Registrant's Common Equity, Related Stockholder Matters and Issuer Purchases of Equity Securities.
The Company's common stock is listed on the Nasdaq Global Market under the symbol "HTBI." The common stock was issued at a price of $10.00 per share in connection with the Conversion. The Conversion was completed on July 10, 2012 and the Company's common stock commenced trading on the Nasdaq Global Market on July 11, 2012. As a result, there is no sale price information for any quarterly period in the fiscal year ended June 30, 2012. As of the close of business on June 30, 2014, there were 20,632,008 shares of common stock outstanding held by 1,003 holders of record. Certain shares are held in "nominee" or "street" name and accordingly, the number of beneficial owners of such shares is not known or included in the foregoing number. The following table presents quarterly market information for the Company's common stock for the year ended June 30, 2014.
Year Ended June 30, 2014 | High | Low | Cash Dividend Declared | |||||||||
First quarter | $ | 17.00 | $ | 16.00 | $ | -- | ||||||
Second quarter | 16.55 | 15.89 | -- | |||||||||
Third quarter | 16.11 | 15.26 | -- | |||||||||
Fourth quarter | 16.00 | 14.87 | -- | |||||||||
The Company did not declare any dividends on its common stock during the fiscal year ended June 30, 2014. The timing and amount of cash dividends paid depends on our earnings, capital requirements, financial condition and other relevant factors. We also have the ability to receive dividends or capital distributions from HomeTrust Bank, our wholly owned subsidiary. There are regulatory restrictions on the ability of HomeTrust Bank to pay dividends. See Item 1, "Business-How We Are Regulated," for more information regarding the restrictions on the Company's and the Bank's abilities to pay dividends.
Unregistered Sales of Equity Securities and Use of Proceeds
On August 27, 2013, the Company announced that its Board of Directors had authorized the repurchase of up to 1,041,245 shares of the Company's common stock, representing 5% of the Company's outstanding shares. We completed this stock repurchase program during the second fiscal quarter of 2014.
On January 31, 2014, the Company announced that its Board of Directors had authorized the repurchase of up to 989,183 shares of the Company's common stock, representing 5% of the Company's outstanding shares. The shares may be purchased in the open market or in privately negotiated transactions, from time to time depending upon market conditions and other factors. As of June 30, 2014, 804,499 shares had been repurchased.
The table below sets forth information regarding the Company's common stock repurchases during the quarter pursuant to its existing stock repurchase plan.
Total Number of | Maximum Number of | |||||||||||||||
Shares Purchased as | Shares that May | |||||||||||||||
Total Number | Average | Part of Publicly | Yet Be Purchased | |||||||||||||
of Shares | Price Paid per | Announced Plans or | Under the Plans or | |||||||||||||
Period | Purchased | Share | Programs | Programs | ||||||||||||
April 1 to April 30, 2014 | 457,863 | $ | 15.88 | 457,863 | 315,285 | |||||||||||
May 1 to May 30, 2013 | - | - | - | - | ||||||||||||
June 1 to June 30, 2013 | 130,601 | 15.63 | 130,601 | 184,684 | ||||||||||||
1 | ||||||||||||||||
Total | 588,464 | $ | 15.82 | 588,464 | 184,684 | |||||||||||
58
Equity Compensation Plans
The equity compensation plan information presented under Part III, Item 12 of this report is incorporated herein by reference.
Shareholder Return Performance Graph Presentation
Our shares of common stock began trading on the NASDAQ Global Select Market on July 11, 2012. Accordingly, no comparative stock performance information is available for periods ending prior to this date. The performance graph below compares the Company's cumulative shareholder return on its common stock since the inception of trading on July 11, 2012 to the cumulative total return of the Nasdaq Composite and the Nasdaq Bank Index for the periods indicated. We believe the Nasdaq Bank Index is a better comparison than the SNL U.S. Thrift Index used in the prior year based on our loan mix and recent change to a national bank charter. The information presented below assumes $100 was invested on July 11, 2012, in the Company's common stock and in each of the indices and assumes the reinvestment of all dividends. Historical stock price performance is not necessarily indicative of future stock price performance. Total return assumes the reinvestment of all dividends and that the value of Common Stock and each index was $100 on July 11, 2012.
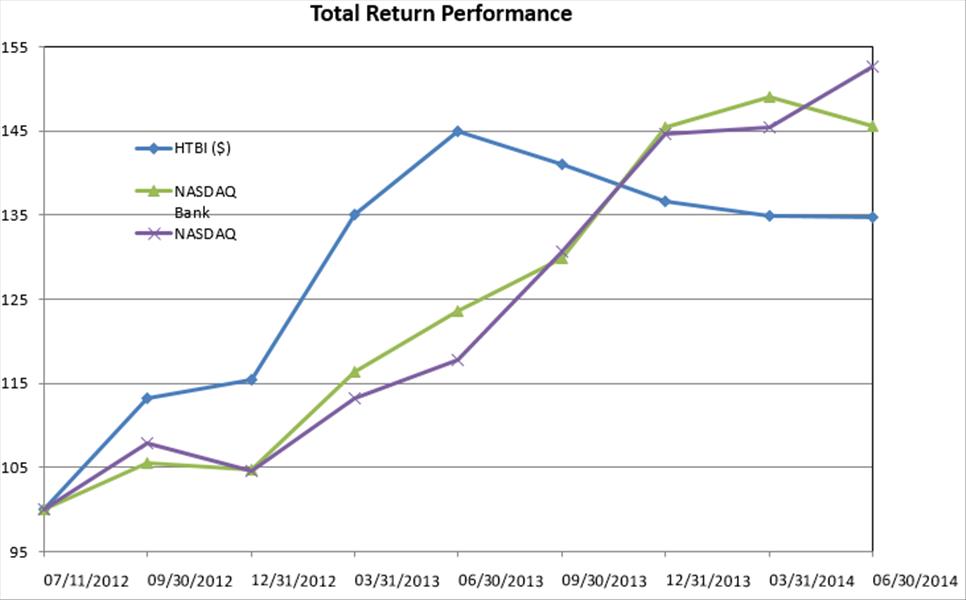
Period Ended | |||||||||
07/11/12 | 09/30/12 | 12/31/12 | 03/31/13 | 06/30/13 | 09/30/13 | 12/31/13/2013 | 03/31/14 | 06/30/14 | |
HomeTrust Bancshares, Inc. | 100.00 | 113.25 | 115.47 | 135.04 | 144.96 | 141.03 | 136.67 | 134.87 | 134.79 |
NASDAQ Bank Index | 100.00 | 105.49 | 104.65 | 116.35 | 123.55 | 129.91 | 145.37 | 149.07 | 145.58 |
NASDAQ Composite | 100.00 | 107.90 | 104.55 | 113.14 | 117.84 | 130.59 | 144.62 | 145.40 | 152.64 |
59
Item 6. Selected Financial and Other Data.
The summary information presented below under "Selected Financial Condition Data" and "Selected Operations Data" for the years ended June 30, 2014, 2013 and 2012 are derived in part from the audited consolidated financial statements that appear in this annual report. The following information is only a summary and you should read it in conjunction with "Management's Discussion and Analysis of Financial Condition and Results of Operations" under Item 7 of this report and "Financial Statements and Supplementary Data" under Item 8 of this report below.
At June 30, | ||||||||||||||||||||
2014 | 2013 | 2012 | 2011 | 2010 | ||||||||||||||||
(In thousands) | ||||||||||||||||||||
Selected Financial Condition Data: | ||||||||||||||||||||
Total assets | $ | 2,074,454 | $ | 1,583,323 | $ | 1,720,056 | $ | 637,643 | $ | 1,641,145 | ||||||||||
Loans receivable, net (1) | 1,473,099 | 1,132,110 | 1,193,945 | 1,276,377 | 1,243,610 | |||||||||||||||
Allowance for loan losses | 23,429 | 32,073 | 35,100 | 50,140 | 41,713 | |||||||||||||||
Certificates of deposit in other banks | 163,780 | 136,617 | 108,010 | 118,846 | 99,140 | |||||||||||||||
Securities available for sale, at fair value | 168,749 | 24,750 | 31,335 | 59,016 | 36,483 | |||||||||||||||
Federal Home Loan Bank stock | 3,697 | 1,854 | 6,300 | 9,630 | 10,790 | |||||||||||||||
Deposits | 1,583,047 | 1,154,750 | 1,466,175 | 1,264,585 | 1,289,549 | |||||||||||||||
Other borrowings | 50,000 | - | 22,265 | 145,278 | 122,199 | |||||||||||||||
Stockholders' equity | 377,151 | 367,515 | 172,485 | 167,769 | 174,815 | |||||||||||||||
Years Ended June 30, | ||||||||||||||||||||
2014 | 2013 | 2012 | 2011 | 2010 | ||||||||||||||||
(In thousands) | ||||||||||||||||||||
Selected Operations Data: | ||||||||||||||||||||
Total interest and dividend income | $ | 60,281 | $ | 60,389 | $ | 67,491 | $ | 72,087 | $ | 71,300 | ||||||||||
Total interest expense | 5,432 | 7,255 | 11,778 | 20,529 | 25,617 | |||||||||||||||
Net interest income | 54,849 | 53,134 | 55,713 | 51,558 | 45,683 | |||||||||||||||
Provision for (recovery of ) loan losses | (6,300 | ) | 1,100 | 15,600 | 42,800 | 38,600 | ||||||||||||||
Net interest income after provision for | ||||||||||||||||||||
loan losses | 61,149 | 52,034 | 40,113 | 8,758 | 7,083 | |||||||||||||||
Fees and service charges | 2,783 | 2,589 | 2,679 | 2,929 | 2,986 | |||||||||||||||
Mortgage banking income and fees | 3,218 | 5,107 | 3,846 | 3,211 | 2,692 | |||||||||||||||
Gain on sale of securities | 10 | - | - | 430 | 191 | |||||||||||||||
Gain from business combination | - | - | - | 5,844 | 17,391 | |||||||||||||||
Gain on sale of fixed assets | - | - | 1,503 | - | - | |||||||||||||||
Other non-interest income | 2,727 | 2,691 | 2,400 | 4,382 | 1,292 | |||||||||||||||
Total non-interest income | 8,738 | 10,387 | 10,428 | 16,796 | 24,552 | |||||||||||||||
Total non-interest expense | 55,032 | 51,393 | 46,661 | 53,554 | 42,171 | |||||||||||||||
Income (loss) before provision | ||||||||||||||||||||
(benefit) for income taxes | 14,855 | 11,028 | 3,880 | (28,000 | ) | (10,536 | ) | |||||||||||||
Income tax expense (benefit) | 4,513 | 1,975 | (647 | ) | (13,263 | ) | (17,577 | ) | ||||||||||||
Net income (loss) | $ | 10,342 | $ | 9,053 | $ | 4,527 | $ | (14,737 | ) | $ | 7,041 | |||||||||
Per Share Data: | ||||||||||||||||||||
Net income per common share: | ||||||||||||||||||||
Basic | $ | 0.54 | $ | 0.45 | n/a | n/a | n/a | |||||||||||||
Diluted | $ | 0.54 | $ | 0.45 | n/a | n/a | n/a | |||||||||||||
60
At or For the | ||||||||||||||||||||
Years Ended June 30, | ||||||||||||||||||||
2014 | 2013 | 2012 | 2011 | 2010 | ||||||||||||||||
Selected Financial Ratios and Other Data: | ||||||||||||||||||||
Performance ratios: | ||||||||||||||||||||
Return on assets (ratio of net income to average total | ||||||||||||||||||||
assets) | 0.62 | % | 0.56 | % | 0.29 | % | (0.88 | ) % | 0.46 | % | ||||||||||
Return on equity (ratio of net income to average | ||||||||||||||||||||
equity) | 2.86 | 2.48 | 2.67 | (8.15 | ) | 4.50 | ||||||||||||||
Tax equivalent yield on earning assets (2) | 4.15 | 4.30 | 4.82 | 4.83 | 5.06 | |||||||||||||||
Rate paid on interest-bearing liabilities | 0.46 | 0.65 | 0.91 | 1.48 | 1.99 | |||||||||||||||
Tax equivalent average interest rate spread (2) | 3.69 | 3.65 | 3.91 | 3.35 | 3.07 | |||||||||||||||
Tax equivalent net interest margin (2)(3) | 3.79 | 3.81 | 4.02 | 3.52 | 3.33 | |||||||||||||||
Operating expense to average total assets | 3.29 | 3.21 | 2.95 | 3.21 | 2.75 | |||||||||||||||
Average interest-earning assets to average interest-bearing | ||||||||||||||||||||
liabilities | 130.20 | 132.54 | 113.61 | 113.01 | 115.06 | |||||||||||||||
Efficiency ratio (4) | 75.37 | 67.63 | 56.77 | 61.94 | 55.59 | |||||||||||||||
Asset quality ratios: | ||||||||||||||||||||
Non-performing assets to total assets (5) | 3.02 | % | 5.07 | % | 4.67 | % | 3.81 | % | 3.87 | % | ||||||||||
Non-accruing loans to total loans (5) | 3.14 | 5.88 | 5.21 | 3.64 | 3.59 | |||||||||||||||
Total classified assets to total assets | 4.56 | 7.43 | 7.75 | 9.83 | 9.20 | |||||||||||||||
Allowance for loan losses to non-accruing loans (5)(6) | 49.84 | 46.78 | 54.69 | 103.43 | 90.09 | |||||||||||||||
Allowance for loan losses to total loans | 1.56 | 2.75 | 2.85 | 3.77 | 3.23 | |||||||||||||||
Net charge-offs to average loans | 0.19 | 0.34 | 2.34 | 2.59 | 1.71 | |||||||||||||||
Capital ratios: | ||||||||||||||||||||
Equity to total assets at end of period (7) | 18.18 | % | 23.21 | % | 10.03 | % | 10.24 | % | 10.65 | % | ||||||||||
Average equity to average assets | 21.62 | 23.09 | 10.71 | 10.82 | 10.21 | |||||||||||||||
Dividend payout to common shareholders | - | - | n/a | n/a | n/a | |||||||||||||||
| ______________________ |
(1) | Net of allowances for loan losses, loans in process and deferred loan fees. |
(2) | The weighted average rate for municipal leases is adjusted for a 34% federal tax rate since the interest from these leases is tax exempt. |
(3) | Net interest income divided by average interest earning assets. |
(4) | As presented, this is a non-GAAP (Generally Accepted Accounting Principles) measure calculated by dividing total non-interest expense, net of FHLB advance prepayment penalties, REO-related expenses and merger-related expenses, by the sum of net interest income, total non-interest income and the tax equivalent adjustment, net of realized gain/loss on securities. The Company believes the efficiency ratio as presented is useful for both investors and management to understand the effects of certain non-interest items and provides an alternative view of the Company's performance over time and in comparison to the Company's competitors. This non-GAAP financial measure should not be considered as a substitute for operating results determined in accordance with GAAP and may not be comparable to other similarly titled financial measures used by other companies. Set forth below is a reconciliation to GAAP of the non-GAAP efficiency ratio shown in the table: |
61
At or for the years ended June 30, | ||||||||||||||||||||
2014 | 2013 | 2012 | 2011 | 2010 | ||||||||||||||||
Non-interest expense | $ | 55,032 | $ | 51,393 | $ | 46,661 | $ | 53,554 | $ | 42,171 | ||||||||||
Less FHLB advance prepayment expense | - | 3,069 | 2,111 | 3,988 | - | |||||||||||||||
Less REO-related expenses | 2,089 | 3,086 | 4,991 | 5,306 | 1,231 | |||||||||||||||
Less merger-related expenses | 2,708 | - | - | - | - | |||||||||||||||
Non-interest expense – as adjusted | 50,235 | 45,238 | 39,559 | 44,260 | 40,940 | |||||||||||||||
Net interest income | 54,849 | 53,134 | 55,713 | 51,558 | 45,683 | |||||||||||||||
Plus non-interest income | 8,738 | 10,387 | 10,428 | 16,796 | 24,552 | |||||||||||||||
Plus tax equivalent adjustment | 3,076 | 3,371 | 3,539 | 3,527 | 3,598 | |||||||||||||||
Less realized gain/loss on securities | 10 | - | - | 430 | 191 | |||||||||||||||
Net interest income plus non-interest income – as adjusted | 66,673 | 66,892 | 69,680 | 71,451 | 73,642 | |||||||||||||||
Efficiency ratio | 75.37 | % | 67.63 | % | 56.77 | % | 61.94 | % | 55.59 | % | ||||||||||
Efficiency ratio (without adjustments) | 86.55 | % | 80.91 | % | 70.55 | % | 78.35 | % | 60.04 | % | ||||||||||
(5) | Non-performing assets include non-accruing loans including certain restructured loans and real estate owned. In the year ended June 30, 2012, $25.7 million of loans were reclassified from impaired loans still accruing interest to non-accruing loans pursuant to regulatory guidance. At June 30, 2014, there were $13.9 million of restructured loans included in non-accruing loans and $23.9 million, or 50.9%, of non-accruing loans were current on their loan payments. |
(6) | The decline in the allowance for loan losses during the year ended June 30, 2012 occurred primarily as a result of the charge-off of specific reserves, totaling $16.7 million, in accordance with regulatory guidance. The ratio of allowance for loan losses to non-accruing loans was reduced during this period by the charge-off, as well as by the reclassification of impaired loans discussed in note (5) above. |
(7) | Does not include proceeds from the Conversion consummated on July 10, 2012 for years ended prior to June 30, 2013. |
62
Item 7. Management's Discussion and Analysis of Financial Condition and Results of Operations
This discussion and analysis reviews our consolidated financial statements and other relevant statistical data and is intended to enhance your understanding of our financial condition and results of operations. The information in this section has been derived from the Consolidated Financial Statements and footnotes thereto, which are included in Item 8 of this Form 10-K. You should read the information in this section in conjunction with the business and financial information regarding us as provided in this Form 10-K. Since the conversion of HomeTrust Bank did not occur until after the June 30, 2012 fiscal year end, unless otherwise indicated, the financial information presented in this section prior to this date reflects the consolidated financial condition and results of operations of HomeTrust Bank and its subsidiary.
Overview
Our principal business consists of attracting deposits from the general public and investing those funds, along with borrowed funds in loans secured primarily by first and second mortgages on one- to four-family residences, including home equity loans and construction and land/lot loans, commercial real estate loans, construction and development loans, and municipal leases. Municipal leases are secured primarily by a ground lease for a firehouse or an equipment lease for fire trucks and firefighting equipment to fire departments located throughout North and South Carolina. We also purchase investment securities consisting primarily of mortgage-backed securities issued by United States Government agencies and government-sponsored enterprises, as well as, certificates of deposit insured by the Federal Deposit Insurance Corporation ("FDIC").
We offer a variety of deposit accounts for individuals, businesses and nonprofit organizations. Deposits are our primary source of funds for our lending and investing activities. We adopted a plan of conversion, primarily to increase our capital to grow our loan portfolio organically and through acquisitions and to continue to build our franchise.
We are significantly affected by prevailing economic conditions, as well as, government policies and regulations concerning, among other things, monetary and fiscal affairs, housing and financial institutions. Deposit flows are influenced by a number of factors, including interest rates paid on competing time deposits, other investments, account maturities, and the overall level of personal income and savings. Lending activities are influenced by the demand for funds, the number and quality of lenders, and regional economic cycles. Our primary source of pre-tax income is net interest income. Net interest income is the difference between interest income, which is the income that we earn on our loans and investments, and interest expense, which is the interest that we pay on our deposits and borrowings. Changes in levels of interest rates affect our net interest income. A secondary source of income is noninterest income, which includes revenue we receive from providing products and services, including service charges on deposit accounts, mortgage banking income and gains and losses from sales of securities.
Our noninterest expenses consist primarily of salaries and employee benefits, expenses for occupancy, marketing and computer services and FDIC deposit insurance premiums. Salaries and benefits consist primarily of the salaries and wages paid to our employees, payroll taxes, expenses for retirement and other employee benefits. Occupancy expenses, which are the fixed and variable costs of buildings and equipment, consist primarily of lease payments, property taxes, depreciation charges, maintenance and costs of utilities.
Beginning in fiscal year 2009 and continuing throughout much of fiscal year 2012, housing markets deteriorated in many of our market areas and we experienced significantly higher levels of delinquencies and non-performing assets, primarily in our construction and land development loan portfolios. During this period, home and lot sales activity was exceptionally slow, causing stress on builders' and developers' cash flows and their ability to service debt, which was reflected in our increased non-performing asset totals. Further, property values generally declined, reducing the value of the collateral securing loans. In addition, other non-housing-related segments of the loan portfolio developed signs of stress and increasing levels of non-accruing loans as the effects of the recent recession became more evident and the pace of the recovery remained slow. As a result, during these periods our provision for loan losses was significantly higher than historical levels and our normal expectations. This higher than normal level of delinquencies and non-accruals also had a material adverse effect on operating income as a result of foregone interest revenues, increased loan collection costs and carrying costs and valuation adjustments for REO. During both fiscal 2013 and 2014, home and lot sales activity and real estate values have modestly improved
63
along with general economic conditions resulting in materially lower loan charge-offs and write-downs of real estate owned in fiscal 2014. As a result, during the year ended June 30, 2014, our provision for loan losses decreased $7.4 million primarily due to lower net loan charge-offs and our loss on sale and impairment of real estate owned declined $305,000 due to improving real estate values. For the year ended June 30, 2014 we had net income of $10.3 million, as compared to net income of $9.1 million for the year ended June 30, 2013.
On July 31, 2013, we completed our acquisition of BankGreenville Financial Corporation ("BankGreenville") with one office located in Greenville, South Carolina. BankGreenville reported total assets of $105.1 million, total deposits of $90.0 million, and stockholders' equity of $9.6 million at June 30, 2013.
On May 31, 2014, we completed our acquisition of Jefferson Bancshares, Inc., ("Jefferson") headquartered in Morristown, Tennessee. Jefferson had twelve offices located across East Tennessee and reported total assets of $506.8 million, total deposits of $384.0 million, and stockholders' equity of $54.4 million at March 31, 2014.
At June 30, 2014, we had 34 banking offices in North Carolina (including the Asheville metropolitan area and the "Piedmont" region), South Carolina (Greenville), and East Tennessee (including Kingsport/Johnson City, Knoxville, and Morristown). We intend to expand through organic growth and through the acquisition of other community financial institutions and/or bank branches. Our goal is to continue to enhance our franchise value and earnings through strategic, planned growth in our banking operations, while maintaining the community-focused, relationship style of exceptional customer service that has differentiated our brand and characterized our success to date.
On July 21, 2014, the HomeTrust Bank opened a commercial loan production office ("LPO") in downtown Roanoke, Virginia. Also, on July 31, 2014, HomeTrust Bank completed its acquisition of Bank of Commerce headquartered in Charlotte, North Carolina. As of June 30, 2014, Bank of Commerce had total assets of $123 million, total deposits of $93 million, and stockholders' equity of $12 million and operates one office in midtown Charlotte.
On August 13, 2014, the Bank received approval from the Office of the Comptroller of the Currency to purchase the branch banking operations of ten locations in Virginia and North Carolina from Bank of America Corporation. Six of the branches are located in Roanoke Valley, two in Danville, one in Martinsville, Virginia, and one in Eden, North Carolina. The acquisition will add approximately $504 million of deposits. In addition to the branches, the Bank will acquire a small amount of loans as part of the transaction. The Bank expects the purchase to be effective Monday, November 17, 2014, following satisfaction of customary closing conditions.
On August 25, 2014, the Company announced that the Bank converted from a federal savings bank charter to a national bank charter and the Company is now a bank holding company. The Bank received approval for the charter change in July 2014 from the Office of the Comptroller of the Currency.
Business and Operating Strategy and Goals
Our primary objective is to continue to operate and grow HomeTrust Bank as a well-capitalized, profitable, independent, community banking organization. Our mission is to continue serving individuals, businesses and community organizations in our primary markets in North Carolina (including the Asheville metropolitan area and the "Piedmont" region), South Carolina (Greenville), East Tennessee (including Kingsport/Johnson City, Knoxville, and Morristown) and the Roanoke Valley area of Virginia through exceptional service. To accomplish our objectives, we will also need to continue building caring relationships with our employees, customers and communities while delivering on our brand promise that "It's Just Better Here." We will also need to continue providing our employees with the tools necessary to effectively deliver our products and services to customers in order to compete effectively with other financial institutions operating in our market areas.
Improving our asset quality. Our goal is to improve upon our level of nonperforming assets by managing credit risk. As real estate markets have weakened since 2008, we have experienced a significant increase in delinquencies and non-performing assets. We have implemented an internal problem loan resolution process that is managed by a group of experienced senior banking officers to focus on early detection and timely solutions. We are focused on actively monitoring and managing all segments of our loan portfolio in order to proactively identify and
64
mitigate risk. We will continue to devote significant efforts and resources to reducing problem assets to levels consistent with our historical experience. We also implemented in fiscal years 2007 through 2009 continuously more stringent underwriting policies and procedures as the economy continued to deteriorate, which included an increased emphasis on a borrower's ongoing ability to repay a loan by requiring lower debt to income ratios, higher credit scores and lower loan to value ratios than our previous lending policies had required. Our percentage of nonperforming assets to total assets was 3.02%, 5.07%, and 4.67% at June 30, 2014, 2013 and 2012, respectively.
Continuing to originate residential and owner-occupied commercial mortgage loans and municipal leases. Our primary lending focus has been, and will continue to be, on operating as a residential and commercial mortgage lender. We originate both fixed and adjustable-rate residential and commercial mortgage loans. Most of the long term fixed-rate residential mortgage loans that we originate are sold into the secondary market with servicing released, while most of the residential adjustable rate mortgages and fixed rate mortgages with terms to maturity of 15 years or less, the commercial mortgages and all of the municipal leases that we originate, are retained in our portfolio. Although our loan originations have declined during recent periods as we focused on our asset quality problems and experienced lower demand for residential and commercial mortgage loans reflecting both the weak housing market and overall weak economic conditions, we intend to continue to emphasize these lending activities. We have strictly limited the origination of speculative construction, land development and land loans in favor of loans that possess credit profiles presenting lower risk to us. We believe the continuing changes in the secondary market as a result of the uncertainty that is surrounding Fannie Mae and Freddie Mac will result in increased opportunities in the coming years to originate high quality residential loans with more attractive pricing for our loan portfolio. With our long experience and expertise in residential lending, we believe we can be effective in capturing the opportunities of these market changes in residential lending.
Expanding our commercial and industrial lending and indirect auto finance line of business. On March 10, 2014, HomeTrust Bank hired a new Chief Credit Officer, Keith Houghton. Under Mr. Houghton's direction, the Bank has expanded its commercial credit department and added new technology systems to support the growth of the Bank's commercial loan portfolio. With our new LPO in Roanoke, Virginia and the acquisitions of BankGreenville and Jefferson, we have expanded our commercial and industrial lending. The expansion and acquisitions have provided us personnel with expertise in commercial and industrial lending, as well as intimate knowledge of the Greenville, South Carolina, East Tennessee, and Roanoke Valley area markets. Additionally, during fiscal year 2014, HomeTrust Bank added an indirect auto finance line of business. The indirect auto finance group services automobile dealerships, its owners, and consumers buying automobiles through these dealerships mainly in western North Carolina and upstate South Carolina. Our focus on working with strong dealerships will allow us to expand into additional market areas and to actively deepen relationships through cross-selling opportunities, while building a strong reputation.
Continuing to expand our presence within our existing and contiguous market areas and by capturing business opportunities resulting from changes in the competitive environment. We believe the significant changes that are impacting the financial services industry in the current economic environment, including failures and consolidations of community banks, may create opportunities to grow our business. Our increased capital position from our stock offering has positioned us to be able to expand our market presence within our existing geographic footprint at the appropriate time. In the past, we have successfully opened de novo branches and integrated five community banks into the HomeTrust Banking Partnership, including the January 31, 2010 addition of Industrial Federal Bank, the October 1, 2010 addition of Cherryville Federal Bank, the July 31, 2013 acquisition of BankGreenville, the May 31, 2014 acquisition of Jefferson Bancshares, Inc., and the July 31, 2014 acquisition of Bank of Commerce. Going forward, while exercising appropriate discipline, we expect to strengthen our market position by capturing a portion of the market share arising from the expected consolidation of community banks in our market areas. We believe that the new regulatory and technology environment, as well as, the revenue and growth challenges in banking, will result in many community banks seeking to affiliate with strongly capitalized larger community banks such as HomeTrust Bank. In addition, by delivering high quality, customer-focused products and services, we expect to attract additional borrowers and depositors and thus increase our market share and revenue generation.
Emphasizing lower cost core deposits to manage the funding costs of our loan growth. We offer personal checking, savings and money-market accounts, which generally are lower-cost sources of funds than certificates of deposit and are less sensitive to withdrawal when interest rates fluctuate. To build our core deposit base, over the
65
past several years, we have sought to reduce our dependence on traditional higher cost deposits in favor of stable lower cost demand deposits. We have utilized additional product offerings, technology and a focus on customer service in working toward this goal. In addition, we intend to increase demand deposits by growing business banking relationships through a recently expanded product line tailored to our target business customers' needs. We are also pursuing a number of strategies that include product offerings such as mobile banking and sales promotions on savings and checking accounts to encourage the growth of lower cost deposits.
Improving profitability through customer growth and balance sheet management. We have focused and are continuing to focus significant efforts on creating brand awareness, offering competitive products and employing a strong and experienced workforce. In order to deepen the relationships with our customers and increase individual customer profitability, we have implemented a new cross-marketing program and further augmented our new account opening process to better identify and discuss the individual customer's product and service needs. In addition, we have targeted our direct mail campaigns to take advantage of competitor mergers and/or branch closures to acquire new customer core deposits. We believe these initiatives have positioned us well to implement a strategy focused on improving revenue growth and non-interest income.
Hiring and retaining experienced employees with a customer service focus. We have been successful in attracting and retaining banking professionals with strong community relationships and significant knowledge of our markets, through both individual hires and business combinations, which is central to our business strategy. Exceptional service, local involvement and timely decision-making are integral parts of our business strategy, and we continue to seek additional highly qualified and motivated individuals. We believe that by focusing on experienced bankers who are established in their communities, we enhance our market position and add profitable growth opportunities. Our compensation and incentive systems are aligned with our strategies to grow core deposits and our loan portfolio as the economy improves, while improving asset quality. We have a strong corporate culture based on personal accountability, high ethical standards and significant training opportunities, which is supported by our commitment to career development and promotion from within the organization.
Critical Accounting Policies
Certain of our accounting policies are important to the portrayal of our financial condition, since they require management to make difficult, complex or subjective judgments, some of which may relate to matters that are inherently uncertain. Estimates associated with these policies are susceptible to material changes as a result of changes in facts and circumstances. Facts and circumstances which could affect these judgments include, but are not limited to, changes in interest rates, changes in the performance of the economy and changes in the financial condition of borrowers.
On April 5, 2012, the JOBS Act was signed into law. The JOBS Act contains provisions that, among other things, reduce certain reporting requirements for qualifying public companies. As an "emerging growth company" we may delay adoption of new or revised accounting pronouncements applicable to public companies until such pronouncements are made applicable to private companies. We intend to take advantage of the benefits of this extended transition period, although we have not done so to date. Accordingly, our financial statements may not be comparable to companies that comply with such new or revised accounting standards or disclosures.
The following represent our critical accounting policies:
Allowance for Loan Losses. The allowance for loan losses is the amount estimated by management as necessary to cover losses inherent in the loan portfolio at the balance sheet date. The allowance is established through the provision for loan losses, which is charged to income. Determining the amount of the allowance for loan losses necessarily involves a high degree of judgment. Among the material estimates required to establish the allowance are: loss exposure at default; the amount and timing of future cash flows on impaired loans; value of collateral; and determination of loss factors to be applied to the various elements of the portfolio. All of these estimates are susceptible to significant change. Management reviews the level of the allowance quarterly and establishes the provision for loan losses based upon an evaluation of the portfolio, past loss experience, current economic conditions and other factors related to the collectability of the loan portfolio. Although we believe that we use the best information available to establish the allowance for loan losses, future adjustments to the allowance may be necessary if economic or other conditions differ substantially from the assumptions used in making the
66
evaluation. In addition, bank regulators, as an integral part of their examination process, periodically review our allowance for loan losses and may require us to recognize adjustments to the allowance based on their judgments about information available to them at the time of their examination. A large loss could deplete the allowance and require increased provisions to replenish the allowance, which would adversely affect earnings.
Business Combinations. We use the acquisition method of accounting for all business combinations. The acquisition method of accounting requires us as acquirer to recognize the fair value of assets acquired and liabilities assumed at the acquisition date, as well as, recognize goodwill or a gain from a bargain purchase, if appropriate. In addition, prior to our Conversion, we recognized the fair value of the acquired institution's equity as a separate component to equity capital on the balance sheet as required for business combinations of mutual institutions. Any acquisition-related costs and restructuring costs are recognized as period expenses as incurred.
We account for purchased performing loans acquired in business combinations using the contractual cash flows method of recognizing discount accretion based on the acquired loans' contractual cash flows. We record purchased performing loans at fair value, including a credit discount. The fair value discount is accreted as an adjustment to yield over the estimated lives of the loans. We do not establish any allowance for loan losses for purchased performing loans, however we will record a provision for loan losses for any further deterioration in these loans subsequent to the acquisition.
We consider loans purchased with evidence of credit deterioration and for which it is probable that all contractually required payments will not be collected as purchased credit-impaired ("PCI") loans. Evidence of credit quality deterioration as of the purchase date may include the internal loan risk grade, delinquent and nonaccrual status, recent credit scores, and recent loan-to-value percentages. We initially record PCI loans at fair value, which includes estimated future credit losses expected to be incurred over the life of the loan. Thus, we do not establish any allowance for loan losses for PCI loans. We estimate the cash flows expected to be collected at the purchase date using specific credit reviews of certain loans and quantitative models incorporating credit risk, prepayment assumptions, and various other factors. These estimates require significant judgment given the impact of real estate prices, changing loss estimates, prepayment assumptions, and other relevant factors. The excess of cash flows expected to be collected over the estimated fair value is the accretable yield and is recognized in interest income over the remaining life of the loan. The difference between the contractually required payments and the cash flows expected to be collected at the purchase date, considering the impact of prepayments, is the nonaccretable difference and is available to absorb future loan chargeoffs.
Real Estate Owned ("REO"). REO represents real estate acquired as a result of customers' loan defaults. At the time of foreclosure, REO is recorded at the fair value less costs to sell, which becomes the property's new basis. Any write-downs based on the asset's fair value at the date of acquisition are charged to the allowance for loan losses. After foreclosure, management periodically performs valuations such that the real estate is carried at the lower of its new cost basis or fair value, net of estimated costs to sell. Revenue and expenses from operations and subsequent valuation adjustments to the carrying amount of the property are included in non-interest expense in the consolidated statements of income. In some instances, we may make loans to facilitate the sales of REO. Management reviews all sales for which it is the lending institution for compliance with sales treatment under provisions established by ASC Topic 360, "Accounting for Sales of Real Estate". Any gains related to sales of REO may be deferred until the buyer has a sufficient initial and continuing investment in the property.
Post Retirement Plan Assumptions. We have various post retirement plans for the benefit of our directors, executive officers and employees. For some of these plans, the computations include assumptions with regard to discount rates, which are used to calculate benefit expense and the accrued benefit plan obligation. Changes in management's assumptions can materially affect amounts recognized in our Consolidated Financial Statements.
Deferred Tax Assets. We use the asset and liability method of accounting for income taxes. Under this method, deferred tax assets and liabilities are recognized for the future tax consequences attributable to differences between the financial statement carrying amounts of existing assets and liabilities and their respective tax bases. Deferred tax assets and liabilities are measured using enacted tax rates expected to apply to taxable income in the years in which those temporary differences are expected to be recovered or settled. Deferred tax assets are reduced by a valuation allowance when it is more likely than not that some portion of the deferred tax asset will not be realized. We exercise significant judgment in evaluating the amount and timing of recognition of the resulting tax
67
liabilities and assets. These judgments require us to make projections of future taxable income. The judgments and estimates we make in determining our deferred tax assets, which are inherently subjective, are reviewed on a continual basis as regulatory and business factors change. Any reduction in estimated future taxable income may require us to record a valuation allowance against our deferred tax assets.
Comparison of Financial Condition at June 30, 2014 and June 30, 2013
Assets. Total assets increased $491.1 million, or 31.0%, to $2.07 billion at June 30, 2014 from $1.58 billion at June 30, 2013, including an increase in net loans receivable of $341.0 million, or 30.1%, to $1.47 billion at June 30, 2014 from $1.13 billion at June 30, 2013, primarily due to the Jefferson acquisition.
Cash and cash equivalents. Total cash and cash equivalents decreased $79.9 million, or 63.5%, to $45.8 million at June 30, 2014 from $125.7 million at June 30, 2013. The decrease was primarily attributable to $25.2 million used to fund the Jefferson acquisition cash consideration and the balance of the decrease was used to partially fund the purchase of $81.6 million in investment securities. As a part of the Company's liquidity strategy, the Company invests a portion of its excess cash in certificates of deposit in other banks which have a higher yield than cash held in interest-earning accounts in order to increase earnings. All of the certificates of deposit in other banks are fully insured by the FDIC. At June 30, 2014, certificates of deposits in other banks totaled $163.8 million compared to $136.6 million at June 30, 2013. The Company has been maintaining a high liquidity position consistent with the Company's strategy of managing credit and liquidity risk.
Loans. Net loans increased $341.0 million, or 30.1%, to $1.47 billion at June 30, 2014 compared to $1.13 billion at June 30, 2013 primarily due to the May 31, 2014 acquisition of Jefferson. With the exception of municipal leases, all other categories of loans increased during the last fiscal year. Total loan originations decreased $118.2 million, or 27.1%, to $318.1 million during the year ended June 30, 2014 compared to $436.3 million during the year ended June 30, 2013, as demand for new loans from creditworthy borrowers was relatively weak and utilization of existing credit lines was low despite the modest recovery in the general economy. We also continued to reduce our exposure to weaker credits as we aggressively managed problem assets.
Allowance for loan losses. Our allowance for loan losses at June 30, 2014 was $23.4 million or 1.56% of total loans, compared to $32.1 million or 2.75% of total loans at June 30, 2013. The allowance for loan losses was 2.08% of total loans at June 30, 2014, excluding the loans acquired from Jefferson and BankGreenville, which have been recorded at fair value with an appropriate credit discount. We recorded net loan charge-offs of $2.3 million for the year ended June 30, 2014, as compared to $4.1 million for the prior fiscal year. Net loan charge-offs as a percentage of average loans also decreased to 0.19% for the year ended June 30, 2014 from 0.34%, for the year ended June 30, 2013. Non-accruing loans decreased to $47.0 million at June 30, 2014 from $68.6 million at June 30, 2013. Non-accruing loans to total loans decreased to 3.14% at June 30, 2014 from 5.88% at June 30, 2013. At June 30, 2014, $23.9 million, or 50.9%, of total non-accruing loans were current on their loan payments, as compared to $39.6 million or 57.7% of total non-accruing loans at June 30, 2013.
In addition, the ratio of classified assets to total assets decreased to 4.56% at June 30, 2014 from 7.43% at June 30, 2013. Classified assets decreased 19.5% to $94.7 million at June 30, 2014, compared to $117.6 million at June 30, 2013. Delinquent loans (loans delinquent 30 days or more) declined 21.1% to $27.9 million at June 30, 2014, from $35.3 million at June 30, 2013. Impaired loans decreased to $62.8 million at June 30, 2014 from $89.7 million at June 30, 2013. At June 30, 2014, impaired loans, net of charge-offs and specific reserves, represented 81.9% of the original contractual loan balance.
Investments. Securities available for sale increased $144.0 million, to $168.7 million at June 30, 2014 compared to $24.8 million at June 30, 2013 primarily as a result of the May 31, 2014 Jefferson acquisition and the $81.6 million of securities purchased during the year. Partially offsetting these increases were $45.2 million of U.S. agency securities called by the issuer during the year ended June 30, 2014. A total of $9.9 million of principal payments were received on mortgage-backed securities. The principal reduction of mortgage-backed securities was primarily attributable to mortgage prepayments and the scheduled principal payments of the underlying mortgage loans. We evaluate individual investment securities quarterly for other-than-temporary declines in market value. We do not believe that there are any other-than-temporary impairments at June 30, 2014; therefore, no impairment
68
losses have been recorded for fiscal 2014. FHLB stock increased $1.8 million over the last fiscal year primarily due to the Jefferson acquisition.
Real estate owned. REO increased $4.0 million, to $15.7 million at June 30, 2014 primarily due to the May 31, 2014 Jefferson acquisition. The total balance of REO included $6.2 million in land, construction and development projects (both residential and commercial), $4.7 million in commercial real estate and $4.8 million in single-family homes at June 30, 2014. During the year ended June 30, 2014, we transferred $9.6 million of loans into REO, disposed of $10.6 million of properties and recognized a net loss of $646,000 on sales and impairment adjustments.
Deposits. Deposits increased $428.3 million, or 37.1%, to $1.58 billion at June 30, 2014 from $1.15 billion at June 30, 2013, primarily due to the Jefferson and BankGreenville acquisitions. Core deposits (which include checking, savings, and money market accounts) increased $334.5 million, or 54.4%, due to the Jefferson acquisition and the Company's strategy to promote these lower cost accounts. Certificates of deposit increased $93.8 million during the fiscal year as a result of $177.4 million acquired from Jefferson and BankGreenville. Excluding these acquisitions, certificates of deposit decreased $83.6 million during the fiscal year as a result of our managed decline of higher rate certificates of deposit, consistent with the Company's strategy to decrease the percentage of time deposits in its deposit base and to increase the percentage of lower cost checking and savings accounts.
Borrowings. FHLB advances increased to $50.0 million at June 30, 2014 from none at June 30, 2013 primarily due to liabilities assumed in the Jefferson acquisition.
Equity. Stockholders' equity at June 30, 2014 increased to $377.2 million from $367.5 million at June 30, 2013. The increase in stockholders' equity primarily reflected a $10.3 million increase in retained earnings resulting from net income for the fiscal year. The Company repurchased approximately 1.8 million shares for $29.7 million during the year which was partially offset by the issuance of approximately 1.7 million shares valued at $25.2 million to consummate the Jefferson acquisition.
69
Average Balances, Interest and Average Yields/Cost
The following table sets forth for the periods indicated, information regarding average balances of assets and liabilities, as well as, the total dollar amounts of interest income from average interest-earning assets and interest expense on average interest-bearing liabilities, resultant yields, interest rate spread, net interest margin (otherwise known as net yield on interest-earning assets), and the ratio of average interest-earning assets to average interest-bearing liabilities. All average balances are daily average balances. Non-accruing loans have been included in the table as loans carrying a zero yield.
Years Ended June 30, | ||||||||||||||||||||||||||||||
2014 | 2013 | 2012 | ||||||||||||||||||||||||||||
Average Balance Outstanding | Interest Earned/ Paid (2) | Yield/ Rate (2) | Average Balance Outstanding | Interest Earned/ Paid (2) | Yield/ Rate (2) | Average Balance Outstanding | Interest Earned/ Paid (2) | Yield/ Rate (2) | ||||||||||||||||||||||
(Dollars in thousands) | ||||||||||||||||||||||||||||||
Interest-earning assets: | ||||||||||||||||||||||||||||||
Loans receivable (1) | $ | 1,213,271 |
| $ | 59,911 |
|
| 4.94 | % | $ | 1,210,153 | $ | 61,775 | 5.10 | % |
| $ | 1,293,747 | $ | 69,195 | 5.35 | % | ||||||||
Deposits in other financial institutions | 211,254 | 1,749 | 0.83 | % | 221,943 | 1,509 | 0.68 | % | 133,905 | 1,331 | 0.99 | % | ||||||||||||||||||
Investment securities | 89,781 | 1,578 | 1.76 | % | 28,862 | 324 | 1.12 | % | 37,905 | 413 | 1.09 | % | ||||||||||||||||||
Other | 13,730 | 119 | 0.87 | % | 20,769 | 152 | 0.73 | % | 8,003 | 91 | 1.14 | % | ||||||||||||||||||
Total interest-earning assets | 1,528,036 | 63,357 | 4.15 | % | 1,481,727 | 63,760 | 4.30 | % | 1,473,560 | 71,030 | 4.82 | % | ||||||||||||||||||
Interest-bearing liabilities: |
|
|
| |||||||||||||||||||||||||||
Interest-bearing checking accounts | 220,427 | 275 | 0.12 | % | 181,849 | 212 | 0.12 | % | 161,780 | 320 | 0.20 | % | ||||||||||||||||||
Money market accounts | 306,747 | 788 | 0.26 | % | 263,826 | 895 | 0.34 | % | 255,513 | 1,397 | 0.55 | % | ||||||||||||||||||
Savings accounts | 92,374 | 156 | 0.17 | % | 90,545 | 199 | 0.22 | % | 84,106 | 314 | 0.37 | % | ||||||||||||||||||
Certificate accounts | 547,929 | 4,198 | 0.77 | % | 571,324 | 5,669 | 0.99 | % | 705,537 | 8,213 | 1.16 | % | ||||||||||||||||||
Borrowings | 6,109 | 15 | 0.25 | % | 10,434 | 280 | 2.68 | % | 90,060 | 1,534 | 1.70 | % | ||||||||||||||||||
Total interest-bearing liabilities | 1,173,586 | 5,432 | 0.46 | % | 1,117,978 | 7,255 | 0.65 | % | 1,296,996 | 11,778 | 0.91 | % | ||||||||||||||||||
Tax-equivalent net interest income | $ | 57,925 | $ | 56,505 | $ | 59,252 | ||||||||||||||||||||||||
Tax equivalent interest rate spread | 3.69 | % | 3.65 | % | 3.91 | % | ||||||||||||||||||||||||
Net earning assets | $ | 354,450 | $ | 363,749 | $ | 176,564 | ||||||||||||||||||||||||
Tax equivalent net interest margin | 3.79 | % | 3.81 | % | 4.02 | % | ||||||||||||||||||||||||
Average interest-earning assets to average interest-bearing liabilities | 130.20 | % | 132.54 | % | 113.61 | % | ||||||||||||||||||||||||
___________________
(1) The average loans receivable, net balances include loans held for sale and non-accruing loans.
(2) Interest income used in the average interest/earned and yield calculation includes the tax equivalent adjustment of $3.1 million, $3.4 million and $3.5 million for fiscal years ended June 30, 2014, 2013, and 2012, respectively, calculated based on a federal tax rate of 34%.
70
Rate/Volume Analysis
The following schedule presents the dollar amount of changes in interest income and interest expense for major components of interest-earning assets and interest-bearing liabilities. It distinguishes between the changes related to outstanding balances and that due to the changes in interest rates. For each category of interest-earning assets and interest-bearing liabilities, information is provided on changes attributable to (i) changes in volume (i.e., changes in volume multiplied by old rate) and (ii) changes in rate (i.e., changes in rate multiplied by old volume). For purposes of this table, changes attributable to both rate and volume, which cannot be segregated, have been allocated proportionately to the change due to volume and the change due to rate.
Year Ended June 30, | Years Ended June 30, | |||||||||||||||||||||||
2014 vs. 2013 | 2013 vs. 2012 | |||||||||||||||||||||||
Increase/ (decrease) due to | Total increase/ (decrease) | Increase/ (decrease) due to | Total increase/ decrease | |||||||||||||||||||||
Volume | Rate | Volume | Rate | |||||||||||||||||||||
Interest-earning assets: | ||||||||||||||||||||||||
Loans receivable | $ | 159 | $ | (2,023 | ) | $ | (1,864 | ) | $ | (4,471 | ) | $ | (2,949 | ) | $ | (7,420 | ) | |||||||
Deposits in other financial institutions | (73 | ) | 313 | 240 | 875 | (697 | ) | 178 | ||||||||||||||||
Investment securities | 684 | 570 | 1,254 | (99 | ) | 10 | (89 | ) | ||||||||||||||||
Other | (52 | ) | 19 | (33 | ) | 145 | (84 | ) | 61 | |||||||||||||||
Total interest-earning assets | $ | 718 | $ | (1,121 | ) | $ | (403 | ) | $ | (3,550 | ) | $ | (3,720 | ) | $ | (7,270 | ) | |||||||
Interest-bearing liabilities: | ||||||||||||||||||||||||
Interest-bearing checking accounts | $ | 45 | $ | 18 | $ | 63 | $ | 40 | $ | (148 | ) | $ | (108 | ) | ||||||||||
Money market accounts | 146 | (253 | ) | (107 | ) | 45 | (547 | ) | (502 | ) | ||||||||||||||
Savings accounts | 4 | (47 | ) | (43 | ) | 24 | (139 | ) | (115 | ) | ||||||||||||||
Certificate accounts | (232 | ) | (1,239 | ) | (1,471 | ) | (1,562 | ) | (982 | ) | (2,544 | ) | ||||||||||||
Borrowings | (116 | ) | (149 | ) | (265 | ) | (1,356 | ) | 102 | (1,254 | ) | |||||||||||||
Total interest-bearing liabilities | $ | (153 | ) | $ | (1,670 | ) | $ | (1,823 | ) | $ | (2,809 | ) | $ | (1,714 | ) | $ | (4,523 | ) | ||||||
| ||||||||||||||||||||||||
Net increase (decrease) in tax equivalent interest income | $ | 1,420 | $ | (2,747 | ) | |||||||||||||||||||
Comparison of Results of Operations for the Years Ended June 30, 2014 and June 30, 2013
General. During the year ended June 30, 2014, we had net income of $10.3 million as compared to net income of $9.1 million for the year ended June 30, 2013. The increase in net income was primarily driven by improved asset quality leading to a recovery of loan losses of $6.3 million. Net income before merger-related expenses, net of tax, for the fiscal year end of 2014 was $12.2 million compared to $9.1 million for fiscal year 2013, a 35.0% increase. On a basic and diluted per share basis, the Company earned $0.54 per share for the fiscal year ended June 30, 2014 versus $0.45 per share for the fiscal year ended June 30, 2013. Earnings per share before merger-related expenses, net of tax, was $0.64 per share for the fiscal year ended June 30, 2014, an increase of 42.2% compared to the prior fiscal year.
Net Interest Income. Net interest income was $54.8 million for the fiscal year ended June 30, 2014 compared to $53.1 million for the fiscal year ended June 30, 2013. Net interest income increased $1.7 million, or 3.2%, compared to the prior year as interest income on securities available for sale increased $1.3 million and total interest expense decreased $1.8 million, which was partially offset by a $1.6 million decrease in interest income on loans. Net interest margin (on a fully taxable-equivalent bases) for the fiscal year ended June 30, 2014 decreased two basis points to 3.79% over last year. The yield on interest-earning assets (on a fully taxable-equivalent basis) decreased 15 basis points to 4.15% while the rate paid on interest-bearing liabilities decreased 19 basis points to 0.46%.
71
The decline in the yield on interest-earning assets during the year ended June 30, 2014 was primarily due to declines in the tax-equivalent yields on loans receivable. The decline in the yield on interest-bearing liabilities was primarily due to declines in both the average balance and tax-equivalent yields on certificates of deposit. Generally, our balance sheet interest rate sensitivity achieves better net interest rate margins in a stable or increasing interest rate environment. However, due to $577.1 million of loans in the loan portfolio with interest rate floors, net interest income will be negatively impacted in a rising interest rate environment until such time as the current rate exceeds these interest rate floors.
Interest Income. Interest income for the year ended June 30, 2014 was $60.3 million, compared to $60.4 million for the year ended June 30, 2013, a decrease of $108,000, or 0.2%. The decrease in interest income occurred primarily as a result of the decline in the yield on loans receivable and was partially offset by increases in both the average balance and yield on investment securities. Interest income on loans receivable decreased by $1.6 million, or 2.7% to $56.8 million for the year ended June 30, 2014 from $58.4 million for the year ended June 30, 2013, reflecting the impact of a 16 basis point decrease in the average tax-equivalent yield on loans. Average loans receivable held steady at $1.21 billion for the year ended June 30, 2014 compared to fiscal 2013. The decrease in average tax-equivalent loan yields reflects the continuing very low level of market interest rates, the maturity or repayment of higher yielding loans, and downward repricing of adjustable rate loans to current market rates. The average tax-equivalent yield on loans was 4.94% for the year ended June 30, 2014, compared to 5.10% for the year ended June 30, 2013.
The combined average balance of investment securities, deposits in other financial institutions, and other interest-earning assets increased by $43.2 million, or 15.9%, to $314.8 million for the year ended June 30, 2014, while the interest and dividend income from those investments increased by $1.5 million compared to the prior fiscal year. The increase in average balance was primarily due to the purchase of $81.6 million of investment securities during fiscal year 2014 and $85.0 million in investment securities acquired in the Jefferson merger. These increases were partially offset by $45.2 million of U.S. agency securities which were called during the fiscal year.
Interest Expense. Interest expense for the year ended June 30, 2014 was $5.4 million, compared to $7.3 million for the year ended June 30, 2013, a decrease of $1.8 million, or 25.1%. The decrease in interest expense occurred as a result of a 19 basis point decrease in the average cost of interest-bearing liabilities to 0.46% for the year ended June 30, 2014, from 0.65% for the year earlier. These decreases reflect the prepayment of all higher-rate FHLB advances during the year ended June 30, 2013, as well as, a managed decline in certificates of deposit as our pricing decreases were designed to allow higher rate certificates of deposit to run off.
Deposit interest expense decreased $1.6 million, or 22.3%, to $5.4 million for the year ended June 30, 2014 compared to $7.0 million for the year earlier primarily as a result of a $23.4 million decrease in the average balance of certificates of deposit and a 22 basis point decrease in the rate paid on these deposits. In addition, the cost of our money market accounts declined $107,000 due an 8 basis point decrease in the rate paid on these deposits compared to last year. Average borrowings decreased to $6.1 million for the year ended June 30, 2014, from $10.4 million for the year ended June 30, 2013, while the average rate paid on borrowings decreased to 0.25% for the year ended June 30, 2014 from 2.68% for the year ended June 30, 2013. The decrease in the average rate paid on borrowings was primarily the result of the repayment of all higher-rate FHLB advances in fiscal 2013.
Provision for Loan Losses. We establish an allowance for loan losses by charging amounts to the loan provision at a level required to reflect estimated credit losses in the loan portfolio. In evaluating the level of the allowance for loans losses, management considers, among other factors, historical loss experience, the types of loans and the amount of loans in the loan portfolio, adverse situations that may affect borrowers' ability to repay, estimated value of any underlying collateral, prevailing economic conditions and current risk factors specifically related to each loan type. See "Critical Accounting Policies – Allowance for Loan Losses" for a description of the manner in which the provision for loan losses is established.
During the year ended June 30, 2014, the provision (recovery) for loan losses was ($6.3) million, compared to $1.1 million for the year ended June 30, 2013, a decrease of $7.4 million. The recovery in the provision was primarily due to improving asset quality due to lower classified and non-accruing loans, as well as lower loan charge-offs. Non-accruing loans decreased $21.6 million, or 31.4%, and our classified assets declined $22.9 million, or 19.5%, during fiscal year 2014. In addition, at June 30, 2014, $23.9 million, or 50.9%, of our total non-accruing
72
loans were current on their loan payments as compared to $39.6 million, or 57.7%, of total non-accruing loans at June 30, 2013. As a result of these factors, combined with our decreasing loan portfolio (excluding loans acquired through acquisition), our provision for loan losses decreased during fiscal 2014.
A comparison of the allowance at June 30, 2014 and 2013 reflects a decrease of $8.7 million, or 27.0%, to $23.4 million at June 30, 2014, from $32.1 million at June 30, 2013. The allowance as a percentage of total loans decreased to 1.56% at June 30, 2014, compared to 2.75% at June 30, 2013. The allowance for loan losses was 2.08% of total loans at June 30, 2014, excluding the loans acquired from Jefferson and BankGreenville. The allowance as a percentage of non-accruing loans increased slightly to 49.84% at June 30, 2014, compared to 46.78% a year earlier.
As of June 30, 2014, we had identified $62.8 million of impaired loans. Our impaired loans are comprised of loans on nonaccrual and TDRs that are performing under their restructured terms. Impaired loans may be evaluated for reserve purposes using either a specific impairment analysis or on a collective basis as part of homogeneous pools. For more information on these impaired loans, see Note 4 of the Notes to Consolidated Financial Statements under Item 8 of this report.
We believe that the allowance for loan losses as of June 30, 2014 was adequate to absorb the known and inherent risks of loss in the loan portfolio at that date. While we believe the estimates and assumptions used in our determination of the adequacy of the allowance are reasonable, there can be no assurance that such estimates and assumptions will not be proven incorrect in the future, or that the actual amount of future provisions will not exceed the amount of past provisions or that any increased provisions that may be required will not adversely impact our financial condition and results of operations. In addition, the determination of the amount of the allowance for loan losses is subject to review by bank regulators as part of the routine examination process, which may result in the establishment of additional reserves based upon their judgment of information available to them at the time of their examination.
Noninterest Income. Noninterest income was $8.7 million for the fiscal year ended June 30, 2014 compared to $10.4 million for the fiscal year ended June 30, 2013. Mortgage banking income and fees decreased $1.9 million, or 37.0%, as proceeds from sales of loans held for sale decreased to $87.9 million during the 2014 fiscal year compared to $230.9 million for the 2013 fiscal year as loans originated for sale were severely curtailed due to lower refinancing activity driven by increased mortgage loan interest rates throughout the fiscal year.
Noninterest Expense. Noninterest expense for the fiscal year ended June 30, 2014 increased $3.6 million or 7.1% to $55.0 million compared to $51.4 million for the fiscal year ended June 30, 2013. This increase was primarily driven by $2.7 million of merger-related expenses incurred this fiscal year in connection with the July 31, 2013 acquisition of BankGreenville and the May 31, 2014 acquisition of Jefferson. In addition, salaries and employee benefits increased $3.9 million, or 14.9%, partially offset by a $3.1 million decrease in FHLB advance prepayment penalties, as compared to the prior fiscal year. Salaries and employee benefits increased during fiscal year 2014 primarily as a result of stock based compensation and additional employees retained from the acquisitions of BankGreenville and Jefferson. As a result, noninterest expenses as a percentage of average assets increased slightly to 3.29% for the year ended June 30, 2014, as compared to 3.21% for the prior fiscal year.
Income Taxes. The provision for income taxes was $4.5 million for fiscal 2014, representing an effective tax rate of 30.4%, as compared to $2.0 million in fiscal 2013. The increase in the income tax provision was due to higher income before income taxes, as well as a nonrecurring $962,000 charge to tax expense for the decrease in the value of our deferred tax assets based on recently implemented decreases in North Carolina's state corporate tax rates. Beginning January 1, 2014, North Carolina's corporate tax rate was reduced from 6.9% to 6.0% and will be further reduced to 5.0% in 2015 with additional reductions to 3.0% in 2017 possible in the event certain state revenue triggers are achieved.
We performed a robust evaluation of our deferred tax assets at June 30, 2014 and June 30, 2013. In making the determination whether a deferred tax asset is more likely than not to be realized, we seek to evaluate all available positive and negative evidence including the possibility of future reversals of existing taxable temporary differences, projected future taxable income, tax planning strategies and recent financial results. A deferred tax asset valuation allowance is established to reduce the net carrying amount of deferred tax assets if it is determined to be more likely than not that all or some portion of the deferred tax asset will not be realized. At June 30, 2014 and June 30, 2013,
73
our deferred tax asset valuation allowance was $1.0 million and $2.2 million, respectively, reducing our net deferred tax assets to $58.4 million and $47.4 million, respectively. The deferred tax asset valuation allowance relates primarily to North Carolina state income taxes due primarily to limitations on state net operating loss carry-forwards. The net deferred tax asset was the amount that we determined was more likely than not to be realized, based on an analysis of positive and negative evidence at June 30, 2014 and June 30, 2013. Negative evidence considered included:
| · | a pre-tax loss of $28.0 million for the year ended June 30, 2011. This loss was due to a $42.8 million provision for loan losses, as well as, a $3.8 million FHLB prepayment penalty and a $4.5 million check kiting loss; and |
| · | a high level of net chargeoffs, totaling $30.6 million and $34.4 million for the years ended June 30, 2012 and 2011, respectively. Net charge-offs decreased to $2.3 million and $4.1 million for the fiscal years ended June 30, 2014 and 2013, respectively. |
Higher levels of provision expense were the primary cause of the recent loss experience. Our local markets were negatively impacted by the recent recession, causing significant declines in real estate values that led to the need for the charge-offs and provisions. As discussed in more detail below, we believe that our current loan portfolio and credit quality trends indicate that most of the losses resulting from the recent recession have been identified. Therefore, we assumed that our level of credit losses would not continue at the same rate as in fiscal years 2011 and 2012.
Positive evidence reviewed included pre-tax income for the years ended June 30, 2014, 2013, and 2012 strong historical earnings performance, our projected earnings forecast, and tax planning strategies. In developing our projected earnings forecast at June 30, 2014, we assumed gradual improvements in economic conditions for the year ending June 30, 2015, with continued improvements in the ensuing years. These assumptions are in line with both national and regional economic forecasts. As such, our estimates included credit losses at more normal levels in the year ending June 30, 2015 followed by improvement in ensuing years as the economy improves. This is supported by the decrease in net chargeoffs for the fiscal year 2014 to $2.3 million.
The positive evidence that led us to conclude that the income tax benefits of our deferred tax assets would be realized included:
| · | cumulative pre-tax income of $29.8 million for the three years ended June 30, 2014; |
| · | our long sustained history prior to 2010 (more than twenty consecutive years) of generating taxable income and realizing the income tax benefits of our deferred tax assets and income tax credits. This history provided evidence, as supported by recent profitability, that we would be able to return to a profitability level that will allow full utilization of deferred tax assets; |
| · | no prior history of generating loss carry forwards or of expiration of loss carry forwards. Taxable losses generated in fiscal 2010 were carried back to prior years, to realize approximately $4.3 million of the deferred tax asset at June 30, 2010; |
| · | HomeTrust Bank was "well capitalized" under regulatory definitions, allowing management sufficient resources to continue to manage through the current economic conditions and return to profitability; |
| · | The Company raised $208.2 million of additional capital in its July 2012 Conversion. |
| · | based on certain improving credit quality indicators, the credit quality issues that gave rise to the net operating loss carry forward and deferred tax asset related to the loan loss allowance were believed to a large extent limited to fiscal years 2010 and 2011. The recovery for loan losses was $6.3 million for fiscal year 2014. Specifically, we reduced our higher risk commercial construction and development loan portfolio by 68.4% from $179.3 million at June 30, 2008 to $56.5 million at June 30, 2014. This portfolio accounted for 39% of all net loan charge-offs over the past six years. Further, the consumer construction and land/lot loan portfolio decreased by 34.9% from $90.9 million at June 30, 2008 to $59.2 million at June 30, 2014. This portfolio accounted for 11% of all net loan charge-offs over the |
74
past six years. Lastly, our overall credit risk was reduced by the growth in our one-to four-family loan portfolio. This growth was primarily through the acquisition of Jefferson (with appropriate credit discounts) and the origination of 10 year fixed rate owner occupied refinance home loans. These loans are made to customers in the Company's market area and have an extremely low risk profile, with average balances of $100,000, average loan to value ratios of 50%, and borrowers with generally higher credit scores. Given their shorter maturities, these loans pay down quicker as well, further adding strength to their low credit risk profile. Growth in the commercial real estate and commercial/industrial categories is primarily related to loans acquired from Jefferson which include appropriate credit discounts.
| · | the deferred compensation deferred tax asset will reverse as those plans are paid, which generally will be at least over twenty years or more based on the retirement dates of the individuals in the plans. The deferred tax asset related to the net operating loss carry-forwards has a 20 year life, which will allow a significant amount of time for us to utilize the asset. The other significant deferred tax asset relates to the allowance for loan losses. This asset is expected to reverse over the next five years as we realize these losses through charge-offs or recoveries of the loan losses; and |
| · | our projections for future earnings do not assume significant changes in margin, levels of non-interest income, or significant reductions of non-interest expense. |
| · | the tax-free municipal lease portfolio could be sold to generate a taxable gain as well as provide over $100 million to reinvest into taxable investments; in doing so, we could convert substantial tax-free income into taxable income. |
Based on our analysis, there is more positive evidence than negative regarding the utilization of our deferred tax asset and the realization of our recorded deferred tax asset at June 30, 2014 and 2013.
Comparison of Results of Operation for the Year Ended June 30, 2013 and 2012
General. During the year ended June 30, 2013, we had net income of $9.1 million as compared to net income of $4.5 million for the year ended June 30, 2012. This increase was primarily as a result of the $14.5 million decrease in the provision for losses on loans over the prior fiscal year partially offset by a $4.7 million increase in noninterest expense. On a basic and diluted per share basis, the Company earned $0.45 per share for the year ended June 30, 2013, while it had no shares outstanding at June 30, 2012.
Net Interest Income. Net interest income was $53.1 million for the year ended June 30, 2013 compared to $55.7 million for the year ended June 30, 2012. Net interest income decreased $2.6 million, or 4.6%, compared to the same period in the prior year as declines in interest income on loans of $7.3 million outpaced a decrease in deposit and other borrowing costs of $4.5 million. Net interest margin (on a fully taxable-equivalent basis) for the year ended June 30, 2013 decreased 21 basis points to 3.81% over the same period last year, primarily due to a 52 basis point decrease in the yield on interest-earning assets (on a fully taxable-equivalent basis) to 4.30%, partially offset by a 26 basis point decline in the rate paid on interest-bearing liabilities to 0.65%. The decline in the yield on interest-earning assets during the year ended June 30, 2013 was primarily due to declines in both the average balance and tax-equivalent yields on loans receivable. Generally, our balance sheet interest rate sensitivity achieves better net interest rate margins in a stable or increasing interest rate environment. However, due to $410.4 million of loans in the loan portfolio with interest rate floors, net interest income will be negatively impacted in a rising interest rate environment until such time as the current rate exceeds these interest rate floors.
Interest Income. Interest income for the year ended June 30, 2013 was $60.4 million, compared to $67.5 million for the year ended June 30, 2012, a decrease of $7.1 million or 10.5%. The decrease in interest income occurred primarily as a result of declines in both the tax-equivalent yield and average balance of loans receivable. Interest income on loans receivable decreased by $7.3 million or 11.0% to $58.4 million for the year ended June 30, 2013 from $65.7 million for the year ended June 30, 2012, reflecting the decline in the average loans receivable balance and the impact of a 25 basis point decrease in the average tax-equivalent yield on loans. Average loans receivable decreased $83.6 million, or 6.5%, to $1.21 billion for the year ended June 30, 2013 from $1.29 billion for
75
the same period of fiscal 2012. The decrease in average tax-equivalent loan yields reflects the continuing very low level of market interest rates, the maturity or repayment of higher yielding loans, and downward repricing of adjustable rate loans to current market rates. The average tax-equivalent yield on loans was 5.10% for the year ended June 30, 2013, compared to 5.35% for the year ended June 30, 2012.
The combined average balance of investment securities, deposits in other financial institutions, and other interest-earning assets increased by $91.8 million or 51.0% to $271.6 million for the year ended June 30, 2013, while the interest and dividend income from those investments increased by $150,000 compared to the prior fiscal year. The increase in average balance was primarily due to the investment of the proceeds from our Conversion at currently relatively low rates.
Interest Expense. Interest expense for the year ended June 30, 2013 was $7.3 million, compared to $11.8 million for the year ended June 30, 2012, a decrease of $4.5 million, or 38.4%. The decrease in interest expense occurred as a result of a $179.0 million decrease in average interest-bearing liabilities and a 26 basis point decrease in the average cost of interest-bearing liabilities to 0.65% for the year ended June 30, 2013, from 0.91% for the same period one year earlier. These decreases reflect repayments upon scheduled maturity and the prepayment of all FHLB advances during the year ended June 30, 2013, as well as, a managed decline in certificates of deposit as our pricing decreases were designed to allow higher rate certificates of deposit to run off.
Deposit interest expense decreased $3.3 million, or 31.9%, to $7.0 million for the year ended June 30, 2013 compared to $10.2 million for the same period one year earlier primarily as a result of a $134.2 million decrease in the average balance of certificates of deposit and a 17 basis point decrease in the rate paid on these deposits. In addition, the cost of our money market accounts declined $502,000 due a 21 basis point decrease in the rate paid on these deposits compared to the same period last year. Average borrowings decreased to $10.4 million for the year ended June 30, 2013, from $90.1 million for the year ended June 30, 2012, while the average rate paid on borrowings increased to 2.68% for the year ended June 30, 2013 from 1.70% for the year ended June 30, 2012. This increase in the average rate paid on borrowings was primarily a result of the repayment of all $113.0 million of lower rate, short term FHLB advances during the prior fiscal year.
Provision for Loan Losses. We establish an allowance for loan losses by charging amounts to the loan provision at a level required to reflect estimated credit losses in the loan portfolio. In evaluating the level of the allowance for loans losses, management considers, among other factors, historical loss experience, the types of loans and the amount of loans in the loan portfolio, adverse situations that may affect borrowers' ability to repay, estimated value of any underlying collateral, prevailing economic conditions and current risk factors specifically related to each loan type. See "Critical Accounting Policies – Allowance for Loan Losses" for a description of the manner in which the provision for loan losses is established.
During the year ended June 30, 2013, the provision for loan losses was $1.1 million, compared to $15.6 million for the year ended June 30, 2012, a decrease of $14.5 million or 92.9%. During fiscal 2013, home and lot sales activity and real estate values have modestly improved along with general economic conditions, resulting in materially lower loan charge-offs, which was the primary factor in the $26.5 million or 86.5% decrease in the provision for loan losses to $4.1 million during fiscal 2013 compared to $30.6 million for the prior fiscal year. Although our non-accruing loans increased $4.4 million during the year ended June 30, 2013 our classified assets declined $15.7 million during the year. In addition, at June 30, 2013, $39.6 million or 57.7% of our total non-accruing loans were current on their loan payments as compared to $28.1 million or 43.8% of total non-accruing loans at June 30, 2012. As a result of these factors, combined with our decreasing loan portfolio, in particular declines in commercial construction and development and commercial real estate loan balances, our provision for loan losses significantly decreased during fiscal 2013.
A comparison of the allowance at June 30, 2013 and 2012 reflects a decrease of $3.0 million to $32.1 million at June 30, 2013, from $35.1 million at June 30, 2012. The allowance as a percentage of total loans decreased to 2.75% at June 30, 2013, compared to 2.85% at June 30, 2012. Likewise, the allowance as a percentage of non-accruing loans decreased to 46.78% at June 30, 2013, compared to 54.69% a year earlier. The decline in the allowance for loan losses as a percentage from the prior year was due to the significant decline in net charge-offs year over year.
76
As of June 30, 2013, we had identified $89.7 million of impaired loans. Our impaired loans are comprised of loans on nonaccrual and TDRs that are performing under their restructured terms. Impaired loans may be evaluated for reserve purposes using either a specific impairment analysis or on a collective basis as part of homogeneous pools. For more information on these impaired loans, see Note 3 of the Notes to Consolidated Financial Statements under Item 8 of this report.
Noninterest Income. Noninterest income remained unchanged at $10.4 million for the fiscal year ended June 30, 2013 compared to the fiscal year ended June 30, 2012. Mortgage banking income and fees increased $1.3 million for the year ended June 30, 2013 as proceeds from loans held for sale increased to $227.2 million from $193.4 million for the year ended June 30, 2012. Mortgage banking loan origination volume remains favorable from a historical perspective as a result of continuing loan refinancing due to very low mortgage interest rates although the recent rise in mortgage interest rates may result in lower refinance activity in the future resulting in reduced income. Gain on sale of fixed assets decreased $1.5 million due to the sale of a branch office during the prior fiscal year. Other noninterest income increased $291,000 for the year ended June 30, 2013 as compared to the prior fiscal year primarily due to income from additional bank-owned life insurance purchased since June 30, 2012.
Noninterest Expense. Noninterest expense for the year ended June 30, 2013 increased $4.7 million or 10.1% to $51.4 million compared to $46.7 million for the year ended June 30, 2012. This increase was primarily related to $3.1 million in prepayment penalties on FHLB borrowings repaid during the year ended June 30, 2013 and a $4.8 million, or 22.0%, increase in salaries and employee benefits as compared to the prior fiscal year. Salaries and employee benefits increased as a direct result of hiring 25 additional full time employees (primarily in mortgage banking, regulatory compliance, and information technology) coupled with additional expense related to the Company's new ESOP and 2013 Omnibus Incentive Plan. These increases were partially offset by a $2.1 million reduction in loss on sale and impairment of real estate owned reflecting the modest improvement in real estate values in our market areas. Noninterest expenses as a percentage of average assets increased to 3.21% for the year ended June 30, 2013, as compared to 2.95% for the prior fiscal year.
Income Taxes. The provision for income taxes was $2.0 million for fiscal 2013, representing an effective tax rate of 17.9%, as compared to a tax benefit of ($647,000) in fiscal 2012. The tax benefit in fiscal 2012 was primarily due to the tax-free income received on our municipal leases as well as our significant provision for loan losses which reduced our earnings before income tax.
Asset/Liability Management
Our Risk When Interest Rates Change. The rates of interest we earn on assets and pay on liabilities generally are established contractually for a period of time. Market interest rates change over time. Our loans generally have longer maturities than our deposits. Accordingly, our results of operations, like those of other financial institutions, are impacted by changes in interest rates and the interest rate sensitivity of our assets and liabilities. The risk associated with changes in interest rates and our ability to adapt to these changes is known as interest rate risk and is our most significant market risk. If interest rates rise, our net interest income could be reduced because interest paid on interest-bearing liabilities, including deposits and borrowings, could increase more quickly than interest received on interest-earning assets, including loans and other investments. In addition, rising interest rates may hurt our income because they may reduce the demand for loans. In the alternative, if interest rates decrease, our net interest income could increase.
How We Measure Our Risk of Interest Rate Changes. As part of our attempt to manage our exposure to changes in interest rates and comply with applicable regulations, we monitor our interest rate risk. In monitoring interest rate risk we continually analyze and manage assets and liabilities based on their payment streams and interest rates, the timing of their maturities, and their sensitivity to actual or potential changes in market interest rates. The board of directors sets the asset and liability policy of HomeTrust Bank, which is implemented by management and an asset/liability committee whose members include certain members of senior management.
The purpose of this committee is to communicate, coordinate and control asset/liability management consistent with our business plan and board approved policies. The committee establishes and monitors the volume and mix of assets and funding sources taking into account relative costs and spreads, interest rate sensitivity and
77
liquidity needs. The objectives are to manage assets and funding sources to produce results that are consistent with liquidity, capital adequacy, growth, risk, and profitability goals.
The committee generally meets on a quarterly basis to review, among other things, economic conditions and interest rate outlook, current and projected liquidity needs and capital position, anticipated changes in the volume and mix of assets and liabilities and interest rate risk exposure limits versus current projections pursuant to net present value of portfolio equity analysis and income simulations. The committee recommends appropriate strategy changes based on this review. The committee is responsible for reviewing and reporting on the effects of the policy implementations and strategies to the board of directors at least quarterly.
Among the techniques we use to manage interest rate risk are: (i) increasing our portfolio of hybrid and adjustable-rate one- to four-family residential loans; (ii) maintaining a strong capital position, which provides for a favorable level of interest-earning assets relative to interest-bearing liabilities; and (iii) emphasizing less interest rate sensitive and lower-costing "core deposits." We also maintain a portfolio of short-term or adjustable-rate assets and use fixed-rate Federal Home Loan Bank advances and brokered deposits to extend the term to repricing of our liabilities.
We consider the relatively short duration of our deposits in our overall asset/liability management process. Should short-term rates increase, we have assets and liabilities that will increase with the market. This is reflected in the small change in our present value equity ("PVE") when rates increase (see the table below). PVE is defined as the net present value of our existing assets and liabilities. In addition, we have historically demonstrated an ability to maintain retail deposits through various interest rate cycles. If local retail deposit rates increase dramatically, we also have access to wholesale funding through our lines of credit with the FHLB and Federal Reserve, as well as through the brokered deposit market to replace retail deposits, as needed.
Depending on the level of general interest rates, the relationship between long- and short-term interest rates, market conditions and competitive factors, the committee may in the future determine to increase our interest rate risk position somewhat in order to maintain or increase our net interest margin. In particular, we believe that the increased net interest income resulting from a mismatch in the maturity of our assets and liabilities portfolios can, during periods of stable or declining interest rates, provide high enough returns to justify increased exposure to sudden and unexpected increases in interest rates. As a result of this philosophy, our results of operations and the economic value of our equity will remain vulnerable to increases in interest rates and to declines due to differences between long- and short-term interest rates.
The committee regularly reviews interest rate risk by forecasting the impact of alternative interest rate environments on net interest income and our PVE. The committee also valuates these impacts against the potential changes in net interest income and market value of our portfolio equity that are monitored by the board of directors of HomeTrust Bank generally on a quarterly basis.
Our asset/liability management strategy sets limits on the change in PVE given certain changes in interest rates. The table presented here, as of June 30, 2014, is forward-looking information about our sensitivity to changes in interest rates. The table incorporates data from an independent service, as it relates to maturity repricing and repayment/withdrawal of interest-earning assets and interest-bearing liabilities. Interest rate risk is measured by changes in PVE for instantaneous parallel shifts in the yield curve up and down 400 basis points. Given the relatively low level of market interest rates, a PVE calculation for a decrease of greater than 100 basis points has not been prepared. An increase in rates would negatively impact our PVE as a result of costs of deposit accounts increasing more rapidly than yields on loans due to the fixed rate nature of a large portion of our loan portfolio. As rates rise, the market value of fixed rate assets generally declines due to both the rate increases and slowing prepayments. In addition, due to a number of loans in our loan portfolio with interest rate floors, our net interest income will be negatively impacted in a rising interest rate environment until such time as the current rate exceeds these interest rate floors. Conversely, in a falling interest rate environment these interest rate floors will assist in maintaining our net interest income. As of June 30, 2014, our loans with interest rate floors totaled approximately $577.1 million and had a weighted average floor rate of 4.46%.
78
June 30, 2014 | ||||||||||||||||||
Change in Interest Rates in | Present Value Equity | PVE | ||||||||||||||||
Basis Points | Amount | $ Change | % Change | Ratio | ||||||||||||||
(Dollars in Thousands) | ||||||||||||||||||
| +400 | $ | 430,566 | $ | (72,118 | ) | (14 | )% | 24 | % | |||||||||
| +300 | 446,496 | (56,188 | ) | (11 | ) | 24 | ||||||||||||
| +200 | 462,920 | (39,764 | ) | (8 | ) | 24 | ||||||||||||
| +100 | 481,619 | (21,065 | ) | (4 | ) | 24 | ||||||||||||
Base | 502,684 | - | - | 25 | ||||||||||||||
| -100 | 503,887 | 1,203 | 0 | 24 | ||||||||||||||
In evaluating our exposure to interest rate movements, certain shortcomings inherent in the method of analysis presented in the foregoing table must be considered. For example, although certain assets and liabilities may have similar maturities or repricing periods, they may react in different degrees to changes in market interest rates. Also, the interest rates on certain types of assets and liabilities may fluctuate in advance of changes in market interest rates, while interest rates on other types may lag behind changes in interest rates. Additionally, certain assets, such as adjustable rate mortgages, have features which restrict changes in interest rates on a short-term basis and over the life of the asset. Further, in the event of a significant change in interest rates, prepayment and early withdrawal levels would likely deviate significantly from those assumed above. Finally, the ability of many borrowers to service their debt may decrease in the event of an interest rate increase. We consider all of these factors in monitoring our exposure to interest rate risk.
The board of directors and management of HomeTrust Bank believe that certain factors afford HomeTrust Bank the ability to operate successfully despite its exposure to interest rate risk. HomeTrust Bank may manage its interest rate risk by originating and retaining adjustable rate loans in its portfolio, by borrowing from the Federal Home Loan Bank to match the duration of our funding to the duration of originated fixed rate one- to four-family real estate loans held in portfolio and by selling on an ongoing basis certain currently originated fixed rate one- to four-family real estate loans.
Liquidity
Management maintains a liquidity position that it believes will adequately provide funding for loan demand and deposit run-off that may occur in the normal course of business. We rely on a number of different sources in order to meet our potential liquidity demands. The primary sources are increases in deposit accounts and cash flows from loan payments and the securities portfolio.
In addition to these primary sources of funds, management has several secondary sources available to meet potential funding requirements. As of June 30, 2014, HomeTrust Bank had an additional borrowing capacity of $253.4 million with the FHLB of Atlanta, a $140.2 million line of credit with the Federal Reserve Bank of Richmond and a $5 million line of credit with another unaffiliated bank. At June 30, 2014, we had $50.0 million in FHLB advances outstanding as part of liabilities assumed from the Jefferson acquisition and nothing outstanding under our other lines of credit. Additionally, the Company classifies its securities portfolio as available for sale, providing an additional source of liquidity. Management believes that our security portfolio is of high quality and the securities would therefore be marketable. In addition, we have historically sold fixed-rate mortgage loans in the secondary market to reduce interest rate risk and to create still another source of liquidity. From time to time we also utilize brokered time deposits to supplement our other sources of funds. Brokered time deposits are obtained by utilizing an outside broker that is paid a fee. This funding requires advance notification to structure the type of deposit desired by us. Brokered deposits can vary in term from one month to several years and have the benefit of being a source of longer-term funding. We also utilize brokered deposits to help manage interest rate risk by extending the term to repricing of our liabilities, enhance our liquidity and fund asset growth. Brokered deposits are typically from outside our primary market areas, and our brokered deposit levels may vary from time to time depending on competitive interest rate conditions and other factors. At June 30, 2014, brokered deposits totaled $10.0 million or 0.63% of total deposits.
79
Liquidity management is both a daily and long-term function of business management. Excess liquidity is generally invested in short-term investments, such as overnight deposits and federal funds. On a longer term basis, we maintain a strategy of investing in various lending products and investment securities, including mortgage-backed securities. The Company on a stand-alone level is a separate legal entity from HomeTrust Bank and must provide for its own liquidity and pay its own operating expenses. The Company's primary source of funds consists of the net proceeds retained by the Company from the Conversion. We also have the ability to receive dividends or capital distributions from HomeTrust Bank, although there are regulatory restrictions on the ability of HomeTrust Bank to pay dividends. At June 30, 2014, the Company (on an unconsolidated basis) had liquid assets of $13.7 million.
We use our sources of funds primarily to meet our ongoing commitments, pay maturing deposits and fund withdrawals, and to fund loan commitments. At June 30, 2014, the total approved loan commitments and unused lines of credit outstanding amounted to $55.4 million and $167.6 million, respectively, as compared to $54.2 million and $151.6 million, respectively, as of June 30, 2013. Certificates of deposit scheduled to mature in one year or less at June 30, 2014, totaled $451.1 million. It is management's policy to manage deposit rates that are competitive with other local financial institutions. Based on this management strategy, we believe that a majority of maturing deposits will remain with us.
During fiscal 2014, cash and cash equivalents decreased $79.9 million, or 63.5%, from $125.7 million as of June 30, 2013 to $45.8 million as of June 30, 2014 primarily due to the purchase of over $81.6 million in investment securities over fiscal year 2014. Cash used for financing activities of $78.5 million and investing activities of $25.1 million was partially offset by cash provided by operating activities of $23.8 million. Primary sources of cash for the year ended June 30, 2014 included proceeds from the maturity of available for sale securities of $45.2 million, a net decrease in portfolio loans of $30.0 million, and proceeds from the sale of real estate owned of $10.6 million. Primary uses of cash during the period included the purchase of securities available for sale, net of proceeds from sales of $79.5 million, a $38.2 million decrease in net deposits, $29.7 million used to repurchase common stock, and the purchase of certificates of deposit in other banks, net of maturities, of $27.2 million.
During fiscal 2013, cash and cash equivalents decreased $99.1 million, or 44.1%, from $224.8 million as of June 30, 2012 to $125.7 million as of June 30, 2013 primarily due to the refunding of $76.0 million in funds held on deposit for orders to purchase shares of the Company's common stock in its recent oversubscribed Conversion. Cash used for financing activities of $152.4 million was partially offset by cash provided by operating activities of $23.9 million and by investing activities of $29.4 million. Primary sources of cash for the year ended June 30, 2013 included proceeds from the Conversion of $208.2 million, a net decrease in portfolio loans of $54.4 million, and proceeds from the sale of real estate owned of $11.1 million. Primary uses of cash during the period included a $311.4 million decrease in net deposits, purchases of bank-owned life insurance of $16.0 million, and the purchase of certificates of deposit in other banks, net of maturities, of $28.6 million. The decrease in net deposits was primarily due to the reduction of $264.2 million in funds held on deposit at June 30, 2012 for orders to purchase shares of the Company's common stock.
At June 30, 2014, equity totaled $377.2 million. Management monitors the capital levels of the Company to provide for current and future business opportunities and to ensure HomeTrust Bank meets regulatory guidelines for "well-capitalized" institutions. As a savings and loan holding company regulated by the Federal Reserve Board, the Company is not currently subject to any separate regulatory capital requirements, however, HomeTrust Bank must maintain various minimum capital ratios established by the OCC to be categorized as well capitalized. Failure to meet minimum capital requirements can initiate certain mandatory and possibly additional discretionary actions by bank regulators that, if undertaken, could have a direct material effect on HomeTrust Bank's financial statements. As of June 30, 2014, HomeTrust Bank was "well-capitalized" as defined under the regulatory framework for prompt corrective action. To be categorized as "well-capitalized," HomeTrust Bank must maintain the minimum capital ratios set forth in the table below.
80
HomeTrust Bank's actual and required minimum capital amounts and ratios to be categorized "adequately" and "well capitalized" are as follows (dollars in thousands):
Regulatory Requirements | ||||||||||||||||||||||||
Minimum for Capital | Minimum to Be | |||||||||||||||||||||||
Actual | Adequacy Purposes | Well Capitalized | ||||||||||||||||||||||
Amount | Ratio | Amount | Ratio | Amount | Ratio | |||||||||||||||||||
As of June 30, 2014: | ||||||||||||||||||||||||
Tier I Capital (to Total Adjusted Assets) | $ | 264,041 | 13.37 | % | $ | 78,985 | 4.00 | % | $ | 98,719 | 5.00 | % | ||||||||||||
Tier I Capital (to Risk-weighted Assets) | $ | 264,041 | 18.29 | % | $ | - | - | % | $ | 86,625 | 6.00 | % | ||||||||||||
Total Risk-based Capital (to Risk-weighted Assets) | $ | 282,160 | 19.54 | % | $ | 115,501 | 8.00 | % | $ | 144,376 | 10.00 | % | ||||||||||||
As of June 30, 2013: | ||||||||||||||||||||||||
Tier I Capital (to Total Adjusted Assets) | $ | 228,454 | 15.25 | % | $ | 59,920 | 4.00 | % | $ | 74,901 | 5.00 | % | ||||||||||||
Tier I Capital (to Risk-weighted Assets) | $ | 228,454 | 21.89 | % | $ | - | - | % | $ | 62,620 | 6.00 | % | ||||||||||||
Total Risk-based Capital (to Risk-weighted Assets) | $ | 241,736 | 23.16 | % | $ | 83,493 | 8.00 | % | $ | 104,367 | 10.00 | % | ||||||||||||
Recent Accounting Pronouncements
For a discussion of recent accounting pronouncements, see Note 1 of the Notes to our Financial Statements beginning on page F-1 of Item 8 of this report.
Item 7A. Quantitative and Qualitative Disclosures About Market Risk
Market risk is the risk of loss from adverse changes in market prices and rates. Our market risk arises principally from interest rate risk inherent in our lending, investing, deposit and borrowings activities. Management actively monitors and manages its interest rate risk exposure. In addition to other risks that we manage in the normal course of business, such as credit quality and liquidity, management considers interest rate risk to be a significant market risk that could have a potentially material effect on our financial condition and result of operations. The information contained in Item 7, "Management's Discussion and Analysis of Financial Condition and Results of Operations – Asset Liability Management" in this Form 10-K is incorporated herein by reference.
81
Item 8. Financial Statements and Supplementary Data
INDEX TO CONSOLIDATED FINANCIAL STATEMENTS
| Page |
Report of Independent Registered Public Accounting Firm | 83 |
Consolidated Balance Sheets, June 30, 2014 and 2013 | 84 |
Consolidated Statements of Income for the Years Ended June 30, 2014, 2013 and 2012 | 85 |
Consolidated Statements of Comprehensive Income for the Years Ended June 30, 2014, 2013 and 2012 | 86 |
Consolidated Statements of Changes in Stockholders' Equity for the Years Ended June 30, 2014, 2013 and 2012 | 87 |
Consolidated Statements of Cash Flows for the Years Ended June 30, 2014, 2013 and 2012 | 88 |
Notes to Consolidated Financial Statements for the Years Ended June 30, 2014, 2013 and 2012 | 90 |
** This annual report does not include an attestation report of the Company's independent registered public accounting firm regarding internal control over financial reporting. As an emerging growth company, management's report was not subject to attestation by the Company's independent registered public accounting firm in accordance with the JOBS Act of 2012.
82

REPORT OF INDEPENDENT REGISTERED PUBLIC ACCOUNTING FIRM
To the Stockholders and the Board of Directors
HomeTrust Bancshares, Inc.
Asheville, North Carolina
We have audited the accompanying consolidated balance sheets of HomeTrust Bancshares, Inc. and subsidiary (the "Company") as of June 30, 2014 and 2013, and the related consolidated statements of income, comprehensive income, changes in stockholders' equity and cash flows for each of the years in the three-year period ended June 30, 2014. These consolidated financial statements are the responsibility of the Company's management. Our responsibility is to express an opinion on these financial statements based on our audits.
We conducted our audits in accordance with the standards of the Public Company Accounting Oversight Board (United States). Those standards require that we plan and perform the audit to obtain reasonable assurance about whether the financial statements are free of material misstatement. An audit includes examining, on a test basis, evidence supporting the amounts and disclosures in the financial statements. An audit also includes assessing the accounting principles used and significant estimates made by management, as well as evaluating the overall financial statement presentation. We believe that our audits provide a reasonable basis for our opinion.
In our opinion, the consolidated financial statements referred to above present fairly, in all material respects, the financial position of HomeTrust Bancshares, Inc. and subsidiary as of June 30, 2014 and 2013, and the results of their operations and their cash flows for each of the years in the three-year period ended June, 2014, in conformity with accounting principles generally accepted in the United States of America.
/s/ DIXON HUGHES GOODMAN LLP
Charlotte, North Carolina
September 15, 2014
83
HOMETRUST BANCSHARES, INC. AND SUBSIDIARY
Consolidated Balance Sheets
(Dollar amounts in thousands except per share data)
June 30, | ||||||||
2014 | 2013 | |||||||
Assets | ||||||||
Cash | $ | 19,801 | $ | 13,251 | ||||
Interest-bearing deposits | 26,029 | 112,462 | ||||||
Cash and cash equivalents | 45,830 | 125,713 | ||||||
Certificates of deposit in other banks | 163,780 | 136,617 | ||||||
Securities available for sale, at fair value | 168,749 | 24,750 | ||||||
Loans held for sale | 2,537 | 10,770 | ||||||
Total loans, net of deferred loan fees and discount | 1,496,528 | 1,164,183 | ||||||
Allowance for loan losses | (23,429 | ) | (32,073 | ) | ||||
Net loans | 1,473,099 | 1,132,110 | ||||||
Premises and equipment, net | 47,411 | 22,400 | ||||||
Federal Home Loan Bank (FHLB) stock, at cost | 3,697 | 1,854 | ||||||
Accrued interest receivable | 6,787 | 5,549 | ||||||
Real estate owned (REO) | 15,725 | 11,739 | ||||||
Deferred income taxes | 58,381 | 47,428 | ||||||
Bank owned life insurance | 71,285 | 62,242 | ||||||
Goodwill | 9,815 | - | ||||||
Core deposit intangibles | 4,014 | 120 | ||||||
Other assets | 3,344 | 2,031 | ||||||
Total Assets | $ | 2,074,454 | $ | 1,583,323 | ||||
Liabilities and Stockholders' Equity | ||||||||
Liabilities | ||||||||
Deposits | $ | 1,583,047 | $ | 1,154,750 | ||||
Other borrowings | 50,000 | - | ||||||
Capital lease obligations | 1,998 | 2,016 | ||||||
Other liabilities | 62,258 | 59,042 | ||||||
Total liabilities | 1,697,303 | 1,215,808 | ||||||
Stockholders' Equity | ||||||||
Preferred stock, $0.01 par value, 10,000,000 shares authorized, none issued | ||||||||
or outstanding | - | - | ||||||
Common stock, $0.01 par value, 60,000,000 shares authorized, 20,632,008 | ||||||||
shares issued and outstanding at June 30, 2014; 20,824,900 at June 30, 2013 | 207 | 208 | ||||||
Additional paid in capital | 225,889 | 227,397 | ||||||
Retained earnings | 160,332 | 149,990 | ||||||
Unearned Employee Stock Ownership Plan (ESOP) shares | (9,522 | ) | (10,051 | ) | ||||
Accumulated other comprehensive income (loss) | 245 | (29 | ) | |||||
Total stockholders' equity | 377,151 | 367,515 | ||||||
Total Liabilities and Stockholders' Equity | $ | 2,074,454 | $ | 1,583,323 | ||||
The accompanying notes are an integral part of these consolidated financial statements.
84
HOMETRUST BANCSHARES, INC. AND SUBSIDIARY
Consolidated Statements of Income
(Dollar amounts in thousands)
June 30, | ||||||||||||
2014 | 2013 | 2012 | ||||||||||
Interest and Dividend Income | ||||||||||||
Loans | $ | 56,835 | $ | 58,404 | $ | 65,656 | ||||||
Securities available for sale | 1,578 | 324 | 413 | |||||||||
Certificates of deposit and other interest-bearing deposits | 1,789 | 1,578 | 1,331 | |||||||||
FHLB stock | 79 | 83 | 91 | |||||||||
Total interest and dividend income | 60,281 | 60,389 | 67,491 | |||||||||
Interest Expense | ||||||||||||
Deposits | 5,417 | 6,975 | 10,244 | |||||||||
Other borrowings | 15 | 280 | 1,534 | |||||||||
Total interest expense | 5,432 | 7,255 | 11,778 | |||||||||
Net Interest Income | 54,849 | 53,134 | 55,713 | |||||||||
Provision for (Recovery of) Loan Losses | (6,300 | ) | 1,100 | 15,600 | ||||||||
Net Interest Income after Provision for Loan Losses | 61,149 | 52,034 | 40,113 | |||||||||
Noninterest Income | ||||||||||||
Service charges on deposit accounts | 2,783 | 2,589 | 2,679 | |||||||||
Mortgage banking income and fees | 3,218 | 5,107 | 3,846 | |||||||||
Gain from sales of securities available for sale | 10 | - | - | |||||||||
Gain on sale of premises and equipment | - | - | 1,503 | |||||||||
Other, net | 2,727 | 2,691 | 2,400 | |||||||||
Total noninterest income | 8,738 | 10,387 | 10,428 | |||||||||
Noninterest Expense | ||||||||||||
Salaries and employee benefits | 30,366 | 26,438 | 21,679 | |||||||||
Net occupancy expense | 5,322 | 5,497 | 4,975 | |||||||||
Marketing and advertising | 1,360 | 1,705 | 1,546 | |||||||||
Telephone, postage, and supplies | 1,799 | 1,737 | 1,459 | |||||||||
Deposit insurance premiums | 1,312 | 1,407 | 2,097 | |||||||||
Computer services | 3,690 | 2,386 | 1,853 | |||||||||
FHLB advance prepayment penalty | - | 3,069 | 2,111 | |||||||||
Loss on sale and impairment of REO | 646 | 951 | 3,040 | |||||||||
REO expense | 1,443 | 2,135 | 1,951 | |||||||||
Merger-related expenses | 2,708 | - | - | |||||||||
Other | 6,386 | 6,068 | 5,950 | |||||||||
Total noninterest expense | 55,032 | 51,393 | 46,661 | |||||||||
Income Before Income Taxes | 14,855 | 11,028 | 3,880 | |||||||||
Income Tax Expense (Benefit) | 4,513 | 1,975 | (647 | ) | ||||||||
Net Income | $ | 10,342 | $ | 9,053 | $ | 4,527 | ||||||
Per Share Data: | ||||||||||||
Net income per common share: | ||||||||||||
Basic | $ | 0.54 | $ | 0.45 | n/a | |||||||
Diluted | $ | 0.54 | $ | 0.45 | n/a | |||||||
Average shares outstanding: | ||||||||||||
Basic | 18,630,774 | 19,922,283 | n/a | |||||||||
Diluted | 18,715,669 | 19,941,687 | n/a | |||||||||
The accompanying notes are an integral part of these consolidated financial statements.
85
HOMETRUST BANCSHARES, INC. AND SUBSIDIARY
Consolidated Statements of Comprehensive Income
(Dollar amounts in thousands)
June 30, | ||||||||||||
2014 | 2013 | 2012 | ||||||||||
Net Income | $ | 10,342 | $ | 9,053 | $ | 4,527 | ||||||
Other Comprehensive Income (Loss) | ||||||||||||
Unrealized holding gains (losses) on securities available for sale | ||||||||||||
Gains (losses) arising during the period | $ | 415 | $ | (318 | ) | $ | 286 | |||||
Deferred income tax benefit (expense) | (141 | ) | 108 | (97 | ) | |||||||
Total other comprehensive income (loss) | $ | 274 | $ | (210 | ) | $ | 189 | |||||
Comprehensive Income | $ | 10,616 | $ | 8,843 | $ | 4,716 | ||||||
The accompanying notes are an integral part of these consolidated financial statements.
86
HOMETRUST BANCSHARES, INC. AND SUBSIDIARY
Consolidated Statements of Changes in Stockholders' Equity
(Dollar amounts in thousands)
Accumulated | ||||||||||||||||||||||||
Additional | Unearned | Other | Total | |||||||||||||||||||||
Common | Paid In | Retained | ESOP | Comprehensive | Stockholders' | |||||||||||||||||||
Stock | Capital | Earnings | Shares | Income (Loss) | Equity | |||||||||||||||||||
Balance at June 30, 2011 | $ | - | $ | 31,367 | $ | 136,410 | $ | - | $ | (8 | ) | $ | 167,769 | |||||||||||
Net income | - | - | 4,527 | - | - | 4,527 | ||||||||||||||||||
Other comprehensive income | - | - | - | - | 189 | 189 | ||||||||||||||||||
Balance at June 30, 2012 | $ | - | $ | 31,367 | $ | 140,937 | $ | - | $ | 181 | $ | 172,485 | ||||||||||||
Net income | - | - | 9,053 | - | - | 9,053 | ||||||||||||||||||
Issuance of common stock | 212 | 211,388 | - | - | - | 211,600 | ||||||||||||||||||
Common stock issuance cost | - | (3,396 | ) | - | - | - | (3,396 | ) | ||||||||||||||||
Loan to ESOP for purchase of shares | - | - | - | (10,580 | ) | - | (10,580 | ) | ||||||||||||||||
Stock repurchased for equity incentive plan | (9 | ) | (13,290 | ) | - | - | - | (13,299 | ) | |||||||||||||||
Granted restricted stock | 5 | (5 | ) | - | - | - | ||||||||||||||||||
Stock option expense | - | 541 | - | - | - | 541 | ||||||||||||||||||
Restricted stock expense | - | 572 | - | - | - | 572 | ||||||||||||||||||
ESOP shares allocated | - | 220 | - | 529 | - | 749 | ||||||||||||||||||
Other comprehensive loss | - | - | - | - | (210 | ) | (210 | ) | ||||||||||||||||
Balance at June 30, 2013 | $ | 208 | $ | 227,397 | $ | 149,990 | $ | (10,051 | ) | $ | (29 | ) | $ | 367,515 | ||||||||||
Net income | - | - | 10,342 | - | - | 10,342 | ||||||||||||||||||
Stock repurchased | (18 | ) | (29,668 | ) | - | - | - | (29,686 | ) | |||||||||||||||
Shares issued for Jefferson Bancshares, Inc. merger | 17 | 25,222 | - | - | - | 25,239 | ||||||||||||||||||
Stock option expense | - | 1,273 | - | - | - | 1,273 | ||||||||||||||||||
Restricted stock expense | - | 1,350 | - | - | - | 1,350 | ||||||||||||||||||
ESOP shares allocated | - | 315 | - | 529 | - | 844 | ||||||||||||||||||
Other comprehensive income | - | - | - | - | 274 | 274 | ||||||||||||||||||
Balance at June 30, 2014 | $ | 207 | $ | 225,889 | $ | 160,332 | $ | (9,522 | ) | $ | 245 | $ | 377,151 | |||||||||||
The accompanying notes are an integral part of these consolidated financial statements.
87
HOMETRUST BANCSHARES, INC. AND SUBSIDIARY
Consolidated Statements of Cash Flows
(Dollar amounts in thousands)
June 30, | ||||||||||||
2014 | 2013 | 2012 | ||||||||||
Operating Activities: | ||||||||||||
Net income | $ | 10,342 | $ | 9,053 | $ | 4,527 | ||||||
Adjustments to reconcile net income to net cash provided by operating activities: | ||||||||||||
Provision for (recovery of) loan losses | (6,300 | ) | 1,100 | 15,600 | ||||||||
Depreciation | 2,369 | 2,287 | 2,276 | |||||||||
Deferred income tax expense (benefit) | 4,378 | 1,607 | (537 | ) | ||||||||
Net amortization and accretion | (1,272 | ) | (210 | ) | (187 | ) | ||||||
FHLB advance prepayment penalty | - | 3,069 | 2,111 | |||||||||
Gain on sale of premises and equipment | - | - | (1,503 | ) | ||||||||
Loss on sale and impairment of REO | 646 | 951 | 3,040 | |||||||||
Earnings from bank owned life insurance | (1,484 | ) | (1,553 | ) | (1,037 | ) | ||||||
Gain from sales of securities available for sale | (10 | ) | - | - | ||||||||
Gain on sale of loans held for sale | (1,603 | ) | (3,751 | ) | (2,900 | ) | ||||||
Origination of loans held for sale | (73,501 | ) | (227,117 | ) | (196,708 | ) | ||||||
Proceeds from sales of loans held for sale | 87,895 | 230,885 | 193,391 | |||||||||
Decrease in deferred loan fees, net | (7 | ) | (513 | ) | (853 | ) | ||||||
Decrease (increase) in accrued interest receivable and other assets | (853 | ) | 4,326 | 3,523 | ||||||||
ESOP compensation expense | 844 | 749 | - | |||||||||
Restricted stock and stock option expense | 2,623 | 1,113 | - | |||||||||
Decrease (increase) in other liabilities | (307 | ) | 1,935 | (873 | ) | |||||||
Net cash provided by operating activities | 23,760 | 23,931 | 19,870 | |||||||||
Investing Activities: | ||||||||||||
Purchase of securities available for sale | (81,565 | ) | (6,000 | ) | (12,539 | ) | ||||||
Proceeds from sales of securities available for sale | 2,086 | - | - | |||||||||
Proceeds from maturities of securities available for sale | 45,225 | 6,100 | 37,332 | |||||||||
Purchase of certificates of deposit in other banks | (45,132 | ) | (79,927 | ) | (35,816 | ) | ||||||
Maturities of certificates of deposit in other banks | 17,969 | 51,320 | 46,652 | |||||||||
Principal repayments of mortgage-backed securities | 9,850 | 6,101 | 3,067 | |||||||||
Net redemptions of FHLB Stock | 3,239 | 4,446 | 3,330 | |||||||||
Net decrease in loans | 30,011 | 54,445 | 53,296 | |||||||||
Purchase of bank owned life insurance | - | (16,000 | ) | (31,000 | ) | |||||||
Proceeds from redemption of bank owned life insurance | - | - | 21,580 | |||||||||
Purchase of premises and equipment | (1,688 | ) | (1,581 | ) | (3,218 | ) | ||||||
Capital improvements to REO | (236 | ) | (542 | ) | (316 | ) | ||||||
Proceeds from sale of premises and equipment | - | - | 1,745 | |||||||||
Proceeds from sale of REO | 10,592 | 11,061 | 9,688 | |||||||||
Acquisition of BankGreenville Financial Corporation, net of cash paid | 1,475 | - | - | |||||||||
Acquisition of Jefferson Bancshares, Inc., net of cash paid | (6,926 | ) | - | - | ||||||||
Net cash provided by (used in) investing activities | (15,100 | ) | 29,423 | 93,801 | ||||||||
Financing Activities: | ||||||||||||
Net increase (decrease) in deposits | (38,166 | ) | (311,425 | ) | 201,590 | |||||||
Net decrease in other borrowings | (10,673 | ) | (25,334 | ) | (125,124 | ) | ||||||
Repayment of subordinated debentures | (10,000 | ) | - | - | ||||||||
Proceeds from stock conversion | - | 208,204 | - | |||||||||
Loan to ESOP for purchase of shares | - | (10,580 | ) | - | ||||||||
Common stock repurchased | (29,686 | ) | (13,299 | ) | - | |||||||
Decrease in capital lease obligations | (18 | ) | (8 | ) | (7 | ) | ||||||
Net cash provided by (used in) financing activities | (88,543 | ) | (152,442 | ) | 76,459 | |||||||
Net Increase (Decrease) in Cash and Cash Equivalents | (79,883 | ) | (99,088 | ) | 190,130 | |||||||
Cash and Cash Equivalents at Beginning of Period | 125,713 | 224,801 | 34,671 | |||||||||
Cash and Cash Equivalents at End of Period | $ | 45,830 | $ | 125,713 | $ | 224,801 | ||||||
The accompanying notes are an integral part of these consolidated financial statements.
88
HOMETRUST BANCSHARES, INC. AND SUBSIDIARY
Consolidated Statements of Cash Flows (continued)
(Dollar amounts in thousands)
June 30, | ||||||||||||
2014 | 2013 | 2012 | ||||||||||
Supplemental Disclosures: | ||||||||||||
Cash paid during the period for: | ||||||||||||
Interest | $ | 5,271 | $ | 7,414 | $ | 11,981 | ||||||
Income taxes | 150 | 123 | 97 | |||||||||
Noncash transactions: | ||||||||||||
Unrealized gain (loss) in value of securities available for sale, net of income taxes | 274 | (210 | ) | 189 | ||||||||
Transfers of loans to REO | 9,645 | 7,730 | 16,137 | |||||||||
Transfers of loans to held for sale | 4,340 | - | - | |||||||||
Loans originated to finance the sale of REO | 94 | 651 | 1,452 | |||||||||
Business Combinations: | ||||||||||||
Assets acquired | 600,022 | - | - | |||||||||
Liabilities assumed | 539,979 | - | - | |||||||||
Net assets acquired | 60,043 | - | - | |||||||||
The accompanying notes are an integral part of these consolidated financial statements.
89
HOMETRUST BANCSHARES, INC. AND SUBSIDIARY
Notes to Consolidated Financial Statements
(Dollar amounts in thousands)
1. | Summary of Significant Accounting Policies |
The consolidated financial statements presented in this report include the accounts of HomeTrust Bancshares, Inc., a Maryland corporation ("HomeTrust"), and its wholly-owned subsidiary, HomeTrust Bank (the "Bank"). As used throughout this report, the term the "Company" refers to HomeTrust and its consolidated subsidiary, unless the context otherwise requires.
Organization and Description of Business – HomeTrust was incorporated in Maryland on December 27, 2011 and became the holding company for the Bank on July 10, 2012 upon the completion of the Bank's conversion from the mutual to stock form of organization (the "Conversion"). In connection with the Conversion, HomeTrust issued an aggregate of 21,160,000 shares of common stock at an offering price of $10.00 per share for gross proceeds of $211.6 million. HomeTrust received $208.2 million in net proceeds from the stock offering of which $104.1 million, or 50%, of the net proceeds were contributed to the Bank upon Conversion. Included in the issuance of shares was 1,058,000 shares to a newly formed ESOP for which HomeTrust loaned the ESOP $10,580,000 to purchase the shares. The Bank is a federally chartered savings bank headquartered in Asheville, North Carolina with thirty-four retail offices in North Carolina (including the Asheville metropolitan area and the "Piedmont" region), South Carolina (Greenville), and East Tennessee (including Kingsport/Johnson City, Knoxville, and Morristown). The business of the Bank is conducted through its seven operating divisions – HomeTrust Bank, Cherryville Federal Bank, Home Savings Bank of Eden, Industrial Federal Bank of Lexington, Shelby Savings Bank, Tryon Federal Bank, and Rutherford County Bank. All divisions operate under a single set of corporate policies and procedures and are recognized as a single banking segment for financial reporting purposes.
Accounting Principles – The accounting and reporting policies of the Company conform to accounting principles generally accepted in the United States ("US GAAP").
Principles of Consolidation and Subsidiary Activities – The accompanying consolidated financial statements include the accounts of HomeTrust, the Bank, and its wholly-owned subsidiary, Western North Carolina Service Corporation ("WNCSC") at or for the years ended June 30, 2014 and 2013, respectively, and of the Bank and WNCSC only for the year ended June 30, 2012. WNCSC owns office buildings in Asheville, North Carolina that are leased to the Bank. All intercompany items have been eliminated.
Cash Flows – Cash and cash equivalents include cash and interest-bearing deposits with initial terms to maturity of ninety days or less.
Securities – The Company classifies investment securities as trading, available for sale or held to maturity.
Securities available for sale are carried at fair value. These securities are used to execute asset/liability management strategies, manage liquidity, and leverage capital, and therefore may be sold prior to maturity. Adjustments for unrealized gains or losses, net of the income tax effect, are made to accumulated other comprehensive income, a separate component of total stockholders' equity.
Securities held to maturity are stated at cost, net of unamortized balances of premiums and discounts. When these securities are purchased, the Company intends to and has the ability to hold such securities until maturity.
Declines in the fair value of individual securities available for sale or held to maturity below their cost that are other-than-temporary result in write-downs of the individual securities to their fair value. The related write-downs are included in earnings as realized losses. In estimating other-than-temporary impairment losses, the Company considers among other things, (i) the length of time and the extent to which the fair value has been less than cost, (ii) the financial condition and near-term prospects of the issuer, and (iii) the intent and ability of the Company to retain its investment in the issuer for a period of time sufficient to allow for any anticipated recovery of the unrealized loss, and in the case of debt securities, whether it is more likely than not that the Company will be required to sell the security prior to a recovery.
Premiums and discounts are amortized or accreted over the life of the security as an adjustment to yield. Dividend and interest income are recognized when earned. Gains or losses on the sale of securities are recognized on a specific identification, trade date basis.
Loans – Loans are carried at their outstanding principal amount, less unearned income and deferred nonrefundable loan fees, net of certain origination costs. Interest income is recorded as earned on an accrual basis based on the contractual rate and the outstanding balance, except for non-accruing loans where interest is recorded as earned on a cash basis. Net deferred loan origination fees/costs are deferred and amortized to interest income over the life of the related loan. The premium or discount on purchased loans is amortized over the expected life of the loans and is included in interest income.
Loan Segments and Classes
The Company's loan portfolio is grouped into two segments (retail consumer loans and commercial loans) and into four classes within each segment. The Company originates, services, and manages its loans based on these segments and classes. The Company's portfolio segments and classes within those segments are subject to risks that could have an adverse impact
90
HOMETRUST BANCSHARES, INC. AND SUBSIDIARY
Notes to Consolidated Financial Statements
(Dollar amounts in thousands)
on the credit quality of the loan portfolio. Management identified the risks described below as significant risks that are generally similar among the loan segments and classes.
Retail Consumer loan segment
The Company underwrites its retail consumer loans using automated credit scoring and analysis tools. These credit scoring tools take into account factors such as payment history, credit utilization, length of credit history, types of credit currently in use, and recent credit inquiries. To the extent that the loan is secured by collateral, the value of the collateral is also evaluated. Common risks to each class of retail consumer loans include general economic conditions within the Company's markets, such as unemployment and potential declines in collateral values, and the personal circumstances of the borrowers. In addition to these common risks for the Company's retail consumer loans, various retail consumer loan classes may also have certain risks specific to them.
One-to-four family and construction and land/lot loans are to individuals and are typically secured by 1-4 family residential property, undeveloped land, and partially developed land in anticipation of pending construction of a personal residence. Significant and rapid declines in real estate values can result in residential mortgage loan borrowers having debt levels in excess of the current market value of the collateral. Recent declines in value have led to unprecedented levels of foreclosures and losses within the banking industry. Construction and land/lot loans often experience delays in completion and cost overruns that exceed the borrower's financial ability to complete the project. Such cost overruns can routinely result in foreclosure of partially completed and unmarketable collateral.
Home equity lines of credit are often secured by second liens on residential real estate, thereby making such loans particularly susceptible to declining collateral values. A substantial decline in collateral value could render the Company's second lien position to be effectively unsecured. Additional risks include lien perfection inaccuracies and disputes with first lien holders that may further weaken collateral positions. Further, the open-end structure of these loans creates the risk that customers may draw on the lines in excess of the collateral value if there have been significant declines since origination.
Consumer loans include loans secured by deposit accounts or personal property such as automobiles, boats, and motorcycles, as well as unsecured consumer debt. The value of underlying collateral within this class is especially volatile due to potential rapid depreciation in values since date of loan origination in excess of principal repayment.
Commercial loan segment
The Company's commercial loans are centrally underwritten based primarily on the customer's ability to generate the required cash flow to service the debt in accordance with the contractual terms and conditions of the loan agreement. The Company's commercial lenders and underwriters work to understand the borrower's businesses and management experiences. The majority of the Company's commercial loans are secured by collateral, so collateral values are important to the transaction. In commercial loan transactions where the principals or other parties provide personal guarantees, the Company's commercial lenders and underwriters analyze the relative financial strength and liquidity of each guarantor. Risks that are common to the Company's commercial loan classes include general economic conditions, demand for the borrowers' products and services, the personal circumstances of the principals, and reductions in collateral values. In addition to these common risks for the Company's commercial loans, the various commercial loan classes also have certain risks specific to them.
Construction and development loans are highly dependent on the supply and demand for commercial real estate in the Company's markets as well as the demand for the newly constructed residential homes and lots being developed by the Company's commercial loan customers. Prolonged deterioration in demand could result in significant decreases in the underlying collateral values and make repayment of the outstanding loans more difficult for the Company's commercial borrowers.
Commercial real estate and commercial and industrial loans are primarily dependent on the ability of the Company's commercial loan customers to achieve business results consistent with those projected at loan origination resulting in cash flow sufficient to service the debt. To the extent that a borrower's actual business results significantly underperform the original projections, the ability of that borrower to service the Company's loan on a basis consistent with the contractual terms may be at risk. While these loans and leases are generally secured by real property, personal property, or business assets such as inventory or accounts receivable, it is possible that the liquidation of the collateral will not fully satisfy the obligation.
Municipal leases are primarily made to volunteer fire departments and depend on the tax revenues received from the county or municipality. These leases are mainly secured by vehicles, fire stations, land, or equipment. The underwriting of the municipal leases is based on the cash flows of the fire department as well as projections of future income.
91
HOMETRUST BANCSHARES, INC. AND SUBSIDIARY
Notes to Consolidated Financial Statements
(Dollar amounts in thousands)
Credit Quality Indicators
Loans are monitored for credit quality on a recurring basis and the composition of the loans outstanding by credit quality indicator is provided below. Loan credit quality indicators are developed through review of individual borrowers on an ongoing basis. Generally, loans are monitored for performance on a quarterly basis with the credit quality indicators adjusted as needed. The indicators represent the rating for loans as of the date presented based on the most recent assessment performed. These credit quality indicators are defined as follows:
Pass -A pass rated asset is not adversely classified because it does not display any of the characteristics for adverse classification.
Special Mention -A special mention asset has potential weaknesses that deserve management's close attention. If left uncorrected, such potential weaknesses may result in deterioration of the repayment prospects or collateral position at some future date. Special mention assets are not adversely classified and do not warrant adverse classification.
Substandard -A substandard asset is inadequately protected by the current net worth and paying capacity of the obligor or of the collateral pledged, if any. Assets classified as substandard generally have a well-defined weakness, or weaknesses, that jeopardize the liquidation of the debt. These assets are characterized by the distinct possibility of loss if the deficiencies are not corrected.
Doubtful -An asset classified doubtful has all the weaknesses inherent in an asset classified substandard with the added characteristic that the weaknesses make collection or liquidation in full highly questionable and improbable, on the basis of currently existing facts, conditions, and values.
Loss -Assets classified loss are considered uncollectible and of such little value that their continuing to be carried as an asset is not warranted. This classification is not necessarily equivalent to no potential for recovery or salvage value, but rather that it is not appropriate to defer a full write-off even though partial recovery may be effected in the future.
Loans Held for Sale -Loans held for sale are residential mortgages and are valued at the lower of cost or fair value less estimated costs to sell as determined by outstanding commitments from investors on a "best efforts" basis or current investor yield requirements, calculated on the aggregate loan basis. Loans sold are generally sold at par value and with servicing released.
Allowance for Loan Losses -The allowance for loan losses is management's estimate of probable credit losses that are inherent in the Company's loan portfolios at the balance sheet date. The allowance increases when the Company provides for loan losses through charges to operating earnings and when the Company recovers amounts from loans previously written down or charged off. The allowance decreases when the Company writes down or charges off loan amounts that are deemed uncollectible.
Management determines the allowance for loan losses based on periodic evaluations that are inherently subjective and require substantial judgment because the evaluations require the use of material estimates that are susceptible to significant change. The Company generally uses two allowance methodologies that are primarily based on management's determination as to whether or not a loan is considered to be impaired.
All classified loans above a certain threshold meeting certain criteria are evaluated for impairment on a loan-by-loan basis and are considered impaired when it is probable, based on current information, that the borrower will be unable to pay contractual interest or principal as required by the loan agreement. Impaired loans below the threshold are evaluated as a pool with additional adjustments to the allowance for loan losses. Loans that experience insignificant payment delays and payment shortfalls are not necessarily considered impaired. Management determines the significance of payment delays and payment shortfalls on a case-by-case basis, taking into consideration all of the circumstances surrounding the loan and the borrower, including the length of the delay, the reasons for the delay, the borrower's prior payment history, and the amount of the shortfall relative to the principal and interest owed. Impaired loans are measured at their estimated net realizable value based on either the value of the loan's expected future cash flows discounted at the loan's effective interest rate or on the collateral value, net of the estimated costs of disposal, if the loan is collateral dependent. For loans considered impaired, an individual allowance for loan losses is recorded when the loan principal balance exceeds the estimated net realizable value.
For loans not considered impaired, management determines the allowance for loan losses based on estimated loss percentages that are determined by and applied to the various classes of loans that comprise the segments of the Company's loan portfolio. The estimated loss percentages by loan class are based on a number of factors that include by class (i) average historical losses over the past two years, (ii) levels and trends in delinquencies, impairments, and net charge-offs, (iii) trends in the volume, terms, and concentrations, (iv) trends in interest rates, (v) effects of changes in the Company's risk tolerance, underwriting standards, lending policies, procedures, and practices, and (vi) national and local business and economic conditions.
Future material adjustments to the allowance for loan losses may be necessary due to changing economic conditions or declining collateral values. In addition, bank regulatory agencies, as an integral part of their examination process, periodically review the Company's allowance for loan losses and may require the Company to make adjustments to the allowance for loan losses based upon judgments that differ significantly from those of management.
92
HOMETRUST BANCSHARES, INC. AND SUBSIDIARY
Notes to Consolidated Financial Statements
(Dollar amounts in thousands)
Nonperforming Assets -Nonperforming assets can include loans that are past due 90 days or more based on the loan's contractual terms and continue to accrue interest, loans on which interest is not being accrued, and REO.
Loans Past Due 90 Days or More, Non-accruing, Impaired, or Restructured -The Company's policies related to when loans are placed on non-accruing status conform to guidelines prescribed by bank regulatory authorities. Generally, the Company suspends the accrual of interest on loans (i) that are maintained on a cash basis because of the deterioration of the financial condition of the borrower, (ii) for which payment in full of principal or interest is not expected (impaired loans), or (iii) on which principal or interest has been in default for a period of 90 days or more, unless the loan is both well secured and in the process of collection. Under the Company's cost recovery method, interest income is subsequently recognized only to the extent cash payments are received in excess of principal due. Loans are returned to accruing status when all principal and interest amounts contractually due are brought current and concern no longer exists as to the future collectability of principal and interest, which is generally confirmed when the loan demonstrates performance for six consecutive months or payment cycles.
Restructured loans to borrowers who are experiencing financial difficulty, and on which the Company has granted concessions that modify the terms of the loan, are accounted for as troubled debt restructurings ("TDRs"). These loans remain as TDRs until the loan has been paid in full, modified to its original terms, or charged off. The Company may place these loans on accrual or nonaccrual status depending on the individual facts and circumstances of the borrower. Generally, these loans are put on nonaccrual status until there is adequate performance that evidences the ability of the borrower to make the contractual payments. This period of performance is normally at least six months, and may include performance immediately prior to or after the modification, depending on the specific facts and circumstances of the borrower.
Loan Charge-offs -The Company charges off loan balances, in whole or in part to fair market value, when available, verifiable, and documentable information confirms that specific loans, or portions of specific loans, are uncollectible or unrecoverable. For unsecured loans, losses are confirmed when it can be determined that the borrower, or any guarantors, are unwilling or unable to pay the amounts as agreed. When the borrower, or any guarantor, is unwilling or unable to pay the amounts as agreed on a loan secured by collateral and any recovery will be realized upon the sale of the collateral, the loan is deemed to be collateral dependent. Repayments or recoveries for collateral dependent loans are directly affected by the value of the collateral at liquidation. As such, loan repayment can be affected by factors that influence the amount recoverable, the timing of the recovery, or a combination of the two. Such factors include economic conditions that affect the markets in which the loan or its collateral is sold, bankruptcy, repossession and foreclosure laws, and consumer banking regulations. Losses are also confirmed when the loan, or a portion of the loan, is classified as loss resulting from loan reviews conducted by the Company or its bank regulatory examiners.
Charge-offs of loans in the commercial loan segment are recognized when the uncollectibility of the loan balance and the inability to recover sufficient value from the sale of any collateral securing the loan is confirmed. The uncollectibility of the loan balance is evidenced by the inability of the commercial borrower to generate cash flows sufficient to repay the loan as agreed causing the loan to become delinquent. For collateral dependent commercial loans, the Company determines the net realizable value of the collateral based on appraisals, current market conditions, and estimated costs to sell the collateral. For collateral dependent commercial loans where the loan balance, including any accrued interest, net deferred fees or costs, and unamortized premiums or discounts, exceeds the net realizable value of the collateral securing the loan, the deficiency is identified as unrecoverable, is deemed to be a confirmed loss, and is charged off.
Charge-offs of loans in the retail consumer loan segment are generally confirmed and recognized in a manner similar to loans in the commercial loan segment. Secured retail consumer loans that are identified as uncollectible and are deemed to be collateral dependent are confirmed as loss to the extent the net realizable value of the collateral is insufficient to recover the loan balance. Consumer loans not secured by real estate that become 90 days past due are charged off to the extent that the fair value of any collateral, less estimated costs to sell the collateral, is insufficient to recover the loan balance. Consumer loans secured by real estate that become 120 days past due are charged off to the extent that the fair value of the real estate securing the loan, less estimated costs to sell the collateral, is insufficient to recover the loan balance. Loans to borrowers in bankruptcy are subject to modification by the bankruptcy court and are charged off to the extent that the fair value of any collateral securing the loan, less estimated costs to sell the collateral, is insufficient to recover the loan balance, unless the Company expects repayment is likely to occur. Such loans are charged off within 60 days of the receipt of notification from a bankruptcy court or when the loans become 120 days past due, whichever is shorter.
Purchased Performing Loans -The Company accounts for purchased performing loans acquired in business combinations using the contractual cash flows method of recognizing discount accretion based on the acquired loans' contractual cash flows. The Company records purchased performing loans at fair value, including a credit discount. The fair value discount is accreted as an adjustment to yield over the estimated lives of the loans. There is no allowance for loan losses established for purchased performing loans, however a provision for loan losses is recorded for any further deterioration in these loans subsequent to the acquisition.
Purchased Credit-Impaired Loans -The Company considers loans purchased with evidence of credit deterioration and for which it is probable that all contractually required payments will not be collected as purchased credit-impaired ("PCI") loans. Evidence of credit quality deterioration as of the purchase date may include the internal loan risk grade, delinquent and nonaccrual status, recent credit scores, and recent loan-to-value percentages. The Company initially records PCI loans at fair value, which includes estimated future credit losses expected to be incurred over the life of the loan. Thus, no allowance
93
HOMETRUST BANCSHARES, INC. AND SUBSIDIARY
Notes to Consolidated Financial Statements
(Dollar amounts in thousands)
for loan losses is established for PCI loans. The Company estimates the cash flows expected to be collected at the purchase date using specific credit reviews of certain loans and quantitative models incorporating credit risk, prepayment assumptions, and various other factors. The excess of cash flows expected to be collected over the estimated fair value is the accretable yield and is recognized in interest income over the remaining life of the loan. The difference between the contractually required payments and the cash flows expected to be collected at the purchase date, considering the impact of prepayments, is the nonaccretable difference and is available to absorb future loan chargeoffs.
Real Estate Owned -REO consists of real estate acquired as a result of customers' loan defaults. REO is stated at the lower of the related loan balance or the fair value of the property net of the estimated costs of disposal with a charge to the allowance for loan losses upon foreclosure. Any write-downs subsequent to foreclosure are charged against operating earnings. To the extent recoverable, costs relating to the development and improvement of property are capitalized, whereas those costs relating to holding the property are charged to expense.
Premises and Equipment -Premises and equipment are stated at cost less accumulated depreciation. Depreciation is computed using the 150% declining balance method and the straight-line method over the estimated useful lives which range from fifteen to forty years for buildings and three to ten years for furniture, fixtures, and equipment. Maintenance and repair costs are expensed as incurred.
Federal Home Loan Bank Stock -As a requirement for membership, the Bank invests in stock of the FHLB of Atlanta. This investment is carried at cost. Due to the redemption provisions of the FHLB, the Bank estimated that fair value equals cost and that this investment was not impaired at June 30, 2014 and June 30, 2013.
Business Combinations -The Company uses the acquisition method of accounting, formerly referred to as the purchase method, for all business combinations. An acquirer must be identified for each business combination, and the acquisition date is the date the acquirer achieves control. The acquisition method of accounting requires the Company as acquirer to recognize the fair value of assets acquired and liabilities assumed at the acquisition date as well as recognize goodwill or a gain from a bargain purchase, if appropriate. Any acquisition-related costs and restructuring costs are recognized as period expenses as incurred.
Goodwill -Goodwill represents the excess of the purchase price over the sum of the estimated fair values of the tangible and identifiable intangible assets acquired less the estimated fair value of the liabilities assumed in a business combination. Goodwill has an indefinite useful life and is evaluated for impairment annually or more frequently if events and circumstances indicate that the asset might be impaired. An impairment loss is recognized to the extent that the carrying amount exceeds the asset's fair value. The goodwill impairment analysis is a two-step process. The first step, used to identify potential impairment, involves comparing each reporting unit's estimated fair value to its carrying value, including goodwill. If the estimated fair value of a reporting unit exceeds its carrying value, goodwill is considered not to be impaired. If the carrying value exceeds estimated fair value, there is an indication of potential impairment and the second step is performed to measure the amount of impairment.
If required, the second step involves calculating an implied fair value of goodwill for each reporting unit for which the first step indicated impairment. The implied fair value of goodwill is determined in a manner similar to the amount of goodwill calculated in a business combination, by measuring the excess of the estimated fair value of the reporting unit, as determined in the first step, over the aggregate estimated fair values of the individual assets, liabilities and identifiable intangibles as if the reporting unit was being acquired in a business combination. If the implied fair value of goodwill exceeds the carrying value of goodwill assigned to the reporting unit, there is no impairment. If the carrying value of goodwill assigned to a reporting unit exceeds the implied fair value of the goodwill, an impairment charge is recorded for the excess. An impairment loss cannot exceed the carrying value of goodwill assigned to a reporting unit, and the loss establishes a new basis in the goodwill. Subsequent reversal of goodwill impairment losses is not permitted.
Core Deposit Intangibles -Core deposit intangibles represents the estimated value of long-term deposit relationships acquired in business combinations. These core deposit premiums are amortized using the straight-line method over the estimated useful lives of the related deposits typically between five and ten years. The estimated useful lives are periodically reviewed for reasonableness.
Income Taxes -The Company accounts for income taxes using the asset and liability method. Deferred tax assets and liabilities are recognized for the future tax consequences attributable to differences between the financial statement carrying amounts of existing assets and liabilities and their respective tax bases and operating loss and tax credit carryforwards. Deferred tax assets and liabilities are measured using enacted tax rates expected to apply to taxable income in the years in which those temporary differences are expected to be recovered or settled. The effect on deferred tax assets and liabilities of a change in tax rates is recognized in income in the period that includes the enactment date. Deferred tax assets are reduced, if necessary, by the amount of such benefits that are not expected to be realized based upon available evidence.
The Company recognizes interest and penalties accrued relative to unrecognized tax benefits in its respective federal or state income taxes accounts. As of June 30, 2014 and June 30, 2013, there were no accruals for uncertain tax positions and no accruals for interest and penalties. HomeTrust and the Bank file a consolidated United States federal income tax return, as well as separate unconsolidated North Carolina state income tax returns. The Company's income tax returns subsequent to 2010 are subject to examination by the taxing authorities.
94
HOMETRUST BANCSHARES, INC. AND SUBSIDIARY
Notes to Consolidated Financial Statements
(Dollar amounts in thousands)
Employee Stock Ownership Plan -In connection with the Conversion, the Bank established an ESOP for the benefit of all of its eligible employees. Full-time employees of the Company and the Bank who have been credited with at least 1,000 hours of service during a 12-month period and who have attained age 21 are eligible to participate in the ESOP. It is anticipated that the Bank will make contributions to the ESOP in amounts necessary to amortize the ESOP loan payable to the Company over a 20 year period.
Unearned ESOP shares are shown as a reduction of stockholders' equity. Dividends on unearned ESOP shares, if paid, will be considered to be compensation expense. The Company recognizes compensation expense equal to the fair value of the Company's ESOP shares during the periods in which they become committed to be released. To the extent that the fair value of the Company's ESOP shares differs from the cost of such shares, the differential is recognized as additional paid in capital. The Company recognizes a tax deduction equal to the cost of the shares released. Because the ESOP is internally leveraged through a loan from the Company to the ESOP, the loan receivable by the Company from the ESOP is not reported as an asset nor is the debt of the ESOP shown as a liability in the consolidated financial statements.
Equity Incentive Plan -The Company issues restricted stock and stock options under the HomeTrust Bancshares, Inc. 2013 Omnibus Incentive Plan ("2013 Omnibus Incentive Plan") to key officers and outside directors. In accordance with the requirements of Accounting Standards Codification ("ASC") 718, Compensation – Stock Compensation, the Company has adopted a fair value based method of accounting for employee stock compensation plans, whereby compensation cost is measured based on the fair value of the award as of the grant date and recognized over the vesting period. The Company estimates forfeitures when recognizing compensation expense and this estimate is adjusted over the requisite service period or vesting schedule based on the extent to which actual forfeitures differ from such estimate. Changes in estimated forfeitures in future periods are recognized through a cumulative catch-up adjustment, which is recognized in the period of change and also will affect the amount of estimated unamortized compensation expense to be recognized in future periods.
Comprehensive Income -Comprehensive income consists of net income and net unrealized gains (losses) on securities available for sale and is presented in the consolidated statements of comprehensive income.
Derivative Instruments and Hedging -The Company recognizes all derivatives as either assets or liabilities in the balance sheet, and measures those instruments at fair value. Changes in the fair value of those derivatives are reported in current earnings or other comprehensive income depending on the purpose for which the derivative is held and whether the derivative qualifies for hedge accounting. Loan commitments related to the origination or acquisition of mortgage loans that will be held for sale must be accounted for as derivative instruments. The Company enters into commitments to originate loans whereby the interest rate on the loan is determined prior to funding (rate lock commitments). The Company also enters into forward sales commitments for the mortgage loans underlying the rate lock commitments. The fair values of these two derivative financial instruments are collectively insignificant to the consolidated financial statements.
Use of Estimates in Financial Statements -The preparation of financial statements in conformity with US GAAP requires management to make estimates and assumptions that affect the reported amounts of assets and liabilities and disclosure of contingent assets and liabilities at the date of the financial statements and the reported amounts of revenues and expenses during the reporting period. Actual results could differ from those estimates.
Reclassifications -Certain amounts in the 2013 consolidated financial statements have been reclassified to conform to the statement presentation for 2014. Such reclassifications have no effect on net income or retained earnings as previously reported.
Recent Accounting Pronouncements -In July 2012, the Financial Accounting Standards Board ("FASB") issued Accounting Standards Update ("ASU") No. 2012-02 "Testing Indefinite-Lived Intangible Assets for Impairment", regarding goodwill which will allow an entity to first assess qualitative factors to determine whether it is necessary to perform the two-step quantitative goodwill impairment test. Under this ASU, an entity would not be required to calculate the fair value of a reporting unit unless the entity determines, based on a qualitative assessment, that it is more likely than not that its fair value is less than its carrying amount. The ASU includes a number of events and circumstances for an entity to consider in conducting the qualitative assessment. The guidance was effective for annual and interim goodwill impairment tests performed for fiscal years beginning after September 15, 2012. Early adoption was permitted, including for annual and interim goodwill impairment tests performed as of a date before July 27, 2012, if an entity's financial statements for the most recent annual or interim period have not yet been issued or, for nonpublic entities, have not yet been made available for issuance. The adoption of this ASU did not have a material impact on the Company's Consolidated Financial Statements.
In February 2013, the FASB issued ASU 2013-02 " Reporting of Amounts Reclassified Out of Accumulated Other Comprehensive Income". This ASU requires an entity to provide information about the amounts reclassified out of accumulated other comprehensive income by component. In addition, an entity is required to present, either on the face of the statement where net income is presented or in the notes, significant amounts reclassified out of accumulated other comprehensive income by the respective line items of net income but only if the amount reclassified is required under US GAAP to be reclassified to net income in its entirety in the same reporting period. For other amounts that are not required under US GAAP to be reclassified in their entirety to net income, an entity is required to cross-reference to other disclosures required under US GAAP that provide additional detail about these amounts. The new guidance was effective prospectively for reporting periods beginning after December 15, 2012. The adoption of this ASU did not have a material impact on the Company's Consolidated Financial Statements.
95
HOMETRUST BANCSHARES, INC. AND SUBSIDIARY
Notes to Consolidated Financial Statements
(Dollar amounts in thousands)
In July 2013, the FASB issued ASU No. 2013-11 "Income Taxes (Topic 740): Presentation of an Unrecognized Tax Benefit When a Net Operating Loss Carryforward, a Similar Tax Loss, or a Tax Credit Carryforward Exists". This ASU provides guidance on financial statement presentation of an unrecognized tax benefit when a net operating loss ("NOL") carryforward, a similar tax loss, or a tax credit carryforward exists. This ASU applies to all entities with unrecognized tax benefits that also have tax loss or tax credit carryforwards in the same tax jurisdiction as of the reporting date. The new guidance is effective for fiscal years, and interim periods within those years, beginning after December 15, 2013 with e arly adoption permitted. Since the Company does not have any unrecognized tax benefits, the adoption of the ASU did not have a material impact on the Company's Consolidated Financial Statements.
In January 2014, the FASB issued ASU No. 2014-04, "Reclassification of Residential Real Estate Collateralized Consumer Mortgage Loans upon Foreclosure." The objective of this guidance is to clarify when an in substance repossession or foreclosure occurs, that is, when a creditor should be considered to have received physical possession of residential real estate property collateralizing a consumer mortgage loan such that the loan receivable should be derecognized and the real estate property recognized. ASU No. 2014-04 states that an in substance repossession or foreclosure occurs, and a creditor is considered to have received physical possession of residential real estate property collateralizing a consumer mortgage loan, upon either (1) the creditor obtaining legal title to the residential real estate property upon completion of a foreclosure or (2) the borrower conveying all interest in the residential real estate property to the creditor to satisfy that loan through completion of a deed in lieu of foreclosure or through a similar legal agreement. Additionally, ASU No. 2014-04 requires interim and annual disclosure of both (1) the amount of foreclosed residential real estate property held by the creditor and (2) the recorded investment in consumer mortgage loans collateralized by residential real estate property that are in the process of foreclosure according to local requirements of the applicable jurisdiction. ASU No. 2014-04 is effective for interim and annual reporting periods beginning after December 15, 2014. The adoption of ASU No. 2014-04 is not expected to have a material impact on the Company's Consolidated Financial Statements.
2. | Business Combinations |
On May 31, 2014, the Company completed its acquisition of Jefferson Bancshares, Inc. ("Jefferson") in accordance with the terms of the Agreement and Plan of Merger dated January 22, 2014. Under the terms of the agreement, Jefferson shareholders received 0.2661 shares of HomeTrust common stock, and $4.00 in cash for each share of Jefferson common stock. This represents approximately $50.5 million of aggregate deal consideration.
Jefferson was accounted for using the acquisition method of accounting and, accordingly, assets acquired, liabilities assumed and consideration exchanged were recorded at acquisition date fair values. Fair values are preliminary and subject to refinement for up to one year after the closing date of the acquisition as additional information regarding the closing date fair values becomes available. The excess of the merger consideration over the fair value of Jefferson's net assets was allocated to goodwill. The book value as of May 31, 2014, of assets acquired was $494.3 million and liabilities assumed was $441.9 million. The Company recorded $7.0 million in goodwill related to the acquisition.
96
HOMETRUST BANCSHARES, INC. AND SUBSIDIARY
Notes to Consolidated Financial Statements
(Dollar amounts in thousands)
The following table presents the consideration paid by the Company in the acquisition of Jefferson and the assets acquired and liabilities assumed as of May 31, 2014:
Fair Value and | ||||||||||||
As Recorded | Other Merger | As Recorded | ||||||||||
by | Related | by the | ||||||||||
Jefferson | Adjustments | Company | ||||||||||
Consideration Paid | ||||||||||||
Cash paid including cash in lieu of fractional shares | $ | 25,251 | ||||||||||
Fair value of HomeTrust common stock at $15.03 per share | 25,239 | |||||||||||
Total consideration | $ | 50,490 | ||||||||||
Assets | ||||||||||||
Cash and cash equivalents | $ | 18,325 | $ | - | $ | 18,325 | ||||||
Securities available for sale | 85,744 | (700 | ) | 85,044 | ||||||||
Loans, net of allowance | 338,616 | (9,134 | ) | 329,482 | ||||||||
FHLB Stock | 4,635 | - | 4,635 | |||||||||
REO | 3,288 | - | 3,288 | |||||||||
Premises and equipment, net | 24,662 | (1,311 | ) | 23,351 | ||||||||
Accrued interest receivable | 1,367 | (90 | ) | 1,277 | ||||||||
Deferred income taxes | 9,606 | 3,395 | 13,001 | |||||||||
Core deposit intangibles | 847 | 2,683 | 3,530 | |||||||||
Other assets | 7,171 | - | 7,171 | |||||||||
Total assets acquired | $ | 494,261 | $ | (5,157 | ) | $ | 489,104 | |||||
Liabilities | ||||||||||||
Deposits | $ | 376,985 | $ | 371 | $ | 377,356 | ||||||
Other borrowings | 55,081 | 858 | 55,939 | |||||||||
Subordinated debentures | 7,460 | 2,540 | 10,000 | |||||||||
Other liabilities | 2,332 | - | 2,332 | |||||||||
Total liabilities assumed | $ | 441,858 | $ | 3,769 | $ | 445,627 | ||||||
Net identifiable assets acquired over liabilities assumed | $ | 52,403 | $ | (8,926 | ) | 43,477 | ||||||
Goodwill | $ | 7,013 | ||||||||||
The following table discloses the impact of the merger with Jefferson since the acquisition on May 31, 2014 through June 30, 2014. The table also presents certain pro forma information as if Jefferson had been acquired on July 1, 2013 and July 1, 2012. These results combine the historical results of Jefferson in the Company's Consolidated Statement of Income and, while certain adjustments were made for the estimated impact of certain fair value adjustments and other acquisition-related activity, they are not indicative of what would have occurred had the acquisition taken place on July 1, 2013 and July 1, 2012. Acquisition related costs of $1,157, net of tax ($837 of which are included in the Company's consolidated statements of income for the year ended June 30, 2014) are not included in the pro forma statements below. Furthermore, expenses related to systems conversions and other costs of integration are expected to be recorded throughout fiscal year 2015. Additionally, the Company expects to achieve further operating cost savings as a result of the acquisition which are not reflected in the pro forma amounts below:
Actual | Pro Forma | Pro Forma | ||||||||||
Year Ended | Year Ended | Year Ended | ||||||||||
June 30, 2014 | June 30, 2014 | June 30, 2013 | ||||||||||
Total revenues* | $ | 63,587 | $ | 81,663 | $ | 84,060 | ||||||
Net income | 12,225 | 11,406 | 11,868 | |||||||||
* Net interest income plus other income
97
HOMETRUST BANCSHARES, INC. AND SUBSIDIARY
Notes to Consolidated Financial Statements
(Dollar amounts in thousands)
The carrying amount of acquired loans from Jefferson as of May 31, 2014 consisted of purchased performing loans and purchased impaired loans as detailed in the following table:
Purchased | Purchased | Total | ||||||||||
Performing | Impaired | Loans | ||||||||||
Retail Consumer Loans: | ||||||||||||
One-to four- family | $ | 74,378 | $ | 6,066 | $ | 80,444 | ||||||
Home equity lines of credit | 16,857 | 18 | 16,875 | |||||||||
Construction and land/lots | 7,810 | 924 | 8,734 | |||||||||
Consumer | 3,690 | 2 | 3,692 | |||||||||
Commercial: | ||||||||||||
Commercial real estate | 118,534 | 15,649 | 134,183 | |||||||||
Construction and development | 24,658 | 1,012 | 25,670 | |||||||||
Commercial and industrial | 52,863 | 6,350 | 59,213 | |||||||||
Total | $ | 298,790 | $ | 30,021 | $ | 328,811 | ||||||
On July 31, 2013, the Company completed its acquisition of BankGreenville Financial Corporation ("BankGreenville") in accordance with the terms of the Agreement and Plan of Merger dated May 3, 2013. Under the terms of the agreement, BankGreenville shareholders received $6.63 per share in cash consideration. This represents approximately $7.8 million of aggregate deal consideration. Additional contingent cash consideration of up to $0.75 per share (or approximately $883,000) may be realized at the expiration of 24 months based on the performance of a select pool of loans totaling approximately $8.0 million.
BankGreenville was accounted for using the acquisition method of accounting and, accordingly, assets acquired, liabilities assumed and consideration exchanged were recorded at acquisition date fair values. Fair values are preliminary and subject to refinement for up to one year after the closing date of the acquisition as additional information regarding the closing date fair values becomes available. The excess of the merger consideration over the fair value of BankGreenville's net assets was allocated to goodwill. The book value as of July 31, 2013, of assets acquired was $102.2 million and liabilities assumed was $94.1 million. The Company recorded $2.8 million in goodwill related to the acquisition.
98
HOMETRUST BANCSHARES, INC. AND SUBSIDIARY
Notes to Consolidated Financial Statements
(Dollar amounts in thousands)
The following table presents the consideration paid by the Company in the acquisition of BankGreenville and the assets acquired and liabilities assumed as of July 31, 2013:
Fair Value and | ||||||||||||
As Recorded | Other Merger | As Recorded | ||||||||||
by | Related | by the | ||||||||||
BankGreenville | Adjustments | Company | ||||||||||
Consideration Paid | ||||||||||||
Cash | $ | 7,823 | ||||||||||
Repayment of BankGreenville preferred stock | 1,050 | |||||||||||
Contingent cash consideration (1) | 680 | |||||||||||
Total consideration | $ | 9,553 | ||||||||||
Assets | ||||||||||||
Cash and cash equivalents | $ | 10,348 | $ | - | $ | 10,348 | ||||||
Securities available for sale | 34,345 | - | 34,345 | |||||||||
Loans, net of allowance | 51,622 | (3,792 | ) | 47,830 | ||||||||
FHLB Stock | 447 | - | 447 | |||||||||
REO | 2,317 | (168 | ) | 2,149 | ||||||||
Premises and equipment, net | 2,458 | (117 | ) | 2,341 | ||||||||
Accrued interest receivable | 429 | - | 429 | |||||||||
Deferred tax asset | - | 2,470 | 2,470 | |||||||||
Core deposit intangibles | - | 530 | 530 | |||||||||
Other assets | 214 | - | 214 | |||||||||
Total assets acquired | $ | 102,180 | $ | (1,077 | ) | $ | 101,103 | |||||
Liabilities | ||||||||||||
Deposits | $ | 88,906 | $ | 201 | $ | 89,107 | ||||||
Other borrowings | 4,700 | 34 | 4,734 | |||||||||
Other liabilities | 511 | - | 511 | |||||||||
Total liabilities assumed | $ | 94,117 | $ | 235 | $ | 94,352 | ||||||
Net identifiable assets acquired over liabilities assumed | $ | 8,063 | $ | (1,312 | ) | 6,751 | ||||||
Goodwill | $ | 2,802 | ||||||||||
(1) | Estimate of additional amount to be paid to shareholders on or about July 31, 2015 based on performance of a select pool of loans totaling approximately $8.0 million. |
The following table discloses the impact of the merger with BankGreenville since the acquisition on July 31, 2013 through June 30, 2014. The table also presents certain pro forma information as if BankGreenville had been acquired on July 1, 2013 and July 1, 2012. These results combine the historical results of BankGreenville in the Company's Consolidated Statement of Income and, while certain adjustments were made for the estimated impact of certain fair value adjustments and other acquisition-related activity, they are not indicative of what would have occurred had the acquisition taken place on July 1, 2013 and July 1, 2012. Acquisition related costs of $957, net of tax ($249 of which are included in the Company's consolidated statements of income for the year ended June 30, 2014) are not included in the pro forma statements below. In particular, no adjustments have been made to eliminate the impact of REO write-downs recognized by BankGreenville of $250 in July 2013 that may not have been necessary had the acquired REO been recorded at fair value as of the beginning of fiscal year 2013. Furthermore, expenses related to systems conversions and other costs of integration are expected to be recorded throughout fiscal year 2014. Additionally, the Company expects to achieve further operating cost savings as a result of the acquisition which are not reflected in the pro forma amounts below:
Actual | Pro Forma | Pro Forma | ||||||||||
Year Ended | Year Ended | Year Ended | ||||||||||
June 30, 2014 | June 30, 2014 | June 30, 2013 | ||||||||||
Total revenues* | $ | 63,587 | $ | 63,844 | $ | 65,996 | ||||||
Net income | 12,481 | 9,588 | 9,326 | |||||||||
* Net interest income plus other income
99
HOMETRUST BANCSHARES, INC. AND SUBSIDIARY
Notes to Consolidated Financial Statements
(Dollar amounts in thousands)
The carrying amount of acquired loans from BankGreenville as of July 31, 2013 consisted of purchased performing loans and purchased impaired loans as detailed in the following table:
Purchased | Purchased | Total | ||||||||||
Performing | Impaired | Loans | ||||||||||
Retail Consumer Loans: | ||||||||||||
One-to four- family | $ | 8,274 | $ | 1,392 | $ | 9,666 | ||||||
Home equity lines of credit | 3,987 | 134 | 4,121 | |||||||||
Consumer | 522 | - | 522 | |||||||||
Commercial: | ||||||||||||
Commercial real estate | 23,073 | 4,552 | 27,625 | |||||||||
Construction and development | 2,367 | 3,529 | 5,896 | |||||||||
Total | $ | 38,223 | $ | 9,607 | $ | 47,830 | ||||||
3. | Securities Available for Sale |
| Securities available for sale consist of the following at the dates indicated: |
June 30, 2014 | ||||||||||||||||
Gross | Gross | Estimated | ||||||||||||||
Amortized | Unrealized | Unrealized | Fair | |||||||||||||
Cost | Gains | Losses | Value | |||||||||||||
U.S. Government Agencies | $ | 38,085 | $ | 45 | $ | (37 | ) | $ | 38,093 | |||||||
Residential Mortgage-backed Securities | ||||||||||||||||
of U.S. Government Agencies and | ||||||||||||||||
Government-Sponsored Enterprises | 111,430 | 393 | (412 | ) | 111,411 | |||||||||||
Municipal Bonds | 15,951 | 282 | (13 | ) | 16,220 | |||||||||||
Corporate Bonds | 2,912 | 113 | - | 3,025 | ||||||||||||
Total | $ | 168,378 | $ | 833 | $ | (462 | ) | $ | 168,749 | |||||||
June 30, 2013 | ||||||||||||||||
Gross | Gross | Estimated | ||||||||||||||
Amortized | Unrealized | Unrealized | Fair | |||||||||||||
Cost | Gains | Losses | Value | |||||||||||||
U.S. Government Agencies | $ | 6,000 | $ | 2 | $ | - | $ | 6,002 | ||||||||
Residential Mortgage-backed Securities | ||||||||||||||||
of U.S. Government Agencies and | ||||||||||||||||
Government-Sponsored Enterprises | 18,794 | 81 | (127 | ) | 18,748 | |||||||||||
Total | $ | 24,794 | $ | 83 | $ | (127 | ) | $ | 24,750 | |||||||
Debt securities available for sale by contractual maturity at the dates indicated are shown below. Mortgage-backed securities are not included in the maturity categories because the borrowers in the underlying pools may prepay without penalty; therefore, it is unlikely that the securities will pay at their stated maturity schedule.
June 30, 2014 | ||||||||
Amortized | Estimated | |||||||
Cost | Fair Value | |||||||
Due within one year | $ | 8,555 | $ | 8,555 | ||||
Due after one year through five years | 21,001 | 21,008 | ||||||
Due after five years through ten years | 22,323 | 22,649 | ||||||
Due after ten years | 5,069 | 5,126 | ||||||
Mortgage-backed securities | 111,430 | 111,411 | ||||||
Total | $ | 168,378 | $ | 168,749 | ||||
100
HOMETRUST BANCSHARES, INC. AND SUBSIDIARY
Notes to Consolidated Financial Statements
(Dollar amounts in thousands)
June 30, 2013 | ||||||||
Amortized | Estimated | |||||||
Cost | Fair Value | |||||||
Due within one year | $ | - | $ | - | ||||
Due after one year through five years | 6,000 | 6,002 | ||||||
Due after five years through ten years | - | - | ||||||
Due after ten years | - | - | ||||||
Mortgage-backed securities | 18,794 | 18,748 | ||||||
Total | $ | 24,794 | $ | 24,750 | ||||
Gross proceeds and gross realized gains and losses from sales of securities recognized in net income follow:
June 30, | ||||||||||||
2014 | 2013 | 2012 | ||||||||||
Gross proceeds from sales of securities | $ | 2,086 | $ | - | $ | - | ||||||
Gross realized gains from sales of securities | 42 | - | - | |||||||||
Gross realized losses from sales of securities | (32 | ) | - | - | ||||||||
Securities available for sale with costs totaling $51,036 and $21,429 with market values of $51,297 and $21,500 at June 30, 2014 and June 30, 2013, respectively, were pledged as collateral to secure various public deposits and retail repurchase agreements.
The gross unrealized losses and the fair value for securities available for sale aggregated by the length of time that individual securities have been in a continuous unrealized loss position as of June 30, 2014 and June 30, 2013 were as follows:
June 30, 2014 | ||||||||||||||||||||||||
Less than 12 Months | 12 Months or More | Total | ||||||||||||||||||||||
Fair | Unrealized | Fair | Unrealized | Fair | Unrealized | |||||||||||||||||||
Value | Losses | Value | Losses | Value | Losses | |||||||||||||||||||
U.S. Government Agencies | $ | 19,475 | $ | (37 | ) | $ | - | $ | - | $ | 19,475 | $ | (37 | ) | ||||||||||
Residential Mortgage-backed | ||||||||||||||||||||||||
Securities of U.S. Government | ||||||||||||||||||||||||
Agencies and Government- | ||||||||||||||||||||||||
Sponsored Enterprises | 75,761 | (399 | ) | 162 | (13 | ) | 75,923 | (412 | ) | |||||||||||||||
Municipal Bonds | 6,668 | (13 | ) | - | - | 6,668 | (13 | ) | ||||||||||||||||
Total | $ | 101,904 | $ | (449 | ) | $ | 162 | $ | (13 | ) | $ | 102,066 | $ | (462 | ) | |||||||||
June 30, 2013 | ||||||||||||||||||||||||
Less than 12 Months | 12 Months or More | Total | ||||||||||||||||||||||
Fair | Unrealized | Fair | Unrealized | Fair | Unrealized | |||||||||||||||||||
Value | Losses | Value | Losses | Value | Losses | |||||||||||||||||||
Residential Mortgage-backed | ||||||||||||||||||||||||
Securities of U.S. Government | ||||||||||||||||||||||||
Agencies and Government- | ||||||||||||||||||||||||
Sponsored Enterprises | $ | 5,707 | $ | (122 | ) | $ | 745 | $ | (5 | ) | $ | 6,452 | $ | (127 | ) | |||||||||
Total | $ | 5,707 | $ | (122 | ) | $ | 745 | $ | (5 | ) | $ | 6,452 | $ | (127 | ) | |||||||||
The total number of securities with unrealized losses at June 30, 2014, and June 30, 2013 were 159 and 26, respectively. Unrealized losses on securities have not been recognized in income because management has the intent and ability to hold the securities for the foreseeable future, and has determined that it is not more likely than not that the Company will be required to sell the securities prior to a recovery in value. The decline in fair value was largely due to increases in market interest rates. The Company had no other than temporary impairment losses during the years ended June 2014, 2013 or 2012.
The Bank, as a member of the FHLB, is required to maintain an investment in FHLB capital stock. No ready market exists for the FHLB stock and the carrying value approximates its fair value based on the redemption provisions of the FHLB.
101
HOMETRUST BANCSHARES, INC. AND SUBSIDIARY
Notes to Consolidated Financial Statements
(Dollar amounts in thousands)
4. | Loans |
Loans consist of the following at the dates indicated:
June 30, | June 30, | |||||||
2014 | 2013 | |||||||
Retail consumer loans: | ||||||||
One- to four- family | $ | 660,200 | $ | 602,050 | ||||
Home equity lines of credit | 148,379 | 125,676 | ||||||
Construction and land/lots | 59,249 | 51,546 | ||||||
Consumer | 15,164 | 3,349 | ||||||
Total retail consumer loans | 882,992 | 783,621 | ||||||
Commercial loans: | ||||||||
Commercial real estate | 377,769 | 231,086 | ||||||
Construction and development | 56,457 | 23,994 | ||||||
Commercial and industrial | 74,435 | 11,452 | ||||||
Municipal leases | 106,215 | 116,377 | ||||||
Total commercial loans | 614,876 | 382,909 | ||||||
Total loans | 1,497,868 | 1,165,530 | ||||||
Deferred loan fees, net | (1,340 | ) | (1,347 | ) | ||||
Total loans, net of deferred loan fees and discount | 1,496,528 | 1,164,183 | ||||||
Allowance for loan and lease losses | (23,429 | ) | (32,073 | ) | ||||
Net loans | $ | 1,473,099 | $ | 1,132,110 | ||||
All qualifying first mortgage loans, home equity lines of credit, and FHLB Stock are pledged as collateral by a blanket pledge to secure outstanding FHLB advances.
The Company's total loans by segment, class, and risk grade at the dates indicated follow:
Special | ||||||||||||||||||||||||
Pass | Mention | Substandard | Doubtful | Loss | Total | |||||||||||||||||||
June 30, 2014 | ||||||||||||||||||||||||
Retail consumer loans: | ||||||||||||||||||||||||
One- to four- family | $ | 607,313 | $ | 17,639 | $ | 32,331 | $ | 2,907 | $ | 10 | $ | 660,200 | ||||||||||||
Home equity lines of credit | 141,015 | 1,605 | 5,337 | 420 | 2 | 148,379 | ||||||||||||||||||
Construction and land/lots | 56,165 | 1,878 | 1,093 | 113 | - | 59,249 | ||||||||||||||||||
Consumer | 14,957 | 94 | 97 | 13 | 3 | 15,164 | ||||||||||||||||||
Commercial loans: | ||||||||||||||||||||||||
Commercial real estate | 334,290 | 16,931 | 24,604 | 1,944 | - | 377,769 | ||||||||||||||||||
Construction and development | 43,779 | 5,096 | 7,012 | 570 | - | 56,457 | ||||||||||||||||||
Commercial and industrial | 71,128 | 873 | 2,431 | - | 3 | 74,435 | ||||||||||||||||||
Municipal leases | 104,404 | 1,811 | - | - | - | 106,215 | ||||||||||||||||||
Total loans | $ | 1,373,051 | $ | 45,927 | $ | 72,905 | $ | 5,967 | $ | 18 | $ | 1,497,868 | ||||||||||||
Special | ||||||||||||||||||||||||
Pass | Mention | Substandard | Doubtful | Loss | Total | |||||||||||||||||||
June 30, 2013 | ||||||||||||||||||||||||
Retail consumer loans: | ||||||||||||||||||||||||
One- to four- family | $ | 536,603 | $ | 14,003 | $ | 47,753 | $ | 3,671 | $ | 20 | $ | 602,050 | ||||||||||||
Home equity lines of credit | 117,438 | 1,374 | 6,679 | 184 | 1 | 125,676 | ||||||||||||||||||
Construction and land/lots | 48,914 | 209 | 2,199 | 224 | - | 51,546 | ||||||||||||||||||
Consumer | 3,144 | 62 | 134 | 6 | 3 | 3,349 | ||||||||||||||||||
Commercial loans: | ||||||||||||||||||||||||
Commercial real estate | 179,310 | 20,105 | 27,116 | 4,555 | - | 231,086 | ||||||||||||||||||
Construction and development | 9,872 | 2,853 | 10,950 | 318 | 1 | 23,994 | ||||||||||||||||||
Commercial and industrial | 8,812 | 835 | 1,647 | 157 | 1 | 11,452 | ||||||||||||||||||
Municipal leases | 114,418 | 1,959 | - | - | - | 116,377 | ||||||||||||||||||
Total loans | $ | 1,018,511 | $ | 41,400 | $ | 96,478 | $ | 9,115 | $ | 26 | $ | 1,165,530 | ||||||||||||
102
HOMETRUST BANCSHARES, INC. AND SUBSIDIARY
Notes to Consolidated Financial Statements
(Dollar amounts in thousands)
The Company's total loans by segment, class, and delinquency status at the dates indicated follows:
Past Due | Total | |||||||||||||||||||
30-89 Days | 90 Days+ | Total | Current | Loans | ||||||||||||||||
June 30, 2014 | ||||||||||||||||||||
Retail consumer loans: | ||||||||||||||||||||
One- to four- family | $ | 4,929 | $ | 8,208 | $ | 13,137 | $ | 647,063 | $ | 660,200 | ||||||||||
Home equity lines of credit | 400 | 939 | 1,339 | 147,040 | 148,379 | |||||||||||||||
Construction and land/lots | 508 | 122 | 630 | 58,619 | 59,249 | |||||||||||||||
Consumer | 34 | 16 | 50 | 15,114 | 15,164 | |||||||||||||||
Commercial loans: | ||||||||||||||||||||
Commercial real estate | 306 | 6,729 | 7,035 | 370,734 | 377,769 | |||||||||||||||
Construction and development | 1,165 | 3,789 | 4,954 | 51,503 | 56,457 | |||||||||||||||
Commercial and industrial | 183 | 576 | 759 | 73,676 | 74,435 | |||||||||||||||
Municipal leases | - | - | - | 106,215 | 106,215 | |||||||||||||||
Total loans | $ | 7,525 | $ | 20,379 | $ | 27,904 | $ | 1,469,964 | $ | 1,497,868 | ||||||||||
Past Due | Total | |||||||||||||||||||
30-89 Days | 90 Days+ | Total | Current | Loans | ||||||||||||||||
June 30, 2013 | ||||||||||||||||||||
Retail consumer loans: | ||||||||||||||||||||
One- to four- family | $ | 7,031 | $ | 8,827 | $ | 15,858 | $ | 586,192 | $ | 602,050 | ||||||||||
Home equity lines of credit | 450 | 1,656 | 2,106 | 123,570 | 125,676 | |||||||||||||||
Construction and land/lots | 242 | 429 | 671 | 50,875 | 51,546 | |||||||||||||||
Consumer | 4 | 35 | 39 | 3,310 | 3,349 | |||||||||||||||
Commercial loans: | ||||||||||||||||||||
Commercial real estate | 3,805 | 7,085 | 10,890 | 220,196 | 231,086 | |||||||||||||||
Construction and development | - | 5,420 | 5,420 | 18,574 | 23,994 | |||||||||||||||
Commercial and industrial | 193 | 172 | 365 | 11,087 | 11,452 | |||||||||||||||
Municipal leases | - | - | - | 116,377 | 116,377 | |||||||||||||||
Total loans | $ | 11,725 | $ | 23,624 | $ | 35,349 | $ | 1,130,181 | $ | 1,165,530 | ||||||||||
The Company's recorded investment in loans, by segment and class that are not accruing interest or are 90 days or more past due and still accruing interest at the dates indicated follow:
June 30, 2014 | June 30, 2013 | |||||||||||||||
90 Days + & | 90 Days + & | |||||||||||||||
Non-accruing | still accruing | Non-accruing | still accruing | |||||||||||||
Retail consumer loans: | ||||||||||||||||
One- to four- family | $ | 17,968 | $ | - | $ | 29,811 | $ | - | ||||||||
Home equity lines of credit | 3,114 | - | 3,793 | - | ||||||||||||
Construction and land/lots | 688 | - | 2,172 | - | ||||||||||||
Consumer | 27 | - | 42 | - | ||||||||||||
Commercial loans: | ||||||||||||||||
Commercial real estate | 16,941 | - | 21,149 | - | ||||||||||||
Construction and development | 6,270 | - | 10,172 | - | ||||||||||||
Commercial and industrial | 2,003 | - | 1,422 | - | ||||||||||||
Municipal leases | - | - | - | - | ||||||||||||
Total loans | $ | 47,011 | $ | - | $ | 68,561 | $ | - | ||||||||
TDRs are loans which have renegotiated loan terms to assist borrowers who are unable to meet the original terms of their loans. Such modifications to loan terms may include a lower interest rate, a reduction in principal, or a longer term to maturity. Additionally, all TDRs are considered impaired.
103
HOMETRUST BANCSHARES, INC. AND SUBSIDIARY
Notes to Consolidated Financial Statements
(Dollar amounts in thousands)
The Company's loans that were performing under the payment terms of TDRs that were excluded from non-accruing loans above at the dates indicated follow:
June 30, | June 30, | |||||||
2014 | 2013 | |||||||
Performing TDRs included in | ||||||||
impaired loans | $ | 22,179 | $ | 14,012 | ||||
An analysis of the allowance for loan losses by segment for the periods shown is as follows:
June 30, 2014 | ||||||||||||
Retail | ||||||||||||
Consumer | Commercial | Total | ||||||||||
Balance at beginning of period | $ | 21,952 | $ | 10,121 | $ | 32,073 | ||||||
Provision for loan losses | (3,447 | ) | (2,853 | ) | (6,300 | ) | ||||||
Charge-offs | (4,436 | ) | (901 | ) | (5,337 | ) | ||||||
Recoveries | 1,662 | 1,331 | 2,993 | |||||||||
Balance at end of period | $ | 15,731 | $ | 7,698 | $ | 23,429 | ||||||
June 30, 2013 | ||||||||||||
Retail | ||||||||||||
Consumer | Commercial | Total | ||||||||||
Balance at beginning of period | $ | 21,172 | $ | 13,928 | $ | 35,100 | ||||||
Provision for loan losses | 3,641 | (2,541 | ) | 1,100 | ||||||||
Charge-offs | (3,715 | ) | (3,276 | ) | (6,991 | ) | ||||||
Recoveries | 854 | 2,010 | 2,864 | |||||||||
Balance at end of period | $ | 21,952 | $ | 10,121 | $ | 32,073 | ||||||
June 30, 2012 | ||||||||||||
Retail | ||||||||||||
Consumer | Commercial | Total | ||||||||||
Balance at beginning of period | $ | 23,538 | $ | 26,602 | $ | 50,140 | ||||||
Provision for loan losses | 14,021 | 1,579 | 15,600 | |||||||||
Charge-offs | (16,749 | ) | (16,063 | ) | (32,812 | ) | ||||||
Recoveries | 362 | 1,810 | 2,172 | |||||||||
Balance at end of period | $ | 21,172 | $ | 13,928 | $ | 35,100 | ||||||
104
HOMETRUST BANCSHARES, INC. AND SUBSIDIARY
Notes to Consolidated Financial Statements
(Dollar amounts in thousands)
The Company's ending balances of loans and the related allowance, by segment and class, at the dates indicated follows:
Allowance for Loan Losses | Total Loans Receivable | |||||||||||||||||||||||
Loans | Loans | |||||||||||||||||||||||
individually | Loans | individually | Loans | |||||||||||||||||||||
evaluated for | Collectively | evaluated for | Collectively | |||||||||||||||||||||
impairment | Evaluated | Total | impairment | Evaluated | Total | |||||||||||||||||||
June 30, 2014 | ||||||||||||||||||||||||
Retail consumer loans: | ||||||||||||||||||||||||
One- to four- family | $ | 493 | $ | 10,034 | $ | 10,527 | $ | 23,929 | $ | 636,271 | $ | 660,200 | ||||||||||||
Home equity | 134 | 2,353 | 2,487 | 3,014 | 145,365 | 148,379 | ||||||||||||||||||
Construction and land/lots | 379 | 2,041 | 2,420 | 1,735 | 57,514 | 59,249 | ||||||||||||||||||
Consumer | 3 | 294 | 297 | 10 | 15,154 | 15,164 | ||||||||||||||||||
Commercial loans: | ||||||||||||||||||||||||
Commercial real estate | 26 | 5,413 | 5,439 | 13,784 | 363,985 | 377,769 | ||||||||||||||||||
Construction and development | 26 | 1,215 | 1,241 | 5,571 | 50,886 | 56,457 | ||||||||||||||||||
Commercial and industrial | 3 | 246 | 249 | 2,378 | 72,057 | 74,435 | ||||||||||||||||||
Municipal leases | - | 769 | 769 | - | 106,215 | 106,215 | ||||||||||||||||||
Total | $ | 1,064 | $ | 22,365 | $ | 23,429 | $ | 50,421 | $ | 1,447,447 | $ | 1,497,868 | ||||||||||||
June 30, 2013 | ||||||||||||||||||||||||
Retail consumer loans: | ||||||||||||||||||||||||
One- to four- family | $ | 1,028 | $ | 14,070 | $ | 15,098 | $ | 35,255 | $ | 566,795 | $ | 602,050 | ||||||||||||
Home equity | 479 | 3,348 | 3,827 | 4,322 | 121,354 | 125,676 | ||||||||||||||||||
Construction and land/lots | 19 | 2,871 | 2,890 | 1,844 | 49,702 | 51,546 | ||||||||||||||||||
Consumer | 3 | 135 | 138 | 3 | 3,346 | 3,349 | ||||||||||||||||||
Commercial loans: | ||||||||||||||||||||||||
Commercial real estate | 110 | 6,473 | 6,583 | 19,446 | 211,640 | 231,086 | ||||||||||||||||||
Construction and development | 255 | 2,144 | 2,399 | 9,780 | 14,214 | 23,994 | ||||||||||||||||||
Commercial and industrial | 1 | 155 | 156 | 2,305 | 9,147 | 11,452 | ||||||||||||||||||
Municipal leases | - | 982 | 982 | - | 116,377 | 116,377 | ||||||||||||||||||
Total | $ | 1,895 | $ | 30,178 | $ | 32,073 | $ | 72,955 | $ | 1,092,575 | $ | 1,165,530 | ||||||||||||
105
HOMETRUST BANCSHARES, INC. AND SUBSIDIARY
Notes to Consolidated Financial Statements
(Dollar amounts in thousands)
The Company's impaired loans and the related allowance, by segment and class, at the dates indicated follows:
Total Impaired Loans | ||||||||||||||||
With a | With No | Related | ||||||||||||||
Recorded | Recorded | Recorded | ||||||||||||||
Allowance | Allowance | Total | Allowance | |||||||||||||
June 30, 2014 | ||||||||||||||||
Retail consumer loans: | ||||||||||||||||
One- to four- family | $ | 17,379 | $ | 14,614 | $ | 31,993 | $ | 678 | ||||||||
Home equity lines of credit | 2,445 | 2,305 | 4,750 | 166 | ||||||||||||
Construction and land/lots | 1,737 | 109 | 1,846 | 411 | ||||||||||||
Consumer | 16 | 11 | 27 | 3 | ||||||||||||
Commercial loans: | ||||||||||||||||
Commercial real estate | 6,228 | 9,114 | 15,342 | 166 | ||||||||||||
Construction and development | 1,043 | 5,088 | 6,131 | 54 | ||||||||||||
Commercial and industrial | 835 | 1,903 | 2,738 | 13 | ||||||||||||
Municipal leases | - | - | - | - | ||||||||||||
Total impaired loans | $ | 29,683 | $ | 33,144 | $ | 62,827 | $ | 1,491 | ||||||||
June 30, 2013 | ||||||||||||||||
Retail consumer loans: | ||||||||||||||||
One- to four- family | $ | 14,194 | $ | 30,219 | $ | 44,413 | $ | 1,176 | ||||||||
Home equity lines of credit | 3,303 | 2,651 | 5,954 | 518 | ||||||||||||
Construction and land/lots | 551 | 1,649 | 2,200 | 38 | ||||||||||||
Consumer | 39 | 3 | 42 | 4 | ||||||||||||
Commercial loans: | ||||||||||||||||
Commercial real estate | 998 | 22,716 | 23,714 | 119 | ||||||||||||
Construction and development | 518 | 10,034 | 10,552 | 256 | ||||||||||||
Commercial and industrial | - | 2,864 | 2,864 | - | ||||||||||||
Municipal leases | - | - | - | - | ||||||||||||
Total impaired loans | $ | 19,603 | $ | 70,136 | $ | 89,739 | $ | 2,111 | ||||||||
The table above includes $12,406 and $16,613, of impaired loans that were not individually evaluated at June 30, 2014 and June 30, 2013, respectively, because these loans did not meet the Company's threshold for individual impairment evaluation. The recorded allowance above includes $427 and $216 related to these loans that were not individually evaluated at June 30, 2014 and June 30, 2013, respectively.
The Company's average recorded investment in loans individually evaluated for impairment, period end unpaid principal balance as of the dates indicated below and interest income recognized on impaired loans for the year ended as follows:
June 30, 2014 | June 30, 2013 | |||||||||||||||||||||||
Average | Unpaid | Interest | Average | Unpaid | Interest | |||||||||||||||||||
Recorded | Principal | Income | Recorded | Principal | Income | |||||||||||||||||||
Investment | Balance | Recognized | Investment | Balance | Recognized | |||||||||||||||||||
Retail consumer loans: | ||||||||||||||||||||||||
One- to four- family | $ | 38,949 | $ | 38,493 | $ | 1,624 | $ | 44,060 | $ | 49,176 | $ | 1,867 | ||||||||||||
Home equity lines of credit | 5,549 | 6,539 | 274 | 5,869 | 9,405 | 194 | ||||||||||||||||||
Construction and land/lots | 2,080 | 3,671 | 182 | 2,906 | 4,617 | 169 | ||||||||||||||||||
Consumer | 34 | 364 | 8 | 67 | 184 | 3 | ||||||||||||||||||
Commercial loans: | ||||||||||||||||||||||||
Commercial real estate | 22,116 | 23,458 | 640 | 25,501 | 28,136 | 1,014 | ||||||||||||||||||
Construction and development | 7,885 | 9,780 | 169 | 12,161 | 17,986 | 425 | ||||||||||||||||||
Commercial and industrial | 2,747 | 3,857 | 163 | 3,006 | 3,801 | 153 | ||||||||||||||||||
Municipal leases | - | - | - | - | - | - | ||||||||||||||||||
Total loans | $ | 79,360 | $ | 86,162 | $ | 3,060 | $ | 93,570 | $ | 113,305 | $ | 3,825 | ||||||||||||
106
HOMETRUST BANCSHARES, INC. AND SUBSIDIARY
Notes to Consolidated Financial Statements
(Dollar amounts in thousands)
A summary of changes in the accretable yield for purchased impaired loans for the year ended June 30, 2014 follows. There were no purchased credit impaired loans during year ended June 30, 2013.
Year Ended | ||||
June 30, | ||||
2014 | ||||
Accretable yield, beginning of period | $ | - | ||
Addition from the BankGreenville acquisition | 1,835 | |||
Addition from the Jefferson acquisition | 4,949 | |||
Interest income | (633 | ) | ||
Accretable yield, end of period | $ | 6,151 | ||
The following table presents the purchased performing loans receivable for Jefferson at June 30, 2014 and May 31, 2014 (the combination date):
Purchased Performing Loans | ||||||||
June 30, | May 31, | |||||||
2014 | 2014 | |||||||
Contractually required principal payments receivable | $ | 304,591 | $ | 305,329 | ||||
Adjustment for credit, interest rate, and liquidity | 6,514 | 6,539 | ||||||
Balance of purchased loans receivable | $ | 298,077 | $ | 298,790 | ||||
The following table presents the purchased performing loans receivable for BankGreenville at June 30, 2014 and July 31, 2013 (the combination date):
Purchased Performing Loans | ||||||||
June 30, | July 31, | |||||||
2014 | 2013 | |||||||
Contractually required principal payments receivable | $ | 30,226 | $ | 41,077 | ||||
Adjustment for credit, interest rate, and liquidity | 2,108 | 2,854 | ||||||
Balance of purchased loans receivable | $ | 28,118 | $ | 38,223 | ||||
The following table presents the purchased impaired loans for Jefferson and BankGreenville at their respective acquisition dates:
Purchased Impaired Loans | ||||||||
Jefferson | BankGreenville | |||||||
May 31, | July 31, | |||||||
2014 | 2013 | |||||||
Contractually required principal and interest payments receivable | $ | 40,689 | $ | 12,817 | ||||
Amounts not expected to be collected – nonaccretable difference | 5,719 | 1,375 | ||||||
Estimated payments expected to be received | 34,970 | 11,442 | ||||||
Accretable yield | 4,949 | 1,835 | ||||||
Fair value of purchased impaired loans | $ | 30,021 | $ | 9,607 | ||||
June 30, 2014 | ||||||||
Jefferson | BankGreenville | |||||||
Carrying value of purchased impaired loans | $ | 29,849 | $ | 9,008 | ||||
Unpaid principal balance of purchased impaired loans | $ | 35,684 | $ | 10,697 | ||||
107
HOMETRUST BANCSHARES, INC. AND SUBSIDIARY
Notes to Consolidated Financial Statements
(Dollar amounts in thousands)
The following table presents a breakdown of the types of concessions made on TDRs by loan class:
Year Ended June 30, 2014 | Year Ended June 30, 2013 | |||||||||||||||||||||||
Number of Loans | Pre Modification Outstanding Recorded Investment | Post Modification Outstanding Recorded Investment | Number of Loans | Pre Modification Outstanding Recorded Investment | Post Modification Outstanding Recorded Investment | |||||||||||||||||||
Below market interest rate: | ||||||||||||||||||||||||
Retail consumer: | ||||||||||||||||||||||||
One- to four- family | 8 | $ | 417 | $ | 424 | 4 | $ | 1,121 | $ | 1,103 | ||||||||||||||
Home equity lines of credit | 4 | 371 | 367 | - | - | - | ||||||||||||||||||
Commercial: | ||||||||||||||||||||||||
Commercial real estate | - | - | - | 1 | 237 | 231 | ||||||||||||||||||
Total | 12 | $ | 788 | $ | 791 | 5 | $ | 1,358 | $ | 1,334 | ||||||||||||||
Extended payment terms: | ||||||||||||||||||||||||
Retail consumer: | ||||||||||||||||||||||||
One- to four- family | 4 | $ | 379 | $ | 355 | 2 | $ | 87 | $ | 83 | ||||||||||||||
Home equity lines of credit | - | - | - | 4 | 85 | 80 | ||||||||||||||||||
Commercial: | ||||||||||||||||||||||||
Commercial and industrial | - | - | - | 1 | 10 | 10 | ||||||||||||||||||
Total | 4 | $ | 379 | $ | 355 | 7 | $ | 182 | $ | 173 | ||||||||||||||
Other TDRs: | ||||||||||||||||||||||||
Retail consumer: | ||||||||||||||||||||||||
One- to four- family | 17 | $ | 1,257 | $ | 1,272 | 85 | 6,830 | 6,456 | ||||||||||||||||
Home equity lines of credit | 2 | 42 | 4 | 39 | 1,232 | 1,157 | ||||||||||||||||||
Construction and land/lots | 2 | 787 | 767 | 8 | 395 | 377 | ||||||||||||||||||
Commercial: | ||||||||||||||||||||||||
Commercial real estate | - | - | - | 4 | 1,651 | 1,119 | ||||||||||||||||||
Commercial and industrial | - | - | - | 1 | 30 | 27 | ||||||||||||||||||
Total | 21 | $ | 2,086 | $ | 2,043 | 137 | $ | 10,138 | $ | 9,136 | ||||||||||||||
Total | 37 | $ | 3,253 | $ | 3,189 | 149 | $ | 11,678 | $ | 10,643 | ||||||||||||||
During the year ended June 30, 2013, one- to four- family TDRs increased by 91 loans or $8.0 million and home equity lines of credit TDRs increased by 43 loans totaling $1.3 million, including 77 one- to four- family TDRs totaling $4.9 million and 41 home equity lines of credit TDRs totaling $1.2 million representing loans classified as TDRs as a result of recent regulatory reporting requirements of the Office of the Comptroller of the Currency ("OCC"), the Bank's primary federal regulator, requiring that banks classify mortgages and other loans discharged by troubled borrowers in bankruptcy as TDRs.
108
HOMETRUST BANCSHARES, INC. AND SUBSIDIARY
Notes to Consolidated Financial Statements
(Dollar amounts in thousands)
The following table presents loans that were modified as TDRs within the previous twelve months and for which there was a payment default during the years ended June 30, 2014 and 2013.
Year Ended June 30, 2014 | Year Ended June 30, 2013 | |||||||||||||||
Number of | Recorded | Number of | Recorded | |||||||||||||
Loans | Investment | Loans | Investment | |||||||||||||
Below market interest rate: | ||||||||||||||||
Retail consumer: | ||||||||||||||||
One- to four- family | 1 | $ | 71 | - | $ | - | ||||||||||
Home equity lines of credit | 2 | 274 | - | - | ||||||||||||
Total | 3 | $ | 345 | - | $ | - | ||||||||||
Extended payment terms: | ||||||||||||||||
Retail consumer: | ||||||||||||||||
One- to four- family | 1 | $ | 278 | 2 | $ | 83 | ||||||||||
Home equity lines of credit | - | - | 1 | 12 | ||||||||||||
Commercial: | ||||||||||||||||
Commercial and industrial | - | - | 1 | 10 | ||||||||||||
Total | 1 | $ | 278 | 4 | $ | 105 | ||||||||||
Other TDRs: | ||||||||||||||||
Retail consumer: | ||||||||||||||||
One- to four- family | 4 | $ | 322 | 27 | $ | 2,510 | ||||||||||
Home equity lines of credit | - | - | 6 | 111 | ||||||||||||
Construction and land/lots | - | - | 5 | 164 | ||||||||||||
Commercial: | ||||||||||||||||
Commercial real estate | - | - | 3 | 126 | ||||||||||||
Commercial and industrial | - | - | 1 | 27 | ||||||||||||
Total | 4 | $ | 322 | 42 | $ | 2,938 | ||||||||||
Total | 8 | $ | 945 | 46 | $ | 3,043 | ||||||||||
Loans that were modified as TDRs within the previous twelve months for which there was a payment default during the year ended June 30, 2013 included 23 one- to four- family loans totaling $1.3 million due to the addition of loans where the borrower's obligation to the Company has been discharged in bankruptcy, per regulatory guidance. Other TDRs include TDRs that have a below market interest rate and extended payment terms. The Company does not typically forgive principal when restructuring troubled debt.
In the determination of the allowance for loan losses, management considers TDRs for all loan classes, and the subsequent nonperformance in accordance with their modified terms, by measuring impairment on a loan-by-loan basis based on either the value of the loan's expected future cash flows discounted at the loan's original effective interest rate or on the collateral value, net of the estimated costs of disposal, if the loan is collateral dependent.
5. | Premises and Equipment |
Premises and equipment consist of the following:
June 30, | ||||||||
2014 | 2013 | |||||||
Land | $ | 12,588 | $ | 5,720 | ||||
Land held under capital lease | 2,052 | 2,052 | ||||||
Office buildings | 44,899 | 26,286 | ||||||
Furniture, fixtures and equipment | 13,391 | 12,456 | ||||||
Total | 72,930 | 46,514 | ||||||
Less accumulated depreciation | (25,519 | ) | (24,114 | ) | ||||
Premises and equipment, net | $ | 47,411 | $ | 22,400 | ||||
109
HOMETRUST BANCSHARES, INC. AND SUBSIDIARY
Notes to Consolidated Financial Statements
(Dollar amounts in thousands)
6. | Accrued Interest Receivable |
Accrued interest receivable consists of the following:
June 30, | ||||||||
2014 | 2013 | |||||||
Loans | $ | 6,051 | $ | 5,392 | ||||
Securities available for sale | 595 | 35 | ||||||
Other | 141 | 122 | ||||||
Total | $ | 6,787 | $ | 5,549 | ||||
7. | Goodwill and Core Deposit Intangibles |
Goodwill represents the excess of the acquisition cost over the fair value of the net assets acquired. The Company recorded $9,815 in goodwill as a result of the acquisitions of Jefferson and BankGreenville during 2014. See footnote 2 for more details regarding these acquisitions.
The Company added $4,060 in core deposit intangibles during 2014 related to the acquisitions of Jefferson and BankGreenville. Amortization expense related to core deposit intangibles was $166, $86, and $131 for the years ended June 30, 2014, 2013, and 2012, respectively.
Amortization of core deposit intangibles is computed using the accelerated method over an amortization period of seven years, which is the estimated life of the related deposits. Estimated amortization expense for each of the next five years is as follows:
June 30, 2014 | ||||
2015 | $ | 1,110 | ||
2016 | 839 | |||
2017 | 698 | |||
2018 | 560 | |||
2019 | 425 | |||
Thereafter | 382 | |||
Total | $ | 4,014 | ||
8. | Deposit Accounts |
Deposit accounts consist of the following:
Weighted Average Interest Rates | ||||||||||||||||
June 30, | June 30, | |||||||||||||||
2014 | 2013 | 2014 | 2013 | |||||||||||||
Noninterest-bearing accounts | $ | 123,285 | $ | 60,828 | 0.00 | % | 0.00 | % | ||||||||
NOW accounts | 295,386 | 195,659 | 0.10 | % | 0.11 | % | ||||||||||
Money market accounts | 354,247 | 275,718 | 0.24 | % | 0.28 | % | ||||||||||
Savings accounts | 175,974 | 82,158 | 0.19 | % | 0.19 | % | ||||||||||
Certificates of deposit | 634,155 | 540,387 | 0.70 | % | 0.90 | % | ||||||||||
Total | $ | 1,583,047 | $ | 1,154,750 | 0.37 | % | 0.52 | % | ||||||||
Maturities of certificates of deposit are as follows:
June 30, 2014 | June 30, 2013 | |||||||
Within 1 year | $ | 451,077 | $ | 374,514 | ||||
1 year to 2 years | 94,918 | 75,944 | ||||||
2 years to 3 years | 52,908 | 44,097 | ||||||
3 years to 4 years | 16,383 | 25,321 | ||||||
4 years to 5 years | 18,869 | 20,511 | ||||||
Total | $ | 634,155 | $ | 540,387 | ||||
Certificates of deposit with balances of $100 or greater totaled $305,160 and $266,458 at June 30, 2014 and 2013, respectively. Generally, deposit amounts in excess of $250,000 are not federally insured.
110
HOMETRUST BANCSHARES, INC. AND SUBSIDIARY
Notes to Consolidated Financial Statements
(Dollar amounts in thousands)
Interest expense on deposits consists of the following:
June 30, | ||||||||||||
2014 | 2013 | 2012 | ||||||||||
NOW accounts | $ | 275 | $ | 212 | $ | 320 | ||||||
Money market accounts | 788 | 895 | 1,397 | |||||||||
Savings accounts | 156 | 199 | 314 | |||||||||
Certificates of deposit | 4,198 | 5,669 | 8,213 | |||||||||
Total | $ | 5,417 | $ | 6,975 | $ | 10,244 | ||||||
9. | Other Borrowings |
Other borrowings consist of:
June 30, | ||||||||||||||||
2014 | 2013 | |||||||||||||||
Balance | Weighted Average Rate | Balance | Weighted Average Rate | |||||||||||||
FHLB advances maturing: | ||||||||||||||||
Within one year | $ | 50,000 | 0.20 | % | $ | - | - | |||||||||
Total | $ | 50,000 | 0.20 | % | $ | - | - | |||||||||
All qualifying first mortgage loans, home equity lines of credit, and FHLB Stock were pledged as collateral to secure the FHLB advances.
In fiscal years ended June 2013 and 2012, the Company prepaid $15,100, and $11,000 of FHLB advances with weighted average interest rates of 4.88%, and 6.02%, respectively. The Company incurred prepayment penalties on these transactions of $3,069, and $2,111, respectively, which is included in the consolidated statements of income.
10. | Leases |
The Company leases certain real property under long-term operating lease agreements. Rent expense under operating leases was $887, $653, and $403 for the years ended June 30, 2014, 2013, and 2012, respectively.
The following schedule summarizes aggregate future minimum lease payments under these operating leases at June 30, 2014.
Fiscal year ending: | June 30, 2014 | |||
2015 | $ | 836 | ||
2016 | 709 | |||
2017 | 613 | |||
2018 | 578 | |||
Thereafter | 196 | |||
Total of future minimum payments | $ | 2,932 | ||
The Company currently leases land for one of its retail office locations under a capital lease. Leases that meet the criteria for capitalization are recorded as assets and the related obligations are reflected as capital lease obligations on the accompanying balance sheets, because the lease has been deemed to have a bargain purchase option. Included in premises and equipment at June 30, 2014 and June 30, 2013 is $2,052 as the capitalized cost of the leased land.
111
HOMETRUST BANCSHARES, INC. AND SUBSIDIARY
Notes to Consolidated Financial Statements
(Dollar amounts in thousands)
Aggregate future minimum lease payments due under this capital lease obligation are as follows:
Fiscal year ending: | June 30, 2014 | |||
2015 | $ | 122 | ||
2016 | 122 | |||
2017 | 123 | |||
2018 | 123 | |||
2019-2029 | 2,807 | |||
Total minimum lease payments | 3,297 | |||
Less: amount representing interest | (1,299 | ) | ||
Present value of net minimum lease payments | $ | 1,998 | ||
11. | Income Taxes |
Income tax expense (benefit) consists of:
June 30, | ||||||||||||
2014 | 2013 | 2012 | ||||||||||
Current: | ||||||||||||
Federal | $ | 75 | $ | 324 | $ | (118 | ) | |||||
State | 9 | 44 | 8 | |||||||||
Total current expense (benefit) | 84 | 368 | (110 | ) | ||||||||
Deferred: | ||||||||||||
Federal | 2,904 | 911 | (769 | ) | ||||||||
State | 1,525 | 696 | 232 | |||||||||
Total deferred expense (benefit) | 4,429 | 1,607 | (537 | ) | ||||||||
Total income tax expense (benefit) | $ | 4,513 | $ | 1,975 | $ | (647 | ) | |||||
Income tax expense (benefit) differed from the amounts computed by applying the U.S. federal income tax rate of 34% to pretax income from continuing operations before income taxes as a result of the following:
Year Ended June 30, | ||||||||||||||||||||||||
2014 | 2013 | 2012 | ||||||||||||||||||||||
| $ | Rate | $ | Rate | $ | Rate | |||||||||||||||||||
Tax at federal income tax rate | $ | 5,051 | 34 | % | $ | 3,749 | 34 | % | $ | 1,319 | 34 | % | ||||||||||||
Increase (decrease) resulting from: | ||||||||||||||||||||||||
Tax exempt income | (1,740 | ) | (12 | ) | (1,946 | ) | (18 | ) | (2,136 | ) | (55 | ) | ||||||||||||
Nondeductible merger expenses | 162 | 1 | - | - | - | - | ||||||||||||||||||
Change in valuation allowance for deferred tax assets, allocated to income tax expense | (1,160 | ) | (8 | ) | (390 | ) | (4 | ) | 28 | 1 | ||||||||||||||
State tax, net of federal benefit | 1,012 | 7 | 489 | 4 | 156 | 4 | ||||||||||||||||||
Other | 1,188 | 8 | 73 | 1 | (14 | ) | (1 | ) | ||||||||||||||||
Total | $ | 4,513 | 30 | % | $ | 1,975 | 18 | % | $ | (647 | ) | (17 | )% | |||||||||||
112
HOMETRUST BANCSHARES, INC. AND SUBSIDIARY
Notes to Consolidated Financial Statements
(Dollar amounts in thousands)
The sources and tax effects of temporary differences that give rise to significant portions of the deferred tax assets (liabilities) at June 30, 2014 and 2013 are presented below:
June 30, | ||||||||
2014 | 2013 | |||||||
Deferred tax assets: | ||||||||
Alternative minimum tax credit | $ | 3,772 | $ | 3,650 | ||||
Allowance for loan losses | 8,965 | 12,564 | ||||||
Deferred compensation and post-retirement benefits | 16,668 | 16,998 | ||||||
Accrued vacation and sick leave | 29 | 358 | ||||||
Impairments on real estate owned | 1,462 | 972 | ||||||
Other than temporary impairment on investments | 3,721 | |||||||
Capital loss carryforward | - | 10 | ||||||
Net operating loss carryforward | 22,825 | 16,336 | ||||||
Discount from business combination | 5,334 | 509 | ||||||
Unrealized loss on securities held for sale | - | 16 | ||||||
Other | 1,827 | 590 | ||||||
Total gross deferred tax assets | 64,603 | 52,003 | ||||||
Less valuation allowance | (1,014 | ) | (2,178 | ) | ||||
Deferred tax assets | 63,589 | 49,825 | ||||||
Deferred tax (liabilities): | ||||||||
Depreciable basis of fixed assets | (2,340 | ) | (1,026 | ) | ||||
Deferred loan fees | (336 | ) | (530 | ) | ||||
FHLB stock, book basis in excess of tax | (144 | ) | (147 | ) | ||||
Stock Compensation Plans | - | (694 | ) | |||||
Unrealized gain on securities available for sale | (138 | ) | - | |||||
Other | (2,250 | ) | - | |||||
Total gross deferred tax liabilities | (5,208 | ) | (2,397 | ) | ||||
Net deferred tax assets | $ | 58,381 | $ | 47,428 | ||||
The Company has net operating loss carry forwards of $64.2 million and $42.9 million as of June 30, 2014 and June 30, 2013, respectively, with a recorded tax benefit of $22.8 million and $16.3 million included in deferred tax assets. These loss carryforwards will begin to expire for federal tax purposes as of June 30, 2031.
The Company adjusted its net deferred tax asset as a result of reductions in the North Carolina corporate income tax rates that were enacted July 23, 2013, and effective January 1, 2014 and January 1, 2015. The lower corporate income tax rate resulted in a reduction in the deferred tax assets as of June 30, 2014 and an increase in the current period income tax expense for the year ended June 30, 2014.
The valuation allowance for deferred tax assets as of June 30, 2014 and 2013 was $1,014 and $2,178, respectively. The net change in the total valuation allowance for June 30, 2014 and 2013 was ($1,157) and ($392), respectively, which relates primarily to North Carolina state income taxes due to limitations on state net operating loss carry forwards. In assessing the realizability of deferred tax assets, management considers whether it is more likely than not that some portion or all of the deferred tax assets will not be realized. The ultimate realization of deferred tax assets is dependent upon the generation of future taxable income during the periods in which those temporary differences become deductible. Management performed a robust evaluation of the Company's deferred tax assets at June 30, 2014 and June 30, 2013. Management considered all available positive and negative evidence including the possibility of future reversals of existing taxable temporary differences, projected future taxable income, tax planning strategies, and recent financial performance in making this assessment. Negative evidence considered included the Company's pre-tax loss for the year ended June 30, 2011 and relatively high net loan chargeoffs during the years ended June 30, 2012 and 2011. Positive evidence considered included pre-tax income for the years ended June 30, 2014, 2013 and 2012, the Company's history of generating taxable income, no prior history of generating loss carry forwards or expiration of loss carry forwards, its regulatory "well capitalized" status, the long-term nature of the deferred compensation deferred tax asset, the Company's improving credit quality indicators, and its ability to sell its municipal lease portfolio to convert current tax-free income to future taxable income. Based upon this evaluation, management believes there is more positive evidence than negative evidence and it is more likely than not the Company will realize the benefits of these deductible differences, net of the existing valuation allowances at June 30, 2014 and June 30, 2013. The amount of the deferred tax asset considered realizable, however, could be reduced in the near term if negative trends occur with credit quality and earnings during the carryforward period.
Retained earnings at June 30, 2014 and 2013 include $19,570 representing pre-1988 tax bad debt reserve base year amounts for which no deferred tax liability has been provided since these reserves are not expected to reverse and may never reverse. Circumstances that would require an accrual of a portion or all of this unrecorded tax liability are a failure to meet the
113
HOMETRUST BANCSHARES, INC. AND SUBSIDIARY
Notes to Consolidated Financial Statements
(Dollar amounts in thousands)
definition of a bank, dividend payments in excess of current year or accumulated earnings and profits, or other distributions in dissolution or liquidation of the Bank.
Income tax returns subsequent to 2010 are subject to examination by the taxing authorities.
12. | Employee Benefit Plans |
The Company has a 401(k) savings/profit-sharing plan for its employees. The Company matches employee contributions dollar for dollar up to 6% of each employee's compensation. The Company may also make discretionary profit sharing contributions for the benefit of all eligible participants as long as total contributions do not exceed applicable limitations. Employees become fully vested in the Company's contributions after six years of service. The Company's expense for 401(k) contributions to this plan was $918, $827, and $320 for the years ended June 30, 2014, 2013, and 2012, respectively.
Post-retirement health care benefits are provided to certain key officers under the Company's Executive Medical Care Plan ("EMCP"). The EMCP is unfunded and is not qualified under the Internal Revenue Code. Plan expense for the years ended June 30, 2014, 2013, and 2012 was $248, $229, and $197, respectively. Total accrued expenses related to this plan included in other liabilities were $5,079 and $4,952, respectively, as of June 30, 2014 and 2013.
13. | Deferred Compensation Agreements |
The Company's Director Emeritus Plans ("Plans") provides certain benefits to Emeritus Directors for providing current advisory services to the Company. The Plans are unfunded and are not qualified under the Internal Revenue Code. Plan benefits vary by participant and are payable to a designated beneficiary in the event of death. The Company records an expense based on the present value of expected future benefits. Plan expenses for the years ended June 30, 2014, 2013, and 2012 were $478, $471, and $553 respectively. Total accrued expenses related to these plans included in other liabilities were $10,816 and $10,996, respectively, as of June 30, 2014 and 2013.
The Company has deferred compensation agreements with certain members of the Company's Board of Directors. The future payments related to these agreements are to be funded with life insurance contracts which are payable to the Company in the event of the director's death. For the years ended June 30, 2014, 2013, and 2012 deferred compensation expense was $104, $71, and $84, respectively.
The net cash surrender value of the related life insurance policies and deferred compensation liability are detailed below:
June 30, | ||||||||
2014 | 2013 | |||||||
Net cash surrender value of life insurance, related to deferred compensation | $ | 6,962 | $ | 6,238 | ||||
Deferred compensation liability, included in other liabilities | 1,752 | 1,827 | ||||||
Long term deferred compensation and supplemental retirement plans are provided to certain key current and former officers. These plans are unfunded and are not qualified under the Internal Revenue Code. The benefits will vary by participant and are payable to a designated beneficiary in the event of death. Plan expenses for the years ended June 30, 2014, 2013, and 2012 were $841, $1,014, and $1,155, respectively. Total accrued expenses related to these plans included in other liabilities were $20,786 and $20,694, respectively, as of June 30, 2014 and 2013.
In addition, the Company has a deferred compensation plan provided to certain officers and directors. The plan allows the participants to defer any of their annual compensation, including bonus payments, up to the maximum allowed for each participant. The plan is unfunded and is not qualified under the Internal Revenue Code. Plan expenses for the years ended June 30, 2014, 2013, and 2012 were $240, $243, and $260, respectively. The total deferred compensation plan payable included in other liabilities was $6,122 and $5,948, respectively as of June 30, 2014 and 2013.
14. | Employee Stock Ownership Plan |
In connection with the Conversion, the Bank established the ESOP for the benefit of all of its eligible employees. Shares released are allocated to each eligible participant based on the ratio of each participant's compensation, as defined in the ESOP, to the total compensation of all eligible plan participants. Forfeited shares shall be reallocated among other participants in the Plan. At the discretion of the Bank, cash dividends, when paid on allocated shares, will be distributed to participants' accounts, paid in cash to the participants, or used to repay the principal and interest on the ESOP loan used to acquire Company stock on which dividends were paid. Cash dividends on unallocated shares will be used to repay the outstanding debt of the ESOP.
114
HOMETRUST BANCSHARES, INC. AND SUBSIDIARY
Notes to Consolidated Financial Statements
(Dollar amounts in thousands)
Compensation expense related to the ESOP for the fiscal year ended June 30, 2014 and 2013 was $844 and $749, respectively. Shares held by the ESOP include the following:
June 30, | June 30, | |||||||
2014 | 2013 | |||||||
Unallocated ESOP shares | 952,200 | 1,005,100 | ||||||
Allocated ESOP shares | 52,900 | - | ||||||
ESOP shares committed to be released | 52,900 | 52,900 | ||||||
Total ESOP shares | 1,058,000 | 1,058,000 | ||||||
Fair value of unallocated ESOP shares | $ | 15,016 | $ | 17,046 | ||||
15. | Net Income per Share |
The following is a reconciliation of the numerator and denominator of basic and diluted net income per share of common stock (in thousands, except share and per share data):
June 30, | ||||||||||||
2014 | 2013 | 2012 | ||||||||||
Numerator: | ||||||||||||
Net income available to common stockholders | $ | 10,342 | $ | 9,053 | $ | 4,527 | ||||||
Denominator: | ||||||||||||
Weighted-average common shares outstanding - basic | 18,630,774 | 19,922,283 | - | |||||||||
Effect of dilutive shares | 84,895 | 19,404 | - | |||||||||
Weighted-average common shares outstanding - diluted | 18,715,669 | 19,941,687 | - | |||||||||
Net income per share - basic | $ | 0.54 | $ | 0.45 | $ | - | ||||||
Net income per share - diluted | $ | 0.54 | $ | 0.45 | $ | - | ||||||
16. | Equity Incentive Plan |
On January 17, 2013, the Company's stockholders approved the 2013 Omnibus Incentive Plan which provides for awards of restricted stock, restricted stock units, stock options, stock appreciation rights and cash awards to directors, emeritus directors, officers, employees and advisory directors. The cost of equity-based awards under the 2013 Omnibus Incentive Plan generally is based on the fair value of the awards on their grant date. The maximum number of shares that may be utilized for awards under the plan is 2,962,400, including 2,116,000 for stock options and stock appreciation rights and 846,400 for awards of restricted stock and restricted stock units.
Shares of common stock issued under the 2013 Omnibus Incentive Plan may be authorized but unissued shares or, in the case of restricted stock awards, may be repurchased shares. As of June 30, 2013, the Company had repurchased all 846,400 shares on the open market for issuance under the 2013 Omnibus Incentive Plan, for $13.3 million, at an average cost of $15.71 per share.
Share based compensation expense related to stock options and restricted stock recognized for the fiscal year ended June 30, 2014 and 2013 were $2,623 and $1,113, respectively, before the related tax benefit of $971 and $434, respectively.
115
HOMETRUST BANCSHARES, INC. AND SUBSIDIARY
Notes to Consolidated Financial Statements
(Dollar amounts in thousands)
The table below presents stock option activity for the fiscal year ended June 30, 2014 and 2013:
Weighted- | Remaining | Aggregate | ||||||||||||||
average | contractual life | Intrinsic | ||||||||||||||
Options | exercise price | (years) | Value | |||||||||||||
Options outstanding at June 30, 2012 | - | - | - | |||||||||||||
Granted | 1,557,000 | $ | 14.37 | 9.6 | ||||||||||||
Exercised | - | - | - | |||||||||||||
Forfeited | - | - | - | |||||||||||||
Expired | - | - | - | |||||||||||||
Options outstanding at June 30, 2013 | 1,557,000 | $ | 14.37 | 9.6 | $ | 4,033 | ||||||||||
Granted | 30,000 | 15.83 | - | |||||||||||||
Exercised | - | - | - | |||||||||||||
Forfeited | 73,500 | 14.37 | - | |||||||||||||
Expired | - | - | - | |||||||||||||
Options outstanding at June 30, 2014 | 1,513,500 | $ | 14.40 | 8.6 | $ | 2,077 | ||||||||||
Exercisable at June 30, 2014 | 290,175 | $ | 14.37 | 8.6 | ||||||||||||
There were no options exercisable at June 30, 2013. The fair value of each option is estimated on the date of grant using the Black-Scholes-Merton option pricing model. The weighted average fair value of each option granted in 2014 and 2013 was $5.26 and $4.50, respectively. Assumptions used for grants were as follows:
Assumptions in Estimating Option Values | ||||||||
2014 | 2013 | |||||||
Weighted-average volatility | 28.19 | % | 28.19 | % | ||||
Expected dividend yield | 0.00 | % | 0.00 | % | ||||
Risk-free interest rate | 2.04 | % | 1.28 | % | ||||
Expected life (years) | 6.5 | 6.6 | ||||||
At June 30, 2014, the Company had $5.3 million of unrecognized compensation expense related to 1,513,500 stock options scheduled to vest over five- and seven-year vesting periods. The weighted average period over which compensation cost related to non-vested awards is expected to be recognized was 2.3 years at June 30, 2014. At June 30, 2013, the Company had $6.5 million of unrecognized compensation expense related to 1,557,000 stock options schedule to vest over five- and seven-year vesting periods. The weighted average period over which compensation cost related to non-vested awards is expected to be recognized was 4.7 years at June 30, 2013. No awards were vested as of June 30, 2013. All unexercised options expire ten years after the grant date.
The table below presents restricted stock award activity for the year ended June 30, 2014:
Weighted- | Aggregate | |||||||||||
Restricted | average grant | Intrinsic | ||||||||||
stock awards | date fair value | Value | ||||||||||
Non-vested at June 30, 2012 | - | - | ||||||||||
Granted | 511,300 | $ | 14.37 | |||||||||
Vested | - | - | ||||||||||
Forfeited | - | - | ||||||||||
Non-vested at June 30, 2013 | 511,300 | $ | 14.37 | $ | 8,672 | |||||||
Granted | 7,050 | 15.80 | ||||||||||
Vested | 95,485 | 14.37 | ||||||||||
Forfeited | 18,900 | 14.37 | ||||||||||
Non-vested at June 30, 2014 | 403,965 | $ | 15.05 | $ | 6,371 | |||||||
At June 30, 2014, unrecognized compensation expense was $5.5 million related to 403,965 shares of restricted stock scheduled to vest over five- and seven-year vesting periods. The weighted average period over which compensation cost related to non-vested awards is expected to be recognized was 2.3 years at June 30, 2014. At June 30, 2013, unrecognized compensation expense was $6.8 million related to 511,300 shares of restricted stock scheduled to vest over five- and seven-year vesting periods. The weighted average period over which compensation cost related to non-vested awards is expected to be recognized was 4.7 years at June 30, 2013.
116
HOMETRUST BANCSHARES, INC. AND SUBSIDIARY
Notes to Consolidated Financial Statements
(Dollar amounts in thousands)
17. | Commitments and Contingencies |
Loan Commitments – Legally binding commitments to extend credit are agreements to lend to a customer as long as there is no violation of any condition established in the contract. Commitments generally have fixed expiration dates or other termination clauses and may require payment of a fee. Since many commitments may expire without being drawn upon, the total commitment amounts do not necessarily represent future cash requirements. In the normal course of business, there are various outstanding commitments to extend credit that are not reflected in the consolidated financial statements. At June 30, 2014 and June 30, 2013, respectively, loan commitments (excluding $27,086 and $27,013 of undisbursed portions of construction loans) totaled $28,360 and $27,147 of which $3,620 and $3,083 were variable rate commitments and $24,740 and $24,064 were fixed rate commitments. The fixed rate loans had interest rates ranging from 1.85% to 10.51% at June 30, 2014 and 2.50% to 9.25% at June 30, 2013, and terms ranging from 3 to 30 years. Pre-approved but unused lines of credit (principally second mortgage home equity loans and overdraft protection loans) totaled $167,630 and $151,611 at June 30, 2014 and 2013, respectively. These amounts represent the Company's exposure to credit risk, and in the opinion of management have no more than the normal lending risk that the Company commits to its borrowers. The Company has freestanding derivative instruments consisting of commitments to originate fixed rate conforming loans and commitments to sell fixed rate conforming loans. The fair value of these commitments was not material at June 30, 2014 or June 30, 2013.
The Company grants construction and permanent loans collateralized primarily by residential and commercial real estate to customers throughout its primary market area. In addition, the Company grants municipal leases to customers throughout North and South Carolina. The Company's loan portfolio can be affected by the general economic conditions within these market areas. Management believes that the Company has no concentration of credit in the loan portfolio.
Restrictions on Cash – The Bank is required by regulation to maintain a varying cash reserve balance with the Federal Reserve System. The daily average calculated cash reserve required as of June 30, 2014 and June 30, 2013 was $8,087, and $1,284, respectively, which was satisfied by vault cash and balances held at the Federal Reserve.
Guarantees – Standby letters of credit obligate the Company to meet certain financial obligations of its customers, if, under the contractual terms of the agreement, the customers are unable to do so. The financial standby letters of credit issued by the Company are irrevocable and payment is only guaranteed upon the borrower's failure to perform its obligations to the beneficiary. Total commitments under standby letters of credit as of June 30, 2014 and June 30, 2013 were $483 and $66. There was no liability recorded for these letters of credit at June 30, 2014 or June 30, 2013.
Litigation – The Company is involved in several litigation matters in the ordinary course of business. One matter, originally filed in March 2012, involves claims of $12.5 million in compensatory damages and a request for additional punitive treble damages resulting from the purported failure of the Company and a third party brokerage firm to discover a Ponzi scheme conducted by a customer holding accounts at each entity. The Company believes that the lawsuit is without merit and intends to defend itself vigorously. Management, after review with its legal counsel, is of the opinion that this litigation should not have a material effect on the Company's financial position or results of operations, although new developments could result in management modifying its assessment. There can be no assurance that the Company will successfully defend or resolve this litigation matter.
The Company is also subject to a variety of other legal matters that have arisen in the ordinary course of our business. In the current economic environment, litigation has increased significantly, primarily as a result of defaulted borrowers asserting claims to defeat or delay foreclosure proceedings. There can be no assurance that loan workouts and other activities will not expose the Company to additional legal actions, including lender liability or environmental claims. Therefore, the Company may be exposed to substantial liabilities, which could adversely affect its results of operations and financial condition. Moreover, the expenses of legal proceedings will adversely affect its results of operations until they are resolved.
18. | Capital |
As a savings and loan holding company regulated by the Federal Reserve Board, the Company is not currently subject to any separate regulatory capital requirements, however, the Bank must maintain various minimum capital ratios established by banking regulators to be categorized as well capitalized. Failure of the Bank to maintain these minimum capital ratios may be deemed to constitute an unsafe and unsound banking practice and could subject the Bank to regulatory action. As of June 30, 2014, the most recent notification from the OCC categorized the Bank as well capitalized under the regulatory framework for prompt corrective action. There are no conditions or events since that notification that management believes have changed the institution's category.
117
HOMETRUST BANCSHARES, INC. AND SUBSIDIARY
Notes to Consolidated Financial Statements
(Dollar amounts in thousands)
The Bank's actual and required minimum capital amounts and ratios as of June 30, 2014 and 2013 are presented below:
Actual | For Capital Adequacy Purposes | To Be Well Capitalized Under Prompt Corrective Action Provisions | ||||||||||||||||||||||
Amount | Ratio | Amount | Ratio | Amount | Ratio | |||||||||||||||||||
As of June 30, 2014: | ||||||||||||||||||||||||
Tier I Capital (to Total Adjusted Assets) | $ | 264,041 | 13.37 | % | $ | 78,985 | 4.00 | % | $ | 98,719 | 5.00 | % | ||||||||||||
Tier I Capital (to Risk-weighted Assets) | $ | 264,041 | 18.29 | % | $ | - | - | % | $ | 86,625 | 6.00 | % | ||||||||||||
Total Risk-based Capital (to Risk- weighted Assets) | $ | 282,160 | 19.54 | % | $ | 115,501 | 8.00 | % | $ | 144,376 | 10.00 | % | ||||||||||||
As of June 30, 2013: | ||||||||||||||||||||||||
Tier I Capital (to Total Adjusted Assets) | $ | 228,454 | 15.25 | % | $ | 59,920 | 4.00 | % | $ | 74,901 | 5.00 | % | ||||||||||||
Tier I Capital (to Risk-weighted Assets) | $ | 228,454 | 21.89 | % | $ | - | - | % | $ | 62,620 | 6.00 | % | ||||||||||||
Total Risk-based Capital (to Risk- weighted Assets) | $ | 241,736 | 23.16 | % | $ | 83,493 | 8.00 | % | $ | 104,367 | 10.00 | % | ||||||||||||
A reconciliation of the Bank's total equity capital under US GAAP and regulatory capital amounts follows:
June 30, | ||||||||
2014 | 2013 | |||||||
Total equity capital under US GAAP | $ | 337,561 | $ | 276,669 | ||||
Accumulated other comprehensive (income) loss, net of tax | (245 | ) | 29 | |||||
Investment in nonincludable subsidiary | (1,065 | ) | (696 | ) | ||||
Disallowed deferred tax assets | (58,381 | ) | (47,428 | ) | ||||
Disallowed goodwill and other disallowed intangible assets | (13,829 | ) | (120 | ) | ||||
Tier I Capital | 264,041 | 228,454 | ||||||
Allowable portion of allowance for loan losses | 18,119 | 13,282 | ||||||
Total Risk-based Capital | $ | 282,160 | $ | 241,736 | ||||
19. | Parent Company Financial Information |
The Company's principal asset is its investment in its subsidiary, the Bank. The following presents condensed financial information of the Company as of June 30, 2014 and 2013. Since the Company became the holding company of the Bank in July 2012, prior years are not applicable.
Condensed balance sheet
June 30, | June 30, | |||||||
2014 | 2013 | |||||||
Assets: | ||||||||
Cash and equivalents | $ | 3,496 | $ | 43,045 | ||||
Certificates of deposit in other banks | 10,196 | 10,197 | ||||||
Total loans | 15,523 | 23,947 | ||||||
Allowance for loan losses | (199 | ) | (224 | ) | ||||
Net loans | 15,324 | 23,723 | ||||||
Real estate owned | 1,004 | 3,529 | ||||||
Investment in bank subsidiary | 337,561 | 276,668 | ||||||
ESOP loan receivable | 9,722 | 10,152 | ||||||
Other assets | 910 | 602 | ||||||
Total Assets | $ | 378,213 | $ | 367,917 | ||||
Liabilities and Stockholders' Equity: | ||||||||
Other liabilities | 1,062 | 402 | ||||||
Stockholders' Equity | 377,151 | 367,515 | ||||||
Total Liabilities and Stockholders' Equity | $ | 378,213 | $ | 367,917 | ||||
118
HOMETRUST BANCSHARES, INC. AND SUBSIDIARY
Notes to Consolidated Financial Statements
(Dollar amounts in thousands)
Condensed statement of income
June 30, | June 30, | |||||||
2014 | 2013 | |||||||
Income: | ||||||||
Interest income | $ | 1,418 | $ | 1,615 | ||||
Other income | 9 | 8 | ||||||
Equity earnings in Bank subsidiary | 9,444 | 10,123 | ||||||
Total income | 10,871 | 11,746 | ||||||
Expense: | ||||||||
Management fee expense | 351 | 354 | ||||||
REO expense | 237 | 195 | ||||||
Loss on sale and impairment of real estate owned | 118 | 638 | ||||||
Provision (Recovery) for loan losses | (357 | ) | 1,300 | |||||
Other expense | 137 | 47 | ||||||
Total expense | 486 | 2,534 | ||||||
Income Before Income Taxes | 10,385 | 9,212 | ||||||
Income Tax Expense | 43 | 159 | ||||||
Net Income | $ | 10,342 | $ | 9,053 | ||||
119
HOMETRUST BANCSHARES, INC. AND SUBSIDIARY
Notes to Consolidated Financial Statements
(Dollar amounts in thousands)
Condensed statement of cash flows
June 30, | June 30, | |||||||
2014 | 2013 | |||||||
Operating Activities: | ||||||||
Net income | $ | 10,342 | $ | 9,053 | ||||
Adjustments to reconcile net income to net cash provided by operating activities: | ||||||||
Provision for (recovery of) loan losses | (357 | ) | 1,300 | |||||
Loss on sale and impairment of real estate owned | 118 | 638 | ||||||
Increase in accrued interest receivable and other assets | (308 | ) | (602 | ) | ||||
Equity in undistributed income of Bank | (9,444 | ) | (10,123 | ) | ||||
ESOP compensation expense | 844 | 749 | ||||||
Restricted stock and stock option expense | 2,623 | 1,113 | ||||||
Increase in other liabilities | 660 | 402 | ||||||
Net cash provided by operating activities | 4,478 | 2,530 | ||||||
Investing Activities: | ||||||||
Purchase of certificates of deposit in other banks | (248 | ) | (10,446 | ) | ||||
Maturities of certificates of deposit in other banks | 249 | 249 | ||||||
Purchase of loans from Bank subsidiary | - | (32,332 | ) | |||||
Repayment of loans | 6,356 | 7,149 | ||||||
Purchase of real estate owned from Bank subsidiary | - | (5,892 | ) | |||||
Capital improvements to real estate owned | (4 | ) | (240 | ) | ||||
Increase in investment in Bank subsidiary | (51,883 | ) | (104,851 | ) | ||||
Dividend from subsidiary | 19,110 | - | ||||||
ESOP loan | - | (10,580 | ) | |||||
ESOP principal payments received | 430 | 428 | ||||||
Proceeds from sale of real estate owned | 4,811 | 2,125 | ||||||
Purchase of BankGreenville Financial | (1,475 | ) | - | |||||
Purchase of Jefferson Bancshares, Inc | (6,926 | ) | - | |||||
Net cash used in investing activities | (29,580 | ) | (154,390 | ) | ||||
Financing Activities: | ||||||||
Repayment of subordinated debentures | (10,000 | ) | ||||||
Proceeds from stock conversion | - | 208,204 | ||||||
Common stock repurchased | (29,686 | ) | (13,299 | ) | ||||
Stock issued for purchase of Jefferson Bancshares, Inc. | 25,239 | |||||||
Net cash provided by (used in) financing activities | (14,447 | ) | 194,905 | |||||
Net Increase (Decrease) in Cash and Cash Equivalents | (39,549 | ) | 43,045 | |||||
Cash and Cash Equivalents at Beginning of Period | 43,045 | - | ||||||
Cash and Cash Equivalents at End of Period | $ | 3,496 | $ | 43,045 | ||||
20. | Fair Value of Financial Instruments |
The Company utilizes fair value measurements to record fair value adjustments to certain assets and to determine fair value disclosures. Securities available for sale are recorded at fair value on a recurring basis. Additionally, from time to time, the Company may be required to record at fair value other assets on a nonrecurring basis, such as impaired loans. These nonrecurring fair value adjustments typically involve application of lower of cost or market accounting or write-downs of individual assets.
Fair Value Hierarchy
The Company groups assets at fair value in three levels, based on the markets in which the assets are traded and the reliability of the assumptions used to determine fair value. These levels are:
Level 1: | Valuation is based upon quoted prices for identical instruments traded in active markets. |
Level 2: | Valuation is based upon quoted prices for similar instruments in active markets, quoted prices for identical or similar instruments in markets that are not active, and model-based valuation techniques for which all significant assumptions are observable in the market. |
120
HOMETRUST BANCSHARES, INC. AND SUBSIDIARY
Notes to Consolidated Financial Statements
(Dollar amounts in thousands)
Level 3: | Valuation is generated from model-based techniques that use at least one significant assumption not observable in the market. These unobservable assumptions reflect estimates of assumptions that market participants would use in pricing the asset. Valuation techniques include use of option pricing models, discounted cash flow models and similar techniques. |
Following is a description of valuation methodologies used for assets recorded at fair value. The Company does not have any liabilities recorded at fair value.
Investment Securities Available for Sale
Securities available for sale are valued on a recurring basis at quoted market prices where available. If quoted market prices are not available, fair values are based on quoted prices of comparable securities. Level 1 securities include those traded on an active exchange, such as the New York Stock Exchange or U.S. Treasury securities that are traded by dealers or brokers in active over-the-counter markets and money market funds. Level 2 securities include mortgage-backed securities and debentures issued by government sponsored enterprises, municipal bonds, and corporate debt securities.
Loans
The Company does not record loans at fair value on a recurring basis. From time to time, however, a loan is considered impaired and an allowance for loan losses is established. Loans for which it is probable that payment of interest and principal will not be made in accordance with the contractual terms of the loan agreement are considered impaired. Once a loan is identified as individually impaired, the fair value is estimated using one of several methods, including collateral value, market value of similar debt, enterprise value, liquidation value and discounted cash flows. The Company reviews all impaired loans each quarter to determine if an allowance is necessary. Those impaired loans not requiring an allowance represent loans for which the fair value of the expected repayments or collateral exceed the recorded investments in such loans.
At June 30, 2014 and June 30, 2013, most of the total impaired loans were evaluated based on the fair value of the collateral. For these collateral dependent impaired loans, the Company obtains updated appraisals at least annually. These appraisals are reviewed for appropriateness and then discounted for estimated closing costs to determine if an allowance is necessary. As part of the quarterly review of impaired loans, the Company reviews these appraisals to determine if any additional discounts to the fair value are necessary. If a current appraisal is not obtained, the Company determines whether a discount is needed to the value from the original appraisal based on the decline in value of similar properties with recent appraisals. Impaired loans where a charge-off has occurred or an allowance is established during the period being reported require classification in the fair value hierarchy. The Company records all impaired loans with an allowance as nonrecurring Level 3.
Real Estate Owned
REO is considered held for sale and is adjusted to fair value less estimated selling costs upon transfer of the loan to foreclosed assets. Fair value is based upon independent market prices, appraised value of the collateral or management's estimation of the value of the collateral. The Company considers all REO carried at fair value as nonrecurring Level 3.
The following table presents financial assets measured at fair value on a recurring basis at the dates indicated:
June 30, 2014 | ||||||||||||||||
Description | Total | Level 1 | Level 2 | Level 3 | ||||||||||||
U.S Government Agencies | $ | 38,093 | $ | - | $ | 38,093 | $ | - | ||||||||
Residential Mortgage-backed Securities of U.S. Government Agencies and Government sponsored Enterprises | 111,411 | - | 111,411 | - | ||||||||||||
Municipal Bonds | 16,220 | - | 16,220 | - | ||||||||||||
Corporate Bonds | 3,025 | - | 3,025 | - | ||||||||||||
Total | $ | 168,749 | $ | - | $ | 168,749 | $ | - | ||||||||
June 30, 2013 | ||||||||||||||||
Description | Total | Level 1 | Level 2 | Level 3 | ||||||||||||
U.S Government Agencies | $ | 6,002 | $ | - | $ | 6,002 | $ | - | ||||||||
Residential Mortgage-backed Securities of U.S. Government Agencies and Government sponsored Enterprises | 18,748 | - | 18,748 | - | ||||||||||||
Total | $ | 24,750 | $ | - | $ | 24,750 | $ | - | ||||||||
121
HOMETRUST BANCSHARES, INC. AND SUBSIDIARY
Notes to Consolidated Financial Statements
(Dollar amounts in thousands)
The following table presents financial assets measured at fair value on a non-recurring basis during the periods indicated:
Year Ended June 30, 2014 | ||||||||||||||||
Description | Total | Level 1 | Level 2 | Level 3 | ||||||||||||
Impaired loans | $ | 3,686 | $ | - | $ | - | $ | 3,686 | ||||||||
Real Estate Owned | 9,185 | - | - | 9,185 | ||||||||||||
Total | $ | 12,871 | $ | - | $ | - | $ | 12,871 | ||||||||
Year Ended June 30, 2013 | ||||||||||||||||
Description | Total | Level 1 | Level 2 | Level 3 | ||||||||||||
Impaired loans | $ | 12,106 | $ | - | $ | - | $ | 12,106 | ||||||||
Real Estate Owned | 2,403 | - | - | 2,403 | ||||||||||||
Total | $ | 14,509 | $ | - | $ | - | $ | 14,509 | ||||||||
Quantitative information about Level 3 fair value measurements during the period ended June 30, 2014 is shown in the table below:
Fair Value | ||||||||||||||
at June 30, | Valuation | Unobservable | Weighted | |||||||||||
2014 | Techniques | Input | Range | Average | ||||||||||
Nonrecurring measurements: | ||||||||||||||
Impaired loans, net | $ | 3,686 | Discounted Appraisals | Collateral discounts | 3% - 66 | % | 18 | % | ||||||
Real estate owned | 9,185 | Discounted Appraisals | Collateral discounts | 10% - 27 | % | 15 | % | |||||||
The stated carrying value and estimated fair value amounts of financial instruments as of June 30, 2014 and June 30, 2013, are summarized below:
June 30, 2014 | ||||||||||||||||||||
Carrying | Fair | |||||||||||||||||||
Value | Value | Level 1 | Level 2 | Level 3 | ||||||||||||||||
Cash and interest-bearing deposits | $ | 45,830 | $ | 45,830 | $ | 45,830 | $ | - | $ | - | ||||||||||
Certificates of deposit in other banks | 163,780 | 163,780 | - | 163,780 | - | |||||||||||||||
Securities available for sale | 168,749 | 168,749 | - | 168,749 | - | |||||||||||||||
Loans, net | 1,473,099 | 1,381,438 | - | - | 1,381,438 | |||||||||||||||
Loans held for sale | 2,537 | 2,578 | - | - | 2,578 | |||||||||||||||
FHLB stock | 3,697 | 3,697 | 3,697 | - | - | |||||||||||||||
Accrued interest receivable | 6,787 | 6,787 | - | 736 | 6,051 | |||||||||||||||
Noninterest-bearing and NOW deposits | 418,671 | 418,671 | - | 418,671 | - | |||||||||||||||
Money market accounts | 354,247 | 354,247 | - | 354,247 | - | |||||||||||||||
Savings accounts | 175,974 | 175,974 | - | 175,974 | - | |||||||||||||||
Certificates of deposit | 634,154 | 620,196 | - | 620,196 | - | |||||||||||||||
Other borrowings | 50,000 | 50,000 | - | 50,000 | ||||||||||||||||
Accrued interest payable | 244 | 244 | - | 244 | - | |||||||||||||||
June 30, 2013 | ||||||||||||||||||||
Carrying | Fair | |||||||||||||||||||
Value | Value | Level 1 | Level 2 | Level 3 | ||||||||||||||||
Cash and interest-bearing deposits | $ | 125,713 | $ | 125,713 | $ | 125,713 | $ | - | $ | - | ||||||||||
Certificates of deposit in other banks | 136,617 | 136,617 | - | 136,617 | - | |||||||||||||||
Securities available for sale | 24,750 | 24,750 | - | 24,750 | - | |||||||||||||||
Loans, net | 1,132,110 | 1,064,954 | - | - | 1,064,954 | |||||||||||||||
Loans held for sale | 10,770 | 10,942 | - | - | 10,942 | |||||||||||||||
FHLB stock | 1,854 | 1,854 | 1,854 | - | - | |||||||||||||||
Accrued interest receivable | 5,549 | 5,549 | - | 157 | 5,392 | |||||||||||||||
Noninterest-bearing and NOW deposits | 256,487 | 256,487 | - | 256,487 | - | |||||||||||||||
Money market accounts | 275,718 | 275,718 | - | 275,718 | - | |||||||||||||||
Savings accounts | 82,158 | 82,158 | - | 82,158 | - | |||||||||||||||
Certificates of deposit | 540,387 | 545,716 | - | 545,716 | - | |||||||||||||||
Accrued interest payable | 84 | 84 | - | 84 | - | |||||||||||||||
122
HOMETRUST BANCSHARES, INC. AND SUBSIDIARY
Notes to Consolidated Financial Statements
(Dollar amounts in thousands)
The Company had off-balance sheet financial commitments, which include approximately $223,076 and $205,771 of commitments to originate loans, undisbursed portions of interim construction loans, and unused lines of credit at June 30, 2014 and June 30, 2013 (see Note 5). Since these commitments are based on current rates, the carrying amount approximates the fair value.
Estimated fair values were determined using the following methods and assumptions:
Cash and interest-bearing deposits – The stated amounts approximate fair values as maturities are less than 90 days.
Certificates of deposit in other banks – The stated amounts approximate fair values.
Securities available for sale and investment securities – Fair values are based on quoted market prices where available. If quoted market prices are not available, fair values are based on quoted market prices of comparable instruments.
Loans, net – Fair values for loans are estimated by segregating the portfolio by type of loan and discounting scheduled cash flows using current market interest rates for loans with similar terms and credit quality. A prepayment assumption is used as an estimate of the portion of loans that will be repaid prior to their scheduled maturity. Both the carrying value and estimated fair value amounts are shown net of the allowance for loan losses and purchase discounts.
Loans held for sale - The fair value of loans held for sale is determined by outstanding commitments from investors on a "best efforts" basis or current investor yield requirements, calculated on the aggregate loan basis.
Federal Home Loan Bank Stock – No ready market exists for this stock and it has no quoted market value. However, redemption of this stock has historically been at par value. Accordingly, cost is deemed to be a reasonable estimate of fair value.
Deposits – Fair values for demand deposits, money market accounts, and savings accounts are the amounts payable on demand as of June 30, 2014 and June 30, 2013. The fair value of certificates of deposit is estimated by discounting the contractual cash flows using current market interest rates for accounts with similar maturities.
Other borrowings – The fair value of advances from the FHLB is estimated based on current rates for borrowings with similar terms.
Accrued interest receivable and payable – The stated amounts of accrued interest receivable and payable approximate the fair value.
Limitations – Fair value estimates are made at a specific point in time, based on relevant market information and information about the financial instrument. These estimates do not reflect any premium or discount that could result from offering for sale at one time the Company's entire holdings of a particular financial instrument. Because no market exists for a significant portion of the Company's financial instruments, fair value estimates are based on judgments regarding future expected loss experience, current economic conditions, risk characteristics of various financial instruments, and other factors. These estimates are subjective in nature and involve uncertainties and matters of significant judgment and therefore cannot be determined with precision. Changes in assumptions could significantly affect the estimates.
Fair value estimates are based on existing on-and-off balance sheet financial instruments without attempting to estimate the value of anticipated future business and the value of assets and liabilities that are not considered financial instruments. For example, a significant asset not considered a financial asset is premises and equipment. In addition, tax ramifications related to the realization of the unrealized gains and losses can have a significant effect on fair value estimates and have not been considered in any of the estimates.
123
HOMETRUST BANCSHARES, INC. AND SUBSIDIARY
Notes to Consolidated Financial Statements
(Dollar amounts in thousands)
21. | Unaudited Interim Financial Information |
The unaudited statements of income for each of the quarters during the fiscal years ended June 30, 2014 and 2013 are summarized below:
Three months ended | ||||||||||||||||
June 30, 2014 | March 31, 2014 | December 31, 2013 | September 30, 2013 | |||||||||||||
Interest and dividend income | $ | 15,781 | $ | 14,392 | $ | 15,265 | $ | 14,843 | ||||||||
Interest expense | 1,255 | 1,248 | 1,383 | 1,546 | ||||||||||||
Net interest income | 14,526 | 13,144 | 13,882 | 13,297 | ||||||||||||
Provision for loan losses | (1,500 | ) | (1,800 | ) | (700 | ) | (2,300 | ) | ||||||||
Net interest income after provision for loan losses | 16,026 | 14,944 | 14,582 | 15,597 | ||||||||||||
Noninterest income | 2,196 | 2,025 | 2,246 | 2,271 | ||||||||||||
Noninterest expense | 16,415 | 13,396 | 13,346 | 11,875 | ||||||||||||
Net income before provision for income taxes | 1,807 | 3,573 | 3,482 | 5,993 | ||||||||||||
Income tax expense | 274 | 967 | 606 | 2,666 | ||||||||||||
Net income | $ | 1,533 | $ | 2,606 | $ | 2,876 | $ | 3,327 | ||||||||
Net income per common share: | ||||||||||||||||
Basic | 0.08 | 0.14 | 0.15 | 0.17 | ||||||||||||
Diluted | 0.08 | 0.14 | 0.15 | 0.17 | ||||||||||||
Three months ended | ||||||||||||||||
June 30, 2013 | March 31, 2013 | December 31, 2012 | September 30, 2012 | |||||||||||||
Interest and dividend income | $ | 14,498 | $ | 14,683 | $ | 15,481 | $ | 15,728 | ||||||||
Interest expense | 1,495 | 1,647 | 1,904 | 2,209 | ||||||||||||
Net interest income | 13,003 | 13,036 | 13,577 | 13,519 | ||||||||||||
Provision for loan losses | (1,200 | ) | 500 | 300 | 1,500 | |||||||||||
Net interest income after provision for loan losses | 14,203 | 12,536 | 13,277 | 12,019 | ||||||||||||
Noninterest income | 2,563 | 2,627 | 2,853 | 2,343 | ||||||||||||
Noninterest expense | 12,561 | 12,058 | 13,381 | 13,393 | ||||||||||||
Net income before provision for income taxes | 4,205 | 3,105 | 2,749 | 969 | ||||||||||||
Income tax expense (benefit) | 1,187 | 490 | 481 | (183 | ) | |||||||||||
Net income | $ | 3,018 | $ | 2,615 | $ | 2,268 | $ | 1,152 | ||||||||
Net income per common share: | ||||||||||||||||
Basic | 0.15 | 0.13 | 0.11 | 0.06 | ||||||||||||
Diluted | 0.15 | 0.13 | 0.11 | 0.06 | ||||||||||||
22. | Subsequent Events |
On July 31, 2014, the Bank completed its acquisition of Bank of Commerce of Charlotte, NC in accordance with the terms of the Agreement and Plan of Share Exchange ("Agreement") between the Bank and Bank of Commerce, dated March 3, 2014. Under the terms of the Agreement, Bank of Commerce shareholders received $6.25 per share in cash consideration, representing approximately $10.1 million of aggregate deal consideration. In addition, all $3.2 million of Bank of Commerce's preferred stock was redeemed. Bank of Commerce had total assets of $122.8 million, total deposits of $92.8 million, and stockholders' equity of $12.3 million at June 30, 2014.
On August 13, 2014, the Bank received approval from the Office of the Comptroller of the Currency to purchase the branch banking operations of ten locations in Virginia and North Carolina from Bank of America Corporation. Six of the branches are located in Roanoke Valley, two in Danville, one in Martinsville, Virginia, and one in Eden, North Carolina. The acquisition will add approximately $504 million of deposits. In addition to the branches, the Bank will acquire a small amount of loans as part of the transaction. The Bank expects the purchase to be effective Monday, November 17, 2014, following satisfaction of customary closing conditions.
124
HOMETRUST BANCSHARES, INC. AND SUBSIDIARY
Notes to Consolidated Financial Statements
(Dollar amounts in thousands)
On August 25, 2014, the Company announced that the Bank converted from a federal savings bank charter to a national bank charter and the Company is now a bank holding company. The Bank received approval for the charter change in July 2014 from the Office of the Comptroller of the Currency.
125
Item 9. Changes In and Disagreements With Accountants on Accounting and Financial Disclosure
None.
Item 9A. Controls and Procedures
(a) Evaluation of Disclosure Controls and Procedures : An evaluation of the Company's disclosure controls and procedures (as defined in Section 13a-15(e) of the Securities Exchange Act of 1934 (the "Act")) was carried out under the supervision and with the participation of the Company's Chief Executive Officer, Chief Financial Officer and several other members of the Company's senior management as of the end of the period covered by this report. The Company's Chief Executive Officer and Chief Financial Officer concluded that the Company's disclosure controls and procedures as currently in effect are effective in ensuring that the information required to be disclosed by the Company in the reports it files or submits under the Act is (i) accumulated and communicated to the Company's management (including the Chief Executive Officer and Chief Financial Officer) in a timely manner, and (ii) recorded, processed, summarized and reported within the time periods specified in the SEC's rules and forms.
(b) Report of Management on Internal Control over Financial Reporting : The management of the Company is responsible for establishing and maintaining adequate internal control over financial reporting. The internal control process has been designed under our supervision to provide reasonable assurance regarding the reliability of financial reporting and the preparation of the Company's financial statements for external reporting purposes in accordance with accounting principles generally accepted in the United States of America.
Management conducted an assessment of the effectiveness of the Company's internal control over financial reporting as of June 30, 2014, utilizing the framework established in Internal Control – Integrated Framework issued by the Committee of Sponsoring Organizations of the Treadway Commission (COSO) (1992 version). Based on this assessment, management has determined that the Company's internal control over financial reporting as of June 30, 2014 was effective.
Our internal control over financial reporting includes policies and procedures that pertain to the maintenance of records that accurately and fairly reflect, in reasonable detail, transactions and dispositions of assets; and provide reasonable assurances that: (1) transactions are recorded as necessary to permit preparation of financial statements in accordance with accounting principles generally accepted in the United States; (2) receipts and expenditures are being made only in accordance with authorizations of management and the directors of the Company; and (3) unauthorized acquisition, use, or disposition of the Company's assets that could have a material effect on the Company's financial statements are prevented or timely detected.
All internal control systems, no matter how well designed, have inherent limitations. Therefore, even those systems determined to be effective can provide only reasonable assurance with respect to financial statement preparation and presentation. Also, projections of any evaluation of effectiveness to future periods are subject to the risk that controls may become inadequate because of changes in conditions, or that the degree of compliance with the policies or procedures may deteriorate.
This annual report does not include an attestation report of the Company's independent registered public accounting firm regarding internal control over financial reporting. As an emerging growth company, management's report was not subject to attestation by the Company's independent registered public accounting firm in accordance with the JOBS Act of 2012.
(c) Changes in Internal Controls : There have been no changes in the Company's internal control over financial reporting during the quarter ended June 30, 2014 that have materially affected, or are reasonably likely to materially affect, the Company's internal control over financial reporting.
The Company intends to continually review and evaluate the design and effectiveness of its disclosure controls and procedures and to improve its controls and procedures over time and to correct any deficiencies that it may discover in the future. The goal is to ensure that senior management has timely access to all material financial and non-financial information concerning the Company's business. While the Company believes the present design of its disclosure controls and procedures is effective to achieve its goal, future events affecting its business may
126
cause the Company to modify its disclosure controls and procedures. The Company does not expect that its disclosure controls and procedures and internal control over financial reporting will prevent every error or instance of fraud. A control procedure, no matter how well conceived and operated, can provide only reasonable, not absolute, assurance that the objectives of the control procedure are met. Because of the inherent limitations in all control procedures, no evaluation of controls can provide absolute assurance that all control issues and instances of fraud, if any, within the Company have been detected. These inherent limitations include the realities that judgments in decision-making can be faulty, and that breakdowns in controls or procedures can occur because of simple error or mistake. Additionally, controls can be circumvented by the individual acts of some persons, by collusion of two or more people, or by management override of the control. The design of any control procedure is based in part upon certain assumptions about the likelihood of future events, and there can be no assurance that any design will succeed in achieving its stated goals under all potential future conditions; over time, controls become inadequate because of changes in conditions, or the degree of compliance with the policies or procedures may deteriorate. Because of the inherent limitations in a cost-effective control procedure, misstatements due to error or fraud may occur and not be detected.
Item 9B. Other Information
None.
127
PART III
Item 10. | Directors, Executive Officers and Corporate Governance |
Directors and Executive Officers . The information concerning our directors required by this item is incorporated herein by reference from our definitive proxy statement for our Annual Meeting of Shareholders being held on November 24, 2014, a copy of which will be filed with the Securities and Exchange Commission not later than 120 days after the end of our fiscal year. Information required by this item regarding the audit committee of the Company's Board of Directors, including information regarding the audit committee financial expert serving on the audit committee, is incorporated herein by reference from our definitive proxy statement for our Annual Meeting of Shareholders being held on November 24, 2014, a copy of which will be filed with the Securities and Exchange Commission not later than 120 days after the end of our fiscal year. Information about our executive officers is contained under the caption "Executive Officers" in Part I of this Form 10-K, and is incorporated herein by this reference.
Section 16(a) Beneficial Ownership Reporting Compliance . The information concerning compliance with the reporting requirements of Section 16(a) of the Securities Exchange Act of 1934 by our directors, officers and ten percent shareholders required by this item is incorporated herein by reference from our definitive proxy statement for our Annual Meeting of Shareholders being held on November 24, 2014, a copy of which will be filed with the Securities and Exchange Commission not later than 120 days after the end of our fiscal year.
Code of Ethics. We have adopted a code of ethics that applies to our principal executive officer, principal financial officer, principal accounting officer, and persons performing similar functions, and to all of our other employees and our directors. A copy of our code of ethics is available on our Internet website address, http://www.hometrustbancshares.com.
Item 11. | Executive Compensation |
The information concerning compensation required by this item is incorporated herein by reference from our definitive proxy statement for our Annual Meeting of Shareholders being held on November 24, 2014, a copy of which will be filed with the Securities and Exchange Commission not later than 120 days after the end of our fiscal year.
Item 12. | Security Ownership of Certain Beneficial Owners and Management and Related Shareholder Matters |
The information concerning security ownership of certain beneficial owners and management and our equity incentive plan required by this item is incorporated herein by reference from our definitive proxy statement for our Annual Meeting of Shareholders being held on November 24, 2014, a copy of which will be filed with the Securities and Exchange Commission not later than 120 days after the end of our fiscal year.
Item 13. | Certain Relationships and Related Transactions, and Director Independence |
The information concerning certain relationships and related transactions and director independence required by this item is incorporated herein by reference from our definitive proxy statement for our Annual Meeting of Shareholders being held on November 24, 2014, a copy of which will be filed with the Securities and Exchange Commission not later than 120 days after the end of our fiscal year.
Item 14. | Principal Accountant Fees and Services |
The information concerning principal accountant fees and services is incorporated herein by reference from our definitive proxy statement for our Annual Meeting of Shareholders being held on November 24, 2014, a copy of which will be filed with the Securities and Exchange Commission not later than 120 days after the end of our fiscal year.
128
PART IV
Item 15. Exhibits and Financial Statement Schedules
(a)(1) | Financial Statements: See Part II--Item 8. Financial Statements and Supplementary Data. |
(a)(2) | Financial Statement Schedules: All financial statement schedules have been omitted as the information is not required under the related instructions or is not applicable. |
(a)(3) | Exhibits: See Exhibit Index. |
(b) | Exhibits: See Exhibit Index. |
129
SIGNATURES
Pursuant to the requirements of Section 13 or 15(d) of the Securities Exchange Act of 1934, the Registrant has duly caused this report to be signed on its behalf by the undersigned, thereunto duly authorized.
| HOMETRUST BANCSHARES, INC. | ||
Date: September 15, 2014 | By: | /s/ Dana L. Stonestreet |
Dana L. Stonestreet | ||
Chairman of the Board, | ||
President, and Chief Executive Officer | ||
Pursuant to the requirements of the Securities Exchange Act of 1934, this report has been signed below by the following persons on behalf of the Registrant and in the capacities and on the dates indicated.
Signature | Title | Date | |
/s/ Dana L. Stonestreet | Chairman of the Board, President and Chief Executive Officer | September 15, 2014 | |
Dana L. Stonestreet | (Principal Executive Officer) | ||
/s/ Tony J. VunCannon | Senior Vice President, Chief Financial Officer and Treasurer | September 15, 2014 | |
Tony J. VunCannon | (Principal Financial and Accounting Officer) | ||
/s/ H. Stanford Allen | Director | September 15, 2014 | |
H. Stanford Allen |
| ||
/s/ Sidney A. Biesecker | Director | September 15, 2014 | |
Sidney A. Biesecker |
| ||
/s/ Robert G. Dinsmore, Jr. | Director | September 15, 2014 | |
Robert G. Dinsmore, Jr. | |||
/s/ William T. Flynt | Director | September 15, 2014 | |
William T. Flynt | |||
/s/ J. Steven Goforth | Director | September 15, 2014 | |
J. Steven Goforth | |||
/s/ Craig C. Koontz | Director | September 15, 2014 | |
Craig C. Koontz | |||
/s/ Larry S. McDevitt | Director | September 15, 2014 | |
Larry S. McDevitt | |||
/s/ F.K. McFarland, III | Director | September 15, 2014 | |
F.K. McFarland, III | |||
/s/ Peggy C. Melville | Director | September 15, 2014 | |
Peggy C. Melville | |||
/s/ Robert E. Shepherd, Sr. | Director | September 15, 2014 | |
Robert E. Shepherd, Sr. | |||
/s/ Anderson L. Smith | Director | September 15, 2014 | |
Anderson L. Smith |
130
EXHIBIT INDEX
Regulation S-K Exhibit Number | Document | Reference to Prior Filing or Exhibit Number Attached Hereto |
2.1 | Purchase and Assumption Agreement, dated as of June 9, 2014, between Bank of America, National Association and HomeTrust Bank | (a) |
2.2 | Agreement and Plan of Merger, dated as of January 22, 2014, by and between HomeTrust Bancshares, Inc. and Jefferson Bancshares, Inc. | (b) |
3.1 | Charter of HomeTrust Bancshares, Inc. | (c) |
3.2 | Articles Supplementary to the Charter of HomeTrust Bancshares, Inc. for HomeTrust Bancshares, Inc.'s Junior Participating Preferred Stock, Series A | (d) |
3.3 | Bylaws of HomeTrust Bancshares, Inc. | (e) |
4.1 | Tax Benefits Preservation Plan, dated as of September 25, 2012, between HomeTrust Bancshares, Inc. and Registrar and Transfer Company, as Rights Agent | (d) |
10.1 | Employment Agreement entered into between HomeTrust Bancshares, Inc. and F. Edward Broadwell, Jr. | (c) |
10.2 | Amended and Restated Employment Agreement entered into between HomeTrust Bancshares, Inc. and Dana L. Stonestreet | (f) |
10.3 | Employment Agreement entered into between HomeTrust Bancshares, Inc. and each of Tony J. VunCannon, Howard L. Sellinger and Charles I. Abbitt, Jr. | (c) |
10.4 | Employment Agreement entered into between HomeTrust Bancshares, Inc. and C. Hunter Westbrook | (g) |
10.5 | Employment Agreement between HomeTrust Bank and Sidney A. Biesecker | (c) |
10.6 | Employment Agreement between HomeTrust Bank and Stan Allen | (c) |
10.7 | HomeTrust Bank Executive Supplemental Retirement Income Master Agreement ("SERP") | (c) |
10.7A | SERP Joinder Agreement for F. Edward Broadwell, Jr. | (c) |
10.7B | SERP Joinder Agreement for Dana L. Stonestreet | (c) |
10.7C | SERP Joinder Agreement for Tony J. VunCannon | (c) |
10.7D | SERP Joinder Agreement for Howard L. Sellinger | (c) |
10.7E | SERP Joinder Agreement for Stan Allen | (c) |
10.7F | SERP Joinder Agreement for Sidney A. Biesecker | (c) |
10.7G | SERP Joinder Agreement for Peggy C. Melville | (c) |
10.7H | SERP Joinder Agreement for William T. Flynt | (c) |
10.7I | Amended and Restated Supplemental Income Agreement between HomeTrust Bank, as successor to Industrial Federal Savings Bank, and Sidney Biesecker | (h) |
10.8 | HomeTrust Bank Director Emeritus Plan ("Director Emeritus Plan") | (c) |
10.8A | Director Emeritus Plan Joinder Agreement for Franklin V. Beam | (c) |
10.8B | Director Emeritus Plan Joinder Agreement for William T. Flynt | (c) |
10.8C | Director Emeritus Plan Joinder Agreement for J. Steven Goforth | (c) |
10.8D | Director Emeritus Plan Joinder Agreement for Craig C. Koontz | (c) |
10.8E | Director Emeritus Plan Joinder Agreement for Larry S. McDevitt | (c) |
10.8F | Director Emeritus Plan Joinder Agreement for F.K. McFarland, III | (c) |
10.8G | Director Emeritus Plan Joinder Agreement for Peggy C. Melville | (c) |
10.8H | Director Emeritus Plan Joinder Agreement for Robert E. Shepherd, Sr. | (c) |
10.9 | HomeTrust Bank Defined Contribution Executive Medical Care Plan | (c) |
10.10 | HomeTrust Bank 2005 Deferred Compensation Plan | (c) |
10.11 | HomeTrust Bank Pre-2005 Deferred Compensation Plan | (c) |
10.12 | HomeTrust Bancshares, Inc. Strategic Operating Committee Incentive Plan | (i) |
10.13 | HomeTrust Bancshares, Inc. 2013 Omnibus Incentive Plan ("Omnibus Incentive Plan") | (j) |
10.14 | Form of Incentive Stock Option Award Agreement under Omnibus Incentive Plan | (k) |
10.15 | Form of Non-Qualified Stock Option Award Agreement under Omnibus Incentive Plan | (k) |
10.16 | Form of Stock Appreciation Right Award Agreement under Omnibus Incentive Plan | (k) |
10.17 | Form of Restricted Stock Award Agreement under Omnibus Incentive Plan | (k) |
10.18 | Form of Restricted Stock Unit Award Agreement under Omnibus Incentive Plan | (k) |
10.19 | Fully Restated Employment Agreement between HomeTrust Bank and Anderson L. Smith | (l) |
10.20 | Amended and Restated Jefferson Federal Bank Supplemental Executive Retirement Plan | (m) |
10.21 | Money Purchase Deferred Compensation Agreement, dated as of September 1, 1987, between HomeTrust Bank and F. Edward Broadwell, Jr. | 10.21 |
10.22 | Retirement Payment Agreement, dated as of September 1, 1987, between HomeTrust Bank and F. Edward Broadwell, Jr., as amended | 10.22 |
10.23 | Retirement Payment Agreement, dated as of September 1, 1987, between HomeTrust Bank and Larry S. McDevitt, as amended | 10.23 |
131
10.24 | Retirement Payment Agreement, dated as of September 1, 1987, between HomeTrust Bank and Peggy C. Melville, as amended | 10.24 |
10.25 | Retirement Payment Agreement, dated as of August 1, 1988, between HomeTrust Bank and Robert E. Shepherd, Sr., as amended | 10.25 |
10.26 | Retirement Payment Agreement, dated as of May 1, 1991, between HomeTrust Bank and William T. Flynt, as amended | 10.26 |
21.0 | Subsidiaries of the Registrant | 21.0 |
23.0 | Consent of Dixon Hughes Goodman LLP | 23.0 |
31.1 | Certification of Chief Executive Officer pursuant to Securities Exchange Act Rules 13a-14(a) and 15d-14(a) as adopted pursuant to Section 302 of the Sarbanes-Oxley Act of 2002 | 31.1 |
31.2 | Certification of Chief Financial Officer pursuant to Securities Exchange Act Rules 13a-14(a) and 15d-14(a) as adopted pursuant to Section 302 of the Sarbanes-Oxley Act of 2002 . | 31.2 |
32.0 | Certificate of Chief Executive Officer and Chief Financial Officer pursuant to Section 906 of the Sarbanes-Oxley Act of 2002. | 32.0 |
101 | The following materials from HomeTrust Bancshares' Annual Report on Form 10-K for the year ended June 30, 2014, formatted in Extensible Business Reporting Language (XBRL): (a) Consolidated Balance Sheets; (b) Consolidated Statements of Income; (c) Consolidated Statements of Comprehensive Income; (d) Consolidated Statements of Changes in Stockholders' Equity; (e) Consolidated Statements of Cash Flows; and (f) Notes to Consolidated Financial Statements. | 101 |
_________________
(a) | Filed as an exhibit to HomeTrust Bancshares's Current Report on Form 8-K filed on June 10, 2014 (File No. 001-35593). |
(b) | Attached as Appendix A to the joint proxy statement/prospectus filed by HomeTrust Bancshares on April 28, 2014 pursuant to Rule 424(b) of the Securities Act of 1933. |
(c) | Filed as an exhibit to HomeTrust Bancshares's Registration Statement on Form S-1 (File No. 333-178817) filed on December 29, 2011. |
(d) | Filed as an exhibit to HomeTrust Bancshares's Current Report on Form 8-K filed on September 25, 2012 (File No. 001-35593). |
(e) | Filed as an exhibit to HomeTrust Bancshares's Current Report on Form 8-K filed on January 29, 2014 (File No. 001-35593). |
(f) | Filed as an exhibit to HomeTrust Bancshares's Current Report on Form 8-K filed on November 27, 2013 (File No. 001-35593). |
(g) | Filed as an exhibit to HomeTrust Bancshares's Annual Report on Form 10-K for the fiscal year ended June 30, 2012 (File No. 001-35593). |
(h) | Filed as an exhibit to Amendment No. One to HomeTrust Bancshares's Registration Statement on Form S-1 (File No. 333-178817) filed on March 9, 2012. |
(i) | Filed as an exhibit to HomeTrust Bancshares's Quarterly Report on Form 10-Q for the quarter ended September 30, 2013 (File No. 001-35593). |
(j) | Attached as Appendix A to HomeTrust Bancshares's definitive proxy statement filed on December 5, 2012 (File No. 001-35593). |
(k) | Filed as an exhibit to HomeTrust Bancshares's Registration Statement on Form S-8 (File No. 333-186666) filed on February 13, 2013. |
(l) | Filed as an exhibit to HomeTrust Bancshares's Current Report on Form 8-K filed on June 3, 2014 (File No. 001-35593). |
(m) | Filed as an exhibit to Jefferson Bancshares, Inc.'s Quarterly Report on Form 10-Q for the quarter ended December 31, 2008 (File No. 000-50347). |
132