UNITED STATES
SECURITIES AND EXCHANGE COMMISSION
Washington, D.C. 20549
Form 10-K
x | ANNUAL REPORT PURSUANT TO SECTION 13 OR 15(d) OF THE SECURITIES EXCHANGE ACT OF 1934 |
For the fiscal year ended December 31, 2014
OR
¨ | TRANSITION REPORT PURSUANT TO SECTION 13 OR 15(d) OF THE SECURITIES EXCHANGE ACT OF 1934 |
Commission File Number: 001-14625 (Host Hotels & Resorts, Inc.)
0-25087 (Host Hotels & Resorts, L.P.)
HOST HOTELS & RESORTS, INC.
HOST HOTELS & RESORTS, L.P.
(Exact Name of Registrant as Specified in Its Charter)
Maryland (Host Hotels & Resorts, Inc.) Delaware (Host Hotels & Resorts, L.P.) |
| 53-0085950 (Host Hotels & Resorts, Inc.) 52-2095412 (Host Hotels & Resorts, L.P.) |
(State or Other Jurisdiction of Incorporation or Organization) |
| (I.R.S. Employer Identification No.) |
|
| |
6903 Rockledge Drive, Suite 1500 Bethesda, Maryland |
| 20817 |
(Address of Principal Executive Offices) |
| (Zip Code) |
(240) 744-1000
(Registrant's Telephone Number, Including Area Code)
Securities registered pursuant to Section 12(b) of the Act:
|
| Title of Each Class |
| Name of Each Exchange on Which Registered |
Host Hotels & Resorts, Inc. |
| Common Stock, $.01 par value (757,520,164 shares outstanding as of February 20, 2015) |
| New York Stock Exchange |
Host Hotels & Resorts, L.P. |
| None |
| None |
Securities registered pursuant to Section 12(g) of the Act:
Host Hotels & Resorts, Inc. |
| None |
Host Hotels & Resorts, L.P. |
| Units of limited partnership interest (750,840,635 units outstanding as of February 20, 2015) |
Indicate by check mark if the registrant is a well-known seasoned issuer, as defined in Rule 405 of the Securities Act.
Host Hotels & Resorts, Inc. |
| Yes x |
| No ¨ |
Host Hotels & Resorts, L.P. |
| Yes ¨ |
| No x |
Indicate by check mark if the registrant is not required to file reports pursuant to Section 13 or Section 15(d) of the Act.
Host Hotels & Resorts, Inc. |
| Yes ¨ |
| No x |
Host Hotels & Resorts, L.P. |
| Yes ¨ |
| No x |
Indicate by check mark whether the registrant: (1) has filed all reports required to be filed by Section 13 or 15(d) of the Securities Exchange Act of 1934 during the preceding 12 months (or for such shorter period that the registrant was required to file such reports), and (2) has been subject to such filing requirements for the past 90 days .
Host Hotels & Resorts, Inc. |
| Yes x |
| No ¨ |
Host Hotels & Resorts, L.P. |
| Yes x |
| No ¨ |
Indicate by check mark whether the registrant has submitted electronically and posted on its corporate Web site, if any, every Interactive Data File required to be submitted and posted pursuant to Rule 405 of Regulation S-T (§ 232.405 of this chapter) during the preceding 12 months (or for such shorter period that the registrant was required to submit and post such files).
Host Hotels & Resorts, Inc. |
| Yes x |
| No ¨ |
Host Hotels & Resorts, L.P. |
| Yes x |
| No ¨ |
Indicate by check mark if disclosure of delinquent filers pursuant to Item 405 of Regulation S-K (§ 229.405 of this chapter) is not contained herein, and will not be contained, to the best of registrant's knowledge, in definitive proxy or information statements incorporated by reference in Part III of this Form 10-K or any amendment to this Form 10-K. ¨
Indicate by check mark whether the registrant is a large accelerated filer, an accelerated filer, a non-accelerated filer, or a smaller reporting company. See the definitions of "large accelerated filer," "accelerated filer" and "smaller reporting company" in Rule 12b-2 of the Exchange Act. (Check one):
Host Hotels & Resorts, Inc.
Large accelerated filer |
| x |
| Accelerated filer |
| ¨ |
|
|
|
| |||
Non-accelerated filer |
| (Do not check if a smaller reporting company) ¨ |
| Smaller reporting company |
| ¨ |
Host Hotels & Resorts, L.P.
Large accelerated filer |
| ¨ |
| Accelerated filer |
| ¨ |
|
|
|
| |||
Non-accelerated filer |
| (Do not check if a smaller reporting company) x |
| Smaller reporting company |
| ¨ |
Indicate by check mark whether the registrant is a shell company (as defined in Rule 12b-2 of the Exchange Act).
Host Hotels & Resorts, Inc. |
| Yes ¨ |
| No x |
Host Hotels & Resorts, L.P. |
| Yes ¨ |
| No x |
The aggregate market value of common shares held by non-affiliates of Host Hotels & Resorts, Inc. (based on the closing sale price on the New York Stock Exchange) on June 30, 2014 was $16,274,124,536.
Documents Incorporated by Reference
Portions of Host Hotels & Resorts, Inc.'s definitive proxy statement to be filed with the Securities and Exchange Commission and delivered to stockholders in connection with its annual meeting of stockholders to be held on May 14, 2015 are incorporated by reference into Part III of this Form 10-K.
EXPLANATORY NOTE
This report combines the annual reports on Form 10-K for the fiscal year ended December 31, 2014 of Host Hotels & Resorts, Inc. and Host Hotels & Resorts, L.P. Unless stated otherwise or the context otherwise requires, references to "Host Inc." mean Host Hotels & Resorts, Inc., a Maryland corporation, and references to "Host L.P." mean Host Hotels & Resorts, L.P., a Delaware limited partnership, and its consolidated subsidiaries. We use the terms "we" or "our" or "the company" to refer to Host Inc. and Host L.P. together, unless the context indicates otherwise. We use the term Host Inc. to specifically refer to Host Hotels & Resorts, Inc. and the term Host L.P. to specifically refer to Host Hotels & Resorts, L.P. (and its consolidated subsidiaries) in cases where it is important to distinguish between Host Inc. and Host L.P. Host Inc. owns properties and conducts operations through Host L.P., of which Host Inc. is the sole general partner and of which it holds approximately 99% of the partnership interests ("OP units") as of December 31, 2014. The remaining partnership interests are owned by various unaffiliated limited partners. As the sole general partner of Host L.P., Host Inc. has the exclusive and complete responsibility for Host L.P.'s day-to-day management and control.
We believe combining the annual reports on Form 10-K of Host Inc. and Host L.P. into this single report results in the following benefits:
● | enhances investors' understanding of Host Inc. and Host L.P. by enabling investors to view the business as a whole in the same manner as management views and operates the business; |
● | eliminates duplicative disclosure and provides a more streamlined presentation, since a substantial portion of our disclosure applies to both Host Inc. and Host L.P.; and |
● | creates time and cost efficiencies through the preparation of one combined report instead of two separate reports. |
Management operates Host Inc. and Host L.P. as one enterprise. The management of Host Inc. consists of the same members who direct the management of Host L.P. The executive officers of Host Inc. are appointed by Host Inc.'s board of directors, but are employed by Host L.P. Host L.P. employs everyone who works for Host Inc. or Host L.P. As general partner with control of Host L.P., Host Inc. consolidates Host L.P. for financial reporting purposes, and Host Inc. does not have significant assets other than its investment in Host L.P. Therefore, the assets and liabilities of Host Inc. and Host L.P. are the same on their respective financial statements.
There are a few differences between Host Inc. and Host L.P., which are reflected in the disclosure in this report. We believe it is important to understand the differences between Host Inc. and Host L.P. in the context of how Host Inc. and Host L.P. operate as an interrelated consolidated company. Host Inc. is a real estate investment trust, or REIT, and its only material asset is its ownership of partnership interests of Host L.P. As a result, Host Inc. does not conduct business itself, other than acting as the sole general partner of Host L.P., and issuing public equity from time to time, the proceeds from which are contributed to Host L.P. in exchange for OP units. Host Inc. itself does not issue any indebtedness and does not guarantee the debt or obligations of Host L.P. Host L.P. holds substantially all of our assets and holds the ownership interests in our joint ventures. Host L.P. conducts the operations of the business and is structured as a limited partnership with no publicly traded equity. Except for net proceeds from public equity issuances by Host Inc., Host L.P. generates the capital required by our business through Host L.P.'s operations, by Host L.P.'s direct or indirect incurrence of indebtedness, or through the issuance of OP units.
The substantive difference between the filings of Host Inc. and Host L.P. is that Host Inc. is a REIT with public stock, while Host L.P. is a partnership with no publicly traded equity. In the financial statements, this difference primarily is reflected in the equity (or partners' capital for Host L.P.) section of the consolidated balance sheets and in the consolidated statements of equity (or partners' capital) and in the consolidated statements of operations and comprehensive income (loss) with respect to the manner in which income is allocated to non-controlling interests. Income allocable to the holders of approximately 1% of the OP units is reflected as income allocable to non-controlling interests at Host Inc. and within net income at Host L.P. Also, earnings per share generally will be slightly less than the earnings per OP unit, as each Host Inc. common share is the equivalent of .97895 OP units (instead of 1 OP unit). Apart from these differences, the financial statements of Host Inc. and Host L.P. are nearly identical.
i
To help investors understand the differences between Host Inc. and Host L.P., this report presents the following separate sections or portions of sections for each of Host Inc. and Host L.P.:
● | Part II Item 5 - Market for Registrant's Common Stock, Related Stockholder Matters and Issuer Purchases of Equity Securities for Host Inc. / Market for Registrant's Common Units, Related Unitholder Matters and Issuer Purchases of Equity Securities for Host L.P.; |
● | Part II Item 6 - Selected Financial Data; |
● | Part II Item 7 - Management's Discussion and Analysis of Financial Condition and Results of Operations is combined, except for a separate discussion of material differences, if any, in the liquidity and capital resources between Host Inc. and Host L.P.; |
● | Part II Item 7A - Quantitative and Qualitative Disclosures about Market Risk is combined, except for separate discussions of material differences, if any, between Host Inc. and Host L.P.; and |
● | Part II Item 8 - Consolidated Financial Statements and Supplementary Data. While the financial statements themselves are presented separately, the notes to the financial statements generally are combined, except for separate discussions of differences between equity of Host Inc. and capital of Host L.P. |
This report also includes separate Item 9A. Controls and Procedures sections and separate Exhibit 31 and 32 certifications for each of Host Inc. and Host L.P. in order to establish that the Chief Executive Officer and the Chief Financial Officer of Host Inc. and the Chief Executive Officer and the Chief Financial Officer of Host Inc. as the general partner of Host L.P. have made the requisite certifications and that Host Inc. and Host L.P. are compliant with Rule 13a-15 or Rule 15d-15 of the Securities Exchange Act of 1934 and 18 U.S.C. §1350.
ii
HOST HOTELS & RESORTS, INC. AND HOST HOTELS & RESORTS, L.P.
|
| Page |
|
|
|
| Part I |
|
|
|
|
Item 1. | Business | 1 |
Item 1A. | Risk Factors | 16 |
Item 1B. | Unresolved Staff Comments | 29 |
Item 2. | Properties | 29 |
Item 3. | Legal Proceedings | 29 |
Item 4. | Mine Safety Disclosures | 30 |
|
|
|
| Part II |
|
|
|
|
Item 5. | Market for Registrant's Common Stock, Related Stockholder Matters and Issuer Purchases of Equity Securities for Host Inc. | 32 |
| Market for Registrant's Common Units, Related Unitholder Matters and Issuer Purchases of Equity Securities for Host L.P. | 34 |
Item 6. | Selected Financial Data (Host Hotels & Resorts, Inc.) | 35 |
| Selected Financial Data (Host Hotels & Resorts, L.P.) | 36 |
Item 7. | Management's Discussion and Analysis of Financial Condition and Results of Operations | 37 |
Item 7A. | Quantitative and Qualitative Disclosures about Market Risk | 80 |
Item 8. | Financial Statements and Supplementary Data | 83 |
Item 9. | Changes in and Disagreements with Accountants on Accounting and Financial Disclosure | 133 |
Item 9A. | Controls and Procedures | 133 |
Item 9B. | Other Information | 133 |
|
|
|
| Part III |
|
|
|
|
Item 10. | Directors, Executive Officers and Corporate Governance | 134 |
Item 11. | Executive Compensation | 134 |
Item 12. | Security Ownership of Certain Beneficial Owners and Management and Related Stockholder And Unitholder Matters | 134 |
Item 13. | Certain Relationships and Related Transactions, and Director Independence | 134 |
Item 14. | Principal Accounting Fees and Services | 134 |
|
|
|
| Part IV |
|
|
|
|
Item 15. | Exhibits and Financial Statement Schedules | 135 |
iii
PART I
Forward Looking Statements
Our disclosure and analysis in this 2014 Form 10-K and in Host Inc.'s 2014 Annual Report to stockholders contain some forward-looking statements that set forth anticipated results based on management's plans and assumptions. From time to time, we also provide forward-looking statements in other materials we release to the public. Such statements give our current expectations or forecasts of future events; they do not relate strictly to historical or current facts. We have tried, wherever possible, to identify each such statement by using words such as "anticipate," "estimate," "expect," "project," "intend," "plan," "believe," "will," "target," "forecast" and similar expressions in connection with any discussion of future operating or financial performance. In particular, these forward-looking statements include those relating to future actions, future acquisitions or dispositions, future capital expenditures plans, future performance or results of current and anticipated expenses, interest rates, foreign exchange rates or the outcome of contingencies, such as legal proceedings.
We cannot guarantee that any future results discussed in any forward-looking statements will be realized, although we believe that we have been prudent in our plans and assumptions. Achievement of future results is subject to risks, uncertainties and potentially inaccurate assumptions, including those discussed in Item 1A "Risk Factors." Should known or unknown risks or uncertainties materialize, or should underlying assumptions prove inaccurate, actual results could differ materially from past results and those results anticipated, estimated or projected. You should bear this in mind as you consider forward-looking statements.
We undertake no obligation to publicly update forward-looking statements, whether as a result of new information, future events or otherwise. You are advised, however, to consult any further disclosures we make or related subjects in our reports on Form 10-Q and Form 8-K that we file with the Securities and Exchange Commission ("SEC"). Also note that, in our risk factors, we provide a cautionary discussion of risks, uncertainties and possibly inaccurate assumptions relevant to our business. These are factors that, individually or in the aggregate, we believe could cause our actual results to differ materially from past results and those results anticipated, estimated or projected. We note these factors for investors as permitted by the Private Securities Litigation Reform Act of 1995. It is not possible to predict or identify all such risk factors. Consequently, you should not consider the discussion of risk factors to be a complete discussion of all of the potential risks or uncertainties that could affect our business.
Item 1. | Business |
Host Inc. was incorporated as a Maryland corporation in 1998 and operates as a self-managed and self-administered REIT. Host Inc. owns properties and conducts operations through Host L.P., of which Host Inc. is the sole general partner and in which it holds approximately 99% of the partnership interests ("OP units") as of December 31, 2014. The remaining partnership interests are owned by various unaffiliated limited partners. Host Inc. has the exclusive and complete responsibility for Host L.P.'s day-to-day management and control.
As of February 20, 2015, our consolidated lodging portfolio consists of 114 primarily luxury and upper-upscale hotels containing approximately 59,000 rooms, with the majority located in the United States, and with 17 of the properties located outside of the U.S. in Australia, Brazil, Canada, Chile, Mexico and New Zealand. In addition, we own non-controlling interests in two international joint ventures: a joint venture in Europe, which owns 19 luxury and upper upscale hotels with approximately 6,500 rooms in Belgium, France, Germany, Italy, Poland, Spain, Sweden, the Netherlands and the United Kingdom; and a joint venture in Asia/Pacific, which owns one upscale hotel in Australia and minority interests in three operating hotels, two upscale and one midscale, in India and four additional hotels in India currently under development. We also hold non-controlling investments in two hotels and a timeshare joint venture.
Business Strategy
Our goal is to be the premier lodging real estate company and to generate superior total returns for our stockholders through a combination of appreciation in asset values, growth in earnings and dividend distributions. To achieve this objective, we seek to:
· | Own a high-quality portfolio of hotel real estate primarily located in our target markets; |
· | Create value in our existing portfolio through well-integrated asset management and capital investment; |
· | Allocate and recycle capital with discipline to earn returns that exceed our cost of capital; |
· | Maintain a flexible capital structure that fosters external growth even through a downturn; and |
· | Align our organizational structure with our business objectives to be an employer of choice and a responsible corporate citizen. |
1
Portfolio Management. We will focus on refining our portfolio to include multiple types of hotels, but in a defined set of target markets that meet our investment criteria. This will provide the opportunity for a more comprehensive understanding of our target markets which we believe will increase the probability of earning premium returns over time.
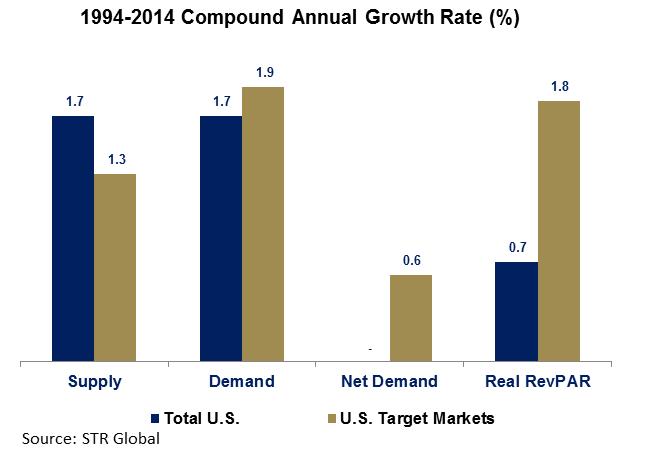
· | Our target markets will be those locations which we believe have strong demand generators that appeal to multiple customer segments, achieve premium rates and relatively higher barriers to entry that limit new supply. While we continually will evaluate and refine our target market list, we generally focus on domestic gateway cities and resort markets, including New York, Washington, D.C., Boston, Florida, Chicago, Los Angeles, San Francisco, San Diego, Seattle, Houston and Hawaii. These target markets historically have outperformed the overall U.S. lodging industry in terms of real revenue per available room ("RevPAR") growth, although there can be no assurances that this outperformance will continue for any number of reasons, including changes in travel patterns or supply in those markets. We also will continue investing internationally, either through direct acquisitions or through joint ventures with strategic partners. We believe international expansion provides us the opportunity to earn favorable risk-adjusted returns and diversify our portfolio. Our international target markets include Western Europe (through our European joint venture), Australia, Singapore, Mexico and Brazil. We believe these markets will continue to see more favorable supply/demand and pricing dynamics in the future. The following chart details the long-term performance of our domestic target markets over the past 20 years: |
· | Establishing a deeper foothold through a concentrated market approach is intended to create efficiencies and increase our knowledge of local market dynamics, data and relationships. We will continue primarily to own upper upscale and luxury hotels that we believe benefit from multiple segments of demand. However, we also will broaden the types of assets we consider owning to include urban, select-service hotels and lifestyle or "boutique" hotels which appeal to the transient customer. We believe focusing on several different hotel types within our target markets will provide the opportunity to capitalize on the evolving nature of the hotel customer. |
· | We will strive for balanced market exposure. Our general goal is that 80% to 90% of our portfolio revenues will come from hotels located within our target markets, which will allow us the flexibility to make opportunistic investments in alternative locations and to continue to hold certain legacy assets that we expect will perform well over time. |
· | Through our disciplined approach to acquisitions and new development we seek to achieve unlevered returns that exceed our cost of capital. Generally, we will look to invest capital early in the lodging cycle and benefit from the subsequent industry-wide increase in values. As we move further into the lodging cycle, we will increase our focus on opportunities where we believe we can add value through redevelopment, repositioning or new development. |
· | We will look to reallocate our portfolio toward target markets through our disposition strategy. Generally, our dispositions will be focused on secondary or tertiary markets. Additionally, we will dispose of properties where we believe the potential for growth is constrained or of properties with significant capital expenditures requirements where we do not believe we would generate a significant return on the investment. Prior to the sale of assets, we will look for opportunities to increase the sales price, which may include value-added capital expenditures projects and ground lease |
2
extensions. We also will look to take advantage of opportunities to capture attractive pricing for hotels that have management contract flexibility. We also may dispose of assets in our target markets through direct sales or through the creation of joint ventures when we have the opportunity to capitalize on value enhancement strategies and apply the proceeds to other business objectives. |
Asset Management. As the owner of a large and diverse portfolio of properties, we believe we are in a unique position to work with our managers to drive operating profit through revenue growth strategies and cost control initiatives. The size and composition of our portfolio and our affiliation with most of the leading brands and operators in the industry allow us to benchmark similar hotels and identify best practices and efficiencies that can improve long-term profitability. We also carefully evaluate and monitor our property agreements, including our management and franchise agreements, in an effort to obtain flexibility and drive overall value. Ultimately, our goal is to differentiate our assets within their competitive market, drive operating performance and enhance the value of the real estate.
· | Work with leading brands, as well as independent operators, in the lodging industry and actively seek to diversify within our portfolio. We will look to capitalize on situations where we have management agreement flexibility to appropriately match a hotel and its operator, brand and contract terms. This will include new relationships with independent operators that may be an improved fit for smaller or unbranded products. |
· | Drive revenue growth by conducting detailed strategic reviews with our managers on market pricing and segment mix to develop the appropriate group/transient mix and market share targets for each property. We also work with our managers to ensure that their brands' on-line presence addresses a broad customer base, including group customers and overseas travelers. |
· | Enhance profitability by using our proprietary business intelligence system to benchmark and monitor hotel performance and cost controls and complete deep-dive analytic reviews to identify new opportunities that could increase profit. |
· | Improve contract flexibility through the extension or purchase of ground leases or the restructuring of management agreements to enhance overall value. |
· | Strategically position food & beverage outlets through initiatives such as combining bars and restaurants to create a more relevant experience for consumers throughout the day or outsourcing outlets when a viable partnership may improve profitability and increase our customer base. |
Capital Investment. We focus on creating and mining value from our existing portfolio through capital investments and value enhancement initiatives. These projects may include significant changes to rooms, public space and meeting space, as well as a repositioning of the property under a different operator or brand. We work closely with our managers to time these projects so as to attempt to reduce disruption to operations and environmental impacts.
· | Value Enhancement Initiatives seek to achieve the highest and best use of our properties. These projects may include the development of timeshare, office space or condominium units on excess land, redevelopment or expansion of existing retail space, and the acquisition of air rights or development entitlements. |
· | Redevelopment and Return on Investment Projects are designed to take advantage of changing market conditions and the favorable location of our properties and seek to increase profitability and enhance customer satisfaction. Our capital expenditures projects generally fall into the following categories: |
Redevelopment projects. These projects are designed to improve the positioning of our hotels within their markets and competitive set. Redevelopment projects include extensive renovations of guest rooms and bathrooms, lobbies, food and beverage outlets; expanding and/or extensive renovation of ballroom and meeting rooms; major mechanical system upgrades, and green building initiatives and certifications.
Targeted Return on Investment (ROI) projects. These projects often are smaller and focused on increasing space profitability or lowering net operating costs. Typical ROI projects include converting unprofitable or underutilized space into meeting space, adding guestrooms, and implementing energy and water conservation measures such as LED lighting, guestroom water efficient fixtures, and building automation systems.
· | Acquisition Capital Expenditures Projects are completed in connection with the acquisition of a property. For each new acquisition, we prepare capital and operational improvement plans designed to improve profitability and enhance the guest experience. These projects may include required renewal and replacement projects, significant redevelopment and even re-branding of the property and represent a key component of our decision to invest in a hotel. These projects typically are completed within two to three years of acquisition. |
3
· | Renewal and Replacement Capital Expenditures are designed to maintain the quality and competitiveness of our hotel properties. Typically, room renovations occur at intervals of approximately seven years, but the timing may vary based on the type of property and equipment being renovated. These renovations generally are divided into the following types: soft goods, case goods, bathroom and infrastructure. Soft goods include items such as carpeting, bed spreads, curtains and wall vinyl and may require more frequent updates in order to maintain brand quality standards. Case goods include items such as dressers, desks, couches, restaurant and meeting room chairs and tables; which generally are not replaced as frequently. Bathroom renovations include the replacement of tile, vanity, lighting and plumbing fixtures. Infrastructure includes the physical plant of the hotel, including the roof, elevators/escalators, façade, heating, ventilation, and air conditioning systems and fire systems. |
Financing Strategy . In order to maintain its qualification as a REIT, Host Inc. is required to distribute 90% of its taxable income (other than net capital gain, but including taxable income recognized for federal income tax purposes but with regard to which we do not receive cash) to its stockholders and, as a result, generally relies on external sources of capital, as well as cash from operations, to finance growth. We use a variety of debt and equity instruments to fund our external growth, including senior notes and mortgage debt, exchangeable debentures, common and preferred stock offerings, issuances of OP units and joint ventures/limited partnerships to take advantage of the prevailing market conditions.
· | Management believes that a strong balance sheet is a key competitive advantage that affords us a lower cost of capital and positions us for external growth. While we may issue debt at any time, generally we will target a net debt-to-EBITDA ratio, (or "Leverage Ratio," as defined in our credit facility) of 2.5x to 3.0x and to maintain an investment grade rating on our senior unsecured debt. We believe the investment grade rating and lower leverage will deliver the most consistent access to capital, thereby providing us with the necessary flexibility to take advantage of opportunities throughout the lodging cycle. |
· | We seek to structure our debt profile to allow us to access different forms of financing , primarily senior notes and exchangeable debentures, as well as mortgage debt (particularly outside of the U.S. when debt is priced reasonably and can be denominated in the local currency). Generally, this means we look to minimize the number of assets that are encumbered by mortgage debt, minimize near-term maturities and maintain a balanced maturity schedule. We may seek to issue debt in foreign currencies to match the proceeds with their intended use in order to reduce the potential costs of international investing related to currency fluctuation and local taxes. Depending on market conditions, we also may utilize variable rate debt which can provide greater protection during a decline in the lodging industry. Generally we will target our floating rate debt to be 20% to 35% of total debt, in part depending on our outlook on future interest rates. |
· | We expect to continue to utilize joint ventures to finance external growth. We believe joint ventures provide a significant means to access external capital and spread the inherent risk of hotel ownership. Our primary focus for joint ventures is in international markets, which helps to diversify exposure to market risk. |
Corporate Responsibility. Our corporate responsibility program is managed by our Corporate Responsibility team, led by our Executive Vice President, Human Resources and Managing Director, Global Development, Design and Construction and overseen by our CEO and the Nominating and Corporate Governance Committee of the Board of Directors. Our corporate responsibility program focuses on the management of the environmental, social and governance risks and opportunities for our business and is organized around the following themes and objectives:
● | Responsible Investment: We incorporate sustainability into our asset management approach. During the acquisition of new properties, we assess both sustainability opportunities and climate change related risks as part of our due diligence process. During the ownership of our properties, we seek to invest in proven sustainability practices in our redevelopment and ROI projects that can enhance asset value while also improving environmental performance. |
● | Environmental Stewardship: We seek to improve the environmental footprint of our properties. We have established goals to reduce energy use and carbon emissions from 2008 levels by 12 percent and water use by 15 percent by 2017 across our portfolio. As part of our asset management approach, we work closely with our hotel managers to monitor environmental performance and support implementation of operational best practices. In our redevelopment and ROI projects, we target specific environmental efficiency projects, equipment upgrades and replacements that reduce energy and water consumption and offer appropriate returns on investment. |
● | Corporate Citizenship: We are committed to being a responsible corporate citizen and strengthening our local communities. We do this through financial support, community engagement, volunteer service, and industry collaboration. Our approach to corporate citizenship is reinforced by our Code of Business Conduct and Ethics and periodic engagement with key stakeholders to understand their corporate responsibility priorities. |
4
The Lodging Industry
The lodging industry in the United States consists of private and public entities that operate in an extremely diversified market under a variety of brand names. The lodging industry has several key participants:
● | Owners -own the hotel and typically enter into an agreement for an independent third party to manage the hotel. These properties may be branded and operated under the manager's brand or branded under a franchise agreement and operated by the franchisee or by an independent hotel manager. The properties also may be operated as an independent hotel by an independent hotel manager. |
● | Owner/Managers -own the hotel and operate the property with their own management team. These properties may be branded under a franchise agreement, operated as an independent hotel or operated under the owner's brand. We are prohibited from operating and managing hotels under applicable REIT rules. |
● | Franchisors -own a brand or brands and strive to grow their revenues by expanding the number of hotels in their franchise system. Franchisors provide their hotels with brand recognition, marketing support and centralized reservation systems for the franchised hotels. |
● | Franchisor/Managers -own a brand or brands and also operate hotels on behalf of the hotel owner or franchisee. |
● | Managers -operate hotels on behalf of the hotel owner, but do not, themselves, own a brand. The hotels may be operated under a franchise agreement or as an independent hotel. |
The hotel manager is responsible for the day-to-day operation of the hotel, including the employment of hotel staff, the determination of room rates, the development of sales and marketing plans, the preparation of operating and capital expenditures budgets and the preparation of financial reports for the owner. The hotel manager typically receives fees based on the revenues and profitability of the hotel.
Supply and Demand Trends. Our industry is influenced by the cyclical relationship between the supply of and demand for hotel rooms. Lodging demand growth typically is related to the vitality of the overall economy, in addition to local market factors that stimulate travel to specific destinations. In particular, trends in economic indicators such as GDP growth, business investment and employment growth are key indicators of the relative strength of lodging demand.
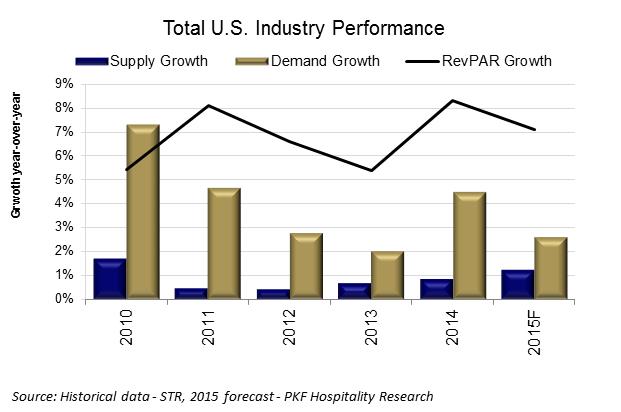
Lodging supply growth generally is driven by overall lodging demand, as extended periods of strong demand growth tend to encourage new development. However, the rate of supply growth also is influenced by a number of additional factors, including the availability of capital, interest rates, construction costs and unique market considerations. The relatively long lead-time required to complete the development of hotels makes supply growth easier to forecast than demand growth, but increases the volatility of the cyclical behavior of the lodging industry. As illustrated in the charts below for the U.S. lodging industry, at different points in the cycle, demand may increase when there is no new supply or supply may grow when demand is declining.
5
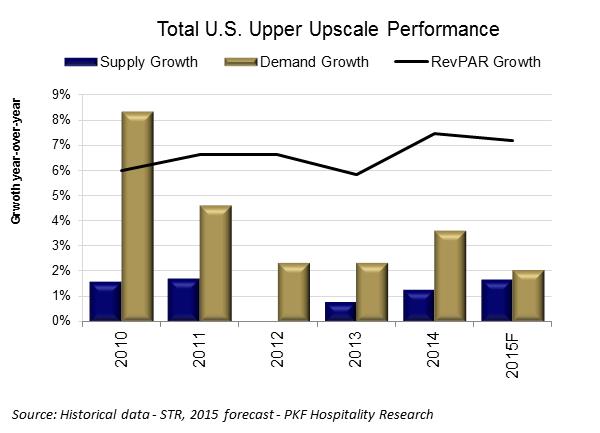
Our portfolio primarily consists of upper upscale hotels and, accordingly, its performance is best understood in comparison to the upper upscale segment rather than the entire industry. The charts below detail the historical supply, demand and RevPAR growth for the U.S. lodging industry and for the U.S. upper upscale segment for 2010 to 2014 and forecast data for 2015:
U.S. Lodging Industry Supply, Demand and RevPAR Growth
U.S. Upper Upscale Supply, Demand and RevPAR Growth
6
Managers and Operational Agreements
All of our hotels are managed by third parties pursuant to management or operating agreements, with some of such hotels also subject to separate license agreements addressing matters pertaining to operation under the designated brand. Under these agreements, the managers generally have sole responsibility and exclusive authority for all activities necessary for the day-to-day operation of the hotels, including establishing room rates, securing and processing reservations, procuring inventories, supplies and services, providing periodic inspection and consultation visits to the hotels by the managers' technical and operational experts and promoting and publicizing the hotels. The managers provide all managerial and other employees for the hotels, review the operation and maintenance of the hotels, prepare reports, budgets and projections, and provide other administrative and accounting support services to the hotels. These support services include planning and policy services, divisional financial services, product planning and development, employee staffing and training, corporate executive management and certain in-house legal services. We have certain approval rights over budgets, capital expenditures, significant leases and contractual commitments, and various other matters.
These management agreements can affect the value of the property associated with it based on the pricing and flexibility of the agreement. In addition to customary performance termination rights, certain of our agreements with Starwood and Marriott have limited special termination rights, as detailed below, that can lend to the flexibility of the agreement. We often will seek to negotiate the terms of an agreement to provide greater value to the associated asset. See " Termination Rights" and "Special Termination Rights" described below.
General Terms and Provisions – Agreements governing the management and operation of our hotels typically include the terms described below:
● | Term and fees for operational services . The initial term of our management and operating agreements generally is 15 to 25 years, with one or more renewal terms at the option of the manager. The majority of our management agreements condition the manager's right to exercise options for specified renewal terms upon the satisfaction of specified economic performance criteria. The manager typically receives compensation in the form of a base management fee, which is calculated as a percentage (generally 2-3%) of annual gross revenues, and an incentive management fee, which typically is calculated as a percentage (generally 10-20%) of operating profit after the owner has received a priority return on its investment in the hotel. In the case of our Starwood-managed hotels, the base management fee is only 1% of annual gross revenues, but that amount is supplemented by license fees payable to Starwood under a separate license agreement (as described below). |
● | License services . In the case of our Starwood-managed hotels, the operation of the hotels is governed by separate license agreements addressing matters pertaining to the designated brand, including rights to use trademarks, service marks and logos, matters relating to compliance with certain brand standards and policies, and the provision of certain system programs and centralized services. Although the term of these license agreements with Starwood generally is coterminous with the corresponding operating agreements, the license agreements contemplate the potential for continued brand affiliation even in the event of a termination of the operating agreement. As noted above, the Starwood licensors receive compensation in the form of license fees (generally 5% of gross revenues attributable to room sales and 2% of gross revenues attributable to food and beverage sales), which amounts supplement the lower base management fee of 1% of gross revenues received by Starwood under the operating agreements. |
● | Chain or system programs and services . Managers are required to provide chain or system programs and services generally that are furnished on a centralized basis. Such services include the development and operation of certain computer systems and reservation services, regional or other centralized management and administrative services, marketing and sales programs and services, training and other personnel services, and other centralized or regional services as may be determined to be more efficiently performed on a centralized, regional or group basis rather than on an individual hotel basis. Costs and expenses incurred in providing these chain or system programs and services generally are allocated on a cost reimbursement basis among all hotels managed by the manager or its affiliates or that otherwise benefit from these services. |
● | Working capital and fixed asset supplies . We are required to maintain working capital for each hotel and to fund the cost of certain fixed asset supplies (for example, linen, china, glassware, silver and uniforms). We also are responsible for providing funds to meet the cash needs for hotel operations if at any time the funds available from working capital are insufficient to meet the financial requirements of the hotels. For certain hotels, the working capital accounts which would otherwise be maintained by the managers for each of such hotels are maintained on a pooled basis, with managers being authorized to make withdrawals from such pooled account as otherwise contemplated with respect to working capital in accordance with the provisions of the management or operating agreements. |
● | Furniture, fixtures and equipment replacements . We are required to provide the managers with all furniture, fixtures and equipment ("FF&E") necessary for the operation of the hotels (including funding any required FF&E replacements). On an annual basis, the managers prepare budgets for FF&E to be acquired and certain routine repairs and maintenance to be performed in the next year and an estimate of the necessary funds, which budgets are subject to our review and approval. For purposes of funding such expenditures, a specified percentage (typically 5%) of the gross revenues of each hotel is deposited by the manager into an escrow or reserve account in our name, to which the manager has access. In the case of |
7
our Starwood-managed hotels, our operating agreements contemplate that this reserve account also may be used to fund the cost of certain major repairs and improvements affecting the hotel building (as described below). For certain of our Marriott-managed hotels, we have entered into an agreement with Marriott to allow for such expenditures to be funded from one pooled reserve account, rather than funds being deposited into separate reserve accounts at each hotel, with the minimum required balance maintained on an ongoing basis in that pooled reserve account being significantly below the amount that would have been maintained otherwise in such separate hotel reserve accounts. For certain of our Starwood-managed hotels, the periodic reserve fund contributions, which otherwise would be deposited into reserve accounts maintained by managers for each hotel, are distributed to us and, as to this pool of hotels, we are responsible for providing funding of expenditures which otherwise would be funded from reserve accounts for each of the subject hotels. |
● | Building alterations, improvements and renewals . The managers are required to prepare an annual estimate of the expenditures necessary for major repairs, alterations, improvements, renewals and replacements to the structural, mechanical, electrical, heating, ventilating, air conditioning, plumbing and elevators of each hotel, along with alterations and improvements to the hotel as are required, in the manager's reasonable judgment, to keep the hotel in a competitive, efficient and economical operating condition that is consistent with brand standards. We generally have approval rights as to such budgets and expenditures, which we review and approve based on our manager's recommendations and on our judgment. Expenditures for these major repairs and improvements affecting the hotel building typically are funded directly by owners, although (as noted above) our agreements with Starwood contemplate that certain such expenditures may be funded from the reserve account. |
● | Treatment of additional owner funding . As additional owner funding becomes necessary either for expenditures generally funded from the FF&E replacement funds, or for any major repairs or improvements to the hotel building which may be required to be funded directly by owners, most of our agreements provide for an economic benefit to us through an impact on the calculation of incentive management fees payable to our managers. One approach frequently utilized at our Marriott-managed hotels is to provide such owner funding through loans which are repaid, with interest, from operational revenues, with the repayment amounts reducing operating profit available for payment of incentive management fees. Another approach that is used at our Starwood-managed hotels, as well as with certain capital expenditures projects at our Marriott-managed hotels, is to treat such owner funding as an increase to our investment in the hotel, resulting in an increase to owner's priority return with a corresponding reduction to the amount of operating profit available for payment of incentive management fees. For our Starwood-managed hotels that are subject to the pooled arrangement described above, the amount of any additional reserve account funding is allocated to each of such hotels on a pro rata basis, determined with reference to the net operating income of each hotel and the total net operating income of all such pooled hotels for the most recent operating year. |
● | Territorial protections . Certain management and operating agreements impose restrictions for a specified period which limit the manager and its affiliates from owning, operating or licensing a hotel of the same brand within a specified area. The area restrictions vary with each hotel, from city blocks in urban areas to up to a multi-mile radius from the hotel in other areas. |
● | Sale of the hotel . Subject to specific agreements as to certain hotels (see below under ‘Special Termination Rights'), we generally are limited in our ability to sell, lease or otherwise transfer the hotels by the requirement that the transferee assume the related management agreements and meet specified other conditions, including the condition that the transferee not be a competitor of the manager. |
● | Performance Termination Rights. In addition to any right to terminate that may arise as a result of a default by the manager, most of our management and operating agreements include reserved rights by us to terminate management or operating agreements on the basis of the manager's failure to meet certain performance-based metrics, typically including a specified threshold return on owner's investment in the hotel, along with a failure of the hotel to achieve a specified RevPAR performance threshold established with reference to other competitive hotels in the market. Typically, such performance-based termination rights arise in the event the operator fails to achieve specified performance thresholds over a consecutive two-year period, and are subject to the manager's ability to ‘cure' and avoid termination by payment to us of specified deficiency amounts (or, in some instances, waiver of the right to receive specified future management fees). We have agreed in the past, and may agree in the future, to waive certain of these termination rights in exchange for consideration from a manager or its affiliates, which consideration may include cash compensation or amendments to management agreements. |
● | Special Termination Rights. In addition to any performance-based or other termination rights set forth in our management and operating agreements, we have specific negotiated termination rights as to certain management and operating agreements. With respect to our Marriott portfolio, subject to certain timing and other limitations, these rights include termination rights applicable to 15 properties. With respect to our Starwood portfolio, subject to certain timing and other limitations, these rights include termination rights applicable to 10 properties. We also have similar termination rights applicable to 8 other properties. While the brand affiliation of a property may increase the value of a hotel, the ability to dispose of a property unencumbered by a management agreement, or even brand affiliation, also can increase the value for |
8
prospective purchasers. These termination rights can take a number of different forms, including termination of agreements upon sale that leave the property unencumbered by any agreement; termination upon sale provided that the property continues to be operated under a license or franchise agreement with continued brand affiliation; as well as termination without sale or other condition, which may require the payment of a fee. These termination rights also may restrict the number of agreements that may be terminated over any annual or other period; impose limitations on the number of agreements terminated as measured by EBITDA; require that a certain number of properties continue to maintain the brand affiliation; or be restricted to a specific pool of assets. |
Operating Structure
Host Inc. operates through an umbrella partnership structure in which substantially all of its assets are held by Host L.P., of which Host Inc. is the sole general partner and holds approximately 99% of the OP units as of December 31, 2014. A REIT is a corporation that has elected to be treated as a REIT under the Internal Revenue Code of 1986, as amended (the "Code"), and that meets certain ownership, organizational and operating requirements set forth under the Code. In general, through payments of dividends to stockholders, a REIT is permitted to reduce or eliminate federal income taxes at the corporate level. Each OP unit owned by holders other than Host Inc. is redeemable, at the option of the holder, for an amount of cash equal to the market value of one share of Host Inc. common stock multiplied by the current conversion factor of 1.021494. Host Inc. has the right to acquire any OP unit offered for redemption directly from the holder in exchange for 1.021494 shares of Host Inc. common stock instead of Host L.P. redeeming such OP unit for cash. Additionally, for every share of common stock issued by Host Inc., Host L.P. will issue .97895 OP units to Host Inc. in exchange for the consideration received from the issuance of the common stock. As of December 31, 2014, non-controlling limited partners held 9.3 million OP units, which were convertible into 9.4 million Host Inc. common shares. Assuming that all OP units held by non-controlling limited partners were converted into common shares, there would have been 765.2 million common shares of Host Inc. outstanding at December 31, 2014.
Our operating structure is as follows:
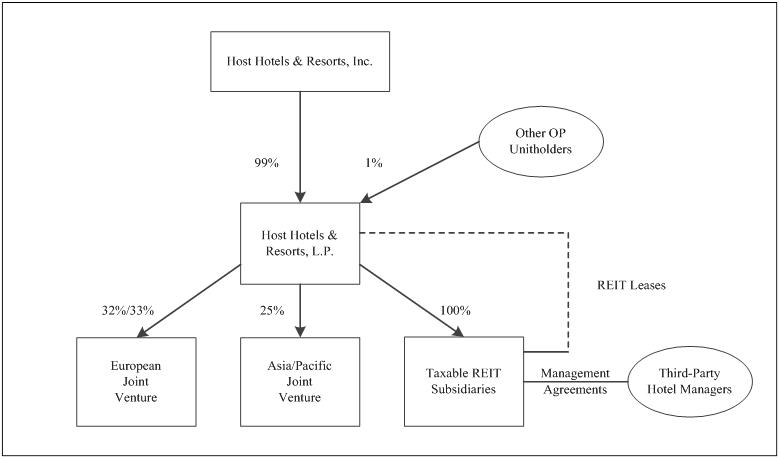
Because Host Inc. has elected to be treated as a REIT, certain tax laws limit the amount of "non-qualifying" income that Host Inc. and Host L.P. can earn, including income derived directly from the operation of hotels. As a result, we lease substantially all of our consolidated properties to certain of our subsidiaries designated as taxable REIT subsidiaries ("TRS") for federal income tax purposes or to third party lessees. Our TRS are subject to income tax and are not limited as to the amount of non-qualifying income they can generate. Our TRS enter into agreements with third parties to manage the operations of the hotels. Our TRS also may own assets engaging in other activities that produce non-qualifying income, such as the development of timeshare or condominium units, subject to certain restrictions. The difference between the hotels' net operating cash flow and the aggregate rents paid to Host L.P. is retained by our TRS as taxable income. Accordingly, the net effect of the TRS leases is that, while, as a REIT, Host Inc. generally does not pay federal and state income tax to the extent that it meets specific distribution requirements, among other REIT requirements, a portion of the net operating cash flow from our properties is subject to federal, state and, if applicable, foreign income tax.
9
Our Consolidated Hotel Portfolio
As of February 20, 2015, we owned a portfolio of 114 hotel properties, of which 97 are located in the United States and 17 are located in Australia, Brazil, Canada, Chile, Mexico and New Zealand. Our consolidated hotels located outside the United States collectively contain approximately 4,200 rooms. Approximately 5% of our revenues were attributed to the operations of these foreign properties in each of 2014, 2013 and 2012, respectively.
The lodging industry is viewed as consisting of six different segments, each of which caters to a discrete set of customer tastes and needs: luxury, upper upscale, upscale, midscale (with and without food and beverage service) and economy. Our portfolio primarily consists of luxury and upper upscale properties that are located in the central business districts of major cities, near airports and resort/conference destinations, which are operated under internationally recognized brand names such as Marriott, Hyatt, Starwood and Accor. There also has been a trend towards more specialized, smaller boutique hotels that are customized towards a particular customer profile. Generally, these properties will be operated by an independent third party and either will have no brand affiliation, or will be associated with a major brand, while maintaining the majority of its independent identity (which we refer to as "soft-branded" properties). We have expanded our investments to include independent and soft-branded properties where we believe that the manager and independent identity is the best fit for the hotel.
Revenues earned at our hotels consist of three broad categories: rooms, food and beverage, and other revenues. While approximately 65% of our revenue is generated from room sales, many of our properties feature a variety of amenities that help drive demand and profitability. Our hotels typically include meeting and banquet facilities, a variety of restaurants and lounges, swimming pools, exercise facilities and/or spas, gift shops and parking facilities, the combination of which enable them to serve business, leisure and group travelers.
Thirty-nine of our consolidated hotels, representing approximately 62% of our revenues, have in excess of 500 rooms. The average age of our properties is 32 years, although substantially all of the properties have benefited from significant renovations or major additions, as well as regularly scheduled renewal and replacement and other capital improvements.
By Brand. The following table details our consolidated hotel portfolio by brand as of February 20, 2015:
|
| Number |
|
|
|
|
|
| Percentage of |
| ||
Brand |
| of Hotels |
|
| Rooms |
|
| Revenues (1) |
| |||
Marriott |
|
| 54 |
|
|
| 30,017 |
|
|
| 48.5 | % |
Ritz-Carlton |
|
| 7 |
|
|
| 2,684 |
|
|
| 7.6 |
|
Starwood: |
|
|
|
|
|
|
|
|
|
|
|
|
Westin |
|
| 13 |
|
|
| 6,907 |
|
|
| 11.4 |
|
Sheraton |
|
| 8 |
|
|
| 6,044 |
|
|
| 9.6 |
|
W |
|
| 3 |
|
|
| 1,390 |
|
|
| 3.2 |
|
St. Regis |
|
| 1 |
|
|
| 232 |
|
|
| 0.6 |
|
The Luxury Collection |
|
| 1 |
|
|
| 139 |
|
|
| 0.1 |
|
Hyatt |
|
| 9 |
|
|
| 6,809 |
|
|
| 12.1 |
|
Hilton/Embassy Suites |
|
| 3 |
|
|
| 1,053 |
|
|
| 1.6 |
|
Swissôtel |
|
| 1 |
|
|
| 661 |
|
|
| 1.0 |
|
Fairmont |
|
| 1 |
|
|
| 450 |
|
|
| 1.8 |
|
Accor: |
|
|
|
|
|
|
|
|
|
|
|
|
ibis |
|
| 4 |
|
|
| 711 |
|
|
| 0.3 |
|
Novotel |
|
| 5 |
|
|
| 862 |
|
|
| 0.7 |
|
Other/Independent |
|
| 4 |
|
|
| 1,124 |
|
|
| 1.5 |
|
|
|
| 114 |
|
|
| 59,083 |
|
|
| 100 |
|
___________ |
|
|
|
|
|
|
|
|
|
|
|
|
(1) | Percentage of revenues is based on 2014 revenues. No individual property contributed more than 7% of total revenues in 2014. |
10
By Location. The following table details the location and number of rooms at our consolidated hotels as of February 20, 2015:
Location |
| Rooms |
|
| Location |
| Rooms |
| ||
Arizona |
|
|
|
|
| Illinois |
|
|
|
|
Scottsdale Marriott Suites Old Town |
|
| 243 |
|
| Chicago Marriott Suites Downers Grove |
|
| 254 |
|
Scottsdale Marriott at McDowell Mountains |
|
| 266 |
|
| Chicago Marriott O'Hare |
|
| 470 |
|
The Ritz-Carlton, Phoenix |
|
| 281 |
|
| Chicago Marriott Suites O'Hare |
|
| 256 |
|
The Westin Kierland Resort & Spa |
|
| 732 |
|
| Courtyard Chicago Downtown/River North |
|
| 337 |
|
California |
|
|
|
|
| Embassy Suites Chicago-Downtown/Lakefront |
|
| 455 |
|
Axiom Hotel |
|
| 151 |
|
| Swissôtel Chicago |
|
| 661 |
|
Coronado Island Marriott Resort & Spa (1) |
|
| 300 |
|
| The Westin Chicago River North |
|
| 424 |
|
Costa Mesa Marriott |
|
| 253 |
|
| Indiana |
|
|
|
|
JW Marriott Desert Springs Resort & Spa |
|
| 884 |
|
| Sheraton Indianapolis Hotel at Keystone Crossing |
|
| 395 |
|
Hyatt Regency San Francisco Airport |
|
| 789 |
|
| The Westin Indianapolis |
|
| 575 |
|
Manchester Grand Hyatt San Diego (1) |
|
| 1,628 |
|
| Louisiana |
|
|
|
|
Manhattan Beach Marriott (1) |
|
| 385 |
|
| New Orleans Marriott |
|
| 1,329 |
|
Marina del Rey Marriott (1) |
|
| 370 |
|
| Maryland |
|
|
|
|
Marriott Marquis San Diego Marina (1) |
|
| 1,360 |
|
| Gaithersburg Marriott Washingtonian Center |
|
| 284 |
|
Newport Beach Marriott Hotel & Spa |
|
| 532 |
|
| Massachusetts |
|
|
|
|
Newport Beach Marriott Bayview |
|
| 254 |
|
| Boston Marriott Copley Place |
|
| 1,144 |
|
San Diego Marriott Mission Valley |
|
| 350 |
|
| Hyatt Regency Cambridge, Overlooking Boston |
|
| 470 |
|
San Francisco Marriott Fisherman's Wharf |
|
| 285 |
|
| Sheraton Boston Hotel |
|
| 1,220 |
|
San Francisco Marriott Marquis (1) |
|
| 1,500 |
|
| Sheraton Needham Hotel |
|
| 247 |
|
San Ramon Marriott (1) |
|
| 368 |
|
| The Westin Waltham-Boston |
|
| 351 |
|
Santa Clara Marriott (1) |
|
| 759 |
|
| Minnesota |
|
|
|
|
Sheraton San Diego Hotel & Marina (1) |
|
| 1,053 |
|
| Minneapolis Marriott City Center (1) |
|
| 583 |
|
The Ritz-Carlton, Marina del Rey (1) |
|
| 304 |
|
| Missouri |
|
|
|
|
The Westin Los Angeles Airport (1) |
|
| 740 |
|
| Kansas City Airport Marriott (1) |
|
| 384 |
|
The Westin Mission Hills Resort & Spa |
|
| 512 |
|
| New Jersey |
|
|
|
|
The Westin South Coast Plaza, Costa Mesa (2) |
|
| 390 |
|
| Newark Liberty International Airport Marriott (1) |
|
| 591 |
|
Colorado |
|
|
|
|
| Park Ridge Marriott (1) |
|
| 289 |
|
Denver Marriott Tech Center Hotel |
|
| 628 |
|
| Sheraton Parsippany Hotel |
|
| 370 |
|
Denver Marriott West (1) |
|
| 305 |
|
| New York |
|
|
|
|
The Westin Denver Downtown |
|
| 430 |
|
| New York Marriott Downtown |
|
| 497 |
|
Florida |
|
|
|
|
| New York Marriott Marquis |
|
| 1,957 |
|
Tampa Airport Marriott (1) |
|
| 298 |
|
| Sheraton New York Times Square Hotel |
|
| 1,780 |
|
Harbor Beach Marriott Resort & Spa (1)(3) |
|
| 650 |
|
| The Westin New York Grand Central |
|
| 774 |
|
Hilton Singer Island Oceanfront Resort |
|
| 222 |
|
| W New York |
|
| 696 |
|
Miami Marriott Biscayne Bay (1) |
|
| 600 |
|
| W New York – Union Square (3) |
|
| 270 |
|
Orlando World Center Marriott |
|
| 2,003 |
|
| Ohio |
|
|
|
|
The Ritz-Carlton, Amelia Island |
|
| 446 |
|
| The Westin Cincinnati (1) |
|
| 456 |
|
The Ritz-Carlton, Naples |
|
| 450 |
|
| Pennsylvania |
|
|
|
|
The Ritz-Carlton Golf Resort, Naples |
|
| 295 |
|
| Four Seasons Hotel Philadelphia |
|
| 357 |
|
YVE Hotel Miami |
|
| 242 |
|
| Philadelphia Airport Marriott (1) |
|
| 419 |
|
Georgia |
|
|
|
|
| Tennessee |
|
|
|
|
Atlanta Marriott Suites Midtown (1) |
|
| 254 |
|
| Sheraton Memphis Downtown |
|
| 600 |
|
Atlanta Marriott Perimeter Center |
|
| 341 |
|
| Texas |
|
|
|
|
Grand Hyatt Atlanta in Buckhead |
|
| 439 |
|
| Houston Airport Marriott at George Bush |
|
|
|
|
JW Marriott Atlanta Buckhead |
|
| 371 |
|
| Intercontinental (1) (3) |
|
| 565 |
|
The Ritz-Carlton, Buckhead |
|
| 510 |
|
| Houston Marriott at the Texas Medical Center (1) |
|
| 394 |
|
The Westin Buckhead Atlanta |
|
| 365 |
|
| JW Marriott Houston |
|
| 515 |
|
Hawaii |
|
|
|
|
| San Antonio Marriott Rivercenter (1) |
|
| 1,001 |
|
Hyatt Regency Maui Resort & Spa |
|
| 806 |
|
| San Antonio Marriott Riverwalk (1) |
|
| 512 |
|
The Fairmont Kea Lani, Maui |
|
| 450 |
|
| The St. Regis Houston |
|
| 232 |
|
Hyatt Place Waikiki Beach |
|
| 426 |
|
|
|
|
|
|
|
|
|
|
|
|
|
|
|
|
|
|
11
|
|
|
|
|
|
|
|
|
|
|
|
|
|
|
|
|
|
|
|
|
|
Virginia |
|
|
|
|
| Brazil (continued) |
|
|
|
|
Hyatt Regency Reston |
|
| 518 |
|
| JW Marriott Hotel Rio de Janeiro |
|
| 245 |
|
Key Bridge Marriott (1) |
|
| 582 |
|
| Novotel Rio de Janeiro Parque Olimpico |
|
| 149 |
|
Residence Inn Arlington Pentagon City |
|
| 299 |
|
| Canada |
|
|
|
|
The Ritz-Carlton, Tysons Corner (1) |
|
| 398 |
|
| Calgary Marriott Downtown |
|
| 384 |
|
Washington Dulles Airport Marriott (1) |
|
| 368 |
|
| Delta Meadowvale Hotel & Conference Centre |
|
| 374 |
|
Westfields Marriott Washington Dulles |
|
| 336 |
|
| Toronto Marriott Downtown Eaton Centre Hotel (1) |
|
| 461 |
|
Washington |
|
|
|
|
| Chile |
|
|
|
|
Seattle Airport Marriott |
|
| 459 |
|
| San Cristobal Tower, Santiago |
|
| 139 |
|
The Westin Seattle |
|
| 891 |
|
| Sheraton Santiago Hotel & Convention Center |
|
| 379 |
|
W Seattle |
|
| 424 |
|
| Mexico |
|
|
|
|
Washington, D.C. |
|
|
|
|
| JW Marriott Hotel Mexico City (3) |
|
| 312 |
|
Grand Hyatt Washington |
|
| 897 |
|
| New Zealand |
|
|
|
|
Hyatt Regency Washington on Capitol Hill |
|
| 836 |
|
| Novotel Auckland Ellerslie |
|
| 147 |
|
JW Marriott Washington D.C. |
|
| 772 |
|
| ibis Ellerslie |
|
| 100 |
|
The Westin Georgetown, Washington, D.C. |
|
| 267 |
|
| Novotel Wellington |
|
| 139 |
|
Washington Marriott at Metro Center |
|
| 459 |
|
| ibis Wellington |
|
| 200 |
|
Australia |
|
|
|
|
| Novotel Queenstown Lakeside |
|
| 273 |
|
Hilton Melbourne South Wharf (1) (3) |
|
| 376 |
|
| Novotel Christchurch Cathedral Square (1) |
|
| 154 |
|
Brazil |
|
|
|
|
| ibis Christchurch (1) |
|
| 155 |
|
ibis Rio de Janeiro Parque Olimpico |
|
| 256 |
|
| Total |
|
| 59,083 |
|
___________ |
|
|
|
|
|
|
|
|
|
|
(1) | The land on which this hotel is built is leased from a third party under one or more lease agreements. |
(2) | The land, building and improvements are leased from a third party under a long-term lease agreement. |
(3) | This property is not wholly owned. |
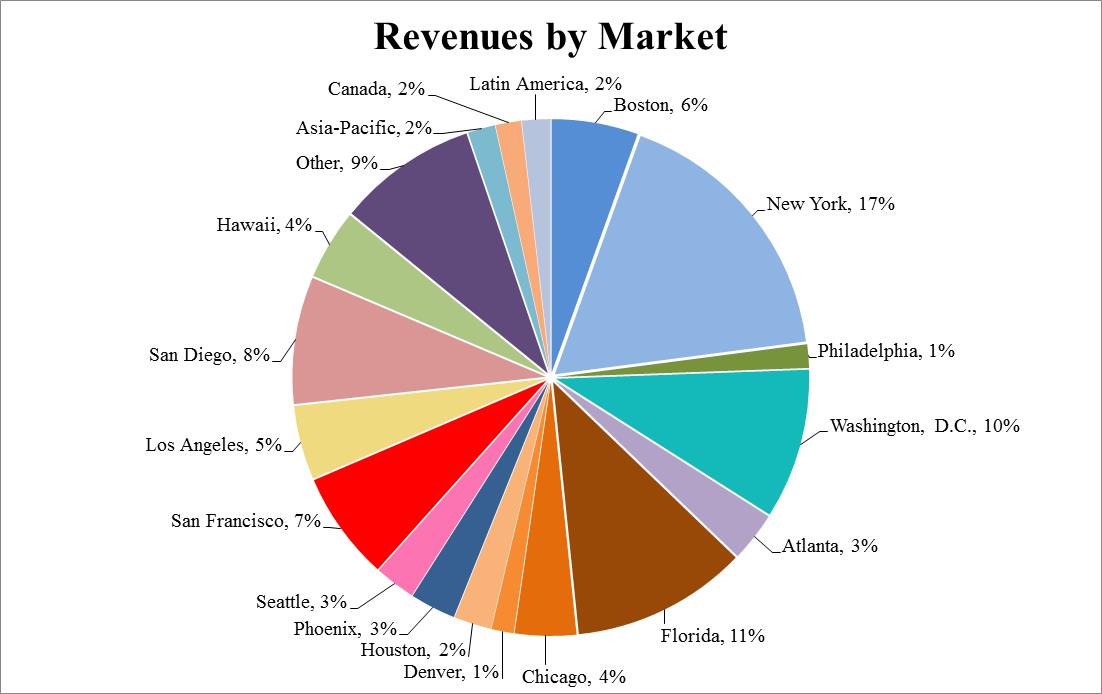
By Market: Since 2004, the percentage of revenues from our target markets in the U.S. and internationally has increased from approximately 65% to 80%. The following graph summarizes the composition of our consolidated hotels by market based on percentage of 2014 revenues (excluding properties owned by our European and Asia/Pacific joint ventures and sold hotels):
12
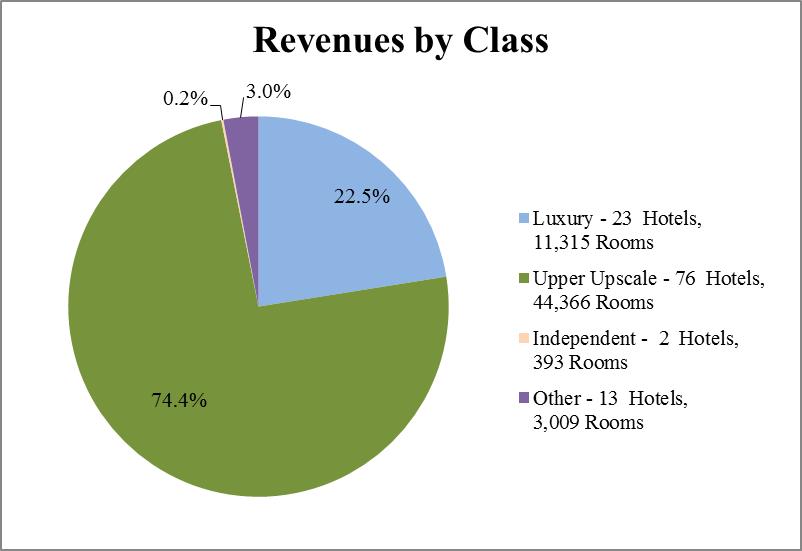
By Class: Historically, we have focused on the upper-upscale and luxury asset classes, as we believe they have broad appeal for both the leisure and business customer. Going forward, we also may broaden our property classes into others, such as urban select-service properties. The following graph summarizes the composition of the 114 hotels in our consolidated portfolio based on the percentage of 2014 revenues represented by our luxury, upper upscale and other categories (excluding properties owned by our European and Asia/Pacific joint ventures and sold hotels):
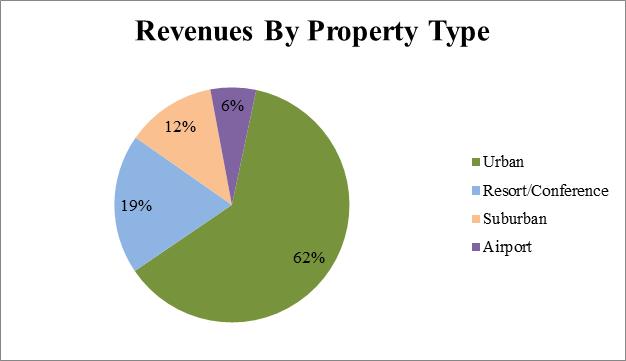
By Type: Our portfolio focus historically has been on gateway markets in urban and resort/conference destinations. The following graph summarizes the composition of the 114 hotels in our consolidated portfolio based on the percentage of 2014 revenues represented by our property type categories (excluding properties owned by our European and Asia/Pacific joint ventures and sold hotels):
Other Real Estate Interests
In addition to our consolidated hotel portfolio, we also own non-controlling interests in several entities that, as of February 20, 2015, owned, or owned an interest in, 25 hotel properties, as detailed below. The operations of the properties owned by these entities
13
are not consolidated and are included in equity in earnings in our consolidated results of operations. See Part II Item 8. "Financial Statements and Supplementary Data – Note 3. Investments in Affiliates."
European Joint Venture. We own a general and limited partnership interest in a joint venture in Europe ("Euro JV") with APG Strategic Real Estate Pool NV, an affiliate of a Dutch Pension Fund, and Jasmine Hotels Pte Ltd, an affiliate of the real estate investment company of the Government of Singapore Investment Corporation Pte Ltd ("GIC RE"). The Euro JV consists of two funds, which we refer to as Euro JV Fund I and Euro JV Fund II. We hold a 32.0% limited partner interest and a 0.1% general partner interest in Euro JV Fund I and a 33.3% limited partner interest and a 0.1% general partner interest in Euro JV Fund II. A subsidiary of Host L.P. acts as the asset manager for the hotels owned by the Euro JV, as well as for one hotel in Paris, France, in exchange for a fee. As of February 20, 2015, the Euro JV owns the following hotels:
Hotel |
| City |
| Country |
| Rooms/Units |
| |
Fund I: |
|
|
|
|
|
|
|
|
Hotel Arts Barcelona |
| Barcelona |
| Spain |
|
| 483 |
|
The Westin Palace, Madrid |
| Madrid |
| Spain |
|
| 467 |
|
Sheraton Roma Hotel & Conference Center |
| Rome |
| Italy |
|
| 640 |
|
The Westin Palace, Milan |
| Milan |
| Italy |
|
| 227 |
|
The Westin Europa & Regina |
| Venice |
| Italy |
|
| 185 |
|
Renaissance Brussels Hotel |
| Brussels |
| Belgium |
|
| 262 |
|
Brussels Marriott Hotel |
| Brussels |
| Belgium |
|
| 221 |
|
Marriott Executive Apartments |
| Brussels |
| Belgium |
|
| 56 |
|
Crowne Plaza Hotel Amsterdam City Centre |
| Amsterdam |
| The Netherlands |
|
| 270 |
|
Sheraton Warsaw Hotel & Towers |
| Warsaw |
| Poland |
|
| 350 |
|
Fund I total rooms |
|
|
|
|
|
| 3,161 |
|
|
|
|
|
|
|
|
|
|
Fund II: |
|
|
|
|
|
|
|
|
Paris Marriott Rive Gauche Hotel & Conference Center |
| Paris |
| France |
|
| 757 |
|
Pullman Bercy Paris |
| Paris |
| France |
|
| 396 |
|
Renaissance Paris La Defense Hotel |
| Paris |
| France |
|
| 327 |
|
Renaissance Paris Vendome Hotel |
| Paris |
| France |
|
| 97 |
|
Renaissance Amsterdam Hotel |
| Amsterdam |
| The Netherlands |
|
| 402 |
|
Le Méridien Piccadilly |
| London |
| United Kingdom |
|
| 280 |
|
Le Méridien Grand Hotel Nuremberg |
| Nuremberg |
| Germany |
|
| 192 |
|
Sheraton Stockholm Hotel |
| Stockholm |
| Sweden |
|
| 465 |
|
Sheraton Berlin Grand Hotel Esplanade |
| Berlin |
| Germany |
|
| 394 |
|
Fund II total rooms |
|
|
|
|
|
| 3,310 |
|
Total European joint venture rooms |
|
|
|
|
|
| 6,471 |
|
|
|
|
|
|
|
|
|
|
Asia/Pacific Joint Venture . We own a 25% interest in a joint venture in Asia (the "Asia/Pacific JV") with RECO Hotels JV Private Limited, an affiliate of GIC RE. Our Asia/Pacific JV owns the 278-room Four Points by Sheraton Perth in Perth, Australia and a 36% non-controlling interest in a joint venture in India with Accor S.A. and InterGlobe Enterprises Limited that owns three hotels, with an additional four hotels under development, totaling 1,750 rooms. The seven hotels in India are or will be operated under the Pullman, Novotel and ibis brands.
Other U.S. Real Estate Investments. Our other domestic real estate investments include the following:
● | We have a non-controlling 50% interest in a joint venture with White Lodging Services that owns the 255-room Hyatt Place Nashville Downtown in Tennessee. |
● | We have a non-controlling 67% interest in a joint venture with Hyatt Residential Group, a subsidiary of Interval Leisure Group, to develop, sell and operate the Hyatt Ka'anapali Beach, A Hyatt Residence Club, a 131-unit vacation ownership project in Maui, Hawaii adjacent to our Hyatt Regency Maui Resort & Spa. The project opened in December 2014. |
● | We have a non-controlling 11% interest in a joint venture that owns the Philadelphia Marriott Downtown following our January 10, 2014 sale of an 89% interest in the property. |
14
Competition
The lodging industry is highly competitive. Competition often is specific to individual markets and is based on a number of factors, including location, brand, guest facilities and amenities, level of service, room rates and the quality of accommodations. The lodging industry is viewed as consisting of six different segments, each of which caters to a discrete set of customer tastes and needs: luxury, upper upscale, upscale, midscale (with and without food and beverage service) and economy. The classification of a property is based on lodging industry standards, which take into consideration many factors such as guest facilities and amenities, level of service and quality of accommodations. Most of our hotels operate in urban and resort markets either as luxury properties under such brand names as Fairmont ® , Grand Hyatt ® , JW Marriott ® , Ritz-Carlton ® , St. Regis ® , The Luxury Collection ® and W ® , or as upper upscale properties under such brand names as Embassy Suites ® , Hilton ® , Hyatt ® , Le Méridien ® , Marriott Executive Apartments ® , Marriott Marquis ® , Marriott Suites ® , Pullman ® , Renaissance ® , Sheraton ® , Swissôtel ® and Westin ® . We also may selectively invest in upscale and midscale properties such as Courtyard by Marriott ® , Crowne Plaza ® , Four Points by Sheraton ® , Hyatt Place ® , ibis ® , Novotel ® or Residence Inn by Marriott ® , particularly in international markets. 1 (1) While our hotels primarily compete with other hotels in the luxury and upper upscale segments, they also may compete with hotels in other lower-tier segments. In addition, many management contracts for our hotels do not prohibit our managers from converting, franchising or developing other hotel properties in our markets. As a result, our hotels compete with other hotels that our managers may own, invest in, manage or franchise.
We believe our properties enjoy competitive advantages associated with the hotel brands under which they operate. The international marketing programs and reservation systems of these brands, combined with the strong management systems and expertise they provide, should enable our properties to perform favorably in terms of both occupancy and room rates. In addition, repeat guest business is enhanced by guest reward or guest recognition programs offered by most of these brands.
We also compete with other REITs and other public and private investors for the acquisition of new properties and investment opportunities, both in domestic and international markets, as we attempt to position our portfolio to take best advantage of changes in markets and travel patterns of our customers.
Seasonality
Our hotel sales traditionally have experienced moderate seasonality, which varies based on the individual property and the region. Hotel sales for our consolidated portfolio averaged approximately 24%, 27%, 24% and 25% for the first, second, third and fourth calendar quarters, respectively, in 2014.
Environmental and Regulatory Matters
Under various federal, state and local environmental laws, ordinances and regulations, a current or previous owner or operator of real property may be liable for the costs of removal or remediation of hazardous or toxic substances. These laws may impose liability whether or not the owner or operator knew of, or was responsible for, the presence of such hazardous or toxic substances. In addition, certain environmental laws and common law principles could be used to impose liability for release of hazardous or toxic materials, and third parties may seek recovery from owners or operators of real properties for personal injury associated with exposure to released hazardous or toxic materials. Environmental laws also may impose restrictions on the manner in which property may be used or businesses may be operated, and these restrictions may require corrective or other expenditures. In connection with our current or prior ownership or operation of hotels, we potentially may be liable for various environmental costs or liabilities. Although currently we are not aware of any material environmental claims pending or threatened against us, we can offer no assurance that a material environmental claim will not be asserted against us in the future.
Employees
As of February 20, 2015 we had 251 employees, of which 228 work in the United States. We had 23 employees located in our offices in London, Amsterdam and Singapore. None of Host's employees are covered by collective bargaining agreements. The number of employees referenced above does not include the hotel employees of our 11 hotels in Brazil, New Zealand and Australia, which, while technically are Host employees, are under the direct supervision and control of our third-party hotel managers. Our third-party managers are responsible for hiring and maintaining the labor force at each of our hotels. Although we do not manage employees at our consolidated hotels, we still are subject to many of the costs and risks generally associated with the hotel labor force, particularly those hotels with unionized labor. We believe relations with the employees of these third party managers are positive. For a discussion of these relationships, see Part I Item 1A. "Risk Factors-We are subject to risks associated with the employment of hotel personnel, particularly with hotels that employ unionized labor."
|
1 (1) (1) | (1) This annual report contains registered trademarks that are the exclusive property of their respective owners, which are companies other than us. None of the owners of these trademarks, their affiliates or any of their respective officers, directors, agents or employees, has or will have any responsibility or liability for any information contained in this annual report. |
15
Employees at certain of our third-party managed hotels are covered by collective bargaining agreements that are subject to review and renewal on a regular basis. For a discussion of these relationships, see Part I Item 1A. "Risk Factors-We are subject to risks associated with the employment of hotel personnel, particularly with hotels that employ unionized labor."
Where to Find Additional Information
The address of our principal executive office is 6903 Rockledge Drive, Suite 1500, Bethesda, Maryland, 20817. Our phone number is 240-744-1000. We maintain an internet website at: www.hosthotels.com. Through our website, we make available free of charge as soon as reasonably practicable after they are filed electronically with, or furnished to, the SEC, our annual reports on Form 10-K, quarterly reports on Form 10-Q, current reports on Form 8-K and amendments to those reports filed or furnished pursuant to Section 13(a) or 15(d) of the Securities Exchange Act of 1934, as amended (the "Exchange Act"). The public also may read and copy any materials we file with the SEC at the SEC's Public Reference Room at 100 F Street, NE, Washington, DC 20549. The public may obtain information on the operation of the Public Reference Room by calling the SEC at 1-800-SEC-0330. The SEC also maintains an Internet site that contains reports, proxy and information statements, and other information regarding issuers that file electronically with the SEC at http://www.sec.gov .
Our website also is a key source of important information about us. We routinely post to the Investor Relations section of our website important information about our business, our operating results and our financial condition and prospects, including, for example, information about material acquisitions and dispositions, our earnings releases and certain supplemental financial information related or complimentary thereto. The website also has a Governance page in the Investor Relations section that includes, among other things, copies of our By-laws, our Code of Business Conduct and Ethics and Conflicts of Interest Policy for our directors, our Code of Business Conduct and Ethics Policy for employees, our Corporate Governance Guidelines and the charters for each standing committee of Host Inc.'s Board of Directors, which currently include the Audit Committee, the Compensation Policy Committee and the Nominating and Corporate Governance Committee. Copies of these charters and policies, Host Inc.'s By-laws and Host L.P.'s partnership agreement also are available in print to stockholders and unitholders upon request to Host Hotels & Resorts, Inc., 6903 Rockledge Drive, Suite 1500, Bethesda, Maryland 20817, Attn: Secretary. Please note that the information contained on our website is not incorporated by reference in, or considered to be a part of, any document, unless expressly incorporated by reference therein.
Item 1A. | Risk Factors |
The statements in this section describe the major risks to our business and should be considered carefully. In addition, these statements constitute our cautionary statements under the Private Securities Litigation Reform Act of 1995.
Financial Risks and Risks of Operation
Our revenues and the value of our properties are subject to conditions affecting the lodging industry.
The performance of the lodging industry traditionally has been affected by the strength of the general economy and, specifically, growth in gross domestic product ("GDP"). Changes in travel patterns of both business and leisure travelers, particularly during periods of economic contraction or low levels of economic growth, may create difficulties for the industry over the long-term and adversely affect our results of operations. The majority of our hotels are classified as luxury or upper upscale and generally target business and high-end leisure travelers. In periods of economic difficulties, business and leisure travelers may seek to reduce travel costs by limiting travel or seeking to reduce costs on their trips. Consequently, our luxury or upper upscale hotels may be more susceptible to a decrease in revenue during an economic downturn, as compared to hotels in other categories that have lower room rates. For instance, reductions in overall travel during the recession in 2008 and 2009 significantly affected our results of operations. Other circumstances affecting the lodging industry which may affect our performance and the forecasts we make include:
● | changes in the international, national, regional and local economic climate; |
● | the effect of terrorist attacks and terror alerts in the United States and internationally, as well as other geopolitical disturbances; |
● | supply growth in markets where we own hotels, which may adversely affect demand at our properties; |
● | the attractiveness of our hotels to consumers relative to competing hotels; |
● | the performance of the managers of our hotels; |
● | outbreaks of disease and the impact on travel of natural disasters and weather; |
● | physical damage to our hotels as a result of earthquakes, hurricanes, or other natural disasters, or the income lost as a result of the damage; |
16
● | changes in room rates and increases in operating costs due to inflation and other factors; |
● | unionization of the labor force at our hotels; and |
● | political uncertainty and changes in government policies, in particular with respect to U.S. economic policy, U.S. federal budget deficit concerns, or a reduction in travel by U.S. government employees and contractors as a result of spending cuts. |
We cannot assure you that adverse changes in the general economy or other circumstances that affect the lodging industry will not have an adverse effect on the hotel revenue or earnings at our properties. A reduction in our revenue or earnings as a result of the above risks may reduce our working capital and revenue, impact our long-term business strategy and impact the value of our assets and our ability to meet certain covenants in our existing debt agreements. In addition, we may incur impairment charges in the future, which charges will affect negatively our results of operations. We can provide no assurance that any impairment loss recognized would not be material to our results of operations.
We depend on external sources of capital for future growth; therefore, any disruption to our ability to access capital at times, and on terms reasonably acceptable to us, may affect adversely our business and results of operations.
Unlike regular C corporations, Host Inc. must finance its growth and fund debt repayments largely with external sources of capital because it is required to distribute to its stockholders at least 90% of its taxable income (other than net capital gain) in order to qualify as a REIT, including taxable income recognized for federal income tax purposes but with regard to which it does not receive cash. Funds used by Host Inc. to make required distributions are provided by distributions from Host L.P. Our ability to access external capital could be hampered by a number of factors, many of which are outside of our control, including:
● | price volatility, dislocations and liquidity disruptions in the U.S. and global equity and credit markets such as occurred during 2008 and 2009; |
● | changes in market perception of our growth potential, including rating agency downgrades by Moody's Investors Service, Standard & Poor's Ratings Services or Fitch Ratings; |
● | decreases in our current and estimated future earnings; |
● | decreases or fluctuations in the market price of the common stock of Host Inc.; |
● | increases in interest rates; and |
● | the terms of our existing indebtedness which, under certain circumstances, restrict our incurrence of debt. |
The occurrence of any of these factors, individually or in combination, could prevent us from being able to obtain the external capital we require on terms that are acceptable to us, or at all, which could have a material adverse effect on our ability to finance our future growth and our results of operations and financial condition. Potential consequences of disruptions in U.S. and global equity and credit markets and, as a result, an inability for us to access external capital at times, and on terms, reasonably acceptable to us could include:
● | a need to seek alternative sources of capital with less attractive terms, such as more restrictive covenants and shorter maturity; |
● | adverse effects on our financial condition and liquidity, and our ability to meet our anticipated requirements for working capital, debt service and capital expenditures; |
● | higher costs of capital; |
● | an inability to enter into derivative contracts in order to hedge risks associated with changes in interest rates and foreign currency exchange rates; or |
● | an inability to execute on our acquisition strategy. |
We have substantial debt and may incur additional debt.
As of December 31, 2014, we and our subsidiaries had total indebtedness of approximately $4.0 billion. Our substantial indebtedness requires us to dedicate a significant portion of our annual cash flow from operations to debt service payments, which reduces the availability of our cash flow to fund working capital, capital expenditures, expansion efforts, dividends and distributions and other general corporate needs. Additionally, our substantial indebtedness could:
● | make it more difficult for us to satisfy our obligations with respect to our indebtedness; |
● | limit our ability in the future to undertake refinancings of our debt or to obtain financing for expenditures, acquisitions, development or other general corporate needs on terms and conditions acceptable to us, if at all; or |
17
● | affect adversely our ability to compete effectively or operate successfully under adverse economic conditions. |
If our cash flow and working capital are not sufficient to fund our expenditures or service our indebtedness, we will be required to raise additional funds through:
● | sales of Host L.P.'s OP units or Host Inc.'s common stock; |
● | the incurrence of additional permitted indebtedness by Host L.P.; or |
● | the sale of our assets. |
We cannot make any assurances that any of these sources of funds will be available to us or, if available, will be on terms that we would find acceptable or in amounts sufficient to meet our obligations or fulfill our business plan. Under certain circumstances, we would be required to use the cash from some of the events described above to repay other indebtedness.
The terms of our indebtedness and preferred units place restrictions on us and our subsidiaries and these restrictions reduce our operational flexibility and create default risks.
We are, and may in the future become, party to agreements and instruments that place restrictions on us and our subsidiaries. For instance, the covenants in the documents governing the terms of our senior notes and our credit facility restrict, among other things, our ability to:
● | conduct acquisitions, mergers or consolidations, unless the successor entity in such transaction assumes our indebtedness; |
● | incur additional debt in excess of certain thresholds and without satisfying certain financial metrics; |
● | incur liens securing indebtedness, unless an effective provision is made to secure our other indebtedness by such liens; |
● | sell assets without using the proceeds from such sales for certain permitted uses or to make an offer to repay or repurchase outstanding indebtedness; |
● | pay dividends on classes and series of Host Inc. capital stock and pay distributions on Host L.P.'s classes of units without satisfying certain financial metrics concerning leverage, fixed charge coverage and unsecured interest coverage; and |
● | conduct transactions with affiliates other than on an arm's length basis and, in certain instances, without obtaining opinions as to the fairness of such transactions. |
In addition, certain covenants in our credit facility also require us and our subsidiaries to meet financial metrics. The restrictive covenants in the applicable indenture(s), the credit facility and the documents governing our other debt (including our mortgage debt) will reduce our flexibility in conducting our operations and will limit our ability to engage in activities that may be in our long-term best interest. Failure to comply with these restrictive covenants could result in an event of default that, if not cured or waived, could result in the acceleration of all or a substantial portion of our debt. In addition, certain of our mortgage debt requires that, to the extent cash flow from the hotels which secure such debt drops below stated levels, we escrow cash flow after the payment of debt service until operations improve above the stated levels. In some cases, the lender may apply the escrowed amount to the outstanding balance of the mortgage debt. If such provisions are triggered, the amounts required to be escrowed may affect negatively our liquidity from these mortgaged properties by limiting our access to cash flow after debt service. For a detailed description of the covenants and restrictions imposed by the documents governing our indebtedness, see Part II Item 7. "Management's Discussion and Analysis of Financial Condition and Results of Operations-Financial Condition."
An increase in interest rates would increase the interest costs on our credit facility and on our floating rate debt and could impact adversely our ability to refinance existing debt or sell assets.
Interest payments for borrowings on our credit facility, the mortgages on certain properties and fixed-to-floating interest rate swaps linked to two other properties are based on floating rates. As a result, an increase in interest rates will reduce our cash flow available for other corporate purposes, including investments in our portfolio. Rising interest rates also could limit our ability to refinance existing debt when it matures and increase interest costs on any debt that is refinanced. We may from time to time enter into agreements such as interest rate swaps, caps, floors and other interest rate hedging contracts. Currently, the majority of our mortgages with floating rates are fully or partially hedged through the use of floating-to-fixed interest rate swaps or interest rate caps and floors. While these agreements may lessen the impact of rising interest rates, they also expose us to the risk that other parties to the agreements will not perform or that the agreements will be unenforceable. In addition, an increase in interest rates could decrease the amount third parties are willing to pay for our assets, thereby limiting our ability to dispose of assets as part of our business strategy.
18
Our expenses may not decrease if our revenue decreases.
Many of the expenses associated with owning and operating hotels, such as debt-service payments, property taxes, insurance, utilities, and employee wages and benefits, are relatively inflexible. They do not necessarily decrease in tandem with a reduction in revenue at the hotels and may be subject to increases that are not tied to the performance of our hotels or the increase in the rate of inflation generally. Also, as of December 31, 2014, 35 of our hotels are subject to third-party ground leases, which generally require periodic increases in ground rent payments. Our ability to pay these rents could be affected adversely if our hotel revenues do not increase at the same or a greater rate than the increases in rental payments under the ground leases.
Additionally, certain costs, such as wages, benefits and insurance, may exceed the rate of inflation in any given period. In the event of a significant decrease in demand, our hotel managers may not be able to reduce the size of hotel work forces in order to decrease wages and benefits. Our managers also may be unable to offset any fixed or increased expenses with higher room rates. Any of our efforts to reduce operating costs also could adversely affect the future growth of our business and the value of our hotel properties.
Our acquisition of additional properties may have a significant effect on our business, liquidity, financial position and/or results of operations.
As part of our business strategy, we seek to acquire primarily luxury and upper upscale hotel properties. We may acquire properties through various structures, including transactions involving portfolios, single assets, joint ventures and acquisitions of all or substantially all of the securities or assets of other REITs or similar real estate entities. We anticipate that our acquisitions will be financed through a combination of methods and a variety of sources of external capital, including proceeds from Host Inc. equity offerings, issuance of limited partnership interests of Host L.P., advances under our credit facility, the incurrence or assumption of indebtedness and proceeds from the sales of assets. Our inability to access external sources of capital may limit our ability to finance acquisitions. For a discussion of factors that may limit our access to sources of capital, see "-We depend on external sources of capital for future growth; therefore, any disruption to our ability to access capital at times, and on terms reasonably acceptable to us, may affect adversely our business and results of operations." In addition, certain of these factors, such as disruption in the global capital markets, may limit the ability of purchasers to finance their acquisition of our hotels and therefore our ability to use disposition proceeds to finance our acquisitions.
We routinely are actively engaged in the process of identifying, analyzing and negotiating possible acquisition transactions. We cannot provide any assurances that we will be successful in consummating future acquisitions on favorable terms or that we will realize the benefits that we anticipate from such acquisitions. Our failure to realize the intended benefits from one or more acquisitions could have a significant adverse effect on our business, liquidity, financial position and/or results of operations. These adverse effects may occur because the performance of the property does not justify the additional indebtedness and related interest expense that we incurred as a result of the acquisition. In addition, assets and entities that we have acquired, or may in the future acquire, may be subject to unknown or contingent liabilities for which we may have no recourse, or only limited recourse, against the sellers. In general, the representations and warranties provided under the transaction agreements may not survive long enough for us to become aware of such liabilities and seek recourse against our sellers and indemnification covering representations and warranties often is limited and subject to various materiality thresholds, a significant deductible or an aggregate cap on losses. As a result, there is no guarantee that we will recover any amounts with respect to losses due to breaches by the sellers of their representations and warranties. The total amount of costs and expenses that may be incurred with respect to liabilities associated with acquired hotels and entities may exceed our expectations, plus we may experience other unanticipated adverse effects, all of which may affect adversely our revenues, expenses, operating results and financial condition. Finally, indemnification agreements between us and the sellers typically provide that the sellers will retain certain specified liabilities relating to the assets and entities acquired by us. While the sellers generally are contractually obligated to pay all losses and other expenses relating to such retained liabilities without regard to survival limitations, materiality thresholds, deductibles or caps on losses, there can be no guarantee that such arrangements will not require us to incur losses or other expenses in addition to those incurred by the sellers.
We may not achieve the value we anticipate from new hotel developments or value enhancement projects at our existing hotels.
We currently are, and in the future may be, involved in the development of hotel properties, timeshare units or other alternate uses of portions of our existing properties, including the development of retail, office or apartments, including through joint ventures. There are risks inherent in any new development, including:
● | We may not obtain the zoning, occupancy and other required governmental permits and authorizations necessary to complete the development. A delay in receiving these approvals could affect adversely the returns we expect to receive. |
● | Any new construction involves the possibility of construction delays and cost overruns that may increase project costs. |
● | Defects in design or construction may result in delays and additional costs to remedy the defect or require a portion of a property to be closed during the period required to rectify the defect. |
19
● | We may not be able to meet the loan covenants in any financing obtained to fund the new development, creating default risks. |
● | The development of timeshare units could become less attractive due to decreases in demand for residential, fractional or interval ownership, increases in mortgage rates and/or decreases in mortgage availability, market absorption or oversupply, with the result that we may not be able to sell the timeshares for a profit or at the prices or selling pace we anticipate. |
In addition, to the extent that developments are conducted through joint ventures, this creates additional risks, including the possibility that our partners may not meet their financial obligations or could have or develop business interests, policies or objectives that are inconsistent with ours. See "-We may acquire hotel properties through joint ventures with third parties that could result in conflicts."
Any of the above factors could affect adversely our and our partners' ability to complete the developments on schedule and along the scope that currently is contemplated, or to achieve the intended value of these projects. For these reasons, there can be no assurances as to the value to be realized by the company from these transactions or any future similar transactions.
We do not control our hotel operations and we are dependent on the managers of our hotels.
To maintain our status as a REIT, we are not permitted to operate any of our hotels. As a result, we have entered into management agreements with third-party managers to operate our hotel properties. For this reason, we are unable to directly implement strategic business decisions with respect to the daily operation and marketing of our hotels, such as decisions with respect to the setting of room rates, food and beverage pricing and certain similar matters. Although we consult with our hotel operators with respect to strategic business plans, the hotel operators are under no obligation to implement any of our recommendations with respect to these matters. While we monitor the hotel managers' performance, we have limited recourse under our management agreements if we believe that the hotel managers are not performing adequately. The cash flow from our hotels may be affected adversely if our managers fail to provide quality services and amenities or if they or their affiliates fail to maintain a quality brand name. Because our management agreements are long-term agreements, we also may not be able to terminate these agreements if we believe the manager is not performing adequately.
From time to time, we have had, and continue to have, differences with the managers of our hotels over their performance and compliance with the terms of our management agreements. We generally resolve issues with our managers through discussions and negotiations. However, if we are unable to reach satisfactory results through discussions and negotiations, we may choose to litigate the dispute or submit the matter to third-party dispute resolution. Failure by our hotel managers to fully perform the duties agreed to in our management agreements or the failure of our managers to adequately manage the risks associated with hotel operations could affect adversely our results of operations.
In addition, our hotel managers or their affiliates manage, and in some cases own, have invested in, or provided credit support or operating guarantees to hotels that compete with our hotels, all of which may result in conflicts of interest. As a result, our hotel managers have in the past made, and may in the future make, decisions regarding competing lodging facilities that are not or would not be in our best interest.
Furthermore, our management agreements generally have provisions that can restrict our ability to sell, lease or otherwise transfer our hotels, unless the transferee is not a competitor of the manager and the transferee assumes the related management agreements and meets specified other conditions. Our ability to finance or sell our properties, depending upon the structure of such transactions, may require the manager's consent. Similarly, decisions with respect to a repositioning of a hotel, such as the outsourcing of food and beverage outlets, may require the manager's consent.
We are subject to risks associated with the employment of hotel personnel, particularly with hotels that employ unionized labor.
Our third-party managers are responsible for hiring and maintaining the labor force at each of our hotels. Although we do not directly employ or manage employees at our consolidated hotels (other than employing, but not managing or supervising, the associates at our properties in Brazil, New Zealand and Australia), we still are subject to many of the costs and risks generally associated with the hotel labor force, particularly at those hotels with unionized labor. From time to time, hotel operations may be disrupted as a result of strikes, lockouts, public demonstrations or other negative actions and publicity. We also may incur increased legal costs and indirect labor costs as a result of contract disputes involving our third-party managers and their labor force or other events. The resolution of labor disputes or re-negotiated labor contracts could lead to increased labor costs, a significant component of our hotel operating costs, either by increases in wages or benefits or by changes in work rules that raise hotel operating costs. As we are not the employer nor bound by any collective bargaining agreement, we do not negotiate with any labor organization, and it is the responsibility of each property's manager to enter into such labor contracts. Our ability, if any, to have any material impact on the
20
outcome of these negotiations is restricted by and dependent on the individual management agreement covering a specific property and we may have little ability to control the outcome of these negotiations.
Our hotels have an ongoing need for renovations and potentially significant capital expenditures in order to remain competitive in the marketplace, maintain brand standards or to comply with applicable laws or regulations. The timing and costs of such renovations or improvements may result in reduced operating performance during construction and may not improve the return on these investments.
We are required by our loan agreements or agreements with our hotel managers to make agreed upon capital expenditures. In addition, we will need to make further capital expenditures in order to remain competitive with other hotels, to maintain the economic value of our hotels and to comply with applicable laws and regulations. The timing of these improvements can affect hotel performance, particularly if the improvements require closure of a significant number of rooms or other features of the hotels, such as ballrooms, meeting space and restaurants. These capital improvements reduce the availability of cash for other purposes and are subject to cost overruns and delays. In addition, because we depend on external sources of capital, we may not have the necessary funds to invest and, if we fail to maintain our properties in accordance with brand standards set by our managers, the manager may terminate the management agreement. Moreover, we may not necessarily realize a significant, or any, improvement in the performance of the hotels in which we make these investments.
Our hotels are geographically concentrated in a limited number of large urban gateway cities and, accordingly, we could be disproportionately harmed by adverse changes to these markets, a natural disaster or threat of a terrorist attack.
The concentration of our hotels in a limited number of large urban gateway cities exposes us to greater risk to local economic or business conditions, changes in hotel supply in these cities, and other conditions than more geographically diversified hotel companies. Hotels in New York, Washington, DC, San Diego, San Francisco, Boston, Florida, Hawaii, Atlanta, and Los Angeles represented approximately 71% of our 2014 revenues. An economic downturn, an increase in hotel supply in these cities, a natural disaster, a terrorist attack or similar disaster in any one of these cities likely would cause a decline in the hotel market and adversely affect occupancy rates, the financial performance of our hotels in these cities and our overall results of operations. For example, in October 2012, our operations in New York City and other East Coast properties were impacted negatively by Hurricane Sandy. In 2013, decreased U.S. government demand for hotel rooms (approximately 5% of our business) in markets such as Washington, D.C. had a negative impact on our results of operations for the year.
In addition, certain of our hotels are located in markets that are more susceptible to natural disasters than others, which could adversely affect those hotels, the local economies, or both. For instance, our hotels in Florida may be susceptible to hurricanes, while our hotels in California may be susceptible to earthquakes.
The threat of terrorism also may negatively impact hotel occupancy and average daily rate, due to resulting disruptions in business and leisure travel patterns and concerns about travel safety. Hotels in major metropolitan areas, such as the gateway cities that represent our target markets, may be particularly adversely affected due to concerns about travel safety. The possibility of future attacks may hamper business and leisure travel patterns and, accordingly, the performance of our business and our operations.
The ownership of hotels outside the United States and the expansion of our business into new markets outside of the United States will expose us to risks related to owning hotels in those international markets.
Part of our business strategy is to expand our presence outside of the United States. As of December 31, 2014, we own directly 17 hotels located outside of the United States. We also are party to a joint venture that owns 19 hotels in Europe and to a joint venture that owns one hotel in Australia and a non-controlling interest in three hotels currently open and four hotels in development in India. We may have difficulty managing our expansion into new geographic markets where we have limited knowledge and understanding of the local economy, an absence of business relationships in the area, or unfamiliarity with local governmental and permitting procedures and regulations. There are risks inherent in conducting business outside of the United States, which include:
● | risks of non-compliance with varied and unfamiliar employment laws and practices; |
● | tax laws, which may provide for income or other taxes or tax rates that exceed those of the U.S. and which may provide that foreign earnings that are repatriated, directly or indirectly, are subject to dividend withholding tax requirements or other restrictions and which may affect our ability to repatriate non-U.S. earnings in a tax efficient manner; |
● | compliance with and unexpected changes in regulatory requirements or monetary policy; |
● | the willingness of domestic or international lenders to provide financing and changes in the availability, cost and terms of such financing; |
● | adverse changes in local, political, economic and market conditions; |
21
● | insurance coverage related to terrorist events; |
● | changes in interest rates and/or currency exchange rates and difficulties in hedging these risks; |
● | regulations regarding the incurrence of debt; |
● | difficulties involved in managing an organization doing business in many different countries; and |
● | difficulties in complying with U.S. rules governing REITs while operating outside of the United States. |
Any of these factors could affect adversely our ability to obtain all of the intended benefits of our international expansion. If we do not effectively manage this expansion and successfully integrate the international hotels into our organization, our operating results and financial condition may be adversely affected.
We may acquire hotel properties through joint ventures with third parties that could result in conflicts.
We have made investments in joint ventures and are exploring further investment opportunities in the United States, Asia, Europe and Latin America. We may, from time to time, invest as a co-venturer in other entities holding hotel properties instead of purchasing hotel properties directly. We also may sell interests in existing properties to a third party as part of forming a joint venture with such third party. Investments in joint ventures may involve risks not present were a third party not involved, including the possibility that partners or co-venturers might become bankrupt or fail to fund their share of required capital contributions. Co-venturers often share control over the operation of a joint venture. Actions by a co-venturer also could subject the assets to additional risks as a result of any of the following circumstances:
● | our co-venturer might have economic or business interests or goals that are inconsistent with our, or the joint venture's, interests or goals; or |
● | our co-venturer may be in a position to take action contrary to our instructions or requests, or contrary to our policies or objectives. |
Although generally we will seek to maintain sufficient control of any joint venture in order to permit our objectives to be achieved, we might not be able to take action without the approval of our joint venture partners. Disputes between us and partners or co-venturers may result in litigation or arbitration that would increase our expenses and may negatively impact operations.
We may not be able to recover fully under our existing terrorism insurance program for losses caused by some types of terrorist acts, and neither U. S. nor foreign terrorism insurance laws or regulations ensure that we will be able to obtain terrorism insurance in adequate amounts or at acceptable premium levels in the future.
We generally obtain terrorism insurance to cover property damage caused by acts of terrorism under separate standalone policies of insurance as well as policies on U.S. properties which currently are subject to U.S. federal government cost sharing as provided in the Terrorism Risk Insurance Program Reauthorization Act ("TRIPRA"). On January 12, 2015, President Obama signed into law H.R. 26, which extended TRIPRA through December 31, 2020. We also have terrorism insurance under our general liability program and in our program for directors' and officers' coverage. We also obtain terrorism insurance to cover some of our foreign properties through insurance programs involving or administered by foreign governments. We may not be able to recover fully under our existing terrorism insurance policies for losses caused by some types of terrorist acts, and neither U.S. nor foreign terrorism insurance legislation or regulations ensure that we will be able to obtain terrorism insurance in adequate amounts or at acceptable premium levels in the future.
While TRIPRA allows direct insurers to be reimbursed for certain losses they incur on U.S. properties resulting from nuclear, biological, chemical and radiological ("NBCR") perils, TRIPRA does not require insurers to offer coverage for these perils and, to date, insurers are not willing to provide this coverage, even with government reimbursement. Any damage related to war and to NBCR incidents, therefore, is excluded under policies covering our U.S. properties. Moreover, many of our foreign properties are not covered against NBCR perils. We obtain a certain amount of property insurance coverage on our U.S. properties for NBCR perils through our wholly-owned subsidiary that acts as our direct insurer against such perils to the extent of reimbursement under TRIPRA. We ultimately are responsible for any loss borne by our insurance subsidiary.
As a result of the above, there remains uncertainty regarding the adequacy and cost of terrorism coverage that will be available to protect our interests in the event of terrorist attacks that impact our properties.
22
Some potential losses are not covered by insurance.
We, or our hotel managers, carry comprehensive insurance coverage for general liability, property, business interruption and other risks with respect to all of our hotels and other properties. These policies offer coverage features and insured limits that we believe are customary for similar types of properties. Generally, our "all-risk" property policies provide coverage that is available on a per-occurrence basis and that, for each occurrence, has an overall limit, as well as various sub-limits, on the amount of insurance proceeds we can receive. Sub-limits exist for certain types of claims, such as service interruption, debris removal, expediting costs, landscaping replacement and natural disasters such as earthquakes, floods and hurricanes, and may be subject to annual aggregate coverage limits. The dollar amounts of these sub-limits are significantly lower than the dollar amounts of the overall coverage limit. In this regard, hotels in certain of our markets, including California, Florida and New Zealand, have in the past been and continue to be particularly susceptible to damage from natural disasters. Recovery under the applicable policies also is subject to substantial deductibles and complex calculations of lost business income. There is no assurance that this insurance, where maintained, will fully fund the re-building or restoration of a hotel that is impacted by an earthquake, hurricane, or other natural disaster, or the income lost as a result of the damage. Our property policies also provide that all of the claims from each of our properties resulting from a particular insurable event must be combined together for purposes of evaluating whether the aggregate limits and sub-limits contained in our policies have been exceeded and, in the case where the manager of one of our hotels provides this coverage, any such claims will be combined with the claims of other owners participating in the manager's program for the same purpose. Therefore, if an insurable event occurs that affects more than one of our hotels, or, in the case of hotels where coverage is provided by the manager, affects hotels owned by others, the claims from each affected hotel will be added together to determine whether the aggregate limit or sub-limits, depending on the type of claim, have been reached. Each affected hotel only may receive a proportional share of the amount of insurance proceeds provided for under the policy if the total value of the loss exceeds the aggregate limits available. We may incur losses in excess of insured limits and, as a result, we may be even less likely to receive complete coverage for risks that affect multiple properties, such as earthquakes, hurricanes, or certain types of terrorism.
In addition, there are other risks, such as certain environmental hazards, that may be deemed to fall completely outside the general coverage limits of our policies or may be uninsurable or too expensive to justify coverage. We also may encounter challenges with an insurance provider regarding whether it will pay a particular claim that we believe to be covered under our policy. Should a loss in excess of insured limits or an uninsured loss occur, or should we be unsuccessful in obtaining coverage from an insurance carrier, we could lose all or a part of the capital we have invested in a property, as well as the anticipated future revenue from the hotel. In that event, we might nevertheless remain obligated for any mortgage debt or other financial obligations related to the property.
Cyber threats and the risk of data breaches or disruptions of our managers' or our own information technology systems could materially adversely affect our business.
Our third party hotel managers are dependent on information technology networks and systems, including the internet, to access, process, transmit and store proprietary and customer information. These complex networks include reservation systems, vacation exchange systems, hotel management systems, customer databases, call centers, administrative systems, and third party vendor systems. These systems require the collection and retention of large volumes of personally identifiable information of hotel guests, including credit card numbers. Our hotel managers may store and process such proprietary and customer information both on systems located at the hotels we own and other hotels operated by our third party managers, their corporate locations and at third-party owned facilities, including for example, in a third-party hosted cloud environment. These information networks and systems can be vulnerable to threats such as system, network or internet failures; computer hacking or business disruption; cyber-terrorism; viruses, worms or other malicious software programs; and employee error, negligence or fraud. The risks from these cyber threats are significant. We rely on the security systems of our mangers to protect proprietary and customer information from these threats. Any compromise of our managers' networks could result in a disruption to operations, such as disruptions in fulfilling guest reservations, delayed bookings or sales, or lost guest reservations. Any of these events could, in turn, result in disruption of the operations of the hotels we own that our managed by them, in increased costs and in potential litigation and liability. In addition, public disclosure, or loss of customer or proprietary information could result in damage to the manager's reputation and a loss of confidence among hotel guests and result in reputational harm for the hotels owned by us and managed by them, which may have a material adverse effect on our business, financial condition and results of operations.
In addition to the information technologies and systems of our managers used to operate our hotels, we have our own corporate technologies and systems that are used to access, store, transmit, and manage or support a variety of business processes. There can be no assurance that the security measures we have taken to protect the contents of these systems will prevent failures, inadequacies or interruptions in system services or that system security will not be breached through physical or electronic break-ins, computer viruses, and attacks by hackers. Disruptions in service, system shutdowns and security breaches in the information technologies and systems we use, including unauthorized disclosure of confidential information, could have a material adverse effect on our business, our financial reporting and compliance, and subject us to liability claims or regulatory penalties which could be significant.
23
Litigation judgments or settlements could have a significant adverse effect on our financial condition.
We are involved in various legal proceedings in the normal course of business and are vigorously defending these claims; however, no assurances can be given as to the outcome of any pending legal proceedings. We believe, based on currently available information, that the results of such proceedings, in the aggregate, will not have a material adverse effect on our financial condition, but might be material to our operating results for any particular period, depending, in part, upon the operating results for such period. We also could become the subject of future claims by the operators of our hotels, individuals or companies who use our hotels, our investors, our joint venture partners or regulating entities and these claims could have a significant adverse effect on our financial condition and performance.
We depend on our key personnel.
Our continued success depends on the efforts and abilities of our executive officers and other key personnel. None of our key personnel have employment agreements and we do not maintain key person life insurance for any of our executive officers. These individuals are important to our business and strategy and to the extent that any of them departs and is not replaced with a qualified substitute, such person's departure could harm our operations and financial condition.
Exchange rate fluctuations could affect adversely our financial results.
As a result of the expansion of our international operations, currency exchange rate fluctuations could affect our results of operations and financial position. We generate revenue and expenses in such foreign currencies as the Euro, the Canadian dollar, the Mexican peso, the Australian dollar, the New Zealand dollar, the British pound sterling, the Polish zloty, Swedish krona, the Brazilian real, the Indian rupee and the Chilean peso. Although we may enter into foreign exchange agreements with financial institutions and/or obtain local currency mortgage debt in order to reduce our exposure to fluctuations in the value of these and other foreign currencies, these transactions, if entered into, will not eliminate entirely that risk. To the extent that we are unable to match revenue received in foreign currencies with expenses paid in that same currency, exchange rate fluctuations could have a negative impact on our results of operations and financial condition. Additionally, because our consolidated financial results are reported in U.S. dollars, if we generate revenues or earnings in other currencies, the conversion of such amounts to U.S. dollars can result in an increase or decrease in the amount of our revenues or earnings.
Similarly, changes in the exchange rates of foreign currencies against the U.S. dollar can result in increases or decreases in demand at our U.S. properties from international travelers coming to the United States. Because of the concentration of our hotels in U.S. gateway cities, we may have more exposure to fluctuations in international travel to the United States than other lodging companies not located as heavily in these markets.
Applicable REIT laws may restrict certain business activities.
As a REIT, Host Inc. is subject to various restrictions on the types of income it can earn, assets it can own and activities in which it can engage. Business activities that could be restricted by applicable REIT laws include, but are not limited to, activities such as developing alternative uses of real estate, including the development and/or sale of timeshare or condominium units. Due to these restrictions, we anticipate that we will conduct certain business activities, including those mentioned above, in one or more of our taxable REIT subsidiaries. Our taxable REIT subsidiaries are taxable as regular C corporations and are subject to federal, state, local, and, if applicable, foreign taxation on their taxable income.
Environmental problems are possible and can be costly.
We believe that our properties comply in all material respects with applicable environmental laws. Unidentified environmental liabilities could arise, however, and could have a material adverse effect on our financial condition and performance. Additionally, even after we have sold a property, we may be liable for environmental liabilities that occurred during our ownership. Federal, state and local laws and regulations relating to the protection of the environment may require a current or previous owner or operator of real estate to investigate and remediate hazardous or toxic substances or petroleum product releases at the property. The owner or operator may be required to pay a governmental entity or third parties for property damage, and for investigation and remediation costs incurred by the parties in connection with the contamination. These laws typically impose clean-up responsibility and liability without regard to whether the owner or operator knew of or caused the presence of the contaminants. Even if more than one person may have been responsible for the contamination, each person covered by the environmental laws may be held responsible for all of the clean-up costs incurred. In addition, third parties may sue the owner or operator of a site for damages and costs resulting from environmental contamination emanating from that site. Environmental laws also govern the presence, maintenance and removal of toxic or hazardous substances. These laws require that owners or operators of buildings properly manage and maintain these substances and notify and train those who may come into contact with them and undertake special precautions. These laws may impose fines and penalties on building owners or operators who fail to comply with these requirements and may allow third parties to seek recovery from owners or operators for personal injury associated with exposure to toxic or hazardous materials.
24
Compliance with other government regulations can be costly.
Our hotels are subject to various other forms of regulation, including Title III of the Americans with Disabilities Act ("ADA"), building codes and regulations pertaining to fire and life safety. Under the ADA, all public accommodations are required to meet certain federal rules related to access and use by disabled persons. These laws and regulations may be changed from time-to-time, or new regulations adopted, resulting in additional costs of compliance, including potential litigation. For example, the ADA was revised substantially in September 2010 and our facilities were required to comply with the new regulations by March 15, 2012. A determination that we are not in compliance with the ADA could result in a court order to bring the hotel into compliance, imposition of civil penalties in cases brought by the Justice Department, or an award of attorneys' fees to private litigants. Compliance with the ADA and other laws and regulations could require substantial capital expenditures. Any increased costs could have a material adverse effect on our business, financial condition or results of operations.
In addition, the operations of our international properties are subject to a variety of United States and international laws and regulations, including the United States Foreign Corrupt Practices Act ("FCPA"). We have policies and procedures designed to promote compliance with the FCPA and other anti-corruption laws, but we cannot assure you that we will continue to be found to be operating in compliance with, or be able to detect violations of, any such laws or regulations. In addition, we cannot predict the nature, scope or effect of future regulatory requirements to which our international properties might be subject and the manner in which existing laws might be administered or interpreted.
Risks of Ownership of Host Inc.'s Common Stock
There are limitations on the acquisition of Host Inc. common stock and changes in control.
Host Inc.'s charter and by-laws, the partnership agreement of Host L.P., and the Maryland General Corporation Law (the "MGCL") contain a number of provisions, the exercise or existence of which could delay, defer or prevent a transaction or a change in control that might involve a premium price for Host Inc.'s stockholders or Host L.P.'s unitholders or otherwise be in their best interests, including the following:
● | Restrictions on transfer and ownership of Host Inc.'s stock. To maintain Host Inc.'s qualification as a REIT for federal income tax purposes, not more than 50% in value of Host Inc.'s outstanding shares of capital stock may be owned in the last half of the taxable year, directly or indirectly, by five or fewer individuals, which, as defined in the Code, may include certain entities. In addition, if Host Inc., or one or more owners of 10% or more of Host Inc., actually or constructively owns 10% or more of a tenant of Host Inc. or a tenant of any partnership in which Host Inc. is a partner, the rent received by Host Inc. either directly or through any such partnership from such tenant generally will not be qualifying income for purposes of the REIT income qualification tests of the Code, and, therefore, could jeopardize Host Inc.'s qualification as a REIT, unless the tenant qualifies as a TRS and certain other requirements are met. |
Accordingly, Host Inc.'s charter prohibits ownership, directly or by attribution, by any person or persons acting as a group, of more than 9.8% in value or number, whichever is more restrictive, of shares of Host Inc.'s outstanding common stock, preferred stock or any other class or series of stock, each considered as a separate class or series for this purpose. Together, these limitations are referred to as the "ownership limit."
Stock acquired or held in violation of the ownership limit will be transferred automatically to a trust for the benefit of a designated charitable beneficiary, and the intended acquirer of the stock in violation of the ownership limit will not be entitled to any distributions thereon, to vote those shares of stock or to receive any proceeds from the subsequent sale of the stock in excess of the lesser of the price paid for the stock or the amount realized from the sale. A transfer of shares of Host Inc.'s stock to a person who, as a result of the transfer, violates the ownership limit may be void under certain circumstances, and, in any event, would deny that person any of the economic benefits of owning shares of Host Inc.'s stock in excess of the ownership limit. These restrictions will not apply if Host Inc.'s Board of Directors determines that it no longer is in Host Inc.'s best interests to continue to qualify as a REIT or that compliance with the restrictions on transfer and ownership no longer is required for Host Inc. to qualify as a REIT.
● | Removal of members of the Board of Directors. Host Inc.'s charter provides that, except for any directors who may be elected by holders of a class or series of shares of capital stock other than common stock, directors may be removed only for cause and by the affirmative vote of stockholders holding at least two-thirds of all the votes entitled to be cast in the election of directors. Vacancies on Host Inc.'s Board of Directors may be filled, at any regular meeting or at any special meeting called for that purpose, by the affirmative vote of the remaining directors, except that a vacancy resulting from an increase in the number of directors may be filled by a majority vote of the entire Board of Directors. Any vacancy resulting from the removal of a director by the stockholders may be filled by the affirmative vote of holders of at least two-thirds of the votes entitled to be cast in the election of directors. |
25
● | Preferred shares; classification or reclassification of unissued shares of capital stock without stockholder approval. Host Inc.'s charter provides that the total number of shares of stock of all classes that Host Inc. has authority to issue is 1,100,000,000, consisting of 1,050,000,000 shares of common stock and 50,000,000 shares of preferred stock. Host Inc.'s Board of Directors has the authority, without a vote of stockholders, to classify or reclassify any unissued shares of stock into other classes or series of stock, and to establish the terms, preferences, conversion or other rights, voting powers, restrictions, limitations as to dividends and other distributions, qualifications and terms or conditions of redemption for each class or series. Because Host Inc.'s Board of Directors has this power, it may give the holders of any class or series of stock terms, preferences, powers and rights, including voting rights, senior to the rights of holders of existing stock. |
● | Certain provisions of Maryland law may limit the ability of a third-party to acquire control of Host Inc. Certain provisions of the MGCL may have the effect of inhibiting a third-party from acquiring Host Inc., including: |
o | "business combination" provisions that, subject to limitations, prohibit certain business combinations between a corporation and an "interested stockholder" (defined generally as any person who beneficially owns 10% or more of the voting power of the corporation's then outstanding shares of voting stock or an affiliate or associate of the corporation who, at any time within the two-year period immediately prior to the date in question, was the beneficial owner of 10% or more of the voting power of the then outstanding stock of the corporation) or an affiliate of any interested stockholder for five years after the most recent date on which the stockholder becomes an interested stockholder, and thereafter imposes two super-majority stockholder voting requirements on these combinations: and |
o | "control share" provisions that provide that holders of "control shares" of a corporation (defined as voting shares of stock that, if aggregated with all other shares of stock owned or controlled by the acquirer, would entitle the acquirer to exercise one of three increasing ranges of voting power in electing directors) acquired in a "control share acquisition" (defined as the direct or indirect acquisition of issued and outstanding "control shares") have no voting rights except to the extent approved by the stockholders by the affirmative vote of at least two-thirds of all of the votes entitled to be cast on the matter, excluding all interested shares. |
| Host Inc. is subject to the Maryland business combination statute. Our by-laws contain a provision exempting us from the control share provisions of the MGCL. There can be no assurance that this by-law provision exempting us from the control share provisions will not be amended or eliminated at any time in the future. |
● | Merger, consolidation, share exchange and transfer of Host Inc.'s assets. Under Maryland law and Host Inc.'s charter, subject to the terms of any outstanding class or series of capital stock, we can merge with or into another entity, consolidate with one or more other entities, participate in a share exchange or transfer Host Inc.'s assets within the meaning of the MGCL if approved (1) by Host Inc.'s Board of Directors in the manner provided in the MGCL, and (2) by Host Inc.'s stockholders holding two-thirds of all the votes entitled to be cast on the matter, except that any merger of Host Inc. with or into a trust organized for the purpose of changing Host Inc.'s form of organization from a corporation to a trust requires only the approval of Host Inc.'s stockholders holding a majority of all votes entitled to be cast on the merger. Under the MGCL, specified mergers may be approved without a vote of stockholders and a share exchange only is required to be approved by the board of directors of a Maryland corporation if the corporation is the successor entity. Host Inc.'s voluntary dissolution also would require approval of stockholders holding two-thirds of all the votes entitled to be cast on the matter. |
● | Certain charter and by-law amendments. Host Inc.'s charter contains provisions relating to restrictions on transfer and ownership of Host Inc.'s stock, fixing the size of the Board of Directors within the range set forth in the charter, removal of directors, the filling of vacancies, exculpation and indemnification of directors, calling special stockholder meetings and others, all of which may be amended only by a resolution adopted by the Board of Directors and approved by Host Inc.'s stockholders holding two-thirds of the votes entitled to be cast on the matter. Other charter amendments generally require approval of the Board and the affirmative vote of holders of a majority of the votes entitled to be cast on the matter. As permitted under the MGCL, Host Inc.'s charter and by-laws provide that the Board of Directors has the exclusive right to amend Host Inc.'s by-laws. These provisions may make it more difficult to amend Host Inc.'s charter and by-laws to alter the provisions described herein that could delay, defer or prevent a transaction or a change in control or the acquisition of Host Inc. common stock, without the approval of the Board of Directors. |
Shares of Host Inc.'s common stock that are or become available for sale could affect the share price of Host Inc.'s common stock.
We have in the past and may in the future issue additional shares of common stock to raise the capital necessary to finance hotel acquisitions, fund capital expenditures, refinance debt or for other corporate purposes. Sales of a substantial number of shares of Host Inc.'s common stock, or the perception that sales could occur, could affect adversely prevailing market prices for Host Inc.'s common stock. In addition, holders of OP units who redeem their units and receive, at Host Inc.'s election, shares of Host Inc. common stock will be able to sell those shares freely. As of December 31, 2014, there are approximately 9.3 million OP units outstanding owned by third parties that are redeemable, which represents approximately 1% of all outstanding units. Further, a substantial number of shares of Host Inc.'s common stock have been and will be issued or reserved for issuance from time to time under our employee benefit
26
plans. We currently maintain two stock-based compensation plans: (i) the comprehensive stock plan, whereby we may award to participating employees and directors restricted shares of common stock, options to purchase common stock and deferred shares of common stock, and (ii) an employee stock purchase plan. At December 31, 2014, there were approximately 17 million shares of Host Inc.'s common stock reserved and available for issuance under the comprehensive stock plan and employee stock purchase plan and 0.8 million outstanding options exercisable with a weighted average exercise price of $17.35 per share.
Also as of December 31, 2014, Host L.P. had outstanding $400 million principal amount of exchangeable senior debentures that currently are exchangeable for cash, shares of Host Inc.'s common stock or any combination thereof. Assuming the holders elected to exchange and we elected to settle in shares of Host Inc. common stock, the debentures would be exchangeable for approximately 31.1 million shares based on the current exchange price. The exchange price is adjusted proportionately based on dividends paid on Host Inc. common stock. While these debentures currently are exchangeable through March 31, 2015 based on past trading prices of Host Inc. common stock, whether they remain exchangeable after March 31, 2015 will depend on the then current trading prices of Host Inc. common stock.
Our earnings and cash distributions will affect the market price of shares of Host Inc.'s common stock.
We believe that the market value of a REIT's equity securities is based primarily upon the market's perception of the REIT's growth potential and its current and potential future cash distributions, whether from operations, sales, acquisitions, development or refinancings, and secondarily is based upon the value of the underlying assets. For that reason, shares of Host Inc.'s common stock may trade at prices that are higher or lower than the net asset value per share. To the extent that we retain operating cash flow for investment purposes, working capital reserves or other purposes, rather than distributing the cash flow to stockholders, these retained funds, while increasing the value of our underlying assets, may impact negatively the market price of Host Inc.'s common stock. Our failure to meet the market's expectation with regard to future earnings and cash distributions likely would affect adversely the market price of Host Inc.'s common stock.
Federal Income Tax Risks
Adverse tax consequences would occur if Host Inc. or any of its subsidiary REITs fail to qualify as a REIT.
We believe that Host Inc. has been organized and has operated in such a manner so as to qualify as a REIT under the Code, commencing with its taxable year beginning January 1, 1999, and Host Inc. currently intends to continue to operate as a REIT during future years. In addition, Host Inc. owns, through Host L.P., two entities that have elected to be treated as REITs. As the requirements for qualification and taxation as a REIT are extremely complex and interpretations of the federal income tax laws governing qualification and taxation as a REIT are limited, no assurance can be provided that Host Inc. currently qualifies as a REIT or will continue to qualify as a REIT or that each of Host Inc.'s subsidiary REITs qualify as a REIT or will continue to qualify as a REIT. If any of the subsidiary REITs were to fail to qualify as a REIT, it is possible that Host Inc. would fail to qualify as a REIT unless it (or the subsidiary REIT) could avail itself of certain relief provisions. New legislation, treasury regulations, administrative interpretations or court decisions could change significantly the tax laws with respect to an entity's qualification as a REIT or the federal income tax consequences of its REIT qualification. If Host Inc. or any of its subsidiary REITs were to fail to qualify as a REIT, and any available relief provisions did not apply, the non-qualifying REIT would not be allowed to take a deduction for distributions to its stockholders in computing its taxable income, and it would be subject to federal and state corporate income tax, including any applicable alternative minimum tax, on its taxable income at regular corporate rates. Moreover, unless entitled to statutory relief, the non-qualifying REIT would not qualify as a REIT for the four taxable years following the year during which REIT qualification was lost.
To qualify as a REIT, Host Inc. is required to satisfy several asset and income tests. Our ability to satisfy the asset tests depends upon our analysis of the characterization and fair market values of our assets, some of which are not susceptible to a precise determination, and for which we will not obtain independent appraisals. Our compliance with the REIT income and quarterly asset test requirements also depends upon our ability to successfully manage the composition of our income and assets on an ongoing basis. Accordingly, there can be no assurance that the IRS will not contend that our hotel leases, interests in subsidiaries, or interests in securities of other issuers will not cause a violation of the REIT requirements.
Any determination that Host Inc. or one of its subsidiary REITs does not qualify as a REIT will have a material adverse effect on our results of operations and could reduce materially the value of Host Inc.'s common stock. The additional tax liability of Host Inc. or the subsidiary REIT for the year, or years, in which the relevant entity did not qualify as a REIT would reduce its net earnings available for investment, debt service or distributions to stockholders. Furthermore, the non-qualifying entity no longer would be required to make distributions to its stockholders as a condition to REIT qualification and all of its distributions to stockholders would be taxable as ordinary C corporation dividends to the extent of its current and accumulated earnings and profits. This means that, if Host Inc. were to fail to qualify as a REIT, Host Inc.'s stockholders currently taxed as individuals would be taxed on those dividends at capital gain rates and Host Inc.'s corporate stockholders generally would be entitled to the dividends received deduction with respect to such dividends, subject in each case to applicable limitations under the Code. Host Inc.'s failure to qualify as a REIT also
27
would cause an event of default under Host L.P.'s credit facility, which default could lead to an acceleration of the amounts due thereunder, which, in turn, would constitute an event of default under Host L.P.'s outstanding debt securities.
If our hotel managers do not qualify as "eligible independent contractors," or if our hotels are not "qualified lodging facilities," Host Inc. will fail to qualify as a REIT.
Each hotel with respect to which our TRS lessee pays rent must be a "qualified lodging facility." A "qualified lodging facility" is a hotel, motel, or other establishment more than one-half of the dwelling units in which are used on a transient basis, including customary amenities and facilities, provided that no wagering activities are conducted at or in connection with such facility by any person who is engaged in the business of accepting wagers and who legally is authorized to engage in such business at or in connection with such facility. We believe that all of the hotels leased to our TRS are qualified lodging facilities. Although we intend to monitor future acquisitions and improvements of hotels, the REIT provisions of the Code provide only limited guidance for making determinations under the requirements for qualified lodging facilities, and there can be no assurance that these requirements will be satisfied in all cases.
If our hotel managers do not qualify as "eligible independent contractors," Host Inc. likely will fail to qualify as a REIT for federal income tax purposes. Each of the hotel management companies that enters into a management contract with our TRS must qualify as an "eligible independent contractor" under the REIT rules in order for the rent paid to us by our TRS to be qualifying income for our REIT income test requirements. Among other requirements, in order to qualify as an eligible independent contractor, a hotel manager must not own more than 35% of our outstanding shares (by value) and no person or group of persons can own more than 35% of our outstanding shares and the ownership interests of the hotel manager, taking into account only owners of more than 5% of our shares and, with respect to ownership interests in such hotel managers that are publicly traded, only holders of more than 5% of such ownership interests. Complex ownership attribution rules apply for purposes of these 35% thresholds. Although we monitor ownership of our shares by our hotel managers and their owners, and certain provisions of our charter are designed to prevent ownership of our shares in violation of these rules, there can be no assurance that these ownership levels will not be exceeded.
Our ownership of our TRS will be limited and our transactions with our TRS will cause us to be subject to a 100% penalty tax on certain income or deductions if those transactions are not conducted on arm's-length terms.
A REIT may own up to 100% of the equity interest of an entity that is a corporation for federal income tax purposes if the entity is a TRS. A TRS may hold assets and earn income that would not be considered as qualifying assets or as qualifying income if held or earned directly by a REIT, including gross operating income from hotel operations pursuant to hotel management agreements. Both the subsidiary and the REIT must jointly elect to treat the subsidiary as a TRS. A corporation of which a TRS directly or indirectly owns more than 35% of the voting power or value of the stock automatically will be treated as a TRS. Overall, no more than 25% of the value of a REIT's assets may consist of stock or securities of one or more TRS. In addition, the TRS rules limit the deductibility of interest paid or accrued by a TRS to its parent REIT in order to assure that the TRS is subject to an appropriate level of corporate taxation.
Our TRS will pay federal income tax and applicable state and local income tax and, if applicable, foreign income tax on its taxable income, and its after-tax net income will be available for distribution to us but is not required to be distributed by such TRS to us. We believe that the aggregate value of the stock and securities of our TRS has been and will be less than 25% of the value of our total assets (including our TRS stock and securities). Furthermore, we monitor the value of our investments in our TRS for the purpose of ensuring compliance with TRS ownership limitations. There can be no assurance, however, that we will be able to comply with the 25% limitation discussed above.
Rents paid to us by our TRS may not be based on net income or profits to qualify as "rents from real property." We receive "percentage rents" calculated based on gross revenues of the hotels subject to leases to our TRS - not on net income or profits. If the IRS determines that the rents charged under our leases with our TRS are excessive, their deductibility may be challenged at the TRS level, and we could be subject to a 100% excise tax on "re-determined rent" or "re-determined deductions" to the extent rents exceed an arm's length amount. We believe that our rents reflect normal business practices in this regard but there can be no assurance that the IRS will agree.
Despite the REIT status of each of Host Inc. and its subsidiary REITs, we remain subject to various taxes.
One of the subsidiary REITs of Host Inc. will be required to pay federal income tax at the highest regular corporate rate on "built-in gain" recognized as a result of the sale of one or more of its hotels prior to the expiration of the applicable 10-year holding period, including certain hotels acquired from Starwood and its affiliates in 2006. The total amount of gain on which the subsidiary REIT would be subject to corporate income tax if all of its built-in gain assets were sold in a taxable transaction prior to the expiration of the applicable 10-year holding period would be material to it. Recently enacted legislation, however, has reduced the 10-year period
28
to five years in the case of dispositions of assets in 2012, 2013, and 2014. In addition, we expect that we could recognize other substantial deferred tax liabilities in the future without any corresponding receipt of cash.
Notwithstanding Host Inc.'s status as a REIT, Host Inc. and our subsidiaries (including our subsidiary REITs) are subject to federal, state, local and foreign taxes on their income and property in certain cases.
Host L.P. is obligated under its partnership agreement to pay all such taxes (and any related interest and penalties) incurred by Host Inc.
Risks Relating to Redemption of OP Units
A holder who offers its OP units for redemption may have adverse tax consequences.
A holder who elects to redeem their OP units will be treated for federal and state income tax purposes as having sold the OP units. The sale of these units is a taxable event and the holder thereof will be treated as realizing an amount equal to the sum of (1) the value of the common stock or cash the holder receives, and (2) the amount of Host L.P.'s nonrecourse liabilities allocated to the redeemed OP units. The gain or loss recognized by the holder of OP units is measured by the difference between the amount realized by the holder and the holder's tax basis in the OP units redeemed (which tax basis includes the amount of Host L.P.'s nonrecourse liabilities allocated to the redeemed OP units). It is possible that the amount of gain and/or the tax liability related thereto that the holder recognizes and pays could exceed the value of the common stock or cash that the holder receives.
Differences between an investment in shares of Host Inc. common stock and Host L.P. OP units may affect redeemed holders of OP units.
If a holder elects to redeem their OP units, we will determine whether the holder receives cash or shares of Host Inc.'s common stock in exchange for the OP units. Although an investment in shares of Host Inc.'s common stock is substantially similar to an investment in Host L.P. OP units, there are some differences. These differences include form of organization, management structure, voting rights, liquidity and federal and state income taxation, some of which differences may be material to investors.
Item 1B . | Unresolved Staff Comments |
None.
Item 2. | Properties |
See Part 1 Item 1. "Business-Our Hotel Portfolio" above for a discussion of our hotels.
Item 3. | Legal Proceedings |
In 2005 we initiated a lawsuit against Keystone-Texas Property Holding Corporation ("Keystone") seeking a declaration that a provision of the ground lease for the property under the San Antonio Marriott Rivercenter was valid and claiming that Keystone had breached that lease provision. Keystone filed an amended counterclaim and later, a third party claim, alleging that we had tortiously interfered with Keystone's attempted sale of the property and that we slandered Keystone's title to the property.
In 2010, we received an adverse jury verdict in the 166th Judicial District Court of Bexar County, Texas. The jury found that we tortiously interfered with the attempted sale by Keystone of the land under the San Antonio Marriott Rivercenter and awarded Keystone $34.3 million in damages, plus statutory interest. In addition, the jury found that we slandered Keystone's title to the property and awarded Keystone $39 million in damages, plus statutory interest. Keystone was only entitled to receive one of these damage awards. The jury also awarded Keystone $7.5 million in exemplary damages with respect to the second claim. In 2011, a three-judge panel of the San Antonio Court of Appeals issued its memorandum opinion denying our appeal of the trial court's final judgment.
In 2012, we filed a Petition for Review in the Texas Supreme Court. On June 13, 2014, the Texas Supreme Court reversed the court of appeals judgment, and Host was no longer liable for the jury verdict and punitive damages award. Keystone requested a rehearing of the Texas Supreme Court's decision, but that motion was denied on October 3, 2014, finalizing the Texas Supreme Court's decision. As a result, in the third quarter of 2014, we reversed the $69 million loss contingency previously recorded related to this litigation and the initial adverse verdict. In addition, a court-ordered bond of $25 million was released on October 17, 2014.
We are involved in various legal proceedings in the normal course of business including, but not limited to, disputes involving hotel-level contracts, employment litigation, compliance with laws such as the Americans with Disabilities Act, tax disputes and other
29
general matters. We are vigorously defending these claims; however, no assurances can be given as to the outcome of any pending legal proceedings. We believe, based on currently available information, that the results of such proceedings, in the aggregate, will not have a material adverse effect on our financial condition, but might be material to our operating results for any particular period, depending, in part, upon the operating results for such period. We record a liability when a loss is considered probable and the amount can be reasonably estimated.
Item 4. | Mine Safety Disclosures |
Not Applicable.
30
EXECUTIVE OFFICERS
In the following table we set forth certain information regarding those persons currently serving as executive officers of Host Inc. as of February 1, 2015. As a partnership, Host L.P. does not have executive officers.
Name and Title |
| Age |
| Business Experience Prior to Becoming an Executive Officer of Host Inc. |
|
|
|
|
|
Richard E. Marriott Chairman of the Board |
| 76 |
| Richard E. Marriott joined our company in 1965 and has served in various executive capacities. In 1979, Mr. Marriott was elected to the Board of Directors. In 1984, he was elected Executive Vice President and in 1986, he was elected Vice Chairman of the Board of Directors. In 1993, Mr. Marriott was elected Chairman of the Board. |
|
|
|
|
|
W. Edward Walter President, Chief Executive Officer and Director |
| 59 |
| W. Edward Walter joined our company in 1996 as Senior Vice President for Acquisitions and was later named Treasurer and Chief Operating Officer before becoming our Chief Financial Officer in 2003 and President, Chief Executive Officer and Director in October 2007. |
|
|
|
|
|
Elizabeth A. Abdoo Executive Vice President, General Counsel and Secretary |
| 56 |
| Elizabeth A. Abdoo joined our company in June 2001 as Senior Vice President and General Counsel and became Executive Vice President in February 2003. She was elected Secretary in August 2001. |
|
|
|
|
|
Minaz B. Abji Executive Vice President, Asset Management |
| 61 |
| Minaz B. Abji joined our company in 2003 as Executive Vice President, Asset Management. Prior to joining us, Mr. Abji was President of Canadian Hotel Income Properties REIT, a Canadian REIT located in Vancouver, British Columbia where he worked since 1998. |
|
|
|
|
|
Joanne G. Hamilton Executive Vice President, Human Resources |
| 57 |
| Joanne G. Hamilton joined our company as Executive Vice President, Human Resources in January 2010. Prior to joining our company, she was the Chief Human Resource Officer for Beers & Cutler, an accounting and consulting firm based in Vienna, Virginia from 2007 to 2010. Prior to joining Beers & Cutler, Ms. Hamilton served as Senior Vice President of Human Resources for Spirent PLC, a global telecommunications company, from 2002 to 2007 . |
|
|
|
|
|
Gregory J. Larson Executive Vice President, Chief Financial Officer |
| 50 |
| Gregory J. Larson joined our company in 1993. In 1998, Mr. Larson joined the Treasury group as Vice President of Corporate Finance. He assumed leadership of the Investor Relations department in 2000, was promoted to Senior Vice President in 2002, and was elected Treasurer in 2005. In November 2007, Mr. Larson was selected to lead our corporate strategy business and promoted to Executive Vice President. In May 2013 he was named Chief Financial Officer. |
|
|
|
|
|
James F. Risoleo Executive Vice President & Managing Director, Europe |
| 59 |
| James F. Risoleo joined our company in 1996 as Senior Vice President for Acquisitions, and was elected Executive Vice President and Chief Investment Officer in 2000. In January 2012, he became managing director of the Company's European business activities. |
|
|
|
|
|
Struan B. Robertson Executive Vice President, Chief Investment Officer |
| 49 |
| Struan B. Robertson joined our company in January 2013. From 1994 to 2012 he held various positions at Morgan Stanley, most recently as Global Co-Head of its real estate and lodging investment banking business. |
|
|
|
|
|
Brian G. Macnamara Senior Vice President, Corporate Controller |
| 55 |
| Brian G. Macnamara joined our company in February 1996, was promoted to Vice President, Assistant Corporate Controller in February 2007, and was elected Senior Vice President, Corporate Controller in September 2007. |
31
PART II
Item 5. | Market for Registrant's Common Stock, Related Stockholder Matters and Issuer Purchases of Equity Securities for Host Inc. |
Host Inc.'s common stock is listed on the New York Stock Exchange and trades under the symbol "HST." The following table sets forth, for the fiscal periods indicated, the high and low sales prices per share of Host Inc.'s common stock as reported on the New York Stock Exchange Composite Tape and dividends declared per share:
| Stock Price |
|
| Dividends |
| ||||||||||||||
|
| High |
|
|
| Low | |||||||||||||
2013 |
|
|
|
|
|
|
|
|
|
|
| ||||||||
1 st Quarter | $ | 17.73 |
|
| $ | 16.14 |
|
| $ | 0.10 |
| ||||||||
2 nd Quarter |
| 18.77 |
|
|
| 16.02 |
|
|
| 0.11 |
| ||||||||
3 rd Quarter |
| 18.70 |
|
|
| 16.41 |
|
|
| 0.12 |
| ||||||||
4 th Quarter |
| 19.44 |
|
|
| 17.09 |
|
|
| 0.13 |
| ||||||||
|
|
|
|
|
|
|
|
|
|
|
| ||||||||
| Stock Price |
|
| Dividends |
| ||||||||||||||
| High |
|
| Low |
|
| |||||||||||||
2014 |
|
|
|
|
|
|
|
|
|
|
| ||||||||
1 st Quarter | $ | 20.47 |
|
| $ | 18.00 |
|
| $ | 0.14 |
| ||||||||
2 nd Quarter |
| 22.77 |
|
|
| 20.05 |
|
|
| 0.15 |
| ||||||||
3 rd Quarter |
| 23.09 |
|
|
| 21.20 |
|
|
| 0.20 |
| ||||||||
4 th Quarter |
| 24.33 |
|
|
| 20.23 |
|
|
| 0.26 |
| ||||||||
Under the terms of certain of our senior notes and the credit facility, Host Inc.'s ability to pay dividends and make other payments is dependent on its ability to satisfy certain financial requirements. See Part II Item 7. "Management's Discussion and Analysis of Financial Condition and Results of Operations-Financial Condition" and Part I Item 1A. "Risk Factors-Financial Risks and Risks of Operation- The terms of our indebtedness and preferred units place restrictions on us and our subsidiaries and these restrictions reduce our operational flexibility and create default risks."
As of February 20, 2015, there were 21,066 holders of record of Host Inc.'s common stock. However, because many of the shares of our common stock are held by brokers and other institutions on behalf of stockholders, we believe that there are considerably more beneficial holders of our common stock than record holders. As of February 20, 2015, there were 1,636 holders of OP units (in addition to Host Inc.). OP units are redeemable for cash, or, at our election, for Host Inc.'s common stock.
Host Inc.'s ability to qualify as a REIT under the Internal Revenue Code is facilitated by limiting the number of shares of its stock that a person may own. Its charter provides that, subject to limited exceptions, no person or persons acting as a group may own, or be deemed to own by virtue of the attribution provisions of the Internal Revenue Code, more than 9.8% in value or in number, whichever is more restrictive, of shares of Host Inc.'s outstanding common stock, preferred stock or any other class of stock, each considered as a separate class or series for this purpose. Host Inc.'s Board of Directors has the authority to increase the ownership limit from time to time, but does not have the authority to do so to the extent that, after giving effect to such increase, any five beneficial owners of capital stock beneficially could own in the aggregate more than 49.5% of the outstanding capital stock. See Part I Item 1A. "Risk Factors-Risks of Ownership of Host Inc.'s Common Stock-There are limitations on the acquisition of Host Inc. common stock and changes in control."
32
Stockholder Return Performance
The following graph compares the five-year cumulative total stockholder return on Host Inc.'s common stock against the cumulative total returns of the Standard & Poor's Corporation Composite 500 Index and the National Association of Real Estate Investment Trust ("NAREIT") Equity Index. The graph assumes an initial investment of $100 in Host Inc.'s common stock and in each of the indexes, and also assumes the reinvestment of dividends.
Comparison of Five-Year Cumulative Stockholder Returns 2009 – 2014
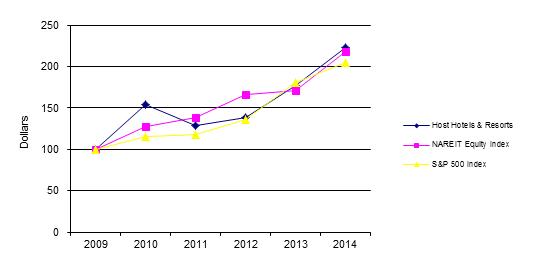
| 2009 |
|
| 2010 |
|
| 2011 |
|
| 2012 |
|
| 2013 |
|
| 2014 |
| ||||||
Host Hotels & Resorts, Inc. | $ | 100.00 |
|
| $ | 153.52 |
|
| $ | 128.17 |
|
| $ | 138.59 |
|
| $ | 176.43 |
|
| $ | 223.19 |
|
NAREIT Equity Index | $ | 100.00 |
|
| $ | 127.95 |
|
| $ | 138.55 |
|
| $ | 165.84 |
|
| $ | 170.58 |
|
| $ | 218.38 |
|
S&P 500 Index | $ | 100.00 |
|
| $ | 115.06 |
|
| $ | 117.49 |
|
| $ | 136.30 |
|
| $ | 180.42 |
|
| $ | 205.14 |
|
This performance graph shall not be deemed "filed" for purposes of Section 18 of the Securities Exchange Act of 1934, as amended, or incorporated by reference into any filing of Host Inc. or Host L.P. (or any of their respective subsidiaries) under the Securities Act of 1933, as amended, except as shall be expressly set forth by specific reference in such filing.
Fourth Quarter 2014 Host Inc. Purchases of Equity Securities
Period |
| Total Number of Host Inc. Common Shares Purchased |
|
|
| Average Price Paid per Common Share |
| Total Number of Common Shares Purchased as Part of Publicly Announced Plans or Programs |
|
| Maximum Number (or Approximate Dollar Value) of Common Shares that May Yet Be Purchased Under the Plans or Programs (in millions) |
| |||||
October 1, 2014 – October 31, 2014 |
|
| - |
|
|
| - |
|
| - |
|
| $ | - |
| ||
November 1, 2014 – November 30, 2014 |
|
| - |
|
|
| - |
|
| - |
|
|
| - |
| ||
December 1, 2014 – December 31, 2014 |
|
| 577 | * |
| $ | 23.86 | * |
| - |
|
|
| - |
| ||
Total |
|
| 577 |
|
| $ | 23.86 |
|
| - |
|
| $ | - |
| ||
| |||||||||||||||||
* | Reflects shares of restricted stock withheld and used for the purpose of paying taxes in connection with the release of restricted common shares to plan participants (the purchase price listed is the weighted average price of Host Inc. common stock on the dates of release). |
33
Item 5. | Market for Registrant's Common Units, Related Unitholder Matters and Issuer Purchases of Equity Securities for Host L.P. |
There is no established public trading market for our OP units and transfers of OP units are restricted by the terms of Host L.P.'s partnership agreement. The following table sets forth, for the fiscal periods indicated, Host L.P.'s distributions declared per common OP unit:
| Distributions Declared |
| |||||
| 2013 |
|
| 2014 |
| ||
1 st Quarter | $ | 0.1021 |
|
| $ | 0.1430 |
|
2 nd Quarter |
| 0.1124 |
|
|
| 0.1532 |
|
3 rd Quarter |
| 0.1226 |
|
|
| 0.2043 |
|
4 th Quarter |
| 0.1328 |
|
|
| 0.2656 |
|
The number of holders of record of Host L.P.'s common OP units on February 20, 2015 was 1,636. The number of outstanding common OP units as of February 20, 2015 was 750,840,635 of which 741,580,449 were owned by Host Inc. Under the terms of certain of our senior notes and the credit facility, Host L.P.'s ability to make distributions and other payments is dependent on its ability to satisfy certain financial requirements. In addition, under the terms of Host L.P.'s preferred OP units, we are not permitted to make distributions on our common OP units unless all cumulative distributions have been paid on our preferred OP units. See Part II Item 7. "Management's Discussion and Analysis of Financial Condition and Results of Operations-Financial Condition" and Part I Item 1A. "Risk Factors-Financial Risks and Risks of Operation- The terms of our indebtedness and preferred units place restrictions on us and our subsidiaries and these restrictions reduce our operational flexibility and create default risks."
Fourth Quarter 2014 Host L.P. Purchases of Equity Securities
Period |
| Total Number of |
|
| Average Price Paid Per Unit |
| Total Number of OP |
|
| Maximum number (or Approximate Dollar Value) (in millions) |
| ||||
|
|
|
|
|
|
|
|
|
|
|
| ||||
October 1, 2014 - October 31, 2014 |
|
| 22,271 | * |
| 1.021494 shares of Host Inc. Common Stock* |
|
| - |
|
|
| - |
| |
November 1, 2014 - November 30, 2014 |
|
| 42,743 | * |
| 1.021494 shares of Host Inc. Common Stock* |
|
| - |
|
|
| - |
| |
December 1, 2014 - December 31, 2014 |
|
| 9,520* | * |
| 1.021494 shares of Host Inc. Common Stock* |
|
| - |
|
|
| - |
| |
Total |
|
| 74,534 |
|
|
|
|
| - |
|
|
| - |
| |
|
* | Reflects common OP units redeemed by Host Inc. in exchange for shares of its common stock. |
** | Reflects (1) 8,956 common OP units redeemed by holders in exchange for shares of Host Inc.'s common stock and (2) 564 common OP units cancelled upon cancellation of 577 shares of Host Inc.'s common stock (and used for the purpose of paying taxes in connection with the release of restricted common shares to plan participants). |
34
Item 6. | Selected Financial Data (Host Hotels & Resorts, Inc.) |
The following table presents certain selected historical financial data which has been derived from audited consolidated financial statements of Host Hotels & Resorts, Inc. for the five years ended December 31, 2014 and should be read in conjunction with the consolidated financial statements and related notes and Part II Item 7. "Management's Discussion and Analysis of Financial Condition and Results of Operations":
|
| Calendar year |
| |||||||||||||||||
|
| 2014 |
|
| 2013 |
|
| 2012 |
|
| 2011 |
|
| 2010 |
| |||||
|
| (in millions, except per share amounts) |
| |||||||||||||||||
Income Statement Data: |
|
|
|
|
|
|
|
|
|
|
|
|
|
|
|
|
|
|
|
|
Revenues |
| $ | 5,354 |
|
| $ | 5,166 |
|
| $ | 5,059 |
|
| $ | 4,714 |
|
| $ | 4,154 |
|
Income (loss) from continuing operations |
|
| 747 |
|
|
| 210 |
|
|
| (8 | ) |
|
| (27 | ) |
|
| (137 | ) |
Income from discontinued operations, net of tax (1) |
|
| - |
|
|
| 115 |
|
|
| 71 |
|
|
| 11 |
|
|
| 5 |
|
Net income (loss) |
|
| 747 |
|
|
| 325 |
|
|
| 63 |
|
|
| (16 | ) |
|
| (132 | ) |
Net income (loss) attributable to Host Hotels & Resorts, Inc. |
|
| 732 |
|
|
| 317 |
|
|
| 61 |
|
|
| (15 | ) |
|
| (130 | ) |
Net income (loss) available to common stockholders |
|
| 732 |
|
|
| 317 |
|
|
| 61 |
|
|
| (15 | ) |
|
| (138 | ) |
Basic earnings (loss) per common share: |
|
|
|
|
|
|
|
|
|
|
|
|
|
|
|
|
|
|
|
|
Continuing operations |
|
| .97 |
|
|
| .27 |
|
|
| (.01 | ) |
|
| (.04 | ) |
|
| (.22 | ) |
Discontinued operations (1) |
|
| - |
|
|
| .16 |
|
|
| .09 |
|
|
| .02 |
|
|
| .01 |
|
Basic earnings (loss) per common share |
|
| .97 |
|
|
| .43 |
|
|
| .08 |
|
|
| (.02 | ) |
|
| (.21 | ) |
Diluted earnings (loss) per common share: |
|
|
|
|
|
|
|
|
|
|
|
|
|
|
|
|
|
|
|
|
Continuing operations |
|
| .96 |
|
|
| .27 |
|
|
| (.01 | ) |
|
| (.04 | ) |
|
| (.22 | ) |
Discontinued operations (1) |
|
| - |
|
|
| .15 |
|
|
| .09 |
|
|
| .02 |
|
|
| .01 |
|
Diluted earnings (loss) per common share |
|
| .96 |
|
|
| .42 |
|
|
| .08 |
|
|
| (.02 | ) |
|
| (.21 | ) |
Dividends declared per common share |
|
| .75 |
|
|
| .46 |
|
|
| .30 |
|
|
| .14 |
|
|
| .04 |
|
Balance Sheet Data: |
|
|
|
|
|
|
|
|
|
|
|
|
|
|
|
|
|
|
|
|
Total assets |
| $ | 12,207 |
|
| $ | 12,814 |
|
| $ | 12,994 |
|
| $ | 13,090 |
|
| $ | 12,411 |
|
Debt |
|
| 3,992 |
|
|
| 4,759 |
|
|
| 5,411 |
|
|
| 5,753 |
|
|
| 5,477 |
|
___________ |
|
|
|
|
|
|
|
|
|
|
|
|
|
|
|
|
|
|
|
|
(1) | Discontinued operations reflects the operations of properties classified as held for sale, the results of operations of properties prior to their disposition and the gain or loss on those dispositions. We adopted ASU 2014-08 as of January 1, 2014, pursuant to which we only report discontinued operations if a disposal represents a strategic shift. No prior year restatements are permitted for this change in policy. |
35
Item 6. | Selected Financial Data (Host Hotels & Resorts, L.P.) |
The following table presents certain selected historical financial data which has been derived from audited consolidated financial statements of Host Hotels & Resorts, L.P. for the five years ended December 31, 2014 and should be read in conjunction with the consolidated financial statements and related notes and Part II Item 7. "Management's Discussion and Analysis of Financial Condition and Results of Operations":
|
| Calendar year |
| |||||||||||||||||
|
| 2014 |
|
| 2013 |
|
| 2012 |
|
| 2011 |
|
| 2010 |
| |||||
|
| (in millions, except per unit amounts) |
| |||||||||||||||||
Income Statement Data: |
|
|
|
|
|
|
|
|
|
|
|
|
|
|
|
|
|
|
|
|
Revenues |
| $ | 5,354 |
|
| $ | 5,166 |
|
| $ | 5,059 |
|
| $ | 4,714 |
|
| $ | 4,154 |
|
Income (loss) from continuing operations |
|
| 747 |
|
|
| 210 |
|
|
| (8 | ) |
|
| (27 | ) |
|
| (137 | ) |
Income from discontinued operations, net of tax (1) |
|
| - |
|
|
| 115 |
|
|
| 71 |
|
|
| 11 |
|
|
| 5 |
|
Net income (loss) |
|
| 747 |
|
|
| 325 |
|
|
| 63 |
|
|
| (16 | ) |
|
| (132 | ) |
Net income (loss) attributable to Host Hotels & Resorts, L.P. |
|
| 741 |
|
|
| 321 |
|
|
| 62 |
|
|
| (15 | ) |
|
| (132 | ) |
Net income (loss) available to common unitholders |
|
| 741 |
|
|
| 321 |
|
|
| 62 |
|
|
| (15 | ) |
|
| (140 | ) |
Basic earnings (loss) per common unit: |
|
|
|
|
|
|
|
|
|
|
|
|
|
|
|
|
|
|
|
|
Continuing operations |
|
| .99 |
|
|
| .28 |
|
|
| (.01 | ) |
|
| (.04 | ) |
|
| (.22 | ) |
Discontinued operations (1) |
|
| - |
|
|
| .15 |
|
|
| .10 |
|
|
| .02 |
|
|
| .01 |
|
Basic earnings (loss) per common unit |
|
| .99 |
|
|
| .43 |
|
|
| .09 |
|
|
| (.02 | ) |
|
| (.21 | ) |
Diluted earnings (loss) per common unit: |
|
|
|
|
|
|
|
|
|
|
|
|
|
|
|
|
|
|
|
|
Continuing operations |
|
| .99 |
|
|
| .28 |
|
|
| (.01 | ) |
|
| (.04 | ) |
|
| (.22 | ) |
Discontinued operations (1) |
|
| - |
|
|
| .15 |
|
|
| .10 |
|
|
| .02 |
|
|
| .01 |
|
Diluted earnings (loss) per common unit |
|
| .99 |
|
|
| .43 |
|
|
| .09 |
|
|
| (.02 | ) |
|
| (.21 | ) |
Distributions declared per common unit |
|
| .766 |
|
|
| .470 |
|
|
| .306 |
|
|
| .143 |
|
|
| .0408 |
|
Balance Sheet Data: |
|
|
|
|
|
|
|
|
|
|
|
|
|
|
|
|
|
|
|
|
Total assets |
| $ | 12,207 |
|
| $ | 12,814 |
|
| $ | 12,994 |
|
| $ | 13,090 |
|
| $ | 12,410 |
|
Debt |
|
| 3,992 |
|
|
| 4,759 |
|
|
| 5,411 |
|
|
| 5,753 |
|
|
| 5,477 |
|
___________ |
|
|
|
|
|
|
|
|
|
|
|
|
|
|
|
|
|
|
|
|
(1) | Discontinued operations reflects the operations of properties classified as held for sale, the results of operations of properties prior to their disposition and the gain or loss on those dispositions. We adopted ASU 2014-08 as of January 1, 2014, pursuant to which we only report discontinued operations if a disposal represents a strategic shift. No prior year restatements are permitted for this change in policy. |
36
Item 7. | Management's Discussion and Analysis of Financial Condition and Results of Operations |
The following discussion should be read in conjunction with the consolidated financial statements and related notes included elsewhere in this report.
Overview
Host Inc. operates as a self-managed and self-administered REIT that owns properties and conducts operations through Host L.P., of which Host Inc. is the sole general partner and in which it holds approximately 99% of its common OP units as of December 31, 2014. The remainder of Host L.P.'s common OP units are owned by various unaffiliated limited partners. Host Inc. has the exclusive and complete responsibility for Host L.P.'s day-to-day management and control.
Host Inc. is the largest lodging REIT in NAREIT's composite index and one of the largest owners of luxury and upper upscale hotel properties. As of February 20, 2015, we own 114 hotels in the United States and internationally and have minority ownership interests in an additional 25 hotels through joint ventures in the United States, Europe and the Asia/Pacific region. These hotels are primarily operated under brand names that are among the most respected and widely recognized in the lodging industry. The majority are located in central business districts of major cities, near airports and in resort/conference destinations that benefit from significant barriers to entry by competitors. Since 2004, the percentage of revenues from our target markets has increased from approximately 65% to 80% in 2014, as we have focused our acquisition efforts on these locations, and similarly disposed of non-core assets. While hotels in these markets still are subject to competitive pressures, we believe this strategy of combining quality assets with superior locations provides opportunities to achieve room rate and occupancy premiums in excess of our competitors.
Our customers fall into three broad groups: transient business, group business and contract business, which accounted for approximately 61%, 34%, and 5%, respectively, of our 2014 room sales. Transient business broadly represents individual business or leisure travelers. Business travelers make up the majority of transient demand at our hotels. Therefore, we will be significantly more affected by trends in business travel than trends in leisure demand. For a discussion of our customer categories, see " – Our Customers".
Understanding Our Performance
Our Revenues and Expenses. Our hotels are operated by third-party managers under long-term agreements, pursuant to which they typically earn base and incentive management fees based on the levels of revenues and profitability of each individual hotel. We provide operating funds, or working capital, which the managers use to purchase inventory and to pay wages, utilities, property taxes and other hotel-level expenses. We generally receive a cash distribution from our hotel managers each month, which distribution reflects hotel-level sales less property-level operating expenses (excluding depreciation).
The following table presents the components of our hotel revenue as a percentage of our total revenue:
|
| % of 2014 |
| ||
| · | Rooms revenue. Occupancy and average daily room rate are the major drivers of rooms revenue. The business mix of the hotel (group versus transient and retail versus discount business) is a significant driver of room rates. |
| 64 | % |
|
|
|
|
| |
| · | Food and beverage revenue. Food & beverage revenues consist of revenues from group functions, which may include both banquet revenue and audio and visual revenues, as well as outlet revenues from the restaurants and lounges at our properties. |
| 29 | % |
|
|
|
|
| |
| · | Other revenue. Occupancy, the nature of the property (e.g., resort, etc.) and its price point are the main drivers of other ancillary revenue, such as parking, golf course, spa, entertainment and other guest services. This category also includes retail and apartment rental revenue. |
| 7 | % |
37
Hotel operating expenses represent approximately 99% of our total operating costs and expenses. The following table presents the components of our hotel operating expenses as a percentage of our total operating costs and expenses:
|
| % of 2014 |
| ||
| · | Rooms expense. These costs include housekeeping, reservation systems, room supplies, laundry services and front desk costs. Occupancy is the major driver of rooms expense. These costs can increase based on increases in salaries and wages, as well as on the level of service and amenities that are provided. |
| 20 | % |
|
|
|
|
| |
| · | Food and beverage expense. These expenses primarily include food, beverage and the associated labor costs and will correlate closely with food and beverage revenues. Group functions with banquet sales and audio and visual components will generally have lower overall costs as a percentage of revenues than outlet sales. |
| 24 | % |
|
|
|
|
| |
| · | Other departmental and support expenses. These expenses include labor and other costs associated with other ancillary revenue, such as parking, golf courses, spas, entertainment and other guest services, as well as labor and other costs associated with administrative departments, sales and marketing, repairs and minor maintenance and utility costs. |
| 27 | % |
|
|
|
|
| |
| · | Management fees. Base management fees are computed as a percentage of gross revenue. Incentive management fees generally are paid when operating profits exceed certain threshold levels. |
| 5 | % |
|
|
|
|
| |
| · | Other property-level expenses. These expenses consist primarily of real and personal property taxes, ground rent, equipment rent and property insurance. Many of these expenses are relatively inflexible and do not necessarily change based on changes in revenue at our hotels. |
| 8 | % |
|
|
|
|
| |
| · | Depreciation and amortization expense. This is a non-cash expense that changes primarily based on the acquisition and disposition of hotel properties and the level of past capital expenditures. |
| 15 | % |
The expense components listed above are based on those presented in our consolidated statements of operations. It also is worth noting that wage and benefit costs are spread among various line items. Taken separately, these costs represent approximately 55% of our hotel operating expenses.
Key Performance Indicators. Revenue per available room ("RevPAR") is a commonly used measure within the hotel industry to evaluate hotel operations. RevPAR is defined as the product of the average daily room rate charged and the average daily occupancy achieved. RevPAR does not include food and beverage, parking, or other guest service revenues generated by the property. Although RevPAR does not include these ancillary revenues, it is considered the key indicator of core revenues for many hotels.
RevPAR changes that are driven by occupancy have different implications on overall revenue levels, as well as incremental operating profit, than do changes that are driven by average room rate. For example, increases in occupancy at a hotel will lead to increases in rooms revenues and ancillary revenues, such as food and beverage revenue, as well as additional incremental costs (including housekeeping services, utilities and room amenity costs). RevPAR increases due to higher room rates, however, will not result in additional room-related costs, with the exception of those charged as a percentage of revenue. As a result, changes in RevPAR driven by increases or decreases in average room rates have a greater effect on profitability than do changes in RevPAR caused by occupancy levels.
In discussing our operating results, we present RevPAR and certain other financial data for our hotels on a comparable hotel basis. Comparable hotels are those properties that we have owned for the entirety of the reporting periods being compared and which operations have been included in our consolidated results. Comparable hotels do not include the results of properties acquired or sold, or that incurred business interruption due to significant property damage or large scale capital improvements. We also present RevPAR separately for our comparable consolidated domestic and international (both on a nominal and constant dollar basis) hotels, as well as for our joint venture in Europe. We provide RevPAR results in constant currency due to the number of consolidated properties we have internationally and the effect that exchange rates have on our reporting. We use constant currency because we believe it is useful to investors as it provides clarity on how the hotels are performing in their local markets. For all other measures (net income, operating profit, EBITDA, FFO, etc.) our discussion refers only to nominal US$, which is consistent with our financial statement presentation under GAAP.
38
We also evaluate the performance of our business through certain non-GAAP financial measures. Each of these non-GAAP financial measures should be considered by investors as supplemental measures to GAAP performance measures such as total revenues, operating profit, net income and earnings per share. We provide a more detailed discussion of these non-GAAP financial measures, how management uses such measures to evaluate our financial condition and operating performance and a discussion of certain limitations of such measures in "-Non-GAAP Financial Measures." Our non-GAAP financial measures include:
● | NAREIT Funds From Operations ("FFO") and Adjusted FFO per diluted share. We use NAREIT FFO and Adjusted FFO per diluted share as supplemental measures of company-wide profitability. NAREIT adopted FFO in order to promote an industry-wide measure of REIT operating performance. We also adjust NAREIT FFO for gains and losses on extinguishment of debt, acquisition costs and litigation gains or losses outside the ordinary course of business. |
● | Comparable Hotel EBITDA. Hotel EBITDA measures property-level results before debt service, depreciation and corporate expenses (as this is a property level measure) and is a supplemental measure of aggregate property-level profitability. We use Hotel EBITDA and associated margins to evaluate the profitability of our comparable hotels. |
● | EBITDA and Adjusted EBITDA. Earnings before interest expense, income taxes, depreciation and amortization ("EBITDA") is a supplemental measure of our operating performance and facilitates comparisons between us and other lodging REITs, hotel owners who are not REITs and other capital-intensive companies. We also adjust EBITDA for gains and losses related to real estate transactions, impairment losses and litigation gains or losses outside the ordinary course of business ("Adjusted EBITDA"). |
Summary of 2014 Operating Results
The following table reflects certain line items from our audited statements of operations and the significant operating statistics (in millions, except per share and hotel statistics):
Historical Income Statement Data:
|
|
|
|
|
|
|
|
|
| Change |
|
|
|
|
|
| Change |
| ||
|
| 2014 |
|
| 2013 |
|
| 2013 to 2014 |
|
| 2012 |
|
| 2012 to 2013 |
| |||||
Total revenues |
| $ | 5,354 |
|
| $ | 5,166 |
|
|
| 3.6 | % |
| $ | 5,059 |
|
|
| 2.1 | % |
Net income |
|
| 747 |
|
|
| 325 |
|
|
| 129.8 | % |
|
| 63 |
|
|
| 415.9 | % |
Operating profit |
|
| 710 |
|
|
| 512 |
|
|
| 38.7 | % |
|
| 362 |
|
|
| 41.4 | % |
Operating profit margin under GAAP |
|
| 13.3 | % |
|
| 9.9 | % |
|
| 340 | bps |
|
| 7.2 | % |
|
| 270 | bps |
Adjusted EBITDA |
| $ | 1,402 |
|
| $ | 1,306 |
|
|
| 7.4 | % |
| $ | 1,190 |
|
|
| 9.7 | % |
|
|
|
|
|
|
|
|
|
|
|
|
|
|
|
|
|
|
|
|
|
Diluted earnings per share |
| $ | .96 |
|
| $ | .42 |
|
|
| 128.6 | % |
| $ | .08 |
|
|
| 425.0 | % |
NAREIT FFO per diluted share |
|
| 1.57 |
|
|
| 1.26 |
|
|
| 24.6 | % |
|
| 1.04 |
|
|
| 21.2 | % |
Adjusted FFO per diluted share |
|
| 1.50 |
|
|
| 1.31 |
|
|
| 14.5 | % |
|
| 1.10 |
|
|
| 19.1 | % |
Comparable Hotel Data: |
|
|
|
|
|
|
|
|
|
|
|
|
|
|
|
|
|
|
|
|
|
|
|
|
|
|
|
|
|
|
|
|
|
|
|
|
|
|
|
|
|
|
|
|
|
|
|
|
|
|
| 2014 Comparable Hotels (1) |
|
| 2013 Comparable Hotels (1) |
| ||||||||||||||||||
|
|
|
|
|
|
|
|
|
| Change |
|
|
|
|
|
|
|
|
|
| Change |
| ||
|
| 2014 |
|
| 2013 |
|
| 2013 to 2014 |
|
| 2013 |
|
| 2012 |
|
| 2012 to 2013 |
| ||||||
Comparable hotel revenues |
| $ | 4,973 |
|
| $ | 4,740 |
|
|
| 4.9 | % |
| $ | 4,670 |
|
| $ | 4,452 |
|
|
| 4.9 | % |
Comparable hotel EBITDA |
|
| 1,318 |
|
|
| 1,200 |
|
|
| 9.8 | % |
|
| 1,190 |
|
|
| 1,089 |
|
|
| 9.3 | % |
Comparable hotel EBITDA margin |
|
| 26.5 | % |
|
| 25.3 | % |
|
| 120 | bps |
|
| 25.5 | % |
|
| 24.5 | % |
|
| 100 | bps |
Change in comparable hotel RevPAR - Constant US$ (2) |
|
| 5.7 | % |
|
|
|
|
|
|
|
|
|
| 5.8 | % |
|
|
|
|
|
|
|
|
Change in comparable hotel RevPAR - Nominal US$ (2) |
|
| 5.3 | % |
|
|
|
|
|
|
|
|
|
| 5.6 | % |
|
|
|
|
|
|
|
|
Change in comparable domestic RevPAR |
|
| 5.4 | % |
|
|
|
|
|
|
|
|
|
| 5.9 | % |
|
|
|
|
|
|
|
|
Change in comparable international RevPAR - Constant US$ (2) |
|
| 10.2 | % |
|
|
|
|
|
|
|
|
|
| 3.9 | % |
|
|
|
|
|
|
|
|
___________ |
|
|
|
|
|
|
|
|
|
|
|
|
|
|
|
|
|
|
|
|
|
|
|
|
(1) | Comparable hotel operating statistics for 2014 and 2013 are based on 106 comparable hotels as of December 31, 2014, while the comparable hotel operating statistics for 2013 and 2012 are based on 105 comparable hotels as of December 31, 2013. |
(2) | For a discussion of our constant US$ and nominal US$ presentation, see "-Comparable Hotel Operating Statistics." |
39
In 2014, on a constant US$ basis, RevPAR at our comparable hotels increased 5.7% compared to 2013, marking the fifth straight year of comparable RevPAR growth in excess of 5.5%. Our results were impacted by a number of key factors, starting with the improving U.S. economy, which saw GDP growth and a decline in unemployment, though this was partially offset by limited wage growth which tempered consumer spending. Corporate business, a key demand driver of our portfolio, experienced slower, but solid growth in 2014 when compared to 2013. Our domestic gateway properties have benefited from increases in demand from travel to the U.S. as international arrivals increased, though we expect that to moderate as a result of the strengthening dollar. Lastly, many of our hotels' results were impacted by increased capital expenditures projects in the fourth quarter of 2014, which slowed RevPAR and profit growth, a trend that we expect will be more significant throughout 2015.
Rooms
RevPAR growth in 2014 at our comparable hotels was both rate and occupancy driven, as room rates improved 4.8% on a constant US$ basis and occupancy improved 60 basis points to 77%, our highest occupancy since our prior peak. Our operators have been able to leverage the higher occupancy levels in order to gradually increase room rates, particularly for our transient business, which increased 5.1%. Group revenue increased 5.6%, driven by a 2.7% increase in room nights coupled with a 2.8% increase in rates. Group business was inconsistent throughout the year, as strong growth in the first and third quarters were each followed by slower growth in the second quarter and a decline in the fourth quarter, partially due to renovations.
Comparable RevPAR at our domestic portfolio increased 5.4% for the year, driven by a 4.6% improvement in room rates. Our San Francisco and Seattle hotels led our domestic portfolio with RevPAR increases of 15.2% and 12.8%, respectively, as already high levels of demand and solid group business allowed for average room rate increases of approximately 12% in both markets. Our New York and Washington, D.C. markets lagged the portfolio with RevPAR increases of 3.3% and 1.9%, respectively, as both markets have had a recent influx of new supply, the impact of which will continue into 2015.
On a constant US$ basis, RevPAR at our comparable consolidated international hotels increased 10.2% in 2014, led by our Latin American properties with an 18.4% increase in average room rate and a 23.3% increase in RevPAR on a constant US$ basis. The JW Marriott Hotel Rio de Janeiro benefited from the FIFA World Cup, resulting in a RevPAR increase of 27.3% for the full year. Comparable RevPAR in constant euros for the Euro JV properties, which are unconsolidated, increased 2.5% for the full year reflecting the continued slow growth of the region.
Rooms expenses increased 4.8% for the full year on a comparable hotel basis, driven by an increase in travel agent commissions and an increase in the rooms hourly wage rate of 3.1%. As a result, cost per occupied room increased 4.0% at our comparable hotels. For the year, rooms department profit at our comparable hotels increased 5.5%.
Food and Beverage
Food and beverage revenues at our comparable hotels increased 3.8% for 2014. The increase was driven primarily by a positive mix shift to banquet and audio visual revenues, which provide higher overall operating margins than outlet revenue, as catered functions generally are more profitable. For the year, banquet and audio visual revenues at our comparable hotels increased 5.1%. Overall, total food and beverage revenues increased by 2.9% compared to 2013. Increased productivity, along with the shift of business to banquet and audio visual revenues, contributed to a 6.8% increase in food and beverage department profit for the year.
Other revenues
Other revenues at our comparable hotels increased 5.9% due to an increase in garage revenues, coupled with higher rents throughout the portfolio.
Operating Profit
Operating margins (calculated based on GAAP operating profit as a percentage of GAAP revenues) increased 340 basis points for the full year 2014. These operating margins are affected significantly by several items, including operations from recently acquired hotels, dispositions, depreciation, impairments, and corporate expenses. Our comparable hotel EBITDA margins, which exclude these items, increased 120 basis points to 26.5%. The improvements were driven by the increase in average room rate, as well as the 6.8% increase in comparable food and beverage profit described above. Additionally, declines in several of our expense categories at our comparable hotels, including incentive management fees and property insurance, as well as below inflationary growth in utilities and nearly flat ground rent, contributed to the growth in operating profit margins during 2014. These expense categories are expected to increase at a more normalized level in 2015, which will slow overall margin growth.
40
Net income for Host Inc. improved $422 million in 2014 to $747 million. Host Inc.'s diluted income per common share improved $0.54 per common share to $0.96 per common share. Net income and diluted income per share benefited from the following:
· | Adjusted EBITDA increased $96 million, or 7.4%, to $1.4 billion, reflecting improvement in hotel operations and an increase in Adjusted EBITDA from our unconsolidated joint ventures, partially offset by a decline due to the net effect of our recent acquisitions and dispositions; |
· | a decrease in interest expense of $90 million due to a reduction in the overall debt balance and weighted average interest rate, combined with a decline in debt extinguishments costs compared to the prior year. The growth in earnings, coupled with the decrease in interest expense, resulted in an increase in Host Inc.'s Adjusted FFO per diluted share of 14.5% to $1.50 per diluted share; |
· | an increase in gains on asset sales of $105 million (in 2013, certain of the gains are included in discontinued operations); and |
· | a gain of $71 million recorded in 2014 for the successful resolution of litigation. |
The trends and transactions described above for Host Inc. affected similarly the operating results for Host L.P, as the only significant difference between the Host Inc. and Host L.P. statements of operations relates to the treatment of income attributable to the outside partners of Host L.P. For the year, Host L.P.'s net income improved $422 million to $747 million, and the diluted income per common unit improved $0.56 per common unit to $0.99 per common unit.
2015 Outlook
For 2015, we expect continued strength in the U.S. lodging industry as overall growth in GDP, driven by strong employment, consumer confidence and business investment, is expected to continue to drive consistent demand growth. At the same time, we anticipate that supply growth will increase compared to recent years, but will remain below historical levels for the industry overall, although growth in individual markets may vary. As a result, we anticipate solid RevPAR growth in the U.S. lodging industry during 2015. As occupancy levels at our properties in target markets and gateway cities are currently at, or near, prior peak levels, we expect that the majority of the growth will be rate driven, which should lead to improvements in our operating margins and results. We anticipate that our results will be driven by strong transient demand and improvement in group performance.
In the near-term, we are anticipating that certain trends will negatively impact our 2015 results. Our portfolio has a large exposure to New York and Washington D.C., which represent 27% of our revenues. These markets recently have experienced above market levels of supply growth. We continue to believe that these are strong gateway markets that will drive long-term value; however, the recent supply growth is expected to cause these markets to underperform in 2015. We also expect the growth in international travel to our gateway markets to slow in 2015 due to the relative strength in the U.S. dollar and weakness in the global economy. Further, we will be completing several significant renovations at many of our largest hotels in 2015, as our redevelopment and return on investment capital expenditures are expected to more than double over 2014 levels. When operating at high occupancy, these renovations have more noticeable disruption effects. Based on these factors, we anticipate that the overall strength of the lodging industry, partially offset by short-term challenges in our portfolio, will lead to domestic year-over-year growth in RevPAR of 4.75% to 5.75%.
We expect the increase in United States lodging demand to outpace international growth. In Europe, while there are areas of growth, the overall economy remains in a tenuous position as strategies to promote overall growth compete with sovereign debt issues. Additionally, the slowdown in China's growth and the decline in oil prices are expected to impact lodging demand in commodity driven countries such as Australia, Canada, Chile and Brazil, where we have direct investments. Difficult year-over-year comparisons, such as the World Cup in Brazil in 2014, also will weigh on RevPAR growth. As a result, we expect our RevPAR for our consolidated international portfolio to be flat to an increase of 2.0% compared to 2014 on a constant dollar basis.
For the portfolio as a whole, we anticipate that RevPAR, on a constant US$ basis, will increase 4.5% to 5.5%. However, growth in net income, operating profit and Adjusted EBITDA will be affected negatively by hotel sales and renovation disruption at several of our properties despite the growth in RevPAR. While we believe that the lodging industry will continue to improve, there can be no assurances that any increases in hotel revenues or earnings at our properties will continue for any number of reasons, including, but not limited to, slower than anticipated growth in the economy, greater than anticipated disruption from renovations to our hotels and changes in travel patterns. See Part I Item 1A. "Risk Factors."
41
Strategic Initiatives
Portfolio
Acquisitions and Development. We continue to seek investment opportunities in our target markets, which we have identified as those that are expected over the long term to have the greatest lodging demand growth, the fewest additions to supply, and the strongest potential for revenue growth. We see increased competition for acquisitions in our target markets due to the accessibility of capital and the current availability of inexpensive financing. Consequently, pricing for upper upscale and luxury assets has become more aggressive, and recent transaction values have approached replacement cost levels, a trend we expect to continue in 2015. In 2014, we acquired one hotel in each of our target markets of San Francisco and Miami, and both hotels are managed by independent operators, as follows:
● | On January 21, 2014, we acquired the 151-room Powell Hotel in San Francisco, including the fee simple interest in the land, for $75 million. The property is located in the heart of downtown San Francisco, two blocks from Union Square, three blocks from the Moscone Convention Center and across from the historic cable car turnaround. The property includes a significant long-term retail lease with Sephora, a leading provider of perfume and cosmetics. The hotel, operated by Kokua Hospitality, currently is closed for renovation and will reopen in September 2015 and will be renamed the Axiom Hotel. |
● | On August 11, 2014, we acquired the 242-room b2 miami downtown hotel for approximately $58 million. The hotel is located in Miami's business and financial district, within walking distance of the American Airlines Arena, across from Bayfront Park and with unobstructed water views. The hotel has been renamed the YVE Hotel Miami and is being managed by Destination Hotels & Resorts. |
● | In the fourth quarter of 2014, we opened the 149-room Novotel and 256-room ibis Rio de Janeiro Parque Olimpico in Barra da Tijuca, both managed by Accor. Our total investment in the development project was R$139 million ($65 million). |
Dispositions. We sold five properties in 2014 for a total sales price of $519 million, including an 89% interest of the Philadelphia Marriott Downtown. These properties are non-core assets where we believe the potential for growth is constrained or where we were able to take advantage of attractive pricing in the market. For further detail, see "–Liquidity and Capital Resources."
During 2015, we believe the disposition market should remain favorable, including increased interest in secondary markets as a result of increased liquidity.
Capital Investment
Value Enhancement. We also look to enhance the value of our portfolio by identifying and executing strategies seeking to achieve the highest and best use of all aspects of our properties. This may include extending ground leases or restructuring management agreements, as well as developing or disposing of underutilized space connected to our properties. We believe that the successful execution of these projects will create significant value for the company. Significant value enhancement initiatives include:
● | In December 2014, we opened Hyatt Ka'anapali Beach, A Hyatt Residence Club, in which we hold a 67% non-controlling interest. The 131–unit vacation ownership project in Maui, Hawaii is adjacent to our Hyatt Regency Maui Resort & Spa. The total development cost of the project as of December 31, 2014 was approximately $180 million, of which $86 million was financed through a construction loan. In 2014, the Maui JV recognized $54 million in sales of the timeshare units. |
● | In collaboration with Vornado Realty Trust, on November 18, 2014, we unveiled a 25,000 square foot high-definition digital advertising display alongside the New York Marriott Marquis. The remaining redevelopment and leasing of the retail space of the hotel is scheduled to be completed by late 2015. |
● | We have extended the ground lease by 30 years through 2104 at the Atlanta Marriott Suites Midtown and obtained flexibility with respect to lease provisions that govern the brand, operator and sub-lease provisions of the asset in return for a small increase in minimum rent. Additionally, in February 2015, we completed the purchase of the ground lease at the Sheraton Indianapolis Hotel at Keystone Crossing, along with two out-parcels, for $4.6 million. |
Capital Expenditures Projects. We continue to pursue opportunities to enhance asset value through select capital improvements, including projects that are designed specifically to increase the eco-efficiency of our hotels, incorporate elements of sustainable design and replace aging equipment and systems with more efficient technology. Capital expenditures have totaled approximately $2.4 billion over the past five years and, as a result, we believe that our properties are in a strong competitive position relative to their market competitors. During 2014, we completed renovations to 4,000 guestrooms, approximately 535,000 square feet of meeting space and almost 128,000 square feet of public space.
42
● | Redevelopment, Return on Investment and Acquisition Capital Expenditures . Redevelopment and ROI projects primarily consist of large-scale redevelopment projects designed to increase cash flow and improve profitability by capitalizing on changing market conditions and the favorable location of our properties. Additionally, in conjunction with the acquisition of a property, we prepare capital and operational improvement plans designed to maximize profitability, which we refer to as Acquisition Capital Expenditures. Approximately $112 million was spent on redevelopment and return on investment projects, including acquisition capital expenditures, during 2014 compared to $133 million in 2013. Significant redevelopment and ROI capital expenditures during the year included the following projects: |
o | The Fairmont Kea Lani Maui – expansion of the 9,000 square foot Willow Stream Spa; |
o | Sheraton Memphis Downtown – conversion and repositioning, including the renovation of over 21,000 square feet of public space and all 600 guest rooms; |
o | Sheraton New York Times Square – completion of a steam to gas conversion, where the hotel operates on its own boiler plant instead of the local utility. A similar project at the New York Marriott Marquis will be completed in the first quarter of 2015. The projects are expected to result in cost savings and decrease our carbon emissions; |
o | Manchester Grand Hyatt San Diego – renovation of over 100,000 square feet of meeting space and the expansion of the fitness center as part of the multi-year $84 million renovation of the hotel; |
o | the renovation of six food and beverage outlets, which brings our total number of restaurant renovations to 22 over the past three years; and |
o | we added over 11,000 square feet of meeting space to our portfolio in order to enhance our appeal to the higher rated corporate segment. |
For 2015, we expect to spend between $245 million and $260 million for redevelopment and ROI projects, including acquisition capital expenditures. These projects for 2015 include the following:
o | The Axiom Hotel, San Francisco - In conjunction with a substantial $33 million renovation, the recently acquired Powell Hotel, located in the heart of downtown San Francisco, was closed on January 2, 2015 and will be converted to a new independent identity and renamed the Axiom Hotel. It is expected to reopen in late 2015. |
o | Marriott Marquis San Diego Marina – In December 2014, the demolition of the existing conference center commenced in order to begin construction of the new $106 million Marriott Marquis San Diego Marina Exhibit Hall, which, upon completion, will provide approximately 180,000 square feet of expanded and modernized space for conferences and events. |
o | Philadelphia Luxury Hotel – We recently announced that we will close the Four Seasons Philadelphia in June 2015 as part of a project to convert the property to a contemporary, independent hotel operated by Sage Hospitality. The renovation will include extensive improvements to the ballroom, meeting space and spa and fitness center, while introducing a new roof-top lounge, high-end coffee bar and new restaurant concept. The hotel is expected to reopen late in 2015. |
o | Houston Airport Marriott – This $53 million project includes the complete repositioning of the hotel and is expected to be completed in December 2015. Guest rooms will receive a renovation of the soft and case goods and bathroom. We will be closing two restaurants and creating a new food and beverage outlet and lobby experience. |
o | Grand Hyatt Washington – We have begun a $12 million public space repositioning project. The project includes the structural reconfiguration of the lobby, retail space, restaurant space and the atrium. The project commenced in December 2014 and is expected to conclude in May 2015. |
o | Sheraton Santiago Hotel & Convention Center – We intend to complete an extensive guestroom renovation that involves the reconfiguration of bathrooms, all new case goods and an expansion of the current room count from 379 to 384. The renovation will require a temporary closure of a significant portion of the guestrooms, simultaneously on multiple floors, due to the building tower structure. |
We plan to complete one additional hotel renovation related to a rebranding project in 2015. Also, in early 2015, we announced that Sage Hospitality has been selected to manage the Denver Marriott Tech Center Hotel pursuant to a Marriott franchise agreement. We plan to implement a transformational renovation that will include a new lobby and lounge and upgrades to the meeting space and food and beverage platforms. The renovation is expected to begin in late 2015, with the majority of the work in 2016.
● | Renewal and Replacement Capital Expenditures. We spent $324 million and $303 million on renewal and replacement expenditures during 2014 and 2013, respectively. These expenditures are designed to ensure that our high standards for |
43
product quality are maintained and to enhance the overall competitiveness of our properties in the marketplace. These projects included the renovation of 3,000 rooms, 56,000 square feet of public space and 290,000 square feet of meeting space in 2014. Projects which were underway during the fourth quarter of 2014 included guestrooms at the New Orleans Marriott, The Westin Chicago River North, JW Marriott Houston, Calgary Marriott Downtown, San Antonio Marriott Riverwalk and JW Marriott Washington D.C. Major projects completed in 2014 included the following: |
o | The renovation of all 532 guest rooms at the Newport Beach Marriott Hotel & Spa, along with over 41,000 square feet of ballroom and meeting space; |
o | The renovation of 428 rooms in the south tower of the Sheraton Boston Hotel, along with 5,000 square feet of restaurant and public space; and |
o | The renovation of 50,000 square feet of ballroom space at the Harbor Beach Marriott Resort & Spa. |
We expect that our investment in renewal and replacement expenditures in 2015 will total approximately $330 million to $350 million. In addition to completing the projects started in the fourth quarter as noted above, these expenditures will include guest room renovations at The Ritz-Carlton, Marina del Rey, the W Seattle, and the Coronado Island Marriott Resort and Spa, and ballroom and meeting space renovations at the Santa Clara Marriott and the Manhattan Beach Marriott.
Finance
During 2014, we continued to improve our leverage ratio, as measured by the decline in our net debt-to-EBITDA ratio, and reduced our overall debt service obligations, increasing our fixed charge coverage ratio, which is calculated as EBITDA-to-fixed charges. Both of these metrics are based on calculations defined in our credit facility. We repaid approximately $760 million of debt and completed an amendment and restatement of our senior unsecured credit facility, which lowered our all-in pricing by 30 basis points on the revolver and 32.5 basis points on the term loan, and extended the maturity for both to 2019, including extensions (which are subject to meeting certain conditions). Our weighted average interest rate is 4.8% and our weighted average debt maturity is 5.2 years. We have a balanced maturity schedule wherein not more than 22% of our outstanding debt is due in any given year. Additionally, at December 31, 2014, we have approximately $796 million of available capacity under our credit facility and a debt balance of $4.0 billion.
During 2014, Host Inc.'s Board of Directors declared dividends of $0.75 per share on Host Inc.'s common stock, an increase of 63% over the prior year. The declared dividends included a $0.20 regular quarterly cash dividend and a $0.06 special dividend declared during the fourth quarter of 2014. Accordingly, Host L.P. made a distribution of $0.7661205 per unit on its common OP units for 2014. On February 17, 2015, the Board of Directors authorized a regular quarterly cash dividend of $0.20 per share on its common stock. The dividend will be paid on April 15, 2015, to stockholders of record on March 31, 2015. The amount of any future dividend will be determined by Host Inc.'s Board of Directors.
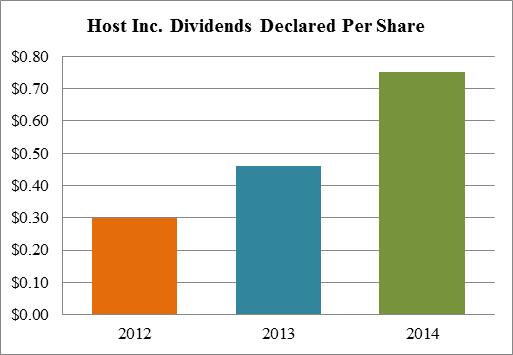
There can be no assurances that any future dividends will match or exceed those set forth above for any number of reasons, including a decline in operations or an increase in liquidity needs. We believe that we have sufficient liquidity and access to the capital
44
markets in order to meet our near-term debt maturities, fund our capital expenditures programs and take advantage of investment opportunities. For a detailed discussion, see "-Liquidity and Capital Resources." For a detailed discussion of our significant debt activities see "Note 4. Debt" in the Notes to Consolidated Financial Statements.
International Joint Venture Investments. We continue to utilize joint ventures to expand our portfolio and to help diversify exposure to target markets internationally. During 2014, the Euro JV expanded its presence in Europe, through the acquisition of the Grand Hotel Esplanade Berlin, later repositioned as the Sheraton Berlin Grand Hotel Esplanade, and sold the Sheraton Skyline Hotel & Conference Center. For further discussion, see "- Off Balance Sheet Arrangements and Contractual Obligations."
Results of Operations
The following table reflects certain line items from our audited statements of operations (in millions, except percentages):
|
|
|
|
|
|
|
|
|
| Change |
|
|
|
|
|
| Change |
| ||
|
| 2014 |
|
| 2013 |
|
| 2013 to 2014 |
|
| 2012 |
|
| 2012 to 2013 |
| |||||
Total revenues |
| $ | 5,354 |
|
| $ | 5,166 |
|
|
| 3.6 | % |
| $ | 5,059 |
|
|
| 2.1 | % |
Operating costs and expenses: |
|
|
|
|
|
|
|
|
|
|
|
|
|
|
|
|
|
|
|
|
Property-level costs (1) |
|
| 4,611 |
|
|
| 4,533 |
|
|
| 1.7 |
|
|
| 4,601 |
|
|
| (1.5 | ) |
Corporate and other expenses (2) |
|
| 43 |
|
|
| 121 |
|
|
| (64.5 | ) |
|
| 107 |
|
|
| 13.1 |
|
Gain on insurance settlements |
|
| 10 |
|
|
| - |
|
| N/M |
|
|
| 11 |
|
| N/M |
| ||
Operating profit |
|
| 710 |
|
|
| 512 |
|
|
| 38.7 |
|
|
| 362 |
|
|
| 41.4 |
|
Interest expense |
|
| 214 |
|
|
| 304 |
|
|
| (29.6 | ) |
|
| 373 |
|
|
| (18.5 | ) |
Gain on sale of assets |
|
| 236 |
|
|
| 33 |
|
| N/M |
|
|
| 13 |
|
|
| 153.8 |
| |
Provision for income taxes |
|
| 14 |
|
|
| 21 |
|
|
| (33.3 | ) |
|
| 31 |
|
|
| (32.3 | ) |
Income (loss) from continuing operations |
|
| 747 |
|
|
| 210 |
|
|
| 255.7 |
|
|
| (8 | ) |
| N/M |
| |
Income from discontinued operations |
|
| - |
|
|
| 115 |
|
| N/M |
|
|
| 71 |
|
|
| 62.0 |
| |
|
|
|
|
|
|
|
|
|
|
|
|
|
|
|
|
|
|
|
|
|
Host Inc.: |
|
|
|
|
|
|
|
|
|
|
|
|
|
|
|
|
|
|
|
|
Net income attributable to non-controlling interests |
| $ | 15 |
|
| $ | 8 |
|
|
| 87.5 |
|
| $ | 2 |
|
|
| 300.0 |
|
Net income attributable to Host Inc. |
|
| 732 |
|
|
| 317 |
|
|
| 130.9 |
|
|
| 61 |
|
|
| 419.7 |
|
|
|
|
|
|
|
|
|
|
|
|
|
|
|
|
|
|
|
|
|
|
Host L.P.: |
|
|
|
|
|
|
|
|
|
|
|
|
|
|
|
|
|
|
|
|
Net income attributable to non-controlling interests |
| $ | 6 |
|
| $ | 4 |
|
|
| 50.0 |
|
| $ | 1 |
|
|
| 300.0 |
|
Net income attributable to Host L.P. |
|
| 741 |
|
|
| 321 |
|
|
| 130.8 |
|
|
| 62 |
|
|
| 417.7 |
|
___________ |
|
|
|
|
|
|
|
|
|
|
|
|
|
|
|
|
|
|
|
|
(1) | Amounts represent total operating costs and expenses from our consolidated statements of operations, less corporate and other expenses and the gain on insurance settlements. |
(2) | For 2014, includes the reversal of the $69 million loss contingency and, for 2013, includes an $8 million accrual, both related to the San Antonio Rivercenter litigation. See Legal Proceedings for further details. |
N/M=Not Meaningful
Statement of Operations Results and Trends
The comparisons of our hotel revenues and expenses are affected by the net results of the hotels acquired and sold during the comparable periods. Our operations for 2014 were affected by the sale of five hotels during the year, most notably the Philadelphia Marriott Downtown in January 2014, which operations prior to sale are included in continuing operations for prior periods, as well as the results of three acquisitions: the b2 miami downtown hotel acquired in August 2014, the Powell Hotel acquired in January 2014, and the Hyatt Place Waikiki Beach acquired in May 2013. Our 2013 operations were affected by the results of the Grand Hyatt Washington acquired in July 2012 and the Hyatt Place Waikiki Beach. In our discussion of results, we collectively refer to these transactions as our "Recent Acquisitions and Dispositions". Due to the adoption of a new accounting standard in 2014, the operations for properties sold in 2014 are included in continuing operations, while revenues and expenses for eight properties sold in 2013 or 2012 have been reclassified to discontinued operations and, accordingly, are excluded from the revenues and expenses discussed in this section. See "-Critical Accounting Policies" for further discussion.
45
The following table presents revenues in accordance with GAAP and includes both comparable and non-comparable hotels (in millions, except percentages):
|
|
|
|
| Change |
|
|
| Change |
| ||||||||||
|
| 2014 |
|
| 2013 |
|
| 2013 to 2014 |
|
| 2012 |
|
| 2012 to 2013 |
| |||||
Revenues: |
|
|
|
|
|
|
|
|
|
|
|
|
|
|
|
|
|
|
|
|
Rooms |
| $ | 3,452 |
|
| $ | 3,317 |
|
|
| 4.1 | % |
| $ | 3,082 |
|
|
| 7.6 | % |
Food and beverage |
|
| 1,546 |
|
|
| 1,503 |
|
|
| 2.9 |
|
|
| 1,419 |
|
|
| 5.9 |
|
Other |
|
| 356 |
|
|
| 346 |
|
|
| 2.9 |
|
|
| 558 |
|
|
| (38.0 | ) |
Total revenues |
| $ | 5,354 |
|
| $ | 5,166 |
|
|
| 3.6 |
|
| $ | 5,059 |
|
|
| 2.1 |
|
The increases in total revenues in 2014 and 2013 of $188 million and $107 million, respectively, were driven by continued growth in rooms revenues, as well as growth in food and beverage ("F&B") and other revenues at our properties. Our revenues were affected by the results of our Recent Acquisitions and Dispositions, which decreased total revenues by $87 million in 2014 and increased revenues by an incremental $72 million in 2013, each on a net basis. Additionally, fluctuation in currency exchange rates and the relative strength of the U.S. dollar reduced the increase in total revenues by 40 basis points in 2014. The 2012 other revenues includes $232 million for hotels leased from Hospitality Properties Trust ("HPT"). These leases were terminated on December 31, 2012.
Rooms . Rooms revenues increased $135 million and $235 million in 2014 and 2013, respectively, reflecting an increase in RevPAR of 5.3% and 5.6%, respectively, at our comparable hotels, as well as RevPAR improvements for recently renovated properties that are not included in our comparable results. Year-over-year comparisons also reflect a $53 million decline in revenues due to Recent Acquisitions and Dispositions in 2014, and an increase of $51 million in 2013, on a net basis.
Food and beverage . F&B revenues increased $43 million and $84 million in 2014 and 2013, respectively. For our comparable hotels, F&B revenues increased 3.8% and 4.0%, respectively, for 2014 and 2013, driven by growth in banquet, audio visual revenues and outlet revenue. Year-over-year comparisons also reflect a $28 million decline in revenues due to Recent Acquisitions and Dispositions in 2014 and an increase of $20 million in 2013, on a net basis.
Other revenues . Other revenues increased $10 million in 2014 primarily due to increases in parking and lease income. In 2013, other revenues decreased $212 million. Excluding the effects of the terminated HPT leases, other revenues increased $20 million, primarily due to lease revenue at the New York Marriott Marquis as a result of the retail development agreement with Vornado Realty Trust and increases in attrition and cancellation fees and parking revenue. Year-over-year comparisons also reflect a $6 million decline in revenues due to Recent Acquisitions and Dispositions in 2014, and an increase of $2 million in 2013, on a net basis.
Property-level Operating Expenses
The following table presents consolidated property-level operating expenses in accordance with GAAP and includes both comparable and non-comparable hotels (in millions, except percentages):
|
|
|
|
| Change |
|
|
| Change |
| ||||||||||
|
| 2014 |
|
| 2013 |
|
| 2013 to 2014 |
|
| 2012 |
|
| 2012 to 2013 |
| |||||
Expenses: |
|
|
|
|
|
|
|
|
|
|
|
|
|
|
|
|
|
|
|
|
Rooms |
| $ | 924 |
|
| $ | 894 |
|
|
| 3.4 | % |
| $ | 836 |
|
|
| 6.9 | % |
Food and beverage |
|
| 1,109 |
|
|
| 1,095 |
|
|
| 1.3 |
|
|
| 1,049 |
|
|
| 4.4 |
|
Other departmental and support expenses |
|
| 1,264 |
|
|
| 1,249 |
|
|
| 1.2 |
|
|
| 1,219 |
|
|
| 2.5 |
|
Management fees |
|
| 227 |
|
|
| 222 |
|
|
| 2.3 |
|
|
| 199 |
|
|
| 11.6 |
|
Other property-level expenses |
|
| 386 |
|
|
| 376 |
|
|
| 2.7 |
|
|
| 576 |
|
|
| (34.7 | ) |
Depreciation and amortization |
|
| 701 |
|
|
| 697 |
|
|
| 0.6 |
|
|
| 722 |
|
|
| (3.5 | ) |
Total property-level operating expenses |
| $ | 4,611 |
|
| $ | 4,533 |
|
|
| 1.7 |
|
| $ | 4,601 |
|
|
| (1.5 | ) |
Our operating costs and expenses, which consist of both fixed and variable components, are affected by a number of factors. Room expense is affected mainly by occupancy, which drives costs related to items such as housekeeping, reservation systems, room supplies, laundry services and front desk costs. Food and beverage expense correlates closely with food and beverage revenues, and is affected by occupancy and the mix of business between banquet and audio-visual and outlet sales. However, the most significant expense for both room expense and food and beverage expense is related to wages and employee benefits, which comprise
46
approximately 55% of these expenses in any year. Other property-level expenses consist of property taxes, which are highly dependent on local taxing authorities, and property and general liability insurance, and do not necessarily change based on changes in revenues at our hotels. The overall increases in operating expenses in 2014 and in 2013, excluding the 2012 expenses related to the expired HPT leases, are consistent with higher overall revenues at our properties. Changes in foreign currency exchange rates reduced the increase in property-level expenses by 30 basis points. The year-over-year changes also reflect the effects of our Recent Acquisitions and Dispositions, as discussed below.
Rooms . Room expenses increased $30 million and $58 million during 2014 and 2013, respectively, reflecting an increase of 4.8% and 5.1%, respectively, at our comparable hotels, primarily driven by increases in wages and benefits, higher travel agent commissions and laundry and guest supply costs. Year-over-year comparisons also reflect a $14 million decline in expenses due to Recent Acquisitions and Dispositions in 2014, and an increase of $12 million in 2013, on a net basis.
Food and beverage. The increase in F&B expenses of $14 million in 2014 and $46 million in 2013 reflect year-over-year increases of 2.6% and 2.7% in comparable F&B expenses, respectively, as well as the effect of the timing of our Recent Acquisitions and Dispositions. The limited increase reflects continued improvements in F&B hourly productivity which has led to declines in F&B costs as a percentage of revenues in 2014 and 2013. Additionally, much of the revenue improvements were driven by increases in banquet and audio visual revenues, which have higher overall operating margins than outlet revenue. Year-over-year comparisons also reflect a $21 million decline in expenses due to Recent Acquisitions and Dispositions in 2014, and an increase of $13 million in 2013, on a net basis.
Other departmental and support expenses . Other departmental and support expenses increased $15 million and $30 million in 2014 and 2013, respectively, primarily due to increases in credit card fees, wages and benefits, and sales and marketing costs. Year-over-year comparisons also reflect a $21 million decline in expenses due to Recent Acquisitions and Dispositions in 2014, and an increase of $13 million in 2013, on a net basis.
Management fees . Management fees, which generally are calculated as a percentage of revenues and operating profit, increased 2.3% to $227 million for 2014 and 11.6% to $222 million for 2013. Base management fees for our comparable hotels, which are calculated as a percentage of total revenues, increased $8 million and $6 million in 2014 and 2013, respectively, due to the overall increase in our hotel revenues, including the effects of our Recent Acquisitions and Dispositions. For 2014, incentive management fees at our comparable properties declined 4.1%, reflecting the renegotiation of management agreements at three of our properties and declines at specific properties, which offset increases due to the overall improvement in operating profit that resulted in more properties incurring incentive management fees. For 2013, the increase is commensurate with the increase in operating profit. Year-over-year comparisons also reflect a $2 million decline in expenses from Recent Acquisitions and Dispositions in 2014 and an increase of $5 million in 2013, on a net basis.
Other property-level expenses . These expenses generally do not vary significantly based on occupancy and include expenses such as property taxes and insurance. In 2014, other property-level expenses increased $10 million, or 2.7%. For 2014, other property-level expenses at our comparable hotels increased 3.6%, as a 3.4% increase in property taxes was substantially offset by a decline in property insurance, as well as a decrease of $4 million due to incremental expenses from our Recent Acquisitions and Dispositions. For 2013, expenses decreased $200 million, or 34.7%, due to the expiration of the HPT leases on December 31, 2012. Excluding the effects of the HPT leases, other property-level expenses increased $34 million, or 10%, in 2013 due to an increase in real estate taxes, as well as $5 million due to incremental expenses from our Recent Acquisitions and Dispositions, on a net basis.
Depreciation and amortization. Depreciation and amortization expense increased $4 million, or 0.6%, to $701 million in 2014 due to capital expenditures, partially offset by a decrease due to Recent Acquisitions and Dispositions. For 2013, depreciation and amortization expense decreased $25 million, or 3.5%, to $697 million, due to a decline in non-cash impairment expenses of $59 million, partially offset by an increase due to Recent Acquisitions and Dispositions and capital expenditures.
Other Income and Expense
Corporate and other expenses . Corporate and other expenses include the following items (in millions):
|
| Year ended December 31, |
| |||||||||
|
| 2014 |
|
| 2013 |
|
| 2012 |
| |||
General and administrative cost |
| $ | 82 |
|
| $ | 87 |
|
| $ | 83 |
|
Non-cash stock-based compensation expense |
|
| 22 |
|
|
| 18 |
|
|
| 16 |
|
Litigation (recoveries) accruals and acquisition costs, net |
|
| (61 | ) |
|
| 16 |
|
|
| 8 |
|
Total corporate and other expenses |
| $ | 43 |
|
| $ | 121 |
|
| $ | 107 |
|
47
General and administrative costs primarily consist of wages and benefits, travel, corporate insurance, legal fees, audit fees, building rent and systems costs. The increases in the non-cash stock-based compensation expense reflect the increase in our stock price in both 2014 and 2013. Litigation (recoveries) accruals and acquisition costs in 2014 include the previously disclosed reversal of the $69 million loss contingency related to the successful resolution of the litigation related to the ground lease for San Antonio.
Gain on insurance settlements . We recorded a gain of $10 million in 2014 related to the receipt of insurance proceeds for several of our properties in New York and Washington, D.C. which were affected by Hurricane Sandy in October 2012. In 2012, we recorded a gain of $11 million related to the receipt of business interruption insurance proceeds for two properties in Christchurch, New Zealand, both of which were affected by an earthquake in February 2011 and recorded a gain of $2 million related to property insurance for two hotels in Chile, both of which were affected by an earthquake in February 2010.
Interest income. Interest income in both 2014 and 2013 was $4 million. The decrease in 2013 of approximately $19 million was due to the 2012 maturity of the mortgage loan investment associated with the portfolio of five hotels acquired by the Euro JV in November 2012.
Interest expense . Interest expense decreased $90 million, or 29.6%, in 2014 as compared to 2013, and decreased $69 million, or 18.5%, in 2013, primarily due to the repayment or refinancing of debt, which lowered our full year weighted average interest rates and overall debt balance. Additionally, total debt extinguishment costs decreased $32 million in 2014 and increased $6 million in 2013. Savings from our fixed-to-floating interest rate swap, which swap matured in March 2014, reduced interest expense by $2 million, $7 million and $6 million in 2014, 2013 and 2012, respectively. The following table presents certain components of interest expense (in millions):
|
| Year ended December 31, (1) |
| |||||||||
|
| 2014 |
|
| 2013 |
|
| 2012 |
| |||
Cash interest expense (1) |
| $ | 186 |
|
| $ | 239 |
|
| $ | 308 |
|
Cash incremental interest expense (1)(2) |
|
| - |
|
|
| 4 |
|
|
| 5 |
|
Non-cash interest expense |
|
| 24 |
|
|
| 25 |
|
|
| 30 |
|
Cash debt extinguishment costs (1) |
|
| 2 |
|
|
| 23 |
|
|
| 21 |
|
Non-cash debt extinguishment costs |
|
| 2 |
|
|
| 13 |
|
|
| 9 |
|
Total interest expense |
| $ | 214 |
|
| $ | 304 |
|
| $ | 373 |
|
___________ |
|
|
|
|
|
|
|
|
|
|
|
|
(1) | Total cash interest expense paid was $189 million, $282 million, and $338 million in 2014, 2013 and 2012, respectively, which includes an increase due to the change in accrued interest of $1 million, $16 million and $4 million for 2014, 2013 and 2012, respectively. |
(2) | Incremental interest expense reflects the cash interest expense for refinanced debt subsequent to the issuance of the new financing and prior to the repayment of the refinanced debt. |
Gain (loss) on sale of assets. During 2014, we recognized a $111 million gain on the sale of an 89% interest in the Philadelphia Marriott Downtown, a gain of $115 million on the sale of the Tampa Marriott Waterside Hotel & Marina and a $3 million gain on the sale of Greensboro-High Point Marriott Airport. Additionally, due to the completion of earnings requirements, we recognized deferred gains totaling $6 million related to the sale of The Ritz-Carlton, San Francisco and land contributed to the Maui JV. The gain (loss) on sale of assets in 2013 includes the $21 million gain on the sale of land adjacent to our Newport Beach Marriott Hotel & Spa and the recognition of a previously deferred $11 million gain related to an eminent domain claim by the State of Georgia of 2.9 acres of land for the highway expansion at the Atlanta Marriott Perimeter Center. The gain (loss) on sale of assets in 2012 includes the $8 million gain related to the contribution of land to the Maui JV. The 2013 and 2012 gain (loss) on sales of hotel properties are classified in discontinued operations.
Benefit (provision) for income taxes. We lease substantially all of our properties to consolidated subsidiaries designated as TRS for federal income tax purposes. The difference between hotel-level operating cash flow and the aggregate rent paid to Host L.P. by the TRS represents taxable income or loss, on which we record an income tax provision or benefit. The decrease in the tax provision in 2014 and 2013 from the prior year reflects a decrease in taxable income at the TRS due to an increase in rent expense in excess of the increase in operating profit from the hotels and a reduction of certain foreign taxes.
48
Income (loss) from discontinued operations. Discontinued operations consist of five hotels disposed of in 2013 and three hotels disposed of in 2012 and represents the results of operations and the gains or losses on the disposition of these hotels during the indicated periods. The following table summarizes the revenues, income before taxes, and the gain on disposals, net of tax, of the hotels which have been reclassified to discontinued operations, which includes assets held for sale and the results of sold hotels prior to their disposition for the periods presented (in millions):
|
| Year ended December 31, |
| |||||
|
| 2013 |
|
| 2012 |
| ||
Revenues |
| $ | 104 |
|
| $ | 264 |
|
Income before taxes |
|
| 22 |
|
|
| 24 |
|
Gain on disposals, net of tax |
|
| 97 |
|
|
| 48 |
|
Comparable Hotel Sales Overview
While management evaluates the performance of each individual hotel against its competitive set in a given market, we evaluate our overall portfolio operating results using three different criteria: geographic market, property type (i.e. urban, suburban, resort/conference or airport), and mix of business (i.e. transient, group or contract). As of December 31, 2014, 106 of our 114 owned hotels have been classified as comparable hotels. See "Comparable Hotel Operating Statistics" for a complete description of our comparable hotels.
49
2014 Compared to 2013
Comparable Hotel Sales by Geographic Market .
The following table sets forth performance information for our comparable hotels by geographic market as of December 31, 2014 and 2013:
Comparable Hotels by Market in Constant US$ (1)
|
| As of December 31, 2014 |
|
| Year ended December 31, 2014 |
|
| Year ended December 31, 2013 |
|
|
|
|
| |||||||||||||||||||||||
Market |
| No. of Properties |
|
| No. of Rooms |
|
| Average Room Rate |
|
| Average Occupancy Percentage |
|
| RevPAR |
|
| Average Room Rate |
|
| Average Occupancy Percentage |
|
| RevPAR |
|
| Percent Change in RevPAR |
| |||||||||
Boston |
|
| 5 |
|
|
| 3,432 |
|
| $ | 213.85 |
|
|
| 77.2 | % |
| $ | 165.05 |
|
| $ | 198.31 |
|
|
| 79.3 | % |
| $ | 157.20 |
|
|
| 5.0 | % |
New York |
|
| 9 |
|
|
| 7,224 |
|
|
| 286.93 |
|
|
| 87.1 |
|
|
| 249.86 |
|
|
| 278.77 |
|
|
| 86.8 |
|
|
| 241.86 |
|
|
| 3.3 |
|
Philadelphia |
|
| 2 |
|
|
| 776 |
|
|
| 211.57 |
|
|
| 78.0 |
|
|
| 165.04 |
|
|
| 208.26 |
|
|
| 74.9 |
|
|
| 156.05 |
|
|
| 5.8 |
|
Washington, D.C. |
|
| 12 |
|
|
| 6,016 |
|
|
| 201.94 |
|
|
| 76.7 |
|
|
| 154.96 |
|
|
| 202.69 |
|
|
| 75.0 |
|
|
| 152.09 |
|
|
| 1.9 |
|
Atlanta |
|
| 6 |
|
|
| 2,280 |
|
|
| 172.85 |
|
|
| 73.9 |
|
|
| 127.82 |
|
|
| 164.58 |
|
|
| 73.3 |
|
|
| 120.57 |
|
|
| 6.0 |
|
Florida |
|
| 6 |
|
|
| 2,511 |
|
|
| 218.49 |
|
|
| 78.0 |
|
|
| 170.47 |
|
|
| 207.93 |
|
|
| 75.6 |
|
|
| 157.12 |
|
|
| 8.5 |
|
Chicago |
|
| 7 |
|
|
| 2,857 |
|
|
| 186.60 |
|
|
| 74.5 |
|
|
| 139.02 |
|
|
| 183.98 |
|
|
| 73.6 |
|
|
| 135.36 |
|
|
| 2.7 |
|
Denver |
|
| 3 |
|
|
| 1,363 |
|
|
| 152.42 |
|
|
| 67.3 |
|
|
| 102.54 |
|
|
| 144.17 |
|
|
| 63.9 |
|
|
| 92.18 |
|
|
| 11.2 |
|
Houston |
|
| 4 |
|
|
| 1,706 |
|
|
| 190.63 |
|
|
| 73.4 |
|
|
| 139.96 |
|
|
| 181.26 |
|
|
| 76.6 |
|
|
| 138.75 |
|
|
| 0.9 |
|
Phoenix |
|
| 4 |
|
|
| 1,522 |
|
|
| 196.63 |
|
|
| 71.3 |
|
|
| 140.19 |
|
|
| 188.53 |
|
|
| 68.2 |
|
|
| 128.65 |
|
|
| 9.0 |
|
Seattle |
|
| 3 |
|
|
| 1,774 |
|
|
| 188.57 |
|
|
| 78.8 |
|
|
| 148.62 |
|
|
| 168.60 |
|
|
| 78.1 |
|
|
| 131.71 |
|
|
| 12.8 |
|
San Francisco |
|
| 5 |
|
|
| 3,701 |
|
|
| 224.15 |
|
|
| 82.4 |
|
|
| 184.78 |
|
|
| 199.66 |
|
|
| 80.3 |
|
|
| 160.41 |
|
|
| 15.2 |
|
Los Angeles |
|
| 8 |
|
|
| 3,228 |
|
|
| 177.43 |
|
|
| 80.6 |
|
|
| 143.01 |
|
|
| 162.93 |
|
|
| 81.7 |
|
|
| 133.11 |
|
|
| 7.4 |
|
San Diego |
|
| 5 |
|
|
| 4,691 |
|
|
| 193.17 |
|
|
| 80.0 |
|
|
| 154.54 |
|
|
| 186.14 |
|
|
| 78.2 |
|
|
| 145.59 |
|
|
| 6.1 |
|
Hawaii |
|
| 2 |
|
|
| 1,256 |
|
|
| 378.37 |
|
|
| 81.7 |
|
|
| 309.29 |
|
|
| 353.41 |
|
|
| 82.0 |
|
|
| 289.89 |
|
|
| 6.7 |
|
Other |
|
| 11 |
|
|
| 7,231 |
|
|
| 161.23 |
|
|
| 66.9 |
|
|
| 107.94 |
|
|
| 157.39 |
|
|
| 67.3 |
|
|
| 105.94 |
|
|
| 1.9 |
|
Domestic |
|
| 92 |
|
|
| 51,568 |
|
|
| 211.82 |
|
|
| 77.3 |
|
|
| 163.73 |
|
|
| 202.55 |
|
|
| 76.7 |
|
|
| 155.27 |
|
|
| 5.4 |
|
|
|
|
|
|
|
|
|
|
|
|
|
|
|
|
|
|
|
|
|
|
|
|
|
|
|
|
|
|
|
|
|
|
|
|
|
|
Asia-Pacific |
|
| 7 |
|
|
| 1,390 |
|
| $ | 153.62 |
|
|
| 82.9 | % |
| $ | 127.37 |
|
| $ | 148.69 |
|
|
| 81.1 | % |
| $ | 120.63 |
|
|
| 5.6 | % |
Canada |
|
| 3 |
|
|
| 1,219 |
|
|
| 180.08 |
|
|
| 66.6 |
|
|
| 119.92 |
|
|
| 171.37 |
|
|
| 68.9 |
|
|
| 118.06 |
|
|
| 1.6 |
|
Latin America |
|
| 4 |
|
|
| 1,075 |
|
|
| 257.33 |
|
|
| 68.3 |
|
|
| 175.82 |
|
|
| 217.40 |
|
|
| 65.6 |
|
|
| 142.55 |
|
|
| 23.3 |
|
International |
|
| 14 |
|
|
| 3,684 |
|
|
| 189.58 |
|
|
| 73.3 |
|
|
| 138.98 |
|
|
| 173.79 |
|
|
| 72.6 |
|
|
| 126.14 |
|
|
| 10.2 |
|
All Markets - Constant US$ |
|
| 106 |
|
|
| 55,252 |
|
|
| 210.40 |
|
|
| 77.0 |
|
|
| 162.07 |
|
|
| 200.72 |
|
|
| 76.4 |
|
|
| 153.32 |
|
|
| 5.7 |
|
|
|
|
|
|
|
|
|
|
|
|
|
|
|
|
|
|
|
|
|
|
|
|
|
|
|
|
|
|
|
|
|
|
|
|
|
|
|
|
|
|
|
|
|
|
|
|
|
|
|
|
|
|
|
|
|
|
|
|
|
|
|
|
|
|
|
|
|
|
|
|
|
|
|
Comparable Hotels in Nominal US$ |
| |||||||||||||||||||||||||||||||||||
|
| As of December 31, 2014 |
|
| Year ended December 31, 2014 |
|
| Year ended December 31, 2013 |
|
|
|
|
| |||||||||||||||||||||||
|
| No. of Properties |
|
| No. of Rooms |
|
| Average Room Rate |
|
| Average Occupancy Percentage |
|
| RevPAR |
|
| Average Room Rate |
|
| Average Occupancy Percentage |
|
| RevPAR |
|
| Percent Change in RevPAR |
| |||||||||
Asia-Pacific |
|
| 7 |
|
|
| 1,390 |
|
| $ | 153.62 |
|
|
| 82.9 | % |
| $ | 127.37 |
|
| $ | 152.79 |
|
|
| 81.1 | % |
| $ | 123.95 |
|
|
| 2.8 | % |
Canada |
|
| 3 |
|
|
| 1,219 |
|
|
| 180.08 |
|
|
| 66.6 |
|
|
| 119.92 |
|
|
| 183.53 |
|
|
| 68.9 |
|
|
| 126.43 |
|
|
| (5.1 | ) |
Latin America |
|
| 4 |
|
|
| 1,075 |
|
|
| 257.33 |
|
|
| 68.3 |
|
|
| 175.82 |
|
|
| 238.71 |
|
|
| 65.6 |
|
|
| 156.52 |
|
|
| 12.3 |
|
International |
|
| 14 |
|
|
| 3,684 |
|
|
| 189.58 |
|
|
| 73.3 |
|
|
| 138.98 |
|
|
| 184.92 |
|
|
| 72.6 |
|
|
| 134.22 |
|
|
| 3.5 |
|
Domestic |
|
| 92 |
|
|
| 51,568 |
|
|
| 211.82 |
|
|
| 77.3 |
|
|
| 163.73 |
|
|
| 202.55 |
|
|
| 76.7 |
|
|
| 155.27 |
|
|
| 5.4 |
|
All Markets - Nominal US$ |
|
| 106 |
|
|
| 55,252 |
|
|
| 210.40 |
|
|
| 77.0 |
|
|
| 162.07 |
|
|
| 201.43 |
|
|
| 76.4 |
|
|
| 153.86 |
|
|
| 5.3 |
|
___________ |
|
|
|
|
|
|
|
|
|
|
|
|
|
|
|
|
|
|
|
|
|
|
|
|
|
|
|
|
|
|
|
|
|
|
|
|
(1) | For a discussion of our markets and constant US$ and nominal US$ presentation, see "-Comparable Hotel Operating Statistics." |
RevPAR improvements were led by properties in our west coast markets, including San Francisco and Seattle, where comparable RevPAR increased 15.2% and 12.8%, respectively. Both markets benefited from already high levels of demand and solid group business, allowing for significant rate improvements for both group and transient business. Our hotels in these markets also benefited from post-renovation improvements.
50
Additionally, our Los Angeles and San Diego markets experienced a 7.4% and 6.1% growth in RevPAR, respectively. The Los Angeles RevPAR growth was driven by an 8.9% improvement in rate, the result of strong group and transient demand which allowed for a reduction in discounted room nights. The RevPAR growth at our San Diego hotels was due to a combination of rate growth of 3.8% and an increase in occupancy of 1.8 percentage points. Steady transient demand at these hotels led to a favorable business mix shift to higher-rated transient segments. With average occupancy over 80% for full year 2014, our Hawaii hotels experienced a 7.1% increase in average rate, as the business mix shifted to higher-rated leisure travelers, including customers previewing the new timeshare project adjacent to the Hyatt Regency Maui Resort & Spa.
In comparison, our east coast properties lagged the portfolio, primarily reflecting results in New York and Washington, D.C., where recent new supply has limited RevPAR growth to 3.3% and 1.9%, respectively. Our Boston market generally was in-line with the portfolio, with RevPAR improvement of 5.0%. This improvement reflected an increase in rate of 7.8%, offset by a decrease in occupancy of 2.1 percentage points, partially due to less favorable comparisons due to the World Series events in 2013. Our Florida market outperformed for the year, with an increase in comparable RevPAR of 8.5% compared to 2013 due to the combination of an increase in average room rate of 5.1% and an increase in occupancy of 2.5 percentage points, as our resort properties performed well, benefiting from an increase in both transient and group business.
Our Central markets were led by our Denver properties, as comparable RevPAR increased 11.2%, driven by a mix of strong citywide demand driving a 5.7% increase in rate, as well as an increase in occupancy of 3.3 percentage points. Our Chicago and Houston markets underperformed, with RevPAR increases of 2.7% and 0.9%, respectively. The Chicago market was affected by severe winter weather and a decrease in citywide events, while the Houston market was affected by renovation activity at some of our larger properties and the decline in oil prices.
Our international markets experienced a strong growth in RevPAR of 10.2%, led by our Latin American properties with RevPAR growth of 23.3%, on a constant US$ basis, as the JW Marriott Hotel Rio de Janeiro benefited from the FIFA World Cup and the JW Marriott Hotel Mexico City benefited from the rooms renovation completed in 2013. Our Canadian properties, in particular in Calgary, were affected negatively by falling oil prices and renovations, a trend that will continue into 2015 for both our Calgary and Houston properties.
Comparable Hotel Sales by Property Type.
The following table sets forth performance information for our comparable hotels by property type as of December 31, 2014 and 2013:
Comparable Hotels by Type in Nominal US$
|
| As of December 31, 2014 |
|
| Year ended December 31, 2014 |
|
| Year ended December 31, 2013 |
|
|
|
|
| |||||||||||||||||||||||
Property type (1) |
| No. of Properties |
|
| No. of Rooms |
|
| Average Room Rate |
|
| Average Occupancy Percentage |
|
| RevPAR |
|
| Average Room Rate |
|
| Average Occupancy Percentage |
|
| RevPAR |
|
| Percent Change in RevPAR |
| |||||||||
Urban |
|
| 56 |
|
|
| 34,536 |
|
| $ | 225.22 |
|
|
| 78.5 | % |
| $ | 176.83 |
|
| $ | 217.29 |
|
|
| 78.1 | % |
| $ | 169.66 |
|
|
| 4.2 | % |
Suburban |
|
| 28 |
|
|
| 9,807 |
|
|
| 165.80 |
|
|
| 71.5 |
|
|
| 118.60 |
|
|
| 156.26 |
|
|
| 70.7 |
|
|
| 110.51 |
|
|
| 7.3 |
|
Resort |
|
| 11 |
|
|
| 5,570 |
|
|
| 258.09 |
|
|
| 73.6 |
|
|
| 189.95 |
|
|
| 244.50 |
|
|
| 72.5 |
|
|
| 177.23 |
|
|
| 7.2 |
|
Airport |
|
| 11 |
|
|
| 5,339 |
|
|
| 144.66 |
|
|
| 81.1 |
|
|
| 117.32 |
|
|
| 133.71 |
|
|
| 79.9 |
|
|
| 106.82 |
|
|
| 9.8 |
|
All Types |
|
| 106 |
|
|
| 55,252 |
|
|
| 210.40 |
|
|
| 77.0 |
|
|
| 162.07 |
|
|
| 201.43 |
|
|
| 76.4 |
|
|
| 153.86 |
|
|
| 5.3 |
|
___________ |
|
|
|
|
|
|
|
|
|
|
|
|
|
|
|
|
|
|
|
|
|
|
|
|
|
|
|
|
|
|
|
|
|
|
|
|
(1) | For a discussion of our property types, see "-Comparable Hotel Operating Statistics." |
Our airport properties led the portfolio for the year with RevPAR growth of 9.8%, driven by strong rate growth at our west coast airport properties. Our urban properties experienced RevPAR growth of 4.2%, as some of our more concentrated urban markets, such as New York and Washington, D.C., experienced slower growth due to increased supply. The RevPAR improvements at our suburban properties of 7.3% was driven by an increase in rates of 6.1%, as high occupancy levels in urban markets has helped drive demand in adjacent suburban markets. An increase in leisure travel and corporate group demand in 2014 led to a 7.2% increase in RevPAR at our resort properties, reflecting a 5.6% increase in rate growth and improvement in occupancy of more than 1 percentage point.
Hotel Sales by Business Mix.
Our customers fall into three broad categories: transient, group and contract business. The information below is derived from business mix results from 106 comparable hotels for which 2014 and 2013 business mix information is available. In 2014, overall revenue growth was due to both group and transient growth. Group business was inconsistent throughout the year, with strong growth in the first and third quarters offset by slow growth in the second quarter and a slight decline in the fourth quarter. The inconsistency primarily can be attributed to timing of holidays throughout the year, as well as significant renovation activity in the fourth quarter.
51
Overall, group revenues improved 5.6% compared to the prior year, consisting of a 2.8% average room rate increase coupled with a 2.7% growth in group room nights sold. Corporate and association group revenue increased by a combined 5.0%, while other groups revenue, both leisure and government groups, grew by a combined 7.4%. During 2014, transient revenues increased 5.1% when compared to 2013, reflecting an increase in average room rate of 4.9%, and a 0.2% increase in nights sold. The transient average room rate increase resulted from a combination of segment price increases and an increasingly favorable shift to higher-rated retail customers.
2013 Compared to 2012
Comparable Hotel Sales by Geographic Market .
As of December 31, 2013, 105 of our 115 owned hotels were classified as comparable hotels. See "Comparable Hotel Operating Statistics" for a complete description of our comparable hotels. The following table sets forth performance information for our comparable hotels by geographic market as of December 31, 2013 and 2012:
Comparable Hotels by Market in Constant US$ (1)
|
| As of December 31, 2013 |
|
| Year ended December 31, 2013 |
|
| Year ended December 31, 2012(2) |
|
|
|
|
| |||||||||||||||||||||||
Market |
| No. of Properties |
|
| No. of Rooms |
|
| Average Room Rate |
|
| Average Occupancy Percentage |
|
| RevPAR |
|
| Average Room Rate |
|
| Average Occupancy Percentage |
|
| RevPAR |
|
| Percent Change in RevPAR |
| |||||||||
Boston |
|
| 6 |
|
|
| 3,672 |
|
| $ | 193.69 |
|
|
| 77.6 | % |
| $ | 150.25 |
|
| $ | 189.22 |
|
|
| 74.0 | % |
| $ | 140.11 |
|
|
| 7.2 | % |
New York |
|
| 8 |
|
|
| 6,450 |
|
|
| 278.42 |
|
|
| 86.6 |
|
|
| 241.20 |
|
|
| 272.52 |
|
|
| 83.5 |
|
|
| 227.64 |
|
|
| 6.0 |
|
Philadelphia |
|
| 3 |
|
|
| 2,191 |
|
|
| 185.36 |
|
|
| 75.2 |
|
|
| 139.37 |
|
|
| 180.98 |
|
|
| 74.7 |
|
|
| 135.24 |
|
|
| 3.1 |
|
Washington, D.C. |
|
| 11 |
|
|
| 5,119 |
|
|
| 197.26 |
|
|
| 74.4 |
|
|
| 146.68 |
|
|
| 197.96 |
|
|
| 73.4 |
|
|
| 145.21 |
|
|
| 1.0 |
|
Atlanta |
|
| 5 |
|
|
| 1,939 |
|
|
| 171.38 |
|
|
| 73.6 |
|
|
| 126.11 |
|
|
| 165.63 |
|
|
| 69.5 |
|
|
| 115.06 |
|
|
| 9.6 |
|
Florida |
|
| 7 |
|
|
| 3,230 |
|
|
| 196.43 |
|
|
| 75.3 |
|
|
| 147.99 |
|
|
| 186.39 |
|
|
| 74.0 |
|
|
| 137.95 |
|
|
| 7.3 |
|
Chicago |
|
| 6 |
|
|
| 2,387 |
|
|
| 191.06 |
|
|
| 75.1 |
|
|
| 143.52 |
|
|
| 184.03 |
|
|
| 75.5 |
|
|
| 138.94 |
|
|
| 3.3 |
|
Denver |
|
| 3 |
|
|
| 1,363 |
|
|
| 144.17 |
|
|
| 63.9 |
|
|
| 92.18 |
|
|
| 138.62 |
|
|
| 63.6 |
|
|
| 88.13 |
|
|
| 4.6 |
|
Houston |
|
| 4 |
|
|
| 1,706 |
|
|
| 181.26 |
|
|
| 76.6 |
|
|
| 138.75 |
|
|
| 157.53 |
|
|
| 76.5 |
|
|
| 120.51 |
|
|
| 15.1 |
|
Phoenix |
|
| 4 |
|
|
| 1,522 |
|
|
| 188.53 |
|
|
| 68.2 |
|
|
| 128.65 |
|
|
| 180.15 |
|
|
| 66.9 |
|
|
| 120.47 |
|
|
| 6.8 |
|
Seattle |
|
| 3 |
|
|
| 1,774 |
|
|
| 168.60 |
|
|
| 78.1 |
|
|
| 131.71 |
|
|
| 158.04 |
|
|
| 75.1 |
|
|
| 118.73 |
|
|
| 10.9 |
|
San Francisco |
|
| 5 |
|
|
| 3,701 |
|
|
| 199.66 |
|
|
| 80.3 |
|
|
| 160.41 |
|
|
| 180.22 |
|
|
| 80.8 |
|
|
| 145.55 |
|
|
| 10.2 |
|
Los Angeles |
|
| 8 |
|
|
| 3,228 |
|
|
| 162.93 |
|
|
| 81.7 |
|
|
| 133.11 |
|
|
| 152.29 |
|
|
| 81.1 |
|
|
| 123.49 |
|
|
| 7.8 |
|
San Diego |
|
| 5 |
|
|
| 4,691 |
|
|
| 186.14 |
|
|
| 78.2 |
|
|
| 145.59 |
|
|
| 182.78 |
|
|
| 76.4 |
|
|
| 139.69 |
|
|
| 4.2 |
|
Hawaii |
|
| 2 |
|
|
| 1,256 |
|
|
| 353.41 |
|
|
| 82.0 |
|
|
| 289.89 |
|
|
| 332.04 |
|
|
| 83.3 |
|
|
| 276.47 |
|
|
| 4.9 |
|
Other |
|
| 12 |
|
|
| 7,532 |
|
|
| 155.82 |
|
|
| 66.8 |
|
|
| 104.05 |
|
|
| 146.87 |
|
|
| 68.0 |
|
|
| 99.90 |
|
|
| 4.2 |
|
Domestic |
|
| 92 |
|
|
| 51,761 |
|
|
| 199.44 |
|
|
| 76.3 |
|
|
| 152.13 |
|
|
| 191.00 |
|
|
| 75.2 |
|
|
| 143.62 |
|
|
| 5.9 |
|
|
|
|
|
|
|
|
|
|
|
|
|
|
|
|
|
|
|
|
|
|
|
|
|
|
|
|
|
|
|
|
|
|
|
|
|
|
Asia-Pacific |
|
| 6 |
|
|
| 1,223 |
|
| $ | 156.30 |
|
|
| 82.3 | % |
| $ | 128.59 |
|
| $ | 149.15 |
|
|
| 79.8 | % |
| $ | 118.96 |
|
|
| 8.1 | % |
Canada |
|
| 3 |
|
|
| 1,219 |
|
|
| 183.53 |
|
|
| 68.9 |
|
|
| 126.43 |
|
|
| 174.08 |
|
|
| 68.2 |
|
|
| 118.70 |
|
|
| 6.5 |
|
Latin America |
|
| 4 |
|
|
| 1,075 |
|
|
| 238.71 |
|
|
| 65.6 |
|
|
| 156.52 |
|
|
| 224.15 |
|
|
| 71.2 |
|
|
| 159.49 |
|
|
| (1.9 | ) |
International |
|
| 13 |
|
|
| 3,517 |
|
|
| 187.71 |
|
|
| 72.6 |
|
|
| 136.31 |
|
|
| 179.22 |
|
|
| 73.2 |
|
|
| 131.15 |
|
|
| 3.9 |
|
All Markets - Constant US$ |
|
| 105 |
|
|
| 55,278 |
|
|
| 198.72 |
|
|
| 76.0 |
|
|
| 151.12 |
|
|
| 190.26 |
|
|
| 75.1 |
|
|
| 142.82 |
|
|
| 5.8 |
|
|
|
|
|
|
|
|
|
|
|
|
|
|
|
|
|
|
|
|
|
|
|
|
|
|
|
|
|
|
|
|
|
|
|
|
|
|
Comparable Hotels in Nominal US$ |
| |||||||||||||||||||||||||||||||||||
|
| As of December 31, 2013 |
|
| Year ended December 31, 2013 |
|
| Year ended December 31, 2012(2) |
|
|
|
|
| |||||||||||||||||||||||
|
| No. of Properties |
|
| No. of Rooms |
|
| Average Room Rate |
|
| Average Occupancy Percentage |
|
| RevPAR |
|
| Average Room Rate |
|
| Average Occupancy Percentage |
|
| RevPAR |
|
| Percent Change in RevPAR |
| |||||||||
Asia-Pacific |
|
| 6 |
|
|
| 1,223 |
|
| $ | 156.30 |
|
|
| 82.3 | % |
| $ | 128.59 |
|
| $ | 154.17 |
|
|
| 79.8 | % |
| $ | 122.96 |
|
|
| 4.6 | % |
Canada |
|
| 3 |
|
|
| 1,219 |
|
|
| 183.53 |
|
|
| 68.9 |
|
|
| 126.43 |
|
|
| 179.47 |
|
|
| 68.2 |
|
|
| 122.37 |
|
|
| 3.3 |
|
Latin America |
|
| 4 |
|
|
| 1,075 |
|
|
| 238.71 |
|
|
| 65.6 |
|
|
| 156.52 |
|
|
| 232.18 |
|
|
| 71.2 |
|
|
| 165.21 |
|
|
| (5.3 | ) |
International |
|
| 13 |
|
|
| 3,517 |
|
|
| 187.71 |
|
|
| 72.6 |
|
|
| 136.31 |
|
|
| 185.24 |
|
|
| 73.2 |
|
|
| 135.56 |
|
|
| 0.6 |
|
Domestic |
|
| 92 |
|
|
| 51,761 |
|
|
| 199.44 |
|
|
| 76.3 |
|
|
| 152.13 |
|
|
| 191.00 |
|
|
| 75.2 |
|
|
| 143.62 |
|
|
| 5.9 |
|
All Markets - Nominal US$ |
|
| 105 |
|
|
| 55,278 |
|
|
| 198.72 |
|
|
| 76.0 |
|
|
| 151.12 |
|
|
| 190.64 |
|
|
| 75.1 |
|
|
| 143.10 |
|
|
| 5.6 |
|
___________
(1) | For a discussion of our markets and constant US$ and nominal US$ presentation, see "-Comparable Hotel Operating Statistics." |
(2) | The 2012 results include one additional day of operations in February compared to 2013 due to the leap year in 2012. |
For 2013, our top performing markets were Houston, Seattle and San Francisco, with RevPAR increases of 15.1%, 10.9%, and 10.2%, respectively. The increase in our Houston market primarily resulted from higher average room rates, as these hotels shifted
52
from lower-rated group and transient business to higher-rated segments, as well as aggressive pricing increases in group for both retail and special corporate business. The increase in our Seattle market reflects a 6.7% increase in average room rate and a 3.0 percentage point increase in average occupancy driven by higher-rated group and transient demand. RevPAR growth in our San Francisco market was driven entirely by rate improvements from an improved business mix. Occupancy declined slightly during the year, but still remained at over 80%, as strong transient and group demand throughout the city have translated to RevPAR gains at our properties.
RevPAR for our Atlanta hotels increased 9.6% for 2013, reflecting a strong citywide and special event calendar during the year that drove group and transient demand.
For 2013, our Los Angeles market RevPAR increased 7.8% primarily due to improved average room rates as a result of increased transient business driven by a mix shift to higher-rated segments and increased corporate group business.
For 2013, our Florida hotels increased RevPAR 7.3% as a result of a 5.4% increase in average room rate and a 1.3 percentage point increase in average occupancy driven by strong leisure demand.
Our Boston market RevPAR increased 7.2% as a result of a 3.5 percentage point increase in average occupancy and a 2.4% increase in average room rate due to strong group performance and transient business due in part to Major League Baseball's Playoff and World Series events and the favorable 2012 comparisons related to Hurricane Sandy.
Our New York hotels increased RevPAR 6.0% as a result of a 3.1 percentage point increase in average occupancy and a 2.2% increase in average room rate. In 2012, RevPAR growth was affected negatively by Hurricane Sandy in the fourth quarter and renovation disruption at several of our New York hotels. In 2013, RevPAR results have been tempered by supply growth in this market.
For 2013, our Washington D.C. market RevPAR increased only 1.0% due to a 1.0 percentage point increase in average occupancy resulting from transient room nights. For 2013, the sequestration and U.S. Federal Government shutdown negatively impacted this market by lowering demand for government and related industry business.
RevPAR in our Asia/Pacific and Canadian markets increased 8.1% and 6.5%, respectively, on a constant US$ basis. For 2013, the increase at our Asia/Pacific hotels resulted from a 4.8% increase in average room rate and a 2.5 percentage point increase in average occupancy, driven by transient demand and the results of renovations completed in 2012. The improvement in RevPAR at our Canadian hotels primarily was driven by an increase in average room rate. RevPAR at our Latin American properties decreased 1.9% on a constant US$ basis, largely due to a decrease in occupancy. The nominal RevPAR results of our international properties were affected negatively by the relative strength of the US Dollar during 2013.
Comparable Hotel Sales by Property Type.
The following table sets forth performance information for our comparable hotels by property type as of December 31, 2013 and 2012:
Comparable Hotels by Type in Nominal US$
|
| As of December 31, 2013 |
|
| Year ended December 31, 2013 |
|
| Year ended December 31, 2012 (1) |
|
|
|
|
| |||||||||||||||||||||||
Property type (2) |
| No. of Properties |
|
| No. of Rooms |
|
| Average Room Rate |
|
| Average Occupancy Percentage |
|
| RevPAR |
|
| Average Room Rate |
|
| Average Occupancy Percentage |
|
| RevPAR |
|
| Percent Change in RevPAR |
| |||||||||
Urban |
|
| 54 |
|
|
| 34,183 |
|
| $ | 212.05 |
|
|
| 77.8 | % |
| $ | 164.95 |
|
| $ | 205.15 |
|
|
| 76.4 | % |
| $ | 156.81 |
|
|
| 5.2 | % |
Suburban |
|
| 28 |
|
|
| 10,021 |
|
|
| 163.16 |
|
|
| 70.7 |
|
|
| 115.40 |
|
|
| 152.34 |
|
|
| 70.7 |
|
|
| 107.74 |
|
|
| 7.1 |
|
Resort/Conference |
|
| 12 |
|
|
| 5,906 |
|
|
| 239.60 |
|
|
| 71.5 |
|
|
| 171.32 |
|
|
| 228.57 |
|
|
| 70.3 |
|
|
| 160.61 |
|
|
| 6.7 |
|
Airport |
|
| 11 |
|
|
| 5,168 |
|
|
| 132.13 |
|
|
| 80.0 |
|
|
| 105.74 |
|
|
| 126.34 |
|
|
| 79.9 |
|
|
| 100.91 |
|
|
| 4.8 |
|
All Types |
|
| 105 |
|
|
| 55,278 |
|
|
| 198.72 |
|
|
| 76.0 |
|
|
| 151.12 |
|
|
| 190.64 |
|
|
| 75.1 |
|
|
| 143.10 |
|
|
| 5.6 |
|
___________ |
|
|
|
|
|
|
|
|
|
|
|
|
|
|
|
|
|
|
|
|
|
|
|
|
|
|
|
|
|
|
|
|
|
|
|
|
(1) | The 2012 results include one additional day of operations due to the leap year. |
(2) | For a discussion of our property types, see "-Comparable Hotel Operating Statistics." |
53
For 2013, our suburban properties led the portfolio with a 7.1% increase in RevPAR, as stable average occupancy levels at these properties have allowed operators to increase average daily room rates. We believe strong demand that has led to high average occupancy and increasing rates in adjacent urban markets has contributed to an increase in demand at our suburban properties. For 2013, our resort/conference hotels experienced RevPAR growth of 6.7%, driven by a 4.8% increase in average room rate and a 1.2 percentage point increase in average occupancy due to higher demand. Our urban properties experienced a RevPAR growth of 5.2% for 2013, as results were mixed throughout these markets. Strength in several of our west coast markets, as well as in our Houston and Atlanta markets, partially were offset by weakness in our Washington D.C. and Philadelphia markets.
Hotel Sales by Business Mix.
The information below is derived from business mix results from 102 comparable hotels for which 2013 and 2012 business mix information is available. In 2013, overall revenue growth was due mainly to transient revenues improving 7.5% compared to the prior year, consisting of a 4.0% average room rate increase coupled with a 3.4% growth in transient room nights sold. The transient average room rate increase resulted from a combination of segment price increases and an increasingly favorable business mix. Higher-rated retail and non-qualified discount transient room nights increased 9.1% for the year, while lower-rated special corporate, government and discount segments decreased 0.9%. During 2013, group revenues increased 2.6% when compared to 2012, reflecting an increase in average room rate of 2.8%, while group room nights sold declined 0.2%. Corporate and association group revenues increased 9.9% and 2.6%, respectively, while discount group revenue decreased 8.4%.
Liquidity and Capital Resources
Liquidity and Capital Resources of Host Inc. and Host L.P. The liquidity and capital resources of Host Inc. and Host L.P. are derived primarily from the activities of Host L.P., which generates the capital required by our business from hotel operations, the incurrence of debt, the issuance of OP units or the sale of properties. Host Inc. is a REIT and its only significant asset is the ownership of partnership interests of Host L.P.; therefore, its financing and investing activities are conducted through Host L.P., except for the issuance of its common and preferred stock. Proceeds from stock issuances by Host Inc. are contributed to Host L.P. in exchange for OP units. Additionally, funds used by Host Inc. to pay dividends or to repurchase stock are provided by Host L.P. Therefore, while we have noted those areas in which it is important to distinguish between Host Inc. and Host L.P., we have not included a separate discussion of liquidity and capital resources as the discussion applies both to Host Inc. and Host L.P.
Overview. We look to maintain a capital structure and liquidity profile with an appropriate balance of cash, debt and equity in order to provide financial flexibility, given the inherent volatility in the lodging industry. We believe this strategy will result in a lower overall cost of capital, allow us to complete opportunistic investments and acquisitions at all times in the lodging cycle, and will position us to manage potential declines in operations caused by the inherent volatility in the lodging industry. As operations have improved in the past several years, we have executed successfully on our strategy to decrease our leverage as measured by our net debt-to-EBITDA ratio and reduce our debt service obligations, leading to an increase in our fixed charge coverage ratio. Currently, these financial metrics, as defined in in our credit facility, are stronger than at any point since we split from Marriott International in 1993. These improvements were due to stronger operations but also were accomplished through acquisitions and other investments, the majority of which were completed with available cash and proceeds from equity issuances, and the repayment and refinancing of senior notes and mortgage debt in order to extend maturity dates and obtain lower interest rates.
As we continue to achieve our balance sheet objectives, we intend to use available cash predominantly for acquisitions or other investments in our portfolio to the extent that we are able to find suitable investment opportunities that meet our return requirements. If we are unable to find appropriate investment opportunities and, assuming operations continue to improve, we may, over time, consider other uses of any available cash, such as a return of capital through dividends or common stock repurchases.
We have structured our debt profile to maintain a balanced maturity schedule and minimize the number of assets that are encumbered by mortgage debt. We have access to multiple types of financing as approximately 90% of our debt consists of senior notes, exchangeable debentures and borrowings under our credit facility, none of which are collateralized by specific hotel properties. Our senior unsecured debt is rated investment grade by Moody's Investor Services, Fitch Ratings and Standard & Poor's Rating Service, which management believes will allow us to borrow capital at better rates than previously achieved. In 2014, we were able to amend and restate our senior unsecured credit facility, lowering the margin on our all-in pricing by 30 basis points on the revolver portion and 32.5 basis points on the term loan and extending the maturity date. We also repaid $371 million of senior notes and draws on our credit facility and $384 million of mortgage and other debt. Additionally, 96% of our hotels (as measured by revenues) are unencumbered by mortgage debt.
54
We believe that we have sufficient liquidity and access to the capital markets to take advantage of opportunities to enhance our portfolio, withstand declines in operating cash flow, pay near-term debt maturities and fund our capital expenditures programs. We may continue to access the capital markets if favorable conditions exist in order to further enhance our liquidity and to fund cash needs. The table below details our significant cash flows for the three years ended December 31 (in millions):
|
| 2014 |
|
| 2013 |
|
| 2012 |
| |||
Cash and cash equivalents, beginning of year |
| $ | 861 |
|
| $ | 417 |
|
| $ | 826 |
|
Increase (decrease) in cash and cash equivalents |
|
| (177 | ) |
|
| 444 |
|
|
| (409 | ) |
Cash and cash equivalents, end of year |
| $ | 684 |
|
| $ | 861 |
|
| $ | 417 |
|
Operating activities |
|
|
|
|
|
|
|
|
|
|
|
|
Cash provided by operating activities |
| $ | 1,150 |
|
| $ | 1,019 |
|
| $ | 781 |
|
Investing activities |
|
|
|
|
|
|
|
|
|
|
|
|
Acquisitions and investments |
|
| (216 | ) |
|
| (259 | ) |
|
| (579 | ) |
Dispositions and return of capital from investments |
|
| 539 |
|
|
| 643 |
|
|
| 296 |
|
Capital expenditures |
|
| (436 | ) |
|
| (436 | ) |
|
| (638 | ) |
Financing activities |
|
|
|
|
|
|
|
|
|
|
|
|
Issuances of senior notes |
|
| - |
|
|
| 400 |
|
|
| 800 |
|
Issuances of mortgage debt |
|
| 4 |
|
|
| 150 |
|
|
| 100 |
|
Issuance of credit facility term loan |
|
| - |
|
|
| - |
|
|
| 500 |
|
Net draws (repayments) on credit facility revolver |
|
| (221 | ) |
|
| 186 |
|
|
| 142 |
|
Repurchase of senior notes, including exchangeable debentures |
|
| (150 | ) |
|
| (801 | ) |
|
| (1,795 | ) |
Mortgage debt and other prepayments and scheduled maturities |
|
| (384 | ) |
|
| (411 | ) |
|
| (113 | ) |
Host Inc.: |
|
|
|
|
|
|
|
|
|
|
|
|
Common stock issuance |
|
| 4 |
|
|
| 303 |
|
|
| 274 |
|
Dividends on common stock |
|
| (469 | ) |
|
| (313 | ) |
|
| (187 | ) |
Host L.P.: |
|
|
|
|
|
|
|
|
|
|
|
|
Common OP unit issuance |
|
| 4 |
|
|
| 303 |
|
|
| 274 |
|
Distributions on common OP units |
|
| (475 | ) |
|
| (317 | ) |
|
| (190 | ) |
Cash Requirements. We use cash for acquisitions, capital expenditures, debt payments, operating costs, corporate and other expenses, as well as dividends and distributions to stockholders and unitholders. As a REIT, Host Inc. is required to distribute to its stockholders at least 90% of its taxable income, excluding net capital gain, on an annual basis. Funds used by Host Inc. to make cash distributions are provided by Host L.P. Our primary sources of cash are cash from operations, proceeds from the sale of assets, borrowings under our credit facility and debt and equity issuances.
The following graph summarizes our aggregate debt maturities as of February 20, 2015:
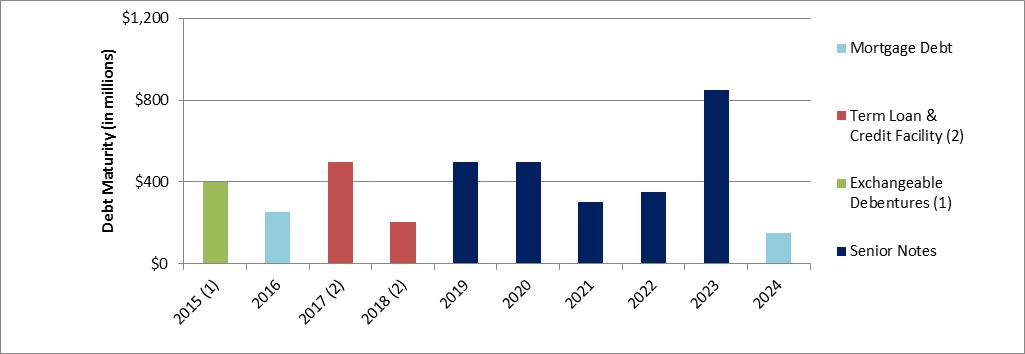
|
|
(1) | The debt maturing in 2015 assumes the exercise of a put option by the holders of our exchangeable senior debentures. |
(2) | The term loan and credit facility agreements contain extension options that would extend the maturity of both instruments to 2019, subject to meeting certain conditions. |
55
Capital Resources. We depend primarily on external sources of capital to finance future growth, including acquisitions. As a result, the liquidity and debt capacity provided by our credit facility and the ability to issue senior unsecured debt are key components of our capital structure. Our financial flexibility (including our ability to incur debt, make distributions and make investments) is contingent on our ability to maintain compliance with the financial covenants of such indebtedness, which include, among other things, the allowable amounts of leverage, interest coverage and fixed charges.
If, at any time, we determine that market conditions are favorable, after taking into account our liquidity requirements, we may cause Host L.P. to issue senior notes or debentures exchangeable for shares of Host Inc. common stock. Given our total debt level and maturity schedule, we also will continue to redeem or refinance senior notes and mortgage debt from time to time, taking advantage of favorable market conditions. In February 2015, Host Inc.'s Board of Directors authorized repurchases of up to $500 million of senior notes, exchangeable debentures and mortgage debt other than in accordance with its terms. We may purchase senior notes and exchangeable debentures for cash through open market purchases, privately negotiated transactions, a tender offer or, in some cases, through the early redemption of such securities pursuant to their terms. Repurchases of debt will depend on prevailing market conditions, our liquidity requirements, contractual restrictions and other factors. Any refinancing or retirement before the maturity date will affect earnings and FFO per diluted share as a result of the payment of any applicable call premiums and the acceleration of previously deferred financing costs. In addition, while we intend to use any available cash predominantly for acquisitions or other investments in our hotel portfolio, to the extent we do not identify appropriate investments, we may elect in the future to use available cash for other uses, including share repurchases. Accordingly, in light of our priorities in managing our capital structure and liquidity profile and given prevailing conditions and relative pricing in the capital markets, we may, at any time, subject to applicable securities laws, be considering, or be in discussions with respect to the repurchase or issuance of exchangeable debentures and/or senior notes or the repurchase or sale of common stock. Any such transactions may, subject to applicable securities laws, occur simultaneously.
We continue actively to explore potential acquisitions and anticipate that any such future acquisitions will be funded primarily by proceeds from sales of properties, but also potentially from equity offerings of Host Inc., or by issuances of OP units by Host L.P., the incurrence of debt, available cash or advances under our credit facility. Given the nature of these transactions, we can make no assurances that we will be successful in acquiring any one or more hotels that we may review, bid on or negotiate to purchase. We may acquire additional properties through various structures, including transactions involving single assets, portfolios, joint ventures and acquisitions of the securities or assets of other REITs.
Counterparty Credit Risk. We are subject to counterparty credit risk, which relates to the ability of counterparties to meet their contractual payment obligations or the potential non-performance of counterparties to deliver contracted commodities or services at the contracted price. We assess the ability of our counterparties to fulfill their obligation to determine the impact, if any, of counterparty bankruptcy or insolvency on our financial condition. We are exposed to credit risk with respect to cash held at various financial institutions, access to our credit facility and amounts due or payable under our derivative contracts. Our credit exposure in each of these cases is limited. Our exposure with regard to our cash and the $796 million available under our credit facility is mitigated, as the credit risk is spread among a diversified group of investment grade financial institutions. At December 31, 2014, the exposure risk related to our derivative contracts totaled $13 million and the counterparties were investment grade financial institutions.
Sources and Uses of Cash. In 2014, our sources of cash included cash from operations and proceeds from asset sales. Uses of cash during the year consisted of acquisitions, investments in our joint ventures, capital expenditures, operating costs, debt repayments and repurchases and distributions to equity holders. We anticipate that our sources and uses of cash will be similar during 2015.
Cash Provided by Operations . Our cash provided by operations for 2014 increased $131 million to $1,150 million compared to 2013, primarily due to improved operations at our hotels and a decrease in cash interest payments.
Cash Used in Investing Activities . Approximately $93 million of cash was used in investing activities during 2014 compared to $75 million in 2013. In addition to the acquisition, investment and disposition activity detailed in the charts below, we spent approximately $436 million on capital expenditures, the same level as in 2013. Our renewal and replacement capital expenditures for 2014 were approximately $324 million, which reflects an increase of approximately 7% from 2013 levels. Our renewal and replacement capital expenditures generally are funded by the furniture, fixture and equipment funds established at certain of our hotels (typically 5% of property revenues) and by our available cash. We also spent approximately $112 million in 2014 on ROI/redevelopment projects and acquisition capital expenditures, which reflects a decrease of approximately 16% compared to 2013 levels. Additionally, we have capitalized certain internal costs and interest expense associated with our capital expenditures projects in accordance with GAAP. These capitalized costs were $14 million, $11 million and $11 million for 2014, 2013 and 2012, respectively.
56
The following tables summarize significant investment activities and dispositions that have been completed as of February 20, 2015 (in millions):
Transaction Date |
| Description of Transaction |
| Investment |
| ||
Acquisitions/Investments |
|
|
|
|
|
|
|
January-December | 2014 |
| Investment in Maui JV |
| $ | (40 | ) |
January-December | 2014 |
| Development costs for two hotels in Rio de Janeiro |
|
| (13 | ) |
January-December | 2014 |
| Investment in Euro JV |
|
| (21 | ) |
August | 2014 |
| Acquisition of b2 miami downtown hotel |
|
| (58 | ) |
January | 2014 |
| Acquisition of The Powell Hotel |
|
| (75 | ) |
December | 2013 |
| Acquisition of land at the New York Marriott Marquis (1) |
|
| (20 | ) |
January-December | 2013 |
| Development costs for two hotels in Rio de Janeiro |
|
| (19 | ) |
May-August | 2013 |
| Investment in Euro JV |
|
| (67 | ) |
May | 2013 |
| Acquisition of Hyatt Place Waikiki Beach |
|
| (139 | ) |
|
|
| Total acquisitions/investments |
| $ | (452 | ) |
___________ |
|
|
|
|
|
| |
(1) | The investment price was $45 million, which includes $25 million of consideration paid in prior years. |
Transaction Date |
| Description of Transaction |
| Net Proceeds (1) |
|
| Sales Price |
| |||
Dispositions/Return on Investments |
|
|
|
|
|
|
|
|
|
|
|
December | 2014 |
| Disposition of Dayton Marriott |
| $ | 18 |
|
| $ | 21 |
|
December | 2014 |
| Disposition of Greensboro-High Point Marriott Airport |
|
| 16 |
|
|
| 19 |
|
October | 2014 |
| Disposition of Tampa Marriott Waterside Hotel & Marina |
|
| 189 |
|
|
| 199 |
|
April | 2014 |
| Distribution from Euro JV |
|
| 17 |
|
|
| 17 |
|
February | 2014 |
| Disposition of Courtyard Nashua |
|
| 9 |
|
|
| 10 |
|
January | 2014 |
| Sale of 89% interest in the Philadelphia Marriott Downtown (2) |
| 290 |
|
|
| 270 |
| |
December | 2013 |
| Disposition of Dallas/Addison Marriott Quorum by the Galleria |
| 53 |
|
|
| 56 |
| |
November | 2013 |
| Disposition of Four Seasons Hotel Atlanta |
| 62 |
|
|
| 63 |
| |
November | 2013 |
| Disposition of Portland Marriott Downtown Waterfront |
| 83 |
|
|
| 87 |
| |
June | 2013 |
| Disposition of The Ritz-Carlton, San Francisco |
| 146 |
|
|
| 161 |
| |
April | 2013 |
| Sale of land adjacent to Newport Beach Marriott Hotel & Spa |
| 24 |
|
|
| 24 |
| |
January | 2013 |
| Disposition of Atlanta Marriott Marquis |
| 276 |
|
|
| 293 |
| |
|
|
| Total dispositions |
| $ | 1,183 |
|
| $ | 1,220 |
|
___________ |
|
|
|
|
|
|
|
|
|
| |
(1) | Proceeds are net of FF&E replacement funds paid by the purchasers and retained at the hotels, transfer taxes and other sales costs. |
(2) | Sales price represents the 89% interest in the hotel that was sold. Net proceeds also include our 11% portion of the proceeds received from the $230 million mortgage loan issued by the partnership at closing. |
Cash Used in Financing Activities . Net cash used in financing activities was $1,226 million for 2014, as compared to $493 million in 2013. During 2014, cash used primarily consisted of debt repayments or repurchases and dividend payments, while 2013 also included issuances of debt and equity securities.
The following table summarizes significant debt issuances, net of deferred financing costs, that have been completed as of February 20, 2015 (in millions):
Transaction Date |
|
| Description of Transaction |
| Net Proceeds |
| |
Debt Issuances |
|
|
|
|
|
|
|
February - December | 2013 |
| Net draw on revolver portion of credit facility |
| $ | 186 |
|
December | 2013 |
| Issuance of mortgage debt on the Harbor Beach Marriott Resort & Spa |
|
| 150 |
|
March | 2013 |
| Proceeds from the issuance of $400 million 3 3/4% Series D senior notes |
|
| 396 |
|
|
|
| Total issuances |
| $ | 732 |
|
57
The following table presents significant debt repayments, including prepayment premiums, that have been completed as of February 20, 2015 (in millions):
|
|
|
|
| Transaction |
| |
Transaction Date |
|
| Description of Transaction |
| Amount |
| |
Cash Repayments |
|
|
|
|
|
|
|
January - October | 2014 |
| Net repayment on revolver portion of credit facility |
| $ | (221 | ) |
October | 2014 |
| Redemption of Dulles Airport industrial revenue bond |
|
| (12 | ) |
June | 2014 |
| Redemption of Philadelphia Airport Marriott industrial revenue bond |
|
| (40 | ) |
June | 2014 |
| Redemption of Newark Liberty International Airport Marriott industrial revenue bond |
|
| (32 | ) |
February | 2014 |
| Repayment of mortgage loan on the Ritz-Carlton, Naples and Newport Beach Marriott |
|
| (300 | ) |
February | 2014 |
| Redemption of $150 million of 6 3/4% Series Q senior notes |
|
| (152 | ) |
December | 2013 |
| Repayment of mortgage loan on The Westin Denver Downtown |
|
| (31 | ) |
December | 2013 |
| Repayment of mortgage loan on the Harbor Beach Marriott Resort & Spa |
|
| (134 | ) |
September | 2013 |
| Redemption of $200 million of 6 3/4% Series Q senior notes |
|
| (202 | ) |
June | 2013 |
| Redemption of $200 million of 6 3/4% Series Q senior notes |
|
| (202 | ) |
May | 2013 |
| Repayment of mortgage loan on the Orlando World Center Marriott |
|
| (246 | ) |
May | 2013 |
| Redemption of $400 million of 9% Series T senior notes |
|
| (418 | ) |
2013/2014 |
|
| Principal amortization |
|
| (2 | ) |
|
|
| Total cash repayments |
| $ | (1,992 | ) |
|
|
|
|
|
|
|
|
Non-cash Debt Transaction |
|
|
|
|
|
|
|
March | 2013 |
| Exchange of a portion of the 2004 Debentures for Host Inc. common stock (1) |
| $ | (174 | ) |
___________ |
|
|
|
|
|
|
|
(1) | In connection with the exchange, Host L.P. issued approximately 11.5 million common OP units to Host Inc. |
Equity/Capital Transactions. In 2013, Host Inc. issued 16.9 million shares of common stock, at an average price of $17.78 per share, for proceeds of approximately $297 million, net of commissions of approximately $3 million. These issuances were made in "at-the-market" offerings pursuant to sales agency financing agreements with BNY Mellon Capital Markets, LLC and Scotia Capital (USA) Inc. and represented the completion of sales available under these agreements. The net proceeds were used to fund hotel acquisitions, development projects and a portion of our ROI/redevelopment capital expenditures. There were no "at-the-market" issuances in 2014.
The following table summarizes significant equity transactions that have been completed as of February 20, 2015 (in millions):
|
|
|
|
| Transaction |
| |
Transaction Date |
|
| Description of Transaction |
| Amount |
| |
Equity of Host Inc. |
|
|
|
|
|
|
|
January | 2015 |
| Dividend payment (1)(2) |
| $ | (197 | ) |
January-December | 2014 |
| Dividend payments (2) |
|
| (469 | ) |
January-December | 2013 |
| Dividend payments (2) |
|
| (313 | ) |
January-September | 2013 |
| Issuance of approximately 16.9 million common shares under Host Inc.'s "at-the- market" equity program (3) |
|
| 297 |
|
|
|
| Cash payments on equity transactions |
| $ | (682 | ) |
|
|
|
|
|
|
|
|
Non-cash Equity Transaction |
|
|
|
|
|
|
|
March | 2013 |
| Issuance of approximately 11.7 million common shares through the exchange of the 2004 Debentures (4) |
| $ | 174 |
|
___________ |
|
|
|
|
|
|
|
58
(1) | Our dividend payment for the fourth quarter of 2014 was made in January 2015, but accrued at December 31, 2014. |
(2) | In connection with the dividends, Host L.P. made distributions of $199 million in 2015, $475 million in 2014 and $317 million in 2013 to its common unit holders. |
(3) | In exchange for the cash consideration received from the issuance of these shares, Host L.P. issued to Host Inc. approximately 16.5 million common OP units in 2013. |
(4) | In connection with the exchange, Host L.P. issued approximately 11.5 million common OP units to Host Inc. |
Financial Condition
As of December 31, 2014, our total debt was approximately $4.0 billion, of which 79% carried a fixed rate of interest. Total debt was comprised of the following (in millions):
|
| As of December 31, |
| |||||
|
| 2014 |
|
| 2013 |
| ||
Series Q senior notes, with a rate of 6¾% due June 2016 |
| $ | - |
|
| $ | 150 |
|
Series V senior notes, with a rate of 6% due November 2020 |
|
| 500 |
|
|
| 500 |
|
Series X senior notes, with a rate of 5⅞% due June 2019 |
|
| 498 |
|
|
| 497 |
|
Series Z senior notes, with a rate of 6% due October 2021 |
|
| 300 |
|
|
| 300 |
|
Series B senior notes, with a rate of 5¼% due March 2022 |
|
| 350 |
|
|
| 350 |
|
Series C senior notes, with a rate of 4¾% due March 2023 |
|
| 450 |
|
|
| 450 |
|
Series D senior notes, with a rate of 3¾% due October 2023 |
|
| 400 |
|
|
| 400 |
|
2009 Exchangeable Senior Debentures, with a rate of 2½% due October 2029 |
|
| 386 |
|
|
| 371 |
|
Total senior notes |
|
| 2,884 |
|
|
| 3,018 |
|
Credit facility revolver |
|
| 204 |
|
|
| 446 |
|
Credit facility term loan due June 2017 |
|
| 500 |
|
|
| 500 |
|
Mortgage debt (non-recourse), with an average interest rate of 5.0% and 4.1% at December 31, 2014 and 2013, respectively, maturing through January 2024 |
|
| 404 |
|
|
| 709 |
|
Other |
|
| - |
|
|
| 86 |
|
Total debt |
| $ | 3,992 |
|
| $ | 4,759 |
|
|
|
|
|
|
|
|
|
|
Aggregate debt maturities at December 31, 2014 are as follows (in millions):
|
| Senior notes |
|
|
|
|
|
|
|
|
| |
|
| and |
|
| Mortgage debt |
|
|
|
|
| ||
|
| credit facility |
|
| and other |
|
| Total |
| |||
2015 (1) |
| $ | 400 |
|
| $ | - |
|
| $ | 400 |
|
2016 |
|
| - |
|
|
| 253 |
|
|
| 253 |
|
2017 |
|
| 500 |
|
|
| - |
|
|
| 500 |
|
2018 |
|
| 204 |
|
|
| - |
|
|
| 204 |
|
2019 |
|
| 500 |
|
|
| - |
|
|
| 500 |
|
Thereafter |
|
| 2,000 |
|
|
| 150 |
|
|
| 2,150 |
|
|
|
| 3,604 |
|
|
| 403 |
|
|
| 4,007 |
|
Unamortized (discounts) premiums, net |
|
| (16 | ) |
|
| - |
|
|
| (16 | ) |
Capital lease obligations |
|
| - |
|
|
| 1 |
|
|
| 1 |
|
|
| $ | 3,588 |
|
| $ | 404 |
|
| $ | 3,992 |
|
___________ |
|
|
|
|
|
|
|
|
|
|
|
|
(1) | The debt maturing in 2015 includes $400 million of our exchangeable senior debentures that are subject to a put option by holders in that year. |
Senior Notes. The following summary is a description of the material provisions of the indentures governing our various senior notes issued by Host L.P., to which we refer collectively as the senior notes indenture. We pay interest on each series of our outstanding senior notes semi-annually in arrears at the respective annual rates indicated on the table above. Under the terms of our senior notes indenture, our senior notes are equal in right of payment with all of Host L.P.'s unsubordinated indebtedness and senior to all subordinated obligations of Host L.P.
59
Pledges and Guarantees . Under the senior notes indenture, all Host L.P. subsidiaries which guarantee Host L.P. debt are required to similarly guarantee debt issuances under the indenture. Also, to the extent the equity of any subsidiaries of Host L.P. is pledged to secure borrowings under the credit facility, such collateral likewise is required to secure senior note issuances under the senior notes indenture. While the credit facility currently does not include any subsidiary guarantees or pledges of equity interests, such guarantees or pledges subsequently will be required in the event that Host L.P.'s leverage ratio exceeds 6.0x for two consecutive fiscal quarters at a time that Host L.P. does not have an investment grade long-term unsecured debt rating. In the event that such guarantee and pledge requirement is triggered, the guarantees and pledges would ratably benefit the credit facility, as well as the senior notes issued under the senior notes indenture and certain hedging and bank product arrangements with lenders that are parties to the credit facility. If triggered, the guarantees and pledges only would be required by certain U.S. and Canadian subsidiaries of Host L.P. and a substantial portion of our subsidiaries would not provide guarantees or pledges of equity interests. Further, if at any time our leverage ratio falls below 6.0x for two consecutive fiscal quarters or Host L.P. has an investment grade long-term unsecured debt rating, such guarantees and pledges may be released.
Series D Senior Notes Restrictive Covenants
In March 2013, we completed an underwritten public offering of $400 million aggregate principal amount of Series D senior notes bearing interest at a rate of 3.75% per year due in 2023. The Series D senior notes are not redeemable prior to 90 days before the October 15, 2023 maturity date, except at a price equal to 100% of their principal amount, plus a make-whole premium as set forth in the senior notes indenture, plus accrued and unpaid interest to the applicable redemption date. The notes were issued under our existing senior notes indenture and have covenants customary for investment grade debt, primarily limitations on our ability to incur debt. There are no restrictions on our ability to pay dividends. Because these senior notes were issued after we attained an investment grade rating, while all other series of our senior notes were issued before we had attained an investment grade rating, the covenants of these senior notes are different than the covenants applicable to our other senior notes.
Under the terms of the Series D senior notes, Host L.P.'s ability to incur indebtedness is subject to restrictions and the satisfaction of various conditions, including the achievement of an EBITDA-to-interest coverage ratio of at least 1.5x by Host L.P. As calculated, this ratio excludes from interest expense items such as call premiums and deferred financing charges that are included in interest expense on Host L.P.'s consolidated statement of operations. In addition, the calculation is based on Host L.P.'s pro forma results for the four prior fiscal quarters, giving effect to certain transactions, such as acquisitions, dispositions and financings, as if they had occurred at the beginning of the period. Other covenants limiting Host L.P.'s ability to incur indebtedness include maintaining total indebtedness of less than 65% of adjusted total assets (using undepreciated real estate book values), maintaining secured indebtedness of less than 40% of adjusted total assets and maintaining total unencumbered assets of at least 150% of the aggregate principal amount of outstanding unsecured indebtedness of Host L.P. and its subsidiaries. So long as Host L.P. maintains the required level of interest coverage and satisfies these and other conditions in the senior notes indenture, it may incur additional debt.
We are in compliance with all of the financial covenants applicable to our Series D senior notes. The following table summarizes the financial tests contained in the senior notes indenture for our Series D senior notes and our actual credit ratios as of December 31, 2014:
|
| Actual Ratio |
|
| Covenant Requirement | |
Unencumbered assets tests |
|
| 489 | % |
| Minimum ratio of 150% |
Total indebtedness to total assets |
|
| 21 | % |
| Maximum ratio of 65% |
Secured indebtedness to total assets |
|
| 2 | % |
| Maximum ratio of 40% |
EBITDA-to-interest coverage ratio |
|
| 7.3 | x |
| Minimum ratio of 1.5x |
Prior Series of Senior Notes Restrictive Covenants
Currently, our senior notes have an investment grade rating from both Moody's and Standard & Poor's. As a result, many of the restrictive covenants contained in the senior notes indenture and the supplemental indentures for our prior series of senior notes are not applicable, as they do not apply for so long as such series of notes maintain an investment grade rating from both Moody's and Standard & Poor's. The following primary covenants continue to apply to our existing senior notes (other than our Series D senior notes):
● | restrict our ability to sell all or substantially all of our assets or merge with or into other companies; and |
● | require us to make an offer to repurchase the existing senior notes then currently outstanding upon the occurrence of a change of control. |
60
If our senior notes no longer are rated investment grade by either or both of Moody's and Standard & Poor's, then the following covenants and other restrictions will be reinstated for our existing senior notes (but will not apply to the Series D senior notes which have different covenants):
● | our ability to incur indebtedness and make distributions will be subject to restrictions and the satisfaction of various conditions, including the achievement of an EBITDA-tointerest coverage ratio of at least 2.0x. We will be able to make distributions to enable Host Inc. to pay dividends on its preferred stock, if any, under the senior notes indenture when our EBITDA-to-interest coverage ratio is above 1.7 to 1.0. This ratio is calculated in accordance with the terms of our senior notes indenture applicable to our existing senior notes based on pro forma results for the four prior fiscal quarters, giving effect to transactions such as acquisitions, dispositions and financings, as if they had occurred at the beginning of the period. Interest expense excludes items such as the gains and losses on the extinguishment of debt, deferred financing charges related to the senior notes or the credit facility, amortization of debt premiums or discounts that were recorded at acquisition of a loan in order to establish the debt at fair value, and, during the year ended December 31, 2014, approximately $16 million of non-cash interest, which represents interest expense recorded as a result of the implementation in 2009 of an accounting requirement relating to our outstanding Exchangeable Senior Debentures. These amounts are included in interest expense on our consolidated statements of operations; |
● | other covenants limiting our ability to incur indebtedness and make distributions would include maintaining total indebtedness of less than 65% of adjusted total assets (using undepreciated real estate book values), excluding intangible assets, and maintaining secured indebtedness and subsidiary indebtedness of less than 45% of adjusted total assets. So long as we maintain the required level of interest coverage and satisfy these and other conditions in the senior notes indenture applicable to our existing senior notes, we may make preferred or common OP unit distributions and incur additional debt, including debt incurred in connection with an acquisition. Even if we are below the coverage levels otherwise required to incur debt and make distributions when our senior notes no longer are rated investment grade, we still will be permitted to incur certain types of debt, including (i) credit facility debt, (ii) refinancing debt, (iii) up to $400 million of mortgage debt, which proceeds would be used to repay debt under the credit facility (and permanently reduce our ability to borrow under the credit facility by such amount), and (iv) up to $150 million of other debt. We also will be permitted to make distributions of estimated taxable income that are necessary to maintain Host Inc.'s REIT status; |
● | a requirement to maintain unencumbered assets, based on undepreciated book values, of not less than 125% of the aggregate amount of senior note debt, plus other debt not secured by mortgages. This coverage requirement must be maintained at all times and is distinct from the coverage requirements necessary to incur debt or make distributions discussed above (which consequences, where we fall below the coverage level, are limited to restricting our ability to incur new debt or make distributions, but which would not otherwise cause a default under our senior notes indenture); and |
● | our ability to make distributions on, redeem or repurchase our OP units; permit payment or distribution restrictions on certain of our subsidiaries; sell assets; enter into transactions with affiliates; and create certain liens will be restricted. |
The following summarizes the actual credit ratios for our existing senior notes (other than the Series D senior notes) as of December 31, 2014 and the covenant requirements contained in the senior notes indenture that would be applicable at such times as our existing senior notes no longer are rated investment grade by either of Moody's or Standard & Poor's. Even if we were to lose the investment grade rating, we would be in compliance with all of our financial covenants under the senior notes indenture:
|
| Actual Ratio* |
|
| Covenant Requirement | |
Unencumbered assets tests |
|
| 498 | % |
| Minimum ratio of 125% |
Total indebtedness to total assets |
|
| 21 | % |
| Maximum ratio of 65% |
Secured indebtedness to total assets |
|
| 2 | % |
| Maximum ratio of 45% |
EBITDA-to-interest coverage ratio |
|
| 7.4 | x |
| Minimum ratio of 2.0x |
* | Because of differences in the calculation methodology between our Series D senior notes and our other senior notes, our actual ratios as reported can be slightly different. |
Exchangeable Debentures. As of December 31, 2014, we have $400 million of 2½% exchangeable senior debentures outstanding that were issued on December 22, 2009 (the "2009 Debentures"). The 2009 Debentures are equal in right of payment with all of our other senior notes. Holders have the right to require us to purchase the 2009 Debentures at a price equal to 100% of the principal amount outstanding plus accrued interest (the "put option") on October 15, 2015 and on certain other subsequent dates. Holders of the 2009 Debentures also have the right to exchange the 2009 Debentures prior to maturity under certain conditions, including at any time at which the closing price of Host Inc.'s common stock is more than 130% of the exchange price per share for at least 20 of the last 30 consecutive trading days of the calendar quarter or at any time up to two days prior to the date on which the 2009 Debentures have been called for redemption. We can redeem for cash all, or part, of the 2009 Debentures at any time subsequent
61
to October 20, 2015, at a redemption price equal to 100% of the principal amount plus accrued interest. If, at any time, we elect to redeem the 2009 Debentures and the exchange value exceeds the cash redemption price, we would expect the holders to elect to exchange the 2009 Debentures at the respective exchange value rather than receive the cash redemption price. The exchange value is equal to the applicable exchange rate multiplied by the price of Host Inc.'s common stock. Upon exchange, the 2009 Debentures would be exchanged for Host Inc.'s common stock, cash or a combination thereof, at our option. As of December 31, 2014, the closing price of Host Inc.'s common stock exceeded 130% of the exchange price for more than 20 of 30 consecutive prior trading days. Therefore, the 2009 Debentures are exchangeable by holders through March 31, 2015. Whether the 2009 Debentures continue to be exchangeable after March 31, 2015 will depend on future trading prices of Host Inc's common stock. Currently, each $1,000 Debenture would be exchanged for 77.8265 Host Inc. common shares (for an equivalent per share price of $12.85), for a total of 31.1 million shares. For additional detail on the initial valuation of the 2009 Debentures and the related interest expense, see "Item 8. Financial Statements and Supplementary Data – Note 4. Debt – Exchangeable Debentures ."
Credit Facility. On June 27, 2014, we entered into a new senior revolving credit facility with Bank of America, N.A., as administrative agent, JPMorgan Chase Bank, N.A., as syndication agent, and certain other agents and lenders. The credit facility allows for revolving borrowings in an aggregate principal amount of up to $1 billion, including a foreign currency subfacility for Canadian dollars, Australian dollars, New Zealand dollars, Japanese yen, Euros, British pound sterling and, if available to the lenders, Mexican peso, of up to the foreign currency equivalent of $500 million, subject to a lower amount in the case of New Zealand dollar and Mexican peso borrowings. The credit facility also provides a subfacility of up to $100 million for swingline borrowings in U.S. dollars, Canadian dollars, Euros or British pounds sterling and a subfacility of up to $100 million for issuances of letters of credit. Host L.P. also has the option to increase the aggregate principal amount of the credit facility by up to $500 million, subject to obtaining additional loan commitments and satisfaction of certain conditions. The credit facility has an initial scheduled maturity of June 2018, with two six-month renewal options, subject to certain conditions, including the payment of an extension fee and the accuracy of representations and warranties.
Credit Facility Term Loan. The June 2014 credit facility contained a term loan facility of $500 million, which replaced and refinanced the term loan under our prior facility of like amount. The term loan facility contains an option for us to increase the aggregate principal amount of the term loan facility by up to $500 million in the future, subject to obtaining additional loan commitments and the satisfaction of the other conditions specified in the credit facility. The term loan facility has an initial scheduled maturity of June 2017, with two one-year renewal options, subject to certain conditions, including the payment of an extension fee and the accuracy of representations and warranties.
The term loan does not require any scheduled amortization payments prior to maturity. The term loan otherwise is subject to the same terms and conditions as those in the credit facility regarding subsidiary guarantees and pledges of security interests in subsidiaries, operational covenants, financial covenants and events of default (as discussed below).
Collateral and Guarantees. The credit facility does not currently include any subsidiary guarantees or pledges of equity interests in our subsidiaries or any other security, and the guarantees and pledges are required only in the event that Host L.P.'s leverage ratio exceeds 6.0x for two consecutive fiscal quarters at a time that Host L.P. does not have an investment grade long-term unsecured debt rating. In the event that such guarantee and pledge requirement is triggered, the guarantees and pledges would ratably benefit the credit facility, as well as the notes outstanding under Host L.P.'s senior notes indenture, interest rate and currency hedges and certain other hedging and bank product arrangements with lenders that are parties to the credit facility. Even when triggered, the guarantees and pledges only would be required by certain U.S. and Canadian subsidiaries of Host L.P. and a substantial portion of our subsidiaries would provide neither guarantees nor pledges of equity interests. Further, if at any time our leverage ratio falls below 6.0x for two consecutive fiscal quarters or Host L.P. has an investment grade long-term unsecured debt rating, such guarantees and pledges may be released.
Prepayments. Voluntary prepayments of the loans under the credit facility are permitted in whole or in part without premium or penalty. The loans under the credit facility are required to be prepaid in the event that asset sales reduce adjusted total assets (using undepreciated real estate book values) to below $10 billion if we do not reinvest the proceeds of those asset sales in new properties. At December 31, 2014, we have adjusted total assets, as defined in our credit facility, of $19 billion.
Financial Covenants. The credit facility contains covenants concerning allowable leverage, fixed charge coverage and unsecured interest coverage. We are permitted to make borrowings and maintain amounts outstanding under the credit facility so long as our leverage ratio is not in excess of 7.25x, our unsecured coverage ratio is not less than 1.75x and our fixed charge coverage ratio is not less than 1.25x. The financial covenants for the credit facility do not apply when there are no borrowings under the credit facility. Hence, so long as there are no amounts outstanding thereunder and the term loan is repaid, we would not be in default if we do not satisfy the financial covenants and we do not lose the potential to draw under the credit facility in the future if we were ever to regain compliance with the financial covenants. These calculations are performed based on pro forma results for the prior four fiscal quarters, giving effect to transactions such as acquisitions, dispositions and financings as if they had occurred at the beginning of the period. Under the terms of the credit facility, interest expense excludes items such as the gains and losses on the extinguishment of
62
debt, deferred financing charges related to the senior notes or the credit facility, amortization of debt premiums or discounts that were recorded at issuance of a loan in order to establish its fair value and non-cash interest expense due to the implementation in 2009 of accounting standards relating to our exchangeable debentures, all of which are included in interest expense on our consolidated statement of operations. Additionally, total debt used in the calculation of our leverage ratio is based on a "net debt" concept, pursuant to which cash and cash equivalents in excess of $100 million are deducted from our total debt balance.
We are in compliance with all of our financial covenants under the credit facility. The following table summarizes the financial tests contained in the credit facility as of December 31, 2014:
|
| Actual Ratio |
|
| Covenant Requirement for all years | |
Leverage ratio |
|
| 2.6 | x |
| Maximum ratio of 7.25x |
Fixed charge coverage ratio |
|
| 5.2 | x |
| Minimum ratio of 1.25x |
Unsecured interest coverage ratio (1) |
|
| 8.5 | x |
| Minimum ratio of 1.75x |
___________ |
|
|
|
|
|
|
(1) | If at any time our leverage ratio is above 7.0x, our minimum unsecured interest coverage ratio will be reduced to 1.5x. |
Interest and Fees. We pay interest on revolver borrowings under the credit facility at floating rates equal to LIBOR plus a margin. The margin ranges from 87.5 to 155 basis points (depending on Host L.P.'s unsecured long-term debt rating). We also pay a facility fee ranging from 12.5 to 30 basis points, depending on our rating and regardless of usage. Based on Host L.P.'s unsecured long-term debt rating as of December 31, 2014, we are able to borrow at a rate of LIBOR plus 100 basis points and pay a facility fee of 20 basis points. Interest on the term loan consists of floating rates equal to LIBOR plus a margin ranging from 90 to 175 basis points (depending on Host L.P.'s unsecured long-term debt rating). Based on Host L.P.'s long-term debt rating as of December 31, 2014, our applicable margin on the term loan is 112.5 basis points, for an all-in interest rate of 1.29%.
Other Covenants and Events of Default. The credit facility contains restrictive covenants on customary matters. Certain covenants are less restrictive at any time that our leverage ratio is below 6.0x, as currently is the case. In particular, at any time that our leverage ratio is below 6.0x, we will not be subject to limitations on capital expenditures, and the limitations on acquisitions, investments, dividends and distributions contained in the credit facility will be superseded by the generally less restrictive corresponding covenants in our senior notes indenture. Additionally, the credit facility's restrictions on incurrence of debt and the payment of dividends and distributions generally are consistent with our senior notes indenture. These provisions, under certain circumstances, limit debt incurrence to debt incurred under the credit facility or in connection with a refinancing, and limit dividend payments to those necessary to maintain Host Inc.'s tax status as a REIT.
The credit facility also includes usual and customary events of default for facilities of this nature, and provides that, upon the occurrence and continuance of an event of default, payment of all amounts due under the credit facility may be accelerated and the lenders' commitments may be terminated. In addition, upon the occurrence of certain insolvency or bankruptcy related events of default, all amounts due under the credit facility will automatically become due and payable and the lenders' commitments automatically will terminate.
Mortgage and Other Debt . As of December 31, 2014, we had mortgage debt secured by 10 hotels, which represent 4% of our total revenues in 2014. Substantially all of our mortgage debt is recourse solely to specific assets, except in instances of fraud, misapplication of funds and other customary recourse provisions. As of December 31, 2014, secured debt represented approximately 10% of our total debt and our aggregate secured debt had an average interest rate of 5.0% and an average maturity of 4.3 years.
63
The following table summarizes our outstanding debt and scheduled amortization and maturities related to mortgage and other debt as of December 31, 2014 (in millions):
|
| Balance as of |
|
|
|
|
|
|
|
|
|
|
|
|
|
|
|
|
|
|
|
|
|
|
|
|
| |
|
| December 31, |
|
|
|
|
|
|
|
|
|
|
|
|
|
|
|
|
|
|
|
|
|
|
|
|
| |
|
| 2014 |
|
| 2015 |
|
| 2016 |
|
| 2017 |
|
| 2018 |
|
| 2019 |
|
| Thereafter |
| |||||||
Mortgage Debt |
|
|
|
|
|
|
|
|
|
|
|
|
|
|
|
|
|
|
|
|
|
|
|
|
|
|
|
|
Harbor Beach Marriott Resort and Spa, 4.75%, due 1/1/2024 |
| $ | 150 |
|
| $ | - |
|
| $ | - |
|
| $ | - |
|
| $ | - |
|
| $ | - |
|
| $ | 150 |
|
New Zealand hotel portfolio, 6.60%, due 2/18/2016 (1) |
|
| 82 |
|
|
| - |
|
|
| 82 |
|
|
| - |
|
|
| - |
|
|
| - |
|
|
| - |
|
Hyatt Regency Reston, 3.26%, due 7/1/16 (2) |
|
| 100 |
|
|
| - |
|
|
| 100 |
|
|
| - |
|
|
| - |
|
|
| - |
|
|
| - |
|
Hilton Melbourne South Wharf, 6.20%, due 11/23/2016 (3) |
|
| 71 |
|
|
| - |
|
|
| 71 |
|
|
| - |
|
|
| - |
|
|
| - |
|
|
| - |
|
Capital leases |
|
| 1 |
|
|
| 1 |
|
|
| - |
|
|
| - |
|
|
| - |
|
|
| - |
|
|
| - |
|
Total mortgage debt |
| $ | 404 |
|
| $ | 1 |
|
| $ | 253 |
|
| $ | - |
|
| $ | - |
|
| $ | - |
|
| $ | 150 |
|
___________ |
|
|
|
|
|
|
|
|
|
|
|
|
|
|
|
|
|
|
|
|
|
|
|
|
|
|
|
|
(1) | The floating interest rate is equal to the 3-month New Zealand Bank Bill Rate plus 105 basis points plus an additional commitment fee of 105 basis points per annum. In addition, we entered into a swap agreement that fixes 75% of the loan at an all-in rate of 6.85%. The rate shown reflects the rate in effect at December 31, 2014. |
(2) | This floating rate mortgage is based on LIBOR plus 310 basis points. The rate shown reflects the rate in effect at December 31, 2014. |
(3) | The floating interest rate is equal to the 3-month BBSY plus 230 basis points. In addition, we entered into separate agreements that fix 75% of the loan at an all-in rate of 6.7% and cap the remaining 25% at an all-in interest rate of 9.9%. The rate shown reflects the rate in effect at December 31, 2014. |
Mortgage Debt of Consolidated and Unconsolidated Partner Interests. For the entities that we consolidate in our financial statements that have third party non-controlling partnership interests, the portion of mortgage debt included in the above table that is attributable to the non-controlling interests, based on their percentage of ownership of the ventures, is approximately $93 million. Additionally, we have non-controlling interests in partnerships and joint ventures that are not consolidated and are accounted for under the equity method. The portion of the mortgage and other debt of these partnerships and joint ventures attributable to us, based on our percentage of ownership thereof, was $502 million at December 31, 2014. This debt balance primarily is attributable to our approximate one-third ownership interest in the Euro JV. The mortgage debt related to the hotels owned by our Euro JV contains operating covenants that could result in the joint venture being required to escrow cash from operations or make principal repayments without penalty. The debt of our European and Asia/Pacific joint ventures is non-recourse to us and we have jointly and/or severally guaranteed construction loans incurred by our Maui timeshare and Hyatt Place Nashville joint ventures. See "-Off-Balance Sheet Arrangements and Contractual Obligations."
Distribution/Dividend . Host Inc.'s policy on common dividends generally is to distribute, over time, 100% of its taxable income, which primarily is dependent on our results of operations, as well as gains and losses on property sales. Host Inc. paid a regular quarterly cash dividend of $0.20 per share and a special cash dividend of $0.06 per share on its common stock on January 15, 2015. The $0.20 per share dividend represents Host Inc.'s intended regular quarterly dividend for the next several quarters, subject to Board approval. While Host Inc. intends to use available cash predominantly for acquisitions or other investments in its portfolio, to the extent that we do not identify appropriate investments, it may elect in the future to use available cash for other uses, such as common stock repurchases or increased dividends, which could be in excess of taxable income. Any special dividend would be subject to approval by Host Inc.'s Board of Directors.
Funds used by Host Inc. to pay dividends are provided through distributions from Host L.P. As of December 31, 2014, Host Inc. is the owner of approximately 99% of Host L.P.'s common OP units. The remaining common OP units are owned by various unaffiliated limited partners. Each OP unit may be offered for redemption by the holders for cash or, at the election of Host Inc., Host Inc. common stock based on the then current conversion ratio. The current conversion ratio is 1.021494 shares of Host Inc. common stock for each OP unit.
Investors should take into account the 1% non-controlling position of Host L.P. OP units when analyzing dividend payments by Host Inc. to its stockholders, as these holders of OP units share, on a pro rata basis, in amounts being distributed by Host L.P. to holders of its corresponding OP units. For example, if Host Inc. paid a $1 per share dividend on its common stock, it would be based on the payment of a $1.021494 per common unit distribution by Host L.P. to Host Inc., as well as to the other common OP unitholders.
64
Off-Balance Sheet Arrangements and Contractual Obligations
Off-Balance Sheet Arrangements. We are party to various transactions, agreements or other contractual arrangements with unconsolidated entities (which we refer to as "off-balance sheet arrangements"), pursuant to which we have certain contingent liabilities and/or guarantees. Contingencies included on our balance sheet are discussed in Part II Item 8. "Financial Statements and Supplementary Data – Note 16. "Guarantees and Contingencies." As of December 31, 2014, we are party to the following material off-balance sheet arrangements:
European Joint Venture . The Euro JV consists of two separate funds, with our partners being APG Strategic Real Estate Pool NV, an affiliate of a Dutch Pension Fund, and Jasmine Hotels Pte Ltd, an affiliate of the real estate investment company of the Government of Singapore Investment Corporation Pte Ltd ("GIC RE"). We serve as the general partner for the joint venture and have a combined general and limited partner interest of 32.1% of Euro JV Fund I and 33.4% of Euro JV Fund II. Due to the ownership structure and substantive participating rights of the non-Host limited partners, including approval over financing, acquisitions and dispositions, and annual operating and capital expenditures budgets, the Euro JV is not consolidated in our financial statements. As of December 31, 2014, the total assets of the Euro JV are approximately €1.9 billion ($2.3 billion).
Our investment and partners' funding as of December 31, 2014 is as follows:
|
| Host's Net Investment |
|
| Total Partner Funding |
| ||||||||||
|
| Euros (in millions) |
|
| US$ (in millions) |
|
| Euros (in millions) |
|
| % of Total Commitment |
| ||||
Euro JV Fund I |
| € | 165 |
|
| $ | 199 |
|
| € | 647 |
|
|
| 94 | % |
Euro JV Fund II |
|
| 123 |
|
|
| 149 |
|
|
| 364 |
|
|
| 81 | % |
|
| € | 288 |
|
| $ | 348 |
|
| € | 1,011 |
|
|
|
|
|
The partners expect to utilize the remaining commitment for Euro JV Fund I for capital expenditures and financing needs. In June 2014, the Euro JV partners executed an amendment and restatement of the Euro JV partnership agreement which allows contributions to the joint venture in the form of loans, as opposed to only equity contributions. Effective June 27, 2014, the Euro JV partners also amended the agreement to extend the commitment period for Euro JV Fund II by one year to June 27, 2015. The commitment period of Euro JV Fund I currently expires in December 2015. As asset manager of the Euro JV funds, we earn an asset management fee based on the amount of equity commitments and equity invested, which in 2014, 2013 and 2012 were approximately $16 million, $15 million and $13 million, respectively.
The following table sets forth operating statistics for the Euro JV comparable hotels as of December 31, 2014 and 2013:
|
| Comparable Euro JV Hotels in Constant Euros (1) |
| |||||||||
|
|
|
|
|
|
|
|
|
| Change |
| |
|
| 2014 |
|
| 2013 |
|
| 2013 to 2014 |
| |||
Average room rate |
| € | 182.05 |
|
| € | 179.92 |
|
|
| 1.2 | % |
Average occupancy |
|
| 77.5 | % |
|
| 76.5 | % |
|
| 100 | bps |
RevPAR |
| € | 141.13 |
|
| € | 137.68 |
|
|
| 2.5 | % |
___________ |
|
|
|
|
|
|
|
|
|
|
|
|
(1) | The presentation above includes the operating performance for the 17 properties consisting of 5,612 rooms in the joint venture with comparable results. The table excludes one hotel acquired in each of 2014 and 2013 as the Euro JV did not own each hotel for the entirety of the periods presented. See "-Comparable Hotel Operating Statistics." |
The operating statistics of the hotels are presented in constant Euros, the functional currency of the Euro JV, in order to present the results of the hotels without the effects of foreign currency exchange rates. The functional currency of the hotels owned in the United Kingdom and Poland are the British pound sterling and the Polish zloty, respectively. For the year ended December 31, 2014, RevPAR in constant Euros for the Euro JV increased by 2.5%, driven primarily by strength in transient business. Additionally, food and beverage revenues for the Euro JV comparable properties increased approximately 5.1% in 2014.
For 2014, 2013 and 2012 our portion of the earnings (losses) of the Euro JV were $21 million, $(12) million and $4 million, respectively, and are included in equity in earnings (losses) of affiliates on our statements of operations. The loss in 2013 includes our portion of a €33 million ($46 million) impairment expense related to the Sheraton Roma Hotel & Conference Center. The Euro JV analyzes its properties for impairment throughout the year when events or circumstances occur that indicate the carrying amount may not be recoverable. A property is considered to be impaired when the sum of the future undiscounted cash flows over its remaining estimated holding period is less than the carrying amount of the asset. If a property is impaired, an expense is recorded for the
65
difference between the fair value and the net carrying amount of the hotel. We also reviewed our investment in the Euro JV for other-than-temporary impairment and determined that no additional impairment expense was considered necessary in 2014 or 2013.
Cash flows from operating activities of the Euro JV were €69 million, €36 million and €35 million for 2014, 2013 and 2012, respectively. In April 2014, the Euro JV made a cash distribution to its partners totaling €37 million, of which Host's share was €12 million ($17 million). No similar distribution was made in 2013 or 2012. Subsequent to year end, in February 2015, the Euro JV distributed an additional €10 million to its partners, of which Host's share was €3 million ($4 million). Future cash flows from operations primarily are expected to continue to be used to invest in the portfolio through capital expenditures and to fund other investments, but also may result in distributions to partners. During 2014, 2013 and 2012, the Euro JV invested approximately €21 million, €32 million and €29 million, respectively, in capital expenditures projects. The Euro JV expects to spend between €20 million and €30 million on capital expenditures in 2015, none of which capital expenditures are expected to require additional partner contributions.
On September 30, 2014, the Euro JV Fund II acquired a 90% ownership interest in the 394-room Grand Hotel Esplanade in Berlin. The hotel was acquired based on an aggregate gross value of €81 million ($102 million), and is subject to approximately €48 million ($61 million) of debt with a margin of 219 basis points over Euribor, which debt is non-recourse to the partners of the Euro JV. We contributed approximately €10 million ($14 million) to the Euro JV in connection with this acquisition, partially funded through a draw on our credit facility. In January 2015, the hotel was repositioned as the Sheraton Berlin Grand Hotel Esplanade.
On October 16, 2014, the Euro JV Fund I sold the 350-room Sheraton Skyline Hotel & Conference Centre for £33 million ($53 million). The proceeds were used to repay the £21 million (€26.5 million) mortgage loan secured by the property, and €15.5 million of mortgage debt secured by other Euro JV properties that were cross collateralized with the Sheraton Skyline.
The Euro JV has €980 million ($1,186 million) of mortgage debt, all of which is non-recourse to us. A default of the Euro JV mortgage debt does not trigger a default under any of our debt. On July 3, 2014, the Euro JV refinanced the €69 million ($94 million) loan secured by three properties in Brussels with Natixis, reducing the outstanding principal amount of the mortgage loan to €47.8 million using funds provided by the partners. Interest on the new loan is a combination of fixed and floating for an initial all-in rate of 2.0% and has a maturity date of July 3, 2019.
The following presents our portion of the Euro JV debt maturities as of December 31, 2014:
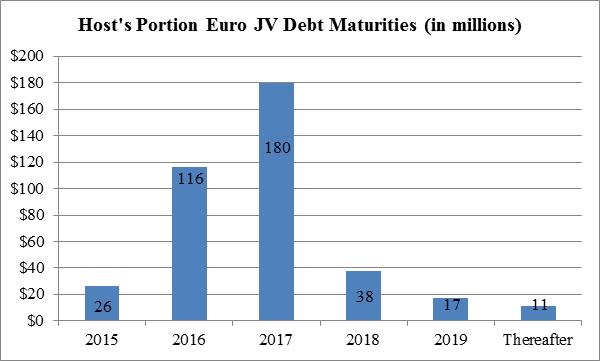
We have entered into four foreign currency forward sale contracts in order to hedge the foreign currency exposure resulting from the eventual repatriation of our net investment in the Euro JV. The forward purchases will occur between August 2015 and May 2017. We have hedged €177 million (approximately $228 million) of our investment through these contracts and designated draws under our credit facility in Euros. For additional detail on the foreign currency forward sale contracts and our exposure to changes in foreign currency exchange rates, see Part II Item 7A. "-Quantitative and Qualitative Disclosures about Market Risk."
Asia/Pacific Joint Venture. We have a 25% interest in the Asia/Pacific JV with RECO Hotels JV Private Limited, an affiliate of GIC RE. The agreement may be terminated by either partner at any time after March 2015, which would trigger the liquidation of the JV along with the assets within the JV. Due to the ownership structure and the substantive participating rights of the non-Host limited
66
partner, including approval over financing, acquisitions and dispositions, and annual operating and capital expenditures budgets, the Asia/Pacific JV is not consolidated in our financial statements. The commitment period for equity contributions to the Asia/Pacific JV expired in March 2012. We did not extend the commitment period beyond the expiration date; however, as we continue to invest in Asia, we may offer GIC RE opportunities to participate in certain acquisitions through the existing joint venture or through a new joint venture.
As of December 31, 2014, the Asia/Pacific JV owns one hotel in Australia and the partners have invested approximately $83 million (of which our share was $21 million) in a separate joint venture in India with Accor S.A. and InterGlobe Enterprises Limited, in which the Asia/Pacific JV holds a 36% interest. This joint venture is developing seven properties in India, totaling approximately 1,750 rooms, two of which opened in Bangalore in 2012, one of which opened in Chennai in 2014 and four of which are under various stages of development in Chennai and Delhi. The hotels currently are and will be managed by Accor under the Pullman, ibis and Novotel brands.
Maui Joint Venture. We have a 67% ownership in a joint venture with an affiliate of Hyatt Residential Group, a subsidiary of Interval Leisure Group, (the "Maui JV") to develop, sell and operate a 131-unit vacation ownership project in Maui, Hawaii adjacent to our Hyatt Regency Maui Resort & Spa. Our ownership is a non-controlling interest as a result of the significant economic rights held by the Interval member, which also is the managing member. The project opened in December 2014 with total development costs to date of $180 million. The total estimated development costs are $200 million, which is partially being funded with a $110 million construction loan, which is jointly and severally guaranteed by us and Hyatt Hotels Corporation, and with member contributions. As of December 31, 2014, $86 million was outstanding on the construction loan. Our total investment in the Maui JV is approximately $87 million, which as of December 31, 2014 includes contributions of land valued at $36 million, $8 million in pre-formation expenditures and additional capital contributions of $43 million. As of December 31, 2014, the Maui JV has recognized $54 million in sales of timeshare units for which we have recognized earnings of $7 million in 2014, including our share of the sales, net of costs, a portion of the deferred gain on the contribution of the land and our share of development fees. The book value of our investment in the Maui JV is $61 million.
Hyatt Place Joint Venture . On November 12, 2013, we opened the 255-room Hyatt Place Nashville Downtown in Tennessee, which was developed for $43 million through a joint venture, in which we are a 50% partner, with White Lodging Services. The joint venture has a $34.8 million construction loan for this project, and as of December 31, 2014, $31 million was outstanding on this facility. Along with White Lodging Services, we have jointly and severally guaranteed the payment of the loan. We invested approximately $6 million for our investment in the joint venture. Due to the significant control rights of our partner, we do not consolidate the joint venture in our financial statements.
For additional discussion on each of our joint venture investments see Part II Item 8. Financial Statements and Supplementary Data – Note 3. "Investments in Affiliates."
Contractual Obligations. The table below summarizes our obligations for principal and estimated interest payments on our debt, future minimum lease payments on our operating and capital leases, projected capital expenditures and other long-term liabilities, each as of December 31, 2014 (in millions):
|
| Payments due by period |
| |||||||||||||||||
|
|
|
|
|
| Less than |
|
|
|
|
|
|
|
|
|
| More than |
| ||
|
| Total |
|
| 1 year |
|
| 1 to 3 years |
|
| 3 to 5 years |
|
| 5 years |
| |||||
Long-term debt obligations (1) |
| $ | 5,006 |
|
| $ | 583 |
|
| $ | 1,054 |
|
| $ | 969 |
|
| $ | 2,400 |
|
Capital lease obligations |
|
| 1 |
|
|
| 1 |
|
|
| - |
|
|
| - |
|
|
| - |
|
Operating lease obligations |
|
| 1,788 |
|
|
| 46 |
|
|
| 88 |
|
|
| 82 |
|
|
| 1,572 |
|
Purchase obligations (2) |
|
| 522 |
|
|
| 419 |
|
|
| 103 |
|
|
| - |
|
|
| - |
|
Other long-term liabilities reflected on the balance sheet (3) |
|
| 19 |
|
|
| - |
|
|
| 10 |
|
|
| - |
|
|
| 9 |
|
Total |
| $ | 7,336 |
|
| $ | 1,049 |
|
| $ | 1,255 |
|
| $ | 1,051 |
|
| $ | 3,981 |
|
___________ |
|
|
|
|
|
|
|
|
|
|
|
|
|
|
|
|
|
|
|
|
(1) | The amounts shown include amortization of principal, debt maturities and estimated interest payments. Interest payments have been included in this category based on the weighted average interest rate. |
(2) | Our only purchase obligations consist of commitments for capital expenditures at our hotels. Under our contracts, we have the ability to defer some of these expenditures into later years. |
(3) | The amounts shown include deferred management fees and the estimated amount of tax expense. Under terms of our management agreements, we have deferred payment of management fees to our hotel managers for some of our properties that have not achieved the required income thresholds for payment of owner's priority to us. The timing of the payments, if any, is based on future operations, the termination of the management agreement or the sale of the hotel, and is, therefore, not determinable. The estimated amount of tax expense relates to uncertain tax liabilities. |
67
Tax Sharing Arrangements . Under tax sharing agreements with former affiliated companies (such as Marriott International, Inc., HMS Host and Barceló Crestline Corporation), we are obligated to pay certain taxes (federal, state, local and foreign, including any related interest and penalties) relating to periods in which the companies were affiliated with us. For example, a taxing authority could adjust an item deducted by a former affiliate during the period that this former affiliate was owned by us. This adjustment could produce a tax liability that we may be obligated to pay under the tax sharing agreement. Additionally, under the partnership agreement between Host Inc. and Host L.P., Host L.P. is obligated to pay certain taxes (federal, state, local and foreign, including any related interest and penalties) incurred by Host Inc., as well as any liabilities the IRS may successfully assert against Host Inc. We do not expect any amounts paid under these tax sharing arrangements to be material.
Tax Indemnification Agreements. As a result of certain federal and state income tax considerations of the former owners of two hotels currently owned by Host L.P., we have agreed to restrictions on selling such hotels, or repaying or refinancing the mortgage debt, for varying periods. One of these agreements expires in 2028 and the other in 2031.
Guarantees . We have entered into certain guarantees, which consist of commitments we have made to third parties for leases or debt, that are not recorded on our books due to various dispositions, spin-offs and contractual arrangements, but that we have agreed to pay in the event of certain circumstances, including default by an unrelated party. We consider the likelihood of any material payments under these guarantees to be remote. For a discussion of the largest guarantees (by dollar amount) see "Item 8. Financial Statements and Supplementary Data - Note 16. Guarantees and Contingencies."
Critical Accounting Policies
Our consolidated financial statements have been prepared in conformity with GAAP, which requires management to make estimates and assumptions that affect the reported amount of assets and liabilities at the date of our financial statements and the reported amounts of revenues and expenses during the reporting period. While we do not believe the reported amounts would be materially different, application of these policies involves the exercise of judgment and the use of assumptions as to future uncertainties and, as a result, actual results could differ from these estimates. We evaluate our estimates and judgments, including those related to the impairment of long-lived assets, on an ongoing basis. We base our estimates on experience and on various other assumptions that are believed to be reasonable under the circumstances. All of our significant accounting policies are disclosed in the notes to our consolidated financial statements. For a detailed discussion of the following critical accounting policies that require us to exercise our business judgment or make significant estimates see "Item 8. Financial Statements and Supplementary Data - Note 1. Summary of Significant Accounting Policies:"
· | Business Combinations; |
· | Property and Equipment – Impairment testing; |
· | Property and Equipment – Other-than-Temporary Impairment of an Investment; |
· | Property and Equipment – Classification of Assets as "Held for Sale"; |
· | Depreciation and Amortization Expense; |
· | Derivative Instruments; |
· | Basis of Presentation and Principles of Consolidation; |
· | Foreign Currency Translation; |
· | Income Taxes – Deferred Tax Assets and Liabilities. Additionally, see "Item 8. Financial Statements and Supplementary Data - Note 6. Income Taxes" for more information; and |
· | Share based payments. Additionally, see "Item 8. Financial Statements and Supplementary Data - Note 8. Employee Stock Plans" for more information. |
Application of New Accounting Standards
In April 2014, the Financial Accounting Standards Board issued Accounting Standards Update (ASU) 2014-08 Presentation of Financial Statements (Topic 205) and Property, Plant and Equipment (Topic 360) - Reporting Discontinued Operations and Disclosure of Disposal of Components of an Entity ("ASU 2014-08 Reporting for Discontinued Operations"). Under this standard, a disposal of a component of an entity or a group of components of an entity is required to be reported in discontinued operations only if the disposal represents a strategic shift that has, or will have, a major effect on an entity's operations and financial results. In addition, it requires an entity to present, for each comparative period, the assets and liabilities of a disposal group that includes a discontinued operation separately in the asset and liability sections, respectively, of the statement of financial position. As a result, the operations through the
68
date of the disposal and the gain or loss on the sale of properties will be included in continuing operations, unless the sale represents a strategic shift. We adopted this standard as of January 1, 2014. No prior year restatements are permitted for this change in policy.
In May 2014, the Financial Accounting Standards Board (FASB) issued Accounting Standards Update (ASU) No. 2014-09, Revenue from Contracts with Customers (Topic 606), which affects virtually all aspects of an entity's revenue recognition. The core principle of the new standard is that revenue should be recognized to depict the transfer of promised goods or services to customers in an amount that reflects the consideration to which the entity expects to be entitled in exchange for those goods or services. The standard is effective for annual reporting periods beginning after December 15, 2016. We have not yet completed our assessment of the effect of the new standard on our financial statements, including possible transition alternatives.
Our Customers
Our customers fall into three broad groups: transient business, group business and contract business. Similar to the majority of the lodging industry, we further categorize business within these broad groups based on characteristics they have in common as follows:
Transient business broadly represents individual business or leisure travelers. Business travelers make up the majority of transient demand at our hotels. Therefore, we will be significantly more affected by trends in business travel than trends in leisure demand. The four key subcategories of the transient business group are:
● | Retail : This is the benchmark rate that a hotel publishes and offers to the general public. It typically is the rate charged to travelers that do not have access to negotiated or discounted rates. It includes the "rack rate," which typically is applied to rooms during high demand periods and is the highest rate category available. Retail room rates will fluctuate more freely depending on anticipated demand levels (e.g. seasonality and weekday vs. weekend stays). |
● | Non-Qualified Discount : These include special rates offered by the hotels, including packages, advance-purchase discounts and promotional offers. These also include rooms booked through online travel agencies (OTAs). |
● | Special Corporate : This is a negotiated rate offered to companies and organizations that provide significant levels of room night demand to the hotel or to hotel brands generally. These rates typically are negotiated annually at a discount to the anticipated retail rate. In addition, this category includes rates offered at the prevailing per diem for approved government travel. |
● | Qualified Discount : This category encompasses all discount programs, such as AAA and AARP discounts, rooms booked through wholesale channels, frequent guest program redemptions, and promotional rates and packages offered by a hotel. |
Group business represents clusters of guestrooms booked together, usually with a minimum of 10 rooms. The three key sub-categories of the group business category are:
● | Association : group business related to national and regional association meetings and conventions. |
● | Corporate : group business related to corporate meetings (e.g., product launches, training programs, contract negotiations, and presentations). |
● | Other : group business predominately related to social, military, education, religious, fraternal and youth and amateur sports teams, otherwise known as SMERF business. |
Contract business refers to blocks of rooms sold to a specific company for an extended period of time at significantly discounted rates. Airline crews are typical generators of contract demand for our airport hotels. Additionally, contract rates may be utilized by hotels that are located in markets that are experiencing consistently lower levels of demand.
Comparable Hotel Operating Statistics
To facilitate a year-to-year comparison of our operations, we present certain operating statistics (i.e., RevPAR, average daily rate and average occupancy) and operating results (revenues, expenses, hotel EBITDA and associated margins) for the periods included in this report on a comparable hotel basis to enable our investors to better evaluate our operating performance.
69
Because these statistics and operating results relate only to our hotel properties, they exclude results for our non-hotel properties and other real estate investments. We define our comparable hotels as properties:
(i) | that are owned or leased by us and the operations of which are included in our consolidated results, whether as continuing operations or discontinued operations, for the entirety of the reporting periods being compared; and |
(ii) | that have not sustained substantial property damage or business interruption, or undergone large-scale capital projects (as further defined below) during the reporting periods being compared. |
The hotel business is capital-intensive and renovations are a regular part of the business. Generally, hotels under renovation remain comparable hotels. A large scale capital project that would cause a hotel to be excluded from our comparable hotel set is an extensive renovation of several core aspects of the hotel, such as rooms, meeting space, lobby, bars, restaurants and other public spaces. Both quantitative and qualitative factors are taken into consideration in determining if the renovation would cause a hotel to be removed from the comparable hotel set, including unusual or exceptional circumstances such as: a reduction or increase in room count, rebranding, a significant alteration of the business operations, or the closing of the hotel during the renovation.
We do not include an acquired hotel in our comparable hotel set until the operating results for that hotel have been included in our consolidated results for one full calendar year. For example, we acquired the Hyatt Place Waikiki Beach in May of 2013. The hotel will not be included in our comparable hotel set until January 1, 2015. Hotels that we sell are excluded from the comparable hotel set once the transaction has closed. Similarly, hotels are excluded from our comparable hotel set from the date that they sustain substantial property damage or business interruption or commence a large-scale capital project. In each case, these hotels are returned to the comparable hotel set when the operations of the hotel have been included in our consolidated results for one full calendar year after completion of the repair of the property damage or cessation of the business interruption, or the completion of large-scale capital projects, as applicable.
Of the 114 hotels that we owned on December 31, 2014, 106 have been classified as comparable hotels. The operating results of the following hotels that we owned or leased as of December 31, 2014 are excluded from comparable hotel results for these periods:
● | Novotel Rio de Janeiro Parque Olimpico and ibis Rio de Janeiro Parque Olimpico (opened in the fourth quarter of 2014); |
● | YVE Hotel Miami (acquired as the b2 miami downtown hotel in August 2014); |
● | Axiom Hotel (acquired as the Powell Hotel in January 2014); |
● | The Ritz-Carlton, Naples, removed in the third quarter of 2013 (business interruption due to the closure of the hotel during extensive renovations that were substantially completed in October 2013, including renovations of 450 rooms, including 35 suites, restaurant, façade and windows); |
● | Hyatt Place Waikiki Beach (acquired in May 2013); |
● | Novotel Christchurch Cathedral Square (business interruption due to the closure of the hotel following an earthquake in February 2011 and the subsequent extensive renovations, which hotel reopened in August 2013); and |
● | Orlando World Center Marriott, removed in the third quarter of 2012 (business interruption due to extensive renovations that were substantially completed in July 2013, including façade restoration, the shutdown of the main pool and a complete restoration and enhancement of the hotel, including new water slides and activity areas, new pool dining facilities and the renovation of one tower of guestrooms, meeting space and restaurants). |
The operating results of ten hotels disposed of in 2014 and 2013 are not included in comparable hotel results for the periods presented herein.
As of December 31, 2013, 105 of our 115 hotels were classified as comparable. The operating results of the following hotels that we owned or leased as of December 31, 2013 are excluded from comparable hotel results for these periods:
● | The Ritz-Carlton, Naples; |
● | Hyatt Place Waikiki Beach; |
● | Grand Hyatt Washington (acquired in July 2012); |
● | The Westin New York Grand Central (business interruption due to re-branding of the hotel and extensive renovations that were substantially completed by December 2012, including the renovation of 774 guest rooms, lobby, public and meeting spaces, fitness center, restaurant and bar); |
● | Two hotels in Christchurch, New Zealand (business interruption due to the closure of the hotels following an earthquake in February 2011 and the subsequent extensive renovations, which hotels reopened August 2013 and September 2012); |
70
● | Orlando World Center Marriott; |
● | Atlanta Marriott Perimeter Center, removed in the third quarter of 2011 (business interruption due to extensive renovations that were completed in April 2012, including renovation of the guest rooms, lobby, bar and restaurant and the demolition of one tower of the hotel); |
● | Chicago Marriott O'Hare, removed in the third quarter of 2011 (business interruption due to extensive renovations that were completed in April 2012, including renovating every aspect of the hotel and shutting down over 200 rooms); and |
● | Sheraton Indianapolis Hotel at Keystone Crossing, removed in the first quarter of 2011 (business interruption due to extensive renovations that were completed in January 2013, including the conversion of one tower of the hotel into apartments, reducing the room count, and the renovation of the remaining guest rooms, lobby, bar and meeting space). |
We evaluate the operating performance of our comparable hotels based on both market and property type. These divisions are generally consistent with groupings recognized in the lodging industry.
Our markets consist of the following:
Domestic
● | Boston –Greater Boston Metropolitan area; |
● | New York – Greater New York Metropolitan area, including northern New Jersey; |
● | Philadelphia – Philadelphia Metropolitan area; |
● | Washington D.C. – Metropolitan area, including the Maryland and Virginia suburbs; |
● | Atlanta – Atlanta Metropolitan area; |
● | Florida – All Florida locations; |
● | Chicago – Chicago Metropolitan area; |
● | Denver – Denver Metropolitan area; |
● | Houston – Houston Metropolitan area; |
● | Phoenix – Phoenix Metropolitan area, including Scottsdale; |
● | Seattle – Seattle Metropolitan area; |
● | San Francisco – Greater San Francisco Metropolitan area, including San Jose; |
● | Los Angeles – Greater Los Angeles area, including Orange County; |
● | San Diego –San Diego Metropolitan area; |
● | Hawaii – All Hawaii locations; and |
● | Other – Select cities in California, Indiana, Louisiana, Minnesota, Missouri, Ohio, Tennessee, and Texas; |
International
● | Asia-Pacific –Australia and New Zealand; |
● | Canada – Toronto and Calgary; and |
● | Latin America –Brazil, Chile and Mexico. |
Our property types consist of the following:
● | Urban-Hotels located in primary business districts of major cities; |
● | Suburban-Hotels located in office parks or smaller secondary markets; |
● | Resort/conference-Hotels located in resort/conference destinations such as Arizona, Florida, Hawaii and Southern California; and |
● | Airport-Hotels located at or near airports. |
71
Constant US$, Nominal US$, and Constant Euros
Operating results denominated in foreign currencies are translated using the prevailing exchange rates on the date of the transaction, or monthly based on the weighted average exchange rate for the period. For comparative purposes, we also present the RevPAR results for 2013 assuming the results of our foreign operations were translated using the same exchange rates that were effective for the comparable periods in 2014, thereby eliminating the effect of currency fluctuation for the year-over-year comparisons. We believe this presentation is useful to investors as it provides clarity with respect to the growth in RevPAR in the local currency of the hotel consistent with the manner in which we would evaluate our domestic portfolio. However, the effect of changes in foreign currency has been reflected in the actual results of net income, EBITDA, earnings per diluted share and Adjusted FFO per diluted share. Nominal US$ results include the effect of currency fluctuations consistent with our financial statement presentation.
We also present RevPAR results for our joint venture in Europe in constant Euros using the same methodology as used for the constant US$ presentation.
Non-GAAP Financial Measures
We use certain "non-GAAP financial measures," which are measures of our historical financial performance that are not calculated and presented in accordance with GAAP, within the meaning of applicable SEC rules. These measures are as follows: (i) EBITDA and Adjusted EBITDA, as a measure of performance for Host Inc. and Host L.P., (ii) Funds From Operations ("FFO") and FFO per diluted share (both NAREIT and Adjusted), as a measure of performance for Host Inc., and (iii) comparable hotel property level operating results, as a measure of performance for Host Inc. and Host L.P.
We calculate NAREIT FFO per diluted share in accordance with standards established by NAREIT, which may not be comparable to measures calculated by other companies that do not use the NAREIT definition of FFO or do not calculate FFO per diluted share in accordance with NAREIT guidance. In addition, although FFO per diluted share is a useful measure when comparing our results to other REITs, it may not be helpful to investors when comparing us to non-REITs. We also calculate Adjusted FFO per diluted share, which measure is not in accordance with NAREIT guidance and may not be comparable to measures calculated by other REITs. EBITDA and Adjusted EBITDA, as presented, also may not be comparable to measures calculated by other companies. This information should not be considered as an alternative to net income, operating profit, cash from operations or any other operating performance measure calculated in accordance with GAAP. Cash expenditures for various long-term assets (such as renewal and replacement capital expenditures), interest expense (for EBITDA and Adjusted EBITDA purposes only) and other items have been and will be made and are not reflected in the EBITDA, Adjusted EBITDA, NAREIT FFO per diluted share and Adjusted FFO per diluted share presentations. Management compensates for these limitations by separately considering the impact of these excluded items to the extent they are material to operating decisions or assessments of our operating performance. Our consolidated statement of operations and cash flows include interest expense, capital expenditures, and other excluded items, all of which should be considered when evaluating our performance, as well as the usefulness of our non-GAAP financial measures. Additionally, NAREIT FFO per diluted share, Adjusted FFO per diluted share, EBITDA and Adjusted EBITDA should not be considered as a measure of our liquidity or indicative of funds available to fund our cash needs, including our ability to make cash distributions. In addition, NAREIT FFO per diluted share and Adjusted FFO per diluted share do not measure, and should not be used as a measure of, amounts that accrue directly to stockholders' benefit. The following discussion defines these terms and presents why we believe they are useful measures of our performance.
EBITDA and Adjusted EBITDA
EBITDA
Earnings before Interest Expense, Income Taxes, Depreciation and Amortization ("EBITDA") is a commonly used measure of performance in many industries. Management believes EBITDA provides useful information to investors regarding our results of operations because it helps us and our investors evaluate the ongoing operating performance of our properties after removing the impact of our capital structure (primarily interest expense) and our asset base (primarily depreciation and amortization). Management also believes the use of EBITDA facilitates comparisons between us and other lodging REITs, hotel owners that are not REITs and other capital-intensive companies. Management uses EBITDA to evaluate property-level results and as one measure in determining the value of acquisitions and dispositions and, like FFO and Adjusted FFO per diluted share, it is widely used by management in the annual budget process and for compensation programs.
72
Adjusted EBITDA
Historically, management has adjusted EBITDA when evaluating our performance because we believe that the exclusion of certain additional items described below provides useful supplemental information to investors regarding our ongoing operating performance and that the presentation of Adjusted EBITDA, when combined with the primary GAAP presentation of net income, is beneficial to an investor's complete understanding of our operating performance. Adjusted EBITDA also is a relevant measure in calculating certain credit ratios. We adjust EBITDA for the following items, which may occur in any period, and refer to this measure as Adjusted EBITDA:
● | Real Estate Transactions – We exclude the effect of gains and losses, including the amortization of deferred gains, recorded on the disposition or acquisition of depreciable assets and property insurance gains in our consolidated statement of operations because we believe that including them in Adjusted EBITDA is not consistent with reflecting the ongoing performance of our assets. In addition, material gains or losses from the depreciated book value of the disposed assets could be less important to investors given that the depreciated asset book value often does not reflect its market value (as noted below for FFO). |
● | Equity Investment Adjustments – We exclude the equity in earnings (losses) of unconsolidated investments in partnerships and joint ventures as presented in our consolidated statement of operations because it includes our pro rata portion of depreciation, amortization and interest expense, which are excluded from EBITDA. We include our pro rata share of the Adjusted EBITDA of our equity investments as we believe this more accurately reflects the performance of our investments. The pro rata Adjusted EBITDA of equity investments is defined as the EBITDA of our equity investments adjusted for any gains or losses on property transactions multiplied by our percentage ownership in the partnership or joint venture. |
● | Consolidated Partnership Adjustments – We deduct the non-controlling partners' pro rata share of the Adjusted EBITDA of our consolidated partnerships as this reflects the non-controlling owners' interest in the EBITDA of our consolidated partnerships. The pro rata Adjusted EBITDA of non-controlling partners is defined as the EBITDA of our consolidated partnerships adjusted for any gains or losses on property transactions multiplied by the non-controlling partners' positions in the partnership or joint venture. |
● | Cumulative Effect of a Change in Accounting Principle – Infrequently, the Financial Accounting Standards Board ("FASB") promulgates new accounting standards that require the consolidated statement of operations to reflect the cumulative effect of a change in accounting principle. We exclude these one-time adjustments because they do not reflect our actual performance for that period. |
● | Impairment Losses – We exclude the effect of impairment expense recorded because we believe that including them in Adjusted EBITDA is not consistent with reflecting the ongoing performance of our remaining assets. In addition, we believe that impairment expense, which is based on historical cost book values, is similar to gains (losses) on dispositions and depreciation expense, both of which also are excluded from EBITDA. |
● | Acquisition Costs – Under GAAP, costs associated with completed property acquisitions are expensed in the year incurred. We exclude the effect of these costs because we believe they are not reflective of the ongoing performance of the company. |
● | Litigation Gains and Losses – Effective April 1, 2013, we have excluded the effect of gains or losses associated with litigation recorded under GAAP that we consider outside the ordinary course of business, which is consistent with the definition of Adjusted FFO that we adopted effective January 1, 2011. We believe that including these items is not consistent with our ongoing operating performance. |
In unusual circumstances, we also may adjust EBITDA for gains or losses that management believes are not representative of our current operating performance. For example, in the first quarter of 2013, management excluded the $11 million gain from the eminent domain claim for land adjacent to the Atlanta Marriott Perimeter Center for which we received the cash proceeds in 2007, but, pending the resolution of certain contingencies, was not recognized until 2013. Typically, gains from the disposition of non-depreciable property are included in the determination of Adjusted EBITDA.
73
The following table provides a reconciliation of net income to Adjusted EBITDA (in millions):
Reconciliation of Net Income to EBITDA and Adjusted EBITDA for Host Inc. and Host L.P.
|
| Year ended December 31, |
| |||||
|
| 2014 |
|
| 2013 |
| ||
Net income (2) |
| $ | 747 |
|
| $ | 325 |
|
Interest expense |
|
| 214 |
|
|
| 304 |
|
Depreciation and amortization |
|
| 695 |
|
|
| 696 |
|
Income taxes |
|
| 14 |
|
|
| 21 |
|
Discontinued operations (1) |
|
| - |
|
|
| 15 |
|
EBITDA (2) |
|
| 1,670 |
|
|
| 1,361 |
|
Gain on dispositions (3) |
|
| (233 | ) |
|
| (98 | ) |
Gain on property insurance settlement |
|
| (1 | ) |
|
| - |
|
Acquisition costs |
|
| 2 |
|
|
| 1 |
|
Recognition of deferred gain on land condemnation (4) |
|
| - |
|
|
| (11 | ) |
Litigation (gain) loss (5) |
|
| (61 | ) |
|
| 8 |
|
Non-cash impairment loss |
|
| 6 |
|
|
| 1 |
|
Equity investment adjustments: |
|
|
|
|
|
|
|
|
Equity in (earnings) losses of affiliates (6) |
|
| (26 | ) |
|
| 17 |
|
Pro rata Adjusted EBITDA of equity investments |
|
| 68 |
|
|
| 48 |
|
Consolidated partnership adjustments: |
|
|
|
|
|
|
|
|
Pro rata Adjusted EBITDA attributable to non-controlling partners in other consolidated partnerships |
|
| (23 | ) |
|
| (21 | ) |
Adjusted EBITDA (2) |
| $ | 1,402 |
|
| $ | 1,306 |
|
___________ |
|
|
|
|
|
|
|
|
(1) | Reflects the interest expense, depreciation and amortization and income taxes included in discontinued operations. |
(2) | Net Income, EBITDA, Adjusted EBITDA, NAREIT FFO and Adjusted FFO include a gain of $3 million for the year ended December 31, 2014 for the sale of the portion of land attributable to individual units sold by the Maui timeshare joint venture. These metrics also include a gain of $21 million for the year ended December 31, 2013 for the sale of excess land adjacent to our Newport Beach Marriott Hotel & Spa. |
(3) | Reflects the sale of an 89% controlling interest in one hotel in 2014, the sale of four hotels in 2014 and the sale of five hotels in 2013. |
(4) | During the first quarter of 2013, we recognized a previously deferred gain of approximately $11 million related to the eminent domain claim by the State of Georgia for 2.9 acres of land at the Atlanta Marriott Perimeter Center for highway expansion for which we received cash proceeds in 2007. We have included the gain in NAREIT FFO per diluted share, which is consistent with the treatment of gains recognized on the disposition of non-depreciated assets. However, due to the significant passage of time since we received the proceeds, we have excluded the gain from Adjusted FFO per diluted share and Adjusted EBITDA for 2013. |
(5) | We exclude the net effect of litigation recoveries/gains or losses that we consider outside of the ordinary course of business from our determination of Adjusted EBITDA and Adjusted FFO. For 2014 and 2013, the amounts primarily reflect activity for the litigation concerning the ground lease for the San Antonio Marriott Rivercenter started in 2005. Over time, we had accrued litigation losses totaling $69 million (including $8 million accrued in 2013) for this litigation. On October 3, 2014, the final motion for rehearing by Keystone-Texas Property Holding Corporation to the Texas Supreme Court was denied. As a result, in the third quarter of 2014, we reversed the $69 million loss contingency, which is included as a reduction to corporate expense in net income. Consistent with our definition of Adjusted EBITDA and Adjusted FFO, we have excluded $59 million of the gain, as the related accrual for this amount was similarly excluded in prior years. We are including $10 million of the gain in Adjusted EBITDA and Adjusted FFO, which represents periodic interest accrued on the judgments since 2010, as this amount was included as a reduction in Adjusted EBITDA and Adjusted FFO in prior years. See Part I, Item 3, Legal Proceedings for more information on the resolution of this case. |
(6) | An adjustment of $15 million is included for the year ended December 31, 2013 for our portion of the non-cash impairment charges related to one of the hotels in our joint venture in Europe. The impairment charge has no effect on Adjusted EBITDA, NAREIT FFO or Adjusted FFO. |
NAREIT FFO, NAREIT FFO per Diluted Share and Adjusted FFO per Diluted Share. We present NAREIT FFO and NAREIT FFO per diluted share as non-GAAP measures of our performance in addition to our earnings per share (calculated in accordance with GAAP). We calculate NAREIT FFO per diluted share as our NAREIT FFO (defined as set forth below) for a given operating period, as adjusted for the effect of dilutive securities, divided by the number of fully diluted shares outstanding during such period in accordance with NAREIT guidelines. NAREIT defines FFO as net income (calculated in accordance with GAAP), excluding gains (losses) from sales of real estate, the cumulative effect of changes in accounting principles, real estate-related depreciation, amortization and impairments and adjustments for unconsolidated partnerships and joint ventures. Adjustments for unconsolidated partnerships and joint ventures are calculated to reflect our pro rata share of the FFO of those entities on the same basis.
We believe that NAREIT FFO per diluted share is a useful supplemental measure of our operating performance and that the presentation of NAREIT FFO per diluted share, when combined with the primary GAAP presentation of earnings per share, provides beneficial information to investors. By excluding the effect of real estate depreciation, amortization, impairments and gains and losses from sales of real estate, all of which are based on historical cost accounting and which may be of lesser significance in evaluating current performance, we believe such measures can facilitate comparisons of operating performance between periods and with other
74
REITs, even though NAREIT FFO per diluted share does not represent an amount that accrues directly to holders of our common stock. Historical cost accounting for real estate assets implicitly assumes that the value of real estate assets diminishes predictably over time. As noted by NAREIT in its April 2002 "White Paper on Funds From Operations," since real estate values historically have risen or fallen with market conditions, many industry investors have considered presentation of operating results for real estate companies that use historical cost accounting to be insufficient by themselves. For these reasons, NAREIT adopted the FFO metric in order to promote an industry-wide measure of REIT operating performance.
We also present Adjusted FFO per diluted share when evaluating our performance because management believes that the exclusion of certain additional items described below provides useful supplemental information to investors regarding our ongoing operating performance. Management historically has made the adjustments detailed below in evaluating our performance, in our annual budget process and for our compensation programs. We believe that the presentation of Adjusted FFO per diluted share, when combined with both the primary GAAP presentation of earnings per share and FFO per diluted share as defined by NAREIT, provides useful supplemental information that is beneficial to an investor's complete understanding of our operating performance. We adjust NAREIT FFO per diluted share for the following items, which may occur in any period, and refer to this measure as Adjusted FFO per diluted share:
● | Gains and Losses on the Extinguishment of Debt – We exclude the effect of finance charges and premiums associated with the extinguishment of debt, including the acceleration of the write off of deferred financing costs from the original issuance of the debt being redeemed or retired and incremental interest expense incurred during the refinancing period. We also exclude the gains on debt repurchases and the original issuance costs associated with the retirement of preferred stock. We believe that these items are not reflective of our ongoing finance costs. |
● | Acquisition Costs –Under GAAP, costs associated with completed property acquisitions are expensed in the year incurred. We exclude the effect of these costs because we believe they are not reflective of the ongoing performance of the company. |
● | Litigation Gains and Losses – We exclude the effect of gains or losses associated with litigation recorded under GAAP that we consider outside the ordinary course of business. We believe that including these items is not consistent with our ongoing operating performance. |
In unusual circumstances, we also may adjust NAREIT FFO for gains or losses that management believes are not representative of our current operating performance. For example, in the first quarter of 2013, management excluded the $11 million gain from the eminent domain claim for land adjacent to the Atlanta Marriott Perimeter Center for which we received the cash proceeds in 2007, but, pending the resolution of certain contingencies, was not recognized until 2013. Typically, gains from the disposition of non-depreciable property are included in the determination of NAREIT and Adjusted FFO.
75
The following table provides a reconciliation of net income to NAREIT FFO and Adjusted FFO (separately and on a per diluted share basis) for Host Inc. (in millions, except per share amounts):
Host Inc. Reconciliation of Net Income
to NAREIT and Adjusted Funds From Operations per Diluted Share
|
| Year ended December 31, |
| |||||
|
| 2014 |
|
| 2013 |
| ||
Net income (2) |
| $ | 747 |
|
| $ | 325 |
|
Less: Net income attributable to non-controlling interests |
|
| (15 | ) |
|
| (8 | ) |
Net income attributable to Host Inc. |
|
| 732 |
|
|
| 317 |
|
Adjustments: |
|
|
|
|
|
|
|
|
Gain on dispositions, net of taxes (3) |
|
| (232 | ) |
|
| (97 | ) |
Gain on property insurance settlement |
|
| (1 | ) |
|
| - |
|
Depreciation and amortization |
|
| 692 |
|
|
| 703 |
|
Non-cash impairment loss |
|
| 6 |
|
|
| 1 |
|
Equity investment adjustments: |
|
|
|
|
|
|
|
|
Equity in (earnings) losses of affiliates (6) |
|
| (26 | ) |
|
| 17 |
|
Pro rata FFO of equity investments |
|
| 51 |
|
|
| 26 |
|
Consolidated partnership adjustments: |
|
|
|
|
|
|
|
|
FFO adjustment for non-controlling partnerships |
|
| (9 | ) |
|
| (8 | ) |
FFO adjustments for non-controlling interests of Host L.P. |
|
| (6 | ) |
|
| (8 | ) |
NAREIT FFO (2) |
|
| 1,207 |
|
|
| 951 |
|
Adjustments to NAREIT FFO: |
|
|
|
|
|
|
|
|
Loss on debt extinguishment |
|
| 4 |
|
|
| 40 |
|
Acquisition costs |
|
| 3 |
|
|
| 1 |
|
Recognition of deferred gain on land condemnation (4) |
|
| - |
|
|
| (11 | ) |
Litigation (gain) loss (5) |
|
| (61 | ) |
|
| 8 |
|
Adjusted FFO (2) |
| $ | 1,153 |
|
| $ | 989 |
|
|
|
|
|
|
|
|
|
|
For calculation on a per share basis: |
|
|
|
|
|
|
|
|
|
|
|
|
|
|
|
|
|
Adjustments for dilutive securities (1) : |
|
|
|
|
|
|
|
|
Assuming conversion of Exchangeable Senior Debentures |
| $ | 27 |
|
| $ | 26 |
|
Diluted NAREIT FFO |
| $ | 1,234 |
|
| $ | 977 |
|
Diluted Adjusted FFO |
| $ | 1,180 |
|
| $ | 1,015 |
|
|
|
|
|
|
|
|
|
|
Diluted weighted average shares outstanding-EPS |
|
| 786.8 |
|
|
| 747.9 |
|
Assuming conversion of Exchangeable Senior Debentures |
|
| - |
|
|
| 29.5 |
|
Diluted weighted average shares outstanding - NAREIT FFO and Adjusted FFO |
|
| 786.8 |
|
|
| 777.4 |
|
NAREIT FFO per diluted share |
| $ | 1.57 |
|
| $ | 1.26 |
|
Adjusted FFO per diluted share |
| $ | 1.50 |
|
| $ | 1.31 |
|
___________ |
|
|
|
|
|
|
|
|
(1) | Earnings per diluted share and NAREIT FFO and Adjusted FFO per diluted share are adjusted for the effects of dilutive securities. Dilutive securities may include shares granted under comprehensive stock plans, preferred OP units held by non-controlling partners, exchangeable debt securities and other non-controlling interests that have the option to convert their limited partnership interests to common OP units. No effect is shown for securities if they are anti-dilutive. |
(2-6) | Refer to the corresponding footnote on the Reconciliation of Net Income to EBITDA and Adjusted EBITDA for Host Inc. and Host L.P. |
76
Comparable Hotel Property Level Operating Results. We present certain operating results for our hotels, such as hotel revenues, expenses, EBITDA and EBITDA margin, on a comparable hotel, or "same store," basis as supplemental information for investors. Our comparable hotel results present operating results for hotels owned during the entirety of the periods being compared without giving effect to any acquisitions or dispositions, significant property damage or large scale capital improvements during these periods. We present comparable hotel EBITDA to help us and our investors evaluate the ongoing operating performance of our comparable properties after removing the impact of our capital structure (primarily interest expense), and its asset base (primarily depreciation and amortization). Other corporate-level costs and expenses are also removed to arrive at property-level results. We believe these property-level results provide investors with supplemental information into the ongoing operating performance of our comparable hotels. We eliminate depreciation and amortization because, even though depreciation and amortization are property-level expenses, these non-cash expenses, which are based on historical cost accounting for real estate assets, implicitly assume that the value of real estate assets diminishes predictably over time. As noted earlier, because real estate values historically have risen or fallen with market conditions, many industry investors have considered presentation of operating results for real estate companies that use historical cost accounting to be insufficient by themselves.
As a result of the elimination of corporate-level costs and expenses and depreciation and amortization, the comparable hotel operating results we present do not represent our total revenues, expenses or operating profit and these comparable hotel operating results should not be used to evaluate our performance as a whole. Management compensates for these limitations by separately considering the impact of these excluded items to the extent they are material to operating decisions or assessments of our operating performance. Our consolidated statements of operations include such amounts, all of which should be considered by investors when evaluating our performance.
We present these hotel operating results on a comparable hotel basis because we believe that doing so provides investors and management with useful information for evaluating the period-to-period performance of our hotels and facilitates comparisons with other hotel REITs and hotel owners. In particular, these measures assist management and investors in distinguishing whether increases or decreases in revenues and/or expenses are due to growth or decline of operations at comparable hotels (which represent the vast majority of our portfolio) or from other factors, such as the effect of acquisitions or dispositions. While management believes that presentation of comparable hotel results is a "same store" supplemental measure that provides useful information in evaluating our ongoing performance, this measure is not used to allocate resources or to assess the operating performance of these hotels, as these decisions are based on data for individual hotels and are not based on comparable portfolio hotel results. For these reasons, we believe that comparable hotel operating results, when combined with the presentation of GAAP operating profit, revenues and expenses, provide useful information to investors and management.
77
The following table presents certain operating results and statistics for our comparable hotels for the periods presented herein:
Comparable Hotel Results for Host Inc. and Host L.P.
(in millions, except hotel statistics)
|
| Year ended December 31, |
| |||||
|
| 2014 |
|
| 2013 |
| ||
Number of hotels |
|
| 106 |
|
|
| 106 |
|
Number of rooms |
|
| 55,252 |
|
|
| 55,252 |
|
Percent change in comparable hotel RevPAR - Constant US$ |
|
| 5.7 | % |
| - |
| |
Percent change in comparable hotel RevPAR - Nominal US$ |
|
| 5.3 | % |
|
| - |
|
Operating profit margin ( 1 ) |
|
| 13.3 | % |
|
| 9.9 | % |
Comparable hotel EBITDA margin ( 1 ) |
|
| 26.5 | % |
|
| 25.3 | % |
Comparable hotel revenues |
|
|
|
|
|
|
|
|
Room |
| $ | 3,270 |
|
| $ | 3,104 |
|
Food and beverage ( 2 ) |
|
| 1,418 |
|
|
| 1,367 |
|
Other |
|
| 285 |
|
|
| 269 |
|
Comparable hotel revenues ( 3 ) |
|
| 4,973 |
|
|
| 4,740 |
|
Comparable hotel expenses |
|
|
|
|
|
|
|
|
Room |
| $ | 874 |
|
| $ | 834 |
|
Food and beverage ( 4 ) |
|
| 1,025 |
|
|
| 999 |
|
Other |
|
| 139 |
|
|
| 138 |
|
Management fees, ground rent and other costs |
|
| 1,617 |
|
|
| 1,569 |
|
Comparable hotel expenses ( 5 ) |
|
| 3,655 |
|
|
| 3,540 |
|
Comparable hotel EBITDA |
|
| 1,318 |
|
|
| 1,200 |
|
Non-comparable hotel results, net ( 6 ) |
|
| 136 |
|
|
| 130 |
|
Depreciation and amortization |
|
| (701 | ) |
|
| (697 | ) |
Interest expense |
|
| (214 | ) |
|
| (304 | ) |
Provision for income taxes |
|
| (14 | ) |
|
| (21 | ) |
Gain on sale of property and corporate level income/expense |
|
| 222 |
|
|
| 17 |
|
Net income |
| $ | 747 |
|
| $ | 325 |
|
___________ |
|
|
|
|
|
|
|
|
(1) | Operating profit margins are calculated by dividing the applicable operating profit by the related revenue amount. GAAP operating profit margins are calculated using amounts presented in the consolidated statements of operations. Comparable hotel EBITDA margins are calculated using amounts presented in the above table. |
( 2 ) | The reconciliation of total food and beverage sales per the consolidated statements of operations to the comparable food and beverage sales is as follows: |
|
| Year ended December 31, |
| |||||
|
| 2014 |
|
| 2013 |
| ||
Food and beverage sales per the consolidated statements of operations |
| $ | 1,546 |
|
| $ | 1,503 |
|
Non-comparable hotel food and beverage sales |
|
| (164 | ) |
|
| (169 | ) |
Food and beverage sales for the property for which we record rental income |
|
| 36 |
|
|
| 33 |
|
Comparable food and beverage sales |
| $ | 1,418 |
|
| $ | 1,367 |
|
( 3 ) | The reconciliation of total revenues per the consolidated statements of operations to the comparable hotel revenues is as follows: |
|
| Year ended December 31, |
| |||||
|
| 2014 |
|
| 2013 |
| ||
Revenues per the consolidated statements of operations |
| $ | 5,354 |
|
| $ | 5,166 |
|
Non-comparable hotel revenues |
|
| (437 | ) |
|
| (478 | ) |
Hotel revenues for the property for which we record rental income, net |
|
| 56 |
|
|
| 52 |
|
Comparable hotel revenues |
| $ | 4,973 |
|
| $ | 4,740 |
|
78
( 4 ) | The reconciliation of total food and beverage expenses per the consolidated statements of operations to the comparable food and beverage expenses is as follows: |
|
| Year ended December 31, |
| |||||
|
| 2014 |
|
| 2013 |
| ||
Food and beverage expenses per the consolidated statements of operations |
| $ | 1,109 |
|
| $ | 1,095 |
|
Non-comparable hotel food and beverage expenses |
|
| (106 | ) |
|
| (117 | ) |
Food and beverage expenses for the property for which we record rental income |
|
| 22 |
|
|
| 21 |
|
Comparable food and beverage expenses |
| $ | 1,025 |
|
| $ | 999 |
|
( 5 ) | The reconciliation of operating costs and expenses per the consolidated statements of operations to the comparable hotel expenses is as follows: |
|
| Year ended December 31, |
| |||||
|
| 2014 |
|
| 2013 |
| ||
Operating costs and expenses per the consolidated statements of operations |
| $ | 4,644 |
|
| $ | 4,654 |
|
Non-comparable hotel expenses |
|
| (301 | ) |
|
| (348 | ) |
Hotel expenses for the property for which we record rental income |
|
| 56 |
|
|
| 52 |
|
Depreciation and amortization |
|
| (701 | ) |
|
| (697 | ) |
Corporate and other expenses |
|
| (43 | ) |
|
| (121 | ) |
Comparable hotel expenses |
| $ | 3,655 |
|
| $ | 3,540 |
|
(6) | Non-comparable hotel results, net, includes the following items: (i) the results of operations of our non-comparable hotels and sold hotels, which operations are included in our consolidated statements of operations as continuing operations, (ii) gains on property insurance settlements, and (iii) the results of our office buildings. |
79
Item 7A. Quantitative and Qualitative Disclosures about Market Risk
All information in this section applies to Host Inc. and Host L.P.
Interest Rate Sensitivity
Our future income, cash flows and fair values relevant to financial instruments are dependent upon prevailing market interest rates. Market risk refers to the risk of loss from adverse changes in market prices and interest rates. We have no derivative financial instruments that are held for trading purposes. We use derivative financial instruments to manage, or hedge, interest rate risks.
The interest payments on 79% of our debt are fixed in nature, which largely mitigates the effect of changes in interest rates on our cash interest payments. Valuations for mortgage debt and the credit facility are determined based on expected future payments, discounted at risk-adjusted rates. The senior notes and the Debentures are valued based on quoted market prices. If market rates of interest on our variable rate debt increase or decrease by 100 basis points, interest expense would increase or decrease, respectively, our future earnings and cash flows by approximately $10 million in 2015. The table below presents scheduled maturities and related weighted average interest rates by expected maturity dates (in millions, except percentages):
| Expected Maturity Date |
|
|
|
|
|
|
|
|
| |||||||||||||||||||||
|
|
|
|
|
|
|
|
|
|
|
|
|
|
|
|
|
|
|
|
|
|
|
|
|
|
|
|
| Fair |
| |
| 2015 |
|
| 2016 |
|
| 2017 |
|
| 2018 |
|
| 2019 |
|
| Thereafter |
|
| Total |
|
| Value |
| ||||||||
Liabilities |
|
|
|
|
|
|
|
|
|
|
|
|
|
|
|
|
|
|
|
|
|
|
|
|
|
|
|
|
|
|
|
Debt: |
|
|
|
|
|
|
|
|
|
|
|
|
|
|
|
|
|
|
|
|
|
|
|
|
|
|
|
|
|
|
|
Fixed rate (1) | $ | 386 |
|
| $ | - |
|
| $ | - |
|
| $ | - |
|
| $ | 500 |
|
| $ | 2,149 |
|
| $ | 3,035 |
|
| $ | 3,567 |
|
Average interest rate |
| 5.45 | % |
|
| 5.28 | % |
|
| 5.28 | % |
|
| 5.28 | % |
|
| 5.19 | % |
|
| 5.07 | % |
|
|
|
|
|
|
|
|
|
|
|
|
|
|
|
|
|
|
|
|
|
|
|
|
|
|
|
|
|
|
|
|
|
|
|
|
|
|
|
|
Variable rate (1) | $ | - |
|
| $ | 253 |
|
| $ | 500 |
|
| $ | 204 |
|
| $ | - |
|
| $ | - |
|
| $ | 957 |
|
| $ | 957 |
|
Average interest rate (2) |
| 2.24 | % |
|
| 1.84 | % |
|
| 1.45 | % |
|
| 1.63 | % |
|
| - | % |
|
| - | % |
|
|
|
|
|
|
|
|
Total debt |
|
|
|
|
|
|
|
|
|
|
|
|
|
|
|
|
|
|
|
|
|
|
|
| $ | 3,992 |
|
| $ | 4,524 |
|
|
|
|
|
|
|
|
|
|
|
|
|
|
|
|
|
|
|
|
|
|
|
|
|
|
|
|
|
|
|
|
|
Interest rate derivative |
|
|
|
|
|
|
|
|
|
|
|
|
|
|
|
|
|
|
|
|
|
|
|
|
|
|
|
|
|
|
|
Variable to fixed-notional | $ | - |
|
| $ | 112 |
|
| $ | - |
|
| $ | - |
|
| $ | - |
|
| $ | - |
|
|
|
|
|
|
|
|
|
Fair value (asset)/liability |
|
|
|
|
|
|
|
|
|
|
|
|
|
|
|
|
|
|
|
|
|
|
|
|
|
|
|
| $ | 2 |
|
Average pay rate |
| 6.78 | % |
|
| 6.72 | % |
|
| - | % |
|
| - | % |
|
| - | % |
|
| - | % |
|
|
|
|
|
|
|
|
Average receive rate (2) |
| 5.50 | % |
|
| 5.19 | % |
|
| - | % |
|
| - | % |
|
| - | % |
|
| - | % |
|
|
|
|
|
|
|
|
___________ |
|
|
|
|
|
|
|
|
|
|
|
|
|
|
|
|
|
|
|
|
|
|
|
|
|
|
|
|
|
|
|
(1) | The amounts are net of unamortized discounts and premiums. |
(2) | The interest rate for our floating rate payments is based on the rate in effect as of December 31, 2014. No adjustments are made for forecast changes in the rate. |
Interest rate swap derivatives designated as cash flow hedges. We have designated our floating-to-fixed interest rate swap derivatives as cash flow hedges. The purpose of the interest rate swaps is to hedge against changes in cash flows (interest payments) attributable to fluctuations in benchmark interest rates associated with variable rate debt. The derivatives are valued based on the prevailing market yield curve on the date of measurement. We also evaluate counterparty credit risk when we calculate the fair value of the swaps. Changes in the fair value of the derivatives are recorded to other comprehensive income (loss) on the accompanying balance sheets. The hedges were fully effective as of December 31, 2014. The following table summarizes our interest rate swap derivatives designated as cash flow hedges (in millions):
|
|
|
|
|
|
|
|
|
|
|
|
| Change in Fair Value |
| |||||||||
|
|
|
|
|
|
|
|
|
|
|
|
| Gain (Loss) |
| |||||||||
|
| Total Notional |
|
| Maturity |
| Swapped |
| All-in- |
|
| Year ended December 31, |
| ||||||||||
Transaction Date |
| Amount |
|
| Date |
| Index |
| Rate |
|
| 2014 |
|
| 2013 |
| |||||||
November 2011 (1) |
| A$ |
| 62 |
|
| November 2016 |
| Reuters BBSY |
|
| 6.7 | % |
| $ |
| - |
|
| $ |
| 1 |
|
February 2011 (2) |
| NZ$ |
| 79 |
|
| February 2016 |
| NZ$ Bank Bill |
|
| 7.15 | % |
| $ |
| - |
|
| $ |
| 2 |
|
___________ |
|
|
|
|
|
|
|
|
|
|
|
|
|
|
|
|
|
|
|
|
|
|
|
(1) | The swap was entered into in connection with the A$86 million ($71 million) mortgage loan on the Hilton Melbourne South Wharf. |
(2) | The swap was entered into in connection with the NZ$105 million ($82 million) mortgage loan on seven properties in New Zealand. |
80
Exchange Rate Sensitivity
We have currency exchange risk as a result of our hotel ownership in Australia, Brazil, Canada, Chile, Mexico and New Zealand and our investment in the European and Asia/Pacific joint ventures. We utilize several strategies to mitigate the exposure of exchange risk for our portfolio, including (i) utilizing local currency denominated debt (including foreign currency draws on our credit facility), (ii) entering into forward or option foreign currency purchase contracts, and (iii) investing through partnership and joint venture structures. For 2014 and 2013, revenues from our consolidated foreign operations were $277 million and $271 million, respectively, or 5% of our total revenues. As of December 31, 2014, our international investments consisted of the following (in millions):
Consolidated
Country |
| Consolidated Assets (Book Value) |
|
| Mortgage Debt |
|
| Non-Controlling Interest |
|
| Net Assets |
|
| Credit Facility Draw (1) |
|
| Foreign Currency Forward Purchase Contracts (notional) |
|
| Net Asset Exposure |
|
| 2014 Net Gain/(Loss) on Foreign Currency Exposure (2) |
| ||||||||
Australia |
| $ | 121 |
|
| $ | (71 | ) |
| $ | (11 | ) |
| $ | 39 |
|
| $ | - |
|
| $ | - |
|
| $ | 39 |
|
| $ | (3 | ) |
Brazil |
|
| 95 |
|
|
| - |
|
|
| - |
|
|
| 95 |
|
|
| - |
|
|
| - |
|
|
| 95 |
|
|
| (9 | ) |
Canada |
|
| 96 |
|
|
| - |
|
|
| - |
|
|
| 96 |
|
|
| (92 | ) |
|
| (22 | ) |
|
| (18 | ) |
|
| (1 | ) |
Chile |
|
| 65 |
|
|
| - |
|
|
| - |
|
|
| 65 |
|
|
| - |
|
|
| - |
|
|
| 65 |
|
|
| (10 | ) |
Mexico |
|
| 29 |
|
|
| - |
|
|
| (14 | ) |
|
| 15 |
|
|
| - |
|
|
| - |
|
|
| 15 |
|
|
| (3 | ) |
New Zealand |
|
| 162 |
|
|
| (82 | ) |
|
| - |
|
|
| 80 |
|
|
| - |
|
|
| - |
|
|
| 80 |
|
|
| (4 | ) |
United Kingdom |
|
| - |
|
|
| - |
|
|
| - |
|
|
| - |
|
|
| (18 | ) |
|
| - |
|
|
| (18 | ) |
|
| 1 |
|
|
| $ | 568 |
|
| $ | (153 | ) |
| $ | (25 | ) |
| $ | 390 |
|
| $ | (110 | ) |
| $ | (22 | ) |
| $ | 258 |
|
| $ | (29 | ) |
Unconsolidated
|
| Investment Balance |
|
| Foreign Currency Forward Purchase Contracts (notional) |
|
| Credit Facility Draw |
|
| Net Asset Exposure |
|
| 2014 Net Gain/(Loss) on Foreign Currency Exposure ( 2 ) |
| |||||
European Joint Venture |
| $ | 348 |
|
| $ | (135 | ) |
| $ | (93 | ) |
| $ | 120 |
|
| $ | (14 | ) |
Asia/Pacific Joint Venture |
|
| 22 |
|
|
| - |
|
|
| - |
|
|
| 22 |
|
|
| - |
|
|
| $ | 370 |
|
| $ | (135 | ) |
| $ | (93 | ) |
| $ | 142 |
|
| $ | (14 | ) |
___________ |
|
|
|
|
|
|
|
|
|
|
|
|
|
|
|
|
|
|
|
|
(1) | Approximately $27 million of the $92 million CAD credit facility draw has been designated as a hedge of our net investment in Canadian entities. |
( 2 ) | Includes a net loss of $42 million that is included in accumulated other comprehensive income and $1 million recognized during 2014 in our Statement of Operations. |
Hedging Instruments . As described above, to manage the currency exchange risk applicable to ownership in non-U.S. hotels, where possible, we may enter into forward or option foreign currency purchase contracts or designate a portion of the foreign currency draws on our credit facility as hedges of net investments in foreign operations. The foreign currency exchange agreements into which we have entered strictly are to hedge foreign currency risk and are not for trading purposes.
81
As of December 31, 2014, we have five foreign currency forward sale contracts that hedge a portion of the foreign currency exposure resulting from the eventual repatriation of our net investment in foreign operations. These derivatives are considered hedges of the foreign currency exposure of a net investment in a foreign operation and are marked-to-market with changes in fair value recorded to other comprehensive income (loss) within the equity portion of our balance sheets. The foreign currency forward sale contracts are valued based on the forward yield curve of the foreign currency to U.S. dollar forward exchange rate on the date of measurement. Pursuant to these contracts, we will sell the foreign currency amount, as applicable, and receive the U.S. dollar amount on the forward sale date. We also evaluate counterparty credit risk when we calculate the fair value of the derivatives. As of December 31, 2014, the fair value of our foreign currency forward sale contracts is $13 million. The following table summarizes our foreign currency forward sale contracts (in millions):
Currently Outstanding |
| Change in Fair Value - All Contracts |
| ||||||||||||||||
|
| Total |
|
|
|
|
|
|
|
|
|
|
|
|
|
|
| ||
|
| Transaction Amount in |
|
| Total Transaction |
|
|
|
| Gain (Loss) |
| ||||||||
Transaction Date |
| Foreign |
|
| Amount |
|
| Forward Purchase |
| Year ended December 31, |
| ||||||||
Range |
| Currency |
|
| in Dollars |
|
| Date Range |
| 2014 |
|
| 2013 |
| |||||
July 2011-May 2014 |
| € |
| 100 |
|
| $ | 135 |
|
| August 2015-May 2017 |
| $ | 18 |
|
| $ | (5 | ) |
November 2014 |
| C$ |
| 25 |
|
| $ | 22 |
|
| November 2016 |
| $ | 1 |
|
| $ | - |
|
In addition to the foreign currency forward sale contracts, we have designated a portion of the foreign currency draws on our credit facility as hedges of net investments in foreign operations. As a result, currency translation adjustments in the designated credit facility draws are recorded to other comprehensive income (loss) within the equity portion of our balance sheet, which adjustments offset a portion of the translation adjustment related to our international investments. The following table summarizes the draws on our credit facility that are designated as hedges of net investments in foreign operations (in millions):
|
| Balance |
| Balance |
| Gain (Loss) | ||||||
|
| Outstanding |
| Outstanding in |
| Year ended December 31, | ||||||
Currency |
| US$ |
| Foreign Currency |
| 2014 |
| 2013 | ||||
Canadian dollars (1) |
| $ | 27 |
| C$ | 31 |
| $ | 2 |
| $ | 2 |
Euros |
| $ | 93 |
| € | 77 |
| $ | 13 |
| $ | (5) |
___________ |
|
|
|
|
|
|
|
|
|
|
|
|
(1) | We have drawn an additional $65 million on the credit facility in Canadian dollars that has not been designated as a hedging instrument. |
82
Item 8. Financial Statements and Supplementary Data
The following financial information is included on the pages indicated:
Host Hotels & Resorts, Inc. & Host Hotels & Resorts, L.P.
| Page |
Reports of Independent Registered Public Accounting Firm (Host Hotels & Resorts, Inc.) | 84 |
Report of Independent Registered Public Accounting Firm (Host Hotels & Resorts, L.P.) | 86 |
Financial Statements of Host Hotels & Resorts, Inc.: |
|
Consolidated Balance Sheets as of December 31, 2014 and 2013 | 87 |
Consolidated Statements of Operations for the Years Ended December 31, 2014, 2013 and 2012 | 88 |
Consolidated Statements of Comprehensive Income (Loss) for the Years Ended December 31, 2014, 2013 and 2012 | 89 |
Consolidated Statements of Equity for the Years Ended December 31, 2014, 2013 and 2012 | 90 |
Consolidated Statements of Cash Flows for the Years Ended December 31, 2014, 2013 and 2012 | 91 |
Financial Statements of Host Hotels & Resorts, L.P.: |
|
Consolidated Balance Sheets as of December 31, 2014 and 2013 | 93 |
Consolidated Statements of Operations for the Years Ended December 31, 2014, 2013 and 2012 | 94 |
Consolidated Statements of Comprehensive Income (Loss) for the Years Ended December 31, 2014, 2013 and 2012 | 95 |
Consolidated Statements of Capital for the Years Ended December 31, 2014, 2013 and 2012 | 96 |
Consolidated Statements of Cash Flows for the Years Ended December 31, 2014, 2013 and 2012 | 97 |
Notes to Consolidated Financial Statements (Host Hotels & Resorts, Inc. and Host Hotels & Resorts, L.P.) | 99 |
83
Report of Independent Registered Public Accounting Firm
The Board of Directors and Stockholders
Host Hotels & Resorts, Inc.:
We have audited the accompanying consolidated balance sheets of Host Hotels & Resorts, Inc. and subsidiaries as of December 31, 2014 and 2013, and the related consolidated statements of operations, comprehensive income (loss), equity, and cash flows for each of the years in the three-year period ended December 31, 2014. In connection with our audits of the consolidated financial statements, we also have audited the financial statement schedule III. These consolidated financial statements and financial statement schedule are the responsibility of the Company's management. Our responsibility is to express an opinion on these consolidated financial statements and financial statement schedule based on our audits.
We conducted our audits in accordance with the standards of the Public Company Accounting Oversight Board (United States). Those standards require that we plan and perform the audit to obtain reasonable assurance about whether the financial statements are free of material misstatement. An audit includes examining, on a test basis, evidence supporting the amounts and disclosures in the financial statements. An audit also includes assessing the accounting principles used and significant estimates made by management, as well as evaluating the overall financial statement presentation. We believe that our audits provide a reasonable basis for our opinion.
In our opinion, the consolidated financial statements referred to above present fairly, in all material respects, the financial position of Host Hotels & Resorts, Inc. and subsidiaries as of December 31, 2014 and 2013, and the results of their operations and their cash flows for each of the years in the three-year period ended December 31, 2014, in conformity with U.S. generally accepted accounting principles. Also in our opinion, the related financial statement schedule, when considered in relation to the basic consolidated financial statements taken as a whole, presents fairly, in all material respects, the information set forth therein.
As discussed in Note 1 to the consolidated financial statements, the Company has changed its method for reporting discontinued operations as of January 1, 2014.
We also have audited, in accordance with the standards of the Public Company Accounting Oversight Board (United States), Host Hotels & Resorts, Inc.'s internal control over financial reporting as of December 31, 2014, based on criteria established in Internal Control-Integrated Framework (2013) issued by the Committee of Sponsoring Organizations of the Treadway Commission (COSO), and our report dated February 24, 2015 expressed an unqualified opinion on the effectiveness of the Company's internal control over financial reporting.
| /s/ KPMG LLP |
McLean, Virginia |
|
February 24, 2015 |
|
84
Report of Independent Registered Public Accounting Firm
The Board of Directors and Stockholders
Host Hotels & Resorts, Inc.:
We have audited Host Hotels & Resorts, Inc.'s internal control over financial reporting as of December 31, 2014, based on criteria established in Internal Control-Integrated Framework (2013) issued by the Committee of Sponsoring Organizations of the Treadway Commission (COSO). Host Hotels & Resorts, Inc.'s management is responsible for maintaining effective internal control over financial reporting and for its assessment of the effectiveness of internal control over financial reporting, included in Item 9a Controls and Procedures-Internal Control over Financial Reporting of Form 10-K. Our responsibility is to express an opin i on on the Company's internal control over financial reporting based on our audit.
We conducted our audit in accordance with the standards of the Public Company Accounting Oversight Board (United States). Those standards require that we plan and perform the audit to obtain reasonable assurance about whether effective internal control over financial reporting was maintained in all material respects. Our audit included obtaining an understanding of internal control over financial reporting, assessing the risk that a material weakness exists, and testing and evaluating the design and operating effectiveness of internal control based on the assessed risk. Our audit also included performing such other procedures as we considered necessary in the circumstances. We believe that our audit provides a reasonable basis for our opinion.
A company's internal control over financial reporting is a process designed to provide reasonable assurance regarding the reliability of financial reporting and the preparation of financial statements for external purposes in accordance with generally accepted accounting principles. A company's internal control over financial reporting includes those policies and procedures that (1) pertain to the maintenance of records that, in reasonable detail, accurately and fairly reflect the transactions and dispositions of the assets of the company; (2) provide reasonable assurance that transactions are recorded as necessary to permit preparation of financial statements in accordance with generally accepted accoun ting principles, and that receipts and expenditures of the company are being made only in accordance with authorizations of management and directors of the company; and (3) provide reasonable assurance regarding prevention or timely detection of unauthorized acquisition, use, or disposition of the company's assets that could have a material effect on the financial statements. Because of its inherent limitations, internal control over financial reporting may not prevent or detect misstatements. Also, projections of any evaluation of effectiveness to future periods are subject to the risk that controls may become inadequate because of changes in conditions, or that the degree of compliance with the policies or procedures may deteriorate.
In our opinion, Host Hotels & Resorts, Inc. maintained, in all material respects, effective internal control over financial reporting as of December 31, 2014, based on criteria established in Internal Control-Integrated Framework (2013) issued by the Committee of Sponsoring Organizations of the Treadway Commission (COSO).
We also have audited, in accordance with the standards of the Public Company Accounting Oversight Board (United States), the consolidated balance sheets of Host Hotels & Resorts, Inc. and subsidiaries as of December 31, 2014 and 2013, and the related consolidated statements of operations, comprehensive income (loss), equity, and cash flows for each of the years in the three-year period ended December 31, 2014, and our report dated February 24, 2015, expressed an unqualified opinion on those consolidated financial statements.
| /s/ KPMG LLP |
McLean, Virginia |
|
February 24, 2015 |
|
85
Report of Independent Registered Public Accounting Firm
The Partners
Host Hotels & Resorts, L.P.:
We have audited the accompanying consolidated balance sheets of Host Hotels & Resorts, L.P. and subsidiaries as of December 31, 2014 and 2013, and the related consolidated statements of operations, comprehensive income (loss), capital, and cash flows for each of the years in the three-year period ended December 31, 2014. In connection with our audits of the consolidated financial statements, we also have audited the financial statement schedule III. These consolidated financial statements and financial statement schedule are the responsibility of the Partnership's management. Our responsibility is to express an opinion on these consolidated financial statements and financial statement schedule based on our audits.
We conducted our audits in accordance with the standards of the Public Company Accounting Oversight Board (United States). Those standards require that we plan and perform the audit to obtain reasonable assurance about whether the financial statements are free of material misstatement. An audit includes examining, on a test basis, evidence supporting the amounts and disclosures in the financial statements. An audit also includes assessing the accounting principles used and significant estimates made by management, as well as evaluating the overall financial statement presentation. We believe that our audits provide a reasonable basis for our opinion.
In our opinion, the consolidated financial statements referred to above present fairly, in all material respects, the financial position of Host Hotels & Resorts, L. P. and subsidiaries as of December 31, 2014 and 2013, and the results of their operations and their cash flows for each of the years in the three-year period ended December 31, 2014, in conformity with U.S. generally accepted accounting principles. Also in our opinion, the related financial statement schedule, when considered in relation to the basic consolidated financial statements taken as a whole, presents fairly, in all material respects, the information set forth therein.
As discussed in Note 1 to the consolidated financial statements, the Company has changed its method for reporting discontinued operations as of January 1, 2014.
| /s/ KPMG LLP |
McLean, Virginia |
|
February 24, 2015 |
|
86
HOST HOTELS & RESORTS, INC. AND SUBSIDIARIES
CONSOLIDATED BALANCE SHEETS
December 31, 2014 and 2013
(in millions, except per share amounts)
|
| 2014 |
|
| 2013 |
| ||
ASSETS |
| |||||||
Property and equipment, net |
| $ | 10,575 |
|
| $ | 10,995 |
|
Due from managers |
|
| 70 |
|
|
| 52 |
|
Advances to and investments in affiliates |
|
| 433 |
|
|
| 415 |
|
Deferred financing costs, net |
|
| 35 |
|
|
| 42 |
|
Furniture, fixtures and equipment replacement fund |
|
| 129 |
|
|
| 173 |
|
Other |
|
| 281 |
|
|
| 244 |
|
Restricted cash |
|
| - |
|
|
| 32 |
|
Cash and cash equivalents |
|
| 684 |
|
|
| 861 |
|
Total assets |
| $ | 12,207 |
|
| $ | 12,814 |
|
|
|
|
|
|
|
|
|
|
LIABILITIES, NON-CONTROLLING INTERESTS AND EQUITY |
| |||||||
Debt |
|
|
|
|
|
|
|
|
Senior notes, including $386 million and $371 million, respectively, net of discount, of Exchangeable Senior Debentures |
| $ | 2,884 |
|
| $ | 3,018 |
|
Credit facility, including the $500 million term loan |
|
| 704 |
|
|
| 946 |
|
Mortgage debt |
|
| 404 |
|
|
| 709 |
|
Other |
|
| - |
|
|
| 86 |
|
Total debt |
|
| 3,992 |
|
|
| 4,759 |
|
Accounts payable and accrued expenses |
|
| 298 |
|
|
| 214 |
|
Other |
|
| 324 |
|
|
| 389 |
|
Total liabilities |
|
| 4,614 |
|
|
| 5,362 |
|
|
|
|
|
|
|
|
|
|
Non-controlling interests - Host Hotels & Resorts, L.P. |
|
| 225 |
|
|
| 190 |
|
|
|
|
|
|
|
|
|
|
Host Hotels & Resorts, Inc. stockholders' equity: |
|
|
|
|
|
|
|
|
Common stock, par value $.01, 1,050 million shares authorized, 755.8 million shares and 754.8 million shares issued and outstanding, respectively |
|
| 8 |
|
|
| 8 |
|
Additional paid-in capital |
|
| 8,476 |
|
|
| 8,492 |
|
Accumulated other comprehensive loss |
|
| (50 | ) |
|
| (9 | ) |
Deficit |
|
| (1,098 | ) |
|
| (1,263 | ) |
Total equity of Host Hotels & Resorts, Inc. stockholders |
|
| 7,336 |
|
|
| 7,228 |
|
Non-controlling interests-other consolidated partnerships |
|
| 32 |
|
|
| 34 |
|
Total equity |
|
| 7,368 |
|
|
| 7,262 |
|
Total liabilities, non-controlling interests and equity |
| $ | 12,207 |
|
| $ | 12,814 |
|
|
|
|
|
|
|
|
|
|
See Notes to Consolidated Financial Statements.
87
HOST HOTELS & RESORTS, INC. AND SUBSIDIARIES
CONSOLIDATED STATEMENTS OF OPERATIONS
Years Ended December 31, 2014, 2013 and 2012
(in millions, except per common share amounts)
|
| 2014 |
|
| 2013 |
|
| 2012 |
|
| |||
REVENUES |
|
|
|
|
|
|
|
|
|
|
|
|
|
Rooms |
| $ | 3,452 |
|
| $ | 3,317 |
|
| $ | 3,082 |
|
|
Food and beverage |
|
| 1,546 |
|
|
| 1,503 |
|
|
| 1,419 |
|
|
Other |
|
| 356 |
|
|
| 346 |
|
|
| 558 |
|
|
Total revenues |
|
| 5,354 |
|
|
| 5,166 |
|
|
| 5,059 |
|
|
EXPENSES |
|
|
|
|
|
|
|
|
|
|
|
|
|
Rooms |
|
| 924 |
|
|
| 894 |
|
|
| 836 |
|
|
Food and beverage |
|
| 1,109 |
|
|
| 1,095 |
|
|
| 1,049 |
|
|
Other departmental and support expenses |
|
| 1,264 |
|
|
| 1,249 |
|
|
| 1,219 |
|
|
Management fees |
|
| 227 |
|
|
| 222 |
|
|
| 199 |
|
|
Other property-level expenses |
|
| 386 |
|
|
| 376 |
|
|
| 576 |
|
|
Depreciation and amortization |
|
| 701 |
|
|
| 697 |
|
|
| 722 |
|
|
Corporate and other expenses |
|
| 43 |
|
|
| 121 |
|
|
| 107 |
|
|
Gain on insurance settlements |
|
| (10 | ) |
|
| - |
|
|
| (11 | ) |
|
Total operating costs and expenses |
|
| 4,644 |
|
|
| 4,654 |
|
|
| 4,697 |
|
|
OPERATING PROFIT |
|
| 710 |
|
|
| 512 |
|
|
| 362 |
|
|
Interest income |
|
| 4 |
|
|
| 4 |
|
|
| 23 |
|
|
Interest expense |
|
| (214 | ) |
|
| (304 | ) |
|
| (373 | ) |
|
Gain on sale of assets |
|
| 236 |
|
|
| 33 |
|
|
| 13 |
|
|
Gain (loss) on foreign currency transactions and derivatives |
|
| (1 | ) |
|
| 3 |
|
|
| (4 | ) |
|
Equity in earnings (losses) of affiliates |
|
| 26 |
|
|
| (17 | ) |
|
| 2 |
|
|
INCOME BEFORE INCOME TAXES |
|
| 761 |
|
|
| 231 |
|
|
| 23 |
|
|
Provision for income taxes |
|
| (14 | ) |
|
| (21 | ) |
|
| (31 | ) |
|
INCOME (LOSS) FROM CONTINUING OPERATIONS |
|
| 747 |
|
|
| 210 |
|
|
| (8 | ) |
|
Income from discontinued operations, net of tax |
|
| - |
|
|
| 115 |
|
|
| 71 |
|
|
NET INCOME |
|
| 747 |
|
|
| 325 |
|
|
| 63 |
|
|
Less: Net income attributable to non-controlling interests |
|
| (15 | ) |
|
| (8 | ) |
|
| (2 | ) |
|
NET INCOME ATTRIBUTABLE TO HOST HOTELS & RESORTS, INC. |
| $ | 732 |
|
| $ | 317 |
|
| $ | 61 |
|
|
Basic earnings (loss) per common share: |
|
|
|
|
|
|
|
|
|
|
|
|
|
Continuing operations |
| $ | .97 |
|
| $ | .27 |
|
| $ | (.01 | ) |
|
Discontinued operations |
|
| - |
|
|
| .16 |
|
|
| .09 |
|
|
Basic earnings per common share |
| $ | .97 |
|
| $ | .43 |
|
| $ | .08 |
|
|
Diluted earnings (loss) per common share: |
|
|
|
|
|
|
|
|
|
|
|
|
|
Continuing operations |
| $ | .96 |
|
| $ | .27 |
|
| $ | (.01 | ) |
|
Discontinued operations |
|
| - |
|
|
| .15 |
|
|
| .09 |
|
|
Diluted earnings per common share |
| $ | .96 |
|
| $ | .42 |
|
| $ | .08 |
|
|
|
|
|
|
|
|
|
|
|
|
|
|
|
|
See Notes to Consolidated Financial Statements.
88
HOST HOTELS & RESORTS, INC. AND SUBSIDIARIES
CONSOLIDATED STATEMENTS OF COMPREHENSIVE INCOME (LOSS)
Years Ended December 31, 2014, 2013 and 2012
(in millions)
|
| 2014 |
|
| 2013 |
|
| 2012 |
| |||
NET INCOME |
| $ | 747 |
|
| $ | 325 |
|
| $ | 63 |
|
OTHER COMPREHENSIVE INCOME (LOSS), NET OF TAX: |
|
|
|
|
|
|
|
|
|
|
|
|
Foreign currency translation and other comprehensive income (loss) of unconsolidated affiliates |
|
| (60 | ) |
|
| (18 | ) |
|
| 20 |
|
Change in fair value of derivative instruments |
|
| 19 |
|
|
| (3 | ) |
|
| (7 | ) |
OTHER COMPREHENSIVE INCOME (LOSS), NET OF TAX |
|
| (41 | ) |
|
| (21 | ) |
|
| 13 |
|
COMPREHENSIVE INCOME |
|
| 706 |
|
|
| 304 |
|
|
| 76 |
|
Less: Comprehensive income attributable to non-controlling interests |
|
| (15 | ) |
|
| (8 | ) |
|
| (2 | ) |
COMPREHENSIVE INCOME ATTRIBUTABLE TO HOST HOTELS & RESORTS, INC. |
| $ | 691 |
|
| $ | 296 |
|
| $ | 74 |
|
See Notes to Consolidated Financial Statements .
89
HOST HOTELS & RESORTS, INC. AND SUBISIDARIES
CONSOLIDATED STATEMENTS OF EQUITY
Years Ended December 31, 2014, 2013 and 2012
(in millions)
Common Shares Outstanding |
|
|
|
| Common Stock |
|
| Additional Paid-in Capital |
|
| Accumulated Other Comprehensive Income (Loss) |
|
| Retained Earnings / (Deficit) |
|
| Non-controlling Interest of Other Consolidated Partnerships |
|
| Non-controlling Interests of Host Hotels & Resorts, L.P. |
| |||||||
| 705.1 |
|
| Balance, December 31, 2011 |
| $ | 7 |
|
| $ | 7,750 |
|
| $ | (1 | ) |
| $ | (1,079 | ) |
| $ | 36 |
|
| $ | 158 |
|
| - |
|
| Net income |
|
| - |
|
|
| - |
|
|
| - |
|
|
| 61 |
|
|
| 1 |
|
|
| 1 |
|
| - |
|
| Other changes in ownership |
|
| - |
|
|
| (12 | ) |
|
| - |
|
|
| - |
|
|
| - |
|
|
| 12 |
|
| - |
|
| Foreign currency translation and other comprehensive income (loss) of unconsolidated affiliates |
|
| - |
|
|
| - |
|
|
| 20 |
|
|
| - |
|
|
| - |
|
|
| - |
|
| - |
|
| Change in fair value of derivative instruments |
|
| - |
|
|
| - |
|
|
| (7 | ) |
|
| - |
|
|
| - |
|
|
| - |
|
| 17.5 |
|
| Common stock issuances |
|
| - |
|
|
| 274 |
|
|
| - |
|
|
| - |
|
|
| - |
|
|
| - |
|
| 1.4 |
|
| Comprehensive stock and employee stock purchase plans |
|
| - |
|
|
| 18 |
|
|
| - |
|
|
| - |
|
|
| - |
|
|
| - |
|
| - |
|
| Common stock dividends |
|
| - |
|
|
| - |
|
|
| - |
|
|
| (216 | ) |
|
| - |
|
|
| - |
|
| 0.6 |
|
| Redemptions of limited partner interests for common stock |
|
| - |
|
|
| 10 |
|
|
| - |
|
|
| - |
|
|
| - |
|
|
| (10 | ) |
| - |
|
| Contributions from non- controlling interests of consolidated partnerships |
|
| - |
|
|
| - |
|
|
| - |
|
|
| - |
|
|
| 1 |
|
|
| - |
|
| - |
|
| Distributions to non-controlling interests |
|
| - |
|
|
| - |
|
|
| - |
|
|
| - |
|
|
| (4 | ) |
|
| (3 | ) |
| 724.6 |
|
| Balance, December 31, 2012 |
| $ | 7 |
|
| $ | 8,040 |
|
| $ | 12 |
|
| $ | (1,234 | ) |
| $ | 34 |
|
| $ | 158 |
|
| - |
|
| Net income |
|
| - |
|
|
| - |
|
|
| - |
|
|
| 317 |
|
|
| 4 |
|
|
| 4 |
|
| - |
|
| Other changes in ownership |
|
| - |
|
|
| (38 | ) |
|
| - |
|
|
| - |
|
|
| (3 | ) |
|
| 38 |
|
| - |
|
| Foreign currency translation and other comprehensive income (loss) of unconsolidated affiliates |
|
| - |
|
|
| - |
|
|
| (18 | ) |
|
| - |
|
|
| - |
|
|
| - |
|
| - |
|
| Change in fair value of derivative instruments |
|
| - |
|
|
| - |
|
|
| (3 | ) |
|
| - |
|
|
| - |
|
|
| - |
|
| 28.7 |
|
| Common stock issuances |
|
| 1 |
|
|
| 476 |
|
|
| - |
|
|
| - |
|
|
| - |
|
|
| - |
|
| 1.2 |
|
| Comprehensive stock and employee stock purchase plans |
|
| - |
|
|
| 8 |
|
|
| - |
|
|
| - |
|
|
| - |
|
|
| - |
|
| - |
|
| Common stock dividends |
|
| - |
|
|
| - |
|
|
| - |
|
|
| (346 | ) |
|
| - |
|
|
| - |
|
| 0.3 |
|
| Redemptions of limited partner interests for common stock |
|
| - |
|
|
| 6 |
|
|
| - |
|
|
| - |
|
|
| - |
|
|
| (6 | ) |
| - |
|
| Contributions from non- controlling interests of consolidated partnerships |
|
| - |
|
|
| - |
|
|
| - |
|
|
| - |
|
|
| 7 |
|
|
| - |
|
| - |
|
| Distributions to non-controlling interests |
|
| - |
|
|
| - |
|
|
| - |
|
|
| - |
|
|
| (8 | ) |
|
| (4 | ) |
| 754.8 |
|
| Balance, December 31, 2013 |
| $ | 8 |
|
| $ | 8,492 |
|
| $ | (9 | ) |
| $ | (1,263 | ) |
| $ | 34 |
|
| $ | 190 |
|
| - |
|
| Net income |
|
| - |
|
|
| - |
|
|
| - |
|
|
| 732 |
|
|
| 6 |
|
|
| 9 |
|
| - |
|
| Other changes in ownership |
|
| - |
|
|
| (39 | ) |
|
| - |
|
|
| - |
|
|
| (1 | ) |
|
| 38 |
|
| - |
|
| Foreign currency translation and other comprehensive income (loss) of unconsolidated affiliates |
|
| - |
|
|
| - |
|
|
| (60 | ) |
|
| - |
|
|
| - |
|
|
| - |
|
| - |
|
| Change in fair value of derivative instruments |
|
| - |
|
|
| - |
|
|
| 19 |
|
|
| - |
|
|
| - |
|
|
| - |
|
| 0.2 |
|
| Common stock issuances |
|
| - |
|
|
| 4 |
|
|
| - |
|
|
| - |
|
|
| - |
|
|
| - |
|
| 0.5 |
|
| Comprehensive stock and employee stock purchase plans |
|
| - |
|
|
| 13 |
|
|
| - |
|
|
| - |
|
|
| - |
|
|
| - |
|
| - |
|
| Common stock dividends |
|
| - |
|
|
| - |
|
|
| - |
|
|
| (567 | ) |
|
| - |
|
|
| - |
|
| 0.3 |
|
| Redemptions of limited partner interests for common stock |
|
| - |
|
|
| 6 |
|
|
| - |
|
|
| - |
|
|
| - |
|
|
| (6 | ) |
| - |
|
| Contributions from non- controlling interests of consolidated partnerships |
|
| - |
|
|
| - |
|
|
| - |
|
|
| - |
|
|
| 1 |
|
|
| - |
|
| - |
|
| Distributions to non-controlling interests |
|
| - |
|
|
| - |
|
|
| - |
|
|
| - |
|
|
| (8 | ) |
|
| (6 | ) |
| 755.8 |
|
| Balance, December 31, 2014 |
| $ | 8 |
|
| $ | 8,476 |
|
| $ | (50 | ) |
| $ | (1,098 | ) |
| $ | 32 |
|
| $ | 225 |
|
See Notes to Consolidated Financial Statements.
90
HOST HOTELS & RESORTS, INC. AND SUBSIDIARIES
CONSOLIDATED STATEMENTS OF CASH FLOWS
Years Ended December 31, 2014, 2013 and 2012
(in millions)
|
| 2014 |
|
| 2013 |
|
| 2012 |
| |||
OPERATING ACTIVITIES |
|
|
|
|
|
|
|
|
|
|
|
|
Net income |
| $ | 747 |
|
| $ | 325 |
|
| $ | 63 |
|
Adjustments to reconcile to cash provided by operations: |
|
|
|
|
|
|
|
|
|
|
|
|
Discontinued operations: |
|
|
|
|
|
|
|
|
|
|
|
|
Gain on dispositions |
|
| - |
|
|
| (97 | ) |
|
| (48 | ) |
Depreciation |
|
| - |
|
|
| 10 |
|
|
| 32 |
|
Depreciation and amortization |
|
| 701 |
|
|
| 697 |
|
|
| 722 |
|
Amortization of finance costs, discounts and premiums, net |
|
| 24 |
|
|
| 25 |
|
|
| 13 |
|
Non-cash loss on extinguishment of debt |
|
| 2 |
|
|
| 13 |
|
|
| 9 |
|
Stock compensation expense |
|
| 22 |
|
|
| 18 |
|
|
| 16 |
|
Deferred income taxes |
|
| (1 | ) |
|
| 6 |
|
|
| 17 |
|
Gain on sale of assets |
|
| (236 | ) |
|
| (33 | ) |
|
| (13 | ) |
(Gain) loss on foreign currency transactions and derivatives |
|
| 1 |
|
|
| (3 | ) |
|
| 4 |
|
Gain on property insurance settlement |
|
| (1 | ) |
|
| - |
|
|
| (2 | ) |
Equity in (earnings) losses of affiliates |
|
| (26 | ) |
|
| 17 |
|
|
| (2 | ) |
Change in due from managers |
|
| (17 | ) |
|
| 21 |
|
|
| (42 | ) |
Change in restricted cash for operating activities |
|
| 25 |
|
|
| - |
|
|
| - |
|
Changes in other assets |
|
| (34 | ) |
|
| 39 |
|
|
| 11 |
|
Changes in other liabilities |
|
| (57 | ) |
|
| (19 | ) |
|
| 1 |
|
Cash provided by operating activities |
|
| 1,150 |
|
|
| 1,019 |
|
|
| 781 |
|
|
|
|
|
|
|
|
|
|
|
|
|
|
INVESTING ACTIVITIES |
|
|
|
|
|
|
|
|
|
|
|
|
Proceeds from sales of assets, net |
|
| 497 |
|
|
| 643 |
|
|
| 160 |
|
Return of investment in affiliates |
|
| 42 |
|
|
| - |
|
|
| 3 |
|
Acquisitions |
|
| (138 | ) |
|
| (166 | ) |
|
| (441 | ) |
Deferred sale proceeds received from HPT |
|
| - |
|
|
| - |
|
|
| 51 |
|
Advances to and investments in affiliates |
|
| (65 | ) |
|
| (74 | ) |
|
| (132 | ) |
Return on mortgage loan investment |
|
| - |
|
|
| - |
|
|
| 82 |
|
Capital expenditures: |
|
|
|
|
|
|
|
|
|
|
|
|
Renewals and replacements |
|
| (324 | ) |
|
| (303 | ) |
|
| (366 | ) |
Redevelopment and acquisition-related investments |
|
| (112 | ) |
|
| (133 | ) |
|
| (272 | ) |
New development |
|
| (13 | ) |
|
| (19 | ) |
|
| (6 | ) |
Change in furniture, fixtures and equipment ("FF&E") replacement fund |
|
| 18 |
|
|
| (23 | ) |
|
| 16 |
|
Property insurance proceeds |
|
| 2 |
|
|
| - |
|
|
| 19 |
|
Cash used in investing activities |
|
| (93 | ) |
|
| (75 | ) |
|
| (886 | ) |
|
|
|
|
|
|
|
|
|
|
|
|
|
FINANCING ACTIVITIES |
|
|
|
|
|
|
|
|
|
|
|
|
Financing costs |
|
| (4 | ) |
|
| (4 | ) |
|
| (18 | ) |
Issuances of debt |
|
| 4 |
|
|
| 550 |
|
|
| 900 |
|
Draws on credit facility |
|
| 4 |
|
|
| 393 |
|
|
| 231 |
|
Term loan issuance |
|
| - |
|
|
| - |
|
|
| 500 |
|
Repayment of credit facility |
|
| (225 | ) |
|
| (207 | ) |
|
| (89 | ) |
Repurchase/redemption of senior notes |
|
| (150 | ) |
|
| (801 | ) |
|
| (1,795 | ) |
Mortgage debt and other prepayments and scheduled maturities |
|
| (384 | ) |
|
| (411 | ) |
|
| (113 | ) |
Scheduled principal repayments |
|
| - |
|
|
| (2 | ) |
|
| (2 | ) |
Issuance of common stock |
|
| 4 |
|
|
| 303 |
|
|
| 274 |
|
Dividends on common stock |
|
| (469 | ) |
|
| (313 | ) |
|
| (187 | ) |
Contributions from non-controlling interests |
|
| 1 |
|
|
| 7 |
|
|
| 1 |
|
Distributions to non-controlling interests |
|
| (14 | ) |
|
| (12 | ) |
|
| (7 | ) |
Change in restricted cash for financing activities |
|
| 7 |
|
|
| 4 |
|
|
| - |
|
Cash used in financing activities |
|
| (1,226 | ) |
|
| (493 | ) |
|
| (305 | ) |
Effects of exchange rate changes on cash held |
|
| (8 | ) |
|
| (7 | ) |
|
| 1 |
|
INCREASE (DECREASE) IN CASH AND CASH EQUIVALENTS |
|
| (177 | ) |
|
| 444 |
|
|
| (409 | ) |
CASH AND CASH EQUIVALENTS, BEGINNING OF PERIOD |
|
| 861 |
|
|
| 417 |
|
|
| 826 |
|
CASH AND CASH EQUIVALENTS, END OF PERIOD |
| $ | 684 |
|
| $ | 861 |
|
| $ | 417 |
|
|
|
|
|
|
|
|
|
|
|
|
|
|
See Notes to Consolidated Financial Statements.
91
HOST HOTELS & RESORTS, INC. AND SUBSIDIARIES
CONSOLIDATED STATEMENTS OF CASH FLOWS (continued)
Years Ended December 31, 2014, 2013 and 2012
(in millions)
Supplemental schedule of noncash investing and financing activities:
During 2014, 2013 and 2012, Host Inc. issued approximately 0.3 million, 0.3 million and 0.6 million shares of common stock, respectively, upon the conversion of Host L.P. units, or OP units, held by non-controlling interests valued at $6 million, $6 million and $10 million, respectively.
In March 2013, holders of approximately $174 million of the 3.25% Exchangeable Debentures elected to exchange their debentures for approximately 11.7 million shares of Host Inc. common stock.
In November 2012, we contributed land with a book value of $11 million and a fair value of $36 million to a joint venture with Hyatt Residential Group to develop a vacation ownership project in Maui, Hawaii. We recorded an initial investment of $8 million related to our 67% ownership in the joint venture and an initial gain of $8 million related to the portion of the land attributable to Hyatt Residential Group's 33% interest, for which we received cash of $12 million.
See Notes to Consolidated Financial Statements.
92
HOST HOTELS & RESORTS, L.P. AND SUBSIDIARIES
CONSOLIDATED BALANCE SHEETS
December 31, 2014 and 2013
(in millions)
|
| 2014 |
|
| 2013 |
| ||
ASSETS |
| |||||||
Property and equipment, net |
| $ | 10,575 |
|
| $ | 10,995 |
|
Due from managers |
|
| 70 |
|
|
| 52 |
|
Advances to and investments in affiliates |
|
| 433 |
|
|
| 415 |
|
Deferred financing costs, net |
|
| 35 |
|
|
| 42 |
|
Furniture, fixtures and equipment replacement fund |
|
| 129 |
|
|
| 173 |
|
Other |
|
| 281 |
|
|
| 244 |
|
Restricted cash |
|
| - |
|
|
| 32 |
|
Cash and cash equivalents |
|
| 684 |
|
|
| 861 |
|
Total assets |
| $ | 12,207 |
|
| $ | 12,814 |
|
|
|
|
|
|
|
|
|
|
LIABILITIES, LIMITED PARTNERSHIP INTERESTS OF THIRD PARTIES AND CAPITAL |
| |||||||
Debt |
|
|
|
|
|
|
|
|
Senior notes, including $386 million and $371 million, respectively, net of discount, of Exchangeable Senior Debentures |
| $ | 2,884 |
|
| $ | 3,018 |
|
Credit facility, including the $500 million term loan |
|
| 704 |
|
|
| 946 |
|
Mortgage debt |
|
| 404 |
|
|
| 709 |
|
Other |
|
| - |
|
|
| 86 |
|
Total debt |
|
| 3,992 |
|
|
| 4,759 |
|
Accounts payable and accrued expenses |
|
| 298 |
|
|
| 214 |
|
Other |
|
| 324 |
|
|
| 389 |
|
Total liabilities |
|
| 4,614 |
|
|
| 5,362 |
|
|
|
|
|
|
|
|
|
|
Limited partnership interests of third parties |
|
| 225 |
|
|
| 190 |
|
|
|
|
|
|
|
|
|
|
Host Hotels & Resorts, L.P. capital: |
|
|
|
|
|
|
|
|
General partner |
|
| 1 |
|
|
| 1 |
|
Limited partner |
|
| 7,385 |
|
|
| 7,236 |
|
Accumulated other comprehensive loss |
|
| (50 | ) |
|
| (9 | ) |
Total Host Hotels & Resorts, L.P. capital |
|
| 7,336 |
|
|
| 7,228 |
|
Non-controlling interests-consolidated partnerships |
|
| 32 |
|
|
| 34 |
|
Total capital |
|
| 7,368 |
|
|
| 7,262 |
|
Total liabilities, limited partnership interest of third parties and capital |
| $ | 12,207 |
|
| $ | 12,814 |
|
|
|
|
|
|
|
|
|
|
See Notes to Consolidated Financial Statements.
93
HOST HOTELS & RESORTS, L.P. AND SUBSIDIARIES
CONSOLIDATED STATEMENTS OF OPERATIONS
Years Ended December 31, 2014, 2013 and 2012
(in millions, except per common unit amounts)
|
| 2014 |
|
| 2013 |
|
| 2012 |
| |||
REVENUES |
|
|
|
|
|
|
|
|
|
|
|
|
Rooms |
| $ | 3,452 |
|
| $ | 3,317 |
|
| $ | 3,082 |
|
Food and beverage |
|
| 1,546 |
|
|
| 1,503 |
|
|
| 1,419 |
|
Other |
|
| 356 |
|
|
| 346 |
|
|
| 558 |
|
Total revenues |
|
| 5,354 |
|
|
| 5,166 |
|
|
| 5,059 |
|
EXPENSES |
|
|
|
|
|
|
|
|
|
|
|
|
Rooms |
|
| 924 |
|
|
| 894 |
|
|
| 836 |
|
Food and beverage |
|
| 1,109 |
|
|
| 1,095 |
|
|
| 1,049 |
|
Other departmental and support expenses |
|
| 1,264 |
|
|
| 1,249 |
|
|
| 1,219 |
|
Management fees |
|
| 227 |
|
|
| 222 |
|
|
| 199 |
|
Other property-level expenses |
|
| 386 |
|
|
| 376 |
|
|
| 576 |
|
Depreciation and amortization |
|
| 701 |
|
|
| 697 |
|
|
| 722 |
|
Corporate and other expenses |
|
| 43 |
|
|
| 121 |
|
|
| 107 |
|
Gain on insurance settlements |
|
| (10 | ) |
|
| - |
|
|
| (11 | ) |
Total operating costs and expenses |
|
| 4,644 |
|
|
| 4,654 |
|
|
| 4,697 |
|
OPERATING PROFIT |
|
| 710 |
|
|
| 512 |
|
|
| 362 |
|
Interest income |
|
| 4 |
|
|
| 4 |
|
|
| 23 |
|
Interest expense |
|
| (214 | ) |
|
| (304 | ) |
|
| (373 | ) |
Gain on sale of assets |
|
| 236 |
|
|
| 33 |
|
|
| 13 |
|
Gain (loss) on foreign currency transactions and derivatives |
|
| (1 | ) |
|
| 3 |
|
|
| (4 | ) |
Equity in earnings (losses) of affiliates |
|
| 26 |
|
|
| (17 | ) |
|
| 2 |
|
INCOME BEFORE INCOME TAXES |
|
| 761 |
|
|
| 231 |
|
|
| 23 |
|
Provision for income taxes |
|
| (14 | ) |
|
| (21 | ) |
|
| (31 | ) |
INCOME (LOSS) FROM CONTINUING OPERATIONS |
|
| 747 |
|
|
| 210 |
|
|
| (8 | ) |
Income from discontinued operations, net of tax |
|
| - |
|
|
| 115 |
|
|
| 71 |
|
NET INCOME |
|
| 747 |
|
|
| 325 |
|
|
| 63 |
|
Less: Net income attributable to non-controlling interests |
|
| (6 | ) |
|
| (4 | ) |
|
| (1 | ) |
NET INCOME ATTRIBUTABLE TO HOST HOTELS & RESORTS, L.P. |
| $ | 741 |
|
| $ | 321 |
|
| $ | 62 |
|
Basic earnings (loss) per common unit: |
|
|
|
|
|
|
|
|
|
|
|
|
Continuing operations |
| $ | .99 |
|
| $ | .28 |
|
| $ | (.01 | ) |
Discontinued operations |
|
| - |
|
|
| .15 |
|
|
| .10 |
|
Basic earnings per common unit |
| $ | .99 |
|
| $ | .43 |
|
| $ | .09 |
|
Diluted earnings (loss) per common unit: |
|
|
|
|
|
|
|
|
|
|
|
|
Continuing operations |
| $ | .99 |
|
| $ | .28 |
|
| $ | (.01 | ) |
Discontinued operations |
|
| - |
|
|
| .15 |
|
|
| .10 |
|
Diluted earnings per common unit |
| $ | .99 |
|
| $ | .43 |
|
| $ | .09 |
|
See Notes to Consolidated Financial Statements.
94
HOST HOTELS & RESORTS, L.P. AND SUBSIDIARIES
CONSOLIDATED STATEMENTS OF COMPREHENSIVE INCOME (LOSS)
Years Ended December 31, 2014, 2013 and 2012
(in millions)
|
| 2014 |
|
| 2013 |
|
| 2012 |
| |||
NET INCOME |
| $ | 747 |
|
| $ | 325 |
|
| $ | 63 |
|
OTHER COMPREHENSIVE INCOME (LOSS), NET OF TAX: |
|
|
|
|
|
|
|
|
|
|
|
|
Foreign currency translation and other comprehensive income (loss) of unconsolidated affiliates |
|
| (60 | ) |
|
| (18 | ) |
|
| 20 |
|
Change in fair value of derivative instruments |
|
| 19 |
|
|
| (3 | ) |
|
| (7 | ) |
OTHER COMPREHENSIVE INCOME (LOSS), NET OF TAX |
|
| (41 | ) |
|
| (21 | ) |
|
| 13 |
|
COMPREHENSIVE INCOME |
|
| 706 |
|
|
| 304 |
|
|
| 76 |
|
Less: Comprehensive income attributable to non-controlling interests |
|
| (6 | ) |
|
| (4 | ) |
|
| (1 | ) |
COMPREHENSIVE INCOME ATTRIBUTABLE TO HOST HOTELS & RESORTS, L.P. |
| $ | 700 |
|
| $ | 300 |
|
| $ | 75 |
|
See Notes to Consolidated Financial Statements.
95
HOST HOTELS & RESORTS, L.P. AND SUBISIDARIES
CONSOLIDATED STATEMENTS OF CAPITAL
Years Ended December 31, 2014, 2013 and 2012
(in millions)
Common OP Units Outstanding |
|
|
|
| General Partner |
|
| Limited Partner |
|
| Accumulated Other Comprehensive Income (Loss) |
|
| Non-controlling Interests of Consolidated Partnerships |
|
| Limited Partnership Interests of Third Parties |
| ||||||
| 690.3 |
|
| Balance, December 31, 2011 |
| $ | 1 |
|
| $ | 6,677 |
|
| $ | (1 | ) |
| $ | 36 |
|
| $ | 158 |
|
| - |
|
| Net income |
|
| - |
|
|
| 61 |
|
|
| - |
|
|
| 1 |
|
|
| 1 |
|
| - |
|
| Other changes in ownership |
|
| - |
|
|
| (12 | ) |
|
| - |
|
|
| - |
|
|
| 12 |
|
| - |
|
| Foreign currency translation and other comprehensive income (loss) of unconsolidated affiliates |
|
| - |
|
|
| - |
|
|
| 20 |
|
|
| - |
|
|
| - |
|
| - |
|
| Change in fair value of derivative instruments |
|
| - |
|
|
| - |
|
|
| (7 | ) |
|
| - |
|
|
| - |
|
| 17.1 |
|
| Common OP unit issuances |
|
| - |
|
|
| 274 |
|
|
| - |
|
|
| - |
|
|
| - |
|
| 1.4 |
|
| Units issued to Host Inc. for the comprehensive stock and employee stock purchase plans |
|
| - |
|
|
| 18 |
|
|
| - |
|
|
| - |
|
|
| - |
|
| - |
|
| Distributions on common OP units |
|
| - |
|
|
| (216 | ) |
|
| - |
|
|
| - |
|
|
| (3 | ) |
| 0.6 |
|
| Redemptions of limited partner interests for common stock |
|
| - |
|
|
| 10 |
|
|
| - |
|
|
| - |
|
|
| (10 | ) |
| - |
|
| Contributions from non- controlling interests of consolidated partnerships |
|
| - |
|
|
| - |
|
|
| - |
|
|
| 1 |
|
|
| - |
|
| - |
|
| Distributions to non-controlling interests |
|
| - |
|
|
| - |
|
|
| - |
|
|
| (4 | ) |
|
| - |
|
| 709.4 |
|
| Balance, December 31, 2012 |
| $ | 1 |
|
| $ | 6,812 |
|
| $ | 12 |
|
| $ | 34 |
|
| $ | 158 |
|
| - |
|
| Net income |
|
| - |
|
|
| 317 |
|
|
| - |
|
|
| 4 |
|
|
| 4 |
|
| - |
|
| Other changes in ownership |
|
| - |
|
|
| (38 | ) |
|
| - |
|
|
| (3 | ) |
|
| 38 |
|
| - |
|
| Foreign currency translation and other comprehensive income (loss) of unconsolidated affiliates |
|
| - |
|
|
| - |
|
|
| (18 | ) |
|
| - |
|
|
| - |
|
| - |
|
| Change in fair value of derivative instruments |
|
| - |
|
|
| - |
|
|
| (3 | ) |
|
| - |
|
|
| - |
|
| 28.1 |
|
| Common OP unit issuances |
|
| - |
|
|
| 477 |
|
|
| - |
|
|
| - |
|
|
| - |
|
| 1.1 |
|
| Units issued to Host Inc. for the comprehensive stock and employee stock purchase plans |
|
| - |
|
|
| 8 |
|
|
| - |
|
|
| - |
|
|
| - |
|
| - |
|
| Distributions on common OP units |
|
| - |
|
|
| (346 | ) |
|
| - |
|
|
| - |
|
|
| (4 | ) |
| 0.3 |
|
| Redemptions of limited partner interests for common stock |
|
| - |
|
|
| 6 |
|
|
| - |
|
|
| - |
|
|
| (6 | ) |
| - |
|
| Contributions from non- controlling interests of consolidated partnerships |
|
| - |
|
|
| - |
|
|
| - |
|
|
| 7 |
|
|
| - |
|
| - |
|
| Distributions to non-controlling interests |
|
| - |
|
|
| - |
|
|
| - |
|
|
| (8 | ) |
|
| - |
|
| 738.9 |
|
| Balance, December 31, 2013 |
| $ | 1 |
|
| $ | 7,236 |
|
| $ | (9 | ) |
| $ | 34 |
|
| $ | 190 |
|
| - |
|
| Net income |
|
| - |
|
|
| 732 |
|
|
| - |
|
|
| 6 |
|
|
| 9 |
|
| - |
|
| Other changes in ownership |
|
| - |
|
|
| (39 | ) |
|
| - |
|
|
| (1 | ) |
|
| 38 |
|
| - |
|
| Foreign currency translation and other comprehensive income (loss) of unconsolidated affiliates |
|
| - |
|
|
| - |
|
|
| (60 | ) |
|
| - |
|
|
| - |
|
| - |
|
| Change in fair value of derivative instruments |
|
| - |
|
|
| - |
|
|
| 19 |
|
|
| - |
|
|
| - |
|
| 0.2 |
|
| Common OP unit issuances |
|
| - |
|
|
| 4 |
|
|
| - |
|
|
| - |
|
|
| - |
|
| 0.5 |
|
| Units issued to Host Inc. for the comprehensive stock and employee stock purchase plans |
|
| - |
|
|
| 13 |
|
|
| - |
|
|
| - |
|
|
| - |
|
| - |
|
| Distributions on common OP units |
|
| - |
|
|
| (567 | ) |
|
| - |
|
|
| - |
|
|
| (6 | ) |
| 0.3 |
|
| Redemptions of limited partner interests for common stock |
|
| - |
|
|
| 6 |
|
|
| - |
|
|
| - |
|
|
| (6 | ) |
| - |
|
| Contributions from non- controlling interests of consolidated partnerships |
|
| - |
|
|
| - |
|
|
| - |
|
|
| 1 |
|
|
| - |
|
| - |
|
| Distributions to non-controlling interests |
|
| - |
|
|
| - |
|
|
| - |
|
|
| (8 | ) |
|
| - |
|
| 739.9 |
|
| Balance, December 31, 2014 |
| $ | 1 |
|
| $ | 7,385 |
|
| $ | (50 | ) |
| $ | 32 |
|
| $ | 225 |
|
|
|
|
|
|
|
|
|
|
|
|
|
|
|
|
|
|
|
|
|
|
|
|
|
|
See Notes to Consolidated Financial Statements.
96
HOST HOTELS & RESORTS, L.P. AND SUBSIDIARIES
CONSOLIDATED STATEMENTS OF CASH FLOWS
Years Ended December 31, 2014, 2013 and 2012
(in millions)
|
| 2014 |
|
| 2013 |
|
| 2012 |
| |||
OPERATING ACTIVITIES |
|
|
|
|
|
|
|
|
|
|
|
|
Net income |
| $ | 747 |
|
| $ | 325 |
|
| $ | 63 |
|
Adjustments to reconcile to cash provided by operations: |
|
|
|
|
|
|
|
|
|
|
|
|
Discontinued operations: |
|
|
|
|
|
|
|
|
|
|
|
|
Gain on dispositions |
|
| - |
|
|
| (97 | ) |
|
| (48 | ) |
Depreciation |
|
| - |
|
|
| 10 |
|
|
| 32 |
|
Depreciation and amortization |
|
| 701 |
|
|
| 697 |
|
|
| 722 |
|
Amortization of finance costs, discounts and premiums, net |
|
| 24 |
|
|
| 25 |
|
|
| 13 |
|
Non-cash loss on extinguishment of debt |
|
| 2 |
|
|
| 13 |
|
|
| 9 |
|
Stock compensation expense |
|
| 22 |
|
|
| 18 |
|
|
| 16 |
|
Deferred income taxes |
|
| (1 | ) |
|
| 6 |
|
|
| 17 |
|
Gain on sale of assets |
|
| (236 | ) |
|
| (33 | ) |
|
| (13 | ) |
(Gain) loss on foreign currency transactions and derivatives |
|
| 1 |
|
|
| (3 | ) |
|
| 4 |
|
Gain on property insurance settlement |
|
| (1 | ) |
|
| - |
|
|
| (2 | ) |
Equity in (earnings) losses of affiliates |
|
| (26 | ) |
|
| 17 |
|
|
| (2 | ) |
Change in due from managers |
|
| (17 | ) |
|
| 21 |
|
|
| (42 | ) |
Change in restricted cash for operating activities |
|
| 25 |
|
|
| - |
|
|
| - |
|
Changes in other assets |
|
| (34 | ) |
|
| 39 |
|
|
| 11 |
|
Changes in other liabilities |
|
| (57 | ) |
|
| (19 | ) |
|
| 1 |
|
Cash provided by operating activities |
|
| 1,150 |
|
|
| 1,019 |
|
|
| 781 |
|
|
|
|
|
|
|
|
|
|
|
|
|
|
INVESTING ACTIVITIES |
|
|
|
|
|
|
|
|
|
|
|
|
Proceeds from sales of assets, net |
|
| 497 |
|
|
| 643 |
|
|
| 160 |
|
Return of investment in affiliates |
|
| 42 |
|
|
| - |
|
|
| 3 |
|
Acquisitions |
|
| (138 | ) |
|
| (166 | ) |
|
| (441 | ) |
Deferred sale proceeds received from HPT |
|
| - |
|
|
| - |
|
|
| 51 |
|
Advances to and investments in affiliates |
|
| (65 | ) |
|
| (74 | ) |
|
| (132 | ) |
Return on mortgage loan investment |
|
| - |
|
|
| - |
|
|
| 82 |
|
Capital expenditures: |
|
|
|
|
|
|
|
|
|
|
|
|
Renewals and replacements |
|
| (324 | ) |
|
| (303 | ) |
|
| (366 | ) |
Redevelopment and acquisition-related investments |
|
| (112 | ) |
|
| (133 | ) |
|
| (272 | ) |
New development |
|
| (13 | ) |
|
| (19 | ) |
|
| (6 | ) |
Change in furniture, fixtures and equipment ("FF&E") replacement fund |
|
| 18 |
|
|
| (23 | ) |
|
| 16 |
|
Property insurance proceeds |
|
| 2 |
|
|
| - |
|
|
| 19 |
|
Cash used in investing activities |
|
| (93 | ) |
|
| (75 | ) |
|
| (886 | ) |
|
|
|
|
|
|
|
|
|
|
|
|
|
FINANCING ACTIVITIES |
|
|
|
|
|
|
|
|
|
|
|
|
Financing costs |
|
| (4 | ) |
|
| (4 | ) |
|
| (18 | ) |
Issuances of debt |
|
| 4 |
|
|
| 550 |
|
|
| 900 |
|
Draws on credit facility |
|
| 4 |
|
|
| 393 |
|
|
| 231 |
|
Term loan issuance |
|
| - |
|
|
| - |
|
|
| 500 |
|
Repayment of credit facility |
|
| (225 | ) |
|
| (207 | ) |
|
| (89 | ) |
Repurchase/redemption of senior notes |
|
| (150 | ) |
|
| (801 | ) |
|
| (1,795 | ) |
Mortgage debt and other prepayments and scheduled maturities |
|
| (384 | ) |
|
| (411 | ) |
|
| (113 | ) |
Scheduled principal repayments |
|
| - |
|
|
| (2 | ) |
|
| (2 | ) |
Issuance of common OP units |
|
| 4 |
|
|
| 303 |
|
|
| 274 |
|
Distributions on common OP units |
|
| (475 | ) |
|
| (317 | ) |
|
| (190 | ) |
Contributions from non-controlling interests |
|
| 1 |
|
|
| 7 |
|
|
| 1 |
|
Distributions to non-controlling interests |
|
| (8 | ) |
|
| (8 | ) |
|
| (4 | ) |
Change in restricted cash for financing activities |
|
| 7 |
|
|
| 4 |
|
|
| - |
|
Cash used in financing activities |
|
| (1,226 | ) |
|
| (493 | ) |
|
| (305 | ) |
Effects of exchange rate changes on cash held |
|
| (8 | ) |
|
| (7 | ) |
|
| 1 |
|
INCREASE (DECREASE) IN CASH AND CASH EQUIVALENTS |
|
| (177 | ) |
|
| 444 |
|
|
| (409 | ) |
CASH AND CASH EQUIVALENTS, BEGINNING OF PERIOD |
|
| 861 |
|
|
| 417 |
|
|
| 826 |
|
CASH AND CASH EQUIVALENTS, END OF PERIOD |
| $ | 684 |
|
| $ | 861 |
|
| $ | 417 |
|
|
|
|
|
|
|
|
|
|
|
|
|
|
See Notes to Consolidated Financial Statements.
97
HOST HOTELS & RESORTS, L.P. AND SUBSIDIARIES
CONSOLIDATED STATEMENTS OF CASH FLOWS
Years Ended December 31, 2014, 2013 and 2012
(in millions)
Supplemental schedule of noncash investing and financing activities:
During 2014, 2013 and 2012, non-controlling partners converted common operating partnership units ("OP units") valued at $6 million, $6 million and $10 million, respectively, in exchange for 0.3 million, 0.3 million and 0.6 million shares, respectively, of Host Inc. common stock.
In March 2013, holders of approximately $174 million of the 3.25% Exchangeable Debentures elected to exchange their debentures for approximately 11.7 million shares of Host Inc. common stock. In connection with the debentures exchanged for Host Inc. common stock, Host L.P. issued 11.5 million common OP units.
In November 2012, we contributed land with a book value of $11 million and a fair value of $36 million to a joint venture with Hyatt Residential Group to develop a vacation ownership project in Maui, Hawaii. We recorded an initial investment of $8 million related to our 67% ownership in the joint venture and an initial gain of $8 million related to the portion of the land attributable to Hyatt Residential Group's 33% interest, for which we received cash of $12 million.
See Notes to Consolidated Financial Statements.
98
HOST HOTELS & RESORTS, INC., HOST HOTELS & RESORTS, L.P., AND SUBSIDIARIES
NOTES TO CONSOLIDATED FINANCIAL STATEMENTS
1. | Summary of Significant Accounting Policies |
Description of Business
Host Hotels & Resorts, Inc. operates as a self-managed and self-administered real estate investment trust, or REIT, with its operations conducted solely through Host Hotels & Resorts, L.P. Host Hotels & Resorts, L.P., a Delaware limited partnership, operates through an umbrella partnership structure, with Host Hotels & Resorts, Inc., a Maryland corporation, as its sole general partner. In the notes to the financial statements, we use the terms "we" or "our" to refer to Host Hotels & Resorts, Inc. and Host Hotels & Resorts, L.P. together, unless the context indicates otherwise. We also use the term "Host Inc." to refer specifically to Host Hotels & Resorts, Inc. and the term "Host L.P." to refer specifically to Host Hotels & Resorts, L.P. in cases where it is important to distinguish between Host Inc. and Host L.P. Host Inc. holds approximately 99% of Host L.P.'s partnership interests, or OP units.
Consolidated Portfolio
As of December 31, 2014, the hotels in our consolidated portfolio are located in the following countries:
| Hotels |
| |
United States |
| 97 |
|
Australia |
| 1 |
|
Brazil |
| 3 |
|
Canada |
| 3 |
|
Chile |
| 2 |
|
Mexico |
| 1 |
|
New Zealand |
| 7 |
|
Total |
| 114 |
|
European Joint Venture
We own a non-controlling interest in a joint venture in Europe ("Euro JV") that owns hotels in two separate funds. We own a 32.1% interest in the first fund ("Euro JV Fund I") (10 hotels) and a 33.4% interest in the second fund ("Euro JV Fund II") (9 hotels).
As of December 31, 2014, the Euro JV hotels are located in the following countries:
| Hotels |
| |
Belgium |
| 3 |
|
France |
| 4 |
|
Germany |
| 2 |
|
Italy |
| 3 |
|
Poland |
| 1 |
|
Spain |
| 2 |
|
Sweden |
| 1 |
|
The Netherlands |
| 2 |
|
United Kingdom |
| 1 |
|
Total |
| 19 |
|
Asia/Pacific Joint Venture
We own a 25% non-controlling interest in a joint venture in Asia ("Asia/Pacific JV") that owns the 278-room Four Points by Sheraton, Perth, in Australia. The Asia/Pacific JV also owns a non-controlling interest in a joint venture in India that is investing in seven hotels, two in Bangalore, one in Chennai and four that are in various stages of development.
Basis of Presentation and Principles of Consolidation
The accompanying consolidated financial statements include the consolidated accounts of Host Inc., Host L.P. and their subsidiaries and controlled affiliates, including joint ventures and partnerships. We consolidate subsidiaries when we have the ability to control the entity. For the majority of our hotel and real estate investments, we consider those control rights to be (i) approval or
99
HOST HOTELS & RESORTS, INC., HOST HOTELS & RESORTS, L.P., AND SUBSIDIARIES
NOTES TO CONSOLIDATED FINANCIAL STATEMENTS
amendment of developments plans, (ii) financing decisions, (iii) approval or amendments of operating budgets, and (iv) investment strategy decisions. For those partnerships and joint ventures where we are the general partner, we review the rights of the limited partners to determine if those rights would overcome the presumption of control as the general partner. Limited partner rights which would overcome presumption of control by the general partner include the substantive ability to dissolve (liquidate) the limited partnership or otherwise remove the general partners without cause and substantive participating rights over activities considered most significant to the business of the partnership or joint venture, primarily voting rights.
We also evaluate our subsidiaries to determine if they are variable interest entities ("VIEs"). If a subsidiary is a VIE, it is subject to the consolidation framework specifically for VIEs. Typically, the entity that has the power to direct the activities that most significantly impact economic performance would consolidate the VIE. We consider an entity a VIE if equity investors own an interest therein that does not have the characteristics of a controlling financial interest or if such investors do not have sufficient equity at risk for the entity to finance its activities without additional subordinated financial support. We review our subsidiaries and affiliates at least annually to determine if (i) they should be considered VIEs, and (ii) whether we should change our consolidation determination based on changes in the characteristics of these entities.
Use of Estimates in the Preparation of Financial Statements
The preparation of financial statements in conformity with U.S. generally accepted accounting principles, or GAAP, requires management to make estimates and assumptions that affect the reported amounts of assets and liabilities and disclosure of contingent assets and liabilities at the date of the financial statements and the reported amounts of revenues and expenses during the reporting period. Actual results could differ from those estimates.
Cash and Cash Equivalents
We consider all highly liquid investments with a maturity of three months or less at the date of purchase to be cash equivalents.
Restricted Cash
Restricted cash includes reserves for debt service, real estate taxes, insurance, and furniture, fixtures and equipment replacement, as well as cash collateral and excess cash flow deposits due to mortgage debt agreement restrictions and provisions, and a reserve required for potential legal damages. For purposes of the statements of cash flows, changes in restricted cash caused by changes in required legal reserves are shown as operating activities. Changes in restricted cash caused by using such funds for furniture, fixtures and equipment replacement are shown as investing activities. The remaining changes in restricted cash are the direct result of restrictions under our loan agreements and are reflected in cash flows from financing activities.
Property and Equipment
Generally, property and equipment is recorded at cost. For properties we develop, cost includes interest and real estate taxes incurred during construction. For property and equipment acquired in a business combination, we record the assets based on their fair value as of the acquisition date. Replacements and improvements and capital leases are capitalized, while repairs and maintenance are expensed as incurred. We depreciate our property and equipment using the straight-line method over the estimated useful lives of the assets. Leasehold improvements are amortized over the shorter of the lease term or the useful lives of the related assets.
We capitalize certain inventory (such as china, glass, silver, and linen) at the time of a hotel opening or acquisition, or when significant inventory is purchased (in conjunction with a major rooms renovation or when the number of rooms or meeting space at a hotel is expanded). These amounts are then amortized over the estimated useful life of three years. Subsequent replacement purchases are expensed when placed in service.
We maintain a furniture, fixtures and equipment replacement fund for renewal and replacement capital expenditures at certain hotels, which generally is funded with 5% of property revenues.
Impairment testing. We analyze our consolidated properties for impairment throughout the year when events or circumstances occur that indicate the carrying value may not be recoverable. We consider a property to be impaired when the sum of the future undiscounted cash flows over our remaining estimated holding period is less than the carrying value of the asset. We test for impairment in several situations, including when a property has a current or projected loss from operations, when it becomes more likely than not that a hotel will be sold before the end of its previously estimated useful life, or when other events, trends, contingencies or changes in circumstances indicate that a triggering event has occurred and the carrying value of an asset may not be
100
HOST HOTELS & RESORTS, INC., HOST HOTELS & RESORTS, L.P., AND SUBSIDIARIES
NOTES TO CONSOLIDATED FINANCIAL STATEMENTS
recoverable. For impaired assets, we record an impairment expense equal to the excess of the carrying value of the asset over its fair value. To the extent that a property has a substantial remaining estimated useful life and management does not believe that it is more likely than not the property will be disposed of prior to the end of its useful life, it would be unusual for undiscounted cash flows to be insufficient to recover the property's carrying value. In the absence of other factors, we assume that the estimated life is equal to the GAAP depreciable life because of the continuous property maintenance and improvement capital expenditures required under our management agreements. We adjust our assumptions with respect to the remaining useful life of the property if situations dictate otherwise, such as an expiring ground lease, or that it is more likely than not that the asset will be sold prior to its previously expected useful life. We also consider the effect of regular renewal and replacement capital expenditures on the estimated life of our properties, including critical infrastructure, which regularly is maintained and then replaced at the end of its useful life.
In the evaluation of the impairment of our assets, we make many assumptions and estimates, including:
· | projected cash flows, both from operations and the eventual disposition; |
· | the expected useful life and holding period of the asset; |
· | the future required capital expenditures; and |
· | fair values, including consideration of capitalization rates, discount rates and comparable selling prices, as well as available third-party appraisals. |
While we consider all of the above indicators as preliminary indicators to determine if the carrying value may not be recovered by undiscounted cash flows, we reviewed the actual year-to-date and the projected cash flows from operations in order to identify properties with actual or projected annual operating losses or minimal operating profit as of December 31, 2014. The projected cash flows consider items such as booking pace, occupancy, room rate and property-level operating costs. As a result of our review, we identified two properties that required further consideration of property and market specific conditions or factors to determine if the property was impaired using an undiscounted cash flow analysis. Management considered a range of RevPAR and operating margins compared to prior years' operating results in evaluating the probability-weighted projected cash flows from operations. To appropriately evaluate if the carrying value of the assets was recoverable, we projected cash flows such that the individual properties would return to normalized levels of operations generally within five years and thereafter grow at a stabilized rate of approximately 3% over the remaining estimated lives of the properties. This stabilized growth rate is lower than the projected growth rate for the urban upper upscale properties, which we believe is most representative of our portfolio, over the period from 2013 through 2023. Based on this testing, none of the properties previously identified required further analysis. Management believes its assumptions and estimates reflect current market conditions. During 2014, 2013 and 2012, we recognized impairment expenses of $6 million, $1 million and $60 million, respectively, on one property each year, which impairment expenses are included in depreciation and amortization, based on changes in estimated holding periods.
Classification of Assets as "Held for Sale". We will classify a hotel as held for sale when the sale thereof is probable, will be completed within one year and actions to complete the sale are unlikely to change or that the sale will not occur. This policy is consistent with our experience with real estate transactions under which the timing and final terms of a sale are frequently not known until purchase agreements are executed, the buyer has a significant deposit at risk and no financing contingencies exist which could prevent the transaction from being completed in a timely manner. We typically classify assets as held for sale when all of the following conditions are met:
· | Host Inc.'s Board of Directors has approved the sale (to the extent that the dollar amount of the sale requires Board approval); |
· | a binding agreement to sell the property has been signed under which the buyer has committed a significant amount of nonrefundable cash; and |
· | no significant financing contingencies exist which could prevent the transaction from being completed in a timely manner. |
If these criteria are met, we will cease recording depreciation and will record an impairment expense if the fair value less costs to sell is less than the carrying amount of the hotel. We will classify the assets and related liabilities as held for sale on the balance sheet. Gains on sales of properties are recognized at the time of sale or deferred and recognized as income in subsequent periods as conditions requiring deferral are satisfied or expire without further cost to us.
Discontinued Operations. In April 2014, the Financial Accounting Standards Board issued Accounting Standards Update (ASU) 2014-08 Presentation of Financial Statements (Topic 205) and Property, Plant and Equipment (Topic 360) - Reporting Discontinued
101
HOST HOTELS & RESORTS, INC., HOST HOTELS & RESORTS, L.P., AND SUBSIDIARIES
NOTES TO CONSOLIDATED FINANCIAL STATEMENTS
Operations and Disclosure of Disposal of Components of an Entity ("ASU 2014-08 Reporting for Discontinued Operations"). Under this standard, a disposal of a component of an entity or a group of components of an entity is required to be reported in discontinued operations only if the disposal represents a strategic shift that has, or will have, a major effect on an entity's operations and financial results. In addition, it requires an entity to present, for each comparative period, the assets and liabilities of a disposal group that includes a discontinued operation separately in the asset and liability sections, respectively, of the statement of financial position. As a result, the operations through the date of disposal and the gain or loss on sale of properties will be included in continuing operations, unless the sale represents a strategic shift. We adopted this standard as of January 1, 2014. No prior year restatements are permitted for this change in policy.
Asset retirement obligations. We recognize the fair value of any liability for conditional asset retirement obligations, including environmental remediation liabilities, when incurred, which generally is upon acquisition, construction, or development and/or through the normal operation of the asset, if sufficient information exists with which to reasonably estimate the fair value of the obligation.
Depreciation and Amortization Expense. Depreciation expense is based on the estimated useful life of our assets and amortization expense for leasehold improvements is based on the shorter of the lease term or the estimated useful life of the related assets. The lives of the assets are based on a number of assumptions, including cost and timing of capital expenditures to maintain and refurbish the assets, as well as specific market and economic conditions. While management believes its estimates are reasonable, a change in the estimated lives could affect depreciation expense and net income (loss) or the gain or loss on the sale of any of our hotels.
Intangible Assets and Liabilities
In conjunction with our acquisitions, we may identify intangible assets and liabilities. Identifiable intangible assets and liabilities typically include contracts, including ground and retail leases and management and franchise agreements, which are recorded at fair value. These contract values are based on the present value of the difference between contractual amounts to be paid pursuant to the contracts acquired and our estimate of the fair value of rates for corresponding contracts measured over the period equal to the remaining non-cancelable term of the contract. Intangible assets and liabilities are amortized using the straight-line method over the remaining non-cancelable term of the related agreements.
Non-Controlling Interests
Other Consolidated Partnerships. As of December 31, 2014, we consolidate six majority-owned partnerships that have third-party, non-controlling ownership interests. The third-party partnership interests are included in non-controlling interest-other consolidated partnerships on the consolidated balance sheets and totaled $32 million and $34 million as of December 31, 2014 and 2013, respectively. Two of the partnerships have finite lives that terminate between 2081 and 2095, and the associated non-controlling interests are mandatorily redeemable at the end of, but not prior to, the finite life. At December 31, 2014 and 2013, the fair values of the non-controlling interests in the partnerships with finite lives were approximately $85 million and $68 million, respectively.
Net income (loss) attributable to non-controlling interests of consolidated partnerships is included in our determination of net income (loss). Net income attributable to non-controlling interests of third parties is $6 million, $4 million and $1 million for 2014, 2013 and 2012, respectively.
Host Inc.'s treatment of the non-controlling interests of Host L.P. Host Inc. adjusts the non-controlling interests of Host L.P. each period so that the amount presented equals the greater of its carrying value based on its historical cost or its redemption value. The historical cost is based on the proportional relationship between the historical cost of equity held by our common stockholders relative to that of the unitholders of Host L.P. The redemption value is based on the amount of cash or Host Inc. stock, at our option, that would be paid to the non-controlling interests of Host L.P. if it were terminated. We have estimated that the redemption value is equivalent to the number of shares issuable upon conversion of the OP units currently owned by unrelated third parties (one OP unit may be exchanged for 1.021494 shares of Host Inc. common stock) valued at the market price of Host Inc. common stock at the balance sheet date. Non-controlling interests of Host L.P. are classified in the mezzanine section of the balance sheet as they do not meet the requirements for equity classification because the redemption feature requires the delivery of registered shares.
102
HOST HOTELS & RESORTS, INC., HOST HOTELS & RESORTS, L.P., AND SUBSIDIARIES
NOTES TO CONSOLIDATED FINANCIAL STATEMENTS
The table below details the historical cost and redemption values for the non-controlling interests:
|
| As of December 31, |
| |||||
|
| 2014 |
|
| 2013 |
| ||
OP units outstanding (millions) |
|
| 9.3 |
|
|
| 9.5 |
|
Market price per Host Inc. common share |
| $ | 23.77 |
|
| $ | 19.44 |
|
Shares issuable upon conversion of one OP unit |
|
| 1.021494 |
|
|
| 1.021494 |
|
Redemption value (millions) |
| $ | 225 |
|
| $ | 190 |
|
Historical cost (millions) |
|
| 94 |
|
|
| 95 |
|
Book value (millions) (1) |
|
| 225 |
|
|
| 190 |
|
___________ |
|
|
|
|
|
|
|
|
(1) The book value recorded is equal to the greater of the redemption value or the historical cost.
Net income (loss) is allocated to the non-controlling interests of Host L.P. based on their weighted average ownership percentage during the period. Net income attributable to Host Inc. has been reduced by the amount attributable to non-controlling interests in Host L.P., which totaled $9 million, $4 million and $1 million for 2014, 2013 and 2012, respectively.
Investments in Affiliates
Other-than-Temporary Impairment of an Investment. We perform an analysis for our equity method investments for impairment based on the occurrence of triggering events that would indicate that the carrying amount of the investment exceeds its fair value on an other-than-temporary basis. Triggering events can include a decline in distributable cash flows from the investment, a change in the expected useful life or other significant events which would decrease the value of the investment. Our investments primarily consist of joint ventures which own hotel properties; therefore, generally we will have few observable inputs and will determine fair value based on a discounted cash flow analysis of the investment, as well as consideration of the impact of other elements (i.e. control premiums, etc.). We use certain inputs, such as available third-party appraisals and forecast net operating income for the hotel properties, to estimate the expected cash flows. If an equity method investment is impaired and that impairment is determined to be other than temporary, an expense is recorded for the difference between the fair value and the carrying amount of the investment. No other-than-temporary impairment was recorded in 2014, 2013, or 2012.
Distributions from Investments in Affiliates. We classify the distributions from our equity investments in the statements of cash flows based upon an evaluation of the specific facts and circumstances of each distribution. For example, distributions from cash generated by property operations are classified as cash flows from operating activities. However, distributions received as a result of property sales are classified as cash flows from investing activities.
Income Taxes
Host Inc. has elected to be treated as a REIT effective January 1, 1999, pursuant to the U.S. Internal Revenue Code of 1986, as amended. It is our current intention to adhere to the REIT qualification requirements and to maintain our qualification for taxation as a REIT. A corporation that elects REIT status and meets certain tax law requirements regarding the distribution of its taxable income to its stockholders as prescribed by applicable tax laws and complies with certain other requirements (relating primarily to the composition of its assets and the sources of its revenues) generally is not subject to federal and state income taxation on its operating income that is distributed to its stockholders. As a partnership for federal income tax purposes, Host L.P. is not subject to federal income tax. Host L.P. is, however, subject to state, local and foreign income and franchise tax in certain jurisdictions. In addition to paying federal and state income tax on any retained income, one of our subsidiary REITs is subject to a tax on "built-in gains" on sales of certain assets. Additionally, each of the Host L.P. taxable REIT subsidiaries is taxable as a regular C corporation, subject to federal, state and foreign income tax. Our consolidated income tax provision or benefit includes the income tax provision or benefit related to the operations of our taxable REIT subsidiaries, and state, local, and foreign income and franchise taxes incurred by Host L.P.
Deferred Tax Assets and Liabilities. Under the partnership agreement, Host L.P. generally is required to reimburse Host Inc. for any tax payments it is required to make. Accordingly, the tax information included herein represents disclosures regarding Host Inc. and its subsidiaries. Deferred tax assets and liabilities are recognized for the estimated future tax consequences attributable to differences between the financial statement carrying amounts of existing assets and liabilities and their respective tax bases, and for net operating loss, capital loss, and tax credit carryovers. Deferred tax assets and liabilities are measured using enacted tax rates in effect for the year in which such amounts are expected to be realized or settled. The effect on deferred tax assets and liabilities from a change in tax rates is recognized in earnings in the period when the new rate is enacted. However, deferred tax assets are recognized
103
HOST HOTELS & RESORTS, INC., HOST HOTELS & RESORTS, L.P., AND SUBSIDIARIES
NOTES TO CONSOLIDATED FINANCIAL STATEMENTS
only to the extent that it is more likely than not that they will be realized based on consideration of available evidence, including future reversals of existing taxable temporary differences, future projected taxable income and tax planning strategies.
GAAP prescribes a recognition threshold and measurement attribute for the financial statement recognition and measurement of a tax position taken in a tax return. We must determine whether it is "more-likely-than-not" that a tax position will be sustained upon examination, including resolution of any related appeals or litigation processes, based on the technical merits of the position. Once it is determined that a position meets the more-likely-than-not recognition threshold, the position is measured at the largest amount of benefit that is greater than 50% likely of being realized upon settlement in order to determine the amount of benefit to recognize in the financial statements. This accounting standard applies to all tax positions related to income taxes. We recognize accrued interest related to unrecognized tax benefits in interest expense and penalties in operating expenses.
Deferred Charges
Financing costs related to long-term debt are deferred and amortized over the remaining life of the debt using the effective interest method.
Foreign Currency Translation
As of December 31, 2014, our international operations consist of hotels located in Australia, Brazil, Canada, Chile, Mexico, and New Zealand, as well as investments in the Euro JV and the Asia/Pacific JV. The financial statements of these hotels and our investments therein are maintained in their functional currency, which generally is the local currency, and their operations are translated to U.S. dollars using the average exchange rates for the period. The assets and liabilities of the hotels and the investments therein are translated to U.S. dollars using the exchange rate in effect at the balance sheet date. The resulting translation adjustments are reflected in other comprehensive income (loss).
Foreign currency transactions are recorded in the functional currency for each entity using the exchange rates prevailing at the dates of the transactions. Assets and liabilities denominated in foreign currencies are remeasured at period end exchange rates. The resulting exchange differences are recorded in gain (loss) on foreign currency transactions and derivatives on the accompanying consolidated statements of operations, except when recorded in other comprehensive income (loss) as qualifying net investment hedges.
Derivative Instruments
We are subject to market exposures in several aspects of our business and may enter into derivative instruments in order to hedge the effect of these market exposures on our operations. Potential market exposures for which we may use derivative instruments to hedge include: (i) changes in the fair value of our international investments due to fluctuations in currency exchange rates, (ii) changes in the fair value of our fixed-rate debt due to changes in the underlying interest rates, and (iii) variability in interest payments due to changes in the underlying interest rate for our floating-rate debt. Derivative instruments are subject to fair value reporting at each reporting date and the increase or decrease in fair value is recorded in net income (loss) or other comprehensive income (loss), based on the applicable hedge accounting guidance. We estimate the fair value of these instruments through the use of third party valuations, which utilize the market standard methodology of netting the discounted future cash receipts and the discounted future expected cash payments. Prior to entering into the derivative instrument, we evaluate whether the transaction will qualify for hedge accounting and continue to evaluate hedge effectiveness throughout the life of the instrument. Derivative instruments that meet the requirements for hedge accounting are recorded on the balance sheet at fair value, with offsetting changes recorded to net income (loss) or other comprehensive income (loss), based on the applicable hedge accounting guidance. We incorporate credit valuation adjustments to reflect, as applicable, our own nonperformance risk or the respective counterparty's nonperformance risk in the fair value measurements. In adjusting the fair value of our derivative instruments for the effect of nonperformance risk, we have considered the impact of netting any applicable credit enhancements, such as collateral postings, thresholds, mutual puts and accumulated guarantees. The variable cash flow streams are based on an expectation of future interest and exchange rates derived from observed market interest and exchange rate curves. The values of these instruments will change over time as cash receipts and payments are made and as market conditions change.
104
HOST HOTELS & RESORTS, INC., HOST HOTELS & RESORTS, L.P., AND SUBSIDIARIES
NOTES TO CONSOLIDATED FINANCIAL STATEMENTS
Accumulated Other Comprehensive Income (Loss)
The components of total accumulated other comprehensive income (loss) in the balance sheets are as follows (in millions):
|
| As of December 31, |
| |||||
|
| 2014 |
|
| 2013 |
| ||
Gain on foreign currency forward contracts |
| $ | 19 |
|
| $ | - |
|
Loss on interest rate swap cash flow hedges |
|
| (2 | ) |
|
| (2 | ) |
Foreign currency translation |
|
| (67 | ) |
|
| (7 | ) |
Total accumulated other comprehensive loss |
| $ | (50 | ) |
| $ | (9 | ) |
There were no material amounts reclassified out of accumulated other comprehensive income (loss) to net income for the year ended December 31, 2014 and 2013. During 2012, we reclassified a net gain of $2 million that had been recognized previously in gain on foreign currency forward sale contracts in other comprehensive income related to two foreign currency denominated subsidiaries that were substantially liquidated during the year and recognized such gain in gain (loss) on foreign currency transactions and derivatives on our consolidated statement of operations.
Revenues
Our results of operations include revenues and expenses of our hotels. Revenues are recognized when the services are provided. Additionally, we collect sales, use, occupancy and similar taxes at our hotels, which we present on a net basis (excluded from revenues) on our statements of operations.
Fair Value Measurement
In evaluating the fair value of both financial and non-financial assets and liabilities, GAAP outlines a valuation framework and creates a fair value hierarchy that distinguishes between market assumptions based on market data ("observable inputs") and a reporting entity's own assumptions about market data ("unobservable inputs"). Fair value is defined as the price that would be received to sell an asset or paid to transfer a liability at the measurement date in an orderly transaction (an "exit price"). Assets and liabilities are measured using inputs from three levels of the fair value hierarchy. The three levels are as follows:
Level 1 - Inputs are quoted prices (unadjusted) in active markets for identical assets or liabilities that we have the ability to access at the measurement date. An active market is defined as a market in which transactions occur with sufficient frequency and volume to provide pricing on an ongoing basis.
Level 2 - Inputs include quoted prices in active markets for similar assets and liabilities, quoted prices for identical or similar assets or liabilities in markets that are not active (markets with few transactions), inputs other than quoted prices that are observable for the asset or liability (i.e., interest rates, yield curves, etc.), and inputs that are derived principally from or corroborated by observable market data correlation or other means.
Level 3 - Unobservable inputs reflect our assumptions about the pricing of an asset or liability when observable inputs are not available.
Host Inc. Earnings Per Common Share
Basic earnings per common share is computed by dividing net income attributable to common stockholders by the weighted average number of shares of Host Inc. common stock outstanding. Diluted earnings per common share is computed by dividing net income attributable to common stockholders, as adjusted for potentially dilutive securities, by the weighted average number of shares of Host Inc. common stock outstanding plus other potentially dilutive securities. Dilutive securities may include shares granted under comprehensive stock plans, other non-controlling interests that have the option to convert their limited partnership interests to common OP units and convertible debt securities. No effect is shown for any securities that are anti-dilutive.
105
HOST HOTELS & RESORTS, INC., HOST HOTELS & RESORTS, L.P., AND SUBSIDIARIES
NOTES TO CONSOLIDATED FINANCIAL STATEMENTS
The calculation of basic and diluted earnings per common share is shown below (in millions, except per share amounts):
|
| Year ended December 31, |
| |||||||||
|
| 2014 |
|
| 2013 |
|
| 2012 |
| |||
Net income |
| $ | 747 |
|
| $ | 325 |
|
| $ | 63 |
|
Less: Net income attributable to non-controlling interests |
|
| (15 | ) |
|
| (8 | ) |
|
| (2 | ) |
Net income attributable to Host Inc. |
|
| 732 |
|
|
| 317 |
|
|
| 61 |
|
Assuming conversion of exchangeable senior debentures |
|
| 27 |
|
|
| - |
|
|
| - |
|
Diluted income attributable to Host Inc. |
| $ | 759 |
|
| $ | 317 |
|
| $ | 61 |
|
|
|
|
|
|
|
|
|
|
|
|
|
|
Basic weighted average shares outstanding |
|
| 755.4 |
|
|
| 744.4 |
|
|
| 718.2 |
|
Assuming weighted average shares for conversion of exchangeable senior debentures |
|
| 30.3 |
|
|
| 2.4 |
|
|
| - |
|
Assuming distribution of common shares granted under the comprehensive stock plans, less shares assumed purchased at market |
|
| 1.1 |
|
|
| 1.1 |
|
|
| 1.4 |
|
Diluted weighted average shares outstanding (1) |
|
| 786.8 |
|
|
| 747.9 |
|
|
| 719.6 |
|
|
|
|
|
|
|
|
|
|
|
|
|
|
Basic earnings per common share |
| $ | .97 |
|
| $ | .43 |
|
| $ | .08 |
|
Diluted earnings per common share |
| $ | .96 |
|
| $ | .42 |
|
| $ | .08 |
|
___________ |
|
|
|
|
|
|
|
|
|
|
|
|
(1) | There were approximately 30 million and 40 million potentially dilutive shares as of December 31, 2013 and 2012, respectively, related to our exchangeable senior debentures, which shares were not included in the computation of diluted earnings per share because to do so would have been anti-dilutive for the period. |
Host L.P. Earnings Per Common Unit
Basic earnings per common unit is computed by dividing net income attributable to common unitholders by the weighted average number of common units outstanding. Diluted earnings per common unit is computed by dividing net income attributable to common unitholders, as adjusted for potentially dilutive securities, by the weighted average number of common units outstanding plus other potentially dilutive securities. Dilutive securities may include units distributed to Host Inc. to support Host Inc. common shares granted under comprehensive stock plans, other non-controlling interests that have the option to convert their limited partnership interests to common OP units and convertible debt securities. No effect is shown for any securities that are anti-dilutive.
106
HOST HOTELS & RESORTS, INC., HOST HOTELS & RESORTS, L.P., AND SUBSIDIARIES
NOTES TO CONSOLIDATED FINANCIAL STATEMENTS
The calculation of basic and diluted earnings per common unit is shown below (in millions, except per unit amounts):
|
| Year ended December 31, |
| |||||||||
|
| 2014 |
|
| 2013 |
|
| 2012 |
| |||
Net income |
| $ | 747 |
|
| $ | 325 |
|
| $ | 63 |
|
Less: Net income attributable to non-controlling interests |
|
| (6 | ) |
|
| (4 | ) |
|
| (1 | ) |
Net income attributable to Host L.P. |
|
| 741 |
|
|
| 321 |
|
|
| 62 |
|
Assuming conversion of exchangeable senior debentures |
|
| 27 |
|
|
| 1 |
|
|
| - |
|
Diluted income attributable to Host L.P. |
| $ | 768 |
|
| $ | 322 |
|
| $ | 62 |
|
|
|
|
|
|
|
|
|
|
|
|
|
|
Basic weighted average units outstanding |
|
| 748.9 |
|
|
| 738.4 |
|
|
| 713.3 |
|
Assuming weighted average units for conversion of exchangeable senior debentures |
|
| 29.7 |
|
|
| 2.4 |
|
|
| - |
|
Assuming distribution of common units granted under the comprehensive stock plans, less units assumed purchased at market |
|
| 1.0 |
|
|
| 1.1 |
|
|
| 1.3 |
|
Diluted weighted average units outstanding (1) |
|
| 779.6 |
|
|
| 741.9 |
|
|
| 714.6 |
|
|
|
|
|
|
|
|
|
|
|
|
|
|
Basic earnings per common unit |
| $ | .99 |
|
| $ | .43 |
|
| $ | .09 |
|
Diluted earnings per common unit |
| $ | .99 |
|
| $ | .43 |
|
| $ | .09 |
|
___________ |
|
|
|
|
|
|
|
|
|
|
|
|
(1) | There were approximately 29 million and 40 million potentially dilutive units as of December 31, 2013 and 2012, respectively, related to our exchangeable senior debentures, which units were not included in the computation of diluted earnings per unit because to do so would have been anti-dilutive for the period. |
Share-Based Payments
At December 31, 2014, Host Inc. maintained two stock-based employee compensation plans. Upon the issuance of Host's common stock under the compensation plans, Host L.P. will issue to Host Inc. common OP units of an equivalent value. These liabilities are included in the consolidated financial statements for Host Inc. and Host L.P.
We recognize costs resulting from Host Inc.'s share-based payment transactions over their vesting periods. We classify share-based payment awards granted in exchange for employee services either as equity awards or liability awards based upon cash settlement options. Equity classified awards are measured based on the fair value on the date of grant. Liability classified awards are remeasured to fair value each reporting period. Awards are classified as liability awards to the extent that settlement features allow the recipient to determine percentage of the restricted stock awards withheld to meet the recipients' tax withholding requirements. As these awards vest over a one-year period ending December 31, the value is calculated as the estimated number of shares earned during the year times the stock price at year end, less estimated forfeitures. For performance-based awards, compensation cost will be recognized when the achievement of the performance condition is considered probable. If a performance condition has more than one outcome that is probable, recognition of compensation cost will be based on the condition that is the most likely outcome. No compensation cost is recognized for awards for which employees do not render the requisite services.
Concentrations of Credit Risk
Financial instruments that potentially subject us to significant concentrations of credit risk consist principally of cash and cash equivalents. We are exposed to credit risk with respect to cash held at various financial institutions, access to our credit facility, and amounts due or payable under our derivative contracts. At December 31, 2014 and December 31, 2013, our exposure to risk related to our derivative instruments totaled $13 million and $4 million, respectively, and the counterparties to such instruments are investment grade financial institutions. Our credit risk exposure with regard to our cash and the $796 million available under our credit facility is spread among a diversified group of investment grade financial institutions.
Business Combinations
We recognize identifiable assets acquired, liabilities assumed, and non-controlling interests in a business combination at their fair values at the acquisition date based on the exit price (i.e. the price that would be received to sell an asset or paid to transfer a liability in an orderly transaction between market participants at the measurement date). We evaluate several factors, including market data for similar assets, expected cash flows discounted at risk adjusted rates and replacement cost for the assets to determine an
107
HOST HOTELS & RESORTS, INC., HOST HOTELS & RESORTS, L.P., AND SUBSIDIARIES
NOTES TO CONSOLIDATED FINANCIAL STATEMENTS
appropriate exit cost when evaluating the fair value of our assets. Property and equipment are recorded at fair value and such fair value is allocated to buildings, improvements, furniture, fixtures and equipment using appraisals and valuations performed by management and independent third parties. Acquisition-related costs, such as due diligence, legal and accounting fees, are not capitalized or applied in determining the fair value of the acquired assets.
Other items that we evaluate in a business combination include identifiable intangible assets, capital lease assets and obligations and goodwill. Identifiable intangible assets typically consist of assumed contracts, including ground and retail leases and management and franchise agreements, which are recorded at fair value. Capital lease obligations that are assumed as part of the acquisition of a leasehold interest are measured at fair value and are included as debt on the accompanying balance sheet and we record the corresponding right-to-use assets. Classification of a lease does not change if it is part of a business combination. In making estimates of fair values for purposes of allocating purchase price, we may utilize a number of sources that arise in connection with the acquisition or financing of a property and other market data, including third-party appraisals and valuations. In certain situations, a deferred tax liability is recognized due to the difference between the fair value and the tax basis of the acquired assets at the acquisition date. Any consideration paid in excess of the net fair value of the identifiable assets and liabilities acquired would be recorded to goodwill. In very limited circumstances, we may record a bargain purchase gain if the consideration paid is less than the net fair value of the assets and liabilities acquired.
Reclassifications
Certain prior year financial statement amounts have been reclassified to conform with the current year presentation.
New Accounting Standards
In May 2014, the Financial Accounting Standards Board (FASB) issued Accounting Standards Update (ASU) No. 2014-09, Revenue from Contracts with Customers (Topic 606), which affects virtually all aspects of an entity's revenue recognition. The core principle of the new standard is that revenue should be recognized to depict the transfer of promised goods or services to customers in an amount that reflects the consideration to which the entity expects to be entitled in exchange for those goods or services. The standard is effective for annual reporting periods beginning after December 15, 2016. We have not yet completed our assessment of the effect of the new standard on our financial statements, including possible transition alternatives.
2. | Property and Equipment |
Property and equipment consists of the following (in millions):
|
| As of December 31, |
| |||||
|
| 2014 |
|
| 2013 |
| ||
Land and land improvements |
| $ | 1,990 |
|
| $ | 1,973 |
|
Buildings and leasehold improvements |
|
| 13,336 |
|
|
| 13,435 |
|
Furniture and equipment |
|
| 2,217 |
|
|
| 2,223 |
|
Construction in progress |
|
| 209 |
|
|
| 176 |
|
|
|
| 17,752 |
|
|
| 17,807 |
|
Less accumulated depreciation and amortization |
|
| (7,177 | ) |
|
| (6,812 | ) |
|
| $ | 10,575 |
|
| $ | 10,995 |
|
The aggregate cost of real estate for federal income tax purposes is approximately $10.4 billion at December 31, 2014.
108
HOST HOTELS & RESORTS, INC., HOST HOTELS & RESORTS, L.P., AND SUBSIDIARIES
NOTES TO CONSOLIDATED FINANCIAL STATEMENTS
3. | Investments in Affiliates |
We own investments in joint ventures that are accounted for under the equity method of accounting. The debt of the Euro JV and Asia/Pacific JV is non-recourse to, and not guaranteed by, us. The debt of the Hyatt Place JV and the construction loan for the Maui JV is jointly and/or severally guaranteed by the partners of the joint ventures. Investments in affiliates consist of the following (in millions):
|
| As of December 31, 2014 | ||||||||||||||||
|
| Ownership |
|
| Our |
|
| Our Portion |
|
|
|
|
|
|
| |||
|
| Interests |
|
| Investment |
|
| of Debt |
|
| Total Debt |
|
| Assets | ||||
Euro JV |
| 32.1 - 33.4 | % |
| $ | 348 |
|
| $ | 388 |
|
| $ | 1,186 |
|
| Nineteen hotels in Europe | |
Asia/Pacific JV |
|
| 25 | % |
|
| 22 |
|
|
| 9 |
|
|
| 37 |
|
| One hotel in Australia and a 36% interest in three operating hotels and four hotels under development in India |
Maui JV |
|
| 67 | % |
|
| 61 |
|
|
| 64 |
|
|
| 96 |
|
| 131-unit vacation ownership project in Maui, Hawaii |
Hyatt Place JV |
|
| 50 | % |
|
| 7 |
|
|
| 16 |
|
|
| 31 |
|
| One hotel in Nashville, Tennessee |
Philadelphia Marriott Downtown |
|
| 11 | % |
|
| (5 | ) |
|
| 25 |
|
|
| 227 |
|
| One hotel in Philadelphia, PA |
Total |
|
|
|
|
| $ | 433 |
|
| $ | 502 |
|
| $ | 1,577 |
|
|
|
|
| As of December 31, 2013 | ||||||||||||||||
|
| Ownership |
|
| Our |
|
| Our Portion |
|
|
|
|
|
|
| |||
|
| Interests |
|
| Investment |
|
| of Debt |
|
| Total Debt |
|
| Assets | ||||
Euro JV |
| 32.1 - 33.4 | % |
| $ | 374 |
|
| $ | 444 |
|
| $ | 1,363 |
|
| Nineteen hotels in Europe | |
Asia/Pacific JV |
|
| 25 | % |
|
| 20 |
|
|
| 10 |
|
|
| 39 |
|
| One hotel in Australia and a 36% interest in two operating hotels and five hotels under development in India |
Maui JV |
|
| 67 | % |
|
| 16 |
|
|
| 34 |
|
|
| 50 |
|
| 131-unit vacation ownership project in Maui, Hawaii |
Hyatt Place JV |
|
| 50 | % |
|
| 5 |
|
|
| 12 |
|
|
| 24 |
|
| One hotel in Nashville, Tennessee |
Total |
|
|
|
|
| $ | 415 |
|
| $ | 500 |
|
| $ | 1,476 |
|
|
|
European Joint Venture
We own general and limited partner interests in the Euro JV that consists of two separate funds, with the other partners thereof including APG Strategic Real Estate Pool NV, an affiliate of a Dutch Pension Fund, and Jasmine Hotels Pte Ltd, an affiliate of the real estate investment company of the Government of Singapore Investment Corporation Pte Ltd ("GIC RE"). We own a combined 32.1% ownership interest of Euro JV Fund I and a combined 33.4% interest of Euro JV Fund II. We do not consolidate the Euro JV due to the ownership structure and substantive participating rights of the non-Host limited partners, including approval over financing, acquisitions and dispositions, and annual operating and capital expenditures budgets. The joint venture agreement expires in 2021, subject to two one-year extensions. As of December 31, 2014, the total assets of the Euro JV are approximately €1.9 billion ($2.3 billion). As asset manager of the Euro JV funds, we earn asset management fees based on the amount of equity commitments and equity invested, which in 2014, 2013 and 2012 were approximately $16 million, $15 million and $13 million, respectively.
As of December 31, 2014, the partners have funded approximately €647 million, or 94%, of the total equity commitment for Euro JV Fund I and €364 million, or 81%, of the total equity commitment for Euro JV Fund II. On April 17, 2013 and June 25, 2013, the Euro JV partners executed amendments of the Euro JV partnership agreement in order to provide the funds necessary for a €95 million principal reduction associated with the refinancing of a mortgage loan secured by a portfolio of six properties, as well as to provide funds for general joint venture purposes, to extend the commitment period of Euro JV Fund I to December 2015 and to extend the commitment period of Euro JV Fund II by one year to June 2014 through the exercise of the extension option. Effective June 27, 2014, the Euro JV partners executed an amendment and restatement of the Euro JV partnership agreement which allows contributions to the joint venture in the form of loans, as opposed to only equity contributions and amended the agreement to extend the commitment period for Euro JV Fund II by one year to June 27, 2015. The partners expect to utilize the remaining equity commitment for Euro JV Fund I for capital expenditures and financing needs.
109
HOST HOTELS & RESORTS, INC., HOST HOTELS & RESORTS, L.P., AND SUBSIDIARIES
NOTES TO CONSOLIDATED FINANCIAL STATEMENTS
In April 2014, the Euro JV made a cash distribution to its partners totaling €37 million, of which Host's share was €12 million ($17 million).
On September 30, 2014, Euro JV Fund II acquired a 90% ownership interest in the 394-room Grand Hotel Esplanade in Berlin. The hotel was acquired based on an aggregate gross value of €81 million ($102 million), and is subject to a mortgage loan of approximately €48 million ($61 million) with a margin of 219 basis points over the Euro Interbank Offered Rate ("Euribor"). The loan is non-recourse to the Euro JV. We contributed approximately €10 million ($14 million) to the Euro JV in connection with this acquisition, partially funded through a draw on our credit facility.
On October 16, 2014, the Euro JV Fund I sold the 350-room Sheraton Skyline Hotel & Conference Centre for £33 million ($53 million) plus certain customary closing adjustments and recognized a gain of approximately £8 million ($12 million). In connection with the sale, the Euro JV repaid the associated mortgage loan of £21.1 million ($34 million).
On August 29, 2013, Euro JV Fund II acquired the 465-room Sheraton Stockholm Hotel in Sweden for approximately €102 million ($135 million). In connection with the acquisition, the Euro JV entered into a €61 million ($81 million) mortgage loan with an interest rate of 5.67% that matures in 2018. The loan is non-recourse to the Euro JV. We contributed approximately €14 million ($19 million) to the Euro JV in connection with this acquisition, funded through a draw on our credit facility.
On October 22, 2013, Euro JV Fund II sold the Courtyard Paris La Defense West – Colombes for €19 million ($26 million) plus certain customary closing adjustments and recognized a gain of approximately €1.7 million ($2.3 million). In connection with the sale, the Euro JV repaid the associated €10.4 million ($14.4 million) mortgage loan.
The Euro JV has €980 million ($1,186 million) of mortgage debt, including debt incurred in its recent acquisitions, all of which is non-recourse to us. A default of the Euro JV mortgage debt does not trigger a default under any of our debt. On July 3, 2014, the Euro JV refinanced the €69 million ($94 million) loan secured by three properties in Brussels with Natixis, reducing the outstanding principal amount of the mortgage loan to €47.8 million using funds provided by the partners. Interest on the new loan is a combination of fixed and floating for an initial all-in rate of 2.0% and has a maturity date of July 3, 2019. On June 20, 2013, the Euro JV refinanced a mortgage loan secured by six properties, extending the maturity date to 2016, with a one year extension option subject to meeting certain conditions. The loan has a fixed and floating rate component with an initial interest rate of 4.5%. In connection with the refinancing, the joint venture reduced the outstanding principal amount of the mortgage loan from €337 million ($446 million) to €242 million ($320 million). We funded our portion of the principal reduction, as well as certain closing costs and other funding requirements, through a €37 million ($48 million) draw on our credit facility.
We have entered into four foreign currency forward sale contracts in order to hedge the foreign currency exposure resulting from the eventual repatriation of our net investment in the Euro JV. The forward purchases will occur between August 2015 and May 2017. We have hedged €177 million (approximately $228 million) of our investment through these contracts and designated draws under our credit facility in Euros. See Note 12 – "Fair Value Measurement" for further information.
Our unconsolidated investees analyze their properties for impairment throughout the year when events or circumstances occur that indicate the carrying amount may not be recoverable. A property is considered to be impaired when the sum of the future undiscounted cash flows over its remaining estimated holding period is less than the carrying amount of the asset. If a property is impaired, an expense is recorded for the difference between the fair value and the carrying amount of the hotel. In 2013, we recognized an expense of approximately $15 million reflecting our share of the impairment of one such property in equity in earnings (losses) of affiliates.
Asia/Pacific Joint Venture
We own a 25% general and limited partner interest in the Asia/Pacific JV, the other partner of which is RECO Hotels JV Private Limited, an affiliate of GIC RE. The Asia/Pacific JV may be terminated after a period of seven years, which occurs in March of 2015. Due to the ownership structure and the substantive participating rights of the non-Host limited partner, including approval over financing, acquisitions and dispositions, and annual operating and capital expenditures budgets, the Asia/Pacific JV is not consolidated in our financial statements. The commitment period for the equity contributions to the joint venture expired in March of 2012. As a result, unanimous approval of the joint venture partners is necessary to fund additional acquisitions. Certain funding commitments remain, however, related to existing investments.
As of December 31, 2014, the Asia/Pacific JV partners have invested approximately $83 million (of which our share was $21 million) in a joint venture in India with Accor S.A. and InterGlobe Enterprises Limited, in which the Asia/Pacific JV holds a 36% interest. This joint venture owns two hotels in Bangalore and one in Chennai and is developing four additional properties in Chennai
110
HOST HOTELS & RESORTS, INC., HOST HOTELS & RESORTS, L.P., AND SUBSIDIARIES
NOTES TO CONSOLIDATED FINANCIAL STATEMENTS
and Delhi. The three hotels that are operating and the four hotels under development will be managed by Accor under the Pullman, ibis and Novotel brands.
Maui Joint Venture
In December 2014, we opened Hyatt Ka'anapali Beach, A Hyatt Residence Club, in which we hold a 67% non-controlling interest. The 131–unit vacation ownership project in Maui, Hawaii is adjacent to our Hyatt Regency Maui Resort & Spa. The development costs were funded with a $110 million construction loan and member contributions. As of December 31, 2014, $86 million has been drawn on the construction loan. The construction loan is jointly and severally guaranteed by both partners and matures in December 2015. Additionally, the joint venture has issued $10 million of debt to fund loans to the timeshare owners, which loans all are nonrecourse to Host. As of December 31, 2014, we have contributed land valued at $36 million, approximately $8 million of pre-formation expenditures and additional contributions of $43 million. Development costs as of December 31, 2014 totaled $180 million. In 2014, sales of the timeshares totaled $54 million.
Combined Financial Information of Unconsolidated Investees
Combined summarized balance sheet information for our affiliates is as follows (in millions):
|
| As of December 31, |
| |||||
|
| 2014 |
|
| 2013 |
| ||
Property and equipment, net |
| $ | 2,369 |
|
| $ | 2,362 |
|
Timeshare inventory |
|
| 178 |
|
|
| 106 |
|
Other assets |
|
| 424 |
|
|
| 376 |
|
Total assets |
| $ | 2,971 |
|
| $ | 2,844 |
|
Debt |
| $ | 1,577 |
|
| $ | 1,476 |
|
Other liabilities |
|
| 163 |
|
|
| 135 |
|
Equity |
|
| 1,231 |
|
|
| 1,233 |
|
Total liabilities and equity |
| $ | 2,971 |
|
| $ | 2,844 |
|
Combined summarized operating results for our affiliates is as follows (in millions):
|
| Year ended December 31, |
| |||||||||
|
| 2014 |
|
| 2013 |
|
| 2012 |
| |||
Total revenues |
| $ | 776 |
|
| $ | 617 |
|
| $ | 428 |
|
Operating expenses |
|
|
|
|
|
|
|
|
|
|
|
|
Expenses |
|
| (568 | ) |
|
| (489 | ) |
|
| (346 | ) |
Depreciation and amortization |
|
| (91 | ) |
|
| (131 | ) |
|
| (56 | ) |
Operating profit (loss) |
|
| 117 |
|
|
| (3 | ) |
|
| 26 |
|
Interest expense |
|
| (79 | ) |
|
| (59 | ) |
|
| (43 | ) |
Gain on disposition |
|
| 12 |
|
|
| 2 |
|
|
| - |
|
Net income (loss) |
| $ | 50 |
|
| $ | (60 | ) |
| $ | (17 | ) |
111
HOST HOTELS & RESORTS, INC., HOST HOTELS & RESORTS, L.P., AND SUBSIDIARIES
NOTES TO CONSOLIDATED FINANCIAL STATEMENTS
4. | Debt |
Debt consists of the following (in millions):
|
| As of December 31, |
| |||||
|
| 2014 |
|
| 2013 |
| ||
Series Q senior notes, with a rate of 6¾% due June 2016 |
| $ | - |
|
| $ | 150 |
|
Series V senior notes, with a rate of 6% due November 2020 |
|
| 500 |
|
|
| 500 |
|
Series X senior notes, with a rate of 5⅞% due June 2019 |
|
| 498 |
|
|
| 497 |
|
Series Z senior notes, with a rate of 6% due October 2021 |
|
| 300 |
|
|
| 300 |
|
Series B senior notes, with a rate of 5¼% due March 2022 |
|
| 350 |
|
|
| 350 |
|
Series C senior notes, with a rate of 4¾% due March 2023 |
|
| 450 |
|
|
| 450 |
|
Series D senior notes, with a rate of 3¾% due October 2023 |
|
| 400 |
|
|
| 400 |
|
2009 Exchangeable Senior Debentures, with a rate of 2½% due October 2029 |
|
| 386 |
|
|
| 371 |
|
Total senior notes |
|
| 2,884 |
|
|
| 3,018 |
|
Credit facility revolver |
|
| 204 |
|
|
| 446 |
|
Credit facility term loan due June 2017 |
|
| 500 |
|
|
| 500 |
|
Mortgage debt (non-recourse), with an average interest rate of 5.0% and 4.1% at December 31, 2014 and 2013, respectively, maturing through January 2024 |
|
| 404 |
|
|
| 709 |
|
Other |
|
| - |
|
|
| 86 |
|
Total debt |
| $ | 3,992 |
|
| $ | 4,759 |
|
Senior Notes
General. Under the terms of our senior notes indenture, which includes our Exchangeable Senior Debentures, our senior notes are equal in right of payment with all of our unsubordinated indebtedness and senior to all of our subordinated obligations. The face amount of our senior notes as of December 31, 2014 and 2013 was $2.9 billion and $3.1 billion, respectively. The senior notes balance as of December 31, 2014 and 2013 includes discounts of approximately $16 million and $32 million, respectively. We pay interest on each series of our senior notes semi-annually in arrears at the respective annual rates indicated in the table above.
Under the terms of the senior notes indenture, our ability to incur indebtedness and pay dividends is subject to restrictions and the satisfaction of various conditions. As of December 31, 2014, we are in compliance with all of these covenants.
We completed the following senior notes transactions:
● | In February 2014, we redeemed the remaining $150 million 6¾ Series Q senior notes due 2016 for an aggregate price of $152 million. |
● | We redeemed $400 million ($200 million in June 2013 and $200 million in September 2013) of our 6¾% Series Q senior notes due 2016, for an aggregate price of $404 million, using proceeds from debt issuances and asset dispositions. |
● | On March 19, 2013, we issued $400 million of our 3 3 ⁄ 4 % Series D senior notes due October of 2023 for net proceeds of approximately $396 million. The net proceeds from the issuance of the Series D senior notes, together with cash on hand, were used to redeem the $400 million of our 9% Series T senior notes due 2017 at an aggregate price of $418 million in May 2013. |
● | In March 2013, holders of $174 million face amount of our 3 1 ⁄ 4 % exchangeable senior debentures (the "2004 Debentures") elected to exchange their debentures for shares of Host Inc. common stock totaling approximately 11.7 million shares, rather than receive the cash redemption proceeds. In connection with this exchange, Host L.P. issued 11.5 million common OP units. The remaining $1 million of debentures were redeemed for cash. |
Exchangeable Debentures. As of December 31, 2014, we have $400 million of 2 1 ⁄ 2 % exchangeable senior debentures outstanding that were issued on December 22, 2009 (the "2009 Debentures"). The 2009 Debentures are equal in right of payment with all of our other senior notes. Holders have the right to require us to purchase the 2009 Debentures at a price equal to 100% of the principal amount outstanding plus accrued interest (the "put option") on October 15, 2015 and on certain subsequent dates. Holders of the 2009 Debentures also have the right to exchange the 2009 Debentures prior to maturity under certain conditions, including at any time at which the closing price of Host Inc.'s common stock is more than 130% ($16.71) of the exchange price per share for at least 20 of the last 30 consecutive trading days of the calendar quarter or at any time up to two days prior to the date on which the 2009 Debentures have been called for redemption. We can redeem for cash all, or part of, any of the 2009 Debentures at any time
112
HOST HOTELS & RESORTS, INC., HOST HOTELS & RESORTS, L.P., AND SUBSIDIARIES
NOTES TO CONSOLIDATED FINANCIAL STATEMENTS
subsequent to October 20, 2015, at a redemption price of 100% of the principal amount plus accrued interest. If, at any time, we elect to redeem the 2009 Debentures and the exchange value exceeds the cash redemption price, we would expect the holders to elect to exchange the 2009 Debentures at the respective exchange value rather than receive the cash redemption price. The exchange value is equal to the applicable exchange rate multiplied by the price of Host Inc.'s common stock. Upon exchange, the 2009 Debentures would be exchanged for Host Inc.'s common stock, cash, or a combination thereof, at our option. Based on Host Inc.'s stock price at December 31, 2014, the if-converted value of the 2009 Debentures would exceed the outstanding principal amount by $339 million. As of December 31, 2014, the closing price of Host Inc.‘s common stock exceeded 130% of the exchange price for more than 20 of 30 consecutive trading days. Therefore, the 2009 Debentures are exchangeable by holders through March 31, 2015. Currently, each $1,000 Debenture would be exchanged for 77.8265 Host Inc. common shares (for an equivalent per share price of $12.85), for a total of 31.1 million shares.
We separately account for the liability and equity components of our 2009 Debentures in order to reflect the fair value of the liability component based on our non-convertible borrowing cost at the issuance date. Accordingly, we recorded the liability components of the 2009 Debentures at fair value as of the date of issuance and will amortize the resulting discount as an increase to interest expense through the initial put option date of the 2009 Debentures, which is the expected life of the debt. However, there is no effect of this accounting treatment on our cash interest payments. We measured the fair value of the liability components of the 2009 Debentures at issuance based on an effective interest rate of 6.9%. The initial allocations between the liability and equity components of the 2009 Debentures, net of the original issue discount, based on the effective interest rate at the time of issuance was $316 million and $82 million, respectively. As of December 31, 2014, the debt carrying value and unamortized discount were $386 million and $14 million, respectively.
Interest expense recorded for our exchangeable senior debentures (including interest expense for debentures redeemed in 2013 and 2012) consists of the following (in millions):
|
| Year ended December 31, |
| |||||||||
|
| 2014 |
|
| 2013 |
|
| 2012 |
| |||
Contractual interest expense (cash) |
| $ | 10 |
|
| $ | 10 |
|
| $ | 19 |
|
Non-cash interest expense due to discount amortization |
|
| 16 |
|
|
| 15 |
|
|
| 17 |
|
Total interest expense |
| $ | 26 |
|
| $ | 25 |
|
| $ | 36 |
|
Authorization for Repurchase of Senior Notes and Exchangeable Senior Debentures. In February 2015, Host Inc.'s Board of Directors authorized repurchases of up to $500 million of senior notes, exchangeable senior debentures and mortgage debt (other than in accordance with their terms).
Credit Facility. On June 27, 2014, we entered into a new senior revolving credit facility with Bank of America, N.A., as administrative agent, JPMorgan Chase Bank, N.A., as syndication agent, and certain other agents and lenders. The credit facility allows for revolving borrowings in an aggregate principal amount of up to $1 billion, including a foreign currency subfacility for Canadian dollars, Australian dollars, New Zealand dollars, Japanese yen, Euros, British pound sterling and, if available to the lenders, Mexican peso, of up to the foreign currency equivalent of $500 million, subject to a lower amount in the case of New Zealand dollar and Mexican peso borrowings. The credit facility also provides a subfacility of up to $100 million for swingline borrowings in U.S. dollars, Canadian dollars, Euros and British pound sterling and a subfacility of up to $100 million for issuances of letters of credit. Host L.P. also has the option to increase the aggregate principal amount of the credit facility by up to $500 million, subject to obtaining additional loan commitments and satisfaction of certain conditions. The credit facility has an initial scheduled maturity of June 2018, with two six-month renewal options. The credit facility contained a term loan facility of $500 million, which replaced and refinanced the term loan under our prior facility of like amount. The term loan facility has an initial scheduled maturity of June 2017, with two one-year renewal options, resulting in a maturity for the entire credit facility in June 2019, if all renewal options are exercised, subject to certain conditions, including the payment of an extension fee and the accuracy of representations and warranties.
We had the following transactions under this credit facility during 2014 and 2013 (draws used for bridge financing to facilitate transactions are not included in the below discussion):
● | On January 10, 2014, we repaid $225 million on the revolver portion of our credit facility and as of December 31, 2014, we have $796 million of available capacity. |
113
HOST HOTELS & RESORTS, INC., HOST HOTELS & RESORTS, L.P., AND SUBSIDIARIES
NOTES TO CONSOLIDATED FINANCIAL STATEMENTS
● | In 2013, we drew $68 million in net proceeds in Euros on the revolver portion of our credit facility, primarily to facilitate acquisitions and a debt refinancing related to our investment in the Euro JV. |
● | In 2013, we also drew $118 million of net proceeds of the revolver portion of our credit facility in U.S. dollars (net of a $7 million repayment of our draw in Australian dollars) primarily to facilitate the redemption of the Series Q senior notes. |
Financial Covenants . The credit facility contains covenants concerning allowable leverage, fixed charge coverage and unsecured interest coverage (as defined in our credit facility). Currently, we are permitted to borrow and maintain amounts outstanding under the credit facility so long as our leverage ratio is not in excess of 7.25x, our unsecured coverage ratio is not less than 1.75x and our fixed charge coverage ratio is not less than 1.25x. The financial covenants for the credit facility do not apply when there are no borrowings under the credit facility. Therefore, so long as there are no amounts outstanding, we would not be in default if we do not satisfy the financial covenants and we do not lose the potential to draw under the credit facility in the future if we were to regain compliance with the financial covenants. These calculations are performed based on pro forma results for the prior four fiscal quarters, giving effect to transactions such as acquisitions, dispositions and financings as if they had occurred at the beginning of the period. Under the terms of the credit facility, interest expense excludes items such as gains and losses on the extinguishment of debt, deferred financing charges related to the senior notes or the credit facility, amortization of debt premiums or discounts that were recorded at issuance of a loan in order to establish the debt at fair value and non-cash interest expense due to the implementation in 2009 of accounting standards related to our exchangeable debentures, all of which are included in interest expense on our consolidated statement of operations. Additionally, total debt used in the calculation of our leverage ratio is based on a "net debt" concept, under which cash and cash equivalents in excess of $100 million are deducted from our total debt balance. As of December 31, 2014, we are in compliance with the financial covenants under our credit facility.
Collateral and Guarantees . The credit facility initially does not include any subsidiary guarantees or pledges of equity interests in our subsidiaries, and the guarantees and pledges are required only in the event that Host L.P.'s leverage ratio exceeds 6.0x for two consecutive fiscal quarters at a time that Host L.P. does not have an investment grade long-term unsecured debt rating. In the event that such guarantee and pledge requirement is triggered, the guarantees and pledges ratably would benefit the credit facility, as well as the notes outstanding under Host L.P.'s senior notes indenture, interest rate and currency hedges and certain other hedging and bank product arrangements with lenders that are parties to the credit facility. Even when triggered, the guarantees and pledges only would be required by certain U.S. and Canadian subsidiaries of Host L.P. and a substantial portion of our subsidiaries would provide neither guarantees nor pledges of equity interests. As of December 31, 2014, our leverage ratio was 2.6x.
Interest and Fees. We pay interest on revolver borrowings under the credit facility at floating rates equal to LIBOR plus a margin ranging from 87.5 to 155 basis points (depending on Host L.P.'s unsecured long-term debt rating). We also pay a facility fee ranging from 12.5 to 30 basis points, depending on our rating and regardless of usage. Based on Host L.P.'s unsecured long-term debt rating as of December 31, 2014, we are able to borrow at a rate of LIBOR plus 100 basis points and pay a facility fee of 20 basis points. Interest on the term loan consists of floating rates plus a margin ranging from 90 to 175 basis points (depending on Host L.P.'s unsecured long-term debt rating). Based on Host L.P.'s unsecured long-term debt rating at December 31, 2014, the margin is 112.5 basis points for an all-in interest rate of 1.29%.
Other Covenants and Events of Default . The credit facility contains restrictive covenants on customary matters. Certain covenants become less restrictive at any time that our leverage ratio falls below 6.0x. In particular, at any time that our leverage ratio is below 6.0x, we will not be subject to limitations on capital expenditures, and the limitations on acquisitions, investments and dividends contained in the credit facility will be superseded by the generally less restrictive corresponding covenants in our senior notes indenture. Additionally, the credit facility's restrictions on the incurrence of debt and the payment of dividends generally are consistent with our senior notes indenture for our Series D senior notes. These provisions, under certain circumstances, limit debt incurrence to debt incurred under the credit facility or in connection with a refinancing, and limit dividend payments to those necessary to maintain Host Inc.'s tax status as a REIT. Our senior notes and credit facility have cross default provisions that would trigger a default under those agreements if we were to have a payment default or an acceleration prior to maturity of other debt of Host L.P. or its subsidiaries. The amount of other debt in default needs to exceed certain thresholds in order to trigger a cross default and the thresholds are greater for secured debt than for unsecured debt. The credit facility also includes usual and customary events of default for facilities of this nature, and provides that, upon the occurrence and continuance of an event of default, payment of all amounts owed under the credit facility may be accelerated, and the lenders' commitments may be terminated. In addition, upon the occurrence of certain insolvency or bankruptcy related events of default, all amounts owed under the credit facility will become due and payable and the lenders' commitments will terminate.
114
HOST HOTELS & RESORTS, INC., HOST HOTELS & RESORTS, L.P., AND SUBSIDIARIES
NOTES TO CONSOLIDATED FINANCIAL STATEMENTS
Mortgage Debt
All of our mortgage debt is recourse solely to specific assets, except for environmental liabilities, fraud, misapplication of funds and other customary recourse provisions. As of December 31, 2014, we have mortgage debt secured by 10 assets, with an average interest rate of 5.0%, which mortgage debt matures between 2016 and 2024. Interest is payable monthly. As of December 31, 2014, we are in compliance with the covenants under all of our mortgage debt obligations.
We had the following mortgage debt issuances and repayments since January 2013:
|
|
|
|
|
|
|
| Maturity |
|
|
|
|
Transaction Date |
| Property |
| Rate |
|
| Date |
| Amount |
| ||
Issuances/Assumptions |
|
|
|
|
|
|
|
|
| (in millions) |
| |
December 2013 |
| Harbor Beach Marriott Resort & Spa |
|
| 4.75 | % |
| 1/1/2024 |
| $ | 150 |
|
Repayments |
|
|
|
|
|
|
|
|
|
|
|
|
February 2014 |
| The Ritz-Carlton, Naples and Newport Beach Marriott Hotel |
|
| 3.25 | % |
| 3/1/2014 |
|
| (300 | ) |
December 2013 |
| Harbor Beach Marriott Resort & Spa |
|
| 5.55 | % |
| 3/1/2014 |
|
| (134 | ) |
December 2013 |
| The Westin Denver Downtown |
|
| 8.51 | % |
| 12/11/2023 |
|
| (31 | ) |
May 2013 |
| Orlando World Center Marriott |
|
| 4.75 | % |
| 7/1/2013 |
|
| (246 | ) |
|
|
|
|
|
|
|
|
|
|
|
|
|
Aggregate Debt Maturities
Aggregate debt maturities are as follows (in millions):
|
| As of December 31, 2014 |
| |
2015 |
| $ | 400 |
|
2016 |
|
| 253 |
|
2017 |
|
| 500 |
|
2018 |
|
| 204 |
|
2019 |
|
| 500 |
|
Thereafter |
|
| 2,150 |
|
|
|
| 4,007 |
|
Unamortized (discounts) premiums, net |
|
| (16 | ) |
Capital lease obligations |
|
| 1 |
|
|
| $ | 3,992 |
|
Other
On October 30, 2014 we redeemed the $12 million 7.125% Dulles Airport Industrial Development Revenue Bonds. On June 25, 2014, we redeemed the $40 million 7.75% Philadelphia Airport Industrial Development Revenue Bonds. Additionally, on June 15, 2014, we redeemed the $32 million 7% Newark Airport Industrial Development Refunding Revenue Bonds.
115
HOST HOTELS & RESORTS, INC., HOST HOTELS & RESORTS, L.P., AND SUBSIDIARIES
NOTES TO CONSOLIDATED FINANCIAL STATEMENTS
Interest
The following items are included in interest expense (in millions):
|
| Year ended December 31, |
| |||||||||
|
| 2014 (1) |
|
| 2013 (1) |
|
| 2012 (1) |
| |||
Interest expense |
| $ | 214 |
|
| $ | 304 |
|
| $ | 373 |
|
Amortization of debt premiums/discounts, net (2) |
|
| (16 | ) |
|
| (15 | ) |
|
| (18 | ) |
Amortization of deferred financing costs |
|
| (8 | ) |
|
| (10 | ) |
|
| (12 | ) |
Non-cash losses on debt extinguishments |
|
| (2 | ) |
|
| (13 | ) |
|
| (9 | ) |
Change in accrued interest |
|
| 1 |
|
|
| 16 |
|
|
| 4 |
|
Interest paid (3) |
| $ | 189 |
|
| $ | 282 |
|
| $ | 338 |
|
___________ |
|
|
|
|
|
|
|
|
|
|
|
|
(1) | Interest expense and interest paid for 2014, 2013 and 2012 include cash prepayment premiums of approximately $2 million, $23 million and $21 million, respectively. |
(2) | Primarily represents the amortization of the debt discount on our Debentures, which is considered non-cash interest expense. |
(3) | Does not include capitalized interest of $7 million, $6 million and $6 million during 2014, 2013 and 2012, respectively. |
Our debt repayments resulted in debt extinguishment costs included in interest expense for 2014, 2013 and 2012 of $4 million, $36 million and $30 million, respectively.
5. | Equity of Host Inc. and Capital of Host L.P. |
Equity of Host Inc.
Host Inc. has authorized 1,050 million shares of common stock, with a par value of $0.01 per share, of which 755.8 million and 754.8 million were outstanding as of December 31, 2014 and 2013, respectively. Fifty million shares of no par value preferred stock are authorized; none of such preferred shares were outstanding as of December 31, 2014 and 2013.
Capital of Host L.P.
As of December 31, 2014, Host Inc. is the owner of approximately 99% of Host L.P.'s common OP units. The remaining 1% of Host L.P.'s common OP units are held by various unaffiliated limited partners. Each common OP unit may be redeemed for cash or, at the election of Host Inc., Host Inc. common stock, based on the conversion ratio of 1.021494 shares of Host Inc. common stock for each OP unit. In connection with the issuance of shares by Host Inc., Host L.P. will issue OP units based on the same conversion ratio. As of December 31, 2014 and 2013, Host L.P. has 749.1 million and 748.4 million OP units outstanding, respectively, of which Host Inc. held 739.9 million and 738.9 million, respectively.
Issuances of Common Stock and Common OP Units
During 2013, Host Inc. issued 16.9 million shares of common stock, at an average price of $17.78 per share, for net proceeds of approximately $297 million. These issuances were made in "at-the-market" offerings pursuant to Sales Agency Financing Agreements with BNY Mellon Capital Markets, LLC and Scotia Capital (USA) Inc. In connection with the common stock issuance, Host L.P. issued 16.5 million common OP units. These issuances completed the capacity under the current agreements.
During March 2013, $174 million of the 2004 Debentures were exchanged for shares of Host Inc. common stock, totaling approximately 11.7 million shares. In connection with the exchange, Host L.P. issued 11.5 million common OP units.
Dividends/Distributions
Host Inc. is required to distribute at least 90% of its annual taxable income, excluding net capital gains, to its stockholders in order to maintain its qualification as a REIT, including taxable income recognized for federal income tax purposes but with regard to which we do not receive cash. Funds used by Host Inc. to pay dividends on its common stock are provided through distributions from Host L.P. The amount of any future dividends will be determined by Host Inc.'s Board of Directors.
116
HOST HOTELS & RESORTS, INC., HOST HOTELS & RESORTS, L.P., AND SUBSIDIARIES
NOTES TO CONSOLIDATED FINANCIAL STATEMENTS
The dividends that were taxable to our stockholders in 2014 were considered 65% ordinary income, 22% capital gain distribution and 13% unrecaptured Section 1250 gain. The dividends that were taxable to our stockholders in 2013 were considered 96.5% ordinary income and 3.5% unrecaptured Section 1250 gain. No portion of these 2014 and 2013 dividends was considered qualified dividends subject to a reduced tax rate.
The table below presents the amount of common dividends declared per share and common distributions per unit as follows:
|
| Year ended December 31, |
| |||||||||
|
| 2014 |
|
| 2013 |
|
| 2012 |
| |||
Common stock |
| $ | .75 |
|
| $ | .46 |
|
| $ | .30 |
|
Common OP units |
|
| .766 |
|
|
| .470 |
|
|
| .306 |
|
On February 17, 2015, Host Inc.'s Board of Directors authorized a regular quarterly cash dividend of $0.20 per share on Host Inc.'s common stock. The dividend is payable on April 15, 2015, to stockholders of record on March 31, 2015.
117
HOST HOTELS & RESORTS, INC., HOST HOTELS & RESORTS, L.P., AND SUBSIDIARIES
NOTES TO CONSOLIDATED FINANCIAL STATEMENTS
6. | Income Taxes |
We elected to be taxed as a REIT under Sections 856 through 860 of the Internal Revenue Code commencing with our taxable year ended December 31, 1999. To qualify as a REIT, we must meet a number of organizational and operational requirements, including a requirement that we distribute at least 90% of our taxable income to our stockholders, excluding net capital gain. As a REIT, we generally will not be subject to federal corporate income tax on that portion of our taxable income that currently is distributed to our stockholders. If we fail to qualify for taxation as a REIT in any taxable year, we will be subject to federal corporate income taxes at regular corporate rates (including any applicable alternative minimum tax) and may not be able to qualify as a REIT for four subsequent taxable years. Even if we qualify for taxation as a REIT, we may be subject to certain state, local and foreign taxes on our income and property, and to federal income and excise taxes on our undistributed taxable income.
We have recorded a 100% valuation allowance of approximately $27 million against the deferred tax asset related to the net operating loss and asset tax credit carryovers as of December 31, 2014 with respect to our hotel in Mexico. There is a $4 million valuation allowance against the deferred tax asset related to the net operating loss and capital loss carryovers as of December 31, 2014 with respect to our hotels in Canada. There is a $4 million valuation allowance related to the net operating loss incurred by our office in Rio de Janeiro as of December 31, 2014. Finally, there is a $10 million valuation allowance against the deferred tax asset related to the net operating loss carryovers as of December 31, 2014 with respect to certain of our U.S. taxable REIT subsidiaries that acted as lessee pursuant to the terminated HPT leases. We expect that the remaining net operating loss and alternative minimum tax credit carryovers for U.S. federal income tax purposes will be realized. The net decrease in the valuation allowance for the year ending December 31, 2014 and December 31, 2013 is approximately $16 million and $2 million, respectively. The primary components of our net deferred tax assets are as follows (in millions):
|
| As of December 31, |
| |||||
|
| 2014 |
|
| 2013 |
| ||
Deferred tax assets |
|
|
|
|
|
|
|
|
Accrued related party interest |
| $ | 21 |
|
| $ | 19 |
|
Net operating loss and capital loss carryovers |
|
| 70 |
|
|
| 85 |
|
Alternative minimum tax credits |
|
| 5 |
|
|
| 5 |
|
Property and equipment |
|
| 4 |
|
|
| 4 |
|
Investments in domestic affiliates |
|
| 3 |
|
|
| 3 |
|
Deferred revenue and expenses |
|
| 55 |
|
|
| 57 |
|
Other |
|
| 1 |
|
|
| 1 |
|
Total gross deferred tax assets |
|
| 159 |
|
|
| 174 |
|
Less: Valuation allowance |
|
| (45 | ) |
|
| (61 | ) |
Total deferred tax assets, net of valuation allowance |
| $ | 114 |
|
| $ | 113 |
|
Deferred tax liabilities |
|
|
|
|
|
|
|
|
Property and equipment |
|
| (17 | ) |
|
| (21 | ) |
Investments in domestic and foreign affiliates |
|
| (8 | ) |
|
| (6 | ) |
Other |
|
| (2 | ) |
|
| (3 | ) |
Total gross deferred tax liabilities |
|
| (27 | ) |
|
| (30 | ) |
Net deferred tax assets |
| $ | 87 |
|
| $ | 83 |
|
At December 31, 2014, we have aggregate gross domestic and foreign net operating loss, capital loss and tax credit carryovers of approximately $204 million. We have deferred tax assets related to these loss and tax credit carryovers of approximately $70 million, with a valuation allowance of approximately $45 million. Our net operating loss carryovers expire through 2034, and our foreign capital loss carryovers have no expiration period. Our domestic alternative minimum tax credit carryovers have no expiration period and our foreign asset tax credit carryovers expire through 2017. We believe that it is more likely than not that we will be able to realize our deferred tax assets, net of valuation allowance, of $114 million in the future.
Our U.S. and foreign income (loss) from continuing operations before income taxes was as follows (in millions):
| Year ended December 31, |
| |||||||||
| 2014 |
|
| 2013 |
|
| 2012 |
| |||
U.S. income (loss) | $ | 744 |
|
| $ | 213 |
|
| $ | (22 | ) |
Foreign income |
| 17 |
|
|
| 18 |
|
|
| 45 |
|
Total | $ | 761 |
|
| $ | 231 |
|
| $ | 23 |
|
118
HOST HOTELS & RESORTS, INC., HOST HOTELS & RESORTS, L.P., AND SUBSIDIARIES
NOTES TO CONSOLIDATED FINANCIAL STATEMENTS
The provision for income taxes from continuing operations consists of (in millions):
|
|
| Year ended December 31, |
| |||||||||
|
|
| 2014 |
|
| 2013 |
|
| 2012 |
| |||
Current | -Federal |
| $ | 3 |
|
| $ | 2 |
|
| $ | 3 |
|
| -State |
|
| 2 |
|
|
| 4 |
|
|
| 1 |
|
| -Foreign |
|
| 10 |
|
|
| 9 |
|
|
| 10 |
|
|
|
|
| 15 |
|
|
| 15 |
|
|
| 14 |
|
Deferred | -Federal |
|
| (1 | ) |
|
| 4 |
|
|
| 11 |
|
| -State |
|
| (1 | ) |
|
| 1 |
|
|
| 1 |
|
| -Foreign |
|
| 1 |
|
|
| 1 |
|
|
| 5 |
|
|
|
|
| (1 | ) |
|
| 6 |
|
|
| 17 |
|
Income tax provision – continuing operations |
| $ | 14 |
|
| $ | 21 |
|
| $ | 31 |
| |
The differences between the income tax provision calculated at the statutory U.S. federal income tax rate of 35% and the actual income tax provision recorded for continuing operations are as follows (in millions):
|
| Year ended December 31, |
| |||||||||
|
| 2014 |
|
| 2013 |
|
| 2012 |
| |||
Statutory federal income tax provision – continuing operations |
| $ | 265 |
|
| $ | 81 |
|
| $ | 8 |
|
Adjustment for nontaxable (income) loss of Host Inc. – continuing operations |
|
| (268 | ) |
|
| (77 | ) |
|
| 4 |
|
State income tax provision, net |
|
| 1 |
|
|
| 5 |
|
|
| 2 |
|
Provision for uncertain tax positions |
|
| 5 |
|
|
| 2 |
|
|
| 2 |
|
Foreign income tax provision |
|
| 11 |
|
|
| 10 |
|
|
| 15 |
|
Income tax provision – continuing operations |
| $ | 14 |
|
| $ | 21 |
|
| $ | 31 |
|
Cash paid for income taxes, net of refunds received, was $22 million, $17 million, and $12 million in 2014, 2013, and 2012, respectively.
A reconciliation of the beginning and ending amount of unrecognized tax benefits is as follows (in millions):
|
| 2014 |
|
| 2013 |
| ||
Balance at January 1 |
| $ | 5 |
|
| $ | 3 |
|
State increases |
|
| 2 |
|
|
| - |
|
Other increases |
|
| 3 |
|
|
| 2 |
|
Balance at December 31 |
| $ | 10 |
|
| $ | 5 |
|
All of such uncertain tax position amounts, if recognized, would impact our reconciliation between the income tax provision calculated at the statutory U.S. federal income tax rate of 35% and the actual income tax provision recorded each year.
We expect an increase to the balance of unrecognized tax benefits within 12 months of the reporting date of approximately $4 million. As of December 31, 2014, the tax years that remain subject to examination by major tax jurisdictions generally include 2011-2014.
There were no material interest or penalties recognized for the years ended December 31, 2014, 2013 and 2012.
7. | Leases |
Taxable REIT Subsidiaries Leases
We lease substantially all of our hotels to a wholly owned subsidiary that qualifies as a taxable REIT subsidiary due to federal income tax restrictions on a REIT's ability to derive revenue directly from the operation and management of a hotel.
119
HOST HOTELS & RESORTS, INC., HOST HOTELS & RESORTS, L.P., AND SUBSIDIARIES
NOTES TO CONSOLIDATED FINANCIAL STATEMENTS
Vornado Lease
On July 30, 2012, we leased the retail and signage components of the New York Marriott Marquis to Vornado Realty Trust ("Vornado"). Vornado will redevelop and expand the existing retail space and a portion of the parking garage into a high-end retail space, as well as create a 25,000 square foot, block front, LED signage. The lease has a 20-year term and, over the term of the lease, each party has options that, if exercised, would result in ownership of the retail space being conveyed to Vornado at a price based on the future cash flow of the leased property. Minimum rental revenue is recognized on a straight-line basis over the term of the lease. The future minimum rental revenue under the non-cancelable lease is $12.5 million on an annual basis. Percentage rent is accrued when the specified income targets have been met.
Ground Leases
As of December 31, 2014, all or a portion of 35 of our hotels are subject to ground leases, generally with multiple renewal options, all of which are accounted for as operating leases. For lease agreements with scheduled rent increases, we recognize the lease expense ratably over the term of the lease. Certain of these leases contain provisions for the payment of contingent rentals based on a percentage of sales in excess of stipulated amounts.
Hospitality Properties Trust
We owned a leasehold interest in 53 Courtyard by Marriott hotels, which were sold to Hospitality Properties Trust ("HPT") and leased back to us in 1995. In connection with our conversion to a REIT, we entered into subleases with a subsidiary of Barceló Crestline Corporation ("Barceló") for these properties and Barceló guaranteed rent payments to HPT as part of the sublease. We terminated the subleases effective July 6, 2010 and resumed acting as owner under the management agreements. Effective upon termination of the subleases, we recorded the operations of the hotels as opposed to rental income. We terminated the lease effective December 31, 2012. At the expiration of the lease in 2012, HPT paid us deferred proceeds related to the initial sale of approximately $51 million. Approximately $11 million related to tenant collections accounts and $5 million for working capital were received in 2013.
Other Lease Information
We also have leases on facilities used in our former restaurant business, all of which we subsequently subleased. These leases and subleases contain one or more renewal options, generally for five or ten-year periods. The restaurant leases are accounted for as operating leases. Our contingent liability related to these leases is $13 million as of December 31, 2014. However, management considers the likelihood of any material funding related to these leases to be remote. Our leasing activity also includes those entered into by our hotels for various types of equipment, such as computer equipment, vehicles and telephone systems. Equipment leases are accounted for either as operating or capital leases, depending on the characteristics of the particular lease arrangement. Equipment leases that are characterized as capital leases are classified as furniture and equipment and are depreciated over the life of the lease. The amortization expense applicable to capitalized leases is included in depreciation expense.
The following table presents the future minimum annual rental commitments required under non-cancelable leases for which we are the lessee (in millions):
|
| As of December 31, 2014 |
| |||||
|
| Capital |
|
| Operating |
| ||
|
| Leases |
|
| Leases |
| ||
2015 |
| $ | 1 |
|
| $ | 46 |
|
2016 |
|
| - |
|
|
| 44 |
|
2017 |
|
| - |
|
|
| 44 |
|
2018 |
|
| - |
|
|
| 42 |
|
2019 |
|
| - |
|
|
| 40 |
|
Thereafter |
|
| - |
|
|
| 1,572 |
|
Total minimum lease payments |
| $ | 1 |
|
| $ | 1,788 |
|
Minimum payments for the operating leases have not been reduced by aggregate minimum sublease rentals from restaurants of approximately $10 million per year that are payable to us under non-cancelable subleases.
120
HOST HOTELS & RESORTS, INC., HOST HOTELS & RESORTS, L.P., AND SUBSIDIARIES
NOTES TO CONSOLIDATED FINANCIAL STATEMENTS
Rent expense is included in other property-level expenses on our consolidated statements of operations and consists of (in millions):
|
| Year ended December 31, |
| |||||||||
|
| 2014 |
|
| 2013 |
|
| 2012 |
| |||
Minimum rentals on operating leases |
| $ | 48 |
|
| $ | 50 |
|
| $ | 117 |
|
Additional rentals based on sales |
|
| 32 |
|
|
| 32 |
|
|
| 31 |
|
Rental payments based on real estate tax assessments |
|
| - |
|
|
| 24 |
|
|
| 23 |
|
Less: sublease rentals |
|
| (3 | ) |
|
| (3 | ) |
|
| (3 | ) |
|
| $ | 77 |
|
| $ | 103 |
|
| $ | 168 |
|
8. | Employee Stock Plans |
Upon the issuance of Host Inc.'s common stock under either of the two stock-based compensation plans described below, Host L.P. will issue to Host Inc. common OP units of an equivalent value. Accordingly, these liabilities and related disclosures are included in both Host Inc.'s and Host L.P.'s consolidated financial statements.
Host Inc. maintains two stock-based compensation plans, the Comprehensive Stock and Cash Incentive Plan (the "2009 Comprehensive Plan"), under which Host Inc. may award to participating employees restricted stock awards of Host Inc.'s common stock and options to purchase our common stock and the Employee Stock Purchase Plan ("ESPP"). At December 31, 2014, there were approximately 17 million shares of Host Inc.'s common stock reserved and available for issuance under the 2009 Comprehensive Plan.
We recognize costs resulting from share-based payments in our financial statements over their vesting periods. No compensation cost is recognized for awards for which employees do not render the requisite services. We classify share-based payment awards granted in exchange for employee services as either equity or liability awards. Equity awards are measured based on their fair value as of the date of grant. In contrast, liability awards are re-measured to fair value each reporting period.
During 2014, 2013 and 2012, we recorded stock-based compensation expense of approximately $22 million, $18 million and $16 million, respectively. Shares granted in 2014, 2013 and 2012 totaled 2.0 million, 2.2 million and 1.8 million, respectively, while 1.3 million, 1.2 million and 0.9 million shares, respectively, vested during those years.
Senior Executive Plan
During 2014, Host Inc. granted 1.5 million shares of restricted stock awards and 0.4 million shares of stock option awards, to senior executives (the "Annual Plan"), which amount represents the maximum number of shares that can be earned during the year if performance is at the "high" level of achievement. The stock option awards have an exercise price of $19.57 per share for performance year 2014. The restricted stock awards and stock option awards vest on an annual basis; therefore, no awards were outstanding at December 31, 2014.
Restricted stock awards
Vesting of restricted stock awards is based on (1) the achievement of relative total shareholder return ("TSR") and (2) the company and personal performance of employees attributable to specific management business objectives. Approximately 50% of the restricted stock awards are based on the satisfaction of the TSR compared to (i) the NAREIT index, (ii) the Standard & Poor's index, and (iii) a Selected Lodging Company index that serves as a relevant industry/asset specific measurement to our competitors, with the remaining 50% based on the achievement of management business objectives. Restricted stock awards granted to U.S. senior executives are classified as liability awards, due to settlement features that allow the recipient to have a percentage of the restricted stock awards withheld to meet tax requirements in excess of the statutory minimum withholding requirements. The fair value of these shares is adjusted at each balance sheet date and, at year end, is equal to the number of shares earned during the year at the December 31, 2014 stock price. Of the awards granted in 2014, 94% were classified as liability awards. In contrast, restricted stock awards granted to senior executives operating out of our international offices do not have this settlement feature and are considered equity awards. The fair value of these equity awards is based on the fair value on the grant date, and is not adjusted for subsequent movements in fair value.
121
HOST HOTELS & RESORTS, INC., HOST HOTELS & RESORTS, L.P., AND SUBSIDIARIES
NOTES TO CONSOLIDATED FINANCIAL STATEMENTS
During 2014, 2013 and 2012, we recorded compensation expense of approximately $18 million, $14 million and $12 million, respectively, related to the restricted stock awards to senior executives. The following table is a summary of the status of our senior executive plans for the three years ended December 31, 2014:
|
| Year ended December 31, |
| |||||||||||||||||||||
|
| 2014 |
|
| 2013 |
|
| 2012 |
| |||||||||||||||
|
| Shares |
|
| Fair Value |
|
| Shares |
|
| Fair Value |
|
| Shares |
|
| Fair Value |
| ||||||
|
| (in millions) |
|
| (per share) |
|
| (in millions) |
|
| (per share) |
|
| (in millions) |
|
| (per share) |
| ||||||
Balance, at beginning of year |
|
| - |
|
| $ | - |
|
|
| - |
|
| $ | - |
|
|
| - |
|
| $ | - |
|
Granted |
|
| 1.5 |
|
|
| 18 |
|
|
| 1.7 |
|
|
| 16 |
|
|
| 1.6 |
|
|
| 14 |
|
Vested (1) |
|
| (0.8 | ) |
|
| 24 |
|
|
| (0.8 | ) |
|
| 19 |
|
|
| (0.6 | ) |
|
| 16 |
|
Forfeited/expired |
|
| (0.7 | ) |
|
| 24 |
|
|
| (0.9 | ) |
|
| 19 |
|
|
| (1.0 | ) |
|
| 16 |
|
Balance, at end of year |
|
| - |
|
|
| - |
|
|
| - |
|
|
| - |
|
|
| - |
|
| - |
| |
Issued in calendar year (1) |
|
| 0.4 |
|
|
| 19 |
|
|
| 0.3 |
|
|
| 19 |
|
|
| 0.8 |
|
|
| 16 |
|
___________ |
|
|
|
|
|
|
|
|
|
|
|
|
|
|
|
|
|
|
|
|
|
|
|
|
(1) | Shares that vest at December 31 of each year are issued to the employees in the first quarter of the following year, although the requisite service period is complete. Accordingly, the 0.4 million shares issued in 2014 include shares vested at December 31, 2013, after adjusting for shares withheld to meet employee tax requirements. The shares withheld for employee tax requirements were valued at $6.1 million, $5.5 million and $9.5 million, for 2014, 2013 and 2012, respectively. |
Stock Option Awards
As of December 31, 2014, 0.8 million shares of stock option awards were outstanding and exercisable, with a weighted average remaining life of 8 years and a weighted average exercise price of $17.35 per share. During 2014, 2013 and 2012, stock option grants totaled 393,000, 420,000 and 201,000, respectively. Stock option compensation expense was $1.8 million, $1.8 million and $1.6 million during 2014, 2013 and 2012, respectively, and all stock option awards outstanding as of December 31, 2014 were fully vested. The stock option awards are equity classified awards, as they do not include cash settlement features. We expense stock option awards over the vesting period based on the estimated fair value of the options at the grant date using a binomial pricing model. The utilization of the binomial model requires us to make certain estimates related to the volatility of the share price of our common stock, risk-free interest rates and the amount of our awards expected to be forfeited, and our expected dividend yield. To calculate the fair value of stock option awards granted from 2012 to 2014, we assumed (i) a volatility ranging between 34% and 66%, (ii) a risk free rate ranging between 1.0% and 1.8%, (iii) a dividend yield of 3.5%, and (iv) an expected life of 5.5 years.
Other Stock Plans
In addition to the share-based plans described above, we maintain an upper-middle management plan and an employee stock purchase plan. The awards are time-based equity awards that vest within three years of the grant date and expense is recognized over the life of the award based on the grant date fair value. Through the employee stock purchase plan, employees can purchase stock at a 10% discount of the lower of the beginning and ending stock price each quarter. During 2014, 2013 and 2012, we granted 118,000 shares, 116,000 shares and 84,000 shares, respectively, under both of these programs and recorded expense of $2.2 million, $2.0 million and $1.9 million, respectively.
9. | Profit Sharing and Postemployment Benefit Plans |
We contribute to defined contribution plans for the benefit of employees who meet certain eligibility requirements and who elect participation in the plans. The discretionary amount to be matched by us is determined annually by Host Inc.'s Board of Directors. Our recorded liability for this obligation is not material. Payments for these items were not material for the three years ended December 31, 2014.
122
HOST HOTELS & RESORTS, INC., HOST HOTELS & RESORTS, L.P., AND SUBSIDIARIES
NOTES TO CONSOLIDATED FINANCIAL STATEMENTS
10. | Dispositions |
We disposed of five hotels in 2014, five hotels in 2013, and three hotels in 2012. Effective January 1, 2014, we adopted ASU 2014-08, Reporting for Discontinued Operations. As a result, operations and any gain or loss on sale of hotels sold subsequent to December 31, 2013 will continue to be reported in continuing operations. The results of properties sold in 2013 and 2012, including the gain on sale, will continue to be reported in discontinued operations
The following table provides summary results of operations for the five hotels sold in 2014, which are included in continuing operations (in millions):
| Year ended December 31, |
| ||||||
|
| 2014 |
|
| 2013 |
| ||
Revenues |
| $ | 72 |
|
| $ | 182 |
|
Income before taxes |
|
| 8 |
|
|
| 19 |
|
Gain on disposals |
|
| 229 |
|
|
| - |
|
Dispositions in 2014 included (i) the Dayton Marriott for $21 million, (ii) the Greensboro-High Point Marriott Airport for $19 million, (iii) the Tampa Marriott Waterside Hotel & Marina for $199 million, (iv) Courtyard Nashua for $10 million, and (v) an 89% controlling interest in the Philadelphia Marriott Downtown based on a gross sales price of $303 million.
In connection with the sale of Tampa Waterside Hotel & Marina, Greensboro-High Point Marriott Airport and the 89% interest in Philadelphia Marriott Downtown, we recorded gains of approximately $115 million, $3 million, and $111 million, respectively.
The following table provides summary results of operations for the five hotels sold in 2013 and the three hotels sold in 2012, which are included in discontinued operations (in millions):
|
| Year ended December 31, |
| |||||
|
| 2013 |
|
| 2012 |
| ||
Revenues |
| $ | 104 |
|
| $ | 264 |
|
Income before taxes |
|
| 22 |
|
|
| 24 |
|
Gain on disposals, net of tax |
|
| 97 |
|
|
| 48 |
|
Net income (loss) attributable to Host Inc. is allocated between continuing and discontinued operations as follows (in millions):
|
| Year ended December 31, |
| |||||
|
| 2013 |
|
| 2012 |
| ||
Continuing operations, net of tax |
| $ | 203 |
|
| $ | (10 | ) |
Discontinued operations, net of tax |
|
| 114 |
|
|
| 71 |
|
Net income attributable to Host Inc. |
| $ | 317 |
|
| $ | 61 |
|
Net income (loss) attributable to Host L.P. is allocated between continuing and discontinued operations as follows (in millions):
|
| Year ended December 31, |
| |||||
|
| 2013 |
|
| 2012 |
| ||
Continuing operations, net of tax |
| $ | 206 |
|
| $ | (9 | ) |
Discontinued operations, net of tax |
|
| 115 |
|
|
| 71 |
|
Net income attributable to Host L.P. |
| $ | 321 |
|
| $ | 62 |
|
123
HOST HOTELS & RESORTS, INC., HOST HOTELS & RESORTS, L.P., AND SUBSIDIARIES
NOTES TO CONSOLIDATED FINANCIAL STATEMENTS
11. | Acquisitions |
Business Combinations
We acquired two hotels during 2014 and recorded $2 million of acquisition related expenses and acquired one hotel during 2013 and recorded $1 million of acquisition related expenses. For 2014 and 2013, our business combinations were as follows:
● | On August 11, 2014, we acquired the 242-room b2 miami downtown hotel for approximately $58 million. |
● | On January 21, 2014, we acquired the 151-room Powell Hotel in San Francisco, California, including retail space and the fee simple interest in the land, for approximately $75 million. |
● | On May 31, 2013, we acquired the 426-room Hyatt Place Waikiki Beach in Honolulu, Hawaii for approximately $138.5 million. |
Accounting for the acquisition of a hotel property or an entity as a purchase transaction requires an allocation of the purchase price to the assets acquired and the liabilities assumed in the transaction at their respective estimated fair values. The purchase price allocations are estimated based on current available information.
The following table summarizes the estimated fair value of the assets acquired and liabilities assumed for our 2014 and 2013 hotel acquisitions (in millions):
|
| As of December 31, |
| |||||
|
| 2014 |
|
| 2013 |
| ||
Property and equipment |
| $ | 131 |
|
| $ | 138 |
|
FF&E Reserves and other assets |
|
| 3 |
|
|
| 1 |
|
Total assets |
|
| 134 |
|
|
| 139 |
|
Other liabilities |
|
| (1 | ) |
|
| - |
|
Net assets acquired |
| $ | 133 |
|
| $ | 139 |
|
124
HOST HOTELS & RESORTS, INC., HOST HOTELS & RESORTS, L.P., AND SUBSIDIARIES
NOTES TO CONSOLIDATED FINANCIAL STATEMENTS
Our summarized unaudited consolidated pro forma results of operations, assuming the 2014 and 2013 hotel acquisitions occurred on January 1, 2013 and 2012, respectively, and excluding the acquisition costs discussed above, are as follows (in millions, except per share and per unit amounts):
|
| Year ended December 31, |
| |||||
|
| 2014 |
|
| 2013 |
| ||
Revenues |
| $ | 5,362 |
|
| $ | 5,189 |
|
Income from continuing operations |
|
| 751 |
|
|
| 214 |
|
Net income |
|
| 751 |
|
|
| 329 |
|
|
|
|
|
|
|
|
|
|
Host Inc.: |
|
|
|
|
|
|
|
|
Net income attributable to Host Inc. |
| $ | 736 |
|
| $ | 321 |
|
|
|
|
|
|
|
|
|
|
Basic earnings per common share: |
|
|
|
|
|
|
|
|
Continuing operations |
| $ | .97 |
|
| $ | .27 |
|
Discontinued operations |
|
| - |
|
|
| .16 |
|
Basic earnings per common share |
| $ | .97 |
|
| $ | .43 |
|
|
|
|
|
|
|
|
|
|
Diluted earnings per common share: |
|
|
|
|
|
|
|
|
Continuing operations |
| $ | .97 |
|
| $ | .28 |
|
Discontinued operations |
|
| - |
|
|
| .15 |
|
Diluted earnings per common share |
| $ | .97 |
|
| $ | .43 |
|
|
|
|
|
|
|
|
|
|
Host L.P.: |
|
|
|
|
|
|
|
|
Net income attributable to Host L.P. |
| $ | 745 |
|
| $ | 325 |
|
|
|
|
|
|
|
|
|
|
Basic earnings per common share: |
|
|
|
|
|
|
|
|
Continuing operations |
| $ | .99 |
|
| $ | .29 |
|
Discontinued operations |
|
| - |
|
|
| .15 |
|
Basic earnings per common share |
| $ | .99 |
|
| $ | .44 |
|
|
|
|
|
|
|
|
|
|
Diluted earnings per common share: |
|
|
|
|
|
|
|
|
Continuing operations |
| $ | .99 |
|
| $ | .29 |
|
Discontinued operations |
|
| - |
|
|
| .15 |
|
Diluted earnings per common share |
| $ | .99 |
|
| $ | .44 |
|
For 2014 and 2013, we have included $39 million and $15 million of revenues, respectively, and $7 million and $2 million of net income, respectively, in our consolidated statements of operations related to the operations of the hotels acquired in 2014 and 2013.
New Development and Other Asset Acquisitions
For 2014 and 2013, our new development and other asset acquisitions were as follows:
● | In the fourth quarter of 2014, we completed construction and opened the 149-room Novotel and 256-room ibis Rio de Janeiro Parque Olimpico in Barra da Tijuca, both managed by Accor. We have invested approximately R$139 million ($65 million) in these hotels as of December 31, 2014. |
● | On December 10, 2013, we made the final incremental payment of $19.9 million for the purchase of the fee simple interest in the land at the New York Marriott Marquis Times Square. In addition, $25 million of the payments made pursuant to the terms of the ground lease have been attributed to the purchase of the land. The purchase was completed in conjunction with our 2012 lease of the existing retail space to Vornado and its on-going redevelopment. |
125
HOST HOTELS & RESORTS, INC., HOST HOTELS & RESORTS, L.P., AND SUBSIDIARIES
NOTES TO CONSOLIDATED FINANCIAL STATEMENTS
12. | Fair Value Measurements |
Overview
Our recurring fair value measurements consist of the valuation of our derivative instruments, all of which are designated as accounting hedges. Non-recurring fair value measurements during 2014 and 2013 consisted of the impairment of two of our hotel properties, which were both sold during 2014.
The following table details the fair value of our financial assets and liabilities that are required to be measured at fair value on a recurring basis, as well as non-recurring fair value measurements that we completed during 2014 and 2013 due to the impairment of non-financial assets (in millions):
|
|
|
|
|
| Fair Value at Measurement Date Using |
| |||||||||
|
| Balance at December 31, 2014 |
|
| Quoted Prices in Active Markets for Identical Assets (Level 1) |
|
| Significant Other Observable Inputs (Level 2) |
|
| Significant Unobservable Inputs (Level 3) |
| ||||
Fair Value Measurements on a Recurring Basis: |
|
|
|
|
|
|
|
|
|
|
|
|
|
|
|
|
Assets |
|
|
|
|
|
|
|
|
|
|
|
|
|
|
|
|
Foreign currency forward sale contracts (1) |
| $ | 13 |
|
| $ | - |
|
| $ | 13 |
|
| $ | - |
|
Liabilities |
|
|
|
|
|
|
|
|
|
|
|
|
|
|
|
|
Interest rate swap derivatives (1) |
|
| (2 | ) |
|
| - |
|
|
| (2 | ) |
|
| - |
|
|
|
|
|
|
|
|
|
|
|
|
|
|
|
|
|
|
Fair Value Measurements on a Non-recurring Basis: |
|
|
|
|
|
|
|
|
|
|
|
|
|
|
|
|
Impaired hotel properties sold (2) |
|
| - |
|
|
| - |
|
|
| - |
|
|
| 18 |
|
|
|
|
|
|
|
|
|
|
|
|
|
|
|
|
|
|
|
|
|
|
|
|
|
|
|
|
|
|
|
|
|
|
|
|
|
|
|
|
| Fair Value at Measurement Date Using |
| |||||||||
|
| Balance at December 31, 2013 |
|
| Quoted Prices in Active Markets for Identical Assets (Level 1) |
|
| Significant Other Observable Inputs (Level 2) |
|
| Significant Unobservable Inputs (Level 3) |
| ||||
Fair Value Measurements on a Recurring Basis: |
|
|
|
|
|
|
|
|
|
|
|
|
|
|
|
|
Assets |
|
|
|
|
|
|
|
|
|
|
|
|
|
|
|
|
Interest rate swap derivatives (1) |
| $ | 1 |
|
| $ | - |
|
| $ | 1 |
|
| $ | - |
|
Foreign currency forward sale contracts (1) |
|
| 3 |
|
|
| - |
|
|
| 3 |
|
|
| - |
|
Liabilities |
|
|
|
|
|
|
|
|
|
|
|
|
|
|
|
|
Interest rate swap derivatives (1) |
|
| (3 | ) |
|
| - |
|
|
| (3 | ) |
|
| - |
|
Foreign currency forward sale contracts (1) |
|
| (6 | ) |
|
| - |
|
|
| (6 | ) |
|
| - |
|
|
|
|
|
|
|
|
|
|
|
|
|
|
|
|
|
|
Fair Value Measurements on a Non-recurring Basis: |
|
|
|
|
|
|
|
|
|
|
|
|
|
|
|
|
Impaired hotel properties held and used (2) |
|
| 9 |
|
|
| - |
|
|
| - |
|
|
| 9 |
|
___________ |
|
|
|
|
|
|
|
|
|
|
|
|
|
|
|
|
(1) | These derivative contracts have been designated as hedging instruments. |
(2) | The fair value measurements are as of the measurement date of the impairment and may not reflect the book value as of December 31, 2014 and 2013, respectively. |
Impairment
During 2014, an impairment loss of $6 million was recorded related to the Dayton Marriott. The fair value was based on expected sale proceeds of the property, which property was sold on December 17, 2014. During 2013, an impairment loss of approximately $1 million was recorded related to the Courtyard Nashua. The fair value was based on expected sale proceeds of the property, which property was sold on February 12, 2014. The impairment losses are included in depreciation expense.
126
HOST HOTELS & RESORTS, INC., HOST HOTELS & RESORTS, L.P., AND SUBSIDIARIES
NOTES TO CONSOLIDATED FINANCIAL STATEMENTS
Derivatives and Hedging
Interest rate swap derivatives designated as cash flow hedges. We have designated our floating-to-fixed interest rate swap derivatives as cash flow hedges. The purpose of the interest rate swaps is to hedge against changes in cash flows (interest payments) attributable to fluctuations in variable rate debt. The derivatives are valued based on the prevailing market yield curve on the date of measurement. We also evaluate counterparty credit risk when we calculate the fair value of the swaps. Changes in the fair value of the derivatives are recorded to other comprehensive income (loss) on the accompanying balance sheets. The hedges were fully effective as of December 31, 2014. The following table summarizes our interest rate swap derivatives designated as cash flow hedges (in millions):
|
|
|
|
|
|
|
|
|
| Change in Fair Value | |||||
|
|
|
|
|
|
|
|
|
| Gain (Loss) | |||||
|
| Total Notional |
| Maturity |
| Swapped |
| All-in- |
| Year ended December 31, | |||||
Transaction Date |
| Amount |
| Date |
| Index |
| Rate |
| 2014 |
| 2013 | |||
November 2011 (1) |
| A$ | 62 |
| November 2016 |
| Reuters BBSY |
| 6.7% |
| $ | - |
| $ | 1 |
February 2011 (2) |
| NZ$ | 79 |
| February 2016 |
| NZ$ Bank Bill |
| 7.15% |
| $ | - |
| $ | 2 |
___________ |
|
|
|
|
|
|
|
|
|
|
|
|
|
|
|
(1) | The swap was entered into in connection with the A$86 million ($71 million) mortgage loan on the Hilton Melbourne South Wharf. |
(2) | The swap was entered into in connection with the NZ$105 million ($82 million) mortgage loan on seven properties in New Zealand. |
Foreign Investment Hedging Instruments. We have five foreign currency forward sale contracts that hedge a portion of the foreign currency exposure resulting from the eventual repatriation of our net investment in foreign operations. These derivatives are considered hedges of the foreign currency exposure of a net investment in a foreign operation and are marked-to-market with changes in fair value recorded to other comprehensive income (loss) within the equity portion of our balance sheet. The foreign currency forward sale contracts are valued based on the forward yield curve of the foreign currency to U.S. dollar forward exchange rate on the date of measurement. We also evaluate counterparty credit risk when we calculate the fair value of the derivatives. The following table summarizes our foreign currency forward sale contracts (in millions):
Currently Outstanding |
| Change in Fair Value - All Contracts |
| ||||||||||||||||
|
| Total |
|
|
|
|
|
|
|
|
|
|
|
|
|
|
| ||
|
| Transaction Amount in |
|
| Total Transaction |
|
|
|
| Gain (Loss) |
| ||||||||
Transaction Date |
| Foreign |
|
| Amount |
|
| Forward Purchase |
| Year ended December 31, |
| ||||||||
Range |
| Currency |
|
| in Dollars |
|
| Date Range |
| 2014 |
|
| 2013 |
| |||||
July 2011-May 2014 |
| € |
| 100 |
|
| $ | 135 |
|
| August 2015-May 2017 |
| $ | 18 |
|
| $ | (5 | ) |
November 2014 |
| C$ |
| 25 |
|
| $ | 22 |
|
| November 2016 |
| $ | 1 |
|
| $ | - |
|
In addition to the foreign currency forward sale contracts, we have designated a portion of the foreign currency draws on our credit facility as hedges of net investments in foreign operations. As a result, currency translation adjustments in the designated credit facility draws are recorded to other comprehensive income (loss) within the equity portion of our balance sheet, which adjustments offset a portion of the translation adjustment related to our foreign investments. The following table summarizes the draws on our credit facility that are designated as hedges of net investments in international operations (in millions):
|
| Balance |
| Balance |
| Gain (Loss) | ||||||
|
| Outstanding |
| Outstanding in |
| Year ended December 31, | ||||||
Currency |
| US$ |
| Foreign Currency |
| 2014 |
| 2013 | ||||
Canadian dollars (1) |
| $ | 27 |
| C$ | 31 |
| $ | 2 |
| $ | 2 |
Euros |
| $ | 93 |
| € | 77 |
| $ | 13 |
| $ | (5) |
___________ |
|
|
|
|
|
|
|
|
|
|
|
|
(1) | We have drawn an additional $65 million on the credit facility in Canadian dollars that has not been designated as a hedging instrument. |
127
HOST HOTELS & RESORTS, INC., HOST HOTELS & RESORTS, L.P., AND SUBSIDIARIES
NOTES TO CONSOLIDATED FINANCIAL STATEMENTS
Other Assets and Liabilities
Fair Value of Other Financial Assets and Liabilities. We did not elect the fair value measurement option for any of our other financial assets or liabilities. The fair values of secured debt and our credit facility are determined based on the expected future payments discounted at risk-adjusted rates. Senior Notes and the Exchangeable Senior Debentures are valued based on quoted market prices. The fair values of financial instruments not included in this table are estimated to be equal to their carrying amounts. The fair value of certain financial assets and liabilities and other financial instruments are shown below (in millions):
|
| As of December 31, |
| |||||||||||||
|
| 2014 |
|
| 2013 |
| ||||||||||
|
| Carrying Amount |
|
| Fair Value |
|
| Carrying Amount |
|
| Fair Value |
| ||||
Financial liabilities |
|
|
|
|
|
|
|
|
|
|
|
|
|
|
|
|
Senior notes (Level 1) |
| $ | 2,498 |
|
| $ | 2,668 |
|
| $ | 2,647 |
|
| $ | 2,766 |
|
Exchangeable Senior Debentures (Level 1) |
|
| 386 |
|
|
| 739 |
|
|
| 371 |
|
|
| 603 |
|
Credit facility (Level 2) |
|
| 704 |
|
|
| 704 |
|
|
| 946 |
|
|
| 946 |
|
Mortgage debt and other, excluding capital leases (Level 2) |
|
| 403 |
|
|
| 413 |
|
|
| 793 |
|
|
| 802 |
|
1 3 . | Hotel Management Agreements and Operating and License Agreements |
All of our hotels are managed by third parties pursuant to management or operating agreements, with some of our hotels also being subject to separate license agreements addressing matters pertaining to operation under the designated brand. The hotel brands of three of our managers, Marriott, Starwood and Hyatt, represent 56%, 25% and 12% of our total revenues, respectively. Under these agreements, the managers generally have sole responsibility for all activities necessary for the day-to-day operation of the hotels, including establishing room rates, processing reservations and promoting and publicizing the hotels. The managers also provide all employees for the hotels, prepare reports, budgets and projections, and provide other administrative and accounting support services to the hotels. For the majority of our properties, we have approval rights over budgets, capital expenditures, significant leases and contractual commitments, and various other matters.
The initial term of our agreements generally is 15 to 25 years, with one or more renewal terms at the option of the manager. The majority of our agreements condition the manager's right to exercise options for renewal upon the satisfaction of specified economic performance criteria. The manager typically receives a base management fee, which is calculated as a percentage (generally 2-3%) of annual gross revenues, and an incentive management fee, which typically is calculated as a percentage (generally 10-20%) of operating profit after the owner has received a priority return on its investment. In the case of our Starwood-managed hotels, the base management fee only is 1% of annual gross revenues, but that amount is supplemented by license fees payable to Starwood under a separate license agreement pertaining to the designated brand, including rights to use trademarks, service marks and logos, matters relating to compliance with certain brand standards and policies, and the provision of certain system programs and centralized services. Under the license agreement Starwood generally receives 5% of gross revenues attributable to room sales and 2% of gross revenues attributable to food and beverage sales in addition to a base management fee.
As part of the agreements, the manager furnishes the hotels with certain chain services, which generally are provided on a central or regional basis to all hotels in the manager's hotel system. Chain services include central training, advertising and promotion, national reservation systems, computerized payroll and accounting services, and such additional services as needed which may be more efficiently performed on a centralized basis. Costs and expenses incurred in providing such services are allocated among the hotels managed, owned or leased by the manager on a fair and equitable basis. In addition, our managers generally will sponsor a guest rewards program, the costs of which will be charged to all of the hotels that participate in such program.
We are obligated to provide the manager with sufficient funds, generally 5% of the revenue generated at the hotel, to cover the cost of (a) certain non-routine repairs and maintenance to the hotels which normally are capitalized, and (b) replacements and renewals to the hotels' furniture, fixtures and equipment. Under certain circumstances, we will be required to establish escrow accounts for such purposes under terms outlined in the agreements.
128
HOST HOTELS & RESORTS, INC., HOST HOTELS & RESORTS, L.P., AND SUBSIDIARIES
NOTES TO CONSOLIDATED FINANCIAL STATEMENTS
We generally are limited in our ability to sell, lease or otherwise transfer the hotels unless the transferee assumes the related management agreement. However, most agreements include owner rights to terminate the agreements on the basis of the manager's failure to meet certain performance-based metrics. Typically, these criteria are subject to the manager's ability to ‘cure' and avoid termination by payment to us of specified deficiency amounts (or, in some instances, waiver of the right to receive specified future management fees).
In addition to any performance-based or other termination rights, we have negotiated with Marriott, Starwood and some of our other managers specific termination rights related to specific agreements. These termination rights can take a number of different forms, including termination of agreements upon sale that leave the property unencumbered by any agreement; termination upon sale provided that the property continues to be operated under a license or franchise agreement with continued brand affiliation; as well as termination without sale or other condition, which may require the payment of a fee. These termination rights also may restrict the number of agreements that may be terminated over any annual or other period; impose limitations on the number of agreements terminated as measured by EBITDA; require that a certain number of properties continue to maintain the brand affiliation; or be restricted to a specific pool of assets.
1 4 . | Geographic and Business Segment Information |
We consider each one of our hotels to be an operating segment, none of which meets the threshold for a reportable segment. We also allocate resources and assess operating performance based on individual hotels. All of our other real estate investment activities (primarily our office buildings) are immaterial and, with our operating segments, meet the aggregation criteria, and thus, we report one segment: hotel ownership. Our international operations consist of hotels in six countries. There were no intersegment sales during the periods presented. The following table presents revenues and long-lived assets for each of the geographical areas in which we operate (in millions):
| 2014 |
|
| 2013 |
|
| 2012 |
| |||||||||||||||
| Revenues |
|
| Property and Equipment, net |
|
| Revenues |
|
| Property and Equipment, net |
|
| Revenues |
|
| Property and Equipment, net |
| ||||||
United States | $ | 5,077 |
|
| $ | 10,111 |
|
| $ | 4,895 |
|
| $ | 10,498 |
|
| $ | 4,791 |
|
| $ | 11,095 |
|
Australia |
| 39 |
|
|
| 102 |
|
|
| 40 |
|
|
| 106 |
|
|
| 42 |
|
|
| 133 |
|
Brazil |
| 36 |
|
|
| 82 |
|
|
| 30 |
|
|
| 76 |
|
|
| 33 |
|
|
| 39 |
|
Canada |
| 87 |
|
|
| 82 |
|
|
| 97 |
|
|
| 89 |
|
|
| 95 |
|
|
| 97 |
|
Chile |
| 32 |
|
|
| 44 |
|
|
| 34 |
|
|
| 54 |
|
|
| 37 |
|
|
| 63 |
|
Mexico |
| 29 |
|
|
| 26 |
|
|
| 24 |
|
|
| 32 |
|
|
| 25 |
|
|
| 26 |
|
New Zealand |
| 54 |
|
|
| 128 |
|
|
| 46 |
|
|
| 140 |
|
|
| 36 |
|
|
| 135 |
|
Total | $ | 5,354 |
|
| $ | 10,575 |
|
| $ | 5,166 |
|
| $ | 10,995 |
|
| $ | 5,059 |
|
| $ | 11,588 |
|
1 5 . | Guarantees and Contingencies |
We have certain guarantees which consist of commitments made to third parties for leases or debt that are not recognized in our consolidated financial statements due to various dispositions, spin-offs and contractual arrangements, but that we have agreed to pay in the event of certain circumstances, including the default by an unrelated party. We also may have contingent environmental liabilities related to the presence of hazardous or toxic substances. We consider the likelihood of any material payments under these guarantees and contingencies to be remote. The guarantees and contingencies that are not recognized in our consolidated financial statements are listed below:
● | We remain contingently liable for rental payments on certain divested non-lodging properties. These primarily represent certain restaurants that were sold subject to our guarantee of the future rental payments. The aggregate amount of these future rental payments is approximately $13 million as of December 31, 2014. |
● | In connection with the sale of two hotels in January 2005, we remain contingently liable for the amounts due under the respective ground leases. The future minimum lease payments are approximately $12 million through the full term of the leases, including renewal options. We believe that the likelihood of any material payments related to these ground leases is remote, and in each case, we have been indemnified by the purchaser of the hotel. |
129
HOST HOTELS & RESORTS, INC., HOST HOTELS & RESORTS, L.P., AND SUBSIDIARIES
NOTES TO CONSOLIDATED FINANCIAL STATEMENTS
Guarantees and environmental liabilities that are recorded on our consolidated balance sheet include:
● | In connection with the sale of the Atlanta Marriott Marquis in January 2013, we retained $5 million of contingent liabilities related to potential environmental liabilities. |
● | In connection with the sale of the Ritz-Carlton San Francisco hotel in June 2013, we agreed to guarantee the hotel's operating income through December 31, 2016. During this period, we will make support payments of up to $4 million a year, not to exceed $11 million for the life of the agreement. In 2014, we recognized approximately $3 million on the deferred gain. As of December 31, 2014, we have accrued $8 million for the guarantee. |
1 6 . | Legal Proceedings |
We are involved in various legal proceedings in the normal course of business regarding the operation of our hotels and company matters. To the extent not covered by insurance, these lawsuits generally fall into the following broad categories: disputes involving hotel-level contracts, employment litigation, compliance with laws such as the Americans with Disabilities Act, tax disputes and other general matters. Under our management agreements, our operators have broad latitude to resolve individual hotel-level claims for amounts generally less than $150,000. However, for matters exceeding such threshold, our operators may not settle claims without our consent.
Based on our analysis of legal proceedings with which we currently are involved or of which we are aware and our experience in resolving similar claims in the past, we have accrued approximately $35 million as of December 31, 2014. We have estimated that, in the aggregate, our losses related to these proceedings could be as much as $57 million. We believe this range represents the maximum potential loss for all of our legal proceedings. We are not aware of any other matters with a reasonably possible unfavorable outcome for which disclosure of a loss contingency is required. No assurances can be given as to the outcome of any pending legal proceedings.
San Antonio Litigation. In 2005 we initiated a lawsuit against Keystone-Texas Property Holding Corporation ("Keystone") seeking a declaration that a provision of the ground lease for the property under the San Antonio Marriott Rivercenter was valid and claiming that Keystone had breached that lease provision. Keystone filed an amended counterclaim and later, a third party claim, alleging that we had tortiously interfered with Keystone's attempted sale of the property and that we slandered Keystone's title to the property.
In 2010, we received an adverse jury verdict in the 166th Judicial District Court of Bexar County, Texas. The jury found that we tortiously interfered with the attempted sale by Keystone of the land under the San Antonio Marriott Rivercenter and awarded Keystone $34.3 million in damages, plus statutory interest. In addition, the jury found that we slandered Keystone's title to the property and awarded Keystone $39 million in damages, plus statutory interest. Keystone was only entitled to receive one of these damage awards. The jury also awarded Keystone $7.5 million in exemplary damages with respect to the second claim. In 2011, a three-judge panel of the San Antonio Court of Appeals issued its memorandum opinion denying our appeal of the trial court's final judgment.
In 2012, we filed a Petition for Review in the Texas Supreme Court. On June 13, 2014, the Texas Supreme Court reversed the court of appeals judgment, and Host was no longer liable for the jury verdict and punitive damages award. Keystone requested a rehearing of the Texas Supreme Court's decision, but that motion was denied on October 3, 2014, finalizing the Texas Supreme Court's decision. As a result, in the third quarter of 2014, we reversed the $69 million loss contingency previously recorded related to this litigation and the initial adverse verdict. In addition, a court-ordered bond of $25 million was released on October 17, 2014.
130
HOST HOTELS & RESORTS, INC., HOST HOTELS & RESORTS, L.P., AND SUBSIDIARIES
NOTES TO CONSOLIDATED FINANCIAL STATEMENTS
1 7 . | Quarterly Financial Data (unaudited) |
|
| 2014 |
| |||||||||||||
|
| First |
|
| Second |
|
| Third |
|
| Fourth |
| ||||
|
| Quarter |
|
| Quarter |
|
| Quarter |
|
| Quarter |
| ||||
|
| (in millions, except per share/unit amounts) |
| |||||||||||||
Host Hotels & Resorts, Inc.: |
|
|
|
|
|
|
|
|
|
|
|
|
|
|
|
|
Revenues |
| $ | 1,309 |
|
| $ | 1,431 |
|
| $ | 1,294 |
|
| $ | 1,320 |
|
Operating profit |
|
| 134 |
|
|
| 225 |
|
|
| 202 |
|
|
| 149 |
|
Income from continuing operations |
|
| 185 |
|
|
| 159 |
|
|
| 145 |
|
|
| 258 |
|
Net income |
|
| 185 |
|
|
| 159 |
|
|
| 145 |
|
|
| 258 |
|
Net income attributable to Host Hotels & Resorts, Inc. |
|
| 179 |
|
|
| 155 |
|
|
| 144 |
|
|
| 254 |
|
Basic earnings per common share: |
|
|
|
|
|
|
|
|
|
|
|
|
|
|
|
|
Continuing operations |
|
| .24 |
|
|
| .21 |
|
|
| .19 |
|
|
| .34 |
|
Discontinued operations |
|
| - |
|
|
| - |
|
|
| - |
|
|
| - |
|
Basic earnings per common share |
|
| .24 |
|
|
| .21 |
|
|
| .19 |
|
|
| .34 |
|
Diluted earnings per common share: |
|
|
|
|
|
|
|
|
|
|
|
|
|
|
|
|
Continuing operations |
|
| .24 |
|
|
| .21 |
|
|
| .19 |
|
|
| .33 |
|
Discontinued operations |
|
| - |
|
|
| - |
|
|
| - |
|
|
| - |
|
Diluted earnings per common share |
|
| .24 |
|
|
| .21 |
|
|
| .19 |
|
|
| .33 |
|
Host Hotels & Resorts, L.P. (1) : |
|
|
|
|
|
|
|
|
|
|
|
|
|
|
|
|
Net income attributable to Host Hotels & Resorts, L.P. |
|
| 181 |
|
|
| 157 |
|
|
| 146 |
|
|
| 257 |
|
Basic earnings per common unit: |
|
|
|
|
|
|
|
|
|
|
|
|
|
|
|
|
Continuing operations |
|
| .24 |
|
|
| .21 |
|
|
| .19 |
|
|
| .34 |
|
Discontinued operations |
|
| - |
|
|
| - |
|
|
| - |
|
|
| - |
|
Basic earnings per common unit |
|
| .24 |
|
|
| .21 |
|
|
| .19 |
|
|
| .34 |
|
Diluted earnings per common unit: |
|
|
|
|
|
|
|
|
|
|
|
|
|
|
|
|
Continuing operations |
|
| .24 |
|
|
| .21 |
|
|
| .19 |
|
|
| .34 |
|
Discontinued operations |
|
| - |
|
|
| - |
|
|
| - |
|
|
| - |
|
Diluted earnings per common unit |
|
| .24 |
|
|
| .21 |
|
|
| .19 |
|
|
| .34 |
|
131
HOST HOTELS & RESORTS, INC., HOST HOTELS & RESORTS, L.P., AND SUBSIDIARIES
NOTES TO CONSOLIDATED FINANCIAL STATEMENTS
|
| 2013 |
| |||||||||||||
|
| First |
|
| Second |
|
| Third |
|
| Fourth |
| ||||
|
| Quarter |
|
| Quarter |
|
| Quarter |
|
| Quarter |
| ||||
|
| (in millions, except per share/unit amounts) |
| |||||||||||||
Host Hotels & Resorts, Inc.: |
|
|
|
|
|
|
|
|
|
|
|
|
|
|
|
|
Revenues |
| $ | 1,224 |
|
| $ | 1,399 |
|
| $ | 1,211 |
|
| $ | 1,331 |
|
Operating profit |
|
| 90 |
|
|
| 205 |
|
|
| 79 |
|
|
| 138 |
|
Income from continuing operations |
|
| 34 |
|
|
| 116 |
|
|
| 2 |
|
|
| 59 |
|
Income from discontinued operations |
|
| 26 |
|
|
| 5 |
|
|
| 16 |
|
|
| 67 |
|
Net income |
|
| 60 |
|
|
| 121 |
|
|
| 18 |
|
|
| 126 |
|
Net income attributable to Host Hotels & Resorts, Inc. |
|
| 56 |
|
|
| 119 |
|
|
| 19 |
|
|
| 123 |
|
Basic earnings per common share: |
|
|
|
|
|
|
|
|
|
|
|
|
|
|
|
|
Continuing operations |
|
| .04 |
|
|
| .15 |
|
|
| .01 |
|
|
| .07 |
|
Discontinued operations |
|
| .04 |
|
|
| .01 |
|
|
| .02 |
|
|
| .09 |
|
Basic earnings per common share |
|
| .08 |
|
|
| .16 |
|
|
| .03 |
|
|
| .16 |
|
Diluted earnings per common share: |
|
|
|
|
|
|
|
|
|
|
|
|
|
|
|
|
Continuing operations |
|
| .04 |
|
|
| .15 |
|
|
| .01 |
|
|
| .07 |
|
Discontinued operations |
|
| .04 |
|
|
| .01 |
|
|
| .02 |
|
|
| .09 |
|
Diluted earnings per common share |
|
| .08 |
|
|
| .16 |
|
|
| .03 |
|
|
| .16 |
|
Host Hotels & Resorts, L.P. (1) : |
|
|
|
|
|
|
|
|
|
|
|
|
|
|
|
|
Net income attributable to Host Hotels & Resorts, L.P. |
|
| 57 |
|
|
| 120 |
|
|
| 19 |
|
|
| 125 |
|
Basic earnings per common unit: |
|
|
|
|
|
|
|
|
|
|
|
|
|
|
|
|
Continuing operations |
|
| .04 |
|
|
| .15 |
|
|
| .01 |
|
|
| .08 |
|
Discontinued operations |
|
| .04 |
|
|
| .01 |
|
|
| .02 |
|
|
| .09 |
|
Basic earnings per common unit |
|
| .08 |
|
|
| .16 |
|
|
| .03 |
|
|
| .17 |
|
Diluted earnings per common unit: |
|
|
|
|
|
|
|
|
|
|
|
|
|
|
|
|
Continuing operations |
|
| .04 |
|
|
| .15 |
|
|
| .01 |
|
|
| .08 |
|
Discontinued operations |
|
| .04 |
|
|
| .01 |
|
|
| .02 |
|
|
| .09 |
|
Diluted earnings per common unit |
|
| .08 |
|
|
| .16 |
|
|
| .03 |
|
|
| .17 |
|
___________ |
|
|
|
|
|
|
|
|
|
|
|
|
|
|
|
|
(1) | Other income statement line items not presented for Host L.P. are equal to the amounts presented for Host Inc. |
The sum of the basic and diluted earnings per common share and OP units for the four quarters in all years presented differs from the annual earnings per common share and OP units due to the required method of computing the weighted average number of shares and OP units in the respective periods.
132
Item 9. | Changes in and Disagreements with Accountants on Accounting and Financial Disclosure |
None.
Item 9A. | Controls and Procedures |
Controls and Procedures (Host Hotels & Resorts, Inc.)
Disclosure Controls and Procedure
Under the supervision and with the participation of our management, including Host Inc.'s Chief Executive Officer and Chief Financial Officer, we have evaluated the effectiveness of our disclosure controls and procedures pursuant to Exchange Act Rule 13a-15(b) as of the end of the period covered by this report. Based on that evaluation, Host Inc.'s Chief Executive Officer and Chief Financial Officer have concluded that these disclosure controls and procedures were effective to provide reasonable assurance that information required to be disclosed by us in reports we file or submit under the Exchange Act is (1) recorded, processed, summarized and reported within the time periods specified in the Securities and Exchange Commission's rules and forms and (2) accumulated and communicated to our management, including Host Inc.'s Chief Executive Officer and Chief Financial Officer, as appropriate to allow timely decisions regarding required disclosures.
Internal Control over Financial Reporting
Management is responsible for establishing and maintaining adequate internal control over financial reporting for Host Inc. With the participation of Host Inc.'s Chief Executive Officer and Chief Financial Officer, management conducted an evaluation of the effectiveness of our internal control over financial reporting as of December 31, 2014 based on the Internal Control-Integrated Framework (2013) issued by the Committee of Sponsoring Organizations of the Treadway Commission. Based on this evaluation, management concluded that our internal control over financial reporting was effective as of December 31, 2014. There were no changes in our internal control over financial reporting during the quarter ended December 31, 2014 that have materially affected, or are reasonably likely to materially affect, our internal control over financial reporting.
Our independent registered public accounting firm, KPMG LLP, has issued an attestation report on the effectiveness of our internal control over financial reporting of Host Inc., which appears in Item 8.
Controls and Procedures (Host Hotels & Resorts, L.P.)
Disclosure Controls and Procedures
Under the supervision and with the participation of our management, including Host Inc.'s Chief Executive Officer and Chief Financial Officer, we have evaluated the effectiveness of our disclosure controls and procedures pursuant to Exchange Act Rule 13a-15(b) as of the end of the period covered by this report. Based on that evaluation, Host Inc.'s Chief Executive Officer and Chief Financial Officer have concluded that these disclosure controls and procedures were effective to provide reasonable assurance that information required to be disclosed by us in reports we file or submit under the Exchange Act is (1) recorded, processed, summarized and reported within the time periods specified in the Securities and Exchange Commission's rules and forms and (2) accumulated and communicated to our management, including Host Inc.'s Chief Executive Officer and Chief Financial Officer, as appropriate to allow timely decisions regarding required disclosures.
Internal Control over Financial Reporting
Management is responsible for establishing and maintaining adequate internal control over financial reporting for Host L.P. With the participation of Host Inc.'s Chief Executive Officer and Chief Financial Officer, management conducted an evaluation of the effectiveness of our internal control over financial reporting as of December 31, 2014 based on the Internal Control–Integrated Framework (2013) issued by the Committee of Sponsoring Organizations of the Treadway Commission. Based on this evaluation, management concluded that our internal control over financial reporting was effective as of December 31, 2014. There were no changes in our internal control over financial reporting during the quarter ended December 31, 2014 that have materially affected, or are reasonably likely to materially affect, our internal control over financial reporting.
This annual report does not include an attestation report of Host L.P.'s independent registered public accounting firm regarding internal control over financial reporting. Management's report was not subject to attestation by Host L.P.'s registered public accounting firm pursuant to rules of the Securities and Exchange Commission applicable to "non-accelerated filers."
Item 9B. | Other Information |
None.
133
PART III
Certain information called for by Items 10-14 is incorporated by reference from Host Inc.'s 2015 Annual Meeting of Stockholders Notice and Proxy Statement (to be filed pursuant to Regulation 14A not later than 120 days after the close of our fiscal year).
Item 10. | Directors, Executive Officers and Corporate Governance |
The information required by this item with respect to directors is incorporated by reference to the section of Host Inc.'s definitive Proxy Statement for its 2015 Annual Meeting of Stockholders entitled "Proposal One: Election of Directors." See Part I "Executive Officers" of this Annual Report for information regarding executive officers.
The information required by this item with respect to Audit Committee and Audit Committee Financial Experts is incorporated by reference to the section of Host Inc.'s definitive Proxy Statement for its 2015 Annual Meeting of Stockholders entitled "Corporate Governance and Board Matters." There have been no material changes to the procedures by which stockholders may recommend nominees to the Board of Directors since our last annual report.
We have adopted a Code of Business Conduct and Ethics that applies to all employees. In compliance with the applicable rules of the SEC, special ethics obligations of our Chief Executive Officer, Chief Financial Officer, Corporate Controller and other employees who perform financial or accounting functions are set forth in Section 10 of the Code of Business Conduct and Ethics, entitled "Special Ethics Obligations of Employees with Financial Reporting Obligations." The Code is available at the Investor Information/Governance section of our website at www.hosthotels.com . A copy of the Code is available in print, free of charge, to stockholders and unitholders upon request to the company at the address set forth in Item 1 of this Annual Report under the section "Business-Where to Find Additional Information." We intend to satisfy the disclosure requirements under the Securities and Exchange Act of 1934, as amended, regarding an amendment to or waiver from a provision of our Code of Business Conduct and Ethics by posting such information on our web site.
Item 11. | Executive Compensation |
The information required by this item is incorporated by reference to the sections of Host Inc.'s definitive Proxy Statement for its 2015 Annual Meeting of Stockholders entitled: "Compensation Discussion and Analysis," "Executive Officer Compensation," "Director Compensation," "Corporate Governance and Board Matters-Compensation Policy Committee Interlocks and Insider Participation" and "Report of the Compensation Policy Committee on Executive Compensation."
Item 12. | Security Ownership of Certain Beneficial Owners and Management and Related Stockholder and Unitholder Matters |
The information required by this item is incorporated by reference to the sections of Host Inc.'s definitive Proxy Statement for its 2015 Annual Meeting of Stockholders entitled: "Security Ownership of Certain Beneficial Owners and Management" and "Executive Officer Compensation-Securities Authorized for Issuance Under Equity Compensation Plans."
Item 13. | Certain Relationships and Related Transactions, and Director Independence |
The information required by this item is incorporated by reference to the sections of Host Inc.'s definitive Proxy Statement for its 2015 Annual Meeting of Stockholders entitled: "Certain Relationships and Related Person Transactions" and "Corporate Governance and Board Matters-Independence of Directors."
Item 14. | Principal Accountant Fees and Services |
The information required by this item is incorporated by reference to the section of Host Inc.'s definitive Proxy Statement for its 2015 Annual Meeting of Stockholders entitled "Auditor Fees."
134
PART IV
Item 15. | Exhibits and Financial Statement Schedules. |
(a) | LIST OF DOCUMENTS FILED AS PART OF THIS REPORT |
(i) FINANCIAL STATEMENTS
All financial statements of the registrants are set forth under Item 8 of this Report on Form 10-K.
(ii) FINANCIAL STATEMENT SCHEDULES
The following financial information is filed herewith on the pages indicated.
Financial Schedules:
|
|
|
| Page |
|
III. |
| Real Estate and Accumulated Depreciation. |
| S-1 to S-5 |
|
All other schedules are omitted because they are not applicable or the required information is included in the consolidated financial statements or notes thereto.
(b) EXHIBITS
In reviewing the agreements included as exhibits to this report, please remember they are included to provide you with information regarding their terms and are not intended to provide any other factual or disclosure information about the company, its subsidiaries or other parties to the agreements. The agreements contain representations and warranties by each of the parties to the applicable agreement. These representations and warranties have been made solely for the benefit of the other parties to the applicable agreement and:
● | should not in all instances be treated as categorical statements of fact, but rather as a way of allocating the risk to one of the parties if those statements prove to be inaccurate; |
● | have been qualified by disclosures that were made to the other party in connection with the negotiation of the applicable agreement, which disclosures are not necessarily reflected in the agreement; |
● | may apply standards of materiality in a way that is different from what may be viewed as material to you or other investors; and |
● | were made only as of the date of the applicable agreement or such other date or dates as may be specified in the agreement and are subject to more recent developments. |
Accordingly, these representations and warranties may not describe the actual state of affairs as of the date they were made or at any other time.
135
Exhibit No. |
| Description |
|
|
|
3. |
| Articles of Incorporation and Bylaws |
|
|
|
3.1 |
| Articles of Restatement of Articles of Incorporation of Host Hotels & Resorts, Inc. (incorporated by reference to Exhibit 3.3 of Host Hotels & Resorts, L.P. Registration Statement on Form S-4 (SEC File No. 333-170934), filed on December 2, 2010). |
|
|
|
3.1A |
| Third Amended and Restated Agreement of Limited Partnership of Host Hotels & Resorts, L.P. (incorporated by reference to Exhibit 3.1 of Host Hotels & Resorts, L.P.'s Annual Report on Form 10-K for the year ended December 31, 2006, filed on March 1, 2007). |
|
|
|
3.2 |
| Amended and Restated Bylaws of Host Hotels & Resorts, Inc., effective November 6, 2008 (incorporated by reference to Exhibit 3.3 of Host Hotels & Resorts, Inc.'s Current Report on Form 8-K, filed on November 12, 2008). |
|
|
|
3.3 |
| Articles Supplementary of Host Hotels & Resorts, Inc. filed with the State Department of Assessments and Taxation of Maryland on March 27, 2014 (incorporated by reference to Exhibit 3.3 of Host Hotels & Resorts, Inc.'s Current Report on Form 8-K filed on March 27, 2014). |
|
|
|
4. |
| Instruments Defining Rights of Security Holders |
|
|
|
4.1 |
| See Exhibit 3.1 and 3.2 for provisions of the Articles and Bylaws of Host Hotels & Resorts, Inc. defining the rights of security holders. See Exhibit 3.1A for provisions of the Agreement of Limited Partnership of Host Hotels & Resorts, L.P. defining the rights of security holders. |
|
|
|
4.2 |
| Form of Common Stock Certificate (incorporated herein by reference to Exhibit 4.7 to Host Marriott Corporation's Amendment No. 4 to its Registration Statement on Form S-4 (SEC File No. 333-55807) filed on October 2, 1998). |
|
|
|
4.3 |
| Amended and Restated Indenture dated as of August 5, 1998, by and among HMH Properties, Inc., as Issuer, and the Subsidiary Guarantors named therein, and Marine Midland Bank, as Trustee (incorporated by reference to Exhibit 4.1 of Host Marriott Corporation's Current Report on Form 8-K dated August 6, 1998) (SEC File No. 001-05664). |
|
|
|
4.4 |
| Third Supplemental Indenture, dated as of December 14, 1998, by and among HMH Properties Inc., Host Marriott, L.P., the entities identified therein as New Subsidiary Guarantors and Marine Midland Bank, as Trustee, to the Amended and Restated Indenture, dated as of August 5, 1998, among the Company, the Guarantors named therein, Subsidiary Guarantors named therein and the Trustee (incorporated by reference to Exhibit 4.3 of Host Marriott, L.P.'s Current Report on Form 8-K filed with the Commission on December 31, 1998) (SEC File No. 333-55807). |
|
|
|
4.5 |
| Thirty-Second Supplemental Indenture, dated December 22, 2009, by and among Host Hotels & Resorts, L.P., Host Hotels & Resorts, Inc., the Subsidiary Guarantors named therein and The Bank of New York Mellon (formerly, The Bank of New York) as successor to HSBC Bank USA (formerly, Marine Midland Bank), as trustee, to the Amended and Restated Indenture dated August 5, 1998, including form of debenture (incorporated by reference to Exhibit 4.1 to Host Hotels & Resorts, Inc.'s Current Report on Form 8-K, filed December 23, 2009). |
|
|
|
4.6 |
| Registration Rights Agreement, dated December 22, 2009, among Host Hotels & Resorts, L.P., Host Hotels & Resorts, Inc. and Deutsche Bank Securities Inc., Merrill Lynch, Pierce, Fenner & Smith Incorporated and J.P. Morgan Securities Inc., in their capacity as representatives of the several initial purchasers of the debentures, related to the 2.50% Exchangeable Senior Debentures due 2029 (incorporated by reference to Exhibit 10.1 to Host Hotels & Resorts, Inc.'s Current Report on Form 8-K filed on December 23, 2009). |
|
|
|
4.7 |
| Thirty-Sixth Supplemental Indenture, dated October 25, 2010, by and among Host Hotels & Resorts, L.P., the Subsidiary Guarantors named therein and The Bank of New York Mellon, as successor to HSBC Bank USA (formerly, Marine Midland Bank), as trustee, to the Amended and Restated Indenture dated August 5, 1998, including form of debenture (incorporated by reference to Exhibit 4.1 to Host Hotels & Resorts, Inc.'s Current Report on Form 8-K, filed on October 29, 2010). |
|
|
|
4.8 |
| Thirty-Ninth Supplemental Indenture, dated May 11, 2011, by and among Host Hotels & Resorts, L.P., the Subsidiary Guarantors named therein and the Bank of New York Mellon, as trustee, to the Amended and Restated Indenture dated August 5, 1998, including form of debenture (incorporated by reference to Exhibit 4.1 to Host Hotels & Resorts, Inc.'s Current Report on Form 8-K, filed May 12, 2011). |
|
|
|
4.9 |
| Forty-First Supplemental Indenture, dated November 18, 2011, by and among Host Hotels & Resorts, L.P., the Subsidiary Guarantors named therein and The Bank of New York Mellon, as trustee, to the Amended and Restated Indenture dated August 5, 1998, including form of debenture (incorporated by reference to Exhibit 4.1 to the combined Current Report on Form 8-K of Host Hotels & Resorts, Inc., and Host Hotels & Resorts L.P., filed on November 18, 2011). |
|
|
|
136
Exhibit No. |
| Description |
4.10 |
| Forty-Second Supplemental Indenture, dated March 22, 2012, by and among Host Hotels & Resorts, L.P. and The Bank of New York Mellon, as trustee, to the Amended and Restated Indenture dated August 5, 1998, including form of debenture (incorporated by reference to Exhibit 4.1 to the combined Current Report on Form 8-K of Host Hotels & Resorts, Inc., and Host Hotels & Resorts L.P., filed on March 23, 2012). |
|
|
|
4.11 |
| Forty-Third Supplemental Indenture, dated August 9, 2012, by and among Host Hotels & Resorts, L.P. and The Bank of New York Mellon, as trustee, to the Amended and Restated Indenture dated August 5, 1998, including form of debenture (incorporated by reference to Exhibit 4.1 to the combined Current Report on Form 8-K of Host Hotels & Resorts, Inc., and Host Hotels & Resorts L.P., filed on August 9, 2012). |
|
|
|
4.12 |
| Forty-Fourth Supplemental Indenture, dated March 28, 2013, by and among Host Hotels & Resorts, L.P. and The Bank of New York Mellon, as trustee, to the Amended and Restated Indenture dated August 5, 1998, including form of debenture (incorporated by reference to Exhibit 4.1 to the combined Current Report on Form 8-K of Host Hotels & Resorts, Inc., and Host Hotels & Resorts L.P., filed on March 28, 2013). |
|
|
|
10. |
| Material Contracts |
|
|
|
10.1 |
| Host Hotels & Resorts, L.P. Executive Deferred Compensation Plan as amended and restated effective January 1, 2014 (incorporated by reference to Exhibit 10.1 of Host Hotels & Resorts, Inc. and Host Hotels & Resorts, L.P. Annual Report on Form 10-K for the year ended December 31, 2013, filed on February 25, 2014). |
|
|
|
10.2 |
| Trust Agreement between Wilmington Trust Company and Host Hotels & Resorts, L.P., dated June 1, 2006, relating to the Host Hotels & Resorts, L.P. Executive Deferred Compensation Plan (incorporated by reference to Exhibit 10.2 of Host Hotels & Resorts, Inc. and Host Hotels & Resorts, L.P. Annual Report on Form 10-K for the year ended December 31, 2013, filed on February 25, 2014). |
|
|
|
10.3 |
| Host Marriott Corporation and Host Marriott, L.P. 1997 Comprehensive Stock and Cash Incentive Plan, as amended and restated December 29, 1998, as amended January 2004 (incorporated by reference to Exhibit 10.7 of Host Marriott Corporation's Annual Report on Form 10-K for the year ended December 31, 2003, filed March 2, 2004). |
|
|
|
10.4 |
| Host Hotels & Resorts, Inc.'s Severance Plan for Executives, as amended and restated, effective as of December 16, 2013 (incorporated by reference to Exhibit 10.2 of Host Hotels & Resorts, Inc. and Host Hotels & Resorts, L.P. Annual Report on Form 10-K for the year ended December 31, 2013, filed on February 25, 2014). |
|
|
|
10.5 |
| Indemnification Agreement for officers and directors of Host Hotels & Resorts, Inc. (incorporated by reference to Exhibit 10.7 of Host Hotels & Resorts, Inc. and Host Hotels & Resorts, L.P. Annual Report on Form 10-K for the year ended December 31, 2011, filed on February 22, 2012). |
|
|
|
10.6 |
| Host Hotels & Resorts 2009 Comprehensive Stock and Cash Incentive Plan, effective as of March 12, 2009 (incorporated by reference to Appendix A to the Host Hotels & Resorts, Inc. Definitive Proxy Statement on Schedule 14A filed with the Commission on March 31, 2009). |
|
|
|
10.7 |
| Form of Restricted Stock Agreement for use under the Host Hotels & Resorts 2009 Comprehensive Stock and Cash Incentive Plan (incorporated by reference to Exhibit 10.33 of Host Hotels & Resorts, Inc.'s Quarterly Report on Form 10-Q, filed July 28, 2009). |
|
|
|
10.8 |
| Form of Option Agreement for use under the Host Hotels & Resorts 2009 Comprehensive Stock and Cash Incentive Plan (incorporated by reference to Exhibit 10.34 of Host Hotels & Resorts, Inc.'s Quarterly Report on Form 10-Q, filed July 28, 2009). |
|
|
|
10.9 |
| Amended and Restated Host Hotels & Resorts, Inc. and Host Hotels & Resorts, L.P. Employee Stock Purchase Plan, effective as of January 1, 2008 (incorporated by reference to Exhibit 10.40 of Host Hotels & Resorts, Inc.'s Annual Report on Form 10-K for the year ended December 31, 2007 filed with the Commission on February 25, 2008). |
|
|
|
10.10# |
| Fifth Amended and Restated Agreement of Limited Partnership of HHR EURO CV, dated as of June 6, 2014, by and among HHR Euro II GP B.V., HST LP Euro B.V., HST Euro II LP B.V., APG Strategic Real Estate Pool N.V. and Jasmine Hotels Private Limited (incorporated by reference to Exhibit 10.2 of Host Hotels & Resorts, Inc. and Host Hotels & Resorts, L.P. Quarterly Report on Form 10-Q, filed on August 1, 2014). |
|
|
|
10.11 |
| Second Amended and Restated Credit Agreement, dated as of June 27, 2014, among Host Hotels & Resorts, L.P., certain Canadian subsidiaries of Host Hotels & Resorts, L.P., Bank of America, N.A., as administrative agent, JPMorgan Chase Bank, N.A., as syndication agent, Wells Fargo Bank, N.A., Deutsche Bank Securities, Inc., The Bank of Nova Scotia , Bank of New York Mellon, Credit Agricole Corporate & Investment Bank and Goldman Sachs Bank USA as documentation agents, and various other agents and lenders (incorporated by reference to Exhibit 10.1 of Host Hotels & Resorts, Inc. and Host Hotels & Resorts, L.P. Current Report on Form 8-K, filed on July 2, 2014). |
|
|
|
137
Exhibit No. |
| Description |
10.12 |
| Host Hotels & Resorts, Inc. Non-Employee Directors' Deferred Stock Compensation Plan, as amended and restated effective as of December 15, 2009, as further amended February 2, 2012 and February 6, 2014 (incorporated by reference to Exhibit 10.14 of Host Hotels & Resorts, Inc. and Host Hotels & Resorts L.P. Annual Report on Form 10-K for the year ended December 31, 2013, filed on February 25, 2014). |
|
|
|
12. |
| Statements re Computation of Ratios |
|
|
|
12.1* |
| Computation of Ratios of Earnings to Fixed Charges and Preferred Stock Dividends for Host Hotels & Resorts, Inc. |
|
|
|
12.2* |
| Computation of Ratios of Earnings to Fixed Charges and Preferred Unit Distributions for Host Hotels & Resorts, L.P. |
|
|
|
21. |
| Subsidiaries |
|
|
|
21.1* |
| List of Subsidiaries of Host Hotels & Resorts, Inc. |
|
|
|
21.2* |
| List of Subsidiaries of Host Hotels & Resorts, L.P. |
|
|
|
23. |
| Consents |
|
|
|
23* |
| Consent of KPMG LLP |
|
|
|
31. |
| Rule 13a-14(a)/15d-14(a) Certifications |
|
|
|
31.1* |
| Certification of Chief Executive Officer for Host Hotels & Resorts, Inc. pursuant to Section 302 of the Sarbanes-Oxley Act of 2002. |
|
|
|
31.2* |
| Certification of Chief Financial Officer for Host Hotels & Resorts, Inc. pursuant to Section 302 of the Sarbanes-Oxley Act of 2002. |
|
|
|
31.3* |
| Certification of Chief Executive Officer for Host Hotels & Resorts, L.P. pursuant to Section 302 of the Sarbanes-Oxley Act of 2002. |
|
|
|
31.4* |
| Certification of Chief Financial Officer for Host Hotels & Resorts, L.P. pursuant to Section 302 of the Sarbanes-Oxley Act of 2002. |
|
|
|
32. |
| Section 1350 Certifications |
|
|
|
32.1* |
| Certification of Chief Executive Officer and Chief Financial Officer for Host Hotels & Resorts, Inc. pursuant to 18 U.S.C. 1350, as created by Section 906 of the Sarbanes-Oxley Act of 2002.† |
|
|
|
32.2* |
| Certification of Chief Executive Officer and Chief Financial Officer for Host Hotels & Resorts, L.P. pursuant to 18 U.S.C. 1350, as created by Section 906 of the Sarbanes-Oxley Act of 2002.† |
101.INS |
| XBRL Instance Document. |
| Submitted electronically with this report. |
|
|
|
|
|
101.SCH |
| XBRL Taxonomy Extension Schema Document. |
| Submitted electronically with this report. |
|
|
|
|
|
101.CAL |
| XBRL Taxonomy Calculation Linkbase Document. |
| Submitted electronically with this report. |
|
|
|
|
|
101.DEF |
| XBRL Taxonomy Extension Definition Linkbase Document. |
| Submitted electronically with this report. |
|
|
|
|
|
101.LAB |
| XBRL Taxonomy Label Linkbase Document. |
| Submitted electronically with this report. |
|
|
|
|
|
101.PRE |
| XBRL Taxonomy Presentation Linkbase Document. |
| Submitted electronically with this report. |
Attached as Exhibit 101 to this report are the following documents formatted in XBRL (Extensible Business Reporting Language): (i) the Consolidated Statements of Operations for the Years ended December 31, 2014, 2013 and 2012, respectively, for Host Hotels & Resorts, Inc.; (ii) the Consolidated Balance Sheets at December 31, 2014 and December 31, 2013, respectively, for Host Hotels & Resorts, Inc.; (iii) the Consolidated Statements of Comprehensive Income (Loss) for the Years ended December 31, 2014, 2013 and 2012, respectively, for Host Hotels & Resorts, Inc.; (iv) the Consolidated Statements of Equity for the Years ended December 31, 2014, 2013 and 2012, respectively, for Host Hotels & Resorts, Inc.; (v) the Consolidated Statements of Cash Flows for the Years ended December 31, 2014, 2013 and 2012, respectively, for Host Hotels & Resorts, Inc.; (vi) the Consolidated Statements of Operations for the Years ended December 31, 2014, 2013 and 2012, respectively, for Host Hotels & Resorts, L.P.; (vii) the Consolidated Balance Sheets at December 31, 2014 and December 31, 2013, respectively, for Host Hotels & Resorts, L.P.; (viii) the Consolidated Statements of Comprehensive Income (Loss) for the Years ended December 31, 2014, 2013 and 2012, respectively, for Host Hotels & Resorts, L.P.; (ix) the Consolidated Statements of Capital for the Years ended December 31, 2014, 2013 and 2012, respectively, for Host Hotels & Resorts, L.P.; (x) the Consolidated Statement of Cash Flows for the Years ended December 31, 2014,
138
2013 and 2012, respectively, for Host Hotels & Resorts, L.P.; and (xi) Notes to the Consolidated Financial Statements that have been detail tagged.
|
* | Filed herewith. |
# | Confidential treatment requested. |
† | This certificate is being furnished solely to accompany the report pursuant to 18 U.S.C. 1350 and is not being filed for purposes of Section 18 of the Securities Exchange Act of 1934, as amended, and is not to be incorporated by reference into any filing of the Company, whether made before or after the date hereof, regardless of any general incorporation language in such filing. |
139
SIGNATURES
Pursuant to the requirements of Section 13 or 15(d) of the Securities Exchange Act of 1934, the Registrant has duly caused this report to be signed on its behalf by the undersigned, thereunto duly authorized.
|
|
| HOST HOTELS & RESORTS, INC. | |||||||
|
|
|
|
| ||||||
Date: February 24, 2015 |
|
| By: | /s/ GREGORY J. LARSON | ||||||
|
|
|
| Gregory J. Larson Executive Vice President, Chief Financial Officer | ||||||
Pursuant to the requirements of the Securities Exchange Act of 1934, this report has been signed below by the following persons on behalf of the registrant and in the capacities and on the dates indicated.
Signatures |
| Title |
| Date | |
|
|
|
|
| |
/s/ RICHARD E. MARRIOTT |
| Chairman of the Board of Directors |
| February 24, 2015 | |
Richard E. Marriott |
|
| |||
|
|
|
|
| |
/s/ W. EDWARD WALTER |
| President, Chief Executive Officer and Director (Principal Executive Officer) |
| February 24, 2015 | |
W. Edward Walter |
|
| |||
|
|
|
|
| |
/s/ GREGORY J. LARSON |
| Executive Vice President, Chief Financial Officer (Principal Financial Officer) |
| February 24, 2015 | |
Gregory J. Larson |
|
| |||
|
|
|
|
| |
/s/ BRIAN G. MACNAMARA |
| Senior Vice President, Corporate Controller (Principal Accounting Officer) |
| February 24, 2015 | |
Brian G. Macnamara |
|
| |||
|
|
|
|
| |
/s/ MARY L. BAGLIVO |
| Director |
| February 24, 2015 | |
Mary L. Baglivo |
|
| |||
|
|
|
|
| |
/s/ SHEILA C. BAIR |
| Director |
| February 24, 2015 | |
Sheila C. Bair |
|
| |||
|
|
|
|
| |
/s/ TERENCE C. GOLDEN |
| Director |
| February 24, 2015 | |
Terence C. Golden |
|
| |||
|
|
|
|
| |
/s/ ANN MCLAUGHLIN KOROLOGOS |
| Director |
| February 24, 2015 | |
Ann McLaughlin Korologos |
|
| |||
|
|
|
|
| |
/s/ JOHN B. MORSE, JR. |
| Director |
| February 24, 2015 | |
John B. Morse, Jr. |
|
| |||
|
|
|
|
| |
/s/ WALTER C. RAKOWICH |
| Director |
| February 24, 2015 | |
Walter C. Rakowich |
|
| |||
|
|
|
|
| |
/s/ GORDON H. SMITH |
| Director |
| February 24, 2015 | |
Gordon H. Smith |
|
| |||
140
SIGNATURES
Pursuant to the requirements of Section 13 or 15(d) of the Securities Exchange Act of 1934, the Registrant has duly caused this report to be signed on its behalf by the undersigned, thereunto duly authorized.
|
|
| HOST HOTELS & RESORTS, LP | |||||||
|
|
|
|
| ||||||
Date: February 24, 2015 |
|
| By: | HOST HOTELS & RESORTS, INC., its general partner | ||||||
|
|
|
|
| ||||||
|
|
| By: | /s/ GREGORY J. LARSON | ||||||
|
|
|
| Gregory J. Larson Executive Vice President, Chief Financial Officer | ||||||
Pursuant to the requirements of the Securities Exchange Act of 1934, this report has been signed below by the following officers and directors of Host Hotels & Resorts, Inc., the general partner of the registrant, and in the capacities and on the dates indicated.
Signatures |
| Title |
| Date |
|
|
|
|
|
/s/ RICHARD E. MARRIOTT |
| Chairman of the Board of Directors |
| February 24, 2015 |
Richard E. Marriott |
|
| ||
|
|
| ||
/s/ W. EDWARD WALTER |
| President, Chief Executive Officer and Director (Principal Executive Officer) |
| February 24, 2015 |
W. Edward Walter |
|
| ||
|
|
| ||
/s/ GREGORY J. LARSON |
| Executive Vice President, Chief Financial Officer (Principal Financial Officer) |
| February 24, 2015 |
Gregory J. Larson |
|
| ||
|
|
| ||
/s/ BRIAN G. MACNAMARA |
| Senior Vice President, Corporate Controller (Principal Accounting Officer) |
| February 24, 2015 |
Brian G. Macnamara |
|
| ||
|
|
| ||
/s/ MARY L. BAGLIVO |
| Director |
| February 24, 2015 |
Mary L. Baglivo |
|
| ||
|
|
| ||
/s/ SHEILA C. BAIR |
| Director |
| February 24, 2015 |
Sheila C. Bair |
|
| ||
|
|
| ||
/s/ TERENCE C. GOLDEN |
| Director |
| February 24, 2015 |
Terence C. Golden |
|
| ||
|
|
| ||
/s/ ANN MCLAUGHLIN KOROLOGOS |
| Director |
| February 24, 2015 |
Ann McLaughlin Korologos |
|
| ||
|
|
| ||
/s/ JOHN B. MORSE, JR. |
| Director |
| February 24, 2015 |
John B. Morse, Jr. |
|
| ||
|
|
| ||
/s/ WALTER C. RAKOWICH |
| Director |
| February 24, 2015 |
Walter C. Rakowich |
|
| ||
|
|
| ||
/s/ GORDON H. SMITH |
| Director |
| February 24, 2015 |
Gordon H. Smith |
|
| ||
141
SCHEDULE III
Page 1 of 5
HOST HOTELS & RESORTS, INC., HOST HOTELS & RESORTS, L.P., AND SUBSIDIARIES
REAL ESTATE AND ACCUMULATED DEPRECIATION
December 31, 2014
(in millions)
|
| Initial Cost |
|
| Subsequent |
|
| Foreign |
|
| Gross Amount at December 31, 2014 |
|
| Date of |
|
|
|
|
|
|
|
|
| |||||||||||||||||||||||||
|
|
|
|
|
|
|
|
|
| Buildings & |
|
| Costs |
|
| Currency |
|
|
|
|
|
| Buildings & |
|
|
|
|
|
| Accumulated |
|
| Completion of |
|
| Date |
|
| Depreciation |
| ||||||||
Description |
| Debt |
|
| Land |
|
| Improvements |
|
| Capitalized |
|
| Adjustment |
|
| Land |
|
| Improvements |
|
| Total |
|
| Depreciation |
|
| Construction |
|
| Acquired |
|
| Life |
| ||||||||||||
Hotels: |
|
|
|
|
|
|
|
|
|
|
|
|
|
|
|
|
|
|
|
|
|
|
|
|
|
|
|
|
|
|
|
|
|
|
|
|
|
|
|
|
|
|
|
|
|
|
|
|
Atlanta Marriott Perimeter Center |
| $ | - |
|
| $ | 15 |
|
| $ | 7 |
|
| $ | 35 |
|
|
| - |
|
| $ | 15 |
|
| $ | 42 |
|
| $ | 57 |
|
| $ | 28 |
|
|
| - |
|
|
| 1976 |
|
|
| 40 |
|
Atlanta Marriott Suites Midtown |
|
| - |
|
|
| - |
|
|
| 26 |
|
|
| 9 |
|
|
| - |
|
|
| - |
|
|
| 35 |
|
|
| 35 |
|
|
| 18 |
|
|
| - |
|
|
| 1996 |
|
|
| 40 |
|
Axiom Hotel |
|
| - |
|
|
| 36 |
|
|
| 38 |
|
|
| - |
|
|
| - |
|
|
| 36 |
|
|
| 38 |
|
|
| 74 |
|
|
| 1 |
|
|
| - |
|
|
| 2014 |
|
|
| 33 |
|
Boston Marriott Copley Place |
|
| - |
|
|
| - |
|
|
| 203 |
|
|
| 67 |
|
|
| - |
|
|
| - |
|
|
| 270 |
|
|
| 270 |
|
|
| 108 |
|
|
| - |
|
|
| 2002 |
|
|
| 40 |
|
Calgary Marriott Downtown |
|
| - |
|
|
| 5 |
|
|
| 18 |
|
|
| 18 |
|
|
| - |
|
|
| 5 |
|
|
| 36 |
|
|
| 41 |
|
|
| 21 |
|
|
| - |
|
|
| 1996 |
|
|
| 40 |
|
Chicago Marriott O'Hare |
|
| - |
|
|
| 4 |
|
|
| 26 |
|
|
| 41 |
|
|
| - |
|
|
| 5 |
|
|
| 66 |
|
|
| 71 |
|
|
| 40 |
|
|
| - |
|
|
| 1998 |
|
|
| 40 |
|
Chicago Marriott Suites Downers Grove |
|
| - |
|
|
| 2 |
|
|
| 14 |
|
|
| 7 |
|
|
| - |
|
|
| 2 |
|
|
| 21 |
|
|
| 23 |
|
|
| 11 |
|
|
| - |
|
|
| 1989 |
|
|
| 40 |
|
Chicago Marriott Suites O'Hare |
|
| - |
|
|
| 5 |
|
|
| 36 |
|
|
| 9 |
|
|
| - |
|
|
| 5 |
|
|
| 45 |
|
|
| 50 |
|
|
| 21 |
|
|
| - |
|
|
| 1997 |
|
|
| 40 |
|
Coronado Island Marriott Resort & Spa |
|
| - |
|
|
| - |
|
|
| 53 |
|
|
| 27 |
|
|
| - |
|
|
| - |
|
|
| 80 |
|
|
| 80 |
|
|
| 43 |
|
|
| - |
|
|
| 1997 |
|
|
| 40 |
|
Costa Mesa Marriott |
|
| - |
|
|
| 3 |
|
|
| 18 |
|
|
| 7 |
|
|
| - |
|
|
| 3 |
|
|
| 25 |
|
|
| 28 |
|
|
| 14 |
|
|
| - |
|
|
| 1996 |
|
|
| 40 |
|
Courtyard Chicago Downtown/River North |
|
| - |
|
|
| 7 |
|
|
| 27 |
|
|
| 14 |
|
|
| - |
|
|
| 7 |
|
|
| 41 |
|
|
| 48 |
|
|
| 24 |
|
|
| - |
|
|
| 1992 |
|
|
| 40 |
|
Delta Meadowvale Hotel & Conference Centre |
|
| - |
|
|
| 4 |
|
|
| 20 |
|
|
| 28 |
|
|
| - |
|
|
| 4 |
|
|
| 48 |
|
|
| 52 |
|
|
| 29 |
|
|
| - |
|
|
| 1996 |
|
|
| 40 |
|
Denver Marriott Tech Center Hotel |
|
| - |
|
|
| 6 |
|
|
| 26 |
|
|
| 29 |
|
|
| - |
|
|
| 6 |
|
|
| 55 |
|
|
| 61 |
|
|
| 32 |
|
|
| - |
|
|
| 1994 |
|
|
| 40 |
|
Denver Marriott West |
|
| - |
|
|
| - |
|
|
| 12 |
|
|
| 13 |
|
|
| - |
|
|
| - |
|
|
| 25 |
|
|
| 25 |
|
|
| 18 |
|
|
| - |
|
|
| 1983 |
|
|
| 40 |
|
Embassy Suites Chicago-Downtown/Lakefront |
|
| - |
|
|
| - |
|
|
| 86 |
|
|
| 8 |
|
|
| - |
|
|
| - |
|
|
| 94 |
|
|
| 94 |
|
|
| 27 |
|
|
| - |
|
|
| 2004 |
|
|
| 40 |
|
Four Seasons Hotel Philadelphia |
|
| - |
|
|
| 26 |
|
|
| 60 |
|
|
| 21 |
|
|
| - |
|
|
| 27 |
|
|
| 80 |
|
|
| 107 |
|
|
| 39 |
|
|
| - |
|
|
| 1998 |
|
|
| 40 |
|
Gaithersburg Marriott Washingtonian Center |
|
| - |
|
|
| 7 |
|
|
| 22 |
|
|
| 12 |
|
|
| - |
|
|
| 7 |
|
|
| 34 |
|
|
| 41 |
|
|
| 18 |
|
|
| - |
|
|
| 1993 |
|
|
| 40 |
|
Grand Hyatt Atlanta in Buckhead |
|
| - |
|
|
| 8 |
|
|
| 88 |
|
|
| 27 |
|
|
| - |
|
|
| 8 |
|
|
| 115 |
|
|
| 123 |
|
|
| 50 |
|
|
| - |
|
|
| 1998 |
|
|
| 40 |
|
Grand Hyatt Washington |
|
| - |
|
|
| 154 |
|
|
| 247 |
|
|
| 14 |
|
|
| - |
|
|
| 154 |
|
|
| 261 |
|
|
| 415 |
|
|
| 24 |
|
|
| - |
|
|
| 2012 |
|
|
| 33 |
|
Harbor Beach Marriott Resort & Spa |
|
| 150 |
|
|
| - |
|
|
| 62 |
|
|
| 104 |
|
|
| - |
|
|
| - |
|
|
| 166 |
|
|
| 166 |
|
|
| 93 |
|
|
| - |
|
|
| 1997 |
|
|
| 40 |
|
Hilton Melbourne South Wharf |
|
| 71 |
|
|
| - |
|
|
| 136 |
|
|
| 10 |
|
|
| (37 | ) |
|
| - |
|
|
| 109 |
|
|
| 109 |
|
|
| 14 |
|
|
| - |
|
|
| 2011 |
|
|
| 31 |
|
Hilton Singer Island Oceanfront Resort |
|
| - |
|
|
| 2 |
|
|
| 10 |
|
|
| 21 |
|
|
| - |
|
|
| 2 |
|
|
| 31 |
|
|
| 33 |
|
|
| 18 |
|
|
| - |
|
|
| 1986 |
|
|
| 40 |
|
Houston Airport Marriott at George Bush Intercontinental |
|
| - |
|
|
| - |
|
|
| 10 |
|
|
| 41 |
|
|
| - |
|
|
| - |
|
|
| 51 |
|
|
| 51 |
|
|
| 44 |
|
|
| - |
|
|
| 1984 |
|
|
| 40 |
|
Houston Marriott at the Texas Medical Center |
|
| - |
|
|
| - |
|
|
| 19 |
|
|
| 20 |
|
|
| - |
|
|
| - |
|
|
| 39 |
|
|
| 39 |
|
|
| 26 |
|
|
| - |
|
|
| 1998 |
|
|
| 40 |
|
S-1
SCHEDULE III
Page 2 of 5
HOST HOTELS & RESORTS, INC., HOST HOTELS & RESORTS, L.P., AND SUBSIDIARIES
REAL ESTATE AND ACCUMULATED DEPRECIATION (continued)
December 31, 2014
(in millions)
|
| Initial Cost |
|
| Subsequent |
|
| Foreign |
|
| Gross Amount at December 31, 2014 |
|
| Date of |
|
|
|
|
|
|
|
|
| |||||||||||||||||||||||||
|
|
|
|
|
|
|
|
|
| Buildings & |
|
| Costs |
|
| Currency |
|
|
|
|
|
| Buildings & |
|
|
|
|
|
| Accumulated |
|
| Completion of |
|
| Date |
|
| Depreciation |
| ||||||||
Description |
| Debt |
|
| Land |
|
| Improvements |
|
| Capitalized |
|
| Adjustment |
|
| Land |
|
| Improvements |
|
| Total |
|
| Depreciation |
|
| Construction |
|
| Acquired |
|
| Life |
| ||||||||||||
Hyatt Place Waikiki Beach |
|
| - |
|
|
| 12 |
|
|
| 120 |
|
|
| - |
|
|
| - |
|
|
| 12 |
|
|
| 120 |
|
|
| 132 |
|
|
| 7 |
|
|
| - |
|
|
| 2013 |
|
|
| 34 |
|
Hyatt Regency Cambridge, Overlooking Boston |
|
| - |
|
|
| 18 |
|
|
| 84 |
|
|
| 6 |
|
|
| - |
|
|
| 19 |
|
|
| 89 |
|
|
| 108 |
|
|
| 47 |
|
|
| - |
|
|
| 1998 |
|
|
| 40 |
|
Hyatt Regency Maui Resort & Spa |
|
| - |
|
|
| 92 |
|
|
| 212 |
|
|
| 36 |
|
|
| - |
|
|
| 81 |
|
|
| 259 |
|
|
| 340 |
|
|
| 84 |
|
|
| - |
|
|
| 2003 |
|
|
| 40 |
|
Hyatt Regency Reston |
|
| 100 |
|
|
| 11 |
|
|
| 78 |
|
|
| 26 |
|
|
| - |
|
|
| 12 |
|
|
| 103 |
|
|
| 115 |
|
|
| 45 |
|
|
| - |
|
|
| 1998 |
|
|
| 40 |
|
Hyatt Regency San Francisco Airport |
|
| - |
|
|
| 16 |
|
|
| 119 |
|
|
| 54 |
|
|
| - |
|
|
| 20 |
|
|
| 169 |
|
|
| 189 |
|
|
| 75 |
|
|
| - |
|
|
| 1998 |
|
|
| 40 |
|
Hyatt Regency Washington on Capitol Hill |
|
| - |
|
|
| 40 |
|
|
| 230 |
|
|
| 40 |
|
|
| - |
|
|
| 40 |
|
|
| 270 |
|
|
| 310 |
|
|
| 71 |
|
|
| - |
|
|
| 2006 |
|
|
| 40 |
|
JW Marriott Atlanta Buckhead |
|
| - |
|
|
| 16 |
|
|
| 21 |
|
|
| 25 |
|
|
| - |
|
|
| 16 |
|
|
| 46 |
|
|
| 62 |
|
|
| 30 |
|
|
| - |
|
|
| 1990 |
|
|
| 40 |
|
JW Marriott Desert Springs Resort & Spa |
|
| - |
|
|
| 13 |
|
|
| 143 |
|
|
| 138 |
|
|
| - |
|
|
| 13 |
|
|
| 281 |
|
|
| 294 |
|
|
| 134 |
|
|
| - |
|
|
| 1997 |
|
|
| 40 |
|
JW Marriott Hotel Rio de Janeiro |
|
| - |
|
|
| 13 |
|
|
| 29 |
|
|
| 3 |
|
|
| (16 | ) |
|
| 8 |
|
|
| 21 |
|
|
| 29 |
|
|
| 3 |
|
|
| - |
|
|
| 2010 |
|
|
| 40 |
|
JW Marriott Houston |
|
| - |
|
|
| 4 |
|
|
| 26 |
|
|
| 29 |
|
|
| - |
|
|
| 6 |
|
|
| 53 |
|
|
| 59 |
|
|
| 31 |
|
|
| - |
|
|
| 1994 |
|
|
| 40 |
|
JW Marriott Mexico City |
|
| - |
|
|
| 11 |
|
|
| 35 |
|
|
| 18 |
|
|
| - |
|
|
| 10 |
|
|
| 54 |
|
|
| 64 |
|
|
| 41 |
|
|
| - |
|
|
| 1996 |
|
|
| 40 |
|
JW Marriott, Washington D.C. |
|
| - |
|
|
| 26 |
|
|
| 98 |
|
|
| 44 |
|
|
| - |
|
|
| 26 |
|
|
| 142 |
|
|
| 168 |
|
|
| 70 |
|
|
| - |
|
|
| 2003 |
|
|
| 40 |
|
Kansas City Airport Marriott |
|
| - |
|
|
| - |
|
|
| 8 |
|
|
| 25 |
|
|
| - |
|
|
| - |
|
|
| 33 |
|
|
| 33 |
|
|
| 30 |
|
|
| - |
|
|
| 1993 |
|
|
| 40 |
|
Key Bridge Marriott |
|
| - |
|
|
| - |
|
|
| 38 |
|
|
| 31 |
|
|
| - |
|
|
| - |
|
|
| 69 |
|
|
| 69 |
|
|
| 64 |
|
|
| - |
|
|
| 1997 |
|
|
| 40 |
|
Manchester Grand Hyatt, San Diego |
|
| - |
|
|
| - |
|
|
| 548 |
|
|
| 37 |
|
|
| - |
|
|
| - |
|
|
| 585 |
|
|
| 585 |
|
|
| 76 |
|
|
| - |
|
|
| 2011 |
|
|
| 35 |
|
Manhattan Beach Marriott |
|
| - |
|
|
| - |
|
|
| 29 |
|
|
| 28 |
|
|
| - |
|
|
| - |
|
|
| 57 |
|
|
| 57 |
|
|
| 31 |
|
|
| - |
|
|
| 1997 |
|
|
| 40 |
|
Marina del Rey Marriott |
|
| - |
|
|
| - |
|
|
| 13 |
|
|
| 28 |
|
|
| - |
|
|
| - |
|
|
| 41 |
|
|
| 41 |
|
|
| 21 |
|
|
| - |
|
|
| 1995 |
|
|
| 40 |
|
Marriott Marquis San Diego Marina |
|
| - |
|
|
| - |
|
|
| 202 |
|
|
| 282 |
|
|
| - |
|
|
| - |
|
|
| 484 |
|
|
| 484 |
|
|
| 219 |
|
|
| - |
|
|
| 1996 |
|
|
| 40 |
|
Miami Marriott Biscayne Bay |
|
| - |
|
|
| - |
|
|
| 27 |
|
|
| 32 |
|
|
| - |
|
|
| - |
|
|
| 59 |
|
|
| 59 |
|
|
| 38 |
|
|
| - |
|
|
| 1998 |
|
|
| 40 |
|
Minneapolis Marriott City Center |
|
| - |
|
|
| - |
|
|
| 27 |
|
|
| 42 |
|
|
| - |
|
|
| - |
|
|
| 69 |
|
|
| 69 |
|
|
| 52 |
|
|
| - |
|
|
| 1986 |
|
|
| 40 |
|
New Orleans Marriott |
|
| - |
|
|
| 16 |
|
|
| 96 |
|
|
| 116 |
|
|
| - |
|
|
| 16 |
|
|
| 212 |
|
|
| 228 |
|
|
| 128 |
|
|
| - |
|
|
| 1996 |
|
|
| 40 |
|
New York Marriott Downtown |
|
| - |
|
|
| 19 |
|
|
| 79 |
|
|
| 43 |
|
|
| - |
|
|
| 19 |
|
|
| 122 |
|
|
| 141 |
|
|
| 65 |
|
|
| - |
|
|
| 1997 |
|
|
| 40 |
|
New York Marriott Marquis |
|
| - |
|
|
| 49 |
|
|
| 552 |
|
|
| 189 |
|
|
| - |
|
|
| 49 |
|
|
| 741 |
|
|
| 790 |
|
|
| 518 |
|
|
| - |
|
|
| 1986 |
|
|
| 40 |
|
New Zealand Hotel Portfolio |
|
| 82 |
|
|
| 34 |
|
|
| 105 |
|
|
| (3 | ) |
|
| 4 |
|
|
| 32 |
|
|
| 108 |
|
|
| 140 |
|
|
| 15 |
|
|
| - |
|
|
| 2011 |
|
|
| 35 |
|
Newark Liberty International Airport Marriott |
|
| - |
|
|
| - |
|
|
| 30 |
|
|
| 34 |
|
|
| - |
|
|
| - |
|
|
| 64 |
|
|
| 64 |
|
|
| 34 |
|
|
| - |
|
|
| 1984 |
|
|
| 40 |
|
Newport Beach Marriott Bayview |
|
| - |
|
|
| 6 |
|
|
| 14 |
|
|
| 9 |
|
|
| - |
|
|
| 6 |
|
|
| 23 |
|
|
| 29 |
|
|
| 14 |
|
|
| - |
|
|
| 1975 |
|
|
| 40 |
|
Newport Beach Marriott Hotel & Spa |
|
| - |
|
|
| 11 |
|
|
| 13 |
|
|
| 115 |
|
|
| - |
|
|
| 8 |
|
|
| 131 |
|
|
| 139 |
|
|
| 77 |
|
|
| - |
|
|
| 1975 |
|
|
| 40 |
|
Orlando World Center Marriott |
|
| - |
|
|
| 18 |
|
|
| 157 |
|
|
| 368 |
|
|
| - |
|
|
| 29 |
|
|
| 514 |
|
|
| 543 |
|
|
| 226 |
|
|
| - |
|
|
| 1997 |
|
|
| 40 |
|
S-2
SCHEDULE III
Page 3 of 5
HOST HOTELS & RESORTS, INC., HOST HOTELS & RESORTS, L.P., AND SUBSIDIARIES
REAL ESTATE AND ACCUMULATED DEPRECIATION (continued)
December 31, 2014
(in millions)
|
| Initial Cost |
|
| Subsequent |
|
| Foreign |
|
| Gross Amount at December 31, 2014 |
|
| Date of |
|
|
|
|
|
|
|
|
| |||||||||||||||||||||||||
|
|
|
|
|
|
|
|
|
| Buildings & |
|
| Costs |
|
| Currency |
|
|
|
|
|
| Buildings & |
|
|
|
|
|
| Accumulated |
|
| Completion of |
|
| Date |
|
| Depreciation |
| ||||||||
Description |
| Debt |
|
| Land |
|
| Improvements |
|
| Capitalized |
|
| Adjustment |
|
| Land |
|
| Improvements |
|
| Total |
|
| Depreciation |
|
| Construction |
|
| Acquired |
|
| Life |
| ||||||||||||
Park Ridge Marriott |
|
| - |
|
|
| - |
|
|
| 20 |
|
|
| 15 |
|
|
| - |
|
|
| - |
|
|
| 35 |
|
|
| 35 |
|
|
| 17 |
|
|
| - |
|
|
| 1987 |
|
|
| 40 |
|
Philadelphia Airport Marriott |
|
| - |
|
|
| - |
|
|
| 42 |
|
|
| 17 |
|
|
| - |
|
|
| - |
|
|
| 59 |
|
|
| 59 |
|
|
| 28 |
|
|
| - |
|
|
| 1995 |
|
|
| 40 |
|
Residence Inn Arlington Pentagon City |
|
| - |
|
|
| 6 |
|
|
| 29 |
|
|
| 11 |
|
|
| - |
|
|
| 6 |
|
|
| 40 |
|
|
| 46 |
|
|
| 20 |
|
|
| - |
|
|
| 1996 |
|
|
| 40 |
|
Rio de Janeiro Parque Olympico Hotels |
|
| - |
|
|
| 21 |
|
|
| 38 |
|
|
| - |
|
|
| (11 | ) |
|
| 16 |
|
|
| 32 |
|
|
| 48 |
|
|
| - |
|
|
| 2014 |
|
|
| - |
|
|
| 35 |
|
San Antonio Marriott Rivercenter |
|
| - |
|
|
| - |
|
|
| 86 |
|
|
| 83 |
|
|
| - |
|
|
| - |
|
|
| 169 |
|
|
| 169 |
|
|
| 84 |
|
|
| - |
|
|
| 1996 |
|
|
| 40 |
|
San Antonio Marriott Riverwalk |
|
| - |
|
|
| - |
|
|
| 45 |
|
|
| 23 |
|
|
| - |
|
|
| - |
|
|
| 68 |
|
|
| 68 |
|
|
| 35 |
|
|
| - |
|
|
| 1995 |
|
|
| 40 |
|
San Cristobal Tower, Santiago |
|
| - |
|
|
| 7 |
|
|
| 15 |
|
|
| 2 |
|
|
| (4 | ) |
|
| 5 |
|
|
| 15 |
|
|
| 20 |
|
|
| 4 |
|
|
| - |
|
|
| 2006 |
|
|
| 40 |
|
San Diego Marriott Mission Valley |
|
| - |
|
|
| 4 |
|
|
| 23 |
|
|
| 16 |
|
|
| - |
|
|
| 4 |
|
|
| 39 |
|
|
| 43 |
|
|
| 21 |
|
|
| - |
|
|
| 1998 |
|
|
| 40 |
|
San Francisco Marriott Fisherman's Wharf |
|
| - |
|
|
| 6 |
|
|
| 20 |
|
|
| 20 |
|
|
| - |
|
|
| 6 |
|
|
| 40 |
|
|
| 46 |
|
|
| 25 |
|
|
| - |
|
|
| 1994 |
|
|
| 40 |
|
San Francisco Marriott Marquis |
|
| - |
|
|
| - |
|
|
| 278 |
|
|
| 111 |
|
|
| - |
|
|
| - |
|
|
| 389 |
|
|
| 389 |
|
|
| 234 |
|
|
| - |
|
|
| 1989 |
|
|
| 40 |
|
San Ramon Marriott |
|
| - |
|
|
| - |
|
|
| 22 |
|
|
| 22 |
|
|
| - |
|
|
| - |
|
|
| 44 |
|
|
| 44 |
|
|
| 22 |
|
|
| - |
|
|
| 1996 |
|
|
| 40 |
|
Santa Clara Marriott |
|
| - |
|
|
| - |
|
|
| 39 |
|
|
| 56 |
|
|
| - |
|
|
| - |
|
|
| 95 |
|
|
| 95 |
|
|
| 78 |
|
|
| - |
|
|
| 1989 |
|
|
| 40 |
|
Scottsdale Marriott at McDowell Mountains |
|
| - |
|
|
| 8 |
|
|
| 48 |
|
|
| 7 |
|
|
| - |
|
|
| 8 |
|
|
| 55 |
|
|
| 63 |
|
|
| 15 |
|
|
| - |
|
|
| 2004 |
|
|
| 40 |
|
Scottsdale Marriott Suites Old Town |
|
| - |
|
|
| 3 |
|
|
| 20 |
|
|
| 10 |
|
|
| - |
|
|
| 3 |
|
|
| 30 |
|
|
| 33 |
|
|
| 16 |
|
|
| - |
|
|
| 1988 |
|
|
| 40 |
|
Seattle Airport Marriott |
|
| - |
|
|
| 3 |
|
|
| 42 |
|
|
| 20 |
|
|
| - |
|
|
| 3 |
|
|
| 62 |
|
|
| 65 |
|
|
| 42 |
|
|
| - |
|
|
| 1998 |
|
|
| 40 |
|
Sheraton Boston Hotel |
|
| - |
|
|
| 42 |
|
|
| 262 |
|
|
| 67 |
|
|
| - |
|
|
| 42 |
|
|
| 329 |
|
|
| 371 |
|
|
| 84 |
|
|
| - |
|
|
| 2006 |
|
|
| 40 |
|
Sheraton Indianapolis Hotel at Keystone Crossing |
|
| - |
|
|
| 3 |
|
|
| 51 |
|
|
| 28 |
|
|
| - |
|
|
| 3 |
|
|
| 79 |
|
|
| 82 |
|
|
| 21 |
|
|
| - |
|
|
| 2006 |
|
|
| 40 |
|
Sheraton Memphis Downtown Hotel |
|
| - |
|
|
| - |
|
|
| 16 |
|
|
| 48 |
|
|
| - |
|
|
| - |
|
|
| 64 |
|
|
| 64 |
|
|
| 28 |
|
|
| - |
|
|
| 1998 |
|
|
| 40 |
|
Sheraton Needham Hotel |
|
| - |
|
|
| 5 |
|
|
| 27 |
|
|
| 13 |
|
|
| - |
|
|
| 5 |
|
|
| 40 |
|
|
| 45 |
|
|
| 11 |
|
|
| - |
|
|
| 1986 |
|
|
| 40 |
|
Sheraton New York Times Square Hotel |
|
| - |
|
|
| 346 |
|
|
| 409 |
|
|
| 194 |
|
|
| - |
|
|
| 346 |
|
|
| 603 |
|
|
| 949 |
|
|
| 158 |
|
|
| - |
|
|
| 2006 |
|
|
| 40 |
|
Sheraton Parsippany Hotel |
|
| - |
|
|
| 8 |
|
|
| 30 |
|
|
| 19 |
|
|
| - |
|
|
| 8 |
|
|
| 49 |
|
|
| 57 |
|
|
| 15 |
|
|
| - |
|
|
| 2006 |
|
|
| 40 |
|
Sheraton San Diego Hotel & Marina |
|
| - |
|
|
| - |
|
|
| 328 |
|
|
| 33 |
|
|
| - |
|
|
| - |
|
|
| 361 |
|
|
| 361 |
|
|
| 87 |
|
|
| - |
|
|
| 2006 |
|
|
| 40 |
|
Sheraton Santiago Hotel & Convention Center |
|
| - |
|
|
| 19 |
|
|
| 11 |
|
|
| 9 |
|
|
| (6 | ) |
|
| 16 |
|
|
| 17 |
|
|
| 33 |
|
|
| 8 |
|
|
| - |
|
|
| 2006 |
|
|
| 40 |
|
Swissôtel Chicago |
|
| - |
|
|
| 29 |
|
|
| 132 |
|
|
| 83 |
|
|
| - |
|
|
| 30 |
|
|
| 214 |
|
|
| 244 |
|
|
| 80 |
|
|
| - |
|
|
| 1998 |
|
|
| 40 |
|
Tampa Airport Marriott |
|
| - |
|
|
| - |
|
|
| 9 |
|
|
| 24 |
|
|
| - |
|
|
| - |
|
|
| 33 |
|
|
| 33 |
|
|
| 26 |
|
|
| - |
|
|
| 2000 |
|
|
| 40 |
|
The Fairmont Kea Lani, Maui |
|
| - |
|
|
| 55 |
|
|
| 294 |
|
|
| 53 |
|
|
| - |
|
|
| 55 |
|
|
| 347 |
|
|
| 402 |
|
|
| 97 |
|
|
| - |
|
|
| 2003 |
|
|
| 40 |
|
The Ritz-Carlton, Amelia Island |
|
| - |
|
|
| 25 |
|
|
| 115 |
|
|
| 71 |
|
|
| - |
|
|
| 25 |
|
|
| 186 |
|
|
| 211 |
|
|
| 83 |
|
|
| - |
|
|
| 1998 |
|
|
| 40 |
|
The Ritz-Carlton, Buckhead |
|
| - |
|
|
| 14 |
|
|
| 81 |
|
|
| 63 |
|
|
| - |
|
|
| 15 |
|
|
| 143 |
|
|
| 158 |
|
|
| 78 |
|
|
| - |
|
|
| 1996 |
|
|
| 40 |
|
The Ritz-Carlton, Marina del Rey |
|
| - |
|
|
| - |
|
|
| 52 |
|
|
| 28 |
|
|
| - |
|
|
| - |
|
|
| 80 |
|
|
| 80 |
|
|
| 44 |
|
|
| - |
|
|
| 1997 |
|
|
| 40 |
|
S-3
SCHEDULE III
Page 4 of 5
HOST HOTELS & RESORTS, INC., HOST HOTELS & RESORTS, L.P., AND SUBSIDIARIES
REAL ESTATE AND ACCUMULATED DEPRECIATION (continued)
December 31, 2014
(in millions)
|
| Initial Cost |
|
| Subsequent |
|
| Foreign |
|
| Gross Amount at December 31, 2014 |
|
| Date of |
|
|
|
|
|
|
|
|
| |||||||||||||||||||||||||
|
|
|
|
|
|
|
|
|
| Buildings & |
|
| Costs |
|
| Currency |
|
|
|
|
|
| Buildings & |
|
|
|
|
|
| Accumulated |
|
| Completion of |
|
| Date |
|
| Depreciation |
| ||||||||
Description |
| Debt |
|
| Land |
|
| Improvements |
|
| Capitalized |
|
| Adjustment |
|
| Land |
|
| Improvements |
|
| Total |
|
| Depreciation |
|
| Construction |
|
| Acquired |
|
| Life |
| ||||||||||||
The Ritz-Carlton, Naples |
|
| - |
|
|
| 19 |
|
|
| 126 |
|
|
| 132 |
|
|
| - |
|
|
| 21 |
|
|
| 256 |
|
|
| 277 |
|
|
| 134 |
|
|
| - |
|
|
| 1996 |
|
|
| 40 |
|
The Ritz-Carlton, Naples Golf Resort |
|
| - |
|
|
| 22 |
|
|
| 10 |
|
|
| 67 |
|
|
| - |
|
|
| 22 |
|
|
| 77 |
|
|
| 99 |
|
|
| 25 |
|
|
| 2002 |
|
|
| - |
|
|
| 40 |
|
The Ritz-Carlton, Phoenix |
|
| - |
|
|
| 10 |
|
|
| 63 |
|
|
| 8 |
|
|
| - |
|
|
| 10 |
|
|
| 71 |
|
|
| 81 |
|
|
| 33 |
|
|
| - |
|
|
| 1998 |
|
|
| 40 |
|
The Ritz-Carlton, Tysons Corner |
|
| - |
|
|
| - |
|
|
| 89 |
|
|
| 22 |
|
|
| - |
|
|
| - |
|
|
| 111 |
|
|
| 111 |
|
|
| 51 |
|
|
| - |
|
|
| 1998 |
|
|
| 40 |
|
The St. Regis Houston |
|
| - |
|
|
| 6 |
|
|
| 33 |
|
|
| 20 |
|
|
| - |
|
|
| 6 |
|
|
| 53 |
|
|
| 59 |
|
|
| 18 |
|
|
| - |
|
|
| 2006 |
|
|
| 40 |
|
The Westin Buckhead Atlanta |
|
| - |
|
|
| 5 |
|
|
| 84 |
|
|
| 30 |
|
|
| - |
|
|
| 6 |
|
|
| 113 |
|
|
| 119 |
|
|
| 48 |
|
|
| - |
|
|
| 1998 |
|
|
| 40 |
|
The Westin Chicago River North |
|
| - |
|
|
| 33 |
|
|
| 116 |
|
|
| 3 |
|
|
| - |
|
|
| 33 |
|
|
| 119 |
|
|
| 152 |
|
|
| 13 |
|
|
| - |
|
|
| 2010 |
|
|
| 40 |
|
The Westin Cincinnati |
|
| - |
|
|
| - |
|
|
| 54 |
|
|
| 13 |
|
|
| - |
|
|
| - |
|
|
| 67 |
|
|
| 67 |
|
|
| 20 |
|
|
| - |
|
|
| 2006 |
|
|
| 40 |
|
The Westin Denver Downtown |
|
| - |
|
|
| - |
|
|
| 89 |
|
|
| 13 |
|
|
| - |
|
|
| - |
|
|
| 102 |
|
|
| 102 |
|
|
| 26 |
|
|
| - |
|
|
| 2006 |
|
|
| 40 |
|
The Westin Georgetown, Washington D.C. |
|
| - |
|
|
| 16 |
|
|
| 80 |
|
|
| 14 |
|
|
| - |
|
|
| 16 |
|
|
| 94 |
|
|
| 110 |
|
|
| 26 |
|
|
| - |
|
|
| 2006 |
|
|
| 40 |
|
The Westin Indianapolis |
|
| - |
|
|
| 12 |
|
|
| 100 |
|
|
| 15 |
|
|
| - |
|
|
| 12 |
|
|
| 115 |
|
|
| 127 |
|
|
| 28 |
|
|
| - |
|
|
| 2006 |
|
|
| 40 |
|
The Westin Kierland Resort & Spa |
|
| - |
|
|
| 100 |
|
|
| 280 |
|
|
| 22 |
|
|
| - |
|
|
| 100 |
|
|
| 302 |
|
|
| 402 |
|
|
| 66 |
|
|
| - |
|
|
| 2006 |
|
|
| 40 |
|
The Westin Los Angeles Airport |
|
| - |
|
|
| - |
|
|
| 102 |
|
|
| 17 |
|
|
| - |
|
|
| - |
|
|
| 119 |
|
|
| 119 |
|
|
| 31 |
|
|
| - |
|
|
| 2006 |
|
|
| 40 |
|
The Westin Mission Hills Resort & Spa |
|
| - |
|
|
| 40 |
|
|
| 47 |
|
|
| (41 | ) |
|
| - |
|
|
| 13 |
|
|
| 33 |
|
|
| 46 |
|
|
| 18 |
|
|
| - |
|
|
| 2006 |
|
|
| 40 |
|
The Westin New York Grand Central |
|
| - |
|
|
| 156 |
|
|
| 152 |
|
|
| 77 |
|
|
| - |
|
|
| 156 |
|
|
| 229 |
|
|
| 385 |
|
|
| 48 |
|
|
| - |
|
|
| 2011 |
|
|
| 40 |
|
The Westin Seattle |
|
| - |
|
|
| 39 |
|
|
| 175 |
|
|
| 23 |
|
|
| - |
|
|
| 39 |
|
|
| 198 |
|
|
| 237 |
|
|
| 46 |
|
|
| - |
|
|
| 2006 |
|
|
| 40 |
|
The Westin South Coast Plaza, Costa Mesa |
|
| - |
|
|
| - |
|
|
| 46 |
|
|
| 13 |
|
|
| - |
|
|
| - |
|
|
| 59 |
|
|
| 59 |
|
|
| 28 |
|
|
| - |
|
|
| 2006 |
|
|
| 40 |
|
The Westin Waltham-Boston |
|
| - |
|
|
| 9 |
|
|
| 59 |
|
|
| 16 |
|
|
| - |
|
|
| 9 |
|
|
| 75 |
|
|
| 84 |
|
|
| 19 |
|
|
| - |
|
|
| 2006 |
|
|
| 40 |
|
Toronto Marriott Downtown Eaton Centre Hotel |
|
| - |
|
|
| - |
|
|
| 27 |
|
|
| 20 |
|
|
| - |
|
|
| - |
|
|
| 47 |
|
|
| 47 |
|
|
| 27 |
|
|
| - |
|
|
| 1995 |
|
|
| 40 |
|
W New York |
|
| - |
|
|
| 138 |
|
|
| 102 |
|
|
| 69 |
|
|
| - |
|
|
| 138 |
|
|
| 171 |
|
|
| 309 |
|
|
| 52 |
|
|
| - |
|
|
| 2006 |
|
|
| 40 |
|
W New York - Union Square |
|
| - |
|
|
| 48 |
|
|
| 145 |
|
|
| 8 |
|
|
| - |
|
|
| 48 |
|
|
| 153 |
|
|
| 201 |
|
|
| 18 |
|
|
| - |
|
|
| 2010 |
|
|
| 40 |
|
W Seattle |
|
| - |
|
|
| 11 |
|
|
| 125 |
|
|
| 5 |
|
|
| - |
|
|
| 11 |
|
|
| 130 |
|
|
| 141 |
|
|
| 29 |
|
|
| - |
|
|
| 2006 |
|
|
| 40 |
|
Washington Dulles Airport Marriott |
|
| - |
|
|
| - |
|
|
| 3 |
|
|
| 39 |
|
|
| - |
|
|
| - |
|
|
| 42 |
|
|
| 42 |
|
|
| 34 |
|
|
| - |
|
|
| 1970 |
|
|
| 40 |
|
Washington Marriott at Metro Center |
|
| - |
|
|
| 20 |
|
|
| 24 |
|
|
| 26 |
|
|
| - |
|
|
| 20 |
|
|
| 50 |
|
|
| 70 |
|
|
| 29 |
|
|
| - |
|
|
| 1994 |
|
|
| 40 |
|
Westfields Marriott Washington Dulles |
|
| - |
|
|
| 7 |
|
|
| 32 |
|
|
| 17 |
|
|
| - |
|
|
| 7 |
|
|
| 49 |
|
|
| 56 |
|
|
| 28 |
|
|
| - |
|
|
| 1994 |
|
|
| 40 |
|
YVE Hotel Miami |
|
| - |
|
|
| 15 |
|
|
| 41 |
|
|
| - |
|
|
| - |
|
|
| 15 |
|
|
| 41 |
|
|
| 56 |
|
|
| 1 |
|
|
| - |
|
|
| 2014 |
|
|
| 33 |
|
Total hotels: |
|
| 403 |
|
|
| 2,019 |
|
|
| 9,185 |
|
|
| 4,171 |
|
|
| (70 | ) |
|
| 1,986 |
|
|
| 13,319 |
|
|
| 15,305 |
|
|
| 5,364 |
|
|
|
|
|
|
|
|
|
|
|
|
|
Other properties, each less than 5% of total |
|
| - |
|
|
| - |
|
|
| 4 |
|
|
| 17 |
|
|
| - |
|
|
| 4 |
|
|
| 17 |
|
|
| 21 |
|
|
| 12 |
|
|
| - |
|
|
| various |
|
|
| 40 |
|
TOTAL |
| $ | 403 |
|
| $ | 2,019 |
|
| $ | 9,189 |
|
| $ | 4,188 |
|
| $ | (70 | ) |
| $ | 1,990 |
|
| $ | 13,336 |
|
| $ | 15,326 |
|
| $ | 5,376 |
|
|
|
|
|
|
|
|
|
|
|
|
|
S-4
SCHEDULE III
Page 5 of 6
HOST HOTELS & RESORTS, INC., AND SUBSIDIARIES
HOST HOTELS & RESORTS, L.P., AND SUBSIDIARIES
REAL ESTATE AND ACCUMULATED DEPRECIATION
December 31, 2014
(in millions)
Notes:
(A) | The change in total cost of properties for the fiscal years ended December 31, 2014, 2013 and 2012 is as follows: |
Balance at December 31, 2011 |
| $ | 15,020 |
|
Additions: |
|
|
|
|
Acquisitions |
|
| 427 |
|
Capital expenditures and transfers from construction-in-progress |
|
| 443 |
|
Deductions: |
|
|
|
|
Dispositions and other |
|
| (172 | ) |
Impairments |
|
| (57 | ) |
Balance at December 31, 2012 |
|
| 15,661 |
|
Additions: |
|
|
|
|
Acquisitions |
|
| 184 |
|
Capital expenditures and transfers from construction-in-progress |
|
| 353 |
|
Deductions: |
|
|
|
|
Dispositions and other |
|
| (789 | ) |
Impairments |
|
| (1 | ) |
Balance at December 31, 2013 |
|
| 15,408 |
|
Additions: |
|
|
|
|
Acquisitions |
|
| 137 |
|
Capital expenditures and transfers from construction-in-progress |
|
| 288 |
|
Deductions: |
|
|
|
|
Dispositions and other |
|
| (501 | ) |
Impairments |
|
| (6 | ) |
Balance at December 31, 2014 |
| $ | 15,326 |
|
(B) | The change in accumulated depreciation and amortization of real estate assets for the fiscal years ended December 31, 2014, 2013 and 2012 is as follows: |
Balance at December 31, 2011 |
| $ | 4,306 |
|
Depreciation and amortization |
|
| 537 |
|
Dispositions and other |
|
| (75 | ) |
Balance at December 31, 2012 |
|
| 4,768 |
|
Depreciation and amortization |
|
| 550 |
|
Dispositions and other |
|
| (270 | ) |
Balance at December 31, 2013 |
|
| 5,048 |
|
Depreciation and amortization |
|
| 547 |
|
Dispositions and other |
|
| (219 | ) |
Balance at December 31, 2014 |
| $ | 5,376 |
|
(C) | The aggregate cost of real estate for federal income tax purposes is approximately $10,390 million at December 31, 2014. |
(D) | The total cost of properties excludes construction-in-progress properties. |
S-5
EXHIBIT INDEX | ||
Exhibit No. |
| Description |
|
|
|
3. |
| Articles of Incorporation and Bylaws |
|
|
|
3.1 |
| Articles of Restatement of Articles of Incorporation of Host Hotels & Resorts, Inc. (incorporated by reference to Exhibit 3.3 of Host Hotels & Resorts, L.P. Registration Statement on Form S-4 (SEC File No. 333-170934), filed on December 2, 2010). |
|
|
|
3.1A |
| Third Amended and Restated Agreement of Limited Partnership of Host Hotels & Resorts, L.P. (incorporated by reference to Exhibit 3.1 of Host Hotels & Resorts, L.P.'s Annual Report on Form 10-K for the year ended December 31, 2006, filed on March 1, 2007). |
|
|
|
3.2 |
| Amended and Restated Bylaws of Host Hotels & Resorts, Inc., effective November 6, 2008 (incorporated by reference to Exhibit 3.3 of Host Hotels & Resorts, Inc.'s Current Report on Form 8-K, filed on November 12, 2008). |
|
|
|
3.3 |
| Articles Supplementary of Host Hotels & Resorts, Inc. filed with the State Department of Assessments and Taxation of Maryland on March 27, 2014 (incorporated by reference to Exhibit 3.3 of Host Hotels & Resorts, Inc.'s Current Report on Form 8-K filed on March 27, 2014). |
|
|
|
4. |
| Instruments Defining Rights of Security Holders |
|
|
|
4.1 |
| See Exhibit 3.1 and 3.2 for provisions of the Articles and Bylaws of Host Hotels & Resorts, Inc. defining the rights of security holders. See Exhibit 3.1A for provisions of the Agreement of Limited Partnership of Host Hotels & Resorts, L.P. defining the rights of security holders. |
|
|
|
4.2 |
| Form of Common Stock Certificate (incorporated herein by reference to Exhibit 4.7 to Host Marriott Corporation's Amendment No. 4 to its Registration Statement on Form S-4 (SEC File No. 333-55807) filed on October 2, 1998). |
|
|
|
4.3 |
| Amended and Restated Indenture dated as of August 5, 1998, by and among HMH Properties, Inc., as Issuer, and the Subsidiary Guarantors named therein, and Marine Midland Bank, as Trustee (incorporated by reference to Exhibit 4.1 of Host Marriott Corporation's Current Report on Form 8-K dated August 6, 1998) (SEC File No. 001-05664). |
|
|
|
4.4 |
| Third Supplemental Indenture, dated as of December 14, 1998, by and among HMH Properties Inc., Host Marriott, L.P., the entities identified therein as New Subsidiary Guarantors and Marine Midland Bank, as Trustee, to the Amended and Restated Indenture, dated as of August 5, 1998, among the Company, the Guarantors named therein, Subsidiary Guarantors named therein and the Trustee (incorporated by reference to Exhibit 4.3 of Host Marriott, L.P.'s Current Report on Form 8-K filed with the Commission on December 31, 1998) (SEC File No. 333-55807). |
|
|
|
4.5 |
| Thirty-Second Supplemental Indenture, dated December 22, 2009, by and among Host Hotels & Resorts, L.P., Host Hotels & Resorts, Inc., the Subsidiary Guarantors named therein and The Bank of New York Mellon (formerly, The Bank of New York) as successor to HSBC Bank USA (formerly, Marine Midland Bank), as trustee, to the Amended and Restated Indenture dated August 5, 1998, including form of debenture (incorporated by reference to Exhibit 4.1 to Host Hotels & Resorts, Inc.'s Current Report on Form 8-K, filed December 23, 2009). |
|
|
|
4.6 |
| Registration Rights Agreement, dated December 22, 2009, among Host Hotels & Resorts, L.P., Host Hotels & Resorts, Inc. and Deutsche Bank Securities Inc., Merrill Lynch, Pierce, Fenner & Smith Incorporated and J.P. Morgan Securities Inc., in their capacity as representatives of the several initial purchasers of the debentures, related to the 2.50% Exchangeable Senior Debentures due 2029 (incorporated by reference to Exhibit 10.1 to Host Hotels & Resorts, Inc.'s Current Report on Form 8-K filed on December 23, 2009). |
|
|
|
4.7 |
| Thirty-Sixth Supplemental Indenture, dated October 25, 2010, by and among Host Hotels & Resorts, L.P., the Subsidiary Guarantors named therein and The Bank of New York Mellon, as successor to HSBC Bank USA (formerly, Marine Midland Bank), as trustee, to the Amended and Restated Indenture dated August 5, 1998, including form of debenture (incorporated by reference to Exhibit 4.1 to Host Hotels & Resorts, Inc.'s Current Report on Form 8-K, filed on October 29, 2010). |
|
|
|
EXHIBIT INDEX | ||
Exhibit No. |
| Description |
4.8 |
| Thirty-Ninth Supplemental Indenture, dated May 11, 2011, by and among Host Hotels & Resorts, L.P., the Subsidiary Guarantors named therein and the Bank of New York Mellon, as trustee, to the Amended and Restated Indenture dated August 5, 1998, including form of debenture (incorporated by reference to Exhibit 4.1 to Host Hotels & Resorts, Inc.'s Current Report on Form 8-K, filed May 12, 2011). |
|
|
|
4.9 |
| Forty-First Supplemental Indenture, dated November 18, 2011, by and among Host Hotels & Resorts, L.P., the Subsidiary Guarantors named therein and The Bank of New York Mellon, as trustee, to the Amended and Restated Indenture dated August 5, 1998, including form of debenture (incorporated by reference to Exhibit 4.1 to the combined Current Report on Form 8-K of Host Hotels & Resorts, Inc., and Host Hotels & Resorts L.P., filed on November 18, 2011). |
|
|
|
4.10 |
| Forty-Second Supplemental Indenture, dated March 22, 2012, by and among Host Hotels & Resorts, L.P. and The Bank of New York Mellon, as trustee, to the Amended and Restated Indenture dated August 5, 1998, including form of debenture (incorporated by reference to Exhibit 4.1 to the combined Current Report on Form 8-K of Host Hotels & Resorts, Inc., and Host Hotels & Resorts L.P., filed on March 23, 2012). |
|
|
|
4.11 |
| Forty-Third Supplemental Indenture, dated August 9, 2012, by and among Host Hotels & Resorts, L.P. and The Bank of New York Mellon, as trustee, to the Amended and Restated Indenture dated August 5, 1998, including form of debenture (incorporated by reference to Exhibit 4.1 to the combined Current Report on Form 8-K of Host Hotels & Resorts, Inc., and Host Hotels & Resorts L.P., filed on August 9, 2012). |
|
|
|
4.12 |
| Forty-Fourth Supplemental Indenture, dated March 28, 2013, by and among Host Hotels & Resorts, L.P. and The Bank of New York Mellon, as trustee, to the Amended and Restated Indenture dated August 5, 1998, including form of debenture (incorporated by reference to Exhibit 4.1 to the combined Current Report on Form 8-K of Host Hotels & Resorts, Inc., and Host Hotels & Resorts L.P., filed on March 28, 2013). |
|
|
|
10. |
| Material Contracts |
|
|
|
10.1 |
| Host Hotels & Resorts, L.P. Executive Deferred Compensation Plan as amended and restated effective January 1, 2014 (incorporated by reference to Exhibit 10.1 of Host Hotels & Resorts, Inc. and Host Hotels & Resorts, L.P. Annual Report on Form 10-K for the year ended December 31, 2013, filed on February 25, 2014). |
|
|
|
10.2 |
| Trust Agreement between Wilmington Trust Company and Host Hotels & Resorts, L.P., dated June 1, 2006, relating to the Host Hotels & Resorts, L.P. Executive Deferred Compensation Plan (incorporated by reference to Exhibit 10.2 of Host Hotels & Resorts, Inc. and Host Hotels & Resorts, L.P. Annual Report on Form 10-K for the year ended December 31, 2013, filed on February 25, 2014). |
|
|
|
10.3 |
| Host Marriott Corporation and Host Marriott, L.P. 1997 Comprehensive Stock and Cash Incentive Plan, as amended and restated December 29, 1998, as amended January 2004 (incorporated by reference to Exhibit 10.7 of Host Marriott Corporation's Annual Report on Form 10-K for the year ended December 31, 2003, filed March 2, 2004). |
|
|
|
10.4 |
| Host Hotels & Resorts, Inc.'s Severance Plan for Executives, as amended and restated, effective as of December 16, 2013 (incorporated by reference to Exhibit 10.2 of Host Hotels & Resorts, Inc. and Host Hotels & Resorts, L.P. Annual Report on Form 10-K for the year ended December 31, 2013, filed on February 25, 2014). |
|
|
|
10.5 |
| Indemnification Agreement for officers and directors of Host Hotels & Resorts, Inc. (incorporated by reference to Exhibit 10.7 of Host Hotels & Resorts, Inc. and Host Hotels & Resorts, L.P. Annual Report on Form 10-K for the year ended December 31, 2011, filed on February 22, 2012). |
|
|
|
10.6 |
| Host Hotels & Resorts 2009 Comprehensive Stock and Cash Incentive Plan, effective as of March 12, 2009 (incorporated by reference to Appendix A to the Host Hotels & Resorts, Inc. Definitive Proxy Statement on Schedule 14A filed with the Commission on March 31, 2009). |
|
|
|
10.7 |
| Form of Restricted Stock Agreement for use under the Host Hotels & Resorts 2009 Comprehensive Stock and Cash Incentive Plan (incorporated by reference to Exhibit 10.33 of Host Hotels & Resorts, Inc.'s Quarterly Report on Form 10-Q, filed July 28, 2009). |
|
|
|
EXHIBIT INDEX | ||
Exhibit No. |
| Description |
10.8 |
| Form of Option Agreement for use under the Host Hotels & Resorts 2009 Comprehensive Stock and Cash Incentive Plan (incorporated by reference to Exhibit 10.34 of Host Hotels & Resorts, Inc.'s Quarterly Report on Form 10-Q, filed July 28, 2009). |
|
|
|
10.9 |
| Amended and Restated Host Hotels & Resorts, Inc. and Host Hotels & Resorts, L.P. Employee Stock Purchase Plan, effective as of January 1, 2008 (incorporated by reference to Exhibit 10.40 of Host Hotels & Resorts, Inc.'s Annual Report on Form 10-K for the year ended December 31, 2007 filed with the Commission on February 25, 2008). |
|
|
|
10.10# |
| Fifth Amended and Restated Agreement of Limited Partnership of HHR EURO CV, dated as of June 6, 2014, by and among HHR Euro II GP B.V., HST LP Euro B.V., HST Euro II LP B.V., APG Strategic Real Estate Pool N.V. and Jasmine Hotels Private Limited (incorporated by reference to Exhibit 10.2 of Host Hotels & Resorts, Inc. and Host Hotels & Resorts, L.P. Quarterly Report on Form 10-Q, filed on August 1, 2014). |
|
|
|
10.11 |
| Second Amended and Restated Credit Agreement, dated as of June 27, 2014, among Host Hotels & Resorts, L.P., certain Canadian subsidiaries of Host Hotels & Resorts, L.P., Bank of America, N.A., as administrative agent, JPMorgan Chase Bank, N.A., as syndication agent, Wells Fargo Bank, N.A., Deutsche Bank Securities, Inc., The Bank of Nova Scotia , Bank of New York Mellon, Credit Agricole Corporate & Investment Bank and Goldman Sachs Bank USA as documentation agents, and various other agents and lenders (incorporated by reference to Exhibit 10.1 of Host Hotels & Resorts, Inc. and Host Hotels & Resorts, L.P. Current Report on Form 8-K, filed on July 2, 2014). |
|
|
|
10.12 |
| Host Hotels & Resorts, Inc. Non-Employee Directors' Deferred Stock Compensation Plan, as amended and restated effective as of December 15, 2009, as further amended February 2, 2012 and February 6, 2014 (incorporated by reference to Exhibit 10.14 of Host Hotels & Resorts, Inc. and Host Hotels & Resorts L.P. Annual Report on Form 10-K for the year ended December 31, 2013, filed on February 25, 2014). |
|
|
|
12. |
| Statements re Computation of Ratios |
|
|
|
12.1* |
| Computation of Ratios of Earnings to Fixed Charges and Preferred Stock Dividends for Host Hotels & Resorts, Inc. |
|
|
|
12.2* |
| Computation of Ratios of Earnings to Fixed Charges and Preferred Unit Distributions for Host Hotels & Resorts, L.P. |
|
|
|
21. |
| Subsidiaries |
|
|
|
21.1* |
| List of Subsidiaries of Host Hotels & Resorts, Inc. |
|
|
|
21.2* |
| List of Subsidiaries of Host Hotels & Resorts, L.P. |
|
|
|
23. |
| Consents |
|
|
|
23* |
| Consent of KPMG LLP |
|
|
|
31. |
| Rule 13a-14(a)/15d-14(a) Certifications |
|
|
|
31.1* |
| Certification of Chief Executive Officer for Host Hotels & Resorts, Inc. pursuant to Section 302 of the Sarbanes-Oxley Act of 2002. |
|
|
|
31.2* |
| Certification of Chief Financial Officer for Host Hotels & Resorts, Inc. pursuant to Section 302 of the Sarbanes-Oxley Act of 2002. |
|
|
|
31.3* |
| Certification of Chief Executive Officer for Host Hotels & Resorts, L.P. pursuant to Section 302 of the Sarbanes-Oxley Act of 2002. |
|
|
|
31.4* |
| Certification of Chief Financial Officer for Host Hotels & Resorts, L.P. pursuant to Section 302 of the Sarbanes-Oxley Act of 2002. |
|
|
|
32. |
| Section 1350 Certifications |
|
|
|
32.1* |
| Certification of Chief Executive Officer and Chief Financial Officer for Host Hotels & Resorts, Inc. pursuant to 18 U.S.C. 1350, as created by Section 906 of the Sarbanes-Oxley Act of 2002.† |
|
|
|
EXHIBIT INDEX | ||
Exhibit No. |
| Description |
32.2* |
| Certification of Chief Executive Officer and Chief Financial Officer for Host Hotels & Resorts, L.P. pursuant to 18 U.S.C. 1350, as created by Section 906 of the Sarbanes-Oxley Act of 2002.† |
101.INS |
| XBRL Instance Document. |
| Submitted electronically with this report. |
|
|
|
|
|
101.SCH |
| XBRL Taxonomy Extension Schema Document. |
| Submitted electronically with this report. |
|
|
|
|
|
101.CAL |
| XBRL Taxonomy Calculation Linkbase Document. |
| Submitted electronically with this report. |
|
|
|
|
|
101.DEF |
| XBRL Taxonomy Extension Definition Linkbase Document. |
| Submitted electronically with this report. |
|
|
|
|
|
101.LAB |
| XBRL Taxonomy Label Linkbase Document. |
| Submitted electronically with this report. |
|
|
|
|
|
101.PRE |
| XBRL Taxonomy Presentation Linkbase Document. |
| Submitted electronically with this report. |
Attached as Exhibit 101 to this report are the following documents formatted in XBRL (Extensible Business Reporting Language): (i) the Consolidated Statements of Operations for the Years ended December 31, 2014, 2013 and 2012, respectively, for Host Hotels & Resorts, Inc.; (ii) the Consolidated Balance Sheets at December 31, 2014 and December 31, 2013, respectively, for Host Hotels & Resorts, Inc.; (iii) the Consolidated Statements of Comprehensive Income (Loss) for the Years ended December 31, 2014, 2013 and 2012, respectively, for Host Hotels & Resorts, Inc.; (iv) the Consolidated Statements of Equity for the Years ended December 31, 2014, 2013 and 2012, respectively, for Host Hotels & Resorts, Inc.; (v) the Consolidated Statements of Cash Flows for the Years ended December 31, 2014, 2013 and 2012, respectively, for Host Hotels & Resorts, Inc.; (vi) the Consolidated Statements of Operations for the Years ended December 31, 2014, 2013 and 2012, respectively, for Host Hotels & Resorts, L.P.; (vii) the Consolidated Balance Sheets at December 31, 2014 and December 31, 2013, respectively, for Host Hotels & Resorts, L.P.; (viii) the Consolidated Statements of Comprehensive Income (Loss) for the Years ended December 31, 2014, 2013 and 2012, respectively, for Host Hotels & Resorts, L.P.; (ix) the Consolidated Statements of Capital for the Years ended December 31, 2014, 2013 and 2012, respectively, for Host Hotels & Resorts, L.P.; (x) the Consolidated Statement of Cash Flows for the Years ended December 31, 2014, 2013 and 2012, respectively, for Host Hotels & Resorts, L.P.; and (xi) Notes to the Consolidated Financial Statements that have been detail tagged.
|
* | Filed herewith. |
# | Confidential treatment requested. |
† | This certificate is being furnished solely to accompany the report pursuant to 18 U.S.C. 1350 and is not being filed for purposes of Section 18 of the Securities Exchange Act of 1934, as amended, and is not to be incorporated by reference into any filing of the Company, whether made before or after the date hereof, regardless of any general incorporation language in such filing. |