Use these links to rapidly review the document
Table of Contents
ITEM 8. Financial Statements and Supplementary Data.
PART IV
Table of Contents
UNITED STATES
SECURITIES AND EXCHANGE COMMISSION
Washington, D.C. 20549
FORM 10-K
| (Mark One) | ||
ý | | ANNUAL REPORT PURSUANT TO SECTION 13 OR 15(d) OF THE SECURITIES EXCHANGE ACT OF 1934 |
For the fiscal year ended October 31, 2010 | ||
Or | ||
o | | TRANSITION REPORT PURSUANT TO SECTION 13 OR 15(d) OF THE SECURITIES EXCHANGE ACT OF 1934 |
For the transition period from to | ||
Commission file number 1-4423 | ||
HEWLETT-PACKARD COMPANY
(Exact name of registrant as specified in its charter)
| Delaware | 94-1081436 | |
| (State or other jurisdiction of incorporation or organization) | (I.R.S. employer identification no.) | |
3000 Hanover Street, Palo Alto, California | | 94304 |
| (Address of principal executive offices) | (Zip code) |
Registrant's telephone number, including area code: (650) 857-1501
Securities registered pursuant to Section 12(b) of the Act:
| Title of each class | Name of each exchange on which registered | |
|---|---|---|
| Common stock, par value $0.01 per share | New York Stock Exchange |
Securities registered pursuant to Section 12(g) of the Act:
None
Indicate by check mark if the registrant is a well-known seasoned issuer as defined in Rule 405 of the Securities Act. Yes ý No o
Indicate by check mark if the registrant is not required to file reports pursuant to Section 13 or Section 15(d) of the Act. Yes o No ý
Indicate by check mark whether the registrant (1) has filed all reports required to be filed by Section 13 or 15(d) of the Securities Exchange Act of 1934 during the preceding 12 months (or for such shorter period that the registrant was required to file such reports), and (2) has been subject to such filing requirements for the past 90 days. Yes ý No o
Indicate by check mark whether the registrant has submitted electronically and posted on its corporate Web site, if any, every Interactive Data File required to be submitted and posted pursuant to Rule 405 of Regulation S-T during the preceding 12 months (or for such shorter period that the registrant was required to submit and post such files). Yes ý No o
Indicate by check mark if disclosure of delinquent filers pursuant to Item 405 of Regulation S-K is not contained herein, and will not be contained, to the best of registrant's knowledge, in definitive proxy or information statements incorporated by reference in Part III of this Form 10-K or any amendment to this Form 10-K. ý
Indicate by check mark whether the registrant is a large accelerated filer, an accelerated filer, a non-accelerated filer, or a smaller reporting company. See the definitions of "large accelerated filer," "accelerated filer" and "smaller reporting company" in Rule 12b-2 of the Exchange Act. (Check one):
| Large accelerated filer ý | Accelerated filer o | Non-accelerated filer o (Do not check if a smaller reporting company) | Smaller reporting company o |
Indicate by check mark whether the registrant is a shell company (as defined in Rule 12b-2 of the Act). Yes o No ý
The aggregate market value of the registrant's common stock held by non-affiliates was $121,784,010,000 based on the last sale price of common stock on April 30, 2010.
The number of shares of HP common stock outstanding as of November 30, 2010 was 2,190,425,610 shares.
| DOCUMENTS INCORPORATED BY REFERENCE | ||
|---|---|---|
DOCUMENT DESCRIPTION | 10-K PART | |
| Portions of the Registrant's proxy statement related to its 2011 Annual Meeting of Stockholders to be filed pursuant to Regulation 14A within 120 days after Registrant's fiscal year end of October 31, 2010 are incorporated by reference into Part III of this Report. | III | |
Table of Contents
Hewlett-Packard Company
Form 10-K
For the Fiscal Year Ended October 31, 2010
Table of Contents
| | | Page | ||
|---|---|---|---|---|
| PART I | |||
Item 1. | Business | 3 | ||
Item 1A. | Risk Factors | 15 | ||
Item 1B. | Unresolved Staff Comments | 31 | ||
Item 2. | Properties | 31 | ||
Item 3. | Legal Proceedings | 32 | ||
| PART II | |||
Item 5. | Market for Registrant's Common Equity, Related Stockholder Matters and Issuer Purchases of Equity Securities | 33 | ||
Item 6. | Selected Financial Data | 35 | ||
Item 7. | Management's Discussion and Analysis of Financial Condition and Results of Operations | 36 | ||
Item 7A. | Quantitative and Qualitative Disclosures about Market Risk | 67 | ||
Item 8. | Financial Statements and Supplementary Data | 69 | ||
Item 9. | Changes in and Disagreements with Accountants on Accounting and Financial Disclosure | 156 | ||
Item 9A. | Controls and Procedures | 156 | ||
Item 9B. | Other Information | 156 | ||
| PART III | |||
Item 10. | Directors, Executive Officers and Corporate Governance | 158 | ||
Item 11. | Executive Compensation | 158 | ||
Item 12. | Security Ownership of Certain Beneficial Owners and Management and Related Stockholder Matters | 158 | ||
Item 13. | Certain Relationships and Related Transactions, and Director Independence | 158 | ||
Item 14. | Principal Accounting Fees and Services | 159 | ||
| PART IV | |||
Item 15. | Exhibits and Financial Statement Schedules | 160 |
Table of Contents
Forward-Looking Statements
This Annual Report on Form 10-K, including "Management's Discussion and Analysis of Financial Condition and Results of Operations" in Item 7, contains forward-looking statements that involve risks, uncertainties and assumptions. If the risks or uncertainties ever materialize or the assumptions prove incorrect, the results of Hewlett-Packard Company and its consolidated subsidiaries ("HP") may differ materially from those expressed or implied by such forward-looking statements and assumptions. All statements other than statements of historical fact are statements that could be deemed forward-looking statements, including but not limited to any projections of revenue, margins, expenses, earnings, earnings per share, tax provisions, cash flows, benefit obligations, share repurchases, currency exchange rates, the impact of acquisitions or other financial items; any statements of the plans, strategies and objectives of management for future operations, including execution of cost reduction programs and restructuring plans; any statements concerning the expected development, performance or market share relating to products or services; any statements regarding current or future macroeconomic trends or events and the impact of those trends and events on HP and its financial performance; any statements regarding pending investigations, claims or disputes; any statements of expectation or belief; and any statements of assumptions underlying any of the foregoing. Risks, uncertainties and assumptions include the impact of macroeconomic and geopolitical trends and events; the competitive pressures faced by HP's businesses; the development and transition of new products and services (and the enhancement of existing products and services) to meet customer needs and respond to emerging technological trends; the execution and performance of contracts by HP and its suppliers, customers and partners; the protection of HP's intellectual property assets, including intellectual property licensed from third parties; integration and other risks associated with business combination and investment transactions; the hiring and retention of key employees; assumptions related to pension and other post-retirement costs; expectations and assumptions relating to the execution and timing of cost reduction programs and restructuring plans; the resolution of pending investigations, claims and disputes; and other risks that are described herein, including but not limited to the items discussed in "Risk Factors" in Item 1A of this report, and that are otherwise described or updated from time to time in HP's Securities and Exchange Commission reports. HP assumes no obligation and does not intend to update these forward-looking statements.
PART I
ITEM 1. Business.
HP is a leading global provider of products, technologies, software, solutions and services to individual consumers, small- and medium-sized businesses ("SMBs") and large enterprises, including customers in the government, health and education sectors. Our offerings span:
• multi-vendor customer services, including infrastructure technology and business process outsourcing, technology support and maintenance, application development and support services and consulting and integration services;• enterprise information technology infrastructure, including enterprise storage and server technology, networking products and solutions, information management software and software that optimizes business technology investments;
• personal computing and other access devices; and
• imaging and printing-related products and services.
HP was incorporated in 1947 under the laws of the State of California as the successor to a partnership founded in 1939 by William R. Hewlett and David Packard. Effective in May 1998, we changed our state of incorporation from California to Delaware.
3
Table of Contents
HP Products and Services; Segment Information
Our operations are organized into seven business segments: Services, Enterprise Storage and Servers ("ESS"), HP Software, the Personal Systems Group ("PSG"), the Imaging and Printing Group ("IPG"), HP Financial Services ("HPFS"), and Corporate Investments. Services, ESS and HP Software are reported collectively as a broader HP Enterprise Business. While the HP Enterprise Business is not an operating segment, we sometimes provide financial data aggregating the segments within it in order to provide a supplementary view of our business. In each of the past three fiscal years, notebooks, desktops and printing supplies each accounted for more than 10% of our consolidated net revenue. In fiscal 2009 and 2010, infrastructure technology outsourcing also accounted for more than 10% of our consolidated net revenue.
A summary of our net revenue, earnings from operations and assets for our segments and business units is found in Note 19 to the Consolidated Financial Statements in Item 8, which is incorporated herein by reference. A discussion of factors potentially affecting our operations is set forth in "Risk Factors" in Item 1A, which is incorporated herein by reference.
HP Enterprise Business
The HP Enterprise Business provides servers, storage, software and information technology ("IT") services that enable enterprise and midmarket business customers to better manage their current IT environments and transform IT into a business enabler. HP Enterprise Business products, software and services help accelerate growth, minimize risk and reduce costs to optimize the business value of customers' IT investments. Companies around the globe leverage HP's infrastructure solutions to deploy next generation data centers and address business challenges ranging from compliance to business continuity. The HP Enterprise Business's modular IT systems and services are primarily standards-based and feature differentiated technologies in areas including power and cooling, unified management, security, virtualization and automation. Each of the three financial reporting segments within the HP Enterprise Business are described in detail below.
Services
Services provides consulting, outsourcing and technology services across infrastructure, applications and business process domains. Services delivers to its clients by leveraging investments in consulting and support professionals, infrastructure technology, applications, standardized methodologies, and global supply and delivery. Our services businesses also create opportunities for us to sell additional hardware units by offering solutions that encompass both products and services. Services is divided into four main business units: infrastructure technology outsourcing, technology services, applications services and business process outsourcing.
Infrastructure Technology Outsourcing. Infrastructure technology outsourcing delivers comprehensive services that streamline and optimize our clients' infrastructure to efficiently enhance performance, reduce costs, mitigate risk and enable business change. These services encompass the data center and the workplace (desktop); network and communications; and security, compliance and business continuity. We also offer a set of managed services, providing a cross-section of our broader infrastructure services for smaller discrete engagements.
Technology Services. HP provides consulting and support services, as well as warranty support across HP's product lines. HP specializes in keeping technology running with mission critical services, converged infrastructure services, networking services, data center transformation services and infrastructure services for storage, server and unified communication environments. HP's technology services offerings are available in the form of service contracts, pre-packaged offerings (HP Care Pack services) or on an individual basis.
4
Table of Contents
Application Services. Applications services help clients revitalize and manage their applications assets through flexible, project-based, consulting services and longer-term outsourcing contracts. These full life cycle services encompass application development, testing, modernization, system integration, maintenance and management. Applications projects open doors to new infrastructure technology outsourcing and business process outsourcing opportunities and represent attractive cross-selling opportunities to current HP clients.
Business Process Outsourcing. Business process outsourcing is powered by a platform of underlying infrastructure technology, applications and standardized methodologies and is supplemented by IT experience and in-depth, industry-specific knowledge. These services encompass both industry-specific and cross-industry solutions. Our cross-industry solutions include a broad array of enterprise shared services, customer relationship management services, financial process management services and administrative services.
Enterprise Storage and Servers
The server market continues to shift towards standards-based architectures as proprietary hardware and operating systems are replaced by industry standard server platforms that typically offer compelling price and performance advantages by leveraging standards-based operating systems and microprocessor designs. At the same time, critical business functions continue to demand scalability and reliability. By providing a broad portfolio of storage and server solutions, ESS aims to optimize the combined product solutions required by different customers and provide solutions for a wide range of operating environments, spanning both the enterprise and the SMB markets. ESS provides storage and server products in a number of categories.
Industry Standard Servers. Industry standard servers include primarily entry-level and mid-range ProLiant servers, which run primarily Windows®, Linux and Novell operating systems and leverage Intel Corporation ("Intel") and Advanced Micro Devices ("AMD") processors. The business spans a range of product lines that include pedestal-tower servers, density-optimized rack servers and HP's BladeSystem family of server blades. In fiscal 2010, HP's industry standard server business continued to lead the industry in terms of units shipped and revenue. HP also has a leadership position in server blades, the fastest growing segment of the market.
Business Critical Systems. Business Critical Systems include HP Integrity servers based on the Intel® Itanium®-based processor that run HP-UX, Windows and OpenVMS operating systems, as well as fault-tolerant HP Integrity NonStop solutions. Business Critical Systems also include HP's scale-up x86 ProLiant servers with more than four processors. In addition, HP continues to support the HP9000 servers and HP AlphaServers with compelling offers available to upgrade these legacy systems to current HP Integrity systems. During 2010, we introduced new Integrity blade servers and the Superdome 2 server solution based on the BladeSystem architecture.
Storage. HP's StorageWorks offerings include entry-level, mid-range and high-end arrays, storage area networks, network attached storage, storage management software and virtualization technologies, as well as StoreOnce data deduplication solutions, tape drives, tape libraries and optical archival storage.
HP Software
HP Software is a leading provider of enterprise and service-provider software and services. Our portfolio consists of:
Enterprise IT management software. Enterprise IT management solutions, including support and professional services, allow customers to manage IT infrastructure, operations, applications, IT services, and business processes. These solutions also include tools to automate data center operations and IT
5
Table of Contents
processes. We market them as the HP business technology optimization suite, and we deliver them in the form of traditional software licenses and, in some cases, via a software-as-a-service distribution model.
Information management and business intelligence solutions. Our information management and business intelligence solutions include information data strategy, enterprise data warehousing, data integration, data protection, archiving, compliance, e-discovery and records management products. These solutions enable businesses to extract more value from their structured and unstructured information.
Communications and media solutions. Our communications and media industry solutions address the creation, delivery and management of consumer and enterprise communications services, with offerings in service delivery infrastructure and applications, real-time business support systems, next-generation operations support systems and digital media. These solutions enable operators, media companies, and network equipment providers to drive incremental revenue, enable new business models and reduce infrastructure costs.
Personal Systems Group
PSG is the leading provider of personal computers ("PCs") in the world based on unit volume shipped and annual revenue. PSG provides commercial PCs, consumer PCs, workstations, handheld computing devices, calculators and other related accessories, software and services for the commercial and consumer markets. We group commercial desktops, commercial notebooks and workstations into commercial clients and consumer desktop and consumer notebooks into consumer clients when describing our performance in these markets. Like the broader PC market, PSG continues to experience a shift toward mobile products such as notebooks. Both commercial and consumer PCs are based predominately on the Windows operating system and use Intel and AMD processors.
Commercial PCs. Commercial PCs are optimized for commercial uses, including enterprise and small-and medium- sized business ("SMB") customers, and for connectivity and manageability in networked environments. Commercial PCs include HP Compaq, HP Pro and HP Elite lines of business desktops and notebooks, as well as the All in One TouchSmart and Omni PCs, HP Mini-Note PCs, HP Blade PCs, Retail POS systems and HP TwinClients.
Consumer PCs. Consumer PCs include the HP and Compaq series of multi-media consumer desktops, notebooks and mini notebooks, including the TouchSmart line of touch-enabled all-in-one desktops and notebooks.
Workstations. Workstations are individual computing products designed for users demanding enhanced performance, such as computer animation, engineering design and other programs requiring high-resolution graphics. PSG provides workstations that run on both Windows® and Linux-based operating systems.
Handheld Computing. PSG provides a series of HP iPAQ Pocket PC handheld computing devices that run on Windows Mobile® software. These products range from basic PDAs to advanced "smartphone" devices with voice and data capability.
Imaging and Printing Group
IPG provides consumer and commercial printer hardware, printing supplies, printing media and scanning devices. IPG is also focused on imaging solutions in the commercial markets. These solutions range from managed print services solutions to addressing new growth opportunities in commercial printing and capturing high-value pages in areas such as industrial applications, outdoor signage, and the graphic arts business.
6
Table of Contents
Inkjet and Web Solutions. Inkjet and web solutions include HP's consumer and SMB inkjet solutions (hardware, supplies, and media) and HP's retail and web businesses. These solutions include single function and all-in-one inkjet printers targeted toward consumers and SMBs as well as retail publishing solutions, Snapfish, and Logoworks.
LaserJet and Enterprise Solutions. LaserJet and enterprise solutions include LaserJet printers and supplies, multi-function printers ("MFDs"), scanners, and enterprise software solutions such as Exstream Software and Web Jetadmin.
Managed Enterprise Solutions. Managed enterprise solutions include managed print services products and solutions delivered to enterprise customers partnering with third-party software providers to offer workflow solutions in the enterprise environment.
Graphics Solutions. Graphics solutions include large format printing (Designjet and Scitex), large format supplies, WebPress supplies, Indigo printing, specialty printing systems and inkjet high-speed production solutions.
Printer Supplies. Printer supplies include LaserJet toner and inkjet printer cartridges, graphic solutions ink products and other printing-related media.
HP Financial Services
HPFS supports and enhances HP's global product and service solutions, providing a broad range of value-added financial life cycle management services. HPFS enables our worldwide customers to acquire complete IT solutions, including hardware, software and services. The group offers leasing, financing, utility programs and asset recovery services, as well as financial asset management services for large global and enterprise customers. HPFS also provides an array of specialized financial services to SMBs and educational and governmental entities. HPFS offers innovative, customized and flexible alternatives to balance unique customer cash flow, technology obsolescence and capacity needs.
Corporate Investments
Corporate Investments includes Hewlett-Packard Laboratories, also known as HP Labs, network infrastructure products, mobile devices associated with the Palm acquisition, and certain business incubation projects. Revenue in this segment is attributable to the sale of certain network infrastructure products, including Ethernet switch products that enhance computing and enterprise solutions under the ProCurve, 3Com and TippingPoint brands. The segment also includes certain video collaboration products sold under the brand "Halo," and Palm smartphones, which are targeted at the consumer segment and include the Pixi and Pre models running on the WebOS operating system. Corporate Investments also derives revenue from licensing specific HP technology to third parties.
Sales, Marketing and Distribution
We manage our business and report our financial results based on the principal business segments described above. Our customers are organized by consumer and commercial customer groups, and distribution is organized by direct and channel. Within the channel, we have various types of partners that we utilize for various customer groups. The partners include:
• retailers that sell our products to the public through their own physical or Internet stores;• resellers that sell our products and services, frequently with their own value-added products or services, to targeted customer groups;
• distribution partners that supply our solutions to smaller resellers with which we do not have direct relationships;
7
Table of Contents
• independent distributors that sell our products into geographies or customer segments in which we have little or no presence;• original equipment manufacturers ("OEMs") that integrate our products with their own hardware or software and sell the integrated products;
• independent software vendors ("ISVs") that provide their clients with specialized software products, and often assist us in selling our products and services to clients purchasing their products;
• systems integrators that provide various levels and kinds of expertise in designing and implementing custom IT solutions and often partner with our services business to extend their expertise or influence the sale of our products and services; and
• advisory firms that provide various levels of management and IT consulting, including some systems integration work, and that typically partner with our services business on client solutions that require our unique products and services.
The mix of HP's business by channel or direct sales differs substantially by business and region. We believe that customer buying patterns and different regional market conditions necessitate sales, marketing and distribution to be tailored accordingly. HP is focused on driving the depth and breadth of its coverage in addition to efficiencies and productivity gains in both the direct and indirect business.
The HP Enterprise Business manages most of our enterprise and public sector customer relationships and also has primary responsibility for simplifying sales processes across our segments to improve speed and effectiveness of customer delivery. In this capacity, the HP Enterprise Business manages our direct sales for value products including UNIX®, enterprise storage and software and pre-sales technical consultants, as well as our direct distribution activities for commercial products and go-to-market activities with systems integrators and ISVs. The HP Enterprise Business also drives HP horizontal and vertical solutions through our own services arm and through the partners previously listed above. The HP Enterprise Business drives HP's vertical sales and marketing approach in the communication, media and entertainment, financial services, manufacturing and distribution and public sector industries.
PSG manages SMB customer relationships and commercial reseller channels, due largely to the significant volume of commercial PCs that HP sells through these channels. In addition to commercial channel relationships, the Volume Direct organization, which is charged with the management of direct sales for volume products, is hosted within PSG. In addition, PSG manages direct online sales through the Consumer Exchange and the Small Business Exchange.
IPG manages HP's overall consumer-related sales and marketing activities, including our annual consumer product launch for the back-to-school and holiday seasons. IPG also manages consumer channel relationships with third-party retail locations for imaging and printing products, as well as other consumer products, including consumer PCs, which provides for a bundled sale opportunity between PCs and IPG products.
Manufacturing and Materials
We utilize a significant number of outsourced manufacturers ("OMs") around the world to manufacture HP-designed products. The use of OMs is intended to generate cost efficiencies and reduce time to market for HP-designed products. We use multiple OMs to maintain flexibility in our supply chain and manufacturing processes. In some circumstances, third-party OEMs manufacture products that we purchase and resell under the HP brand. In addition to our use of OMs, we currently manufacture a limited number of finished products from components and sub-assemblies that we acquire from a wide range of vendors.
8
Table of Contents
We utilize two primary methods of fulfilling demand for products: building products to order and configuring products to order. We employ building products to order capabilities to maximize manufacturing and logistics efficiencies by producing high volumes of basic product configurations. Configuring products to order permits configuration of units to the particular hardware and software customization requirements of customers. Our inventory management and distribution practices in both building products to order and configuring products to order seek to minimize inventory holding periods by taking delivery of the inventory and manufacturing immediately prior to the sale or distribution of products to our customers.
We purchase materials, supplies and product subassemblies from a substantial number of vendors. For most of our products, we have existing alternate sources of supply, or such sources are readily available. However, we do rely on sole sources for laser printer engines, LaserJet supplies and parts for products with short life cycles (although some of these sources have operations in multiple locations in the event of a disruption). We are dependent upon Intel as a supplier of processors and Microsoft for various software products. However, we believe that disruptions with these suppliers would result in industry-wide dislocations and therefore would not disproportionately disadvantage us relative to our competitors. For processors, we also have a relationship with AMD, and we have continued to see solid acceptance of AMD processors in the market during fiscal 2010.
Like other participants in the high technology industry, we ordinarily acquire materials and components through a combination of blanket and scheduled purchase orders to support our requirements for periods averaging 90 to 120 days. From time to time, we experience significant price volatility and supply constraints for certain components that are not available from multiple sources. Frequently, we are able to obtain scarce components for somewhat higher prices on the open market, which may have an impact on gross margin but does not disrupt production. We also acquire component inventory in anticipation of supply constraints or enter into longer-term pricing commitments with vendors to improve the priority, price and availability of supply. See "Risk Factors-We depend on third-party suppliers, and our revenue and gross margin could suffer if we fail to manage suppliers properly," in Item 1A, which is incorporated herein by reference.
International
Our products and services are available worldwide. We believe this geographic diversity allows us to meet demand on a worldwide basis for both consumer and enterprise customers, draws on business and technical expertise from a worldwide workforce, provides stability to our operations, allows us to drive economies of scale, provides revenue streams to offset geographic economic trends and offers us an opportunity to access new markets for maturing products. In addition, we believe that future growth is dependent in part on our ability to develop products and sales models that target developing countries. In this regard, we believe that our broad geographic presence gives us a solid base upon which to build such future growth.
A summary of our domestic and international net revenue and net property, plant and equipment is set forth in Note 19 to the Consolidated Financial Statements in Item 8, which is incorporated herein by reference. Approximately 65% of our overall net revenue in fiscal 2010 came from outside the United States. The substantial majority of our net revenue originating outside the United States was from customers other than foreign governments.
For a discussion of risks attendant to HP's foreign operations, see "Risk Factors-Due to the international nature of our business, political or economic changes or other factors could harm our future revenue, costs and expenses and financial condition," in Item 1A, "Quantitative and Qualitative Disclosure about Market Risk" in Item 7A and Note 10 to the Consolidated Financial Statements in Item 8, which are incorporated herein by reference.
9
Table of Contents
Research and Development
We remain committed to innovation as a key element of HP's culture. Our development efforts are focused on designing and developing products, services and solutions that anticipate customers' changing needs and desires and emerging technological trends. Our efforts also are focused on identifying the areas where we believe we can make a unique contribution and the areas where partnering with other leading technology companies will leverage our cost structure and maximize our customers' experiences.
HP Labs, together with the various research and development groups within the five principal business segments, are responsible for our research and development efforts. HP Labs is part of our Corporate Investments segment.
Expenditures for research and development were $3.0 billion in fiscal 2010, $2.8 billion in fiscal 2009 and $3.5 billion in fiscal 2008. We anticipate that we will continue to have significant research and development expenditures in the future to provide a continuing flow of innovative, high-quality products and services to maintain and enhance our competitive position.
For a discussion of risks attendant to our research and development activities, see "Risk Factors-If we cannot continue to develop, manufacture and market products and services that meet customer requirements for innovation and quality, our revenue and gross margin may suffer," in Item 1A, which is incorporated herein by reference.
Patents
Our general policy has been to seek patent protection for those inventions and improvements likely to be incorporated into our products and services or where proprietary rights will improve our competitive position. At October 31, 2010, our worldwide patent portfolio included over 37,000 patents, which represents an increase over the number of patents in our patent portfolio at the end of both fiscal 2009 and fiscal 2008.
Patents generally have a term of twenty years from the time they are filed. As our patent portfolio has been built over time, the remaining terms on the individual patents vary. We believe that our patents and applications are important for maintaining the competitive differentiation of our products and services, enhancing our ability to access technology of third parties, and maximizing our return on research and development investments. No single patent is in itself essential to us as a whole or any of our principal business segments.
In addition to developing our patents, we license intellectual property from third parties as we deem appropriate. We have also granted and continue to grant to others licenses under patents owned by us when we consider these arrangements to be in our interest. These license arrangements include a number of cross-licenses with third parties.
For a discussion of risks attendant to intellectual property rights, see "Risk Factors-Our revenue, cost of sales, and expenses may suffer if we cannot continue to license or enforce the intellectual property rights on which our businesses depend or if third parties assert that we violate their intellectual property rights," in Item 1A, which is incorporated herein by reference.
Backlog
We believe that backlog is not a meaningful indicator of future business prospects due to the diversity of our products and services portfolio, including the large volume of products delivered from shelf or channel partner inventories and the shortening of product life cycles. Therefore, we believe that backlog information is not material to an understanding of our overall business.
10
Table of Contents
Seasonality
General economic conditions have an impact on our business and financial results. From time to time, the markets in which we sell our products experience weak economic conditions that may negatively affect sales. We experience some seasonal trends in the sale of our products and services. For example, European sales often are weaker in the summer months and consumer sales often are stronger in the fourth calendar quarter. Demand during the spring and early summer months also may be adversely impacted by market anticipation of seasonal trends. See "Risk Factors-Our sales cycle makes planning and inventory management difficult and future financial results less predictable," in Item 1A, which is incorporated herein by reference.
Competition
We encounter aggressive competition in all areas of our business activity. We compete primarily on the basis of technology, performance, price, quality, reliability, brand, reputation, distribution, range of products and services, ease of use of our products, account relationships, customer training, service and support, security and availability of application software and our Internet infrastructure offerings.
The markets for each of our business segments are characterized by vigorous competition among major corporations with long-established positions and a large number of new and rapidly growing firms. Product life cycles are short, and to remain competitive we must develop new products and services, periodically enhance our existing products and services and compete effectively on the basis of the factors listed above. In addition, we compete with many of our current and potential partners, including OEMs that design, manufacture and often market their products under their own brand names. Our successful management of these competitive partner relationships will continue to be critical to our future success. Moreover, we anticipate that we will have to continue to adjust prices on many of our products and services to stay competitive.
On a revenue basis we are the largest company offering our range of general purpose computers and personal information, imaging and printing products for industrial, scientific, business and consumer applications, and IT services. We are the leader or among the leaders in each of our principal business segments.
The competitive environments in which each segment operates are described below:
Enterprise Storage and Servers. The areas in which ESS operates are intensely competitive and are characterized by rapid and ongoing technological innovation and price reductions. Our competitors range from broad solution providers such as International Business Machines Corporation ("IBM") to more focused competitors such as EMC Corporation and NetApp, Inc. in storage and Dell, Inc. in industry standard servers. We believe that our important competitive advantages in this segment include the six technology components of our converged infrastructure initiatives: IT systems, power and cooling, security, management, virtualization and automation. We believe that our competitive advantages also include our global reach and our significant intellectual property portfolio and research and development capabilities, which will contribute to further enhancements of our product and service offerings and our ability to cross-sell our portfolio and leverage scale advantages in everything from brand to procurement leverage.
11
Table of Contents
Services. Our service businesses including HP Enterprise Services and Technology Services compete in IT support services, consulting and integration, infrastructure technology outsourcing, business process outsourcing and application services. The IT support services and consulting and integration markets have been under significant pressure as our customers have reduced their IT budgets. However, this trend has benefited the outsourcing services business as customers drive toward lower IT management costs to enable more strategic investments. Our competitors include IBM Global Services, Computer Sciences Corporation, systems integration firms such as Accenture Ltd. and offshore companies such as Fujitsu Limited and India-based competitors Wipro Limited. Infosys Technologies Limited and Tata Consultancy Services Ltd. We also compete with other traditional hardware providers, such as Dell, which are increasingly offering services to support their products. Many of our competitors are able to offer a wide range of global services, and some of our competitors enjoy significant brand recognition. Our service businesses team with many companies to offer services, and those arrangements allow us to extend our reach and augment our capabilities. Our competitive advantages are evident in our deep technology expertise, which includes multi-vendor environments, virtualization and automation, our strong track record of collaboration with clients and partners, and the combination of our expertise in infrastructure management with skilled global resources in SAP, AG, Oracle Corporation and Microsoft Corporation platforms.
HP Software. The areas in which HP Software operates are fueled by rapidly changing customer requirements and technologies. We market enterprise IT management software in competition with IBM, CA, Inc. ("CAI"), BMC Software, Inc. and others. Our information management and business intelligence solutions compete with products from companies like Symantec Corporation, IBM, EMC, CAI, and Teradata Corporation. We also deliver communications and media solutions that compete with products from IBM and various other competitors. As new delivery mechanisms such as software-as-a-service come on the scene, we are also confronting less traditional competitors. Our differentiation lies in the breadth and depth of our software and services portfolio and the scope of our market coverage.
Personal Systems Group. The areas in which PSG operates are intensely competitive and are characterized by rapid price reductions and inventory depreciation. Our primary competitors for the branded personal computers are Dell, Acer Inc., ASUSTeK Computer Inc., Apple Inc., Lenovo Group Limited and Toshiba Corporation. In particular regions, we also experience competition from local companies and from generically-branded or "white box" manufacturers. Our competitive advantages include our broad product portfolio, our innovation and research and development capabilities, our brand and procurement leverage, our ability to cross-sell our portfolio of offerings, our extensive service and support offerings and the availability of our broad-based distribution of products from retail and commercial channels to direct sales.
Imaging and Printing Group. The markets for printer hardware and associated supplies are highly competitive, especially with respect to pricing and the introduction of new products and features. IPG's key competitors include Canon U.S.A., Inc., Lexmark International, Inc., Xerox Corporation, Seiko Epson Corporation, Samsung Electronics Co., Ltd. and Brother Industries, Ltd. In addition, independent suppliers offer refill and remanufactured alternatives for our supplies which, although generally offering lower print quality and reliability, may be offered at lower prices and put pressure on our supplies sales and margins. Other companies also have developed and marketed new compatible cartridges for HP's laser and inkjet products, particularly in jurisdictions outside of the United States where adequate intellectual property protection may not exist. In recent years, we and our competitors have regularly lowered prices on printer hardware both to reach new customers and in response to the competitive environment. Important areas for future growth include printer-based multi-function devices in the office space, digital presses in our imaging and graphics space and driving color printing expansion in the office. We believe we will continue to provide important new contributions in the home, the office and publishing environments by providing comprehensive solutions.
12
Table of Contents
HP Financial Services. In our financing business, our competitors are captive financing companies, mainly IBM Global Financing, as well as banks and financial institutions. We believe our competitive advantage in this business over banks and financial institutions is our ability to finance products, services and total solutions.
For a discussion of risks attendant to these competitive factors, see "Risk Factors-The competitive pressures we face could harm our revenue, gross margin and prospects," in Item 1A, which is incorporated herein by reference.
Environment
Our operations are subject to regulation under various federal, state, local and foreign laws concerning the environment, including laws addressing the discharge of pollutants into the air and water, the management and disposal of hazardous substances and wastes, and the cleanup of contaminated sites. We could incur substantial costs, including cleanup costs, fines and civil or criminal sanctions, and third-party damage or personal injury claims, if we were to violate or become liable under environmental laws.
Many of our products are subject to various federal, state, local and foreign laws governing chemical substances in products and their safe use, including laws regulating the manufacture and distribution of chemical substances and laws restricting the presence of certain substances in electronics products. Some of our products also are, or may in the future be, subject to requirements applicable to their energy consumption. In addition, we face increasing complexity in our product design and procurement operations as we adjust to new and future requirements relating to the chemical and materials composition of our products, their safe use, and their energy efficiency, including requirements relating to climate change. We also are subject to legislation in an increasing number of jurisdictions that makes producers of electrical goods, including computers and printers, financially responsible for specified collection, recycling, treatment and disposal of past and future covered products (sometimes referred to as "product take-back legislation"). In the event our products become non-compliant with these laws, they could be restricted from entering certain jurisdictions, and we could face other sanctions, including fines.
Our operations and ultimately our products are expected to become increasingly subject to federal, state, local and foreign laws and regulations and international treaties relating to climate change. As these laws, regulations and treaties and similar initiatives and programs are adopted and implemented throughout the world, we will be required to comply or potentially face market access limitations or other sanctions, including fines. However, we believe that technology will be fundamental to finding solutions to achieve compliance with and manage those requirements, and we are collaborating with industry, business groups and governments to find and promote ways that HP technology can be used address climate change and to facilitate compliance with these related laws, regulations and treaties.
We are committed to maintaining compliance with all environmental laws applicable to our operations, products and services and to reducing our environmental impact across all aspects of our business. We meet this commitment with a comprehensive environmental, health and safety policy, strict environmental management of our operations and worldwide environmental programs and services.
The liability for environmental remediation and other environmental costs is accrued when HP considers it probable and can reasonably estimate the costs. Environmental costs and accruals are presently not material to our operations or financial position. Although there is no assurance that existing or future environmental laws applicable to our operations or products will not have a material adverse effect on HP's operations or financial condition, we do not currently anticipate material capital expenditures for environmental control facilities.
13
Table of Contents
Executive Officers:
Léo Apotheker; age 57; President and Chief Executive Officer
Mr. Apotheker has served as President and Chief Executive Officer and as a member of the Board of Directors since November 2010. Previously, Mr. Apotheker served as Chief Executive Officer of SAP AG, a software company, from June 2009 until February 2010 after having served as co-Chief Executive Officer of SAP from April 2008 to May 2009. Prior to that, Mr. Apotheker served as worldwide Chairman of Customer Solutions and Operations for SAP from 2002 until April 2008.
Peter J. Bocian; age 56; Executive Vice President and Chief Administrative Officer
Mr. Bocian has served as Executive Vice President and Chief Administrative Officer since December 2008. Previously, Mr. Bocian served as Executive Vice President, Chief Financial Officer and Chief Administrative Officer of Starbucks Corporation, a roaster and retailer of specialty coffee, from October 2007 until November 2008 after having served as Executive Vice President and Chief Financial Officer designate of Starbucks since May 2007. Prior to joining Starbucks, Mr. Bocian served in various positions at NCR Corporation since 1983, most recently as Senior Vice President and Chief Financial Officer from September 2004 until May 2007.
R. Todd Bradley; age 52; Executive Vice President, Personal Systems Group
Mr. Bradley has served as Executive Vice President of HP's Personal Systems Group since June 2005.
Michael J. Holston; age 48; Executive Vice President, General Counsel and Secretary
Mr. Holston has served as Executive Vice President and General Counsel since February 2007 and as Secretary since March 2007. Prior to that, he was a partner in the litigation practice at Morgan, Lewis & Bockius LLP, where, among other clients, he supported HP as external counsel on a variety of litigation and regulatory matters for more than ten years.
Vyomesh I. Joshi; age 56; Executive Vice President, Imaging and Printing Group
Mr. Joshi has served as Executive Vice President of HP's Imaging and Printing Group since 2002. Mr. Joshi also is a director of Yahoo! Inc.
Catherine A. Lesjak; age 51; Executive Vice President and Chief Financial Officer
Ms. Lesjak has served as Executive Vice President and Chief Financial Officer since January 2007. Ms. Lesjak served as HP's interim Chief Executive Officer from August 2010 until November 2010. Previously, she served as Senior Vice President from 2003 until December 2006 and as Treasurer from 2003 until March 2007.
Ann M. Livermore; age 52; Executive Vice President, HP Enterprise Business
Ms. Livermore has served as Executive Vice President of the HP Enterprise Business since May 2004. Ms. Livermore also is a director of United Parcel Service, Inc.
John N. McMullen; age 52; Senior Vice President and Treasurer
Mr. McMullen has served as Senior Vice President and Treasurer since March 2007. Previously, he served as Vice President of Finance for HP's Imaging and Printing Group from May 2002 until 2007.
14
Table of Contents
Randall D. Mott; age 54; Executive Vice President and Chief Information Officer
Mr. Mott has served as Executive Vice President and Chief Information Officer since July 2005.
James T. Murrin; age 50; Senior Vice President, Controller and Principal Accounting Officer
Mr. Murrin has served as Senior Vice President, Controller and Principal Accounting Officer since March 2007. Previously, he served as Vice President of Finance for the former Technology Solutions Group since 2004.
Marcela Perez de Alonso; age 56; Executive Vice President, Human Resources
Ms. Perez de Alonso has served as Executive Vice President, Human Resources since January 2004. In December 2010, we announced that Ms. Perez de Alonso will retire from HP following the hiring of her successor.
Shane V. Robison; age 57; Executive Vice President and Chief Strategy and Technology Officer
Mr. Robison has served as Executive Vice President and Chief Strategy and Technology Officer since May 2002.
Employees
We had approximately 324,600 employees worldwide as of October 31, 2010.
Available Information
Our Annual Report on Form 10-K, Quarterly Reports on Form 10-Q, Current Reports on Form 8-K and amendments to reports filed or furnished pursuant to Sections 13(a) and 15(d) of the Securities Exchange Act of 1934, as amended, are available on our website at http://www.hp.com/investor/home, as soon as reasonably practicable after HP electronically files such reports with, or furnishes those reports to, the Securities and Exchange Commission. HP's Corporate Governance Guidelines, Board of Directors committee charters (including the charters of the Audit Committee, HR and Compensation Committee, and Nominating and Governance Committee) and code of ethics entitled "Standards of Business Conduct" also are available at that same location on our website. Stockholders may request free copies of these documents from:
Hewlett-Packard
Company
Attention: Investor Relations
3000 Hanover Street
Palo Alto, CA 94304
(866) GET-HPQ1 or (866) 438-4771
http://www.hp.com/investor/informationrequest
Additional Information
Microsoft®, Windows® and Windows Mobile® are registered trademarks of Microsoft Corporation in the United States and/or other jurisdictions. Intel®, Itanium® and Intel Itanium® are trademarks of Intel Corporation in the United States and/or other jurisdictions. UNIX is a registered trademark of The Open Group.
ITEM 1A. Risk Factors.
Because of the following factors, as well as other variables affecting our operating results, past financial performance may not be a reliable indicator of future performance, and historical trends should not be used to anticipate results or trends in future periods.
15
Table of Contents
Competitive pressures could harm our revenue, gross margin and prospects.
We encounter aggressive competition from numerous and varied competitors in all areas of our business, and our competitors may target our key market segments. We compete primarily on the basis of technology, performance, price, quality, reliability, brand, reputation, distribution, range of products and services, ease of use of our products, account relationships, customer training, service and support, security, availability of application software, and Internet infrastructure offerings. If our products, services, support and cost structure do not enable us to compete successfully based on any of those criteria, our operations, results and prospects could be harmed.
Unlike many of our competitors, we have a portfolio of businesses and must allocate resources across these businesses while competing with companies that specialize in one or more of these product lines. As a result, we may invest less in certain areas of our businesses than our competitors do, and these competitors may have greater financial, technical and marketing resources available to them than our businesses that compete against them. Industry consolidation also may affect competition by creating larger, more homogeneous and potentially stronger competitors in the markets in which we compete, and our competitors also may affect our business by entering into exclusive arrangements with existing or potential customers or suppliers. In addition, companies with whom we have strategic alliances in some areas may be competitors in other areas. Those companies also may acquire or form alliances with our competitors, thereby reducing their business with us. Any inability to effectively manage these complicated relationships with strategic alliance partners could have an adverse effect on our results of operations.
We may have to continue to lower the prices of many of our products and services to stay competitive, while at the same time trying to maintain or improve revenue and gross margin. The markets in which we do business, particularly the personal computer and printing markets, are highly competitive, and we encounter aggressive price competition for all of our products and services from numerous companies globally. Over the past several years, price competition in the market for personal computers, printers and related products has been particularly intense as competitors have aggressively cut prices and lowered their product margins for these products. In addition, competitors in some of the markets in which we compete with a greater presence in lower-cost jurisdictions may be able to offer lower prices than we are able to offer. Our results of operations and financial condition may be adversely affected by these and other industry-wide pricing pressures.
Because our business model is based on providing innovative and high quality products, we may spend a proportionately greater amount on research and development than some of our competitors. If we cannot proportionately decrease our cost structure on a timely basis in response to competitive price pressures, our gross margin and, therefore, our profitability could be adversely affected. In addition, if our pricing and other factors are not sufficiently competitive, or if there is an adverse reaction to our product decisions, we may lose market share in certain areas, which could adversely affect our revenue and prospects.
Even if we are able to maintain or increase market share for a particular product, revenue could decline because the product is in a maturing industry. Revenue and margins also could decline due to increased competition from other types of products. For example, growing demand for an increasing array of mobile computing devices and the development of cloud-based solutions may reduce demand for some of our existing hardware products. In addition, refill and remanufactured alternatives for some of HP's LaserJet toner and inkjet cartridges compete with HP's supplies business. Other companies have also developed and marketed new compatible cartridges for HP's LaserJet and inkjet products, particularly in jurisdictions outside of the United States where adequate intellectual property protection may not exist.
16
Table of Contents
If we cannot continue to develop, manufacture and market products and services that meet customer requirements for innovation and quality, our revenue and gross margin may suffer.
The process of developing new high technology products and services and enhancing existing products and services is complex, costly and uncertain, and any failure by us to anticipate customers' changing needs and emerging technological trends accurately could significantly harm our market share and results of operations. For example, we must successfully address the increasing market demand for mobile computing devices in a variety of form factors that provide a compelling user experience. We must also attract and retain developers to ensure the continued availability and development of appealing and innovative software applications for our mobile computing devices. In addition, we are transitioning to an environment characterized by cloud-based computing and software being delivered as a service, and we must continue to successfully develop and deploy cloud-based solutions for our customers. We must make long-term investments, develop or obtain appropriate intellectual property and commit significant resources before knowing whether our predictions will accurately reflect customer demand for our products and services. After we develop a product, we must be able to manufacture appropriate volumes quickly and at low costs. To accomplish this, we must accurately forecast volumes, mixes of products and configurations that meet customer requirements, and we may not succeed at doing so at all or within a given product's life cycle. Any delay in the development, production or marketing of a new product could result in us not being among the first to market, which could further harm our competitive position.
In the course of conducting our business, we must adequately address quality issues associated with our products and services, including defects in our engineering, design and manufacturing processes, as well as defects in third-party components included in our products. In order to address quality issues, we work extensively with our customers and suppliers and engage in product testing to determine the cause of the problem and to determine appropriate solutions. However, we may have limited ability to control quality issues, particularly with respect to faulty components manufactured by third parties. If we are unable to determine the cause, find an appropriate solution or offer a temporary fix (or "patch"), we may delay shipment to customers, which would delay revenue recognition and could adversely affect our revenue and reported results. Finding solutions to quality issues can be expensive and may result in additional warranty, replacement and other costs, adversely affecting our profits. If new or existing customers have difficulty operating our products, our operating margins could be adversely affected, and we could face possible claims if we fail to meet our customers' expectations. In addition, quality issues can impair our relationships with new or existing customers and adversely affect our brand and reputation, which could adversely affect our operating results.
Economic weakness and uncertainty could adversely affect our revenue, gross margin and expenses.
Our revenue and gross margin depend significantly on worldwide economic conditions and the demand for computing and imaging products and services in the markets in which we compete. Economic weakness and uncertainty have resulted, and may result in the future, in decreased revenue, gross margin, earnings or growth rates and difficulty managing inventory levels. Sustained uncertainty about current global economic conditions may adversely affect demand for our products and services. Economic weakness and uncertainty also make it more difficult for us to make accurate forecasts of revenue, gross margin and expenses.
We also have experienced, and may experience in the future, gross margin declines in certain businesses, reflecting the effect of items such as competitive pricing pressures, inventory write downs and increases in component and manufacturing costs resulting from higher labor and material costs borne by our manufacturers and suppliers that, as a result of competitive pricing pressures or other factors, we are unable to pass on to our customers. In addition, our business may be disrupted if we are unable to obtain equipment, parts and components from our suppliers-and our suppliers from their suppliers-due to the insolvency of key suppliers or the inability of key suppliers to obtain credit.
17
Table of Contents
Economic weakness and uncertainty could cause our expenses to vary materially from our expectations. Any renewed financial turmoil affecting the banking system and financial markets or any significant financial services institution failures could negatively impact our treasury operations, as the financial condition of such parties may deteriorate rapidly and without notice in times of market volatility and disruption. Poor financial performance of asset markets could lead to increased pension and post-retirement benefit expenses. Other income and expense could vary materially from expectations depending on changes in interest rates, borrowing costs, currency exchange rates, hedging expenses and the fair value of derivative instruments. Economic downturns also may lead to restructuring actions and associated expenses.
We depend on third-party suppliers, and our revenue and gross margin could suffer if we fail to manage suppliers properly.
Our operations depend on our ability to anticipate our needs for components, products and services and our suppliers' ability to deliver sufficient quantities of quality components, products and services at reasonable prices in time for us to meet critical schedules. Given the wide variety of systems, products and services that we offer, the large number of our suppliers and contract manufacturers that are dispersed across the globe, and the long lead times that are required to manufacture, assemble and deliver certain components and products, problems could arise in planning production and managing inventory levels that could seriously harm us. In addition, our ongoing project to improve the efficiency of our supply chain could cause supply disruptions and be more expensive, time consuming and resource-intensive than expected. Other supplier problems that we could face include component shortages, excess supply, risks related to the terms of our contracts with suppliers, risks associated with contingent workers, and risks related to our relationships with single source suppliers, as described below.
• Shortages. Occasionally we may experience a shortage of, or a delay in receiving, certain components as a result of strong demand, capacity constraints, supplier financial weaknesses, inability of suppliers to borrow funds in the credit markets, disputes with suppliers (some of whom are also customers), disruptions in the operations of component suppliers, other problems experienced by suppliers or problems faced during the transition to new suppliers. In particular, our PC business relies heavily upon OMs to manufacture its products and is therefore dependent upon the continuing operations of those OMs to fulfill demand for our PC products. HP represents a substantial portion of the business of some of these OMs, and any changes to the nature or volume of business transacted by HP with a particular OM could adversely affect the operations and financial condition of the OM and lead to shortages or delays in receiving products from that OM. If shortages or delays persist, the price of these components may increase, we may be exposed to quality issues or the components may not be available at all. We may not be able to secure enough components at reasonable prices or of acceptable quality to build products or provide services in a timely manner in the quantities or according to the specifications needed. Accordingly, our revenue and gross margin could suffer as we could lose time-sensitive sales, incur additional freight costs or be unable to pass on price increases to our customers. If we cannot adequately address supply issues, we might have to reengineer some products or service offerings, resulting in further costs and delays.• Oversupply. In order to secure components for the provision of products or services, at times we may make advance payments to suppliers or enter into non-cancelable commitments with vendors. In addition, we may purchase components strategically in advance of demand to take advantage of favorable pricing or to address concerns about the availability of future components. If we fail to anticipate customer demand properly, a temporary oversupply could result in excess or obsolete components, which could adversely affect our gross margin.
18
Table of Contents
• Contractual terms. As a result of binding price or purchase commitments with vendors, we may be obligated to purchase components or services at prices that are higher than those available in the current market and be limited in our ability to respond to changing market conditions. In the event that we become committed to purchase components or services for prices in excess of the current market price, we may be at a disadvantage to competitors who have access to components or services at lower prices, and our gross margin could suffer. In addition, many of our competitors obtain products or components from the same OMs and suppliers that we utilize. Our competitors may obtain better pricing and other terms and more favorable allocations of products and components during periods of limited supply, and our ability to engage in relationships with certain OMs and suppliers could be limited. The practice employed by our PC business of purchasing product components and transferring those components to its OMs may create large supplier receivables with the OMs that, depending on the financial condition of the OMs, may have risk of uncollectability. In addition, certain of our OMs and suppliers may decide in the future to discontinue conducting business with us. Any of these actions by our competitors, OMs or suppliers could adversely affect our future operating results and financial condition.• Contingent workers. We also rely on third-party suppliers for the provision of contingent workers, and our failure to manage our use of such workers effectively could adversely affect our results of operations. We have been exposed to various legal claims relating to the status of contingent workers in the past and could face similar claims in the future. We may be subject to shortages, oversupply or fixed contractual terms relating to contingent workers, as described above. Our ability to manage the size of, and costs associated with, the contingent workforce may be subject to additional constraints imposed by local laws.
• Single source suppliers. Our use of single source suppliers for certain components could exacerbate our supplier issues. We obtain a significant number of components from single sources due to technology, availability, price, quality or other considerations. For example, we rely on Intel Corporation to provide us with a sufficient supply of processors for many of our PCs, workstations, handheld computing devices and servers, and some of those processors are customized for our products. New products that we introduce may utilize custom components obtained from only one source initially until we have evaluated whether there is a need for additional suppliers. Replacing a single source supplier could delay production of some products as replacement suppliers initially may be subject to capacity constraints or other output limitations. For some components, such as customized components and some of the processors that we obtain from Intel, alternative sources may not exist or those alternative sources may be unable to produce the quantities of those components necessary to satisfy our production requirements. In addition, we sometimes purchase components from single source suppliers under short-term agreements that contain favorable pricing and other terms but that may be unilaterally modified or terminated by the supplier with limited notice and with little or no penalty. The performance of such single source suppliers under those agreements (and the renewal or extension of those agreements upon similar terms) may affect the quality, quantity and price of components to HP. The loss of a single source supplier, the deterioration of our relationship with a single source supplier, or any unilateral modification to the contractual terms under which we are supplied components by a single source supplier could adversely affect our revenue and gross margins.
Business disruptions could seriously harm our future revenue and financial condition and increase our costs and expenses.
Our worldwide operations could be subject to earthquakes, power shortages, telecommunications failures, water shortages, tsunamis, floods, hurricanes, typhoons, fires, extreme weather conditions, medical epidemics or pandemics and other natural or manmade disasters or business interruptions, for
19
Table of Contents
which we are predominantly self-insured. The occurrence of any of these business disruptions could seriously harm our revenue and financial condition and increase our costs and expenses. Our corporate headquarters, and a portion of our research and development activities, are located in California, and other critical business operations and some of our suppliers are located in California and Asia, near major earthquake faults. In addition, all six of our principal worldwide IT data centers are located in the southern United States, making our operations more vulnerable to natural disasters or other business disruptions occurring in that geographical area. The manufacture of product components, the final assembly of our products and other critical operations are concentrated in certain geographic locations, including Shanghai, Singapore and India. We also rely on major logistics hubs primarily in Asia to manufacture and distribute our products and in the southwestern United States to import products into the Americas region. Our operations could be adversely affected if manufacturing, logistics or other operations in these locations are disrupted for any reason, including natural disasters, information technology system failures, military actions or economic, business, labor, environmental, public health, regulatory or political issues. The ultimate impact on us, our significant suppliers and our general infrastructure of being located near major earthquake faults and being consolidated in certain geographical areas is unknown, but our revenue, profitability and financial condition could suffer in the event of a major earthquake or other natural disaster.
System security risks, data protection breaches and systems integration issues could disrupt our internal operations or information technology services provided to customers, and any such disruption could reduce our expected revenue, increase our expenses, damage our reputation and adversely affect our stock price.
Experienced computer programmers and hackers may be able to penetrate our network security and misappropriate our confidential information or that of third parties, create system disruptions or cause shutdowns. Computer programmers and hackers also may be able to develop and deploy viruses, worms, and other malicious software programs that attack our products or otherwise exploit any security vulnerabilities of our products. In addition, sophisticated hardware and operating system software and applications that we produce or procure from third parties may contain defects in design or manufacture, including "bugs" and other problems that could unexpectedly interfere with the operation of the system. The costs to us to eliminate or alleviate security problems, bugs, viruses, worms, malicious software programs and security vulnerabilities could be significant, and the efforts to address these problems could result in interruptions, delays, cessation of service and loss of existing or potential customers that may impede our sales, manufacturing, distribution or other critical functions.
We manage and store various proprietary information and sensitive or confidential data relating to our business. In addition, our outsourcing services business routinely processes, stores and transmits large amounts of data for our clients, including sensitive and personally identifiable information. Breaches of our security measures or the accidental loss, inadvertent disclosure or unapproved dissemination of proprietary information or sensitive or confidential data about us or our clients, including the potential loss or disclosure of such information or data as a result of fraud, trickery or other forms of deception, could expose us, our customers or the individuals affected to a risk of loss or misuse of this information, result in litigation and potential liability for us, damage our brand and reputation or otherwise harm our business. We also could lose existing or potential customers for outsourcing services or other information technology solutions or incur significant expenses in connection with our customers' system failures or any actual or perceived security vulnerabilities in our products. In addition, the cost and operational consequences of implementing further data protection measures could be significant.
Portions of our IT infrastructure also may experience interruptions, delays or cessations of service or produce errors in connection with systems integration or migration work that takes place from time to time. We may not be successful in implementing new systems and transitioning data which could cause business disruptions and be more expensive, time consuming, disruptive and resource-intensive. Such disruptions could adversely impact our ability to fulfill orders and interrupt other processes. Delayed sales, lower margins or lost customers resulting from these disruptions have adversely affected in the past, and in the future could adversely affect, our financial results, stock price and reputation.
20
Table of Contents
The revenue and profitability of our operations have historically varied, which makes our future financial results less predictable.
Our revenue, gross margin and profit vary among our products and services, customer groups and geographic markets and therefore will likely be different in future periods than our current results. Our revenue depends on the overall demand for our products and services. Delays or reductions in IT spending could materially adversely affect demand for our products and services, which could result in a significant decline in revenues. Overall gross margins and profitability in any given period are dependent partially on the product, customer and geographic mix reflected in that period's net revenue. In particular, IPG and certain of its business units such as printer supplies contribute significantly to our gross margin and profitability. In addition, our services business has contributed significantly to our revenue and operating profit in recent periods. Competition, lawsuits, investigations and other risks affecting those businesses therefore may have a significant impact on our overall gross margin and profitability. Certain segments, and ESS in particular, have a higher fixed cost structure and more variation in gross margins across their business units and product portfolios than others and may therefore experience significant operating profit volatility on a quarterly basis. In addition, newer geographic markets may be relatively less profitable due to investments associated with entering those markets and local pricing pressures, and we may have difficulty establishing and maintaining the operating infrastructure necessary to support the high growth rate associated with some of those markets. Market trends, competitive pressures, commoditization of products, seasonal rebates, increased component or shipping costs, regulatory impacts and other factors may result in reductions in revenue or pressure on gross margins of certain segments in a given period, which may necessitate adjustments to our operations.
HP's stock price has historically fluctuated and may continue to fluctuate, which may make future prices of HP's stock difficult to predict.
HP's stock price, like that of other technology companies, can be volatile. Some of the factors that could affect our stock price are:
• speculation in the press or investment community about, or actual changes in, our business, strategic position, market share, organizational structure, operations, financial condition, financial reporting and results, effectiveness of cost cutting efforts, value or liquidity of our investments, exposure to market volatility, prospects, business combination or investment transactions, or executive team;• the announcement of new products, services, technological innovations or acquisitions by HP or its competitors;
• quarterly increases or decreases in revenue, gross margin, earnings or cash flow from operations, changes in estimates by the investment community or guidance provided by HP, and variations between actual and estimated financial results;
• announcements of actual and anticipated financial results by HP's competitors and other companies in the IT industry; and
• the timing and amount of share repurchases by HP.
General or industry specific market conditions or stock market performance or domestic or international macroeconomic and geopolitical factors unrelated to HP's performance also may affect the price of HP common stock. For these reasons, investors should not rely on recent trends to predict future stock prices, financial condition, results of operations or cash flows. In addition, following periods of volatility in a company's securities, securities class action litigation against a company is sometimes instituted. If instituted against HP, this type of litigation could result in substantial costs and the diversion of management time and resources.
21
Table of Contents
Our revenue, cost of sales, and expenses may suffer if we cannot continue to license or enforce the intellectual property rights on which our businesses depend or if third parties assert that we violate their intellectual property rights.
We rely upon patent, copyright, trademark and trade secret laws in the United States, similar laws in other countries, and agreements with our employees, customers, suppliers and other parties, to establish and maintain intellectual property rights in the technology and products we sell, provide or otherwise use in our operations. However, any of our direct or indirect intellectual property rights could be challenged, invalidated or circumvented, or such intellectual property rights may not be sufficient to permit us to take advantage of current market trends or otherwise to provide competitive advantages, either of which could result in costly product redesign efforts, discontinuance of certain product offerings or other competitive harm. Further, the laws of certain countries do not protect proprietary rights to the same extent as the laws of the United States. Therefore, in certain jurisdictions we may be unable to protect our proprietary technology adequately against unauthorized third-party copying or use; this too could adversely affect our competitive position.
Because of the rapid pace of technological change in the information technology industry, much of our business and many of our products rely on key technologies developed or licensed by third parties. We may not be able to obtain or continue to obtain licenses and technologies from these third parties at all or on reasonable terms, or such third parties may demand cross-licenses to our intellectual property. In addition, it is possible that as a consequence of a merger or acquisition, third parties may obtain licenses to some of our intellectual property rights or our business may be subject to certain restrictions that were not in place prior to the transaction. Consequently, we may lose a competitive advantage with respect to these intellectual property rights or we may be required to enter into costly arrangements in order to terminate or limit these rights.
Third parties also may claim that we or customers indemnified by us are infringing upon their intellectual property rights. For example, individuals and groups frequently purchase intellectual property assets for the sole purpose of asserting claims of infringement and attempting to extract settlements from large companies such as HP. The number of these claims has increased significantly in recent periods and may continue to increase in the future. If we cannot or do not license the infringed technology at all or on reasonable terms, or substitute similar technology from another source, our operations could be adversely affected. Even if we believe that the claims are without merit, they can be time-consuming and costly to defend and may divert management's attention and resources away from our business. Claims of intellectual property infringement also might require us to redesign affected products, enter into costly settlement or license agreements, pay costly damage awards, or face a temporary or permanent injunction prohibiting us from importing, marketing or selling certain of our products. Even if we have an agreement to indemnify us against such costs, the indemnifying party may be unable to uphold its contractual obligations to us.
Finally, our results of operations and cash flows have been and could continue to be affected in certain periods and on an ongoing basis by the imposition, accrual and payment of copyright levies or similar fees. In certain countries (primarily in Europe), proceedings are ongoing or have been concluded involving HP in which groups representing copyright owners sought to impose upon and collect from HP levies upon equipment (such as PCs, MFDs and printers) alleged to be copying devices under applicable laws. Other such groups have also sought to modify existing levy schemes to increase the amount of the levies that can be collected from HP. Other countries that have not imposed levies on these types of devices are expected to extend existing levy schemes, and countries that do not currently have levy schemes may decide to impose copyright levies on these types of devices. The total amount of the copyright levies will depend on the types of products determined to be subject to the levy, the number of units of those products sold during the period covered by the levy, and the per unit fee for each type of product, all of which are affected by several factors, including the outcome of ongoing litigation involving HP and other industry participants and possible action by the legislative
22
Table of Contents
bodies in the applicable countries, and could be substantial. Consequently, the ultimate impact of these copyright levies or similar fees, and the ability of HP to recover such amounts through increased prices, remain uncertain.
Due to the international nature of our business, political or economic changes or other factors could harm our future revenue, costs and expenses and financial condition.
Sales outside the United States make up approximately 65% of our net revenue. In addition, an increasing portion of our business activity is being conducted in emerging markets, including Brazil, Russia, India and China. Our future revenue, gross margin, expenses and financial condition could suffer due to a variety of international factors, including:
• ongoing instability or changes in a country's or region's economic or political conditions, including inflation, recession, interest rate fluctuations and actual or anticipated military or political conflicts;• longer accounts receivable cycles and financial instability among customers;
• trade regulations and procedures and actions affecting production, pricing and marketing of products;
• local labor conditions and regulations, including local labor issues faced by specific HP suppliers and OMs;
• managing a geographically dispersed workforce;
• changes in the regulatory or legal environment;
• differing technology standards or customer requirements;
• import, export or other business licensing requirements or requirements relating to making foreign direct investments, which could increase our cost of doing business in certain jurisdictions, prevent us from shipping products to particular countries or markets, affect our ability to obtain favorable terms for components, increase our operating costs or lead to penalties or restrictions;
• difficulties associated with repatriating cash generated or held abroad in a tax-efficient manner and changes in tax laws; and
• fluctuations in freight costs, limitations on shipping and receiving capacity, and other disruptions in the transportation and shipping infrastructure at important geographic points of exit and entry for our products and shipments.
The factors described above also could disrupt our product and component manufacturing and key suppliers located outside of the United States. For example, we rely on manufacturers in Taiwan for the production of notebook computers and other suppliers in Asia for product assembly and manufacture.
As approximately 65% of our sales are from countries outside of the United States, other currencies, particularly the euro, the British pound, Chinese yuan renminbi and the Japanese yen, can have an impact on HP's results (expressed in U.S. dollars). Currency variations also contribute to variations in sales of products and services in impacted jurisdictions. Accordingly, fluctuations in foreign currency rates, most notably the strengthening of the dollar against the euro, could adversely affect our revenue growth in future periods. In addition, currency variations can adversely affect margins on sales of our products in countries outside of the United States and margins on sales of products that include components obtained from suppliers located outside of the United States. We use a combination of forward contracts and options designated as cash flow hedges to protect against foreign currency exchange rate risks. The effectiveness of our hedges depends on our ability to accurately forecast future cash flows, which is particularly difficult during periods of uncertain demand for our products and
23
Table of Contents
services and highly volatile exchange rates. As a result, we could incur significant losses from our hedging activities if our forecasts are incorrect. In addition, our hedging activities may be ineffective or may not offset any or more than a portion of the adverse financial impact resulting from currency variations. Gains or losses associated with hedging activities also may impact our revenue and to a lesser extent our cost of sales and financial condition.
In many foreign countries, particularly in those with developing economies, it is common to engage in business practices that are prohibited by laws and regulations applicable to us, such as the Foreign Corrupt Practices Act. For example, as discussed in Note 18 to the Consolidated Financial Statements, the German Public Prosecutor's Office, the U.S. Department of Justice and the SEC have been investigating allegations that certain current and former employees of HP engaged in bribery, embezzlement and tax evasion or were involved in kickbacks or other improper payments. Although we implement policies and procedures designed to facilitate compliance with these laws, our employees, contractors and agents, as well as those companies to which we outsource certain of our business operations, may take actions in violation of our policies. Any such violation, even if prohibited by our policies, could have an adverse effect on our business and reputation.
If we fail to manage the distribution of our products and services properly, our revenue, gross margin and profitability could suffer.
We use a variety of distribution methods to sell our products and services, including third-party resellers and distributors and both direct and indirect sales to both enterprise accounts and consumers. Successfully managing the interaction of our direct and indirect channel efforts to reach various potential customer segments for our products and services is a complex process. Moreover, since each distribution method has distinct risks and gross margins, our failure to implement the most advantageous balance in the delivery model for our products and services could adversely affect our revenue and gross margins and therefore our profitability. Other distribution risks are described below.
• Our financial results could be materially adversely affected due to channel conflicts or if the financial conditions of our channel partners were to weaken.Our future operating results may be adversely affected by any conflicts that might arise between our various sales channels, the loss or deterioration of any alliance or distribution arrangement or the loss of retail shelf space. Moreover, some of our wholesale and retail distributors may have insufficient financial resources and may not be able to withstand changes in business conditions, including economic weakness and industry consolidation. Many of our significant distributors operate on narrow product margins and have been negatively affected by business pressures. Considerable trade receivables that are not covered by collateral or credit insurance are outstanding with our distribution and retail channel partners. Revenue from indirect sales could suffer, and we could experience disruptions in distribution if our distributors' financial conditions, abilities to borrow funds in the credit markets or operations weaken.
• Our inventory management is complex as we continue to sell a significant mix of products through distributors.We must manage inventory effectively, particularly with respect to sales to distributors, which involves forecasting demand and pricing issues. Distributors may increase orders during periods of product shortages, cancel orders if their inventory is too high or delay orders in anticipation of new products. Distributors also may adjust their orders in response to the supply of our products and the products of our competitors and seasonal fluctuations in end-user demand. Our reliance upon indirect distribution methods may reduce visibility to demand and pricing issues, and therefore make forecasting more difficult. If we have excess or obsolete inventory, we may have to reduce our prices and write down inventory. Moreover, our use of indirect distribution channels may limit our willingness or ability to adjust prices quickly and otherwise to respond to
24
Table of Contents
pricing changes by competitors. We also may have limited ability to estimate future product rebate redemptions in order to price our products effectively.
If we do not effectively manage our product and services transitions, our revenue may suffer.
Many of the industries in which we compete are characterized by rapid technological advances in hardware performance and software features and functionality; frequent introduction of new products; short product life cycles; and continual improvement in product price characteristics relative to product performance. Among the risks associated with the introduction of new products and services are delays in development or manufacturing, variations in costs, delays in customer purchases or reductions in price of existing products in anticipation of new introductions, difficulty in predicting customer demand for the new offerings and effectively managing inventory levels so that they are in line with anticipated demand, risks associated with customer qualification and evaluation of new products and the risk that new products may have quality or other defects or may not be supported adequately by application software. If we do not make an effective transition from existing products and services to future offerings, our revenue may decline.
Our revenue and gross margin also may suffer due to the timing of product or service introductions by our suppliers and competitors. This is especially challenging when a product has a short life cycle or a competitor introduces a new product just before our own product introduction. Furthermore, sales of our new products and services may replace sales, or result in discounting of some of our current offerings, offsetting the benefit of even a successful introduction. There also may be overlaps in the current products and services of HP and portfolios acquired through mergers and acquisitions that we must manage. In addition, it may be difficult to ensure performance of new customer contracts in accordance with our revenue, margin and cost estimates and to achieve operational efficiencies embedded in our estimates. Given the competitive nature of our industry, if any of these risks materializes, future demand for our products and services and our results of operations may suffer.
Our revenue and profitability could suffer if we do not manage the risks associated with our IT services business properly.
The size and significance of the IT services portion of our business has increased in recent periods. The risks that accompany that business differ from those of our other businesses and include the following:
• The pricing and other terms of some of our IT services agreements, particularly our long-term IT outsourcing services agreements, require us to make estimates and assumptions at the time we enter into these contracts that could differ from actual results. Any increased or unexpected costs or unanticipated delays in connection with the performance of these engagements, including delays caused by factors outside our control, could make these agreements less profitable or unprofitable, which would have an adverse affect on the profit margin of our IT services business.• Some of our IT services agreements require significant investment in the early stages that is expected to be recovered through billings over the life of the agreement. These agreements often involve the construction of new IT systems and communications networks and the development and deployment of new technologies. Substantial performance risk exists in each agreement with these characteristics, and some or all elements of service delivery under these agreements are dependent upon successful completion of the development, construction and deployment phases. Any failure to perform satisfactorily under these agreements may expose us to legal liability, result in the loss of customers and harm our reputation, which could decrease the revenues and profitability of our IT services business.
25
Table of Contents
• Some of our outsourcing services agreements contain pricing provisions that permit a client to request a benchmark study by a mutually acceptable third party. The benchmarking process typically compares the contractual price of our services against the price of similar services offered by other specified providers in a peer comparison group, subject to agreed upon adjustment and normalization factors. Generally, if the benchmarking study shows that our pricing has a difference outside a specified range, and the difference is not due to the unique requirements of the client, then the parties will negotiate in good faith any appropriate adjustments to the pricing. This may result in the reduction of our rates for the benchmarked services performed after the implementation of those pricing adjustments, which could decrease the revenues and profitability of our IT services business.If we fail to comply with our customer contracts or government contracting regulations, our revenue could suffer.
Our contracts with our customers may include unique and specialized performance requirements. In particular, our contracts with federal, state, provincial and local governmental customers are subject to various procurement regulations, contract provisions and other requirements relating to their formation, administration and performance. Any failure by us to comply with the specific provisions in our customer contracts or any violation of government contracting regulations could result in the imposition of various civil and criminal penalties, which may include termination of contracts, forfeiture of profits, suspension of payments and, in the case of our government contracts, fines and suspension from future government contracting. In addition, we have in the past been, and may in the future be, subject to qui tam litigation brought by private individuals on behalf of the government relating to our government contracts, which could include claims for up to treble damages. Further, any negative publicity related to our customer contracts or any proceedings surrounding them, regardless of its accuracy, may damage our business by affecting our ability to compete for new contracts. If our customer contracts are terminated, if we are suspended from government work, or if our ability to compete for new contracts is adversely affected, we could suffer a reduction in expected revenue.
We make estimates and assumptions in connection with the preparation of HP's Consolidated Financial Statements, and any changes to those estimates and assumptions could adversely affect our results of operations.
In connection with the preparation of HP's Consolidated Financial Statements, we use certain estimates and assumptions based on historical experience and other factors. Our most critical accounting estimates are described in "Management's Discussion and Analysis of Financial Condition and Results of Operations" in this report. In addition, as discussed in Note 18 to the Consolidated Financial Statements, we make certain estimates, including decisions related to provisions for legal proceedings and other contingencies. While we believe that these estimates and assumptions are reasonable under the circumstances, they are subject to significant uncertainties, some of which are beyond our control. Should any of these estimates and assumptions change or prove to have been incorrect, it could adversely affect our results of operations.
Unanticipated changes in HP's tax provisions, the adoption of new tax legislation or exposure to additional tax liabilities could affect our profitability.
We are subject to income and other taxes in the United States and numerous foreign jurisdictions. Our tax liabilities are affected by the amounts we charge for inventory, services, licenses, funding and other items in intercompany transactions. We are subject to ongoing tax audits in various jurisdictions. Tax authorities may disagree with our intercompany charges, cross-jurisdictional transfer pricing or other matters and assess additional taxes. We regularly assess the likely outcomes of these audits in order to determine the appropriateness of our tax provision. However, there can be no assurance that we will accurately predict the outcomes of these audits, and the amounts ultimately paid upon
26
Table of Contents
resolution of audits could be materially different from the amounts previously included in our income tax expense and therefore could have a material impact on our tax provision, net income and cash flows. In addition, our effective tax rate in the future could be adversely affected by changes to our operating structure, changes in the mix of earnings in countries with differing statutory tax rates, changes in the valuation of deferred tax assets and liabilities, changes in tax laws and the discovery of new information in the course of our tax return preparation process. In particular, the carrying value of deferred tax assets, which are predominantly in the United States, is dependent on our ability to generate future taxable income in the United States. In addition, President Obama's administration has announced proposals for other U.S. tax legislation that, if adopted, could adversely affect our tax rate. There are also other tax proposals that have been introduced, that are being considered, or that have been enacted by the United States Congress or the legislative bodies in foreign jurisdictions that could affect our tax rate, the carrying value of deferred tax assets, or our other tax liabilities. For example, the Commonwealth of Puerto Rico has enacted tax legislation effective on January 1, 2011 that, in certain situations, would impose a new, temporary excise tax relating to our non-Puerto Rican subsidiaries that sell products manufactured by our Puerto Rican subsidiaries. Any of these changes could affect our profitability.
Our sales cycle makes planning and inventory management difficult and future financial results less predictable.
In some of our segments, our quarterly sales often have reflected a pattern in which a disproportionate percentage of each quarter's total sales occur towards the end of such quarter. This uneven sales pattern makes prediction of revenue, earnings, cash flow from operations and working capital for each financial period difficult, increases the risk of unanticipated variations in quarterly results and financial condition and places pressure on our inventory management and logistics systems. If predicted demand is substantially greater than orders, there will be excess inventory. Alternatively, if orders substantially exceed predicted demand, we may not be able to fulfill all of the orders received in the last few weeks of each quarter. Other developments late in a quarter, such as a systems failure, component pricing movements, component shortages or global logistics disruptions, could adversely impact inventory levels and results of operations in a manner that is disproportionate to the number of days in the quarter affected.
We experience some seasonal trends in the sale of our products that also may produce variations in quarterly results and financial condition. For example, sales to governments (particularly sales to the United States government) are often stronger in the third calendar quarter, consumer sales are often stronger in the fourth calendar quarter, and many customers whose fiscal and calendar years are the same spend their remaining capital budget authorizations in the fourth calendar quarter prior to new budget constraints in the first calendar quarter of the following year. European sales are often weaker during the summer months. Demand during the spring and early summer also may be adversely impacted by market anticipation of seasonal trends. Moreover, to the extent that we introduce new products in anticipation of seasonal demand trends, our discounting of existing products may adversely affect our gross margin prior to or shortly after such product launches. Typically, our third fiscal quarter is our weakest and our fourth fiscal quarter is our strongest. Many of the factors that create and affect seasonal trends are beyond our control.
Any failure by us to execute on our strategy for operational efficiency successfully could result in total costs and expenses that are greater than expected.
We have adopted an operating framework that includes a disciplined focus on operational efficiency. As part of this framework, we have adopted several initiatives, including a multi-year program announced in 2006 to reduce real estate costs by consolidating several hundred HP real estate locations worldwide to fewer core sites, and a multi-year process of examining every function and every one of our businesses and functions in order to optimize efficiency and reduce cost. We have also
27
Table of Contents
implemented a workforce restructuring program in fiscal 2008 relating to our acquisition of Electronic Data Systems Corporation ("EDS"), a workforce restructuring program in fiscal 2009 relating to our product businesses and a multi-year restructuring plan in the third quarter of fiscal 2010 relating to our enterprise services business.
Our ability to achieve the anticipated cost savings and other benefits from these initiatives within the expected time frame is subject to many estimates and assumptions, including estimates and assumptions regarding the cost of consolidating real estate locations, the amount of accelerated depreciation or asset impairment to be incurred when we vacate facilities or cease using equipment before the end of their respective lease term or asset life, and the costs and timing of other activities in connection with these initiatives. These estimates and assumptions are subject to significant economic, competitive and other uncertainties, some of which are beyond our control. In addition, there are significant risks associated with our workforce restructuring programs, including potential delays in the implementation of those programs in highly regulated locations outside of the United States, particularly in Europe and Asia, decreases in employee morale, and the failure to meet operational targets due to the loss of employees. If these estimates and assumptions are incorrect, if we experience delays, or if other unforeseen events occur, our business and results of operations could be adversely affected.
In order to be successful, we must attract, retain and motivate key employees, and failure to do so could seriously harm us.
In order to be successful, we must attract, retain and motivate executives and other key employees, including those in managerial, technical, sales, marketing and IT support positions. Hiring and retaining qualified executives, engineers, skilled solutions providers in the IT support business and qualified sales representatives are critical to our future, and competition for experienced employees in the IT industry can be intense. In order to attract and retain executives and other key employees in a competitive marketplace, we must provide a competitive compensation package, including cash and share-based compensation. Our primary form of share-based incentive award is performance-based restricted stock units, which contain conditions relating to HP's long-term financial and stock price performance that makes the future value of those awards uncertain. If the anticipated value of such share-based incentive awards does not materialize, if our share-based compensation otherwise ceases to be viewed as a valuable benefit, or if our total compensation package is not viewed as being competitive, our ability to attract, retain, and motivate executives and key employees could be weakened. The failure to successfully hire executives and key employees or the loss of any executives and key employees could have a significant impact on our operations.
Terrorist acts, conflicts and wars may seriously harm our business and revenue, costs and expenses and financial condition and stock price.
Terrorist acts, conflicts or wars (wherever located around the world) may cause damage or disruption to HP, our employees, facilities, partners, suppliers, distributors, resellers or customers. The potential for future attacks, the national and international responses to attacks or perceived threats to national security, and other actual or potential conflicts or wars, including the ongoing military operations in Iraq and Afghanistan have created many economic and political uncertainties. In addition, as a major multinational company with headquarters and significant operations located in the United States, actions against or by the United States may impact our business or employees. Although it is impossible to predict the occurrences or consequences of any such events, they could result in a decrease in demand for our products, make it difficult or impossible to deliver products to our customers or to receive components from our suppliers, create delays and inefficiencies in our supply chain and result in the need to impose employee travel restrictions. We are predominantly uninsured for losses and interruptions caused by terrorist acts, conflicts and wars.
28
Table of Contents
Any failure by us to identify, manage, complete and integrate acquisitions, divestitures and other significant transactions successfully could harm our financial results, business and prospects, and the costs, expenses and other financial and operational effects associated with managing, completing and integrating acquisitions may result in financial results that are different than expected.
As part of our business strategy, we frequently acquire complementary companies or businesses, divest non-core businesses or assets, enter into strategic alliances and joint ventures and make investments to further our business (collectively, "business combination and investment transactions"). In order to pursue this strategy successfully, we must identify suitable candidates for and successfully complete business combination and investment transactions, some of which may be large and complex, and manage post-closing issues such as the integration of acquired companies or employees. We may not fully realize all of the anticipated benefits of any business combination and investment transaction, and the timeframe for achieving benefits of a business combination and investment transaction may depend partially upon the actions of employees, suppliers or other third parties. In addition, the pricing and other terms of our contracts for business combination and investment transactions require us to make estimates and assumptions at the time we enter into these contracts, and, during the course of our due diligence, we may not identify all of the factors necessary to estimate our costs accurately. Any increased or unexpected costs, unanticipated delays or failure to meet contractual obligations could make these transactions less profitable or unprofitable. Moreover, if we fail to identify and successfully complete business combination and investment transactions that further our strategic objectives, we may be required to expend resources to develop products and technology internally, we may be at a competitive disadvantage or we may be adversely affected by negative market perceptions, any of which could adversely affect our revenue, gross margin and profitability.
Integration issues are complex, time-consuming and expensive and, without proper planning and implementation, could significantly disrupt our business. The challenges involved in integration include:
• combining product offerings and entering into new markets in which we are not experienced;• convincing customers and distributors that the transaction will not diminish client service standards or business focus, preventing customers and distributors from deferring purchasing decisions or switching to other suppliers (which could result in our incurring additional obligations in order to address customer uncertainty), minimizing sales force attrition and coordinating sales, marketing and distribution efforts;
• consolidating and rationalizing corporate IT infrastructure, which may include multiple legacy systems from various acquisitions and integrating software code;
• minimizing the diversion of management attention from ongoing business concerns;
• persuading employees that business cultures are compatible, maintaining employee morale and retaining key employees, engaging with employee works councils representing an acquired company's non-U.S. employees, integrating employees into HP, correctly estimating employee benefit costs and implementing restructuring programs;
• coordinating and combining administrative, manufacturing, research and development and other operations, subsidiaries, facilities and relationships with third parties in accordance with local laws and other obligations while maintaining adequate standards, controls and procedures;
• achieving savings from supply chain integration; and
• managing integration issues shortly after or pending the completion of other independent transactions.
Managing business combination and investment transactions requires varying levels of management resources, which may divert our attention from other business operations. These business combination
29
Table of Contents
and investment transactions also have resulted, and in the future may result, in significant costs and expenses and charges to earnings, including those related to severance pay, early retirement costs, employee benefit costs, asset impairment charges, charges from the elimination of duplicative facilities and contracts, in-process research and development charges, inventory adjustments, assumed litigation and other liabilities, legal, accounting and financial advisory fees, and required payments to executive officers and key employees under retention plans. Moreover, HP has incurred and will incur additional depreciation and amortization expense over the useful lives of certain assets acquired in connection with business combination and investment transactions, and, to the extent that the value of goodwill or intangible assets with indefinite lives acquired in connection with a business combination and investment transaction becomes impaired, we may be required to incur additional material charges relating to the impairment of those assets. In order to complete an acquisition, we may issue common stock, potentially creating dilution for existing stockholders. In addition, we may borrow to finance an acquisition, and the amount and terms of any potential future acquisition-related borrowings, as well as other factors, could affect our liquidity and financial condition and potentially our credit ratings. Any potential future downgrades in our credit rating associated with an acquisition could adversely affect our ability to borrow and cost of borrowing and result in more restrictive borrowing terms. In addition, HP's effective tax rate on an ongoing basis is uncertain, and business combination and investment transactions could impact our effective tax rate. We also may experience risks relating to the challenges and costs of closing a business combination and investment transaction and the risk that an announced business combination and investment transaction may not close. As a result, any completed, pending or future transactions may contribute to financial results that differ from the investment community's expectations in a given quarter.
Unforeseen environmental costs could impact our future net earnings.
We are subject to various federal, state, local and foreign laws and regulations concerning environmental protection, including laws addressing the discharge of pollutants into the air and water, the management and disposal of hazardous substances and wastes, the cleanup of contaminated sites, the content of our products and the recycling, treatment and disposal of our products including batteries. In particular, we face increasing complexity in our product design and procurement operations as we adjust to new and future requirements relating to the chemical and materials composition of our products, their safe use, the energy consumption associated with those products, climate change laws and regulations, and product take-back legislation. We could incur substantial costs, our products could be restricted from entering certain jurisdictions, and we could face other sanctions, if we were to violate or become liable under environmental laws or if our products become non-compliant with environmental laws. Our potential exposure includes fines and civil or criminal sanctions, third-party property damage, personal injury claims and clean up costs. Further, liability under some environmental laws relating to contaminated sites can be imposed retroactively, on a joint and several basis, and without any finding of noncompliance or fault. The amount and timing of costs under environmental laws are difficult to predict.
Some anti-takeover provisions contained in our certificate of incorporation and bylaws, as well as provisions of Delaware law, could impair a takeover attempt.
We have provisions in our certificate of incorporation and bylaws, each of which could have the effect of rendering more difficult or discouraging an acquisition of HP deemed undesirable by our Board of Directors. These include provisions:
• authorizing blank check preferred stock, which HP could issue with voting, liquidation, dividend and other rights superior to our common stock;• limiting the liability of, and providing indemnification to, HP's directors and officers;
30
Table of Contents
• specifying that HP stockholders may take action only at a duly called annual or special meeting of stockholders and otherwise in accordance with our bylaws and limiting the ability of our stockholders to call special meetings;• requiring advance notice of proposals by HP stockholders for business to be conducted at stockholder meetings and for nominations of candidates for election to our Board of Directors;
• requiring a vote by the holders of two-thirds of HP's outstanding shares to amend certain bylaws relating to HP stockholder meetings, the Board of Directors and indemnification; and
• controlling the procedures for conduct of HP Board and stockholder meetings and election, appointment and removal of HP directors.
These provisions, alone or together, could deter or delay hostile takeovers, proxy contests and changes in control or management of HP. As a Delaware corporation, HP also is subject to provisions of Delaware law, including Section 203 of the Delaware General Corporation Law, which prevents some stockholders from engaging in certain business combinations without approval of the holders of substantially all of HP's outstanding common stock.
Any provision of our certificate of incorporation or bylaws or Delaware law that has the effect of delaying or deterring a change in control of HP could limit the opportunity for our stockholders to receive a premium for their shares of HP common stock and also could affect the price that some investors are willing to pay for HP common stock.
ITEM 1B. Unresolved Staff Comments.
Not applicable.
ITEM 2. Properties.
As of October 31, 2010, we owned or leased a total of approximately 80 million square feet of space worldwide. We owned 45% of this space and leased the remaining 55%. Included in these amounts are 14 million square feet of vacated space, of which 2 million square feet is leased to non-HP interests. We believe that our existing properties are in good condition and are suitable for the conduct of our business.
As of October 31, 2010, HP core sales and support operations occupied approximately 10 million square feet. We own 34% of the space used for sales and support activities and lease the remaining 66%.
HP core manufacturing plants, research and development facilities and warehouse and administrative facilities occupied approximately 56 million square feet. We own 45% of our manufacturing, research and development, warehouse and administrative space and lease the remaining 55%. Our plants are equipped with machinery, most of which we own and which, in part, we developed to meet the special requirements of our manufacturing processes. We continue to execute on our plan to reduce our real estate costs and increase our productive utilization by consolidating into several hundred HP core real estate locations worldwide.
As mentioned above in Item 1. Business, we have seven business segments: Services, ESS, HP Software, PSG, IPG, HPFS, and Corporate Investments. Because of the interrelation of these segments, a majority of these segments use substantially all of the properties at least in part, and we retain the flexibility to use each of the properties in whole or in part for each of the segments.
31
Table of Contents
Principal Executive Offices
Our principal executive offices, including our global headquarters, are located at 3000 Hanover Street, Palo Alto, California, United States of America.
Headquarters of Geographic Operations
The locations of our headquarters of geographic operations at October 31, 2010 were as follows:
| Americas | Europe, Middle East, Africa | Asia Pacific | ||
| Houston, United States Miami, United States Mississauga, Canada | Geneva, Switzerland | Singapore Tokyo, Japan |
Product Development and Manufacturing
The locations of our major product development, manufacturing, and HP Labs at October 31, 2010 were as follows:
| Americas | Europe, Middle East, Africa | Hewlett-Packard Laboratories | ||
|---|---|---|---|---|
| Aguadilla, Puerto Rico Cupertino, Roseville, San Diego, and Woodland, California Fort Collins, Colorado Boise, Idaho Indianapolis, Indiana Andover, Massachusetts Corvallis, Oregon LaVergne, Tennessee Houston, Texas Sandston, Virginia Vancouver, Washington | Herrenberg, Germany Leixlip, Ireland Kiryat-Gat, Nes Ziona, and Netanya, Israel Amersfoort, The Netherlands Sant Cugat del Valles, Spain Erskine, United Kingdom Asia Pacific ChongQing and Shanghai, China Udham Singh Nagar, India Tokyo, Japan Singapore | Bangalore, India Beijing, China Bristol, United Kingdom Fusionopolis, Singapore Haifa, Israel Palo Alto, United States St. Petersburg, Russia |
ITEM 3. Legal Proceedings.
Information with respect to this item may be found in Note 18 to the Consolidated Financial Statements in Item 8, which is incorporated herein by reference.
32
Table of Contents
PART II
ITEM 5. Market for Registrant's Common Equity, Related Stockholder Matters and Issuer Purchases of Equity Securities.
Information regarding the market prices of HP common stock and the markets for that stock may be found in the "Quarterly Summary" in Item 8 and on the cover page of this Annual Report on Form 10-K, respectively, which are incorporated herein by reference. We have declared and paid cash dividends each fiscal year since 1965. The trend has been to declare $0.16 per share in each first fiscal quarter and third fiscal quarter and to pay $0.08 per share in each fiscal quarter. As of November 30, 2010, there were approximately 118,100 stockholders of record. Additional information concerning dividends may be found in "Selected Financial Data" in Item 6 and in Item 8, which are incorporated herein by reference.
Recent Sales of Unregistered Securities
There were no unregistered sales of equity securities in fiscal 2010 that have not been previously reported in a Quarterly Report on Form 10-Q.
Issuer Purchases of Equity Securities
Period | Total Number of Shares Purchased | Average Price Paid per Share | Total Number of Shares Purchased as Part of Publicly Announced Plans or Programs | Approximate Dollar Value of Shares that May Yet Be Purchased under the Plans or Programs | |||||||||
|---|---|---|---|---|---|---|---|---|---|---|---|---|---|
| | In thousands, except per share amounts | ||||||||||||
Month #1 | 27,964 | $ | 41.97 | 27,964 | $ | 13,701,215 | |||||||
Month #2 | 34,312 | $ | 39.52 | 34,312 | $ | 12,345,379 | |||||||
Month #3 | 34,204 | $ | 41.90 | 34,204 | $ | 10,912,310 | |||||||
Total | 96,480 | $ | 41.07 | 96,480 | |||||||||
HP repurchased shares in the fourth quarter of fiscal 2010 under an ongoing program to manage the dilution created by shares issued under employee stock plans as well as to repurchase shares opportunistically. This program, which does not have a specific expiration date, authorizes repurchases in the open market or in private transactions. All shares repurchased in the fourth quarter of fiscal 2010 were purchased in open market transactions.
As of October 31, 2010, HP had remaining authorization of $10.9 billion for future share repurchases under the $8.0 billion and $10.0 billion repurchase authorizations approved by HP's Board of Directors on November 19, 2009 and August 29, 2010, respectively.
33
Table of Contents
Stock Performance Graph and Cumulative Total Return
The graph below shows the cumulative total stockholder return assuming the investment of $100 on the date specified (and the reinvestment of dividends thereafter) in each of HP common stock, the S&P 500 Index, and the S&P Information Technology Index. (1) The comparisons in the graph below are based upon historical data and are not indicative of, or intended to forecast, future performance of our common stock.
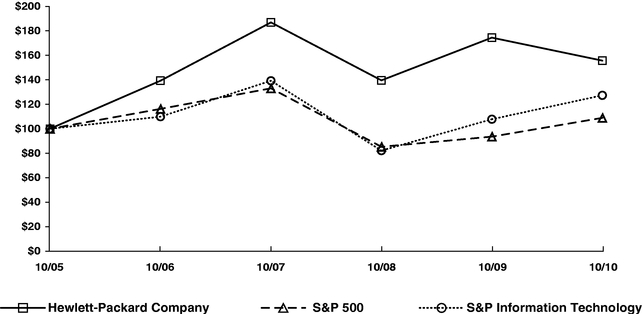
| | 10/05 | 10/06 | 10/07 | 10/08 | 10/09 | 10/10 | |||||||||||||
|---|---|---|---|---|---|---|---|---|---|---|---|---|---|---|---|---|---|---|---|
Hewlett-Packard Company | 100.00 | 139.54 | 187.52 | 139.83 | 174.99 | 156.07 | |||||||||||||
S&P 500 | 100.00 | 116.34 | 133.28 | 85.17 | 93.52 | 108.97 | |||||||||||||
S&P Information Technology | 100.00 | 109.93 | 139.51 | 82.02 | 107.85 | 127.52 | |||||||||||||
(1) The stock performance graph does not include HP's peer group because peer group information is represented and included in the S&P Information Technology Index.
34
Table of Contents
ITEM 6. Selected Financial Data.
The information set forth below is not necessarily indicative of results of future operations and should be read in conjunction with Item 7, "Management's Discussion and Analysis of Financial Condition and Results of Operations," and the Consolidated Financial Statements and notes thereto included in Item 8, "Financial Statements and Supplementary Data," of this Form 10-K, which are incorporated herein by reference, in order to understand further the factors that may affect the comparability of the financial data presented below.
HEWLETT-PACKARD COMPANY AND SUBSIDIARIES
Selected Financial Data
| | For the fiscal years ended October 31 | ||||||||||||||||
|---|---|---|---|---|---|---|---|---|---|---|---|---|---|---|---|---|---|
| | 2010 | 2009 | 2008 | 2007 | 2006 | ||||||||||||
| | In millions, except per share amounts | ||||||||||||||||
Net revenue | $ | 126,033 | $ | 114,552 | $ | 118,364 | $ | 104,286 | $ | 91,658 | |||||||
Earnings from operations (1) | $ | 11,479 | $ | 10,136 | $ | 10,473 | $ | 8,719 | $ | 6,560 | |||||||
Net earnings | $ | 8,761 | $ | 7,660 | $ | 8,329 | $ | 7,264 | $ | 6,198 | |||||||
Net earnings per share | |||||||||||||||||
Basic | $ | 3.78 | $ | 3.21 | $ | 3.35 | $ | 2.76 | $ | 2.23 | |||||||
Diluted | $ | 3.69 | $ | 3.14 | $ | 3.25 | $ | 2.68 | $ | 2.18 | |||||||
Cash dividends declared per share | $ | 0.32 | $ | 0.32 | $ | 0.32 | $ | 0.32 | $ | 0.32 | |||||||
At year-end: | |||||||||||||||||
Total assets | $ | 124,503 | $ | 114,799 | $ | 113,331 | $ | 88,699 | $ | 81,981 | |||||||
Long-term debt | $ | 15,258 | $ | 13,980 | $ | 7,676 | $ | 4,997 | $ | 2,490 | |||||||
(1) Earnings from operations include the following items:
| | 2010 | 2009 | 2008 | 2007 | 2006 | ||||||||||||
|---|---|---|---|---|---|---|---|---|---|---|---|---|---|---|---|---|---|
| | In millions | ||||||||||||||||
Amortization of purchased intangible assets | $ | 1,484 | $ | 1,578 | $ | 1012 | $ | 973 | $ | 656 | |||||||
Restructuring charges | 1,144 | 640 | 270 | 387 | 158 | ||||||||||||
Pension curtailments and pension settlements, net | - | - | - | (517 | ) | - | |||||||||||
Acquisition-related charges | 293 | 242 | 41 | - | - | ||||||||||||
Total charges before taxes | $ | 2,921 | $ | 2,460 | $ | 1,323 | $ | 843 | $ | 814 | |||||||
Total charges, net of taxes | $ | 2,105 | $ | 1,733 | $ | 973 | $ | 690 | $ | 604 | |||||||
35
Table of Contents
ITEM 7. Management's Discussion and Analysis of Financial Condition and Results of Operations.
HEWLETT-PACKARD COMPANY AND SUBSIDIARIES
Management's Discussion and Analysis of
Financial Condition and Results of Operations
The following discussion should be read in conjunction with the Consolidated Financial Statements and the related notes that appear elsewhere in this document.
OVERVIEW
We are a leading global provider of products, technologies, software, solutions and services to individual consumers, small- and medium-sized businesses, and large enterprises, including customers in the government, health and education sectors. Our offerings span:
• multi-vendor customer services, including infrastructure technology and business process outsourcing, technology support and maintenance, application development and support services, and consulting and integration services;• enterprise information technology infrastructure, including enterprise storage and server technology, networking products and solutions, information management software and software that optimizes business technology investments;
• personal computing and other access devices; and
• imaging and printing-related products and services.
We have seven business segments for financial reporting purposes: Services, Enterprise Storage and Servers ("ESS"), HP Software, the Personal Systems Group ("PSG"), the Imaging and Printing Group ("IPG"), HP Financial Services ("HPFS"), and Corporate Investments. Services, ESS and HP Software are reported collectively as a broader HP Enterprise Business. While the HP Enterprise Business is not an operating segment, we sometimes provide financial data aggregating the segments within it in order to provide a supplementary view of our business.
Our strategy and operations are currently focused on the following initiatives:
Competitive Positioning
We are positioning our businesses to take advantage of important trends in the markets for our products and services. For example, we are aligning our printing business to capitalize on key market trends such as the shift from analog to digital printing and the growth in printable content by developing innovative products for consumers such as the first web-connected home printer, working to enable web and mobile printing, expanding our presence in high-usage annuity businesses including graphics and retail publishing printing, and growing our managed print services business. We are also positioning our enterprise business to capitalize on the trend towards converged infrastructure products that integrate storage, networking, servers and management software, while also delivering services for that converged infrastructure in a manner that best fits each client's needs, be it at a client site, as an outsourced service via the Internet or via a hybrid approach. In addition, we have developed IT management software offerings that seek to satisfy the increasing demand for virtualization management and increased automation.
Driving Operational Efficiency
We are working to optimize efficiency across the company. As part of those efforts, we are continuing to execute on our multi-year program to consolidate real estate locations worldwide to fewer
36
Table of Contents
HEWLETT-PACKARD COMPANY AND SUBSIDIARIES
Management's Discussion and Analysis of
Financial Condition and Results of Operations (Continued)
core sites in order to reduce our IT spending and real estate costs. We are also continuing to implement the restructuring plan announced in the fourth quarter of fiscal 2008 to optimize the cost structure of our Services business and the restructuring plan announced in May 2009 to structurally change and improve the effectiveness of several of our product businesses. In June 2010, we announced and started implementing a new restructuring plan that will consolidate data centers, systems and tools to better position for growth our enterprise services business, which includes our infrastructure technology outsourcing, application services, and business process outsourcing business units. See Note 8 to the Consolidated Financial Statements in Item 8 for further discussion of these restructuring plans and the associated restructuring charges.
Investing for Growth
We are investing for growth by strengthening our position in our core markets and accelerating growth in adjacent markets in anticipation of market trends, such as data center consolidation and automation, cloud computing and virtualization, digitization, IT security, and mobility and connectivity. For example, we are increasing our sales coverage and investing in our sales channels to better address the markets we cover, including further expansion in emerging markets. We are creating innovative new products and developing new channels to connect with our customers. In addition, we have been making focused investments in innovation to strengthen our portfolio of products and services that we can offer to our customers, both through acquisitions and through organic growth. A critical component of this strategy was our acquisition of Electronic Data Systems Corporation ("EDS") in August 2008, which has increased the size and breadth of our services business and enabled us to provide comprehensive IT product and services solutions to our customers. In addition, with the completion of the acquisition of 3Com Corporation ("3Com") in April 2010, we are accelerating our investments in networking. In July 2010, we completed the acquisition of Palm, Inc. ("Palm"), which enhances our ability to participate more aggressively in the growing smartphone and connected mobile device markets. In September 2010, we completed the acquisition of 3PAR Inc. ("3PAR"), which expands our storage portfolio into enterprise-class public and private cloud computing environments. In October 2010, we completed the acquisition of ArcSight, Inc. ("ArcSight"), which enables us to offer customers an integrated security platform with a holistic approach to securing their networks, applications and sensitive data. These acquisitions have enabled us to expand in high-margin and high-growth industry segments and have further strengthened our portfolio of hardware, software and services.
Leveraging our Portfolio and Scale
We now offer one of the IT industry's broadest portfolios of products and services, and we leverage that portfolio to our strategic advantage. For example, in our enterprise business, we are able to provide servers, storage and networking products packaged with services that can be delivered to customers in the manner of their choosing, be it in-house, outsourced as a service via the Internet or via a hybrid environment. Our portfolio of management software completes the package by allowing our customers to manage their IT operations in an efficient and cost-effective manner. In addition, we are working to optimize our supply chain by eliminating complexity, reducing fixed costs, and leveraging our scale to ensure the availability of components at favorable prices even during shortages. We are also expanding our use of industry standard components in our enterprise products to further leverage our scale.
37
Table of Contents
HEWLETT-PACKARD COMPANY AND SUBSIDIARIES
Management's Discussion and Analysis of
Financial Condition and Results of Operations (Continued)
The following provides an overview of our key fiscal 2010 financial metrics and demonstrates how our execution has translated into financial performance:
| | | HP Enterprise Business | | | | |||||||||||||||||||||
|---|---|---|---|---|---|---|---|---|---|---|---|---|---|---|---|---|---|---|---|---|---|---|---|---|---|---|
| | HP (1) Consolidated | Services | ESS | HP Software | Total | PSG | IPG | HPFS | ||||||||||||||||||
| | In millions, except per share amounts | |||||||||||||||||||||||||
Net revenue | $ | 126,033 | $ | 34,935 | $ | 18,651 | $ | 3,586 | $ | 57,172 | $ | 40,741 | $ | 25,764 | $ | 3,047 | ||||||||||
Year-over-year net revenue % increase | 10.0 | % | 0.7 | % | 21.4 | % | 0.4 | % | 6.6 | % | 15.4 | % | 7.3 | % | 14.0 | % | ||||||||||
Earnings from operations | $ | 11,479 | $ | 5,609 | $ | 2,402 | $ | 759 | $ | 8,770 | $ | 2,032 | $ | 4,412 | $ | 281 | ||||||||||
Earnings from operations as a % of net revenue | 9.1 | % | 16.1 | % | 12.9 | % | 21.2 | % | 15.3 | % | 5.0 | % | 17.1 | % | 9.2 | % | ||||||||||
Net earnings | $ | 8,761 | ||||||||||||||||||||||||
Net earnings per share | ||||||||||||||||||||||||||
Basic | $ | 3.78 | ||||||||||||||||||||||||
Diluted | $ | 3.69 | ||||||||||||||||||||||||
(1) Includes Corporate Investments and eliminations.
Cash and cash equivalents at October 31, 2010 totaled $10.9 billion, a decrease of $2.4 billion from the October 31, 2009 balance of $13.3 billion. The decrease for fiscal 2010 was due primarily to $11.0 billion of cash used to repurchase common stock, $8.1 billion of net cash paid for business acquisitions, and $3.5 billion net investment in property, plant and equipment, all of which were partially offset by $11.9 billion of cash provided from operations, $6.0 billion of increased net borrowings, and $2.6 billion of proceeds related to issuance of common stock under employee stock plans.
We intend the discussion of our financial condition and results of operations that follows to provide information that will assist in understanding our Consolidated Financial Statements, the changes in certain key items in those financial statements from year to year, and the primary factors that accounted for those changes, as well as how certain accounting principles, policies and estimates affect our Consolidated Financial Statements.
The discussion of results of operations at the consolidated level is followed by a more detailed discussion of results of operations by segment.
For a further discussion of trends, uncertainties and other factors that could impact our operating results, see the section entitled "Risk Factors" in Item 1A, which is incorporated herein by reference.
CRITICAL ACCOUNTING POLICIES AND ESTIMATES
General
The Consolidated Financial Statements of HP are prepared in accordance with U.S. generally accepted accounting principles ("GAAP"), which require management to make estimates, judgments and assumptions that affect the reported amounts of assets, liabilities, net revenue and expenses, and the disclosure of contingent assets and liabilities. Management bases its estimates on historical experience and on various other assumptions that it believes to be reasonable under the circumstances, the results of which form the basis for making judgments about the carrying values of assets and liabilities that are not readily apparent from other sources. Senior management has discussed the
38
Table of Contents
HEWLETT-PACKARD COMPANY AND SUBSIDIARIES
Management's Discussion and Analysis of
Financial Condition and Results of Operations (Continued)
development, selection and disclosure of these estimates with the Audit Committee of HP's Board of Directors. Management believes that the accounting estimates employed and the resulting balances are reasonable; however, actual results may differ from these estimates under different assumptions or conditions.
The summary of significant accounting policies is included in Note 1 to the consolidated financial statements in Item 8. An accounting policy is deemed to be critical if it requires an accounting estimate to be made based on assumptions about matters that are highly uncertain at the time the estimate is made, if different estimates reasonably could have been used, or if changes in the estimate that are reasonably possible could materially impact the financial statements. Management believes the following critical accounting policies reflect the significant estimates and assumptions used in the preparation of the Consolidated Financial Statements.
Revenue Recognition
We enter into contracts to sell our products and services, and, while the majority of our sales agreements contain standard terms and conditions, there are agreements that contain multiple elements or non-standard terms and conditions. As a result, significant contract interpretation is sometimes required to determine the appropriate accounting, including whether the deliverables specified in a multiple element arrangement should be treated as separate units of accounting for revenue recognition purposes, and, if so, how the price should be allocated among the elements and when to recognize revenue for each element. We recognize revenue for delivered elements only when the delivered elements have standalone value, uncertainties regarding customer acceptance are resolved and there are no customer-negotiated refund or return rights for the delivered elements. If the arrangement includes a customer-negotiated refund or return right relative to the delivered item and the delivery and performance of the undelivered item is considered probable and substantially in our control, the delivered element constitutes a separate unit of accounting. Changes in the allocation of the sales price between elements may impact the timing of revenue recognition but will not change the total revenue recognized on the contract.
We recognize revenue as work progresses on certain fixed price contracts, such as consulting arrangements. Using a proportional performance method, we estimate the total expected labor costs in order to determine the amount of revenue earned to date. We follow this basis because reasonably dependable estimates of the labor costs applicable to various stages of a contract can be made. Total contract profit is subject to revisions throughout the life of the contract. We record changes in revenue to income, as a result of revisions to cost estimates, in the period in which the facts that give rise to the revision become known.
We recognize revenue on certain design and build (design, development and/or constructions of software and/or systems) projects using the percentage-of-completion method. We use the cost-to-cost method of measurement towards completion as determined by the percentage of cost incurred to date to the total estimated costs of the project. In circumstances when reasonable and reliable cost estimates for a project cannot be made, we recognize revenue using the completed contract method.
We record estimated reductions to revenue for customer and distributor programs and incentive offerings, including price protection, promotions, other volume-based incentives and expected returns. Future market conditions and product transitions may require us to take actions to increase customer incentive offerings, possibly resulting in an incremental reduction of revenue at the time the incentive is offered. Additionally, certain incentive programs require us to estimate, based on historical experience
39
Table of Contents
HEWLETT-PACKARD COMPANY AND SUBSIDIARIES
Management's Discussion and Analysis of
Financial Condition and Results of Operations (Continued)
and the specific terms and conditions of the incentive, the number of customers who will actually redeem the incentive.
Under our current revenue recognition policies, which were applied in fiscal 2010 and 2009, we establish vendor-specific objective evidence ("VSOE") of selling price using the price charged for a deliverable when sold separately and, in rare instances, using the price established by management having the relevant authority. Third-party evidence of selling price is established by evaluating largely similar and interchangeable competitor products or services in standalone sales to similarly situated customers. The best estimate of selling price ("ESP") is established considering internal factors such as margin objectives, pricing practices and controls, customer segment pricing strategies and the product life cycle. Consideration is also given to market conditions such as competitor pricing strategies and industry technology life cycles. When determining our best estimate of selling price, we apply management judgment when establishing margin objectives and pricing strategies and evaluating market conditions and product life cycles. We may modify or develop new go-to-market practices in the future. As these go-to-market strategies evolve, we may modify our pricing practices in the future, which may result in changes in selling prices, impacting both VSOE and ESP. The aforementioned factors may result in a different allocation of revenue to the deliverables in multiple element arrangements from the current fiscal year, which may change the pattern and timing of revenue recognition for these elements but will not change the total revenue recognized for the arrangement.
For 2008, pursuant to the previous guidance for revenue arrangements with multiple deliverables, HP allocated revenue to each element based on relative fair value, or, for software, based on VSOE of fair value.
Warranty Provision
We provide for the estimated cost of product warranties at the time we recognize revenue. We evaluate our warranty obligations on a product group basis. Our standard product warranty terms generally include post-sales support and repairs or replacement of a product at no additional charge for a specified period of time. While we engage in extensive product quality programs and processes, including actively monitoring and evaluating the quality of our component suppliers, we base our estimated warranty obligation upon warranty terms, ongoing product failure rates, repair costs, product call rates, average cost per call, and current period product shipments. If actual product failure rates, repair rates or any other post sales support costs were to differ from our estimates, we would be required to make revisions to the estimated warranty liability. Warranty terms generally range from 90 days to three years for parts and labor, depending upon the product. Over the last three fiscal years, the annual warranty provision has averaged approximately 3.5% of annual net product revenue, while actual annual warranty costs have experienced favorable trends and averaged approximately 3.3% of annual net product revenue.
Business Combinations
We allocate the purchase price of acquired companies to the tangible assets acquired, liabilities assumed and intangible assets acquired, including in-process research and development ("IPR&D"), based on their estimated fair values. The excess of the purchase price over these fair values is recorded as goodwill. We engage independent third-party appraisal firms to assist us in determining the fair values of assets acquired and liabilities assumed. Such valuations require management to make significant estimates and assumptions, especially with respect to intangible assets.
40
Table of Contents
HEWLETT-PACKARD COMPANY AND SUBSIDIARIES
Management's Discussion and Analysis of
Financial Condition and Results of Operations (Continued)
Critical estimates in valuing certain intangible assets include but are not limited to: future expected cash flows from customer contracts, customer lists, distribution agreements, and acquired developed technologies and patents; expected costs to develop IPR&D into commercially viable products and estimating cash flows from projects when completed; brand awareness and market position, as well as assumptions about the period of time the brand will continue to be used in our product portfolio; and discount rates. Management's estimates of fair value are based upon assumptions believed to be reasonable, but which are inherently uncertain and unpredictable and, as a result, actual results may differ from estimates.
Other estimates associated with the accounting for acquisitions may change as additional information becomes available regarding the assets acquired and liabilities assumed, as more fully discussed in Note 6 to the Consolidated Financial Statements in Item 8.
Valuation of Goodwill and Purchased Intangible Assets
We review goodwill and purchased intangible assets with indefinite lives for impairment annually and whenever events or changes in circumstances indicate the carrying value of an asset may not be recoverable. The provisions of the accounting standard for goodwill and other intangibles require that we perform a two-step impairment test on goodwill. In the first step, we compare the fair value of each reporting unit to its carrying value. In general, our reporting units are consistent with the reportable segments identified in Note 19 to the Consolidated Financial Statements in Item 8. However, for certain businesses within Corporate Investments, the reporting unit is one step below the segment level. We determine the fair value of our reporting units based on a weighting of income and market approaches. Under the income approach, we calculate the fair value of a reporting unit based on the present value of estimated future cash flows. Under the market approach, we estimate the fair value based on market multiples of revenue or earnings for comparable companies. If the fair value of the reporting unit exceeds the carrying value of the net assets assigned to that unit, goodwill is not impaired and we are not required to perform further testing. If the carrying value of the net assets assigned to the reporting unit exceeds the fair value of the reporting unit, then we must perform the second step of the impairment test in order to determine the implied fair value of the reporting unit's goodwill. If the carrying value of a reporting unit's goodwill exceeds its implied fair value, then we record an impairment loss equal to the difference. We also compare the fair value of purchased intangible assets with indefinite lives to their carrying value. We estimate the fair value of these intangible assets using an income approach. We recognize an impairment loss when the estimated fair value of the intangible asset is less than the carrying value.
Determining the fair value of a reporting unit or an indefinite-lived purchased intangible asset is judgmental in nature and involves the use of significant estimates and assumptions. These estimates and assumptions include revenue growth rates and operating margins used to calculate projected future cash flows, risk-adjusted discount rates, assumed royalty rates, future economic and market conditions and determination of appropriate market comparables. We base our fair value estimates on assumptions we believe to be reasonable but that are unpredictable and inherently uncertain. Actual future results may differ from those estimates. In addition, we make certain judgments and assumptions in allocating shared assets and liabilities to determine the carrying values for each of our reporting units.
Our annual goodwill impairment analysis, which we performed during the fourth quarter of fiscal 2010, did not result in an impairment charge. The excess of fair value over carrying value for each of HP's reporting units as of August 1, 2010, the annual testing date, ranged from approximately
41
Table of Contents
HEWLETT-PACKARD COMPANY AND SUBSIDIARIES
Management's Discussion and Analysis of
Financial Condition and Results of Operations (Continued)
$760 million to approximately $33 billion. In order to evaluate the sensitivity of the fair value calculations on the goodwill impairment test, we applied a hypothetical 10% decrease to the fair values of each reporting unit. This hypothetical 10% decrease would result in excess fair value over carrying value ranging from approximately $360 million to approximately $29 billion for each of HP's reporting units.
Restructuring
We have engaged, and may continue to engage, in restructuring actions, which require management to utilize significant estimates related to the timing and the expenses for severance and other employee separation costs, realizable values of assets made redundant or obsolete, lease cancellation and other exit costs. If the actual amounts differ from our estimates, the amount of the restructuring charges could be materially impacted. For a full description of our restructuring actions, refer to our discussions of restructuring in the Results of Operations section and Note 8 to the Consolidated Financial Statements in Item 8, which are incorporated herein by reference.
Stock-Based Compensation Expense
We recognize stock-based compensation expense for all share-based payment awards, net of an estimated forfeiture rate. We recognize compensation cost for only those shares expected to vest on a straight-line basis over the requisite service period of the award.
Determining the appropriate fair value model and calculating the fair value of share-based payment awards requires subjective assumptions, including the expected life of the share-based payment awards and stock price volatility. We utilize the Black-Scholes option pricing model to value the stock options granted under our principal option plans. To implement this model, we examined our historical pattern of option exercises to determine if there were any discernable activity patterns based on certain employee populations. From this analysis, we identified three employee populations to which to apply the Black-Scholes model. We determined that implied volatility calculated based on actively traded options on HP common stock is a better indicator of expected volatility and future stock price trends than historical volatility.
We issue performance-based restricted units ("PRUs") representing hypothetical shares of HP common stock. Each PRU award reflects a target number of shares that may be issued to the award recipient. We determine the actual number of shares the recipient receives at the end of a three-year performance period based on results achieved versus goals based on our annual cash flow from operations as a percentage of revenue and total shareholder return ("TSR") relative to the S&P 500 over the performance period. We use historic volatility for PRU awards as implied volatility cannot be used when simulating multivariate prices for companies in the S&P 500. We estimate the fair value of PRUs using the Monte Carlo simulation model, as the TSR modifier contains a market condition. We update the estimated expense, net of forfeitures, for the cash flow performance against the goal for that year at the end of each reporting period.
The assumptions used in calculating the fair value of share-based payment awards represent management's best estimates, but these estimates involve inherent uncertainties and the application of management judgment. As a result, if factors change and we use different assumptions, our stock-based compensation expense could be materially different in the future. In addition, we are required to estimate the expected forfeiture rate and recognize expense only for those shares expected to vest. If our actual forfeiture rate is materially different from our estimate, the stock-based compensation
42
Table of Contents
HEWLETT-PACKARD COMPANY AND SUBSIDIARIES
Management's Discussion and Analysis of
Financial Condition and Results of Operations (Continued)
expense could be significantly different from what we have recorded in the current period. See Note 2 to the Consolidated Financial Statements in Item 8 for a further discussion on stock-based compensation.
Taxes on Earnings
We calculate our current and deferred tax provisions based on estimates and assumptions that could differ from the final positions reflected in our income tax returns filed during the subsequent year. We record adjustments based on filed returns when we have identified and finalized them, which is generally in the third and fourth quarters of the subsequent year for U.S. federal and state provisions, respectively.
We recognize deferred tax assets and liabilities for the expected tax consequences of temporary differences between the tax bases of assets and liabilities and their reported amounts using enacted tax rates in effect for the year in which we expect the differences to reverse. We record a valuation allowance to reduce the deferred tax assets to the amount that we are more likely than not to realize.
We have considered future market growth, forecasted earnings, future taxable income, the mix of earnings in the jurisdictions in which we operate and prudent and feasible tax planning strategies in determining the need for a valuation allowance. In the event we were to determine that we would not be able to realize all or part of our net deferred tax assets in the future, we would increase the valuation allowance and make a corresponding charge to earnings in the period in which we make such determination. Likewise, if we later determine that we are more likely than not to realize the net deferred tax assets, we would reverse the applicable portion of the previously provided valuation allowance. In order for us to realize our deferred tax assets, we must be able to generate sufficient taxable income in the tax jurisdictions in which the deferred tax assets are located.
Our effective tax rate includes the impact of certain undistributed foreign earnings for which we have not provided U.S. taxes because we plan to reinvest such earnings indefinitely outside the United States. We plan foreign earnings remittance amounts based on projected cash flow needs as well as the working capital and long-term investment requirements of our foreign subsidiaries and our domestic operations. Based on these assumptions, we estimate the amount we will distribute to the United States and provide the U.S. federal taxes due on these amounts. Further, as a result of certain employment actions and capital investments we have undertaken, income from manufacturing activities in certain countries is subject to reduced tax rates, and in some cases is wholly exempt from taxes, for fiscal years through 2024. Material changes in our estimates of cash, working capital and long-term investment requirements in the various jurisdictions in which we do business could impact our effective tax rate.
We are subject to income taxes in the United States and approximately eighty foreign countries, and we are subject to routine corporate income tax audits in many of these jurisdictions. We believe that our tax return positions are fully supported, but tax authorities are likely to challenge certain positions, which may not be fully sustained. However, our income tax expense includes amounts intended to satisfy income tax assessments that result from these challenges. Determining the income tax expense for these potential assessments and recording the related assets and liabilities requires management judgments and estimates. We evaluate our uncertain tax positions in accordance with the guidance for accounting for uncertainty in income taxes. We believe that our reserve for uncertain tax positions, including related interest, is adequate. The amounts ultimately paid upon resolution of audits could be materially different from the amounts previously included in our income tax expense and therefore could have a material impact on our tax provision, net income and cash flows. Our reserve
43
Table of Contents
HEWLETT-PACKARD COMPANY AND SUBSIDIARIES
Management's Discussion and Analysis of
Financial Condition and Results of Operations (Continued)
for uncertain tax positions is attributable primarily to uncertainties concerning the tax treatment of our international operations, including the allocation of income among different jurisdictions, and related interest. We review our reserves quarterly, and we may adjust such reserves because of proposed assessments by tax authorities, changes in facts and circumstances, issuance of new regulations or new case law, previously unavailable information obtained during the course of an examination, negotiations between tax authorities of different countries concerning our transfer prices, execution of Advanced Pricing Agreements, resolution with respect to individual audit issues, the resolution of entire audits, or the expiration of statutes of limitations.
See Note 14 to the Consolidated Financial Statements in Item 8 for a further discussion on taxes on earnings.
Allowance for Doubtful Accounts
We determine our allowance for doubtful accounts using a combination of factors to ensure that we have not overstated our trade and financing receivables balances due to uncollectibility. We maintain an allowance for doubtful accounts for all customers based on a variety of factors, including the use of third-party credit risk models that generate quantitative measures of default probabilities based on market factors, the financial condition of customers, the length of time receivables are past due, trends in overall weighted-average risk rating of the total portfolio, macroeconomic conditions, significant one-time events and historical experience. Also, we record specific provisions for individual accounts when we become aware of specific customer circumstances, such as in the case of bankruptcy filings or deterioration in the customer's operating results or financial position. If circumstances related to customers change, we would further adjust our estimates of the recoverability of receivables either upward or downward. The annual provision for doubtful accounts has averaged approximately 0.03% of net revenue over the last three fiscal years. Using our third-party credit risk model at October 31, 2010, a 50-basis-point deterioration in the weighted-average default probabilities of our significant customers would have resulted in an approximately $64 million increase to our trade allowance at the end of fiscal year 2010.
Inventory
We state our inventory at the lower of cost or market. We make adjustments to reduce the cost of inventory to its net realizable value, if required, at the product group level for estimated excess, obsolescence or impaired balances. Factors influencing these adjustments include changes in demand, rapid technological changes, product life cycle and development plans, component cost trends, product pricing, physical deterioration and quality issues. Revisions to these adjustments would be required if these factors differ from our estimates.
Fair Value of Financial Instruments
We measure certain financial assets and liabilities at fair value based on valuation techniques using the best information available, which may include quoted market prices, market comparables, and discounted cash flow projections. Financial instruments are primarily comprised of time deposits, money market funds, commercial paper, corporate and other debt securities, equity securities and other investments in common stock and common stock equivalents and derivative instruments.
Cash Equivalents and Investments: We hold time deposits, money market funds, commercial paper, other debt securities primarily consisting of corporate and foreign government notes and bonds, and
44
Table of Contents
HEWLETT-PACKARD COMPANY AND SUBSIDIARIES
Management's Discussion and Analysis of
Financial Condition and Results of Operations (Continued)
common stock and equivalents. In general, and where applicable, we use quoted prices in active markets for identical assets to determine fair value. If quoted prices in active markets for identical assets are not available to determine fair value, then we use quoted prices for similar assets and liabilities or inputs that are observable either directly or indirectly. If quoted prices for identical or similar assets are not available, we use internally developed valuation models, whose inputs include bid prices, and third party valuations utilizing underlying asset assumptions.
Derivative Instruments: As discussed in Note 10 to the Consolidated Financial Statements in Item 8, we mainly hold non-speculative forwards, swaps and options to hedge certain foreign currency and interest rate exposures. When active market quotes are not available, we use industry standard valuation models. Where applicable, these models project future cash flows and discount the future amounts to a present value using market-based observable inputs including interest rate curves, credit risk, foreign exchange rates, and forward and spot prices for currencies. In certain cases, market-based observable inputs are not available and, in those cases, we use management judgment to develop assumptions which are used to determine fair value.
Retirement Benefits
Our pension and other post-retirement benefit costs and obligations are dependent on various assumptions. Our major assumptions relate primarily to discount rates, salary growth, long-term return on plan assets and medical cost trend rates. We base the discount rate assumption on current investment yields of high quality fixed income investments during the retirement benefits maturity period. The salary growth assumptions reflect our long-term actual experience and future and near-term outlook. Long-term return on plan assets is determined based on historical portfolio results and management's expectation of the future economic environment, as well as target asset allocations.
Our medical cost trend assumptions are developed based on historical cost data, the near-term outlook and an assessment of likely long-term trends. Actual results that differ from our assumptions are accumulated and are amortized generally over the estimated future working life of the plan participants.
Our major assumptions vary by plan and the weighted-average rates used are set forth in Note 16 to the Consolidated Financial Statements in Item 8, which is incorporated herein by reference. Each assumption has different sensitivity characteristics, and, in general, changes, if any, have moved in the same direction over the last several years. For fiscal 2010, changes in the weighted-average rates for the HP benefit plans would have had the following impact on our net periodic benefit cost:
• A decrease of 25 basis points in the long-term rate of return would have increased our net benefit cost by approximately $50 million;• A decrease of 25 basis points in the discount rate would have increased our net benefit cost by approximately $65 million; and
• An increase of 25 basis points in the future compensation rate would have increased our net benefit cost by approximately $24 million.
Loss Contingencies
We are involved in various lawsuits, claims, investigations and proceedings that arise in the ordinary course of business. We record a provision for a liability when we believe that it is both probable that a liability has been incurred and the amount can be reasonably estimated. Significant
45
Table of Contents
HEWLETT-PACKARD COMPANY AND SUBSIDIARIES
Management's Discussion and Analysis of
Financial Condition and Results of Operations (Continued)
judgment is required to determine both probability and the estimated amount. We review these provisions at least quarterly and adjust these provisions to reflect the impact of negotiations, settlements, rulings, advice of legal counsel, and updated information. Litigation is inherently unpredictable and is subject to significant uncertainties, some of which are beyond our control. Should any of these estimates and assumptions change or prove to have been incorrect, it could have a material impact on our results of operations, financial position and cash flows. See Note 18 to the Consolidated Financial Statements in Item 8 for a further discussion of litigation and contingencies.
ACCOUNTING PRONOUNCEMENTS
In June 2009, the FASB issued a new accounting standard related to the consolidation of variable interest entities. It eliminates the quantitative approach previously required for determining the primary beneficiary of a variable interest entity and requires ongoing qualitative reassessments of whether an enterprise is the primary beneficiary of a variable interest entity. This new standard also requires additional disclosures about an enterprise's involvement in variable interest entities. We will adopt this new accounting standard in the first quarter of fiscal 2011. We do not expect the adoption of this standard will have a material effect on our consolidated financial statements.
CONSTANT CURRENCY PRESENTATION
Revenue from our international operations has historically represented, and we expect will continue to represent, a majority of our overall net revenue. As a result, our revenue growth has been impacted, and we expect will continue to be impacted, by fluctuations in foreign currency exchange rates. In order to provide a framework for assessing how each of our business segments performed excluding the impact of foreign currency fluctuations, we present the year-over-year percentage change in revenue performance on a constant currency basis, which assumes no change in the exchange rate from the prior-year period. This constant currency disclosure is provided in addition to, and not as a substitute for, the year-over-year percentage change in revenue on an as-reported basis.
RESULTS OF OPERATIONS
The following discussion compares the historical results of operations on a GAAP basis for the fiscal years ended October 31, 2010, 2009, and 2008. Unless otherwise noted, all comparative performance data included below reflect year-over-year comparisons.
46
Table of Contents
HEWLETT-PACKARD COMPANY AND SUBSIDIARIES
Management's Discussion and Analysis of
Financial Condition and Results of Operations (Continued)
Results of operations in dollars and as a percentage of net revenue were as follows for the following fiscal years ended October 31:
| | 2010 | 2009 | 2008 | ||||||||||||||||
|---|---|---|---|---|---|---|---|---|---|---|---|---|---|---|---|---|---|---|---|
| | In millions | ||||||||||||||||||
Net revenue | $ | 126,033 | 100.0 | % | $ | 114,552 | 100.0 | % | $ | 118,364 | 100.0 | % | |||||||
Cost of sales (1) | 96,089 | 76.2 | % | 87,524 | 76.4 | % | 89,699 | 75.8 | % | ||||||||||
Gross profit | 29,944 | 23.8 | % | 27,028 | 23.6 | % | 28,665 | 24.2 | % | ||||||||||
Research and development | 2,959 | 2.3 | % | 2,819 | 2.5 | % | 3,543 | 3.0 | % | ||||||||||
Selling, general and administrative | 12,585 | 10.1 | % | 11,613 | 10.1 | % | 13,326 | 11.3 | % | ||||||||||
Amortization of purchased intangible assets | 1,484 | 1.1 | % | 1,578 | 1.4 | % | 1,012 | 0.9 | % | ||||||||||
Restructuring charges | 1,144 | 1.0 | % | 640 | 0.6 | % | 270 | 0.2 | % | ||||||||||
Acquisition-related charges | 293 | 0.2 | % | 242 | 0.2 | % | 41 | - | |||||||||||
Earnings from operations | 11,479 | 9.1 | % | 10,136 | 8.8 | % | 10,473 | 8.8 | % | ||||||||||
Interest and other, net | (505 | ) | (0.4 | )% | (721 | ) | (0.6 | )% | - | - | |||||||||
Earnings before taxes | 10,974 | 8.7 | % | 9,415 | 8.2 | % | 10,473 | 8.8 | % | ||||||||||
Provision for taxes | 2,213 | 1.7 | % | 1,755 | 1.5 | % | 2,144 | 1.8 | % | ||||||||||
Net earnings | $ | 8,761 | 7.0 | % | $ | 7,660 | 6.7 | % | $ | 8,329 | 7.0 | % | |||||||
Net Revenue
The components of the weighted net revenue change were as follows for the following fiscal years ended October 31:
| | 2010 | 2009 | |||||
|---|---|---|---|---|---|---|---|
| | Percentage Points | ||||||
Personal Systems Group | 4.8 | (5.9 | ) | ||||
Enterprise Storage and Servers | 2.9 | (3.4 | ) | ||||
Imaging and Printing Group | 1.5 | (4.7 | ) | ||||
HP Financial Services | 0.3 | - | |||||
Corporate Investments/Other | 0.3 | (0.2 | ) | ||||
Services | 0.2 | 11.6 | |||||
HP Software | - | (0.6 | ) | ||||
Total HP | 10.0 | (3.2 | ) | ||||
Fiscal 2010
In fiscal 2010, total HP net revenue increased 10% (8.3% on a constant currency basis). U.S. net revenue increased 7.8% to $44.5 billion, while net revenue from outside of the United States increased 11.3% to $81.5 billion. As reflected in the table above, the PSG segment was the largest contributor to HP net revenue growth as a result of balanced growth across the regions. An analysis of the change in net revenue for each business segment is included under "Segment Information" below.
47
Table of Contents
HEWLETT-PACKARD COMPANY AND SUBSIDIARIES
Management's Discussion and Analysis of
Financial Condition and Results of Operations (Continued)
Fiscal 2009
In fiscal 2009, the global slowdown of IT and consumer spending impacted each of our segments. Net revenue decreased 3.2% in fiscal 2009 (increased 1.3% on a constant currency basis). The unfavorable currency impact for fiscal 2009 was due primarily to the movement of the dollar against the euro. For fiscal 2009, the Services segment contributed favorably to the total HP net revenue change primarily as a result of the EDS acquisition. U.S. net revenue increased 12% to $41.3 billion for fiscal 2009 as compared to fiscal 2008, while net revenue from outside of the United States decreased 10% to $73.2 billion. The increase in U.S. net revenue in fiscal 2009 was primarily a result of the acquisition of EDS. An analysis of the change in net revenue for each business segment is included under "Segment Information" below.
Gross Margin
Fiscal 2010
In fiscal 2010, total HP gross margin increased by 0.2 percentage points. The increase was a result of an increased mix in networking products and rate increase in Services, the effect of which was partially offset by strong revenue growth in personal computers and printer hardware that have lower gross margins.
Services gross margin increased in fiscal 2010 due primarily to the continued focus on operating improvements, including delivery efficiencies and cost controls in our technology services business, and EDS-related acquisition synergies.
ESS gross margin declined in fiscal 2010 due primarily to a product mix shift resulting from the strength in industry standard servers ("ISS"), the effect of which was partially offset by lower product costs and strong volume.
HP Software gross margin increased in fiscal 2010 primarily as a result of a higher license and support mix, the effect of which was partially offset by a reduced services gross margin rate.
PSG gross margin declined in fiscal 2010 primarily as a result of higher component costs, the effect of which was partially offset by lower warranty and logistics expenses.
IPG gross margin declined in fiscal 2010 due primarily to a higher mix of hardware and a correspondingly lower mix of supplies, the effect of which was partially offset by cost savings associated with our ongoing efforts to optimize our supply chain.
HPFS gross margin increased in fiscal 2010 primarily as a result of higher portfolio margins due to favorable financing conditions and higher remarketing margin, the effect of which was partially offset by higher bad debt.
Corporate Investments gross margin increased in fiscal 2010 primarily as a result of the impact from the 3Com acquisition along with lower product costs for our network infrastructure products.
Fiscal 2009
Total HP gross margin decreased by 0.6 percentage points in fiscal 2009. From a segment perspective and on a weighted basis, ESS had the largest impact to the total company gross margin decline due to product mix shift and rate declines.
48
Table of Contents
HEWLETT-PACKARD COMPANY AND SUBSIDIARIES
Management's Discussion and Analysis of
Financial Condition and Results of Operations (Continued)
Services gross margin increased in fiscal 2009 due primarily to the continued focus on cost structure improvements, including delivery efficiencies and cost controls in our technology services business, and EDS-related acquisition synergies. This was partially offset by the mix effect from the acquisition of the EDS business, which has lower gross margins.
ESS gross margin decreased in fiscal 2009 due primarily to competitive pricing across each of the segment business units and product mix shifts.
HP Software gross margin increased in fiscal 2009 primarily as a result of favorable support and services revenue mix and improved services margins, the effect of which was partially offset by an unfavorable license revenue mix.
PSG gross margin declined in fiscal 2009, resulting from average selling prices ("ASPs") declining at a faster pace than component costs combined with a mix shift towards lower-end products, the effects of which were partially offset by lower warranty and supply chain costs and improvements in the option attach rate.
IPG gross margin improved in fiscal 2009 primarily as a result of an increase in the supplies mix and supplies pricing, the effect of which was partially offset by hardware margin declines.
HPFS gross margin declined in fiscal 2009 primarily as a result of unfavorable currency impacts, lower margins relating to end-of-lease activities, higher bad debt expenses and lower margins for remarketing and buyout activities, the effect of which was partially offset by higher portfolio margins.
Corporate Investments gross margin declined in fiscal 2009 primarily as a result of a unit volume decline in the sale of network infrastructure products and competitive pricing pressures.
Operating Expenses
Research and Development
Total research and development ("R&D") expense increased in fiscal 2010 due primarily to additional expenses from acquired companies. In fiscal 2010, R&D expense as a percentage of net revenue increased for Corporate Investments, HP Software and Services, decreased for ESS, PSG, and IPG and was flat for HPFS.
Total R&D expense decreased in fiscal 2009 due primarily to favorable currency impacts related to the movement of the dollar against the euro, as well as effective cost controls, the effect of which was partially offset by additional expenses related primarily to Services. In fiscal 2009, R&D expense as a percentage of net revenue decreased for ESS, PSG, and IPG, and increased for HP Software, Services and Corporate Investments.
Selling, General and Administrative
Selling, general and administrative ("SG&A") expense increased in fiscal 2010 due primarily to higher field selling and marketing costs as a result of our investments in sales resources to grow revenue. In fiscal 2010, SG&A expense as a percentage of net revenue increased for Corporate Investments and IPG, and decreased for ESS, HP Software, PSG, HPFS and Services even as we invested in incremental sales resources across the segments.
Total SG&A expense decreased in fiscal 2009 due primarily to favorable currency impacts related to the movement of the dollar against the euro, lower compensation expense as well as effective cost
49
Table of Contents
HEWLETT-PACKARD COMPANY AND SUBSIDIARIES
Management's Discussion and Analysis of
Financial Condition and Results of Operations (Continued)
management, the impact of which was partially offset by additional expenses related to the EDS acquisition. In fiscal 2009, SG&A expense as a percentage of net revenue decreased for each of our segments, except for Corporate Investments.
Amortization of Purchased Intangible Assets
The decrease in amortization expense in fiscal 2010 was due primarily to certain intangible assets associated with prior acquisitions reaching the end of their amortization periods, the effect of which was partially offset by increased amortization of purchased intangible assets from acquisitions completed during fiscal 2010.
The increase in amortization expense in fiscal 2009 was due primarily to amortization expenses related to the intangible assets purchased as part of the EDS acquisition.
For more information on our amortization of purchased intangibles assets, see Note 7 to the Consolidated Financial Statements in Item 8, which is incorporated herein by reference.
Restructuring
Restructuring charges for fiscal 2010 were $1.1 billion. These charges included $650 million of severance and facility costs related to our fiscal 2010 enterprise services restructuring plan, $429 million of severance and facility costs related to our fiscal 2008 restructuring plan, $46 million and $18 million associated with the Palm and 3Com restructuring plans, respectively, and an increase of $1 million related to adjustments to other restructuring plans.
Restructuring charges for fiscal 2009 were $640 million. These charges included $346 million of severance and facility costs related to our fiscal 2008 restructuring plan, $297 million of severance costs associated with our fiscal 2009 restructuring plan, and a reduction of $3 million related to adjustments to other restructuring plans.
Restructuring charges for fiscal 2008 were $270 million, which included $246 million of charges due primarily to severance and facility costs related to the EDS acquisition and a net charge of $24 million relating to adjustments for existing restructuring programs.
For more information on our restructuring charges, see Note 8 to the Consolidated Financial Statements in Item 8, which is incorporated herein by reference.
As part of our ongoing business operations, we incurred workforce rebalancing charges for severance and related costs within certain business segments in fiscal 2010. Workforce rebalancing activities are considered part of normal operations as we continue to optimize our cost structure. Workforce rebalancing costs are included in our business segment results, and we expect to incur additional workforce rebalancing costs in the future.
Acquisition-Related Charges
In fiscal 2010, we recorded acquisition-related charges of $293 million primarily for consulting and integration costs, acquisition costs and retention bonuses associated with the EDS, 3Com, Palm, 3PAR and ArcSight acquisitions.
In fiscal 2009, we recorded acquisition-related charges of $242 million primarily for consulting and integration costs as well as retention bonuses associated with the EDS acquisition.
50
Table of Contents
HEWLETT-PACKARD COMPANY AND SUBSIDIARIES
Management's Discussion and Analysis of
Financial Condition and Results of Operations (Continued)
Interest and Other, Net
Interest and other, net improved by $216 million in fiscal 2010. The improvement was driven primarily by lower currency losses on balance sheet remeasurement items, lower interest expenses on debt balances due to lower interest rates, and a value-added tax refund, the effect of which was partially offset by an increase to our litigation accruals.
Interest and other, net decreased by $721 million in fiscal 2009. The decrease was driven primarily by higher interest expenses due to higher average debt balances principally related to the EDS acquisition, lower interest income as a result of lower interest rates, and higher currency losses on balance sheet remeasurement items. Additionally, there were higher gains from the sale of real estate in fiscal 2008 as compared to fiscal 2009.
Provision for Taxes
Our effective tax rates were 20.2%, 18.6% and 20.5% in fiscal 2010, 2009 and 2008, respectively. HP's effective tax rate generally differs from the U.S. federal statutory rate of 35% due to favorable tax rates associated with certain earnings from HP's operations in lower-tax jurisdictions throughout the world. HP has not provided U.S. taxes for all of its international earnings because HP plans to reinvest some of those earnings indefinitely outside the United States.
The increase in the overall tax rate in fiscal 2010 was due primarily to a decrease in the income tax benefits related to foreign earnings.
The decrease in the overall tax rate in fiscal 2009 was due primarily to the net income tax benefits recorded for fiscal 2009 which were related to foreign net operating losses, adjustments to estimated fiscal 2008 tax accruals upon filing the 2008 income tax returns, valuation allowance reversals for state and foreign net operating losses, and other miscellaneous items.
For a full reconciliation of our effective tax rate to the U.S. federal statutory rate of 35% and further explanation of our provision for taxes, see Note 14 to the Consolidated Financial Statements in Item 8, which is incorporated herein by reference.
Segment Information
A description of the products and services, as well as financial data, for each segment can be found in Note 19 to the Consolidated Financial Statements in Item 8, which is incorporated herein by reference. We have realigned segment financial data for the fiscal years ended October 31, 2009 and 2008 to reflect changes in HP's organizational structure that occurred at the beginning of the first quarter of fiscal 2010. We describe these changes more fully in Note 19. We have presented the business segments in this Annual Report on Form 10-K based on the distinct nature of various businesses such as customer base, homogeneity of products and technology. The discussions below include the results of each of our segments.
HP Enterprise Business
Services, ESS and HP Software are reported collectively as a broader HP Enterprise Business. We describe the results of the business segments of the HP Enterprise Business in more detail below.
51
Table of Contents
HEWLETT-PACKARD COMPANY AND SUBSIDIARIES
Management's Discussion and Analysis of
Financial Condition and Results of Operations (Continued)
Services
| | For fiscal years ended October 31 | |||||||||
|---|---|---|---|---|---|---|---|---|---|---|
| | 2010 | 2009 | 2008 | |||||||
| | In millions | |||||||||
Net revenue | $ | 34,935 | $ | 34,693 | $ | 20,977 | ||||
Earnings from operations | $ | 5,609 | $ | 5,044 | $ | 2,518 | ||||
Earnings from operations as a % of net revenue | 16.1 | % | 14.5 | % | 12.0 | % | ||||
The components of the weighted net revenue change by business unit were as follows for the following fiscal years ended October 31:
| | 2010 | 2009 | |||||
|---|---|---|---|---|---|---|---|
| | Percentage Points | ||||||
Infrastructure technology outsourcing | 1.2 | 37.1 | |||||
Other | 0.1 | 0.9 | |||||
Technology services | (0.1 | ) | (1.4 | ) | |||
Application services | (0.2 | ) | 18.0 | ||||
Business process outsourcing | (0.3 | ) | 10.8 | ||||
Total Services | 0.7 | 65.4 | |||||
Services net revenue increased 0.7% (decreased 1.7% when adjusted for currency) in fiscal 2010. Net revenue in infrastructure technology outsourcing increased by 2.6% in fiscal 2010. The revenue increase was due to favorable currency impact and growth in data center services and networking services. Net revenue in technology services declined by 0.4% in fiscal 2010. The revenue decline was due primarily to lower contract revenue tied to reduced levels of enterprise hardware sales in the prior-year period and market conditions in the current-year period, the effect of which was partially offset by a favorable currency impact. Net revenue in application services decreased by 1.1% in fiscal 2010. The revenue decrease was driven primarily by market conditions and existing contract completion, the effect of which was partially offset by new business and a favorable currency impact. Net revenue in business process outsourcing decreased by 3.5% in fiscal 2010. The revenue decrease was due primarily to a divestiture completed at the end of the third quarter of fiscal 2010 and economic conditions in certain industries with key clients, the effect of which was partially offset by a favorable currency impact.
Services earnings from operations as a percentage of net revenue increased by 1.6 percentage points in fiscal 2010. Operating margin increased primarily due to continued focus on operating improvements and cost initiatives that favorably impacted the cost structure of our enterprise services business, delivery efficiencies and cost controls in our technology services business, as well as EDS-related acquisition synergies.
Services net revenue increased 65.4% (71.6% when adjusted for currency) in fiscal 2009. The increase in revenues is due primarily to the acquisition of EDS on August 26, 2008. Net revenue in infrastructure technology outsourcing, application services and business process outsourcing increased due to the EDS acquisition. The net revenue increase in infrastructure technology outsourcing, application services, and business process outsourcing was partially offset by unfavorable currency impacts and a decline in spending from existing customers not being offset with new growth due to slowing demand in the current economic environment. Application services and business process outsourcing were impacted to a greater degree than infrastructure technology outsourcing. Net revenue
52
Table of Contents
HEWLETT-PACKARD COMPANY AND SUBSIDIARIES
Management's Discussion and Analysis of
Financial Condition and Results of Operations (Continued)
in technology services declined due primarily to unfavorable currency impacts and weak economic conditions, the effect of which was partially offset by growth in extended warranty.
Services earnings from operations as a percentage of net revenue increased by 2.5 percentage points in fiscal 2009. The operating margin increased due primarily to a decrease in operating expenses as a percentage of revenue. There was also an increase in gross margin for fiscal 2009. Operating expense declined as a result of a continued focus on cost structure improvements from overall cost controls. The gross margin in our Services segment increased for fiscal 2009 from fiscal 2008 due primarily to the continued focus on cost structure improvements, including delivery efficiencies and cost controls in our technology services business, and EDS-related acquisition synergies. This was partially offset by the mix effect from the acquisition of the EDS business, which has lower gross margins.
Enterprise Storage and Servers
| | For the fiscal years ended October 31 | |||||||||
|---|---|---|---|---|---|---|---|---|---|---|
| | 2010 | 2009 | 2008 | |||||||
| | In millions | |||||||||
Net revenue | $ | 18,651 | $ | 15,359 | $ | 19,400 | ||||
Earnings from operations | $ | 2,402 | $ | 1,518 | $ | 2,577 | ||||
Earnings from operations as a % of net revenue | 12.9 | % | 9.9 | % | 13.3 | % | ||||
The components of the weighted net revenue change by business unit were as follows for the following fiscal years ended October 31:
| | 2010 | 2009 | |||||
|---|---|---|---|---|---|---|---|
| | Percentage Points | ||||||
Industry standard servers | 21.3 | (12.1 | ) | ||||
Storage | 2.0 | (3.8 | ) | ||||
Business critical systems | (1.9 | ) | (4.9 | ) | |||
Total ESS | 21.4 | (20.8 | ) | ||||
ESS net revenue increased 21.4% (18.9% when adjusted for currency) for fiscal 2010. ESS blades revenue increased by 37% in fiscal 2010. ISS net revenue increased by 35% in fiscal 2010, driven primarily by unit volume growth coupled with increased average unit prices due to improving market conditions and demand for the latest generation of ISS products. Storage net revenue increased by 9% in fiscal 2010, driven primarily by strong performance in products related to our acquisition of Lefthand Networks, and growth in high-end disk products and storage networking products. Business critical systems ("BCS") net revenue decreased 12%, due primarily to market conditions and competitive pressures, the effect of which was partially offset by new product introductions in the fourth quarter of fiscal 2010.
ESS earnings from operations as a percentage of net revenue increased by 3.0 percentage points in fiscal 2010, driven by decreases in operating expenses as a percentage of net revenue, the effect of which was partially offset by declines in gross margin. Operating expenses as a percentage of net revenue decreased as a result of operating leverage benefits from increased volume and cost controls. The gross margin decline in fiscal 2010 was due primarily to a product mix shift resulting from the strength in ISS, the effect of which was partially offset by lower product costs and strong volume.
53
Table of Contents
HEWLETT-PACKARD COMPANY AND SUBSIDIARIES
Management's Discussion and Analysis of
Financial Condition and Results of Operations (Continued)
ESS net revenue decreased 20.8% (16.0% when adjusted for currency) in fiscal 2009. The revenue decline was due primarily to the economic slowdown and overall weak demand environment. ISS net revenue declined 20% in fiscal 2009 due to declines in unit volume. ISS average unit prices declined in fiscal 2009 while improving in the second half of fiscal 2009 as a result of a new product ramp up. Total ESS blades revenue declined by 2% in fiscal 2009. BCS net revenue decreased 27% in fiscal 2009 driven by a decline in Integrity server revenue due to weaker market conditions and by the planned phase-out of the PA-RISC and Alpha Server product lines. Storage net revenue declined 17% in fiscal 2009 due to a decline in disk and tape products as a result of a weaker demand environment, the effects of which were partially offset by revenue resulting from the acquisition of Lefthand Networks, which was completed in the first quarter of fiscal 2009.
In fiscal 2009, ESS earnings from operations as a percentage of net revenue decreased by 3.4 percentage points, due primarily to a decline in gross margin. Gross margin in fiscal 2009 decreased due primarily to competitive pricing across each of the segment business units and product mix shifts. Operating expense as a percentage of net revenue in fiscal 2009 was generally consistent with the fiscal 2008.
HP Software
| | For the fiscal years ended October 31 | |||||||||
|---|---|---|---|---|---|---|---|---|---|---|
| | 2010 | 2009 | 2008 | |||||||
| | In millions | |||||||||
Net revenue | $ | 3,586 | $ | 3,572 | $ | 4,220 | ||||
Earnings from operations | $ | 759 | $ | 684 | $ | 499 | ||||
Earnings from operations as a % of net revenue | 21.2 | % | 19.1 | % | 11.8 | % | ||||
The components of the weighted net revenue change by business unit were as follows for the following fiscal years ended October 31:
| | 2010 | 2009 | |||||
|---|---|---|---|---|---|---|---|
| | Percentage Points | ||||||
Business technology optimization | 1.5 | (9.7 | ) | ||||
Other software | (1.1 | ) | (5.7 | ) | |||
Total HP Software | 0.4 | (15.4 | ) | ||||
HP Software net revenue increased 0.4% (decreased 1.8% when adjusted for currency) in fiscal 2010, due to growth in business technology optimization ("BTO"), information management and business intelligence, the effect of which was offset by weakness in sales of communication and media solutions. In fiscal 2010, support and license revenue increased while services revenue declined. Net revenue from business technology optimization increased 2% in fiscal 2010, due to growth in support and license renewals. Net revenue from our other software businesses decreased 3% in fiscal 2010, due to a decline in revenue from sales of communication and media solutions resulting from market conditions in the Asia Pacific region and EMEA (Europe, Middle East and Africa). The revenue increase in information management was due primarily to increases in license and support revenue. The revenue increase in business intelligence solutions was primarily a result of increases in support and services.
HP Software earnings from operations as a percentage of net revenue increased by 2.1 percentage points in fiscal 2010. The operating margin improvement in fiscal 2010 was due primarily to an increase
54
Table of Contents
HEWLETT-PACKARD COMPANY AND SUBSIDIARIES
Management's Discussion and Analysis of
Financial Condition and Results of Operations (Continued)
in gross margin and a decrease in operating expenses as a percentage of net revenue. The increase in gross margin in fiscal 2010 was primarily a result of a higher license and support mix, the effect of which was partially offset by a reduced services gross margin rate. The decrease in operating expenses as a percentage of net revenue in fiscal 2010 was due primarily to lower field selling, administrative and acquisition integration costs.
HP Software net revenue decreased 15.4% (10.8% when adjusted for currency) in fiscal 2009, due to softening in enterprise spending and declines in large deals. For fiscal 2009, revenue from licenses and services declined, the effect of which was partially offset by increased support revenue as a result of renewal rate increases. Net revenue from BTO decreased 15% in fiscal 2009 as compared to fiscal 2008. Net revenue from other software decreased 17% in fiscal 2009 as compared to fiscal 2008, due to declines in revenues for communication and media solutions, business intelligence solutions and information management.
HP Software earnings from operations as a percentage of net revenue increased by 7.3 percentage points in fiscal 2009. The operating margin improvement in fiscal 2009 was due primarily to increased gross margin coupled with decreased operating expenses as a percentage of net revenue. The increase in gross margin in fiscal 2009 resulted primarily from a favorable support and services revenue mix and improved services margins, the effect of which was partially offset by an unfavorable license revenue mix. The decrease in operating expenses as a percentage of net revenue in fiscal 2009 was due primarily to continued cost controls.
Personal Systems Group
| | For the fiscal years ended October 31 | |||||||||
|---|---|---|---|---|---|---|---|---|---|---|
| | 2010 | 2009 | 2008 | |||||||
| | In millions | |||||||||
Net revenue | $ | 40,741 | $ | 35,305 | $ | 42,295 | ||||
Earnings from operations | $ | 2,032 | $ | 1,661 | $ | 2,375 | ||||
Earnings from operations as a % of net revenue | 5.0 | % | 4.7 | % | 5.6 | % | ||||
The components of the weighted net revenue change by business unit were as follows for the following fiscal years ended October 31:
| | 2010 | 2009 | |||||
|---|---|---|---|---|---|---|---|
| | Percentage Points | ||||||
Desktop PCs | 7.4 | (8.9 | ) | ||||
Notebook PCs | 6.6 | (5.8 | ) | ||||
Workstations | 1.5 | (1.5 | ) | ||||
Handhelds | (0.2 | ) | (0.4 | ) | |||
Other | 0.1 | 0.1 | |||||
Total PSG | 15.4 | (16.5 | ) | ||||
PSG revenue increased 15.4% (12.8% when adjusted for currency) in fiscal 2010. The revenue increase resulted from balanced growth across all regions. PSG unit volume and net revenue increased across all business units except the handhelds business unit in fiscal 2010. Unit volume was up 14% as the commercial refresh cycle and continued demand for consumer notebooks drove an increase in shipments. In fiscal 2010, net revenue from notebook PCs increased 12% while desktop PCs revenue increased 20%. Workstations revenue increased 42% while handhelds revenue declined 49%. In fiscal
55
Table of Contents
HEWLETT-PACKARD COMPANY AND SUBSIDIARIES
Management's Discussion and Analysis of
Financial Condition and Results of Operations (Continued)
2010, net revenue for consumer clients increased 12% while commercial client revenue increased 20%. Net revenue in Other increased 6% due primarily to increased sales of calculators, home servers and warranty extensions. For fiscal 2010, the favorable impact on PSG net revenue from unit increases was accompanied by a 1% increase in ASPs.
PSG earnings from operations as a percentage of net revenue increased 0.3 percentage points in fiscal 2010. The increase was driven by improvements in operating expenses as a percentage of net revenue, the effect of which was offset partially by a slight decline in gross margins. The decrease in operating expenses as a percentage of net revenue was due to effective cost controls and operating leverage benefits from increased volume. The decrease in gross margins was a result of higher component costs, the effect of which was partially offset by lower warranty and logistics expenses.
PSG net revenue decreased 16.5% (11.6% when adjusted for currency) in fiscal 2009. The revenue decline was primarily the result of the overall slowdown in the global economy. Despite the overall regional declines, revenue in China increased for fiscal 2009. PSG net revenue decreased across all businesses in fiscal 2009. Unit volume increased slightly in fiscal 2009, as an increase in notebook PC volume was offset by a decline in desktop PCs, workstations, and handheld devices. The unit volume increase in notebook PCs was due in part to growth of the HP and Compaq mini notebooks. In fiscal 2009, net revenue for notebook PCs decreased 11%, while net revenue for desktop PCs decreased 23%. Workstations and handheld revenues declined 33% and 52%, respectively, in fiscal 2009. In fiscal 2009, net revenue for consumer clients decreased 14%, while net revenue for commercial clients decreased 19%. The net revenue increase in Other PSG was related primarily to increased sales of extended warranties, support services and third-party branded options. In fiscal 2009, PSG net revenue was also impacted by ASP declines. ASPs in consumer clients declined 21%, while ASPs in commercial clients declined 16%. ASPs declined due primarily to a competitive pricing environment, component cost reductions and the impact of currency combined with a mix shift toward lower-end models. The ASP decline in fiscal 2009 was offset slightly by an increase in the option and monitor attach rates.
PSG earnings from operations as a percentage of net revenue decreased by 0.9 percentage points in fiscal 2009. The decrease was due primarily to a gross margin decline resulting from ASPs declining at a faster pace than component costs combined with a mix shift toward lower-end products, the effects of which were partially offset by lower warranty and supply chain costs and improvements in the option attach rate. The decrease in operating expenses as a percentage of net revenue in fiscal 2009 was the result of effective cost controls.
Imaging and Printing Group
| | For the fiscal years ended October 31 | |||||||||
|---|---|---|---|---|---|---|---|---|---|---|
| | 2010 | 2009 | 2008 | |||||||
| | In millions | |||||||||
Net revenue | $ | 25,764 | $ | 24,011 | $ | 29,614 | ||||
Earnings from operations | $ | 4,412 | $ | 4,310 | $ | 4,559 | ||||
Earnings from operations as a % of net revenue | 17.1 | % | 18.0 | % | 15.4 | % | ||||
56
Table of Contents
HEWLETT-PACKARD COMPANY AND SUBSIDIARIES
Management's Discussion and Analysis of
Financial Condition and Results of Operations (Continued)