Table of Contents
UNITED STATES
SECURITIES AND EXCHANGE COMMISSION
Washington, D.C. 20549
FORM 10-K
☑ ANNUAL REPORT PURSUANT TO SECTION 13 OR 15(d) OF THE SECURITIES EXCHANGE ACT OF 1934
For the fiscal year ended February 28, 2015
OR
☐ TRANSITION REPORT PURSUANT TO SECTION 13 OR 15(d) OF THE SECURITIES EXCHANGE ACT OF 1934
Commission file number 001-14669

HELEN OF TROY LIMITED
(Exact name of the registrant as specified in its charter)
|
|
|
Bermuda |
| 74-2692550 |
(State or other jurisdiction of |
| (I.R.S. Employer |
incorporation or organization) |
| Identification No.) |
|
|
|
Clarenden House 2 Church Street Hamilton, Bermuda |
|
|
(Address of principal executive offices) |
|
|
|
|
|
1 Helen of Troy Plaza |
|
|
El Paso, Texas |
| 79912 |
(Registrant's United States Mailing Address ) |
| (Zip Code) |
Registrant's telephone number, including area code: (915) 225-8000
Securities registered pursuant to Section 12(b) of the Act:
|
|
|
Title of each class |
| Name of each exchange on which registered |
Common Shares, $ 0 .10 par value per share |
| The NASDAQ Stock Market, LLC |
Securities registered pursuant to Section 12(g) of the Act: NONE
Indicate by check mark if the registrant is a well-known seasoned issuer, as defined in Rule 405 of the Securities Act. Yes ☑ No ☐
Indicate by check mark if the registrant is not required to file reports pursuant to Section 13 or Section 15(d) of the Act. Yes ☐ No ☑
Indicate by check mark whether the registrant (1) has filed all reports required to be filed by Section 13 or 15(d) of the Securities Exchange Act of 1934 during the preceding 12 months (or for such shorter period that the registrant was required to file such reports), and (2) has been subject to such filing requirements for the past 90 days. Yes ☑ No ☐
Indicate by check mark whether the registrant has submitted electronically and posted on its corporate Web site, if any, every Interactive Data File required to be submitted and posted pursuant to Rule 405 of Regulation S-T (§232.405 of this chapter) during the preceding 12 months (or for such shorter period that the registrant was required to submit and post such files) . Yes ☑ No ☐
Indicate by check mark if disclosure of delinquent filers pursuant to Item 405 of Regulation S-K (§229.405 of this chapter) is not contained herein, and will not be contained, to the best of registrant's knowledge, in definitive proxy or information statements incorporated by reference in Part III of this Form 10-K or any amendment to this Form 10- K . ☐
Indicate by check mark whether the registrant is a large accelerated filer, an accelerated filer, a non-accelerated filer or a smaller reporting company. See the definitions of "large accelerated filer," "accelerated filer" and "smaller reporting company" in Rule 12b-2 of the Exchange Act.
Large accelerated filer ☑ | Accelerated filer ☐ | Non-accelerated filer ☐ (Do not check if a smaller reporting company) | Smaller reporting company ☐ |
Indicate by check mark whether the registrant is a shell company (as defined in Rule 12b-2 of the Exchange Act) . Yes ☐ No ☑
The aggregate market value of the voting and non-voting common shares held by non-affiliates of the registrant as of August 31, 2014 , based upon the closing price of the common shares as reported by The NASDAQ Global Select Market on such date, was approximately $1,653,513,000 .
As of April 20, 2015 , there were 28,496,412 common shares , $ 0 .10 par value per share, outstanding.
DOCUMENTS INCORPORATED BY REFERENCE
Certain information required for Part III of this annual report will be set forth in and incorporated herein by reference into Part III of this report from the Company's definitive Proxy Statement for the 2015 Annual General Meeting of Shareholders.
Table of Contents
TABLE OF
CONTENTS
PAGE
PART I | Item 1. | Business | 5 |
| Item 1A. | Risk Factors | 18 |
| Item 1B. | Unresolved Staff Comments | 31 |
| Item 2. | Properties | 32 |
| Item 3. | Legal Proceedings | 33 |
| Item 4. | Mine Safety Disclosures | 34 |
PART II | Item 5. | Market for Registrant's Common Equity, Related Shareholder Matters and Issuer Purchases of Equity Securities | 35 |
| Item 6. | Selected Financial Data | 38 |
| Item 7. | Management's Discussion and Analysis of Financial Condition and Results of Operations | 40 |
| Item 7A. | Quantitative and Qualitative Disclosures About Market Risk | 68 |
| Item 8. | Financial Statements and Supplementary Data | 72 |
| Item 9. | Changes in and Disagreements with Accountants on Accounting and Financial Disclosure | 122 |
| Item 9A. | Controls and Procedures | 122 |
PART III | Item 10. | Directors, Executive Officers and Corporate Governance | 123 |
| Item 11. | Executive Compensation | 123 |
| Item 12. | Security Ownership of Certain Beneficial Owners and Management and Related Shareholder Matters | 123 |
| Item 13. | Certain Relationships and Related Transactions, and Director Independence | 123 |
| Item 14. | Principal Accounting Fees and Services | 123 |
PART IV | Item 15. | Exhibits, Financial Statement Schedules | 124 |
|
|
|
|
|
| Signatures | 127 |
1
Table of Contents
CERTAIN CONVENTIONS USED IN THIS REPORT
In this report and the accompanying consolidated financial statements and notes, unless the context suggests otherwise or otherwise indicated, references to "the Company", "our Company", "Helen of Troy", "we", "us", or "our" refer to Helen of Troy Limited and its subsidiaries. We refer to the Company's common shares, par value $0.10 per share, as "common stock." References to "OXO" refer to the operations of OXO International and certain of its affiliated subsidiaries that comprise our Housewares segment. References to "Kaz" refer to the operations of Kaz, Inc. and its subsidiaries, which comprise a segment within the Company referred to as the Healthcare / Home Environment segment. References to "Healthy Directions" refer to the operations of Healthy Directions, LLC and its subsidiaries, acquired on June 30, 2014, that comprise the Nutritional Supplements segment. References to "EMEA" refer to the combined geographic markets of Europe, the Middle East and Africa. We use p roduct and service names in this report for identification purposes only and they may be protected in the United States and other jurisdictions by trademarks, trade names, service marks, and other intellectual property rights of the Company and other parties. The absence of a specific attribution in connection with any such mark does not constitute a waiver of any such right. All trademarks, trade names, service marks, and logos referenced herein belong to their respective owners. References to "the FASB" refer to the Financial Accounting Standards Board. References to "GAAP" refer to U.S. generally accepted accounting principles. References to "ASU" refer to the codification of GAAP in the Accounting Standards Updates issued by the FASB. References to "ASC" refer to the codification of GAAP in the Accounting Standards Codification issued by the FASB .
2
Table of Contents
INFORMATION REGARDING FORWARD-LOOKING STATEMENTS
Certain written and oral statements made by our Company and subsidiaries of our Company may constitute "forward-looking statements" as defined under the Private Securities Litigation Reform Act of 1995. This includes statements made in this report, in other filings with the Securities and Exchange Commission (the "SEC"), in press releases, and in certain other oral and written presentations. Generally, the words "anticipates", "believes", "expects", "plans", "may", "will", "should", "seeks", "estimates", "project", "predict", "potential", "continue", "intends", and other similar words identify forward-looking statements. All statements that address operating results, events or developments that we expect or anticipate will occur in the future, including statements related to sales, earnings per share results , and statements expressing general expectations about future operating results, are forward-looking statements and are based upon our current expectations and various assumptions. We believe there is a reasonable basis for our expectations and assumptions, but there can be no assurance that we will realize our expectations or that our assumptions will prove correct. Forward-looking statements are subject to risks that could cause them to differ materially from actual results. Accordingly, we caution readers not to place undue reliance on forward-looking statements. We believe that these risks include but are not limited to the risks described in this report under Item 1A., "Risk Factors" and that are otherwise described from time to time in our SEC reports filed after this report. As described later in this report, such risks, uncertainties and other important factors include, among others:
| · |
| the retention and recruitment of key personnel; |
| · |
| our ability to deliver products to our customers in a timely manner and according to their fulfillment standards; |
| · |
| our relationships with key customers and licensors; |
| · |
| the costs of complying with the business demands and requirements of large sophisticated customers; |
| · |
| our dependence on the strength of retail economies and vulnerabilities to any prolonged economic downturn; |
| · |
| expectations regarding our recent and future acquisitions, including our ability to realize anticipated cost savings, synergies and other benefits along with our ability to effectively integrate acquired businesses; |
| · |
| foreign currency exchange rate fluctuations; |
| · |
| disruptions in U.S., Euro zone, Venezuela, and other international credit markets; |
| · |
| risks associated with weather conditions; |
| · |
| our dependence on foreign sources of supply and foreign manufacturing, and associated operational risks including but not limited to long lead times, consistent local labor availability and capacity, and timely availability of sufficient shipping carrier capacity; |
| · |
| risks to the Nutritional Supplements segment associated with the availability, purity and integrity of materials used in the manufacture of vitamins, minerals and supplements; |
| · |
| the impact of changing costs of raw materials, labor and energy on cost of goods sold and certain operating expenses; |
| · |
| the geographic concentration and peak season capacity of certain U.S. distribution facilities increases our exposure to significant shipping disruptions and added shipping and storage costs; |
| · |
| difficulties encountered during the transition of certain businesses to our distribution facilit ies could interrupt our logistical systems and cause shipping disruptions; |
| · |
| our projections of product demand, sales and net income are highly subjective in nature and future sales and net income could vary in a material amount from such projections; |
| · |
| circumstances which may contribute to future impairment of goodwill, intangible or other long-lived assets; |
| · |
| the risks associated with the use of trademarks licensed from and to third parties; |
| · |
| our ability to develop and introduce a continuing stream of new products to meet changing consumer preferences; |
3
Table of Contents
| · |
| increased products liability and reputational risks associated with the formulation and distribution of vitamins, minerals and supplements; |
| · |
| the risks associated with potential adverse publicity and negative public perception regarding the use of vitamins, minerals and supplements; |
| · |
| trade barriers, exchange controls, expropriations, and other risks associated with foreign operations; |
| · |
| debt leverage and the constraints it may impose on our cash resources and ability to operate our business; |
| · |
| the costs, complexity and challenges of upgrading and managing our global information systems; |
| · |
| the risks associated with information security breaches; |
| · |
| the increased complexity of compliance with a number of new government regulations as a result of adding vitamins, minerals and supplements to the Company's portfolio of products; |
| · |
| the risks associated with tax audits and related disputes with taxing authorities; |
| · |
| the risks of potential changes in laws, including tax laws, health insurance laws and new regulations related to conflict minerals along with the costs and complexities of compliance with such laws; and |
| · |
| our ability to continue to avoid classification as a controlled foreign corporation. |
We undertake no obligation to publicly update or revise any forward-looking statements as a result of new information, future events or otherwise.
4
Table of Contents
PART I
ITEM 1. BUSINESS
GENERAL
We are a global consumer products company offering creative solutions for our customers through a strong portfolio of well-recognized and widely trusted brands. We have built our market positions through new product innovation, product quality and competitive pricing. People around the world use our products every day to help meet their household, health and beauty needs. We have four business segments:
| · |
| Housewares. Our Housewares segment provides a broad range of innovative consumer products for the home. Product offerings include food preparation tools, gadgets , storage containers, cleaning, organization, baby and toddler care products. Key brands include OXO, OXO Good Grips, OXO Soft Works, OXO tot, and OXO Stee L . |
| · |
| Healthcare / Home Environment. The Healthcare / Home Environment segment focuses on healthcare devices such as thermometers, humidifiers, blood pressure monitors, and heating pads; water filtration systems; and small home appliances such as portable heaters, fans, air purifiers, and insect control devices. Key brands include Vicks, Braun, Honeywell, PUR, Febreze, Stinger, Duracraft, and SoftHeat. |
| · |
| Nutritional Supplements. Our Nutritional Supplements segment is a leading provider of premium branded vitamins, minerals and supplements, as well as other health products sold directly to consumers. Key brands include Omega Q Plus Resveratrol®, Omega Q Plus®, Probiotic Advantage®, Vision Essentials®, Total Cardio Cover®, Joint Advantage Gold®, Triveratrol®, Trilane® and OxyRub®. |
| · |
| Personal Care. Our Personal Care segment's products include electric hair care, beauty care and wellness appliances; grooming tools and accessories; and liquid, solid- and powder-based personal care and grooming products. Key brands include Revlon, Vidal Sassoon, Dr. Scholl's, Toni&Guy, Sure, Pert Plus, Infusium 23, Brut, Ammens, Hot Tools, Bed Head, Karina, Sea Breeze, and Gold ‘N Hot. |
The Nutritional Supplements segment sells directly to consumers. Our other segments sell their products primarily through mass merchandisers, drugstore chains, warehouse clubs, catalogs, grocery stores and specialty stores. In addition, the Personal Care segment sells extensively through beauty supply retailers and wholesalers and the Healthcare / Home Environment segment sells certain of its product lines through medical distributors and other products through home improvement stores. We purchase our products from unaffiliated manufacturers, most of which are located in China, Mexico and the United States.
5
Table of Contents
Fiscal Year 2015 Operating Initiatives
In fiscal year 2015, we made the following progress on key initiatives:
| · |
| Brand Investment and Growth– A key priority during fiscal year 2015 was to accelerate overall growth and identify new opportunities to create sustained organic growth. W e increased our investment in consumer-centric innovation including market research and new product development . We also better leveraged the global scale of our advertising efforts and utilized best practices across the Company , while increasing our spend by approximately 26 percent over fiscal year 2014 levels, which helped increase the impact of selected new product introductions. Some additional examples of progress made within each segment follow: |
| o |
| Housewares. OXO continues to leverage opportunities to expand its brand into new housewares categories. During fiscal year 2015, OXO successfully concluded a new licensing agreement with The Cookware Company, which began shipments of high quality cookware during the third quarter of fiscal year 2015. After almost three years of market research and product development, OXO recently announced its plan to enter into the high-end small kitchen electrics category in the second half of fiscal year 2016. The initial launch will include coffeemakers and grinders, cordless glass kettles, motorized toasters, mixers and blenders with sleek stainless steel and black styling. OXO also recently introduced a new bakeware product line initially consisting of 11 items marketed under its Good Grips collection. The line is U.S. manufactured using heavy-gauge aluminized steel with a scratch- and stain-resistant, Swiss-engineered, ceramic-reinforced non-stick coating. All items feature a gold tone micro-textured pattern that adds structural rigidity to the products and helps to promote airflow and assure even baking. The new line is currently scheduled to ship in the second half of fiscal year 2016. |
| o |
| Healthcare / Home Environment . In fiscal year 2015, the Healthcare / Home Environment segment reaped the benefit of several years of research and development efforts with the introduction of several new thermometry products under the Braun brand, which we believe were well received in our key markets. We also extended our line of air purification appliances using Febreze branded odor eliminating air filters and liquid scent cartridges , which we believe contributed to market share growth in the product category. |
| o |
| Personal Care . We worked closely with trademark licensing partners to explore new opportunities to expand brand reach. For example, we expanded our long-standing license arrangement with Revlon in Personal Care appliances to include key markets in Western Europe, including the United Kingdom, France, Germany and Italy, among others. This will provide new opportunities for growth in our largest regional market outside the U.S. and provides Personal Care with a global brand. We have new Personal Care products in our pipeline that we expect to begin shipping into these markets later in fiscal year 2016. |
| o |
| Nutritional Supplements . The acquisition of Healthy Directions, LLC and its subsidiaries ("Healthy Directions") on June 30, 2014 gained us entry into a new product category of premium doctor-branded vitamins, minerals and supplements through a direct to consumer distribution model that we can leverage with other products in the Company's portfolio. Healthy Directions reports its operations as the Nutritional Supplements segment. |
| · |
| Transforming the Organization –In April 201 4 , we announced a new global shared services management structure effective May 1, 2014. The three shared service groups; Global Finance, Global Operations, and Global Legal, Human Resources and Corporate Communications , are expected to increase the level of collaboration across the enterprise, implement best practices across divisions and departments and better leverage our scale. Brian Grass, who was promoted to Chief Financial Officer, heads Global Finance. Global Finance oversees the global accounting, SEC reporting, tax, treasury, credit and collection, and internal financial reporting functions. Thomas Benson, who was promoted to Chief Operations Officer, heads Global Operations. Mr. Benson formerly served as our Chief Financial Officer. Mr. Benson oversees the global operational capabilities of the Company, including Helen of Troy's sourcing and order processing centers in China, distribution operations , transportation, logistics, customer service, and product testing/certification labs. Vincent Carson, who was promoted to Chief Legal Officer, heads Global Legal, Human Resources , Investor Relations and Corporate Communications . Throughout fiscal year 2015 , we also b rought new
6 |
Table of Contents
talent into the organization, securing key new leadership for p roduct d evelopment, China s ourcing and o rder p rocessing, U.S. distribution and l ogistics, and g lobal i nformation t echnology. Additionally, in late February 2015, we unified all Personal C are business units under a newly hired global leader for the Personal Care s egment . Finally, to retain our talent and better align management and shareholder inte rests, we implemented new compensation programs better tied to business unit profitability and key corporate performance metrics such as multi-year earnings per share growth and multi-year total shareholder return measured against a group of peers. |
| · |
| Shareholder Friendly Policies –We are committed to acting in the best interests of shareholders, which was demonstrated in fiscal year 2015 through a return of capital to our shareholders, accretive acquisition, better use of the Company's balance sheet, greater outreach to investors and analysts, and enhanced corporate governance. We started the year with a tender offer that returned over $245 million to our shareholders and reduced shares outstanding by over 11 percent. We utilized our balance sheet to fund the tender offer, make additional share repurchases of approximately $26 million and acquire Healthy Directions. We invested in and expanded our shareholder communications team to improve investor outreach. These efforts build upon a series of actions taken by the Board of Directors to strengthen our corporate governance and position the Company for greater growth and profitability. These actions have included the implementation of our CEO succession plan, the separation of the Chairman and CEO roles and a significant reduction in executive compensation. |
T he f ollowing table summarizes certain key results for fiscal year 2015:
|
|
|
|
|
|
Financial Performance Measure | Result | ||||
Growth in net sales revenue |
| $ | 127.98 | million | (+ 9.7 Percent) |
Growth in net income |
| $ | 44.92 | million | (+ 52.1 Percent) |
Growth in diluted earnings per share |
| $ | 1.86 |
| (+ 69.9 Percent) |
Closing sales price for a share of common stock: |
|
|
|
|
|
February 28, 2014 |
| $ | 65.31 |
|
|
February 28, 2015 |
| $ | 76.62 |
|
|
Fiscal Year 2015 Developments
| · |
| In March 2014, we completed a modified "Dutch auction" tender offer resulting in the repurchase of 3,693,816 shares of our outstanding common stock at a total cost of $247.83 million, including tender offer transaction-related costs. The cost of the tender offer and related costs were paid with cash on hand and borrowings under our Credit Agreement (as described below). During the fiscal quarter ended May 31, 2014, we repurchased an additional 408,327 shares of outstanding common stock on the open market at a total cost of $25.77 million, primarily funded with borrowings under our Credit Agreement. |
| · |
| Early in the fiscal quarter ended May 31, 2014, we completed the transition of our domestic Personal Care segment appliance distribution operation to our new 1.3 million square foot facility in Olive Branch, Mississippi. The segment shares the facility with our Healthcare / Home Environment segment. The shipping and handling characteristics of both segments' products are similar and we are working to achieve additional operating efficiencies over the long-term with both distribution operations located in one facility. |
| · |
| On June 30, 2014, we completed the acquisition of Healthy Directions, a U.S. direct-to-consumer market leader in premium doctor-branded vitamins, minerals and supplements , for a total cash purchase price of $195.94 million. The sellers were certain funds controlled by American Securities, LLC and ACI Capital Co., LLC. Significant assets acquired include inventory, property and equipment, customer relationships, brand assets, and goodwill. The acquisition generated incremental net sales of over $100 million and earnings per share of $0.12 for the eight months included in the fiscal year 2015 results. |
| · |
| We entered into a strategic licensing agreement with The Cookware Company ("TCC") to bring to market high quality cookware under the OXO Good Grips brand name. The licensing agreement extends OXO's brand into a new housewares category. Under the arrangement, TCC has collaborated with OXO to develop three initial collections
7 |
Table of Contents
using an innovative new "smart shapes" concept built with premium materials consisting of two lines of hard anodized aluminum cookware and one line of stainless steel cookware. These will be marketed by TCC into OXO's normal channels of distribution. TCC began i nitial shipments of the new line during the third quarter of fiscal year 2015. |
| · |
| On October 24, 2014, we amended the terms of our trademark licensing agreement with Honeywell International Inc. to relinquish the rights to market Honeywell branded portable air purifiers after December 31, 2015 in twelve selected developing countries, including China. In exchange for the amendment, we received a one-time cash payment of $7 million ($6.98 million after tax), which was recorded as a gain in selling, general and administrative expense ("SG&A") . We plan to market portable air purifiers in the relinquished markets under non-Honeywell branded trademarks and retained the rights to market Honeywell portable air purifiers in all other countries subject to the previous agreement, including the United States, Canada and all European countries. For categories such as portable fans, portable heaters and portable humidifiers, we remain the Honeywell global licensee under the same material terms as our previous agreement. |
| · |
| Effective January 1 , 2015, we amende d our long-standing license arrangement with Revlon in Personal Care a ppliances to include key markets in Western Europe, including the United Kingdom, France, Germany and Italy, among others. This will provide new opportunities for growth in our largest regional market outside the U.S . |
| · |
| On January 16, 2015, we amended and restated our credit agreement with Bank of America, N.A. and other lenders ( the " Credit Agreement"). The Credit Agreement , among other things, increased the unsecured revolving commitment from $570 million to $650 million, reduced borrowing costs, and eased the limitations o f certain covenants. For further information regarding the Credit Agreement, see "Management's, Discussion and Analysis of Financial Condition and Results of Operations-Financial Condition, Liquidity and Capital Resources."
8 |
Table of Contents
|
Company Strateg ies
As we look to the future, we have adopted a new way of looking at our strategic choices to improve the focus of our business segments and corporate shared service organization. These choices will guide us regarding where we will operate and how we will achieve our goals in markets around the world. The overall design of our business and organizational plan is intended to create sustainable growth and improve organizational capability.
| · |
| Invest in our core businesses.We have developed a portfolio of brands that are clear market leaders or have a path to grow their market position in attractive categories. We believe that prudent investment in new products, new go-to-market plans and new marketing activities can grow them organically. During fiscal year 2015, we increased our investment in those brands with the most promising potential. |
| · |
| Strategic, disciplinedmergers and acquisitions.We have a track record of successful acquisition and are continually looking for new businesses and opportunities to expand in categories and geographies where we believe we have critical mass and can develop a competitive advantage. We also seek to increase our brand reach through new licensing opportunities. We constantly assess our full suite of businesses to ensure each is a good fit with our long-term plans. |
| · |
| Invest inconsumer-centricinnovation.We have a long history of developing or acquiring new technologies, new products that improve consumers' lives and new designs to differentiate our products from competitors. We continue to increase our focus on innovation both in our core categories and product adjacencies. We also focus on initiatives that create commercial value for existing leadership products in order to increase their appeal and accelerate their organic growth. |
| · |
| Improve our organization and people systems.Our employees are our most valuable asset. Attracting, retaining and developing talent is a key focus of our company . To help us deliver strong business results, we have recently transformed our organizational structure in an effort to increase collaboration across the enterprise, implement best practices across divisions and departments and better leverage our scale. We have also adopted new compensation program s that we believe will promote greater accountability, better align management and shareholder interests and help attract and retain talent. |
| · |
| Best in classshared services.We have developed an outstanding, diversified base of suppliers in North America, China and Mexico. We have also invested heavily in our distribution centers and information technology systems. We continuously strive to improve our existing supplier base and infrastructure, and to develop new manufacturing partners to ensure our products are innovative, on time, on cost, and on quality. We are applying similar disciplines and best practices to achieve operational excellence and leverage scale in our back-office functions including customer service, product development, finance, legal services, human resources, investor relations and corporate communications. |
| · |
| Asset efficiency.As we manage our businesses for long-term growth and success in the marketplace, we are also looking to manage our overall base of assets and capital structure to increase shareholder value. We are focused on maximizing cash flow, controlling our costs, increasing the efficiency of the capital we deploy, and optimizing working capital assets such as inventory and accounts receivable through improved systems. We also seek to optimiz e our capital structure, with the selective use of leverage to invest in acquisition and, where appropriate, provide a return of capital to shareholders. |
We present financial information by operating segment in Note (21) to the accompanying consolidated financial statements. The matters discussed in this Item 1., "Business," pertain to all existing operating segments, unless otherwise specified.
9
Table of Contents
TRADEMARKS, PATENTS AND PRODUCTS
We sell certain of our products under trademarks licensed from third parties. We also market products under a number of trademarks that we own. The following is a representative listing of some of the more important trademarks by segment and major product category:
|
|
|
|
SEGMENT | PRODUCT CATEGORY | OWNED TRADEMARKS | LICENSED TRADEMARKS |
|
| OXO®, Good Grips®, |
|
Housewares |
| SoftWorks®, |
|
|
| OXO tot®, OXO SteeL® |
|
Healthcare / | Healthcare | SoftHeat®, Protec®, SmartTemp® | Braun®, Vicks® |
Home | Water Filtration | PUR® |
|
Environment | Home Environment | Duracraft®, Stinger®, Nosquito® | Honeywell®, Febreze® |
|
| Omega Q Plus Resveratrol®, Trilane® |
|
| Vitamins, | Joint Advantage Gold®, OxyRub®, |
|
Nutritional Supplements | Minerals | Probiotic Advantage®, Triveratrol®, |
|
| and Supplements | Omega Q Plus®, Vision Essentials®, |
|
|
| Total Cardio Cover®, |
|
|
| PRO Beauty Tools®, Karina®, | Revlon ®, |
| Retail and Professional | HOT Tools®, Gold ‘N Hot®, | Vidal Sassoon®, |
| Appliances and Accessories | Carel®, Comare®, | Dr. Scholls®, Scholl®, |
Personal Care |
| Shear Technology®, DCNL® | Bed Head® |
| Grooming, | Brut®, Infusium 23®, |
|
| Skin Care | Pert Plus®, Sure®, Ammens®, | Sea Breeze® |
| and Hair Care Solutions | Ogilvie®, Final Net® |
|
Licensed Trademarks
The Personal Care and Healthcare / Home Environment segments depend upon the continued use of trademarks licensed under various agreements for a substantial portion of their net sales revenue. New product introductions under licensed trademarks require approval from the respective licensors. The licensors must also approve the product packaging. Many of our license agreements require us to pay minimum royalties, meet minimum sales volumes and some require us to make minimum levels of advertising expenditures. If we decide to renew upon expiration of their current terms, we may be required to pay renewal fees at the time of that election or we may be unable to renegotiate acceptable terms that will allow for renewal.
We believe our principal trademarks, both owned and licensed, have high levels of brand name recognition among retailers and consumers throughout the world. In addition, we believe our brands have an established reputation for quality, reliability and value.
Patents, Other Intellectual Property and Infringement Considerations
Helen of Troy maintains utility and design patents in the United States and several foreign countries. We believe the loss of the protection afforded by any one of these patents would not have a material adverse effect on our business as
10
Table of Contents
a whole. We also protect certain details about our processes, products and strategies as trade secrets, keeping confidential the information that we believe provides us with a competitive advantage.
We monitor and protect our brands against infringement, as we deem practical and appropriate; however, our ability to enforce patents, copyrights, licenses, and other intellectual property is subject to general litigation risks, as well as uncertainty as to the enforceability of various intellectual property rights in various jurisdictions.
Products
We market and sell Housewares, Healthcare / Home Environment, Nutritional Supplements , and Personal Care products that we acquire, design, formulate or otherwise develop. The following table summarizes the types of products we sell by business segment:
|
|
|
|
SEGMENT | PRODUCT CATEGORY | SIGNIFICANT PRODUCTS | |
|
| Food preparation tools and gadgets, food storage containers, baking |
|
Housewares |
| tools, barware, salt and pepper grinders and mills, household cleaning |
|
|
| tools, hydration products, bathroom accessories, storage and |
|
|
| organization products, and baby and toddler care products |
|
| Healthcare | Thermometers, blood pressure monitors, humidifiers, heating pads, |
|
|
| and hot/cold wraps |
|
Healthcare / | Water Filtration | Faucet mount water filtration systems, pitcher based water filtration |
|
Home Environment |
| systems and refrigerator filters |
|
| Home Environment | Air purifiers, heaters, fans, humidifiers, dehumidifiers, and |
|
|
| insect control |
|
|
| Heart health supplements, digestive health supplements, |
|
Nutritional | Vitamins, Minerals | multi-vitamins, joint health supplements, blood sugar support |
|
Supplements | and Supplements | supplements, sleep health supplements, topical skin care products, |
|
|
| and topical analgesic products |
|
| Retail and | Curling and straightening irons, hot air brushes, hand-held dryers, hard |
|
| Professional | and soft-bonnet hair dryers, hair setters, facial/skin care appliances, |
|
| Appliances and | foot care appliances, hair clippers and trimmers, mirrors, hair brushes, |
|
Personal Care | Accessories | hair styling implements and decorative hair accessories |
|
| Grooming, | Liquid hair styling products, treatments, conditioners, shampoos, |
|
| Skin Care and | liquid and/or medicated skin care products, fragrances, deodorants, |
|
| Hair Care Solutions | and antiperspirants |
|
Innovation is a core strategy of the Company. We continue to develop new products, respond to market innovations and enhance existing products with the objective of improving our market positions. Overall, in fiscal year 2015 , we shippe d approximately 340 new products across all of our categories. Currently, approximately 350 additional new products are in our product development pipeline for expected introduction in fiscal year 2016 .
11
Table of Contents
SALES AND MARKETING
We now market our products in approximately 87 countries throughout the world. Sales within the United States compri sed approximately 79 , 77 and 79 percent of total net sales revenue in fiscal years 2015 , 2014 and 2013 , respectively. Our segments primarily sell their products through mass merchandisers, drugstore chains, warehouse clubs, home improvement stores, catalogs, grocery stores, specialty stores, beauty supply retailers, e-commerce retailers, wholesalers, and various types of distributors , as well as directly to consumers . We collaborate extensively with our retail customers and in many instances produce specific versions of our product lines with exclusive designs and packaging for their stores, which are appropriately priced for their respective customer bases. We market products principally through the use of outside sales representatives and our own internal sales staff, supported by our internal marketing, category management, engineering, creative services, and customer and consumer service staff. These groups work closely together to develop pricing and distribution strategies, to design packaging and to help develop product line extensions and new products.
The Nutritional Supplements segment sells directly to consumers through highly targeted catalog and other printed collateral mailings, internet websites and direct response print, radio and television media. The segment also sells over the telephone, through a number of customer call centers . The segment maintains exclusive development and marketing relationships with several physicians , wh o provide research and advocacy for Company products and are key component s of its marketing and customer outreach programs. T he N utritional Supplement s s egment does not have any material formal relationships with any re-distributors, nor does it maintain any field sales force outside of its call centers.
The companies from whom we license many of our brand names promote those names extensively. The Honeywell, Braun, Vicks, Febreze, Revlon, Vidal Sassoon, Dr. Scholl's, Scholl, Bed Head, and Toni&Guy trademarks are widely recognized because of the licensors' advertising and the sale of a variety of products in categories other than ours. We believe we benefit from the name recognition associated with a number of our licensed trademarks and seek to further improve the name recognition and perceived quality of all trademarks under which we sell products through our own advertising and product development efforts. We also promote our non-licensed products through television advertising and various media, including consumer and trade magazines, extensive in-store and customer cooperative advertising, company websites, social media websites, other digital media and various industry trade shows.
12
Table of Contents
MANUFACTURING AND DISTRIBUTION
We contract with unaffiliated manufacturers in the Far East, primarily in China, to manufacture a significant portion of our finished goods for the Personal Care a ppliance s, Housewares, Healthcare, Water Filtration and Home Environment product categories. The Nutritional Supplements segment and the U.S. region of the Grooming, Skin and Hair Care category of the P ersonal C are segment source most of their products from U.S. manufacturers. For a discussion regarding our dependency on third party manufacturers, see Item 1A., "Risk Factors." For fiscal years 2015 , 2014 and 2013 , finished goods manufactured by vendors in the Far East comprised approximately 67 , 6 9 and 6 8 percent, respectively, of total finished goods purchased .
Many of our key Far East manufacturers have been doing business with us for over 30 years. In some instances, we are now working with the second generation of entrepreneurs from the same families. We believe these relationships give us a stable and sustainable advantage over many of our competitors. Manufacturers who produce our products use formulas, molds and certain other tooling, some of which we own, in manufacturing those products. We employ numerous technical and quality control personnel responsible for ensuring high product quality. Most of our products manufactured outside the countries in which they are sold are subject to import duties, which increase the amount we pay to obtain such products.
The Nutritional Supplements segment owns nearly all of the formulations used in its products, with the majority having formulations that are proprietary , and in some cases, include ingredient combinations that are exclusive to the segment. Quality is paramount to the efficacy of our products and a competitive differentiator in nutritional supplements. P roducts are formulated and manufactured under the direction of the Company, following a rigorous t riple t esting method t o ensure the stability, purity, potency and safety of all finished products.
Our retail customers seek to minimize their inventory levels and often demand that we fulfill their orders within relatively short time frames. Consequently, our policy is to maintain several months of supply of inventory in order to meet our customers' needs. Accordingly, we order products substantially in advance of the anticipated time of their sale to our customers. While we have limited formal long-term arrangements with our suppliers, in most instances, we place purchase orders for products several months in advance of receipt of orders from our customers. Our relationships and arrangements with most of our manufacturers allow for some flexibility in modifying the quantity, composition and delivery dates of orders. Because of long lead times for most of our foreign sourced products, from time to time, we must discount end of model product or sell it through closeout sales channels to eliminate excess inventories. Most purchase orders are in U.S. Dollars.
In total, we occupy approximately 3,429,000 square feet of distribution space in various locations to support our operations, which includes a 1,200,000 square foot distribution center in Southaven, Mississippi, and a 1,300,000 square foot distribution center in Olive Branch, Mississippi, used to support a significant portion of our domestic distribution. We ship Housewares and Personal Care g rooming , s kin c are and h air c are s olutions products out of the Southaven facility. We ship Healthcare / Home Environment and Personal Care segment appliance products out of the Olive Branch facility.
Approximately 63 percent of our consolidated gross sales volume shipped from these two facilities in fiscal year 2015 . Nearly all Nutritional Supplement segment products are currently processed in a third-party facility based in Arden, North Carolina. We are beginning the process of relocating the segment's distribution operations to our Southaven facility , which we expect to complete in mid-fiscal year 2016. For a further discussion of the risks associated with our distribution capabilities, see Item 1A., "Risk Factors."
13
Table of Contents
Products that are manufactured in the Far East and sold in North America are shipped to the West Coast of the United States and Canada. The products are then shipped by truck or rail service to distribution centers in El Paso, Texas; Southaven, Mississippi; Olive Branch, Mississippi; and Toronto, Canada, or directly to customers. We ship substantially all products to North American customers from these distribution centers by ground transportation services. The Nutritional Supplement segment ' s products are shipped almost exclusively through U.S. mail and parcel delivery services. Products sold outside the United States and Canada are shipped from manufacturers, primarily in the Far East, to distribution centers in Belgium, the United Kingdom, Mexico, and Hong Kong or directly to customers. We then ship products stored at these international distribution centers to distributors or retailers.
CUSTOMERS
Sales to Wal-Mart Stores, Inc. (including its worldwide affiliates) accounted for approximately 18 , 19 and 19 percent of our consolidated net sales revenue in fiscal years 2015 , 2014 and 2013 , respectively. Sales to our second largest customer, Target Corporation, accounted for approximately 9 , 11 and 11 percent of our consolidated net sales revenue in fiscal years 2015 , 2014 and 2013 , respectively. No other customers accounted for 10 percent or more of consolidated net sales revenue during those fiscal years. Sales to our top five customers accounted for approximately 41 , 43 and 42 percent of our consolidated net sales revenue in fiscal years 2015 , 2014 and 2013 , respectively. The Nutritional Supplement segment maintains a database of over 600,000 customers to whom it actively markets. A large proportion of these customers take advantage of the segment's auto-delivery service that periodically ships a re-supply of product, resulting in a more stable and less seasonal order flow.
ORDER BACKLOG
When placing orders, our individual consumer, retail and wholesale customers usually request that we ship the related products within a short time frame. As such, there usually is no significant backlog of orders in any of our distribution channels.
COMPETITIVE CONDITIONS
The markets in which we sell our products are very competitive and mature. The rapid growth of large mass merchandisers, together with changes in consumer shopping patterns, have contributed to a significant consolidation of the consumer products retail industry and the formation of dominant multi-category retailers with strong negotiating power. The growth in internet sales both by traditional retailers and pure online retailers , such as Amazon , ha s begun to erode market share at "brick-and-mortar" retailers. Current trends among retailers include fostering high levels of competition among suppliers, insist ing on maintaining or reducing prices , requir ing deliver y of products in shorter lead times, and a significant number of North American store closings by underperforming retail chains. Certain retailers continue to source and sell products under their own private label brands that compete with our Company's products. We believe that we have certain key competitive advantages, such as well recognized brands, engineering expertise and innovation, sourcing and supply chain know-how, and productive co-development relationships with our Far East manufacturers, some of which have been built over 30 years or more of working together. We believe these advantages allow us to bring our retailers a value proposition in our products that can significantly out-perform private label products in most categories. Maintaining and gaining market share depends heavily on product development and enhancement, pricing, quality, performance, packaging and availability, brand name recognition, patents, and rapidly adaptive marketing and distribution approaches.
W e believe the market for the Nutritional Supplements segment is growing, but highly fragmented. Competition includes multi-level marketers, internet sites, specialty and mass retailers, pharmacy, grocery and membership clubs . The primary competitive factors across these channels are pricing, perceived value and efficacy of ingredients, supporting clinical research, ease of ordering , customer service and cost of delivery. We believe we compete favorably with respect to the above factors.
14
Table of Contents
The following table summarizes our primary competitors by business segment:
|
|
|
SEGMENT | PRODUCT CATEGORY | PRIMARY COMPETITORS |
|
| Lifetime Brands, Inc. (KitchenAid), Zyliss AG, Wilton Industries, Inc. |
|
| (Copco), Simplehuman LLC, Casabella Holdings LLC, Interdesign, Inc., |
Housewares |
| Kuhn Rikon Corporation, Newell Rubbermaid, Inc. (Calphalon Cookware), |
|
| Boon Inc., Ignite USA, LLC (Contigo), PMI (Aladdin), Munchkin, Inc., |
|
| Skip Hop, Inc., Chef'n, Progressive International, and Stokke AS. |
|
| Philips Electronics N.V., Microlife AG Swiss Corporation, Omron |
| Healthcare | Corporation, Medisana AG, Beurer GmbH, Exergen Corporation, |
Healthcare / |
| Paul Hartmann AG, and Visiomed Group SA (Thermoflash) |
Home | Water Filtration | The Clorox Company (Brita), 3M Company (Filtrete), and |
Environment |
| Zero Technologies LLC (ZeroWater) |
|
| Panasonic Corporation, Sharp Corporation, Jarden Corporation (Sunbeam, |
| Home Environment | Bionair and Holmes), Lasko Products, Inc., De' Longhi S.p.A., |
|
| Blueair, Inc., and Samsung Electronics Co., Ltd. |
Nutritional | Vitamins, Minerals | Vitacost.com, Inc., Mercola.com, Life Extension, Purity Products, |
Supplements | and Supplements | Swanson Health Products, and Vitamin Research Products |
|
| Conair, Farouk Systems Inc. (CHI), T3 Micro, Inc., International Consulting |
| Retail and | Associates (InfraShine), FHI Heat, Inc., Jamella Limited (GHD), Turbo Ion, |
| Professional | Inc. (Croc Hair Products), Spectrum Brands, Inc. (Remington), Goody |
| Appliances and | Products, Inc. a division of Newell Rubbermaid, Inc., Wahl Clipper |
Personal Care | Accessories | Corporation, BaByliss S.A., AST Systems, LLC (SalonTech), |
|
| John Paul Mitchell Systems, Inc., and Homedics-U.S.A., Inc. |
| Grooming, | The Procter & Gamble Company, L'Or é al Group, Unilever N.V., Colgate- |
| Skin Care and | Palmolive Company, Johnson & Johnson, Henkel AG & Co. KGaA, |
| Hair Care Solutions | Beirsdorf AG, Coty Inc., and KAO Brands Company |
Some of these competitors have significantly greater financial and other resources than we do.
15
Table of Contents
SEASONALITY
The following table shows our seasonality over the latest three fiscal years.
SEASONALITY AS A PERCENTAGE OF ANNUAL NET SALES REVENUE
|
|
|
|
|
|
|
|
|
|
|
|
| Fiscal Years Ended |
| |||||||
|
| the Last Day of February, |
| |||||||
Fiscal Quarter Ended |
| 2015 |
| 2014 |
| 2013 |
| |||
May |
|
| 21.6 | % |
| 23.1 | % |
| 23.3 | % |
August |
|
| 22.1 | % |
| 24.3 | % |
| 22.3 | % |
November |
|
| 30.2 | % |
| 28.9 | % |
| 29.1 | % |
February |
|
| 26.1 | % |
| 23.7 | % |
| 25.3 | % |
Our core business is seasonal due to different calendar events, holidays and seasonal weather patterns ; however, the overall sales pattern for our Nutritional Supplements segment is not highly seasonal . Historically, the third fiscal quarter normally produces the highest net sales revenue during the fiscal year. Seasonality in fiscal year 2015 was skewed in the latter half of the year by the inclusion of eight months of net sales revenue from Healthy Directions following its acquisition on June 30, 2014. Because of the impact of the seasonality of our net sales revenues, our working capital needs fluctuate during the year.
GOVERNMENTAL REGULATION AND ENVIRONMENTAL MATTERS
Our operations are subject to national, state, local, and provincial jurisdictions' environmental, health and safety laws and regulations. These laws and regulations impose workplace standards and regulate the discharge of pollutants into the environment. In addition, they establish various standards for the handling, generation, emission, release, discharge, treatment, storage and disposal of materials, and substances including solid and hazardous wastes.
Many of the products we sell are subject to a number of product safety laws and regulations in various jurisdictions. These laws and regulations specify the maximum allowable levels of certain materials that may be contained in our products, provide statutory prohibitions against misbranded and adulterated products, establish ingredients and manufacturing procedures for certain products, specify product safety testing requirements, and set product identification and labeling requirements. The Nutritional Supplements segment operates almost entirely in the United States. I mporting, manufacturing, processing, formulating, packaging, labeling, distributing, selling and advertising of our Nutritional Supplements segment products may be subject to regulation by one or more federal or state agencies. The Food and Drug Administration ( the "FDA") has primary jurisdiction over our product s pursuant to the Federal Food, Drug and Cosmetic Act ( the "FDCA") as amended by the Dietary Supplement and Health Education Act of 1994 ( the " DSHEA "), and is responsible for issuing regulations under these and associated laws . The FDCA provides the regulatory framework for the safety and labeling of dietary supplements, foods, and medical foods. In particular, the FDA regulates the safety, manufacturing, labeling and distribution of dietary supplements. The Federal Trade Commission ( the "FTC") and the FDA share jurisdiction over the promotion and advertising of dietary supplements. Pursuant to a memorandum of understanding between the two agencies, the FDA has primary jurisdiction over claims that appear on product labels and labeling and the FTC has primary jurisdiction o ver product advertising.
FDA rules impose requirements on the manufacture, packaging, labeling, holding, and distribution of dietary supplement products. For example, it requires that companies establish extensive written procedures and controls governing areas such as: (1) personnel, (2) plant and equipment cleanliness, (3) production controls, (4) laboratory operations, (5) packaging and labeling, (6) distribution, (7) product returns, and (8) complaint handling. The FDA also requires identity testing of all incoming ingredients unless a company successfully petitions for an exemption from this testing requirement in accordance with the regulations. FDA prescribed good manufacturing practices are designed to ensure that dietary supplements and dietary ingredients are not adulterated with contaminants or impurities, and are accurately labeled to reflect the active ingredients and other ingredients in the products.
Additionally, an emerging trend with both governments and our retail customers is to prescribe public and private social accountability reporting requirements regarding our worldwide business activities. In our product space, some
16
Table of Contents
requirements have already been mandated and we believe others may become required. Examples of current requirements include conflict minerals content reporting and reporting of foreign fair labor practices in connection with our supply chain vendors.
We believe that we are in material compliance with these laws, regulations and other reporting requirements. Further, the cost of maintaining compliance has not had a material adverse effect on our business, consolidated results of operations and consolidated financial condition, nor do we expect it to do so in the foreseeable future. Due to the nature of our operations and the frequently changing nature of compliance and social reporting standards and technology, we cannot predict with any certainty that future material capital or operating expenditures will not be required in order to comply with applicable laws, regulations and other reporting mandates.
EMPLOYEES
As of February 28, 2015 , we employed approximately 1,640 full-time employees worldwide . We also use temporary, part-time and seasonal employees as needed. None of our U.S. employees are covered by a collective bargaining agreement. Certain of our employees in Europe are covered by collective arrangements in accordance with local practice. We have never experienced a work stoppage, and we believe that we have satisfactory working relations with our employees.
GEOGRAPHIC AND SEGMENT INFORMATION
Note (21) to our accompanying consolidated financial statements contains geographic and segment information concerning our net sales revenue, long-lived assets and operating income.
AVAILABLE INFORMATION
We maintain our main Internet site at the following address: 1H1H1H1H1H1H1H1H1H1H1H1H1H1H http://www.hotus.com . The information contained on this website is not included as a part of, or incorporated by reference into, this report. We make available on or through our main website's Investor Relations page under the heading "SEC Filings" certain reports and amendments to those reports that we file with, or furnish to, the SEC in accordance with the Securities Exchange Act of 1934, as amended (the "Exchange Act"). These include our annual reports on Form 10-K, our quarterly reports on Form 10-Q, our current reports on Form 8-K, our proxy statements on Schedule 14A, amendments to these reports, and the reports required under Section 16 of the Exchange Act of transactions in Company shares by directors and officers. We make this information available on our website free of charge as soon as reasonably practicable after we electronically file the information with, or furnish it to, the SEC. Also, on the Investor Relations page, under the heading "Corporate Governance", are the Company's Code of Ethics, Corporate Governance Guidelines and the Charters of the Committees of the Board of Directors.
17
Table of Contents
ITEM 1A
. RISK FACTORS
The ownership of our common stock involves a number of risks and uncertainties. When evaluating the Company before making a decision regarding investment in our securities, potential investors should carefully consider the risk factors and uncertainties described below, together with other information contained in this report. If any of the events or circumstances described below or elsewhere in this report actually occur, they could adversely effect our business and operating results. The risks listed below are not the only risks that we face. Additional risks that are presently unknown to us or that we currently believe are not significant may also impact our business operations.
our Chief Executive Officer and a limited number of other key senior officers to operate our business. The loss of any of these individuals could have a material adverse effect on our business.
The loss of our Chief Executive Officer or any of our key senior officers could have a material adverse effect on our business, financial condition and results of operations, particularly if we are unable to hire or relocate and integrate suitable replacements on a timely basis or at all. Further, in order to continue to grow our business, we will need to expand our senior management team. We may be unable to attract or retain these persons. This could hinder our ability to grow our business and could disrupt our operations or otherwise have a material adverse effect on our business.
Our ability to deliver products to our customers in a timely manner and to satisfy our customers' fulfillment standards are subject to several factors, some of which are beyond our control.
Retailers place great emphasis on timely delivery of our products for specific selling seasons, especially during our third fiscal quarter, and on the fulfillment of consumer demand throughout the year. We cannot control all of the various factors that might affect product delivery to retailers. Vendor production delays, difficulties encountered in shipping from overseas, customs clearance delays, and operational issues with any of the third-party logistics providers we use in certain countries are on-going risks of our business. We also rely upon third-party carriers for our product shipments from our distribution centers to customers. In certain circumstances, we rely on the shipping arrangements our suppliers have made in the case of products shipped directly to retailers from the suppliers. Accordingly, we are subject to risks, including labor disputes, inclement weather, natural disasters, possible acts of terrorism, availability of shipping containers, and increased security restrictions associated with the carriers' ability to provide delivery services to meet our shipping needs. Failure to deliver products to our retailers in a timely and effective manner, often under special vendor requirements to use specific carriers and delivery schedules, could damage our reputation and brands and result in loss of customers or reduced orders.
Our results of operations are dependent on sales to several large customers and the loss of, or substantial decline in, sales to a top customer could have a material adverse effect on our revenues and profitability.
A few customers account for a substantial percentage of our net sales revenue. Our financial condition and results of operations could suffer if we lost all or a portion of the sales to any one of these customers. In particular, sales to our first and second largest customers accounted for approximately 18 and 9 percent, respectively, of our consolidated net sales revenue in fiscal year 2015. While only one customer individually accounted for 10 percent or more of our consolidated net sales revenue in fiscal year 2015, sales to our top five customers accounted for approximately 41 percent of fiscal year 2015 consolidated net sales revenue. We expect that a small group of customers will continue to account for a significant portion of our net sales revenue. Although we have long-standing relationships with our major customers, we generally do not have written agreements that require these customers to buy from us or to purchase a minimum amount of our products. A substantial decrease in sales to any of our major customers could have a material adverse effect on our financial condition and results of operations.
18
Table of Contents
With the continuing trend towards retail trade consolidation, we are increasingly dependent upon key customers whose bargaining strength is substantial and growing. We may be negatively affected by changes in the policies of our customers, such as on-hand inventory reductions, limitations on access to shelf space, use of private label brands, price demands and other conditions, which could negatively impact our financial condition and results of operations.
A significant deterioration in the financial condition of our major customers could have a material adverse effect on our sales and profitability. We regularly monitor and evaluate the credit status of our customers and attempt to adjust sales terms as appropriate. Despite these efforts, a bankruptcy filing by a key customer could have a material adverse effect on our business, financial condition and results of operations.
Large sophisticated customers may take actions that adversely affect our gross profit and results of operations.
In recent years, we have observed a consumer trend away from traditional grocery and drugstore channels and toward mass merchandisers, which includes super centers and warehouse club stores. In addition, the growth in internet sales both by large traditional retailers and pure online retailers such as Amazon has begun to reach a critical mass. This trend has resulted in the increased size and influence of these types of customers. Additionally, certain of these customers source and sell products under their own private label brands that compete with our products. As certain large customers and online retailers grow even larger and become more sophisticated, they may continue to demand lower pricing, special packaging, shorter lead times for the delivery of products, smaller more frequent shipments, or impose other requirements on product suppliers. These business demands may relate to inventory practices, logistics or other aspects of the customer-supplier relationship. If we do not effectively respond to these demands, these customers could decrease their purchases from us. A reduction in the demand for our products by these customers and the costs of complying with their business demands could have a material adverse effect on our business, financial condition and results of operations.
We are subject to risks related to our dependence on the strength of retail economies and may be vulnerable in the event of a prolonged economic downturn.
Our business depends on the strength of the retail economies in various parts of the world, primarily in North America and to a lesser extent E MEA , Asia and Latin America. These retail economies are affected primarily by factors such as consumer demand and the condition of the retail industry, which, in turn, are affected by general economic conditions and specific events such as natural disasters, terrorist attacks and political unrest. Consumer spending in any geographic region is generally affected by a number of factors, including local economic conditions, government actions, inflation, interest rates, energy costs, unemployment rates, gasoline prices and consumer confidence, all of which are beyond our control. Consumer purchases of discretionary items tend to decline during recessionary periods, when disposable income is lower, and may impact sales of our products. As a result of a prolonged recovery from the most recent global recession, we believe many consumers have less money for discretionary purchases as a result of a variety of factors, such as job losses, bankruptcies, reduced access to credit, increases in ta xes, government program curtailments, personal health care costs, and slow-to-recover housing prices. The modest and protracted recovery from the recession in the United States, the United Kingdom, Canada, Mexico or any of the other countries in which we conduct significant business may continue to cause significant readjustments in both the volume and mix of our product sales, which could materially and adversely affect our business, financial condition and results of operations.
The impact of these external factors and the extent to which they may continue is difficult to predict, and one or more of the factors could adversely impact our business. In recent years, the retail industry in the U.S., and increasingly elsewhere, has been characterized by intense competition among retailers and the growth in internet sales both by traditional retailers and pure online retailers such as Amazon. Because such competition, particularly when weak retail economies exist, can cause retailers to struggle or fail, we must continuously monitor, and adapt to changes in, the profitability, creditworthiness and pricing policies of our customers. A deterioration of any of our key retail economies, could have a material adverse effect on our business, financial condition and results of operations.
19
Table of Contents
Expectations regarding recent acquisitions, and any future acquisitions, including our ability to realize anticipated cost savings, synergies and other benefits along with our ability to effectively integrate acquired businesses, may adversely affect the price of our common stock.
We continue to look for opportunities to make complementary strategic business and/or brand acquisitions. Past and future acquisitions, if not favorably received by consumers, shareholder s, analysts, and others in the investment community, could have a material adverse effect on the price of our common stock. In addition, any acquisition involves numerous risks, including:
| · |
| difficulties in the assimilation of the operations, technologies, products, and personnel associated with the acquisitions; |
| · |
| difficulties in integrating distribution channels; |
| · |
| diversion of management's attention from other business concerns; |
| · |
| difficulties in transitioning and preserving customer, contractor, supplier, and other important third-party relationships; |
| · |
| difficulties realizing anticipated cost savings, synergies and other benefits related to an acquisition; |
| · |
| risks associated with subsequent operating asset write-offs, contingent liabilities and impairment of related acquired intangible assets; |
| · |
| risks of entering markets in which we have no or limited experience; and |
| · |
| potential loss of key employees associated with the acquisitions. |
Any difficulties encountered with acquisitions could have a material adverse effect on our business, financial condition and results of operations.
Our operating results may be adversely affected by foreign currency exchange rate fluctuations.
Our functional currency is the U.S. Dollar. Changes in the relation of other foreign currencies to the U.S. Dollar will affect our sales and profitability and can result in exchange losses because the Company has operations and assets located outside the United States. The Company transacts a significant portion of its international business in currencies other than the U.S. Dollar ("foreign currencies"). Such transactions include sales, certain inventory purchases and operating expenses. As a result, portions of our cash, trade accounts receivable and trade accounts payable are denominated in foreign currencies. Accordingly, foreign operations will continue to expose us to foreign currency fluctuations, both for purposes of actual conversion and financial reporting purposes. Additionally, we purchase a substantial amount of our products from Chinese manufacturers. During fiscal years 2015 and 2013, the Chinese Renminbi remained relatively flat against the U.S. Dollar. During fiscal year 2014, the Chinese Renminbi appreciated against the U.S. Dollar approximately 3 percent. While China's currency intervention strategy with respect to the U.S. Dollar is continuously evolving, we believe that China's currency may continue to fluctuate against the U.S. Dollar in the short-to-intermediate term, which could result in increased product costs over time and we may not be able to pass on all or any of these increases to our customers.
Where operating conditions permit, we seek to reduce foreign currency risk by purchasing most of our inventory with U.S. Dollars and by converting cash balances denominated in foreign currencies to U.S. Dollars. We have also historically hedged against certain foreign currency exchange rate-risk by using a series of forward contracts designated as cash flow hedges to protect against the foreign currency exchange risk inherent in our forecasted transactions denominated in currencies other than the U.S. Dollar. In these transactions, we execute a forward currency contract that will settle at the end of a forecasted period. Because the size and terms of the forward contract are designed so that its fair market value will move in the opposite direction and approximate magnitude of the underlying foreign currency's forecasted exchange gain or loss during the forecasted period, a hedging relationship is created. To the extent we forecast the expected foreign currency cash flows from the period the forward contract is entered into until the date it will settle
20
Table of Contents
with reasonable accuracy, we significantly lower or materially eliminate a particular currency's exchange risk exposure over the life of the related forward contract. We enter into these types of agreements where we believe we have meaningful exposure to foreign currency exchange risk and the hedge pricing appears reasonable. It is not practical for us to hedge all our exposures, nor are we able to project in any meaningful way the possible effect and interplay of all foreign currency fluctuations on translated amounts or future net income . This is due to our constantly changing exposure to various currencies, the fact that each foreign currency reacts differently to the U.S. Dollar and the significant number of currencies involved.
The impact of future exchange rate fluctuations on our results of operations cannot be accurately predicted. Accordingly, there can be no assurance that U.S. Dollar foreign exchange rates will be stable in the future or that fluctuations in foreign currency markets will not have a material adverse effect on our business, financial condition and results of operations.
Disruptions in U.S., Euro zone and other international credit markets may adversely affect our business, financial condition and results of operations.
Disruptions in national and international credit markets could result in limitations on credit availability, tighter lending standards, higher interest rates on consumer and business loans, and higher fees associated with obtaining and maintaining credit availability. Disruptions may also materially limit consumer credit availability and restrict credit availability to our customer base and the Company. In addition, in the event of disruptions in the financial markets, current or future lenders may become unwilling or unable to continue to advance funds under any agreements in place, increase their commitments under existing credit arrangements or enter into new financing arrangements. The failure of our lenders to provide sufficient financing may constrain our ability to operate or grow the business and to make complementary strategic business and/or brand acquisitions. This could have a material adverse effect on our business, financial condition and results of operations.
Our business continues to become more subject to weather conditions , which can cause our operating results to vary from quarter to quarter.
S ales of our Healthcare / Home Environment segment are influence d by weather conditions. Sales volumes for thermometry, humidifiers and heating appliances are higher during , and subject to , the severity of the cold weather months, while sales of fans, dehumidifiers and insect control devices are higher during , and subject to , weather conditions in spring and summer months. Weather conditions can also more broadly impact sales across the organization. For instance, natural disasters (i.e., hurricanes and ice storms) or unusually severe winter weather may result in temporary unanticipated reductions in retail traffic and consumer demand , may impact our ability to staff our distribution facilities or could otherwise impede timely transport and delivery of product from our distribution facilities . These factors could have a material adverse effect on our business, results of operations and financial condition.
We are dependent on third-party manufacturers, most of which are located in the Far East, and any inability to obtain products from such manufacturers could have a material adverse effect on our business, financial condition and results of operations.
All of our products are manufactured by unaffiliated companies, most of which are in the Far East, principally in China. This concentration exposes us to risks associated with doing business globally, including: changing international political relations; labor availability and cost; changes in laws, including tax laws, regulations and treaties; changes in labor laws, regulations and policies; changes in customs duties and other trade barriers; changes in shipping costs; currency exchange fluctuations; local political unrest; an extended and complex transportation cycle; the impact of changing economic conditions; and the availability and cost of raw materials and merchandise. The political, legal and cultural environment in the Far East is rapidly evolving, and any change that impairs our ability to obtain products from manufacturers in that region, or to obtain products at marketable rates, could have a material adverse effect on our business, financial condition and results of operations.
21
Table of Contents
With most of our manufacturers located in the Far East, our production lead times are relatively long. Therefore, we must commit to production in advance of customer orders. If we fail to forecast customer or consumer demand accurately, we may encounter difficulties in filling customer orders on a timely basis or in liquidating excess inventories. We may also find that customers are canceling orders or returning products. Any of these results could have a material adverse effect on our business, financial condition and results of operations.
Historically, labor in China has been readily available at relatively low cost as compared to labor costs in North America, Europe and other countries. China has experienced rapid social, political and economic change in recent years. There is no assurance labor will continue to be available in China at costs consistent with historical levels or that changes in labor or other laws will not be enacted which would have a material adverse effect on the cost of products manufactured in China. Many of our suppliers in China continue to experience labor shortages, which could result in future supply delays and disruptions and have resulted in a substantial increase in labor costs over the last three fiscal years. Similarly, evolving government labor regulations and associated compliance standards could cause our product costs to rise or could cause manufacturing partners we rely on to exit the business. This could have an adverse impact on product availability and quality. The Chinese economy has experienced rapid expansion and highly fluctuating rates of inflation. Higher general inflation rates will require manufacturers to continue to seek increased product prices. While the Chinese Renminbi remained relatively flat against the U.S. Dollar in fiscal years 2015 and 2013, it appreciated against the U.S. Dollar approximately 3 percent in fiscal year 2014 . If the Chinese Renminbi appreciates with respect to the U.S. Dollar in the future, the Company may experience cost increases on such purchases, and this can adversely impact profitability. Future interventions by China may result in further currency appreciation and increase our product costs over time. The Company may not be successful at implementing customer pricing or other actions in an effort to mitigate the related effects of the product cost increases. Although China currently enjoys "most favored nation" trading status with the U.S., the U.S. government has in the past proposed to revoke such status and to impose higher tariffs on products imported from China. There is no assurance that our business will not be affected by any of the aforementioned risks, each of which could have a material adverse effect on our business, financial condition and results of operations.
The availability, purity and integrity of raw materials used in the manufacture of the Nutritional Supplements segment's products could be compromised.
The Nutritional Supplements segment depends on outside suppliers for raw materials, acquiring all of its raw materials for the manufacture of its products from third-party suppliers. The segment uses multiple agreements for the supply of materials used in the manufacture of its products in order to hedge against shortages or potential spikes in material costs. The segment also contracts with third-party manufacturers and suppliers for the production of its products. In the event of a loss of any significant supplier, the segment could experience difficulties in finding or transitioning to alternative suppliers, which could result in product shortages or product back orders, which could harm its business. There can be no assurance that suppliers will be able to provide the segment with the raw materials in the quantities and at the appropriate level of quality requested or at prices it will be willing to pay. The segment is also subject to the delays caused by any interruption in the production of these materials including weather, crop conditions, climate change, transportation interruptions, and natural disasters or other catastrophic events.
Occasionally, suppliers have experienced production difficulties with respect to the segment's products, including the delivery of materials or products that do not meet rigorous quality control standards. These quality problems have in the past resulted in, and in the future could result in, stock outages or shortages of our products, and could harm sales or create inventory write-offs for unusable product.
High costs of raw materials and energy may result in increased cost of goods sold and certain operating expenses and adversely affect our results of operations and cash flow.
Significant variations in the costs and availability of raw materials and energy may negatively affect our results of operations. Our suppliers purchase significant amounts of metals and plastics to manufacture our products. In addition, they also purchase significant amounts of electricity to supply the energy required in their production processes. Changes in the cost of fuel as a result of Middle East tensions and related political instabilities may continue to drive up fuel prices resulting in higher transportation prices and product costs. The cost of these raw materials and energy, in the aggregate,
22
Table of Contents
represents a significant portion of our cost of goods sold and certain operating expenses. Our results of operations could be adversely affected by future increases in these costs. We have had some success in implementing price increases to our customers or passing on product cost increases by moving customers to newer product models with enhancements that justify higher prices, and we intend to continue these efforts. We can make no assurances that these efforts will be successful in the future or will materially offset the cost increases we may incur.
Certain of our U.S. distribution facilities are geographically concentrated and operate during peak shipping periods at or near capacity. These factors increase our risk that disruptions could occur and significantly affect our ability to deliver products to our customers in a timely manner. Such disruptions could have a material adverse effect on our business.
To make our distribution operations more efficient, we have consolidated most of our U.S. distribution, receiving and storage functions into two distribution facilities in northern Mississippi. Approximately 63 percent of our consolidated gross sales volume shipped from facilities in this region in fiscal year 2015. For this reason, any disruption in our distribution process in either of these facilities, even for a few days, could adversely effect our business and operating results.
Additionally, our U.S. distribution operations may incur capacity constraints during peak shipping periods as we continue to grow our sales revenue through a combination of organic growth and acquisitions. These and other factors described above could cause delays in the delivery of our products and increases in shipping and storage costs that could have a material and adverse effect on our business, financial condition and results of operations.
Any difficulties encountered during the fiscal year 2016 transition of the Nutritional Supplement s segment 's distribution operations from a third-party operated facility to our Company operated facility in Southaven, Mississippi, could interrupt our logistical systems and could have a material adverse impact on our business.
We expect to complete the transition of our Nutritional Supplement s segment's distribution operations from a third-party operated facility to our Southaven, Mississippi distribution facility during the middle of fiscal year 2016. During this transition, there is a risk for order processing and shipment delays as a result of the impacts of new software installations, adapting to new equipment and processes, and the training of new employees. Any resulting interruption in our logistical systems could negatively impact our ability to procure our products from our factories and suppliers, transport them to our distribution facilities, and store and deliver them to our customers on time and in the correct amounts. These and other factors described above could have a material and adverse effect on our business, financial condition and results of operations.
Our projections of product demand, sales and net income are highly subjective in nature and our future sales and net income could vary in a material amount from our projections.
From time to time, we may provide projections to our shareholder s, lenders, investment community, and other stakeholders of our future sales and net income. Since we do not require long-term purchase commitments from our major customers and the customer order and ship process is very short, it is difficult for us to accurately predict the demand for many of our products, or the amount and timing of our future sales and related net income. Our projections are based on management's best estimate of sales using historical sales data and other information deemed relevant. These projections are highly subjective since sales to our customers can fluctuate substantially based on the demands of their retail customers and due to other risks described in this report. Additionally, changes in retailer inventory management strategies could make our inventory management more difficult. Because our ability to forecast product demand and the timing of related sales includes significant subjective input, our future sales and net income could vary materially from our projections.
23
Table of Contents
If our goodwill, indefinite-lived intangible assets or other long-term assets become impaired, we will be required to record impairment charges, which may be significant.
A significant portion of our long-term assets continues to consist of goodwill and other indefinite-lived intangible assets recorded as a result of past acquisitions. We do not amortize goodwill and indefinite-lived intangible assets, but rather review them for impairment on an annual basis or more frequently whenever events or changes in circumstances indicate that their carrying value may not be recoverable. If such circumstances or conditions exist, further steps are required in order to determine whether the carrying value of each of the individual assets exceeds its fair market value. If our analysis indicates that an individual asset's carrying value does exceed its fair market value, the next step is to record a loss equal to the excess of the individual asset's carrying value over its fair value. The steps required by GAAP entail significant amounts of judgment and subjectivity.
We complete our analysis of the carrying value of our goodwill and other intangible assets during the first quarter of each fiscal year, or more frequently, whenever events or changes in circumstances indicate their carrying value may not be recoverable. Events and changes in circumstances that may indicate there is impairment and which may indicate interim impairment testing is necessary include, but are not limited to: strategic decisions to exit a business or dispose of an asset made in response to changes in economic, political and competitive conditions ; the impact of the economic environment on our customer base and on broad market conditions that drive valuation considerations by market participants ; our internal expectations with regard to future revenue growth and the assumptions we make when performing our impairment reviews ; a significant decrease in the market price of our assets ; a significant adverse change in the extent or manner in which our assets are used ; a significant adverse change in legal factors or the business climate that could affect our assets ; an accumulation of costs significantly in excess of the amount originally expected for the acquisition of an asset ; and significant changes in the cash flows associated with an asset. We analyze these assets at the individual asset, reporting unit and company levels. As a result of such circumstances, we may be required to record a significant charge to net income in our financial statements during the period in which any impairment of our goodwill, indefinite-lived intangible assets or other long-term assets is determined. Any such impairment charges could have a material adverse effect on our business, financial condition and results of operations.
We rely on licensed trademarks with third parties and license certain trademarks to third parties in exchange for royalty income, the loss of which could have a material adverse effect on our revenues and profitability.
A substantial portion of our sales revenue comes from selling products under licensed trademarks. As a result, we are dependent upon the continued use of these trademarks, including the Revlon, Vicks, Braun, Honeywell, and Vidal Sassoon trademarks. Additionally, we license certain owned trademarks, including OXO and PUR, to third parties in exchange for royalty income. It is possible that certain actions taken by the Company, its licensors, licensees, or other third parties might diminish greatly the value of any of our licensed trademarks. S ome of our licensors and licensees also have the ability to terminate their license agreements with us at their option subject to each parties' right to continue the license for a limited period of time following notice of termination. If we or our licensees were unable to sell products under these licensed trademarks, or one or more of our license agreements are terminated or the value of the trademarks were diminished , the effect on our business, financial condition and results of operations could be both negative and material.
To compete successfully, we must develop and introduce a continuing stream of innovative new products to meet changing consumer preferences.
Our long-term success in the competitive retail environment depends on our ability to develop and commercialize a continuing stream of innovative new products that meet changing consumer preferences and take advantage of opportunities sooner than our competition. We face the risk that our competitors will introduce innovative new products that compete with our products. Our core initiatives include fostering our culture of innovation and new product development, enhancing and extending our existing product categories and developing new allied product categories. There are numerous uncertainties inherent in successfully developing and commercializing new products on a continuing basis and new product launches may not deliver expected growth in sales or operating income. If we are unable to
24
Table of Contents
develop and introduce a continuing stream of new products, it may have an adverse effect on our business, financial condition and results of operations.
The Nutritional Supplements segment may be subject to product liability claims, which could materially and adversely affect our business, financial condition, results of operation or reputation.
As a formulator and distributor of products designed for human consumption or use on or in the body, our Nutritional Supplements segment may be subject to product liability claims if the use of our products is alleged to have resulted in illness or injury or if our products include inadequate instructions or warnings. These products generally consist of vitamins, minerals, herbs, and other ingredients that are classified as foods, over-the-counter drugs, dietary supplements, and medical devices and generally are not subject to pre-market regulatory approval or clearance by governmental authorities. In the event products contained spoiled or contaminated substances, or, in the case of products that contain ingredients that do not have long histories of human consumption, previously unknown adverse reactions resulting from human consumption of these ingredients could occur. We could also be subject to product liability claims, including among others, that our products include insufficient instructions for use or inadequate warnings concerning possible side effects or interactions with other substances. Any product liability claim against us could result in increased costs and adversely affect our reputation with our customers, which in turn could materially adversely affect our business, financial condition or results of operations.
The Nutritional Supplements segment may be subject to the effects of potential adverse publicity and negative public perception .
Consumer acceptance of the safety, efficacy and quality of the Nutritional Supplements segment's products, as well as similar products distributed by other companies can be significantly influenced by scientific research or findings, national media attention and other publicity about product use. A product may initially be received favorably, resulting in high sales associated with that product that may not be sustainable as consumer preferences change. In addition, recent studies have challenged the safety or benefit of certain nutritional supplements and dietary ingredients. Future scientific research or publicity could be unfavorable to the industry or any of our products and may not be consistent with earlier favorable research or publicity. Any research or publicity that is perceived by consumers as less than favorable or that questions earlier favorable research or publicity could have a material adverse effect on the Nutritional Supplements segment's ability to generate revenue. Adverse publicity in the form of published scientific research, statements by regulatory authorities or otherwise, whether or not accurate, that associates consumption of products or any other similar products with illness or other adverse effects, or that questions the benefits of our or similar products, or that claims that such products are ineffective , could have a material adverse effect on our business, reputation, financial condition or results of operations.
25
Table of Contents
Our operating results may be adversely affected by trade barriers, exchange controls, expropriations, and other risks associated with foreign operations .
The economies of foreign countries important to our operations, including countries in Asia, EMEA and Latin America, could suffer slower economic growth or economic, social and/or political instability or hyperinflation in the future. Our international operations in countries in Asia, EMEA and Latin America, including manufacturing and sourcing operations (and the international operations of our customers), are subject to inherent risks which could adversely affect us, including, among other things:
| · |
| protectionist policies restricting or impairing the manufacturing, sales or import and export of our products; |
| · |
| new restrictions on access to markets; |
| · |
| lack of developed infrastructure; |
| · |
| inflation (including hyperinflation) or recession; |
| · |
| changes in, and the burdens and costs of compliance with, a variety of foreign laws and regulations, including tax laws, accounting standards, environmental laws and occupational health and safety laws; |
| · |
| social, political or economic instability; |
| · |
| acts of war and terrorism; |
| · |
| natural disasters or other crises; |
| · |
| reduced protection of intellectual property rights in some countries; |
| · |
| increases in duties and taxation; |
| · |
| restrictions on transfer of funds or exchange of currencies; |
| · |
| currency devaluations; |
| · |
| expropriation of assets; and |
| · |
| other adverse changes in policies, including monetary, tax or lending policies, encouraging foreign investment or foreign trade by our host countries. |
Should any of these events occur, our ability to sell or export our products or repatriate profits could be impaired, we could experience a loss of sales and profitability from our international operations, and/or we could experience a substantial impairment or loss of assets, any of which could materially and adversely affect our business, financial condition and results of operations.
26
Table of Contents
We incurred significant debt and may incur additional debt to fund future acquisitions, share repurchases and capital expenditures, which could have an adverse impact on our business and profitability.
Our debt levels can adversely affect our financial condition and can add constraints on our ability to operate our business. Our indebtedness can, among other things:
| · |
| increase our vulnerability to general adverse economic conditions; |
| · |
| limit our ability to obtain necessary financing and to fund future working capital, capital expenditures and other general corporate requirements; |
| · |
| require us to dedicate a portion of our cash flow from operations to payments on our indebtedness, thereby reducing the availability of our cash flow to fund working capital and capital expenditures, and for other general corporate purposes; |
| · |
| subject us to higher interest expense (the majority of our debt is floating rate , if interest rates rise and we do not or are otherwise unable to convert debt to fixed rates through refinancing or the use of derivative instruments, we may be subject to higher interest rates in the future) ; |
| · |
| limit our flexibility in planning for, or reacting to, changes in our business and the industry in which we operate; |
| · |
| place us at a competitive disadvantage compared to our competitors that have less debt; |
| · |
| limit our ability to pursue acquisitions or sell assets; and |
| · |
| limit our ability to borrow additional funds. |
Any of these events could have a material adverse effect on us. In addition, our debt agreements contain restrictive financial and operational covenants. Significant restrictive covenants include limitations on, among other things, our ability under certain circumstances to:
| · |
| incur additional debt, including guarantees; |
| · |
| grant certain types of liens; |
| · |
| sell or otherwise dispose of assets; |
| · |
| engage in mergers, acquisitions or consolidations; |
| · |
| pay dividends on our common stock; |
| · |
| repurchase our common stock; |
| · |
| enter into substantial new lines of business; and |
| · |
| enter into certain types of transactions with our affiliates. |
Our failure to comply with these and other restrictive covenants could result in an event of default, which if not cured or waived, could have a material adverse effect on us.
27
Table of Contents
We rely on central Global Enterprise Resource Planning ("ERP") systems and other peripheral information systems. Obsolescence or interruptions in the operation of our computerized systems or other information technologies could have a material adverse effect on our operations and profitability.
We now conduct most of our businesses using a single ERP system. Our operations are largely dependent on this system. We continuously make adjustments to improve the effectiveness of the ERP and other peripheral information systems, including the installation of significant new subsystems. During fiscal year 2014, our Healthcare / Home Environment segment converted from its legacy ERP system onto our global ERP system. We are constantly upgrading and adding functionality to the overall system with key enhancements currently underway in various functional areas. Testing of any new subsystems before active deployment often requires significant additional effort across much of our organization. Complications or delays in completing these projects could cause considerable disruptions to our business and may result in higher implementation costs than planned, along with a concurrent reallocation of human resources.
Any failures or disruptions in the ERP and other information systems or any complications resulting from ongoing adjustments to our systems could cause interruption or loss of data in our information or logistical systems that could materially impact our ability to procure products from our factories and suppliers, transport them to our distribution centers, and store and deliver them to our customers on time and in the correct amounts. In addition, natural disasters or other extraordinary events may disrupt our information systems and other infrastructure, and our data recovery processes may not be sufficient to protect against loss. Furthermore, application program bugs, system conflict crashes, user error, data integrity issues, customer data conflicts, and integration issues all pose significant risks.
We rely on certain outside vendors to assist us with the upgrade of our software, the ongoing implementation of new enhancements to our information systems and the maintenance of some of our information technology infrastructure. Should any of these vendors fail to perform as expected, it could adversely affect our service levels and restrict our ability to conduct business.
Information security breaches and any related operational interruptions could have a material adverse effect on our operations and profitability.
Information systems require constant updates to their security policies and hardware systems to reduce the risk of unauthorized access, malicious destruction of data or information theft. We rely on commercially available systems, software, tools, and monitoring to provide security for processing, transmission and storage of confidential information. Improper activities by third parties, advances in computer and software capabilities and encryption technology, new tools and discoveries and other events or developments may facilitate or result in a compromise or breach of our computer systems, some of which may go undetected for extended periods.
Any such compromise or breach could cause interruptions in our operations, cause damage to our reputation and might require us to spend significant management time and money investigating the event and dealing with local and federal law enforcement. In addition, we could become the subject of litigation and various claims from our customers, employees, suppliers, service providers, and shareholders. Regardless of the merits and ultimate outcome of these matters, litigation and proceedings of this type are expensive to respond to and defend, and we could be forced to devote substantial resources and time responding to and defending them, which could have a material adverse effect on our business, financial condition and results of operations.
28
Table of Contents
The products, business practices and manufacturing activities of the Nutritional Supplements segment are subject to extensive government regulations and could be subject to additional laws and regulations in the future.
The addition of the Nutritional Supplements segment brings with it requirements to comply with an extensive new body of regulations by national, state and provincial governmental authorities including regulations issued in the United States by the FDA , the FTC , the Consumer Products Safety Commission and the United Stated Department of Agriculture. These regulations, and their evolving nature can from time-to-time require us to reformulate products for specific markets, conform product labeling to market regulations and register or qualify products or obtain necessary approvals with the applicable governmental authorities in order to market products in these markets. Failure to comply with the regulatory requirements of these various governmental agencies and authorities could result in enforcement actions including: cease and desist orders, injunctions, limits on advertising, consumer redress, divestitures of assets, rescission of contracts, or such other relief as may be deemed necessary. Violation of these regulations could result in substantial financial or other penalties. Any action against us could materially affect our ability to successfully market not only the affected products, but other products as well.
In the future, we may be subject to additional laws or regulations administered by the FDA or other federal, state, local or regulatory authorities, the repeal or amendment of laws or regulations which we consider favorable and/or more stringent interpretations of current laws or regulations. We can neither predict the nature of such future laws, regulations, interpretations or applications, nor what effect additional governmental regulations or administrative orders, when and if promulgated, would have on our business. However, they could require reformulation of certain products to meet new standards, recall or discontinuance of certain products not able to be reformulated, imposition of additional record-keeping requirements, expanded documentation of the properties of certain products, expanded or altered labeling and/or scientific substantiation. Any or all such requirements could increase our costs of operating the Nutritional Supplements segment, and which could have a material adverse effect on our business, reputation, financial condition, or results of operations.
Audits and related disputes with taxing authorities could have an adverse impact on our business.
We are involved in tax audits and related disputes in various taxing jurisdictions. Recent acquisitions have added considerable complexity to our tax structure, and some have added the risk of liability for past activities under prior ownership. We believe that we have complied with all applicable reporting and tax payment obligations. However, in the past we have sometimes disagreed with taxing authority positions on various issues. Historically, we have vigorously defended our tax positions through available administrative and judicial avenues. Based on currently available information, we have established reserves for our best estimate of the probable tax liabilities. Future actions by taxing authorities may result in tax liabilities that are significantly higher or lower than the reserves established, which could have a material effect on our consolidated results of operations or cash flows. For more information about tax audits and related disputes, see Note (11) to the accompanying consolidated financial statements.
Potential changes in laws, including tax laws, and the costs and complexities of compliance with such laws could have an adverse impact on our business.
The impact of future legislation in the U.S. or abroad, including such things as employment and health insurance laws, climate change related legislation, tax legislation, regulations or treaties is always uncertain. Federal and local legislative agenda s from time to time contain numerous propos als dealing with taxes, financial regulation, energy policy, environmental policy, transportation policy and infrastructure policy, among others that , if enacted into law , could increase our costs of doing business.
Under current tax law, favorable tax treatment of our non- U.S. net income is dependent on our ability to avoid classification as a Controlled Foreign Corporation. Changes in the composition of our stock ownership could have an impact on our classification. If our classification were to change, it could have a material adverse effect on the largest U.S. shareholders and, in turn, on the Company's business.
A non-U.S. corporation, such as ours, will constitute a "controlled foreign corporation" or "CFC" for U.S. federal income tax purposes if its largest U.S. shareholders (i.e., those owning 10 percent or more of its shares) together own more than 50 percent of the stock outstanding. If the IRS or a court determined that we were a CFC, then each of our U.S.
29
Table of Contents
shareholders who own (directly, indirectly, or constructively) 10 percent or more of the total combined voting power of all classes of our stock on the last day of our taxable year would be required to include in gross income for U.S. federal income tax purposes its pro rata share of our "subpart F income" (and the subpart F income of any of our subsidiaries determined to be a CFC) for the period during which we (and our non-U.S. subsidiaries) were a CFC. In addition, any gain on the sale of our shares realized by such a shareholder may be treated as ordinary income to the extent of the shareholder's proportionate share of our and our CFC subsidiaries' undistributed earnings and profits accumulated during the shareholder's holding period of the shares while we were deemed to be a CFC.
30
Table of Contents
ITEM 1B
. UNRESOLVED STAFF COMMENTS
None.
31
Table of Contents
ITEM 2
. PROPERTIES
The Company owns, leases or otherwise utilizes through third-party management service agreements, a total of 46 properties worldwide , which include selling, procurement, research and development, administrative, distribution facilities and land held for expansion . All properties operated by the Company are adequate for the ir intended purpose . Summarized information regarding the location, number, type and use, segment, ownership and approximate size of our principal and other properties as of February 28 , 2015 is provided in the table below:
|
|
|
|
|
|
|
Location |
| Type and Use |
| Business Segment |
| Approximate Size (Square Feet or Acres) |
Owned Properties |
|
|
|
|
|
|
El Paso, Texas, USA |
| Land & Building - U.S. Headquarters |
| All Segments |
| 135,000 |
El Paso, Texas, USA |
| Land - Held for Future Expansion |
| All Segments |
| 4 Acres |
El Paso, Texas, USA |
| Land & Building - Distribution Facility |
| Housewares, Healthcare / Home Environment & Personal Care |
| 408,000 |
Olive Branch, Mississippi, USA |
| Land & Building - Distribution Facility |
| Healthcare / Home Environment & Personal Care |
| 1,300,000 |
Southaven, Mississippi, USA |
| Land & Building - Distribution Facility |
| Housewares & Personal Care |
| 1,200,000 |
Southaven, Mississippi, USA |
| Land - Held for Future Expansion |
| All Segments |
| 31 Acres |
Sheffield, England |
| Land & Building - Office Space |
| Housewares, Healthcare / Home Environment & Personal Care |
| 10,000 |
Mexico City, Mexico |
| Office Space - Latin American Headquarters |
| Healthcare / Home Environment & Personal Care |
| 3,900 |
|
|
|
|
|
|
|
Leased Properties |
|
|
|
|
|
|
3 - Facilities Worldwide |
| Office Space |
| Housewares |
| 32,150 |
1 - Facility, Hong Kong, China |
| Distribution Facility |
| Housewares |
| 3,500 |
7 - Facilities Worldwide |
| Office Space |
| Healthcare / Home Environment |
| 61,800 |
2 - Facilities Worldwide |
| Distribution Facilities |
| Healthcare / Home Environment |
| 49,600 |
1 - Facility, Bethesda, Maryland, USA |
| Office Space |
| Nutritional Supplements |
| 32,000 |
3 - Facilities, USA |
| Call Centers and Distribution Facilities |
| Nutritional Supplements |
| 67,000 |
7 - Facilities Worldwide |
| Office Space |
| Personal Care |
| 26,600 |
7 - Facilities Worldwide |
| Distribution Facilities |
| Personal Care |
| 141,850 |
1 - Facility, Darwen, England |
| Distribution Facility |
| Housewares & Personal Care |
| 100,000 |
2 - Facilities Worldwide |
| Office Space |
| Healthcare / Home Environment & Personal Care |
| 5,600 |
1 - Facility, Lausanne, Switzerland |
| Office Space - EMEA Headquarters |
| Housewares, Healthcare / Home Environment & Personal Care |
| 8,150 |
3 - Facilities in China |
| Office Space - Supply Chain Operations |
| Housewares, Healthcare / Home Environment & Personal Care |
| 33,350 |
1 - Facility, Genk, Belgium |
| Distribution Facility |
| Housewares, Healthcare / Home Environment & Personal Care |
| 178,000 |
32
Table of Contents
ITEM 3.
LEGAL
PROCEEDINGS
We are involved in various legal claims and proceedings in the normal course of operations. In the opinion of management, the outcome of these matters will not have a material adverse effect on our consolidated financial position, results of operations or liquidity.
33
Table of Contents
ITEM 4
. MINE SAFETY DISCLOSURES
Not applicable.
34
Table of Contents
PART I
I
ITEM 5. MARKET FOR REGISTRANT'S COMMON EQUITY, RELATED SHAREHOLDER MATTERS AND ISSUER PURCHASES OF EQUITY SECURITIES
PRICE RANGE OF COMMON STOCK
Our common stock is listed on the NASDAQ Global Select Market ("NASDAQ") [symbol: HELE]. The following table sets forth, for the periods indicated, in dollars per share, the high and low sales prices of the common stock as reported on the NASDAQ. These quotations reflect the inter-dealer prices, without retail markup, markdown or commission and may not necessarily represent actual transactions.
|
|
|
|
|
|
|
|
|
| High |
| Low |
| ||
FISCAL YEAR 2015 |
|
|
|
|
|
|
|
First quarter |
| $ | 70.23 |
| $ | 57.48 |
|
Second quarter |
|
| 62.55 |
|
| 53.17 |
|
Third quarter |
|
| 65.65 |
|
| 51.80 |
|
Fourth quarter |
|
| 79.90 |
|
| 60.79 |
|
|
|
|
|
|
|
|
|
FISCAL YEAR 2014 |
|
|
|
|
|
|
|
First quarter |
| $ | 40.31 |
| $ | 33.35 |
|
Second quarter |
|
| 44.49 |
|
| 37.36 |
|
Third quarter |
|
| 49.11 |
|
| 39.88 |
|
Fourth quarter |
|
| 65.94 |
|
| 46.76 |
|
APPROXIMATE NUMBER OF EQUITY SECURITY HOLDERS OF RECORD
Our common stock is our only class of equity security outstanding at February 28, 2015. As of April 20, 2015, there were 182 holders of record of the Company's common stock. A substantially greater number of holders of the Company's common stock are "street name" or beneficial holders whose shares are held of record by banks, brokers and other financial institutions.
CASH DIVIDENDS
Our current policy is to retain earnings to provide funds for the operation and expansion of our business, common stock repurchases and for potential acquisitions. We have not paid any cash dividends on our common stock since inception. Any change in dividend policy will depend upon future conditions, including earnings and financial condition, general business conditions, any applicable contractual limitations, and other factors deemed relevant by our Board of Directors. Generally, our Credit Agreement limits our ability to declare or pay cash dividends to our shareholders if, (1) the Leverage Ratio (as defined in the Credit Agreement ) on a pro forma basis is greater than (a) 3.00 to 1.00 if any of our 3.90% Senior Notes due January 2018 are outstanding and (b) 3.25 to 1.00 if our 3.90% Senior Notes are not outstanding or the maximum leverage ratio permitted under agreements relating to our 3.90% Senior Notes is increased to 3.50 to 1.00 and (2) unrestricted cash, cash equivalents and availability for borrowings under the Credit Agreement is less than $25 million.
ISSUER PURCHASES OF EQUITY SECURITIES
On February 6, 2014, our Board of Directors approved a resolution to repurchase $550 million of the Company's outstanding common stock in keeping with its stated intention to return to shareholders excess capital not otherwise deployed for strategic acquisitions. This resolution superseded the previous resolution in place, which allowed the purchase of up to 2,907,637 shares of common stock as of February 6, 2014. On February 10, 2014, as part of the $550 million repurchase program, the Company announced the commencement of a modified "Dutch auction" tender offer (the "tender offer") to repurchase up to $300 million of its common stock at a price not greater than $66.50 per share nor less
35
Table of Contents
than $57.75 per share. The tender offer expired March 10, 2014, resulting in the Company accepting for payment 3,693,816 shares of common stock properly tendered for an aggregate purchase price of approximately $245.64 million.
Subsequent repurchases may include open market purchases, privately negotiated transactions, block trades, accelerated stock repurchase transactions, or any combination of such methods. The number of shares purchased and the timing of the purchases will depend on a number of factors, including share price, trading volume and general market conditions, working capital requirements, general business conditions, financial conditions, any applicable contractual limitations and other factors, including alternative investment opportunities.
Our current equity compensation plans include provisions that allow for the "net exercise" of stock options by all plan participants. In a net exercise, any required payroll taxes, federal withholding taxes and exercise price of the shares due from option or other share-based award holders can be paid for by having the holder tender back to the Company a number of shares at fair value equal to the amounts due. Net exercises are accounted for by the Company as a purchase and retirement of shares. For the periods covered in the accompanying consolidated financial statements, open market repurchase activity and common stock option exercises resulted in the following share repurchases:
SHARE REPURCHASES
|
|
|
|
|
|
|
|
|
|
|
| Fiscal Years Ended the Last Day of February, | |||||||
|
| 2015 |
| 2014 |
| 2013 | |||
Common stock repurchased on the open market or through tender offer |
|
|
|
|
|
|
|
|
|
Number of shares |
|
| 4,102,143 |
|
| 33,862 |
|
| 61,426 |
Aggregate market value of shares (in thousands) |
| $ | 273,599 |
| $ | 1,311 |
| $ | 1,759 |
Average price per share |
| $ | 66.70 |
| $ | 38.71 |
| $ | 28.64 |
|
|
|
|
|
|
|
|
|
|
Common stock received in connection with share-based compensation |
|
|
|
|
|
|
|
|
|
Number of shares |
|
| 71,950 |
|
| 112,677 |
|
| 49,126 |
Aggregate market value of shares (in thousands) |
| $ | 4,826 |
| $ | 6,937 |
| $ | 1,627 |
Average price per share |
| $ | 67.08 |
| $ | 61.57 |
| $ | 33.12 |
The following schedule sets forth the purchase activity for each month during the three months ended February 28 , 2015:
ISSUER PURCHASES OF EQUITY SECURITIES FOR THE THREE MONTHS ENDED FEBRUARY 28, 2015
|
|
|
|
|
|
|
|
|
|
|
|
|
Period |
|
| Total Number of Shares Purchased |
| Average Price Paid per Share |
| Total Number of Shares Purchased as Part of Publicly Announced Plans or Programs |
|
| Dollar Value of Shares that May Yet be Purchased Under the Plans or Programs (in thousands) | ||
December 1 through December 31, 2014 |
|
| - |
| $ | - |
|
| - |
| $ | 265,428 |
January 1 through January 31, 2015 |
|
| 1,871 |
|
| 74.64 |
|
| 1,871 |
|
| 265,288 |
February 1 through February 28, 2015 |
|
| - |
|
| - |
|
| - |
|
| 265,288 |
Total |
|
| 1,871 |
| $ | 74.64 |
|
| 1,871 |
|
|
|
36
Table of Contents
PERFORMANCE GRAPH
The graph below compares the cumulative total return of our Company to the NASDAQ Market Index and a Peer Group Index, assuming $100 was invested on March 1, 2010. The Peer Group Index is the Dow Jones– U.S. Personal Products, Broad Market Cap, Yearly, and Total Return Index. The comparisons in this table are required by the SEC and are not intended to forecast or be indicative of the possible future performance of our common stock.
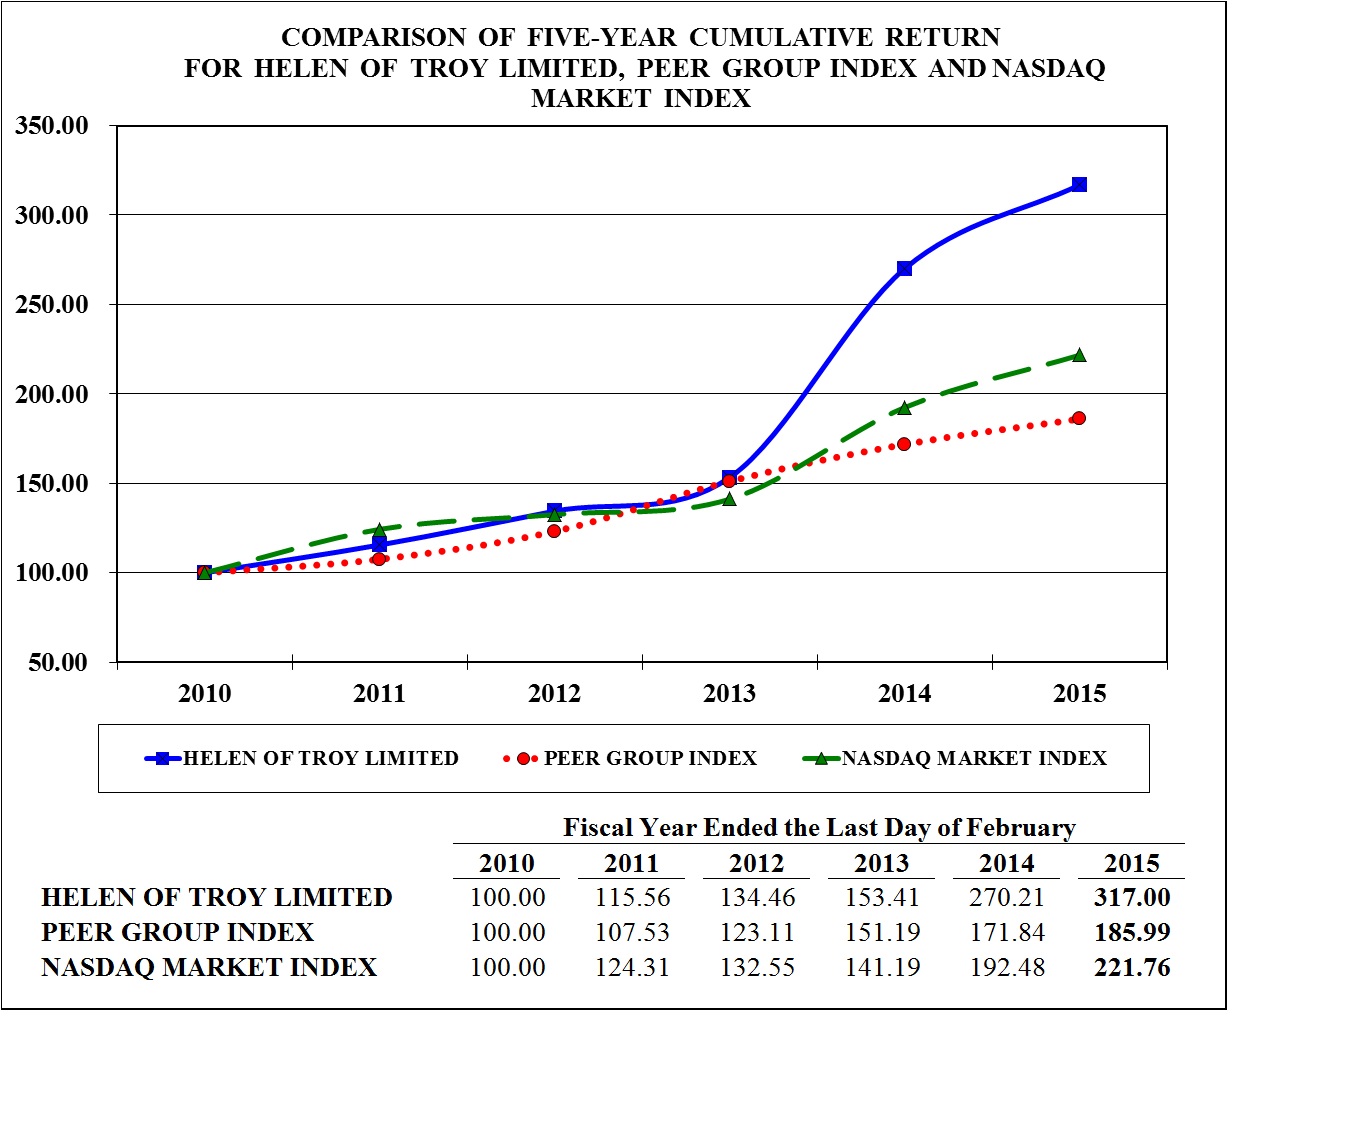
The Performance Graph shall not be deemed to be "soliciting material" or to be "filed" with the SEC or subject to the liabilities of Section 18 under the Exchange Act. In addition, it shall not be deemed incorporated by reference by any statement that incorporates this annual report on Form 10-K by reference into any filing under the Securities Act of 1933 or the Exchange Act, except to the extent that we specifically incorporate this information by reference.
37
Table of Contents
ITEM 6. SELECTED
FINANCIAL DATA
The selected consolidated statements of income and cash flow data for the years ended on the last day of February 2015, 2014 and 2013, and the selected consolidated balance sheet data as of the last day of February 2015 and 2014, have been derived from our audited consolidated financial statements included in this report. The selected consolidated statements of income and cash flow data for the years ended on the last day of February 2012 and 2011, and the selected consolidated balance sheet data as of the last day of February 2013, 2012 and 2011, have been derived from our audited consolidated financial statements, which are not included in this report. This information should be read together with the discussion in "Management's Discussion and Analysis of Financial Condition and Results of Operations" and our consolidated financial statements and notes to those statements included in this report. All currency amounts are denominated in U.S. Dollars.
Years Ended the Last Day of February,
(in thousands, except per share data)
|
|
|
|
|
|
|
|
|
|
|
|
|
|
|
|
|
| 2015(1) |
| 2014 |
| 2013(2) |
| 2012 (2) (3) (4) |
| 2011 (3) (4) | |||||
Income Statement Data: |
|
|
|
|
|
|
|
|
|
|
|
|
|
|
|
Sales revenue, net |
| $ | 1,445,131 |
| $ | 1,317,153 |
| $ | 1,288,263 |
| $ | 1,181,676 |
| $ | 777,043 |
Gross profit |
|
| 599,559 |
|
| 516,703 |
|
| 518,211 |
|
| 478,484 |
|
| 349,246 |
Asset impairment charges |
|
| 9,000 |
|
| 12,049 |
|
| - |
|
| - |
|
| 2,161 |
Operating income |
|
| 161,719 |
|
| 117,100 |
|
| 148,773 |
|
| 139,386 |
|
| 111,744 |
Interest expense |
|
| 15,022 |
|
| 10,193 |
|
| 13,345 |
|
| 12,917 |
|
| 9,693 |
Income tax expense |
|
| 16,050 |
|
| 20,886 |
|
| 19,848 |
|
| 15,718 |
|
| 9,323 |
Net income |
|
| 131,164 |
|
| 86,248 |
|
| 115,666 |
|
| 110,374 |
|
| 93,305 |
|
|
|
|
|
|
|
|
|
|
|
|
|
|
|
|
Earnings per share - basic |
| $ | 4.59 |
| $ | 2.69 |
| $ | 3.64 |
| $ | 3.52 |
| $ | 3.04 |
Earnings per share - diluted |
| $ | 4.52 |
| $ | 2.66 |
| $ | 3.62 |
| $ | 3.48 |
| $ | 2.98 |
|
|
|
|
|
|
|
|
|
|
|
|
|
|
|
|
Weighted average shares outstanding - basic |
|
| 28,579 |
|
| 32,007 |
|
| 31,754 |
|
| 31,340 |
|
| 30,669 |
Weighted average shares outstanding - diluted |
|
| 29,035 |
|
| 32,386 |
|
| 31,936 |
|
| 31,705 |
|
| 31,355 |
|
|
|
|
|
|
|
|
|
|
|
|
|
|
|
|
Cash Flow Data: |
|
|
|
|
|
|
|
|
|
|
|
|
|
|
|
Depreciation and amortization |
| $ | 39,653 |
| $ | 33,839 |
| $ | 34,425 |
| $ | 30,178 |
| $ | 18,502 |
Net cash provided by operating activities |
|
| 178,603 |
|
| 154,165 |
|
| 87,558 |
|
| 103,880 |
|
| 87,430 |
Capital and intangible asset expenditures |
|
| 6,521 |
|
| 40,463 |
|
| 14,688 |
|
| 16,051 |
|
| 4,629 |
Payments to acquire businesses, net of cash received |
|
| 195,943 |
|
| - |
|
| - |
|
| 160,000 |
|
| 336,240 |
Net amounts borrowed (repaid) |
|
| 240,600 |
|
| (64,393) |
|
| (92,100) |
|
| 47,100 |
|
| 168,000 |
Last Day of February,
(in thousands)
|
|
|
|
|
|
|
|
|
|
|
|
|
|
|
|
|
| 2015(1) |
| 2014 |
| 2013 |
| 2012 (2) |
| 2011 (3)(4) | |||||
Balance Sheet Data: |
|
|
|
|
|
|
|
|
|
|
|
|
|
|
|
Working capital |
| $ | 302,895 |
| $ | 286,122 |
| $ | 236,540 |
| $ | 109,647 |
| $ | 121,510 |
Goodwill and other intangible assets |
|
| 948,157 |
|
| 775,550 |
|
| 808,869 |
|
| 829,500 |
|
| 660,947 |
Total assets |
|
| 1,653,755 |
|
| 1,533,302 |
|
| 1,474,004 |
|
| 1,435,723 |
|
| 1,240,524 |
Long-term debt |
|
| 411,307 |
|
| 95,707 |
|
| 155,000 |
|
| 175,000 |
|
| 178,000 |
Stockholders' equity (5) |
|
| 904,565 |
|
| 1,029,487 |
|
| 926,606 |
|
| 796,729 |
|
| 685,549 |
Cash dividends |
|
| - |
|
| - |
|
| - |
|
| - |
|
| - |
| (1) |
| Fiscal year 2015 includes eight months of operating results for the Nutritional Supplements segment formed when we acquired Healthy Directions on June 30, 2014 for a net cash purchase price of $195.94 million. The acquisition was funded from borrowings under our Credit Agreement and cash on hand. In connection with the acquisition, we initially recorded ($12.09) in net working capital, $5.96 million of property and equipment, $204.61 million of goodwill and other intangible assets, and $2.54 million of other long-term liabilities. See Notes (6), (11) and (20) to
38 |
Table of Contents
our accompanying consolidated financial statements for more information regarding the Healthy Directions acquisition. |
| (2) |
| Fiscal year 2012 includes two months of operating results from PUR and fiscal year 2013 and thereafter includes a full year's operating results. We acquired PUR on December 30, 2011 for a net cash purchase price of $160 million. The acquisition of PUR was funded with $160 million in short-term debt. In connection with the acquisition, we initially recorded $12.50 million of property and equipment, $1.43 million in supplier advances, $178 million of goodwill and other intangible assets, and $31.93 millio n of deferred tax liabilities. |
| (3) |
| Fiscal year 2011 includes two months of operating results from Kaz and fiscal year 2012 and thereafter includes a full year's operating results. We acquired Kaz on December 31, 2010 for a net cash purchase price of $271.50 million subject to certain later adjustments. The acquisition was funded with $77.50 million of cash and $194 million in short- and long-term debt. In connection with the acquisition, we initially recorded $31.45 million of net working capital, $4.08 million of property and equipment, $246.25 million of goodwill and other intangible assets, $12.38 million in deferred tax assets, $3.10 million in other assets, $24.30 million in deferred tax liabilities, and $1.45 million in liabilities for uncertain tax positions. |
| (4) |
| Fiscal year 2011 includes eleven months of operating results from the Pert Plus hair care and Sure antiperspirant and deodorant brands and fiscal year 2012 and thereafter includes a full year's operating results. We acquired Pert Plus and Sure on March 31, 2010 for a net cash purchase price of $69 million including the assumption of certain liabilities. The acquisition was funded with cash. In connection with the acquisition, we recorded $4.90 million of net working capital, $0.73 million of fixed assets, and $63.37 million of goodwill, trademarks and other intangible assets. |
| (5) |
| For the fiscal years ended 2015, 2014, 2013, 2012, and 2011, we repurchased and retired 4,1 74,093 , 146,539, 110,552, 1,124,563, and 87,733 shares of common stock at a total purchase price of $27 8.42 , $8.25, $3.39, $40.05, and $2.03 million, respectively. |
39
Table of Contents
ITEM 7
. MANAGEMENT'S DISCUSSION AND ANALYSIS OF FINANCIAL CONDITION AND RESULTS OF OPERATIONS
This Management's Discussion and Analysis of Financial Condition and Results of Operations ("MD&A") should be read in conjunction with the other sections of this report, including Part I, Item 1., "Business"; Part II, Item 6., "Selected Financial Data"; and Part II, Item 8., "Financial Statements and Supplementary Data." The various sections of this MD&A contain a number of forward-looking statements, all of which are based on our current expectations. Actual results may differ materially due to a number of factors, including those discussed on page 3 of this report in the section entitled " Information Regarding Forward-Looking Statements," in Item 1A., "Risk Factors," and in Item 7A., "Quantitative and Qualitative Disclosures A bout Market Risk."
Throughout MD&A, we refer to certain measures used by management to evaluate financial performance. We also may refer to a number of financial measures that are not defined under GAAP, but have corresponding GAAP-based measures. Where non-GAAP measures appear, we provide tables reconciling these to their corresponding GAAP-based measures and refer to a discussion of their use. We believe these measures provide investors with important information that is useful in understanding our business results and trends. Please see "Explanation of Certain Terms and Measures Used in MD&A" beginning on page 67 for more information on the use and calculation of certain financial measures.
OVERVIEW
We operate our business under four segments: Housewares, Healthcare / Home Environment, Nutritional Supplements, and Personal Care. Our Housewares segment reports the operations of OXO, whose product offerings include food preparation tools, gadgets and storage containers, cleaning, organization, and baby and toddler care products. The Healthcare / Home Environment segment sells products in the following categories: health care devices, such as thermometers, humidifiers, blood pressure monitors, and heating pads; water filtration systems; and small home appliances such as portable heaters, fans, air purifiers, and insect control devices. Our Nutritional Supplements segment , formed following our acquisition of Healthy Directions , LLC and its subsidiaries ("Healthy Directions") on June 30, 201 4 , is a leading provider of premium branded vitamins, minerals and supplements, as well as other health products sold directly to consumers. Our Personal Care segment currently offers products in three categories: electric hair care, beauty care and wellness appliances; grooming tools and hair accessories ; and liquid-, solid- and powder-based personal care and grooming products.
The Nutritional Supplements segment sells directly to consumers. Our other segments sell their products primarily through mass merchandisers, drugstore chains, warehouse clubs, catalogs, grocery stores and specialty stores. In addition, the Personal Care segment sells extensively through beauty supply retailers and wholesalers, and the Healthcare / Home Environment segment sells certain of its product lines through medical distributors and other products through home improvement stores.
Our core business is seasonal due to different calendar events, holidays and seasonal weather patterns ; however, the overall sales pattern for our Nutritional Supplements segment is not highly seasonal . Historically, the third fiscal quarter produces the highest net sales revenue and operating income during the fiscal year. Seasonality in fiscal year 2015 was skewed in the latter half of the year by the inclusion of eight months of net sales revenue from Healthy Directions following its acquisition on June 30, 2014.
During the second half of fiscal year 2015 , international sales were dampened by the strengthening of the U.S. Dollar against most currencies, in particular the British Pound, Euro, Canadian Dollar, and Mexican Peso. T hese currencies weakened against the U.S. Dollar by approximately 3 , 10 , 8 , and 7 percent, respectively, when compared to average levels for the second half of f iscal year 2014 .
40
Table of Contents
We believe that the growth in the internet as a sales channel continues to erode market share in the traditional "brick and mortar" channels. For fiscal year 201 5 , sales to our internet-based customers grew approximately 60 percent, compared to fiscal year 2014, and comprised approximately 9.4 and 6.4 percent, respectively, of our total consolidated net sales revenue s for each fiscal year . We believe it will become increasingly important to leverage our domestic distribution capabilities to meet the logistical challenge of higher frequency, smaller order size shipments. We also believe the acquisition of Healthy Directions has brought additional internet and direct-to-consumer expertise to our Company, which we hope will provide us with future operational scale to further develop the internet channel across all our product lines.
Our business depends upon discretionary consumer demand for most of our products and primarily operates within mature and highly developed consumer markets. The principal driver of our operating performance is the strength of the U.S. retail economy, as approximately 79 percent of our fiscal year 2015 net sales revenue was from U.S. shipments. Domestically, we believe that consumers became more relaxed with their discretionary spending in the second half of fiscal year 2015 due to lower gasoline prices, continued low interest rates and improving employment activity, contributing to higher overall net sales revenue in fiscal year 2015 , as compared to the prior fiscal year. Seasonal cough/cold/flu patterns also influence sales for the Healthcare / Home Environment segment. In the United States, the season historically runs from November through March with peak activity normally in January-March. Indications from the U.S. Center for Disease Control (the "CDC") suggest the current season's flu and fever incidence trend s were ahead of the historical averages through March 2015 . The prior year flu season was slightly below historical averages. Many of our new product launches in thermometry and humidification benefited at point-of-sale from the higher flu and fever incidence .
We believe that the recent trend of improving domestic macroeconomic fundamentals should continue to bolster the retail environment throughout the remainder of calendar year 201 5 . International operations still remain more tentative in their outlook as these operations, particularly those in Latin America and Europe, serve consumers in more inconsistently recovering economies that are more susceptible to fiscal and geo-political instabilities. We are also implementing a number of initiatives, including significant management an d organizational changes, which are designed to stabilize our Personal Care segment and provide a foundation for future expansion.
41
Table of Contents
Significant Developments during Fiscal Year 2015
| · |
| In March 2014, we completed a modified "Dutch auction" tender offer resulting in the repurchase of 3,693,816 shares of our outstanding common stock at a total cost of $247.83 million, including tender offer transaction-related costs. The cost of the tender offer and related costs were paid with cash on hand and borrowings under our Credit Agreement (as described below). During the fiscal quarter ended May 31, 2014, we repurchased an additional 408,327 shares of outstanding common stock on the open market at a total cost of $25.77 million, primarily funded with borrowings under our Credit Agreement. |
| · |
| Early in the fiscal quarter ended May 31, 2014, we completed the transition of our domestic Personal Care segment appliance distribution operation to our new 1.3 million square foot facility in Olive Branch, Mississippi. The segment shares the facility with our Healthcare / Home Environment segment. The shipping and handling characteristics of both segments' products are similar and we are working to achieve additional operating efficiencies over the long-term with both distribution operations located in one facility. |
| · |
| On June 30, 2014, we completed the acquisition of Healthy Directions , a U.S. direct-to-consumer market leader in premium doctor-branded vitamins, minerals and supplements , for a total cash purchase price of $195.94 million. The sellers were certain funds controlled by American Securities, LLC and ACI Capital Co., LLC. Significant assets acquired include inventory, property and equipment, customer relationships, brand assets, and goodwill. The acquisition generated incremental net sales of over $100 million and diluted earnings per share of $0.12 for the eight months included in the fiscal year 2015 results. |
| · |
| We entered into a strategic licensing agreement with The Cookware Company ("TCC") to bring to market high quality cookware under the OXO Good Grips brand name. The licensing agreement extends OXO's brand into a new housewares category. Under the arrangement, TCC has collaborated with OXO to develop three initial collections using an innovative new "smart shapes" concept built with premium materials consisting of two lines of hard anodized aluminum cookware and one line of stainless steel cookware. These will be marketed by TCC into OXO's normal channels of distribution. TCC began i nitial shipments of the new line during the third quarter of fiscal year 2015. |
| · |
| On October 24, 2014, we amended the terms of our trademark licensing agreement with Honeywell International Inc. to relinquish the rights to market Honeywell branded portable air purifiers after December 31, 2015 in twelve selected developing countries, including China. In exchange for the amendment, we received a one-time cash payment of $7 million ($6.98 million after tax), which was recorded as a gain in selling, general and administrative expense ("SG&A") . We plan to market portable air purifiers in the relinquished markets under non-Honeywell branded trademarks and retained the rights to market Honeywell portable air purifiers in all other countries subject to the previous agreement, including the United States, Canada and all European countries. For categories such as portable fans, portable heaters and portable humidifiers, we remain the Honeywell global licensee under the same material terms as our previous agreement. |
| · |
| Effective January 1 , 2015, we amende d our long-standing license arrangement with Revlon in Personal Care a ppliances to include key markets in Western Europe, including the United Kingdom, France, Germany and Italy, among others. This will provide new opportunities for growth in our largest regional market outside the U.S . |
| · |
| On January 16, 2015, we amended and restated our c redit a greement with Bank of America, N.A. and other lenders ( the " Credit Agreement"). The Credit Agreement , among other things, increased the unsecured revolving commitment from $570 million to $650 million, reduced borrowing costs, and eased the limitations o f certain covenants . For further information regarding the Credit Agreement, see "Management's Discussion and Analysis of Financial Condition and Results of Operations-Financial Condition, Liquidity and Capital Resources." |
Financial Recap of Fiscal Year 2015
| · |
| Consolidated net sales revenue increased 9.7 percent, or $127.98 million, to $1,445.13 million in fiscal year 2015 compared to $1,317.15 million in fiscal year 2014 . Net sales revenue growth from a cquisitions was $100.40 million , or 7.6 percentage points. Core business net sales revenue growth was $27.58 million , or 2.1 percentage points. Net
42 |
Table of Contents
sales revenue in our Housewares segment increased $21.77 million or 7.9 percent in fiscal year 2015 compared to fiscal year 2014 . Net sales revenue in our Healthcare / Home Environment segment increased $45.18 million , or 8.0 percent , in fiscal year 2015 compared to fiscal year 2014 . Net sales revenue in our Personal Care segment decreased $39.37 million , or 8.3 percent , in fiscal year 2015 compared to fiscal year 2014 . Our fiscal year 2015 net sales revenue includes the unfavorable impact of net foreign exchange fluctuations of $7.50 million compared to fiscal year 2014 , most of which impacted the Personal Care and Healthcare / Home Environment segments. The impact of foreign exchange fluctuation s reduced our fiscal year 2015 core business growth rate by 0.6 percentage points. |
| · |
| Consolidated gross profit margin as a percentage of net sales revenue increased 2.3 percentage points to 41.5 percent in fiscal year 2015 compared to 39.2 percent in fiscal year 2014 . |
| · |
| Our SG&A ratio increased 0.3 percentage points to 29.7 percent in fiscal year 2015 compared to 29.4 percent in fiscal year 2014 . |
| · |
| Operating income as a percentage of net sales increased 2.3 percentage points to 11.2 percent in fiscal year 2015 compared to 8.9 percent in fiscal year 2014 . Operating income for fiscal year 2015 included a non-cash intangible asset impairment charge of $9.00 million compared to $12.05 million in fiscal year 2014 . Fiscal year 2014 operating income also included pre -tax CEO succession costs of $18.23 million, for which there were no comparable charges in fiscal year 2015 . |
| · |
| Adjusted operating income (excluding non ‐ cash asset impairment charges, CEO succession costs, acquisition ‐ related expenses, amortization of intangible assets, and non ‐ cash share ‐ based compensation, as applicable) as a percentage of net sales increased 0.3 percentage points to 14.2 percent in fiscal year 2015 compared to 13.9 percent in fiscal year 2014. |
| · |
| Income tax expense was $16.05 million, or 10.9 percent of income before taxes , in fiscal year 2015 compared to $20.89 million, or 19.5 percent of income before taxes , in fiscal year 2014 . |
| · |
| Our net income was $131.16 million in fiscal year 2015 compared to net income of $86.25 million in fiscal year 2014 . Diluted EPS was $4.52 in fiscal year 2015 compared to $2.66 in fiscal year 2014 . |
| · |
| Adjusted income (excluding non ‐ cash asset impairment charges, CEO succession costs, acquisition ‐ related expenses, amortization of intangible assets and non ‐ cash share ‐ based compensation, as applicable) was $169.92 million for fiscal year 2015 , compared to $145.77 million for fiscal year 2014 . |
| · |
| Adjusted diluted EPS (excluding non ‐ cash asset impairment charges, CEO succession costs, acquisition ‐ related expenses, amortization of intangible assets, and non ‐ cash share ‐ based compensation, as applicable) was $5.84 in fiscal year 2015 compared to $4.50 in fiscal year 2014 . |
| · |
| SG&A, operating income, adjusted operating income, net income and adjusted income for fiscal year 2015 include a $7 million gain ($6.98 million after tax) from the amendment of a trademark license agreement with Honeywell International Inc. This gain had a $0.24 impact on diluted EPS and adjusted diluted EPS. There was no comparable gain or income in fiscal year 2014. |
The effect of the Healthy Directions acquisition on net sales revenue is discussed on pages 46 and 47 . Adjusted operating income, adjusted income and adjusted diluted EPS are non ‐ GAAP financial measures as contemplated by SEC Regulation G, Rule 100. These measures are discussed further, and reconciled to their applicable GAAP ‐ based measures, on pages 55 and 56 .
43
Table of Contents
RESULTS OF OPERATIONS
The following table sets forth, for the periods indicated, our selected operating data, in U.S. Dollars, as a percentage of net sales revenue, and as a year-over-year percentage change.
SELECTED OPERATING DATA
(in thousands)
|
|
|
|
|
|
|
|
|
|
|
|
|
|
|
|
|
|
|
|
|
|
| Fiscal Years Ended |
|
|
|
|
|
|
|
|
|
|
| |||||||
|
| the Last Day of February, |
| % of Sales Revenue, net (2) |
| % Change |
| |||||||||||||
|
| 2015(1) |
| 2014 |
| 2013 |
| 2015(1) |
| 2014 |
| 2013 |
| 15/14 |
| 14/13 |
| |||
Sales revenue by segment, net |
|
|
|
|
|
|
|
|
|
|
|
|
|
|
|
|
|
|
|
|
Housewares |
| $ | 296,252 |
| $ | 274,478 |
| $ | 259,042 |
| 20.5 | % | 20.8 | % | 20.1 | % | 7.9 | % | 6.0 | % |
Healthcare / Home Environment |
|
| 613,253 |
|
| 568,075 |
|
| 538,666 |
| 42.4 | % | 43.1 | % | 41.8 | % | 8.0 | % | 5.5 | % |
Nutritional Supplements |
|
| 100,395 |
|
| - |
|
| - |
| 6.9 | % | - | % | - | % | * |
| - | % |
Personal Care |
|
| 435,231 |
|
| 474,600 |
|
| 490,555 |
| 30.1 | % | 36.0 | % | 38.1 | % | (8.3) | % | (3.3) | % |
Total sales revenue, net |
|
| 1,445,131 |
|
| 1,317,153 |
|
| 1,288,263 |
| 100.0 | % | 100.0 | % | 100.0 | % | 9.7 | % | 2.2 | % |
Cost of goods sold |
|
| 845,572 |
|
| 800,450 |
|
| 770,052 |
| 58.5 | % | 60.8 | % | 59.8 | % | 5.6 | % | 3.9 | % |
Gross profit |
|
| 599,559 |
|
| 516,703 |
|
| 518,211 |
| 41.5 | % | 39.2 | % | 40.2 | % | 16.0 | % | (0.3) | % |
Selling, general and administrative expense |
|
| 428,840 |
|
| 387,554 |
|
| 369,438 |
| 29.7 | % | 29.4 | % | 28.7 | % | 10.7 | % | 4.9 | % |
Asset impairment charges |
|
| 9,000 |
|
| 12,049 |
|
| - |
| 0.6 | % | 0.9 | % | - | % | (25.3) | % | * | % |
Operating income |
|
| 161,719 |
|
| 117,100 |
|
| 148,773 |
| 11.2 | % | 8.9 | % | 11.5 | % | 38.1 | % | (21.3) | % |
Nonoperating income (expense), net |
|
| 517 |
|
| 227 |
|
| 86 |
| - | % | - | % | - | % | 127.8 | % | 164.0 | % |
Interest expense |
|
| (15,022) |
|
| (10,193) |
|
| (13,345) |
| (1.0) | % | (0.8) | % | (1.0) | % | 47.4 | % | (23.6) | % |
Total other expense |
|
| (14,505) |
|
| (9,966) |
|
| (13,259) |
| (1.0) | % | (0.8) | % | (1.0) | % | 45.5 | % | (24.8) | % |
Income before income taxes |
|
| 147,214 |
|
| 107,134 |
|
| 135,514 |
| 10.2 | % | 8.1 | % | 10.5 | % | 37.4 | % | (20.9) | % |
Income tax expense |
|
| 16,050 |
|
| 20,886 |
|
| 19,848 |
| 1.1 | % | 1.6 | % | 1.5 | % | (23.2) | % | 5.2 | % |
Net income |
| $ | 131,164 |
| $ | 86,248 |
| $ | 115,666 |
| 9.1 | % | 6.5 | % | 9.0 | % | 52.1 | % | (25.4) | % |
* Calculation is not meaningful
| (1) |
| Includes eight months of operations for Healthy Directions, which was acquired on June 30, 2014. |
| (2) |
| Sales revenue percentages by segment are computed as a percentage of the related segment's sales revenue, net to total sales revenue, net. All other percentages are computed as a percentage of total sales revenue, net. |
Consolidated Net Sales Revenue:
Comparison of fiscal year 2015 to fiscal year 2014
Consolidated net sales revenue increased $127.98 million, or 9.7 percentage points, in fiscal year 2015 compared to fiscal year 2014 . Net sales revenue growth from acquisitions was $ 100.40 million , or 7.6 percentage points. Core business net sales revenue growth was $27.58 million , or 2.1 percentage points. The increase in consolidated core business net sales revenue was driven by Housewares and Healthcare / Home Environment segment net sales revenue, which was partially offset by a decline in Personal Care segment net sales revenue. Housewares segment net sales revenue increased $21.77 million, or 7.9 percent, in fiscal year 2015 compared to fiscal year 2014 . Within the segment, year-over-year unit volume increases had a favorable 8.3 percentage point impact on net sales revenue . The unit volume increase was slightly offset by a 0.4 percentage point decline in the average unit selling price, primarily due to slightly higher year-over-year promotional discounts. Healthcare / Home Environment segment net sales revenue increased $45.18 million, or 8.0 percent, in fiscal year 2015 compared to fiscal year 2014 . Within the segment, year-over-year unit volume increases had a favorable impact of 1.5 percentage points and higher average unit selling prices, largely due to a more favorable sales mix, contributed 6.5 percentage points to net sales revenue growth. Personal Care segment net sales revenue decreased $39.37 million, or 8.3 percent, in fiscal year 2015 compared to fiscal year 2014 . Within the segment, year-over-year unit volume declines had an unfavorable 5.6 percentage point impact on net sales revenue, and lower average unit selling prices due to changes in sales mix decreased net sales revenue by 2.7 percentage point s. Our fiscal
44
Table of Contents
year 2015 net sales revenue includes the unfavorable impact of net foreign exchange fluctuations of $7.50 million compared to fiscal year 2014 , most of which impacted our Personal Care and Healthcare / Home Environment segments. The impact of foreign exchange fluctuations reduced our fiscal year 2015 core business growth rate by approximately 0.6 percentage points.
Comparison of fiscal year 2014 to fiscal year 2013
Consolidated net sales revenue increased $28.89 million, or 2.2 percentage points, in fiscal year 2014 compared to fiscal year 2013. All revenue growth was from core business. In the fourth quarter of fiscal year 2014, net sales across all segments was negatively affected by lower store traffic and store closings due to cold winter weather in the U.S., with consolidated net sales revenue down 4.1 percent, c ompared to the same fiscal quarter last year. The increase in consolidated net sales revenue was driven by Housewares and Healthcare / Home Environment segment net sales revenue, partially offset by a decline in Personal Care segment net sales revenue. Housewares segment net sales revenue increased $15.44 million, or 6.0 percent, in fiscal year 2014 compared to fiscal year 2013. Within the segment, year-over-year unit volume increases had a favorable 6.2 percentage point impact on net sales revenue, which was slightly offset by a 0.2 percentage point decline in the average unit selling price, primarily the result of slightly higher year-over-year promotional and other sales discounts. Healthcare / Home Environment segment net sales revenue increased $29.41 million, or 5.5 percent, in fiscal year 2014 compared to fiscal year 2013. Within the segment, year-over-year unit volume increases had a favorable impact of 3.8 percentage points and higher average unit selling prices, largely as a result of more favorable sales mix, contributed 1.7 percentage points to net sales revenue growth. Personal Care segment net sales revenue decreased $15.96 million, or 3.3 percent, in fiscal year 2014 c ompared to fiscal year 2013. Within the segment, year-over-year unit volume declines had an unfavorable 4.4 percentage point impact on net sales revenue, partially offset by higher average unit selling prices, which contributed 1.1 percentage point s of net sales revenue growth . Our fiscal year 2014 net sales revenue includes an unfavorable impact of net foreign exchange fluctuations of $4.63 million compared to fiscal year 2013, most of which impacted our Personal Care and Healthcare / Home Environment segments. The impact of foreign exchange fluctuations reduced our fiscal year 2014 core business growth rate by approximately 0.4 percentage points.
Segment Net Sales Revenue:
Comparison of fiscal year 2015 to fiscal year 2014
Housewares Segment
- Net sales revenue in the Housewares segment for fiscal year 2015 increased $21.77 million, or 7.9 percent, to $296.25 million compared to $274.48 million for the same period last year. Year-over-year unit volume increases had a favorable impact of 8.3 percentage points on net sales revenue. The unit volume increase was slightly offset by a 0.4 percentage point decline in the average unit selling price, despite a better product sales mix and a better channel mix, primarily due to higher year-over-year promotional discounts. Year-over-year international sales grew in the low double digits while domestic sales grew in the mid-to-high single digits. Growth was strong across most channels with the only significant decline occurring in the closeout channel. From a product perspective, OXO had net sales revenue growth through line extensions in our infant and toddler category and gains in the gadgets, bath, cleaning products, barware, baking and measuring categories. OXO tot (our infant and toddler product line) continues to gain traction with consumers, resulting in net sales revenue growth of approximately 30 percent, compared to the same period last year. OXO has increased its product lines to over 800 items and growth continues to be driven by expanded shelf space and assortments at key traditional and internet retailers.
45
Table of Contents
Healthcare / Home Environment Segment
- Net sales revenue in the Healthcare / Home Environment segment for fiscal year 2015 increased $45.18 million, or 8.0 percent, to $613.25 million compared to $568.08 million for the same period last year. Higher unit volume contributed approximately 1.5 percentage points of growth. An increase in average unit selling prices, largely due to a more favorable sales mix, contributed approximately 6.5 percentage points to the increase in net sales revenue. The segment experienced growth in the thermometry, air purification and fan product lines . In addition, the humidification product line recovered in the fourth fiscal quarter due to a strong cold/cough/ flu season, ending fiscal year 2015 with mid-single digit category growth. Worldwide sales gains continue in thermometry and associated consumables as a result of new product introductions during the year and a strong flu season, which included a higher incidence of fever . These gains were partially offset by overall declines in water filtration and heater shipments. A relatively warm fall had the offsetting effects of improving fan sales and weakening early season heater shipments.
Nutritional Supplement
s Segment
- The Nutritional Supplements segment consists of the operating results from Healthy Directions, which we acquired on June 30, 2014. Net sales revenue for the eight months of its operation during fiscal year 2015 was $100.40 million.
Personal Care Segment
- Net sales revenue in the Personal Care segment for fiscal year 2015 decreased $39.37 million, or 8.3 percent, to $435.23 million compared with $474.60 million for the same period last year. Lower unit volumes had an unfavorable impact of 5.6 percentage points on net sales revenue and a decrease in the average unit selling price contributed an additional 2.7 percentage points to the overall decline. The decrease in net sales revenue was spread across most major product categories within the segment. The environment for most categories in this segment has been difficult and highly promotional for a large part of fiscal year 2015 as a result of low demand and a retail and consumer focus on lower price-point merchandise. The grooming, skin care and hair care solutions product category continued to confront significant competitive product launches and promotional spending in hair care. The results for fiscal year 2015 also include the impact of an inventory reduction in the retail appliance s category at our largest customer. The retail appliances category was also negatively impacted by the loss of distribution with a Canadian retailer in the third quarter of fiscal year 2015. The loss of distribution is expected to have an ongoing year-over-year impact on net sales revenue for the next several quarters, but the impact on operating income is not expected to be material. In addition, during fiscal year 2015 we experienced an approximate $12.50 million year-over-year decline in our European appliance net sales revenue attributed to a product distribution agreement that did not repeat in fiscal year 2015.
Comparison of fiscal year 2014 to fiscal year 2013
Housewares Segment
- Net sales revenue in the Housewares segment for fiscal year 2014 increased $15.44 million, or 6.0 percent, to $274.48 million compared with $259.04 million for the same period last year. Year-over-year unit volume increases had a favorable impact of 6.2 percentage points on net sales revenue. The unit volume increase was slightly offset by a 0.2 percentage point decline in the average unit selling price, primarily the result of slightly higher year-over-year promotional and other sales discounts. From a product perspective, the Housewares segment's net sales revenue growth was principally driven by volume growth in cleaning products, fruit and vegetable preparation tools, baking, dry food storage and kitchen organization. The segment also continue d to expand the market penetration of our line of infant and toddler care products. From a customer perspective, growth was driven by continued growth in internet sales, expanded shelf space and assortments at several key retailers and new customer distribution in fiscal year 2014 .
Healthcare / Home Environment Segment
- Net sales revenue in the Healthcare / Home Environment segment for fiscal year 2014 increased $29.41 million, or 5.5 percent, to $568.08 million compared with $538.67 million for the same period last year. Year-over-year unit volume increases had a favorable impact of 3.8 percentage points and higher average unit selling prices, largely due to a more favorable sales mix, contributed 1.7 percentage points to net sales revenue growth. Sales were adversely affected by a weak cough/cold/flu season, particularly in the thermometry line during the fourth quarter of fiscal year 2014. From a product perspective, humidification products provided net sales revenue gains for fiscal year 2014 in the pharmacy channel along with associated consumable scent pads. The air purifiercategory was bolstered by new Bluetooth enabled and True HEPA filtration products, which strengthened our market positioning in higher price point products. We also continued to see progress in the water filtration product category with double-digit growth in both faucet mount and water pitcher systems. Sales growth was partially offset by lost distribution in hot/cold therapy and weak insect control sales resulting from a cool, dry spring in North America that affected most
46
Table of Contents
participants in the market segment. From a customer perspective, the segment saw growth with customers in the mass retail, internet and home improvement channels.
Personal Care Segment
- Net sales revenue in the Personal Care segment for fiscal year 2014 decreased $15.96 million, or 3.3 percent, to $474.60 million compared with $490.56 million for the same period last year. Year-over-year unit volume decreases had an unfavorable impact of 4.4 percentage points, partially offset by a higher average unit selling price. The increase in average selling price was largely a result of shifts in product category mix, which had a 1.1 percentage point favorable impact on net sales revenue. The segment contended with a difficult retail environment throughout fiscal year 2014 . Beginning in fiscal year 2013, significant competition has resulted in more pricing and promotional discounts in the hair care solutions product category. Retailers took advantage of extreme promotional programs provided by certain competitors and our Personal Care segment lost distribution as a result. T hese conditions continue d throughout fiscal year 2015. In addition, the broader grooming, skin care and hair care solutions category lost distribution as a result of inventory rationalization programs at large retailers and changing customer order replenishment practices in the U.S., leading to elevated out-of-stock positions on key retailer shelves. The domestic retail appliance product category has been negatively impacted by lost shelf space at a major retailer and higher promotional discounts, which has been partially offset by increased distribution elsewhere and a European product distribution arrangement that ended in fiscal year 2014. Our professional appliances line helped to offset declines in the overall appliance business with growth in sales volume at several key customers, particularly with its Hot Tools brand.
Impact of Acquisitions:
The following table summarizes, for the periods indicated, the impact that acquisitions had on our net sales revenue:
IMPACT OF ACQUISITIONS ON NET SALES REVENUE
(in thousands)
|
|
|
|
|
|
|
|
|
|
|
|
| Fiscal Years Ended |
| |||||||
|
| the Last Day of February, |
| |||||||
|
| 2015 |
| 2014 |
| 2013 |
| |||
Prior year's sales revenue, net |
| $ | 1,317,153 |
| $ | 1,288,263 |
| $ | 1,181,676 |
|
Components of sales revenue change, net |
|
|
|
|
|
|
|
|
|
|
Core business |
|
| 27,583 |
|
| 28,890 |
|
| 19,887 |
|
Incremental net sales revenue from acquisitions (non-core business): |
|
|
|
|
|
|
|
|
|
|
Healthy Directions (eight months in fiscal 2015) |
|
| 100,395 |
|
| - |
|
| - |
|
PUR (ten months in fiscal 2013) |
|
| - |
|
| - |
|
| 86,700 |
|
Change in sales revenue, net |
|
| 127,978 |
|
| 28,890 |
|
| 106,587 |
|
Total sales revenue, net |
| $ | 1,445,131 |
| $ | 1,317,153 |
| $ | 1,288,263 |
|
|
|
|
|
|
|
|
|
|
|
|
Total net sales revenue growth |
|
| 9.7 | % |
| 2.2 | % |
| 9.0 | % |
Core business |
|
| 2.1 | % |
| 2.2 | % |
| 1.7 | % |
Acquisitions |
|
| 7.6 | % |
| 0.0 | % |
| 7.3 | % |
In the above table, core business is net sales revenue associated with product lines or brands after the first twelve months from the date the product line or brand was acquired. Net sales revenue from internally developed brands or product lines is always considered core business. Net sales revenue from acquisitions is net sales revenue associated with product lines or brands that we have acquired and operated for less than twelve months during each period presented.
47
Table of Contents
Geographic Net Sales Revenue:
The following table sets forth, for the periods indicated, our net sales revenue by geographic region, in U.S. Dollars, as a percentage of net sales revenue, and the year-over-year percentage change in each region.
|
|
|
|
|
|
|
|
|
|
|
|
|
|
|
|
|
|
|
|
|
|
|
| Fiscal Years Ended |
|
|
|
|
|
|
|
|
|
|
| ||||||
|
|
| the Last Day of February, |
| % of Sales Revenue, net (2) |
| % Change |
| ||||||||||||
(in thousands) |
| 2015(1) |
| 2014 |
| 2013 |
| 2015(1) |
| 2014 |
| 2013 |
| 15/14 |
| 14/13 |
| |||
Sales revenue, net by geographic region |
|
|
|
|
|
|
|
|
|
|
|
|
|
|
|
|
|
|
|
|
United States |
| $ | 1,139,959 |
| $ | 1,019,525 |
| $ | 1,014,354 |
| 78.9 | % | 77.4 | % | 78.7 | % | 11.8 | % | 0.5 | % |
Canada |
|
| 69,996 |
|
| 69,190 |
|
| 71,312 |
| 4.8 | % | 5.3 | % | 5.6 | % | 1.2 | % | (3.0) | % |
EMEA |
|
| 181,147 |
|
| 176,674 |
|
| 153,707 |
| 12.5 | % | 13.4 | % | 11.9 | % | 2.5 | % | 14.9 | % |
Latin America |
|
| 54,029 |
|
| 51,764 |
|
| 48,890 |
| 3.7 | % | 3.9 | % | 3.8 | % | 4.4 | % | 5.9 | % |
Total sales revenue, net |
| $ | 1,445,131 |
| $ | 1,317,153 |
| $ | 1,288,263 |
| 100.0 | % | 100.0 | % | 100.0 | % | 9.7 | % | 2.2 | % |
| (1) |
| Includes eight months of operations for Healthy Directions, which was acquired on June 30, 2014. |
| (2) |
| Percentages of net sales revenue by geographic region are computed as a percentage of the geographic region's net sales revenue to consolidated total net sales revenue. |
Comparison of fiscal year 2015 to fiscal year 2014
In fiscal year 2015 , Canada, E MEA , and Latin America operations ( collectively "international operations") each accounted for approximately 23 , 59 and 18 percent of total international net sales revenue, respectively. The U.S. contributed 9.1 percentage points to consolidated net sales revenue growth or $120.43 million, primarily due to $100.40 million of sales from the addition of the Nutritional Supplements segment, which transacts almost entirely in the U.S . International operations contributed 0.6 percentage points, or $7.55 million, to consolidated net sales revenue growth. Canadian operations accounted for a 0.1 percentage point increase in our consolidated net sales revenue, or $0.81 million. EMEA accounted for a 0.3 percentage point increase in our consolidated net sales revenue, or $4.47 million , despite the approximate $12.50 million year-over-year decline in our European personal care appliance net sales revenue attributed to a product distribution agreement that did not repeat in fiscal year 2015 . Latin American operations accounted for a 0.2 percentage point increase in our consolidated net sales revenue, or $2.27 million. In addition to relatively weaker international consumer economies, overall international net sales revenue performance was hurt by the impact of net unfavorable exchange rate fluctuations, which decreased our overall reported international net sales by approximately $7.50 million in fiscal year 2015 . In our Personal Care segment, where our Canadian and Latin American operations comprise a high proportion of foreign revenues, foreign exchange fluctuations had a $3.61 million unfavorable impact on reported net sales revenues. In our Healthcare / Home environment segment, where our E MEA and Canadian operations comprise a high proportion of foreign revenues, foreign exchange fluctuations had a $4.15 million unfavorable impact on reported net sales revenues.
Comparison of fiscal year 2014 to fiscal year 2013
In fiscal year 2014, Canada, E MEA , and Latin America operations each accounted for approximately 23, 60 and 17 percent of total international net sales revenue, respectively. The U.S. contributed 0.4 percentage points to consolidated net sales revenue growth or $5.17 million. International operations contributed to consolidated net sales revenue growth with a 1.8 percentage point net increase, or $23.72 million. Canadian operations accounted for a 0.2 percentage point decrease in our consolidated net sales revenue, or $2.12 million. The loss was entirely due to the devaluation of the Canadian dollar against the U.S. Dollar, which decreased reported net sales by approximately $2.35 million. E MEA accounted for a 1.8 percentage point increase in our consolidated net sales revenue, or $22.97 million. Sales in E MEA were bolstered by a European spa product distribution arrangement that ended in the fourth quarter of fiscal year 2014, the success of new Braun thermometry in the professional channel, and new Honeywell fan and heating distribution. Latin American operations accounted for a 0.2 percentage point increase in our consolidated net sales revenue, or $2.87 million. The year-over-year comparison of Latin America net sales revenue reported in U.S. Dollars was negatively impacted by
48
Table of Contents
the February 2013 devaluation of the Venezuelan currency against the U.S. Dollar, which reduced fiscal year 2014 reported net sales revenue by approximately $3.81 million, year-over-year. Our overall international net sales revenue performance continues to be hurt by the net impact of unfavorable exchange rate fluctuations, which decreased our overall reported international net sales by approximately $4.63 million in fiscal year 2014.
Gross Profit Margins:
Our product sourcing mix is heavily dependent on imports from China. China's currency is no longer pegged solely to the U.S. Dollar. While China's currency intervention strategy with respect to the U.S. Dollar is continuously evolving, we believe that China's currency may continue to fluctuate against the U.S. Dollar in the short ‐ to ‐ intermediate term, which could result in increased product costs over time.
Comparison of fiscal year 2015 to fiscal year 2014
Consolidated gross profit as a percentage of net sales revenue increased 2.3 percentage points to 41.5 percent in fiscal year 2015 from 39.2 percent in fiscal year 2014 . The addition of eight months operations of the Nutritional Supplements segment had a favorable impact of 2.3 percentage points on the consolidated gross profit margin. Because of the nature of its product s and direct to consumer business model, this segment's spending patterns differ from our core business. As a result, higher gross margins are partially offset by comparatively higher percentages of spending devoted to selling, promotional and distribution activities. The overall fiscal year 2015 gross profit margin for our core business was flat compared to fiscal year 2014 , despite a n approximate $7.50 million unfavorable impact on net sales revenue from foreign currency exchange rate fluctuations.
Comparison of fiscal year 2014 to fiscal year 2013
Consolidated gross profit as a percentage of net sales revenue decreased 1.0 percentage point to 39.2 percent in fiscal year 2014 from 40.2 percent in fiscal year 2013. In fiscal year 2014, our consolidated gross profit margin continued to be unfavorably impacted by the combined effects of increased promotional program costs, the effect of foreign currency exchange rate fluctuations on net sales revenue and general product cost increases across all segments.
Selling, General and Administrative Expense:
Comparison of fiscal year 2015 to fiscal year 2014
Our SG&A ratio increased 0.3 percentage points, to 29.7 percent of net sales revenue for fiscal year 2015 , compared to 29.4 percent for the same period last year. The year-over-year increase in the SG&A ratio is primarily due to the following items:
| · |
| The Nutritional Supplements segment operates with a higher SG&A ratio than our core business. The addition of eight months of operations of this segment, excluding the acquisition ‐ related expenses discussed below, increased the consolidated SG&A ratio by 2.3 percentage points; |
| · |
| Expenses of $3.61 million incurred in connection with the Healthy Directions acquisition during the second fiscal quarter increased our SG&A ratio for fiscal year 2015 by 0.2 percentage points; and |
| · |
| A year-over-year decrease of 2.2 percentage points in the SG&A ratio for the core business due to a combination of: the impact of CEO succession costs of $18.23 million in fiscal year 2014 , with no comparable cost in fiscal year 2015; and the impact of a $7 million gain from the amendment of our trademark license agreement with Honeywell International Inc. in fiscal year 2015 ; partially offset by $ 5. 01 million of higher media and advertising expenses and approximately $4.77 million of higher foreign currency exchange losses in fiscal year 2015 . |
Comparison of fiscal year 2014 to fiscal year 2013
SG&A increased 0.7 percentage points, to 29.4 percent of net sales revenue for fiscal year 2014, compared to 28.7 percent for the same period last year. The year-over-year increase in the SG&A ratio is primarily due to fiscal year 2014
49
Table of Contents
pre-tax charges for CEO succession costs totaling $18.23 million incurred in connection with our former CEO's separation from the Company. These costs were partially offset by reduced media advertising costs, primarily in the Personal Care segment, lower outbound freight costs, the favorable comparative impact arising from product packaging litigation expense recorded in fiscal year 2013 that did not reoccur in fiscal year 2014, and the favorable comparative impact of certain transition services charges relating to our acquisition of PUR that ceased being incurred after the first half of fiscal year 2013.
Asset impairment charges:
A significant portion of our long-term assets continues to consist of goodwill and other indefinite-lived intangible assets recorded because of past acquisitions. The Company conducts its annual test of impairment of goodwill and indefinite-lived intangible assets in the first quarter of each fiscal year. The Company also tests for impairment if events or circumstances indicate a more frequent evaluation is necessary. The steps required by GAAP to test for impairment entail significant amounts of judgment and subjectivity. The results of our annual testing may result in us recording declines in asset value that are not apparent until all test work is completed. Any such impairment charges could have a material adverse effect on our business, financial condition and results of operations.
First Quarter of Fiscal Year 2015
– The Company performed its annual evaluation of goodwill and indefinite ‐ lived intangible assets for impairment during the first quarter of fiscal year 2015. As a result of our testing of indefinite ‐ lived trademarks and licenses, we recorded a non ‐ cash asset impairment charge of $9.00 million ($8.16 million after tax) during the first quarter of fiscal year 2015. The charge was related to certain trademarks in our Personal Care segment, which were written down to their estimated fair value, determined based on future discounted cash flows using the relief from royalty valuation method.
First Quarter of Fiscal Year 2014
– The Company performed its annual evaluation of goodwill and indefinite-lived intangible assets for impairment during the first quarter of fiscal year 2014. As a result of our testing of indefinite-lived trademarks and licenses, we recorded a non-cash intangible asset impairment charge of $12.05 million ($12.03 million after tax). The charge was related to certain trademarks in our Personal Care segment, which were written down to their estimated fair value, as a result of lower revenue outlooks due to competitive factors. Fair values were determined based on future discounted cash flows using the relief from royalty valuation method.
First Quarter of Fiscal Year 2013
- The Company performed its annual evaluation of goodwill and indefinite - lived intangible assets for impairment during the first quarter of fiscal year 2013. As a result of its testing, the Company concluded no impairment charges were required as the estimated fair value of the indefinite-lived trademarks and licenses, reporting unit net assets and the Company's estimated enterprise value exceeded their respective carrying values as of the date of the evaluation.
50
Table of Contents
Operating Income by Segment:
Operating income by segment for fiscal years 2015, 2014 and 2013 was as follows:
|
|
|
|
|
|
|
|
|
|
|
|
|
|
|
|
|
|
|
|
|
|
| Fiscal Years Ended |
|
|
|
|
|
|
|
|
|
|
| |||||||
|
| the Last Day of February, |
| % of Sales Revenue, net (2) |
| % Change |
| |||||||||||||
(in thousands) |
| 2015(1) |
| 2014 |
| 2013 |
| 2015(1) |
| 2014 |
| 2013 |
| 15/14 |
| 14/13 |
| |||
Housewares |
| $ | 59,392 |
| $ | 50,828 |
| $ | 49,612 |
| 20.0 | % | 18.5 | % | 19.2 | % | 16.8 | % | 2.5 | % |
Healthcare / Home Environment |
|
| 50,821 |
|
| 20,764 |
|
| 37,772 |
| 8.3 | % | 3.7 | % | 7.0 | % | 144.8 | % | (45.0) | % |
Nutritional Supplements |
|
| 9,512 |
|
| - |
|
| - |
| 9.5 | % | - | % | - | % | * |
| - | % |
Personal Care |
|
| 41,994 |
|
| 45,508 |
|
| 61,389 |
| 9.6 | % | 9.6 | % | 12.5 | % | (7.7) | % | (25.9) | % |
Total operating income |
| $ | 161,719 |
| $ | 117,100 |
| $ | 148,773 |
| 11.2 | % | 8.9 | % | 11.5 | % | 38.1 | % | (21.3) | % |
* Calculation is not meaningful
| (1) |
| Includes eight months of operations for Healthy Directions, which was acquired on June 30, 2014. |
| (2) |
| Percentages by segment are computed as a percentage of the segments' net sales revenue. |
The operat ing income for the Nutritional Supplements segment do es not include any allocation of shared service or corporate costs for fiscal year 2015. As the new segment is further integrated into our operating structure, we expect to make an allocation of shared service and corporate costs to the segment in future fiscal years. When we decide such allocations are appropriate, there may be some reduction in the operating income of the Nutritional Supplements segment offset by increases in operating income of our other segments. The extent of this operating income impact between the segments has not yet been determined.
Comparison of fiscal year 2015 to fiscal year 2014
Housewares
- The Housewares segment's operating income increased $8.56 million, or 16.8 percent, for fiscal year 2015 compared to fiscal year 2014 . Segment operating margin increased 1.5 percentage points to 20.0 percent, compared to 18.5 percent for the same period last year. The year - over - year improvement in operating margin is primarily due to $3.64 million of allocated CEO succession costs in fiscal year 2014, for which there was no comparable cost in fiscal year 2015. The increase in segment operating margin was also due to higher net sales revenues and an increase in operating leverage, partially offset by a slightly lower margin mix and certain product cost increases compared to the same period last year.
Healthcare / Home Environment
- The Healthcare / Home Environment segment's operating income increased $30.06 million, or 144.8 percent, for fiscal year 2015 compared to fiscal year 2014 . Segment operating margin increased 4.6 percentage points to 8.3 percent, compared to 3.7 percent for the same period last year. The increase in segment operating margin was due to higher net sales revenue and a lower operating expense ratio year-over-year . The lower operating expense ratio was primarily due to $ 7.92 million of allocated CEO succession costs in fiscal year 2014, for which there was no comparable cost in fiscal year 2015 , and a $7 million gain recognized in connection with the amendment of our trademark license agreement with Honeywell International Inc. in fiscal year 2015. These operating expense reductions were partially offset by an increase in foreign exchange losses year-over-year .
Nutritional Supplements Segment
- The Nutritional Supplements segment's operating income includes eight months of operating results from Healthy Directions, which we acquired on June 30, 2014. The segment's operating income was $9.51 million, resulting in an operating margin of 9.5 percent. The fiscal year ‐ to ‐ date operating income includes expense s of $3.61 million incurred in connection with the acquisition.
51
Table of Contents
Personal Care Segment
- The Personal Care segment's operating income decreased $3.51 million, or 7.7 percent, for fiscal year 2015 compared to fiscal year 2014 . Segment operating margin remained flat at 9.6 percent for both fiscal year 2015 and 2014 . The flat operating margin was due to $ 6.67 million of allocated CEO succession costs in fiscal year 2014, for which there was no comparable cost in fiscal year 2015 , offset by higher advertising and other marketing expenses and higher foreign exchange losses. Operating income includes non ‐ cash intangible asset impairment charges totaling $9.00 million and $12.05 million for fiscal years 2015 and 2014, respectively , as previously described.
Comparison of fiscal year 2014 to fiscal year 2013
Housewares
- The Housewares segment's operating income increased $1.22 million, or 2.5 percent, for fiscal year 2014 compared to fiscal year 2013. Segment operating margin decreased 0.7 percentage points to 18.5 percent, compared to 19.2 percent for the same period last year. The impact of h igher net sales revenue was offset by product cost increases and the incremental impact of higher CEO incentive compensation and the CEO succession costs referred to previously .
Healthcare / Home Environment
- The Healthcare / Home Environment segment's operating income decreased $17.00 million, or 45.0 percent, for fiscal year 2014 compared to fiscal year 2013. Segment operating margin decreased 3.3 percentage points to 3.7 percent, compared to 7.0 percent for fiscal year 2013 . The decrease in segment operating margin was principally due to higher promotional allowances and cooperative advertising, higher product costs, certain incentive compensation costs exclusive to the segment, foreign currency exchange rate fluctuations, higher allocat ed CEO incentive compensation, and the CEO succession costs referred to previously . These factors were partially offset by the combined effects of lower media advertising costs and the favorable comparative impact arising from product packaging litigation expense recorded in fiscal year 2013.
Personal Care Segment
- The Personal Care segment's operating income decreased $15.88 million, or 25.9 percent, compared to fiscal year 2013. Segment operating margin decreased 2.9 percentage points to 9.6 percent, compared to 12.5 percent for the same period last year. The decrease in segment operating margin was principally due to a decline in sales, the impact of higher promotional allowances, higher product costs, the unfavorable impact of foreign currency exchange rate fluctuations, the incremental impact of higher allocated CEO incentive compensation , the CEO succession costs discussed previously, and a non-cash intangible asset impairment charge of $12.05 million (as previously discussed under "Asset impairment charges"). These unfavorable factors were partially offset by lower media advertising costs and lower outbound freight costs.
As discussed above, a significant amount of the variation in operating income can be attributed to the combined effects of the following significant items: non ‐ cash asset impairment charges, CEO succession costs, acquisition ‐ related expenses, amortization of intangible assets, and non ‐ cash share ‐ based compensation, as applicable . The tables on the following page help to provide a better understanding of the comparative impact of these items on operating income for each segment and consolidated operating income.
52
Table of Contents
ADJUSTED OPERATING INCOME AND OPERATING MARGIN
(in thousands)
|
|
|
|
|
|
|
|
|
|
|
|
|
|
|
|
|
|
|
|
|
|
|
|
|
|
|
|
|
|
|
|
| Year Ended February 28, 2015 |
|
|
| |||||||||||||||||||||||||
|
| Housewares |
|
| Healthcare / Home Environment |
|
| Nutritional Supplements (6) |
|
| Personal Care |
|
| Total |
| |||||||||||||||
Operating income, as reported (GAAP) |
| $ | 59,392 |
| 20.0 | % |
| $ | 50,821 |
| 8.3 | % |
| $ | 9,512 |
| 9.5 | % |
| $ | 41,994 |
| 9.6 | % |
| $ | 161,719 |
| 11.2 | % |
Asset impairment charges (1) |
|
| - |
| - | % |
|
| - |
| - | % |
|
| - |
| - | % |
|
| 9,000 |
| 2.1 | % |
|
| 9,000 |
| 0.6 | % |
Acquisition-related expenses (3) |
|
| - |
| - | % |
|
| - |
| - | % |
|
| 3,611 |
| 3.6 | % |
|
| - |
| - | % |
|
| 3,611 |
| 0.2 | % |
Subtotal |
|
| 59,392 |
| 20.0 | % |
|
| 50,821 |
| 8.3 | % |
|
| 13,123 |
| 13.1 | % |
|
| 50,994 |
| 11.7 | % |
|
| 174,330 |
| 12.1 | % |
Amortization of intangible assets (4) |
|
| 1,345 |
| 0.5 | % |
|
| 13,878 |
| 2.3 | % |
|
| 4,171 |
| 4.2 | % |
|
| 5,934 |
| 1.4 | % |
|
| 25,328 |
| 1.8 | % |
Non-cash share-based compensation (5) |
|
| 758 |
| 0.3 | % |
|
| 1,115 |
| 0.2 | % |
|
| 499 |
| 0.5 | % |
|
| 3,602 |
| 0.8 | % |
|
| 5,974 |
| 0.4 | % |
Adjusted operating income (non-GAAP) |
| $ | 61,495 |
| 20.8 | % |
| $ | 65,814 |
| 10.7 | % |
| $ | 17,793 |
| 17.7 | % |
| $ | 60,530 |
| 13.9 | % |
| $ | 205,632 |
| 14.2 | % |
|
|
|
|
|
|
|
|
|
|
|
|
|
|
|
|
|
|
|
|
|
|
|
|
|
|
|
|
|
|
|
|
| Year Ended February 28, 2014 |
|
|
| |||||||||||||||||||||||||
|
| Housewares |
|
| Healthcare / Home Environment |
|
| Nutritional Supplements (6) |
|
| Personal Care |
|
| Total |
| |||||||||||||||
Operating income, as reported (GAAP) |
| $ | 50,828 |
| 18.5 | % |
| $ | 20,764 |
| 3.7 | % |
| $ | - |
| - | % |
| $ | 45,508 |
| 9.6 | % |
| $ | 117,100 |
| 8.9 | % |
Asset impairment charges (1) |
|
| - |
| - | % |
|
| - |
| - | % |
|
| - |
| - | % |
|
| 12,049 |
| 2.5 | % |
|
| 12,049 |
| 0.9 | % |
CEO succession costs (2) |
|
| 3,644 |
| 1.3 | % |
|
| 7,916 |
| 1.4 | % |
|
| - |
| - | % |
|
| 6,668 |
| 1.4 | % |
|
| 18,228 |
| 1.4 | % |
Subtotal |
|
| 54,472 |
| 19.8 | % |
|
| 28,680 |
| 5.0 | % |
|
| - |
| - | % |
|
| 64,225 |
| 13.5 | % |
|
| 147,377 |
| 11.2 | % |
Amortization of intangible assets (4) |
|
| 1,322 |
| 0.5 | % |
|
| 14,350 |
| 2.5 | % |
|
| - |
| - | % |
|
| 5,940 |
| 1.3 | % |
|
| 21,612 |
| 1.6 | % |
Non-cash share-based compensation (5) |
|
| 2,400 |
| 0.9 | % |
|
| 4,966 |
| 0.9 | % |
|
| - |
| - | % |
|
| 6,866 |
| 1.4 | % |
|
| 14,232 |
| 1.1 | % |
Adjusted operating income (non-GAAP) |
| $ | 58,194 |
| 21.2 | % |
| $ | 47,996 |
| 8.4 | % |
| $ | - |
| - | % |
| $ | 77,031 |
| 16.2 | % |
| $ | 183,221 |
| 13.9 | % |
|
|
|
|
|
|
|
|
|
|
|
|
|
|
|
|
|
|
|
|
|
|
|
|
|
|
|
|
|
|
|
|
| Year Ended February 28, 2013 |
|
|
| |||||||||||||||||||||||||
|
| Housewares |
|
| Healthcare / Home Environment |
|
| Nutritional Supplements (6) |
|
| Personal Care |
|
| Total |
| |||||||||||||||
Operating income, as reported (GAAP) |
| $ | 49,612 |
| 19.2 | % |
| $ | 37,772 |
| 7.0 | % |
| $ | - |
| - | % |
| $ | 61,389 |
| 12.5 | % |
| $ | 148,773 |
| 11.5 | % |
Amortization of intangible assets (4) |
|
| 1,500 |
| 0.6 | % |
|
| 14,456 |
| 2.7 | % |
|
| - |
| - | % |
|
| 6,444 |
| 1.3 | % |
|
| 22,400 |
| 1.7 | % |
Non-cash share-based compensation (5) |
|
| 740 |
| 0.3 | % |
|
| 1,553 |
| 0.3 | % |
|
| - |
| - | % |
|
| 3,620 |
| 0.7 | % |
|
| 5,913 |
| 0.5 | % |
Adjusted operating income (non-GAAP) |
| $ | 51,852 |
| 20.0 | % |
| $ | 53,781 |
| 10.0 | % |
| $ | - |
| - | % |
| $ | 71,453 |
| 14.6 | % |
| $ | 177,086 |
| 13.7 | % |
In the tables above, footnote references (1) to (5) correspond to the notes beginning on page 55 under the table entitled "Adjusted Income and EPS" .
| (6) |
| The Nutritional Supplements segment includes eight months of operating results for fiscal year 2015, as the segment was acquired on June 30, 2014. |
The table s shown above entitled " Adjusted o perating i ncome and operating margin " reports fiscal year s 2015, 2014 and 2013 operating income and associate d operating margin excluding non ‐ cash asset impairment charges, CEO succession costs, acquisition ‐ related expenses, amortization of intangible assets, and non ‐ cash share ‐ based compensation, as applicable . Adjusted o perating income and operating margin, as discussed in the preceding table s , may be considered non-GAAP financial measures as set forth in SEC Regulation G, Rule 100. An explanation of the reasons why the Company believes the non-GAAP financial information is useful and the nature and limitations of the non-GAAP financial measures, is furnished on page 56 .
53
Table of Contents
Interest Expense:
Interest expense increased to $15.02 million in fiscal year 2015 compared to $10.19 million in fiscal year 2014 . The increase in interest expense is due to higher levels of debt as a result of borrowings used to fund the repurchase of $278.43 million of the Company's outstanding common stock in fiscal year 2015 through a combination of a modified "Dutch auction" tender offer, the settlement of certain stock awards, and open market transactions, and to fund the $195.94 million acquisition of Healthy Directions on June 30, 2014.
Interest expense decreased to $10.19 million in fiscal year 2014 compared to $13.35 million in fiscal year 2013. Interest expense was lower when compared to the prior fiscal year primarily due to lower levels of debt outstanding.
Income Tax Expense:
Our fiscal years 2015 , 2014 and 2013 income tax expense was $16.05 , $20.89 and $19.85 million, respectively, and our effective tax rates were 10.9 , 19.5 and 14.6 percent, respectively. The year-over-year comparison of our effective tax rates was primarily impacted by the mix of taxable income in our various tax jurisdictions.
The fiscal year 2015 tax rate was also favorably impacted by a $0.85 million tax benefit associated with a net reduction in the valuation allowance for net operating loss carryforwards, a $0.52 million tax benefit resulting from the finalization of certain tax returns and tax benefit s of $ 3.00 million related to the resolution of uncertain tax position s and the impact of foreign currency fluctuations on foreign unrecognized tax benefits . In addition, a $7 million gain ($6.98 million after tax) from the amendment of our trademark license agreement with Honeywell International Inc. decreased the effective tax rate by 0.5 percentage points in fiscal year 2015.
The fiscal year 2014 effective tax rate was also impacted by intangible asset impairment charges of $12.05 million recorded during the first quarter of fiscal year 2014, for which the related tax benefit was only $0.02 million. The impact of intangible asset impairment charges increased the effective tax rate by 2.0 percentage points.
We expect our effective tax rate for fiscal year 2016 to range between 14.0 and 16.0 percent.
Net Income:
Comparison of fiscal year 2015 to fiscal year 2014
Our net income was $131.16 million for fiscal year 2015 compared to $86.25 million for fiscal year 2014 , an increase of 52.1 percent. Our diluted earnings per share increased $1.86 to $4.52 for fiscal year 2015 compared to $2.66 for fiscal year 2014 , an increase of 69.9 percent.
Comparison of fiscal year 2014 to fiscal year 2013
Our net income was $86.25 million for fiscal year 2014 compared to $115.67 million for fiscal year 2013, a decrease of 25.4 percent. Our diluted earnings per share decreased $0.96 to $2.66 for fiscal year 2014 compared to $3.62 for fiscal year 2013, a decrease of 26.5 percent.
54
Table of Contents
Adjusted Income and EPS
:
In order to provide a better understanding of the impact of certain items on our net income and EPS, the analysis that follows reports the comparative after tax impact of non ‐ cash asset impairment charges, CEO succession costs, acquisition ‐ related expenses, amortization of intangible assets, and non ‐ cash share ‐ based compensation, as applicable , on our net income, and basic and diluted EPS for the periods covered below.
ADJUSTED INCOME AND EPS
(dollars in thousands, except per share data)
|
|
|
|
|
|
|
|
|
|
|
|
|
|
|
|
|
|
|
|
|
|
|
|
|
|
|
|
|
| Fiscal Years Ended the Last Day of February, |
| Basic EPS |
| Diluted EPS | |||||||||||||||||||||
|
| 2015 |
| 2014 |
| 2013 |
| 2015 |
| 2014 |
| 2013 |
| 2015 |
| 2014 |
| 2013 | |||||||||
Net income as reported (GAAP) |
| $ | 131,164 |
| $ | 86,248 |
| $ | 115,666 |
| $ | 4.59 |
| $ | 2.69 |
| $ | 3.64 |
| $ | 4.52 |
| $ | 2.66 |
| $ | 3.62 |
Asset impairment charges, net of tax (1) |
|
| 8,155 |
|
| 12,034 |
|
| - |
|
| 0.29 |
|
| 0.38 |
|
| - |
|
| 0.28 |
|
| 0.37 |
|
| - |
CEO succession costs, net of tax (2) |
|
| - |
|
| 16,335 |
|
| - |
|
| - |
|
| 0.51 |
|
| - |
|
| - |
|
| 0.51 |
|
| - |
Acquisition-related expenses, net of tax (3) |
|
| 2,306 |
|
| - |
|
| - |
|
| 0.08 |
|
| - |
|
| - |
|
| 0.08 |
|
| - |
|
| - |
Subtotal |
|
| 141,625 |
|
| 114,617 |
|
| 115,666 |
|
| 4.96 |
|
| 3.58 |
|
| 3.64 |
|
| 4.88 |
|
| 3.54 |
|
| 3.62 |
Amortization of intangible assets, net of tax (4) |
|
| 22,985 |
|
| 20,741 |
|
| 22,126 |
|
| 0.80 |
|
| 0.64 |
|
| 0.70 |
|
| 0.79 |
|
| 0.64 |
|
| 0.69 |
Non-cash share-based compensation, net of tax (5) |
|
| 5,313 |
|
| 10,416 |
|
| 5,055 |
|
| 0.19 |
|
| 0.33 |
|
| 0.16 |
|
| 0.18 |
|
| 0.32 |
|
| 0.16 |
Adjusted income (non-GAAP) |
| $ | 169,923 |
| $ | 145,774 |
| $ | 142,847 |
| $ | 5.95 |
| $ | 4.55 |
| $ | 4.50 |
| $ | 5.85 |
| $ | 4.50 |
| $ | 4.47 |
|
|
|
|
|
|
|
|
|
|
|
|
|
|
|
|
|
|
|
|
|
|
|
|
|
|
|
|
Weighted average shares of common stock used in computing basic and diluted EPS (GAAP) |
|
|
|
|
|
|
|
|
|
|
| 28,579 |
|
| 32,007 |
|
| 31,754 |
|
| 29,035 |
|
| 32,386 |
|
| 31,936 |
Dilutive impact of CEO succession costs (2) |
|
|
|
|
|
|
|
|
|
|
| - |
|
| - |
|
| - |
|
| - |
|
| (42) |
|
| - |
Weighted average shares of common stock used in computing adjusted basic and diluted EPS (non-GAAP) |
|
|
|
|
|
|
|
|
|
|
| 28,579 |
|
| 32,007 |
|
| 31,754 |
|
| 29,035 |
|
| 32,344 |
|
| 31,936 |
| (1) |
| For fiscal years 2015 and 2014, non-cash intangible asset impairment charges were $9.00 and $12.05 million, respectively, net of taxes of $0.84 and $0.02 million, respectively. No comparable expenses were incurred for fiscal year 2013. |
| (2) |
| CEO succession costs totaling $18.23 million ($16.34 million, net of tax) were incurred in the fourth quarter of fiscal year 2014 in connection with the former CEO's separation from the Company. The portion of costs settled through the issuance of the Company's common stock had a dilutive impact on weighted average shares of common stock outstanding of 42,000 shares for the fiscal year ended February 28, 2014. No comparable expenses were incurred for fiscal years 2015 and 2013. |
| (3) |
| For fiscal year 2015, expenses of $3.61 million ($2.31 million after tax) were incurred in connection with the Healthy Directions acquisition. No comparable expenses were incurred for fiscal years 2014 and 2013. |
| (4) |
| For fiscal years 2015 , 2014 and 2013 amortization of intangible assets was $25.33 , $21.61 and $22.40 million respectively, net of taxes of $2.58 , $0.87 and $0.27 million, respectively. |
| (5) |
| Includes n on-cash share-based compensation expense totaling $14.23 million ($10.42 million, net of tax) in fiscal year 2014 , not including $17.45 million ( $ 15.56 million, net of tax) of non-cash share-based compensation expense included in the settlement of certain CEO succession costs referred to in note ( 2 ) above . |
55
Table of Contents
Comparison of fiscal year 2015 to fiscal year 2014
Adjusted income increased $24.15 million or 16.6 percent for fisc al year 2015 compared to fiscal year 2014 . Adjusted diluted EPS was $5.84 for fiscal year 2015 compared to $4.5 0 for fiscal year 2014 . The increase in adjusted income was primarily due to higher overall sales, a lower SG&A ratio , lower income tax expense in the core business, the $6.98 million after tax gain from the amendment of our trademark license agreement with Honeywell International, Inc. and the accretive impact of the Healthy Directions acquisition. The increase in adjusted diluted EPS was due to the combined effects of increased adjusted income and share repurchases totaling 4,174,093 shares in fiscal year 2015 , which resulted in lower diluted shares outstanding, when compared to fiscal year 2014 .
Comparison of fiscal year 2014 to fiscal year 2013
Adjusted income increased $ 2.93 million or 2. 0 percent for fiscal year 2014 compared to fiscal year 2013. Adjusted diluted EPS was $4.5 0 for fiscal year 2014 compared to $4.47 for fiscal year 2013. The increase in adjusted income and adjusted diluted EPS was primarily due to higher overall sales and lower interest expense in fiscal year 2014, when compared to fiscal year 2013.
The table s referred on pages 53 and 55 entitled " Adjusted o perating i ncome and operating margin " and "Adjusted i ncome and EPS" , respectively report operating income, operating margin, net income and EPS without the after tax impact of noncash asset impairment charges, CEO succession costs, acquisition - related expenses, amortization of intangible assets, and non - cash share - based compensation for the periods presented, as applicable. These measures may be considered non - GAAP financial information as set forth in SEC Regulation G, Rule 100. The preceding table reconciles these measures to their corresponding GAAP - based measures presented in our consolidated condensed statements of income. We believe that adjusted operating income, adjusted operating margin, adjusted income and EPS provide useful information to management and investors regarding financial and business trends relating to the Company's financial condition and results of operations. We believe that these non - GAAP financial measures, in combination with the Company's financial results calculated in accordance with GAAP, provide investors with additional perspective regarding the impact of such charges on net income and earnings per share. We also believe that these non - GAAP measures facilitate a more direct comparison of the Company's performance with its competitors. We further believe that including the excluded charges would not accurately reflect the underlying performance of the Company's continuing operations for the period in which the charges are incurred, even though such charges may be incurred and reflected in the Company's GAAP financial results in the near future. The material limitation associated with the use of the non - GAAP financial measures is that the non - GAAP measures do not reflect the full economic impact of the Company's activities. The Company's adjusted operating income, adjusted operating margin, adjusted income and EPS are not prepared in accordance with GAAP, are not an alternative to GAAP financial information and may be calculated differently than non - GAAP financial information disclosed by other companies. Accordingly, undue reliance should not be placed on non - GAAP information.
56
Table of Contents
FINANCIAL CONDITION, LIQUIDITY AND CAPITAL RESOURCES
Selected measures of our liquidity and capital utilization for fiscal years 2015 and 2014 are shown below:
SELECTED MEASURES OF OUR LIQUIDITY AND CAPITAL UTILIZATION (1)
|
|
|
|
|
|
|
|
|
| Fiscal Years Ended |
| ||||
|
| the Last Day of February, |
| ||||
|
| 2015 |
| 2014 |
| ||
Accounts Receivable Turnover (Days) |
|
| 58.6 |
|
| 63.7 |
|
Inventory Turnover (Times) |
|
| 2.7 |
|
| 2.8 |
|
Working Capital (in thousands) |
| $ | 302,895 |
| $ | 286,122 |
|
Current Ratio |
|
| 2.2:1 |
|
| 1.9:1 |
|
Ending Debt to Ending Equity Ratio |
|
| 47.9 | % |
| 18.7 | % |
Return on Average Equity (2) |
|
| 15.0 | % |
| 8.8 | % |
(1) Our computation and use of the measures in this table are further described and explained beginning on page 67 .
(2) Net income and average equity for fiscal years 2015 and 2014 include after tax non-cash asset impairment charges of $8.16 and $12.0 3 million, respectively. In addition, net income and average equity for fiscal year 2015 include after tax acquisition - related expenses of $2.31 million. Twelve-month trailing net income and average equity used in the calculation also include after tax CEO succession costs of $16.34 million recorded in the fourth quarter of fiscal year 2014. For fiscal years 2015 and 2014, these items had an unfavorable impact of 0.9 and 2.8 percentage points, respectively, on the return on average equity.
Operating Activities:
Comparison of fiscal year 2015 to fiscal year 2014
Operating activities provided $178.60 million of cash during fiscal year 2015 compared to $154.17 million of cash provided during fiscal year 2014 . The increase in operating cash flow was primarily due to the increase in net income.
Accounts receivable increased $9.45 million to $222.50 million at the end of fiscal year 2015 , compared to $213.05 million at the end of fiscal year 2014 . Accounts receivable turnover improved to 58.6 days from 63.7 days in fiscal year 2014. O ur new Nutritional Supplements segment carries little or no receivables at any point in time as most of its net sales revenue is collected prior to shipment . The addition of the segment's net revenue without a corresponding increase in receivables outstanding was the primary reason for the improvement in turnover .
Inventory increased $3.83 million to $293.08 million at the end of fiscal year 2015, compared to $289.26 million at the end of fiscal year 2014 . Inventory turnover decreased slightly to 2.7 times per year from 2.8 times per year in fiscal year 2014 . The increase in inventory is primarily due to the acquisition of Healthy Directions, which carried $7.34 million of inventory at the end of fiscal year 2015.
Working capital was $302.90 million at the end of fiscal year 2015 , compared to $286.12 million at the end of fiscal year 2014 . The increase in working capital over the last twelve months is primarily due to a decrease in current maturities of long-term debt as a result of the payment of $75 million on our unsecured floating interest rate Senior Notes at maturity i n June 201 4 and the extension of our C redit A greement to January 2020 in the fourth quarter of fiscal year 201 4 . As a result, our current ratio in creased to 2.2:1 at the end of fiscal year 2015 , compared to 1.9:1 at the end of fiscal year 2014 .
57
Table of Contents
Comparison of fiscal year 2014 to fiscal year 2013
Operating activities provided $154.17 million of cash during fiscal year 2014 compared to $87.56 million of cash provided during fiscal year 2013. The increase in operating cash flow was primarily due to relative stability in the net components of working capital, when compared to the same period last year.
Accounts receivable decreased $6.67 million to $213.05 million at the end of fiscal year 2014, compared to $219.72 million at the end of fiscal year 2013. Accounts receivable turnover increased slightly to 63.7 days from 60.6 days in fiscal year 2013. This calculation is based on a rolling five-quarter accounts receivable balance. We believe the increase in turnover to be the result of normal fluctuations and changes in our geographic net sales revenue mix and do not reflect any fundamental changes in credit terms or credit quality.
Inventory increased $8.38 million to $289.26 million at the end of fiscal year 2014, compared to $280.87 million at the end of fiscal year 2013. Inventory turnover improved slightly to 2.8 times per year from 2.7 times per year in fiscal year 2013.
Working capital was $286.16 million at the end of fiscal year 2014, compared to $236.54 million at the end of fiscal year 2013. The increase in working capital was primarily due to an increase in cash and a net decrease in current debt, partially offset by a net increase in accrued expenses and other current liabilities. CEO succession costs and certain incentive compensation accruals were the primary contributors to a net increase in accrued expenses and other current liabilities at the end of fiscal year 2014. As a result, our current ratio increased to 1.9:1 at the end of fiscal year 2014, compared to 1.8:1 at the end of fiscal year 2013.
Investing Activities:
In fiscal year 2015 , investing activities used $202.46 million of cash compared with $40.46 and $13.93 million used in fiscal years 2014 and 2013 , respectively.
Significant highlights of our fiscal year 2015 investing activities
| · |
| We spent $ 2.97 million on information technology infrastructure, building improvements and furniture and other equipment, $ 2.39 million on tools, molds and other capital asset additions and $1. 16 million on the development of new patents. |
| · |
| We paid $195.94 million to acquire Healthy Directions. |
Significant highlights of our fiscal year 2014 investing activities
| · |
| We spent $34.03 million on building, information technology infrastructure, improvements, furniture and equipment, and new distribution equipment in connection with the construction and outfitting of our new distribution facility in Olive Branch, Mississippi; and |
| · |
| We spent an additional $4.52 million on other information technology infrastructure, other building improvements and other furniture and equipment, $1.57 million on tools, molds and other capital asset additions and $0.34 million on the development of new patents. |
58
Table of Contents
Significant highlights of our fiscal year 2013 investing activities
| · |
| We spent $2.79 million on molds, tooling and other production equipment, $4.03 million on land for our new Olive Branch, Mississippi distribution center, $2.04 million on facility improvements, $4.75 million on information technology infrastructure and other office furniture and equipment, $0.28 million on the development of new patents, and $0.80 million on other intangible asset additions; and |
| · |
| We received proceeds of $0.74 million on a note receivable associated with the fiscal year 2012 sale of a land parcel in El Paso, Texas. |
Financing Activities:
During fiscal year 2015 , financing activities used $33.87 million of cash compared with $56.52 and $82.64 million used in fiscal year s 2014 and 2013 , respectively .
Significant highlights of our fiscal year 2015 financing activities
| · |
| We had draws of $769.00 million against our revolving credit agreement; |
| · |
| We repaid $431.50 million drawn against our revolving credit agreement; |
| · |
| We repaid $96.90 million of long-term debt; |
| · |
| We incurred $4.59 million in debt acquisition costs in connection with various amendments to our revolving c redit a greement and certain related guarantees during fiscal year 2015; |
| · |
| Employees and certain non-employee members of our Board of Directors exercised options to purchase 187,286 shares of common stock, and employees purchased 31,128 shares of common stock through our Employee Stock Purchase Plan. These programs provided a combined $7.6 2 million of cash, including tax benefits; |
| · |
| We paid $ 4.57 million in tax obligations in connection with the vesting and settlement of certain stock awards to our former CEO and non-employee members of our Board of Directors; |
| · |
| We repurchased and retired 4,174,093 shares of common stock at an average price of $66.70 per share for a total purchase price of $278.43 million through a combination of a modified "Dutch auction" tender offer, the settlement of certain stock awards and open market purchases; and |
| · |
| Share-based compensation expenses provided $0.66 million in current tax benefits. |
Significant highlights of our fiscal year 2014 financing activities
| · |
| We had draws of $107.30 million against our revolving credit agreement; |
| · |
| We repaid $189.30 million drawn against our revolving credit agreement; |
| · |
| We repaid $20 million of long-term debt; |
| · |
| We had draws of $37.61 million against new debt to finance the construction of our new distribution facility in Olive Branch, Mississippi; |
| · |
| We incurred $0.37 million in debt acquisition costs in connection with new long-term debt; |
| · |
| Employees and certain non-employee members of our Board of Directors exercised options to purchase 239,136 shares of common stock, and employees purchased 41,328 shares of common stock through our Employee Stock Purchase Plan. These programs provided a combined $10.29 million of cash, including tax benefits; |
| · |
| We paid $6.45 million in tax obligations in connection with the vesting and settlement of certain stock awards to our former CEO and non-employee members of our Board of Directors; |
| · |
| We repurchased and retired 33,862 shares of common stock at an average price of $38.71 per share for a total purchase price of $1.31 million; and |
59
Table of Contents
| · |
| Share-based compensation expenses provided $5.71 million in current tax benefits. |
Significant highlights of our fiscal year 2013 financing activities
| · |
| We had draws of $234.65 million against our revolving credit facility; |
| · |
| We repaid $323.75 million drawn against our revolving credit facility; |
| · |
| We repaid $3.00 million of long-term debt; |
| · |
| Employees and certain non-employee members of our Board of Directors exercised options to purchase 247,661 shares of common stock, and employees purchased 39,728 shares of common stock through our Employee Stock Purchase Plan. These programs provided $10.39 million of cash, including tax benefits; and |
| · |
| We repurchased and retired 61,426 shares of common stock at a total purchase price of $1.76 million, for a $28.64 per share average price. |
Revolving Credit Agreement and Other Debt Agreements:
Revolving Credit Agreement
The Company had a c redit a greement , dated December 30, 2010, by and among the Company, the Borrower, Bank of America, N.A., as administrative agent, and the other lenders party thereto that provided for an unsecured total revolving commitment of $570 million. On January 16, 2015, the Company entered into that certain Amended and Restated Credit Agreement (the " Credit Agreement") with Bank of America, N.A., as administrative agent, and the other lenders party thereto. The unsecured revolving commitment under the Credit Agreement was increased from $570 million to $650 million, subject to the terms and limitations described below. The maturity of the commitment under the Credit Agreement was extended from December 31, 2015 to January 16, 2020. Additionally, the LIBOR interest rate, letter of credit fees and loan commitment fees under the Credit Agreement were reduced and the limitations of certain covenants were eased . Borrowings under the Credit Agreement accrue interest at a "Base Rate" plus a margin of zero to 1.00 percent per annum based on the l everage r atio at the time of borrowing. The Base Rate is equal to the highest of the Federal Funds Rate plus 0.50 percent, Bank of America's prime rate, or the LIBOR rate plus 1.00 percent. Alternatively, if the Company elects, borrowings accrue interest based on the respective 1, 2, 3, or 6-month LIBOR rate plus a margin of 1.00 to 2.00 percent per annum based upon the l everage r atio at the time of the borrowing. The Company will incur loan commitment fees under the Credit Agreement at a rate ranging from 0.15 to 0.35 percent per annum on the unused balance of the Credit Agreement. Additionally, the Company will incur letter of credit fees under the Credit Agreement at a rate ranging from 1.00 to 2.00 percent per annum on the face value of any letter of credit. All obligations under the Credit Agreement are unconditionally guaranteed , on a joint and several basis, by the Company and certain of the Company's subsidiaries.
Other Debt Agreements
In addition to the Credit Agreement, at February 28, 2015, we had an aggregate principal balance of $60 million of 3.90 % Senior Notes due January 2018 with varying installments due between January 2016 and January 2018. $75 million of principal on our 6.01 % Senior Notes was repaid at maturity on June 30, 2014.
In March 2014, the Company concluded its borrowings under a loan agreement with the Mississippi Business Finance Corporation (the "MBFC Loan"). Under the MBFC Loan, a principal balance of $37.61 million was incurred to fund construction of our Olive Branch, Mississippi distribution facility. A $1.90 million principal payment was made on March 1, 2014. The remaining loan balance is payable as follows: $1.90 million on March 1 in each of 2015, 2018, 2019, 2020, 2021, and 2022; $3.80 million on March 1, 2016; $5.70 million on March 1, 2017; and $14.81 million on March 1, 2023. Any remaining outstanding principal and interest is due upon maturity on March 1, 2023.
On February 18, 2015, the Company entered into a supplement to the indenture related to the MBFC Loan that lowered the interest rate of the loan. Accordingly, from and after February 1, 2015, the MBFC Loan bear s interest at a
60
Table of Contents
variable rate as elected by us equal to either (a) a "Base Rate" plus a margin within a range of 0.00% to 1.00% (decreased from a range of 0.00% to 1.125%), depending upon the leverage ratio or (b) the respective one, two, three, or six-month LIBOR rate plus a margin within a range of 1.00% to 2.00% (decreased from a range of 1.00% to 2.125%), depending upon the leverage ratio.
Our debt agreements require the maintenance of certain financial covenants, including maximum leverage ratios, minimum interest coverage ratios and minimum consolidated net worth levels (as each of these terms are defined in the various agreements). Our debt agreements also contain other customary covenants, including, among other things, covenants restricting or limiting the Company, except under certain conditions set forth therein, from (1) incurring debt, (2) incurring liens on its properties, (3) making certain types of investments, (4) selling certain assets or making other fundamental changes relating to mergers and consolidations, and (5) repurchasing shares of our common stock and paying dividends. Our debt agreements also contain customary events of default, including failure to pay principal or interest when due, among others. Our debt agreements are cross-defaulted to each other. Upon an event of default under our debt agreements, the holders or lenders may, among other things, accelerate the maturity of any amounts outstanding under our debt. Under the terms of our Credit Agreement, the commitments of the lenders to make loans to us are several and not joint. Accordingly, if any lender fails to make loans to us, our available liquidity could be reduced by an amount up to the aggregate amount of such lender's commitments under the revolving credit facility.
61
Table of Contents
The table below provides the formulas currently in effect under various provisions contained in certain key financial covenants under our debt agreements:
|
|
|
|
Applicable Financial Covenant |
| Credit Agreement and MBFC Loan | 3.90% Senior Notes |
|
|
|
|
|
|
| $500 Million |
Minimum Consolidated Net Worth |
| None | + |
|
|
| 25% of Fiscal Quarter Net Earnings |
|
|
| After August 31, 2010 (1) |
|
|
|
|
|
| EBIT (2) | EBIT (2) |
|
| ÷ | ÷ |
Interest Coverage Ratio |
| Interest Expense (2) | Interest Expense (2) |
|
| Minimum Required: 3.00 to 1.00 | Minimum Required: 2.50 to 1.00 |
|
| Total Current and Long Term Debt (3) | Total Current and Long Term Debt (3) |
|
| ÷ | ÷ |
Maximum Leverage Ratio |
| [EBITDA (2) + Pro Forma Effect of | [ EBITDA (2) + Pro Forma Effect of Acquisitions ] |
|
| Acquisitions] |
|
|
| Maximum Allowed: 3.25 to 1.00 | Maximum Allowed: 3.25 to 1.00 |
|
|
|
Key Definitions: |
|
|
|
|
|
EBIT: |
| Earnings Before Non-Cash Charges, Interest Expense and Taxes |
|
|
|
EBITDA: |
| EBIT + Depreciation and Amortization Expense + Share Based Compensation |
|
|
|
Total Capitalization: |
| Total Current and Long Term Debt + Total Equity |
|
|
|
Pro Forma Effect of Acquisitions: |
| For any acquisition, pre-acquisition EBITDA of the acquired business is included so that the EBITDA of the acquired business included in the computation equals its twelve month trailing total. |
Notes:
| (1) |
| Excluding any fiscal quarter net losses. |
| (2) |
| Computed using totals for the latest reported four consecutive fiscal quarters. |
| (3) |
| Computed using the ending balances as of the latest reported fiscal quarter. |
62
Table of Contents
Contractual Obligations
Our contractual obligations and commercial commitments in effect as of the end of fiscal year 2015 were:
PAYMENTS DUE BY PERIOD - TWELVE MONTHS ENDED THE LAST DAY OF FEBRUARY:
(in thousands)
|
|
|
|
|
|
|
|
|
|
|
|
|
|
|
|
|
|
|
|
|
|
|
|
|
|
| 2016 |
| 2017 |
| 2018 |
| 2019 |
| 2020 |
| After | ||||||
|
| Total |
| 1 year |
| 2 years |
| 3 years |
| 4 years |
| 5 years |
| 5 years | |||||||
Fixed rate debt |
| $ | 60,000 |
| $ | 20,000 |
| $ | 20,000 |
| $ | 20,000 |
| $ | - |
| $ | - |
| $ | - |
Floating rate debt |
|
| 373,207 |
|
| 1,900 |
|
| 3,800 |
|
| 5,700 |
|
| 1,900 |
|
| 339,400 |
|
| 20,507 |
Long-term incentive plan payouts |
|
| 12,379 |
|
| 5,718 |
|
| 4,096 |
|
| 2,565 |
|
| - |
|
| - |
|
| - |
Interest on fixed rate debt |
|
| 4,372 |
|
| 2,236 |
|
| 1,460 |
|
| 676 |
|
| - |
|
| - |
|
| - |
Interest on floating rate debt |
|
| 38,366 |
|
| 7,805 |
|
| 7,732 |
|
| 7,622 |
|
| 7,586 |
|
| 6,655 |
|
| 966 |
Open purchase orders |
|
| 197,998 |
|
| 197,998 |
|
| - |
|
| - |
|
| - |
|
| - |
|
| - |
Long-term purchase commitments |
|
| 2,609 |
|
| 1,094 |
|
| 606 |
|
| 606 |
|
| 303 |
|
| - |
|
| - |
Minimum royalty payments |
|
| 73,283 |
|
| 12,566 |
|
| 12,567 |
|
| 12,518 |
|
| 9,708 |
|
| 8,446 |
|
| 17,478 |
Advertising and promotional |
|
| 54,059 |
|
| 11,284 |
|
| 5,901 |
|
| 6,054 |
|
| 6,162 |
|
| 6,271 |
|
| 18,387 |
Operating leases |
|
| 20,791 |
|
| 4,063 |
|
| 3,467 |
|
| 2,876 |
|
| 2,720 |
|
| 1,394 |
|
| 6,271 |
Capital spending commitments |
|
| 2,597 |
|
| 2,597 |
|
| - |
|
| - |
|
| - |
|
| - |
|
| - |
Total contractual obligations (1) |
| $ | 839,661 |
| $ | 267,261 |
| $ | 59,629 |
| $ | 58,617 |
| $ | 28,379 |
| $ | 362,166 |
| $ | 63,609 |
| (1) |
| In addition to the contractual obligations and commercial commitments in the table above, as of February 28, 2015 , we have recorded a provision for uncertain tax positions of $10.30 million. We are unable to reliably estimate the timing of most of the future payments, if any, related to uncertain tax positions; therefore, we have excluded these tax liabilities from the table above. |
Off-Balance Sheet Arrangements
We have no existing activities involving special purpose entities or off-balance sheet financing.
Current and Future Capital Needs
Based on our current financial condition and current operations, we believe that cash flows from operations and available financing sources will continue to provide sufficient capital resources to fund our foreseeable short- and long-term liquidity requirements. We expect our capital needs to stem primarily from the need to purchase sufficient levels of inventory and to carry normal levels of accounts receivable on our balance sheet. In addition, we continue to evaluate acquisition opportunities on a regular basis. We may finance acquisition activity with available cash, the issuance of shares of common stock, additional debt, or other sources of financing, depending upon the size and nature of any such transaction and the status of the capital markets at the time of such acquisition. The Company may also elect to repurchase additional shares of common stock up to the balance of its current authorization over the next two fiscal years, subject to limitations contained in its debt agreements and based upon its assessment of a number of factors, including share price, trading volume and general market conditions, working capital requirements, general business conditions, financial conditions, any applicable contractual limitations and other factors, including alternative investment opportunities. For additional information, see Part II, Item 2., "Unregistered Sales of Equity Securities and Use of Proceeds" in this report.
63
Table of Contents
CRITICAL ACCOUNTING POLICIES
The SEC defines critical accounting policies as those that are both most important to the portrayal of a company's financial condition and results, and require management's most difficult, subjective or complex judgments, often as a result of the need to make estimates about the effect of matters that are inherently uncertain. We consider the following policies to meet this definition.
-
We must make certain estimates and judgments in determining income tax expense for financial statement purposes. These estimates and judgments must be used in the calculation of certain tax assets and liabilities because of differences in the timing of recognition of revenue and expense for tax and financial statement purposes. We must assess the likelihood that we will be able to recover our deferred tax assets. If recovery is not likely, we must increase our provision for taxes by recording a valuation allowance against the deferred tax assets that we estimate will not ultimately be recoverable. As changes occur in our assessments regarding our ability to recover our deferred tax assets, our tax provision is increased in any period in which we determine that the recovery is not probable.
In addition, the calculation of our tax liabilities requires us to account for uncertainties in the application of complex tax regulations. We recognize liabilities for uncertain tax positions based on the two-step process prescribed within the topic. The first step is to evaluate the tax position for recognition by determining if the weight of available evidence indicates that it is more likely than not that the position will be sustained on audit based upon its technical merits, including resolution of related appeals or litigation processes, if any. The second step requires us to estimate and measure the tax benefit as the largest amount that has greater than a 50 percent likelihood of being realized upon ultimate settlement. It is inherently difficult and subjective to estimate such amounts, as this requires us to determine the probability of various possible outcomes. We reevaluate these uncertain tax positions on a quarterly basis. This evaluation is based on factors including, but not limited to, changes in facts or circumstances, changes in tax law, effectively settled issues under audit, historical experience with similar tax matters, guidance from our tax advisors, and new audit activity. A change in recognition or measurement would result in the recognition of a tax benefit or an additional charge to the tax provision in the period in which the change occurs.
Estimates of credits to be issued to customers - We regularly receive requests for credits from retailers for returned products or in connection with sales incentives, such as cooperative advertising and volume rebate agreements. We reduce sales or increase SG&A, depending on the nature of the credits, for estimated future credits to customers. Our estimates of these amounts are based on either historical information about credits issued, relative to total sales, or on specific knowledge of incentives offered to retailers. This process entails a significant amount of subjectivity and uncertainty.
Valuation of inventory – We currently record inventory on our balance sheet at average cost, or net realizable value, if it is below our recorded cost. Determination of net realizable value requires us to estimate the point in time at which an item's net realizable value drops below its recorded cost. We regularly review our inventory for slow-moving items and for items that we are unable to sell at prices above their original cost. When we identify such an item, we reduce its book value to the net amount that we expect to realize upon its sale. This process entails a significant amount of inherent subjectivity and uncertainty.
Goodwill and Indefinite-Lived Intangibles – As a result of acquisitions, we have significant intangible assets on our balance sheet that include goodwill and indefinite-lived intangibles (primarily trademarks and licenses). Accounting for business combinations requires the use of estimates and assumptions in determining the fair value of assets acquired and liabilities assumed in order to properly allocate the purchase price. The estimates of the fair value of the assets acquired and liabilities assumed are based upon assumptions believed to be reasonable using established valuation techniques that consider a number of factors, and when appropriate, valuations performed by independent third-party appraisers.
We consider whether circumstances or conditions exist which suggest that the carrying value of our goodwill and other long-lived assets might be impaired. If such circumstances or conditions exist, further steps are required in order to determine whether the carrying value of each of the individual assets exceeds its fair market value. If analysis indicates
64
Table of Contents
that an individual asset's carrying value does exceed its fair market value, the next step is to record a loss equal to the excess of the individual asset's carrying value over its fair value. The steps entail significant amounts of judgment and subjectivity. We complete our analysis of the carrying value of our goodwill and other intangible assets during the first quarter of each fiscal year, or more frequently whenever events or changes in circumstances indicate that their carrying value may not be recoverable.
Considerable management judgment is necessary in reaching a conclusion regarding the reasonableness of fair value estimates, evaluating the most likely impact of a range of possible external conditions, considering the resulting operating changes and their impact on estimated future cash flows, determining the appropriate discount factors to use, and selecting and weighting appropriate comparable market level inputs.
The Company continues to monitor its reporting units for any triggering events or other signs of impairment. For both the goodwill and indefinite-lived intangible assets in its reporting units, the recoverability of these amounts is dependent upon achievement of the Company's projections and the continued execution of key initiatives related to revenue growth and improved profitability. The rates used in our projections are management's estimate of the most likely results over time, given a wide range of potential outcomes. The assumptions and estimates used in our impairment testing involve significant elements of subjective judgment and analysis by the Company's management. While we believe that the assumptions we use are reasonable at the time made, changes in business conditions or other unanticipated events and circumstances may occur that cause actual results to differ materially from projected results and this could potentially require future adjustments to our asset valuations.
Carrying value of other long-lived assets - We consider whether circumstances or conditions exist that suggest that the carrying value of a long-lived asset might be impaired. If such circumstances or conditions exist, further steps are required in order to determine whether the carrying value of the asset exceeds its fair market value. If analysis indicates that the asset's carrying value does exceed its fair market value, the next step is to record a loss equal to the excess of the asset's carrying value over its fair value. The steps entail significant amounts of judgment and subjectivity.
Economic useful life of intangible assets - We amortize intangible assets, such as licenses, trademarks, customer lists and distribution rights over their economic useful lives, unless those assets' economic useful lives are indefinite. If an intangible asset's economic useful life is deemed indefinite, that asset is not amortized. When we acquire an intangible asset, we consider factors such as the asset's history, our plans for that asset and the market for products associated with the asset. We consider these same factors when reviewing the economic useful lives of our previously acquired intangible assets as well. We review the economic useful lives of our intangible assets at least annually. The determination of the economic useful life of an intangible asset requires a significant amount of judgment and entails significant subjectivity and uncertainty. We complete our analysis of the remaining useful economic lives of our intangible assets during the first quarter of each fiscal year.
Share-based Compensation - We account for share-based employee compensation plans under the fair value recognition and measurement provisions in accordance with applicable accounting standards, which require all share-based payments to employees, including grants of stock options, restricted stock awards ("RSAs"), restricted stock units ("RSUs") and performance restricted stock units ("PSUs"), to be measured based on the grant date fair value of the awards . T he resulting expense is recognized over the period s during which the employee is required to perform service in exchange for the award. The estimated number of PSU's that will ultimately vest requires judgment, and to the extent actual results or updated estimates differ from our current estimates, such amounts will be recorded as a cumulative adjustment in the period estimates are revised.
Stock options are recognized in the financial statements based on their fair values using an option pricing model at the date of grant. We use a Black-Scholes option-pricing model to calculate the fair value of options. This model requires various judgmental assumptions including volatility, forfeiture rates and expected option life.
All s hare-based compensation expense is recorded net of estimated forfeitures in our consolidated statements of income and as such is recorded for only those share-based awards that we expect to vest. We estimate the forfeiture rate
65
Table of Contents
based on historical forfeitures of equity awards and adjust the rate to reflect changes in facts and circumstances, if any. We revise our estimated forfeiture rate if actual forfeitures differ from our initial estimates. Changes in any of our estimates and assumptions may cause us to realize material changes in stock-based compensation expense in the future.
For a more comprehensive list of our accounting policies, we encourage you to read Note (1) included in the accompanying consolidated financial statements. Note (1) describes several other policies, including policies governing the timing of revenue recognition, that are important to the preparation of our consolidated financial statements, but do not meet the SEC's definition of critical accounting policies because they do not involve subjective or complex judgments.
NEW ACCOUNTING GUIDANCE
Refer to Note (1) in the accompanying consolidated financial statements for a discussion of any new accounting pronouncements and the potential impact to our consolidated results of operations and financial position.
66
Table of Contents
EXPLANATION OF CERTAIN TERMS AND MEASURES USED IN MD&A
Accounts receivable turnover: Twelve-month trailing net sales revenue divided by the average of the current and prior four fiscal quarters' ending accounts receivable balances. This result is divided into 365 to express turnover in terms of average days outstanding.
Core business: Core business is net sales revenue and related operations associated with product lines or brands after the first twelve months from the date the product line or brand was acquired. Net sales revenue and related operations from internally developed product lines or brands are always considered core business.
Corporate costs: All general corporate managerial and related administrative compensation costs, legal, accounting, and regulatory compliance costs together with associated operating overhead that is not directly attributable to any one operating segment, but benefits the Company as a whole. These charges are allocated to each operating segment based upon a number of factors depending on the nature of the expense. Such factors include relative revenues, estimates of relative labor expenditures for each segment, and certain intangible asset levels held by each segment.
Current r atio : Current assets divided by current liabilities at the end of a reporting period, expressed as a ratio.
Ending debt to ending equity ratio: Total interest bearing short- and long-term debt divided by shareholder's equity.
Inventory turnover: Twelve-month trailing cost of goods sold divided by the average of the current and prior four fiscal quarters' ending inventory balances.
Net sales revenue growth from acquisitions: Net sales revenue growth associated with product lines or brands that we have acquired and operated for less than twelve months during each period presented.
Operating expense ratio: Total operating expense (SG&A plus asset impairment charges) for the Company or a segment divided by the related net sales revenue for the Company or a segment.
Operating leverage: The improvement in operating margin that the Company achieves with sales growth, due to the fixed nature of certain operating expenses.
Operating margin: Operating income for the Company or a segment divided by the related net sales revenue for the Company or a segment.
Return on average equity: Twelve month trailing net income divided by the average of the current and prior four fiscal quarters' ending shareholders' equity.
Segment operating income: We compute segment operating income based on net sales revenue, less cost of goods sold, SG&A, and any asset impairment charges associated with the segment. The SG&A used to compute each segment operating income is directly associated with the segment. We then deduct allocations for operational shared services and corporate costs. We do not allocate nonoperating income and expense, including interest or income taxes to operating segments.
SG&A ratio: This is total SG&A for the Company or a segment divided by the related net sales revenue for the Company or a segment.
Working capital: Current assets less current liabilities.
67
Table of Contents
ITEM 7A
. QUANTITATIVE AND QUALITATIVE DISCLOSURES ABOUT MARKET RISK
Changes in currency exchange rates and interest rates are our primary financial market risks.
Foreign Currency Risk
Our functional currency is the U.S. Dollar. By operating internationally, we are subject to foreign currency risk from transactions denominated in currencies other than the U.S. Dollar ("foreign currencies"). Such transactions include sales, certain inventory purchases and operating expenses. As a result of such transactions, portions of our cash, trade accounts receivable and trade accounts payable are denominated in foreign currencies. For the fiscal years 2015 , 2014 and 2013 , approximately 14 , 15 and 15 percent, respectively, of our net sales revenue was in foreign currencies. These sales were primarily denominated in British Pounds, Euros, Mexican Pesos, Canadian Dollars, Australian Dollars, Peruvian Soles, and Venezuelan Bolivars. We make most of our inventory purchases from the Far East and use the U.S. Dollar for such purchases. In our consolidated statements of income, exchange gains and losses resulting from the remeasurement of foreign taxes receivable, taxes payable, deferred tax assets, and deferred tax liabilities, are recognized in their respective income tax lines, and all other foreign exchange gains and losses are recognized in SG&A.
We identify foreign currency risk by regularly monitoring our foreign currency-denominated transactions and balances. Where operating conditions permit, we reduce foreign currency risk by purchasing most of our inventory with U.S. Dollars and by converting cash balances denominated in foreign currencies to U.S. Dollars.
We have historically hedged against certain foreign currency exchange rate-risk by using a series of forward contracts designated as cash flow hedges to protect against the foreign currency exchange risk inherent in our forecasted transactions denominated in currencies other than the U.S. Dollar. In these transactions, we execute a forward currency contract that will settle at the end of a forecasted period. Because the size and terms of the forward contract are designed so that its fair market value will move in the opposite direction and approximate magnitude of the underlying foreign currency's forecasted exchange gain or loss during the forecasted period, a hedging relationship is created. To the extent that we forecast the expected foreign currency cash flows from the period we enter into the forward contract until the date it will settle with reasonable accuracy, we significantly lower or materially eliminate a particular currency's exchange risk exposure over the life of the related forward contract. We enter into these types of agreements where we believe we have meaningful exposure to foreign currency exchange risk and the hedge pricing appears reasonable. It is not practical for us to hedge all our exposures, nor are we able to project in any meaningful way the possible effect and interplay of all foreign currency fluctuations on translated amounts or future earnings. This is due to our constantly changing exposure to various currencies, the fact that each foreign currency reacts differently to the U.S. Dollar and the significant number of currencies involved. Accordingly, we will always be subject to foreign exchange rate-risk on exposures we have not hedged, and these risks may be material. We do not enter into any forward exchange contracts or similar instruments for trading or other speculative purposes. We expect that as currency market conditions warrant, and our foreign denominated transaction exposure grows, we will continue to execute additional contracts in order to hedge against certain potential foreign exchange losses.
-
A significant portion of the products we sell are purchased from third-party manufacturers in China . During fiscal years 2015 and 2013, the Chinese Renminbi remained relatively flat against the U.S. Dollar. During fiscal year 2014, the Chinese Renminbi appreciated against the U.S. Dollar approximately 3 percent. While China's currency intervention strategy with respect to the U.S. Dollar is continuously evolving, we believe that China's currency may continue to fluctuate against the U.S. Dollar in the short-to-intermediate term, which could result in increased product costs over time.
68
Table of Contents
Venezuelan Bolivar Currency Exchange Uncertainties - In February 2013, the Venezuelan government devalued its currency from 4.30 to 6.30 Bolivars per U.S. Dollar for all goods and services. In March 2013, the Venezuelan government announced an additional complementary auction-based exchange rate mechanism known as SICAD 1. SICAD 1 was made available to certain companies that operate in designated industry sectors. At February 28, 2015 , the SICAD 1 rate was 12 Bolivars to the U.S. Dollar.
In early 2014, the Venezuelan government created a National Center of Foreign Commerce ("CENCOEX") to control the multiple currency exchange rate mechanisms that may be available for a company to exchange funds. CENCOEX was granted the authority to determine the sectors that will be allowed to buy U.S. dollars in SICAD auctions, and subsequently introduced a more accessible market-based, SICAD 2 daily auction exchange market.
In February 2015, the Venezuelan Government unveiled its latest foreign exchange mechanism known as SIMADI, which replaced the S ICAD 2 rate as the lowest rate in Venezuela's three-tier foreign exchange system. Under the latest program , SICAD 1 (now referred to as "SICAD") is still being used in limited circumstances , which we believe preclude us from accessing such rates if we chose to do so . SIMADI is a somewhat less restrictive auction system whose value is determined by ma rket forces. SIMADI is currently under a trial period and accounts for a small percentage of Venezuelan's foreign exchange. At February 28, 2015 , the SI MADI rate was approximately 177 Bolivars to the U.S. Dollar.
Despite the recent changes made by the Venezuelan government, there remains a significant degree of uncertainty as to which exchange markets might be available to the Company . To date, we have not gained access to U.S. Dollars in Venezuela through either SICAD or SI MADI mechanisms . As of February 28, 2015 , these auctions had not eliminated or changed the official rate of 6.30 Bolivars per U.S. Dollar.
Our business in Venezuela continues to be entirely self-funded with earnings from operations. We have no current need or intention to repatriate Venezuelan earnings and remain committed to the business for the long-term. Within Venezuela, we market primarily liquid, solid- and powder-based personal care and grooming products , which are sourced almost entirely within the country. We do not have, nor do we foresee having, any need to access SICAD or SIMADI . Accordingly, we continue to utilize the official rate of 6.30 Bolivars per U.S. Dollar to re-measure our Venezuelan financial statements.
For the fiscal years 2015 , 2014 and 2013 sales in Venezuela represented approximately 0.7 , 0.6 and 0.6 percent, respectively, of the Company's consolidated net sales revenue. At February 28, 2015 and 2014 , we had a U.S. Dollar based net investment in our Venezuelan business of $10.38 and $7.35 million, respectively, consisting almost entirely of working capital.
Developments within the Venezuelan economy, including any future governmental interventions, are beyond our ability to control or predict, and we cannot assess impacts, if any, such events may have on our Venezuelan business. We will continue to closely monitor the applicability and viability of the various exchange mechanisms.
Interest Rate Risk
Interest on our outstanding debt as of February 28, 2015 is both floating and fixed. Fixed rates are in place on $60 million of Senior Notes at 3.90 percent and floating rates are in place on the balance of all other debt outstanding, which totaled $373.21 million as of February 28, 2015 . If short-term interest rates increase, we will incur higher interest rates on any future outstanding balances under the Credit Agreement and MFBC Loan.
At February 28, 2014, floating rate $75 million Senior Notes due June 2014 had been effectively converted to fixed rate debt using an interest rate swap (the "swap"). The swap converted the total aggregate notional principal from floating interest rate payments to fixed interest rate payments at 6.01 percent. Changes in the spread between the fixed rate payment side of the swap and the floating rate receipt side of the swap offset 100 percent of the c hange in any period of the underlying debt's floating rate payments. The swap was 100 percent effective. As of June 30, 2014, the swap ended concurrent with the repayment at maturity of $75 million of principal on the related Senior Notes.
69
Table of Contents
The following table summarizes the fair values of our various derivative instruments at the end of fiscal years 2015 and 2014
FAIR VALUES OF DERIVATIVE INSTRUMENTS
(in thousands)
|
|
|
|
|
|
|
|
|
|
|
|
|
|
|
| February 28, 2015 | |||||||||||
|
|
|
|
|
|
|
|
| Prepaid |
| Accrued | ||
|
|
|
|
|
|
|
|
| Expenses |
| Expenses | ||
|
|
|
| Final |
|
|
|
| and Other |
| and Other | ||
|
|
|
| Settlement |
| Notional |
| Current |
| Current | |||
Designated as hedging instruments |
| Hedge Type |
| Date |
| Amount |
| Assets |
| Liabilities | |||
Foreign currency contracts - sell Euro |
| Cash flow |
| 1/2016 |
| € | 10,000 |
| $ | 129 |
| $ | - |
Foreign currency contracts - sell Pounds |
| Cash flow |
| 2/2016 |
| £ | 6,900 |
|
| - |
|
| 240 |
Total fair value |
|
|
|
|
|
|
|
| $ | 129 |
| $ | 240 |
|
|
|
|
|
|
|
|
|
|
|
|
|
|
|
| February 28, 2014 | |||||||||||
|
|
|
|
|
|
|
|
| Prepaid |
| Accrued | ||
|
|
|
|
|
|
|
|
| Expenses |
| Expenses | ||
|
|
|
| Final |
|
|
|
| and Other |
| and Other | ||
|
|
|
| Settlement |
| Notional |
| Current |
| Current | |||
Designated as hedging instruments |
| Hedge Type |
| Date |
| Amount |
| Assets |
| Liabilities | |||
Foreign currency contracts - sell Euro |
| Cash flow |
| 6/2014 |
| € | 2,850 |
| $ | - |
| $ | 89 |
Foreign currency contracts - sell Pounds |
| Cash flow |
| 11/2014 |
| £ | 4,250 |
|
| - |
|
| 280 |
Interest rate swap |
| Cash flow |
| 6/2014 |
| $ | 75,000 |
|
| - |
|
| 1,227 |
Total fair value |
|
|
|
|
|
|
|
| $ | - |
| $ | 1,596 |
Counterparty Credit Risk
Financial instruments, including foreign currency contracts and interest rate swaps, expose us to counterparty credit risk for nonperformance. We manage our exposure to counterparty credit risk by dealing with counterparties who are substantial international financial institutions with significant experience using such derivative instruments. Although our theoretical credit risk is the replacement cost at the then estimated fair value of these instruments, we believe that the risk of incurring credit risk losses is remote.
70
Table of Contents
Rate Sensitive Financial Instruments
The following table shows the approximate potential fair value change in U.S. Dollars that would arise from a hypothetical adverse 10 percent change in certain market based rates underlying our rate sensitive financial instruments as of February 28, 2015 and 2014 .
CHANGE IN FAIR VALUE DUE TO AN ADVERSE MOVE IN RELATED RATES
(in thousands)
|
|
|
|
|
|
|
|
|
|
|
|
|
|
| February 28, 2015 | ||||||||||
|
| Face or |
|
|
|
|
|
|
| Estimated | ||
|
| Notional |
| Carrying |
| Fair |
| Change in | ||||
|
| Amount |
| Value |
| Value |
| Fair Value | ||||
Fixed Rate Long-Term Debt (1) |
| $ | 60,000 |
| $ | (60,000) |
| $ | (62,006) |
| $ | (228) |
Foreign Currency Exchange Contracts - Pounds (2) |
| £ | 6,900 |
| $ | (240) |
| $ | (240) |
| $ | (1,306) |
Foreign Currency Exchange Contracts - Euros (2) |
| € | 10,000 |
| $ | 129 |
| $ | 129 |
| $ | (994) |
|
|
|
|
|
|
|
|
|
|
|
|
|
|
| February 28, 2014 | ||||||||||
|
| Face or |
|
|
|
|
|
|
| Estimated | ||
|
| Notional |
| Carrying |
| Fair |
| Change in | ||||
|
| Amount |
| Value |
| Value |
| Fair Value | ||||
Fixed Rate Long-Term Debt (1) |
| $ | 80,000 |
| $ | (80,000) |
| $ | (83,951) |
| $ | (332) |
Interest Rate Swaps (3) |
| $ | 75,000 |
| $ | (1,227) |
| $ | (1,227) |
| $ | (5) |
Foreign Currency Exchange Contracts - Pounds (2) |
| £ | 4,250 |
| $ | (280) |
| $ | (280) |
| $ | (710) |
Foreign Currency Exchange Contracts - Euros (2) |
| € | 2,850 |
| $ | (89) |
| $ | (89) |
| $ | (395) |
| (1) |
| The underlying interest rates used as a basis for these estimates are rates quoted by our lenders on fixed rate notes of similar term and credit quality as of the balance sheet dates shown. |
| (2) |
| Appreciation in the value of the U.S. Dollar would result in an increase in the fair value of the related foreign currency contracts. |
| (3) |
| The underlying interest rates were based on projections over the related lives of the underlying swap contracts of expected three-month LIBOR rates. |
The table above is for risk analysis purposes and does not purport to represent actual losses or gains in fair value that we will incur. It is important to note that the change in value represents the estimated change in the fair value of the contracts. Actual results in the future may differ materially from these estimated results due to actual developments in the global financial markets. Because the contracts hedge an underlying exposure, we would expect a similar and opposite change in foreign exchange gains or losses and floating interest rates over the same periods as the contracts.
We expect that as currency market conditions warrant, and if our foreign denominated transaction exposure grows, we will continue to execute additional contracts in order to hedge against potential foreign exchange losses.
71
Table of Contents
ITEM 8. FINANCIAL STATEMENTS AND SUPPLEMENTARY DATA
INDEX TO CONSOLIDATED FINANCIAL STATEMENTS
AND FINANCIAL STATEMENT SCHEDULE
|
| PAGE | |
|
|
| |
Management's Report on Internal Control Over Financial Reporting |
| 73 | |
|
|
| |
Reports of Independent Registered Public Accounting Firm |
| 74 | |
|
|
| |
Consolidated Financial Statements: |
|
| |
|
|
| |
| Consolidated Balance Sheets as of February 28, 2015 and February 28, 2014 |
| 76 |
|
|
|
|
| Consolidated Statements of Income for each of the years in the three-year period ended February 28, 2015 |
| 77 |
|
|
|
|
| Consolidated Statements of Comprehensive Income for each of the years in the three-year period ended February 28, 2015 |
| 78 |
|
|
|
|
| Consolidated Statements of Stockholders' Equity for each of the years in the three-year period ended February 28, 2015 |
| 79 |
|
|
|
|
| Consolidated Statements of Cash Flows for each of the years in the three-year period ended February 28, 2015 |
| 80 |
|
|
|
|
| Notes to Consolidated Financial Statements |
| 81 |
|
|
|
|
Financial Statement Schedule: |
|
| |
|
|
| |
| Schedule II - Valuation and Qualifying Accounts for each of the years in the three-year period ended February 28, 2015 |
| 121 |
All other schedules are omitted as the required information is included in the consolidated financial statements or is not applicable.
72
Table of Contents
MANAGEMENT'S REPOR
T ON INTERNAL CONTROL OVER FINANCIAL REPORTING
Helen of Troy's management is responsible for establishing and maintaining adequate internal control over financial reporting as defined by Rules 13a-15(f) or 15d-15(f) under the Securities Exchange Act.
Our internal control system is designed to provide reasonable assurance regarding the reliability of financial reporting and the preparation of financial statements for external purposes in accordance with U.S. generally accepted accounting principles and includes those policies and procedures that:
| · |
| pertain to the maintenance of records that, in reasonable detail, accurately and fairly reflect our transactions and dispositions of assets; |
| · |
| provide reasonable assurance that transactions are recorded as necessary to permit preparation of financial statements in accordance with generally accepted accounting principles, and that our receipts and expenditures are being made only in accordance with authorizations of our management and Board of Directors; and |
| · |
| provide reasonable assurance regarding prevention or timely detection of unauthorized acquisition, use or disposition of our assets that could have a material effect on the financial statements. |
There are inherent limitations in the effectiveness of internal control over financial reporting, including the possibility that misstatements may not be prevented or detected. Furthermore, the effectiveness of internal controls may become inadequate because of future changes in conditions, or variations in the degree of compliance with our policies or procedures.
Our management assesses the effectiveness of our internal control over financial reporting using the criteria set forth by the Committee of Sponsoring Organizations of the Treadway Commission ("COSO") in the 2013 Internal Control-Integrated Framework . Based on our assessment, we concluded that our internal control over financial reporting was effective as of February 28, 2015 .
Our independent registered public accounting firm, Grant Thornton LLP, has issued an audit report on the effectiveness of the Company's internal control over financial reporting. This report appears on page 74 .
73
Table of Contents
REPORT OF INDEPENDEN
T REGISTERED PUBLIC ACCOUNTING FIRM
Board of Directors and Shareholders
Helen of Troy Limited and Subsidiaries
We have audited the internal control over financial reporting of Helen of Troy Limited and Subsidiaries (the "Company") as of February 28, 2015 , based on criteria established in the 2013 Internal Control-Integrated Framework issued by the Committee of Sponsoring Organizations of the Treadway Commission ("COSO"). The Company's management is responsible for maintaining effective internal control over financial reporting and for its assessment of the effectiveness of internal control over financial reporting, included in the accompanying Management's Report on Internal Control over Financial Reporting . Our responsibility is to express an opinion on the Company's internal control over financial reporting based on our audit.
We conducted our audit in accordance with the standards of the Public Company Accounting Oversight Board (United States). Those standards require that we plan and perform the audit to obtain reasonable assurance about whether effective internal control over financial reporting was maintained in all material respects. Our audit included obtaining an understanding of internal control over financial reporting, assessing the risk that a material weakness exists, testing and evaluating the design and operating effectiveness of internal control based on the assessed risk, and performing such other procedures as we considered necessary in the circumstances. We believe that our audit provides a reasonable basis for our opinion.
A company's internal control over financial reporting is a process designed to provide reasonable assurance regarding the reliability of financial reporting and the preparation of financial statements for external purposes in accordance with generally accepted accounting principles. A company's internal control over financial reporting includes those policies and procedures that (1) pertain to the maintenance of records that, in reasonable detail, accurately and fairly reflect the transactions and dispositions of the assets of the company; (2) provide reasonable assurance that transactions are recorded as necessary to permit preparation of financial statements in accordance with generally accepted accounting principles, and that receipts and expenditures of the company are being made only in accordance with authorizations of management and directors of the company; and (3) provide reasonable assurance regarding prevention or timely detection of unauthorized acquisition, use, or disposition of the company's assets that could have a material effect on the financial statements.
Because of its inherent limitations, internal control over financial reporting may not prevent or detect misstatements. Also, projections of any evaluation of effectiveness to future periods are subject to the risk that the controls may become inadequate because of changes in conditions, or that the degree of compliance with the policies or procedures may deteriorate.
In our opinion, the Company maintained, in all material respects, effective internal control over financial reporting as of February 28, 2015 , based on the criteria established in the 2013 Internal Control-Integrated Framework issued by COSO.
We also have audited, in accordance with the standards of the Public Company Accounting Oversight Board (United States), the consolidated financial statements of the Company as of and for the year ended February 28, 201 5 , and our report dated April 29, 201 5 expressed an unqualified opinion on those financial statements .
/s/ GRANT THORNTON LLP
Dallas, Texas
April 29, 201 5
74
Table of Contents
REPORT OF INDEPENDENT REGISTERED PUBLIC ACCOUNTING FIRM
Board of Directors and Shareholders
Helen of Troy Limited and Subsidiaries
We have audited the accompanying consolidated balance sheets of Helen of Troy Limited and Subsidiaries (the "Company") as of February 28, 201 5 and February 28, 201 4 , and the related consolidated statements of income, comprehensive income, stockholders' equity, and cash flows for each of the three years in the period ended February 28, 2015 . Our audits of the consolidated financial statements included the financial statement schedule listed in the index appearing under Item 15(a)(2). These financial statements and the financial statement schedule are the responsibility of the Company's management. Our responsibility is to express an opinion on these financial statements and financial statement schedule based on our audits.
We conducted our audits in accordance with the standards of the Public Company Accounting Oversight Board (United States). Those standards require that we plan and perform the audit to obtain reasonable assurance about whether the financial statements are free of material misstatement. An audit includes examining, on a test basis, evidence supporting the amounts and disclosures in the financial statements. An audit also includes assessing the accounting principles used and significant estimates made by management, as well as evaluating the overall financial statement presentation. We believe that our audits provide a reasonable basis for our opinion.
In our opinion, the consolidated financial statements referred to above present fairly, in all material respects, the financial position of Helen of Troy Limited and Subsidiaries as of February 28, 201 5 and February 28, 201 4 , and the results of their operations and their cash flows for each of the three years in the period ended February 28, 201 5 , in conformity with accounting principles generally accepted in the United States of America. Also in our opinion, the related financial statement schedule, when considered in relation to the basic consolidated financial statements taken as a whole, presents fairly, in all material respects, the information set forth therein.
We also have audited, in accordance with the standards of the Public Company Accounting Oversight Board (United States), the Company's internal control over financial reporting as of February 28, 2015 , based on criteria established in the 2013 Internal Control-Integrated Framework issued by the Committee of Sponsoring Organizations of the Treadway Commission ("COSO") and our report dated April 29, 201 5 expressed an unqualified opinion.
/s/ GRANT THORNTON LLP
Dallas, Texas
April 29, 201 5
75
Table of Contents
HELEN OF TROY LIMITED AND SUBSIDIARIES
Consolidated Balance Sheets
(in thousands, except shares and par value)
|
|
|
|
|
|
|
|
| February 28, |
| February 28, | ||
|
| 2015 |
| 2014 | ||
Assets |
|
|
|
|
|
|
Assets, current: |
|
|
|
|
|
|
Cash and cash equivalents |
| $ | 12,295 |
| $ | 70,027 |
Receivables - principally trade, less allowances of $5,882 and $4,679 |
|
| 222,499 |
|
| 213,054 |
Inventory, net |
|
| 293,081 |
|
| 289,255 |
Prepaid expenses and other current assets |
|
| 9,715 |
|
| 10,097 |
Income taxes receivable |
|
| 417 |
|
| 3,783 |
Deferred tax assets, net |
|
| 26,753 |
|
| 29,260 |
Total assets, current |
|
| 564,760 |
|
| 615,476 |
|
|
|
|
|
|
|
Property and equipment, net of accumulated depreciation of $82,154 and $71,516 |
|
| 126,068 |
|
| 129,117 |
Goodwill |
|
| 549,727 |
|
| 453,241 |
Other intangible assets, net of accumulated amortization of $111,627 and $94,698 |
|
| 398,430 |
|
| 322,309 |
Deferred tax assets, net |
|
| 2,132 |
|
| 2,523 |
Other assets, net of accumulated amortization of $9,166 and $6,781 |
|
| 12,638 |
|
| 10,636 |
Total assets |
| $ | 1,653,755 |
| $ | 1,533,302 |
|
|
|
|
|
|
|
Liabilities and Stockholders' Equity |
|
|
|
|
|
|
Liabilities, current: |
|
|
|
|
|
|
Accounts payable, principally trade |
| $ | 98,564 |
| $ | 75,585 |
Accrued expenses and other current liabilities |
|
| 141,201 |
|
| 156,688 |
Deferred tax liabilities, net |
|
| 200 |
|
| 181 |
Long-term debt, current maturities |
|
| 21,900 |
|
| 96,900 |
Total liabilities, current |
|
| 261,865 |
|
| 329,354 |
|
|
|
|
|
|
|
Long-term debt, excluding current maturities |
|
| 411,307 |
|
| 95,707 |
Deferred tax liabilities, net |
|
| 52,711 |
|
| 56,988 |
Other liabilities, noncurrent |
|
| 23,307 |
|
| 21,766 |
Total liabilities |
|
| 749,190 |
|
| 503,815 |
|
|
|
|
|
|
|
Commitments and contingencies |
|
|
|
|
|
|
|
|
|
|
|
|
|
Stockholders' equity: |
|
|
|
|
|
|
Cumulative preferred stock, non-voting, $1.00 par. Authorized 2,000,000 shares; none issued |
|
| - |
|
| - |
Common stock, $0.10 par. Authorized 50,000,000 shares; 28,488,411 and 32,272,519 shares |
|
|
|
|
|
|
issued and outstanding |
|
| 2,849 |
|
| 3,227 |
Additional paid in capital |
|
| 179,934 |
|
| 180,861 |
Accumulated other comprehensive loss |
|
| (76) |
|
| (1,091) |
Retained earnings |
|
| 721,858 |
|
| 846,490 |
Total stockholders' equity |
|
| 904,565 |
|
| 1,029,487 |
Total liabilities and stockholders' equity |
| $ | 1,653,755 |
| $ | 1,533,302 |
See accompanying notes to consolidated financial statements.
76
Table of Contents
HELEN OF TROY LIMITED AND SUBSIDIARIES
Consolidated Statements of Income
(in thousands, except per share data)
|
|
|
|
|
|
|
|
|
|
|
| Fiscal Years Ended the Last Day of February, | |||||||
|
| 2015 |
| 2014 |
| 2013 | |||
Sales revenue, net |
| $ | 1,445,131 |
| $ | 1,317,153 |
| $ | 1,288,263 |
Cost of goods sold |
|
| 845,572 |
|
| 800,450 |
|
| 770,052 |
Gross profit |
|
| 599,559 |
|
| 516,703 |
|
| 518,211 |
|
|
|
|
|
|
|
|
|
|
Selling, general and administrative expense |
|
| 428,840 |
|
| 387,554 |
|
| 369,438 |
Asset impairment charges |
|
| 9,000 |
|
| 12,049 |
|
| - |
Operating income |
|
| 161,719 |
|
| 117,100 |
|
| 148,773 |
|
|
|
|
|
|
|
|
|
|
Nonoperating income, net |
|
| 517 |
|
| 227 |
|
| 86 |
Interest expense |
|
| (15,022) |
|
| (10,193) |
|
| (13,345) |
Income before income taxes |
|
| 147,214 |
|
| 107,134 |
|
| 135,514 |
|
|
|
|
|
|
|
|
|
|
Income tax expense |
|
| 16,050 |
|
| 20,886 |
|
| 19,848 |
Net income |
| $ | 131,164 |
| $ | 86,248 |
| $ | 115,666 |
|
|
|
|
|
|
|
|
|
|
Earnings per share: |
|
|
|
|
|
|
|
|
|
Basic |
| $ | 4.59 |
| $ | 2.69 |
| $ | 3.64 |
Diluted |
| $ | 4.52 |
| $ | 2.66 |
| $ | 3.62 |
|
|
|
|
|
|
|
|
|
|
Weighted average shares of common stock used in |
|
|
|
|
|
|
|
|
|
computing net earnings per share: |
|
|
|
|
|
|
|
|
|
Basic |
|
| 28,579 |
|
| 32,007 |
|
| 31,754 |
Diluted |
|
| 29,035 |
|
| 32,386 |
|
| 31,936 |
See accompanying notes to consolidated financial statements.
77
Table of Contents
HELEN OF TROY LIMITED AND SUBSIDIARIES
Consolidated Statements of Comprehensive Income
(in thousands)
|
|
|
|
|
|
|
|
|
|
|
|
|
|
|
|
|
|
|
|
|
|
|
|
|
|
|
|
|
| Fiscal Years Ended the Last Day of February, | |||||||||||||||||||||||||
|
| 2015 |
| 2014 |
| 2013 | |||||||||||||||||||||
|
| Before |
|
|
|
| Net of |
| Before |
|
|
| Net of |
| Before |
|
|
| Net of | ||||||||
|
| Tax |
| Tax |
| Tax |
| Tax |
| Tax |
| Tax |
| Tax |
| Tax |
| Tax | |||||||||
|
|
|
|
|
|
|
|
|
|
|
|
|
|
|
|
|
|
|
|
|
|
|
|
|
|
|
|
Income |
| $ | 147,214 |
| $ | (16,050) |
| $ | 131,164 |
| $ | 107,134 |
| $ | (20,886) |
| $ | 86,248 |
| $ | 135,514 |
| $ | (19,848) |
| $ | 115,666 |
Other comprehensive income |
|
|
|
|
|
|
|
|
|
|
|
|
|
|
|
|
|
|
|
|
|
|
|
|
|
|
|
Cash flow hedge activity - interest rate swaps |
|
|
|
|
|
|
|
|
|
|
|
|
|
|
|
|
|
|
|
|
|
|
|
|
|
|
|
Changes in fair market value |
|
| 28 |
|
| (10) |
|
| 18 |
|
| (111) |
|
| 39 |
|
| (72) |
|
| (103) |
|
| 36 |
|
| (67) |
Settlements reclassified to income |
|
| 1,199 |
|
| (420) |
|
| 779 |
|
| 3,707 |
|
| (1,297) |
|
| 2,410 |
|
| 3,833 |
|
| (1,342) |
|
| 2,491 |
Subtotal |
|
| 1,227 |
|
| (430) |
|
| 797 |
|
| 3,596 |
|
| (1,258) |
|
| 2,338 |
|
| 3,730 |
|
| (1,306) |
|
| 2,424 |
|
|
|
|
|
|
|
|
|
|
|
|
|
|
|
|
|
|
|
|
|
|
|
|
|
|
|
|
Cash flow hedge activity - foreign currency contracts |
|
|
|
|
|
|
|
|
|
|
|
|
|
|
|
|
|
|
|
|
|
|
|
|
|
|
|
Changes in fair market value |
|
| 434 |
|
| (62) |
|
| 372 |
|
| (962) |
|
| 195 |
|
| (767) |
|
| (132) |
|
| (17) |
|
| (149) |
Ineffectiveness recorded in income |
|
| - |
|
| - |
|
| - |
|
| - |
|
| - |
|
| - |
|
| 44 |
|
| 2 |
|
| 46 |
Settlements reclassified to income |
|
| (176) |
|
| 22 |
|
| (154) |
|
| 98 |
|
| (31) |
|
| 67 |
|
| 629 |
|
| (90) |
|
| 539 |
Subtotal |
|
| 258 |
|
| (40) |
|
| 218 |
|
| (864) |
|
| 164 |
|
| (700) |
|
| 541 |
|
| (105) |
|
| 436 |
Total other comprehensive income |
|
| 1,485 |
|
| (470) |
|
| 1,015 |
|
| 2,732 |
|
| (1,094) |
|
| 1,638 |
|
| 4,271 |
|
| (1,411) |
|
| 2,860 |
Comprehensive income |
| $ | 148,699 |
| $ | (16,520) |
| $ | 132,179 |
| $ | 109,866 |
| $ | (21,980) |
| $ | 87,886 |
| $ | 139,785 |
| $ | (21,259) |
| $ | 118,526 |
See accompanying notes to consolidated financial statements.
78
Table of Contents
HELEN OF TROY LIMITED AND SUBSIDIARIES
Consolidated Statements of Stockholders' Equit y
(in thousands)
|
|
|
|
|
|
|
|
|
|
|
| Fiscal Years Ended the Last Day of February, | |||||||
|
| 2015 |
| 2014 |
| 2013 | |||
Common stock shares |
|
|
|
|
|
|
|
|
|
Balances, beginning of period |
|
| 32,273 |
|
| 31,868 |
|
| 31,681 |
Exercise of stock options |
|
| 187 |
|
| 239 |
|
| 248 |
Restricted share-based compensation |
|
| 71 |
|
| 11 |
|
| 11 |
Vesting of performance awards |
|
| 100 |
|
| 260 |
|
| - |
Issuance of common stock in connection with employee stock purchase plan |
|
| 31 |
|
| 42 |
|
| 39 |
Common stock repurchased and retired |
|
| (4,174) |
|
| (147) |
|
| (111) |
Balances, end of period |
|
| 28,488 |
|
| 32,273 |
|
| 31,868 |
|
|
|
|
|
|
|
|
|
|
Common stock |
|
|
|
|
|
|
|
|
|
Balances, beginning of period |
| $ | 3,227 |
| $ | 3,187 |
| $ | 3,168 |
Exercise of stock options |
|
| 19 |
|
| 24 |
|
| 25 |
Restricted share-based compensation |
|
| 7 |
|
| 1 |
|
| 1 |
Vesting of performance awards |
|
| 10 |
|
| 26 |
|
| - |
Issuance of common stock in connection with employee stock purchase plan |
|
| 3 |
|
| 4 |
|
| 4 |
Common stock repurchased and retired |
|
| (417) |
|
| (15) |
|
| (11) |
Balances, end of period |
| $ | 2,849 |
| $ | 3,227 |
| $ | 3,187 |
|
|
|
|
|
|
|
|
|
|
Paid in capital |
|
|
|
|
|
|
|
|
|
Balances, beginning of period |
| $ | 180,861 |
| $ | 164,471 |
| $ | 151,006 |
Adjustments to paid in capital for changes in uncertain tax positions |
|
| - |
|
| 257 |
|
| - |
Stock option share-based compensation |
|
| 3,670 |
|
| 2,804 |
|
| 3,067 |
Exercise of stock options, including tax benefits of $773, $452 and $4,941 |
|
| 6,318 |
|
| 6,494 |
|
| 10,730 |
Restricted share-based compensation, including tax benefits of $0, $2,921 and $0 |
|
| 9,759 |
|
| 12,285 |
|
| (1) |
Issuance of common stock in connection with employee stock purchase plan |
|
| 1,538 |
|
| 1,346 |
|
| 1,056 |
Common stock repurchased and retired |
|
| (22,212) |
|
| (6,796) |
|
| (1,387) |
Balances, end of period |
| $ | 179,934 |
| $ | 180,861 |
| $ | 164,471 |
|
|
|
|
|
|
|
|
|
|
Accumulated other comprehensive loss |
|
|
|
|
|
|
|
|
|
Balances, beginning of period |
| $ | (1,091) |
| $ | (2,729) |
| $ | (5,589) |
Cash flow hedge activity - interest rate swaps, net of tax |
|
| 797 |
|
| 2,338 |
|
| 2,424 |
Cash flow hedge activity - foreign currency, net of tax |
|
| 218 |
|
| (700) |
|
| 436 |
Balances, end of period |
| $ | (76) |
| $ | (1,091) |
| $ | (2,729) |
|
|
|
|
|
|
|
|
|
|
Retained earnings |
|
|
|
|
|
|
|
|
|
Balances, beginning of period |
| $ | 846,490 |
| $ | 761,677 |
| $ | 648,144 |
Net Income |
|
| 131,164 |
|
| 86,248 |
|
| 115,666 |
Common stock repurchased and retired |
|
| (255,796) |
|
| (1,435) |
|
| (2,133) |
Balances, end of period |
| $ | 721,858 |
| $ | 846,490 |
| $ | 761,677 |
|
|
|
|
|
|
|
|
|
|
Total stockholders' equity |
| $ | 904,565 |
| $ | 1,029,487 |
| $ | 926,606 |
See accompanying notes to consolidated financial statements.
79
Table of Contents
HELEN OF TROY LIMITED AND SUBSIDIARIES
Consolidated Statements of Cash Flow s
(in thousands)
|
|
|
|
|
|
|
|
|
|
|
| Fiscal Years Ended the Last Day of February, | |||||||
|
| 2015 |
| 2014 |
| 2013 | |||
Cash provided (used) by operating activities: |
|
|
|
|
|
|
|
|
|
Net income |
| $ | 131,164 |
| $ | 86,248 |
| $ | 115,666 |
Adjustments to reconcile net income to net cash provided by operating activities: |
|
|
|
|
|
|
|
|
|
Depreciation and amortization |
|
| 39,653 |
|
| 33,839 |
|
| 34,425 |
Amortization of financing costs |
|
| 1,846 |
|
| 911 |
|
| 903 |
Provision for doubtful receivables |
|
| 299 |
|
| 400 |
|
| 188 |
Non-cash share-based compensation |
|
| 5,974 |
|
| 31,683 |
|
| 5,913 |
Intangible asset impairment charges |
|
| 9,000 |
|
| 12,049 |
|
| - |
(Gain) loss on the sale of property and equipment |
|
| 49 |
|
| 81 |
|
| 175 |
Deferred income taxes and tax credits |
|
| (1,830) |
|
| (10,109) |
|
| (12,061) |
Changes in operating capital, net of effects of acquisition of businesses: |
|
|
|
|
|
|
|
|
|
Receivables |
|
| (9,487) |
|
| 6,265 |
|
| (24,624) |
Inventories |
|
| 2,274 |
|
| (8,383) |
|
| (34,625) |
Prepaid expenses and other current assets |
|
| 2,317 |
|
| 1,166 |
|
| (1,545) |
Other assets and liabilities, net |
|
| 2,448 |
|
| (1,867) |
|
| (326) |
Accounts payable |
|
| 16,502 |
|
| 3,733 |
|
| 2,507 |
Accrued expenses and other current liabilities |
|
| (21,135) |
|
| 8,129 |
|
| 1,360 |
Accrued income taxes |
|
| (471) |
|
| (9,980) |
|
| (398) |
Net cash provided by operating activities |
|
| 178,603 |
|
| 154,165 |
|
| 87,558 |
|
|
|
|
|
|
|
|
|
|
Cash provided (used) by investing activities: |
|
|
|
|
|
|
|
|
|
Capital and intangible asset expenditures |
|
| (6,521) |
|
| (40,463) |
|
| (14,688) |
Proceeds from the sale of property and equipment |
|
| - |
|
| 5 |
|
| 26 |
Note receivable from land sale |
|
| - |
|
| - |
|
| 737 |
Payment to acquire a business, net of cash received |
|
| (195,943) |
|
| - |
|
| - |
Net cash used by investing activities |
|
| (202,464) |
|
| (40,458) |
|
| (13,925) |
|
|
|
|
|
|
|
|
|
|
Cash provided (used) by financing activities: |
|
|
|
|
|
|
|
|
|
Proceeds from line of credit |
|
| 769,000 |
|
| 107,300 |
|
| 234,650 |
Repayment of line of credit |
|
| (431,500) |
|
| (189,300) |
|
| (323,750) |
Proceeds from issuance of long-term debt |
|
| - |
|
| 37,607 |
|
| - |
Repayment of long-term debt |
|
| (96,900) |
|
| (20,000) |
|
| (3,000) |
Payment of financing costs |
|
| (4,585) |
|
| (367) |
|
| (28) |
Proceeds from share issuances under share-based compensation plans, including tax benefits |
|
| 7,621 |
|
| 10,285 |
|
| 10,392 |
Payment of tax obligations resulting from cashless share award exercises |
|
| (4,569) |
|
| (6,445) |
|
| - |
Payments for repurchases of common stock |
|
| (273,599) |
|
| (1,311) |
|
| (1,759) |
Share-based compensation tax benefit |
|
| 661 |
|
| 5,709 |
|
| 858 |
Net cash used by financing activities |
|
| (33,871) |
|
| (56,522) |
|
| (82,637) |
|
|
|
|
|
|
|
|
|
|
Net (decrease) increase in cash and cash equivalents |
|
| (57,732) |
|
| 57,185 |
|
| (9,004) |
Cash and cash equivalents, beginning balance |
|
| 70,027 |
|
| 12,842 |
|
| 21,846 |
Cash and cash equivalents, ending balance |
| $ | 12,295 |
| $ | 70,027 |
| $ | 12,842 |
|
|
|
|
|
|
|
|
|
|
Supplemental cash flow information: |
|
|
|
|
|
|
|
|
|
Interest paid |
| $ | 13,990 |
| $ | 10,632 |
| $ | 11,681 |
Income taxes paid, net of refunds |
| $ | 16,591 |
| $ | 31,289 |
| $ | 26,449 |
Value of common stock received as exercise price of options |
| $ | 257 |
| $ | 492 |
| $ | 1,627 |
See accompanying notes to consolidated financial statements.
80
Table of Contents
HELEN OF TROY LIMITED AND SUBSIDIARIES
NOTES TO CONSOLIDATED FINANCIA L STATEMENTS
( in thousands of U.S. Dollars, except share and per share data, unless indicated otherwise )
(a) General
When used in these notes, unless otherwise indicated or the context suggests otherwise, references to "the Company", "our Company", "Helen of Troy", "we", "us", or "our" refer to Helen of Troy Limited and its subsidiaries. We refer to the Company's common shares, par value $0.10 per share, as "common stock." References to "OXO" refer to the operations of OXO International and certain of its affiliated subsidiaries that comprise our Housewares segment. References to "Kaz" refer to the operations of Kaz, Inc. and its subsidiaries, which comprise a segment within the Company referred to as the Healthcare / Home Environment segment. References to "Healthy Directions" refer to the operations of Healthy Directions, LLC and its subsidiaries, acquired on June 30, 2014, that comprise the Nutritional Supplements segment. We use product and service names in this report for identification purposes only and they may be protected in the United States and other jurisdictions by trademarks, trade names, service marks, and other intellectual property rights of the Company and other parties. The absence of a specific attribution in connection with any such mark does not constitute a waiver of any such right. All trademarks, trade names, service marks, and logos referenced herein belong to their respective owners. References to "the FASB" refer to the Financial Accounting Standards Board. References to "GAAP" refer to U.S. generally accepted accounting principles. References to "ASU" refer to the codification of GAAP in the Accounting Standards Updates issued by the FASB. References to "ASC" refer to the codification of GAAP in the Accounting Standards Codification issued by the FASB.
We are a global designer, developer, importer, marketer, and distributor of an expanding portfolio of brand-name consumer products. We have four segments: Housewares, Healthcare / Home Environment, Nutritional Supplements, and Personal Care. Our Housewares segment provides a broad range of innovative consumer products for the home. Product offerings include food preparation tools, gadgets and storage containers, cleaning, organization, and baby and toddler care products. The Healthcare / Home Environment segment focuses on healthcare devices such as thermometers, humidifiers, blood pressure monitors, and heating pads; water filtration systems; and small home appliances such as portable heaters, fans, air purifiers, and insect control devices. Our Nutritional Supplements segment is a leading provider of premium branded vitamins, minerals and supplements, as well as other health products sold directly to consumers. Our Personal Care segment products include electric hair care, beauty care and wellness appliances; grooming tools and accessories; and liquid-, solid- and powder-based personal care and grooming products.
Our business is seasonal due to different calendar events, holidays, and seasonal weather patterns. Historically, our highest sales volume and operating income occur in our third fiscal quarter ending November 30 th . We purchase our products from unaffiliated manufacturers, most of which are located in China, Mexico and the United States.
Our consolidated financial statements are prepared in U.S. Dollars and in accordance with GAAP, which requires us to make estimates and assumptions that affect the reported amounts of assets, liabilities, revenues, expenses, and the disclosure of contingent assets and liabilities. Actual results could differ from those estimates. W e have reclassified, combined or separately disclosed certain amounts in the prior years' consolidated financial statements and accompanying footnotes to conform to the current year's presentation. These reclassif ications had no effect on previously reported results of operations, working capital or stockholders' equit y.
81
Table of Contents
(b) Consolidation
Our consolidated financial statements include the accounts of Helen of Troy Limited and its wholly owned subsidiaries. All intercompany accounts and transactions are eliminated in consolidation.
(c) Cash and cash equivalents
Cash equivalents include all highly liquid investments with an original maturity of three months or less. We maintain cash and cash equivalents at several financial institutions, which at times may not be federally insured or may exceed federally insured limits. We have not experienced any losses in such accounts and believe we are not exposed to any significant credit risks on such accounts.
Our cash balances at the end of fiscal years 2015 and 2014 include restricted cash of $0.73 and $2.59 million, respectively, denominated in Venezuelan Bolivars. The balances arise from our operations within the Venezuelan market. Until we are able to repatriate cash from Venezuela, we intend to use these cash balances in country to continue to fund operations. We do not otherwise rely on these restricted funds as a source of liquidity.
We consider money market investment accounts to be cash equivalents. Cash equivalents comprised $1.69 and $1.55 million of the amounts reported on our consolidated balance sheets as "Cash and cash equivalents" at February 28, 2015 and 2014, respectively. Note (12) contains additional information regarding our cash and cash equivalents.
(d) Trading securities
Trading securities, when held, consist of shares of common stock of publicly traded companies and are stated on our consolidated balance sheets at fair value, as determined by the most recent trading price of each security as of each balance sheet date. We determine the appropriate classification of our investments when those investments are purchased and reevaluate those determinations at each balance sheet date. Trading securities, when held, are included in the "Assets, current" section of our consolidated balance sheets.
All realized and unrealized gains and losses attributable to trading securities are included in "Nonoperating income (expense), net" in the consolidated statements of income.
(e) Receivables
Our receivables are comprised of trade credit granted to customers, primarily in the retail industry, offset by two valuation reserves: an allowance for doubtful receivables and an allowance for back-to-stock returns.
Our allowance for doubtful receivables reflects our best estimate of probable losses, determined principally based on historical experience and specific allowances for known troubled accounts. Our policy is to charge off receivables when we have determined they will no longer be collectible. Charge offs are applied as a reduction to the allowance for doubtful accounts and any recoveries of previous charge offs are netted against bad debt expense in the period recovered. At February 28, 2015 and 2014, the allowance for doubtful receivables was $1.85 and $2.13 million, respectively.
Our allowance for back-to-stock returns reflects our best estimate of future customer returns, determined principally based on historical experience and specific allowances for known pending returns. At February 28, 2015 and 2014, the allowance for back-to-stock returns was $4.03 and $2.55 million, respectively.
The Company had significant concentrations of credit risk with two major customers at February 28, 2015 representing approximately 15 and 10 percent of gross trade receivables, respectively. In addition, as of February 28, 2015 and 2014, approximately 42 and 44 percent, respectively, of the Company's gross trade receivables were due from its five top customers.
(f) Inventory, net and cost of goods sold
Our inventory consists almost entirely of finished goods. We currently record inventory on our balance sheet at
82
Table of Contents
average cost, or net realizable value, if it is below our recorded cost. Our average costs include the amounts we pay manufacturers for product, tariffs and duties associated with transporting product across national borders, freight costs associated with transporting the product from our manufacturers to our distribution centers, and general and administrative expenses directly attributable to acquiring inventory, as applicable.
General and administrative expenses in inventory include all the expenses of operating the Company's sourcing activities and expenses incurred for production monitoring, product design, engineering and packaging. We charged $36.37, $36.23 and $30.28 million of such general and administrative expenses to inventory during fiscal years 2015, 2014 and 2013 , respectively. We estimate that $12.52 and $12.26 million of general and administrative expenses directly attributable to the procurement of inventory were included in our inventory balances on hand at February 28, 2015 and 2014, respectively.
The "Cost of goods sold" line item on the consolidated statements of income is comprised of the book value of inventory sold to customers during the reporting period. When circumstances dictate that we use net realizable value as the basis for recording inventory, we base our estimates on expected future selling prices less expected disposal costs.
For fiscal years 2015, 2014 and 2013 , finished goods purchased from vendors in the Far East comprised approximately 67, 6 9 and 6 8 percent, respectively, of finished goods purchased. During fiscal year 2015, we had one vendor who fulfilled approximately 10 percent of our product requirements. Our top two manufacturers combined fulfilled approximately 17 percent of our product requirements. Over the same period, our top five suppliers fulfilled approximately 31 percent of our product requirements.
(g) Property and equipment
These assets are stated at cost and d epreciation is recorded on a straight-line basis over the estimated useful lives of the assets. E xpenditures for repair and maintenance of property and equipment are expensed as incurred. For tax purposes, accelerated depreciation methods are used where allowed by tax laws.
(h) License agreements, trademarks, patents, and other intangible assets
A significant portion of our consolidated sales are made subject to trademark license agreements with various licensors. Our license agreements are reported on our consolidated balance sheets at cost, less accumulated amortization. The cost of our license agreements represents amounts paid to licensors to acquire the license or to alter the terms of the license in a manner that we believe to be in our best interest. Certain licenses have extension terms that may require additional payments to the licensor as part of the terms of renewal. The Company capitalizes costs incurred to renew or extend the term of a license agreement and amortizes such costs on a straight-line basis over the remaining term or economic life of the agreement, whichever is shorter. Royalty payments are not included in the cost of license agreements. Royalty expense under our license agreements is recognized as incurred and is included in our consolidated statements of income on the line entitled "Selling, general and administrative expense" ("SG&A"). Net sales revenue subject to trademark license agreements requiring royalty payments comprised approximately 42, 44 and 44 percent of consolidated net sales revenue for fiscal years 2015, 2014 and 2013 , respectively. During fiscal year 2015, we had one licensor where our net sales revenue subject to royalty payments was approximately 19 percent of consolidated net sales. No other licensors had associated net sales revenue subject to royalty payments that accounted for 10 percent or more of consolidated net sales revenue.
83
Table of Contents
We also sell products under trademarks and brand assets that we own. Trademarks and brand assets that we acquire from other entities are generally recorded on our consolidated balance sheets based upon the appraised cost of acquiring the asset, net of any accumulated amortization and impairment charges. Costs associated with developing trademarks internally are recorded as expenses in the period incurred. In certain instances where trademarks or brand assets have readily determinable useful lives, we amortize their costs on a straight-line basis over such lives. In most instances, we have determined that such acquired assets have an indefinite useful life. In these cases, no amortization is recorded. Patents acquired through purchase from other entities, if material, are recorded on our consolidated balance sheets based upon the appraised value of the acquired patents and amortized over the remaining life of the patent. Additionally, we incur certain costs, primarily legal fees in connection with the design and development of products to be covered by patents, which are capitalized as incurred and amortized on a straight-line basis over the life of the patent in the jurisdiction filed, typically 14 years.
Other intangible assets include customer lists, distribution rights, patent rights, and non-compete agreements that we acquired from other entities. These are recorded on our consolidated balance sheets based upon the fair value of the acquired asset and amortized on a straight-line basis over the remaining life of the asset as determined either through outside appraisal or by the term of any controlling agreements. See Notes (5) and (6) to these consolidated financial statements for additional information on our intangible assets.
(i) Goodwill, intangible and other long-lived assets and impairments
We complete our analysis of the carrying value of our goodwill and other intangible assets during the first quarter of each fiscal year, or more frequently whenever events or changes in circumstances indicate that their carrying value may not be recoverable.
Goodwill is recorded as the difference, if any, between the aggregate consideration paid and the fair value of the net tangible and intangible assets received in the acquisition of a business. We evaluate goodwill at the reporting unit level (operating segment or one level below an operating segment). We measure the amount of any goodwill impairment based upon the estimated fair value of the underlying assets and liabilities of the reporting unit, including any unrecognized intangible assets and estimates of the implied fair value of goodwill. An impairment charge is recognized to the extent the recorded goodwill exceeds the implied fair value of goodwill.
We consider whether circumstances or conditions exist that suggest that the carrying value of our goodwill and other long-lived assets might be impaired. If such circumstances or conditions exist, further steps are required in order to determine whether the carrying value of each of the individual assets exceeds its fair market value. If the analysis indicates that an individual asset's carrying value does exceed its fair market value, the next step is to record a loss equal to the excess of the individual asset's carrying value over its fair value. These steps entail significant amounts of judgment and subjectivity. Events and changes in circumstances that may indicate there is impairment include, but are not limited to, strategic decisions to exit a business or dispose of an asset made in response to changes in economic, political and competitive conditions, the impact of the economic environment on our customer base and on broad market conditions that drive valuation considerations by market participants, our internal expectations with regard to future revenue growth and the assumptions we make when performing our impairment reviews, a significant decrease in the market price of our assets, a significant adverse change in the extent or manner in which our assets are used, a significant adverse change in legal factors or the business climate that could affect our assets, an accumulation of costs significantly in excess of the amount originally expected for the acquisition of an asset, and significant changes in the cash flows associated with an asset. We analyze these assets at the individual asset, reporting unit and Company levels.
As further discussed in Note (5) to these consolidated financial statements, in fiscal years 2015 and 2014, we recorded non-cash impairment charges totaling $9.00 million ($8.16 million after tax) and $12.05 million ($12.03 million after tax), respectively, in order to reflect the carrying value of certain trademarks in our Personal Care segment at estimates of their fair value.
(j) Economic useful lives and amortization of intangible assets
We amortize intangible assets, such as licenses and trademarks, over their economic useful lives, unless those assets' economic useful lives are indefinite. If an intangible asset's economic useful life is deemed indefinite, that
84
Table of Contents
asset is not amortized. When we acquire an intangible asset, we consider factors such as the asset's history, our plans for that asset, and the market for products associated with the asset. We consider these same factors when reviewing the economic useful lives of our existing intangible assets as well. We review the economic useful lives of our intangible assets at least annually.
Intangible assets consist primarily of goodwill, license agreements, trademarks, brand assets, customer lists, distribution rights, patents, and patent licenses. Some of our goodwill is held in jurisdictions that allow deductions for tax purposes, however, in some of those jurisdictions we have no tax basis for the associated goodwill recorded for book purposes. Accordingly, the majority of our goodwill is not deductible for tax purposes. We amortize certain intangible assets using the straight-line method over appropriate periods ranging from 2 to 30 years. We recorded intangible asset amortization totaling $25.33, $21.61 and $22.40 million during fiscal years 2015, 2014 and 2013 , respectively. See Notes (5) and (6) to these consolidated financial statements for more information about our intangible assets.
(k) Fair value classifications
We classify our various assets and liabilities recorded or reported at fair value under a hierarchy prescribed by GAAP that prioritizes inputs to fair value measurement techniques into three broad levels:
| · |
| Level 1: Observable inputs such as quoted prices for identical assets or liabilities in active markets. |
| · |
| Level 2: Observable inputs other than quoted prices that are directly or indirectly observable for the asset or liability, including quoted prices for similar assets or liabilities in active markets; quoted prices for similar or identical assets or liabilities in markets that are not active; and model-derived valuations whose inputs are observable or whose significant value drivers are observable. |
| · |
| Level 3: Unobservable inputs that reflect the reporting entity's own assumptions. |
Assets and liabilities subject to classification are classified upon acquisition. When circumstances dictate the transfer of an asset or liability to a different level, our policy is to recognize the transfer at the beginning of the reporting period in which the event resulting in the transfer occurred.
(l) Warranties
Our products are under warranty against defects in material and workmanship for periods ranging from two to five years. We estimate our warranty accrual using our historical experience and believe that this is the most reliable method by which we can estimate our warranty liability. The following table summarizes the activity in the Company's accrual for the past two fiscal years:
ACCRUAL FOR WARRANTY RETURNS
(in thousands)
|
|
|
|
|
|
| ||||
|
| Fiscal Years Ended | ||||||||
|
| the Last Day of February, | ||||||||
|
| 2015 |
| 2014 | ||||||
Beginning balance |
| $ | 19,269 |
| $ | 23,150 | ||||
Additions to the accrual |
|
| 57,217 |
|
| 48,461 | ||||
Reductions of the accrual - payments and credits issued |
|
| (52,933) |
|
| (52,342) | ||||
Ending balance |
| $ | 23,553 |
| $ | 19,269 | ||||
85
Table of Contents
(m) Financial instruments
The carrying amounts of cash and cash equivalents, receivables, accounts payable, accrued expenses and income taxes payable approximate fair value because of the short maturity of these items. See Note (10) to these consolidated financial statements for our assessment of the fair value of our Senior Notes and other long-term debt. We have previously used interest rate swaps (the "swaps") to protect our funding costs against rising interest rates. The interest rate swaps allowed us to raise long-term borrowings at floating rates and effectively swap them into fixed rates. Under our previous swaps, we agreed with another party to exchange quarterly the difference between fixed-rate and floating-rate interest amounts calculated by reference to notional amounts that match the amount of our underlying debt. Under these swap agreements, we paid the fixed rates and received the floating rates. The swaps settled quarterly and terminated upon maturity of the related debt in June 2014. We hedge a portion of our foreign exchange rate risk by entering into forward contracts to exchange foreign currencies for U.S. Dollars at specified rates. Our foreign exchange contracts and interest rate swaps are considered highly effective and are accounted for as cash flow hedges. See Notes (12), (13) and (18) to these consolidated financial statements for more information on our hedging activities.
(n) Income taxes and uncertain tax positions
Deferred income tax assets and liabilities are recognized for the future tax consequences of temporary differences between the book and tax bases of applicable assets and liabilities. Generally, deferred tax assets represent future income tax reductions while deferred tax liabilities represent income taxes that we expect to pay in the future. We measure deferred tax assets and liabilities using enacted tax rates for the years in which we expect temporary differences to be reversed or be settled. Changes in tax rates affect the carrying values of our deferred tax assets and liabilities, and the effects of any tax rate changes are recognized in the periods when they are enacted. The ultimate realization of our deferred tax assets depends upon generating sufficient future taxable income during the periods in which our temporary differences become deductible or before our net operating loss and tax credit carryforwards expire.
We recognize the benefit of a tax position if that position will more likely than not be sustained in an audit, based on the technical merits of the position. If the tax position meets the more likely than not recognition threshold, the tax effect is recognized at the largest amount of the benefit that has greater than a fifty percent likelihood of being realized upon ultimate settlement. Liabilities created for unrecognized tax benefits are disclosed as a separate liability and not combined with deferred tax liabilities or assets. We recognize interest and penalties accrued related to unrecognized tax benefits in the provision for income taxes. Note (11) to these consolidated financial statements contains additional information regarding our income taxes.
(o) Revenue recognition
Sales are recognized when revenue is realized or realizable and has been earned. Sales and shipping terms vary among our customers, and as such, revenue is recognized when risk and title to the product transfer to the customer. Net sales revenue is comprised of gross revenues less estimates of expected returns, trade discounts and customer allowances, which include incentives such as advertising discounts, volume rebates and off-invoice markdowns. Such deductions are recorded and/or amortized during the period the related revenue is recognized. Sales and value added taxes collected from customers and remitted to governmental authorities are excluded from net sales revenue reported in the consolidated financial statements.
86
Table of Contents
(p) Consideration granted to customers
We offer our customers certain incentives in the form of cooperative advertising arrangements, volume rebates, product markdown allowances, trade discounts, cash discounts, slotting fees, and similar other arrangements. In instances where the customer provides us with proof of advertising performance, reductions in amounts received from customers under cooperative advertising programs are expensed in our consolidated statements of income in SG&A. Customer cooperative advertising incentives included in SG&A were $17.28, $16.45 and $14.25 million for the fiscal years 2015, 2014 and 2013 , respectively.
Reductions in amounts received from customers without proof of advertising performance , markdown allowances, slotting fees, trade discounts, cash discounts, and volume rebates are all recorded as reductions of net sales revenue.
(q) Advertising
Advertising costs, including cooperative advertising discussed in (p) above, are expensed in the period in which they are incurred and included in our consolidated statements of income in SG&A. We incurred total advertising costs, including amounts paid to customers for cooperative media and print advertising, of $53.75, $46.29 and $51.08 million during fiscal years 2015, 2014 and 2013 , respectively.
(r) Shipping and handling revenues and expenses
Shipping and handling expenses are included in our consolidated statements of income in SG&A. These expenses include distribution center costs, third-party logistics costs and outbound transportation costs. Our expenses for shipping and handling was approximately $88 , $81 and $84 million during fiscal years 2015, 2014 and 2013 , respectively. We bill our customers for charges for shipping and handling on certain sales made directly to consumers and retail customers ordering relatively small dollar amounts of product. Such charges are recorded as a reduction of our shipping and handling expense and are not material in the aggregate.
(s) Foreign currency transactions and related derivative financial instruments
The U.S. Dollar is the functional currency for the Company and all its foreign subsidiaries; therefore, we do not have a translation adjustment recorded through accumulated other comprehensive income (loss). All our non-U.S. subsidiaries' transactions involving other currencies have been re-measured in U.S. Dollars using exchange rates in effect on the date each transaction occurred. In our consolidated statements of income, exchange gains and losses resulting from the remeasurement of foreign taxes receivable, taxes payable, deferred tax assets, and deferred tax liabilities are recognized in their respective income tax lines and all other foreign exchange gains and losses are recognized in SG&A. We recorded net foreign exchange gains (losses), including the impact of currency hedges, of ($5.72), ($0.95) and ($2.36) million in SG&A and $0.40 , ($0.17) and ($0.04) million in income tax expense during fiscal years 2015, 2014 and 2013 , respectively. In order to manage our exposure to changes in foreign currency exchange rates, we use forward currency contracts to exchange foreign currencies for U.S. Dollars at specified rates. We account for these transactions as cash flow hedges, which requires these derivatives to be recorded on the balance sheet at their fair value and that changes in the fair value of the forward exchange contracts are recorded each period in our consolidated statements of income or other comprehensive income (loss), depending on the type of hedging instrument and the effectiveness of the hedges. All our current contracts are cash flow hedges and are adjusted to their fair market values at the end of each fiscal quarter. We evaluate all hedging transactions each quarter to determine that they are effective. Any ineffectiveness is recorded as part of SG&A in our consolidated statements of income. See Notes (12), (13) and (18) to these consolidated financial statements for a further discussion of our hedging activities.
87
Table of Contents
(t) Share-based compensation plans
We account for share-based employee compensation plans under the fair value recognition and measurement provisions in accordance with applicable accounting standards, which require all share-based payments to employees, including grants of stock options, restricted stock awards ("RSAs"), restricted stock units ("RSUs") and performance stock units ("PSUs"), to be measured based on the grant date fair value of the awards. The resulting expense is recognized over the periods during which the employee is required to perform service in exchange for the award. The estimated number of PSU's that will ultimately vest requires judgment, and to the extent actual results or updated estimates differ from our current estimates, such amounts will be recorded as a cumulative adjustment in the period estimates are revised.
Stock options are recognized in the financial statements based on their fair values using an option-pricing model at the date of grant. We use a Black-Scholes option-pricing model to calculate the fair value of options. This model requires various judgmental assumptions including volatility, forfeiture rates and expected option life.
All share-based compensation expense is recorded net of estimated forfeitures in our consolidated statements of income and as such is recorded for only those share-based awards that we expect to vest. We estimate the forfeiture rate based on historical forfeitures of equity awards and adjust the rate to reflect changes in facts and circumstances, if any. We revise our estimated forfeiture rate if actual forfeitures differ from our initial estimates.
See Note (16) to these consolidated financial statements for more information on our share-based compensation plans.
(u) Interest income
Interest income is included in "Nonoperating income, net" on the consolidated statements of income. Interest income totaled $0.06, $0.07 and $0.07 million in fiscal years 2015, 2014 and 2013 , respectively. Interest income is normally earned on cash invested in short-term accounts, cash equivalen ts, and temporary and long-term investments.
(v) Earnings per share
We compute basic earnings per share using the weighted average number of shares of common stock outstanding during the period. We compute diluted earnings per share using the weighted average number of shares of common stock outstanding plus the effect of dilutive securities. Dilutive securities at any given point in time may consist of outstanding options to purchase common stock and issued and contingently issuable unvested restricted share units and other performance-based share awards. See Note (16) to these consolidated financial statements for more information regarding these restricted share units and other performance-based share awards. Options for common stock are excluded from the computation of diluted earnings per share if their effect is antidilutive.
For fiscal years 2015, 2014 and 2013 , the components of basic and diluted shares were as follows:
WEIGHTED AVERAGE DILUTED SECURITIES
(in thousands)
|
|
|
|
|
|
|
|
| Fiscal Years Ended the Last Day of February, | ||||
|
| 2015 |
| 2014 |
| 2013 |
Weighted average shares outstanding, basic |
| 28,579 |
| 32,007 |
| 31,754 |
Incremental shares from share-based payment arrangements |
| 456 |
| 379 |
| 182 |
Weighted average shares outstanding, diluted |
| 29,035 |
| 32,386 |
| 31,936 |
|
|
|
|
|
|
|
Dilutive securities, stock options |
| 647 |
| 488 |
| 278 |
Dilutive securities, unvested or unsettled share awards |
| 273 |
| 322 |
| 252 |
Antidilutive securities, stock options |
| 239 |
| 441 |
| 586 |
88
Table of Contents
NOTE 2 – CHANGE IN ACCOUNTING ESTIMATE
In the third quarter of fiscal year 2015, we revised our product liability estimates to reflect more relevant historical claims experience. The effect of the change in estimate was recorded in SG&A . The change increased operating income, net income and diluted earnings per share by $2.22 million, $1.36 million and $0.05 per share , respectively, for fiscal year 2015 .
NOTE 3 – NEW ACCOUNTING PRONOUNCEMENTS
In May 2014, the FASB issued ASU 2014-09, " Revenue from Contracts with Customers " , issued as a new Topic, ASC Topic 606. The new revenue recognition standard provides a five-step analysis of transactions to determine when and how revenue is recognized. The core principle of the guidance is that a Company should recognize revenue to depict the transfer of promised goods or services to customers in an amount that reflects the consideration to which the entity expects to be entitled in exchange for those goods or services. In April 2015, the FASB voted to propose deferral of the effective date of the new revenue standard by one year, but to permit entities to adopt one year earlier if they choose. The proposed deferral is not a final decision . A ssuming the proposal is sustained after the FASB's due process (including their evaluation of resulting public comments) , we will be required to adopt the new standard i n fiscal year 201 9 (unless we elect to adopt one year earlier) and can adopt either retrospectively or as a cumulative effect adjustment as of the date of adoption. We are currently evaluating the effect this new accounting guidance will have on our consolidated results of operations, cash flows and financial position.
Unless otherwise discussed above, the Company's management believes that the impact of other recently issued standards that are not yet effective will not have a material impact on its consolidated financial position, results of operations and cash flows upon adoption.
89
Table of Contents
NOTE 4 – PROPERTY AND EQUIPMENT
A summary of property and equipment is as follows:
PROPERTY AND EQUIPMENT
(in thousands)
|
|
|
|
|
|
|
|
|
|
|
|
| Estimated |
|
|
| |||||
|
| Useful Lives |
| Balances at February 28, | ||||||
|
| (Years) |
| 2015 |
| 2014 | ||||
Land |
|
| - |
|
| $ | 12,800 |
| $ | 12,800 |
Building and improvements |
| 3 | - | 40 |
|
| 102,058 |
|
| 98,660 |
Computer, furniture and other equipment |
| 3 | - | 15 |
|
| 64,464 |
|
| 60,291 |
Tools, molds and other production equipment |
| 1 | - | 10 |
|
| 25,861 |
|
| 23,017 |
Construction in progress |
|
| - |
|
|
| 3,039 |
|
| 5,865 |
Property and equipment, gross |
|
|
|
|
|
| 208,222 |
|
| 200,633 |
Less accumulated depreciation |
|
|
|
|
|
| (82,154) |
|
| (71,516) |
Property and equipment, net |
|
|
|
|
| $ | 126,068 |
| $ | 129,117 |
We recorded $14.33 , $12.23 and $12.03 million of depreciation expense for fiscal years 2015, 2014 and 2013 , respectively. Capital expenditures for property and equipment totaled $5.36 , $40.12 and $13.61 million in fiscal years 2015, 2014 and 2013 , respectively.
We lease certain facilities, equipment and vehicles under operating leases, which expire at various dates through fiscal year 20 25 . Certain of the leases contain escalation clauses and renewal or purchase options. Rent expense related to our operating leases was $5.01 , $5.68 and $6.39 million for fiscal years 2015, 2014 and 2013 , respectively. During the third quarter of fiscal year 2014, in connection with our move to a new distribution facility discussed below, we terminated the lease of our previous distribution facility in Memphis, Tennessee as of October 31, 2013.
During fiscal year 2014, the Company completed construction of a new 1.3 million square foot distribution facility on approximately 84 acres of land in Olive Branch, Mississippi. Capital expenditures for fiscal years 2014 and 2013 include $34.03 million and $4.03 million, respectively, in connection with this project. The new facility consolidated the distribution operations of our U.S. based Personal Care and Healthcare / Home Environment segment's appliance businesses. We commenced shipments out of the new facility during the first week of September 2013.
During the first quarter of fiscal year 2015, we completed the transition of our domestic Personal Care appliance distribution operation to the new facility. The capital expenditures made in connection with the Personal Care appliance transition were not material. See Note (10) to these consolidated financial statements for related information regarding the debt incurred to fund the construction of the new distribution facility.
90
Table of Contents
NOTE 5 – GOODWILL AND INTANGIBLE ASSETS
We do not record amortization expense for goodwill or other intangible assets that have indefinite useful lives. Amortization expense is recorded for intangible assets with definite useful lives. We perform an annual impairment review of goodwill and other intangible assets during the first quarter of each fiscal year. We also perform interim testing, if necessary, as required by GAAP. We write down any asset deemed to be impaired to its fair value.
The Company's traditional impairment test methodology uses primarily estimated future discounted cash flow models ("DCF Models"). The DCF Models use a number of assumptions including expected future cash flows from the assets, volatility, risk free rate, and the expected life of the assets, the determination of which require significant judgments from management. In determining the assumptions to be used, the Company considers the existing rates on Treasury Bills, yield spreads on assets with comparable expected lives, historical volatility of the Company's common stock and that of comparable companies and general economic and industry trends, among other considerations. When stock market or other conditions warrant, the Company expands its traditional impairment test methodology to give weight to other methods that provide additional observable market information in order to better reflect the current risk level being incorporated into market prices and in order to corroborate the fair values of each of the Company's reporting units. Management will place increased reliance on these additional methods in conjunction with its DCF Models in the event that the total market capitalization of its stock drops below its consolidated stockholders' equity balance for a sustained period.
Considerable management judgment is necessary in reaching a conclusion regarding the reasonableness of fair value estimates, evaluating the most likely impact of a range of possible external conditions, considering the resulting operating changes and their impact on estimated future cash flows, determining the appropriate discount factors to use, and selecting and weighting appropriate comparable market level inputs.
Annual Impairment Testing in the First Quarter of Fiscal Year 2015 – The Company performed its annual evaluation of goodwill and indefinite-lived intangible assets for impairment during the first quarter of fiscal year 2015. As a result of our testing of indefinite-lived trademarks and licenses, we recorded a non-cash asset impairment charge of $9.00 million ($8.16 million after tax). The charge was related to certain trademarks in our Personal Care segment, which were written down to their estimated fair value, determined on the basis of future discounted cash flows using the relief from royalty valuation method.
Annual Impairment Testing in the First Quarter of Fiscal Year 2014 – The Company performed its annual evaluation of goodwill and indefinite-lived intangible assets for impairment during the first quarter of fiscal year 2014. As a result of our testing of indefinite-lived trademarks and licenses, we recorded a non-cash asset impairment charge of $12.05 million ($12.03 million after tax). The charge was related to certain trademarks in our Personal Care segment, which were written down to their estimated fair value, determined on the basis of future discounted cash flows using the relief from royalty valuation method.
Annual Impairment Testing in the First Quarter of Fiscal Year 2013 – The Company performed its annual evaluation of goodwill and indefinite-lived intangible assets for impairment during the first quarter of fiscal year 2013. As a result of its testing, the Company concluded no impairment charges were required as the estimated fair value of the indefinite-lived trademarks and licenses, reporting unit net assets and the Company's estimated enterprise value exceeded their respective carrying values as of the date of evaluation.
91
Table of Contents
The following tables summarize by operating segment the changes in our goodwill and intangible assets for fiscal years 2015 and 2014 :
GOODWILL AND INTANGIBLE ASSETS
(in thousands)
|
|
|
|
|
|
|
|
|
|
|
|
|
|
|
|
|
|
|
|
|
|
|
|
|
|
|
|
|
|
|
|
|
|
| Balances at |
|
|
|
|
|
|
|
|
|
| Balances at |
| ||||||||||||||
|
| Weighted |
| February 28, 2014 |
| Year Ended February 28, 2015 |
| February 28, 2015 |
| |||||||||||||||||||||
|
| Average |
| Gross |
| Cumulative |
|
|
|
|
|
|
| Acquisition |
| Gross |
| Cumulative |
|
|
|
|
|
|
| |||||
|
| Life |
| Carrying |
| Goodwill |
|
|
|
|
|
|
| and Retirement |
| Carrying |
| Goodwill |
| Accumulated |
| Net Book |
| |||||||
Description / Life |
| (Years) |
| Amount |
| Impairments |
| Additions |
| Impairments |
| Adjustments |
| Amount |
| Impairments |
| Amortization |
| Value |
| |||||||||
|
|
|
|
|
|
|
|
|
|
|
|
|
|
|
|
|
|
|
|
|
|
|
|
|
|
|
|
|
|
|
Housewares: |
|
|
|
|
|
|
|
|
|
|
|
|
|
|
|
|
|
|
|
|
|
|
|
|
|
|
|
|
|
|
Goodwill |
|
|
| $ | 166,132 |
| $ | - |
| $ | - |
| $ | - |
| $ | - |
| $ | 166,132 |
| $ | - |
| $ | - |
| $ | 166,132 |
|
Trademarks - indefinite |
|
|
|
| 75,200 |
|
| - |
|
| - |
|
| - |
|
| - |
|
| 75,200 |
|
| - |
|
| - |
|
| 75,200 |
|
Other intangibles - finite |
| 1.7 |
|
| 15,693 |
|
| - |
|
| 244 |
|
| - |
|
| (183) |
|
| 15,754 |
|
| - |
|
| (12,331) |
|
| 3,423 |
|
Subtotal |
|
|
|
| 257,025 |
|
| - |
|
| 244 |
|
| - |
|
| (183) |
|
| 257,086 |
|
| - |
|
| (12,331) |
|
| 244,755 |
|
|
|
|
|
|
|
|
|
|
|
|
|
|
|
|
|
|
|
|
|
|
|
|
|
|
|
|
|
|
|
|
Healthcare / Home Environment: |
|
|
|
|
|
|
|
|
|
|
|
|
|
|
|
|
|
|
|
|
|
|
|
|
|
|
|
|
|
|
Goodwill |
|
|
|
| 251,758 |
|
| - |
|
| - |
|
| - |
|
| - |
|
| 251,758 |
|
| - |
|
| - |
|
| 251,758 |
|
Trademarks - indefinite |
|
|
|
| 54,000 |
|
| - |
|
| - |
|
| - |
|
| - |
|
| 54,000 |
|
| - |
|
| - |
|
| 54,000 |
|
Licenses - finite |
| 2.0 |
|
| 15,300 |
|
| - |
|
| - |
|
| - |
|
| - |
|
| 15,300 |
|
| - |
|
| (9,377) |
|
| 5,923 |
|
Other Intangibles - finite |
| 6.7 |
|
| 114,490 |
|
| - |
|
| 827 |
|
| - |
|
| (1,675) |
|
| 113,642 |
|
| - |
|
| (43,848) |
|
| 69,794 |
|
Subtotal |
|
|
|
| 435,548 |
|
| - |
|
| 827 |
|
| - |
|
| (1,675) |
|
| 434,700 |
|
| - |
|
| (53,225) |
|
| 381,475 |
|
|
|
|
|
|
|
|
|
|
|
|
|
|
|
|
|
|
|
|
|
|
|
|
|
|
|
|
|
|
|
|
Nutritional Supplements: |
|
|
|
|
|
|
|
|
|
|
|
|
|
|
|
|
|
|
|
|
|
|
|
|
|
|
|
|
|
|
Goodwill |
|
|
|
| - |
|
| - |
|
| 95,308 |
|
| - |
|
| 1,178 |
|
| 96,486 |
|
| - |
|
| - |
|
| 96,486 |
|
Brand assets - indefinite |
|
|
|
| - |
|
| - |
|
| 65,500 |
|
| - |
|
| - |
|
| 65,500 |
|
| - |
|
| - |
|
| 65,500 |
|
Other intangibles - finite |
| 6.3 |
|
| - |
|
| - |
|
| 43,800 |
|
| - |
|
| - |
|
| 43,800 |
|
| - |
|
| (4,171) |
|
| 39,629 |
|
Subtotal |
|
|
|
| - |
|
| - |
|
| 204,608 |
|
| - |
|
| 1,178 |
|
| 205,786 |
|
| - |
|
| (4,171) |
|
| 201,615 |
|
|
|
|
|
|
|
|
|
|
|
|
|
|
|
|
|
|
|
|
|
|
|
|
|
|
|
|
|
|
|
|
Personal Care: |
|
|
|
|
|
|
|
|
|
|
|
|
|
|
|
|
|
|
|
|
|
|
|
|
|
|
|
|
|
|
Goodwill |
|
|
|
| 81,841 |
|
| (46,490) |
|
| - |
|
| - |
|
| - |
|
| 81,841 |
|
| (46,490) |
|
| - |
|
| 35,351 |
|
Trademarks - indefinite |
|
|
|
| 63,754 |
|
| - |
|
| - |
|
| (9,000) |
|
| - |
|
| 54,754 |
|
| - |
|
| - |
|
| 54,754 |
|
Trademarks - finite |
| 13.6 |
|
| 150 |
|
| - |
|
| - |
|
| - |
|
| - |
|
| 150 |
|
| - |
|
| (82) |
|
| 68 |
|
Licenses - indefinite |
|
|
|
| 10,300 |
|
| - |
|
| - |
|
| - |
|
| - |
|
| 10,300 |
|
| - |
|
| - |
|
| 10,300 |
|
Licenses - finite |
| 7.8 |
|
| 18,683 |
|
| - |
|
| - |
|
| - |
|
| (4,987) |
|
| 13,696 |
|
| - |
|
| (11,216) |
|
| 2,480 |
|
Other intangibles - finite |
| 3.2 |
|
| 49,437 |
|
| - |
|
| 85 |
|
| - |
|
| (1,561) |
|
| 47,961 |
|
| - |
|
| (30,602) |
|
| 17,359 |
|
Subtotal |
|
|
|
| 224,165 |
|
| (46,490) |
|
| 85 |
|
| (9,000) |
|
| (6,548) |
|
| 208,702 |
|
| (46,490) |
|
| (41,900) |
|
| 120,312 |
|
|
|
|
|
|
|
|
|
|
|
|
|
|
|
|
|
|
|
|
|
|
|
|
|
|
|
|
|
|
|
|
Total |
|
|
| $ | 916,738 |
| $ | (46,490) |
| $ | 205,764 |
| $ | (9,000) |
| $ | (7,228) |
| $ | 1,106,274 |
| $ | (46,490) |
| $ | (111,627) |
| $ | 948,157 |
|
92
Table of Contents
GOODWILL AND INTANGIBLE ASSETS
(in thousands)
|
|
|
|
|
|
|
|
|
|
|
|
|
|
|
|
|
|
|
|
|
|
|
|
|
|
|
|
|
|
|
|
|
|
| Balances at |
|
|
|
|
|
|
|
|
|
| Balances at |
| ||||||||||||||
|
| Weighted |
| February 28, 2013 |
| Year Ended February 28, 2014 |
| February 28, 2014 |
| |||||||||||||||||||||
|
| Average |
| Gross |
| Cumulative |
|
|
|
|
|
|
| Acquisition |
| Gross |
| Cumulative |
|
|
|
|
|
|
| |||||
|
| Life |
| Carrying |
| Goodwill |
|
|
|
|
|
|
| and Retirement |
| Carrying |
| Goodwill |
| Accumulated |
| Net Book |
| |||||||
Description / Life |
| (Years) |
| Amount |
| Impairments |
| Additions |
| Impairments |
| Adjustments |
| Amount |
| Impairments |
| Amortization |
| Value |
| |||||||||
|
|
|
|
|
|
|
|
|
|
|
|
|
|
|
|
|
|
|
|
|
|
|
|
|
|
|
|
|
|
|
Housewares: |
|
|
|
|
|
|
|
|
|
|
|
|
|
|
|
|
|
|
|
|
|
|
|
|
|
|
|
|
|
|
Goodwill |
|
|
| $ | 166,132 |
| $ | - |
| $ | - |
| $ | - |
| $ | - |
| $ | 166,132 |
| $ | - |
| $ | - |
| $ | 166,132 |
|
Trademarks - indefinite |
|
|
|
| 75,200 |
|
| - |
|
| - |
|
| - |
|
| - |
|
| 75,200 |
|
| - |
|
| - |
|
| 75,200 |
|
Other intangibles - finite |
| 2.7 |
|
| 15,609 |
|
| - |
|
| 339 |
|
| - |
|
| (255) |
|
| 15,693 |
|
| - |
|
| (11,149) |
|
| 4,544 |
|
Subtotal |
|
|
|
| 256,941 |
|
| - |
|
| 339 |
|
| - |
|
| (255) |
|
| 257,025 |
|
| - |
|
| (11,149) |
|
| 245,876 |
|
|
|
|
|
|
|
|
|
|
|
|
|
|
|
|
|
|
|
|
|
|
|
|
|
|
|
|
|
|
|
|
Healthcare / Home Environment: |
|
|
|
|
|
|
|
|
|
|
|
|
|
|
|
|
|
|
|
|
|
|
|
|
|
|
|
|
|
|
Goodwill |
|
|
|
| 251,758 |
|
| - |
|
| - |
|
| - |
|
| - |
|
| 251,758 |
|
| - |
|
| - |
|
| 251,758 |
|
Trademarks - indefinite |
|
|
|
| 54,000 |
|
| - |
|
| - |
|
| - |
|
| - |
|
| 54,000 |
|
| - |
|
| - |
|
| 54,000 |
|
Licenses - finite |
| 3.0 |
|
| 15,300 |
|
| - |
|
| - |
|
| - |
|
| - |
|
| 15,300 |
|
| - |
|
| (6,416) |
|
| 8,884 |
|
Other Intangibles - finite |
| 7.6 |
|
| 114,490 |
|
| - |
|
| - |
|
| - |
|
| - |
|
| 114,490 |
|
| - |
|
| (34,606) |
|
| 79,884 |
|
Subtotal |
|
|
|
| 435,548 |
|
| - |
|
| - |
|
| - |
|
| - |
|
| 435,548 |
|
| - |
|
| (41,022) |
|
| 394,526 |
|
|
|
|
|
|
|
|
|
|
|
|
|
|
|
|
|
|
|
|
|
|
|
|
|
|
|
|
|
|
|
|
Personal Care: |
|
|
|
|
|
|
|
|
|
|
|
|
|
|
|
|
|
|
|
|
|
|
|
|
|
|
|
|
|
|
Goodwill |
|
|
|
| 81,841 |
|
| (46,490) |
|
| - |
|
| - |
|
| - |
|
| 81,841 |
|
| (46,490) |
|
| - |
|
| 35,351 |
|
Trademarks - indefinite |
|
|
|
| 75,803 |
|
| - |
|
| - |
|
| (12,049) |
|
| - |
|
| 63,754 |
|
| - |
|
| - |
|
| 63,754 |
|
Trademarks - finite |
| 14.6 |
|
| 150 |
|
| - |
|
| - |
|
| - |
|
| - |
|
| 150 |
|
| - |
|
| (77) |
|
| 73 |
|
Licenses - indefinite |
|
|
|
| 10,300 |
|
| - |
|
| - |
|
| - |
|
| - |
|
| 10,300 |
|
| - |
|
| - |
|
| 10,300 |
|
Licenses - finite |
| 6.5 |
|
| 18,683 |
|
| - |
|
| - |
|
| - |
|
| - |
|
| 18,683 |
|
| - |
|
| (15,887) |
|
| 2,796 |
|
Other intangibles - finite |
| 4.0 |
|
| 49,437 |
|
| - |
|
| - |
|
| - |
|
| - |
|
| 49,437 |
|
| - |
|
| (26,563) |
|
| 22,874 |
|
Subtotal |
|
|
|
| 236,214 |
|
| (46,490) |
|
| - |
|
| (12,049) |
|
| - |
|
| 224,165 |
|
| (46,490) |
|
| (42,527) |
|
| 135,148 |
|
|
|
|
|
|
|
|
|
|
|
|
|
|
|
|
|
|
|
|
|
|
|
|
|
|
|
|
|
|
|
|
Total |
|
|
| $ | 928,703 |
| $ | (46,490) |
| $ | 339 |
| $ | (12,049) |
| $ | (255) |
| $ | 916,738 |
| $ | (46,490) |
| $ | (94,698) |
| $ | 775,550 |
|
In the third quarter of fiscal year 2015, we amended the terms of our trademark licensing agreement with Honeywell International Inc. to relinquish the rights to market Honeywell branded portable air purifiers after December 31, 2015 in twelve selected developing countries, including China. In exchange for the amendment, we received a one ‐ time cash payment of $7 million ($6.98 million after tax), which was recorded as a gain in SG&A. For fiscal years 2015, 2014 and 2013, sales into the relinquished countries accounted for approximately 0.3, 0.2 and 0.1 percent, respectively, of the Healthcare / Home Environment segment's total net sales. We plan to market portable air purifiers in the relinquished markets under non ‐ Honeywell branded trademarks and retained the rights to market Honeywell portable air purifiers in other countries, including the United States, Canada and all European countries. For categories such as portable fans, portable heaters and portable humidifiers, we remain the Honeywell global licensee under the same material terms as our previous agreement.
93
Table of Contents
The following table summarizes the amortization expense attributable to intangible assets for the fiscal years 2015, 2014 and 2013, as well as estimated amortization expense for the fiscal years 2016 through 2020 :
AMORTIZATION OF INTANGIBLE ASSETS
(in thousands)
|
|
|
|
Aggregate Amortization Expense |
|
|
|
For the fiscal years ended |
|
|
|
February 2015 |
| $ | 25,328 |
February 2014 |
| $ | 21,612 |
February 2013 |
| $ | 22,400 |
|
|
|
|
Estimated Amortization Expense |
|
|
|
For the fiscal years ended |
|
|
|
February 2016 |
| $ | 27,138 |
February 2017 |
| $ | 26,826 |
February 2018 |
| $ | 22,885 |
February 2019 |
| $ | 18,492 |
February 2020 |
| $ | 16,733 |
Many of the license agreements under which we sell or intend to sell products with trademarks owned by other entities require that we pay minimum royalties. Some license agreements also require that we make minimum levels of advertising expenditures. For fiscal year 2016, estimated minimum royalties due and minimum advertising expenditures under these license agreements total $12.57 and $5.74 million, respectively.
NOTE 6 – ACQUISITIONS
On June 30, 2014, we completed the acquisition of Healthy Directions, a leader in the premium branded vitamin, mineral and supplement market for a total cash purchase price of $195.94 million. The purchase price was funded from borrowings under the Credit Agreement, as described below, and cash on hand. The sellers were certain funds controlled by American Securities, LLC and ACI Capital Co., LLC. Significant assets acquired include inventory, property and equipment, customer relationships, brand assets, and goodwill. Brand assets consist of a portfolio of complementary marketing related assets determined to have indefinite lives that are utilized across multiple product lines. Brand assets include trademarks, tradenames, product formulations, proprietary research, doctor endorsements and all other associated elements of brand equity. Acquisition-related expenses incurred in fiscal year 2015 were approximately $3.61 million ($2.31 million after tax). Healthy Directions reports its operations as the Nutritional Supplements segment.
We accounted for the acquisition as the purchase of a business and recorded the excess purchase price as goodwill. The goodwill recognized is expected to be deductible for income tax purposes. As of February 28, 2015, we completed our analysis of the economic lives of all the assets acquired and determined the appropriate allocation of the initial purchase price. We assigned the acquired brand assets an indefinite economic li fe and are amortizing the customer relationships over an expected weighted average li fe of approximately 7 years. For the customer relationships, we used historical attrition rates to assign an expected life. Since the brand assets acquired are considered to have an indefinite li f e, they are not subject to amortization.
94
Table of Contents
The following table presents the acquisition date fair value of the net assets of Healthy Directions . These balances are provisional and may be subject to additional adjustment :
HEALTHY DIRECTIONS - NET ASSETS RECORDED UPON ACQUISITION AT JUNE 30, 2014
(in thousands)
|
|
|
|
Assets: |
|
|
|
Receivables |
| $ | 257 |
Inventory |
|
| 6,226 |
Prepaid expenses and other current assets |
|
| 1,875 |
Property and equipment |
|
| 5,962 |
Goodwill |
|
| 95,308 |
Brand assets - indefinite |
|
| 65,500 |
Customer relationships - definite |
|
| 43,800 |
Subtotal - assets |
|
| 218,928 |
|
|
|
|
Liabilities: |
|
|
|
Accounts payable |
|
| 6,479 |
Accrued expenses |
|
| 13,964 |
Other long-term liabilities |
|
| 2,542 |
Subtotal - liabilities |
|
| 22,985 |
|
|
|
|
Net assets recorded |
| $ | 195,943 |
The fair values of the above assets acquired were estimated by applying income and market approaches. The fair value measurement of the intangible assets are based on significant inputs that are not observable in the market and, therefore , represent Level 3 measurements. Key assumptions included various discount rates based upon a 14.6 percent weighted average cost of capital, a royalty rate of 5 percent used in the determination of the brand assets fair value, and a customer attrition rate averaging 14 percent per year used in the determination of customer relationship values.
The impact of the Healthy Directions acquisition on the Company's consolidated statements of income from the acquisition date through February 28, 2015 is as follows:
HEALTHY DIRECTIONS - IMPACT ON CONSOLIDATED STATEMENT OF INCOME
June 30, 2014 (Acquisition Date) through February 28, 2015
(in thousands, except earnings per share data)
|
|
|
|
|
|
| Eight Months |
|
|
| Ended |
|
|
| February 28, 2015 |
Sales revenue, net |
| $ | 100,395 |
Net income |
|
| 3,507 |
|
|
|
|
Earnings per share: |
|
|
|
Basic |
| $ | 0.12 |
Diluted |
| $ | 0.12 |
Net income for the eight months ended February 28, 2015 includes after tax acquisition-related expenses of $2.31 million.
95
Table of Contents
The following supplemental pro forma information presents the Company's financial results as if the Healthy Directions acquisition had occurred as of the beginning of the fiscal periods presented. This supplemental pro forma information has been prepared for comparative purposes and would not necessarily indicate what may have occurred if the acquisition had been completed on March 1, 2013, and this information is not intended to be indicative of future results.
HEALTHY DIRECTIONS
PRO FORMA IMPACT ON CONSOLIDATED STATEMENTS OF INCOME
As if the Acquisition had been completed at the beginning of March 1, 2013
(in thousands, except earnings per share data)
|
|
|
|
|
|
|
|
| Fiscal Years Ended | ||||
|
| the Last Day of February, | ||||
|
| 2015 |
| 2014 | ||
Sales revenue, net |
| $ | 1,498,249 |
| $ | 1,465,057 |
Net income |
|
| 134,614 |
|
| 88,460 |
|
|
|
|
|
|
|
Earnings per share: |
|
|
|
|
|
|
Basic |
| $ | 4.71 |
| $ | 2.76 |
Diluted |
| $ | 4.64 |
| $ | 2.73 |
96
Table of Contents
NOTE 7 – CREDIT AGREEMENT
On June 11, 2014, in connection with the acquisition of Healthy Directions, we entered into a fourth amendment to our credit agreement with Bank of America, N.A. and other lenders. We also entered into an amendment of a guaranty agreement in favor of Bank of America, N.A. and other lenders, which relates to a loan with the Mississippi Business Finance Corporation (the "MBFC Loan"). These amendments , among other things, increased the unsecured revolving commitment of the c redit a greement from $375 million to $570 million. Additionally, the amendments modified the limitation on dividends and stock repurchases to allow for the Company to declare or pay cash dividends to shareholders or make stock repurchases if, after giving effect to the dividends or share repurchases, the l everage r atio is not greater than 2.75 to 1.00. Finally, the amendment s increased the l everage r atio limit to 3.25 to 1.00, from a previous limit of 3.00 to 1.00.
On January 16, 2015, the Company entered into an Amended and Restated Credit Agreement (the "Credit Agreement") with Bank of America, N.A., as administrative agent, and the other lenders party thereto. The unsecured revolving commitment under the Credit Agreement was increased from $570 million to $650 million, subject to the terms and limitations described below. The maturity of the commitment under the Credit Agreement was extended from December 31, 2015 to January 16, 2020. Accordingly, borrowings under the Credit Agreement are reported as long-term debt at February 28, 2015 . Additionally, the LIBOR interest rate, letter of credit fees and loan commitment fees under the Credit Agreement were reduced and the limitations of certain covenants were eased . Borrowings under the Credit Agreement accrue interest at a " Base Rate " plus a margin of zero to 1.00 percent per annum based on the l everage r atio at the time of borrowing. The Base Rate is equal to the highest of the Federal Funds Rate plus 0.50 percent, Bank of America's prime rate, or the LIBOR rate plus 1.00 percent. Alternatively, if the Company elects, borrowings accrue interest based on the respective 1, 2, 3, or 6-month LIBOR rate plus a margin of 1.00 to 2.00 percent per annum based upon the Leverage Ratio at the time of the borrowing. The Company will incur loan commitment fees under the Credit Agreement at a rate ranging from 0.15 to 0.35 percent per annum on the unused balance of the Credit Agreement. Additionally, the Company will incur letter of credit fees under the Credit Agreement at a rate ranging from 1.00 to 2.00 percent per annum on the face value of any letter of credit. Outstanding letters of credit reduce the borrowing availability under the Credit Agreement on a dollar-for-dollar basis. All obligations under the Credit Agreement are unconditionally guaranteed , on a joint and several basis, by the Company and certain of the Company's subsidiaries.
The Credit Agreement and our other debt agreements require the maintenance of a maximum l everage ratio and minimum interest c overage r atio, and contain other customary covenants, which restrict or limit the Company from incurring liens on any of its properties and place certain limits on the amount of dividends the Company may pay f or shares of common stock the Company may repurchase, among other things. The Company was in compliance with the terms of its debt agreement s as of February 28, 2015 .
In connection with the amendments to our credit agreement in fiscal year 2015 , we incurred a total of $ 4.59 million in new debt acquisition costs that are being amortized over the remaining term of the Credit Agreement. As of February 28, 2015 , there w as $337.50 million in revolving debt and $0.77 million of open letters of credit outstanding under the Credit Agreement. As of February 28, 2015 , the amount available for borrowings under the Credit Agreement was $311.73 million.
97
Table of Contents
The following table contains information about interest rates on our Credit Agreement and the related weighted average borrowings outstanding for the periods covered by our consolidated statements of income:
INTEREST RATES ON CREDIT AGREEMENT
(in thousands)
|
|
|
|
|
|
|
|
|
|
|
|
| Fiscal Years Ended the Last Day of February, |
| |||||||
|
| 2015 |
| 2014 |
| 2013 |
| |||
Average borrowings outstanding (1) |
| $ | 300,280 |
| $ | 29,680 |
| $ | 143,100 |
|
Average interest rate during each year (2) |
|
| 2.5 | % |
| 1.3 | % |
| 1.7 | % |
Interest rate range during each year |
|
| 1.9 - 4.4 | % |
| 1.2 - 3.6 | % |
| 1.6 - 4.0 | % |
Weighted average interest rates on borrowings outstanding at year end |
|
| 1.9 | % |
| 0.0 | % |
| 1.6 | % |
(1) Average borrowings outstanding is computed as the average of the current and four prior quarters ending balances of our revolving credit facility.
(2) The average interest rate during each year is computed by dividing the total interest expense associated with our revolving credit facility for a fiscal year by the average borrowings outstanding for the same fiscal year.
NOTE 8 – ACCRUED EXPENSES AND OTHER CURRENT LIABILITIES
A summary of accrued expenses and other current liabilities is as follows:
ACCRUED EXPENSES AND OTHER CURRENT LIABILITIES
(in thousands)
|
|
|
|
|
|
|
|
| Balances at February 28, | ||||
|
| 2015 |
| 2014 | ||
Accrued compensation, benefits and payroll taxes |
| $ | 44,382 |
| $ | 69,877 |
Accrued sales returns, discounts and allowances |
|
| 24,271 |
|
| 25,297 |
Accrued warranty returns |
|
| 23,553 |
|
| 19,269 |
Accrued advertising |
|
| 18,930 |
|
| 16,414 |
Accrued product liability, legal and professional fees |
|
| 6,001 |
|
| 5,705 |
Accrued royalties |
|
| 7,683 |
|
| 5,712 |
Accrued property, sales and other taxes |
|
| 6,850 |
|
| 6,835 |
Derivative liabilities, current |
|
| 240 |
|
| 1,596 |
Liability for uncertain tax positions |
|
| - |
|
| 453 |
Other |
|
| 9,291 |
|
| 5,530 |
Total accrued expenses and other current liabilities |
| $ | 141,201 |
| $ | 156,688 |
NOTE 9 – OTHER
LIABILITIES, NONCURRENT
A summary of other noncurrent liabilities is as follows:
OTHER LIABILITIES, NONCURRENT
(in thousands)
|
|
|
|
|
|
|
|
| Balances at February 28, | ||||
|
| 2015 |
| 2014 | ||
Deferred compensation liability |
| $ | 7,091 |
| $ | 7,257 |
Liability for uncertain tax positions |
|
| 10,295 |
|
| 13,471 |
Other liabilities |
|
| 5,921 |
|
| 1,038 |
Total other liabilities, noncurrent |
| $ | 23,307 |
| $ | 21,766 |
98
Table of Contents
NOTE 10 – LONG-TERM DEBT
A summary of long-term debt is as follows:
LONG-TERM DEBT
(dollars in thousands)
|
|
|
|
|
|
|
|
|
|
|
|
|
|
| Original |
|
|
|
|
|
|
| |||
|
| Date |
| Interest |
|
|
| Balances at February 28, | ||||
|
| Borrowed |
| Rates |
| Matures |
| 2015 |
| 2014 | ||
$37.61 million unsecured loan with the Mississippi Business Finance Corporation, interest is set and payable quarterly at a Base Rate, plus a margin of up to 1.00% , or applicable LIBOR plus a margin of up to 2.00% , as determined by the interest rate elected and the Leverage Ratio. Loan subject to holder's call on or after March 1, 2018. Loan can be prepaid without penalty. (1) |
| 03/13 |
| 1.92 | % | 03/23 |
| $ | 35,707 |
| $ | 37,607 |
$75 million unsecured floating interest rate Senior Notes. Interest set and payable quarterly at three month LIBOR plus 90 basis points. Principal was due and paid on June 30, 2014. (2) |
| 06/04 |
| 6.01 | % | 06/14 |
|
| - |
|
| 75,000 |
$100 million unsecured Senior Notes payable at a fixed interest rate of 3.90% . Interest payable semi-annually. Annual principal payments of $20 million began in January 2014. Prepayment of notes are subject to a "make whole" premium. |
| 01/11 |
| 3.90 | % | 01/18 |
|
| 60,000 |
|
| 80,000 |
Credit Agreement. (3) |
| 01/15 |
| Floating |
| 01/20 |
|
| 337,500 |
|
| - |
Total long-term debt |
|
|
|
|
|
|
|
| 433,207 |
|
| 192,607 |
Less current maturities of long-term debt |
|
|
|
|
|
|
|
| (21,900) |
|
| (96,900) |
Long-term debt, excluding current maturities |
|
|
|
|
|
|
| $ | 411,307 |
| $ | 95,707 |
| (1) |
| A $1.90 million principal payment was made on March 1, 2014. The remaining loan balance is payable as follows: $1.90 million on March 1 in each of 2015, 2018 , 2019 , 2020 , 2021 , and 2022; $3.80 million on March 1, 2016; $5.70 million on March 1, 2017; and $14.81 million on March 1, 2023. Any remaining outstanding principal and interest is due upon maturity on March 1, 2023. |
| (2) |
| Floating interest rates were hedged with an interest rate swap to effectively fix interest rates while the Senior Notes were outstanding. Additional information regarding the swap is provided in Notes (12) and (13) to these consolidated financial statements. |
| (3) |
| See Note (7) to these consolidated financial statements for further information regarding the terms of the Credit Agreement. |
The fair market value of the fixed rate debt at February 28, 2015 computed using a discounted cash flow analysis was $62.01 million compared to the $60 million book value and represents a Level 2 liability . Our other long-term debt has floating interest rates, and its book value approximates its fair value at February 28, 2015 .
All of our debt is unconditionally guaranteed, on a joint and several basis, by the Company and certain of its subsidiaries. Our debt agreements require the maintenance of certain financial covenants, including maximum leverage ratios, minimum interest coverage ratios and minimum consolidated net worth levels (as each of these terms is defined in the various agreements). Our debt agreements also contain other customary covenants, including, among other things, covenants restricting or limiting the Company, except under certain conditions set forth therein, from (1) incurring debt, (2) incurring liens on its properties, (3) making certain types of investments, (4) selling certain assets or making other fundamental changes relating to mergers and consolidations, and (5) repurchasing shares of our common stock and paying dividends.
99
Table of Contents
As of February 28, 2015 , our debt agreements effectively limited our ability to incur more than $296.82 million of additional debt from all sources, including our Credit Agreement. We were in compliance with the terms of these agreements as of February 28, 2015 .
The following table contains a summary of the components of our interest expense for the periods covered by our consolidated statements of income:
INTEREST EXPENSE
(in thousands)
|
|
|
|
|
|
|
|
|
|
|
| Fiscal Years Ended the Last Day of February, | |||||||
|
| 2015 |
| 2014 |
| 2013 | |||
Interest and commitment fees |
| $ | 11,958 |
| $ | 5,610 |
| $ | 8,858 |
Deferred finance costs |
|
| 1,846 |
|
| 911 |
|
| 903 |
Interest rate swap settlements, net |
|
| 1,218 |
|
| 3,672 |
|
| 3,584 |
Total interest expense |
| $ | 15,022 |
| $ | 10,193 |
| $ | 13,345 |
NOTE 11 - INCOME TAXES
Our components of income before income tax expense are as follows:
COMPONENTS OF INCOME BEFORE TAXES
(in thousands)
|
|
|
|
|
|
|
|
|
|
|
| Fiscal Years Ended the Last Day of February, | |||||||
|
| 2015 |
| 2014 |
| 2013 | |||
U.S. |
| $ | 34,876 |
| $ | 38,147 |
| $ | 50,834 |
Non-U.S. |
|
| 112,338 |
|
| 68,987 |
|
| 84,680 |
Total |
| $ | 147,214 |
| $ | 107,134 |
| $ | 135,514 |
Our components of income tax expense (benefit) are as follows:
COMPONENTS OF INCOME TAX EXPENSE (BENEFIT)
(in thousands)
|
|
|
|
|
|
|
|
|
|
|
| Fiscal Years Ended the Last Day of February, | |||||||
|
| 2015 |
| 2014 |
| 2013 | |||
U.S. |
|
|
|
|
|
|
|
|
|
Current |
| $ | 18,525 |
| $ | 24,736 |
| $ | 26,369 |
Deferred |
|
| (3,014) |
|
| (9,021) |
|
| (8,776) |
|
|
| 15,511 |
|
| 15,715 |
|
| 17,593 |
|
|
|
|
|
|
|
|
|
|
Non-U.S. |
|
|
|
|
|
|
|
|
|
Current |
|
| (645) |
|
| 6,254 |
|
| 5,464 |
Deferred |
|
| 1,184 |
|
| (1,083) |
|
| (3,209) |
|
|
| 539 |
|
| 5,171 |
|
| 2,255 |
Total |
| $ | 16,050 |
| $ | 20,886 |
| $ | 19,848 |
100
Table of Contents
Our total income tax expense differs from the amounts computed by applying the statutory tax rate to income before income taxes. A summary of these differences are as follows:
INCOME TAX RATE RECONCILIATION
|
|
|
|
|
|
|
|
|
|
|
|
| Fiscal Years Ended the Last Day of February, |
| |||||||
|
| 2015 |
| 2014 |
| 2013 |
| |||
Expected effective income tax rate at the U.S. statutory rate |
|
| 35.0 | % |
| 35.0 | % |
| 35.0 | % |
Impact of U.S. state income taxes and other |
|
| 2.3 | % |
| 2.2 | % |
| (0.2) | % |
Decrease in income taxes due to income from non-U.S. operations subject to varying income tax rates |
|
| (10.9) | % |
| (9.1) | % |
| (11.4) | % |
Effect of zero tax rate in Macau |
|
| (16.6) | % |
| (12.3) | % |
| (8.8) | % |
Decrease in income taxes resulting from tax audit settlements |
|
| (0.5) | % |
| (0.2) | % |
| - | % |
Effect of asset impairment charges, most of which are non-deductible |
|
| 1.6 | % |
| 3.9 | % |
| - | % |
Effective income tax rate |
|
| 10.9 | % |
| 19.5 | % |
| 14.6 | % |
Each year there are significant transactions or events that are incidental to our core businesses and that by a combination of their nature and jurisdiction, can have a disproportionate impact on our reported effective tax rates. Without these transactions or events, the trend in our effective tax rates would follow a more normalized pattern.
The tax effects of temporary differences that give rise to significant portions of the deferred tax assets and liabilities as of the last day of February 2015 and 2014 are as follows:
COMPONENTS OF DEFERRED TAX ASSETS AND LIABILITIES
(in thousands)
|
|
|
|
|
|
|
|
| Balances at February 28, | ||||
|
| 2015 |
| 2014 | ||
Deferred tax assets, gross: |
|
|
|
|
|
|
Operating loss carryforwards |
| $ | 17,193 |
| $ | 17,455 |
Accounts receivable |
|
| 4,367 |
|
| 4,068 |
Inventories |
|
| 8,450 |
|
| 8,528 |
Accrued expenses and other |
|
| 17,666 |
|
| 20,307 |
Foreign currency contracts, interest rate swaps and deferred exchange gains |
|
| 68 |
|
| 528 |
Total gross deferred tax assets |
|
| 47,744 |
|
| 50,886 |
|
|
|
|
|
|
|
Valuation allowance |
|
| (16,982) |
|
| (15,602) |
Deferred tax liabilities: |
|
|
|
|
|
|
Depreciation and amortization |
|
| (54,788) |
|
| (60,670) |
Total deferred tax liabilities, net |
| $ | (24,026) |
| $ | (25,386) |
In assessing the realizability of deferred tax assets, we consider whether it is more likely than not that some portion or all of the deferred tax assets will not be realized. The ultimate realization of deferred tax assets is dependent upon the generation of future taxable income during the periods in which those temporary differences become deductible. We consider the scheduled reversal of deferred tax liabilities, expected future taxable income and tax planning strategies in making this assessment. In fiscal year 2015, the net increase in our valuation allowance was $1.38 million, principally due to changes in estimates regarding the value of operating loss carryforwards to be used in the future.
101
Table of Contents
The schedule below shows the composition of our operating loss carryforwards and the approximate future taxable income we will need to generate in order to utilize all carryforwards prior to their expiration.
SUMMARY OF OPERATING LOSS CARRYFORWARDS
(in thousands)
|
|
|
|
|
|
|
|
|
|
| Balances at February 28, 2015 | ||||||
|
| Tax Year |
| Gross |
| Required | ||
|
| Expiration |
| Deferred Tax |
| Future Taxable | ||
|
| Date Range |
| Assets |
| Income | ||
U.S. operating loss carryforwards |
| 2016 - 2032 |
| $ | 1,935 |
| $ | 6,260 |
Non-U.S. operating loss carryforwards with definite carryover periods |
| 2014 - 2025 |
|
| 1,848 |
|
| 12,203 |
Non-U.S. operating loss carryforwards with indefinite carryover periods |
| Indefinite |
|
| 13,410 |
|
| 44,757 |
Subtotals |
|
|
|
| 17,193 |
|
| 63,220 |
Less portion of valuation allowance established for operating loss carryforwards |
|
|
|
| (14,649) |
|
| (49,393) |
Total |
|
|
| $ | 2,544 |
| $ | 13,827 |
As of February 28, 2015 , subject to the valuation allowances provided, we believe it is more likely than not that we will realize the net benefits of these deferred tax assets. Any future amount of deferred tax assets considered realizable, however, could be reduced in the near term if estimates of future taxable income during any carryforward periods are reduced.
United States Income Taxes – The U.S. federal income tax returns of Kaz, Inc. and its U.S. subsidiaries for tax years 2003, 2007 and 2008 continue to be under examination as of February 28, 2015 . During fiscal year 2012, the Company received notices of proposed adjustments related to Kaz's 2007 and 2008 tax years. The Company is protesting the adjustments and does not expect them to have a material impact on our results of operations or financial position.
During fiscal year 2014, the IRS began an audit of the U.S. Federal income tax returns of Helen of Troy Texas Corporation and its subsidiaries for the 2011 and 2012 tax years. As of February 28, 2015 , no adjustments have been proposed.
Hungary Income Taxes – The Company is currently under audit in Hungary with respect to the 2005, 2006 and 2009 tax years and has received notices of proposed adjustments for each year. We are currently challenging these adjustments through judicial proceedings and have recorded an unrecognized tax benefit of $2. 54 million.
Income Tax Provisions – We must make certain estimates and judgments in determining income tax expense for financial statement purposes. These estimates and judgments must be used in the calculation of certain tax assets and liabilities because of differences in the timing of recognition of revenue and expense for tax and financial statement purposes. We must assess the likelihood that we will be able to recover our deferred tax assets. If recovery is not likely, we must increase our provision for taxes by recording a valuation allowance against the deferred tax assets that we estimate will not ultimately be recoverable. As changes occur in our assessments regarding our ability to recover our deferred tax assets, our tax provision is increased in any period in which we determine that the recovery is not probable.
102
Table of Contents
Uncertainty in Income Taxes – The calculation of our tax liabilities involves dealing with uncertainties in the application of complex tax regulations. When there is uncertainty in a tax position taken or expected to be taken in a tax return, a liability is recorded for the amount of the position that could be challenged and overturned through any combination of audit, appeals or litigation processes. This amount is determined through criteria and a methodology prescribed by GAAP and is referred to as an "unrecognized tax benefit." In the period these liabilities are established, we record an associated charge to our provision for taxes. If based on new information in a later period, we determine that payment of these amounts are not probable, or that the recorded tax liability differs from what we expect the ultimate assessment to be, we adjust the liability accordingly and recognize a related tax benefit or expense.
During fiscal years 2015 and 2014, changes in the total amount of unrecognized tax benefits were as follows:
UNRECOGNIZED TAX BENEFITS
(in thousands)
|
|
|
|
|
|
|
|
| Fiscal Years Ended | ||||
|
| the Last Day of February, | ||||
|
| 2015 |
| 2014 | ||
Total unrecognized tax benefits, beginning balance |
| $ | 13,924 |
| $ | 15,759 |
Tax positions taken during the current period |
|
| 341 |
|
| - |
Changes in tax positions taken during a prior period |
|
| (1,802) |
|
| 536 |
Changes due to lapse in statute of limitations |
|
| (523) |
|
| (2,363) |
Impact of foreign currency remeasurement on unrecognized tax benefits in the current period |
|
| (763) |
|
| 216 |
Changes resulting from agreements with taxing authorities |
|
| (882) |
|
| (224) |
Total unrecognized tax benefits, ending balance |
|
| 10,295 |
|
| 13,924 |
Less current unrecognized tax benefits |
|
| - |
|
| (453) |
Noncurrent unrecognized tax benefits |
| $ | 10,295 |
| $ | 13,471 |
We do not expect any additional material changes to our existing unrecognized tax benefits during the next twelve months resulting from any issues currently pending with tax authorities.
The Company classifies all interest and penalties on uncertain tax positions as income tax expense. As of February 28 , 2015 and February 28, 2014, the liability for tax-related interest expense and penalties included in unrecognized tax benefits was $1.53 and $2.66 million for interest expense and $1.29 and $1.48 million for penalties, respectively. Additionally, the 2015, 2014 and 2013 provisions for income tax include combined tax-related interest and penalties expense of $0.23 , $0.56 and $1.03 million, respectively.
We file income tax returns in the U.S. federal jurisdiction and in various states and foreign jurisdictions. As of February 28, 2015 , tax years under examination or still subject to examination by material tax jurisdictions are as follows:
|
|
|
|
|
|
|
Jurisdiction |
| Tax Years Under Examination |
| Open Tax Years | ||
Mexico |
| - None - |
| 2009 | - | 2014 |
United Kingdom |
| - None - |
| 2014 | - | 2015 |
United States * |
| 2003, 2007, 2008, 2011, 2012 |
| 2003, 2007, 2008, 2011 - 2015 | ||
Switzerland |
| - None - |
| 2008 | - | 2015 |
Hong Kong |
| - None - |
| 2007 | - | 2015 |
France |
| - None - |
| 2012 | - | 2015 |
Hungary |
| 2005, 2006, 2009 |
| 2005, 2006, 2009 - 2015 | ||
*
Kaz, Inc. and its U.S. subsidiaries are under examination for the 2003, 2007 and 2008 tax years. Helen of Troy Texas Corporation and its subsidiaries are currently under examination for the 2011 and 2012 tax years.
103
Table of Contents
NOTE 12 – FAIR VALUE
The following tables present the fair value of our financial assets and liabilities carried at fair value and measured on a recurring basis as of the last day of February 2015 and 2014 :
FAIR VALUES OF FINANCIAL ASSETS AND LIABILITIES
(in thousands)
|
|
|
|
|
|
|
|
|
| Fair Values at | |
|
| February 28, 2015 | |
Description |
| (Level 2) (1) | |
Assets: |
|
|
|
Money market accounts |
| $ | 1,692 |
Foreign currency contracts |
|
| 129 |
Total assets |
| $ | 1,821 |
|
|
|
|
Liabilities: |
|
|
|
Long-term debt - fixed rate (2) |
| $ | 62,006 |
Long-term debt - floating rate |
|
| 35,707 |
Foreign currency contracts |
|
| 240 |
Total liabilities |
| $ | 97,953 |
|
|
|
|
|
|
|
|
|
| Fair Values at | |
|
| February 28, 2014 | |
Description |
| (Level 2) (1) | |
Assets: |
|
|
|
Money market accounts |
| $ | 1,549 |
Total assets |
| $ | 1,549 |
|
|
|
|
Liabilities: |
|
|
|
Long-term debt - fixed rate (2) |
| $ | 83,951 |
Long-term debt - floating rate |
|
| 112,607 |
Interest rate swaps and foreign currency contracts |
|
| 1,596 |
Total liabilities |
| $ | 198,154 |
| (1) |
| O ur financial assets and liabilities are classified as Level 2 assets because their valuation is dependent on observable inputs and other quoted prices for similar assets or liabilities, or model-derived valuations whose significant value driv er s are observable. |
| (2) |
| Debt values are reported at estimated fair value in these tables , but are recorded in the accompanying consolidated balance sheets at the undiscounted value of remaining principal payments due. |
The carrying amounts of cash and cash equivalents, receivables and accounts payable approximate fair value because of the short maturity of these items. Money market accounts included in cash and cash equivalents in the accompanying consolidated balance sheets consist of interest bearing deposits with banks that pay comparable money market interest rates .
We use derivatives for hedging purposes and our derivatives are primarily foreign currency contracts and interest rate swaps. See Notes (1), (13) and (18) to these consolidated financial statements for more information on our hedging activities.
104
Table of Contents
We classify our fixed and floating rate debt as Level 2 items because the estimation of the fair market value of these financial assets requires the use of a discount rate based upon current market rates of interest for obligations with comparable remaining terms. Such comparable rates are considered significant other observable market inputs. The fair market value of the fixed rate debt was computed using a discounted cash flow analysis and discount rates at February 28 , 2015 and 2014 of 2.05 and 1.75 , respectively. All other long-term debt has floating interest rates, and its book value approximates its fair value as of the reporting date.
The Company's other non-financial assets include goodwill and other intangible assets, which we classify as Level 3 items. These assets are measured at fair value on a non-recurring basis as part of the Company's impairment assessments and as circumstances require. As discussed in Note ( 5 ) to these consolidated financial statements, in connection with our annual impairment testing during the first quarters of fiscal years 2015 and 2014, we recorded non-cash asset impairment charges of $9.00 million ($8.16 million after tax) and $12.05 million ($12.03 million after tax), respectively. The charge s related to certain trademarks in our Personal Care segment, which were written down to their estimated fair value, determined on the basis of future discounted cash flows using the relief from royalty valuation method. The table below presents other non-financial assets measured on a non-recurring basis using significant unobservable inputs (Level 3) for the fiscal years 2015 and 2014:
OTHER NON-FINANCIAL ASSETS
FAIR VALUE MEASUREMENTS USING SIGNIFICANT UNOBSERVABLE INPUTS (Level 3)
(in thousands)
|
|
|
|
|
|
|
|
| Fiscal Years Ended | ||||
|
| the Last Day of February, | ||||
|
| 2015 |
| 2014 | ||
Beginning balances |
| $ | 775,550 |
| $ | 808,869 |
Total gains/income (losses/expense): |
|
|
|
|
|
|
Included in net income - realized |
|
| (34,152) |
|
| (33,403) |
Acquired during the period |
|
| 205,764 |
|
| 339 |
Acquisition adjustments and retirements during the period |
|
| 995 |
|
| (255) |
Ending balances |
| $ | 948,157 |
| $ | 775,550 |
N OTE 13 – FINANCIAL INSTRUMENTS AND RISK MANAGEMENT
Foreign Currency Risk – Our functional currency is the U.S. Dollar. By operating internationally, we are subject to foreign currency risk from transactions denominated in currencies other than the U.S. Dollar ("foreign currencies"). Such transactions include sales, certain inventory purchases and operating expenses. As a result of such transactions, portions of our cash, trade accounts receivable and trade accounts payable are denominated in foreign currencies. For the fiscal years 2015 , 2014 and 2013 , approximately 14 , 15 and 15 percent, respectively, of our net sales revenue was in foreign currencies. These sales were primarily denominated in British Pounds, Euros, Mexican Pesos, Canadia n Dollars, Australian Dollars, Peruvian Soles, and Venezuelan Bolivars. We make most of our inventory purchases from the Far East and use the U.S. Dollar for such purchases. In our consolidated statements of income, exchange gains and losses resulting from the remeasurement of foreign taxes receivable, taxes payable, deferred tax assets, and deferred tax liabilities, are recognized in their respective income tax lines, and all other foreign exchange gains and losses are recognized in SG&A. We recorded net foreign exchange gains (losses), including the impact of currency hedges, of ($5.72) , ($0.95) and ($2.36) million in SG& A and $0.40 , ($0.17) and ($0.04) million in income tax expense during fiscal years 2015 , 2014 and 2013 , respectively.
We have historically hedged against certain foreign currency exchange rate-risk by using a series of forward contracts designated as cash flow hedges to protect against the foreign currency exchange risk inherent in our forecasted transactions denominated in currencies other than the U.S. Dollar. We do not enter into any forward exchange contracts or similar instruments for trading or other speculative purposes.
105
Table of Contents
-
A significant portion of the products we sell are purchased from third-party manufacturers in China . During fiscal years 2015 and 2013, the Chinese Renminbi remained relatively flat against the U.S. Dollar. During fiscal year 2014, the Chinese Renminbi appreciated against the U.S. Dollar approximately 3 percent. While China's currency intervention strategy with respect to the U.S. Dollar is continuously evolving, we believe that China's currency may continue to fluctuate against the U.S. Dollar in the short-to-intermediate term, which could result in increased product costs over time.
Venezuelan Bolivar Currency Exchange Uncertainties - In February 2013, the Venezuelan government devalued its currency from 4.30 to 6.30 Bolivars per U.S. Dollar for all goods and services. In March 2013, the Venezuelan government announced an additional complementary auction-based exchange rate mechanism known as SICAD 1. SICAD 1 was made available to certain companies that operate in designated industry sectors. At February 28, 2015 , the SICAD 1 rate was 12 Bolivars to the U.S. Dollar.
In early 2014, the Venezuelan government created a National Center of Foreign Commerce ("CENCOEX") to control the multiple currency exchange rate mechanisms that may be available for a company to exchange funds. CENCOEX was granted the authority to determine the sectors that will be allowed to buy U.S. dollars in SICAD auctions, and subsequently introduced a more accessible market-based, SICAD 2 daily auction exchange market.
In February 2015 , the Venezuelan Government unveiled its latest foreign exchange mechanism known as SIMADI , which replaced the SICAD 2 rate as the lowest rate in Venezuela's three-tier foreign exchange system. Under the latest program , SICAD 1 (now referred to as "SICAD") is still being used in limited circumstances , which we believe preclude us from accessing such rates if we chose to do so . SIMADI is a somewhat less restrictive auction system whose value i s determined by market forces. SIMADI is currently under a trial period and accounts for a small percentage of Venezuelan's foreign exchange. At February 28, 2015 , the SI MADI rate was approximately 177 Bolivars to the U.S. Dollar.
Despite the recent changes made by the Venezuelan government, there remains a significant degree of uncertainty as to which exchange markets might be available to the Company. To date, we have not gained access to U.S. Dollars in Venezuela through either SICAD or SIMADI mechanisms. As of February 28, 2015 , these auctions had not eliminated or changed the official rate of 6.30 Bolivars per U.S. Dollar.
Our business in Venezuela continues to be entirely self-funded with earnings from operations. We have no current need or intention to repatriate Venezuelan earnings and remain committed to the business for the long-term. Within Venezuela, we market primarily liquid, solid- and powder-based personal care and grooming products , which are sourced almost entirely within the country. We do not have, nor do we foresee having, any need to access SICAD or SI MADI . Accordingly, we continue to utilize the official rate of 6.30 Bolivars per U.S. Dollar to re-measure our Venezuelan financial statements.
For the fiscal years 2015 , 2014 and 2013 sales in Venezuela represented approximately 0.7 , 0.6 and 0.6 percent, respectively, of the Company's consolidated net sales revenue. At February 28, 2015 and 2014 , we had a U.S. Dollar based net investment in our Venezuelan business of $10.38 and $7.35 million, respectively, consisting almost entirely of working capital.
Developments within the Venezuelan economy, including any future governmental interventions, are beyond our ability to control or predict, and we cannot assess impacts, if any, such events may have on our Venezuelan business. We will continue to closely monitor the applicability and viability of t he various exchange mechanisms.
Interest Rate Risk – Interest on our outstanding debt as of February 28, 2015 is both floating and fixed. Fixed rates are in place on $60 million of Senior Notes at 3.90 percent and floating rates are in place on the balance of all other debt outstanding, which totaled $373.21 million as of February 28, 2015 . If short-term interest rates increase, we will incur higher interest rates on any future outstanding balances under our Credit Agreement and MFBC Loan.
At February 28, 2014, floating rate $75 million Senior Notes due June 2014 had been effectively converted to fixed rate debt using an interest rate swap (the "swap"). The swap converted the total aggregate notional principal from floating
106
Table of Contents
interest rate payments to fixed interest rate payments at 6.01 percent. Changes in the spread between the fixed rate payment side of the swap and the floating rate receipt side of the swap offset 100 percent of the change in any period of the underlying debt's floating rate payments. The swap was 100 percent effective. As of June 30, 2014, the swap ended concurrent with the repayment at maturity of $75 million of principal on the related Senior Notes.
The following table summarizes the fair values of our various derivative instruments at the end of fiscal years 2015 and 2014 :
FAIR VALUES OF DERIVATIVE INSTRUMENTS
(in thousands)
|
|
|
|
|
|
|
|
|
|
|
|
|
|
|
| February 28, 2015 | |||||||||||
|
|
|
|
|
|
|
|
| Prepaid |
| Accrued | ||
|
|
|
|
|
|
|
|
| Expenses |
| Expenses | ||
|
|
|
| Final |
|
|
|
| and Other |
| and Other | ||
|
|
|
| Settlement |
| Notional |
| Current |
| Current | |||
Designated as hedging instruments |
| Hedge Type |
| Date |
| Amount |
| Assets |
| Liabilities | |||
Foreign currency contracts - sell Euro |
| Cash flow |
| 1/2016 |
| € | 10,000 |
| $ | 129 |
| $ | - |
Foreign currency contracts - sell Pounds |
| Cash flow |
| 2/2016 |
| £ | 6,900 |
|
| - |
|
| 240 |
Total fair value |
|
|
|
|
|
|
|
| $ | 129 |
| $ | 240 |
|
|
|
|
|
|
|
|
|
|
|
|
|
|
|
| February 28, 2014 | |||||||||||
|
|
|
|
|
|
|
|
| Prepaid |
| Accrued | ||
|
|
|
|
|
|
|
|
| Expenses |
| Expenses | ||
|
|
|
| Final |
|
|
|
| and Other |
| and Other | ||
|
|
|
| Settlement |
| Notional |
| Current |
| Current | |||
Designated as hedging instruments |
| Hedge Type |
| Date |
| Amount |
| Assets |
| Liabilities | |||
Foreign currency contracts - sell Euro |
| Cash flow |
| 6/2014 |
| € | 2,850 |
| $ | - |
| $ | 89 |
Foreign currency contracts - sell Pounds |
| Cash flow |
| 11/2014 |
| £ | 4,250 |
|
| - |
|
| 280 |
Interest rate swap |
| Cash flow |
| 6/2014 |
| $ | 75,000 |
|
| - |
|
| 1,227 |
Total fair value |
|
|
|
|
|
|
|
| $ | - |
| $ | 1,596 |
The pre-tax effect of derivative instruments for the fiscal years 2015 and 2014 is as follows:
PRE-TAX EFFECT OF DERIVATIVE INSTRUMENTS
|
|
|
|
|
|
|
|
|
|
|
|
|
|
|
|
| Fiscal Years Ended the Last Day of February | ||||||||||||
|
| Gain / (Loss) |
| Gain / (Loss) Reclassified | ||||||||||
|
| Recognized in OCI |
| from Accumulated Other | ||||||||||
|
| (effective portion) |
| Comprehensive Income (Loss) into Income | ||||||||||
|
| 2015 |
| 2014 |
| Location |
| 2015 |
| 2014 | ||||
Currency contracts - cash flow hedges |
| $ | 434 |
| $ | (962) |
| SG&A |
| $ | 176 |
| $ | (98) |
Interest rate swaps - cash flow hedges |
|
| 28 |
|
| (111) |
| Interest expense |
|
| (1,199) |
|
| (3,707) |
Total |
| $ | 462 |
| $ | (1,073) |
|
|
| $ | (1,023) |
| $ | (3,805) |
We expect net losses of $0.11 million associated with foreign currency contracts currently reported in accumulated other comprehensive income (loss) , to be reclassified into income over the next twelve months. The amount ultimately realized, however, will differ as exchange rates change and the underlying contracts settle. See Notes (1), (12) and (18) to these consolidated financial statements for more information on our hedging activities.
–
Financial instruments, including foreign currency contracts and interest rate swaps, expose us to counterparty credit risk for nonperformance. We manage our exposure to counterparty credit risk by dealing with counterparties who are substantial international financial institutions with significant experience using such derivative
107
Table of Contents
instruments. Although our theoretical credit risk is the replacement cost at the then-estimated fair value of these instruments, we believe that the risk of incurring credit risk losses is remote.
NOTE 14 – OTHER COMMITMENTS AND CONTINGENCIES
Indemnity Agreements – Under agreements with customers, licensors and parties from whom we have acquired assets or entered into business combinations, we indemnify these parties against liability associated with our products. Additionally, we are party to a number of agreements under leases where we indemnify the lessor for liabilities attributable to our actions or conduct. The indemnity agreements to which we are a party do not, in general, increase our liability for claims related to our products or actions and have not materially affected our consolidated financial statements.
Employment Contracts – Until January 2014 , we were party to a restated employment agreement with Gerald J. Rubin, our former Chief Executive Officer and President (the "former CEO"). On January 14, 2014, the Company and the former CEO entered into a separation agreement (the "Separation Agreement"). Pursuant to the Separation Agreement, the former CEO ceased serving as the Chief Executive Officer and President and resigned as a director of the Company, effective January 14, 2014, but remained an employee of the Company through February 28, 2014. The former CEO's employment with the Company was considered a termination without cause under the terms of his employment agreement. As a result, in connection with the termination of his employment, Mr. Rubin will only receive the amounts or payments due to him under the employment agreement for a termination of employment without cause as of February 28, 2014. As a result of the Separation Agreement, the Company recorded a charge of $16.34 million (after tax) in the fourth quarter of fiscal year 2014, which accrued for liabilities and associated legal and administrative costs as a result of the separation.
We have entered into employment contracts with certain officers, including an employment agreement with Mr. Mininberg effective March 1, 2014, in connection with his appointment as the Company's new CEO. These agreements provide for minimum salary levels, potential incentive bonuses, and in some cases, performance based awards. These agreements also specify varying levels of salary continuation and/or severance compensation dependent on certain circumstances such as involuntary termination for other than cause or involuntary termination due to a change of control.
In some cases, the expiration dates for these agreements are indefinite, unless terminated by either party. At February 28, 2015, the estimated aggregate commitment for potential future compensation and/or severance pursuant to all continuing employment contracts, was approximately $7.95 million, payable over varying terms for the next two years.
International Trade – We purchase most of our appliances and a significant portion of other products that we sell from unaffiliated manufacturers located in the Far East, mainly in China. With most of our products being manufactured in the Far East, we are subject to risks associated with trade barriers, currency exchange fluctuations and social, economic and political unrest. In recent years, increasing labor costs, regional labor dislocations driven by new government policies, local inflation, changes in ocean cargo carrier capacity and costs, the impact of energy prices on transportation, and the appreciation of the Chinese Renminbi against the U.S. Dollar have resulted in fluctuations in our cost of goods sold. In the past, certain Chinese suppliers have closed operations due to economic conditions that pressured their profitability. Any future supplier closings could cause periodic disruptions in delivery of certain items that can affect our sales. Although we have multiple sourcing partners for many of our products, occasionally we are unable to source certain items on a timely basis due to changes occurring with our suppliers. We believe supplier contraction continues to be a trend in our industry. We also believe that we could source similar products outside China, if necessary, and we continuously explore expanding sourcing alternatives in other countries. However, the relocation of any production capacity could require substantial time and increased costs.
Customer Incentives – We regularly enter into arrangements with customers whereby we offer various incentives, including incentives in the form of volume rebates. Our estimate of the liability for such incentives is included in the accompanying consolidated balance sheets on the line entitled "Accrued expenses and other current liabilities," and in Note ( 8 ) to these consolidated financial statements included in the lines entitled "Accrued sales returns, discounts and allowances" and "Accrued advertising" and are based on incentives applicable to sales occurring up to the respective balance sheet dates.
108
Table of Contents
Other Matters – We are involved in various legal claims and proceedings in the normal course of operations. We believe the outcome of these matters will not have a material adverse effect on our consolidated financial position, results of operations, or liquidity.
Contractual Obligations and Commercial Commitments – Our contractual obligations and commercial commitments at the end of fiscal year 2015 were:
PAYMENTS DUE BY PERIOD - TWELVE MONTHS ENDED THE LAST DAY OF FEBRUARY:
(in thousands)
|
|
|
|
|
|
|
|
|
|
|
|
|
|
|
|
|
|
|
|
|
|
|
|
|
|
| 2016 |
| 2017 |
| 2018 |
| 2019 |
| 2020 |
| After | ||||||
|
| Total |
| 1 year |
| 2 years |
| 3 years |
| 4 years |
| 5 years |
| 5 years | |||||||
Fixed rate debt |
| $ | 60,000 |
| $ | 20,000 |
| $ | 20,000 |
| $ | 20,000 |
| $ | - |
| $ | - |
| $ | - |
Floating rate debt |
|
| 373,207 |
|
| 1,900 |
|
| 3,800 |
|
| 5,700 |
|
| 1,900 |
|
| 339,400 |
|
| 20,507 |
Long-term incentive plan payouts |
|
| 12,379 |
|
| 5,718 |
|
| 4,096 |
|
| 2,565 |
|
| - |
|
| - |
|
| - |
Interest on fixed rate debt |
|
| 4,372 |
|
| 2,236 |
|
| 1,460 |
|
| 676 |
|
| - |
|
| - |
|
| - |
Interest on floating rate debt |
|
| 38,366 |
|
| 7,805 |
|
| 7,732 |
|
| 7,622 |
|
| 7,586 |
|
| 6,655 |
|
| 966 |
Open purchase orders |
|
| 197,998 |
|
| 197,998 |
|
| - |
|
| - |
|
| - |
|
| - |
|
| - |
Long-term purchase commitments |
|
| 2,609 |
|
| 1,094 |
|
| 606 |
|
| 606 |
|
| 303 |
|
| - |
|
| - |
Minimum royalty payments |
|
| 73,283 |
|
| 12,566 |
|
| 12,567 |
|
| 12,518 |
|
| 9,708 |
|
| 8,446 |
|
| 17,478 |
Advertising and promotional |
|
| 54,059 |
|
| 11,284 |
|
| 5,901 |
|
| 6,054 |
|
| 6,162 |
|
| 6,271 |
|
| 18,387 |
Operating leases |
|
| 20,791 |
|
| 4,063 |
|
| 3,467 |
|
| 2,876 |
|
| 2,720 |
|
| 1,394 |
|
| 6,271 |
Capital spending commitments |
|
| 2,597 |
|
| 2,597 |
|
| - |
|
| - |
|
| - |
|
| - |
|
| - |
Total contractual obligations (1) |
| $ | 839,661 |
| $ | 267,261 |
| $ | 59,629 |
| $ | 58,617 |
| $ | 28,379 |
| $ | 362,166 |
| $ | 63,609 |
| (1) |
| In addition to the contractual obligations and commercial commitments in the table above, as of February 28, 2015, we have recorded a provision for uncertain tax positions of $10.30 million. We are unable to reliably estimate the timing of most of the future payments, if any, related to uncertain tax positions; therefore, we have excluded these tax liabilities from the table above . |
NOTE 15 – REPURCHASE OF HELEN OF TROY COMMON STOCK
As of February 28, 2015, we were authorized by our Board of Directors to purchase up to $265.43 million of common stock in the open market or through private transactions. On March 14, 2014, the Company completed a modified "Dutch auction" tender offer resulting in the repurchase of 3,693,816 shares of its outstanding common stock at a total cost of $247.83 million, including tender offer transaction-related costs. The Company also repurchased 408,327 shares of outstanding common stock on the open market at a total cost of $25.77 million during fiscal year 2015 .
Our current equity-based compensation plans include provisions that allow for the "net exercise" of stock options by all plan participants. In a net exercise, any required payroll taxes, federal withholding taxes and exercise price of the shares due from the option holder can be paid for by having the option holder tender back to the Company a number of shares at fair value equal to the amounts due. These transactions are accounted for by the Company as a purchase and retirement of shares and are included in the table on the following page as common stock received in connection with share-based compensation.
During the fiscal quarter ended May 31, 2014, certain employees tendered 1,993 shares of common stock having a market value of $59.13 per share, or $0.12 million in the aggregate, and our former CEO tendered 68,086 shares of common
stock having a market value of $67.10 per share, or $4.57 million in the aggregate, as payment for related federal tax obligations arising from the vesting and settlement of performance-based restricted stock units and restricted stock awards. During the fiscal quarter ended May 31, 2013, 9,898 shares of common stock having a market value of $35.55
per share, or $0.35 million in the aggregate, were withheld as payment for related federal tax obligations arising from the vesting and settlement of performance-based restricted stock awards.
109
Table of Contents
For the second through fourth quarters of fiscal year 2015, we did not repurchase any shares of common stock on the open market or through tender offer . In the second and third quarters of fiscal year 2015 , no shares of common stock were tendered by our employees in "net exercise" transactions.
During the fourth quarter ended February 28, 201 5 , certain employees tendered 1,871 shares of common stock having a market value of $74.64 per share, or $0.14 million in the aggregate.
The following table summarizes our share repurchase activity for the periods covered below:
SHARE REPURCHASES
|
|
|
|
|
|
|
|
|
|
|
| Fiscal Years Ended the Last Day of February, | |||||||
|
| 2015 |
| 2014 |
| 2013 | |||
Common stock repurchased on the open market or through tender offer |
|
|
|
|
|
|
|
|
|
Number of shares |
|
| 4,102,143 |
|
| 33,862 |
|
| 61,426 |
Aggregate market value of shares (in thousands) |
| $ | 273,599 |
| $ | 1,311 |
| $ | 1,759 |
Average price per share |
| $ | 66.70 |
| $ | 38.71 |
| $ | 28.64 |
|
|
|
|
|
|
|
|
|
|
Common stock received in connection with share-based compensation |
|
|
|
|
|
|
|
|
|
Number of shares |
|
| 71,950 |
|
| 112,677 |
|
| 49,126 |
Aggregate market value of shares (in thousands) |
| $ | 4,826 |
| $ | 6,937 |
| $ | 1,627 |
Average price per share |
| $ | 67.08 |
| $ | 61.57 |
| $ | 33.12 |
NOTE 16 – SHARE-BASED COMPENSATION PLANS
We have equity awards outstanding under a n expired employee stock option and restricted stock plan adopted in 1998 (the "1998 Plan"). We also have equity awards outstanding under three active share-based compensation plans. The plans consist of the Helen of Troy Limited 2008 Stock Incentive Plan, an employee stock option and restricted stock plan (the "2008 Stock Incentive Plan"), the Helen of Troy Limited 2008 Non-Employee Directors Stock Incentive Plan, a non-employee director restricted stock plan (the "2008 Directors' Plan"), and the Helen of Troy Limited 2008 Employee Stock Purchase Plan (the "2008 Stock Purchase Plan"). These plans are described below. The plans are administered by the Compensation Committee of the Board of Directors, which consists of non-employee directors who are independent under the NASDAQ Stock Market listing standards.
Expired Plan
The 1998 Plan – The plan covered a total of 6,750,000 shares of common stock for issuance to key officers and employees. The 1998 Plan provided for the grant of options to purchase our common stock at a price equal to or greater than the fair market value on the grant date. The 1998 Plan contained provisions for incentive stock options, non-qualified stock options and restricted share grants. Generally, options granted under the 1998 Plan become exercisable over four - or five -year vesting periods and expire on dates ranging from seven to ten years from the date of grant. The 1998 Plan expired by its terms on August 25, 2008. As of February 28 , 2015 , 16,350 shares of common stock subject to options were outstanding under the plan.
Active Plans
The 2008 Stock Incentive Plan – The plan covers a total of 3,750,000 shares of common stock for issuance to key officers, employees and consultants of the Company. Under this plan, the Company offers stock-based compensation that includes stock options, annual restricted share awards, time- vested restricted stock units and performan ce-based restricted stock units . The plan will expire by its terms on August 19, 2018.
110
Table of Contents
Stock Options
Generally, options granted under the 2008 Stock Incentive Plan will become exercisable over four - or five -year vesting periods and will expire on dates ranging from seven to ten years from the date of grant. These stock options are expensed ratably over their vesting terms. As of February 28, 2015 , 751,665 shares of common stock subject to options were outstanding.
Restricted Stock Awards (" RSAs ")
RSAs were awarded in settlement of our former CEO's annual bonus as a result of the achievement of certain performance targets specified in his employment agreement. RSAs for 159,666 shares of common stock for fiscal year 2013 with a fair value at the date of the award of $35.55 per share, vested and settled on February 28, 2014 . RSA s for 62,304 shares of common stock for fiscal year 2014 with a fair value at the date of the award of $67.10 per share, vested during fiscal year 2015 .
Restricted Stock Units (" RSUs ")
RSUs are awards of time- vested restricted stock units that are independent of stock option grants and are generally subject to forfeiture if employment terminates prior to vesting. During fiscal year 2015, the Company granted RSUs that may be settled for up to 28,937 shares of common stock with an average fair value at the grant date s of $58.36 , to the CEO and certain members of the management team. The awards vest 50 percent on the second anniversary of the grant date and 50 percent on the third anniversary of the grant date. The Company expenses the cost of restricted stock units ratably over their vesting periods.
Performance Restricted Stock Units (" PSUs ")
PSUs are performance-based restricted stock unit awards that represent the right to receive unrestricted shares of stock based on the achievement of Company performance goals over the performance period established by the Compensation Committee of the Company's Board of Directors. In fiscal years 2014 and 2013, respectively, 100,000 PSUs each, having a fair value at the date of grant of $32.88 were awarded in accordance with the terms of our former CEO's employment agreement . During fiscal year 2015, the Company granted PSUs that may be settled for up to 178,101 shares of common stock with an average fair value at the grant date of $58.34 , to the CEO and certain members of the management team. These awards have a three year performance period ending February 28, 201 7 . The awards will vest and settle on the date the Compensation Committee certifies that the performance goals have been achieved. Expense for the new plan must be estimated until earned, subject to a probability assessment of achieving the various performance goals and payout levels.
A summary of activity under the 2008 stock incentive plan follows :
SUMMARY OF ACTIVITY UNDER THE 2008 STOCK INCENTIVE PLAN
|
|
|
|
|
|
|
|
|
|
|
|
|
|
|
Shares originally authorized |
|
|
|
|
|
|
|
|
|
|
|
|
| 3,750,000 |
Less cumulative stock option grants issued, net of forfeitures |
|
|
|
|
|
|
|
| (1,154,860) | |||||
Less restricted share awards previously vested and settled |
|
|
|
|
|
|
|
| (421,970) | |||||
Subtotal |
|
|
|
|
|
|
|
|
|
|
|
|
| 2,173,170 |
Less maximum RSUs issuable upon vesting (1) |
|
|
|
|
|
|
|
| (28,937) | |||||
Less estimated maximum PSUs issuable upon vesting (1) |
|
|
|
|
|
|
|
| (178,101) | |||||
Shares available for issuance |
|
|
|
|
|
|
|
|
|
|
|
|
| 1,966,132 |
| (1) |
| RSUs and PSUs potentially issuable are estimated by dividing the maximum payouts of $1.69 and $10.39 million, respectively (assuming no forfeitures), by grant date weighted average fair values of $58.36 and $58.34 per share, respectively . |
The 2008 Directors' Plan – The plan covers a total of 175,000 shares of common stock for issuance of restricted stock, restricted stock units or other stock-based awards to non-employee members of our Board of Directors. Awards granted
111
Table of Contents
under the 2008 Directors' Plan will be subject to vesting schedules and other terms and conditions as determined by the Compensation Committee of the Company's Board of Directors. The plan will expire by its terms on August 19, 2018. As of February 28, 2015 , 67,891 shares of restricted stock have been granted and 107,109 shares remained available for future issue under the plan. Under the 2008 Directors' Plan, for the fiscal years ended 2015 , 2014 and 2013 , the Company granted 9,267 , 10 ,512 and 10,512 shares of restricted stock, respectively, to certain members of our Board of Directors having weighted average fair values at the date of grant of $61.72 , $ 41.26 and $31.54 per share for each year, respectively. The restricted stock awards vested immediately, were valued at the fair value of the Company's common stock at the date of the grant and accordingly, were expensed at the time of the grants.
The 2008 Stock Purchase Plan – The plan covers a total of 350,000 shares of common stock for issuance to our employees. Under the terms of the plan, employees may authorize the withholding of up to 15 percent of their wages or salaries to purchase our shares of common stock. The purchase price for shares acquired under the 2008 Stock Purchase Plan is equal to the lower of 85 percent of the share's fair market value on either the first day of each option period or the last day of each period. The plan will expire by its terms on September 1, 2018. Shares of common stock purchased under the 2008 Stock Purchase Plan vest immediately at the time of purchase. Accordingly, the fair value award associated with their discounted purchase price is expensed at the time of purchase. During fiscal years 2015 , 2014 and 2013 , plan participants acquired a total of 31,128 , 41,328 and 39,728 shares of common stock at average prices of $49.49 , $32.66 and $26.68 per share, respectively. As of February 28 , 2015 , 127,085 shares remained available for future issue under this plan.
The Company recorded share-based compensation expense in SG&A for each of the fiscal years covered by our consolidated statements of income as follows:
SHARE-BASED PAYMENT EXPENSE
(in thousands, except per share data)
|
|
|
|
|
|
|
|
|
|
|
| Fiscal Years Ended the Last Day of February, | |||||||
|
| 2015 |
| 2014 |
| 2013 | |||
Stock options |
| $ | 3,279 |
| $ | 2,380 |
| $ | 2,298 |
Directors stock compensation |
|
| 816 |
|
| 619 |
|
| 473 |
Performance based and other stock awards (1) |
|
| 1,732 |
|
| 13,446 |
|
| 2,988 |
CEO separation compensation (2) |
|
| - |
|
| 15,000 |
|
| - |
Employee stock purchase plan |
|
| 391 |
|
| 424 |
|
| 296 |
Share-based payment expense |
|
| 6,218 |
|
| 31,869 |
|
| 6,055 |
Less income tax benefits |
|
| (661) |
|
| (5,709) |
|
| (858) |
Share-based payment expense, net of income tax benefits |
| $ | 5,557 |
| $ | 26,160 |
| $ | 5,197 |
|
|
|
|
|
|
|
|
|
|
Earnings per share impact of share based payment expense: |
|
|
|
|
|
|
|
|
|
Basic |
| $ | 0.19 |
| $ | 0.82 |
| $ | 0.16 |
Diluted |
| $ | 0.19 |
| $ | 0.81 |
| $ | 0.16 |
The table above includes the following awards recognized in accordance with the terms of our former CEO's Employment and Separation Agreements:
| (1) |
| Includes RSAs for 159,666 shares of common stock for fiscal year 2013 with a fair value at the date of the award of $35.55 per share, vested and settled at the end of Februa r y 2014, and RSAs for 62,304 shares of common stock for fiscal year 2014 with a fair value at the date of the award of $67.10 per share, vested in April 2014. For both fiscal years 2014 and 2013, PSUs for 100,000 shares of common stock having a fair value at the date of grant of $32.88 were awarded in accordance with the terms of our former CEO's employment agree ment. PSUs for 1 66,600 and 34,4 00 shares of common stock vested and settled in April 2014 and April 201 3, respectively . |
| (2) |
| $15 million in aggregate fair value of shares of common stock, awarded under the terms of the employment agreement with our former CEO. |
The fair value of all share-based payment awards are estimated using a Black-Scholes option pricing model with the following assumptions for fiscal years 2015 , 2014 and 2013
112
Table of Contents
ASSUMPTIONS USED FOR FAIR VALUE OF STOCK OPTION GRANTS
|
|
|
|
|
|
|
|
| Fiscal Years Ended the Last Day of February | ||||
|
| 2015 |
| 2014 |
| 2013 |
Range of risk free interest rates used |
| 1.2% - 1.5% |
| 0.6% - 1.3% |
| 0.1% - 0.9% |
Expected dividend rate |
| 0.0% |
| 0.0% |
| 0.0% |
Weighted average volatility rate |
| 48.0% |
| 38.8% |
| 51.4% |
Range of expected volatility rates used |
| 35.3% - 50.5% |
| 34.0% - 41.7% |
| 45.7% - 55.3% |
Range of expected terms used (in years) |
| 4.1 - 4.4 |
| 4.1 - 4.4 |
| 4.1 - 4.4 |
The following describes how certain assumptions above are determined and affect the estimated fair value of options or discounted employee share purchases ("share-based payments"). The risk-free interest rate is based on U.S. Treasury securities with maturities equal to the expected life of the share-based payments. The dividend yield is computed as zero because the Company has not historically paid dividends nor does it expect to do so at this time. Expected volatility is based on a weighted average of the market implied volatility and historical volatility over the expected life of the underlying share-based payments. The Company uses its historical experience to estimate the expected life of each stock-option grant and also to estimate the impact of exercise, forfeitures, termination, and holding period behavior for fair value expensing purposes.
A summary of stock option activity under all the Company's share-based compensation plans follows:
SUMMARY OF STOCK OPTION ACTIVITY
(in thousands, except contractual term and per share data)
|
|
|
|
|
|
|
|
|
|
|
|
|
|
|
|
|
|
|
|
|
|
|
|
| Weighted |
|
|
| |
|
|
|
| Weighted |
| Weighted |
| Average |
|
|
| |||
|
|
|
| Average |
| Average |
| Remaining |
|
|
| |||
|
|
|
| Exercise |
| Grant Date |
| Contractual |
|
|
| |||
|
|
|
| Price |
| Fair Value |
| Term |
| Intrinsic | ||||
|
| Options |
| (per share) |
| (per share) |
| (in years) |
| Value | ||||
Outstanding at March 1, 2012 |
| 871 |
| $ | 26.26 |
| $ | 10.31 |
|
| 5.78 |
| $ | 5,570 |
Grants |
| 309 |
|
| 34.57 |
|
| 14.09 |
|
|
|
|
|
|
Exercises |
| (248) |
|
| 22.88 |
|
|
|
|
|
|
|
| 2,634 |
Forfeitures / expirations |
| (68) |
|
| 30.23 |
|
|
|
|
|
|
|
|
|
Outstanding at February 28, 2013 |
| 864 |
|
| 29.89 |
|
| 11.98 |
|
| 6.26 |
|
| 6,209 |
Grants |
| 264 |
|
| 36.45 |
|
| 11.61 |
|
|
|
|
|
|
Exercises |
| (239) |
|
| 25.36 |
|
|
|
|
|
|
|
| 4,663 |
Forfeitures / expirations |
| (50) |
|
| 33.55 |
|
|
|
|
|
|
|
|
|
Outstanding at February 28, 2014 |
| 839 |
|
| 33.03 |
|
| 12.38 |
|
| 6.48 |
|
| 27,081 |
Grants |
| 257 |
|
| 63.84 |
|
| 25.22 |
|
|
|
|
|
|
Exercises |
| (187) |
|
| 29.70 |
|
|
|
|
|
|
|
| 6,498 |
Forfeitures / expirations |
| (141) |
|
| 40.67 |
|
|
|
|
|
|
|
|
|
Outstanding at February 28, 2015 |
| 768 |
| $ | 42.76 |
| $ | 16.28 |
|
| 6.59 |
| $ | 26,008 |
|
|
|
|
|
|
|
|
|
|
|
|
|
|
|
Exercisable at February 28, 2015 |
| 94 |
| $ | 28.32 |
| $ | 11.23 |
|
| 4.72 |
| $ | 4,523 |
|
|
|
|
|
|
|
|
|
|
|
|
|
|
|
113
Table of Contents
A summary of non-vested stock option activity and changes under all the Company's share-based compensation plans follows:
NON-VESTED STOCK OPTION ACTIVITY
(in thousands, except per share data)
|
|
|
|
|
|
|
|
|
|
|
|
|
|
|
|
|
|
|
|
|
|
|
|
|
|
|
| Weighted | |
|
|
|
|
|
|
|
|
|
|
|
|
| Average | |
|
|
|
|
|
|
|
|
|
|
| Non- |
| Grant Date | |
|
|
|
|
|
|
|
|
|
|
| Vested |
| Fair Value | |
|
|
|
|
|
|
|
|
|
|
| Options |
| (per share) | |
Outstanding at March 1, 2012 |
|
|
|
|
|
|
|
|
|
| 617 |
| $ | 10.99 |
Grants |
|
|
|
|
|
|
|
|
|
| 309 |
|
| 14.09 |
Vested or forfeited |
|
|
|
|
|
|
|
|
|
| (237) |
|
| 10.29 |
Outstanding at February 28, 2013 |
|
|
|
|
|
|
|
|
|
| 689 |
|
| 12.62 |
Grants |
|
|
|
|
|
|
|
|
|
| 264 |
|
| 11.61 |
Vested or forfeited |
|
|
|
|
|
|
|
|
|
| (225) |
|
| 11.06 |
Outstanding at February 28, 2014 |
|
|
|
|
|
|
|
|
|
| 728 |
|
| 12.74 |
Grants |
|
|
|
|
|
|
|
|
|
| 257 |
|
| 25.22 |
Vested or forfeited |
|
|
|
|
|
|
|
|
|
| (311) |
|
| 13.87 |
Outstanding at February 28, 2015 |
|
|
|
|
|
|
|
|
|
| 674 |
| $ | 16.98 |
114
Table of Contents
A summary of restricted stock award activity under the Company's 2008 Stock Incentive Plan follows:
SUMMARY OF RESTRICTED STOCK AWARD ACTIVITY
(in thousands, except per share data)
|
|
|
|
|
|
|
|
|
|
|
|
|
|
|
|
|
|
|
|
|
|
|
|
| Weighted |
|
|
| |
|
|
|
|
|
|
|
|
|
| Average |
|
|
| |
|
|
|
|
|
|
|
| Restricted |
| Grant Date |
|
|
| |
|
|
|
|
|
|
|
| Stock |
| Fair Value |
| Fair Value | ||
|
|
|
|
|
|
|
| Awards |
| (per share) |
| Outstanding | ||
Due for issue at March 1, 2012 |
|
|
|
|
|
|
| - |
| $ | - |
| $ | - |
Earned (1) |
|
|
|
|
|
|
| 160 |
|
| 35.55 |
|
|
|
Vested and issued |
|
|
|
|
|
|
| - |
|
| - |
|
|
|
Due for Issue at February 28, 2013 (2) |
|
|
|
|
|
|
| 160 |
| $ | 35.55 |
| $ | 5,920 |
Earned (2) |
|
|
|
|
|
|
| 62 |
|
| 67.10 |
|
|
|
Vested and issued (1) |
|
|
|
|
|
|
| (160) |
|
| 35.55 |
|
|
|
Due for issue at February 28, 2014 |
|
|
|
|
|
|
| 62 |
| $ | 67.10 |
| $ | 4,073 |
Vested and issued (2) |
|
|
|
|
|
|
| (62) |
|
| 67.10 |
|
|
|
Due for issue at February 28, 2015 |
|
|
|
|
|
|
| - |
| $ | - |
| $ | - |
The schedule above includes the following awards earned based on fiscal years 201 3 and 201 4 performance and vested in accordance with the terms of our former CEO's employment a greement:
| (1) |
| Fiscal year 2013 RSAs, which vested on February 28, 2014. |
| (2) |
| Fiscal year 2014 RSAs, which vested on April 22, 2014. |
For further information regarding the former CEO's employment agreement , see Note (14) to these consolidated financial statements under the subheading "Employment Contracts."
115
Table of Contents
A summary of restricted stock unit activity and changes under the Company's 2008 Stock Incentive Plan follows:
SUMMARY OF RESTRICTED STOCK UNIT ACTIVITY
(in thousands, except per share data)
|
|
|
|
|
|
|
|
|
|
|
|
|
|
|
|
|
|
|
|
|
|
|
|
|
| Weighted |
|
|
|
|
|
|
|
|
|
|
|
|
|
| Average |
|
|
|
|
|
|
|
|
|
|
| Restricted |
|
| Grant Date |
|
|
|
|
|
|
|
|
|
|
| Stock |
|
| Fair Value |
|
| Fair Value |
|
|
|
|
|
|
|
| Units |
|
| (per share) |
|
| Outstanding |
Outstanding at March 1, 2012 |
|
|
|
|
|
|
| - |
| $ | - |
| $ | - |
Granted |
|
|
|
|
|
|
| 700 |
|
| 32.88 |
|
|
|
Vested |
|
|
|
|
|
|
| - |
|
| - |
|
|
|
Outstanding at February 28, 2013 |
|
|
|
|
|
|
| 700 |
|
| 32.88 |
|
| 25,956 |
Vested (1) |
|
|
|
|
|
|
| (100) |
|
| 32.88 |
|
|
|
Forfeited (2) |
|
|
|
|
|
|
| (500) |
|
| 32.88 |
|
|
|
Outstanding at February 28, 2014 (3) |
|
|
|
|
|
|
| 100 |
| $ | 32.88 |
| $ | 6,531 |
Granted (4) |
|
|
|
|
|
|
| 118 |
|
| 58.35 |
|
|
|
Vested (3) |
|
|
|
|
|
|
| (100) |
| $ | 32.88 |
|
|
|
Outstanding at February 28, 2015 |
|
|
|
|
|
|
| 118 |
| $ | 58.35 |
| $ | 9,041 |
The schedule above includes the following awards and forfeitures recognized in accordance with the terms of our former CEO's employment a greement:
| (1) |
| Incl udes fiscal year 2013 PSUs for 100,000 shares of common stock . 33,400 vested and settled on April 22, 2013 at a fair value of $35.55 per share and 66,600 vested and settled on Febru ary 28, 2014 at a fair value of $65.31 per share. |
| (2) |
| PSUs for 500,000 shares of common stock were forfeited. |
| (3) |
| Inclu des fiscal year 2014 PSUs for 100,000 shares of common stock , which were vested and settled on April 22, 2014 at a fair value of $67.10 per share. |
| (4) |
| Includes target level RSUs and PSUs granted to its current CEO and certain members of the management team in connection with new long-term incentive compensation instituted by the Company in fiscal year 2015. |
A summary of our total unrecognized share-based compensation expense as of February 28, 2015 is as follows:
UNRECOGNIZED SHARE-BASED COMPENSATION EXPENSE
(in thousands, except weighted average expense period data)
|
|
|
|
|
|
|
|
|
|
| Weighted |
|
|
|
|
| Average |
|
| Unrecognized |
| Period of | |
|
| Compensation |
| Recognition | |
|
| Expense |
| (in months) | |
Stock options |
| $ | 6,405 |
| 35.0 |
Restricted Stock Units (RSUs and PSUs) |
|
| 3,585 |
| 22.1 |
NOTE 17 – DEFINED CONTRIBUTION PLANS
We sponsor defined contribution savings plans in the U.S. and other countries where we have employees. Total matching contributions made to these savings plans for the fiscal years ended 2015, 2014 and 2013 were $3.21 , $2.89 and $2.60 million, respectively .
116
Table of Contents
NOTE 18 – ACCUMULATED OTHER COMPREHENSIVE INCOME (LOSS)
The changes in accumulated other comprehensive income (loss) by component and related tax effects for fiscal years 2015 and 2014 were as follows:
CHANGES IN ACCUMULATED OTHER COMPREHENSIVE INCOME ( LOSS ) BY COMPONENT
(in thousands)
|
|
|
|
|
|
|
|
|
|
|
| Unrealized Holding Gains (Losses) |
|
|
| ||||
|
| On Cash Flow Hedges |
|
|
| ||||
|
|
|
| Foreign |
|
|
| ||
|
| Interest Rate |
| Currency |
|
|
| ||
|
| Swaps (1) |
| Contracts (2) |
| Total | |||
Balance at February 28, 2013 |
| $ | (3,135) |
| $ | 406 |
| $ | (2,729) |
Other comprehensive income before reclassification |
|
| (111) |
|
| (962) |
|
| (1,073) |
Amounts reclassified out of accumulated other comprehensive income |
|
| 3,707 |
|
| 98 |
|
| 3,805 |
Tax effects |
|
| (1,258) |
|
| 164 |
|
| (1,094) |
Other Comprehensive Income (Loss) |
|
| 2,338 |
|
| (700) |
|
| 1,638 |
Balance at February 28, 2014 |
|
| (797) |
|
| (294) |
|
| (1,091) |
Other comprehensive income before reclassification |
|
| 28 |
|
| 434 |
|
| 462 |
Amounts reclassified out of accumulated other comprehensive income |
|
| 1,199 |
|
| (176) |
|
| 1,023 |
Tax effects |
|
| (430) |
|
| (40) |
|
| (470) |
Other Comprehensive Income (Loss) |
|
| 797 |
|
| 218 |
|
| 1,015 |
Balance at February 28, 2015 |
| $ | - |
| $ | (76) |
| $ | (76) |
| (1) |
| Includes net deferred tax benefits of $0.43 million at the end of fiscal year 2014. |
| (2) |
| Includes net deferred tax benefits (expense) of $0.03 and $0.08 million at the end of fiscal years 2015 and 2014 , respectively. |
See Notes (1), (12) and (13) to these consolidated financial statements for additional information regarding our hedging activities.
117
Table of Contents
NOTE 19 – SELECTED QUARTERLY FINANCIAL DATA (UNAUDITED)
Selected unaudited quarterly financial data is as follows:
SELECTED QUARTERLY FINANCIAL DATA
(in thousands, except per share data)
|
|
|
|
|
|
|
|
|
|
|
|
|
|
|
|
|
| May |
| August |
| November |
| February |
| Total | |||||
Fiscal Year 2015: |
|
|
|
|
|
|
|
|
|
|
|
|
|
|
|
Sales revenue, net |
| $ | 311,778 |
| $ | 319,949 |
| $ | 435,674 |
| $ | 377,730 |
| $ | 1,445,131 |
Gross profit |
|
| 119,520 |
|
| 133,744 |
|
| 181,411 |
|
| 164,884 |
|
| 599,559 |
Asset impairment charges |
|
| 9,000 |
|
| - |
|
| - |
|
| - |
|
| 9,000 |
Net income |
|
| 16,398 |
|
| 18,839 |
|
| 55,377 |
|
| 40,550 |
|
| 131,164 |
|
|
|
|
|
|
|
|
|
|
|
|
|
|
|
|
Earnings per share (1) |
|
|
|
|
|
|
|
|
|
|
|
|
|
|
|
Basic |
|
| 0.56 |
|
| 0.66 |
|
| 1.95 |
|
| 1.42 |
|
| 4.59 |
Diluted |
|
| 0.55 |
|
| 0.65 |
|
| 1.92 |
|
| 1.40 |
|
| 4.52 |
|
|
|
|
|
|
|
|
|
|
|
|
|
|
|
|
Fiscal Year 2014: |
|
|
|
|
|
|
|
|
|
|
|
|
|
|
|
Sales revenue, net |
| $ | 304,516 |
| $ | 319,387 |
| $ | 380,730 |
| $ | 312,520 |
| $ | 1,317,153 |
Gross profit |
|
| 120,165 |
|
| 123,255 |
|
| 147,701 |
|
| 125,582 |
|
| 516,703 |
Asset impairment charges |
|
| 12,049 |
|
| - |
|
| - |
|
| - |
|
| 12,049 |
Net income |
|
| 14,392 |
|
| 23,318 |
|
| 37,524 |
|
| 11,014 |
|
| 86,248 |
|
|
|
|
|
|
|
|
|
|
|
|
|
|
|
|
Earnings per share (1) |
|
|
|
|
|
|
|
|
|
|
|
|
|
|
|
Basic |
|
| 0.45 |
|
| 0.73 |
|
| 1.17 |
|
| 0.34 |
|
| 2.69 |
Diluted |
|
| 0.45 |
|
| 0.72 |
|
| 1.16 |
|
| 0.34 |
|
| 2.66 |
| (1) |
| Earnings per share calculations for each quarter are based on the weighted average number of shares outstanding for each period, and the sum of the quarterly amounts may not necessarily equal the annual earnings per share amounts. |
NOTE 20 – FOURTH QUARTER CHARGES / TRANSACTIONS
Fiscal Year 2015 – Our results for the fourth quarter of fiscal year 201 5 did not contain any transactions of a non-routine nature.
Fiscal Year 2014 – Our results for the fourth quarter of fiscal year 2014 included a charge of $16.34 million (after tax) in connection with payments, including associated legal and administrative costs, required as a result of our former CEO's separation from service, as further discussed in Notes (14), (15) and (16) to these consolidated financial statements.
Fiscal Year 2013 – Our results for the fourth quarter of fiscal year 2013 did not contain any transactions of a non-routine nature other than a $1.41 million Venezuela foreign currency devaluation adjustment.
118
Table of Contents
NOTE 21 - SEGMENT INFORMATION
The following table contains segment information for fiscal years covered by our consolidated financial statements:
SEGMENT INFORMATION
(in thousands)
|
|
|
|
|
|
|
|
|
|
|
|
|
|
|
|
|
|
|
|
| Healthcare / |
| Nutritional |
| Personal |
|
| ||||
Fiscal Year 2015 |
| Housewares |
| Home Environment |
| Supplements (1) |
| Care |
| Total | |||||
Sales revenue, net |
| $ | 296,252 |
| $ | 613,253 |
| $ | 100,395 |
| $ | 435,231 |
| $ | 1,445,131 |
Asset impairment charges |
|
| - |
|
| - |
|
| - |
|
| 9,000 |
|
| 9,000 |
Operating income |
|
| 59,392 |
|
| 50,821 |
|
| 9,512 |
|
| 41,994 |
|
| 161,719 |
Identifiable assets |
|
| 397,956 |
|
| 683,533 |
|
| 218,181 |
|
| 354,085 |
|
| 1,653,755 |
Capital and intangible asset expenditures |
|
| 2,019 |
|
| 2,602 |
|
| 613 |
|
| 1,287 |
|
| 6,521 |
Depreciation and amortization |
|
| 3,615 |
|
| 20,532 |
|
| 5,380 |
|
| 10,126 |
|
| 39,653 |
|
|
|
|
|
|
|
|
|
|
|
|
|
|
|
|
|
|
|
|
| Healthcare / |
| Nutritional |
| Personal |
|
|
| |||
Fiscal Year 2014 |
| Housewares |
| Home Environment |
| Supplements (1) |
| Care |
| Total | |||||
Sales revenue, net |
| $ | 274,478 |
| $ | 568,075 |
|
| - |
| $ | 474,600 |
| $ | 1,317,153 |
Asset impairment charges |
|
| - |
|
| - |
|
| - |
|
| 12,049 |
|
| 12,049 |
Operating income |
|
| 50,828 |
|
| 20,764 |
|
| - |
|
| 45,508 |
|
| 117,100 |
Identifiable assets |
|
| 369,698 |
|
| 676,131 |
|
|
|
|
| 487,473 |
|
| 1,533,302 |
Capital and intangible asset expenditures |
|
| 851 |
|
| 22,934 |
|
| - |
|
| 16,678 |
|
| 40,463 |
Depreciation and amortization |
|
| 3,461 |
|
| 19,318 |
|
| - |
|
| 11,060 |
|
| 33,839 |
|
|
|
|
|
|
|
|
|
|
|
|
|
|
|
|
|
|
|
|
| Healthcare / |
| Nutritional |
| Personal |
|
| ||||
Fiscal Year 2013 |
| Housewares |
| Home Environment |
| Supplements (1) |
| Care |
| Total | |||||
Sales revenue, net |
| $ | 259,042 |
| $ | 538,666 |
| $ | - |
| $ | 490,555 |
| $ | 1,288,263 |
Operating income |
|
| 49,612 |
|
| 37,772 |
|
| - |
|
| 61,389 |
|
| 148,773 |
Identifiable assets |
|
| 362,378 |
|
| 645,586 |
|
| - |
|
| 466,040 |
|
| 1,474,004 |
Capital and intangible asset expenditures |
|
| 1,269 |
|
| 7,795 |
|
| - |
|
| 5,624 |
|
| 14,688 |
Depreciation and amortization |
|
| 4,803 |
|
| 16,614 |
|
| - |
|
| 13,008 |
|
| 34,425 |
| (1) |
| The Nutritional Supplements segment includes eight months of operating results for fiscal year 2015. The segment was acquired on June 30, 2014. Operating income includes acquisition- related expenditures of $3.61 million for fiscal year 2015 . For further information regarding the acquisition, see Note (6) to these consolidated financial statements. |
We compute segment operating income based on net sales revenue, less cost of goods sold, SG&A and any asset impairment charges associated with the segment. The SG&A used to compute each segment's operating income is directly associated with the segment, plus overhead expenses that are allocable to the segment. We do not allocate nonoperating income and expense, including interest or income taxes, to operating segments. The operat ing income for the Nutritional Supplements segment do es not include any allocation of shared service or corporate costs for fiscal year 2015. As the new segment is further integrated into our operating structure, we expect to make an allocation of shared service and corporate costs to the segment in future fiscal years. When we decide such allocations are appropriate, there may be some reduction in the operating income of the Nutritional Supplements segment offset by increases in operating income of our other segments. The extent of this operating income impact between the segments has not yet been determined.
119
Table of Contents
Our domestic and international net sales revenue and long-lived assets were as follows:
GEOGRAPHIC INFORMATION
(in thousands)
|
|
|
|
|
|
|
|
|
|
|
| Fiscal Years Ended the Last Day of February, | |||||||
|
| 2015 |
| 2014 |
| 2013 | |||
SALES REVENUE, NET: |
|
|
|
|
|
|
|
|
|
United States |
| $ | 1,139,959 |
| $ | 1,019,525 |
| $ | 1,014,354 |
International |
|
| 305,172 |
|
| 297,628 |
|
| 273,909 |
Total |
| $ | 1,445,131 |
| $ | 1,317,153 |
| $ | 1,288,263 |
|
|
|
|
|
|
|
|
|
|
LONG-LIVED ASSETS: |
|
|
|
|
|
|
|
|
|
United States |
| $ | 636,089 |
| $ | 444,788 |
| $ | 515,411 |
International: |
|
|
|
|
|
|
|
|
|
Barbados |
|
| 319,298 |
|
| 324,399 |
|
| 398,340 |
Other international |
|
| 133,608 |
|
| 148,639 |
|
| 15,048 |
Subtotal |
|
| 452,906 |
|
| 473,038 |
|
| 413,388 |
Total |
| $ | 1,088,995 |
| $ | 917,826 |
| $ | 928,799 |
The table above classifies assets based upon the country where we hold legal title.
Worldwide sales to our largest customer and its affiliates accounted for approximately 18 , 19 and 19 percent of our net sales revenue in fiscal years 2015, 2014 and 2013 , respectively. Sales to this customer are made within the Personal Care and Healthcare / Home Environment segments. Of these sales, approximately 84 , 92 and 91 percent were within the U.S. during fiscal years 2015, 2014 and 2013 , respectively.
Sales to our second largest customer accounted for approximately 9 , 11 and 11 percent of our net sales revenue in fiscal years ending 2015, 2014 and 2013 , respectively. Sales to this customer are made across all segments, primarily within the United States and Canada. No other customers accounted for 10 percent or more of net sales revenue during those fiscal years.
NOTE 22 – SUBSEQUENT EVENT
On March 31, 2015 the Company announced the acquisition of the Vicks VapoSteam U.S. liquid inhalant business from The Procter & Gamble Company ("P&G"), which includes a fully paid-up license of P&G's Vicks VapoSteam trademarks. In a related transaction, the Company acquired a fully paid-up license of P&G's Vicks VapoPad trademarks for scent pads in the U.S. The vast majority of Vicks VapoSteam and VapoPads are used in Vicks humidifiers, vaporizers and other health care devices already marketed by the Company . The transaction includes the acquisition of certain production assets and inventory related to the above categories, as well as the right to use related product formulations and other intellectual property. The aggregate purchase price for the two transactions was approximately $42.75 million financed under the Credit Agreement . The acquired Vapo S team business had annual revenues of approximately $10 million in calendar year 2014.
120
Table of Contents
HELEN OF TROY LIMITED AND SUBSIDIARIES
Schedule II - Valuation
and Qualifying Accounts
(in thousands)
|
|
|
|
|
|
|
|
|
|
|
|
|
|
|
|
|
|
|
|
| Additions |
|
|
|
|
|
| ||||
|
|
|
|
| Charged to |
| Net charge |
|
|
|
|
|
| ||
|
| Beginning |
| cost and |
| (credit) to |
|
|
|
| Ending | ||||
Description |
| Balance |
| expenses (1) |
| sales revenue (2) |
| Deductions (3) |
| Balance | |||||
Year ended February 28, 2015 |
|
|
|
|
|
|
|
|
|
|
|
|
|
|
|
Allowances for doubtful accounts |
| $ | 2,127 |
| $ | 299 |
| $ | - |
| $ | 577 |
| $ | 1,849 |
Allowances for back-to-stock returns |
|
| 2,552 |
|
| - |
|
| 1,481 |
|
| - |
| $ | 4,033 |
|
|
|
|
|
|
|
|
|
|
|
|
|
|
|
|
Year ended February 28, 2014 |
|
|
|
|
|
|
|
|
|
|
|
|
|
|
|
Allowances for doubtful accounts |
| $ | 1,764 |
| $ | 400 |
| $ | - |
| $ | 37 |
| $ | 2,127 |
Allowances for back-to-stock returns |
|
| 3,267 |
|
| - |
|
| (715) |
|
| - |
| $ | 2,552 |
|
|
|
|
|
|
|
|
|
|
|
|
|
|
|
|
Year ended February 28, 2013 |
|
|
|
|
|
|
|
|
|
|
|
|
|
|
|
Allowances for doubtful accounts |
| $ | 1,811 |
| $ | 188 |
| $ | - |
| $ | 235 |
| $ | 1,764 |
Allowances for back-to-stock returns |
|
| 3,730 |
|
| - |
|
| (463) |
|
| - |
| $ | 3,267 |
| (1) |
| Represents periodic charges to the provision for doubtful accounts. |
| (2) |
| Represents net charges (credits) during the period to sales returns and allowances. Net additions to the allowance for back-to-stock returns for fiscal year 2015 includes $1.40 million of initial back-to-stock reserves recorded through purchase accounting upon the acquisition of Healthy Directions. For more information regarding the acquisition of Healthy Directions, see Note (6) to the accompanying consolidated financial statements. |
| (3) |
| Represents write-offs of doubtful accounts net of recoveries of previously reserved amounts. |
121
Table of Contents
ITEM 9
. CHANGES IN AND DISAGREEMENTS WITH ACCOUNTANTS ON ACCOUNTING AND
FINANCIAL DISCLOSURE
Not applicable.
ITEM 9A
. CONTROLS AND PROCEDURES
EVALUATION OF DISCLOSURE CONTROLS AND PROCEDURES
Under the supervision and with the participation of our Company's management, including the Chief Executive Officer (CEO) and Chief Financial Officer (CFO), we have evaluated the effectiveness of the design and operation of our disclosure controls and procedures as defined in Rule 13a-15(e) promulgated under the Exchange Act as of February 28, 2015 . Based upon that evaluation, our CEO and CFO concluded that our disclosure controls and procedures are effective to ensure that information we are required to disclose in reports that we file or submit under the Exchange Act is accumulated and communicated to management, including the CEO and CFO, as appropriate to allow timely decisions regarding required disclosure and is recorded, processed, summarized and reported within the time periods specified in the SEC's rules and forms.
MANAGEMENT'S REPORT ON INTERNAL CONTROL OVER FINANCIAL REPORTING
The management's report on internal control over financial reporting and the attestation report on internal controls over financial reporting of the independent registered public accounting firm required by this item are set forth under Item 8., "Financial Statements and Supplementary Data" of this report on pages 73 through 74 , and are incorporated herein by reference.
CHANGES IN INTERNAL CONTROL OVER FINANCIAL REPORTING
In connection with the evaluation described above, we identified no change in our internal control over financial reporting as defined in Rule 13a-15(f) promulgated under the Exchange Act that occurred during our fiscal year ended February 28 , 2015 , that has materially affected, or is reasonably likely to materially affect, our internal control over financial reporting.
122
Table of Contents
PART III
ITEM 10
. DIRECTORS, EXECUTIVE OFFICERS AND CORPORATE GOVERNANCE
Information in our Proxy Statement for the 201 5 Annual General Meeting of Shareholders (the "Proxy Statement") is incorporated by reference in response to this Item 10, as noted below:
| · |
| Information about our Directors who are standing for re-election is set forth under "Election of Directors"; |
| · |
| Information about our executive officers is set forth under "Executive Officers"; |
| · |
| Information about our Audit Committee, including members of the committee, and our designated "audit committee financial experts" is set forth under "Corporate Governance" and "Board Committees and Meetings"; and |
| · |
| Information about Section 16(a) beneficial ownership reporting compliance is set forth under "Section 16(a) Beneficial Ownership Reporting Compliance." |
We have adopted a Code of Ethics governing our Chief Executive Officer, Chief Financial and Principal Accounting Officer, and finance department members. The full text of our Code of Ethics is published on our website, at www.hotus.com , under the "Investor Relations-Corporate Governance" caption. We intend to disclose future amendments to, or waivers from, certain provisions of this Code on our website or in a current report on Form 8-K.
ITEM 11
. EXECUTIVE COMPENSATION
Information set forth under the captions "Director Compensation"; "Executive Compensation"; "Compensation Discussion and Analysis"; "Compensation Committee Interlocks and Insider Participation"; and "Report of the Compensation Committee" in our Proxy Statement is incorporated by reference in response to this Item 11.
ITEM 12
. SECURITY OWNERSHIP OF CERTAIN BENEFICIAL OWNERS AND MANAGEMENT AND RELATED SHAREHOLDER MATTERS
Information set forth under the captions "Security Ownership of Certain Beneficial Owners and Management" and "Executive Compensation" in our Proxy Statement is incorporated by reference in response to this Item 12.
ITEM 13
. CERTAIN RELATIONSHIPS AND RELATED TRANSACTIONS, AND DIRECTOR INDEPENDENCE
Information set forth under the captions "Certain Relationships - Related Person Transactions"; "Corporate Governance"; and "Board Committees and Meetings" in our Proxy Statement is incorporated by reference in response to this Item 13.
ITEM 14. PRINCIPAL
ACCOUNTING
FEES AND SERVICES
Information set forth under the caption "Audit and Other Fees Paid to our Independent Registered Public Accounting Firm" in our Proxy Statement is incorporated by reference in response to this Item 14.
123
Table of Contents
PART I
V
ITEM 15
. EXHIBITS, FINANCIAL STATEMENT SCHEDULES
(a) | 1. | Financial Statements: See "Index to Consolidated Financial Statements" under Item 8 on page 72 of this report |
| 2. | Financial Statement Schedule: See "Schedule II" on page 121 of this report |
| 3. | Exhibits |
The exhibit numbers succeeded by an asterisk (*) indicate exhibits physically filed with this Form 10-K. The exhibit numbers succeeded by an asterisk (**) indicate exhibits furnished with this Form 10-K that are not deemed filed for purposes of Section 18 of the Securities Exchange Act of 1934 and otherwise are not subject to liability. All other exhibit numbers indicate exhibits filed by incorporation by reference. Exhibit numbers succeeded by a cross ( † ) are management contracts or compensatory plans or arrangements. | ||
2.1 |
| Agreement and Plan of Merger dated as of December 8, 2010, among Helen of Troy Texas Corporation, KI Acquisition Corp., Kaz, Inc., the Company, and the Kaz, Inc. shareholders party thereto (incorporated by reference to Exhibit 2.1 to the Company's Current Report on Form 8-K, filed with the Securities and Exchange Commission on December 9, 2010). |
3.1 |
| Memorandum of Association (incorporated by reference to Exhibit 3.1 to the Company's Registration Statement on Form S-4, File No. 33-73594, filed with the Securities and Exchange Commission on December 30, 1993 (the "1993 S-4")). |
3.2 |
| Bye-Laws, as amended (incorporated by reference to Exhibit 3.2 to the Company's Quarterly Report on Form 10-Q for the period ending August 31, 2007, filed with the Securities and Exchange Commission on October 10, 2007). |
10.1 † |
| Form of Indemnification Agreement. |
10. 2 |
| Note Purchase Agreement, dated June 29, 2004, by and among the Company, Helen of Troy L.P., Helen of Troy Limited (Barbados) and the purchasers listed in Schedule A thereto (incorporated by reference to Exhibit 10.1 to the Company's Current Report on Form 8-K, filed with the Securities and Exchange Commission on July 2, 2004). |
10. 3 † |
| Amended and Restated Helen of Troy Limited 1998 Stock Option and Restricted Stock Plan (incorporated by reference to Appendix A to the Company's Definitive Proxy Statement on Schedule 14A, File Number 001-14669, filed with the Securities and Exchange Commission on June 15, 2005). |
10. 4 † |
| Form of Helen of Troy Limited Nonstatutory Stock Option Agreement (incorporated by reference to Exhibit 10.25 of the Company's Annual Report on Form 10-K for the fiscal year ended February 28, 2006, filed with the Securities and Exchange Commission on May 15, 2006 (the "2006 10-K")). |
10. 5 † |
| Form of Helen of Troy Limited Incentive Stock Option Agreement (incorporated by reference to Exhibit 10.26 of the 2006 10-K). |
10. 6 † |
| Helen of Troy Limited 2008 Employee Stock Purchase Plan (incorporated by reference to Appendix A to the (incorporated by reference to Appendix A to the Company's Definitive Proxy Statement on Schedule 14A filed with the Securities and Exchange Commission on June 27, 2008 (the "2008 Proxy Statement")). |
10. 7 † |
| Helen of Troy Limited 2008 Non-Employee Directors Stock Incentive Plan (incorporated by reference to Appendix C to the 2008 Proxy Statement). |
10. 8 † |
| Form of Restricted Stock Agreement for the Company's 2008 Non-Employee Directors Stock Incentive Plan (incorporated by reference to Exhibit 10.1 to the Company's Current Report on Form 8-K filed with the Securities and Exchange Commission on August 26, 2009). |
10. 9 |
| Note Purchase Agreement, dated January 12, 2011, by and among Helen of Troy, L.P., the Company, Helen of Troy Limited, a Barbados company, and the purchasers party thereto (incorporated by reference to Exhibit 10.1 to the Company's Current Report on Form 8-K, filed with the Securities and Exchange Commission on January 18, 2011). |
124
Table of Contents
10. 1 0 † |
| Helen of Troy Limited 2008 Stock Incentive Plan, as amended (incorporated by reference to Appendix A to the Company's Definitive Proxy Statement on Schedule 14A, File Number 001-14669, filed with the Securities and Exchange Commission on September 14, 2011). |
10. 1 1 † * |
| Amended and Restated Helen of Troy Limited 2011 Annual Incentive Plan. |
10. 1 2 |
| Loan Agreement, dated as of March 1, 2013, by and between Kaz USA, Inc. and Mississippi Business Finance Corporation (incorporated by reference to Exhibit 10.1 to the Company's Current Report on Form 8-K, filed with the Securities and Exchange Commission on March 26, 2013). |
10. 1 3 |
| Guaranty Agreement, dated as of March 1, 2013, by Helen of Troy Limited and certain of its subsidiaries in favor of Bank of America, N.A. (incorporated by reference to Exhibit 10.2 to the Company's Current Report on Form 8-K, filed with the Securities and Exchange Commission on March 26, 2013). |
10. 1 4 |
| Trust Indenture, dated as of March 1, 2013 between Mississippi Business Finance Corporation and Deutsche Bank National Trust, as trustee (incorporated by reference to Exhibit 10.2 to the Company's Current Report on Form 8-K, filed with the Securities and Exchange Commission on March 26, 2013). |
10. 1 5 † |
| Form of Helen of Troy Limited Stock Option Agreement (incorporated by reference to Exhibit 10.34 to the Company's Annual Report on Form 10-K for the fiscal year ended February 28, 2013, filed with the Securities and Exchange Commission on April 29, 2013 (the "2013 10-K")). |
10. 1 6 † |
| Form of Restricted Stock Agreement for the Company's 2008 Non-Employee Directors Stock Incentive Plan (incorporated by reference to Exhibit 10.35 of the 2013 10-K). |
10. 1 7 † |
| Employment Agreement among Helen of Troy Nevada Corporation, Helen of Troy Limited and Julien Mininberg, dated January 14, 2014 (incorporated by reference to Exhibit 10.1 to the Company's Current Report on Form 8-K, filed with the Securities and Exchange Commission on January 16, 2014). |
10. 1 8 † |
| Separation Agreement among Helen of Troy Nevada Corporation, Helen of Troy Limited, Helen of Troy Limited (a Barbados company) and Gerald J. Rubin, dated January 14, 2014 (incorporated by reference to Exhibit 10.2 to the Company's Current Report on Form 8-K, filed with the Securities and Exchange Commission on January 16, 2014). |
10. 19 |
| First Amendment to Guaranty Agreement, dated as of February 7, 2014, made by Helen of Troy, L.P., Helen of Troy Limited, a Barbados company, HOT Nevada, Inc, Helen of Troy Nevada Corporation, Helen of Troy Texas Corporation, Idelle Labs Ltd., OXO International Ltd., Helen of Troy Macao Commercial Offshore Limited, Kaz, Inc., Kaz USA, Inc., Kaz Canada, Inc., and Pur Water Purification Products, Inc., in favor of Bank of America, N.A. (incorporated by reference to Exhibit 10.2 to the Company's Current Report on Form 8-K, filed with the Securities and Exchange Commission on February 10, 2014). |
10. 2 0 |
| Second Amendment to Guaranty Agreement, dated as of June 11, 2014, made by Helen of Troy Limited and certain of its subsidiaries in favor of Bank of America, N.A. (incorporated by reference to Exhibit 10.1 to the Company's Current Report on Form 8-K, filed with the Securities and Exchange Commission on June 17, 2014). |
10. 2 1 |
| Amended and Restated Credit Agreement dated January 16, 2015, by and among Helen of Troy, L.P., a Texas limited partnership, Helen of Troy Limited, a Bermuda company, Bank of America, N.A., as administrative agent, and the other lenders party thereto (incorporated by reference to Exhibit 10.1 to the Company's Current Report on Form 8-K, filed with the Securities and Exchange Commission on January 20, 201 5 ). |
10. 2 2 |
| Guaranty, dated January 16, 2015, made by Helen of Troy Limited and certain of its subsidiaries in favor of Bank of America, N.A. and other lenders, pursuant to the Amended and Restated Credit Agreement, dated January 16, 2015 (incorporated by reference to Exhibit 10.2 to the Company's Current Report on Form 8-K, filed with the Securities and Exchange Commission on January 20, 201 5 ). |
10. 2 3 |
| Third Amendment to Guaranty Agreement, dated as of January 16, 2015, made by Helen of Troy Limited and certain of its subsidiaries in favor of Bank of America, N.A. (incorporated by reference to Exhibit 10.3 to the Company's Current Report on Form 8-K, filed with the Securities and Exchange Commission on January 20, 201 5 ). |
125
Table of Contents
10. 2 4 * |
| First Supplemental Trust Indenture, dated as of March 1, 2014 , by and between Mississippi Business Finance Corporation and Deutsche Bank National Trust, as trustee. |
10. 2 5 |
| Second Supplemental Trust Indenture, dated as of February 18, 2015 but effective February 1, 2015, by and between Mississippi Business Finance Corporation and Deutsche Bank National Trust, as trustee (incorporated by reference to Exhibit 10.1 to the Company's Current Report on Form 8-K, filed with the Securities and Exchange Commission on February 23, 2015). |
21* |
| Subsidiaries of the Registrant. |
23.1* |
| Consent of Independent Registered Public Accounting Firm, Grant Thornton LLP. |
31.1* |
| Certification of Chief Executive Officer Pursuant to Rule 13a-14(a) or Rule 15d-14(a) pursuant to Section 302 of the Sarbanes-Oxley Act of 2002. |
31.2* |
| Certification of Chief Financial Officer Pursuant to Rule 13a-14(a) or Rule 15d-14(a) pursuant to Section 302 of the Sarbanes-Oxley Act of 2002. |
32** |
| Joint certification of the Chief Executive Officer and the Chief Financial Officer pursuant to 18 U.S.C. Section 1350, as Adopted Pursuant to Section 906 of the Sarbanes-Oxley Act of 2002. |
101.INS* |
| XBRL Instance Document |
101.SCH* |
| XBRL Taxonomy Extension Schema |
101.CAL* |
| XBRL Taxonomy Extension Calculation Linkbase |
101.DEF* |
| XBRL Taxonomy Extension Definition Linkbase |
101.LAB* |
| XBRL Taxonomy Extension Label Linkbase |
101.PRE* |
| XBRL Taxonomy Extension Presentation Linkbase |
126
Table of Contents
SIGNATURE
S
Pursuant to the requirements of Section 13 or 15(d) of the Exchange Act, the registrant has duly caused this report to be signed on its behalf by the undersigned, thereunto duly authorized.
| HELEN OF TROY LIMITED |
|
|
| By: /s/ Julien R. Mininberg |
| Julien R. Mininberg |
| Chief Executive Officer and Director |
| April 29, 2015 |
Pursuant to the requirements of the Exchange Act, this report has been signed below by the following persons on behalf of the registrant and in the capacities and on the dates indicated.
/s/ Julien R. Mininberg |
| /s/ Brian L. Grass |
Julien R. Mininberg |
| Brian L. Grass |
Chief Executive Officer, Director and Principal Executive Officer April 29, 2015 |
| Chief Financial Officer and Principal Financial Officer April 29, 2015 |
|
|
|
/s/ Richard J. Oppenheim |
| /s/ Timothy F. Meeker |
Richard J. Oppenheim |
| Timothy F. Meeker |
Financial Controller and Principal Accounting Officer |
| Director, Chairman of the Board |
April 29, 2015 |
| April 29, 2015 |
|
|
|
/s/ Gary B. Abromovitz |
| /s/ John B. Butterworth |
Gary B. Abromovitz |
| John B. Butterworth |
Director, Deputy Chairman of the Board |
| Director |
April 29, 2015 |
| April 29, 2015 |
|
|
|
/s/ Alexander M. Davern |
| /s/ Beryl B. Raff |
Alexander M. Davern |
| Beryl B. Raff |
Director |
| Director |
April 29, 2015 |
| April 29, 2015 |
|
|
|
/s/ William F. Susetka |
| /s/ Darren G. Woody |
William F. Susetka |
| Darren G. Woody |
Director |
| Director |
April 29, 2015 |
| April 29, 2015 |
127
Table of Contents
INDEX TO EXHIBITS
The exhibit numbers succeeded by an asterisk (*) indicate exhibits physically filed with this Form 10-K. The exhibit numbers succeeded by an asterisk (**) indicate exhibits furnished with this Form 10-K that are not deemed filed for purposes of Section 18 of the Securities Exchange Act of 1934 and otherwise are not subject to liability. All other exhibit numbers indicate exhibits filed by incorporation by reference. Exhibit numbers succeeded by a cross ( † ) are management contracts or compensatory plans or arrangements.
|
|
|
2.1 |
| Agreement and Plan of Merger dated as of December 8, 2010, among Helen of Troy Texas Corporation, KI Acquisition Corp., Kaz, Inc., the Company, and the Kaz, Inc. shareholders party thereto (incorporated by reference to Exhibit 2.1 to the Company's Current Report on Form 8-K, filed with the Securities and Exchange Commission on December 9, 2010). |
3.1 |
| Memorandum of Association (incorporated by reference to Exhibit 3.1 to the Company's Registration Statement on Form S-4, File No. 33-73594, filed with the Securities and Exchange Commission on December 30, 1993 (the "1993 S-4")). |
3.2 |
| Bye-Laws, as amended (incorporated by reference to Exhibit 3.2 to the Company's Quarterly Report on Form 10-Q for the period ending August 31, 2007, filed with the Securities and Exchange Commission on October 10, 2007). |
10.1 † |
| Form of Indemnification Agreement. |
10. 2 |
| Note Purchase Agreement, dated June 29, 2004, by and among the Company, Helen of Troy L.P., Helen of Troy Limited (Barbados) and the purchasers listed in Schedule A thereto (incorporated by reference to Exhibit 10.1 to the Company's Current Report on Form 8-K, filed with the Securities and Exchange Commission on July 2, 2004). |
10. 3 † |
| Amended and Restated Helen of Troy Limited 1998 Stock Option and Restricted Stock Plan (incorporated by reference to Appendix A to the Company's Definitive Proxy Statement on Schedule 14A, File Number 001-14669, filed with the Securities and Exchange Commission on June 15, 2005). |
10. 4 † |
| Form of Helen of Troy Limited Nonstatutory Stock Option Agreement (incorporated by reference to Exhibit 10.25 of the Company's Annual Report on Form 10-K for the fiscal year ended February 28, 2006, filed with the Securities and Exchange Commission on May 15, 2006 (the "2006 10-K")). |
10. 5 † |
| Form of Helen of Troy Limited Incentive Stock Option Agreement (incorporated by reference to Exhibit 10.26 of the 2006 10-K). |
10. 6 † |
| Helen of Troy Limited 2008 Employee Stock Purchase Plan (incorporated by reference to Appendix A to the (incorporated by reference to Appendix A to the Company's Definitive Proxy Statement on Schedule 14A filed with the Securities and Exchange Commission on June 27, 2008 (the "2008 Proxy Statement")). |
10. 7 † |
| Helen of Troy Limited 2008 Non-Employee Directors Stock Incentive Plan (incorporated by reference to Appendix C to the 2008 Proxy Statement). |
10. 8 † |
| Form of Restricted Stock Agreement for the Company's 2008 Non-Employee Directors Stock Incentive Plan (incorporated by reference to Exhibit 10.1 to the Company's Current Report on Form 8-K filed with the Securities and Exchange Commission on August 26, 2009). |
10. 09 |
| Note Purchase Agreement, dated January 12, 2011, by and among Helen of Troy, L.P., the Company, Helen of Troy Limited, a Barbados company, and the purchasers party thereto (incorporated by reference to Exhibit 10.1 to the Company's Current Report on Form 8-K, filed with the Securities and Exchange Commission on January 18, 2011). |
10.1 0 † |
| Helen of Troy Limited 2008 Stock Incentive Plan, as amended (incorporated by reference to Appendix A to the Company's Definitive Proxy Statement on Schedule 14A, File Number 001-14669, filed with the Securities and Exchange Commission on September 14, 2011). |
10.1 1 †* |
| Amended and Restated Helen of Troy Limited 2011 Annual Incentive Plan. |
10.1 2 |
| Loan Agreement, dated as of March 1, 2013, by and between Kaz USA, Inc. and Mississippi Business Finance Corporation (incorporated by reference to Exhibit 10.1 to the Company's Current Report on Form 8-K, filed with the Securities and Exchange Commission on March 26, 2013). |
128
Table of Contents
10.1 3 |
| Guaranty Agreement, dated as of March 1, 2013, by Helen of Troy Limited and certain of its subsidiaries in favor of Bank of America, N.A. (incorporated by reference to Exhibit 10.2 to the Company's Current Report on Form 8-K, filed with the Securities and Exchange Commission on March 26, 2013). |
10.1 4 |
| Trust Indenture, dated as of March 1, 2013 between Mississippi Business Finance Corporation and Deutsche Bank National Trust, as trustee (incorporated by reference to Exhibit 10.2 to the Company's Current Report on Form 8-K, filed with the Securities and Exchange Commission on March 26, 2013). |
10.1 5 † |
| Form of Helen of Troy Limited Stock Option Agreement (incorporated by reference to Exhibit 10.34 to the Company's Annual Report on Form 10-K for the fiscal year ended February 28, 2013, filed with the Securities and Exchange Commission on April 29, 2013 (the "2013 10-K")). |
10.1 6 † |
| Form of Restricted Stock Agreement for the Company's 2008 Non-Employee Directors Stock Incentive Plan (incorporated by reference to Exhibit 10.35 of the 2013 10-K) . |
10. 1 7 † |
| Employment Agreement among Helen of Troy Nevada Corporation, Helen of Troy Limited and Julien Mininberg, dated January 14, 2014 (incorporated by reference to Exhibit 10.1 to the Company's Current Report on Form 8-K, filed with the Securities and Exchange Commission on January 16, 2014). |
10. 1 8 † |
| Separation Agreement among Helen of Troy Nevada Corporation, Helen of Troy Limited, Helen of Troy Limited (a Barbados company) and Gerald J. Rubin, dated January 14, 2014 (incorporated by reference to Exhibit 10.2 to the Company's Current Report on Form 8-K, filed with the Securities and Exchange Commission on January 16, 2014). |
10. 19 |
| First Amendment to Guaranty Agreement, dated as of February 7, 2014, made by Helen of Troy, L.P., Helen of Troy Limited, a Barbados company, HOT Nevada, Inc, Helen of Troy Nevada Corporation, Helen of Troy Texas Corporation, Idelle Labs Ltd., OXO International Ltd., Helen of Troy Macao Commercial Offshore Limited, Kaz, Inc., Kaz USA, Inc., Kaz Canada, Inc., and Pur Water Purification Products, Inc., in favor of Bank of America, N.A. (incorporated by reference to Exhibit 10.2 to the Company's Current Report on Form 8-K, filed with the Securities and Exchange Commission on February 10, 2014). |
10.2 0 |
| Second Amendment to Guaranty Agreement, dated as of June 11, 2014, made by Helen of Troy Limited and certain of its subsidiaries in favor of Bank of America, N.A. (incorporated by reference to Exhibit 10.1 to the Company's Current Report on Form 8-K, filed with the Securities and Exchange Commission on June 17, 2014). |
10.2 1 |
| Amended and Restated Credit Agreement dated January 16, 2015, by and among Helen of Troy, L.P., a Texas limited partnership, Helen of Troy Limited, a Bermuda company, Bank of America, N.A., as administrative agent, and the other lenders party thereto (incorporated by reference to Exhibit 10.1 to the Company's Current Report on Form 8-K, filed with the Securities and Exchange Commission on January 20, 2015). |
10.2 2 |
| Guaranty, dated January 16, 2015, made by Helen of Troy Limited and certain of its subsidiaries in favor of Bank of America, N.A. and other lenders, pursuant to the Amended and Restated Credit Agreement, dated January 16, 2015 (incorporated by reference to Exhibit 10.2 to the Company's Current Report on Form 8-K, filed with the Securities and Exchange Commission on January 20, 2015). |
10.2 3 |
| Third Amendment to Guaranty Agreement, dated as of January 16, 2015, made by Helen of Troy Limited and certain of its subsidiaries in favor of Bank of America, N.A. (incorporated by reference to Exhibit 10.3 to the Company's Current Report on Form 8-K, filed with the Securities and Exchange Commission on January 20, 2015). |
10.2 4 * |
| First Supplemental Trust Indenture, dated as of March 1 , 2014, by and between Mississippi Business Finance Corporation and Deutsche Bank National Trust, as trustee. |
10.2 5 |
| Second Supplemental Trust Indenture, dated as of February 18, 2015 but effective February 1, 2015, by and between Mississippi Business Finance Corporation and Deutsche Bank National Trust, as trustee (incorporated by reference to Exhibit 10.1 to the Company's Current Report on Form 8-K, filed with the Securities and Exchange Commission on February 23, 2015). |
21* |
| Subsidiaries of the Registrant. |
129
Table of Contents
23.1* |
| Consent of Independent Registered Public Accounting Firm, Grant Thornton LLP. |
31.1* |
| Certification of Chief Executive Officer Pursuant to Rule 13a-14(a) or Rule 15d-14(a) pursuant to Section 302 of the Sarbanes-Oxley Act of 2002. |
31.2* |
| Certification of Chief Financial Officer Pursuant to Rule 13a-14(a) or Rule 15d-14(a) pursuant to Section 302 of the Sarbanes-Oxley Act of 2002. |
32** |
| Joint certification of the Chief Executive Officer and the Chief Financial Officer pursuant to 18 U.S.C. Section 1350, as Adopted Pursuant to Section 906 of the Sarbanes-Oxley Act of 2002. |
101.INS* |
| XBRL Instance Document |
101.SCH* |
| XBRL Taxonomy Extension Schema |
101.CAL* |
| XBRL Taxonomy Extension Calculation Linkbase |
101.DEF* |
| XBRL Taxonomy Extension Definition Linkbase |
101.LAB* |
| XBRL Taxonomy Extension Label Linkbase |
101.PRE* |
| XBRL Taxonomy Extension Presentation Linkbase |
130