UNITED STATES
SECURITIES AND EXCHANGE COMMISSION
Washington, D.C. 20549
FORM 10-K
(Mark One)
| ☒ | ANNUAL REPORT PURSUANT TO SECTION 13 OR 15(d) OF THE SECURITIES EXCHANGE ACT OF 1934 |
For the fiscal year ended December 31, 2016
Commission file number 0-10792
Horizon Bancorp
(Exact name of registrant as specified in its charter)
| Indiana | 35-1562417 | |
(State or other jurisdiction of incorporation or organization) | (I.R.S. Employer Identification No.) | |
| 515 Franklin Square, Michigan City | 46360 | |
| (Address of principal executive offices) | (Zip Code) | |
Registrant's telephone number, including area code: 219-879-0211
Securities registered pursuant to Section 12(b) of the Act:
Title of each class | Name of each exchange on which registered | |
| Common Stock, no par value | The NASDAQ Stock Market, LLC |
Securities registered pursuant to Section 12(g) of the Act: None
Indicate by check mark if the registrant is a well-known seasoned issuer, as defined in Rule 405 of the Securities Act Yes ☐ No ☒
Indicate by check mark if the registrant is not required to file reports pursuant to Section 13 or Section 15(d) of the Exchange Act Yes ☐ No ☒
Indicate by check mark whether the registrant (1) has filed all reports required to be filed by Section 13 or 15(d) of the Securities Exchange Act of 1934 during the preceding 12 months (or for such shorter period that the registrant was required to file such reports), and (2) has been subject to such filing requirements for the past 90 days. Yes ☒ No ☐
Indicate by check mark whether the registrant has submitted electronically and posted on its corporate Website, if any, every Interactive Data File required to be submitted and posted pursuant to Rule 405 of Regulation S-T (§232.405 of this chapter) during the preceding 12 months (or for such shorter period that the registrant was required to submit and post such files). Yes ☒ No ☐
Indicate by check mark if disclosure of delinquent filers pursuant to Item 405 of Regulation S-K is not contained herein, and will not be contained, to the best of registrant's knowledge, in definitive proxy or information statements incorporated by reference in Part III of this Form 10-K or any amendment to the Form 10-K ☐
Indicate by check mark whether the registrant is a large accelerated filer, an accelerated filer, a non-accelerated filer, or a smaller reporting company. See the definitions of "large accelerated filer," accelerated filer," and "smaller reporting company" in Rule 12b-2 of the Exchange Act. (Check One)
| Large Accelerated Filer | ☐ | Accelerated Filer | ☒ | |||
| Non-Accelerated Filer | ☐ (Do not check if a smaller reporting company) | Smaller Reporting Company | ☐ | |||
Indicate by check mark whether the registrant is a shell company (as defined in Rule 12b-2 of the Exchange Act). Yes ☐ No ☒
The aggregate market value of the registrant's common stock held by non-affiliates of the registrant, based on the average bid price of such stock as of June 30, 2016, the last day of the registrant's most recently completed second fiscal quarter, was approximately $294.8 million.
As of February 28, 2017, the registrant had 22,195,625 shares of common stock outstanding.
Documents Incorporated by Reference
| Document | Part of Form 10-K into which portion of document is incorporated | |
| Portions of the Registrant's Proxy Statement to be filed for its May 4, 2017 annual meeting of shareholders | Part III |
H ORIZON B ANCORP
2016 Annual Report on Form 10-K
Table of Contents
| Page | ||||||
| FORWARD-LOOKING STATEMENTS | 3 | |||||
| PART I | ||||||
Item 1 | Business | 4 | ||||
Item 1A | Risk Factors | 20 | ||||
Item 1B | Unresolved Staff Comments | 29 | ||||
Item 2 | Properties | 29 | ||||
Item 3 | Legal Proceedings | 31 | ||||
Item 4 | Mine Safety Disclosures | 31 | ||||
Special Item: | Executive Officers of Registrant | 31 | ||||
| PART II | ||||||
Item 5 | Market for Registrant's Common Equity, Related Stockholder Matters and Issuer Purchases of Equity Securities | 32 | ||||
Item 6 | Selected Financial Data | 33 | ||||
Item 7 | Management's Discussion and Analysis of Financial Condition and Results of Operations | 34 | ||||
Item 7A | Quantitative and Qualitative Disclosures about Market Risk | 57 | ||||
Item 8 | Financial Statements and Supplementary Data | 58 | ||||
Item 9 | Changes in and Disagreement with Accountants on Accounting and Financial Disclosure | 132 | ||||
Item 9A | Controls and Procedures | 132 | ||||
Item 9B | Other Information | 132 | ||||
| PART III | ||||||
Item 10 | Directors, Executive Officers and Corporate Governance | 133 | ||||
Item 11 | Executive Compensation | 133 | ||||
Item 12 | Security Ownership of Certain Beneficial Owners and Management and Related Stockholder Matters | 134 | ||||
Item 13 | Certain Relationships and Related Transactions, and Director Independence | 134 | ||||
Item 14 | Principal Accountant Fees and Services | 134 | ||||
| PART IV | ||||||
Item 15 | Exhibits and Financial Statement Schedules | 134 | ||||
SIGNATURES | 135 | |||||
EXHIBIT INDEX | 137 | |||||
2
H ORIZON B ANCORP
2016 Annual Report on 10-K
FORWARD-LOOKING STATEMENTS
A cautionary note about forward-looking statements: In addition to historical information, information included and incorporated by reference in this Annual Report on Form 10-K contains certain "forward-looking statements" within the meaning of the federal securities laws. Horizon intends such forward-looking statements to be covered by the safe harbor provisions for forward-looking statements contained in the Private Securities Litigation Reform Act of 1995 and is including this statement for purposes of invoking those safe-harbor provisions. Forward-looking statements can include statements about estimated cost savings, plans and objectives for future operations and expectations about Horizon's financial and business performance as well as economic and market conditions. They often can be identified by the use of words such as "expect," "may," "could," "will," "intend," "project," "estimate," "believe," "anticipate," "seek," "plan" and variations of such words and similar expressions.
Horizon may include forward-looking statements in filings it makes with the Securities and Exchange Commission ("SEC"), such as this Form 10-K, in other written materials, and in oral statements made by senior management to analysts, investors, representatives of the media and others. Horizon intends that these forward-looking statements speak only as of the date they are made, and Horizon undertakes no obligation to update any forward-looking statement to reflect events or circumstances after the date on which the forward-looking statement is made or to reflect the occurrence of unanticipated events.
Although management believes that the expectations reflected in forward-looking statements are reasonable, actual results may differ materially, whether adversely or positively, from the expectations of Horizon that are expressed or implied by any forward-looking statement. Risks, uncertainties, and factors that could cause Horizon's actual results to vary materially from those expressed or implied by any forward-looking statement include but are not limited to the following:
| • | economic conditions and their impact on Horizon and its customers; |
| • | changes in the level and volatility of interest rates, spreads on earning assets and interest-bearing liabilities, and interest rate sensitivity; |
| • | rising interest rates and their impact on mortgage loan volumes and the outflow of deposits; |
| • | loss of key Horizon personnel; |
| • | increases in disintermediation, as new technologies allow consumers to complete financial transactions without the assistance of banks; |
| • | loss of fee income, as new technologies take a greater market share of the payment systems; |
| • | estimates of fair value of certain of Horizon's assets and liabilities; |
| • | volatility and disruption in financial markets; |
| • | prepayment speeds, loan originations, credit losses and market values, collateral securing loans and other assets; |
| • | sources of liquidity; |
| • | potential risk of environmental liability related to lending activities; |
| • | changes in the competitive environment in Horizon's market areas and among other financial service providers; |
| • | legislation and/or regulation affecting the financial services industry as a whole, and Horizon and its subsidiaries in particular, including the effects resulting from the reforms enacted by the Dodd-Frank Wall Street Reform and Consumer Protection Act (the "Dodd-Frank Act") and the adoption of regulations by regulatory bodies under the Dodd-Frank Act; |
| • | the possible impact of whole or partial dismantling of provisions of the Dodd-Frank Act under a new federal administration; |
| • | the impact of the Basel III capital rules; |
| • | changes in regulatory supervision and oversight, including monetary policy and capital requirements; |
| • | changes in accounting policies or procedures as may be adopted and required by regulatory agencies; |
| • | rapid technological developments and changes; |
3
H ORIZON B ANCORP
| • | the risks presented by cyber terrorism and data security breaches; |
| • | containing costs and expenses; |
| • | the slowing or failure of economic recovery; |
| • | the ability of the U.S. federal government to manage federal debt limits; and |
| • | the risks of expansion through mergers and acquisitions, including unexpected credit quality problems with acquired loans, difficulty integrating acquired operations and material differences in the actual financial results of such transactions compared with Horizon's initial expectations, including the full realization of anticipated cost savings. |
You are cautioned that actual results may differ materially from those contained in the forward-looking statements. The "Management's Discussion and Analysis of Financial Condition and Results of Operations" in Item 7 of this Form 10-K lists some of the factors that could cause Horizon's actual results to vary materially from those expressed in or implied by any forward-looking statements. We direct your attention to this discussion.
Other risks and uncertainties that could affect Horizon's future performance are set forth below in Item 1A, "Risk Factors."
PART I
ITEM 1. BUSINESS
The disclosures in this Item 1 are qualified by the disclosures below in Item 1A, "Risk Factors," and Item 7, "Management's Discussion and Analysis of Financial Condition and Results of Operations," and in other cautionary statements set forth elsewhere in this Annual Report on Form 10-K.
General
Horizon Bancorp ("Horizon" or the "Company") is a registered bank holding company incorporated in Indiana and headquartered in Michigan City, Indiana. Horizon provides a broad range of banking services in Northern and Central Indiana and Southwestern and Central Michigan through its bank subsidiary, Horizon Bank, N.A. (the "Bank") and other affiliated entities and Horizon Risk Management, Inc. Horizon operates as a single segment, which is commercial banking. Horizon's common stock is traded on the NASDAQ Global Select Market under the symbol HBNC. The Bank was chartered as a national banking association in 1873 and has operated continuously since that time. The Bank is a full-service commercial bank offering commercial and retail banking services, corporate and individual trust and agency services and other services incident to banking. Horizon Risk Management, Inc. is a captive insurance company incorporated in Nevada and was formed as a wholly owned subsidiary of Horizon. LSB Risk Management, Inc. is a captive insurance company incorporated in Nevada and was acquired by Horizon through the acquisition of LaPorte Bancorp, Inc. in July 2016.
On November 7, 2016, Horizon completed the acquisition of CNB Bancorp, an Indiana corporation headquartered in Attica, Indiana ("CNB") and the Bank's acquisition of The Central National Bank and Trust Company ("Central National Bank & Trust"), through mergers effective November 7, 2016. Under terms of the acquisition, shareholders of CNB received merger consideration in the form of cash. The total value of the consideration for the acquisition was $5.3 million. As a result of the acquisition, the Company will have an opportunity to increase its deposit base and reduce transaction costs. The Company also expects to reduce costs through economies of scale.
On July 18, 2016, Horizon completed the acquisition of LaPorte Bancorp, Inc., a Maryland corporation ("LaPorte Bancorp") and the Bank's acquisition of The LaPorte Savings Bank, a state-chartered savings bank and wholly owned subsidiary of LaPorte Bancorp, through mergers effective July 18, 2016. Under the terms of the merger agreement, shareholders of LaPorte Bancorp had the option to receive $17.50 per share in cash or 0.9435 shares of Horizon common stock for each share of LaPorte Bancorp's common stock, subject to allocation provisions to assure that in aggregate, LaPorte Bancorp shareholders received total consideration that consisted of 65% stock and 35% cash. As a result of LaPorte Bancorp stockholder stock and cash elections and the related proration provisions of the merger agreement, Horizon issued 3,421,488 shares of its common stock in the merger. Based upon the July 18, 2016 closing price of $18.36 per share of Horizon common stock, less the consideration used to pay off LaPorte Bancorp's ESOP loan receivable, the
4
H ORIZON B ANCORP
transaction had an implied valuation of approximately $98.6 million. As a result of the acquisition, the Company was able to increase its deposit base and reduce transaction costs. The Company also expects to reduce costs through economies of scale.
On June 1, 2016, Horizon completed the acquisition of Kosciusko Financial, Inc., an Indiana corporation ("Kosciusko") and the Bank's acquisition of Farmers State Bank, a state-chartered bank and wholly owned subsidiary of Kosciusko, through mergers effective June 1, 2016. Under the terms of the merger agreement, shareholders of Kosciusko had the option to receive $81.75 per share in cash or 4.5183 shares of Horizon common stock for each share of Kosciusko's common stock, subject to allocation provisions to assure that in aggregate, Kosciusko shareholders received total consideration that consisted of 65% stock and 35% cash. Kosciusko shareholders owning fewer than 100 shares of common stock received $81.75 in cash for each common share. As a result of Kosciusko stockholder stock and cash elections and the related proration provisions of the merger agreement, Horizon issued 873,430 shares of its common stock in the merger. Based upon the June 1, 2016 closing price of $16.57 per share of Horizon common stock, the transaction had an implied valuation of approximately $23.0 million. As a result of the acquisition, the Company was able to increase its deposit base and reduce transaction costs. The Company also expects to reduce costs through economies of scale.
On July 1, 2015, Horizon completed the acquisition of Peoples Bancorp, an Indiana corporation ("Peoples") and the Bank's acquisition of Peoples Federal Savings Bank of DeKalb County ("Peoples FSB"), through mergers effective July 1, 2015. Under the terms of the acquisition, the exchange ratio was 1.425 shares of Horizon common stock and $9.75 in cash for each outstanding share of Peoples common stock. Peoples shareholders owning fewer than 100 shares of common stock received $33.14 in cash for each common share. Peoples shares outstanding at the closing were 2,311,858, and the shares of Horizon common stock issued to Peoples shareholders totaled 3,288,303. Horizon's stock price was $16.88 per share at the close of business on July 1, 2015. Based upon these numbers, the total value of the consideration for the acquisition was $78.1 million. As a result of the acquisition, the Company experienced, and expects to continue to experience, increases in its deposit base, reductions in transaction costs and reduced costs through economies of scale.
On April 3, 2014 Horizon completed its acquisition of SCB Bancorp, Inc. ("Summit") and the Bank's acquisition of Summit Community Bank, through mergers effective as of that date. Under the final terms of the acquisition, the exchange ratio was 0.7356 shares of Horizon's common stock and $5.15 in cash for each share of Summit common stock outstanding. Summit shares outstanding at the closing were 1,164,442, and the shares of Horizon common stock issued to Summit shareholders totaled 856,230. Horizon's stock price was $14.82 per share at the close of business on April 3, 2014. Based upon these numbers, the total value of the consideration for the acquisition was $18.9 million (not including the retirement of Summit debt). As a result of the acquisition, the Company experienced, and expects to continue to experience, increases in its deposit base, reductions in transaction costs and reduced costs through economies of scale.
On July 17, 2012, Horizon completed its acquisition of Heartland Bancshares, Inc. ("Heartland") and Heartland's wholly owned subsidiary, Heartland Community Bank ("Heartland Bank"). Heartland was merged into Horizon, and Heartland Bank was merged into the Bank. The exchange ratio was 1.215 shares of Horizon's common stock for each share of Heartland common stock outstanding. Horizon acquired the 1,442,449 outstanding shares of Heartland common stock in exchange for 1,752,574 shares of Horizon common stock, which had a market price of $11.22 per share at the close of business on July 17, 2012. Horizon also purchased and retired all shares of preferred stock that Heartland had issued pursuant to the Troubled Asset Relief Program Capital Purchase Program ("TARP"). Based upon the $11.22 market price and the TARP preferred stock purchase, the total value of the consideration for the acquisition was $26.9 million. As a result of the acquisition, the Company experienced, and expects to continue to experience, increases in its deposit base, reductions in transaction costs and reduced costs through economies of scale.
The Bank maintains 56 full service offices and 3 loan and deposit production offices. At December 31, 2016, the Bank had total assets of $3.14 billion and total deposits of $2.47 billion. The Bank has wholly-owned direct and indirect subsidiaries: Horizon Investments, Inc. ("Horizon Investments"), Horizon Properties, Inc. ("Horizon Properties"), Horizon Insurance Services, Inc. ("Horizon Insurance") and Horizon Grantor Trust. Horizon Investments manages the investment portfolio of the Bank. Horizon Properties manages the real estate investment trust. Horizon Insurance is used by the Company's Wealth Management to sell certain insurance products. Horizon Grantor Trust holds title to certain company owned life insurance policies .
5
H ORIZON B ANCORP
Horizon formed Horizon Bancorp Capital Trust II in 2004 ("Trust II") and Horizon Bancorp Capital Trust III in 2006 ("Trust III") for the purpose of participating in pooled trust preferred securities offerings. The Company assumed additional debentures as the result of the acquisition of Alliance Financial Corporation in 2005, which formed Alliance Financial Statutory Trust I ("Alliance Trust"). The Company also assumed additional debentures as the result of the acquisition of American Trust & Savings Bank ("American") in 2010, which formed Am Tru Statutory Trust I ("Am Tru Trust"). The Company also assumed additional debentures as the result of the Heartland transaction, which formed Heartland (IN) Statutory Trust II ("Heartland Trust"). In 2016, the Company also assumed additional debentures as the result of the LaPorte Bancorp transaction. LaPorte Bancorp acquired City Savings Financial Corporation in 2007. City Savings Financial Corporation issued the debentures and formed City Savings Statutory Trust I ("City Savings") in 2003. See Note 15 of the Consolidated Financial Statements included at Item 8 for further discussion regarding these previously consolidated entities that are now reported separately.
The business of Horizon is not seasonal to any material degree. No material part of Horizon's business is dependent upon a single or small group of customers, the loss of any one or more of which would have a materially adverse effect on the business of Horizon. In 2016, revenues from loans accounted for 63.4% of the total consolidated revenue, and revenues from investment securities accounted for 10.4% of total consolidated revenue.
Available Information
The Company's Internet address is www.horizonbank.com. The Company makes available, free of charge through the "About Us - Investor Relations – Documents - SEC Filings" section of its Internet website, copies of the Company's Annual Report on Form 10-K, Quarterly Reports on Form 10-Q, Current Reports on Form 8-K and any amendments to those reports filed or furnished pursuant to Section 13(a) of the Securities Exchange Act of 1934, as amended, as soon as reasonably practicable after those reports are filed with or furnished to the SEC.
Employees
The Bank employed approximately 665 full and part-time employees as of December 31, 2016. Other than the Bank, neither Horizon nor any of its direct or indirect subsidiaries have employees.
Competition
Horizon faces a high degree of competition in all of its primary markets. The Bank's primary market consists of areas throughout the northern, northwest and northeastern portions of the state of Indiana along with central Indiana defined by the counties of Lake, Porter, La Porte, St. Joseph, Elkhart, Kosciusko, LaGrange, DeKalb, Noble, Whitley, Allen, Fountain, Hamilton, Marion and Johnson Counties Indiana, along with the counties of Berrien, Cass, St. Joseph, Kalamazoo, and Ingham Counties located in southwest and southern Michigan. The Bank competes with other commercial banks as well as with savings and loan associations, consumer finance companies, credit unions and other non-bank and digital financial service providers. To a more moderate extent, the Bank competes with Chicago money center banks, mortgage banking companies, insurance companies, brokerage houses, other institutions engaged in money market financial services and certain government agencies.
Based on deposits as of June 30, 2016, Horizon was the largest of the nine bank and thrift institutions in La Porte County with a 36.68% market share. On July 18, 2016, Horizon completed its acquisition of The LaPorte Savings Bank which was the second largest of the nine bank and thrift institutions in La Porte County with a 19.92% market share as of June 30, 2016. In Porter County, Horizon was the fifth largest of the 14 institutions with a 9.56% market share while The LaPorte Savings Bank was the ninth largest with a 1.22% market share as of June 30, 2016. On June 1, 2016, Horizon completed its acquisition of Farmers State Bank which held 9.25% of the market share in Kosciusko County, Indiana as of June 30, 2016. In the northeastern Indiana counties where Horizon acquired Peoples FSB, Horizon held the largest market share of 11 banks at 25.14% market share in DeKalb County; 6.24% in LaGrange County; 8.08% in Noble County; 9.24% in Whitley County and then less than 1% in Allen County where the newest branch of the former Peoples FSB is located. The branches in Michigan that were formerly with Peoples FSB are in the counties of Cass and St. Joseph with 5.99% and 5.87% market share, respectively. On November 7, 2016, Horizon completed its acquisition of Central National Bank & Trust which held 12.63% of the market share in Fountain County Indiana as of June 30, 2016. In Johnson County,
6
H ORIZON B ANCORP
Indiana, where Horizon acquired the branches of Heartland Bank, the Bank enjoys a 12.15% market share as the third largest of the 20 institutions in that county. In Berrien County, Michigan, Horizon was the fifth largest of the 11 bank and thrift institutions with a 8.22% market share. Horizon's market share of deposits in Lake County, Indiana was just over 1% at 1.53%, a little over 1% at 1.40% in Kalamazoo County, Michigan, and less than 1% in each of St. Joseph, Elkhart, Marion, and Hamilton Counties in Indiana. The branches the Bank acquired in the acquisition of Summit Community Bank are located in Ingham County, Michigan and had a 2.62% market share. (Source: FDIC Summary of Deposits Market Share Reports, available at www.fdic.gov.)
Regulation and Supervision
As a bank holding company and a financial holding company, the Company is subject to extensive regulation, supervision, and examination by the Board of Governors of the Federal Reserve System (the "Federal Reserve Board" or "Federal Reserve") as its primary federal regulator. The Bank, as a nationally chartered bank, is subject to extensive regulation, supervision and examination by the Office of the Comptroller of the Currency ("OCC") as its primary federal regulator and, as to certain matters, by the Federal Reserve Board and the Federal Deposit Insurance Corporation ("FDIC"). Both federal and state law extensively regulate various aspects of the banking business, such as reserve requirements, truth-in-lending and truth-in-savings disclosures, equal credit opportunity, fair credit reporting, trading in securities and other aspects of banking operations. Branching by the Bank is subject to the jurisdiction and requires notice to, or the prior approval of, the OCC. The Dodd-Frank Act permits the establishment of de novo branches in states where such branches could be opened by a state bank chartered by that state. The consent of the state is no longer required. The supervision, regulation and examination of Horizon and the Bank by the regulatory agencies are intended primarily for the protection of depositors rather than for Horizon's shareholders. In January 2017, the Bank filed an application with the Indiana Department of Financial Institutions to convert from a national bank to an Indiana state commercial bank. If the application to convert is approved, and the Bank becomes an Indiana state commercial bank, then its primary regulator would become the Indiana Department of Financial Institutions rather than the OCC, and its primary federal regulator would become the FDIC.
Horizon also is subject to the disclosure and regulatory requirements of the Securities Act of 1933, as amended, and the Securities Exchange Act of 1934, as amended, as administered by the SEC. Horizon's common stock is listed on The NASDAQ Global Select Stock Market under the trading symbol "HBNC," and Horizon is subject to the NASDAQ rules applicable to listed companies.
Included below is a brief summary of significant aspects of the laws, regulations and policies applicable to Horizon and the Bank. This summary is qualified in its entirety by reference to the full text of the statutes, regulations and policies that are referenced and is not intended to be an exhaustive description of the statutes, regulations and policies applicable to the business of Horizon and the Bank. Also, such statutes, regulations and policies are continually under review by Congress and state legislatures and federal and state regulatory agencies. A change in statutes, regulations or regulatory policies applicable to Horizon and the Bank could have a material effect on Horizon's business, financial condition and results of operations.
The Bank Holding Company Act
The Bank Holding Company Act of 1956, as amended ("BHC Act"), generally limits the business in which a bank holding company and its subsidiaries may engage to banking or managing or controlling banks and those activities that the Federal Reserve Board has determined to be so closely related to banking as to be a proper incident thereto. Bank holding companies, such as Horizon, that qualify as, and elect to be, financial holding companies, however, may engage in any activity, or acquire and retain the shares of a company engaged in any activity, that is either (i) financial in nature or incidental to such financial activity (as determined by the Federal Reserve Board in consultation with the Secretary of the Treasury) or (ii) complementary to a financial activity and does not pose a substantial risk to the safety and soundness of depository institutions or the financial system generally (as solely determined by the Federal Reserve Board), without prior approval of the Federal Reserve Board. Activities that are financial in nature include securities underwriting and dealing, insurance underwriting and making merchant banking investments.
For a bank holding company to remain qualified as a financial holding company, the company and all of its depository institution subsidiaries must be "well capitalized" and "well managed." To commence any new activity permitted by the BHC Act or to acquire a company engaged in any new activity permitted by the BHC Act, each insured depository
7
H ORIZON B ANCORP
institution subsidiary of the financial holding company must have received a rating of at least "satisfactory" in its most recent examination under the Community Reinvestment Act. The Federal Reserve Board has the power to order any bank holding company or its subsidiaries to terminate any activity or to terminate its ownership or control of any subsidiary when the Federal Reserve Board has reasonable grounds to believe that continuation of such activity or such ownership or control constitutes a serious risk to the financial soundness, safety or stability of any bank subsidiary of the bank holding company.
Federal Reserve Board policy has historically required bank holding companies to act as a source of financial and management strength for their subsidiary banks. The Dodd-Frank Act, which was signed into law on July 21, 2010, codified this policy. Under this requirement, Horizon is required to act as a source of financial strength to the Bank and to commit resources to support the Bank in circumstances in which Horizon might not otherwise do so. For this purpose, "source of financial strength" means Horizon's ability to provide financial assistance to the Bank in the event of the Bank's financial distress.
The BHC Act, the Bank Merger Act and other federal and state statutes regulate acquisitions of banks and bank holding companies. The BHC Act requires the prior approval of the Federal Reserve before a bank holding company may acquire more than a 5% voting interest or substantially all assets of any bank or bank holding company. Under the Bank Merger Act, the prior approval of the OCC or another federal banking agency is required for the Bank to merge with another bank or purchase the assets or assume the deposits of another bank. In reviewing applications seeking approval for mergers and other acquisition transactions, the bank regulatory authorities will consider, among other things, the competitive effect and public benefits of the transactions, the capital position of the combined organization, the risks to the stability of the U.S. banking or financial system, the applicant's performance record under the Community Reinvestment Act and the effectiveness of the subject organizations in combating money laundering activities.
Under the Federal Deposit Insurance Corporation Improvement Act of 1991 (the "FDICIA"), a bank holding company is required to guarantee the compliance of any insured depository institution subsidiary that may become "undercapitalized" (as defined in FDICIA) with the terms of any capital restoration plan filed by such subsidiary with its appropriate federal bank regulatory agency.
Bank holding companies are required to comply with the Federal Reserve's risk-based capital guidelines. The FDIC and the OCC also have risk-based capital ratio guidelines to which depository institutions under their respective supervision are subject. The guidelines establish a systematic analytical framework that makes regulatory capital requirements more sensitive to differences in risk profiles among banking organizations. Risk-based capital ratios are determined by allocating assets and specified off-balance sheet commitments to four risk weighted categories, with higher levels of capital being required for the categories perceived as representing greater risk. For Horizon's regulatory capital ratios and regulatory requirements as of December 31, 2016, see the information in "Management's Discussion and Analysis of Financial Condition and Results of Operations" in Item 7 below, which is incorporated herein by reference.
National Bank Act
As a national bank, the Bank is subject to the provisions of the National Bank Act. The Bank is supervised, regulated, and examined by the OCC, and is subject to the rules and regulations of the OCC, Federal Reserve, Consumer Financial Protection Bureau ("CFPB") and the FDIC.
Deposit Insurance and Assessments
The Bank's deposits are insured to applicable limits by the Deposit Insurance Fund ("DIF") of the FDIC. Generally, deposits are insured up to the statutory limit of $250,000. Banks are subject to deposit insurance premiums and assessments to maintain the DIF. A bank's deposit insurance premium assessment rate depends on the capital category and supervisory category to which it is assigned. The FDIC has authority to raise or lower assessment rates on insured banks in order to achieve statutorily required reserve ratios in the DIF and to impose special additional assessments.
The Dodd-Frank Act has resulted in significant changes to the FDIC's deposit insurance system. Under the Dodd-Frank Act, the FDIC is authorized to set the reserve ratio for the DIF at no less than 1.35%, and must achieve the 1.35% designated reserve ratio by September 30, 2020. The FDIC must offset the effect of the increase in the minimum
8
H ORIZON B ANCORP
designated reserve ratio from 1.15% to 1.35% on insured depository institutions of less than $10 billion and may declare dividends to depository institutions when the reserve ratio at the end of a calendar quarter is at least 1.5%, although the FDIC has the authority to suspend or limit such permitted dividend declarations. In December 2010, the FDIC adopted a final rule setting the designated reserve ratio for the deposit insurance fund at 2% of estimated insured deposits.
Also as a consequence of the Dodd-Frank Act, the assessment base for deposit insurance premiums was changed, effective April 1, 2011, from adjusted domestic deposits to average consolidated total assets minus average tangible equity. Tangible equity for this purpose means Tier 1 capital. Effective April 1, 2011, the initial base assessment rates were as follows:
| • | For small Risk Category I banks, such as Horizon, the rates range from 5-9 basis points. |
| • | The rates for small institutions in Risk Categories II, III and IV are 14, 23 and 35 basis points, respectively. |
| • | For large institutions and large, highly complex institutions, the rate schedule ranges from 5 to 35 basis points. |
Adjustments are made to the initial assessment rates based on long-term unsecured debt, depository institution debt, and brokered deposits.
However, effective as of June 30, 2016, the reserve ratio reached 1.15% and a new assessment rate schedule became effective July 1, 2016, with rates ranging from 3 to 30 basis points instead of 5 to 35 basis points. Assessment rates for all established smaller banks will be determined using financial measures and supervisory ratings derived from a statistical model estimating the probability of failure over three years. The new pricing system eliminates risk categories, but establishes minimum and maximum assessment rates for established small banks based on a bank's CAMELs composite ratings.
Horizon's FDIC deposit insurance expense increased slightly during 2016 compared to 2015. The FDIC continued to offset the regular insurance assessments until the earlier of the exhaustion of an institution's prepaid assessments or June 30, 2013. Any prepaid assessment remaining after collection of the amount due on June 30, 2013, was returned to the institution. The FDIC returned to the Bank $2.0 million in prepaid assessments.
The FDIC may terminate the deposit insurance of any insured depository institution if the FDIC determines, after a hearing, that the institution has engaged or is engaging in unsafe or unsound practices, is in an unsafe and unsound condition to continue operations or has violated any applicable law, regulation, order or any condition imposed in writing by, or written agreement with, the FDIC. The FDIC may also suspend deposit insurance temporarily during the hearing process for a permanent termination of insurance if the institution has no tangible capital.
FDIC-insured institutions are also subject to the requirement to pay assessments to the FDIC to fund interest payments on bonds issued by the Financing Corporation ("FICO"), an agency of the Federal government established to recapitalize the predecessor to the Savings Association Insurance Fund ("SAIF"). These assessments will continue until the FICO bonds are repaid between 2017 and 2019. The FICO assessment rate was 0.58 basis points for each $100 of insured deposits for the first quarter of 2016 and 0.56 basis points for the remaining three quarter of 2016.
Transactions with Affiliates and Insiders
Horizon and the Bank are subject to the Federal Reserve Act, which restricts financial transactions between banks, affiliated companies and their executive officers, including limits on credit transactions between these parties. The statute prescribes terms and conditions for bank affiliate transactions deemed to be consistent with safe and sound banking practices, and restricts the types of collateral security permitted in connection with a bank's extension of credit to an affiliate.
Effective July 21, 2011, among other changes, the Dodd-Frank Act eliminated the exceptions under Section 23A of the Federal Reserve Act for transactions with financial subsidiaries and expanded the scope of transactions treated as "covered transactions" to include derivatives transactions and securities repurchase agreements. The Dodd-Frank Act also expands the types of transactions subject to insider lending limits.
9
H ORIZON B ANCORP
Capital Regulation
The federal bank regulatory authorities have adopted risk-based capital guidelines for banks and bank holding companies that are designed to make regulatory capital requirements more sensitive to differences in risk profiles among banks and bank holding companies and account for off-balance sheet items. Risk-based capital ratios are determined by allocating assets and specified off-balance sheet commitments to risk weighted categories consisting primarily of 0%, 20%, 50%, 100% or 150%, but also including 250% and beyond, with higher levels of capital being required for the categories perceived as representing greater risk.
The capital guidelines divide a bank holding company's or bank's capital into two tiers. The first tier ("Tier I") includes common equity, certain non-cumulative perpetual preferred stock and minority interests in equity accounts of consolidated subsidiaries, less goodwill and certain other intangible assets (except mortgage servicing rights and purchased credit card relationships, subject to certain limitations). Supplementary capital ("Tier II") includes, among other items, cumulative perpetual and long-term limited-life preferred stock, mandatory convertible securities, certain hybrid capital instruments, term subordinated debt and the allowance for loan and lease losses, subject to certain limitations, less required deductions. Also required by the regulations is the maintenance of a leverage ratio designed to supplement the risk-based capital guidelines. This ratio is computed by dividing Tier I capital, net of all intangibles, by the quarterly average of total assets. Pursuant to the regulations, banks must maintain capital levels commensurate with the level of risk, including the volume and severity of problem loans to which they are exposed.
In July 2013, the federal banking agencies approved final rules to be phased in from 2015 to 2019 implementing the U.S. Basel Committee on Banking Supervision's capital framework ("Basel III") for all U.S. banks and for bank holding companies. Under these final rules, minimum requirements have increased for both the quantity and quality of capital held by Horizon and the Bank. The rules include a new common equity Tier 1 capital ratio of 4.5%, a minimum Tier 1 capital ratio of 6.0% (increased from 4.0%), a total capital ratio of 8 % (unchanged from prior rules) and a minimum leverage ratio of 4.0%. The final rules also require a common equity Tier 1 capital conservation buffer of 2.5% of risk-weighted assets, which is in addition to the other minimum risk-based capital standards in the rule. Institutions that do not maintain the required capital conservation buffer will become subject to progressively more stringent limitations on the percentage of earnings that can be paid out in dividends or used for stock repurchases and on the payment of certain bonuses to senior executive management. The capital conservation buffer requirement will be phased in over three years beginning in 2016. The capital conservation buffer requirement effectively raises the minimum required common equity Tier 1 capital ratio to 7.0%, the Tier 1 capital ratio to 8.5%, and the total capital ratio to 10.5% on a fully phased-in basis.
The final rules also introduced other changes, including an increase in the capital required for certain categories of assets, including higher-risk construction real estate loans and certain exposures related to securitizations. The final rules allow banking organizations with less than $15 billion in assets as of December 31, 2010, to retain non-qualifying Tier 1 capital trust preferred securities issued prior to May 19, 2010, subject generally to a limit of 25% of Tier 1 capital.
These new minimum capital ratios became effective for Horizon on January 1, 2015, and will be fully phased-in on January 1, 2019. Horizon's management believes that, as of December 31, 2016, Horizon and the Bank would meet all capital adequacy requirements under the Basel III capital rules on a fully phased-in basis, as if such requirements were currently in effect.
10
H ORIZON B ANCORP
The following is a summary of Horizon's and the Bank's regulatory capital and capital requirements at December 31, 2016.
| Actual | Required For Capital 1 Adequacy Purposes | Required For Capital 1 Adequacy Purposes with Capital Buffer | Well Capitalized Under Prompt 1 Corrective Action Provisions | |||||||||||||||||||||||||||||
| Amount | Ratio | Amount | Ratio | Amount | Ratio | Amount | Ratio | |||||||||||||||||||||||||
As of December 31, 2016 | ||||||||||||||||||||||||||||||||
Total capital 1 (to risk-weighted assets) | ||||||||||||||||||||||||||||||||
Consolidated | $ | 316,576 | 13.87 | % | $ | 182,596 | 8.00 | % | $ | 196,976 | 8.63 | % | N/A | N/A | ||||||||||||||||||
Bank | 319,013 | 13.98 | % | $ | 182,541 | 8.00 | % | 196,916 | 8.63 | % | $ | 228,176 | 10.00 | % | ||||||||||||||||||
Tier 1 capital 1 (to risk-weighted assets) | ||||||||||||||||||||||||||||||||
Consolidated | 301,739 | 13.22 | % | $ | 136,947 | 6.00 | % | 151,326 | 6.63 | % | N/A | N/A | ||||||||||||||||||||
Bank | 304,176 | 13.33 | % | $ | 136,905 | 6.00 | % | 151,280 | 6.63 | % | 182,540 | 8.00 | % | |||||||||||||||||||
Common equity tier 1 capital 1 (to risk-weighted assets) | ||||||||||||||||||||||||||||||||
Consolidated | 263,313 | 11.50 | % | $ | 103,036 | 4.50 | % | 117,460 | 5.13 | % | N/A | N/A | ||||||||||||||||||||
Bank | 304,176 | 13.33 | % | $ | 102,679 | 4.50 | % | 117,054 | 5.13 | % | 148,314 | 6.50 | % | |||||||||||||||||||
Tier 1 capital 1 (to average assets) | ||||||||||||||||||||||||||||||||
Consolidated | 301,739 | 10.44 | % | $ | 115,609 | 4.00 | % | 115,609 | 4.00 | % | N/A | N/A | ||||||||||||||||||||
Bank | 304,176 | 9.93 | % | $ | 122,521 | 4.00 | % | 122,521 | 4.00 | % | 153,151 | 5.00 | % | |||||||||||||||||||
| 1 | As defined by regulatory agencies |
The Dodd-Frank Act also requires the Federal Reserve to set minimum capital levels for bank holding companies that are as stringent as those required for insured depository subsidiaries, except that bank holding companies with less than $1 billion in assets are exempt from these capital requirements.
Dividends
Dividends received from the Bank are the primary source of Horizon's revenues. The Bank's payment of dividends, without prior regulatory approval, is subject to regulatory limitations. The National Bank Act requires the Bank to obtain the prior approval of the OCC for the payment of dividends if the total of all dividends declared by it in one year would exceed its net profits for the current year plus its retained net profits for the two preceding years, less any required transfers to surplus. In addition, the Bank may only pay dividends to the extent that its retained net profits (including the portion transferred to surplus) exceed the Bank's undivided profits after deducting statutory bad debt in excess of the Bank's allowance for loan losses. Under the Federal Deposit Insurance Act, the Bank is prohibited from paying any dividends, making other distributions or paying any management fees if, after such payment, it would fail to satisfy its minimum capital requirements.
In 2011, Horizon issued 12,500 shares of Senior Non-Cumulative Perpetual Preferred Stock, Series B (the "Series B Preferred Stock") to the U. S. Department of the Treasury (the "Treasury"). The issuance to the Treasury of the Series B Preferred Stock resulted in the imposition of limitations on Horizon's ability to pay dividends. Under the terms of the Series B Preferred Stock, no repurchases may be effected, and no dividends may be declared or paid on preferred shares ranking pari passu with the Series B Preferred Stock, junior preferred shares, or other junior securities, including the common stock, during the current quarter and for the next three quarters following the failure to declare and pay dividends on the Series B Preferred Stock, except that, in any such quarter in which the dividend is paid, dividend payments on shares ranking pari passu may be paid to the extent necessary to avoid any resulting material covenant breach. Effective February 1, 2016, Horizon redeemed all the Series B Preferred Stock and, accordingly, the restrictions imposed on the payment of dividends by the outstanding Series B Preferred Stock no longer had any effect. Further, on May 10, 2016, the Company amended its Articles of Incorporation to delete and remove the Certificate of Designations for the Series B Preferred Stock so it is no longer authorized for issuance.
Prompt Corrective Regulatory Action
Federal law provides the federal banking regulators with broad powers to require an undercapitalized financial institution to take prompt corrective action to resolve the institution's problems. The extent of the regulators' powers depends on whether the institution in question is "well capitalized," "adequately capitalized," "undercapitalized," "significantly undercapitalized," or "critically undercapitalized," as defined by regulation. Depending upon the capital category to which an institution is assigned, the regulators' corrective powers include: (i) requiring the submission of a capital restoration plan;
11
H ORIZON B ANCORP
(ii) placing limits on asset growth and restrictions on activities; (iii) requiring the institution to issue additional capital stock (including additional voting stock) or to be acquired; (iv) restricting transactions with affiliates; (v) restricting the interest rate the institution may pay on deposits; (vi) ordering a new election of directors of the institution; (vii) requiring that senior executive officers or directors be dismissed; (viii) prohibiting the institution from accepting deposits from correspondent banks; (ix) requiring the institution to divest certain subsidiaries; (x) prohibiting the payment of principal or interest on subordinated debt; and (xi) ultimately, appointing a receiver for the institution. New prompt corrective action requirements became effective January 1, 2015 and increased the capital level requirements necessary to qualify as "well capitalized." At December 31, 2016, the Bank was categorized as "well capitalized," meaning that the Bank's total risk-based capital ratio exceeded 10%, the Bank's Tier I risk-based capital ratio exceeded 8%, the Bank's common equity Tier I risk-based capital ratio exceeded 6.5%, the Bank's leverage ratio exceeded 5%, and the Bank was not subject to a regulatory order, agreement or directive to meet and maintain a specific capital level for any capital measure.
Anti-Money Laundering and the USA Patriot Act
Horizon is subject to the provisions of the USA PATRIOT Act of 2001, which contains anti-money laundering and financial transparency laws and requires financial institutions to implement additional policies and procedures with respect to, or additional measures designed to address, any or all of the following matters, among others: money laundering, suspicious activities and currency transaction reporting, and currency crimes.
Sarbanes-Oxley Act of 2002
Horizon also is subject to the Sarbanes-Oxley Act of 2002 (the "Sarbanes-Oxley Act"), which revised the laws affecting corporate governance, accounting obligations and corporate reporting. The Sarbanes-Oxley Act applies to all companies with equity or debt securities registered under the Securities Exchange Act of 1934. In particular, the Sarbanes-Oxley Act established: (i) new requirements for audit committees, including independence, expertise and responsibilities; (ii) additional responsibilities regarding financial statements for the Chief Executive Officer and Chief Financial Officer of the reporting company; (iii) new standards for auditors and regulation of audits; (iv) increased disclosure and reporting obligations for the reporting company and its directors and executive officers; and (v) new and increased civil and criminal penalties for violation of the securities laws. Management expects that significant additional efforts and expense will continue to be required to comply with the provisions of the Sarbanes-Oxley Act.
Pursuant to the final rules adopted by the SEC to implement Section 404 of the Sarbanes-Oxley Act of 2002, Horizon is required to include in each Form 10-K it files a report of management on Horizon's internal control over financial reporting. The internal control report must include a statement of management's responsibility for establishing and maintaining adequate control over financial reporting of Horizon, identify the framework used by management to evaluate the effectiveness of Horizon's internal control over financial reporting and provide management's assessment of the effectiveness of Horizon's internal control over financial reporting. This Annual Report on Form 10-K also includes an attestation report issued by Horizon's registered public accounting firm on Horizon's internal control over financial reporting. For fiscal years prior to the year ended December 31, 2012, Horizon was not an "accelerated filer" and, therefore, Horizon was exempt from the attestation report requirements.
Financial System Reform – The Dodd-Frank Act and the CFPB
The Dodd-Frank Act, which was signed into law in 2010, significantly changed the regulation of financial institutions and the financial services industry. The Dodd-Frank Act includes provisions affecting large and small financial institutions alike, including several provisions that have profoundly affected how community banks, thrifts, and small bank and thrift holding companies are regulated. Among other things, these provisions eliminated the Office of Thrift Supervision and transferred its functions to the other federal banking agencies, relaxed rules regarding interstate branching, allowed financial institutions to pay interest on business checking accounts, changed the scope of federal deposit insurance coverage and imposed new capital requirements on bank and thrift holding companies.
The Dodd-Frank Act created the CFPB as an independent bureau within the Federal Reserve System with broad rulemaking, supervisory and enforcement powers under various federal consumer financial protection laws, including the Equal Credit Opportunity Act, Truth in Lending Act, Real Estate Settlement Procedures Act, Fair Credit Reporting Act, Fair Debt Collection Practices Act, the Consumer Financial Privacy provisions of the Gramm-Leach-Bliley Act, and certain
12
H ORIZON B ANCORP
other statutes. In July 2011, many of the consumer financial protection functions formerly assigned to the federal banking and other designated agencies transferred to the CFBP. The CFBP has a large budget and staff, and has the authority to implement regulations under federal consumer protection laws and enforce those laws against financial institutions. The CFPB has examination and primary enforcement authority over depository institutions with $10 billion or more in assets. Smaller institutions are subject to rules promulgated by the CFPB but continue to be examined and supervised by the federal banking regulators for consumer compliance purposes. The CFPB also has authority to prevent unfair, deceptive or abusive practices in connection with offering consumer financial products. Additionally, the CFPB is authorized to collect fines and provide consumer restitution in the event of violations, engage in consumer financial education, track consumer complaints, request data, and promote the availability of financial services to underserved consumers and communities.
The CFPB has indicated that mortgage lending is an area of supervisory focus and that it will concentrate its examination and rulemaking efforts on the variety of mortgage-related topics required under the Dodd-Frank Act, including minimum standards for the origination of residential mortgages. The CFPB has published several final regulations impacting the mortgage industry, including rules related to ability-to-repay, mortgage servicing, escrow accounts, and mortgage loan originator compensation. The ability-to-repay rule makes lenders liable if they fail to assess a borrower's ability to repay under a prescribed test, but also creates a safe harbor for so called "qualified mortgages." Failure to comply with the ability-to-repay rule may result in possible CFPB enforcement action and special statutory damages plus actual, class action, and attorneys' fees damages, all of which a borrower may claim in defense of a foreclosure action at any time. Horizon's management is assessing the impact of these requirements on its mortgage lending business.
The Dodd-Frank Act contains numerous other provisions affecting financial institutions of all types, many of which may have an impact on the operating environment of Horizon in substantial and unpredictable ways. Horizon has incurred higher operating costs in complying with the Dodd-Frank Act, and expects higher costs to continue for the foreseeable future. Horizon's management continues to review rules and regulations adopted pursuant to the Dodd-Frank Act and assess their probable impact on the business, financial condition and results of operations of Horizon, and Horizon's management will also continue to monitor whether the new federal administration pursues announced plans to repeal or modify the Dodd-Frank Act.
Other Regulation
In addition to the matters discussed above, the Bank is subject to additional regulation of its activities, including a variety of consumer protection regulations affecting its lending, deposit, and collection activities and regulations affecting secondary mortgage market activities.
Effect of Governmental Monetary Policies
The Bank's earnings are affected by domestic economic conditions and the monetary and fiscal policies of the United States government and its agencies. The Federal Reserve's monetary policies have had, and are likely to continue to have, an important impact on the operating results of commercial banks through its power to implement national monetary policy in order, among other things, to curb inflation or combat a recession. The monetary policies of the Federal Reserve have major effects upon the levels of bank loans, investments and deposits through its open market operations in United States government securities and through its regulation of the discount rate on borrowings of member banks and the reserve requirements against member bank deposits. It is not possible to predict the nature or impact of future changes in monetary and fiscal policies.
Federal Home Loan Bank ("FHLB") System
The Bank is a member of the FHLB of Indianapolis, which is one of twelve regional FHLBs. Each FHLB serves as a reserve or central bank for its members within its assigned region. The FHLB is funded primarily from funds deposited by banks and savings associations and proceeds derived from the sale of consolidated obligations of the FHLB system. It makes loans to members (i.e., advances) in accordance with policies and procedures established by the Board of Directors of the FHLB. All FHLB advances must be fully secured by sufficient collateral as determined by the FHLB. The Federal Housing Finance Board ("FHFB"), an independent agency, controls the FHLB System, including the FHLB of Indianapolis.
13
H ORIZON B ANCORP
As a member of the FHLB, the Bank is required to purchase and maintain stock in the FHLB of Indianapolis in an amount equal to at least 1% of its aggregate unpaid residential mortgage loans, home purchase contracts, or similar obligations at the beginning of each year. At December 31, 2016, the Bank's investment in stock of the FHLB of Indianapolis was $14.9 million. The FHLB imposes various limitations on advances such as limiting the amount of certain types of real estate related collateral to 30% of a member's capital and limiting total advances to a member. Interest rates charged for advances vary depending upon maturity, the cost of funds to the FHLB of Indianapolis and the purpose of the borrowing.
The FHLBs are required to provide funds for the resolution of troubled savings associations and to contribute to affordable housing programs through direct loans or interest subsidies on advances targeted for community investment and low and moderate income housing projects. For the year ended December 31, 2016, dividends paid by the FHLB of Indianapolis to the Bank totaled approximately $529,000, for an annualized rate paid in dividends of 4.3%.
Limitations on Rates Paid for Deposits; Restrictions on Brokered Deposits
FDIC regulations restrict the interest rates that less than well-capitalized insured depository institutions may pay on deposits and also restrict the ability of such institutions to accept brokered deposits. These regulations permit a "well capitalized" depository institution to accept, renew or roll over brokered deposits without restriction, and an "adequately capitalized" depository institution to accept, renew or roll over brokered deposits with a waiver from the FDIC (subject to certain restrictions on payments of rates). The regulations prohibit an "undercapitalized" depository institution from accepting, renewing or rolling over brokered deposits. These regulations contemplate that the definitions of "well capitalized," "adequately capitalized" and "undercapitalized" will be the same as the definitions adopted by the agencies to implement the prompt corrective action provisions of FDICIA. Management does not believe that these regulations will have a materially adverse effect on the Bank's current operations.
Legislative Initiatives
Additional legislative and administrative actions affecting the banking industry may be considered by the United States Congress, state legislatures and various regulatory agencies, including those referred to above. It cannot be predicted with certainty whether such legislative or administrative action will be enacted or the extent to which the banking industry in general or Horizon and its affiliates will be affected.
14
H ORIZON B ANCORP
BANK HOLDING COMPANY STATISTICAL DISCLOSURES
| I. | DISTRIBUTION OF ASSETS, LIABILITIES AND STOCKHOLDERS' EQUITY; INTEREST RATES AND INTEREST DIFFERENTIAL |
Information required by this section of Securities Act Industry Guide 3 is presented in "Management's Discussion and Analysis of Financial Condition and Results of Operations" as set forth in Item 7 below, herein incorporated by reference.
| II. | INVESTMENT PORTFOLIO |
| A. | The following is a schedule of the amortized cost and fair value of investment securities available for sale and held to maturity. |
| December 31, 2016 | December 31, 2015 | December 31, 2014 | ||||||||||||||||||||||
| (dollars in thousands) | Amortized Cost | Fair Value | Amortized Cost | Fair Value | Amortized Cost | Fair Value | ||||||||||||||||||
Available for sale | ||||||||||||||||||||||||
U.S. Treasury and federal agencies | $ | 8,051 | $ | 7,989 | $ | 5,940 | $ | 5,926 | $ | 26,996 | $ | 26,823 | ||||||||||||
State and municipal | 117,327 | 116,592 | 73,829 | 75,095 | 46,535 | 47,952 | ||||||||||||||||||
Federal agency collateralized mtg. obligations | 139,040 | 137,195 | 157,291 | 156,203 | 122,930 | 122,860 | ||||||||||||||||||
Federal agency mortgage-backed pools | 180,183 | 176,726 | 206,970 | 207,704 | 122,583 | 125,395 | ||||||||||||||||||
Private labeled mortgage-backed pools | - | - | - | - | 670 | 689 | ||||||||||||||||||
Corporate notes | 1,238 | 1,329 | 32 | 54 | 32 | 45 | ||||||||||||||||||
|
|
|
|
|
|
|
|
|
|
|
| |||||||||||||
Total available for sale | 445,839 | 439,831 | 444,062 | 444,982 | 319,746 | 323,764 | ||||||||||||||||||
Total held to maturity | 193,194 | 194,086 | 187,629 | 193,703 | 165,767 | 169,904 | ||||||||||||||||||
|
|
|
|
|
|
|
|
|
|
|
| |||||||||||||
Total investment securities | $ | 639,033 | $ | 633,917 | $ | 631,691 | $ | 638,685 | $ | 485,513 | $ | 493,668 | ||||||||||||
|
|
|
|
|
|
|
|
|
|
|
| |||||||||||||
| B. | The following is a schedule of maturities of each category of available for sale and held-to-maturity debt securities and the related weighted-average yield of such securities as of December 31, 2016: |
| One Year or Less | After One Year Through Five Years | After Five Years Through Ten Years | After Ten Years | |||||||||||||||||||||||||||||
| (dollars in thousands) | Amount | Yield | Amount | Yield | Amount | Yield | Amount | Yield | ||||||||||||||||||||||||
Available for sale | ||||||||||||||||||||||||||||||||
U.S. Treasury and federal agencies (1) | $ | - | 0.00 | % | $ | 7,643 | 1.43 | % | $ | 346 | 2.06 | % | $ | - | 0.00 | % | ||||||||||||||||
State and municipal | 7,480 | 2.27 | % | 29,836 | 2.91 | % | 20,638 | 3.88 | % | 58,638 | 4.42 | % | ||||||||||||||||||||
Federal agency collateralized mtg. obligations (2) | - | 0.00 | % | 5,559 | 3.10 | % | 27,655 | 2.93 | % | 103,980 | 2.55 | % | ||||||||||||||||||||
Federal agency mortgage-backed pools (2) | - | 0.00 | % | 3,390 | 3.26 | % | 23,946 | 2.47 | % | 149,391 | 2.53 | % | ||||||||||||||||||||
Corporate notes | - | 0.00 | % | - | 0.00 | % | - | 0.00 | % | 1,329 | 0.00 | % | ||||||||||||||||||||
|
|
|
|
|
|
|
| |||||||||||||||||||||||||
Total available for sale | $ | 7,480 | 2.27 | % | $ | 46,428 | 2.71 | % | $ | 72,585 | 3.04 | % | $ | 313,338 | 2.88 | % | ||||||||||||||||
Total held to maturity | $ | - | 0.00 | % | $ | 35,446 | 4.08 | % | $ | 95,872 | 3.77 | % | $ | 62,768 | 4.09 | % | ||||||||||||||||
|
|
|
|
|
|
|
| |||||||||||||||||||||||||
Total investment securities | $ | 7,480 | 2.27 | % | $ | 81,874 | 3.31 | % | $ | 168,457 | 3.46 | % | $ | 376,106 | 3.08 | % | ||||||||||||||||
|
|
|
|
|
|
|
| |||||||||||||||||||||||||
| (1) | Fair value is based on contractual maturity or call date where a call option exists |
| (2) | Maturity based upon final maturity date |
The weighted-average interest rates are based on coupon rates for securities purchased at par value and on effective interest rates considering amortization or accretion if the securities were purchased at a premium or discount. Yields are not presented on a tax-equivalent basis.
15
H ORIZON B ANCORP
Excluding those holdings of the investment portfolio in Treasury securities and other agencies and corporations of the U.S. Government, there were no investments in securities of any one issuer that exceeded 10% of the consolidated stockholders' equity of Horizon at December 31, 2016.
| III. | LOAN PORTFOLIO |
| A. | Types of Loans - Total loans on the balance sheet are comprised of the following classifications for the years indicated. |
| (dollars in thousands) | December 31 2016 | December 31 2015 | December 31 2014 | December 31 2013 | December 31 2012 | |||||||||||||||
Commercial | $ | 1,069,956 | $ | 804,995 | $ | 674,314 | $ | 505,189 | $ | 460,471 | ||||||||||
Real estate | 531,874 | 437,144 | 254,625 | 185,958 | 189,714 | |||||||||||||||
Mortgage warehouse | 135,727 | 144,692 | 129,156 | 98,156 | 251,448 | |||||||||||||||
Consumer | 398,429 | 362,300 | 320,459 | 279,525 | 289,084 | |||||||||||||||
|
|
|
|
|
|
|
|
|
| |||||||||||
| 2,135,986 | 1,749,131 | 1,378,554 | 1,068,828 | 1,190,717 | ||||||||||||||||
Allowance for loan losses | (14,837 | ) | (14,534 | ) | (16,501 | ) | (15,992 | ) | (18,270 | ) | ||||||||||
|
|
|
|
|
|
|
|
|
| |||||||||||
Total loans | $ | 2,121,149 | $ | 1,734,597 | $ | 1,362,053 | $ | 1,052,836 | $ | 1,172,447 | ||||||||||
|
|
|
|
|
|
|
|
|
| |||||||||||
| B. | Maturities and Sensitivities of Loans to Changes in Interest Rates - The following is a schedule of maturities and sensitivities of loans to changes in interest rates, excluding real estate mortgage, mortgage warehouse and consumer loans, as of December 31, 2016: |
(dollars in thousands) Maturing or repricing | One Year or Less | One Through Five Years | After Five Years | Total | ||||||||||||
Commercial, financial, agricultural and commercial tax-exempt loans | $ | 658,783 | $ | 365,370 | $ | 45,803 | $ | 1,069,956 | ||||||||
The following is a schedule of fixed-rate and variable-rate commercial, financial, agricultural and commercial tax-exempt loans due after one year. (Variable-rate loans are those loans with floating or adjustable interest rates.)
| (dollars in thousands) | Fixed Rate | Variable Rate | ||||||
Total commercial, financial, agricultural and commercial tax-exempt loans due after one year | $ | 297,424 | $ | 113,749 | ||||
16
H ORIZON B ANCORP
| C. | Risk Elements |
Non-accrual, Past Due and Restructured Loans - The following schedule summarizes non-accrual, past due and restructured loans.
| (dollars in thousands) | December 31 2016 | December 31 2015 | December 31 2014 | December 31 2013 | December 31 2012 | |||||||||||||||
Non-performing loans | ||||||||||||||||||||
Commercial | ||||||||||||||||||||
More than 90 days past due | $ | 183 | $ | - | $ | - | $ | 45 | $ | - | ||||||||||
Non-accrual | 2,249 | 5,030 | 10,024 | 4,014 | 5,754 | |||||||||||||||
Trouble debt restructuring - accruing | - | 60 | 610 | 1,296 | 1,265 | |||||||||||||||
Trouble debt restructuring - non-accrual | - | 1,915 | 1,221 | 2,116 | 3,674 | |||||||||||||||
Real estate | ||||||||||||||||||||
More than 90 days past due | - | 1 | 40 | 2 | 2 | |||||||||||||||
Non-accrual | 2,959 | 4,354 | 2,297 | 2,459 | 4,565 | |||||||||||||||
Trouble debt restructuring - accruing | 1,254 | 808 | 2,526 | 2,686 | 1,761 | |||||||||||||||
Trouble debt restructuring - non-accrual | 809 | 1,074 | 1,031 | 999 | 2,827 | |||||||||||||||
Mortgage warehouse | ||||||||||||||||||||
More than 90 days past due | - | - | - | - | - | |||||||||||||||
Non-accrual | - | - | - | - | - | |||||||||||||||
Trouble debt restructuring - accruing | - | - | - | - | - | |||||||||||||||
Trouble debt restructuring - non-accrual | - | - | - | - | - | |||||||||||||||
Consumer | ||||||||||||||||||||
More than 90 days past due | 58 | 27 | 75 | 2 | 52 | |||||||||||||||
Non-accrual | 2,728 | 2,878 | 2,991 | 3,275 | 3,055 | |||||||||||||||
Trouble debt restructuring - accruing | 238 | 350 | 1,236 | 1,072 | 676 | |||||||||||||||
Trouble debt restructuring - non-accrual | 205 | 183 | 391 | 311 | 148 | |||||||||||||||
|
|
|
|
|
|
|
|
|
| |||||||||||
Total non-performing loans | 10,683 | 16,680 | 22,442 | 18,277 | 23,779 | |||||||||||||||
|
|
|
|
|
|
|
|
|
| |||||||||||
Other real estate owned and repossessed collateral | ||||||||||||||||||||
Commercial | 542 | 161 | 411 | 830 | 1,337 | |||||||||||||||
Real estate | 2,648 | 3,046 | 636 | 1,277 | 1,228 | |||||||||||||||
Mortgage warehouse | - | - | - | - | - | |||||||||||||||
Consumer | 26 | - | 154 | 14 | 11 | |||||||||||||||
|
|
|
|
|
|
|
|
|
| |||||||||||
Total other real estate owned and repossessed collateral | 3,216 | 3,207 | 1,201 | 2,121 | 2,576 | |||||||||||||||
|
|
|
|
|
|
|
|
|
| |||||||||||
Total non-performing assets | $ | 13,899 | $ | 19,887 | $ | 23,643 | $ | 20,398 | $ | 26,355 | ||||||||||
|
|
|
|
|
|
|
|
|
| |||||||||||
| (dollars in thousands) | ||||
Gross interest income that would have been recorded on non-accrual loans outstanding as of December 31, 2016, in the period if the loans had been current, in accordance with their original terms and had been outstanding throughout the period or since origination if held for part of the period. | $ | 690 | ||
Interest income actually recorded on non-accrual loans outstanding as of December 31, 2016, and included in net income for the period. | 204 | |||
|
| |||
Interest income not recognized during the period on non-accrual loans outstanding as of December 31, 2016. | $ | 486 | ||
|
| |||
Discussion of Non-Accrual Policy
| 1. | From time to time, the Bank obtains information which may lead management to believe that the collection of payments may be doubtful on a particular loan. In recognition of such, it is management's policy to convert the loan from an "earning asset" to a non-accruing loan. Further, it is management's policy to place a commercial loan on a non-accrual status when delinquent in excess of 90 days or it has had the accrual of interest discontinued by management. The officer responsible for the loan, the Chief Credit Officer and the senior commercial loan workout officer must review all loans placed on non-accrual status. |
17
H ORIZON B ANCORP
| 2. | Potential Problem Loans: |
Impaired and non-accrual loans for which the discounted cash flows or collateral value exceeded the carrying value of the loan totaled $10.7 million and $16.7 million at December 31, 2016 and 2015. The allowance for impaired and non-accrual loans included in the Bank's allowance for loan losses totaled $4,000 and $202,000 at those respective dates. The average balance of impaired loans during 2016 and 2015 was $2.9 million and $7.1 million.
| 3. | Foreign Outstandings: |
None.
| 4. | Loan Concentrations: |
As of December 31, 2016, there are no significant concentrations of loans exceeding 10% of total loans. See Item III A above for a listing of the types of loans by concentration.
| D. | Other Interest-Bearing Assets |
There are no other interest-bearing assets as of December 31, 2016, which would be required to be disclosed under Item III C.1 or 2 if such assets were loans.
| IV. | SUMMARY OF LOAN LOSS EXPERIENCE |
| A. | The following is an analysis of the activity in the allowance for loan losses account: |
| (dollars in thousands) | December 31 2016 | December 31 2015 | December 31 2014 | December 31 2013 | December 31 2012 | |||||||||||||||
Loans outstanding at the end of the period (1) | $ | 2,135,986 | $ | 1,749,131 | $ | 1,378,554 | $ | 1,068,828 | $ | 1,190,717 | ||||||||||
Average loans outstanding during the period (1) | 1,948,580 | 1,593,790 | 1,247,510 | 1,092,662 | 1,043,620 | |||||||||||||||
| (1) | Net of unearned income and deferred loan fees |
| (dollars in thousands) | December 31 2016 | December 31 2015 | December 31 2014 | December 31 2013 | December 31 2012 | |||||||||||||||
Balance at beginning of the period | $ | 14,534 | $ | 16,501 | $ | 15,992 | $ | 18,270 | $ | 18,882 | ||||||||||
Loans charged-off: | ||||||||||||||||||||
Commercial | 758 | 3,437 | 1,802 | 2,532 | 2,388 | |||||||||||||||
Real estate | 213 | 288 | 328 | 1,055 | 597 | |||||||||||||||
Consumer | 1,689 | 2,374 | 1,999 | 2,663 | 2,958 | |||||||||||||||
|
|
|
|
|
|
|
|
|
| |||||||||||
Total loans charged-off | 2,660 | 6,099 | 4,129 | 6,250 | 5,943 | |||||||||||||||
Recoveries of loans previously charged-off: | ||||||||||||||||||||
Commercial | 210 | 192 | 773 | 668 | 782 | |||||||||||||||
Real estate | 97 | 69 | 21 | 114 | 77 | |||||||||||||||
Consumer | 814 | 709 | 786 | 1,270 | 948 | |||||||||||||||
|
|
|
|
|
|
|
|
|
| |||||||||||
Total loan recoveries | 1,121 | 970 | 1,580 | 2,052 | 1,807 | |||||||||||||||
|
|
|
|
|
|
|
|
|
| |||||||||||
Net loans charged-off | 1,539 | 5,129 | 2,549 | 4,198 | 4,136 | |||||||||||||||
Provision charged to operating expense | 1,842 | 3,162 | 3,058 | 1,920 | 3,524 | |||||||||||||||
|
|
|
|
|
|
|
|
|
| |||||||||||
Balance at the end of the period | $ | 14,837 | $ | 14,534 | $ | 16,501 | $ | 15,992 | $ | 18,270 | ||||||||||
|
|
|
|
|
|
|
|
|
| |||||||||||
Percent of net charge-offs to average loans outstanding for the period | 0.08 | % | 0.32 | % | 0.20 | % | 0.38 | % | 0.40 | % | ||||||||||
18
H ORIZON B ANCORP
| B. | The following schedule is a breakdown of the allowance for loan losses allocated by type of loan and the percentage of loans in each category to total loans. |
| December 31 2016 | December 31 2015 | December 31 2014 | December 31 2013 | December 31 2012 | ||||||||||||||||||||||||||||||||||||
| (dollars in thousands) | Allowance Amount | % of Loans to Total Loans | Allowance Amount | % of Loans to Total Loans | Allowance Amount | % of Loans to Total Loans | Allowance Amount | % of Loans to Total Loans | Allowance Amount | % of Loans to Total Loans | ||||||||||||||||||||||||||||||
Commercial, financial and agricultural | $ | 6,579 | 50 | % | $ | 7,195 | 46 | % | $ | 7,910 | 50 | % | $ | 6,663 | 48 | % | $ | 7,771 | 39 | % | ||||||||||||||||||||
Real estate | 2,090 | 25 | % | 2,476 | 25 | % | 2,508 | 18 | % | 3,462 | 17 | % | 3,204 | 16 | % | |||||||||||||||||||||||||
Mortgage warehousing | 1,254 | 6 | % | 1,007 | 8 | % | 1,132 | 9 | % | 1,638 | 9 | % | 1,705 | 21 | % | |||||||||||||||||||||||||
Consumer | 4,914 | 19 | % | 3,856 | 21 | % | 4,951 | 23 | % | 4,229 | 26 | % | 5,590 | 24 | % | |||||||||||||||||||||||||
Unallocated | - | - | - | - | - | - | - | - | - | - | ||||||||||||||||||||||||||||||
|
|
|
|
|
|
|
|
|
|
|
|
|
|
|
|
|
|
|
| |||||||||||||||||||||
Total | $ | 14,837 | 100 | % | $ | 14,534 | 100 | % | $ | 16,501 | 100 | % | $ | 15,992 | 100 | % | $ | 18,270 | 100 | % | ||||||||||||||||||||
|
|
|
|
|
|
|
|
|
|
|
|
|
|
|
|
|
|
|
| |||||||||||||||||||||
In 1999, Horizon began a mortgage warehousing program. This program is described in "Management's Discussion and Analysis of Financial Condition and Results of Operations" in Item 7 below and in the Notes to the Consolidated Financial Statements in Item 8 below, which are incorporated herein by reference. The greatest risk related to these loans is transaction and fraud risk. During 2016, Horizon processed approximately $3.6 billion in mortgage warehouse loans.
| V. | DEPOSITS |
Information required by this section is found in "Management's Discussion and Analysis of Financial Condition and Results of Operations" in Item 7 below and in the Consolidated Financial Statements and related Notes in Item 8 below, which are incorporated herein by reference.
| VI. | RETURN ON EQUITY AND ASSETS |
Information required by this section is found in "Management's Discussion and Analysis of Financial Condition and Results of Operation in Item 7 below and in the Consolidated Financial Statements and related notes in Item 8 below, which are incorporated herein by reference.
| VII. | SHORT TERM BORROWINGS |
The following is a schedule of statistical information relative to securities sold under agreements to repurchase which are secured by Treasury and U.S. Government agency securities and mature within one year. There were no other categories of short-term borrowings for which the average balance outstanding during the period was 30% or more of stockholders' equity at the end of the period.
| (dollars in thousands) | December 31 2016 | December 31 2015 | ||||||
Outstanding at year end | $ | 57,144 | $ | 59,399 | ||||
Approximate weighted-average interest rate at year-end | 0.18 | % | 0.13 | % | ||||
Highest amount outstanding as of any month-end during the year | $ | 62,703 | $ | 61,205 | ||||
Approximate average outstanding during the year | $ | 54,737 | $ | 54,899 | ||||
Approximate weighted-average interest during the year | 0.17 | % | 0.13 | % | ||||
19
H ORIZON B ANCORP
ITEM 1A. RISK FACTORS
An investment in Horizon's securities is subject to risks inherent to our business. The material risks and uncertainties that management believes currently affect Horizon are described below. Before making an investment decision, you should carefully consider these risks as well as information we include or incorporate by reference in this report and other filings we make with the SEC. The risks and uncertainties we have described are not the only ones facing our company. Additional risks and uncertainties not presently known to us or that we currently deem immaterial also may affect our business operations.
If any of these risks or uncertainties materializes or any of these assumptions proves incorrect, our results could differ materially from the forward-looking statements. All forward-looking statements in this report are current only as of the date on which the statements were made. We do not undertake any obligation to publicly update any forward-looking statement to reflect events or circumstances after the date on which any statement is made or to reflect the occurrence of unanticipated events.
Risks Related to Our Business
As a financial institution, we are subject to a number of risks relating to our daily business. Although we undertake a variety of efforts to manage and control those risks, many of the risks are outside of our control. Among the risks we face are the following:
| • | Credit risk : the risk that loan customers or other parties will be unable to perform their contractual obligations; |
| • | Market risk : the risk that changes in market rates and prices will adversely affect our financial condition or results of operation; |
| • | Liquidity risk : the risk that Horizon or the Bank will have insufficient cash or access to cash to meet its operating needs; |
| • | Operational risk : the risk of loss resulting from fraud, inadequate or failed internal processes, cyber-security breaches, people and systems, or external events; |
| • | Economic risk : the risk that the economy in our markets could decline further resulting in increased unemployment, decreased real estate values and increased loan charge-offs; and |
| • | Compliance risk : the risk of additional action by our regulators or additional regulation could hinder our ability to do business profitably. |
The current economic environment poses significant challenges for us and could adversely affect our financial condition and results of operations.
We are operating in a challenging and uncertain economic environment, including generally uncertain world, national and local conditions in our markets. The capital and credit markets have been experiencing volatility and disruption since 2008. This presents financial institutions with unprecedented circumstances and challenges that in some cases have resulted in large declines in the fair values of investments and other assets, constraints on liquidity and significant credit quality problems, including severe volatility in the valuation of real estate and other collateral supporting loans. Our financial statements have been prepared using values and information currently available to us, but given this volatility, the values of assets and liabilities recorded in the financial statements could change rapidly, resulting in material future adjustments in asset values and the allowance for loan losses, which could negatively impact our ability to meet regulatory capital requirements and maintain sufficient liquidity. The risks associated with our business become more acute in periods of a slowing economy or slow growth such as we began experiencing in the latter half of 2008 and which continued through 2016. Although economic forecasters discuss the potential for more robust growth in 2017, financial institutions continue to be affected by sluggish real estate markets and constrained financial markets. While we continue to take steps to decrease and limit our exposure to residential construction and land development loans and home equity loans, we nonetheless retain direct exposure to the residential and commercial real estate markets, and we are affected by these events.
Continued declines in real estate values, home sales volumes and financial stress on borrowers as a result of the uncertain economic environment, including job loss, could have an adverse effect on our borrowers or their customers, which could adversely affect our financial condition and results of operations. Further deterioration in local economic conditions in our
20
H ORIZON B ANCORP
markets could drive losses beyond that which is provided for in our allowance for loan losses and result in the following other consequences: increases in loan delinquencies, problem assets and foreclosures; demand for our products and services may decline; deposits may decrease, which would adversely impact our liquidity position; and collateral for our loans, especially real estate, may decline in value, in turn reducing customers' borrowing power, and reducing the value of assets and collateral associated with our existing loans.
We face intense competition in all phases of our business from other banks, financial institutions and non-banks.
The banking and financial services business in most of our markets is highly competitive. Our competitors include large regional banks, local community banks, savings and loan associations, securities and brokerage companies, mortgage companies, insurance companies, finance companies, money market mutual funds, credit unions and other non-bank financial and digital service providers, many of which have greater financial, marketing and technological resources than us. Many of these competitors are not subject to the same regulatory restrictions that we are and may be able to compete more effectively as a result.
Also, technology and other changes have lowered barriers to entry and made it possible for customers to complete financial transactions using non-banks that historically have involved banks at one or both ends of the transaction. Non-banks now offer products and services traditionally provided by banks. For example, consumers can maintain funds that would have historically been held as bank deposits in brokerage accounts or mutual funds. Consumers can also complete transactions such as paying bills and/or transferring funds directly without the assistance of banks. The process of eliminating banks as intermediaries, known as "disintermediation," could result in the loss of fee income, as well as the loss of customer deposits and the related income generated from those deposits. The effects of disintermediation can also impact the lending business because of the fast growing body of financial technology companies that use software to deliver mortgage lending and other financial services. A related risk is the migration of bank personnel away from the traditional bank environments into financial technology companies and other non-banks.
Increased competition in our market may result in a decrease in the amounts of our loans and deposits, reduced spreads between loan rates and deposit rates or loan terms that are more favorable to the borrower. Any of these results could have a material adverse effect on our ability to maintain our earnings record, grow our loan portfolios and obtain low-cost funds. If increased competition causes us to significantly discount the interest rates we offer on loans or increase the amount we pay on deposits, our net interest income could be adversely impacted. If increased competition causes us to relax our underwriting standards, we could be exposed to higher losses from lending activities. Additionally, many of our competitors are larger in total assets and capitalization, have greater access to capital markets and offer a broader range of financial services than we can offer.
Our commercial and consumer loans expose us to increased credit risks.
We have a large percentage of commercial and consumer loans. Commercial loans generally have greater credit risk than residential mortgage loans because repayment of these loans often depends on the successful business operations of the borrowers. These loans also typically have much larger loan balances than residential mortgage loans. Consumer loans generally involve greater risk than residential mortgage loans because they are unsecured or secured by assets that depreciate in value. Although we undertake a variety of underwriting, monitoring and reserving protections with respect to these types of loans, there can be no guarantee that we will not suffer unexpected losses.
Our holdings of construction, land and home equity loans may pose more credit risk than other types of mortgage loans.
Construction loans, loans secured by commercial real estate and home equity loans generally entail more risk than other types of mortgage loans. When real estate values decrease, the developers to whom we lend are likely to experience a decline in sales of new homes from their projects. Land and construction loans are more likely to become non-performing as developers are unable to build and sell homes in volumes large enough for orderly repayment of loans and as other owners of such real estate (including homeowners) are unable to keep up with their payments. We strive to establish what we believe are adequate reserves on our financial statements to cover the credit risk of these loan portfolios. However, there can be no assurance that losses will not exceed our reserves, and ultimately result in a material level of charge-offs, which could adversely impact our results of operations, liquidity and capital.
21
H ORIZON B ANCORP
The allowance for loan losses may prove inadequate or be negatively affected by credit risk exposures.
Our business depends on the creditworthiness of our customers. We periodically review the allowance for loan and lease losses for adequacy considering economic conditions and trends, collateral values, and credit quality indicators, including past charge-off experience and levels of past due loans and non-performing assets. There is no certainty that the allowance for loan losses will be adequate over time to cover credit losses in the portfolio because of unanticipated adverse changes in the economy, market conditions or events adversely affecting specific customers, industries or markets. If the credit quality of the customer base materially decreases, if the risk profile of a market, industry or group of customers changes materially, or if the allowance for loan losses is not adequate, our business, financial condition, liquidity, capital, and results of operations could be materially adversely affected.
Changes in market interest rates could adversely affect our financial condition and results of operations.
Our financial condition and results of operations are significantly affected by changes in market interest rates. We can neither predict with certainty nor control changes in interest rates. These changes can occur at any time and are affected by many factors, including international, national, regional and local economic conditions, competitive pressures and monetary policies of the Federal Reserve.
Our results of operations depend substantially on our net interest income, which is the difference between the interest income that we earn on our interest-earning assets and the interest expense that we pay on our interest-bearing liabilities. Our profitability depends on our ability to manage our assets and liabilities during periods of changing market interest rates. If rates increase rapidly as a result of an improving economy, we may have to increase the rates paid on our deposits and borrowed funds more quickly than loans and investments re-price, resulting in a negative impact on interest spreads and net interest income. The impact of rising rates could be compounded if deposit customers flow funds away from us into direct investments, such as U.S. Government bonds, corporate securities and other investment vehicles, including mutual funds, which, because of the absence of federal insurance premiums and reserve requirements, generally pay higher rates of return than those offered by financial institutions such as ours. These consequences and consumer reactions may be more likely to occur during a future rise in interest rates as a result of, and in reaction to, the historically low interest rates that have persisted for an extended period of time since 2008. In other words, historical consumer behavior may not be a reliable predictor of future consumer behavior in a period of rising interest rates, resulting in a larger outflow of deposits or a higher level of loan prepayments than we would expect. In either case, our deposit costs may increase and our loan interest income may decline, either or both of which may have an adverse effect on our financial results.
Changes in interest rates also could affect loan volume. For instance, an increase in interest rates could cause a decrease in the demand for mortgage loans (and other loans), which could result in a significant decline in our revenue stream.
Conversely, should market interest rates fall below current levels, our net interest margin could also be negatively affected, as competitive pressures could keep us from further reducing rates on our deposits, and prepayments and curtailments on assets may continue. Such movements may cause a decrease in our interest rate spread and net interest margin, and therefore, decrease our profitability.
We also are subject to reinvestment risk associated with changes in interest rates. Changes in interest rates may affect the average life of loans and mortgage-related securities. Increases in interest rates may decrease loan demand and/or may make it more difficult for borrowers to repay adjustable rate loans. Decreases in interest rates often result in increased prepayments of loans and mortgage-related securities, as borrowers refinance their loans to reduce borrowing costs. Under these circumstances, we are subject to reinvestment risk to the extent that we are unable to reinvest the cash received from such prepayments in loans or other investments that have interest rates that are comparable to the interest rates on existing loans and securities.
22
H ORIZON B ANCORP
An economic slowdown in our primary market areas could affect our business.
Our primary market area for deposits and loans consists of Northern and Central Indiana and Southwestern and Central Michigan. An economic slowdown could hurt our business and the possible consequences of such a downturn could include the following:
| • | increases in loan delinquencies and foreclosures; |
| • | declines in the value of real estate and other collateral securing loans; |
| • | an increase in loans charged off; |
| • | an increase in the Company's expense to fund loan loss reserves; |
| • | an increase in collection costs; |
| • | a decline in the demand for our products and services, and; |
| • | an increase in non-accrual loans and other real estate owned. |
The loss of key members of our senior management team and our lending teams could affect our ability to operate effectively.
We depend heavily on the services of our existing senior management team, particularly our CEO Craig M. Dwight, to carry out our business and investment strategies. As we continue to grow and expand our business and our locations, products and services, we will increasingly need to rely on Mr. Dwight's experience, judgment and expertise as well as that of the other members of our senior management team. We also depend heavily on our experienced and effective lending teams and their respective special market insights, including, for example, our agricultural lending specialists. In addition to the importance of retaining our lending team, we will also need to continue to attract and retain qualified banking personnel at all levels. Competition for such personnel is intense in our geographic market areas. If we are unable to attract and retain an effective lending team and other talented people, our business could suffer. The loss of the services of any senior management personnel, particularly Mr. Dwight, or the inability to recruit and retain qualified lending and other personnel in the future, could have a material adverse effect on our consolidated results of operations, financial condition and prospects.
Potential acquisitions may disrupt our business and dilute stockholder value.
We periodically evaluate merger and acquisition opportunities and conduct due diligence activities related to possible transactions with other financial institutions and financial services companies. We generally seek merger or acquisition partners that are culturally similar and possess either significant market presence or have potential for improved profitability through financial management, economies of scale or expanded services. Acquiring other banks, businesses, or branches involves various risks commonly associated with acquisitions, including, among other things:
| • | potential exposure to unknown or contingent liabilities of the target company; |
| • | exposure to potential asset quality issues of the target company; |
| • | potential disruption to our business; |
| • | potential diversion of our management's time and attention away from day-to-day operations; |
| • | the possible loss of key employees, business and customers of the target company; |
| • | difficulty in estimating the value of the target company, and; |
| • | potential problems in integrating the target company's systems, customers and employees with ours. |
As a result, merger or acquisition discussions and, in some cases, negotiations may take place and future mergers or acquisitions involving the payment of cash or the issuance of our debt or equity securities may occur at any time. Acquisitions typically involve the payment of a premium over book and market values, and, therefore, some dilution of our tangible book value and net income per common share may occur in connection with any future transaction. To the extent we were to issue additional common shares in any such transaction, our current shareholders would be diluted and such an issuance may have the effect of decreasing our stock price, perhaps significantly. Furthermore, failure to realize the expected revenue increases, cost savings, increases in geographic or product presence, and/or other projected benefits from an acquisition could have a material adverse effect on our financial condition and results of operations.
23
H ORIZON B ANCORP
In addition, merger and acquisition costs incurred by Horizon may temporarily increase operating expenses.
We may need to raise additional capital in the future, and such capital may not be available when needed or at all.
We may need to raise additional capital in the future to fund acquisitions and to provide us with sufficient capital resources and liquidity to meet our commitments, regulatory capital requirements and business needs, particularly if our asset quality or earnings were to deteriorate significantly. Although we are currently, and have historically been, "well capitalized" for regulatory purposes, our capital levels are not far in excess of the well capitalized threshold, and in the past we have been required to maintain increased levels of capital in connection with certain acquisitions. Additionally, we periodically explore acquisition opportunities with other financial institutions, some of which are in distressed financial condition. Any future acquisition, particularly the acquisition of a significantly troubled institution or an institution of comparable size to us, may require us to raise additional capital in order to obtain regulatory approval and/or to remain well capitalized.
Our ability to raise additional capital, if needed, will depend on, among other things, conditions in the capital markets at that time, which are outside of our control, and our financial performance. Economic conditions and the loss of confidence in financial institutions may increase our cost of funding and limit access to certain customary sources of capital, including inter-bank borrowings, repurchase agreements and borrowings from the discount window of the Federal Reserve.
We cannot guarantee that such capital will be available on acceptable terms or at all. Any occurrence that may limit our access to the capital markets, such as a decline in the confidence of debt purchasers, our depositors or counterparties participating in the capital markets may adversely affect our capital costs and our ability to raise capital and, in turn, our liquidity. Moreover, if we need to raise capital in the future, we may have to do so when many other financial institutions are also seeking to raise capital and would have to compete with those institutions for investors. An inability to raise additional capital on acceptable terms when needed could have a materially adverse effect on our businesses, financial condition and results of operations and may restrict our ability to grow.
The preparation of our financial statements requires the use of estimates that may vary from actual results.
The preparation of consolidated financial statements in conformity with accounting principles generally accepted in the United States of America requires management to make significant estimates that affect the financial statements. One of our most critical estimates is the level of the allowance for loan losses. Due to the inherent nature of these estimates, we cannot provide absolute assurance that we will not have to increase the allowance for loan losses and/or sustain loan losses that are significantly higher than the provided allowance.
Our mortgage warehouse and indirect lending operations are subject to a higher fraud risk than our other lending operations.
We buy loans originated by mortgage bankers and automobile dealers. Because we must rely on the mortgage bankers and automobile dealers in making and documenting these loans, there is an increased risk of fraud to us on the part of the third-party originators and the underlying borrowers. In order to guard against this increased risk, we perform investigations on the mortgage companies with whom we do business, and we review the loan files and loan documents we purchase to attempt to detect any irregularities or legal noncompliance. However, there is no guarantee that our procedures will detect all cases of fraud or legal noncompliance.
Our mortgage lending profitability could be significantly reduced if we are not able to resell mortgages or experience other problems with the secondary market process or are unable to retain our mortgage loan sales force due to regulatory changes.
Currently, we sell a substantial portion of the mortgage loans we originate. The profitability of our mortgage banking operations depends in large part upon our ability to aggregate a high volume of loans and to sell them in the secondary market at a gain. Thus, we are dependent upon the existence of an active secondary market and our ability to profitably sell loans into that market.
24
H ORIZON B ANCORP
Our ability to sell mortgage loans readily is dependent upon the availability of an active secondary market for single-family mortgage loans, which in turn depends in part upon the continuation of programs currently offered by Fannie Mae, Freddie Mac and Ginnie Mae (the "Agencies") and other institutional and non-institutional investors. These entities account for a substantial portion of the secondary market in residential mortgage loans. Some of the largest participants in the secondary market, including the Agencies, are government-sponsored enterprises whose activities are governed by federal law. Any future changes in laws that significantly affect the activity of such government-sponsored enterprises could, in turn, adversely affect our operations.
In September 2008, Fannie Mae and Freddie Mac were placed into conservatorship by the U.S. government. Although to date, the conservatorship has not had a significant or adverse effect on our operations, and during 2010 and 2012 the Federal Housing Finance Agency indicated that the Treasury Department is committed to fund Fannie Mae and Freddie Mac to levels needed in order to sufficiently meet their funding needs, it is currently unclear whether further changes would significantly and adversely affect our operations. Members of the present federal administration have expressed an intent to seek an end to the conservatorship and to privatize the Agencies, and it is unclear how that might impact us. In addition, our ability to sell mortgage loans readily is dependent upon our ability to remain eligible for the programs offered by the Agencies and other institutional and non-institutional investors. Our ability to remain eligible may also depend on having an acceptable peer-relative delinquency ratio for the Federal Housing Administration ("FHA") and maintaining a delinquency rate with respect to Ginnie Mae pools that are below Ginnie Mae guidelines. In the case of Ginnie Mae pools, we have repurchased delinquent loans from them in the past to maintain compliance with the minimum required delinquency ratios. Although these loans are typically insured as to principal by the FHA, such repurchases increase our capital and liquidity needs, and there can be no assurance that we will have sufficient capital or liquidity to continue to purchase such loans out of the Ginnie Mae pools if required to do so.
Any significant impairment of our eligibility with any of the Agencies could materially and adversely affect our operations. Further, the criteria for loans to be accepted under such programs may be changed from time-to-time by the sponsoring entity which could result in a lower volume of corresponding loan originations. The profitability of participating in specific programs may vary depending on a number of factors, including our administrative costs of originating and purchasing qualifying loans and our costs of meeting such criteria.
We are exposed to intangible asset risk in that our goodwill may become impaired.
As of December 31, 2016, we had $86.3 million of goodwill and other intangible assets. A significant and sustained decline in our stock price and market capitalization, a significant decline in our expected future cash flows, a significant adverse change in the business climate, or slower growth rates could result in impairment of goodwill. If we were to conclude that a future write-down of our goodwill is necessary, then we would record the appropriate charge, which could be materially adverse to our operating results and financial position. For further discussion, see Notes 1 and 11, "Nature of Operations and Summary of Significant Accounting Policies" and "Intangible Assets," to the Consolidated Financial Statements included in Item 8 of our Annual Report on Form 10-K for the year ended December 31, 2016.
We are subject to extensive regulation and changes in laws and regulatory policies could adversely affect our business.
Our operations are subject to extensive regulation by federal agencies. See "Regulation and Supervision" in the description of our Business in Item 1 of Part I of this report for detailed information on the laws and regulations to which we are subject. Changes in applicable laws, regulations or regulator policies can materially affect our business. The likelihood of any major changes in the future and their effects are impossible to determine. As an example, the Bank could experience higher credit losses because of federal or state legislation or by regulatory or bankruptcy court action that reduces the amount the Bank's borrowers are otherwise contractually required to pay under existing loan contracts. Also, the Bank could experience higher credit losses because of federal or state legislation or regulatory action that limits its ability to foreclose on property or other collateral or makes foreclosure less economically feasible.
Corporate tax reform continues to be a priority in the U.S., and the present federal administration proposes reducing the corporate income tax rate. Changes to the U.S. tax system could have significant effects, positive and negative, on our
25
H ORIZON B ANCORP
effective tax rate, and on our deferred tax assets and liabilities. In addition, changes to the tax system could impact our ability to utilize our federal and state net operating loss carryforwards. Accordingly, a decline in the U.S. corporate tax rate or other changes to the U.S. tax system could have a material adverse effect on Horizon's earnings in the quarter and year in which the legislation is enacted.
We face other risks from recent actions of the U.S. Treasury and the Internal Revenue Service. In November 2016, these agencies issued a Notice making captive insurance company activities "transactions of interest" due to the potential for tax avoidance or evasion. We have two captive insurance companies (one was acquire in 2016 as part of the LaPorte Bancorp acquisition), and it is not certain at this point how the Notice may impact us on our operation of the captive insurance companies as a risk management tool.
Legislation enacted in recent years, together with additional actions announced by the U.S. Treasury and other regulatory agencies, continue to develop. It is not clear at this time what impact legislation and liquidity and funding initiatives of the U.S. Treasury and other bank regulatory agencies, and additional programs that may be initiated in the future, will have on the financial markets and the financial services industry.
Our inability to continue to accurately process large volumes of transactions could adversely impact our business and financial results.
In the normal course of business, we process large volumes of transactions. If systems of internal control should fail to work as expected, if systems are used in an unauthorized manner, or if employees subvert the system of internal controls, significant losses could result.
We process large volumes of transactions on a daily basis and are exposed to numerous types of operational risk. Operational risk resulting from inadequate or failed internal processes, people and systems includes the risk of fraud by persons inside or outside Horizon, the execution of unauthorized transactions by employees, errors relating to transaction processing and systems, and breaches of the internal control system and compliance requirements. This risk of loss also includes the potential legal actions that could arise as a result of the operational deficiency or as a result of noncompliance with applicable regulatory standards.
We establish and maintain systems of internal operational controls that are designed to provide us with timely and accurate information about our level of operational risk. While not foolproof, these systems have been designed to manage operational risk at appropriate, cost-effective levels. Procedures also exist that are designed to ensure that policies relating to conduct, ethics and business practices are followed. From time to time, losses from operational risk may occur, including the consequences of operational errors.
While we continually monitor and improve the system of internal controls, data processing systems and corporate-wide processes and procedures, there can be no assurance that future losses will not occur.
Our information systems may experience cyber-attacks or an interruption or breach in security.
We rely heavily on internal and outsourced technologies, communications, and information systems to conduct our business. Additionally, in the normal course of business, we collect, process and retain sensitive and confidential information regarding our customers. As our reliance on technology has increased, so have the potential risks of a technology-related operation interruption (such as disruptions in our customer relationship management, general ledger, deposit, loan, or other systems) or the occurrence of cyber-attacks (such as unauthorized access to our systems, computer viruses or other malicious code). These risks have increased for all financial institutions as new technologies, including the use of the Internet and telecommunications technologies (including mobile devices), have become commonly used to conduct financial and other business transactions, during a time of increased technological sophistication of organized crime, perpetrators of fraud, hackers, terrorists and others. In addition to cyber-attacks or other security breaches involving the theft of sensitive and confidential information, hackers recently have engaged in attacks against large financial institutions, particularly denial of service attacks, that are designed to disrupt key business services, such as customer-facing web sites. We are not able to anticipate or implement effective preventive measures against all security breaches of these types, especially because the techniques used change frequently and because attacks can originate from a wide variety of sources, both domestic and foreign. However, we have analyzed and will continue to analyze security related to device-specific considerations, user access topics, transaction-processing and network integrity.
26
H ORIZON B ANCORP
We also face risks related to cyber-attacks and other security breaches in connection with credit card and debit card transactions that typically involve the transmission of sensitive information regarding our customers through various third parties, including merchant acquiring banks, payment processors, payment card networks and our processors. Some of these parties have in the past been the target of security breaches and cyber-attacks, and because the transactions involve third parties and environments such as the point of sale that we do not control or secure, future security breaches or cyber-attacks affecting any of these third parties could impact us through no fault of our own, and in some cases we may have exposure and suffer losses for breaches or attacks relating to them. Further cyber-attacks or other breaches in the future, whether affecting us or others, could intensify consumer concern and regulatory focus and result in reduced use of payment cards and increased costs, all of which could have a material adverse effect on our business.
To the extent we are involved in any future cyber-attacks or other breaches, we may be required to expend significant additional resources to modify our protective measures or to investigate and remediate vulnerabilities or other exposures, and we may be subject to litigation and financial losses that are either not insured against or not fully covered through any insurance we maintain. We could also suffer significant damage to our reputation. Although we are insured against many of these risks, including privacy breach response costs, notification expenses, breach support and credit monitoring expenses, cyber extortion and cyber terrorism, there can be no assurances that such insurance will be sufficient to cover all costs arising from a data or information technology breach and our exposure may exceed our coverage.
We continually encounter technological changes.
The financial services industry is continually undergoing rapid technological change with frequent introductions of new technology-driven products and services. The effective use of technology increases efficiency and enables financial institutions to better serve customers and to reduce costs. Our future success depends, in part, upon our ability to address the needs of our customers by using technology to provide products and services that will satisfy customer demands, as well as to create additional efficiencies in our operations. Many of our competitors have substantially greater resources to invest in technological improvements, and we may not be able to effectively implement new technology-driven products and services or be successful in marketing these products and services to our customers. Failure to successfully keep pace with technological change affecting the financial services industry could have a material adverse impact on our business and, in turn, our financial condition and results of operations.
We rely on other companies to provide key components of our business infrastructure.
Third-party vendors provide key components of our business infrastructure, including Internet connections, mobile and internet banking, network access and transaction and other processing services. Although we have selected these third-party vendors carefully, we do not control their actions. Any problems caused by these third parties, including as a result of inadequate or interrupted service or breach of customer information, could adversely affect our ability to deliver products and services to our customers and otherwise to conduct our business. In addition, any breach in customer information could affect our reputation and cause a loss of business. Replacing these third-party vendors also could result in significant delay and expense.
Damage to our reputation could damage our business.
Our business depends upon earning and maintaining the trust and confidence of our customers, investors and employees. Damage to our reputation could cause significant harm to our business and prospects. Harm to our reputation can arise from numerous sources, including, among others, employee misconduct, compliance failures, litigation or regulatory outcomes or governmental investigations. In addition, a failure to deliver appropriate standards of service and quality, or a failure or perceived failure to treat customers and clients fairly, can result in customer dissatisfaction, litigation, privacy breach and heightened regulatory scrutiny, all of which can lead to lost revenue, higher operating costs and harm to our reputation. Adverse publicity about Horizon, whether or not true, may result in harm to our existing business, customer relationships and prospects. Should any events or factors that can undermine our reputation occur, there is no assurance that the additional costs and expenses that we may need to incur to address the issues giving rise to the reputational harm would not adversely affect our earnings and results of operations.
27
H ORIZON B ANCORP
The soundness of other financial institutions could adversely affect us.
Financial services institutions are interrelated as a result of trading, clearing, counterparty, or other relationships. We have exposure to many different industries and counterparties, and we routinely execute transactions with counterparties in the financial services industry, including brokers and dealers, commercial banks, investment banks, mutual and hedge funds, and other institutional clients. Many of these transactions expose us to credit risk in the event of default by our counterparty or client. In addition, our credit risk may be exacerbated when the collateral held by us cannot be realized or is liquidated at prices not sufficient to recover the full amount of the loan or derivative exposure due us. There is no assurance that any such losses would not materially and adversely affect our results of operations or earnings.
Risks Related to our Common Stock
The price of our common stock may fluctuate significantly, and this may make it difficult for you to resell our common stock at times or at prices you find attractive.
Although our common stock is listed on the NASDAQ Global Select Market, our stock price constantly changes, and we expect our stock price to continue to fluctuate in the future. Our stock price is impacted by a variety of factors, some of which are beyond our control.
These factors include:
| • | variations in our operating results or the quality of our assets; |
| • | operating results that vary from the expectations of management, securities analysts and investors; |
| • | increases in loan losses, non-performing loans and other real estate owned; |
| • | changes in expectations as to our future financial performance; |
| • | announcements of new products, strategic developments, acquisitions and other material events by us or our competitors; |
| • | the operating and securities price performance of other companies that investors believe are comparable to us; |
| • | loss of our inclusion on the Russell 3000 or other indices; |
| • | actual or anticipated sales of our equity or equity-related securities; |
| • | our past and future dividend practice; |
| • | our creditworthiness; |
| • | interest rates; |
| • | the credit, mortgage and housing markets, the markets for securities relating to mortgages or housing; |
| • | developments with respect to financial institutions generally; and |
| • | economic, financial, geopolitical, regulatory, congressional or judicial events that affect us or the financial markets. |
In addition the stock market in general has recently experienced extreme price and volume fluctuations. This volatility has had a significant effect on the market price of securities issued by many companies and particularly those in the financial services and banking sector, including for reasons unrelated to their operating performance. These broad market fluctuations may adversely affect our stock price, notwithstanding our operating results.
Because our stock is moderately traded, it may be more difficult for you to sell your shares or buy additional shares when you desire to do so and the price may be volatile.
Although our common stock has been listed on the NASDAQ stock market since December 2001, our common stock is moderately traded. The prices of moderately traded stocks, such as ours, can be more volatile than stocks traded in a large, active public market and can be more easily impacted by sales or purchases of large blocks of stock. Moderately traded stocks are also less liquid, and because of the low volume of trades, you may be unable to sell your shares when you desire to do so.
28
H ORIZON B ANCORP
Provisions in our articles of incorporation, our by-laws, and Indiana law may delay or prevent an acquisition of us by a third party.
Our articles of incorporation and by-laws and Indiana law contain provisions that have certain anti-takeover effects. While the purpose of these provisions is to strengthen the negotiating position of the board in the event of a hostile takeover attempt, the overall effects of these provisions may be to render more difficult or discourage a merger, tender offer or proxy contest, the assumption of control by a holder of a larger block of our shares, and the removal of incumbent directors and key management.
Our articles of incorporation provide for a staggered board, which means that only one-third of our board can be replaced by shareholders at any annual meeting. Our articles also provide that our directors may only be removed without cause by shareholders owning 70% or more of our outstanding common stock. Furthermore, our articles provide that only our board of directors, and not our shareholders, may adopt, alter, amend and repeal our by-laws.
Our articles also preempt Indiana law with respect to business combinations with a person who acquires 10% or more of our common stock and provide that such transactions are subject to independent and super-majority shareholder approval requirements unless certain pricing and board pre-approval requirements are satisfied.
Our by-laws do not permit cumulative voting of shareholders in the election of directors, allowing the holders of a majority of our outstanding shares to control the election of all our directors, and our directors are elected by plurality (not majority) voting. Our by-laws also establish detailed procedures that shareholders must follow if they desire to nominate directors for election or otherwise present issues for consideration at a shareholders' meeting. We also have a mandatory retirement age for directors.
These and other provisions of our governing documents and Indiana law are intended to provide the board of directors with the negotiating leverage to achieve a more favorable outcome for our shareholders in the event of an offer for the Company. However, there is no assurance that these same anti-takeover provisions could not have the effect of delaying, deferring or preventing a transaction or a change in control that might be in the best interest of our shareholders.
ITEM 1B. UNRESOLVED STAFF COMMENTS
Not applicable.
ITEM 2. PROPERTIES
The main office and full service branch of Horizon and the Bank is located at 515 Franklin Square, Michigan City, Indiana. The building located across the street from the main office of Horizon and the Bank, at 502 Franklin Square, houses the credit administration, operations, facilities and purchasing, and information technology departments of the Bank. In addition to these principal facilities, the Bank has 55 sales offices located at:
| 3631 South Franklin Street | Michigan City | Indiana | ||
| 113 West First Street | Wanatah | Indiana | ||
| 1500 West Lincolnway | LaPorte | Indiana | ||
| 423 South Roosevelt Street | Chesterton | Indiana | ||
| 4208 North Calumet Avenue | Valparaiso | Indiana | ||
| 902 East Lincolnway | Valparaiso | Indiana | ||
| 455 Morthland Drive | Valparaiso | Indiana | ||
| 2650 Willowcreek Road | Portage | Indiana | ||
| 8590 Broadway | Merrillville | Indiana | ||
| 10429 Calumet Avenue | Munster | Indiana | ||
| 17400 State Road 23 | South Bend | Indiana | ||
| 1909 East Bristol Street | Elkhart | Indiana | ||
| 1321 119 th Street | Whiting | Indiana | ||
| 1349 Calumet Avenue | Hammond | Indiana |
29
H ORIZON B ANCORP
| 1300 North Main Street | Crown Point | Indiana | ||
| 420 North Morton Street | Franklin | Indiana | ||
| 151 Marlin Drive | Greenwood | Indiana | ||
| 942 South US 31 | Greenwood | Indiana | ||
| 507 Three Notch Lane | Bargersville | Indiana | ||
| 302 North Alabama Street | Indianapolis | Indiana | ||
| 1216 West Carmel Drive | Carmel | Indiana | ||
| 212 West Seventh Street | Auburn | Indiana | ||
| 105 North Main Street | Avilla | Indiana | ||
| 507 North Main Street | Columbia City | Indiana | ||
| 123-129 South Main Street | Columbia City | Indiana | ||
| 1212 South Randolph Street | Garrett | Indiana | ||
| 303 Defiance Street | Howe | Indiana | ||
| 116 West Mitchell Street | Kendallville | Indiana | ||
| 114 South Detroit Street | LaGrange | Indiana | ||
| 210 West Lake Street | Topeka | Indiana | ||
| 625 South Wayne Street | Waterloo | Indiana | ||
| 22730 Main Street | Woodburn | Indiana | ||
| 200 Main Street | Leesburg | Indiana | ||
| 102 East Main Street | Mentone | Indiana | ||
| 411 South Huntington Street | Syracuse | Indiana | ||
| 2102 East Center Street | Warsaw | Indiana | ||
| 433 Anchorage Road | Warsaw | Indiana | ||
| 301 Boyd Boulevard | LaPorte | Indiana | ||
| 6959 West Johnson Road | LaPorte | Indiana | ||
| 710 Indiana Avenue | LaPorte | Indiana | ||
| 1 Parkman Drive | Westville | Indiana | ||
| 307 East Jackson Street | Attica | Indiana | ||
| 2 South Perry Street | Attica | Indiana | ||
| 811 Ship Street | St. Joseph | Michigan | ||
| 2608 Niles Road | St. Joseph | Michigan | ||
| 1041 East Napier Avenue | Benton Harbor | Michigan | ||
| 500 West Buffalo Street | New Buffalo | Michigan | ||
| 6801 West US 12 | Three Oaks | Michigan | ||
| 3250 West Centre Avenue | Portage | Michigan | ||
| 1600 Abbot Road | East Lansing | Michigan | ||
| 2151 West Grand River | Okemos | Michigan | ||
| 500 North Grand Street | Schoolcraft | Michigan | ||
| 123 Portage Avenue | Three Rivers | Michigan | ||
| 1213 West Michigan Avenue | Three Rivers | Michigan | ||
| 15534 US 12 | Union | Michigan |
Horizon owns all of these facilities except for the East Lansing, Michigan office located at 1600 Abbot Road, which is leased. The Bank also has three loan production offices which are all leased located at:
| 10020 Auburn Park Drive | Fort Wayne | Indiana | ||
| 7100 Tower Road, Suite A | Battle Creek | Michigan | ||
| 250 Pearl Street NW | Grand Rapids | Michigan |
30
H ORIZON B ANCORP
ITEM 3. LEGAL PROCEEDINGS
Horizon and its subsidiaries are involved in various legal proceedings incidental to the conduct of their business. Management does not expect that the outcome of any such proceedings will have a material adverse effect on our consolidated financial position or results of operations.
ITEM 4. MINE SAFETY DISCLOSURES
Not applicable.
SPECIAL ITEM: EXECUTIVE OFFICERS OF REGISTRANT
| Craig M. Dwight | 60 | Chairman of Horizon since July 2014; Chairman and Chief Executive Officer of the Bank since January 2003; Chief Executive Officer of Horizon and the Bank since July 2001; President of the Bank from 1998 to January 2003. | ||
| Thomas H. Edwards | 64 | President of the Bank since January 2003. | ||
| Mark E. Secor | 50 | Executive Vice President of Horizon since January 2014 ; Chief Financial Officer and Executive Vice President of Horizon and the Bank since January 2009; Vice President, Chief Investment and Asset Liability Manager from June 2007 to January 2009; Chief Financial Officer of St. Joseph Capital Corp., Mishawaka, Indiana from 2004 to 2007. | ||
| James D. Neff | 57 | Corporate Secretary of Horizon since 2007; Executive Vice President-Mortgage Banking of the Bank since January 2004; Senior Vice President of the Bank from October 1999 to January 2004. | ||
| Kathie A. DeRuiter | 55 | Executive Vice President of Horizon and Senior Bank Operations Officer since January 2014; Senior Vice President, Senior Bank Operations Officer from January 2003 to January 2014; Vice President, Senior Bank Operations Officer from January 2000 to January 2003. |
All officers are appointed annually by the Board of Directors of Horizon and the Bank, as applicable.
31
H ORIZON B ANCORP
PART II
ITEM 5. MARKET FOR REGISTRANT'S COMMON EQUITY, RELATED STOCKHOLDER MATTERS AND ISSUER PURCHASES OF EQUITY SECURITIES
Repurchases of Securities
There were no purchases by the Company of its common stock during the fourth quarter of 2016.
Performance Graph
The SEC requires Horizon to include a line graph comparing Horizon's cumulative five-year total shareholder returns on the common shares with market and industry returns over the past five years. SNL Financial LC prepared the following graph. The return represented in the graph assumes the investment of $100 on December 31, 2011, and further assumes reinvestment of all dividends. The Company's common stock began trading on the NASDAQ Global Market on February 1, 2007, and on the NASDAQ Global Select Market on January 2, 2014. Prior to that date, the common stock was traded on the NASDAQ Capital Market.
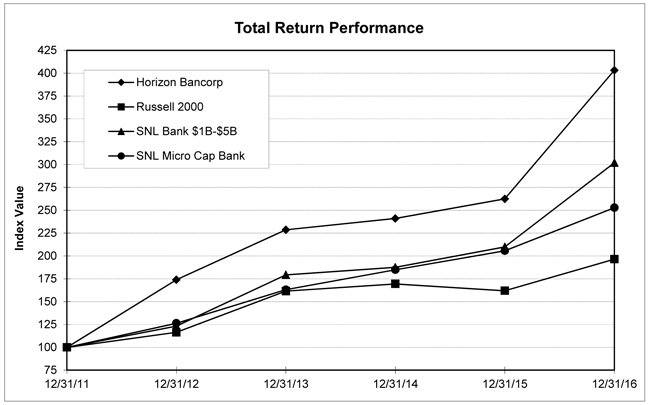
| Period Ending | ||||||||||||||||||||||||
| Index | December 31 2011 | December 31 2012 | December 31 2013 | December 31 2014 | December 31 2015 | December 31 2016 | ||||||||||||||||||
Horizon Bancorp | 100.00 | 173.93 | 228.51 | 240.98 | 262.38 | 403.16 | ||||||||||||||||||
Russell 2000 | 100.00 | 116.35 | 161.52 | 169.43 | 161.95 | 196.45 | ||||||||||||||||||
SNL Bank $1B-$5B | 100.00 | 123.31 | 179.31 | 187.48 | 209.86 | 301.92 | ||||||||||||||||||
SNL Micro Cap Bank | 100.00 | 126.37 | 163.04 | 184.90 | 205.62 | 252.77 | ||||||||||||||||||
| Source : SNL Financial LC, Charlottesville, VA | ||
| Copyright 2017 | www.snl.com |
32
H ORIZON B ANCORP
The following chart compares the change in market price of Horizon's common stock since December 31, 2011 to that of publicly traded banks in Indiana and Michigan with assets greater than $500 million, excluding the reinvestment of dividends.
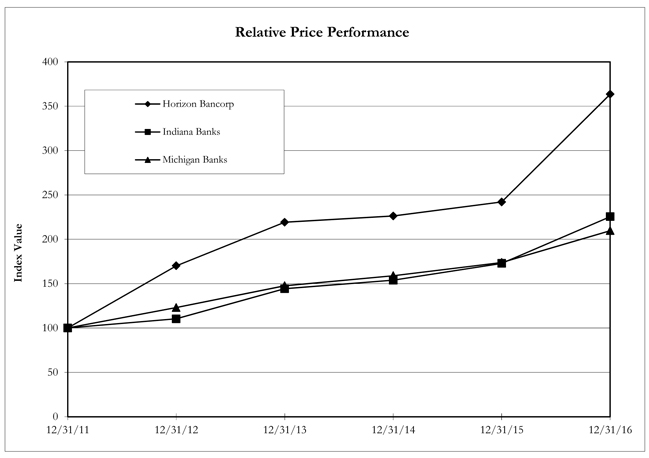
| Period Ending | ||||||||||||||||||||||||
| Index | December 31 2011 | December 31 2012 | December 31 2013 | December 31 2014 | December 31 2015 | December 31 2016 | ||||||||||||||||||
Horizon Bancorp | 100.00 | 170.08 | 219.24 | 226.26 | 242.01 | 363.53 | ||||||||||||||||||
Indiana Banks (1) | 100.00 | 110.30 | 144.28 | 153.88 | 172.82 | 225.46 | ||||||||||||||||||
Michigan Banks (1) | 100.00 | 123.05 | 147.57 | 158.96 | 173.88 | 209.68 | ||||||||||||||||||
| (1) | excludes merger targets |
| Source : SNL Financial LC, Charlottesville, VA | ||
| Copyright 2017 | www.snl.com |
The other information regarding Horizon's common stock, including the approximate number of holders of the common stock, is included under the caption "Horizon's Common Stock and Related Stockholders Matters" in Item 8 below, which is incorporated by reference.
ITEM 6. SELECTED FINANCIAL DATA
The information required under this item is incorporated by reference to the information appearing under the caption "Summary of Selected Financial Data" in Item 8 of this Form 10-K.
33
H ORIZON B ANCORP AND S UBSIDIARIES
Management's Discussion and Analysis of
Financial Condition and Results of Operations
(Table dollars in thousands except per share data)
ITEM 7. MANAGEMENT'S DISCUSSION AND ANALYSIS OF FINANCIAL CONDITION AND RESULTS OF OPERATIONS
Overview
Horizon is a registered bank holding company incorporated in Indiana and headquartered in Michigan City, Indiana. Horizon provides a broad range of banking services in Northern and Central Indiana and Southwestern and Central Michigan through its bank subsidiary. Horizon operates as a single segment, which is commercial banking. Horizon's common stock is traded on the NASDAQ Global Select Market under the symbol HBNC. The Bank was chartered as a national banking association in 1873 and has operated continuously since that time. The Bank is a full-service commercial bank offering commercial and retail banking services, corporate and individual trust and agency services, and other services incident to banking. All share data included below has been adjusted to reflect Horizon's three-for-two stock splits paid on November 14, 2016, November 9, 2012 and December 9, 2011.
Following are some highlights of Horizon's financial performance during 2016:
| • | Net income for the year ending December 31, 2016 was $23.9 million or $1.19 diluted earnings per share compared to $20.5 million or $1.26 diluted earnings per share for the year ended December 31, 2015. |
| • | Excluding acquisition-related expenses, gain on sale of investment securities, the death benefit on bank owned life insurance, prepayment penalties and purchase accounting adjustments, net income for the year ending December 31, 2016 increased 34.5% to $29.2 million or $1.45 diluted earnings per share compared to $21.7 million or $1.33 diluted earnings per share for the year ended December 31, 2015. |
| • | Total loans increased 22.0% or $387.0 million during the year ended December 31, 2016. |
| • | Total loans, excluding acquired loans, mortgage warehouse loans and loans held for sale, increased 4.3% or $69.6 million during the year ended December 31, 2016. |
| • | Net interest income for the year ended December 31, 2016 increased 15.1% or $11.3 million compared to the year ended December 31, 2015. |
| • | Net interest margin was 2.92% for the fourth quarter of 2016 compared to 3.37% for the prior quarter and 3.50% for the same period in 2015. |
| • | Net interest margin, excluding the impact of the prepayment penalties on borrowings and purchase accounting adjustments ("core net interest margin"), was 3.45% for the fourth quarter of 2016 compared to 3.31% for the prior quarter and 3.38% for the same period in 2015. |
| • | Non-interest income for the year ended December 31, 2016 increased 24.9% or $7.6 million compared to the year ended December 31, 2015. |
| • | Horizon's tangible book value per share rose to $11.48 at December 31, 2016, compared to $11.02 at December 31, 2015. |
| • | The Bank's capital ratios, including Tier 1 Capital to Average Assets of 9.93% and Total Capital to Risk Weighted Assets of 13.98% as of December 31, 2016, continue to be well above the regulatory standards for well-capitalized banks. |
Critical Accounting Policies
The Notes to the Consolidated Financial Statements included in Item 8 of this Annual Report on Form 10-K for 2016 contain a summary of the Company's significant accounting policies. Certain of these policies are important to the portrayal of the Company's financial condition, since they require management to make difficult, complex or subjective judgments, some of which may relate to matters that are inherently uncertain. Management has identified the allowance for loan losses, goodwill and intangible assets, mortgage servicing rights, derivative instruments and valuation measurements as critical accounting policies.
34
H ORIZON B ANCORP AND S UBSIDIARIES
Management's Discussion and Analysis of
Financial Condition and Results of Operations
(Table dollars in thousands except per share data)
Allowance for Loan Losses
An allowance for loan losses is maintained to absorb probable incurred loan losses inherent in the loan portfolio. The determination of the allowance for loan losses is a critical accounting policy that involves management's ongoing quarterly assessments of the probable incurred losses inherent in the loan portfolio. The identification of loans that have probable incurred losses is subjective; therefore, a general reserve is maintained to cover all probable losses within the entire loan portfolio. Horizon utilizes a loan grading system that helps identify, monitor and address asset quality problems in an adequate and timely manner. Each quarter, various factors affecting the quality of the loan portfolio are reviewed. Large credits are reviewed on an individual basis for loss potential. Other loans are reviewed as a group based upon previous trends of loss experience. Horizon also reviews the current and anticipated economic conditions of its lending market as well as transaction risk to determine the effect they may have on the loss experience of the loan portfolio.
Acquired credit-impaired loans are accounted for under the accounting guidance for loans and debt securities acquired with deteriorated credit quality (FASB ASC 310-30) and initially measured at fair value, which includes estimated future credit losses expected to be incurred over the life of the loans. Accordingly, allowances for credit losses related to these loans are not carried over and recorded at the acquisition dates. Loans acquired through business combinations that do not meet the specific criteria of FASB ASC 310-30, but for which a discount is attributable, at least in part to the credit quality, are also accounted for under this guidance. As a result, related discounts are recognized subsequently through accretion based on the expected cash flows of the acquired loans. For purposes of applying FASB ASC 310-30, loans acquired in business combinations are aggregated into pools of loans with common risk characteristics.
Goodwill and Intangible Assets
Management believes that the accounting for goodwill and other intangible assets also involves a higher degree of judgment than most other significant accounting policies. FASB ASC 350-10 establishes standards for the amortization of acquired intangible assets and impairment assessment of goodwill. At December 31, 2016, Horizon had core deposit intangibles of $9.4 million subject to amortization and $76.9 million of goodwill, which is not subject to amortization. Goodwill arising from business combinations represents the value attributable to unidentifiable intangible assets in the business acquired. Horizon's goodwill relates to the value inherent in the banking industry and that value is dependent upon the ability of Horizon to provide quality, cost effective banking services in a competitive marketplace. The goodwill value is supported by revenue that is in part driven by the volume of business transacted. A decrease in earnings resulting from a decline in the customer base or the inability to deliver cost effective services over sustained periods can lead to impairment of goodwill that could adversely affect earnings in future periods. FASB ASC 350-10 requires an annual evaluation of goodwill for impairment. The evaluation of goodwill for impairment requires the use of estimates and assumptions. Market price at the close of business on December 30, 2016 was $28.00 per share compared to a tangible book value of $11.48 per common share. Horizon's return on average assets was 81 basis points for the year ending December 31, 2016.
Mortgage Servicing Rights
Servicing assets are recognized as separate assets when rights are acquired through purchase or through the sale of financial assets on a servicing-retained basis. Capitalized servicing rights are amortized into non-interest income in proportion to, and over the period of, the estimated future net servicing income of the underlying financial assets. Servicing assets are evaluated regularly for impairment based upon the fair value of the rights as compared to amortized cost. Impairment is determined by stratifying servicing rights by predominant characteristics, such as interest rates, original loan terms and whether the loans are fixed or adjustable rate mortgages. Fair value is determined using prices for similar assets with similar characteristics, when available, or based upon discounted cash flows using market-based assumptions. When the book value of an individual stratum exceeds its fair value, an impairment reserve is recognized so that each individual stratum is carried at the lower of its amortized book value or fair value. In periods of falling market interest rates, accelerated loan prepayment can adversely affect the fair value of these mortgage-servicing rights relative to their book value. In the event that the fair value of these assets was to increase in the future, Horizon can recognize the increased fair value to the extent of the impairment allowance but cannot recognize an asset in excess of its amortized book value.
35
H ORIZON B ANCORP AND S UBSIDIARIES
Management's Discussion and Analysis of
Financial Condition and Results of Operations
(Table dollars in thousands except per share data)
Future changes in management's assessment of the impairment of these servicing assets, as a result of changes in observable market data relating to market interest rates, loan prepayment speeds, and other factors, could impact Horizon's financial condition and results of operations either positively or negatively.
Generally, when market interest rates decline and other factors favorable to prepayments occur, there is a corresponding increase in prepayments as customers refinance existing mortgages under more favorable interest rate terms. When a mortgage loan is prepaid, the anticipated cash flows associated with servicing that loan are terminated, resulting in a reduction of the fair value of the capitalized mortgage servicing rights. To the extent that actual borrower prepayments do not react as anticipated by the prepayment model (i.e., the historical data observed in the model does not correspond to actual market activity), it is possible that the prepayment model could fail to accurately predict mortgage prepayments and could result in significant earnings volatility. To estimate prepayment speeds, Horizon utilizes a third-party prepayment model, which is based upon statistically derived data linked to certain key principal indicators involving historical borrower prepayment activity associated with mortgage loans in the secondary market, current market interest rates and other factors, including Horizon's own historical prepayment experience. For purposes of model valuation, estimates are made for each product type within the mortgage servicing rights portfolio on a monthly basis. In addition, on a quarterly basis Horizon engages a third party to independently test the value of its servicing asset.
Derivative Instruments
As part of the Company's asset/liability management program, Horizon utilizes, from time-to-time, interest rate floors, caps or swaps to reduce the Company's sensitivity to interest rate fluctuations. These are derivative instruments, which are recorded as assets or liabilities in the consolidated balance sheets at fair value. Changes in the fair values of derivatives are reported in the consolidated income statements or other comprehensive income ("OCI") depending on the use of the derivative and whether the instrument qualifies for hedge accounting. The key criterion for the hedge accounting is that the hedged relationship must be highly effective in achieving offsetting changes in those cash flows that are attributable to the hedged risk, both at inception of the hedge and on an ongoing basis.
Horizon's accounting policies related to derivatives reflect the guidance in FASB ASC 815-10. Derivatives that qualify for the hedge accounting treatment are designated as either: a hedge of the fair value of the recognized asset or liability or of an unrecognized firm commitment (a fair value hedge) or a hedge of a forecasted transaction or the variability of cash flows to be received or paid related to a recognized asset or liability (a cash flow hedge). For fair value hedges, the cumulative change in fair value of both the hedge instruments and the underlying loans is recorded in non-interest income. For cash flow hedges, changes in the fair values of the derivative instruments are reported in OCI to the extent the hedge is effective. The gains and losses on derivative instruments that are reported in OCI are reflected in the consolidated income statement in the periods in which the results of operations are impacted by the variability of the cash flows of the hedged item. Generally, net interest income is increased or decreased by amounts receivable or payable with respect to the derivatives, which qualify for hedge accounting. At inception of the hedge, Horizon establishes the method it uses for assessing the effectiveness of the hedging derivative and the measurement approach for determining the ineffective aspect of the hedge. The ineffective portion of the hedge, if any, is recognized currently in the consolidated statements of income. Horizon excludes the time value expiration of the hedge when measuring ineffectiveness.
Valuation Measurements
Valuation methodologies often involve a significant degree of judgment, particularly when there are no observable active markets for the items being valued. Investment securities, residential mortgage loans held for sale and derivatives are carried at fair value, as defined in FASB ASC 820, which requires key judgments affecting how fair value for such assets and liabilities is determined. In addition, the outcomes of valuations have a direct bearing on the carrying amounts of goodwill, mortgage servicing rights, and pension and other post-retirement benefit obligations. To determine the values of these assets and liabilities, as well as the extent, to which related assets may be impaired, management makes assumptions and estimates related to discount rates, asset returns, prepayment speeds and other factors. The use of different discount rates or other valuation assumptions could produce significantly different results, which could affect Horizon's results of operations.
36
H ORIZON B ANCORP AND S UBSIDIARIES
Management's Discussion and Analysis of
Financial Condition and Results of Operations
(Table dollars in thousands except per share data)
Analysis of Financial Condition
Horizon's total assets were $3.1 billion as of December 31, 2016, an increase of $488.8 million from December 31, 2015.
Investment Securities
Investment securities totaled $633.0 million at December 31, 2016, and consisted of Treasury and federal agency securities of $8.0 million (1.3%); state and municipal securities of $282.2 million (44.6%); federal agency mortgage-backed pools of $197.8 million and federal agency collateralized mortgage obligations of $143.7 million (53.9%); and corporate securities of $1.3 million (0.2%).
As indicated above, 53.9% of the investment portfolio consists of mortgage-backed securities and collateralized mortgage obligations. These instruments are secured by residential mortgages of varying maturities. Principal and interest payments are received monthly as the underlying mortgages are repaid. These payments also include prepayments of mortgage balances as borrowers either sell their homes or refinance their mortgages. Therefore, mortgage-backed securities and collateralized mortgage obligations have maturities that are stated in terms of average life. The average life is the average amount of time that each dollar of principal is expected to be outstanding. As of December 31, 2016, the mortgage-backed securities and collateralized mortgage obligations in the investment portfolio had an average duration of 3.75 years. Securities that have interest rates above current market rates are purchased at a premium. Management monitors these investments periodically for other than temporary impairment by obtaining and reviewing the underlying collateral details and has concluded at December 31, 2016, any unrealized loss is temporary and that the Company has the intent and ability to hold these investments to maturity.
Available-for-sale municipal securities are priced by a third party using a pricing grid which estimates prices based on recent sales of similar securities. All municipal securities are investment grade or local non-rated issues and management does not believe there is other than temporary deterioration in market value. A credit review is performed annually on the municipal securities portfolio.
At December 31, 2016, 69.5% and at December 31, 2015, 70.3% of investment securities were classified as available for sale. Securities classified as available for sale are carried at their fair value, with both unrealized gains and losses recorded, net of tax, directly to stockholders' equity. Net depreciation on these securities totaled $6.0 million, which resulted in a balance of $3.9 million, net of tax, included in stockholders' equity at December 31, 2016. This compared to $598,000, net of tax, included in stockholders' equity at December 31, 2015.
Fair value is defined as the price that would be received to sell an asset or paid to transfer a liability in an orderly transaction between market participants at the measurement date. A fair value hierarchy is also established which requires an entity to maximize the use of observable and minimize the use of unobservable inputs. There are three levels of inputs that may be used to measure fair value:
| Level 1 | Quoted prices in active markets for identical assets or liabilities. | |
| Level 2 | Observable inputs other than Level 1 prices, such as quoted prices for similar assets or liabilities; quoted prices in markets that are not active; or other inputs that are observable or can be corroborated by observable market data for substantially the full term of the assets or liabilities. | |
| Level 3 | Unobservable inputs that are supported by little or no market activity and that are significant to the fair value of the assets or liabilities. |
When quoted market prices are available in an active market, securities are classified within Level 1 of the valuation hierarchy. There are no Level 1 securities. If quoted market prices are not available, then fair values are estimated by using pricing models, quoted prices of securities with similar characteristics or discounted cash flows. Level 2 securities include U.S. Treasury and Federal agency securities, State and municipal securities, Federal agency collateralized mortgage obligations, Federal agency mortgage-backed pools and corporate notes. For Level 2 securities, Horizon uses a third party service to determine fair value. In performing the valuations, the pricing service relies on models that consider security-specific
37
H ORIZON B ANCORP AND S UBSIDIARIES
Management's Discussion and Analysis of
Financial Condition and Results of Operations
(Table dollars in thousands except per share data)
details as well as relevant industry and economic factors. The most significant of these inputs are quoted market prices, interest rate spreads on relevant benchmark securities and certain prepayment assumptions. To verify the reasonableness of the fair value determination by the service, Horizon has a portion of the Level 2 securities priced by an independent securities broker-dealer.
Unrealized gains and losses on available-for-sale securities, deemed temporary, are recorded, net of income tax, in a separate component of other comprehensive income on the balance sheet. No unrealized losses were deemed to be "other-than-temporary."
As a member of the Federal Reserve and Federal Home Loan Bank systems, Horizon is required to maintain an investment in the common stock of each entity. The investment in common stock is based on a predetermined formula. At December 31, 2016, Horizon had investments in the common stock of the Federal Reserve and Federal Home Loan Banks totaling $23.9 million and at December 31, 2015, investments totaled $13.8 million.
At December 31, 2016, Horizon did not maintain a trading account.
For more information about securities, see Note 4 - Securities to the Consolidated Financial Statements at Item 8.
Loans
Total loans, net of deferred fees/costs, the principal earning asset of the Bank, were $2.1 billion at December 31, 2016. The current level of total loans increased 22.1% from the December 31, 2015, level of $1.7 billion. The table below provides comparative detail on the loan categories.
| December 31 2016 | December 31 2015 | Dollar Change | Percent Change | |||||||||||||
Commercial | ||||||||||||||||
Working capital and equipment | $ | 539,403 | $ | 381,245 | $ | 158,158 | 41.5 | % | ||||||||
Real estate, including agriculture | 485,620 | 391,668 | 93,952 | 24.0 | % | |||||||||||
Tax exempt | 15,486 | 8,674 | 6,812 | 78.5 | % | |||||||||||
Other | 29,447 | 23,408 | 6,039 | 25.8 | % | |||||||||||
|
|
|
|
|
| |||||||||||
Total | 1,069,956 | 804,995 | 264,961 | 32.9 | % | |||||||||||
Real estate | ||||||||||||||||
1–4 family | 526,024 | 433,015 | 93,009 | 21.5 | % | |||||||||||
Other | 5,850 | 4,129 | 1,721 | 41.7 | % | |||||||||||
|
|
|
|
|
| |||||||||||
Total | 531,874 | 437,144 | 94,730 | 21.7 | % | |||||||||||
Consumer | ||||||||||||||||
Auto | 174,773 | 168,397 | 6,376 | 3.8 | % | |||||||||||
Recreation | 5,669 | 5,365 | 304 | 5.7 | % | |||||||||||
Real estate/home improvement | 53,898 | 47,015 | 6,883 | 14.6 | % | |||||||||||
Home equity | 144,508 | 127,113 | 17,395 | 13.7 | % | |||||||||||
Unsecured | 3,875 | 4,120 | (245 | ) | -5.9 | % | ||||||||||
Other | 15,706 | 10,290 | 5,416 | 52.6 | % | |||||||||||
|
|
|
|
|
| |||||||||||
Total | 398,429 | 362,300 | 36,129 | 10.0 | % | |||||||||||
Mortgage warehouse | 135,727 | 144,692 | (8,965 | ) | -6.2 | % | ||||||||||
|
|
|
|
|
| |||||||||||
Total loans | 2,135,986 | 1,749,131 | 386,855 | 22.1 | % | |||||||||||
Allowance for loan losses | (14,837 | ) | (14,534 | ) | (303 | ) | ||||||||||
|
|
|
|
|
| |||||||||||
Loans, net | $ | 2,121,149 | $ | 1,734,597 | $ | 386,552 | ||||||||||
|
|
|
|
|
| |||||||||||
38
H ORIZON B ANCORP AND S UBSIDIARIES
Management's Discussion and Analysis of
Financial Condition and Results of Operations
(Table dollars in thousands except per share data)
The acceptance and management of credit risk is an integral part of the Bank's business as a financial intermediary. The Bank has established underwriting standards including a policy that monitors the lending function through strict administrative and reporting requirements as well as an internal loan review of consumer and small business loans. The Bank also uses an independent third-party loan review function that regularly reviews asset quality.
Changes in the mix of the loan portfolio averages are shown in the following table.
| December 31 2016 | December 31 2015 | December 31 2014 | ||||||||||
Commercial | $ | 918,844 | $ | 743,175 | $ | 620,809 | ||||||
Real estate | 497,337 | 368,653 | 234,335 | |||||||||
Mortgage warehouse | 159,588 | 138,137 | 95,070 | |||||||||
Consumer | 372,811 | 343,825 | 297,296 | |||||||||
|
|
|
|
|
| |||||||
Total average loans | $ | 1,948,580 | $ | 1,593,790 | $ | 1,247,510 | ||||||
|
|
|
|
|
| |||||||
Commercial Loans
Commercial loans totaled $1.1 billion, or 50.1% of total loans as of December 31, 2016, compared to $805.0 million, or 46.0% as of December 31, 2015. The increase during 2016 was primarily related to the $226.0 million of commercial loans acquired in the Kosciusko, LaPorte and CNB acquisitions along with organic growth of $38.9 million net of principal reductions from payments.
Commercial loans consisted of the following types of loans at December 31:
| December 31, 2016 | December 31, 2015 | |||||||||||||||||||||||
| Number | Amount | Percent of Portfolio | Number | Amount | Percent of Portfolio | |||||||||||||||||||
SBA guaranteed loans | 295 | $ | 61,503 | 5.7 | % | 251 | $ | 54,549 | 6.8 | % | ||||||||||||||
Municipal government | 1 | 344 | 0.0 | % | 1 | 447 | 0.1 | % | ||||||||||||||||
Lines of credit | 1,106 | 192,178 | 18.0 | % | 927 | 153,080 | 19.0 | % | ||||||||||||||||
Real estate and equipment term loans | 2,559 | 815,931 | 76.3 | % | 1,834 | 596,919 | 74.2 | % | ||||||||||||||||
|
|
|
|
|
|
|
|
|
|
|
| |||||||||||||
Total | 3,961 | $ | 1,069,956 | 100.0 | % | 3,013 | $ | 804,995 | 100.0 | % | ||||||||||||||
|
|
|
|
|
|
|
|
|
|
|
| |||||||||||||
Fixed rate term loans with a book value of $122.4 million and a fair value of $122.3 million have been swapped to a variable rate using derivative instruments. The loans are carried at fair value in the financial statements and the related swap is carried at fair value and is included with other liabilities in the balance sheet. The recognition of the loan and swap fair values are recorded in the income statement and for 2016 equally offset each other. Fair values are determined by the counter party using a proprietary model that uses live market inputs to value interest rate swaps. The model is subject to daily market tests as current and future positions are priced and valued. These are Level 3 inputs under the fair value hierarchy as described above.
At December 31, 2016, the commercial loan portfolio held $106.4 million of adjustable rate loans that had interest rate floors in the terms of the note. Of the commercial loans with interest rate floors, loans totaling $79.1 million were at their floor at December 31, 2016.
Residential Real Estate Loans
Residential real estate loans totaled $531.9 million or 24.9% of total loans as of December 31, 2016, compared to $437.1 million or 25.0% of total loans as of December 31, 2015. This category consists of home mortgages that generally require a loan to value of no more than 80%. Some special guaranteed or insured real estate loan programs do permit a higher loan to collateral value ratio. The increase during 2016 was primarily related to the $75.5 million of real estate loans acquired in the Kosciusko, LaPorte and CNB acquisitions along with organic growth of $19.3 million net of principal reductions from payments.
39
H ORIZON B ANCORP AND S UBSIDIARIES
Management's Discussion and Analysis of
Financial Condition and Results of Operations
(Table dollars in thousands except per share data)
In addition to the customary real estate loans described above, the Bank also had outstanding on December 31, 2016, $144.5 million in home equity lines of credit compared to $127.1 million at December 31, 2015. Credit lines normally limit the loan to collateral value to no more than 89%. Home equity credit lines are primarily not combined with a first mortgage and are therefore evaluated in the allowance for loan losses as a separate pool. These loans are classified as consumer loans in the table above and in Note 5 of the Consolidated Financial Statements at Item 8.
Residential real estate lending is a highly competitive business. As of December 31, 2016, the real estate loan portfolio reflected a wide range of interest rates and repayment patterns, but could generally be categorized as follows:
| December 31, 2016 | December 31, 2015 | |||||||||||||||||||||||
| (dollars in thousands) | Amount | Percent of Portfolio | Yield | Amount | Percent of Portfolio | Yield | ||||||||||||||||||
Fixed rate | ||||||||||||||||||||||||
Monthly payment | $ | 136,292 | 25.6 | % | 4.25 | % | $ | 114,035 | 26.1 | % | 4.20 | % | ||||||||||||
Biweekly payment | 104 | 0.0 | % | 6.27 | % | 151 | 0.0 | % | 6.20 | % | ||||||||||||||
Adjustable rate | ||||||||||||||||||||||||
Monthly payment | 395,478 | 74.4 | % | 3.77 | % | 322,959 | 73.9 | % | 3.84 | % | ||||||||||||||
Biweekly payment | - | 0.0 | % | 0.00 | % | - | 0.0 | % | 0.00 | % | ||||||||||||||
|
|
|
|
|
|
|
| |||||||||||||||||
Sub total | 531,874 | 100.0 | % | 3.89 | % | 437,145 | 100.0 | % | 3.93 | % | ||||||||||||||
|
|
|
| |||||||||||||||||||||
Loans held for sale | 8,087 | 7,917 | ||||||||||||||||||||||
|
|
|
| |||||||||||||||||||||
Total real estate loans | $ | 539,961 | $ | 445,062 | ||||||||||||||||||||
|
|
|
| |||||||||||||||||||||
The increase in fixed and adjustable rate residential mortgage loans during 2016 was primarily due to the real estate loans acquired in the Kosciusko, LaPorte and CNB acquisitions as well as organic growth. In addition to the real estate loan portfolio, the Bank originates and sells real estate loans and retains the servicing rights. During 2016 and 2015, approximately $316.9 million and $302.4 million, respectively, of residential mortgages were sold into the secondary market. Loans serviced for others are not included in the consolidated balance sheets. The unpaid principal balances of loans serviced for others totaled approximately $1.3 billion and $1.2 billion at December 31, 2016 and 2015.
The aggregate fair value of capitalized mortgage servicing rights at December 31, 2016, totaled approximately $12.1 million compared to the carrying value of $11.2 million. Comparable market values and a valuation model that calculates the present value of future cash flows were used to estimate fair value. For purposes of measuring impairment, risk characteristics including product type, investor type and interest rates, were used to stratify the originated mortgage servicing rights.
| December 31 2016 | December 31 2015 | December 31 2014 | ||||||||||
Mortgage servicing rights | ||||||||||||
Balances, January 1 | $ | 9,271 | $ | 7,980 | $ | 7,428 | ||||||
Servicing rights capitalized | 3,426 | 2,974 | 2,280 | |||||||||
Amortization of servicing rights | (1,016 | ) | (1,683 | ) | (1,728 | ) | ||||||
|
|
|
|
|
| |||||||
Balances, December 31 | 11,681 | 9,271 | 7,980 | |||||||||
|
|
|
|
|
| |||||||
Impairment allowance | ||||||||||||
Balances, January 1 | (397 | ) | (338 | ) | (389 | ) | ||||||
Additions | (236 | ) | (130 | ) | (95 | ) | ||||||
Reductions | 126 | 71 | 146 | |||||||||
|
|
|
|
|
| |||||||
Balances, December 31 | (507 | ) | (397 | ) | (338 | ) | ||||||
|
|
|
|
|
| |||||||
Mortgage servicing rights, net | $ | 11,174 | $ | 8,874 | $ | 7,642 | ||||||
|
|
|
|
|
| |||||||
40
H ORIZON B ANCORP AND S UBSIDIARIES
Management's Discussion and Analysis of
Financial Condition and Results of Operations
(Table dollars in thousands except per share data)
Mortgage Warehouse Loans
Horizon's mortgage warehousing lending has specific mortgage companies as customers of Horizon Bank. Individual mortgage loans originated by these mortgage companies are funded as a secured borrowing with pledge of collateral under Horizon's agreement with the mortgage company. Each individual mortgage and the related mortgagee are underwritten by Horizon to the end investor guidelines and assigned to Horizon until the loan is sold to the secondary market by the mortgage company. In addition, Horizon takes possession of each original note and forwards such note to the end investor once the mortgage company has sold the loan. At the time a loan is transferred to the secondary market, the mortgage company repurchases the loan under its option within the agreement. Due to the repurchase feature contained in the agreement, the transaction does not qualify as a sale and therefore is accounted for as a secured borrowing with pledge of collateral pursuant to the agreement with the mortgage company. When the individual loan is sold to the end investor by the mortgage company the proceeds from the sale of the loan are received by Horizon and used to pay off the loan balance with Horizon along with any accrued interest and any related fees. The remaining balance from the sale is forwarded to the mortgage company. These individual loans typically are sold by the mortgage company within 30 days and are seldom held more than 90 days. Interest income is accrued during this period and collected at the time each loan is sold. Fee income for each loan sold is collected when the loan is sold and no costs are deferred due to the term between each loan funding and related payoff, which is typically less than 30 days.
Based on the agreements with each mortgage company, at any time a mortgage company can repurchase from Horizon its outstanding loan balance on an individual mortgage and regain possession of the original note. Horizon also has the option to request that the mortgage company repurchase an individual mortgage. Should this occur, Horizon would return the original note and reassign the assignment of the mortgage to the mortgage company. Also, in the event that the end investor would not be able to honor the sales commitment and the mortgage company would not be able to repurchase its loan on an individual mortgage, Horizon would be able to exercise its rights under the agreement.
At December 31, 2016, the mortgage warehouse loan balance was $135.7 million compared to $144.7 million as of December 31, 2015. The decrease in mortgage warehouse loans reflected an increase in long-term interest rates in 2016 and the lower refinance volume.
Consumer Loans
Consumer loans totaled $398.4 million, or 18.7% of total loans as of December 31, 2016, compared to $362.3 million, or 20.7% as of December 31, 2015. The increase during 2016 was primarily related to the $24.7 million of consumer loans acquired in the Kosciusko, LaPorte and CNB acquisitions along with organic growth of $11.4 million net of principal reductions from payments.
Allowance and Provision for Loan Losses/Critical Accounting Policy
At December 31, 2016, the allowance for loan losses was $14.8 million, or 0.69% of total loans outstanding, compared to $14.5 million, or 0.83% at December 31, 2015. The decrease in the ratio was primarily due to an increase in total loans from both organic growth and the Kosciusko, LaPorte and CNB acquisitions. During 2016, the expense for provision for loan losses totaled $1.8 million compared to $3.2 million in 2015. Horizon's loan loss reserve ratio, excluding loans with credit-related purchase accounting adjustments, was 0.91% as of December 31, 2016.
Horizon assesses the adequacy of its Allowance for Loan and Lease Losses (ALLL) by regularly reviewing the performance of all of its loan portfolios. As a result of its quarterly reviews, a provision for loan losses is determined to bring the total ALLL to a level called for by the analysis.
No assurance can be given that Horizon will not, in any particular period, sustain loan losses that are significant in relation to the amount reserved, or that subsequent evaluations of the loan portfolio, in light of factors then prevailing, including economic conditions and management's ongoing quarterly assessments of the portfolio, will not require increases in the allowance for loan losses. Horizon considers the allowance for loan losses to be adequate to cover losses inherent in the loan portfolio as of December 31, 2016.
41
H ORIZON B ANCORP AND S UBSIDIARIES
Management's Discussion and Analysis of
Financial Condition and Results of Operations
(Table dollars in thousands except per share data)
Non-performing Loans
Non-performing loans are defined as loans that are greater than 90 days delinquent or have had the accrual of interest discontinued by management. Management continues to work diligently toward returning non-performing loans to an earning asset basis. Non-performing loans for the previous three years ending December 31 are as follows:
| December 31 2016 | December 31 2015 | December 31 2014 | ||||||||||
Non-performing loans | $ | 10,683 | $ | 16,680 | $ | 22,442 | ||||||
Non-performing loans total 72.0%, 114.8% and 136.0% of the allowance for loan losses at December 31, 2016, 2015 and 2014, respectively. Non-performing loans at December 31, 2016 totaled $10.7 million, a decrease from a balance of $16.7 million as of December 31, 2015 and $22.4 million as of December 31, 2014. Non-performing loans as a percentage of total loans was 0.50% as of December 31, 2016, a decrease from 0.95% and 1.62% as of December 31, 2015 and December 31, 2014, respectively.
A loan becomes impaired when, based on current information, it is probable that a creditor will be unable to collect all amounts due according to the contractual terms of the loan agreement. When a loan is classified as impaired, the degree of impairment must be recognized by estimating future cash flows from the debtor. The present value of these cash flows is computed at a discount rate based on the interest rate contained in the loan agreement. However, if a particular loan has a determinable market value, the creditor may use that value. Also, if the loan is secured and considered collateral dependent, the creditor may use the fair value of the collateral. (See Note 8 of the Consolidated Financial Statements at Item 8 for further discussion of impaired loans.)
Smaller-balance, homogeneous loans are evaluated for impairment in total. Such loans include residential first mortgage loans secured by 1 – 4 family residences, residential construction loans, automobile, home equity, second mortgage loans and mortgage warehouse loans. Commercial loans and mortgage loans secured by other properties are evaluated individually for impairment. When analysis of borrower operating results and financial condition indicate that underlying cash flows of a borrower's business are not adequate to meet its debt service requirements, the loan is evaluated for impairment. Often this is associated with a delay or shortfall in payments of 30 days or more. Loans are generally moved to non-accrual status when 90 days or more past due. These loans are often considered impaired. Impaired loans, or portions thereof, are charged off when deemed uncollectible.
Other Real Estate Owned (OREO) net of any related allowance for OREO losses for the previous three years ending December 31 were as follows:
| December 31 2016 | December 31 2015 | December 31 2014 | ||||||||||
Other real estate owned | $ | 3,190 | $ | 3,207 | $ | 1,047 | ||||||
OREO totaled $3.2 million on December 31, 2016, a decrease of $17,000 from December 31, 2015 and an increase of $2.1 million from December 31, 2014. On December 31, 2016, OREO was comprised of nine properties. Of these properties, three totaling $542,000 were commercial real estate and six totaling $2.6 million were residential real estate.
No mortgage warehouse loans were non-performing or OREO as of December 31, 2016, 2015 or 2014.
42
H ORIZON B ANCORP AND S UBSIDIARIES
Management's Discussion and Analysis of
Financial Condition and Results of Operations
(Table dollars in thousands except per share data)
Deferred Tax
Horizon had a net deferred tax asset totaling $7.4 million and $5.2 million as of December 31, 2016 and December 31, 2015, respectively. The following table shows the major components of deferred tax:
| December 31 2016 | December 31 2015 | |||||||
Assets | ||||||||
Allowance for loan losses | $ | 5,581 | $ | 5,329 | ||||
Net operating loss (from acquisitions) | 2,368 | 1,679 | ||||||
Director and employee benefits | 3,124 | 2,223 | ||||||
Unrealized loss on AFS securities and fair value hedge | 937 | 711 | ||||||
Accrued Pension | 1,323 | 1,725 | ||||||
Fair value adjustment on acquisitions | 2,340 | 756 | ||||||
Other | 1,593 | 273 | ||||||
|
|
|
| |||||
Total assets | 17,266 | 12,696 | ||||||
|
|
|
| |||||
Liabilities | ||||||||
Depreciation | (1,916 | ) | (2,180 | ) | ||||
State tax | (341 | ) | (192 | ) | ||||
Federal Home Loan Bank stock dividends | (474 | ) | (343 | ) | ||||
Difference in basis of intangible assets | (4,654 | ) | (2,938 | ) | ||||
FHLB Penalty | - | (123 | ) | |||||
Unrealized gain on securities available for sale | - | - | ||||||
Other | (431 | ) | (264 | ) | ||||
|
|
|
| |||||
Total liabilities | (7,816 | ) | (6,040 | ) | ||||
Valuation allowance | (2,018 | ) | (1,407 | ) | ||||
|
|
|
| |||||
Net deferred tax asset | $ | 7,432 | $ | 5,249 | ||||
|
|
|
| |||||
Deposits
The primary source of funds for the Bank comes from the acceptance of demand and time deposits. However, at times the Bank will use its ability to borrow funds from the Federal Home Loan Bank and other sources when it can do so at interest rates and terms that are more favorable than those required for deposited funds or loan demand is greater than the ability to grow deposits. Total deposits were $2.5 billion at December 31, 2016, compared to $1.9 billion at December 31, 2015. Average deposits and rates by category for the three years ended December 31 are as follows:
| Average Balance Outstanding for the Year Ending December 31 | Average Rate Paid for the Year Ending December 31 | |||||||||||||||||||||||
| 2016 | 2015 | 2014 | 2016 | 2015 | 2014 | |||||||||||||||||||
Noninterest-bearing demand deposits | $ | 417,900 | $ | 314,840 | $ | 258,523 | ||||||||||||||||||
Interest-bearing demand deposits | 732,117 | 671,493 | 582,916 | 0.12 | % | 0.12 | % | 0.12 | % | |||||||||||||||
Savings deposits | 303,229 | 191,593 | 142,420 | 0.06 | % | 0.05 | % | 0.05 | % | |||||||||||||||
Money market | 254,453 | 205,119 | 161,146 | 0.26 | % | 0.24 | % | 0.23 | % | |||||||||||||||
Time deposits | 462,527 | 344,464 | 296,349 | 1.06 | % | 1.21 | % | 1.39 | % | |||||||||||||||
|
|
|
|
|
| |||||||||||||||||||
Total deposits | $ | 2,170,226 | $ | 1,727,509 | $ | 1,441,354 | ||||||||||||||||||
|
|
|
|
|
| |||||||||||||||||||
43
H ORIZON B ANCORP AND S UBSIDIARIES
Management's Discussion and Analysis of
Financial Condition and Results of Operations
(Table dollars in thousands except per share data)
The $442.7 million increase in average deposits during 2016 was the result of an increase in the depositor base due to organic growth as well as the Kosciusko, LaPorte and CNB acquisitions. The transactional accounts average balances, as the lower cost funding sources, increased $343.5 million and the average balances for higher cost time deposits increased $115.5 million. Horizon continually enhances its interest-bearing consumer and commercial demand deposit products based on local market conditions and its need for funding to support various types of assets.
Certificates of deposit of $250,000 or more, which are considered to be rate sensitive and are not considered a part of core deposits, mature as follows as of December 31, 2016:
Due in three months or less | $ | 17,713 | ||
Due after three months through six months | 30,304 | |||
Due after six months through one year | 25,412 | |||
Due after one year | 31,932 | |||
|
| |||
| $ | 105,361 | |||
|
|
Interest expense on time certificates of $100,000 or more was approximately $2.1 million, $2.3 million, and $2.2 million for 2016, 2015 and 2014. Interest expense on time certificates of $250,000 or more was approximately $753,000 and $990,000 for 2016 and 2015.
Off-Balance Sheet Arrangements
As of December 31, 2016, Horizon did not have any off-balance sheet arrangements that have or are reasonably likely to have a current or future effect on the Company's financial condition, change in financial condition, revenues or expenses, results of operations, liquidity, capital expenditures or capital resources that are material to investors. The term "off-balance sheet arrangement" generally means any transaction, agreement, or other contractual arrangement to which an entity unconsolidated with the Company is a party and under which the Company has (i) any obligation arising under a guarantee contract, derivative instrument or variable interest; or (ii) a retained or contingent interest in assets transferred to such entity or similar arrangement that serves as credit, liquidity or market risk support for such assets.
Contractual Obligations
The following tables summarize Horizon's contractual obligations and other commitments to make payments as of December 31, 2016:
| Total | Within One Year | One to Three Years | Three to Five Years | After Five Years | ||||||||||||||||
Certificates of Deposit | $ | 475,843 | $ | 257,071 | $ | 149,172 | $ | 47,380 | $ | 22,220 | ||||||||||
Borrowings (1) | 267,489 | 203,610 | 55,285 | 8,164 | 430 | |||||||||||||||
Subordinated debentures (2) | 37,456 | - | - | - | 37,456 | |||||||||||||||
| (1) | Includes debt obligations to the Federal Home Loan Bank and term repurchase agreements with maturities beyond one year borrowed by Horizon's banking subsidiary. See Note 13 in Horizon's Consolidated Financial Statements at Item 8. |
| (2) | Includes Trust Preferred Capital Securities issued by Horizon Statutory Trusts II and III and those assumed in the acquisitions of Alliance Bank in 2005, American Trust in 2009, Heartland in 2012 and City Savings in 2016. See Note 15 in Horizon's Consolidated Financial Statements at Item 8. |
| Expiration by Period | ||||||||
| Within One Year | Greater Than One Year | |||||||
Letters of credit | $ | 2 | $ | 967 | ||||
Unfunded loan commitments | 254,063 | 554,236 | ||||||
44
H ORIZON B ANCORP AND S UBSIDIARIES
Management's Discussion and Analysis of
Financial Condition and Results of Operations
(Table dollars in thousands except per share data)
Capital Resources
The capital resources of Horizon and the Bank exceed regulatory capital ratios for "well capitalized" banks at December 31, 2016. Stockholders' equity totaled $340.9 million as of December 31, 2016, compared to $266.8 million as of December 31, 2015. At year-end 2016, the ratio of stockholders' equity to assets was 10.85%, compared to 10.06% for 2015. Tangible equity to tangible assets was 8.33% at December 31, 2016, compared to 7.60% at December 31, 2015. Book value per common share at December 31, 2016 increased to $15.37, compared to $14.20 at December 31, 2015. Horizon's capital increased during 2016 as a result of earnings and common stock issued in acquisitions, partially offset by a decrease in other comprehensive income and dividends declared.
In 2008, in connection with the issuance of preferred stock that was subsequently redeemed, Horizon issued a warrant to the Treasury to purchase shares of Horizon's common stock. The Treasury sold the warrant to a third party, and at December 31, 2015, the warrant covered 481,510 shares with an exercise price of $7.79 per share. These warrants were exercised during 2015.
On August 25, 2011, the Company sold 12,500 shares of Series B Preferred Stock for aggregate consideration of $12.5 million, to the Treasury pursuant to the Small Business Lending Fund program. Concurrently with this transaction, Horizon redeemed all 18,750 shares of our Series A Preferred Stock that remained outstanding under the Treasury's Capital Purchase Program. The redemption of the Series A Preferred Stock was funded by the $12.5 million in proceeds from the sale of the Series B Preferred Stock together with other available funds. On February 1, 2016 the Company redeemed all 12,500 shares of Series B Preferred Stock for $12,500,000 along with the final dividend payment of $10,417.
Horizon declared dividends in the amount of $0.41 per share in 2016, $0.39 per share in 2015, and $0.34 per share in 2014. The dividend payout ratio (dividends as a percent of net income) was 34.3% for 2016, 29.9% for 2015, and 25.7% for 2014. For additional information regarding dividend conditions, see Note 1 of the Notes to the Consolidated Financial Statements at Item 8.
In October of 2004, Horizon formed Horizon Statutory Trust II ("Trust II"), a wholly owned statutory business trust. Trust II sold $10.3 million of Trust Preferred Capital Securities as a participant in a pooled trust preferred securities offering. The proceeds from the sale of the trust preferred securities were used by the trust to purchase an equivalent amount of junior subordinated debentures from Horizon. The junior subordinated debentures are the sole assets of Trust II and are fully and unconditionally guaranteed by Horizon. The junior subordinated debentures and the trust preferred securities pay interest and dividends on a quarterly basis. The junior subordinated debentures and the securities bear interest at a rate of 90-day LIBOR plus 1.95% (2.95% at December 31, 2016) and mature on October 21, 2034, and securities may be called at any quarterly interest payment date at par.
In December of 2006, Horizon formed Horizon Bancorp Capital Trust III ("Trust III"), a wholly owned statutory business trust. Trust III sold $12.4 million of Trust Preferred Capital Securities as a participant in a pooled trust preferred securities offering. The proceeds from the sale of the trust preferred securities were used by the trust to purchase an equivalent amount of junior subordinated debentures from Horizon. The junior subordinated debentures are the sole assets of Trust III and are fully and unconditionally guaranteed by Horizon. The junior subordinated debentures and the trust preferred securities pay interest and dividends on a quarterly basis. The junior subordinated debentures and the securities bear interest at a rate of 90-day LIBOR plus 1.65% (2.65% at December 31, 2016) and mature on January 30, 2037, and securities may be called at any quarterly interest payment date at par.
The Company assumed additional debentures as the result of the acquisition of Alliance Bank Corporation in 2005. In June 2004, Alliance formed Alliance Financial Statutory Trust I, a wholly owned business trust ("Alliance Trust") to sell $5.2 million in trust preferred securities. The proceeds from the sale of the trust preferred securities were used by the trust to purchase an equivalent amount of junior subordinated debentures from Alliance. The junior subordinated debentures are the sole assets of Alliance Trust and are fully and unconditionally guaranteed by Horizon. The junior subordinated debentures and the trust preferred securities pay interest and dividends on a quarterly basis. The junior subordinated debentures and the securities bear interest at a rate of 90-day LIBOR plus 2.65% (3.65% at December 31, 2016) and mature in June 2034, and securities may be called at any quarterly interest payment date at par.
45
H ORIZON B ANCORP AND S UBSIDIARIES
Management's Discussion and Analysis of
Financial Condition and Results of Operations
(Table dollars in thousands except per share data)
The Company assumed additional debentures as the result of the American Trust & Savings Bank purchase and assumption in 2010. In March 2004, Am Tru Inc., the holding company for American Trust & Savings Bank, formed Am Tru Statutory Trust I a wholly owned business trust ("Am Tru Trust"), to sell $3.5 million in trust preferred securities. The proceeds from the sale of the trust preferred securities were used by the trust to purchase an equivalent amount of junior subordinated debentures from Am Tru Inc. The junior subordinated debentures are the sole assets of Am Tru Trust and are fully and unconditionally guaranteed by Horizon. The junior subordinated debentures and the trust preferred securities pay interest and dividends on a quarterly basis. The junior subordinated debentures and the securities bear interest at a rate of 90-day LIBOR plus 2.85% (3.85% at December 31, 2016) and mature in March 2034, and securities may be called at any quarterly interest payment date at par. The carrying value was $3.2 million, net of the remaining purchase discount, at December 31, 2016.
The Company assumed additional debentures as the result of the Heartland merger in July 2013. In December 2006, Heartland formed Heartland (IN) Statutory Trust II a wholly owned business trust ("Heartland Trust"), to sell $3.0 million in trust preferred securities. The proceeds from the sale of the trust preferred securities were used by the trust to purchase an equivalent amount of junior subordinated debentures from Heartland. The junior subordinated debentures are the sole assets of Heartland Trust and are fully and unconditionally guaranteed by Horizon. The junior subordinated debentures and the trust preferred securities pay interest and dividends on a quarterly basis. The junior subordinated debentures and the securities bear interest at a rate of 90-day LIBOR plus 1.67% (2.67% at December 31, 2016) and mature in December 2036, and securities may be called at any quarterly interest payment date at par. The carrying value was $1.7 million, net of the remaining purchase discount, at December 31, 2016.
The Company assumed additional debentures as the result of the LaPorte merger in July 2016. In October 2007, LaPorte assumed debentures as the result of its acquisition of City Savings Financial Corporation ("City Savings"). In June 2003, City Savings formed City Savings Statutory Trust I a wholly owned business trust ("City Savings Trust"), to sell $5.0 million in trust preferred securities. The proceeds from the sale of the trust preferred securities were used by the trust to purchase an equivalent amount of subordinated debentures from City Savings. The junior subordinated debentures are the sole assets of City Savings Trust and are fully and unconditionally guaranteed by Horizon. The junior subordinated debentures and the trust preferred securities pay interest and dividends on a quarterly basis. The junior subordinated debentures and the securities bear interest at a rate of 90-day LIBOR plus 3.10% (4.10% at December 31, 2016) and mature in June 2033, and securities may be called at any quarterly interest payment date at par. The carrying value was $4.3 million, net of the remaining purchase discount, at December 31, 2016.
The Trust Preferred Capital Securities, subject to certain limitations, are included in Tier 1 Capital for regulatory purposes. Dividends on the Trust Preferred Capital Securities are recorded as interest expense.
Results of Operations
Net Income
Consolidated net income was $23.9 million or $1.19 per diluted share in 2016, $20.5 million or $1.26 per diluted share in 2015, and $18.1 million or $1.27 per diluted share in 2014. The increase in net income from the previous year reflects an increase in net interest income of $11.3 million, an increase in non-interest income of $7.6 million and a decrease in the provision for loan losses of $1.3 million, partially offset by an increase in non-interest expenses of $15.2 million and income taxes of $1.6 million. The decrease in diluted earnings per share compared to the previous year reflects an increase in diluted shares due to the Peoples, Kosciusko and LaPorte acquisitions. Excluding acquisition-related expenses, gain on sale of investment securities, the death benefit on bank owned life insurance, prepayment penalties on borrowings and purchase accounting adjustments, net income for the year ended December 31, 2016 was $29.2 million or $1.45 diluted earnings per share compared to $21.7 million or $1.33 diluted earnings per share for the year ended December 31, 2015. Diluted earnings per share were also reduced by $0.00 for the twelve months ending December 31, 2016, $0.01 for the twelve months ending December 31, 2015 and $0.01 for the twelve months ending December 31, 2014 resulting from the payment of preferred stock dividends.
46
H ORIZON B ANCORP AND S UBSIDIARIES
Management's Discussion and Analysis of
Financial Condition and Results of Operations
(Table dollars in thousands except per share data)
Net Interest Income
The largest component of net income is net interest income. Net interest income is the difference between interest income, principally from loans and investment securities, and interest expense, principally on deposits and borrowings. Changes in the net interest income are the result of changes in volume and the net interest spread which affects the net interest margin. Volume refers to the average dollar levels of interest-earning assets and interest-bearing liabilities. Net interest spread refers to the difference between the average yield on interest-earning assets and the average cost of interest-bearing liabilities. Net interest margin refers to net interest income divided by average interest-earning assets and is influenced by the level and relative mix of interest-earning assets and interest-bearing liabilities.
Net interest income during 2016 was $86.0 million, an increase of $11.3 million or 15.1% over the $74.7 million earned in 2015. Yields on the Company's interest-earning assets decreased by 15 basis points to 4.05% during 2016 from 4.20% in 2015. Interest income increased $17.9 million to $106.5 million for 2016 from $88.6 million in 2015. This increase was due to increased volume in interest-earning assets, partially offset by a decrease in the recognition of interest income from the acquisition-related purchase accounting adjustments of approximately $673,000 from $3.0 million in 2015 to $2.3 million in 2016 and the lower yield on interest-earning assets in 2016.
Rates paid on interest-bearing liabilities increased by 15 basis points during the same period due to the prepayment penalties on borrowings of $4.8 million in 2016. Interest expense increased $6.7 million from $13.9 million in 2015 to $20.5 million in 2016. This increase was due to increased volume of interest-bearing liabilities, partially offset by lower rates being paid. Due to the decrease in the yield on the Company's interest-earning assets and the prepayment penalties paid on borrowings, the net interest margin decreased 27 basis points from 3.56% for 2015 to 3.29% in 2016. Excluding the interest expense recognized from the prepayment penalties on borrowings and the interest income recognized from the acquisition-related purchase accounting adjustments, the margin would have been 3.38% for 2016 compared to 3.42% for 2015. Management believes that the current level of interest rates is driven by external factors and therefore impacts the results of the Company's net interest margin. Management does not expect significant increases in interest rates in the short term, but an increase in rates is expected at some time in the future due to the current historically low interest rate environment.
47
H ORIZON B ANCORP AND S UBSIDIARIES
Management's Discussion and Analysis of
Financial Condition and Results of Operations
(Table dollars in thousands except per share data)
Twelve Months Ended December 31, 2016 | Twelve Months Ended December 31, 2015 | Twelve Months Ended December 31, 2014 | ||||||||||||||||||||||||||||||||||
| Average Balance | Interest | Average Rate | Average Balance | Interest | Average Rate | Average Balance | Interest | Average Rate | ||||||||||||||||||||||||||||
ASSETS | ||||||||||||||||||||||||||||||||||||
Interest-earning assets | ||||||||||||||||||||||||||||||||||||
Federal funds sold | $ | 17,142 | $ | 95 | 0.55 | % | $ | 10,264 | $ | 11 | 0.11 | % | $ | 6,246 | $ | 11 | 0.18 | % | ||||||||||||||||||
Interest-earning deposits | 34,506 | 278 | 0.81 | % | 14,045 | 10 | 0.07 | % | 7,087 | 10 | 0.14 | % | ||||||||||||||||||||||||
Investment securities - taxable | 490,274 | 9,666 | 1.97 | % | 394,976 | 8,700 | 2.20 | % | 387,013 | 9,323 | 2.41 | % | ||||||||||||||||||||||||
Investment securities - non-taxable (1) | 192,881 | 4,921 | 3.59 | % | 152,931 | 4,494 | 4.32 | % | 146,407 | 4,426 | 4.32 | % | ||||||||||||||||||||||||
Loans receivable (2)(3)(4) | 1,948,580 | 91,569 | 4.71 | % | 1,593,790 | 75,373 | 4.74 | % | 1,247,510 | 62,435 | 5.01 | % | ||||||||||||||||||||||||
|
|
|
|
|
|
|
|
|
|
|
| |||||||||||||||||||||||||
Total interest-earning assets (1) | 2,683,383 | 106,529 | 4.05 | % | 2,166,006 | 88,588 | 4.20 | % | 1,794,263 | 76,205 | 4.36 | % | ||||||||||||||||||||||||
Non-interest-earning assets | ||||||||||||||||||||||||||||||||||||
Cash and due from banks | 37,549 | 31,692 | 27,168 | |||||||||||||||||||||||||||||||||
Allowance for loan losses | (14,439 | ) | (16,351 | ) | (15,945 | ) | ||||||||||||||||||||||||||||||
Other assets | 255,129 | 179,138 | 144,803 | |||||||||||||||||||||||||||||||||
|
|
|
|
|
| |||||||||||||||||||||||||||||||
| $ | 2,961,622 | $ | 2,360,485 | $ | 1,950,289 | |||||||||||||||||||||||||||||||
|
|
|
|
|
| |||||||||||||||||||||||||||||||
LIABILITIES AND SHAREHOLDERS' EQUITY | ||||||||||||||||||||||||||||||||||||
Interest-bearing liabilities | ||||||||||||||||||||||||||||||||||||
Interest-bearing deposits | $ | 1,752,326 | $ | 6,616 | 0.38 | % | $ | 1,438,026 | $ | 5,559 | 0.39 | % | $ | 1,182,831 | $ | 5,257 | 0.44 | % | ||||||||||||||||||
Borrowings | 425,444 | 11,807 | 2.78 | % | 336,618 | 6,286 | 1.87 | % | 281,649 | 5,956 | 2.11 | % | ||||||||||||||||||||||||
Subordinated debentures | 49,834 | 2,114 | 4.24 | % | 32,717 | 2,009 | 6.14 | % | 32,561 | 2,009 | 6.17 | % | ||||||||||||||||||||||||
|
|
|
|
|
|
|
|
|
|
|
| |||||||||||||||||||||||||
Total interest-bearing liabilities | 2,227,604 | 20,537 | 0.92 | % | 1,807,361 | 13,854 | 0.77 | % | 1,497,041 | 13,222 | 0.88 | % | ||||||||||||||||||||||||
Non-interest-bearing liabilities | ||||||||||||||||||||||||||||||||||||
Demand deposits | 417,900 | 317,246 | 258,523 | |||||||||||||||||||||||||||||||||
Accrued interest payable and other liabilities | 13,574 | 16,364 | 12,776 | |||||||||||||||||||||||||||||||||
Stockholders' equity | 302,544 | 219,514 | 181,949 | |||||||||||||||||||||||||||||||||
|
|
|
|
|
| |||||||||||||||||||||||||||||||
| $ | 2,961,622 | $ | 2,360,485 | $ | 1,950,289 | |||||||||||||||||||||||||||||||
|
|
|
|
|
| |||||||||||||||||||||||||||||||
Net interest income/spread | $ | 85,992 | 3.13 | % | $ | 74,734 | 3.43 | % | $ | 62,983 | 3.48 | % | ||||||||||||||||||||||||
|
|
|
|
|
| |||||||||||||||||||||||||||||||
Net interest income as a percent of average interest earning assets (1) | 3.29 | % | 3.56 | % | 3.62 | % | ||||||||||||||||||||||||||||||
| (1) | Horizon has no foreign office and, accordingly, no assets or liabilities to foreign operations. Horizon's subsidiary bank had no funds invested in Eurodollar Certificates of Deposit at December 31, 2016. |
| (2) | Yields are presented on a tax-equivalent basis. |
| (3) | Non-accruing loans for the purpose of the computations above are included in the daily average loan amounts outstanding. Loan totals are shown net of unearned income and deferred loans fees. |
| (4) | Loan fees and late fees included in interest on loans aggregated $5.5 million, $4.9 million, and $4.3 million in 2016, 2015 and 2014. |
| 2016-2015 | 2015-2014 | |||||||||||||||||||||||
| Total Change | Change Due To Volume | Change Due To Rate | Total Change | Change Due To Volume | Change Due To Rate | |||||||||||||||||||
Interest Income | ||||||||||||||||||||||||
Federal funds sold | $ | 84 | $ | 12 | $ | 72 | $ | - | $ | 5 | $ | (5 | ) | |||||||||||
Interest-earning deposits | 268 | 33 | 235 | - | 7 | (7 | ) | |||||||||||||||||
Investment securities - taxable | 966 | 1,946 | (980 | ) | (623 | ) | 189 | (812 | ) | |||||||||||||||
Investment securities - non-taxable | 427 | 1,550 | (1,123 | ) | 68 | 282 | (214 | ) | ||||||||||||||||
Loans receivable | 16,196 | 16,711 | (515 | ) | 12,938 | 16,571 | (3,633 | ) | ||||||||||||||||
|
|
|
|
|
|
|
|
|
|
|
| |||||||||||||
Total interest income | 17,941 | 20,252 | (2,311 | ) | 12,383 | 17,054 | (4,671 | ) | ||||||||||||||||
|
|
|
|
|
|
|
|
|
|
|
| |||||||||||||
Interest Expense | ||||||||||||||||||||||||
Interest-bearing deposits | 1,057 | 1,189 | (132 | ) | 302 | 1,042 | (740 | ) | ||||||||||||||||
Borrowings | 5,521 | 1,942 | 3,579 | 330 | 1,077 | (747 | ) | |||||||||||||||||
Subordinated debentures | 105 | 847 | (742 | ) | - | 10 | (10 | ) | ||||||||||||||||
|
|
|
|
|
|
|
|
|
|
|
| |||||||||||||
Total interest expense | 6,683 | 3,978 | 2,705 | 632 | 2,129 | (1,497 | ) | |||||||||||||||||
|
|
|
|
|
|
|
|
|
|
|
| |||||||||||||
Net interest income | $ | 11,258 | $ | 16,274 | $ | (5,016 | ) | $ | 11,751 | $ | 14,925 | $ | (3,174 | ) | ||||||||||
|
|
|
|
|
|
|
|
|
|
|
| |||||||||||||
48
H ORIZON B ANCORP AND S UBSIDIARIES
Management's Discussion and Analysis of
Financial Condition and Results of Operations
(Table dollars in thousands except per share data)
Net interest income during 2015 was $74.7 million, an increase of $11.8 million or 18.7% over the $63.0 million earned in 2014. Yields on the Company's interest-earning assets decreased by 16 basis points to 4.20% during 2015 from 4.36% in 2014. Interest income increased $12.4 million to $88.6 million for 2015 from $76.2 million in 2015. This increase was due to increased volume in interest-earning assets and an increase in the recognition of interest income from the acquisition-related purchase accounting adjustments of approximately $300,000 from $2.7 million in 2014 to $3.0 million in 2015, partially offset by the lower yield on interest-earnings assets.
Rates paid on interest-bearing liabilities decreased by 11 basis points during the same period due to the lower interest rate environment. Interest expense increased $632,000 from $13.2 million in 2014 to $13.9 million in 2015. This increase was due to increased volume of interest-bearing liabilities, partially offset by lower rates being paid. Due to a larger decrease in the yield on the Company's interest-earning assets compared to the decrease in the rates paid on the Company's interest-bearing liabilities, the net interest margin decreased 6 basis points from 3.62% for 2014 to 3.56% in 2015. Excluding the interest income recognized from the acquisition-related purchase accounting adjustments, the margin would have been 3.42% for 2015 compared to 3.47% for 2014. Management believes that the current level of interest rates is driven by external factors and therefore impacts the results of the Company's net interest margin. Management does not expect a significant rise in interest rates in the short term, but an increase in rates is expected at some time in the future due to the current historically low interest rate environment.
Provision for Loan Losses
Horizon assesses the adequacy of its Allowance for Loan and Lease Losses (ALLL) by regularly reviewing the performance of its loan portfolios. The provision for loan losses totaled $1.8 million in 2016 compared to $3.2 million in 2015. The lower provision for loan losses in 2016 compared to the previous year was due to continued improvement in non-performing loans and lower charged off loans. Total loan net charge-offs were $1.5 million, commercial loan net charge-offs were $548,000, residential mortgage loan net charge-offs were $116,000 and consumer loan net charge-offs were $875,000 for the year ending December 31, 2016.
During 2015, the provision for loan losses totaled $3.2 million, compared to $3.1 million in 2014. The higher provision for loan losses in 2015 compared to 2014 was due to continued loan growth. Commercial loan net charge-offs were $3.2 million, residential mortgage loan net charge-offs were $219,000 and consumer loan net charge-offs were $1.6 million for the year ending December 31, 2015.
Non-interest Income
The following is a summary of changes in non-interest income:
| Twelve Months Ended | 2014 - 2015 | |||||||||||||||||||||||||||
| December 31 | December 31 | Amount | Percent | December 31 | Amount | Percent | ||||||||||||||||||||||
| 2016 | 2015 | Change | Change | 2014 | Change | Change | ||||||||||||||||||||||
Non-interest Income | ||||||||||||||||||||||||||||
Service charges on deposit accounts | $ | 5,404 | $ | 4,807 | $ | 597 | 12.4 | % | $ | 4,085 | $ | 722 | 17.7 | % | ||||||||||||||
Wire transfer fees | 806 | 633 | 173 | 27.3 | % | 557 | 76 | 13.6 | % | |||||||||||||||||||
Interchange fees | 7,042 | 5,591 | 1,451 | 26.0 | % | 4,649 | 942 | 20.3 | % | |||||||||||||||||||
Fiduciary activities | 6,621 | 5,637 | 984 | 17.5 | % | 4,738 | 899 | 19.0 | % | |||||||||||||||||||
Gain on sale of investment securities | 1,836 | 189 | 1,647 | 871.4 | % | 988 | (799 | ) | -80.9 | % | ||||||||||||||||||
Gain on sale of mortgage loans | 11,675 | 10,055 | 1,620 | 16.1 | % | 8,395 | 1,660 | 19.8 | % | |||||||||||||||||||
Mortgage servicing net of impairment | 1,908 | 993 | 915 | 92.1 | % | 805 | 188 | 23.4 | % | |||||||||||||||||||
Increase in cash surrender value of bank owned life insurance | 1,643 | 1,249 | 394 | 31.5 | % | 1,047 | 202 | 19.3 | % | |||||||||||||||||||
Death benefit on officer life insurance | - | 145 | (145 | ) | 100.0 | % | - | 145 | 0.0 | % | ||||||||||||||||||
Other income | 1,039 | 1,103 | (64 | ) | -5.8 | % | 1,013 | 90 | 8.9 | % | ||||||||||||||||||
|
|
|
|
|
|
|
|
|
| |||||||||||||||||||
Total non-interest income | $ | 37,974 | $ | 30,402 | $ | 7,572 | 24.9 | % | $ | 26,277 | $ | 4,125 | 15.7 | % | ||||||||||||||
|
|
|
|
|
|
|
|
|
| |||||||||||||||||||
49
H ORIZON B ANCORP AND S UBSIDIARIES
Management's Discussion and Analysis of
Financial Condition and Results of Operations
(Table dollars in thousands except per share data)
The increase in service charges on deposit accounts and interchange fee income in 2016 compared to 2015 was the result of growth in transactional deposit accounts and volume during 2016. Fiduciary activities income increased $984,000 during 2016 as a result of an increase in assets under management. During 2016, the Company originated approximately $316.9 million of mortgage loans to be sold on the secondary market, compared to $302.4 million in 2015. This increase in volume and increase in the percentage earned on the sale of mortgage loans, increased the overall gain on sale of mortgage loans by $1.6 million compared to the prior year. Mortgage servicing net of impairment increased by $915,000 during 2016 compared to 2015 due to a larger portfolio of mortgage loans serviced during 2016. The cash surrender value of bank owned life insurance increased by $394,000 in 2016 due to an increase in the number of policies outstanding as a result of the Kosciusko and LaPorte acquisitions. Gain on sale of investment securities increased $1.6 million in 2016 due to security gains used to help offset the penalties paid on the repayment of debt as part of a balance sheet restructuring and the result of an analysis that determined market conditions provided the opportunity to add gains to capital without negatively impacting long-term earnings. The death benefit on Bank owned life insurance decreased by $145,000 in 2016 due to a payment realized on one of the policies in 2015. These increases were partially offset by a decrease in other income of $64,000 in 2016.
The increase in service charges on deposit accounts and interchange fee income in 2015 compared to 2014 was the result of growth in transactional deposit accounts and volume during 2015. Fiduciary activities income increased $899,000 during 2015 as a result of an increase in assets under management. During 2015, the Company originated approximately $302.4 million of mortgage loans to be sold on the secondary market, compared to $229.2 million in 2014. This increase in volume, partially offset by a decrease in the percentage earned on the sale of mortgage loans, increased the overall gain on sale of mortgage loans by $1.7 million compared to the prior year. Mortgage servicing net of impairment increased by $188,000 during 2015 compared to 2014 due to a larger portfolio of mortgage loans serviced during 2015. The cash surrender value of bank owned life insurance increased by $202,000 in 2015 due to an increase in the number of policies outstanding as a result of the Peoples acquisition. The death benefit on Bank owned life insurance increased by $145,000 in 2015 due to payment realized on one of the policies. These increases were partially offset by a decrease in gain on sale of investment securities of $799,000 in 2015 due to a gain on sale of securities of $988,000 during the third quarter of 2014. This gain was the result of an analysis that determined market conditions provided the opportunity to add gains to capital without negatively impacting long-term earnings. The sale of securities was also used to fund loan growth.
Non-interest Expense
The following is a summary of changes in non-interest expense:
| Twelve Months Ended | 2014 - 2015 | |||||||||||||||||||||||||||
| December 31 | December 31 | Amount | Percent | December 31 | Amount | Percent | ||||||||||||||||||||||
| 2016 | 2015 | Change | Change | 2014 | Change | Change | ||||||||||||||||||||||
Non-interest Expense | ||||||||||||||||||||||||||||
Salaries | $ | 30,445 | $ | 25,284 | $ | 5,161 | 20.4 | % | $ | 22,859 | $ | 2,425 | 10.6 | % | ||||||||||||||
Commission and bonuses | 6,484 | 6,008 | 476 | 7.9 | % | 4,111 | 1,897 | 46.1 | % | |||||||||||||||||||
Employee benefits | 7,084 | 6,420 | 664 | 10.3 | % | 5,712 | 708 | 12.4 | % | |||||||||||||||||||
Net occupancy expenses | 8,322 | 6,400 | 1,922 | 30.0 | % | 5,607 | 793 | 14.1 | % | |||||||||||||||||||
Data processing | 5,367 | 4,251 | 1,116 | 26.3 | % | 3,663 | 588 | 16.1 | % | |||||||||||||||||||
Professional fees | 2,752 | 2,070 | 682 | 32.9 | % | 1,731 | 339 | 19.6 | % | |||||||||||||||||||
Outside services and consultants | 7,863 | 5,735 | 2,128 | 37.1 | % | 3,250 | 2,485 | 76.5 | % | |||||||||||||||||||
Loan expense | 5,582 | 5,379 | 203 | 3.8 | % | 4,770 | 609 | 12.8 | % | |||||||||||||||||||
FDIC deposit insurance | 1,559 | 1,499 | 60 | 4.0 | % | 1,175 | 324 | 27.6 | % | |||||||||||||||||||
Other losses | 684 | 432 | 252 | 58.3 | % | (70 | ) | 502 | -717.1 | % | ||||||||||||||||||
Other expense | 13,269 | 10,715 | 2,554 | 23.8 | % | 9,138 | 1,577 | 17.3 | % | |||||||||||||||||||
|
|
|
|
|
|
|
|
|
| |||||||||||||||||||
Total non-interest expense | $ | 89,411 | $ | 74,193 | $ | 15,218 | 20.5 | % | $ | 61,946 | $ | 12,247 | 19.8 | % | ||||||||||||||
|
|
|
|
|
|
|
|
|
| |||||||||||||||||||
50
H ORIZON B ANCORP AND S UBSIDIARIES
Management's Discussion and Analysis of
Financial Condition and Results of Operations
(Table dollars in thousands except per share data)
Salary expense, commission and bonuses, employee benefits, net occupancy expense and other expense increased by $5.2 million, $476,000, $664,000, $1.9 million and $2.6 million, respectively, due to the Kosciusko, LaPorte and CNB mergers, Horizon's investments in growth markets and overall growth. Data processing and other expenses increased during 2016 from the cost of continued growth and expansion and the Kosciusko, LaPorte and CNB mergers. Outside services and consultants increased primarily due to the fees associated with the Kosciusko, LaPorte and CNB acquisitions. Loan expense increased in 2016 compared to 2015 due to company growth and collection costs. Other losses increased in 2016 compared to 2015 due to the recovery of a previously recorded loss contingency in 2014 and higher one-time losses in 2015.
Salary expense, commission and bonuses, employee benefits, net occupancy expense and other expense increased by $2.4 million, $1.9 million, $708,000, $793,000 and $1.6 million, respectively, due to the Peoples merger, Horizon's investment in growth markets and overall growth. Data processing and other expenses increased during 2015 from the cost of continued growth and expansion and the Peoples merger. Outside services and consultants increased primarily due to the fees associated with the Peoples acquisition. Loan expense increased in 2015 compared to 2014 due to company growth and collection costs. Other losses increased in 2015 compared to 2014 due to the recovery of a previously recorded loss contingency in 2014 and higher one-time losses in 2015.
Income Taxes
Income tax expense for 2016 was $8.8 million, compared to $7.2 million of tax expense during 2015. The effective tax rate for 2016 was 26.9% compared to 26.0% in 2015 and 25.4% in 2014.
Use of Non-GAAP Financial Measures
Certain information set forth in this report on Form 10-K refers to financial measures determined by methods other than in accordance with GAAP. Specifically, we have included non-GAAP financial measures of the net interest income and net interest margin excluding the impact of acquisition-related purchase accounting adjustments and net income and diluted earnings per share excluding the impact of one-time costs related to the acquisitions, acquisition-related purchase accounting adjustments and other events that are considered to be non-recurring. Horizon believes these non-GAAP financial measures are helpful to investors and provide a greater understanding of our business without giving effect to the purchase accounting impacts and one-time costs of acquisitions, although these measures are not necessarily comparable to similar measures that may be presented by other companies and should not be considered in isolation or as a substitute for the related GAAP measure.
Non-GAAP Reconciliation of Net Interest Margin
(Dollars in Thousands, Unaudited)
| Three Months Ended | Twelve Months Ended | |||||||||||||||||||||||
| December 31 | September 30 | December 31 | December 31 | |||||||||||||||||||||
| 2016 | 2016 | 2015 | 2016 | 2015 | 2014 | |||||||||||||||||||
Net Interest Margin As Reported | ||||||||||||||||||||||||
Net interest income | $ | 20,939 | $ | 24,410 | $ | 20,222 | $ | 85,992 | $ | 74,734 | $ | 62,983 | ||||||||||||
Average interest-earning assets | 2,932,145 | 2,957,944 | 2,369,301 | 2,683,383 | 2,166,006 | 1,794,263 | ||||||||||||||||||
Net interest income as a percent of average interest- earning assets ("Net Interest Margin") | 2.92 | % | 3.37 | % | 3.50 | % | 3.29 | % | 3.56 | % | 3.62 | % | ||||||||||||
Impact of Prepayment Penalties on Borrowings | ||||||||||||||||||||||||
Interest expense from prepayment penalties on borrowings | $ | 4,839 | $ | - | $ | - | $ | 4,839 | $ | - | $ | - | ||||||||||||
Impact of Acquisitions | ||||||||||||||||||||||||
Interest income from acquisition-related purchase accounting adjustments | $ | (900 | ) | $ | (459 | ) | $ | (695 | ) | $ | (2,304 | ) | $ | (2,977 | ) | $ | (2,745 | ) | ||||||
Excluding Impact of Prepayment Penalties and Acquisitions | ||||||||||||||||||||||||
Net interest income | $ | 24,878 | $ | 23,951 | $ | 19,527 | $ | 88,527 | $ | 71,757 | $ | 60,238 | ||||||||||||
Average interest-earning assets | 2,932,145 | 2,957,944 | 2,369,301 | 2,683,383 | 2,166,006 | 1,794,263 | ||||||||||||||||||
Core Net Interest Margin | 3.45 | % | 3.31 | % | 3.38 | % | 3.38 | % | 3.42 | % | 3.47 | % | ||||||||||||
51
H ORIZON B ANCORP AND S UBSIDIARIES
Management's Discussion and Analysis of
Financial Condition and Results of Operations
(Table dollars in thousands except per share data)
Non-GAAP Reconciliation of Net Income and Diluted Earnings per Share
(Dollars in Thousands Except per Share Data)
| Twelve Months Ended | ||||||||||||
| December 31 | ||||||||||||
| 2016 | 2015 | 2014 | ||||||||||
Non-GAAP Reconciliation of Net Income | ||||||||||||
Net income as reported | $ | 23,912 | $ | 20,549 | $ | 18,101 | ||||||
Merger expenses | 6,827 | 4,889 | 1,335 | |||||||||
Tax effect | (1,998 | ) | (1,585 | ) | (467 | ) | ||||||
|
|
|
|
|
| |||||||
Net income excluding merger expenses | 28,741 | 23,853 | 18,969 | |||||||||
Gain on sale of investment securities | (1,836 | ) | (189 | ) | (988 | ) | ||||||
Tax effect | 643 | 66 | 346 | |||||||||
|
|
|
|
|
| |||||||
Net income excluding gain on sale of investment securities | 27,548 | 23,730 | 18,327 | |||||||||
Death benefit on bank owned life insurance ("BOLI") | - | (145 | ) | - | ||||||||
Tax effect | - | 51 | - | |||||||||
|
|
|
|
|
| |||||||
Net income excluding death benefit on BOLI | 27,548 | 23,636 | 18,327 | |||||||||
Prepayment penalties on borrowings | 4,839 | - | - | |||||||||
Tax effect | (1,694 | ) | - | - | ||||||||
|
|
|
|
|
| |||||||
Net income excluding prepayment penalties on borrowings | $ | 30,693 | $ | 23,636 | $ | 18,327 | ||||||
Acquisition-related purchase accounting adjustments ("PAUs") | (2,304 | ) | (2,977 | ) | (2,745 | ) | ||||||
Tax effect | 807 | 1,042 | 961 | |||||||||
|
|
|
|
|
| |||||||
Net income excluding PAUs | $ | 29,196 | $ | 21,701 | $ | 16,543 | ||||||
|
|
|
|
|
| |||||||
Non-GAAP Reconciliation of Diluted Earnings per Share | ||||||||||||
Diluted earnings per share as reported | $ | 1.19 | $ | 1.26 | $ | 1.27 | ||||||
Merger expenses | 0.34 | 0.30 | 0.09 | |||||||||
Tax effect | (0.10 | ) | (0.10 | ) | (0.03 | ) | ||||||
|
|
|
|
|
| |||||||
Diluted earnings per share excluding merger expenses | 1.43 | 1.46 | 1.33 | |||||||||
Gain on sale of investment securities | (0.09 | ) | (0.01 | ) | (0.07 | ) | ||||||
Tax effect | 0.03 | 0.00 | 0.02 | |||||||||
|
|
|
|
|
| |||||||
Net income excluding gain on sale of investment securities | 1.37 | 1.46 | 1.28 | |||||||||
Death benefit on BOLI | - | (0.01 | ) | - | ||||||||
Tax effect | - | 0.00 | - | |||||||||
|
|
|
|
|
| |||||||
Net income excluding death benefit on BOLI | 1.37 | 1.45 | 1.28 | |||||||||
Prepayment penalties on borrowings | 0.24 | - | - | |||||||||
Tax effect | (0.08 | ) | - | - | ||||||||
|
|
|
|
|
| |||||||
Net income excluding prepayment penalties on borrowings | 1.53 | 1.45 | 1.28 | |||||||||
Acquisition-related PAUs | (0.11 | ) | (0.18 | ) | (0.19 | ) | ||||||
Tax effect | 0.03 | 0.06 | 0.07 | |||||||||
|
|
|
|
|
| |||||||
Diluted earnings per share excluding PAUs | $ | 1.45 | $ | 1.33 | $ | 1.16 | ||||||
|
|
|
|
|
| |||||||
52
H ORIZON B ANCORP AND S UBSIDIARIES
Management's Discussion and Analysis of
Financial Condition and Results of Operations
(Table dollars in thousands except per share data)
Non-GAAP Reconciliation of Return on Average Assets and Average Common Equity
(Dollars in Thousands)
| Twelve Months Ended | ||||||||||||
| December 31 | ||||||||||||
| 2016 | 2015 | 2014 | ||||||||||
Non-GAAP Reconciliation of Return on Average Assets | ||||||||||||
Average Assets | $ | 2,961,622 | $ | 2,360,485 | $ | 1,950,289 | ||||||
Return on average assets as reported | 0.81 | % | 0.87 | % | 0.93 | % | ||||||
Merger expenses | 0.23 | % | 0.21 | % | 0.07 | % | ||||||
Tax effect | -0.07 | % | -0.07 | % | -0.02 | % | ||||||
|
|
|
|
|
| |||||||
Excluding merger expenses | 0.97 | % | 1.01 | % | 0.97 | % | ||||||
Gain on sale of investment securities | -0.06 | % | -0.01 | % | -0.05 | % | ||||||
Tax effect | 0.02 | % | 0.00 | % | 0.02 | % | ||||||
|
|
|
|
|
| |||||||
Excluding gain on sale of investment securities | 0.93 | % | 1.01 | % | 0.94 | % | ||||||
Death benefit on BOLI | 0.00 | % | -0.01 | % | 0.00 | % | ||||||
Tax effect | 0.00 | % | 0.00 | % | 0.00 | % | ||||||
|
|
|
|
|
| |||||||
Excluding death benefit on BOLI | 0.93 | % | 1.00 | % | 0.94 | % | ||||||
Prepayment penalties on borrowings | 0.16 | % | 0.00 | % | 0.00 | % | ||||||
Tax effect | -0.06 | % | 0.00 | % | 0.00 | % | ||||||
|
|
|
|
|
| |||||||
Excluding prepayment penalties on borrowings | 1.04 | % | 1.00 | % | 0.94 | % | ||||||
Acquisition-related PAUs | -0.08 | % | -0.13 | % | -0.14 | % | ||||||
Tax effect | 0.03 | % | 0.04 | % | 0.05 | % | ||||||
|
|
|
|
|
| |||||||
Excluding PAUs | 0.99 | % | 0.92 | % | 0.85 | % | ||||||
Non-GAAP Reconciliation of Return on Average Common Equity | ||||||||||||
Average Common Equity | $ | 301,485 | $ | 207,014 | $ | 169,449 | ||||||
Return on average common equity as reported | 7.92 | % | 9.87 | % | 10.60 | % | ||||||
Merger expenses | 2.26 | % | 2.36 | % | 0.79 | % | ||||||
Tax effect | -0.66 | % | -0.77 | % | -0.28 | % | ||||||
|
|
|
|
|
| |||||||
Excluding merger expenses | 9.52 | % | 11.46 | % | 11.12 | % | ||||||
Gain on sale of investment securities | -0.61 | % | -0.09 | % | -0.58 | % | ||||||
Tax effect | 0.21 | % | 0.03 | % | 0.20 | % | ||||||
|
|
|
|
|
| |||||||
Excluding gain on sale of investment securities | 9.12 | % | 11.40 | % | 10.74 | % | ||||||
Death benefit on BOLI | 0.00 | % | -0.07 | % | 0.00 | % | ||||||
Tax effect | 0.00 | % | 0.02 | % | 0.00 | % | ||||||
|
|
|
|
|
| |||||||
Excluding death benefit on BOLI | 9.12 | % | 11.36 | % | 10.74 | % | ||||||
Prepayment penalties on borrowings | 1.61 | % | 0.00 | % | 0.00 | % | ||||||
Tax effect | -0.56 | % | 0.00 | % | 0.00 | % | ||||||
|
|
|
|
|
| |||||||
Excluding prepayment penalties on borrowings | 10.17 | % | 11.36 | % | 10.74 | % | ||||||
Acquisition-related PAUs | -0.76 | % | -1.44 | % | -1.62 | % | ||||||
Tax effect | 0.27 | % | 0.50 | % | 0.57 | % | ||||||
|
|
|
|
|
| |||||||
Excluding PAUs | 9.67 | % | 10.42 | % | 9.68 | % | ||||||
53
H ORIZON B ANCORP AND S UBSIDIARIES
Management's Discussion and Analysis of
Financial Condition and Results of Operations
(Table dollars in thousands except per share data)
Non- GAAP Allowance for Loan and Lease Loss Detail
As of December 31, 2016
(Dollars in Thousands, Unaudited)
| Horizon | ||||||||||||||||||||||||||||||||
| Legacy | Heartland | Summit | Peoples | Kosciusko | LaPorte | CNB | Total | |||||||||||||||||||||||||
Pre-discount loan balance | $ | 1,636,945 | $ | 16,046 | $ | 55,042 | $ | 148,467 | $ | 81,946 | $ | 202,407 | $ | 10,303 | $ | 2,151,156 | ||||||||||||||||
Allowance for loan losses (ALLL) | 14,833 | 4 | - | - | - | - | - | 14,837 | ||||||||||||||||||||||||
Loan discount | N/A | 1,083 | 2,475 | 3,323 | 997 | 6,971 | 321 | 15,170 | ||||||||||||||||||||||||
|
|
|
|
|
|
|
|
|
|
|
|
|
|
|
| |||||||||||||||||
ALLL+loan discount | 14,833 | 1,087 | 2,475 | 3,323 | 997 | 6,971 | 321 | 30,007 | ||||||||||||||||||||||||
|
|
|
|
|
|
|
|
|
|
|
|
|
|
|
| |||||||||||||||||
Loans, net | $ | 1,622,112 | $ | 14,959 | $ | 52,567 | $ | 145,144 | $ | 80,949 | $ | 195,436 | $ | 9,982 | $ | 2,121,149 | ||||||||||||||||
|
|
|
|
|
|
|
|
|
|
|
|
|
|
|
| |||||||||||||||||
ALLL/ pre-discount loan balance | 0.91 | % | 0.02 | % | 0.00 | % | 0.00 | % | 0.00 | % | 0.00 | % | 0.00 | % | 0.69 | % | ||||||||||||||||
Loan discount/ pre-discount loan balance | N/A | 6.75 | % | 4.50 | % | 2.24 | % | 1.22 | % | 3.44 | % | 3.12 | % | 0.71 | % | |||||||||||||||||
ALLL+loan discount/ pre-discount loan balance | 0.91 | % | 6.77 | % | 4.50 | % | 2.24 | % | 1.22 | % | 3.44 | % | 3.12 | % | 1.39 | % | ||||||||||||||||
Liquidity and Rate Sensitivity Management
Management and the Board of Directors meet regularly to review both the liquidity and rate sensitivity position of Horizon. Effective asset and liability management ensures Horizon's ability to monitor the cash flow requirements of depositors along with the demands of borrowers and to measure and manage interest rate risk. Horizon utilizes an interest rate risk assessment model designed to highlight sources of existing interest rate risk and consider the effect of these risks on strategic planning. Management maintains (within certain parameters) an essentially balanced ratio of interest sensitive assets to liabilities in order to protect against the effects of wide interest rate fluctuations.
Liquidity
The Bank maintains a stable base of core deposits provided by long standing relationships with consumers and local businesses. These deposits are the principal source of liquidity for Horizon. Other sources of liquidity for Horizon include earnings, loan repayments, investment security sales and maturities, sale of real estate loans and borrowing relationships with correspondent banks, including the FHLB and the Federal Reserve Bank ("FRB"). At December 31, 2016, Horizon had available approximately $453.9 million in available credit from various money center banks, including the FHLB and the FRB Discount Window. Factors which could impact Horizon's funding needs in the future include:
| • | Horizon had outstanding borrowings of over $124.0 million with the FHLB and total borrowing capacity with the FHLB of $419.8 million. Generally, the loan terms from the FHLB are better than the terms Horizon can receive from other sources, making it less expensive to borrow money from the FHLB. Financial difficulties at the FHLB could reduce or eliminate Horizon's additional borrowing capacity with the FHLB or FHLB could change collateral requirements, which could lower the Company's borrowing availability. |
| • | If residential mortgage loan rates remain low, Horizon's mortgage warehouse loans could create an additional need for funding. |
| • | Horizon had a total of $68.2 million of Federal Fund lines from various money center banks. These are uncommitted lines and could be withdrawn at any time by the correspondent banks. |
| • | Horizon had a total of $89.9 million of available collateral at the FRB secured by municipal securities. These securities may mature, call, or be sold, which would reduce the available collateral. |
| • | A downgrade in Horizon's ability to obtain credit due to factors such as deterioration in asset quality, a large charge to earnings, a decline in profitability or other financial measures, or a significant merger or acquisition. |
| • | An act of terrorism or war, natural disasters, political events, or the default or bankruptcy of a major corporation, mutual fund, hedge fund or a government agency. |
| • | Market speculation or rumors about Horizon or the banking industry in general may adversely affect the cost and availability of normal funding sources. |
54
H ORIZON B ANCORP AND S UBSIDIARIES
Management's Discussion and Analysis of
Financial Condition and Results of Operations
(Table dollars in thousands except per share data)
If any of these events occur, they could force Horizon to borrow money from other sources including negotiable certificates of deposit. Such other monies may only be available at higher interest rates and on less advantageous terms, which will impact our net income and could impact our ability to grow. Management believes Horizon has adequate funding sources to meet short and long term needs.
Horizon maintains a liquidity contingency plan that outlines the process for addressing a liquidity crisis. The plan provides for an evaluation of funding sources under various market conditions. It also assigns specific roles and responsibilities for effectively managing liquidity through a problem period.
During 2016, cash flows were generated primarily from the sales, maturities, and prepayments of investment securities of $300.4 million, a decrease in loans of $32.1 million, cash received from acquisitions totaling $169.5 million and an increase in deposits of $46.6 million. Cash flows were used to purchase investments totaling $271.4 million, to decrease in borrowings by $256.0 million and to redeem preferred stock for $12.5 million. The net cash and cash equivalent position increased by $22.2 million during 2016.
The following table sets forth contractual obligations and other commitments representing required and potential cash outflows as of December 31, 2016. Interest on subordinated debentures and long-term borrowed funds is calculated based on current contractual interest rates.
| After one | After three | After | ||||||||||||||||||
| Within | but within | but within | five | |||||||||||||||||
| Total | one year | three years | five years | years | ||||||||||||||||
Remaining contractual maturities of time deposits | $ | 475,843 | $ | 257,071 | $ | 149,172 | $ | 47,380 | $ | 22,220 | ||||||||||
Borrowings | 267,489 | 203,610 | 55,285 | 8,164 | 430 | |||||||||||||||
Subordinated debentures | 37,456 | - | - | - | 37,456 | |||||||||||||||
Loan Commitments | 808,299 | 254,063 | 554,236 | - | - | |||||||||||||||
Letters of credit | 969 | 2 | 967 | - | - | |||||||||||||||
|
|
|
|
|
|
|
|
|
| |||||||||||
Total | $ | 1,590,056 | $ | 714,746 | $ | 752,161 | $ | 57,543 | $ | 65,606 | ||||||||||
|
|
|
|
|
|
|
|
|
| |||||||||||
Interest Rate Sensitivity
The degree by which net interest income may fluctuate due to changes in interest rates is monitored by Horizon using computer simulation models, incorporating not only the current GAP position but the effect of expected repricing of specific financial assets and liabilities. When repricing opportunities are not properly aligned, net interest income may be affected when interest rates change. Forecasting results of the possible outcomes determines the exposure to interest rate risk inherent in Horizon's balance sheet. The goal is to manage imbalanced positions that arise when the total amount of assets that reprice or mature in a given time period differs significantly from liabilities that reprice or mature in the same time period. The theory behind managing the difference between repricing assets and liabilities is to have more assets repricing in a rising rate environment and more liabilities repricing in a declining rate environment. Based on a model that assumes a lag in repricing, at December 31, 2016, the amount of assets that reprice within one year was 218% of liabilities that reprice within one year. At December 31, 2015, this same model reported that the amount of assets that reprice within one year was approximately 209% of the amount of liabilities that reprice within the same time period. The year 2016 was a stable rate environment and the yields on assets continued to reprice at lower rates due to current asset pricing and a more competitive environment. However, the impact of slightly lower funding costs and a balance sheet restructuring that repaid higher cost long term debt during 2016 positively impacted the net interest margin.
55
H ORIZON B ANCORP AND S UBSIDIARIES
Management's Discussion and Analysis of
Financial Condition and Results of Operations
(Table dollars in thousands except per share data)
| Rate Sensitivity | ||||||||||||||||||||
| > 3 Months | Greater | |||||||||||||||||||
| 3 Months | & < 6 | > 6 Months | Than 1 | |||||||||||||||||
| or Less | Months | & < 1 Year | Year | Total | ||||||||||||||||
Loans | $ | 825,794 | $ | 150,925 | $ | 223,235 | $ | 944,119 | $ | 2,144,073 | ||||||||||
Federal Funds Sold | 3,098 | - | - | - | 3,098 | |||||||||||||||
Interest-Bearing balances with Banks | 19,022 | - | - | - | 19,022 | |||||||||||||||
Investment securities and FRB and FHLB stock | 52,524 | 26,609 | 45,498 | 532,326 | 656,957 | |||||||||||||||
Other assets | - | - | - | 318,006 | 318,006 | |||||||||||||||
|
|
|
|
|
|
|
|
|
| |||||||||||
Total Assets | $ | 900,438 | $ | 177,534 | $ | 268,733 | $ | 1,794,451 | $ | 3,141,156 | ||||||||||
|
|
|
|
|
|
|
|
|
| |||||||||||
Noninterest-bearing deposits | $ | 13,498 | $ | 13,498 | $ | 26,996 | $ | 442,256 | $ | 496,248 | ||||||||||
Interest-bearing deposits | 116,459 | 116,287 | 176,047 | 1,566,169 | 1,974,962 | |||||||||||||||
Borrowed Funds | 124,105 | 7,978 | 20,939 | 151,923 | 304,945 | |||||||||||||||
Other Liabilities | - | - | - | 24,146 | 24,146 | |||||||||||||||
Stockholders' equity | - | - | - | 340,855 | 340,855 | |||||||||||||||
|
|
|
|
|
|
|
|
|
| |||||||||||
Total liabilities and stockholder's equity | $ | 254,062 | $ | 137,763 | $ | 223,982 | $ | 2,525,349 | $ | 3,141,156 | ||||||||||
|
|
|
|
|
|
|
|
|
| |||||||||||
GAP | $ | 646,376 | $ | 39,771 | $ | 44,751 | $ | (730,898 | ) | |||||||||||
Cumulative GAP | $ | 646,376 | $ | 686,147 | $ | 730,898 | ||||||||||||||
Quantitative and Qualitative Disclosures about Market Risk
Horizon's primary market risk exposure is interest rate risk. Interest rate risk ("IRR") is the risk that Horizon's earnings and capital will be adversely affected by changes in interest rates. The primary approach to IRR management is one that focuses on adjustments to the asset/liability mix in order to limit the magnitude of IRR.
Horizon's exposure to interest rate risk arises from repricing or mismatch risk, embedded options risk, and yield curve risk. Repricing risk is the risk of adverse consequence from a change in interest rates that arises because of differences in the timing of when those interest rate changes affect Horizon's assets and liabilities. Basis risk is the risk that the spread, or rate difference, between instruments of similar maturities will change. Options risk arises whenever products give the customer the right, but not the obligation, to alter the quantity or timing of cash flows. Yield curve risk is the risk that changes in prevailing interest rates will affect instruments of different maturities by different amounts. Horizon's objective is to remain reasonably neutral with respect to IRR. Horizon utilizes a variety of strategies to maintain this position, including the sale of mortgage loans on the secondary market, hedging certain balance sheet items using derivatives, varying maturities of FHLB advances, certificates of deposit funding and investment securities.
The table which follows provides information about Horizon's financial instruments that were sensitive to changes in interest rates as of December 31, 2016. The table incorporates Horizon's internal system generated data related to the maturity and repayment/withdrawal of interest-earning assets and interest-bearing liabilities. For loans, securities and liabilities with contractual maturities, the table presents principal cash flows and related weighted-average interest rates by contractual maturities as well as the historical experience of Horizon related to the impact of interest rate fluctuations on the prepayment of residential loans and mortgage-backed securities. From a risk management perspective, Horizon believes that repricing dates are more relevant than contractual maturity dates when analyzing the value of financial instruments. For deposits with no contractual maturity dates, the table presents principal cash flows and weighted average rate, as applicable, based upon Horizon's experience and management's judgment concerning the most likely withdrawal behaviors.
56
H ORIZON B ANCORP AND S UBSIDIARIES
Management's Discussion and Analysis of
Financial Condition and Results of Operations
(Table dollars in thousands except per share data)
| Fair Value | ||||||||||||||||||||||||||||||||
| 2022 | December 31 | |||||||||||||||||||||||||||||||
| 2017 | 2018 | 2019 | 2020 | 2021 | & Beyond | Total | 2016 | |||||||||||||||||||||||||
Rate-sensitive assets | ||||||||||||||||||||||||||||||||
Fixed interest rate loans | $ | 442,447 | $ | 210,532 | $ | 137,396 | $ | 83,172 | $ | 45,380 | $ | 74,691 | $ | 993,618 | $ | 895,233 | ||||||||||||||||
Average interest rate | 4.50 | % | 4.55 | % | 4.54 | % | 4.52 | % | 4.53 | % | 4.57 | % | 4.52 | % | ||||||||||||||||||
Variable interest rate loans | 751,349 | 80,145 | 70,570 | 57,912 | 52,088 | 138,391 | 1,150,455 | 1,201,126 | ||||||||||||||||||||||||
Average interest rate | 4.13 | % | 4.26 | % | 4.22 | % | 4.14 | % | 4.08 | % | 3.66 | % | 4.08 | % | ||||||||||||||||||
|
|
|
|
|
|
|
|
|
|
|
|
|
|
|
| |||||||||||||||||
Total loans | 1,193,796 | 290,677 | 207,966 | 141,084 | 97,468 | 213,082 | 2,144,073 | 2,096,359 | ||||||||||||||||||||||||
Average interest rate | 4.26 | % | 4.47 | % | 4.43 | % | 4.36 | % | 4.29 | % | 3.98 | % | 4.29 | % | ||||||||||||||||||
Securities, including FRB and FHLB stock | 124,632 | 79,663 | 61,179 | 53,727 | 43,832 | 293,923 | 656,957 | 661,093 | ||||||||||||||||||||||||
Average interest rate | 2.42 | % | 2.55 | % | 2.42 | % | 2.92 | % | 3.27 | % | 3.83 | % | 3.16 | % | ||||||||||||||||||
Other interest-bearing assets | 22,120 | - | - | - | - | - | 22,120 | 22,120 | ||||||||||||||||||||||||
Average interest rate | 2.38 | % | 0.00 | % | 0.00 | % | 0.00 | % | 0.00 | % | 0.00 | % | 2.38 | % | ||||||||||||||||||
|
|
|
|
|
|
|
|
|
|
|
|
|
|
|
| |||||||||||||||||
Total earnings assets | $ | 1,340,548 | $ | 370,340 | $ | 269,145 | $ | 194,811 | $ | 141,300 | $ | 507,005 | $ | 2,823,149 | $ | 2,779,572 | ||||||||||||||||
|
|
|
|
|
|
|
|
|
|
|
|
|
|
|
| |||||||||||||||||
Average interest rate | 4.06 | % | 4.06 | % | 3.98 | % | 3.97 | % | 4.06 | % | 3.89 | % | 4.01 | % | ||||||||||||||||||
Rate-sensitive liabilities | ||||||||||||||||||||||||||||||||
Noninterest-bearing deposits | $ | 53,992 | $ | 48,117 | $ | 42,882 | $ | 38,217 | $ | 34,059 | $ | 278,981 | $ | 496,248 | $ | 496,248 | ||||||||||||||||
NOW accounts | 45,964 | 41,794 | 38,004 | 34,557 | 31,422 | 315,021 | 506,762 | 468,264 | ||||||||||||||||||||||||
Average interest rate | 0.09 | % | 0.09 | % | 0.09 | % | 0.09 | % | 0.09 | % | 0.09 | % | 0.09 | % | ||||||||||||||||||
Savings and money market accounts | 105,526 | 93,984 | 83,740 | 74,646 | 66,568 | 567,894 | 992,358 | 907,801 | ||||||||||||||||||||||||
Average interest rate | 0.18 | % | 0.18 | % | 0.18 | % | 0.17 | % | 0.17 | % | 0.16 | % | 0.17 | % | ||||||||||||||||||
Certificates of deposit | 257,304 | 75,178 | 73,602 | 31,629 | 15,632 | 22,498 | 475,843 | 463,104 | ||||||||||||||||||||||||
Average interest rate | 0.81 | % | 1.10 | % | 1.36 | % | 1.58 | % | 1.47 | % | 1.57 | % | 1.05 | % | ||||||||||||||||||
|
|
|
|
|
|
|
|
|
|
|
|
|
|
|
| |||||||||||||||||
Total deposits | 462,786 | 259,073 | 238,228 | 179,049 | 147,681 | 1,184,394 | 2,471,211 | 2,335,415 | ||||||||||||||||||||||||
Average interest rate | 0.50 | % | 0.40 | % | 0.50 | % | 0.37 | % | 0.25 | % | 0.13 | % | 0.29 | % | ||||||||||||||||||
Fixed interest rate borrowings | 134,065 | 32,019 | 10,856 | 1,333 | 10,642 | 1,930 | 190,845 | 191,662 | ||||||||||||||||||||||||
Average interest rate | 0.54 | % | 1.17 | % | 1.69 | % | 1.94 | % | 2.48 | % | 2.82 | % | 0.85 | % | ||||||||||||||||||
Variable interest rate borrowings | 114,100 | - | - | - | - | - | 114,100 | 111,905 | ||||||||||||||||||||||||
Average interest rate | 2.46 | % | 0.00 | % | 0.00 | % | 0.00 | % | 0.00 | % | 0.00 | % | 2.46 | % | ||||||||||||||||||
|
|
|
|
|
|
|
|
|
|
|
|
|
|
|
| |||||||||||||||||
Total funds | $ | 710,951 | $ | 291,092 | $ | 249,084 | $ | 180,382 | $ | 158,323 | $ | 1,186,324 | $ | 2,776,156 | $ | 2,638,982 | ||||||||||||||||
|
|
|
|
|
|
|
|
|
|
|
|
|
|
|
| |||||||||||||||||
Average interest rate | 0.82 | % | 0.48 | % | 0.55 | % | 0.38 | % | 0.40 | % | 0.14 | % | 0.42 | % | ||||||||||||||||||
ITEM 7A. QUANTITATIVE AND QUALITATIVE DISCLOSURES ABOUT MARKET RISK
The information required under this item is incorporated by reference to the information appearing in "Management's Discussion and Analysis of Financial Condition and Results of Operations" included in Item 7.
57
ITEM 8. FINANCIAL STATEMENTS AND SUPPLEMENTARY DATA
H ORIZON B ANCORP AND S UBSIDIARIES
Consolidated Financial Statements
Table of Contents
| Consolidated Financial Statements | Page | |||
Balance Sheets | 59 | |||
Statements of Income | 60 | |||
Statements of Comprehensive Income | 61 | |||
Statements of Stockholders' Equity | 62 | |||
Statements of Cash Flows | 63 | |||
Notes to Financial Statements | 65 | |||
Reports of Independent Registered Public Accounting Firm | 127 | |||
Other Information | ||||
Management's Report on Financial Statements | 129 | |||
Summary of Selected Financial Data | 130 | |||
Horizon's Common Stock and Related Stockholders' Matters | 131 | |||
58
H ORIZON B ANCORP AND S UBSIDIARIES
Consolidated Balance Sheets
(Dollar Amounts in Thousands)
| December 31 | December 31 | |||||||
| 2016 | 2015 | |||||||
Assets | ||||||||
Cash and due from banks | $ | 70,832 | $ | 48,650 | ||||
Investment securities, available for sale | 439,831 | 444,982 | ||||||
Investment securities, held to maturity (fair value of $194,086 and $193,703) | 193,194 | 187,629 | ||||||
Loans held for sale | 8,087 | 7,917 | ||||||
Loans, net of allowance for loan losses of $14,837 and $14,534 | 2,121,149 | 1,734,597 | ||||||
Premises and equipment, net | 66,357 | 60,798 | ||||||
Federal Reserve and Federal Home Loan Bank stock | 23,932 | 13,823 | ||||||
Goodwill | 76,941 | 49,600 | ||||||
Other intangible assets | 9,366 | 7,371 | ||||||
Interest receivable | 12,713 | 10,535 | ||||||
Cash value of life insurance | 74,134 | 54,504 | ||||||
Other assets | 44,620 | 31,995 | ||||||
|
|
|
| |||||
Total assets | $ | 3,141,156 | $ | 2,652,401 | ||||
|
|
|
| |||||
Liabilities | ||||||||
Deposits | ||||||||
Non-interest bearing | $ | 496,248 | $ | 335,955 | ||||
Interest bearing | 1,974,962 | 1,544,198 | ||||||
|
|
|
| |||||
Total deposits | 2,471,210 | 1,880,153 | ||||||
Borrowings | 267,489 | 449,347 | ||||||
Subordinated debentures | 37,456 | 32,797 | ||||||
Interest payable | 472 | 507 | ||||||
Other liabilities | 23,674 | 22,765 | ||||||
|
|
|
| |||||
Total liabilities | 2,800,301 | 2,385,569 | ||||||
|
|
|
| |||||
Commitments and contingent liabilities | ||||||||
Stockholders' Equity | ||||||||
Preferred stock, Authorized, 1,000,000 shares | ||||||||
Series B shares $.01 par value, $1,000 liquidation value | ||||||||
Issued 0 and 12,500 shares | - | 12,500 | ||||||
Common stock, no par value | ||||||||
Authorized, 66,000,000 shares (1) | ||||||||
Issued, 22,192,530 and 17,992,986 shares (1) | ||||||||
Outstanding, 22,171,596 and 17,909,831 shares (1) | - | - | ||||||
Additional paid-in capital | 182,326 | 106,370 | ||||||
Retained earnings | 164,173 | 148,685 | ||||||
Accumulated other comprehensive loss | (5,644 | ) | (723 | ) | ||||
|
|
|
| |||||
Total stockholders' equity | 340,855 | 266,832 | ||||||
|
|
|
| |||||
Total liabilities and stockholders' equity | $ | 3,141,156 | $ | 2,652,401 | ||||
|
|
|
| |||||
| (1) | Adjusted for 3:2 stock split on November 14, 2016. |
See notes to consolidated financial statements
59
H ORIZON B ANCORP AND S UBSIDIARIES
Consolidated Statements of Income
(Dollar Amounts in Thousands, Except Per Share Data)
| Years Ended December 31 | ||||||||||||
| 2016 | 2015 | 2014 | ||||||||||
Interest Income | ||||||||||||
Loans receivable | $ | 91,569 | $ | 75,373 | $ | 62,435 | ||||||
Investment securities | ||||||||||||
Taxable | 10,039 | 8,721 | 9,344 | |||||||||
Tax exempt | 4,921 | 4,494 | 4,426 | |||||||||
|
|
|
|
|
| |||||||
Total interest income | 106,529 | 88,588 | 76,205 | |||||||||
|
|
|
|
|
| |||||||
Interest Expense | ||||||||||||
Deposits | 6,616 | 5,559 | 5,257 | |||||||||
Borrowed funds | 11,807 | 6,286 | 5,956 | |||||||||
Subordinated debentures | 2,114 | 2,009 | 2,009 | |||||||||
|
|
|
|
|
| |||||||
Total interest expense | 20,537 | 13,854 | 13,222 | |||||||||
|
|
|
|
|
| |||||||
Net Interest Income | 85,992 | 74,734 | 62,983 | |||||||||
Provision for loan losses | 1,842 | 3,162 | 3,058 | |||||||||
|
|
|
|
|
| |||||||
Net Interest Income after Provision for Loan Losses | 84,150 | 71,572 | 59,925 | |||||||||
|
|
|
|
|
| |||||||
Non-interest Income | ||||||||||||
Service charges on deposit accounts | 5,404 | 4,807 | 4,085 | |||||||||
Wire transfer fees | 806 | 633 | 557 | |||||||||
Interchange fees | 7,042 | 5,591 | 4,649 | |||||||||
Fiduciary activities | 6,621 | 5,637 | 4,738 | |||||||||
Gain on sale of investment securities (includes $1,836, $189 and $988 for the years ended December 31, 2016, 2015 and | ||||||||||||
2014 related to accumulated other comprehensive earnings reclassifications) | 1,836 | 189 | 988 | |||||||||
Gain on sale of mortgage loans | 11,675 | 10,055 | 8,395 | |||||||||
Mortgage servicing income net of impairment | 1,908 | 993 | 805 | |||||||||
Increase in cash value of bank owned life insurance | 1,643 | 1,249 | 1,047 | |||||||||
Death benefit on bank owned life insurance | - | 145 | - | |||||||||
Other income | 1,039 | 1,103 | 1,013 | |||||||||
|
|
|
|
|
| |||||||
Total non-interest income | 37,974 | 30,402 | 26,277 | |||||||||
|
|
|
|
|
| |||||||
Non-interest Expense | ||||||||||||
Salaries and employee benefits | 44,013 | 37,712 | 32,682 | |||||||||
Net occupancy expenses | 8,322 | 6,400 | 5,607 | |||||||||
Data processing | 5,367 | 4,251 | 3,663 | |||||||||
Professional fees | 2,752 | 2,070 | 1,731 | |||||||||
Outside services and consultants | 7,863 | 5,735 | 3,250 | |||||||||
Loan expense | 5,582 | 5,379 | 4,770 | |||||||||
FDIC insurance expense | 1,559 | 1,499 | 1,175 | |||||||||
Other losses | 684 | 432 | (70 | ) | ||||||||
Other expense | 13,269 | 10,715 | 9,138 | |||||||||
|
|
|
|
|
| |||||||
Total non-interest expense | 89,411 | 74,193 | 61,946 | |||||||||
|
|
|
|
|
| |||||||
Income Before Income Tax | 32,713 | 27,781 | 24,256 | |||||||||
Income tax expense (includes $643, $66 and $346 for the years ended December 31, 2016, 2015 and 2014 related to income tax expense from reclassification items) | 8,801 | 7,232 | 6,155 | |||||||||
|
|
|
|
|
| |||||||
Net Income | 23,912 | 20,549 | 18,101 | |||||||||
Preferred stock dividend | (42 | ) | (125 | ) | (133 | ) | ||||||
|
|
|
|
|
| |||||||
Net Income Available to Common Shareholders | $ | 23,870 | $ | 20,424 | $ | 17,968 | ||||||
|
|
|
|
|
| |||||||
Basic Earnings Per Share (1) | $ | 1.19 | $ | 1.30 | $ | 1.32 | ||||||
Diluted Earnings Per Share (1) | 1.19 | 1.26 | 1.27 | |||||||||
| (1) | Adjusted for 3:2 stock split on November 14, 2016. |
See notes to consolidated financial statements
60
H ORIZON B ANCORP AND S UBSIDIARIES
Consolidated Statements of Comprehensive Income
(Dollar Amounts in Thousands)
| Years Ended December 31 | ||||||||||||
| 2016 | 2015 | 2014 | ||||||||||
Net Income | $ | 23,912 | $ | 20,549 | $ | 18,101 | ||||||
|
|
|
|
|
| |||||||
Other Comprehensive Income (Loss) | ||||||||||||
Change in fair value of derivative instruments: | ||||||||||||
Change in fair value of derivative instruments for the period | 9 | 195 | (511 | ) | ||||||||
Income tax effect | (3 | ) | (68 | ) | 179 | |||||||
|
|
|
|
|
| |||||||
Changes from derivative instruments | 6 | 127 | (332 | ) | ||||||||
|
|
|
|
|
| |||||||
Change in securities: | ||||||||||||
Unrealized appreciation (depreciation) for the period on AFS securities | (5,091 | ) | (2,910 | ) | 4,841 | |||||||
Amortization from transfer of securities from available-for-sale to held-to-maturity securities | (653 | ) | (549 | ) | 1,658 | |||||||
Reclassification adjustment for securities gains realized in income | (1,836 | ) | (189 | ) | (988 | ) | ||||||
Income tax effect | 2,653 | 1,277 | (1,929 | ) | ||||||||
|
|
|
|
|
| |||||||
Unrealized gains (losses) on securities | (4,927 | ) | (2,371 | ) | 3,582 | |||||||
|
|
|
|
|
| |||||||
Other Comprehensive Income (Loss), Net of Tax | (4,921 | ) | (2,244 | ) | 3,250 | |||||||
|
|
|
|
|
| |||||||
Comprehensive Income | $ | 18,991 | $ | 18,305 | $ | 21,351 | ||||||
|
|
|
|
|
| |||||||
See notes to consolidated financial statements
61
H ORIZON B ANCORP AND S UBSIDIARIES
Consolidated Statements of Stockholders' Equity
(Dollar Amounts in Thousands, Except Per Share Data)
| Accumulated | ||||||||||||||||||||
| Additional | Other | |||||||||||||||||||
| Preferred | Paid-in | Retained | Comprehensive | |||||||||||||||||
| Stock | Capital | Earnings | Income (Loss) | Total | ||||||||||||||||
Balances, January 1, 2014 | $ | 12,500 | $ | 32,496 | $ | 121,253 | $ | (1,729 | ) | $ | 164,520 | |||||||||
Net income | 18,101 | 18,101 | ||||||||||||||||||
Other comprehensive income, net of tax | 3,250 | 3,250 | ||||||||||||||||||
Amortization of unearned compensation | 363 | 363 | ||||||||||||||||||
Stock issued stock plans | 165 | 165 | ||||||||||||||||||
Stock option expense | 203 | 203 | ||||||||||||||||||
Stock issued from acquisition | 12,689 | 12,689 | ||||||||||||||||||
Cash dividends on preferred stock (1.06%) | (133 | ) | (133 | ) | ||||||||||||||||
Cash dividends on common stock ($0.34 per share) | (4,744 | ) | (4,744 | ) | ||||||||||||||||
|
|
|
|
|
|
|
|
|
| |||||||||||
Balances, December 31, 2014 | $ | 12,500 | $ | 45,916 | $ | 134,477 | $ | 1,521 | $ | 194,414 | ||||||||||
Net income | 20,549 | 20,549 | ||||||||||||||||||
Other comprehensive loss, net of tax | (2,244 | ) | (2,244 | ) | ||||||||||||||||
Amortization of unearned compensation | 355 | 355 | ||||||||||||||||||
Stock issued stock plans | 554 | 554 | ||||||||||||||||||
Exercise of stock warrants | 3,751 | 3,751 | ||||||||||||||||||
Stock option expense | 288 | 288 | ||||||||||||||||||
Stock issued from acquisition | 55,506 | 55,506 | ||||||||||||||||||
Cash dividends on preferred stock (1.00%) | (125 | ) | (125 | ) | ||||||||||||||||
Cash dividends on common stock ($0.39 per share) | (6,216 | ) | (6,216 | ) | ||||||||||||||||
|
|
|
|
|
|
|
|
|
| |||||||||||
Balances, December 31, 2015 | $ | 12,500 | $ | 106,370 | $ | 148,685 | $ | (723 | ) | $ | 266,832 | |||||||||
Net income | 23,912 | 23,912 | ||||||||||||||||||
Other comprehensive income, net of tax | (4,921 | ) | (4,921 | ) | ||||||||||||||||
Redemption of preferred stock | (12,500 | ) | (12,500 | ) | ||||||||||||||||
Amortization of unearned compensation | 284 | 284 | ||||||||||||||||||
Stock option expense | 324 | 324 | ||||||||||||||||||
Stock issued stock plans | 572 | 572 | ||||||||||||||||||
Stock issued in Kosciusko acquisition | 14,470 | 14,470 | ||||||||||||||||||
Stock issued in LaPorte acquisition | 60,306 | 60,306 | ||||||||||||||||||
Cash dividends on preferred stock (1.00%) | (42 | ) | (42 | ) | ||||||||||||||||
Cash dividends on common stock ($0.41 per share) | (8,382 | ) | (8,382 | ) | ||||||||||||||||
|
|
|
|
|
|
|
|
|
| |||||||||||
Balances, December 31, 2016 | $ | - | $ | 182,326 | $ | 164,173 | $ | (5,644 | ) | $ | 340,855 | |||||||||
|
|
|
|
|
|
|
|
|
| |||||||||||
See notes to consolidated financial statements
62
H ORIZON B ANCORP AND S UBSIDIARIES
Consolidated Statements of Cash Flows
(Dollar Amounts in Thousands)
| Twelve Months Ended December 31 | ||||||||||||
| 2016 | 2015 | 2014 | ||||||||||
Operating Activities | ||||||||||||
Net income | $ | 23,912 | $ | 20,549 | $ | 18,101 | ||||||
Items not requiring (providing) cash | ||||||||||||
Provision for loan losses | 1,842 | 3,162 | 3,058 | |||||||||
Depreciation and amortization | 5,275 | 4,152 | 3,779 | |||||||||
Share based compensation | 324 | 288 | 203 | |||||||||
Mortgage servicing rights net (recovery) impairment | 110 | 59 | (51 | ) | ||||||||
Premium amortization on securities available for sale, net | 6,162 | 3,420 | 2,299 | |||||||||
Gain on sale of investment securities | (1,836 | ) | (189 | ) | (988 | ) | ||||||
Gain on sale of mortgage loans | (11,675 | ) | (10,055 | ) | (8,395 | ) | ||||||
Proceeds from sales of loans | 328,377 | 310,700 | 234,776 | |||||||||
Loans originated for sale | (316,875 | ) | (302,419 | ) | (229,243 | ) | ||||||
Change in cash value of life insurance | (1,618 | ) | (1,224 | ) | (1,007 | ) | ||||||
Gain (Loss) on sale of other real estate owned | 261 | (289 | ) | (186 | ) | |||||||
Net change in | ||||||||||||
Interest receivable | (544 | ) | (1,010 | ) | (398 | ) | ||||||
Interest payable | (275 | ) | (11 | ) | (50 | ) | ||||||
Other assets | 489 | 8,569 | (4,945 | ) | ||||||||
Other liabilities | (8,381 | ) | (472 | ) | 712 | |||||||
|
|
|
|
|
| |||||||
Net cash provided by operating activities | 25,548 | 35,230 | 17,665 | |||||||||
|
|
|
|
|
| |||||||
Investing Activities | ||||||||||||
Purchases of securities available for sale | (225,555 | ) | (244,195 | ) | (93,375 | ) | ||||||
Proceeds from sales, maturities, calls, and principal repayments of securities available for sale | 269,587 | 121,724 | 117,533 | |||||||||
Purchases of securities held to maturity | (45,832 | ) | (32,605 | ) | (4,839 | ) | ||||||
Proceeds from maturities of securities held to maturity | 30,843 | 7,155 | 13,851 | |||||||||
Change in FHLB stock | (5,448 | ) | 268 | 4,972 | ||||||||
Net change in loans | 32,099 | (156,340 | ) | (190,838 | ) | |||||||
Proceeds on the sale of OREO and repossessed assets | 2,572 | 3,014 | 2,726 | |||||||||
Change in premises and equipment, net | (1,383 | ) | (5,622 | ) | (6,255 | ) | ||||||
Acquisition of SCB, net of cash received | - | - | 7,914 | |||||||||
Acquisition of Peoples, net of cash received | - | 182,413 | - | |||||||||
Acquisition of Kosciusko, net of cash received | 30,437 | - | - | |||||||||
Acquisition of LaPorte, net of cash received | 116,521 | - | - | |||||||||
Acquisition of CNB, net of cash received | 22,549 | - | - | |||||||||
Purchase of Mortgage Company | - | - | (735 | ) | ||||||||
|
|
|
|
|
| |||||||
Net cash provided by (used in) investing activities | 226,390 | (124,188 | ) | (149,046 | ) | |||||||
|
|
|
|
|
| |||||||
Financing Activities | ||||||||||||
Net change in | ||||||||||||
Deposits | 46,590 | 46,747 | 69,780 | |||||||||
Borrowings | (255,994 | ) | 49,421 | 78,068 | ||||||||
Redemption of preferred stock | (12,500 | ) | - | - | ||||||||
Proceeds from issuance of stock | 572 | 4,305 | 165 | |||||||||
Dividends paid on common shares | (8,382 | ) | (6,216 | ) | (4,744 | ) | ||||||
Dividends paid on preferred shares | (42 | ) | (125 | ) | (133 | ) | ||||||
|
|
|
|
|
| |||||||
Net cash provided by (used in) financing activities | (229,756 | ) | 94,132 | 143,136 | ||||||||
|
|
|
|
|
| |||||||
Net Change in Cash and Cash Equivalents | 22,182 | 5,174 | 11,755 | |||||||||
Cash and Cash Equivalents, Beginning of Period | 48,650 | 43,476 | 31,721 | |||||||||
|
|
|
|
|
| |||||||
Cash and Cash Equivalents, End of Period | $ | 70,832 | $ | 48,650 | $ | 43,476 | ||||||
|
|
|
|
|
| |||||||
Continued
63
H ORIZON B ANCORP AND S UBSIDIARIES
Consolidated Statements of Cash Flows
(Dollar Amounts in Thousands)
| Twelve Months Ended December 31 | ||||||||||||
| 2016 | 2015 | 2014 | ||||||||||
Additional Supplemental Information | ||||||||||||
Interest paid | $ | 20,572 | $ | 13,844 | $ | 13,230 | ||||||
Income taxes paid | 6,916 | 4,123 | 2,800 | |||||||||
Transfer of loans to other real estate owned | 3,679 | 5,567 | 3,905 | |||||||||
Transfer of available-for-sale securities to held-to-maturity | - | - | 167,047 | |||||||||
The Company purchased all of the capital stock of Kosciusko for $22,983 on June 1, 2016. In conjunction with the acquisition, liabilities were assumed as follows: | ||||||||||||
Fair value of assets acquired | 155,873 | - | - | |||||||||
Less: common stock issued | 14,470 | - | - | |||||||||
Cash paid for the capital stock | 8,513 | - | - | |||||||||
Liabilities assumed | 132,890 | - | - | |||||||||
The Company purchased all of the capital stock of LaPorte Bancorp for $98,634 on July 18, 2016. In conjunction with the acquisition, liabilities were assumed as follows: | ||||||||||||
Fair value of assets acquired | 549,412 | - | - | |||||||||
Less: common stock issued | 60,306 | - | - | |||||||||
Cash paid for the capital stock | 38,328 | - | - | |||||||||
Liabilities assumed | 450,778 | - | - | |||||||||
The Company purchased all of the capital stock of CNB Bancorp for $5,311 on November 7, 2016. In conjunction with the acquisition, liabilities were assumed as follows: | - | - | ||||||||||
Fair value of assets acquired | 56,219 | - | - | |||||||||
Less: cash paid for the capital stock | 5,311 | - | - | |||||||||
Liabilities assumed | 50,908 | - | - | |||||||||
The Company purchased all of the capital stock of Summit for $18,896 on April 3, 2014 and Peoples for $78,147 on July 1, 2015. In conjunction with the acquisition, liabilities were assumed as follows: | ||||||||||||
Fair value of assets acquired | - | 485,077 | 158,585 | |||||||||
Cash paid to retire debt | - | - | 1,029 | |||||||||
Less: common stock issued | - | 55,506 | 12,689 | |||||||||
Cash paid for the capital stock | - | 22,641 | 6,207 | |||||||||
Liabilities assumed | - | 406,930 | 138,660 | |||||||||
See notes to consolidated financial statements
64
H ORIZON B ANCORP AND S UBSIDIARIES
Notes to Consolidated Financial Statements
(Table dollars in thousands except for per share data)
Note 1 - Nature of Operations and Summary of Significant Accounting Policies
Nature of Business - The consolidated financial statements of Horizon Bancorp ("Horizon") and its wholly owned subsidiaries, Horizon Bank, N.A. ("Bank"), Horizon Risk Management, Inc. and LSB Risk Management, Inc., together referred to as "Horizon" conform to accounting principles generally accepted in the United States of America and reporting practices followed by the banking industry. Horizon Risk Management, Inc. is a captive insurance company incorporated in Nevada and was formed as a wholly owned subsidiary of Horizon. LSB Risk Management, Inc. is a captive insurance company incorporated in Nevada and acquired by Horizon as part of its LaPorte Bancorp acquisition.
The Bank is a full-service commercial bank offering a broad range of commercial and retail banking and other services incident to banking along with a trust department that offers corporate and individual trust and agency services and investment management services. The Bank maintains 56 full service offices. The Bank has wholly owned direct and indirect subsidiaries: Horizon Investments, Inc. ("Horizon Investments"), Horizon Properties, Inc. ("Horizon Properties"), Horizon Insurance Services, Inc. ("Horizon Insurance") and Horizon Grantor Trust. Horizon Investments manages the investment portfolio of the Bank. Horizon Properties manages the real estate investment trust. Horizon Insurance is used by the Company's Wealth Management to sell certain insurance products. Horizon Grantor Trust holds title to certain company owned life insurance policies. Horizon conducts no business except that incident to its ownership of the subsidiaries.
Horizon formed Horizon Bancorp Capital Trust II in 2004 ("Trust II") and Horizon Bancorp Capital Trust III in 2006 ("Trust III") for the purpose of participating in pooled trust preferred securities offerings. The Company assumed additional debentures as the result of the following acquisitions: Alliance Financial Corporation in 2005, which formed Alliance Financial Statutory Trust I ("Alliance Trust"); American Trust & Savings Bank in 2010, which formed Am Tru Statutory Trust I ("Am Tru Trust"); Heartland Bancshares, Inc. in 2013, which formed Heartland (IN) Statutory Trust II ("Heartland Trust"); and LaPorte Bancorp, Inc. in 2016, which acquired City Savings Statutory Trust I ("City Savings Trust") in 2007. See Note 15 of the Consolidated Financial Statements for further discussion regarding these previously consolidated entities that are now reported separately. The business of Horizon is not seasonal to any material degree.
Basis of Reporting - The consolidated financial statements include the accounts of Horizon and subsidiaries. All material inter-company accounts and transactions have been eliminated in consolidation.
Use of Estimates - The preparation of financial statements in conformity with accounting principles generally accepted in the United States of America requires management to make estimates and assumptions that affect the reported amounts of assets and liabilities and disclosure of contingent assets and liabilities at the date of the financial statements and the reported amounts of revenue and expenses during the reporting period. Actual results could differ from those estimates.
Material estimates that are particularly susceptible to significant change relate to the determination of the allowance for loan losses, valuation of other real estate owned, goodwill and intangible assets, mortgage servicing rights, other-than-temporary impairments and fair values of financial instruments.
Fair Value Measurements - Horizon uses fair value measurements to record fair value adjustments, to certain assets, and liabilities and to determine fair value disclosures. Horizon has adopted Accounting Standards Codification (ASC) 820, Fair Value Measurements and Disclosures for all applicable financial and nonfinancial assets and liabilities. This accounting guidance defines fair value, establishes a framework for measuring fair value and expands disclosures about fair value measurements. This guidance applies only when other guidance requires or permits assets or liabilities to be measured at fair value; it does not expand the use of fair value in any new circumstances.
As defined in codification, fair value is the price to sell an asset or transfer a liability in an orderly transaction between market participants. It represents an exit price at the measurement date. Market participants are buyers and sellers, who are independent, knowledgeable, and willing and able to transact in the principal (or most advantageous) market for the asset or liability being measured. Current market conditions, including imbalances between supply and demand, are considered
65
H ORIZON B ANCORP AND S UBSIDIARIES
Notes to Consolidated Financial Statements
(Table dollars in thousands except for per share data)
in determining fair value. Horizon values its assets and liabilities in the principal market where it sells the particular asset or transfers the liability with the greatest volume and level of activity. In the absence of a principal market, the valuation is based on the most advantageous market for the asset or liability (i.e., the market where the asset could be sold or the liability transferred at a price that maximizes the amount to be received for the asset or minimizes the amount to be paid to transfer the liability).
In measuring the fair value of an asset, Horizon assumes the highest and best use of the asset by a market participant to maximize the value of the asset, and does not consider the intended use of the asset.
When measuring the fair value of a liability, Horizon assumes that the nonperformance risk associated with the liability is the same before and after the transfer. Nonperformance risk is the risk that an obligation will not be satisfied and encompasses not only Horizon's own credit risk (i.e., the risk that Horizon will fail to meet its obligation), but also other risks such as settlement risk. Horizon considers the effect of its own credit risk on the fair value for any period in which fair value is measured.
There are three acceptable valuation techniques that can be used to measure fair value: the market approach, the income approach and the cost approach. Selection of the appropriate technique for valuing a particular asset or liability takes into consideration the exit market, the nature of the asset or liability being valued, and how a market participant would value the same asset or liability. Ultimately, determination of the appropriate valuation method requires significant judgment, and sufficient knowledge and expertise are required to apply the valuation techniques.
Valuation inputs refer to the assumptions market participants would use in pricing a given asset or liability using one of the three valuation techniques. Inputs can be observable or unobservable. Observable inputs are those assumptions which market participants would use in pricing the particular asset or liability. These inputs are based on market data and are obtained from a source independent of Horizon. Unobservable inputs are assumptions based on Horizon's own information or estimate of assumptions used by market participants in pricing the asset or liability. Unobservable inputs are based on the best and most current information available on the measurement date. All inputs, whether observable or unobservable, are ranked in accordance with a prescribed fair value hierarchy which gives the highest ranking to quoted prices (unadjusted) in active markets for identical assets or liabilities (Level 1) and the lowest ranking to unobservable inputs (Level 3). Fair values for assets or liabilities classified as Level 2 are based on one or a combination of the following factors: (i) quoted prices for similar assets; (ii) observable inputs for the asset or liability, such as interest rates or yield curves; or (iii) inputs derived principally from or corroborated by observable market data. The level in the fair value hierarchy within which the fair value measurement in its entirety falls is determined based on the lowest level input that is significant to the fair value measurement in its entirety. The Company considers an input to be significant if it drives 10% or more of the total fair value of a particular asset or liability.
Assets and liabilities are considered to be fair valued on a recurring basis if fair value is measured regularly (i.e., daily, weekly, monthly or quarterly). Recurring valuation occurs at a minimum on the measurement date. Assets and liabilities are considered to be fair valued on a nonrecurring basis if the fair value measurement of the instrument does not necessarily result in a change in the amount recorded on the balance sheet. Generally, nonrecurring valuation is the result of the application of other accounting pronouncements which require assets or liabilities to be assessed for impairment or recorded at the lower of cost or fair value. The fair value of assets or liabilities transferred in or out of Level 3 is measured on the transfer date, with any additional changes in fair value subsequent to the transfer considered to be realized or unrealized gains or losses.
Investment Securities Available for Sale - Horizon designates the majority of its investment portfolio as available for sale based on management's plans to use such securities for asset and liability management, liquidity and not to hold such securities as long-term investments. Management repositions the portfolio to take advantage of future expected interest rate trends when Horizon's long-term profitability can be enhanced. Investment securities available for sale and marketable equity securities are carried at estimated fair value and any net unrealized gains/losses (after tax) on these securities are included in accumulated other comprehensive income. Amortization of premiums and accretion of discounts are recorded as interest income from securities. Gains/losses on the disposition of securities available for sale are recognized at the time of the transaction and are determined by the specific identification method.
66
H ORIZON B ANCORP AND S UBSIDIARIES
Notes to Consolidated Financial Statements
(Table dollars in thousands except for per share data)
Investment Securities Held to Maturity - Includes any security for which Horizon has the positive intent and ability to hold until maturity. These securities are carried at amortized cost.
Loans Held for Sale - Mortgage loans originated and intended for sale in the secondary market are carried at the lower of cost or fair value in the aggregate. Net unrealized losses, if any, are recognized through a valuation allowance by charges to noninterest income. Gains and losses on loan sales are recorded in noninterest income, and direct loan origination costs and fees are deferred at origination of the loan and are recognized in noninterest income upon sale of the loan.
Interest and Fees on Loans - Interest on commercial, mortgage and installment loans is recognized over the term of the loans based on the principal amount outstanding. When principal or interest is past due 90 days or more, and the loan is not well secured or in the process of collection, or when serious doubt exists as to the collectability of a loan, the accrual of interest is discontinued. Loan origination fees, net of direct loan origination costs, are deferred and recognized over the life of the loan as a yield adjustment. Discounts and premiums on purchased loans are amortized to income using the interest method over the remaining period to contractual maturity, adjusted for anticipated prepayments.
Concentrations of Credit Risk - The Bank grants commercial, real estate, and consumer loans to customers located primarily in Northern and Central Indiana and Southwestern and Central Michigan and provides mortgage warehouse lines to mortgage companies in the United States. Commercial loans make up approximately 46% of the loan portfolio and are secured by both real estate and business assets. These loans are expected to be repaid from cash flows from operations of the businesses. The Bank does not have a concentration in speculative commercial real estate loans. Residential real estate loans make up approximately 25% of the loan portfolio and are secured by residential real estate. Installment loans make up approximately 20% of the loan portfolio and are primarily secured by consumer assets. Mortgage warehouse loans make up approximately 6% of the loan portfolio and are secured by residential real estate.
Mortgage Warehouse Loans - Horizon's mortgage warehousing has specific mortgage companies as customers of the Bank. Individual mortgage loans originated by these mortgage companies are funded as a secured borrowing with pledge of collateral under Horizon's agreement with the mortgage company. Each individual mortgage is assigned to Horizon until the loan is sold to the secondary market by the mortgage company. In addition, Horizon takes possession of each original note and forwards such note to the end investor once the mortgage company has sold the loan. At the time a loan is transferred to the secondary market, the mortgage company reacquires the loan under its option within the agreement.
The transaction does not qualify as a sale under ASC 860, Transfers and Servicing and therefore is accounted for as a secured borrowing with pledge of collateral pursuant to the agreement with the mortgage company. When the individual loan is sold to the end investor by the mortgage company, the proceeds from the sale of the loan are received by Horizon and used to pay off the loan balance with Horizon along with any accrued interest and any related fees. The remaining balance from the sale is forwarded to the mortgage company. These individual loans typically are sold by the mortgage company within 30 days and are seldom held more than 90 days. Interest income is accrued during this period and collected at the time each loan is sold. Fee income for each loan sold is collected when the loan is sold and no costs are deferred due to the term between each loan funding and related payoff, which is typically less than 30 days.
Based on the agreements with each mortgage company, at any time a mortgage company can reacquire from Horizon its outstanding loan balance on an individual mortgage and regain possession of the original note. Horizon also has the option to request that the mortgage company reacquire an individual mortgage. Should this occur, Horizon would return the original note and reassign the assignment of the mortgage to the mortgage company. Also, in the event that the end investor would not be able to honor the sales commitment and the mortgage company would not be able to reacquire its loan on an individual mortgage, Horizon would be able to exercise its rights under the agreement.
Allowance for Loan Losses - An allowance for loan losses is maintained to absorb probable incurred losses inherent in the loan portfolio. The allowance is based on ongoing quarterly assessments of the probable incurred losses inherent in the
67
H ORIZON B ANCORP AND S UBSIDIARIES
Notes to Consolidated Financial Statements
(Table dollars in thousands except for per share data)
loan portfolio. The allowance is increased by the provision for credit losses, which is charged against current period operating results and decreased by the amount of charge offs, net of recoveries. Horizon's methodology for assessing the appropriateness of the allowance consists of several key elements, which include the general allowance, specific allowances for identified problem loans and the qualitative allowance.
The general allowance is calculated by applying loss factors to pools of outstanding loans. Loss factors are based on historical loss experience and may be adjusted for significant factors that, in management's judgment, affect the collectability of the portfolio as of the evaluation date.
Specific allowances are established in cases where management has identified conditions or circumstances related to a credit that management believes indicate the probability that a loss will be incurred in excess of the amount determined by the application of the formula allowance.
The qualitative allowance is based upon management's evaluation of various conditions, the effects of which are not directly measured in the determination of the general and specific allowances. The evaluation of the inherent loss with respect to these conditions is subject to a higher degree of uncertainty because they are not identified with specific credits. The conditions evaluated in connection with the qualitative allowance may include factors such as local, regional and national economic conditions and forecasts, concentrations of credit and changes in the composition of the portfolio.
Loan Impairment - When analysis determines a borrower's operating results and financial condition are not adequate to meet debt service requirements, the loan is evaluated for impairment. Often this is associated with a delay or shortfall in payments of 30 days or more. Loans are generally placed on non-accrual status when 90 days or more past due. These loans are also often considered impaired. Impaired loans or portions thereof, are charged-off when deemed uncollectible. This typically occurs when the loan is 90 or more days past due.
Loans are considered impaired if the borrower does not exhibit the ability to pay or the full principal or interest payments are not expected or made in accordance with the original terms of the loan. Impaired loans are measured and carried at the lower of cost or the present value of expected future cash flows discounted at the loan's effective interest rate, at the loan's observable market price or at the fair value of the collateral if the loan is collateral dependent.
Smaller balance homogenous loans are evaluated for impairment in the aggregate. Such loans include residential first mortgage loans secured by one to four family residences, residential construction loans and automobile, home equity and second mortgages. Commercial loans and mortgage loans secured by other properties are evaluated individually for impairment.
Loans Acquired in Business Combinations - Loans acquired in business combinations with evidence of credit deterioration since origination and for which it is probable that all contractually required payments will not be collected are considered to be credit impaired. Evidence of credit quality deterioration as of purchase dates may include information such as past-due and nonaccrual status, borrower credit scores and recent loans to value percentages. Acquired credit-impaired loans are accounted for under the accounting guidance for loans and debt securities acquired with deteriorated credit quality (FASB ASC 310-30) and initially measured at fair value, which includes estimated future credit losses expected to be incurred over the life of the loans. Accordingly, allowances for credit losses related to these loans are not carried over and recorded at the acquisition dates. As a result, related discounts are recognized subsequently through accretion based on the expected cash flows of the acquired loans. For purposes of applying FASB ASC 310-30, loans acquired in business combinations are aggregated into pools of loans with common risk characteristics.
The expected cash flows of the acquired loan pools in excess of the fair values recorded is referred to as the accretable yield and is recognized in interest income over the remaining estimated lives of the loan pools. The Company continues to evaluate the fair value of the loans including cash flows expected to be collected. Increases in the Company's cash flow expectation are recognized as increases to the accretable yield while decreases are recognized as impairments through the allowance for loan losses.
Performing loans acquired (FASB ASC 310-20) with credit impairment subsequent to the acquisition date are evaluated individually and charged down to the fair value of the underlying collateral in the period the uncollectible loss is reasonably determined.
68
H ORIZON B ANCORP AND S UBSIDIARIES
Notes to Consolidated Financial Statements
(Table dollars in thousands except for per share data)
Premises and Equipment - Buildings and major improvements are capitalized and depreciated using primarily the straight-line method with useful lives ranging from 3 to 40 years. Furniture and equipment are capitalized and depreciated using primarily the straight-line method with useful lives ranging from 2 to 20 years. Maintenance and repairs are expensed as incurred while major additions and improvements are capitalized. Gains and losses on disposition are included in current operations.
Federal Reserve and Federal Home Loan Bank of Indianapolis (FHLBI) Stock - The stock is a required investment for institutions that are members of the Federal Reserve Bank ("FRB") and Federal Home Loan Bank ("FHLB") systems. The required investment in the common stock is based on a predetermined formula.
Mortgage Servicing Rights -Mortgage servicing assets are recognized separately when rights are acquired through purchase or through sale of financial assets. Under the servicing assets and liabilities accounting guidance (ASC 860-50), servicing rights resulting from the sale or securitization of loans originated by the Company are initially measured at fair value at the date of transfer. Amortized mortgage servicing rights include commercial mortgage servicing rights. Under the amortization method, servicing rights are amortized in proportion to and over the period of estimated net servicing income. The amortized assets are assessed for impairment or increased obligation based on fair value at each reporting date.
Fair value is based on market prices for comparable mortgage servicing contracts, when available, or alternatively, is based on a valuation model that calculates the present value of estimated future net servicing income. The valuation model incorporates assumptions that market participants would use in estimating future net servicing income, such as the cost to service, the discount rate, the custodial earnings rate, an inflation rate, ancillary income, prepayment speeds and default rates and losses. These variables change from quarter to quarter as market conditions and projected interest rates change, and may have an adverse impact on the value of the mortgage servicing right and may result in a reduction to noninterest income.
Each class of separately recognized servicing assets subsequently measured using the amortization method are evaluated and measured for impairment. Impairment is determined by stratifying rights into tranches based on predominant characteristics, such as interest rate, loan type and investor type. Impairment is recognized through a valuation allowance for an individual tranche, to the extent that fair value is less than the carrying amount of the servicing assets for that tranche. The valuation allowance is adjusted to reflect changes in the measurement of impairment after the initial measurement of impairment. Changes in valuation allowances are reported with mortgage servicing income net of impairment on the income statement. Fair value in excess of the carrying amount of servicing assets for that stratum is not recognized.
Servicing fee income is recorded for fees earned for servicing loans. The fees are based on a contractual percentage of the outstanding principal or a fixed amount per loan and are recorded as income when earned. The amortization of mortgage servicing rights is netted against loan servicing fee income.
Intangible Assets - Goodwill is tested annually for impairment. At December 31, 2016, Horizon had core deposit intangibles of $9.4 million subject to amortization and $76.9 million of goodwill, which is not subject to amortization. Goodwill arising from business combinations represents the value attributable to unidentifiable intangible assets in the business acquired. Horizon's goodwill relates to the value inherent in the banking industry and that value is dependent upon the ability of Horizon to provide quality, cost effective banking services in a competitive marketplace. The goodwill value is supported by revenue that is in part driven by the volume of business transacted. If the implied fair value of goodwill is lower than its carrying amount, goodwill impairment is indicated and goodwill is written down to its implied fair value. Goodwill totaled $76.9 million at December 31, 2016 and $49.6 million at December 31, 2015. A large majority of the goodwill relates to the acquisitions of Heartland, Summit, Peoples, Kosciusko and LaPorte.
69
H ORIZON B ANCORP AND S UBSIDIARIES
Notes to Consolidated Financial Statements
(Table dollars in thousands except for per share data)
Bank Owned Life Insurance (BOLI) – BOLI has been purchased on certain employees and directors of the Company. The Company records the life insurance at the amount that can be realized under the insurance contract at the balance sheet date, which is the cash surrender value adjusted for other charges or amounts due that are probable at settlement.
Income Taxes -The Company accounts for income taxes in accordance with income tax accounting guidance (ASC 740, Income Taxes ). The income tax accounting guidance results in two components of income tax expense: current and deferred. Current income tax expense reflects taxes to be paid or refunded for the current period by applying the provisions of the enacted tax law to the taxable income or excess of deductions over revenues. The Company determines deferred income taxes using the liability (or balance sheet) method. Under this method, the net deferred tax asset or liability is based on the tax effects of the differences between the book and tax bases of assets and liabilities, and enacted changes in tax rates and laws are recognized in the period in which they occur. Deferred income tax expense results from changes in deferred tax assets and liabilities between periods. Deferred tax assets are reduced by a valuation allowance if, based on the weight of evidence available, it is more likely than not that some portion or all of a deferred tax asset will not be realized.
Uncertain tax positions are recognized if it is more likely than not, based on the technical merits, that the tax position will be realized or sustained upon examination. The term more likely than not means a likelihood of more than 50 percent; the terms examined and upon examination also include resolution of the related appeals or litigation processes, if any. A tax position that meets the more-likely-than-not recognition threshold is initially and subsequently measured as the largest amount of tax benefit that has a greater than 50 percent likelihood of being realized upon settlement with a taxing authority that has full knowledge of all relevant information. The determination of whether or not a tax position has met the more-likely-than-not recognition threshold considers the facts, circumstances and information available at the reporting date and is subject to management's judgment.
The Company recognizes interest and penalties on income taxes as a component of income tax expense.
The Company files consolidated income tax returns with its subsidiaries.
Trust Assets and Income - Property, other than cash deposits, held in a fiduciary or agency capacity is not included in the consolidated balance sheets since such property is not owned by Horizon.
Transfer of Financial Assets - The transfer of financial assets are accounted for as sales, when control over the assets has been surrendered. Control over transferred assets is deemed to be surrendered when (1) the assets have been isolated from the Company and put presumptively beyond the reach of the transferor and its creditors, even in bankruptcy or other receivership, (2) the transferee obtains the right (free of conditions that constrain it from taking advantage of that right) to pledge or exchange the transferred assets and (3) the Company does not maintain effective control over the transferred assets through an agreement to repurchase them before their maturity or the ability to unilaterally cause the holder to return specific assets.
70
H ORIZON B ANCORP AND S UBSIDIARIES
Notes to Consolidated Financial Statements
(Table dollars in thousands except for per share data)
Earnings per Common Share - Basic earnings per share is computed by dividing net income available to common shareholders (net income less dividend requirements for preferred stock and accretion of preferred stock discount) by the weighted-average number of common shares outstanding. Diluted earnings per share reflect the potential dilution that could occur if securities or other contracts to issue common stock were exercised or converted into common stock. The following table shows computation of basic and diluted earnings per share.
| Years Ended December 31 | ||||||||||||
| 2016 | 2015 | 2014 | ||||||||||
Basic earnings per share | ||||||||||||
Net income | $ | 23,912 | $ | 20,549 | $ | 18,101 | ||||||
Less: Preferred stock dividends | 42 | 125 | 133 | |||||||||
|
|
|
|
|
| |||||||
Net income available to common shareholders | $ | 23,870 | $ | 20,424 | $ | 17,968 | ||||||
Weighted average common shares outstanding (1) | 19,987,728 | 15,765,444 | 13,591,053 | |||||||||
Basic earnings per share | $ | 1.19 | $ | 1.30 | $ | 1.32 | ||||||
|
|
|
|
|
| |||||||
Diluted earnings per share | ||||||||||||
Net income available to common shareholders | $ | 23,870 | $ | 20,424 | $ | 17,968 | ||||||
Weighted average common shares outstanding (1) | 19,987,728 | 15,765,444 | 13,591,053 | |||||||||
Effect of dilutive securities: | ||||||||||||
Warrants | - | 330,474 | 473,519 | |||||||||
Restricted stock | 26,553 | 48,015 | 59,214 | |||||||||
Stock options | 68,129 | 53,379 | 57,402 | |||||||||
|
|
|
|
|
| |||||||
Weighted average shares outstanding | 20,082,410 | 16,197,312 | 14,181,188 | |||||||||
Diluted earnings per share | $ | 1.19 | $ | 1.26 | $ | 1.27 | ||||||
|
|
|
|
|
| |||||||
| (1) | Adjusted for 3:2 stock split on November 14, 2016 |
At December 31, 2016 there were zero shares and at December 31, 2015 and 2014 there were 3,750 and 3,750 shares that were not included in the computation of diluted earnings per share because they were non-dilutive.
Dividend Restrictions - Regulations of the OCC limit the amount of dividends that may be paid by a national bank to its parent holding company without prior approval of the OCC. At December 31, 2016, $6.6 million was available for payment of dividends from the Bank to Horizon. Additionally, the Federal Reserve Board limits the amount of dividends that may be paid by Horizon to its stockholders under its capital adequacy guidelines.
Consolidated Statements of Cash Flows - For purposes of reporting cash flows, cash and cash equivalents are defined to include cash and due from banks, money market investments and federal funds sold with maturities of one day or less. Horizon reports net cash flows for customer loan transactions, deposit transactions, short-term investments and borrowings.
Comprehensive Income - Comprehensive income consists of net income and other comprehensive income (loss), net of applicable income taxes. Other comprehensive income (loss) includes unrealized appreciation (depreciation) on available-for-sale securities, unrealized and realized gains and losses in derivative financial instruments and amortization of available-for-sale securities transferred to held-to-maturity.
Share-Based Compensation - At December 31, 2016, Horizon has share-based compensation plans, which are described more fully in Note 22. All share-based payments are to be recognized as expense, based upon their fair values, in the financial statements over the vesting period of the awards. Horizon has recorded approximately $608,000, $643,000, and $566,000 for 2016, 2015 and 2014, in compensation expense relating to vesting of stock options less estimated forfeitures for the 12-month period ended December 31, 2016, 2015 and 2014.
71
H ORIZON B ANCORP AND S UBSIDIARIES
Notes to Consolidated Financial Statements
(Table dollars in thousands except for per share data)
Reclassifications - Certain reclassifications have been made to the 2015 consolidated financial statements to be comparable to 2016. These reclassifications had no effect on net income.
Recent Accounting Pronouncements
FASB Accounting Standards Updates No. 2017-04, Intangibles – Goodwill and Other (Topic 350): Simplifying the Test for Goodwill Impairment
The FASB has issued Accounting Standards Update (ASU) No. 2017-04, Intangibles – Goodwill and Other (Topic 350): Simplifying the Test for Goodwill Impairment. The new guidance is intended to simplify the subsequent measurement of goodwill by eliminating Step 2 from the goodwill impairment test. The annual, or interim, goodwill impairment test is performed by comparing the fair value of a reporting unit with its carrying amount. An impairment charge should be recognized for the amount by which the carrying amount exceeds the reporting unit's fair value; however, the loss recognized should not exceed the total amount of goodwill allocated to that reporting unit. In addition, the income tax effects of tax deductible goodwill on the carrying amount of the reporting unit should be considered when measuring the goodwill impairment loss, if applicable. The amendments also eliminate the requirements for any reporting unit with a zero or negative carrying amount to perform Step 2 of the goodwill impairment test. An entity still has the option to perform the qualitative assessment for a reporting unit to determine if the qualitative impairment test is necessary. The amendments should be applied on a prospective basis. The nature of and reason for the change in accounting principle should be disclosed upon transition. The amendments in this update should be adopted for annual or any interim goodwill impairment tests in fiscal years beginning after December 15, 2019. Early adoption is permitted on testing dates after January 1, 2017. We are currently evaluating the impact of adopting the new guidance on the consolidated financial statements, but it is not expected to have a material impact.
FASB Accounting Standards Updates No. 2017-01, Business Combinations (Topic 805): Clarifying the Definition of a Business
The FASB has issued Accounting Standards Update (ASU) No. 2017-01, Business Combinations (Topic 805): Clarifying the Definition of a Business. The amendments in this update provide a more robust framework to use in determining when a set of assets and activities is a business. Because the current definition of a business is interpreted broadly and can be difficult to apply, stakeholders indicated that analyzing transactions is inefficient and costly and that the definition does not permit the use of reasonable judgment. The amendments provide more consistency in applying the guidance, reduce the costs of application, and make the definition of a business more operable. The amendments in this update become effective for annual periods and interim periods within those annual periods beginning after December 15, 2017. We are currently evaluating the impact of adopting the new guidance on the consolidated financial statements, but it is not expected to have a material impact.
72
H ORIZON B ANCORP AND S UBSIDIARIES
Notes to Consolidated Financial Statements
(Table dollars in thousands except for per share data)
FASB Accounting Standards Updates No. 2016-15, Statement of Cash Flows (Topic 230)
The FASB has issued Accounting Standards Update (ASU) No. 2016-15, Statement of Cash Flows (Topic 230) . This update addresses eight specific cash flow issues with the objective of reducing the existing diversity in practice of how certain cash receipts and cash payments are presented and classified in the statement of cash flow. In November 2016, the FASB issued ASU No. 2016-18, which gave clarification on how restricted cash was to be presented in the cash flow statement. The Company elected to adopt these updates as of December 31, 2016, and there was no material impact on the consolidated financial statements.
FASB Accounting Standards Updates No. 2016-13, Financial Instruments – Credit Losses (Topic 326): Measurement of Credit Losses on Financial Instruments
The FASB has issued Accounting Standards Update (ASU) No. 2016-13, Financial Instruments – Credit Losses (Topic 326): Measurement of Credit Losses on Financial Instruments. The main objective of this amendment is to provide financial statement users with more decision-useful information about the expected credit losses on financial instruments and other commitments to extend credit held by a reporting entity at each reporting date. The amendment requires the measurement of all expected credit losses for financial assets held at the reporting date based on historical experience, current conditions, and reasonable and supportable forecasts. Financial institutions and other organizations will now use forward-looking information to enhance their credit loss estimates. The amendment requires enhanced disclosures to help investors and other financial statement users better understand significant estimates and judgments used in estimating credit losses, as well as the credit quality and underwriting standards of an organization's portfolio. In addition, the ASU amends the accounting for credit losses on available-for-sale debt securities and purchased financial assets with credit deterioration. The amendments in this update become effective for annual periods and interim periods within those annual periods beginning after December 15, 2019. Early adoption will be permitted beginning after December 15, 2018. We have formed a cross functional committee that is assessing our data and system needs and are evaluating the impact of adopting the new guidance. We expect to recognize a one-time cumulative effect adjustment to the allowance for loan losses as of the beginning of the first reporting period in which the new standard is effective, but cannot yet determine the magnitude of any such one-time adjustment or the overall impact of the new guidance on the consolidated financial statements.
73
H ORIZON B ANCORP AND S UBSIDIARIES
Notes to Consolidated Financial Statements
(Table dollars in thousands except for per share data)
FASB Accounting Standards Updates No. 2016-09, Compensation – Stock Compensation (Topic 718): Improvements to Employee Share-Based Payment Accounting
The FASB has issued Accounting Standards Update (ASU) No. 2016-09, Compensation – Stock Compensation (Topic 718): Improvements to Employee Shared-Base Payment Accounting. The amendments are intended to improve the accounting for employee shared-base payments and affects all organizations that issue share-based payment awards to their employees. Several aspects of the accounting for share-based payment award transactions are simplified, including the income tax consequences, the classification of awards as either equity or liabilities, and the classification on the statement of cash flows. The amendments in this update became effective on January 1, 2017 and did not have a material impact on the consolidated financial statements.
74
H ORIZON B ANCORP AND S UBSIDIARIES
Notes to Consolidated Financial Statements
(Table dollars in thousands except for per share data)
FASB Accounting Standards Updates No. 2016-05, Derivatives and Hedging (Topic 815): Effect of Derivative Contract Novations and Existing Hedge Accounting Relationships
The FASB has issued Accounting Standards Update (ASU) No. 2016-05, Derivatives and Hedging (Topic 815): Effect of Derivative Contract Novations and Existing Hedge Accounting Relationships. The amendments apply to all reporting entities for which there is a change in the counterparty to a derivative instrument that has been designated as a hedging instrument. The amendments clarify that a change in the counterparty to a derivative instrument that has been designated as the hedging instrument does not, in and of itself, require de-designation of that hedging relationship provided that all other hedge accounting criteria continue to be met. The amendments in this update became effective for annual periods and interim periods within those annual periods beginning after December 15, 2016, and did not have a material impact on the consolidated financial statements.
FASB Accounting Standards Updates No. 2016-02, Leases (Topic 842)
The FASB has issued Accounting Standards Update (ASU) No. 2016-02, Leases. Under the new guidance, lessees will be required to recognize the following for all leases, with the exception of short-term leases, at the commencement date: (1) a lease liability, which is a lessee's obligation to make lease payments arising from a lease, measured on a discounted basis; and (2) a right-of-use asset, which is an asset that represents the lessee's right to use, or control the use of, a specified asset for the lease term. Under the new guidance, lessor accounting is largely unchanged. The amendments in this update become effective for annual periods and interim periods within those annual periods beginning after December 15, 2018. Based on leases outstanding as of December 31, 2016, we do not expect the new standard to have a material impact on our income statement, but anticipate an $80 million to $100 million increase in our assets and liabilities. Decisions to repurchase, modify or renew leases prior to the implementation date will impact this level of materiality.
FASB Accounting Standards Updates No. 2016-01, Financial Instruments – Overall (Subtopic 825-10): Recognition and Measurement of Financial Assets and Financial Liabilities
The FASB has issued Accounting Standards Update (ASU) No. 2016-01, Financial Instruments – Overall (Subtopic 825-10): Recognition and Measurement of Financial Assets and Financial Liabilities. The new guidance is intended to improve the recognition and measurement of financial instruments. The ASU affects public and private companies, not-for-profit organizations, and employee benefit plans that hold financial assets or owe financial liabilities.
The new guidance makes targeted improvements to existing U.S. GAAP by:
| • | Requiring equity investments (except those accounted for under the equity method of accounting, or those that result in consolidation of the investee) to be measured at fair value with changes in fair value recognized in net income; |
| • | Requiring public business entities to use the exit price notion when measuring the fair value of financial instruments for disclosure purposes; |
| • | Requiring separate presentation of financial assets and financial liabilities by measurement category and form of financial asset (i.e., securities or loans and receivables) on the balance sheet or the accompanying notes to the financial statements; |
| • | Eliminating the requirement to disclose the fair value of financial instruments measured at amortized cost for organizations that are not public business entities; |
| • | Eliminating the requirement for public business entities to disclose the method(s) and significant assumptions used to estimate the fair value that is required to be disclosed for financial instruments measured at amortized cost on the balance sheet; and |
| • | Requiring a reporting organization to present separately in other comprehensive income the portion of the total change in the fair value of a liability resulting from a change in the instrument-specific credit risk (also referred to as "own credit") when the organization has elected to measure the liability at fair value in accordance with the fair value option for financial instruments. |
75
H ORIZON B ANCORP AND S UBSIDIARIES
Notes to Consolidated Financial Statements
(Table dollars in thousands except for per share data)
The new guidance is effective for public companies for fiscal years beginning after December 15, 2017, including interim periods within those fiscal years. The new guidance permits early adoption of the own credit provision. In addition, the new guidance permits early adoption of the provision that exempts private companies and not-for-profit organizations from having to disclose fair value information about financial instruments measured at amortized cost. Adoption of the ASU is not expected to have a significant effect on the Company's consolidated financial statements.
FASB Accounting Standards Update No. 2015-16, Business Combinations (Topic 805): Simplifying the Accounting for Measurement-Period Adjustments
The FASB has issued Accounting Standards Update (ASU) No. 2015-16, Business Combinations (Topic 805): Simplifying the Accounting for Measurement-Period Adjustments. To simplify the accounting for adjustments made to provisional amounts recognized in a business combination, the amendments eliminate the requirement to retrospectively account for those adjustments.
U.S. GAAP currently requires that during the measurement period, the acquirer retrospectively adjust the provisional amounts recognized at the acquisition date with a corresponding adjustment to goodwill. Those adjustments are required when new information is obtained about facts and circumstances that existed as of the acquisition date that, if known, would have affected the measurement of the amounts initially recognized or would have resulted in the recognition of additional assets or liabilities. The acquirer also must revise comparative information for prior periods presented in financial statements as needed, including revising depreciation, amortization, or other income effects as a result of changes made to provisional amounts.
The amendments require that an acquirer recognize adjustments to provisional amounts that are identified during the measurement period in the reporting period in which the adjustment amounts are determined. The amendments require that the acquirer record, in the same period's financial statements, the effect on earnings of changes in depreciation, amortization, or other income effects, if any, as a result of the change to the provisional amounts, calculated as if the accounting had been completed at the acquisition date.
The amendments require an entity to present separately on the face of the income statement or disclose in the notes the portion of the amount recorded in current-period earnings by line item that would have been recorded in previous reporting periods if the adjustment to the provisional amounts had been recognized as of the acquisition date.
For public business entities, the amendments are effective for fiscal years beginning after December 15, 2015, including interim periods within those fiscal years. Adoption of the ASU is not expected to have a significant effect on the Company's consolidated financial statements.
The only disclosures required at transition should be the nature of and reason for the change in accounting principle. An entity should disclose that information in the first annual period of adoption and in the interim periods within the first annual period if there is a measurement-period adjustment during the first annual period in which the changes are effective.
FASB Accounting Standards Update No. 2015-15, Interest-Imputation of Interest (Subtopic 835-30), Presentation and Subsequent Measurement of Debt Issuance Costs Associated with Line-of-Credit Arrangements
The FASB has issued Accounting Standards Update (ASU) No. 2015-15, Interest - Imputation of Interest (Subtopic 835-30): Presentation and Subsequent Measurement of Debt Issuance Costs Associated with Line-of-Credit Arrangements - Amendments to SEC Paragraphs Pursuant to Staff Announcement at June 18, 2015 EITF Meeting. This ASU adds SEC paragraphs pursuant to the SEC Staff Announcement at the June 18, 2015, Emerging Issues Task Force meeting about the presentation and subsequent measurement of debt issuance costs associated with line-of-credit arrangements.
76
H ORIZON B ANCORP AND S UBSIDIARIES
Notes to Consolidated Financial Statements
(Table dollars in thousands except for per share data)
In April 2015, the FASB issued ASU No. 2015-03, Interest - Imputation of Interest (Subtopic 835-30): Simplifying the Presentation of Debt Issuance Costs, which requires the presentation of debt issuance costs related to a recognized debt liability as a direct deduction from the carrying amount of that debt liability. ASU 2015-03 does not address presentation or subsequent measurement of debt issuance costs related to line-of-credit arrangements.
Given the absence of authoritative guidance within ASU 2015-03 for debt issuance costs related to line-of-credit arrangements, the SEC staff would not object to an entity deferring and presenting debt issuance costs as an asset and subsequently amortizing the deferred debt issuance costs ratably over the term of the line-of-credit arrangement, regardless of whether there are any outstanding borrowings on the line-of-credit arrangement. Adoption of the ASU is not expected to have a significant effect on the Company's consolidated financial statements.
FASB Accounting Standards Update No. 2015-01, Eliminating the Concept of Extraordinary Items
The FASB has issued Accounting Standards Update (ASU) No. 2015-01, Income Statement - Extraordinary and Unusual Items (Subtopic 225-20): Simplifying Income Statement Presentation by Eliminating the Concept of Extraordinary Items. The FASB issued this ASU as part of its initiative to reduce complexity in accounting standards. The objective of the simplification initiative is to identify, evaluate, and improve areas of U.S. GAAP for which cost and complexity can be reduced while maintaining or improving the usefulness of the information provided to the users of financial statements.
This ASU eliminates from U.S. GAAP the concept of extraordinary items. Subtopic 225-20, Income Statement - Extraordinary and Unusual Items, required that an entity separately classify, present, and disclose extraordinary events and transactions. Presently, an event or transaction is presumed to be an ordinary and usual activity of the reporting entity unless evidence clearly supports its classification as an extraordinary item.
If an event or transaction meets the criteria for extraordinary classification, an entity is required to segregate the extraordinary item from the results of ordinary operations and show the item separately in the income statement, net of tax, after income from continuing operations. The entity also is required to disclose applicable income taxes and either present or disclose earnings-per-share data applicable to the extraordinary item. The amendments in this update became effective for interim and annual periods beginning after December 15, 2015 and did not have a material impact on the consolidated financial statements.
FASB Accounting Standards Update No. 2014-12, Compensation – Stock Compensation (Topic 718): Accounting for Share-Based Payments When the Terms of an Award Provide That a Performance Target Could Be Achieved after the Requisite Service Period
The FASB has issued Accounting Standards Update (ASU) No. 2014-12, Compensation – Stock Compensation (Topic 718): Accounting for Share-Based Payments When the Terms of an Award Provide That a Performance Target Could Be Achieved after the Requisite Service Period. Generally, an award with a performance target also requires an employee to render service until the performance target is achieved. In some cases, however, the terms of an award may provide that the performance target could be achieved after an employee completes the requisite service period. The amendments in this update require that a performance target that affects vesting and that could be achieved after the requisite service period be treated as a performance condition. An entity should apply guidance in Topic 718 as it relates to awards with performance conditions that affect vesting to account for such awards. As such, the performance target should not be reflected in estimating the grant-date fair value of the award. Compensation cost should be recognized in the period in which it becomes probable that the performance target will be achieved and should represent the compensation cost attributable to the period for which the service has already been rendered. The amendments in this update became effective for interim and annual periods beginning after December 15, 2015 and did not have a material impact on the consolidated financial statements.
FASB Accounting Standards Update No. 2014-09, Revenue from Contracts with Customers – (Topic 606)
The FASB has issued Accounting Standards Update (ASU) No. 2014-09 creating, Revenue from Contracts with Customers ( Topic 606). The guidance in this update affects any entity that either enters into contracts with customers to transfer goods or services or enters into contracts for the transfer of nonfinancial assets unless those contracts are within the scope of other standards (for example, insurance contracts or lease contracts). The core principle of the guidance is that an entity should recognize revenue to depict the transfer of promised goods or services to customers in an amount that reflects the consideration to which the entity expects to be entitled in exchange for those goods or services. The guidance provides steps to follow to achieve the core principle. An entity should disclose sufficient information to enable users of financial statements to understand the nature, amount, timing and uncertainty of revenue and cash flows arising from contracts with customers. The amendments in this update become effective for annual periods and interim periods within those annual periods beginning after December 15, 2017. We do not expect the new standard, or any of the amendments detailed below, to result in a material change from our current accounting for revenue, as recognition of interest income and the larger sources of non-interest income from Horizon's current financial instruments would not be impacted by the guidance.
In May 2016, the FASB issued ASU No. 2016-12, Revenue from Contracts with Customers (Topic 606): Narrow-Scope Improvements and Practical Expedients. The amendments do not change the core revenue recognition principle in Topic 606. The amendments provide clarifying guidance in certain narrow areas and add some practical expedients.
In December 2016, the FASB issued ASU No. 2016-20, Revenue from Contracts with Customers (Topic 606): Technical Corrections and Improvements. The FASB board decided to issue a separate update for technical corrections and improvements to Topic 606 and other Topics amended by ASU No. 2014-09 to increase awareness of the proposals and to expedite improvements to ASU No. 2014-09. The amendment affects narrow aspects of the guidance issued in ASU No. 2014-09.
77
H ORIZON B ANCORP AND S UBSIDIARIES
Notes to Consolidated Financial Statements
(Table dollars in thousands except for per share data)
Note 2 – Acquisitions
On November 7, 2016, Horizon completed the acquisition of CNB Bancorp, an Indiana corporation headquartered in Attica, Indiana ("CNB") and the Bank's acquisition of The Central National Bank and Trust Company ("Central National Bank & Trust"), through mergers effective November 7, 2016. Under terms of the acquisition, shareholders of CNB received merger consideration in the form of cash. The total value of the consideration for the acquisition was $5.3 million. The Company had approximately $779,000 in costs related to the acquisition as of December 31, 2016. These expenses are classified in the non-interest expense section of the income statement and primarily located in the salaries and employee benefits, professional services and other expense line items. As a result of the acquisition, the Company will have an opportunity to increase its deposit base and reduce transaction costs. The Company also expects to reduce costs through economies of scale.
Under the purchase method of accounting, the total estimated purchase price is allocated to CNB's net tangible and intangible assets based on their current estimated fair values on the date of the acquisition. Based on management's preliminary valuation of the fair value of tangible and intangible assets acquired and liabilities assumed, which are based on estimates and assumptions that are subject to change, the final purchase price for the CNB acquisition is allocated as follows:
ASSETS | LIABILITIES | |||||||||||||
Cash and due from banks | $ | 27,860 | Deposits | |||||||||||
Investment securities, available for sale | 16,393 | Non-interest bearing | $ | 24,079 | ||||||||||
NOW accounts | 9,038 | |||||||||||||
Commercial | 2,267 | Savings and money market | 13,829 | |||||||||||
Residential mortgage | 6,624 | Certificates of deposits | 3,342 | |||||||||||
|
| |||||||||||||
Consumer | 1,579 | Total deposits | 50,288 | |||||||||||
|
| |||||||||||||
Total loans | 10,470 | |||||||||||||
Borrowings | 459 | |||||||||||||
Premises and equipment, net | 444 | Interest payable | 7 | |||||||||||
FHLB stock | 50 | Other liabilities | 154 | |||||||||||
Goodwill | 609 | |||||||||||||
Core deposit intangible | 190 | |||||||||||||
Interest receivable | 154 | |||||||||||||
Other assets | 49 | |||||||||||||
|
|
|
| |||||||||||
Total assets purchased | $ | 56,219 | Total liabilities assumed | $ | 50,908 | |||||||||
|
|
|
| |||||||||||
Cash paid | 5,311 | |||||||||||||
|
| |||||||||||||
Total estimated purchase price | $ | 5,311 | ||||||||||||
|
| |||||||||||||
Of the total purchase price of $5.3 million, $190,000 has been allocated to core deposit intangible. Additionally, $609,000 has been allocated to goodwill and none of the purchase price is deductible. The core deposit intangible will be amortized over 10 years on a straight line basis.
The Company acquired the $10.8 million performing loan portfolio with an estimated fair value of $10.5 million. No loans were purchased with evidence of credit deterioration since origination and for which it is probable that all contractually required payments will not be collected are considered to be credit impaired.
78
H ORIZON B ANCORP AND S UBSIDIARIES
Notes to Consolidated Financial Statements
(Table dollars in thousands except for per share data)
On July 18, 2016, Horizon completed the acquisition of LaPorte Bancorp, Inc., a Maryland corporation ("LaPorte Bancorp") and the Bank's acquisition of The LaPorte Savings Bank, a state-chartered savings bank and wholly owned subsidiary of LaPorte Bancorp, through mergers effective July 18, 2016. Under the terms of the merger agreement, shareholders of LaPorte Bancorp had the option to receive $17.50 per share in cash or 0.9435 shares of Horizon common stock for each share of LaPorte Bancorp's common stock, subject to allocation provisions to assure that in aggregate, LaPorte Bancorp shareholders received total consideration that consisted of 65% stock and 35% cash. As a result of LaPorte Bancorp shareholder stock and cash elections and the related proration provisions of the merger agreement, Horizon issued 3,421,488 shares of its common stock in the merger. Based upon the July 18, 2016 closing price of $18.36 per share of Horizon common stock, less the consideration used to pay off LaPorte Bancorp's ESOP loan receivable, the transaction has an implied valuation of approximately $98.6 million. The Company had approximately $4.0 million in costs related to the acquisition as of December 31, 2016. These expenses are classified in the non-interest expense section of the income statement and primarily located in the salaries and employee benefits, professional services and other expense line items. As a result of the acquisition, the Company was able to increase its deposit base and reduce transaction costs. The Company also expects to reduce costs through economies of scale.
Under the acquisition method of accounting, the total purchase price is allocated to net tangible and intangible assets based on their current estimated fair values on the date of the acquisition. Based on preliminary valuations of the fair value of tangible and intangible assets acquired and liabilities assumed, which are based on assumptions that are subject to change, the purchase price for the LaPorte Bancorp acquisition is detailed in the following table.
ASSETS | LIABILITIES | |||||||||||||
Cash and due from banks | $ | 154,849 | Deposits | |||||||||||
Investment securities, available for sale | 23,779 | Non-interest bearing | $ | 66,733 | ||||||||||
NOW accounts | 99,346 | |||||||||||||
Commercial | 153,750 | Savings and money market | 117,688 | |||||||||||
Residential mortgage | 42,603 | Certificates of deposits | 87,605 | |||||||||||
|
| |||||||||||||
Consumer | 16,801 | Total deposits | 371,372 | |||||||||||
Mortgage Warehousing | 99,752 | |||||||||||||
|
| |||||||||||||
Total loans | 312,906 | |||||||||||||
Borrowings | 64,793 | |||||||||||||
Premises and equipment, net | 6,022 | Interest payable | 178 | |||||||||||
FHLB stock | 4,029 | Subordinated debt | 4,504 | |||||||||||
Goodwill | 20,290 | Other liabilities | 9,931 | |||||||||||
Core deposit intangible | 2,514 | |||||||||||||
Interest receivable | 844 | |||||||||||||
Cash value of life insurance | 15,267 | |||||||||||||
Other assets | 8,912 | |||||||||||||
|
|
|
| |||||||||||
Total assets purchased | $ | 549,412 | Total liabilities assumed | $ | 450,778 | |||||||||
|
|
|
| |||||||||||
Common shares issued | $ | 60,306 | ||||||||||||
Cash paid | 38,328 | |||||||||||||
|
| |||||||||||||
Total estimated purchase price | $ | 98,634 | ||||||||||||
|
| |||||||||||||
Of the total estimated purchase price of $98.6 million, $2.5 million has been allocated to core deposit intangible. Additionally, $20.3 million has been allocated to goodwill and none of the purchase price is deductible. The core deposit intangible will be amortized over 10 years on a straight line basis.
The Company acquired certain loans in the acquisition and the transferred loans had evidence of deterioration of credit quality since origination and it was probable, at acquisition, that all contractually required payments would not be collected.
79
H ORIZON B ANCORP AND S UBSIDIARIES
Notes to Consolidated Financial Statements
(Table dollars in thousands except for per share data)
Loans purchased with evidence of credit deterioration since origination and for which it is probable that all contractually required payments will not be collected are considered to be credit impaired. Evidence of credit quality deterioration as of the purchase date may include information such as past-due and non-accrual status, borrower credit scores and recent loan-to-value percentages. Purchased credit-impaired loans are accounted for under the accounting guidance for loans and debt securities acquired with deteriorated credit quality (ASC 310-30) and initially measured at fair value, which includes estimated future credit losses expected to be incurred over the life of the loan. Accordingly, an allowance for credit losses related to these loans is not carried over and recorded at the acquisition date. Management estimated the cash flows expected to be collected at acquisition using our internal risk models, which incorporate the estimate of current key assumptions, such as default rates, severity and prepayment speeds.
Loans with specific credit-related deterioration, since origination, are recorded at fair value, reflecting the present value of the amounts expected to be collected. Income recognition of these loans is based on reasonable expectation about the timing and amount of cash flows to be collected.
The following table details the acquired loans that are accounted for in accordance with ASC 310-30 as of July 18, 2016.
Contractually required principal and interest at acquisition | $ | 12,545 | ||
Contractual cash flows not expected to be collected (nonaccretable differences) | 4,492 | |||
|
| |||
Expected cash flows at acquisition | 8,053 | |||
Interest component of expected cash flows (accretable discount) | 1,258 | |||
|
| |||
Fair value of acquired loans accounted for under ASC 310-30 | $ | 6,795 | ||
|
|
Final estimates of certain loans, those for which specific credit-related deterioration, since origination, are recorded at fair value, reflecting the present value of the amounts expected to be collected. Income recognition of these loans is based on reasonable expectation about the timing and amount of cash flows to be collected.
80
H ORIZON B ANCORP AND S UBSIDIARIES
Notes to Consolidated Financial Statements
(Table dollars in thousands except for per share data)
On June 1, 2016, Horizon completed the acquisition of Kosciusko Financial, Inc., an Indiana corporation ("Kosciusko") and the Bank's acquisition of Farmers State Bank, a state-chartered bank and wholly owned subsidiary of Kosciusko, through mergers effective June 1, 2016. Under the terms of the merger agreement, shareholders of Kosciusko had the option to receive $81.75 per share in cash or 4.5183 shares of Horizon common stock for each share of Kosciusko's common stock, subject to allocation provisions to assure that in aggregate, Kosciusko shareholders received total consideration that consisted of 65% stock and 35% cash. Kosciusko shareholders owning fewer than 100 shares of common stock received $81.75 in cash for each common share. As a result of Kosciusko shareholder stock and cash elections and the related proration provisions of the merger agreement, Horizon issued 873,430 shares of its common stock in the merger. Based upon the June 1, 2016 closing price of $16.57 per share of Horizon common stock, the transaction has an implied valuation of approximately $23.0 million. The Company had approximately $2.0 million in costs related to the acquisition. These expenses are classified in the non-interest expense section of the income statement and primarily located in the salaries and employee benefits, professional services and other expense line items. As a result of the acquisition, the Company was able to increase its deposit base and reduce transaction costs. The Company also expects to reduce costs through economies of scale.
81
H ORIZON B ANCORP AND S UBSIDIARIES
Notes to Consolidated Financial Statements
(Table dollars in thousands except for per share data)
Under the acquisition method of accounting, the total purchase price is allocated to net tangible and intangible assets based on their current estimated fair values on the date of the acquisition. Based on preliminary valuations of the fair value of tangible and intangible assets acquired and liabilities assumed, which are based on assumptions that are subject to change, the purchase price for the Kosciusko acquisition is detailed in the following table.
ASSETS | LIABILITIES | |||||||||||||
Cash and due from banks | $ | 38,950 | Deposits | |||||||||||
Investment securities, available for sale | 1,191 | Non-interest bearing | $ | 27,871 | ||||||||||
NOW accounts | 35,213 | |||||||||||||
Commercial | 70,006 | Savings and money market | 26,953 | |||||||||||
Residential mortgage | 26,244 | Certificates of deposits | 32,771 | |||||||||||
|
| |||||||||||||
Consumer | 6,319 | Total deposits | 122,808 | |||||||||||
|
| |||||||||||||
Total loans | 102,569 | |||||||||||||
Borrowings | 9,038 | |||||||||||||
Premises and equipment, net | 1,466 | Interest payable | 55 | |||||||||||
FRB and FHLB stock | 582 | Other liabilities | 989 | |||||||||||
Goodwill | 6,443 | |||||||||||||
Core deposit intangible | 526 | |||||||||||||
Interest receivable | 636 | |||||||||||||
Cash value of life insurance | 2,745 | |||||||||||||
Other assets | 765 | |||||||||||||
|
|
|
| |||||||||||
Total assets purchased | $ | 155,873 | Total liabilities assumed | $ | 132,890 | |||||||||
|
|
|
| |||||||||||
Common shares issued | $ | 14,470 | ||||||||||||
Cash paid | 8,513 | |||||||||||||
|
| |||||||||||||
Total estimated purchase price | $ | 22,983 | ||||||||||||
|
| |||||||||||||
Of the total estimated purchase price of $23.0 million, $526,000 has been allocated to core deposit intangible. Additionally, $6.4 million has been allocated to goodwill and none of the purchase price is deductible. The core deposit intangible will be amortized over 10 years on a straight line basis.
The Company acquired certain loans in the acquisition and the transferred loans had evidence of deterioration of credit quality since origination and it was probable, at acquisition, that all contractually required payments would not be collected.
Loans purchased with evidence of credit deterioration since origination and for which it is probable that all contractually required payments will not be collected are considered to be credit impaired. Evidence of credit quality deterioration as of the purchase date may include information such as past-due and non-accrual status, borrower credit scores and recent loan-to-value percentages. Purchased credit-impaired loans are accounted for under the accounting guidance for loans and debt securities acquired with deteriorated credit quality (ASC 310-30) and initially measured at fair value, which includes estimated future credit losses expected to be incurred over the life of the loan. Accordingly, an allowance for credit losses related to these loans is not carried over and recorded at the acquisition date. Management estimated the cash flows expected to be collected at acquisition using our internal risk models, which incorporate the estimate of current key assumptions, such as default rates, severity and prepayment speeds.
Loans with specific credit-related deterioration, since origination, are recorded at fair value, reflecting the present value of the amounts expected to be collected. Income recognition of these loans is based on reasonable expectation about the timing and amount of cash flows to be collected.
82
H ORIZON B ANCORP AND S UBSIDIARIES
Notes to Consolidated Financial Statements
(Table dollars in thousands except for per share data)
The following table details the acquired loans that are accounted for in accordance with ASC 310-30 as of June 1, 2016.
Contractually required principal and interest at acquisition | $ | 2,682 | ||
Contractual cash flows not expected to be collected (nonaccretable differences) | 25 | |||
|
| |||
Expected cash flows at acquisition | 2,657 | |||
Interest component of expected cash flows (accretable discount) | 634 | |||
|
| |||
Fair value of acquired loans accounted for under ASC 310-30 | $ | 2,023 | ||
|
|
Final estimates of certain loans, those for which specific credit-related deterioration, since origination, are recorded at fair value, reflecting the present value of the amounts expected to be collected. Income recognition of these loans is based on reasonable expectation about the timing and amount of cash flows to be collected.
The results of operations of CNB, LaPorte Bancorp and Kosciusko have been included in the Company's consolidated financial statements since the acquisition dates. The following schedule includes pro-forma results for the periods ended December 31, 2016 and 2015 as if the CNB, LaPorte Bancorp and Kosciusko acquisitions had occurred as of the beginning of the comparable prior reporting period.
| December 31 | December 31 | |||||||
| 2016 | 2015 | |||||||
Summary of Operations: | ||||||||
Net Interest Income | $ | 95,451 | $ | 91,986 | ||||
Provision for loan losses | 1,842 | 3,417 | ||||||
Net Interest Income after Provision for Loan Losses | 93,609 | 88,569 | ||||||
Non-interest Income | 43,237 | 33,301 | ||||||
Non-interest Expense | 104,226 | 87,779 | ||||||
Income before Income Taxes | 32,620 | 34,091 | ||||||
Income Tax Expense | 9,679 | 8,528 | ||||||
Net Income | 22,941 | 25,563 | ||||||
Net Income Available to Common Shareholders | $ | 22,899 | $ | 25,438 | ||||
|
|
|
| |||||
Basic Earnings Per Share | $ | 1.15 | $ | 1.61 | ||||
Diluted Earnings Per Share | $ | 1.14 | $ | 1.57 | ||||
The pro-forma information includes adjustments for interest income on loans, amortization of intangibles arising from the transaction, interest expense on deposits acquired, premises expense for the banking centers acquired and the related income tax effects. The pro-forma information for the year ended 2016 includes $4.3 million, net of tax, of operating revenue from CNB, LaPorte Bancorp and Kosciusko since the acquisition and approximately $4.8 million, net of tax, of non-recurring expenses directly attributable to the CNB, LaPorte Bancorp and Kosciusko acquisitions.
The pro-forma financial information is presented for information purposes only and is not indicative of the results of operations that actually would have been achieved had the acquisition been consummated as of that time, nor is it intended to be a projection of future results.
On July 1, 2015, Horizon completed the acquisition of Peoples Bancorp, an Indiana corporation ("Peoples") and the Bank's acquisition of Peoples Federal Savings Bank of DeKalb County ("Peoples FSB"), through mergers effective July 1, 2015. Under the terms of the acquisition, the exchange ratio was 1.425 shares of Horizon common stock and $9.75 in cash for each outstanding share of Peoples common stock. Peoples shareholders owning fewer than 100 shares of common stock received $33.14 in cash for each common share. Peoples shares outstanding at the closing were 2,311,858, and the shares of Horizon common stock issued to Peoples shareholders totaled 3,288,303. Horizon's stock price was $16.88 per share at the close of business on July 1, 2015. Based upon these numbers, the total value of the consideration for the acquisition was $78.1 million. The Company had approximately $4.9 million in costs related to the acquisition as of December 31, 2015. These expenses are classified in the non-interest expense section of the income statement and primarily located in the salaries and employee benefits, professional services and other expense line items. As a result of the acquisition, the Company experienced, and expects to continue to experience, increases in its deposit base, reductions in transaction costs and reduced costs through economies of scale.
83
H ORIZON B ANCORP AND S UBSIDIARIES
Notes to Consolidated Financial Statements
(Table dollars in thousands except for per share data)
Under the purchase method of accounting, the total estimated purchase price is allocated to Peoples net tangible and intangible assets based on their current estimated fair values on the date of the acquisition. Based on management's preliminary valuation of the fair value of tangible and intangible assets acquired and liabilities assumed, which are based on estimates and assumptions that are subject to change, the final purchase price for the Peoples acquisition is allocated as follows:
ASSETS | LIABILITIES | |||||||||||||
Cash and due from banks | $ | 205,054 | Deposits | |||||||||||
Investment securities, available for sale | 2,038 | Non-interest bearing | $ | 28,251 | ||||||||||
NOW accounts | 65,771 | |||||||||||||
Commercial | 67,435 | Savings and money market | 125,176 | |||||||||||
Residential mortgage | 137,331 | Certificates of deposits | 131,889 | |||||||||||
|
| |||||||||||||
Consumer | 19,593 | Total deposits | 351,087 | |||||||||||
|
| |||||||||||||
Total loans | 224,359 | |||||||||||||
Borrowings | 48,884 | |||||||||||||
Premises and equipment, net | 5,524 | Interest payable | 21 | |||||||||||
FRB and FHLB stock | 2,743 | Other liabilities | 6,938 | |||||||||||
Goodwill | 21,424 | |||||||||||||
Core deposit intangible | 4,394 | |||||||||||||
Interest receivable | 1,279 | |||||||||||||
Cash value of life insurance | 13,898 | |||||||||||||
Other assets | 4,364 | |||||||||||||
|
|
|
| |||||||||||
Total assets purchased | $ | 485,077 | Total liabilities assumed | $ | 406,930 | |||||||||
|
|
|
| |||||||||||
Common shares issued | $ | 55,506 | ||||||||||||
Cash paid | 22,641 | |||||||||||||
|
| |||||||||||||
Total estimated purchase price | $ | 78,147 | ||||||||||||
|
| |||||||||||||
Of the total purchase price of $78.1 million, $4.4 million has been allocated to core deposit intangible. Additionally, $21.4 million has been allocated to goodwill and none of the purchase price is deductible. The core deposit intangible will be amortized over 10 years on a straight line basis.
The Company acquired the $228.6 million loan portfolio at a fair value discount of $4.8 million. The performing portion of the portfolio, $223.4 million, had an estimated fair value of $220.0 million. The excess of expected cash flows above the fair value of the performing portion of loans will be accreted to interest income over the remaining lives of the loans in accordance with ASC 310-20.
The Company acquired certain loans in the acquisition and the transferred loans had evidence of deterioration of credit quality since origination and it was probable, at acquisition, that all contractually required payments would not be collected.
The loans purchased with evidence of credit deterioration since origination and for which it is probable that all contractually required payments will not be collected are considered to be credit impaired. Evidence of credit quality deterioration as of the purchase date may include information such as past-due and non-accrual status, borrower credit scores and recent loan-to-value percentages. Purchased credit-impaired loans are accounted for under the accounting guidance for loans and debt securities acquired with deteriorated credit quality (ASC 310-30) and initially measured at fair value, which includes estimated future credit losses expected to be incurred over the life of the loan. Accordingly, an allowance for credit losses related to these loans is not carried over and recorded at the acquisition date. Management estimated the cash flows expected to be collected at acquisition using our internal risk models, which incorporate the estimate of current key assumptions, such as default rates, severity and prepayment speeds.
Loan with specific credit-related deterioration, since origination, are recorded at fair value, reflecting the present value of the amounts expected to be collected. Income recognition of these loans is based on reasonable expectation about the timing and amount of cash flows to be collected.
84
H ORIZON B ANCORP AND S UBSIDIARIES
Notes to Consolidated Financial Statements
(Table dollars in thousands except for per share data)
The following table details the acquired loans that are accounted for in accordance with ASC 310-30 as of July 1, 2015.
Contractually required principal and interest at acquisition | $ | 5,730 | ||
Contractual cash flows not expected to be collected (nonaccretable differences) | 715 | |||
|
| |||
Expected cash flows at acquisition | 5,015 | |||
Interest component of expected cash flows (accretable discount) | 647 | |||
|
| |||
Fair value of acquired loans accounted for under ASC 310-30 | $ | 4,368 | ||
|
|
The results of operations of Peoples and Peoples FSB have been included in the Company's consolidated financial statements since the acquisition dates. The following schedule includes pro forma results for the periods ended December 31, 2015 and December 31, 2014 as if the Peoples and Peoples FSB acquisitions had occurred as of the beginning of the comparable prior reporting period.
| December 31 2015 | December 31 2014 | |||||||
Summary of Operations: | ||||||||
Net Interest Income | $ | 80,688 | $ | 75,442 | ||||
Provision for Loan Losses | 3,222 | 3,443 | ||||||
Net Interest Income after Provision for Loan Losses | 77,466 | 71,999 | ||||||
Non-interest Income | 32,295 | 29,928 | ||||||
Non-Interest Expense | 80,489 | 74,010 | ||||||
Income before Income Taxes | 29,272 | 27,917 | ||||||
Income Tax Expense | 7,359 | 6,560 | ||||||
Net Income | 21,913 | 21,357 | ||||||
Net Income Available to Common Shareholders | $ | 21,788 | $ | 21,342 | ||||
|
|
|
| |||||
Basic Earnings Per Share | $ | 1.27 | $ | 1.25 | ||||
Diluted Earnings Per Share | $ | 1.23 | $ | 1.21 | ||||
The pro forma information includes adjustments for interest income on loans, amortization of intangibles arising from the transaction, interest expense on deposits acquired, premises expense for the banking centers acquired and the related income tax effects. The pro forma information for the year ended 2015 includes $2.3 million, net of tax, of operating revenue from Peoples since the acquisition and approximately $3.3 million, net of tax, of non-recurring expenses directly attributable to the Peoples acquisition.
The pro forma financial information is presented for information purposes only and is not indicative of the results of operations that actually would have been achieved had the acquisition been consummated as of that time, nor is it intended to be a projection of future results.
On April 3, 2014 Horizon closed its acquisition of SCB Bancorp, Inc. ("Summit") and the Bank's acquisition of Summit Community Bank, through mergers effective as of that date. Under the final terms of the acquisition, the exchange ratio was 0.7356 shares of Horizon's common stock and $5.15 in cash for each share of Summit common stock outstanding. Summit shares outstanding at the closing were 1,164,442, and the shares of Horizon common stock issued to Summit shareholders totaled 856,230. Horizon's stock price was $14.82 per share at the close of business on April 3, 2014. Based upon these numbers, the total value of the consideration for the acquisition was $18.9 million (not including the retirement of Summit debt). For the year ended December 31, 2014, the Company had approximately $1.3 million in costs related to the acquisition. These expenses are classified in the other expense section of the income statement and primarily located in the salaries and employee benefits, professional services and other expense line items. As a result of the acquisition, the Company experienced, and expects to continue to experience, increases in its deposit base and reductions in transaction costs. The Company also expects to reduce costs through economies of scale.
85
H ORIZON B ANCORP AND S UBSIDIARIES
Notes to Consolidated Financial Statements
(Table dollars in thousands except for per share data)
Under the purchase method of accounting, the total estimated purchase price is allocated to Summit's net tangible and intangible assets based on their current estimated fair values on the date of the acquisition. Based on management's preliminary valuation of the fair value of tangible and intangible assets acquired and liabilities assumed, which are based on estimates and assumptions that are subject to change, the preliminary purchase price for the Summit acquisition is allocated as follows:
ASSETS | LIABILITIES | |||||||||||||
Cash and due from banks | $ | 15,161 | Deposits | |||||||||||
Non-interest bearing | $ | 27,274 | ||||||||||||
Commercial | 70,441 | NOW accounts | 16,332 | |||||||||||
Residential mortgage | 43,448 | Savings and money market | 35,045 | |||||||||||
Consumer | 10,192 | Certificates of deposits | 42,368 | |||||||||||
|
|
|
| |||||||||||
Total loans | 124,081 | Total deposits | 121,019 | |||||||||||
Premises and equipment, net | 2,548 | Borrowings | 16,990 | |||||||||||
FRB and FHLB stock | 2,136 | Interest payable | 52 | |||||||||||
Goodwill | 8,428 | Other liabilities | 599 | |||||||||||
Core deposit intangible | 822 | |||||||||||||
Interest receivable | 347 | |||||||||||||
Cash value of life insurance | 2,185 | |||||||||||||
Other assets | 2,877 | |||||||||||||
|
|
|
| |||||||||||
Total assets purchased | $ | 158,585 | Total liabilities assumed | $ | 138,660 | |||||||||
|
|
|
| |||||||||||
Of the total estimated purchase price of $19.9 million, $822,000 has been allocated to core deposit intangible. Additionally, $8.4 million has been allocated to goodwill and $4.4 million of the purchase price is deductible and was assigned to the business assets. The core deposit intangible will be amortized over 10 years on a straight line basis.
The Company acquired loans in the acquisition and the transferred loans had evidence of deterioration of credit quality since origination and it was probable, at acquisition, that all contractually required payments would not be collected.
Loans purchased with evidence of credit deterioration since origination and for which it is probable that all contractually required payments will not be collected are considered to be credit impaired. Evidence of credit quality deterioration as of the purchase date may include information such as past-due and non-accrual status, borrower credit scores and recent loan-to-value percentages. Purchased credit-impaired loans are accounted for under the accounting guidance for loans and debt securities acquired with deteriorated credit quality (ASC 310-30) and initially measured at fair value, which includes estimated future credit losses expected to be incurred over the life of the loan. Accordingly, an allowance for credit losses related to these loans is not carried over and recorded at the acquisition date. Management estimated the cash flows expected to be collected at acquisition using our internal risk models, which incorporate the estimate of current key assumptions, such as default rates, severity and prepayment speeds.
The Company acquired the $130.5 million loan portfolio at a fair value discount of $6.4 million. The performing portion of the portfolio, $106.2 million, had an estimated fair value of $104.6 million. The excess of expected cash flows above the fair value of the performing portion of loans will be accreted to interest income over the remaining lives of the loans in accordance with ASC 310-20.
Final estimates of loans for which specific credit-related deterioration has been identified, since origination, are recorded at fair value, reflecting the present value of the amounts expected to be collected. Income recognition of these loans is based on reasonable expectation about the timing and amount of cash flows to be collected.
86
H ORIZON B ANCORP AND S UBSIDIARIES
Notes to Consolidated Financial Statements
(Table dollars in thousands except for per share data)
The following table details the acquired loans that are accounted for in accordance with ASC 310-30 as of April 3, 2014.
Contractually required principal and interest at acquisition | $ | 14,460 | ||
Contractual cash flows not expected to be collected (nonaccretable differences) | 3,146 | |||
|
| |||
Expected cash flows at acquisition | 11,314 | |||
Interest component of expected cash flows (accretable discount) | 1,688 | |||
|
| |||
Fair value of acquired loans accounted for under ASC 310-30 | $ | 9,626 | ||
|
|
Pro-forma statements were not presented due to the materiality of the transaction.
Note 3 – Cash Equivalents
The Company considers all liquid investments with original maturities of three months or less to be cash equivalents. At December 31, 2016 and 2015, cash equivalents consisted primarily of money market accounts with brokers and certificates of deposit.
At December 31, 2016, the Company's cash accounts exceeded federally insured limits by approximately $6.5 million.
Note 4 – Securities
The fair value of securities is as follows:
| December 31, 2016 | Amortized Cost | Gross Unrealized Gains | Gross Unrealized Losses | Fair Value | ||||||||||||
Available for sale | ||||||||||||||||
U.S. Treasury and federal agencies | $ | 8,051 | $ | 2 | $ | (64 | ) | $ | 7,989 | |||||||
State and municipal | 117,327 | 324 | (1,059 | ) | 116,592 | |||||||||||
Federal agency collateralized mortgage obligations | 139,040 | 254 | (2,099 | ) | 137,195 | |||||||||||
Federal agency mortgage-backed pools | 180,183 | 251 | (3,707 | ) | 176,726 | |||||||||||
Corporate notes | 1,238 | 91 | - | 1,329 | ||||||||||||
|
|
|
|
|
|
|
| |||||||||
Total available for sale investment securities | $ | 445,839 | $ | 922 | $ | (6,929 | ) | $ | 439,831 | |||||||
|
|
|
|
|
|
|
| |||||||||
Held to maturity | ||||||||||||||||
State and municipal | $ | 165,607 | $ | 2,700 | $ | (2,485 | ) | $ | 165,822 | |||||||
Federal agency collateralized mortgage obligations | 6,530 | 31 | (71 | ) | 6,490 | |||||||||||
Federal agency mortgage-backed pools | 21,057 | 897 | (180 | ) | 21,774 | |||||||||||
|
|
|
|
|
|
|
| |||||||||
Total held to maturity investment securities | $ | 193,194 | $ | 3,628 | $ | (2,736 | ) | $ | 194,086 | |||||||
|
|
|
|
|
|
|
| |||||||||
| December 31, 2015 | Amortized Cost | Gross Unrealized Gains | Gross Unrealized Losses | Fair Value | ||||||||||||
Available for sale | ||||||||||||||||
U.S. Treasury and federal agencies | $ | 5,940 | $ | 3 | $ | (17 | ) | $ | 5,926 | |||||||
State and municipal | 73,829 | 1,299 | (33 | ) | 75,095 | |||||||||||
Federal agency collateralized mortgage obligations | 157,291 | 567 | (1,655 | ) | 156,203 | |||||||||||
Federal agency mortgage-backed pools | 206,970 | 2,080 | (1,346 | ) | 207,704 | |||||||||||
Corporate notes | 32 | 22 | - | 54 | ||||||||||||
|
|
|
|
|
|
|
| |||||||||
Total available for sale investment securities | $ | 444,062 | $ | 3,971 | $ | (3,051 | ) | $ | 444,982 | |||||||
|
|
|
|
|
|
|
| |||||||||
Held to maturity | ||||||||||||||||
U.S. Treasury and federal agencies | $ | 5,859 | $ | 93 | $ | - | $ | 5,952 | ||||||||
State and municipal | 146,331 | 5,375 | (253 | ) | 151,453 | |||||||||||
Federal agency collateralized mortgage obligations | 9,051 | 27 | (124 | ) | 8,954 | |||||||||||
Federal agency mortgage-backed pools | 26,388 | 1,141 | (185 | ) | 27,344 | |||||||||||
|
|
|
|
|
|
|
| |||||||||
Total held to maturity investment securities | $ | 187,629 | $ | 6,636 | $ | (562 | ) | $ | 193,703 | |||||||
|
|
|
|
|
|
|
| |||||||||
Based on evaluation of available evidence, including recent changes in market interest rates, credit rating information, and information obtained from regulatory filings, management believes the declines in fair value for these securities are temporary. While these securities are held in the available for sale portfolio and held-to-maturity, Horizon intends, and has the ability, to hold them until the earlier of a recovery in fair value or maturity.
87
H ORIZON B ANCORP AND S UBSIDIARIES
Notes to Consolidated Financial Statements
(Table dollars in thousands except for per share data)
Should the impairment of any of these securities become other than temporary, the cost basis of the investment will be reduced and the resulting loss recognized in net income in the period the other-than-temporary impairment is identified. At December 31, 2016, no individual investment security had an unrealized loss that was determined to be other-than-temporary.
The unrealized losses on the Company's investments in securities of state and municipal governmental agencies, U.S. Treasury and federal agencies, federal agency collateralized mortgage obligations, and federal agency mortgage-backed pools were caused by interest rate volatility and not a decline in credit quality. The contractual terms of those investments do not permit the issuer to settle the securities at a price less than the amortized cost basis of the investments. The Company expects to recover the amortized cost basis over the term of the securities. Because the Company does not intend to sell the investments and it is not likely that the Company will be required to sell the investments before recovery of their amortized cost basis, which may be at maturity, the Company did not consider those investments to be other-than-temporarily impaired at December 31, 2016.
The Company elected to transfer 319 available-for-sale ("AFS") securities with an aggregate fair value of $167.1 million to a classification of held-to-maturity ("HTM") on April 1, 2014. In accordance with FASB ASC 320-10-55-24, the transfer from AFS to HTM must be recorded at the fair value of the AFS securities at the time of transfer. The net unrealized holding gain of $1.3 million, net of tax, at the date of transfer was retained in accumulated other comprehensive income (loss), with the associated pre-tax amount retained in the carrying value of the HTM securities. Such amounts will be amortized to comprehensive income over the remaining life of the securities. The fair value of the transferred AFS securities became the book value of the HTM securities at April 1, 2014, with no unrealized gain or loss at this date. Future reporting periods, with potential changes in market value for these securities, would likely record an unrealized gain or loss for disclosure purposes.
The amortized cost and fair value of securities available for sale and held-to-maturity at December 31, 2016 and December 31, 2015, by contractual maturity, are shown below. Expected maturities will differ from contractual maturities because issuers may have the right to call or prepay obligations with or without call or prepayment penalties.
| December 31, 2016 | December 31, 2015 | |||||||||||||||
| Amortized | Fair | Amortized | Fair | |||||||||||||
| Cost | Value | Cost | Value | |||||||||||||
Available for sale | ||||||||||||||||
Within one year | $ | 7,455 | $ | 7,480 | $ | 7,192 | $ | 7,232 | ||||||||
One to five years | 37,483 | 37,479 | 38,197 | 38,894 | ||||||||||||
Five to ten years | 21,112 | 20,984 | 16,807 | 17,152 | ||||||||||||
After ten years | 60,566 | 59,967 | 17,605 | 17,797 | ||||||||||||
|
|
|
|
|
|
|
| |||||||||
| 126,616 | 125,910 | 79,801 | 81,075 | |||||||||||||
Federal agency collateralized mortgage obligations | 139,040 | 137,195 | 157,291 | 156,203 | ||||||||||||
Federal agency mortgage-backed pools | 180,183 | 176,726 | 206,970 | 207,704 | ||||||||||||
|
|
|
|
|
|
|
| |||||||||
Total available for sale investment securities | $ | 445,839 | $ | 439,831 | $ | 444,062 | $ | 444,982 | ||||||||
|
|
|
|
|
|
|
| |||||||||
Held to maturity | ||||||||||||||||
Within one year | $ | - | $ | - | $ | - | $ | - | ||||||||
One to five years | 24,594 | 25,271 | 17,815 | 18,403 | ||||||||||||
Five to ten years | 87,645 | 88,805 | 106,167 | 110,026 | ||||||||||||
After ten years | 53,368 | 51,746 | 28,208 | 28,976 | ||||||||||||
|
|
|
|
|
|
|
| |||||||||
| 165,607 | 165,822 | 152,190 | 157,405 | |||||||||||||
Federal agency collateralized mortgage obligations | 6,530 | 6,490 | 9,051 | 8,954 | ||||||||||||
Federal agency mortgage-backed pools | 21,057 | 21,774 | 26,388 | 27,344 | ||||||||||||
|
|
|
|
|
|
|
| |||||||||
Total held to maturity investment securities | $ | 193,194 | $ | 194,086 | $ | 187,629 | $ | 193,703 | ||||||||
|
|
|
|
|
|
|
| |||||||||
88
H ORIZON B ANCORP AND S UBSIDIARIES
Notes to Consolidated Financial Statements
(Table dollars in thousands except for per share data)
The following table shows the gross unrealized losses and the fair value of the Company's investments, aggregated by investment category and length of time that individual securities have been in a continuous unrealized loss position.
| Less than 12 Months | 12 Months or More | Total | ||||||||||||||||||||||
| Fair | Unrealized | Fair | Unrealized | Fair | Unrealized | |||||||||||||||||||
| December 31, 2016 | Value | Losses | Value | Losses | Value | Losses | ||||||||||||||||||
U.S. Treasury and federal agencies | $ | 6,987 | $ | (64 | ) | $ | - | $ | - | $ | 6,987 | $ | (64 | ) | ||||||||||
State and municipal | 142,466 | (3,544 | ) | - | - | 142,466 | (3,544 | ) | ||||||||||||||||
Federal agency collateralized mortgage obligations | 112,414 | (1,918 | ) | 10,199 | (252 | ) | 122,613 | (2,170 | ) | |||||||||||||||
Federal agency mortgage-backed pools | 163,768 | (3,887 | ) | - | - | 163,768 | (3,887 | ) | ||||||||||||||||
|
|
|
|
|
|
|
|
|
|
|
| |||||||||||||
Total temporarily impaired securities | $ | 425,635 | $ | (9,413 | ) | $ | 10,199 | $ | (252 | ) | $ | 435,834 | $ | (9,665 | ) | |||||||||
|
|
|
|
|
|
|
|
|
|
|
| |||||||||||||
| Less than 12 Months | 12 Months or More | Total | ||||||||||||||||||||||
| Fair | Unrealized | Fair | Unrealized | Fair | Unrealized | |||||||||||||||||||
| December 31, 2015 | Value | Losses | Value | Losses | Value | Losses | ||||||||||||||||||
U.S. Treasury and federal agencies | $ | 5,468 | $ | (17 | ) | $ | - | $ | - | $ | 5,468 | $ | (17 | ) | ||||||||||
State and municipal | 17,353 | (280 | ) | 446 | (6 | ) | 17,799 | (286 | ) | |||||||||||||||
Federal agency collateralized mortgage obligations | 89,459 | (1,124 | ) | 25,428 | (655 | ) | 114,887 | (1,779 | ) | |||||||||||||||
Federal agency mortgage-backed pools | 113,244 | (1,212 | ) | 16,506 | (319 | ) | 129,750 | (1,531 | ) | |||||||||||||||
|
|
|
|
|
|
|
|
|
|
|
| |||||||||||||
Total temporarily impaired securities | $ | 225,524 | $ | (2,633 | ) | $ | 42,380 | $ | (980 | ) | $ | 267,904 | $ | (3,613 | ) | |||||||||
|
|
|
|
|
|
|
|
|
|
|
| |||||||||||||
U.S. Treasury, federal agency, state and municipal
The unrealized losses on the Company's investments in U.S. Treasury, federal agency and state and municipals were caused by interest rate changes. The contractual terms of those investments do not permit the issuer to settle the securities at a price less than the amortized cost bases of the investments. Because the Company does not intend to sell the investments and it is not more likely than not the Company will be required to sell the investments before recovery of their amortized cost bases, which may be maturity, the Company does not consider those investments to be other-than-temporarily impaired at December 31, 2016.
Federal agency mortgage-backed pools and collateralized mortgage obligations
The unrealized losses on the Company's investment in federal agency mortgage backed pools and collateralized mortgage obligations securities were caused by interest rate changes. The Company expects to recover the amortized cost basis over the term of the securities. Because the decline in market value is attributable to changes in interest rates and not credit quality, and because the Company does not intend to sell the investments and it is not more likely than not the Company will be required to sell the investments before recovery of their amortized cost bases, which may be maturity, the Company does not consider those investments to be other-than-temporarily impaired at December 31, 2016.
Information regarding security proceeds, gross gains and gross losses are presented below.
| Years ended December 31 | ||||||||||||
| 2016 | 2015 | 2014 | ||||||||||
Sales of securities available for sale | ||||||||||||
Proceeds | $ | 182,549 | $ | 43,051 | $ | 45,228 | ||||||
Gross gains | 2,646 | 254 | 988 | |||||||||
Gross losses | (810 | ) | (65 | ) | - | |||||||
The tax effect of the proceeds from the sale of securities available for sale was $643, $66 and $346 for the years ended December 31, 2016, 2015 and 2014, respectively.
The Company pledges securities to secure retail and corporate repurchase agreements to the Federal Reserve for borrowing availability and as settlements for the fair value of swap agreements. At December 31, 2016, the Company had pledged $64.4 million of fair value or $65.1 million of amortized cost, in securities as collateral for $57.1 million in repurchase
89
H ORIZON B ANCORP AND S UBSIDIARIES
Notes to Consolidated Financial Statements
(Table dollars in thousands except for per share data)
agreements, $92.5 million of fair value or $92.4 million of amortized cost, in securities as collateral for borrowing availability at the Federal Reserve with no current outstanding borrowings and $16.2 million of fair value or $16.0 million of amortized cost, in securities as collateral for $3.1 million in settlements on the fair value of swap agreements.
Note 5 – Loans
| December 31 | December 31 | |||||||
| 2016 | 2015 | |||||||
Commercial | ||||||||
Working capital and equipment | $ | 539,403 | $ | 381,245 | ||||
Real estate, including agriculture | 485,620 | 391,668 | ||||||
Tax exempt | 15,486 | 8,674 | ||||||
Other | 29,447 | 23,408 | ||||||
|
|
|
| |||||
Total | 1,069,956 | 804,995 | ||||||
Real estate | ||||||||
1–4 family | 526,024 | 433,015 | ||||||
Other | 5,850 | 4,129 | ||||||
|
|
|
| |||||
Total | 531,874 | 437,144 | ||||||
Consumer | ||||||||
Auto | 174,773 | 168,397 | ||||||
Recreation | 5,669 | 5,365 | ||||||
Real estate/home improvement | 53,898 | 47,015 | ||||||
Home equity | 144,508 | 127,113 | ||||||
Unsecured | 3,875 | 4,120 | ||||||
Other | 15,706 | 10,290 | ||||||
|
|
|
| |||||
Total | 398,429 | 362,300 | ||||||
Mortgage warehouse | 135,727 | 144,692 | ||||||
|
|
|
| |||||
Total loans | 2,135,986 | 1,749,131 | ||||||
Allowance for loan losses | (14,837 | ) | (14,534 | ) | ||||
|
|
|
| |||||
Loans, net | $ | 2,121,149 | $ | 1,734,597 | ||||
|
|
|
| |||||
Commercial
Commercial loans are primarily based on the identified cash flows of the borrower and secondarily on the underlying collateral provided by the borrower. The cash flows of borrowers, however, may not be as expected, and the collateral securing these loans may fluctuate in value. Most commercial loans are secured by the assets being financed or other business assets such as accounts receivable or inventory and may incorporate a personal guarantee; however, some short-term loans may be made on an unsecured basis. In the case of loans secured by accounts receivable, the availability of funds for the repayment of these loans may be substantially dependent on the ability of the borrower to collect amounts due from its customers.
Commercial real estate loans are viewed primarily as cash flow loans and secondarily as loans secured by real estate. Commercial real estate lending typically involves larger loan principal amounts and the repayment of these loans is generally dependent on the successful operation of the property securing the loan or the business conducted on the property securing the loan. Commercial real estate loans may be more adversely affected by conditions in the real estate markets or in the general economy. The properties securing the Company's commercial real estate portfolio are diverse in terms of property type, and are monitored for concentrations of credit. Management monitors and evaluates commercial
90
H ORIZON B ANCORP AND S UBSIDIARIES
Notes to Consolidated Financial Statements
(Table dollars in thousands except for per share data)
real estate loans based on collateral, cash flow and risk grade criteria. As a general rule, the Company avoids financing single purpose projects unless other underwriting factors are present to help mitigate risk. In addition, management tracks the level of owner-occupied commercial real estate loans versus non-owner occupied loans.
Real Estate and Consumer
With respect to residential loans that are secured by 1-4 family residences and are generally owner occupied, the Company generally establishes a maximum loan-to-value ratio and requires private mortgage insurance if that ratio is exceeded. Home equity loans are typically secured by a subordinate interest in 1-4 family residences, and consumer loans are secured by consumer assets such as automobiles or recreational vehicles. Some consumer loans are unsecured such as small installment loans and certain lines of credit. Repayment of these loans is primarily dependent on the personal income of the borrowers, which can be impacted by economic conditions in their market areas such as unemployment levels. Repayment can also be impacted by changes in property values on residential properties. Risk is mitigated by the fact that the loans are of smaller individual amounts and spread over a large number of borrowers.
Mortgage Warehousing
Horizon's mortgage warehouse lending has specific mortgage companies as customers of Horizon Bank. Individual mortgage loans originated by these mortgage companies are funded as a secured borrowing with a pledge of collateral under Horizon's agreement with the mortgage company. Each individual mortgage and the related mortgagee are underwritten by Horizon to the end investor guidelines and is assigned to Horizon until the loan is sold to the secondary market by the mortgage company. In addition, Horizon takes possession of each original note and forwards such note to the end investor once the mortgage company has sold the loan. At the time a loan is transferred to the secondary market, the mortgage company reacquires the loan under its option within the agreement. Due to the reacquire feature contained in the agreement, the transaction does not qualify as a sale and therefore is accounted for as a secured borrowing with a pledge of collateral pursuant to the agreement with the mortgage company. When the individual loan is sold to the end investor by the mortgage company, the proceeds from the sale of the loan are received by Horizon and used to pay off the loan balance with Horizon along with any accrued interest and any related fees. The remaining balance from the sale is forwarded to the mortgage company. These individual loans typically are sold by the mortgage company within 30 days and are seldom held more than 90 days. Interest income is accrued during this period and collected at the time each loan is sold. Fee income for each loan sold is collected when the loan is sold, and no costs are deferred due to the term between each loan funding and related payoff, which is typically less than 30 days.
Based on the agreements with each mortgage company, at any time a mortgage company can reacquire from Horizon its outstanding loan balance on an individual mortgage and regain possession of the original note. Horizon also has the option to request that the mortgage company reaquire an individual mortgage. Should this occur, Horizon would return the original note and reassign the assignment of the mortgage to the mortgage company. Also, in the event that the end investor would not be able to honor the purchase commitment and the mortgage company would not be able to reacquire its loan on an individual mortgage, Horizon would be able to exercise its rights under the agreement.
91
H ORIZON B ANCORP AND S UBSIDIARIES
Notes to Consolidated Financial Statements
(Table dollars in thousands except for per share data)
The following table shows the recorded investment of individual loan categories.
| December 31, 2016 | Loan Balance | Interest Due | Deferred Fees / (Costs) | Recorded Investment | ||||||||||||
Owner occupied real estate | $ | 337,548 | $ | 899 | $ | 1,022 | $ | 339,469 | ||||||||
Non owner occupied real estate | 461,897 | 624 | 2,176 | 464,697 | ||||||||||||
Residential spec homes | 5,006 | 8 | (2 | ) | 5,012 | |||||||||||
Development & spec land loans | 31,228 | 56 | 119 | 31,403 | ||||||||||||
Commercial and industrial | 230,520 | 1,906 | 442 | 232,868 | ||||||||||||
|
|
|
|
|
|
|
| |||||||||
Total commercial | 1,066,199 | 3,493 | 3,757 | 1,073,449 | ||||||||||||
Residential mortgage | 508,233 | 1,492 | 3,030 | 512,755 | ||||||||||||
Residential construction | 20,611 | 33 | - | 20,644 | ||||||||||||
Mortgage warehouse | 135,727 | 480 | - | 136,207 | ||||||||||||
|
|
|
|
|
|
|
| |||||||||
Total real estate | 664,571 | 2,005 | 3,030 | 669,606 | ||||||||||||
Direct installment | 71,150 | 199 | (385 | ) | 70,964 | |||||||||||
Direct installment purchased | 119 | - | - | 119 | ||||||||||||
Indirect installment | 153,204 | 345 | - | 153,549 | ||||||||||||
Home equity | 175,126 | 703 | (785 | ) | 175,044 | |||||||||||
|
|
|
|
|
|
|
| |||||||||
Total consumer | 399,599 | 1,247 | (1,170 | ) | 399,676 | |||||||||||
|
|
|
|
|
|
|
| |||||||||
Total loans | 2,130,369 | 6,745 | 5,617 | 2,142,731 | ||||||||||||
Allowance for loan losses | (14,837 | ) | - | - | (14,837 | ) | ||||||||||
|
|
|
|
|
|
|
| |||||||||
Net loans | $ | 2,115,532 | $ | 6,745 | $ | 5,617 | $ | 2,127,894 | ||||||||
|
|
|
|
|
|
|
| |||||||||
| December 31, 2015 | Loan Balance | Interest Due | Deferred Fees / (Costs) | Recorded Investment | ||||||||||||
Owner occupied real estate | $ | 268,281 | $ | 613 | $ | 1,328 | $ | 270,222 | ||||||||
Non owner occupied real estate | 326,399 | 306 | 497 | 327,202 | ||||||||||||
Residential spec homes | 5,018 | 9 | 17 | 5,044 | ||||||||||||
Development & spec land loans | 18,183 | 33 | 26 | 18,242 | ||||||||||||
Commercial and industrial | 184,911 | 1,246 | 335 | 186,492 | ||||||||||||
|
|
|
|
|
|
|
| |||||||||
Total commercial | 802,792 | 2,207 | 2,203 | 807,202 | ||||||||||||
Residential mortgage | 414,924 | 1,275 | 2,470 | 418,669 | ||||||||||||
Residential construction | 19,751 | 34 | - | 19,785 | ||||||||||||
Mortgage warehouse | 144,692 | 480 | - | 145,172 | ||||||||||||
|
|
|
|
|
|
|
| |||||||||
Total real estate | 579,367 | 1,789 | 2,470 | 583,626 | ||||||||||||
Direct installment | 54,341 | 168 | (359 | ) | 54,150 | |||||||||||
Direct installment purchased | 153 | - | - | 153 | ||||||||||||
Indirect installment | 151,523 | 323 | - | 151,846 | ||||||||||||
Home equity | 157,164 | 628 | (522 | ) | 157,270 | |||||||||||
|
|
|
|
|
|
|
| |||||||||
Total consumer | 363,181 | 1,119 | (881 | ) | 363,419 | |||||||||||
|
|
|
|
|
|
|
| |||||||||
Total loans | 1,745,340 | 5,115 | 3,792 | 1,754,247 | ||||||||||||
Allowance for loan losses | (14,534 | ) | - | - | (14,534 | ) | ||||||||||
|
|
|
|
|
|
|
| |||||||||
Net loans | $ | 1,730,806 | $ | 5,115 | $ | 3,792 | $ | 1,739,713 | ||||||||
|
|
|
|
|
|
|
| |||||||||
92
H ORIZON B ANCORP AND S UBSIDIARIES
Notes to Consolidated Financial Statements
(Table dollars in thousands except for per share data)
Note 6 – Accounting for Certain Loans Acquired in a Transfer
The Company acquired loans in acquisitions and the transferred loans had evidence of deterioration of credit quality since origination and it was probable, at acquisition, that all contractually required payments would not be collected.
Loans purchased with evidence of credit deterioration since origination and for which it is probable that all contractually required payments will not be collected are considered to be credit impaired. Evidence of credit quality deterioration as of the purchase date may include information such as past-due and non-accrual status, borrower credit scores and recent loan-to-value percentages. Purchased credit-impaired loans are accounted for under the accounting guidance for loans and debt securities acquired with deteriorated credit quality (ASC 310-30) and initially measured at fair value, which includes estimated future credit losses expected to be incurred over the life of the loan. Accordingly, an allowance for credit losses related to these loans is not carried over and recorded at the acquisition date. Management estimated the cash flows expected to be collected at acquisition using our internal risk models, which incorporate the estimate of current key assumptions, such as default rates, severity and prepayment speeds.
The carrying amounts of those loans included in the balance sheet amounts of loans receivable are as follows:
| December 31 2016 Heartland | December 31 2016 Summit | December 31 2016 Peoples | December 31 2016 Kosciusko | December 31 2016 LaPorte | December 31 2016 CNB | December 31 2016 Total | ||||||||||||||||||||||
Commercial | $ | 774 | $ | 5,245 | $ | 692 | $ | 1,652 | $ | 3,200 | $ | - | $ | 11,563 | ||||||||||||||
Real estate | 534 | 967 | 165 | 457 | 1,114 | - | 3,237 | |||||||||||||||||||||
Consumer | 2 | 0 | - | - | 41 | - | 43 | |||||||||||||||||||||
|
|
|
|
|
|
|
|
|
|
|
|
|
| |||||||||||||||
Outstanding balance | $ | 1,310 | $ | 6,213 | $ | 856 | $ | 2,109 | $ | 4,355 | $ | - | $ | 14,843 | ||||||||||||||
|
|
|
|
|
|
|
|
|
|
|
|
|
| |||||||||||||||
Carrying amount, net of allowance of $0 | $ | 14,843 | ||||||||||||||||||||||||||
|
| |||||||||||||||||||||||||||
| December 31 2015 Heartland | December 31 2015 Summit | December 31 2015 Peoples | December 31 2015 Kosciusko | December 31 2015 LaPorte | December 31 2015 CNB | December 31 2015 Total | ||||||||||||||||||||||
Commercial | $ | 1,633 | $ | 5,567 | $ | 1,061 | $ | - | $ | - | $ | - | $ | 8,261 | ||||||||||||||
Real estate | 693 | 1,216 | 179 | - | - | - | 2,088 | |||||||||||||||||||||
Consumer | 6 | 35 | - | - | - | - | 41 | |||||||||||||||||||||
|
|
|
|
|
|
|
|
|
|
|
|
|
| |||||||||||||||
Outstanding balance | $ | 2,332 | $ | 6,818 | $ | 1,240 | $ | - | $ | - | $ | - | $ | 10,390 | ||||||||||||||
|
|
|
|
|
|
|
|
|
|
|
|
|
| |||||||||||||||
Carrying amount, net of allowance of $63 | $ | 10,327 | ||||||||||||||||||||||||||
|
| |||||||||||||||||||||||||||
Accretable yield, or income expected to be collected are as follows:
| Twelve Months Ended December 31, 2016 | ||||||||||||||||||||||||||||
| Heartland | Summit | Peoples | Kosciusko | LaPorte | CNB | Total | ||||||||||||||||||||||
Balance at January 1 | $ | 795 | $ | 708 | $ | 555 | $ | - | $ | - | $ | - | $ | 2,058 | ||||||||||||||
Additions | - | - | - | 634 | 1,636 | 2,270 | ||||||||||||||||||||||
Accretion | (164 | ) | (171 | ) | (106 | ) | (72 | ) | (147 | ) | - | (660 | ) | |||||||||||||||
Reclassification from nonaccretable difference | - | - | - | - | - | - | - | |||||||||||||||||||||
Disposals | (74 | ) | (35 | ) | (60 | ) | (32 | ) | (10 | ) | - | (211 | ) | |||||||||||||||
|
|
|
|
|
|
|
|
|
|
|
|
|
| |||||||||||||||
Balance at December 31 | $ | 557 | $ | 502 | $ | 389 | $ | 530 | $ | 1,479 | $ | - | $ | 3,457 | ||||||||||||||
|
|
|
|
|
|
|
|
|
|
|
|
|
| |||||||||||||||
| Twelve Months Ended December 31, 2015 | ||||||||||||||||||||||||||||
| Heartland | Summit | Peoples | Kosciusko | LaPorte | CNB | Total | ||||||||||||||||||||||
Balance at January 1 | $ | 2,400 | $ | 1,268 | $ | - | $ | - | $ | - | $ | - | $ | 3,668 | ||||||||||||||
Additions | - | - | 647 | - | - | - | 647 | |||||||||||||||||||||
Accretion | (327 | ) | (315 | ) | (83 | ) | - | - | - | (725 | ) | |||||||||||||||||
Reclassification from nonaccretable difference | - | - | - | - | - | - | - | |||||||||||||||||||||
Disposals | (1,278 | ) | (245 | ) | (9 | ) | - | - | - | (1,532 | ) | |||||||||||||||||
|
|
|
|
|
|
|
|
|
|
|
|
|
| |||||||||||||||
Balance at December 31 | $ | 795 | $ | 708 | $ | 555 | $ | - | $ | - | $ | - | $ | 2,058 | ||||||||||||||
|
|
|
|
|
|
|
|
|
|
|
|
|
| |||||||||||||||
During the years ended December 31, 2016 and 2015, the Company increased (decreased) the allowance for loan losses by a charge to the income statement of $71,000 and $(190,000), respectively. $0 and $63,000 of allowances for loan losses were reversed for the years ended December 31, 2016 and 2015, respectively.
93
H ORIZON B ANCORP AND S UBSIDIARIES
Notes to Consolidated Financial Statements
(Table dollars in thousands except for per share data)
Note 7 – Allowance for Loan Losses
The historical loss experience is determined by portfolio segment and is based on the actual loss history experienced by the Company over the prior one to five years. Management believes using the highest of the one, two or five-year historical loss experience is an appropriate methodology in the current economic environment, as it captures loss rates that are comparable to the current period being analyzed. The actual allowance for loan loss activity is provided below.
| December 31 | December 31 | December 31 | ||||||||||
| 2016 | 2015 | 2014 | ||||||||||
|
|
|
|
|
| |||||||
Balance at beginning of the period | $ | 14,534 | $ | 16,501 | $ | 15,992 | ||||||
Loans charged-off: | ||||||||||||
Commercial | ||||||||||||
Owner occupied real estate | 181 | 2,208 | 40 | |||||||||
Non owner occupied real estate | 471 | 556 | 136 | |||||||||
Residential development | - | - | - | |||||||||
Development & Spec Land Loans | - | - | 173 | |||||||||
Commercial and industrial | 106 | 673 | 1,453 | |||||||||
|
|
|
|
|
| |||||||
Total commercial | 758 | 3,437 | 1,802 | |||||||||
Real estate | ||||||||||||
Residential mortgage | 213 | 288 | 328 | |||||||||
Residential construction | - | - | - | |||||||||
Mortgage warehouse | - | - | - | |||||||||
|
|
|
|
|
| |||||||
Total real estate | 213 | 288 | 328 | |||||||||
Consumer | ||||||||||||
Direct Installment | 329 | 367 | 250 | |||||||||
Direct Installment Purchased | - | - | - | |||||||||
Indirect Installment | 1,051 | 1,081 | 1,233 | |||||||||
Home Equity | 309 | 926 | 516 | |||||||||
|
|
|
|
|
| |||||||
Total consumer | 1,689 | 2,374 | 1,999 | |||||||||
|
|
|
|
|
| |||||||
Total loans charged-off | 2,660 | 6,099 | 4,129 | |||||||||
Recoveries of loans previously charged-off: | ||||||||||||
Commercial | ||||||||||||
Owner occupied real estate | 31 | 104 | 13 | |||||||||
Non owner occupied real estate | 55 | 1 | 210 | |||||||||
Residential development | 8 | - | - | |||||||||
Development & Spec Land Loans | - | 35 | 55 | |||||||||
Commercial and industrial | 116 | 52 | 495 | |||||||||
|
|
|
|
|
| |||||||
Total commercial | 210 | 192 | 773 | |||||||||
Real estate | ||||||||||||
Residential mortgage | 97 | 69 | 21 | |||||||||
Residential construction | - | - | - | |||||||||
Mortgage warehouse | - | - | - | |||||||||
|
|
|
|
|
| |||||||
Total real estate | 97 | 69 | 21 | |||||||||
Consumer | ||||||||||||
Direct Installment | 81 | 106 | 67 | |||||||||
Direct Installment Purchased | - | - | - | |||||||||
Indirect Installment | 529 | 489 | 560 | |||||||||
Home Equity | 204 | 114 | 159 | |||||||||
|
|
|
|
|
| |||||||
Total consumer | 814 | 709 | 786 | |||||||||
|
|
|
|
|
| |||||||
Total loan recoveries | 1,121 | 970 | 1,580 | |||||||||
|
|
|
|
|
| |||||||
Net loans charged-off (recovered) | 1,539 | 5,129 | 2,549 | |||||||||
|
|
|
|
|
| |||||||
Provision charged to operating expense | ||||||||||||
Commercial | (68 | ) | 2,531 | 2,277 | ||||||||
Real estate | (23 | ) | 62 | (1,153 | ) | |||||||
Consumer | 1,933 | 569 | 1,934 | |||||||||
|
|
|
|
|
| |||||||
Total provision charged to operating expense | 1,842 | 3,162 | 3,058 | |||||||||
|
|
|
|
|
| |||||||
Balance at the end of the period | $ | 14,837 | $ | 14,534 | $ | 16,501 | ||||||
|
|
|
|
|
| |||||||
Certain loans are individually evaluated for impairment, and the Company's general practice is to proactively charge down impaired loans to the fair value of the underlying collateral.
94
H ORIZON B ANCORP AND S UBSIDIARIES
Notes to Consolidated Financial Statements
(Table dollars in thousands except for per share data)
Consistent with regulatory guidance, charge-offs on all loan segments are taken when specific loans, or portions thereof, are considered uncollectible. The Company's policy is to promptly charge these loans off in the period the uncollectible loss is reasonably determined.
For all loan portfolio segments except 1-4 family residential and consumer loans, the Company promptly charges-off loans, or portions thereof, when available information confirms that specific loans are uncollectible based on information that includes, but is not limited to, (1) the deteriorating financial condition of the borrower, (2) declining collateral values, and/or (3) legal action, including bankruptcy, that impairs the borrower's ability to adequately meet its obligations. For impaired loans that are considered to be solely collateral dependent, a partial charge-off is recorded when a loss has been confirmed by an updated appraisal or other appropriate valuation of the collateral.
The Company charges-off 1-4 family residential and consumer loans, or portions thereof, when the Company reasonably determines the amount of the loss. The Company adheres to timeframes established by applicable regulatory guidance which provides for the charge-down or specific allocation of 1-4 family first and junior lien mortgages to the net realizable value less costs to sell when the value is known but no later than when a loan is 180 days past due. Pursuant to such guidelines, the Company also charges-off unsecured open-end loans when the loan is 90 days past due, and charges down to the net realizable value other secured loans when they are 90 days past due. Loans at these respective delinquency thresholds for which the Company can clearly document that the loan is both well-secured and in the process of collection, such that collection in full will occur regardless of delinquency status, are not charged off.
The following table presents the balance in the allowance for loan losses and the recorded investment in loans by portfolio segment and based on impairment analysis:
| December 31, 2016 | Commercial | Real Estate | Mortgage Warehousing | Consumer | Total | |||||||||||||||
Allowance For Loan Losses | ||||||||||||||||||||
Ending allowance balance attributable to loans: | ||||||||||||||||||||
Individually evaluated for impairment | $ | 4 | $ | - | $ | - | $ | - | $ | 4 | ||||||||||
Collectively evaluated for impairment | 6,575 | 2,090 | 1,254 | 4,914 | 14,833 | |||||||||||||||
Loans acquired with deteriorated credit quality | - | - | - | - | - | |||||||||||||||
|
|
|
|
|
|
|
|
|
| |||||||||||
Total ending allowance balance | $ | 6,579 | $ | 2,090 | $ | 1,254 | $ | 4,914 | $ | 14,837 | ||||||||||
|
|
|
|
|
|
|
|
|
| |||||||||||
Loans: | ||||||||||||||||||||
Individually evaluated for impairment | $ | 2,250 | $ | - | $ | - | $ | - | $ | 2,250 | ||||||||||
Collectively evaluated for impairment | 1,071,199 | 533,399 | 136,207 | 399,676 | 2,140,481 | |||||||||||||||
Loans acquired with deteriorated credit quality | - | - | - | - | - | |||||||||||||||
|
|
|
|
|
|
|
|
|
| |||||||||||
Total ending loans balance | $ | 1,073,449 | $ | 533,399 | $ | 136,207 | $ | 399,676 | $ | 2,142,731 | ||||||||||
|
|
|
|
|
|
|
|
|
| |||||||||||
| December 31, 2015 | Commercial | Real Estate | Mortgage Warehousing | Consumer | Total | |||||||||||||||
Allowance For Loan Losses | ||||||||||||||||||||
Ending allowance balance attributable to loans: | ||||||||||||||||||||
Individually evaluated for impairment | $ | 202 | $ | - | $ | - | $ | - | $ | 202 | ||||||||||
Collectively evaluated for impairment | 6,739 | 2,476 | 1,007 | 3,856 | 14,078 | |||||||||||||||
Loans acquired with deteriorated credit quality | 254 | - | - | - | 254 | |||||||||||||||
|
|
|
|
|
|
|
|
|
| |||||||||||
Total ending allowance balance | $ | 7,195 | $ | 2,476 | $ | 1,007 | $ | 3,856 | $ | 14,534 | ||||||||||
|
|
|
|
|
|
|
|
|
| |||||||||||
Loans: | ||||||||||||||||||||
Individually evaluated for impairment | $ | 7,019 | $ | - | $ | - | $ | - | $ | 7,019 | ||||||||||
Collectively evaluated for impairment | 798,454 | 438,454 | 145,172 | 363,419 | 1,745,499 | |||||||||||||||
Loans acquired with deteriorated credit quality | 1,729 | - | - | - | 1,729 | |||||||||||||||
|
|
|
|
|
|
|
|
|
| |||||||||||
Total ending loans balance | $ | 807,202 | $ | 438,454 | $ | 145,172 | $ | 363,419 | $ | 1,754,247 | ||||||||||
|
|
|
|
|
|
|
|
|
| |||||||||||
95
H ORIZON B ANCORP AND S UBSIDIARIES
Notes to Consolidated Financial Statements
(Table dollars in thousands except for per share data)
Note 8 – Non-performing Assets and Impaired Loans
The following table presents the nonaccrual, loans past due over 90 days still on accrual, and troubled debt restructured ("TDRs") by class of loans:
| December 31, 2016 | Non-accrual | Loans Past Due Over 90 Days Still Accruing | Non- Performing TDRs | Performing TDRs | Total Non- Performing Loans | |||||||||||||||
Commercial | ||||||||||||||||||||
Owner occupied real estate | $ | 1,532 | $ | 183 | $ | - | $ | - | $ | 1,715 | ||||||||||
Non owner occupied real estate | 440 | - | - | - | 440 | |||||||||||||||
Residential development | - | - | - | - | - | |||||||||||||||
Development & Spec Land Loans | 118 | - | - | - | 118 | |||||||||||||||
Commercial and industrial | 159 | - | - | - | 159 | |||||||||||||||
|
|
|
|
|
|
|
|
|
| |||||||||||
Total commercial | 2,249 | 183 | - | - | 2,432 | |||||||||||||||
Real estate | ||||||||||||||||||||
Residential mortgage | 2,959 | - | 576 | 1,254 | 4,789 | |||||||||||||||
Residential construction | - | - | 233 | - | 233 | |||||||||||||||
Mortgage warehouse | - | - | - | - | - | |||||||||||||||
|
|
|
|
|
|
|
|
|
| |||||||||||
Total real estate | 2,959 | - | 809 | 1,254 | 5,022 | |||||||||||||||
Consumer | ||||||||||||||||||||
Direct Installment | 512 | - | - | - | 512 | |||||||||||||||
Direct Installment Purchased | - | - | - | - | - | |||||||||||||||
Indirect Installment | 659 | 49 | - | - | 708 | |||||||||||||||
Home Equity | 1,557 | 9 | 205 | 238 | 2,009 | |||||||||||||||
|
|
|
|
|
|
|
|
|
| |||||||||||
Total Consumer | 2,728 | 58 | 205 | 238 | 3,229 | |||||||||||||||
|
|
|
|
|
|
|
|
|
| |||||||||||
Total | $ | 7,936 | $ | 241 | $ | 1,014 | $ | 1,492 | $ | 10,683 | ||||||||||
|
|
|
|
|
|
|
|
|
| |||||||||||
| December 31, 2015 | Non-accrual | Loans Past Due Over 90 Days Still Accruing | Non- Performing TDRs | Performing TDRs | Total Non- Performing Loans | |||||||||||||||
Commercial | ||||||||||||||||||||
Owner occupied real estate | $ | 1,749 | $ | - | $ | - | $ | - | $ | 1,749 | ||||||||||
Non owner occupied real estate | 3,034 | - | 1,915 | 60 | 5,009 | |||||||||||||||
Residential development | - | - | - | - | - | |||||||||||||||
Development & Spec Land Loans | 71 | - | - | - | 71 | |||||||||||||||
Commercial and industrial | 176 | - | - | - | 176 | |||||||||||||||
|
|
|
|
|
|
|
|
|
| |||||||||||
Total commercial | 5,030 | - | 1,915 | 60 | 7,005 | |||||||||||||||
Real estate | ||||||||||||||||||||
Residential mortgage | 4,354 | 1 | 824 | 808 | 5,987 | |||||||||||||||
Residential construction | - | - | 250 | - | 250 | |||||||||||||||
Mortgage warehouse | - | - | - | - | - | |||||||||||||||
|
|
|
|
|
|
|
|
|
| |||||||||||
Total real estate | 4,354 | 1 | 1,074 | 808 | 6,237 | |||||||||||||||
Consumer | ||||||||||||||||||||
Direct Installment | 541 | - | - | - | 541 | |||||||||||||||
Direct Installment Purchased | - | - | - | - | - | |||||||||||||||
Indirect Installment | 601 | 27 | - | - | 628 | |||||||||||||||
Home Equity | 1,736 | - | 183 | 350 | 2,269 | |||||||||||||||
|
|
|
|
|
|
|
|
|
| |||||||||||
Total Consumer | 2,878 | 27 | 183 | 350 | 3,438 | |||||||||||||||
|
|
|
|
|
|
|
|
|
| |||||||||||
Total | $ | 12,262 | $ | 28 | $ | 3,172 | $ | 1,218 | $ | 16,680 | ||||||||||
|
|
|
|
|
|
|
|
|
| |||||||||||
96
H ORIZON B ANCORP AND S UBSIDIARIES
Notes to Consolidated Financial Statements
(Table dollars in thousands except for per share data)
Included in the $7.9 million of non-accrual loans and the $1.0 million of non-performing TDRs at December 31, 2016 were $2.8 million and $17,000, respectively, of loans acquired for which there were accretable yields recognized.
From time to time, the Bank obtains information that may lead management to believe that the collection of payments may be doubtful on a particular loan. In recognition of this, it is management's policy to convert the loan from an "earning asset" to a non-accruing loan. The entire balance of a loan is considered delinquent if the minimum payment contractually required to be made is not received by the specified due date. Further, it is management's policy to place a loan on a non-accrual status when the payment is delinquent in excess of 90 days or the loan has had the accrual of interest discontinued by management. The officer responsible for the loan and the Chief Operating Officer or the senior collection officer must review all loans placed on non-accrual status. Subsequent payments on non-accrual loans are recorded as a reduction of principal, and interest income is recorded only after principal recovery is reasonably assured. Nonaccrual loans are returned to accrual status when, in the opinion of management, the financial position of the borrower indicates there is no longer any reasonable doubt as to the timely collection of interest or principal in accordance with the loan terms. The Company requires a period of satisfactory performance of not less than six months before returning a nonaccrual loan to accrual status.
A loan becomes impaired when, based on current information, it is probable that a creditor will be unable to collect all amounts due according to the contractual terms of the loan agreement. When a loan is classified as impaired, the degree of impairment must be recognized by estimating future cash flows from the debtor. The present value of these cash flows is computed at a discount rate based on the interest rate contained in the loan agreement. However, if a particular loan has a determinable market value for its collateral, the creditor may use that value. Also, if the loan is secured and considered collateral dependent, the creditor may use the fair value of the collateral. Interest income on loans individually classified as impaired is recognized on a cash basis after all past due and current principal payments have been made.
Smaller-balance, homogeneous loans are evaluated for impairment in total. Such loans include residential first mortgage loans secured by 1 – 4 family residences, residential construction loans, automobile, home equity, second mortgage loans and mortgage warehouse loans. Commercial loans and mortgage loans secured by other properties are evaluated individually for impairment. When analysis of borrower operating results and financial condition indicate that underlying cash flows of a borrower's business are not adequate to meet its debt service requirements, the loan is evaluated for impairment. Often this is associated with a delay or shortfall in payments of 30 days or more. Loans are generally moved to non-accrual status when they are 90 days or more past due. These loans are often considered impaired. Impaired loans, or portions thereof, are charged off when deemed uncollectible.
Loans for which it is probable that the Company will not collect all principal and interest due according to contractual terms, including TDRs, are measured for impairment. Allowable methods for determining the amount of impairment include estimating fair value using the fair value of the collateral for collateral-dependent loans.
The Company's TDRs are considered impaired loans and included in the allowance methodology using the guidance for impaired loans. At December 31, 2016, the type of concessions the Company has made on restructured loans has been temporary rate reductions and/or reductions in monthly payments and there have been no restructured loans with modified recorded balances. Any modification to a loan that is a concession and is not in the normal course of lending is considered a restructured loan. A restructured loan is returned to accruing status after six consecutive payments but is still reported as TDR unless the loan bears interest at a market rate. As of December 31, 2016, the Company had $2.5 million in TDRs and $1.5 million were performing according to the restructured terms and four TDRs were returned to accrual status during 2016. There was $109,000 of specific reserves allocated to TDRs at December 31, 2016 based on the collateral deficiencies.
97
H ORIZON B ANCORP AND S UBSIDIARIES
Notes to Consolidated Financial Statements
(Table dollars in thousands except for per share data)
The following table presents commercial loans individually evaluated for impairment by class of loans:
| Twelve Months Ending | ||||||||||||||||||||
| December 31, 2016 | Unpaid Principal Balance | Recorded Investment | Allowance For Loan Loss Allocated | Average Balance in Impaired Loans | Cash/Accrual Interest Income Recognized | |||||||||||||||
With no recorded allowance | ||||||||||||||||||||
Commercial | ||||||||||||||||||||
Owner occupied real estate | $ | 1,533 | $ | 1,533 | $ | - | $ | 1,619 | $ | 58 | ||||||||||
Non owner occupied real estate | 440 | 440 | - | 871 | 18 | |||||||||||||||
Residential development | - | - | - | - | - | |||||||||||||||
Development & Spec Land Loans | 118 | 118 | - | 61 | 16 | |||||||||||||||
Commercial and industrial | 128 | 127 | - | 349 | 1 | |||||||||||||||
|
|
|
|
|
|
|
|
|
| |||||||||||
Total commercial | 2,219 | 2,218 | - | 2,900 | 93 | |||||||||||||||
With an allowance recorded | ||||||||||||||||||||
Commercial | ||||||||||||||||||||
Owner occupied real estate | - | - | - | - | - | |||||||||||||||
Non owner occupied real estate | - | - | - | - | - | |||||||||||||||
Residential development | - | - | - | - | - | |||||||||||||||
Development & Spec Land Loans | - | - | - | - | - | |||||||||||||||
Commercial and industrial | 31 | 32 | 4 | 5 | 2 | |||||||||||||||
|
|
|
|
|
|
|
|
|
| |||||||||||
Total commercial | 31 | 32 | 4 | 5 | 2 | |||||||||||||||
|
|
|
|
|
|
|
|
|
| |||||||||||
Total | $ | 2,250 | $ | 2,250 | $ | 4 | $ | 2,905 | $ | 95 | ||||||||||
|
|
|
|
|
|
|
|
|
| |||||||||||
| Twelve Months Ending | ||||||||||||||||||||
| December 31, 2015 | Unpaid Principal Balance | Recorded Investment | Allowance For Loan Loss Allocated | Average Balance in Impaired Loans | Cash/Accrual Interest Income Recognized | |||||||||||||||
With no recorded allowance | ||||||||||||||||||||
Commercial | ||||||||||||||||||||
Owner occupied real estate | $ | 1,340 | $ | 1,339 | $ | - | $ | 1,001 | $ | 22 | ||||||||||
Non owner occupied real estate | 4,938 | 4,953 | - | 5,417 | 8 | |||||||||||||||
Residential development | - | - | - | - | - | |||||||||||||||
Development & Spec Land Loans | 71 | 71 | - | 6 | 3 | |||||||||||||||
Commercial and industrial | 79 | 79 | - | 275 | 4 | |||||||||||||||
|
|
|
|
|
|
|
|
|
| |||||||||||
Total commercial | 6,428 | 6,442 | - | 6,699 | 37 | |||||||||||||||
With an allowance recorded | ||||||||||||||||||||
Commercial | ||||||||||||||||||||
Owner occupied real estate | 410 | 410 | 105 | 243 | 8 | |||||||||||||||
Non owner occupied real estate | 70 | 70 | 32 | 6 | 13 | |||||||||||||||
Residential development | - | - | - | - | - | |||||||||||||||
Development & Spec Land Loans | - | - | - | - | - | |||||||||||||||
Commercial and industrial | 97 | 97 | 65 | 162 | - | |||||||||||||||
|
|
|
|
|
|
|
|
|
| |||||||||||
Total commercial | 577 | 577 | 202 | 411 | 21 | |||||||||||||||
|
|
|
|
|
|
|
|
|
| |||||||||||
Total | $ | 7,005 | $ | 7,019 | $ | 202 | $ | 7,110 | $ | 58 | ||||||||||
|
|
|
|
|
|
|
|
|
| |||||||||||
98
H ORIZON B ANCORP AND S UBSIDIARIES
Notes to Consolidated Financial Statements
(Table dollars in thousands except for per share data)
| Twelve Months Ending | ||||||||||||||||||||
| December 31, 2014 | Unpaid Principal Balance | Recorded Investment | Allowance For Loan Loss Allocated | Average Balance in Impaired Loans | Cash/Accrual Interest Income Recognized | |||||||||||||||
With no recorded allowance | ||||||||||||||||||||
Commercial | ||||||||||||||||||||
Owner occupied real estate | $ | 1,169 | $ | 1,170 | $ | - | $ | 645 | $ | 65 | ||||||||||
Non owner occupied real estate | 1,193 | 1,194 | - | 1,341 | 51 | |||||||||||||||
Residential development | - | - | - | - | - | |||||||||||||||
Development & Spec Land Loans | - | - | - | - | - | |||||||||||||||
Commercial and industrial | 854 | 854 | - | 357 | 27 | |||||||||||||||
|
|
|
|
|
|
|
|
|
| |||||||||||
Total commercial | 3,216 | 3,218 | - | 2,343 | 143 | |||||||||||||||
With an allowance recorded | ||||||||||||||||||||
Commercial | ||||||||||||||||||||
Owner occupied real estate | 422 | 422 | 165 | 141 | 16 | |||||||||||||||
Non owner occupied real estate | 6,453 | 6,453 | 744 | 1,995 | 208 | |||||||||||||||
Residential development | - | - | - | - | - | |||||||||||||||
Development & Spec Land Loans | - | - | - | - | - | |||||||||||||||
Commercial and industrial | 962 | 962 | 680 | 798 | 12 | |||||||||||||||
|
|
|
|
|
|
|
|
|
| |||||||||||
Total commercial | 7,837 | 7,837 | 1,589 | 2,934 | 236 | |||||||||||||||
|
|
|
|
|
|
|
|
|
| |||||||||||
Total | $ | 11,053 | $ | 11,055 | $ | 1,589 | $ | 5,277 | $ | 379 | ||||||||||
|
|
|
|
|
|
|
|
|
| |||||||||||
The following table presents the payment status by class of loans:
| December 31, 2016 | 30 - 59 Days Past Due | 60 - 89 Days Past Due | 90 Days or Greater Past Due | Total Past Due | Loans Not Past Due | Total | ||||||||||||||||||
Commercial | ||||||||||||||||||||||||
Owner occupied real estate | $ | 1,068 | $ | - | $ | 183 | $ | 1,251 | $ | 336,297 | $ | 337,548 | ||||||||||||
Non owner occupied real estate | 357 | - | - | 357 | 461,540 | 461,897 | ||||||||||||||||||
Residential development | - | - | - | - | 5,006 | 5,006 | ||||||||||||||||||
Development & Spec Land Loans | 1 | - | - | 1 | 31,227 | 31,228 | ||||||||||||||||||
Commercial and industrial | 982 | - | - | 982 | 229,538 | 230,520 | ||||||||||||||||||
|
|
|
|
|
|
|
|
|
|
|
| |||||||||||||
Total commercial | 2,408 | - | 183 | 2,591 | 1,063,608 | 1,066,199 | ||||||||||||||||||
Real estate | ||||||||||||||||||||||||
Residential mortgage | 886 | 123 | - | 1,009 | 507,224 | 508,233 | ||||||||||||||||||
Residential construction | - | - | - | - | 20,611 | 20,611 | ||||||||||||||||||
Mortgage warehouse | - | - | - | - | 135,727 | 135,727 | ||||||||||||||||||
|
|
|
|
|
|
|
|
|
|
|
| |||||||||||||
Total real estate | 886 | 123 | - | 1,009 | 663,562 | 664,571 | ||||||||||||||||||
Consumer | ||||||||||||||||||||||||
Direct Installment | 139 | 4 | - | 143 | 71,007 | 71,150 | ||||||||||||||||||
Direct Installment Purchased | - | - | - | - | 119 | 119 | ||||||||||||||||||
Indirect Installment | 1,339 | 237 | 49 | 1,625 | 151,579 | 153,204 | ||||||||||||||||||
Home Equity | 912 | 267 | 9 | 1,188 | 173,938 | 175,126 | ||||||||||||||||||
|
|
|
|
|
|
|
|
|
|
|
| |||||||||||||
Total consumer | 2,390 | 508 | 58 | 2,956 | 396,643 | 399,599 | ||||||||||||||||||
|
|
|
|
|
|
|
|
|
|
|
| |||||||||||||
Total | $ | 5,684 | $ | 631 | $ | 241 | $ | 6,556 | $ | 2,123,813 | $ | 2,130,369 | ||||||||||||
|
|
|
|
|
|
|
|
|
|
|
| |||||||||||||
Percentage of total loans | 0.27 | % | 0.03 | % | 0.01 | % | 0.31 | % | 99.69 | % | ||||||||||||||
99
H ORIZON B ANCORP AND S UBSIDIARIES
Notes to Consolidated Financial Statements
(Table dollars in thousands except for per share data)
| December 31, 2015 | 30 - 59 Days Past Due | 60 - 89 Days Past Due | 90 Days or Greater Past Due | Total Past Due | Loans Not Past Due | Total | ||||||||||||||||||
Commercial | ||||||||||||||||||||||||
Owner occupied real estate | $ | 481 | $ | 18 | $ | - | $ | 499 | $ | 267,782 | $ | 268,281 | ||||||||||||
Non owner occupied real estate | 49 | - | - | 49 | 326,350 | 326,399 | ||||||||||||||||||
Residential development | - | - | - | - | 5,018 | 5,018 | ||||||||||||||||||
Development & Spec Land Loans | - | - | - | - | 18,183 | 18,183 | ||||||||||||||||||
Commercial and industrial | 32 | - | - | 32 | 184,879 | 184,911 | ||||||||||||||||||
|
|
|
|
|
|
|
|
|
|
|
| |||||||||||||
Total commercial | 562 | 18 | - | 580 | 802,212 | 802,792 | ||||||||||||||||||
Real estate | ||||||||||||||||||||||||
Residential mortgage | 1,121 | 344 | 1 | 1,466 | 413,458 | 414,924 | ||||||||||||||||||
Residential construction | - | - | - | - | 19,751 | 19,751 | ||||||||||||||||||
Mortgage warehouse | - | - | - | - | 144,692 | 144,692 | ||||||||||||||||||
|
|
|
|
|
|
|
|
|
|
|
| |||||||||||||
Total real estate | 1,121 | 344 | 1 | 1,466 | 577,901 | 579,367 | ||||||||||||||||||
Consumer | ||||||||||||||||||||||||
Direct Installment | 106 | 10 | - | 116 | 54,225 | 54,341 | ||||||||||||||||||
Direct Installment Purchased | - | - | - | - | 153 | 153 | ||||||||||||||||||
Indirect Installment | 1,186 | 268 | 27 | 1,481 | 150,042 | 151,523 | ||||||||||||||||||
Home Equity | 1,193 | 203 | - | 1,396 | 155,768 | 157,164 | ||||||||||||||||||
|
|
|
|
|
|
|
|
|
|
|
| |||||||||||||
Total consumer | 2,485 | 481 | 27 | 2,993 | 360,188 | 363,181 | ||||||||||||||||||
|
|
|
|
|
|
|
|
|
|
|
| |||||||||||||
Total | $ | 4,168 | $ | 843 | $ | 28 | $ | 5,039 | $ | 1,740,301 | $ | 1,745,340 | ||||||||||||
|
|
|
|
|
|
|
|
|
|
|
| |||||||||||||
Percentage of total loans | 0.24 | % | 0.05 | % | 0.00 | % | 0.29 | % | 99.71 | % | ||||||||||||||
The entire balance of a loan is considered delinquent if the minimum payment contractually required to be made is not received by the specified due date.
Horizon Bank's processes for determining credit quality differ slightly depending on whether a new loan or a renewed loan is being underwritten, or whether an existing loan is being re-evaluated for credit quality. The latter usually occurs upon receipt of current financial information or other pertinent data that would trigger a change in the loan grade.
| • | For new and renewed commercial loans, the Bank's Credit Department, which acts independently of the loan officer, assigns the credit quality grade to the loan. Loan grades for loans with an aggregate credit exposure that exceeds the authorities in the respective markets (ranging from $1,000,000 to $2,500,000) are validated by the Loan Committee, which is chaired by the Chief Credit Officer (CCO). |
| • | Commercial loan officers are responsible for reviewing their loan portfolios and report any adverse material change to the CCO or Loan Committee. When circumstances warrant a change in the credit quality grade, loan officers are required to notify the CCO and the Credit Department of the change in the loan grade. Downgrades are accepted immediately by the CCO, however, lenders must present their factual information to either the Loan Committee or the CCO when recommending an upgrade. |
| • | The CCO, or his designee, meets weekly with loan officers to discuss the status of past-due loans and classified loans. These meetings are also designed to give the loan officers an opportunity to identify an existing loan that should be downgraded to a classified grade. |
| • | Monthly, senior management meets with the Watch Committee, which reviews all of the past due, classified, and impaired loans and the relative trends of these assets. This committee also reviews the actions taken by management regarding foreclosure mitigation, loan extensions, troubled debt restructures, other real estate owned and personal property repossessions. The information reviewed in this meeting acts as a precursor for developing management's analysis of the adequacy of the Allowance for Loan and Lease Losses. |
For residential real estate and consumer loans, Horizon uses a grading system based on delinquency. Loans that are 90 days or more past due, on non-accrual, or are classified as a TDR are graded "Substandard." After being 90 days delinquent a loan is charged off unless it is well secured and in the process of collection. If the latter case exists, the loan is placed on non-accrual. Occasionally a mortgage loan may be graded as "Special Mention." When this situation arises, it is because the characteristics of the loan and the borrower fit the definition of a Risk Grade 5 described below, which is normally used for grading commercial loans. Loans not graded Substandard are considered Pass.
100
H ORIZON B ANCORP AND S UBSIDIARIES
Notes to Consolidated Financial Statements
(Table dollars in thousands except for per share data)
Horizon Bank employs a nine-grade rating system to determine the credit quality of commercial loans. The first five grades represent acceptable quality, and the last four grades mirror the criticized and classified grades used by the bank regulatory agencies (special mention, substandard, doubtful, and loss). The loan grade definitions are detailed below.
Risk Grade 1: Excellent (Pass)
Loans secured by liquid collateral, such as certificates of deposit, reputable bank letters of credit, or other cash equivalents; loans that are guaranteed or otherwise backed by the full faith and credit of the United States government or an agency thereof, such as the Small Business Administration; or loans to any publicly held company with a current long-term debt rating of A or better.
Risk Grade 2: Good (Pass)
Loans to businesses that have strong financial statements containing an unqualified opinion from a CPA firm and at least three consecutive years of profits; loans supported by unaudited financial statements containing strong balance sheets, five consecutive years of profits, a five-year satisfactory relationship with the Bank, and key balance sheet and income statement trends that are either stable or positive; loans secured by publicly traded marketable securities where there is no impediment to liquidation; loans to individuals backed by liquid personal assets and unblemished credit history; or loans to publicly held companies with current long-term debt ratings of Baa or better.
Risk Grade 3: Satisfactory (Pass)
Loans supported by financial statements (audited or unaudited) that indicate average or slightly below average risk and having some deficiency or vulnerability to changing economic conditions; loans with some weakness but offsetting features of other support are readily available; loans that are meeting the terms of repayment, but which may be susceptible to deterioration if adverse factors are encountered.
Loans may be graded Satisfactory when there is no recent information on which to base a current risk evaluation and the following conditions apply:
| • | At inception, the loan was properly underwritten, did not possess an unwarranted level of credit risk, and the loan met the above criteria for a risk grade of Excellent, Good, or Satisfactory; |
| • | At inception, the loan was secured with collateral possessing a loan value adequate to protect the Bank from loss. |
| • | The loan has exhibited two or more years of satisfactory repayment with a reasonable reduction of the principal balance. |
| • | During the period that the loan has been outstanding, there has been no evidence of any credit weakness. Some examples of weakness include slow payment, lack of cooperation by the borrower, breach of loan covenants, or the borrower is in an industry known to be experiencing problems. If any of these credit weaknesses is observed, a lower risk grade may be warranted. |
Risk Grade 4 Satisfactory/Monitored:
Loans in this category are considered to be of acceptable credit quality, but contain greater credit risk than Satisfactory loans. Borrower displays acceptable liquidity, leverage, and earnings performance within the Bank's minimum underwriting guidelines. The level of risk is acceptable but conditioned on the proper level of loan officer supervision. Loans that normally fall into this grade include acquisition, construction and development loans and income producing properties that have not reached stabilization.
Risk Grade 4W Management Watch:
Loans in this category are considered to be of acceptable quality, but with above normal risk. Borrower displays potential indicators of weakness in the primary source of repayment resulting in a higher reliance on secondary sources of repayment. Balance sheet may exhibit weak liquidity and/or high leverage. There is inconsistent earnings performance without the ability to sustain adverse economic conditions. Borrower may be operating in a declining industry or the property type, as for a commercial real estate loan, may be high risk or in decline. These loans require an increased level of loan officer supervision and monitoring to assure that any deterioration is addressed in a timely fashion.
101
H ORIZON B ANCORP AND S UBSIDIARIES
Notes to Consolidated Financial Statements
(Table dollars in thousands except for per share data)
Risk Grade 5: Special Mention
Loans which possess some credit deficiency or potential weakness which deserves close attention. Such loans pose an unwarranted financial risk that, if not corrected, could weaken the loan by adversely impacting the future repayment ability of the borrower. The key distinctions of a Special Mention classification are that (1) it is indicative of an unwarranted level of risk and (2) weaknesses are considered "potential," not "defined," impairments to the primary source of repayment. These loans may be to borrowers with adverse trends in financial performance, collateral value and/or marketability, or balance sheet strength.
Risk Grade 6: Substandard
One or more of the following characteristics may be exhibited in loans classified Substandard:
| • | Loans which possess a defined credit weakness. The likelihood that a loan will be paid from the primary source of repayment is uncertain. Financial deterioration is under way and very close attention is warranted to ensure that the loan is collected without loss. |
| • | Loans are inadequately protected by the current net worth and paying capacity of the obligor. |
| • | The primary source of repayment is gone, and the Bank is forced to rely on a secondary source of repayment, such as collateral liquidation or guarantees. |
| • | Loans have a distinct possibility that the Bank will sustain some loss if deficiencies are not corrected. |
| • | Unusual courses of action are needed to maintain a high probability of repayment. |
| • | The borrower is not generating enough cash flow to repay loan principal; however, it continues to make interest payments. |
| • | The lender is forced into a subordinated or unsecured position due to flaws in documentation. |
| • | Loans have been restructured so that payment schedules, terms, and collateral represent concessions to the borrower when compared to the normal loan terms. |
| • | The lender is seriously contemplating foreclosure or legal action due to the apparent deterioration in the loan. |
| • | There is a significant deterioration in market conditions to which the borrower is highly vulnerable. |
Risk Grade 7: Doubtful
One or more of the following characteristics may be present in loans classified Doubtful:
| • | Loans have all of the weaknesses of those classified as Substandard. However, based on existing conditions, these weaknesses make full collection of principal highly improbable. |
| • | The primary source of repayment is gone, and there is considerable doubt as to the quality of the secondary source of repayment. |
| • | The possibility of loss is high but because of certain important pending factors which may strengthen the loan, loss classification is deferred until the exact status of repayment is known. |
Risk Grade 8: Loss
Loans are considered uncollectible and of such little value that continuing to carry them as assets is not feasible. Loans will be classified Loss when it is neither practical nor desirable to defer writing off or reserving all or a portion of a basically worthless asset, even though partial recovery may be possible at some time in the future.
102
H ORIZON B ANCORP AND S UBSIDIARIES
Notes to Consolidated Financial Statements
(Table dollars in thousands except for per share data)
The following table presents loans by credit grades.
| December 31, 2016 | Pass | Special Mention | Substandard | Doubtful | Total | |||||||||||||||
Commercial | ||||||||||||||||||||
Owner occupied real estate | $ | 322,924 | $ | 4,960 | $ | 9,664 | $ | - | $ | 337,548 | ||||||||||
Non owner occupied real estate | 455,648 | 341 | 5,908 | - | 461,897 | |||||||||||||||
Residential development | 5,006 | - | - | - | 5,006 | |||||||||||||||
Development & Spec Land Loans | 31,057 | - | 171 | - | 31,228 | |||||||||||||||
Commercial and industrial | 220,424 | 3,728 | 6,368 | - | 230,520 | |||||||||||||||
|
|
|
|
|
|
|
|
|
| |||||||||||
Total commercial | 1,035,059 | 9,029 | 22,111 | - | 1,066,199 | |||||||||||||||
Real estate | ||||||||||||||||||||
Residential mortgage | 503,444 | - | 4,789 | - | 508,233 | |||||||||||||||
Residential construction | 20,378 | - | 233 | - | 20,611 | |||||||||||||||
Mortgage warehouse | 135,727 | - | - | - | 135,727 | |||||||||||||||
|
|
|
|
|
|
|
|
|
| |||||||||||
Total real estate | 659,549 | - | 5,022 | - | 664,571 | |||||||||||||||
Consumer | ||||||||||||||||||||
Direct Installment | 70,638 | - | 512 | - | 71,150 | |||||||||||||||
Direct Installment Purchased | 119 | - | - | - | 119 | |||||||||||||||
Indirect Installment | 152,496 | - | 708 | - | 153,204 | |||||||||||||||
Home Equity | 173,117 | - | 2,009 | - | 175,126 | |||||||||||||||
|
|
|
|
|
|
|
|
|
| |||||||||||
Total Consumer | 396,370 | - | 3,229 | - | 399,599 | |||||||||||||||
|
|
|
|
|
|
|
|
|
| |||||||||||
Total | $ | 2,090,978 | $ | 9,029 | $ | 30,362 | $ | - | $ | 2,130,369 | ||||||||||
|
|
|
|
|
|
|
|
|
| |||||||||||
Percentage of total loans | 98.15 | % | 0.42 | % | 1.43 | % | 0.00 | % | ||||||||||||
| December 31, 2015 | Pass | Special Mention | Substandard | Doubtful | Total | |||||||||||||||
Commercial | ||||||||||||||||||||
Owner occupied real estate | $ | 257,181 | $ | 4,954 | $ | 6,146 | $ | - | $ | 268,281 | ||||||||||
Non owner occupied real estate | 320,216 | 585 | 5,598 | - | 326,399 | |||||||||||||||
Residential development | 5,018 | - | - | - | 5,018 | |||||||||||||||
Development & Spec Land Loans | 18,112 | - | 71 | - | 18,183 | |||||||||||||||
Commercial and industrial | 180,581 | 693 | 3,637 | - | 184,911 | |||||||||||||||
|
|
|
|
|
|
|
|
|
| |||||||||||
Total commercial | 781,108 | 6,232 | 15,452 | - | 802,792 | |||||||||||||||
Real estate | ||||||||||||||||||||
Residential mortgage | 408,937 | - | 5,987 | - | 414,924 | |||||||||||||||
Residential construction | 19,501 | - | 250 | - | 19,751 | |||||||||||||||
Mortgage warehouse | 144,692 | - | - | - | 144,692 | |||||||||||||||
|
|
|
|
|
|
|
|
|
| |||||||||||
Total real estate | 573,130 | - | 6,237 | - | 579,367 | |||||||||||||||
Consumer | ||||||||||||||||||||
Direct Installment | 53,800 | - | 541 | - | 54,341 | |||||||||||||||
Direct Installment Purchased | 153 | - | - | - | 153 | |||||||||||||||
Indirect Installment | 150,895 | - | 628 | - | 151,523 | |||||||||||||||
Home Equity | 154,895 | - | 2,269 | - | 157,164 | |||||||||||||||
|
|
|
|
|
|
|
|
|
| |||||||||||
Total Consumer | 359,743 | - | 3,438 | - | 363,181 | |||||||||||||||
|
|
|
|
|
|
|
|
|
| |||||||||||
Total | $ | 1,713,981 | $ | 6,232 | $ | 25,127 | $ | - | $ | 1,745,340 | ||||||||||
|
|
|
|
|
|
|
|
|
| |||||||||||
Percentage of total loans | 98.20 | % | 0.36 | % | 1.44 | % | 0.00 | % | ||||||||||||
103
H ORIZON B ANCORP AND S UBSIDIARIES
Notes to Consolidated Financial Statements
(Table dollars in thousands except for per share data)
Note 9 – Premises and Equipment
| December 31 2016 | December 31 2015 | |||||||
Land | $ | 20,032 | $ | 19,475 | ||||
Buildings and improvements | 59,607 | 55,341 | ||||||
Furniture and equipment | 19,965 | 15,702 | ||||||
|
|
|
| |||||
Total cost | 99,604 | 90,518 | ||||||
Accumulated depreciation | (33,247 | ) | (29,720 | ) | ||||
|
|
|
| |||||
Net premise and equipment | $ | 66,357 | $ | 60,798 | ||||
|
|
|
| |||||
Note 10 – Loan Servicing
Loans serviced for others are not included in the accompanying consolidated balance sheets. The unpaid principal balances of loans serviced for others totaled approximately $1.3 billion and $1.2 billion at December 31, 2016 and 2015.
The aggregate fair value of capitalized mortgage servicing rights was approximately $12.1 million, $10.8 million, and $10.5 million at December 31, 2016, 2015 and 2014, compared to the carrying values of $11.1 million, $8.9 million and $7.6 million, respectively. The fair value of capitalized mortgage servicing rights was approximately $7.0 million on January 1, 2014. Comparable market values and a valuation model that calculates the present value of future cash flows were used to estimate fair value. For purposes of measuring impairment, risk characteristics including product type, investor type and interest rates, were used to stratify the originated mortgage servicing rights.
| December 31 2016 | December 31 2015 | December 31 2014 | ||||||||||
Mortgage servicing rights | ||||||||||||
Balances, January 1 | $ | 9,271 | $ | 7,980 | $ | 7,428 | ||||||
Servicing rights capitalized | 3,426 | 2,974 | 2,280 | |||||||||
Amortization of servicing rights | (1,016 | ) | (1,683 | ) | (1,728 | ) | ||||||
|
|
|
|
|
| |||||||
Balances, December 31 | 11,681 | 9,271 | 7,980 | |||||||||
|
|
|
|
|
| |||||||
Impairment allowance | ||||||||||||
Balances, January 1 | (397 | ) | (338 | ) | (389 | ) | ||||||
Additions | (236 | ) | (130 | ) | (95 | ) | ||||||
Reductions | 126 | 71 | 146 | |||||||||
|
|
|
|
|
| |||||||
Balances, December 31 | (507 | ) | (397 | ) | (338 | ) | ||||||
|
|
|
|
|
| |||||||
Mortgage servicing rights, net | $ | 11,174 | $ | 8,874 | $ | 7,642 | ||||||
|
|
|
|
|
| |||||||
During 2016, 2015 and 2014, the Bank recorded recovery and additional (impairment) of approximately $(110,000), $(59,000) and $51,000, respectively.
Note 11 – Goodwill and Intangible Assets
On November 7, 2016, the CNB acquisition resulted in goodwill of $609,000. On July 18, 2016, the LaPorte acquisition resulted in goodwill of $20.3 million. On June 1, 2016, the Kosciusko acquisition resulted in goodwill of $6.4 million. On July 1, 2015, the Peoples acquisition resulted in goodwill of $21.4 million. Additionally, on April 3, 2014, the Summit acquisition resulted in goodwill of $8.4 million.
No impairment loss was recorded in 2016 or 2015. The Company tested goodwill for impairment during 2016 and 2015. In both valuations, the fair value exceeded the Company's carrying value, therefore, it was concluded goodwill is not impaired. For additional details related to impairment testing, see the "Goodwill and Intangible Assets" section of "Management's Discussion and Analysis of Financial Condition and Results of Operations" included as Item 7 of this Annual Report on Form 10K.
104
H ORIZON B ANCORP AND S UBSIDIARIES
Notes to Consolidated Financial Statements
(Table dollars in thousands except for per share data)
| 2016 | 2015 | |||||||
Balance, January 1 | $ | 49,600 | $ | 28,176 | ||||
Goodwill acquired | 27,341 | 21,424 | ||||||
|
|
|
| |||||
Balance, December 31 | $ | 76,941 | $ | 49,600 | ||||
|
|
|
| |||||
As a result of the acquisition of Alliance Bank Corporation in 2005, American Trust & Savings Bank in 2010, Heartland in 2012, Summit in 2014, Peoples in 2015, Kosciusko, LaPorte and CNB in 2016, the Company has recorded certain amortizable intangible assets related to core deposit intangibles. The core deposit intangible is being amortized over seven to ten years using an accelerated method. Amortizable intangible assets are summarized as follows:
| December 31, 2016 | December 31, 2015 | |||||||||||||||
| Gross Carrying Amount | Accumulated Amortization | Gross Carrying Amount | Accumulated Amortization | |||||||||||||
Amortizable intangible assets | ||||||||||||||||
Core deposit intangible | $ | 16,151 | $ | (6,785 | ) | $ | 12,920 | $ | (5,549 | ) | ||||||
Amortization expense for intangible assets totaled $1.2 million, $988,000, and $880,000 for the years ended December 31, 2016, 2015 and 2014. Estimated amortization for the years ending December 31 is as follows:
2017 | $ | 1,425 | ||
2018 | 1,422 | |||
2019 | 1,280 | |||
2020 | 984 | |||
2021 | 910 | |||
Thereafter | 3,345 | |||
|
| |||
| $ | 9,366 | |||
|
|
Note 12 – Deposits
| December 31 | December 31 | |||||||
| 2016 | 2015 | |||||||
Noninterest-bearing demand deposits | $ | 496,248 | $ | 335,955 | ||||
Interest-bearing demand deposits | 850,641 | 706,739 | ||||||
Money market (variable rate) | 290,896 | 231,956 | ||||||
Savings deposits | 357,582 | 238,956 | ||||||
Certificates of deposit of $250,000 or more | 105,361 | 67,697 | ||||||
Other certificates and time deposits | 370,482 | 298,850 | ||||||
|
|
|
| |||||
Total deposits | $ | 2,471,210 | $ | 1,880,153 | ||||
|
|
|
| |||||
105
H ORIZON B ANCORP AND S UBSIDIARIES
Notes to Consolidated Financial Statements
(Table dollars in thousands except for per share data)
Certificates and other time deposits for both retail and brokered maturing in years ending December 31 are as follows:
| Retail | Brokered | Total | ||||||||||
2017 | $ | 215,751 | $ | 41,320 | $ | 257,071 | ||||||
2018 | 74,148 | 1,250 | 75,398 | |||||||||
2019 | 73,774 | - | 73,774 | |||||||||
2020 | 31,702 | - | 31,702 | |||||||||
2021 | 12,528 | 3,150 | 15,678 | |||||||||
Thereafter | 19,741 | 2,479 | 22,220 | |||||||||
|
|
|
|
|
| |||||||
| $ | 427,644 | $ | 48,199 | $ | 475,843 | |||||||
|
|
|
|
|
| |||||||
Note 13 – Borrowings
| December 31 | December 31 | |||||||
| 2016 | 2015 | |||||||
Federal Home Loan Bank advances, variable and fixed rates ranging from 0.74% to 7.53%, due at various dates through November 15, 2024 | $ | 124,034 | $ | 158,948 | ||||
Securities sold under agreements to repurchase | 57,144 | 154,399 | ||||||
Federal funds purchased | 66,811 | 136,000 | ||||||
Notes payable, variable rate of 2.75%, due at various dates through July 13, 2019 | 19,500 | - | ||||||
|
|
|
| |||||
Total borrowings | $ | 267,489 | $ | 449,347 | ||||
|
|
|
| |||||
The Federal Home Loan Bank advances are secured by first and second mortgage loans and mortgage warehouse loans totaling approximately $537.8 million. Advances are subject to restrictions or penalties in the event of prepayment.
At December 31, 2016, the Bank had available approximately $453.9 million in credit lines with various money center banks, including the FHLB.
Contractual maturities in years ending December 31 are as follows:
2017 | $ | 203,610 | ||
2018 | 33,328 | |||
2019 | 21,957 | |||
2020 | 2,847 | |||
2021 | 5,317 | |||
Thereafter | 430 | |||
|
| |||
| $ | 267,489 | |||
|
|
Note 14 – Repurchase Agreements
The Company transfers various securities to customers in exchange for cash at the end of each business day and agrees to acquire the securities at the end of the next business day for the cash exchanged plus interest. The process is repeated at the end of each business day until the agreement is terminated. The securities underlying the agreement remain under the Bank's control. Securities sold under agreements to repurchase are secured by federal agency collateralized mortgage obligations and mortgage-backed pools.
106
H ORIZON B ANCORP AND S UBSIDIARIES
Notes to Consolidated Financial Statements
(Table dollars in thousands except for per share data)
The following table shows repurchase agreements accounted for as secured borrowings (in thousands):
| Remaining Contractual Maturity of the Agreements | ||||||||||||||||||||||||||||
| December 31, 2016 | Overnight and Continuous | Up to one year | One to three years | Three to five years | Five to ten years | Beyond ten years | Total | |||||||||||||||||||||
Repurchase Agreements and repurchase-to-maturity transactions | ||||||||||||||||||||||||||||
Repurchase Agreements | $ | 57,144 | $ | - | $ | - | $ | - | $ | - | $ | - | $ | 57,144 | ||||||||||||||
Securities pledged for Repurchase Agreements | ||||||||||||||||||||||||||||
U.S. Treasury and federal agencies | $ | - | $ | - | $ | - | $ | - | $ | - | $ | - | $ | - | ||||||||||||||
Federal agency collateralized mortgage obligations | 44,408 | - | - | - | - | - | 44,408 | |||||||||||||||||||||
Federal agency mortgage-backed pools | 19,980 | - | - | - | - | - | 19,980 | |||||||||||||||||||||
|
|
|
|
|
|
|
|
|
|
|
|
|
| |||||||||||||||
Total | $ | 64,388 | $ | - | $ | - | $ | - | $ | - | $ | - | $ | 64,388 | ||||||||||||||
|
|
|
|
|
|
|
|
|
|
|
|
|
| |||||||||||||||
Securities sold under agreements to repurchase consist of obligations of the Bank to other parties. The obligations are secured by U.S. Treasury and federal agencies, federal agency collateralized mortgage obligations and federal agency mortgage-backed pools and such collateral is held in safekeeping by third parties. The maximum amount of outstanding agreements at any month end during 2016 and 2015 totaled $157.7 million and $156.2 million and the daily average of such agreements totaled $134.2 million and $149.9 million. The agreements at December 31, 2016, are overnight agreements.
Note 15 – Subordinated Debentures
In October of 2004, Horizon formed Horizon Statutory Trust II ("Trust II"), a wholly owned statutory business trust. Trust II sold $10.3 million of Trust Preferred Capital Securities as a participant in a pooled trust preferred securities offering. The proceeds from the sale of the trust preferred securities were used by the trust to purchase an equivalent amount of subordinated debentures from Horizon. The junior subordinated debentures are the sole assets of Trust II and are fully and unconditionally guaranteed by Horizon. The junior subordinated debentures and the trust preferred securities pay interest and dividends on a quarterly basis. The junior subordinated debentures and the securities bear interest at a rate of 90-day LIBOR plus 1.95% (2.95% at December 31, 2016) and mature on October 21, 2034, and securities may be called at any quarterly interest payment date at par. Costs associated with the issuance of the securities totaling $17,500 were capitalized and were amortized to October 31, 2009, the first call date of the securities.
In December of 2006, Horizon formed Horizon Bancorp Capital Trust III ("Trust III"), a wholly owned statutory business trust. Trust III sold $12.4 million of Trust Preferred Capital Securities as a participant in a pooled trust preferred securities offering. The proceeds from the sale of the trust preferred securities were used by the trust to purchase an equivalent amount of subordinated debentures from Horizon. The junior subordinated debentures are the sole assets of Trust III and are fully and unconditionally guaranteed by Horizon. The junior subordinated debentures and the trust preferred securities pay interest and dividends on a quarterly basis. The junior subordinated debentures and the securities bear interest at a rate of 90-day LIBOR plus 1.65% (2.65% at December 31, 2016) and mature on January 30, 2037, and securities may be called at any quarterly interest payment date at par. Costs associated with the issuance of the securities totaling $12,647 were capitalized and are being amortized to the first call date of the securities.
The Company assumed additional debentures as the result of the acquisition of Alliance Bank Corporation in 2005. In June 2004, Alliance formed Alliance Financial Statutory Trust I a wholly owned business trust ("Alliance Trust"), to sell $5.2 million in trust preferred securities. The proceeds from the sale of the trust preferred securities were used by the trust to purchase an equivalent amount of subordinated debentures from Alliance. The junior subordinated debentures are the sole assets of Alliance Trust and are fully and unconditionally guaranteed by Horizon. The junior subordinated debentures and the trust preferred securities pay interest and dividends on a quarterly basis. The junior subordinated debentures and the securities bear interest at a rate of 90-day LIBOR plus 2.65% (3.65% at December 31, 2016) and mature in June 2034, and securities may be called at any quarterly interest payment date at par.
107
H ORIZON B ANCORP AND S UBSIDIARIES
Notes to Consolidated Financial Statements
(Table dollars in thousands except for per share data)
The Company assumed additional debentures as the result of the American Trust & Savings Bank purchase and assumption in 2010. In March 2004, Am Tru Inc., the holding company for American Trust & Savings Bank, formed Am Tru Statutory Trust I a wholly owned business trust ("Am Tru Trust"), to sell $3.5 million in trust preferred securities. The proceeds from the sale of the trust preferred securities were used by the trust to purchase an equivalent amount of subordinated debentures from Am Tru Inc. The junior subordinated debentures are the sole assets of Am Tru Trust and are fully and unconditionally guaranteed by Horizon. The junior subordinated debentures and the trust preferred securities pay interest and dividends on a quarterly basis. The junior subordinated debentures and the securities bear interest at a rate of 90-day LIBOR plus 2.85% (3.85% at December 31, 2016) and mature in March 2034, and securities may be called at any quarterly interest payment date at par. The carrying value was $3.2 million, net of the remaining purchase discount, at December 31, 2016.
The Company assumed additional debentures as the result of the Heartland merger in July 2012. In December 2006, Heartland formed Heartland (IN) Statutory Trust II a wholly owned business trust ("Heartland Trust"), to sell $3.0 million in trust preferred securities. The proceeds from the sale of the trust preferred securities were used by the trust to purchase an equivalent amount of subordinated debentures from Heartland. The junior subordinated debentures are the sole assets of Heartland Trust and are fully and unconditionally guaranteed by Horizon. The junior subordinated debentures and the trust preferred securities pay interest and dividends on a quarterly basis. The junior subordinated debentures and the securities bear interest at a rate of 90-day LIBOR plus 1.67% (2.67% at December 31, 2016) and mature in December 2036, and securities may be called at any quarterly interest payment date at par. The carrying value was $1.7 million, net of the remaining purchase discount, at December 31, 2016.
The Company assumed additional debentures as the result of the LaPorte merger in July 2016. In October 2007, LaPorte assumed debentures as the result of its acquisition of City Savings Financial Corporation ("City Savings"). In June 2003, City Savings formed City Savings Statutory Trust I a wholly owned business trust ("City Savings Trust"), to sell $5.0 million in trust preferred securities. The proceeds from the sale of the trust preferred securities were used by the trust to purchase an equivalent amount of subordinated debentures from City Savings. The junior subordinated debentures are the sole assets of City Savings Trust and are fully and unconditionally guaranteed by Horizon. The junior subordinated debentures and the trust preferred securities pay interest and dividends on a quarterly basis. The junior subordinated debentures and the securities bear interest at a rate of 90-day LIBOR plus 3.10% (4.10% at December 31, 2016) and mature in June 2033, and securities may be called at any quarterly interest payment date at par. The carrying value was $4.3 million, net of the remaining purchase discount, at December 31, 2016.
The Trust Preferred Capital Securities, subject to certain limitations, are included in Tier 1 Capital for regulatory purposes. Dividends on the Trust Preferred Capital Securities are recorded as interest expense.
Note 16 – Employee Stock Ownership Plan
Effective January 1, 2007, Horizon converted its stock bonus plan to an employee stock ownership plan ("ESOP"). Prior to that date, Horizon maintained an employee stock bonus plan that covered substantially all employees. The stock bonus plan was noncontributory, and Horizon made matching contributions of amounts contributed by the employees to the Employee Thrift Plan and discretionary contributions. Prior to the establishment of the employee stock bonus plan, Horizon maintained an ESOP that was terminated in 1999. The prior ESOP accounts of active employees and the discretionary accounts of active employees remain in the new ESOP. The Matching contribution accounts under the stock bonus plan were transferred to the Employees Thrift Plan.
The ESOP exists for the benefit of substantially all employees. Contributions to the ESOP are by Horizon and are determined by the Board of Directors at its discretion. The contributions may be made in the form of cash or common stock. Shares are allocated among participants each December 31 on the basis of each participant's eligible compensation to total eligible compensation. Eligible compensation is limited to $265,000 for each participant. Dividends on shares held by the plan, at the discretion of each participant, may be distributed to an individual participant or left in the plan to purchase additional shares.
108
H ORIZON B ANCORP AND S UBSIDIARIES
Notes to Consolidated Financial Statements
(Table dollars in thousands except for per share data)
Total cash contributions and expense recorded for the ESOP was $550,000 in 2016, $450,000 in 2015 and $400,000 in 2014.
The ESOP, which is not leveraged, owns a total of 1,131,629 shares of Horizon's stock or 5.1% of the outstanding shares.
Note 17 – Employee Thrift and Defined Benefit Plan
The Employee Thrift Plan ("Plan") provides that all employees of Horizon with the requisite hours of service are eligible for the Plan. The Plan permits voluntary employee contributions and Horizon may make discretionary matching and profit sharing contributions. Each eligible employee is vested according to a schedule based upon years of service. Employee voluntary contributions are vested at all times. The Bank's expense related to the Plan totaled approximately $785,000 in 2016, $848,000 in 2015 and $633,000 in 2014.
The Plan owns a total of 501,923 shares of Horizon's stock or 2.3% of the outstanding shares.
The Company acquired a pension fund known as the Pentegra Defined Benefit Plan ("Pentegra Plan") in the Peoples acquisition. Prior to August 1, 2007, Peoples provided pension benefits for substantially all of its employees through its participation in the Pentegra Plan. Peoples chose to freeze the Pentegra Plan effective August 1, 2007. The trustees of the Financial Institutions Retirement Fund administer the Pentegra Plan, employer identification number 13-5645888 and plan number 333. This plan operates as a multi-employer plan for accounting purposes and as a multiple-employer plan under the Employee Retirement Income Security Act of 1974 and the Internal Revenue Code. There are no collective bargaining agreements in place that require contributions to the Pentegra Plan. The Pentegra Plan is a single plan under Internal Revenue Code 413(c) and, as a result, all of the assets stand behind all of the liabilities.
The risks of participating in these multiemployer plans are different from single-employer plans in the following aspects:
Assets contributed to the multiemployer plan by one employer may be used to provide benefits to employees of other participating employers.
If a participating employer stops contributing to the plan, the unfunded obligations of the plan may be borne by the remaining participating employers.
If the Company chooses to stop participating in the multiemployer plan, the Company may be required to pay the plan an amount based on the underfunded status of the plan, referred to as a withdrawal liability.
There was no expense to the Company in 2016 and 2015 for this Pentegra Plan. The Company intends on terminating this Pentegra Plan during the first quarter of 2017 and has recorded a $3.4 million withdrawal liability for the termination of the Pentegra Plan.
109
H ORIZON B ANCORP AND S UBSIDIARIES
Notes to Consolidated Financial Statements
(Table dollars in thousands except for per share data)
Note 18 – Income Tax
| December 31 | December 31 | December 31 | ||||||||||
| 2016 | 2015 | 2014 | ||||||||||
Income tax expense | ||||||||||||
Currently payable | ||||||||||||
Federal | $ | 7,467 | $ | 5,511 | $ | 4,561 | ||||||
Deferred | 1,334 | 1,721 | 1,594 | |||||||||
|
|
|
|
|
| |||||||
Total income tax expense | $ | 8,801 | $ | 7,232 | $ | 6,155 | ||||||
|
|
|
|
|
| |||||||
Reconciliation of federal statutory to actual tax expense | ||||||||||||
Federal statutory income tax at 35% | $ | 11,450 | $ | 9,724 | $ | 8,488 | ||||||
Tax exempt interest | (1,882 | ) | (1,708 | ) | (1,628 | ) | ||||||
Tax exempt income | (575 | ) | (488 | ) | (366 | ) | ||||||
Other tax exempt income | (608 | ) | (199 | ) | (309 | ) | ||||||
Nondeductible and other | 416 | (97 | ) | (30 | ) | |||||||
|
|
|
|
|
| |||||||
Actual tax expense | $ | 8,801 | $ | 7,232 | $ | 6,155 | ||||||
|
|
|
|
|
| |||||||
| December 31 | December 31 | |||||||
| 2016 | 2015 | |||||||
Assets | ||||||||
Allowance for loan losses | $ | 5,581 | $ | 5,329 | ||||
Net operating loss (from acquisitions) | 2,368 | 1,679 | ||||||
Director and employee benefits | 3,124 | 2,223 | ||||||
Unrealized loss on AFS securities and fair value hedge | 937 | 711 | ||||||
Accrued Pension | 1,323 | 1,725 | ||||||
Fair value adjustment on acquisitions | 2,340 | 756 | ||||||
Other | 1,593 | 273 | ||||||
|
|
|
| |||||
Total assets | 17,266 | 12,696 | ||||||
|
|
|
| |||||
Liabilities | ||||||||
Depreciation | (1,916 | ) | (2,180 | ) | ||||
State tax | (341 | ) | (192 | ) | ||||
Federal Home Loan Bank stock dividends | (474 | ) | (343 | ) | ||||
Difference in basis of intangible assets | (4,654 | ) | (2,938 | ) | ||||
FHLB Penalty | - | (123 | ) | |||||
Other | (431 | ) | (589 | ) | ||||
|
|
|
| |||||
Total liabilities | (7,816 | ) | (6,040 | ) | ||||
Valuation allowance | (2,018 | ) | (1,082 | ) | ||||
|
|
|
| |||||
Net deferred tax asset | $ | 7,432 | $ | 5,249 | ||||
|
|
|
| |||||
As of December 31, 2016, the Company had approximately $31.2 million of state tax loss carryforward available to offset future franchise taxable income. Also, at December 31, 2016, the Company had approximately $970,000 of Federal loss carryforward available to offset future federal income tax. The state loss carryforward begins to expire in 2024. The Federal loss carryforward begins to expire in 2032. Due to these losses being incurred by acquired institutions, prior to the acquisitions by Horizon, the annual losses which can be used are subject to an annual limitation. Management believes that the Company will be able to utilize the benefits recorded for both state and federal loss carryforwards within the allotted time periods, except for the amount represented by the valuation allowance. The valuation allowance has been recorded for the possible inability to use a portion of the state net operating loss carryover.
110
H ORIZON B ANCORP AND S UBSIDIARIES
Notes to Consolidated Financial Statements
(Table dollars in thousands except for per share data)
Retained earnings of the Bank include approximately $10.8 million for which no deferred income tax liability has been recognized. This amount represents an allocation of previously acquired institutions income to bad debt deductions as of December 31, 1987 for tax purposes only. Reductions of amounts so allocated for purposes other than tax bad debt losses including redemption of bank stock or excess dividends, or loss of "bank" status would create income for tax purposes only, which would be subject to the then-current corporate income tax rate. The unrecorded deferred income tax liability on the above amount for the Company was approximately $3.8 million at December 31, 2016.
The Company files income tax returns in the U.S. federal jurisdiction. With a few exceptions, the Company is no longer subject to U.S. federal, state and local or non-U.S. income tax examinations by tax authorities for years before 2013.
Note 19 – Accumulated Other Comprehensive Income (Loss)
The components of accumulated other comprehensive income (loss) included in capital are as follows:
| December 31 | December 31 | |||||||
| 2016 | 2015 | |||||||
Unrealized gain (loss) on securities available for sale | $ | (6,007 | ) | $ | 920 | |||
Unamortized gain on securities held to maturity, previously transferred from AFS | 456 | 1,109 | ||||||
Unrealized loss on derivative instruments | (3,132 | ) | (3,141 | ) | ||||
Tax effect | 3,039 | 389 | ||||||
|
|
|
| |||||
Total accumulated other comprehensive income (loss) | $ | (5,644 | ) | $ | (723 | ) | ||
|
|
|
| |||||
Note 20 – Commitments, Off-Balance Sheet Risk and Contingencies
Because of the nature of its activities, Horizon is subject to claims and lawsuits that arise primarily in the ordinary course of business. It is the opinion of management that the disposition or ultimate resolution of such claims and lawsuits will not have a material adverse effect on the consolidated financial position, results of operations and cash flows of the Company.
The Bank was required to have approximately $1.8 million of cash on hand or on deposit with the Federal Reserve Bank to meet regulatory reserve and clearing balance requirements at December 31, 2016. These balances are included in cash and cash equivalents and do not earn interest.
The Bank is a party to financial instruments with off-balance sheet risk in the ordinary course of business to meet financing needs of its customers. These financial instruments include commitments to make loans and standby letters of credit. The Bank's exposure to credit loss in the event of nonperformance by the other party to the financial instrument for commitments to make loans and standby letters of credit is represented by the contractual amount of those instruments. The Bank follows the same credit policy to make such commitments as is followed for those loans recorded in the financial statements.
At December 31, 2016 and 2015, commitments to make loans amounted to approximately $808.3 million and $468.8 million and commitments under outstanding standby letters of credit amounted to approximately $1.0 million and $3.6 million. Since many commitments to make loans and standby letters of credit expire without being used, the amount does not necessarily represent future cash advances. No losses are anticipated as a result of these transactions. Collateral obtained upon exercise of the commitment is determined using management's credit evaluation.
111
H ORIZON B ANCORP AND S UBSIDIARIES
Notes to Consolidated Financial Statements
(Table dollars in thousands except for per share data)
Note 21 – Regulatory Capital
Horizon and the Bank are subject to various regulatory capital requirements administered by the federal banking agencies and are assigned to a capital category. Failure to meet the minimum regulatory capital requirements can initiate certain mandatory and possible additional discretionary actions by regulators, which if undertaken, could have a direct material effect on the Company's financial statements. Under capital adequacy guidelines and the regulatory framework for prompt corrective actions, the Company and Bank must meet specific capital guidelines involving quantitative measures of the Bank's assets, liabilities, and certain off-balance-sheet items as calculated under regulatory accounting practices. The Company and Bank's capital amounts and classification are also subject to qualitative judgments by the regulators about components, risk weightings and other factors.
Quantitative measures established by regulation to ensure capital adequacy require the Company and the Bank to maintain minimum amounts and ratios of total and Tier I capital (as defined in the regulations) to risk-weighted assets (as defined), and of Tier I capital (as defined) to average assets (as defined), or leverage ratio. For December 31, 2016 and 2015, Basel III rules require the Company and Bank to maintain minimum amounts and ratios of common equity Tier I capital (as defined in the regulation) to risk-weighted assets (as defined). Additionally, under Basel III rules, the decision was made to opt-out of including accumulated other comprehensive income in regulatory capital.
To be categorized as well capitalized, the Company and Bank must maintain minimum Total risk-based, Tier I risk-based, common equity Tier I risk-based and Tier I leverage ratios as set forth in the table below. As of December 31, 2016 and December 31, 2015, the Company and Bank met all capital adequacy requirements to be considered well capitalized. There have been no conditions or events since the year ending December 31, 2016 that management believes have changed the Bank's classification as well capitalized. There is no threshold for well-capitalized status for bank holding companies.
Horizon and the Bank's actual and required capital ratios as of December 31, 2016 and 2015 were as follows:
| Actual | Required For Capital 1 Adequacy Purposes | Required For Capital 1 Adequacy Purposes with Capital Buffer | Well Capitalized Under Prompt 1 Corrective Action Provisions | |||||||||||||||||||||||||||||
| Amount | Ratio | Amount | Ratio | Amount | Ratio | Amount | Ratio | |||||||||||||||||||||||||
As of December 31, 2016 | ||||||||||||||||||||||||||||||||
Total capital 1 (to risk-weighted assets) | ||||||||||||||||||||||||||||||||
Consolidated | $ | 316,576 | 13.87 | % | $ | 182,596 | 8.00 | % | $ | 196,976 | 8.63 | % | N/A | N/A | ||||||||||||||||||
Bank | 319,013 | 13.98 | % | $ | 182,541 | 8.00 | % | 196,916 | 8.63 | % | $ | 228,176 | 10.00 | % | ||||||||||||||||||
Tier 1 capital 1 (to risk-weighted assets) | ||||||||||||||||||||||||||||||||
Consolidated | 301,739 | 13.22 | % | $ | 136,947 | 6.00 | % | 151,326 | 6.63 | % | N/A | N/A | ||||||||||||||||||||
Bank | 304,176 | 13.33 | % | $ | 136,905 | 6.00 | % | 151,280 | 6.63 | % | 182,540 | 8.00 | % | |||||||||||||||||||
Common equity tier 1 capital 1 (to risk-weighted assets) | ||||||||||||||||||||||||||||||||
Consolidated | 263,313 | 11.50 | % | $ | 103,036 | 4.50 | % | 117,460 | 5.13 | % | N/A | N/A | ||||||||||||||||||||
Bank | 304,176 | 13.33 | % | $ | 102,679 | 4.50 | % | 117,054 | 5.13 | % | 148,314 | 6.50 | % | |||||||||||||||||||
Tier 1 capital 1 (to average assets) | ||||||||||||||||||||||||||||||||
Consolidated | 301,739 | 10.44 | % | $ | 115,609 | 4.00 | % | 115,609 | 4.00 | % | N/A | N/A | ||||||||||||||||||||
Bank | 304,176 | 9.93 | % | $ | 122,521 | 4.00 | % | 122,521 | 4.00 | % | 153,151 | 5.00 | % | |||||||||||||||||||
As of December 31, 2015 | ||||||||||||||||||||||||||||||||
Total capital 1 (to risk-weighted assets) | ||||||||||||||||||||||||||||||||
Consolidated | $ | 264,452 | 13.99 | % | $ | 151,223 | 8.00 | % | N/A | N/A | N/A | N/A | ||||||||||||||||||||
Bank | 237,348 | 12.57 | % | 151,057 | 8.00 | % | N/A | N/A | $ | 188,821 | 10.00 | % | ||||||||||||||||||||
Tier 1 capital 1 (to risk-weighted assets) | ||||||||||||||||||||||||||||||||
Consolidated | 249,918 | 13.22 | % | 113,427 | 6.00 | % | N/A | N/A | N/A | N/A | ||||||||||||||||||||||
Bank | 222,814 | 11.80 | % | 113,295 | 6.00 | % | N/A | N/A | 151,060 | 8.00 | % | |||||||||||||||||||||
Common equity tier 1 capital 1 (to risk-weighted assets) | ||||||||||||||||||||||||||||||||
Consolidated | 204,350 | 10.81 | % | 85,067 | 4.50 | % | N/A | N/A | N/A | N/A | ||||||||||||||||||||||
Bank | 222,814 | 11.80 | % | 84,971 | 4.50 | % | N/A | N/A | 122,737 | 6.50 | % | |||||||||||||||||||||
Tier 1 capital 1 (to average assets) | ||||||||||||||||||||||||||||||||
Consolidated | 249,918 | 9.82 | % | 101,800 | 4.00 | % | N/A | N/A | N/A | N/A | ||||||||||||||||||||||
Bank | 222,814 | 8.77 | % | 101,626 | 4.00 | % | N/A | N/A | 127,032 | 5.00 | % | |||||||||||||||||||||
| 1 | As defined by regulatory agencies |
The above minimum capital requirements exclude the capital conservation buffer required to avoid limitations on capital distributions, including dividend payments and certain discretionary bonus payments to executive officers. The capital conservation buffer is being phased in from 0.0% for 2015 to 2.50% by 2019. The capital conservation buffer was 0.625% at December 31, 2016. The net unrealized gain or loss on available for sale securities is not included in computing regulatory capital.
112
H ORIZON B ANCORP AND S UBSIDIARIES
Notes to Consolidated Financial Statements
(Table dollars in thousands except for per share data)
Note 22 – Share-Based Compensation
On January 21, 2003, the Board of Directors adopted the Horizon Bancorp 2003 Omnibus Equity Incentive Plan ("2003 Plan"), which was approved by stockholders on May 8, 2003. Under the 2003 Plan, Horizon could issue up to 506,250 common shares, plus the number of shares that are tendered to or withheld by Horizon in connection with the exercise of options plus that number of shares that are purchased by Horizon with the cash proceeds received upon option exercises. The 2003 Plan limited the number of shares available to 506,250 for incentive stock options and to 253,125 for the grant of non-option awards. The shares available for issuance under the 2003 Plan could be divided among the various types of awards and among the participants as the Compensation Committee ("Committee") determines. The Committee was authorized to grant any type of award to a participant that was consistent with the provisions of the 2003 Plan. Awards could consist of incentive stock options, nonqualified stock options, stock appreciation rights, restricted stock, performance units, performance shares or any combination of these awards. The Committee determined the provisions, terms and conditions of each award. The restricted shares vest over a period of time established by the Committee at the time of each grant. Holders of restricted shares receive dividends and may vote the shares. The restricted shares are recorded at fair market value (on the date granted) as a separate component of stockholders' equity. The cost of these shares is being amortized against earnings using the straight-line method over the vesting period. The options shares granted under the 2003 plan vest at a rate designated per the individual agreements. The restricted shares granted under the 2003 Plan vest at the end of each grant's vesting period. On March 8, 2010, the Board of Directors adopted, and on May 6, 2010, the stockholders approved, an amendment to the 2003 Omnibus Equity Incentive Plan making an additional 590,625 common shares available for issuance. All share data has been adjusted for the 3:2 stock split on November 14, 2016.
A summary of option activity under the 2003 Plan as of December 31, 2016, and changes during the year then ended, is presented below:
| Shares | Weighted- Average Exercise Price | Weighted- Average Remaining Contractual Term | Aggregate Intrinsic Value | |||||||||||||
Outstanding, beginning of year | 66,000 | $ | 7.38 | |||||||||||||
Granted | - | - | ||||||||||||||
Exercised | (25,990 | ) | 7.47 | |||||||||||||
Forfeited | (3,375 | ) | 8.22 | |||||||||||||
|
| |||||||||||||||
Outstanding, end of year | 36,635 | 7.25 | 3.69 | $ | 760,345 | |||||||||||
|
| |||||||||||||||
Exercisable, end of year | 35,285 | 7.11 | 3.63 | 736,963 | ||||||||||||
On June 18, 2013, the Board of Directors adopted the Horizon Bancorp 2013 Omnibus Equity Incentive Plan ("2013 Plan"), which was approved by the Company's shareholders on May 8, 2014. Under the 2013 Plan, Horizon may issue up to 1,037,550 common shares, plus the number of shares that are tendered to or withheld by Horizon in connection with the exercise of options plus that number of shares that are purchased by Horizon with the cash proceeds received upon option exercises. The 2013 Plan limits the number of shares available to 150,000 for incentive stock options and to 600,000 for the grant of non-option awards. The shares available for issuance under the 2013 Plan may be divided among the various types of awards and among the participants as the Committee determines. The Committee is authorized to grant any type of award to a participant that is consistent with the provisions of the 2013 Plan. Awards may consist of incentive stock options, nonqualified stock options, stock appreciation rights, restricted stock, performance units, performance shares or any combination of these awards. The Committee determines the provisions, terms and conditions of each award.
The restricted shares can vest over a period of time established by the Committee at the time of each grant, but the restricted shares already granted under the 2013 Plan generally vest at the end of each grant's vesting period. Holders of restricted shares receive dividends and may vote the shares. The restricted shares are recorded at fair market value (on the date granted) as a separate component of stockholders' equity. The cost of these shares is being amortized against earnings using the straight-line method over the vesting period.
113
H ORIZON B ANCORP AND S UBSIDIARIES
Notes to Consolidated Financial Statements
(Table dollars in thousands except for per share data)
The performance shares that are awarded become earned and vested based on the achievement of certain performance goals during a performance period as established by the Committee at the time of each grant. The performance goals are based on a comparison of the Company's average performance over the performance period for the return on common equity, compounded annual growth rate of total assets, and return on average assets, all as relative to the average performance for publicly traded banks with total assets between $1 billion and $5 billion on the SNL Bank Index. Holders of performance share awards receive pass-through dividends but do not have any voting rights before the performance shares are earned and vested.
The options shares granted under the 2013 Plan vest at a rate designated per the individual agreements
The fair value of options granted is estimated on the date of the grant using an option-pricing model with the following weighted-average assumptions:
| December 31 | 2016 | 2015 | 2014 | |||||||||
Dividend yields | 2.34 | % | 2.35 | % | 2.01 | % | ||||||
Volatility factors of expected market price of common stock | 28.60 | % | 28.97 | % | 29.54 | % | ||||||
Risk-free interest rates | 1.83 | % | 2.10 | % | 2.66 | % | ||||||
Expected life of options | 8 years | 8 years | 8 years | |||||||||
A summary of option activity under the 2013 Plan as of December 31, 2016, and changes during the year then ended, is presented below:
| Shares | Weighted- Average Exercise Price | Weighted- Average Remaining Contractual Term | Aggregate Intrinsic Value | |||||||||||||
Outstanding, beginning of year | 181,627 | $ | 14.72 | |||||||||||||
Granted | 103,959 | 15.57 | ||||||||||||||
Exercised | (1,500 | ) | 13.49 | |||||||||||||
Forfeited | - | - | ||||||||||||||
Outstanding, end of year | 284,086 | 15.04 | 7.99 | $ | 3,682,975 | |||||||||||
|
| |||||||||||||||
Exercisable, end of year | 120,957 | 14.33 | 7.00 | 1,653,164 | ||||||||||||
|
| |||||||||||||||
The weighted average grant-date fair value of options granted during the years 2016, 2015 and 2014 was $3.89, $4.09 and $4.33.
114
H ORIZON B ANCORP AND S UBSIDIARIES
Notes to Consolidated Financial Statements
(Table dollars in thousands except for per share data)
A summary of the status of Horizon's non-vested restricted and performance shares as of December 31, 2016 is presented below:
| Shares | Weighted Average Grant Date Fair Value | |||||||
Non-vested beginning of year | 123,571 | $ | 12.13 | |||||
Vested | (72,563 | ) | 9.69 | |||||
Granted | 19,951 | 15.57 | ||||||
Forfeited | - | - | ||||||
|
| |||||||
Non-vested, end of year | 70,959 | 15.59 | ||||||
|
| |||||||
Grants vest at the end of three, four or five years of continuous employment.
Total compensation cost recognized in the income statement for option-based payment arrangements during 2016 was $324,000 and the related tax benefit recognized was approximately $113,000. Total compensation cost recognized in the income statement for option-based payment arrangements during 2015 and 2014 was $288,000 and $203,000 and the related tax benefit recognized was $101,000 and $71,000, respectively.
Total compensation cost recognized in the income statement for restricted share and performance share based payment arrangements during 2016, 2015 and 2014 was $284,000, $355,000, and $363,000. The recognized tax benefit related thereto was approximately $99,000, $124,000, and $127,000 for the years ended December 31, 2016, 2015 and 2014.
Cash received from option exercise under all share-based payment arrangements for the years ended December 31, 2016, 2015 and 2014 was $214,000, $403,000, and $122,000. The actual tax benefit realized for the tax deductions from option exercise of the share-based payment arrangements totaled $158,000, $151,000, and $43,000, for the years ended December 31, 2016, 2015 and 2014.
As of December 31, 2016, there was $888,000 of total unrecognized compensation cost related to all non-vested share-based compensation arrangements granted under all of the plans. That cost is expected to be recognized over a weighted-average period of 1.8 years.
Note 23 – Derivative Financial Instruments
Cash Flow Hedges
As a strategy to maintain acceptable levels of exposure to the risk of changes in future cash flow due to interest rate fluctuations, the Company entered into interest rate swap agreements for a portion of its floating rate debt. The agreements provide for the Company to receive interest from the counterparty at three month LIBOR and to pay interest to the counterparty at a weighted average fixed rate of 6.14% on a notional amount of $30.5 million at December 31, 2016 and $30.5 million at December 31, 2015. Under the agreements, the Company pays or receives the net interest amount monthly, with the monthly settlements included in interest expense.
The Company assumed additional interest rate swap agreements as the result of the LaPorte acquisition in July 2016. The agreements provide for the Company to receive interest from the counterparty at one month LIBOR and to pay interest to the counterparty at a weighted average fixed rate of 2.31% on a notional amount of $30.0 million at December 31, 2016. Under the agreements, the Company pays or receives the net interest amount monthly, with the monthly settlements included in interest expense.
115
H ORIZON B ANCORP AND S UBSIDIARIES
Notes to Consolidated Financial Statements
(Table dollars in thousands except for per share data)
Management has designated the interest rate swap agreements as cash flow hedging instruments. For derivative instruments that are designated and qualify as a cash flow hedge, the effective portion of the gain or loss on the derivative is reported as a component of other comprehensive income and reclassified into earnings in the same period or periods during which the hedged transaction affects earnings. Gains and losses on the derivative representing either hedge ineffectiveness or hedge components excluded from the assessment of effectiveness are recognized in current earnings. At December 31, 2016, the Company's cash flow hedge was effective and is not expected to have a significant impact on the Company's net income over the next 12 months.
Fair Value Hedges
Fair value hedges are intended to reduce the interest rate risk associated with the underlying hedged item. The Company enters into fixed rate loan agreements as part of its lending policy. To mitigate the risk of changes in fair value based on fluctuations in interest rates, the Company has entered into interest rate swap agreements on individual loans, converting the fixed rate loans to a variable rate. For derivative instruments that are designated and qualify as a fair value hedge, the gain or loss on the derivative as well as the offsetting gain or loss on the hedged item attributable to the hedged risk are recognized in current earnings. At December 31, 2016, the Company's fair value hedges were effective and are not expected to have a significant impact on the Company's net income over the next 12 months.
The change in fair value of both the hedge instruments and the underlying loan agreements are recorded as gains or losses in interest income. The fair value hedges are considered to be highly effective and any hedge ineffectiveness was deemed not material. The notional amounts of the loan agreements being hedged were $122.4 million at December 31, 2016 and $117.3 million at December 31, 2015.
Other Derivative Instruments
The Company enters into non-hedging derivatives in the form of mortgage loan forward sale commitments with investors and commitments to originate mortgage loans as part of its mortgage banking business. At December 31, 2016, the Company's fair values of these derivatives were recorded and over the next 12 months are not expected to have a significant impact on the Company's net income.
The change in fair value of both the forward sale commitments and commitments to originate mortgage loans were recorded and the net gains or losses included in the Company's gain on sale of loans.
116
H ORIZON B ANCORP AND S UBSIDIARIES
Notes to Consolidated Financial Statements
(Table dollars in thousands except for per share data)
The following tables summarize the fair value of derivative financial instruments utilized by Horizon:
| Asset Derivatives December 31, 2016 | Liability Derivatives December 31, 2016 | |||||||||||||||
| Derivatives designated as hedging instruments (Unaudited) | Balance Sheet Location | Fair Value | Balance Sheet Location | Fair Value | ||||||||||||
Interest rate contracts | Loans | $ | - | Other liabilities | $ | 6 | ||||||||||
Interest rate contracts | Other Assets | 6 | Other liabilities | 3,132 | ||||||||||||
|
|
|
| |||||||||||||
Total derivatives designated as hedging instruments | 6 | 3,138 | ||||||||||||||
|
|
|
| |||||||||||||
Derivatives not designated as hedging instruments | ||||||||||||||||
Mortgage loan contracts | Other assets | 602 | Other liabilities | 22 | ||||||||||||
|
|
|
| |||||||||||||
Total derivatives not designated as hedging instruments | 602 | 22 | ||||||||||||||
|
|
|
| |||||||||||||
Total derivatives | $ | 608 | $ | 3,160 | ||||||||||||
|
|
|
| |||||||||||||
| Asset Derivatives December 31, 2015 | Liability Derivatives December 31, 2015 | |||||||||||||||
| Derivatives designated as hedging instruments (Unaudited) | Balance Sheet Location | Fair Value | Balance Sheet Location | Fair Value | ||||||||||||
Interest rate contracts | Loans | $ | - | Other liabilities | $ | 1,782 | ||||||||||
Interest rate contracts | Other Assets | 1,782 | Other liabilities | 3,141 | ||||||||||||
|
|
|
| |||||||||||||
Total derivatives designated as hedging instruments | 1,782 | 4,923 | ||||||||||||||
|
|
|
| |||||||||||||
Derivatives not designated as hedging instruments | ||||||||||||||||
Mortgage loan contracts | Other assets | 642 | Other liabilities | - | ||||||||||||
|
|
|
| |||||||||||||
Total derivatives not designated as hedging instruments | 642 | - | ||||||||||||||
|
|
|
| |||||||||||||
Total derivatives | $ | 2,424 | $ | 4,923 | ||||||||||||
|
|
|
| |||||||||||||
The effect of the derivative instruments on the consolidated statement of income for the 12-month periods ended is as follows:
| Amount of Loss Recognized in Other Comprehensive Income on Derivative (Effective Portion) | ||||||||||||
| Years Ended December 31 | ||||||||||||
Derivative in cash flow hedging relationship | 2016 | 2015 | 2014 | |||||||||
Interest rate contracts | $ | 6 | $ | 127 | $ | (332 | ) | |||||
FASB Accounting Standards Codification ("ASC") Topic 820-10-20 defines fair value as the price that would be received to sell an asset or paid to transfer a liability in an orderly transaction between market participants at the measurement date. Topic 820-10-55 establishes a fair value hierarchy that emphasizes the use of observable inputs and minimizes the use of unobservable inputs when measuring fair value.
117
H ORIZON B ANCORP AND S UBSIDIARIES
Notes to Consolidated Financial Statements
(Table dollars in thousands except for per share data)
Derivative in fair value hedging relationship | Location of gain (loss) recognized on derivative | Amount of Gain (Loss) Recognized on Derivative | ||||||||||||
| Years Ended December 31 | ||||||||||||||
| 2016 | 2015 | 2014 | ||||||||||||
Interest rate contracts | Interest income - loans | $ | (1,776 | ) | $ | 574 | $ | 1,261 | ||||||
Interest rate contracts | Interest income - loans | 1,776 | (574 | ) | (1,261 | ) | ||||||||
|
|
|
|
|
| |||||||||
Total | $ | - | $ | - | $ | - | ||||||||
|
|
|
|
|
| |||||||||
Derivative not designated as hedging relationship | Location of gain (loss) recognized on derivative | Amount of Gain (Loss) Recognized on Derivative Years Ended December 31 | ||||||||||||
| 2016 | 2015 | 2014 | ||||||||||||
Mortgage contracts | Other income - gain on sale of loans | $ | (62 | ) | $ | 195 | $ | 256 | ||||||
Note 24 – Disclosures about fair value of assets and liabilities
The Fair Value Measurements topic of the FASB ASC defines fair value, establishes a framework for measuring fair value and expands disclosures about fair value measurements. There are three levels of inputs that may be used to measure fair value:
| Level 1 | Quoted prices in active markets for identical assets or liabilities | |
| Level 2 | Observable inputs other than Level 1 prices, such as quoted prices for similar assets or liabilities; quoted prices in markets that are not active; or other inputs that are observable or can be corroborated by observable market data for substantially the full term of the assets or liabilities | |
| Level 3 | Unobservable inputs that are supported by little or no market activity and that are significant to the fair value of the assets or liabilities | |
Following is a description of the valuation methodologies used for instruments measured at fair value on a recurring basis and recognized in the accompanying consolidated financial statements, as well as the general classification of such instruments pursuant to the valuation hierarchy. There have been no significant changes in the valuation techniques during the period ended December 31, 2016. For assets classified within Level 3 of the fair value hierarchy, the process used to develop the reported fair value is described below.
Available for sale securities
When quoted market prices are available in an active market, securities are classified within Level 1 of the valuation hierarchy. If quoted market prices are not available, then fair values are estimated by using pricing models, quoted prices of securities with similar characteristics or discounted cash flows. Level 2 securities include U.S. Treasury and federal agency securities, state and municipal securities, federal agency mortgage obligations and mortgage-backed pools, private-label mortgage-backed pools and corporate notes. Level 2 securities are valued by a third party pricing service commonly used in the banking industry utilizing observable inputs. Observable inputs include dealer quotes, market spreads, cash flow analysis, the U.S. Treasury yield curve, trade execution data, market consensus prepayment spreads and available credit information and the bond's terms and conditions. The pricing provider utilizes evaluated pricing models that vary based on asset class. These models incorporate available market information including quoted prices of securities with similar characteristics and, because many fixed-income securities do not trade on a daily basis, apply available information through processes such as benchmark curves, benchmarking of like securities, sector grouping, and matrix pricing. In addition, model processes, such as an option adjusted spread model is used to develop prepayment and interest rate scenarios for securities with prepayment features.
118
H ORIZON B ANCORP AND S UBSIDIARIES
Notes to Consolidated Financial Statements
(Table dollars in thousands except for per share data)
Hedged loans
Certain fixed rate loans have been converted to variable rate loans by entering into interest rate swap agreements. The fair value of those fixed rate loans is based on discounting the estimated cash flows using interest rates determined by the respective interest rate swap agreement. Loans are classified within Level 2 of the valuation hierarchy based on the unobservable inputs used.
Interest rate swap agreements
The fair value of the Company's interest rate swap agreements is estimated by a third party using inputs that are primarily unobservable including a yield curve, adjusted for liquidity and credit risk, contracted terms and discounted cash flow analysis, and therefore, are classified within Level 2 of the valuation hierarchy.
The following table presents the fair value measurements of assets and liabilities recognized in the accompanying financial statements measured at fair value on a recurring basis and the level within the FASB ASC fair value hierarchy in which the fair value measurements fall at the following:
| Fair Value | Quoted Prices in Active Markets for Identical Assets (Level 1) | Significant Other Observable Inputs (Level 2) | Significant Unobservable Inputs (Level 3) | |||||||||||||
December 31, 2016 | ||||||||||||||||
Available-for-sale securities | ||||||||||||||||
U.S. Treasury and federal agencies | $ | 7,989 | $ | - | $ | 7,989 | $ | - | ||||||||
State and municipal | 116,592 | - | 116,592 | - | ||||||||||||
Federal agency collateralized mortgage obligations | 137,195 | - | 137,195 | - | ||||||||||||
Federal agency mortgage-backed pools | 176,726 | - | 176,726 | - | ||||||||||||
Corporate notes | 1,329 | - | 1,329 | - | ||||||||||||
|
|
|
|
|
|
|
| |||||||||
Total available-for-sale securities | 439,831 | - | 439,831 | - | ||||||||||||
Hedged loans | 122,345 | - | 122,345 | - | ||||||||||||
Forward sale commitments | 602 | - | 602 | - | ||||||||||||
Interest rate swap agreements | (3,138 | ) | - | (3,138 | ) | - | ||||||||||
Commitments to originate loans | (22 | ) | - | (22 | ) | - | ||||||||||
December 31, 2015 | ||||||||||||||||
Available-for-sale securities | ||||||||||||||||
U.S. Treasury and federal agencies | $ | 5,926 | $ | - | $ | 5,926 | $ | - | ||||||||
State and municipal | 75,095 | - | 75,095 | - | ||||||||||||
Federal agency collateralized mortgage obligations | 156,203 | - | 156,203 | - | ||||||||||||
Federal agency mortgage-backed pools | 207,704 | - | 207,704 | - | ||||||||||||
Corporate notes | 54 | - | 54 | - | ||||||||||||
|
|
|
|
|
|
|
| |||||||||
Total available-for-sale securities | 444,982 | - | 444,982 | - | ||||||||||||
Hedged loans | 115,472 | - | 115,472 | - | ||||||||||||
Forward sale commitments | 642 | - | 642 | - | ||||||||||||
Interest rate swap agreements | (4,923 | ) | - | (4,923 | ) | - | ||||||||||
119
H ORIZON B ANCORP AND S UBSIDIARIES
Notes to Consolidated Financial Statements
(Table dollars in thousands except for per share data)
Realized gains and losses included in net income for the periods are reported in the consolidated statements of income as follows:
| Non Interest Income Total gains and losses from: | Years Ended December 31 | |||||||||||
| 2016 | 2015 | 2014 | ||||||||||
Hedged loans | $ | (1,776 | ) | $ | 574 | $ | 1,261 | |||||
Fair value interest rate swap agreements | 1,776 | (574 | ) | (1,261 | ) | |||||||
Derivative loan commitments | (62 | ) | 195 | 256 | ||||||||
|
|
|
|
|
| |||||||
| $ | (62 | ) | $ | 195 | $ | 256 | ||||||
|
|
|
|
|
| |||||||
Certain other assets are measured at fair value on a nonrecurring basis in the ordinary course of business and are subject to fair value adjustments in certain circumstances (for example, when there is evidence of impairment):
| Fair Value | Quoted Prices in Active Markets for Identical Assets (Level 1) | Significant Other Observable Inputs (Level 2) | Significant Unobservable Inputs (Level 3) | |||||||||||||
December 31, 2016 | ||||||||||||||||
Impaired loans | $ | 2,246 | $ | - | $ | - | $ | 2,246 | ||||||||
Mortgage servicing rights | 11,174 | - | - | 11,174 | ||||||||||||
December 31, 2015 | ||||||||||||||||
Impaired loans | $ | 6,803 | $ | - | $ | - | $ | 6,803 | ||||||||
Mortgage servicing rights | 8,874 | - | - | 8,874 | ||||||||||||
Impaired (collateral dependent): Loans for which it is probable that the Company will not collect all principal and interest due according to contractual terms are measured for impairment. Allowable methods for determining the amount of impairment include estimating fair value using the fair value of the collateral for collateral-dependent loans.
If the impaired loan is identified as collateral dependent, then the fair value method of measuring the amount of impairment is utilized. This method requires obtaining a current independent appraisal of the collateral and applying a discount factor to the value.
Impaired loans that are collateral dependent are classified within Level 3 of the fair value hierarchy when impairment is determined using the fair value method.
Mortgage Servicing Rights (MSRs): MSRs do not trade in an active market with readily observable prices. Accordingly, the fair value of these assets is classified as Level 3. The Company determines the fair value of MSRs using an income approach model based upon the Company's month-end interest rate curve and prepayment assumptions. The model utilizes assumptions to estimate future net servicing income cash flows, including estimates of time decay, payoffs and changes in valuation inputs and assumptions. The Company reviews the valuation assumptions against this market data for reasonableness and adjusts the assumptions if deemed appropriate. The carrying amount of the MSRs were reduced by $507,000 in 2016 and $397,000 in 2015 for the fair value.
120
H ORIZON B ANCORP AND S UBSIDIARIES
Notes to Consolidated Financial Statements
(Table dollars in thousands except for per share data)
The following table presents qualitative information about unobservable inputs used in recurring and nonrecurring Level 3 fair value measurements, other than goodwill, at December 31, 2016 and 2015.
| Fair Value at December 31, 2016 | Valuation Technique | Unobservable Inputs | Range (Weighted Average) | |||||||
Impaired loans | $ | 2,246 | Collateral based measurement | Discount to reflect current market conditions and ultimate collectability | 10% - 16% (13%) | |||||
Mortgage servicing rights | $ | 11,174 | Discounted cashflows | Discount rate, Constant prepayment rate, Probability of default | 10% - 16% (13%), 4% - 7% (4.6%), 1% - 10% (4.5%) | |||||
| Fair Value at December 31, 2015 | Valuation Technique | Unobservable Inputs | Range (Weighted Average) | |||||||
Impaired loans | $ | 6,803 | Collateral based measurement | Discount to reflect current market conditions and ultimate collectability | 10% - 15% (12%) | |||||
Mortgage servicing rights | $ | 8,874 | Discounted cashflows | Discount rate, Constant prepayment rate, Probability of default | 10% - 15% (12%), 4% - 7% (4.6%), 1% - 10% (4.5%) | |||||
Note 25 – Fair Value of Financial Instruments
The estimated fair value amounts of the Company's financial instruments were determined using available market information, current pricing information applicable to Horizon and various valuation methodologies. Where market quotations were not available, considerable management judgment was involved in the determination of estimated fair values. Therefore, the estimated fair value of financial instruments shown below may not be representative of the amounts at which they could be exchanged in a current or future transaction. Due to the inherent uncertainties of expected cash flows of financial instruments, the use of alternate valuation assumptions and methods could have a significant effect on the estimated fair value amounts.
The estimated fair values of financial instruments, as shown below, are not intended to reflect the estimated liquidation or market value of Horizon taken as a whole. The disclosed fair value estimates are limited to Horizon's significant financial instruments at December 31, 2016 and December 31, 2015. These include financial instruments recognized as assets and liabilities on the consolidated balance sheet as well as certain off-balance sheet financial instruments. The estimated fair values shown below do not include any valuation of assets and liabilities which are not financial instruments as defined by the FASB ASC fair value hierarchy.
The following methods and assumptions were used to estimate the fair value of each class of financial instrument:
Cash and Due from Banks - The carrying amounts approximate fair value.
Held-to-Maturity Securities - For debt securities held to maturity, fair values are based on quoted market prices or dealer quotes. For those securities where a quoted market price is not available, carrying amount is a reasonable estimate of fair value based upon comparison with similar securities.
Loans Held for Sale - The carrying amounts approximate fair value.
121
H ORIZON B ANCORP AND S UBSIDIARIES
Notes to Consolidated Financial Statements
(Table dollars in thousands except for per share data)
Net Loans - The fair value of portfolio loans is estimated by discounting the future cash flows using the current rates at which similar loans would be made to borrowers with similar credit ratings and for the same remaining maturities. The carrying amounts of loans held for sale approximate fair value.
FHLB and FRB Stock - Fair value of FHLB and FRB stock is based on the price at which it may be resold to the FHLB and FRB.
Interest Receivable/Payable - The carrying amounts approximate fair value.
Deposits - The fair value of demand deposits, savings accounts, interest-bearing checking accounts and money market deposits is the amount payable on demand at the reporting date. The fair value of fixed maturity certificates of deposit is estimated by discounting the future cash flows using rates currently offered for deposits of similar remaining maturity.
Borrowings - Rates currently available to Horizon for debt with similar terms and remaining maturities are used to estimate fair values of existing borrowings.
Subordinated Debentures - Rates currently available for debentures with similar terms and remaining maturities are used to estimate fair values of existing debentures.
Commitments to Extend Credit and Standby Letters of Credit - The fair value of commitments is estimated using the fees currently charged to enter into similar agreements, taking into account the remaining terms of the agreements and the present creditworthiness of the counterparties. For fixed-rate loan commitments, fair value also considers the difference between current levels of interest rates and the committed rates. The fair value of letters of credit is based on fees currently charged for similar agreements or on the estimated cost to terminate them or otherwise settle the obligations with the counterparties at the reporting date. Due to the short-term nature of these agreements, carrying amounts approximate fair value.
The following table presents estimated fair values of the Company's financial instruments and the level within the fair value hierarchy in which the fair value measurements fall.
| December 31, 2016 | ||||||||||||||||
| Quoted Prices | ||||||||||||||||
| in Active | Significant | |||||||||||||||
| Markets for | Other | Significant | ||||||||||||||
| Identical | Observable | Unobservable | ||||||||||||||
| Carrying | Assets | Inputs | Inputs | |||||||||||||
| Amount | (Level 1) | (Level 2) | (Level 3) | |||||||||||||
Assets | ||||||||||||||||
Cash and due from banks | $ | 70,832 | $ | 70,832 | $ | - | $ | - | ||||||||
Investment securities, held to maturity | 193,194 | - | 194,086 | - | ||||||||||||
Loans held for sale | 8,087 | - | - | 8,087 | ||||||||||||
Loans excluding loan level hedges, net | 1,998,804 | - | - | 1,965,928 | ||||||||||||
Stock in FHLB and FRB | 23,932 | - | 23,932 | - | ||||||||||||
Interest receivable | 12,713 | - | 12,713 | - | ||||||||||||
Liabilities | ||||||||||||||||
Non-interest bearing deposits | $ | 496,248 | $ | 496,248 | $ | - | $ | - | ||||||||
Interest-bearing deposits | 1,974,962 | - | 1,839,167 | - | ||||||||||||
Borrowings | 267,489 | - | 261,141 | - | ||||||||||||
Subordinated debentures | 37,456 | - | 36,371 | - | ||||||||||||
Interest payable | 472 | - | 472 | - | ||||||||||||
122
H ORIZON B ANCORP AND S UBSIDIARIES
Notes to Consolidated Financial Statements
(Table dollars in thousands except for per share data)
| December 31, 2015 | ||||||||||||||||
| Quoted Prices | ||||||||||||||||
| in Active | Significant | |||||||||||||||
| Markets for | Other | Significant | ||||||||||||||
| Identical | Observable | Unobservable | ||||||||||||||
| Carrying | Assets | Inputs | Inputs | |||||||||||||
| Amount | (Level 1) | (Level 2) | (Level 3) | |||||||||||||
Assets | ||||||||||||||||
Cash and due from banks | $ | 48,650 | $ | 48,650 | $ | - | $ | - | ||||||||
Investment securities, held to maturity | 187,629 | - | 193,703 | - | ||||||||||||
Loans held for sale | 7,917 | - | - | 7,917 | ||||||||||||
Loans excluding loan level hedges, net | 1,619,125 | - | - | 1,703,506 | ||||||||||||
Stock in FHLB and FRB | 13,823 | - | 13,823 | - | ||||||||||||
Interest receivable | 10,535 | - | 10,535 | - | ||||||||||||
Liabilities | ||||||||||||||||
Non-interest bearing deposits | $ | 335,955 | $ | 335,955 | $ | - | $ | - | ||||||||
Interest-bearing deposits | 1,544,198 | - | 1,461,314 | - | ||||||||||||
Borrowings | 449,347 | - | 441,547 | - | ||||||||||||
Subordinated debentures | 32,797 | - | 32,996 | - | ||||||||||||
Interest payable | 507 | - | 507 | - | ||||||||||||
Note 26 – General Litigation
The Company is subject to claims and lawsuits that arise primarily in the ordinary course of business. It is the opinion of management that the disposition or ultimate resolution of such claims and lawsuits will not have a material adverse effect on the consolidated financial position, results or operation and cash flows of the Company.
Note 27 – Condensed Financial Information (Parent Company Only)
Presented below is condensed financial information as to financial position, results of operations and cash flows of Horizon Bancorp:
Condensed Balance Sheets
| December 31 | December 31 | |||||||
| 2016 | 2015 | |||||||
Assets | ||||||||
Total cash and cash equivalents | $ | 15,736 | $ | 26,507 | ||||
Investment in Bank | 386,389 | 276,718 | ||||||
Other assets | 2,504 | 3,392 | ||||||
|
|
|
| |||||
Total assets | $ | 404,629 | $ | 306,617 | ||||
|
|
|
| |||||
Liabilities | ||||||||
Borrowings | $ | 19,500 | $ | - | ||||
Subordinated debentures | 37,456 | 32,797 | ||||||
Other liabilities | 6,818 | 6,988 | ||||||
Stockholders' Equity | 340,855 | 266,832 | ||||||
|
|
|
| |||||
Total liabilities and stockholders' equity | $ | 404,629 | $ | 306,617 | ||||
|
|
|
| |||||
123
H ORIZON B ANCORP AND S UBSIDIARIES
Notes to Consolidated Financial Statements
(Table dollars in thousands except for per share data)
Condensed Statements of Income
| Years Ended December 31 | ||||||||||||
| 2016 | 2015 | 2014 | ||||||||||
Operating Income (Expense) | ||||||||||||
Dividend income from Bank | $ | 20,000 | $ | 30,470 | $ | 12,500 | ||||||
Investment income | 33 | 15 | 12 | |||||||||
Other income | 42 | 24 | 17 | |||||||||
Interest expense | (2,376 | ) | (2,009 | ) | (2,009 | ) | ||||||
Employee benefit expense | (1,158 | ) | (1,093 | ) | (965 | ) | ||||||
Other expense | 1,279 | 910 | 883 | |||||||||
|
|
|
|
|
| |||||||
Income Before Undistributed Income of Subsidiaries | 17,820 | 28,317 | 10,438 | |||||||||
Undistributed Income of Subsidiaries | 5,938 | (8,168 | ) | 6,814 | ||||||||
|
|
|
|
|
| |||||||
Income Before Tax | 23,758 | 20,149 | 17,252 | |||||||||
Income Tax Benefit | 154 | 400 | 849 | |||||||||
|
|
|
|
|
| |||||||
Net Income | 23,912 | 20,549 | 18,101 | |||||||||
Preferred stock dividend | (42 | ) | (125 | ) | (133 | ) | ||||||
|
|
|
|
|
| |||||||
Net Income Available to Common Shareholders | $ | 23,870 | $ | 20,424 | $ | 17,968 | ||||||
|
|
|
|
|
| |||||||
Condensed Statements of Comprehensive Income
| Years Ended December 31 | ||||||||||||
| 2016 | 2015 | 2014 | ||||||||||
Net Income | $ | 23,912 | $ | 20,549 | $ | 18,101 | ||||||
|
|
|
|
|
| |||||||
Other Comprehensive Income (Loss) | ||||||||||||
Change in fair value of derivative instruments, net of taxes | 6 | 127 | (332 | ) | ||||||||
Unrealized appreciation for the period on held-to-maturity securities, net of taxes | (424 | ) | (357 | ) | 1,078 | |||||||
Unrealized appreciation (depreciation) on available-for-sale securities, net of taxes | (3,310 | ) | (1,891 | ) | 3,146 | |||||||
Less: reclassification adjustment for realized gains included in net income, net of taxes | (1,193 | ) | (123 | ) | (642 | ) | ||||||
|
|
|
|
|
| |||||||
| (4,921 | ) | (2,244 | ) | 3,250 | ||||||||
|
|
|
|
|
| |||||||
Comprehensive Income | $ | 18,991 | $ | 18,305 | $ | 21,351 | ||||||
|
|
|
|
|
| |||||||
124
H ORIZON B ANCORP AND S UBSIDIARIES
Notes to Consolidated Financial Statements
(Table dollars in thousands except for per share data)
Condensed Statements of Cash Flows
| Years Ended December 31 | ||||||||||||
| 2016 | 2015 | 2014 | ||||||||||
Operating Activities | ||||||||||||
Net income | $ | 23,912 | $ | 20,549 | $ | 18,101 | ||||||
Items not requiring (providing) cash | ||||||||||||
Equity in undistributed net income of subsidiaries | (5,938 | ) | 8,168 | (6,814 | ) | |||||||
Change in | ||||||||||||
Share based compensation | 284 | 288 | 203 | |||||||||
Amortization of unearned compensation | 324 | 355 | 363 | |||||||||
Other assets | 888 | (634 | ) | 906 | ||||||||
Other liabilities | (244 | ) | (13 | ) | 1,377 | |||||||
|
|
|
|
|
| |||||||
Net cash provided by operating activities | 19,226 | 28,713 | 14,136 | |||||||||
|
|
|
|
|
| |||||||
Investing Activities | ||||||||||||
Acquisition of Summit | - | - | (7,036 | ) | ||||||||
Acquisition of Peoples | - | (19,365 | ) | - | ||||||||
Acquisition of Kosciusko | (6,741 | ) | - | - | ||||||||
Acquisition of LaPorte | (17,108 | ) | - | - | ||||||||
Acquisition of CNB | (5,296 | ) | - | - | ||||||||
|
|
|
|
|
| |||||||
Net cash used in investing activities | (29,145 | ) | (19,365 | ) | (7,036 | ) | ||||||
|
|
|
|
|
| |||||||
Financing Activities | ||||||||||||
Redemption of preferred stock | (12,500 | ) | - | - | ||||||||
Net change in borrowings | 19,500 | - | - | |||||||||
Dividends paid on preferred shares | (42 | ) | (125 | ) | (133 | ) | ||||||
Dividends paid on common shares | (8,382 | ) | (6,216 | ) | (4,744 | ) | ||||||
Exercise of stock options | 572 | 4,305 | 165 | |||||||||
|
|
|
|
|
| |||||||
Net cash used in financing activities | (852 | ) | (2,036 | ) | (4,712 | ) | ||||||
|
|
|
|
|
| |||||||
Net Change in Cash and Cash Equivalents | (10,771 | ) | 7,312 | 2,388 | ||||||||
Cash and Cash Equivalents at Beginning of Year | 26,507 | 19,195 | 16,807 | |||||||||
|
|
|
|
|
| |||||||
Cash and Cash Equivalents at End of Year | $ | 15,736 | $ | 26,507 | $ | 19,195 | ||||||
|
|
|
|
|
| |||||||
125
H ORIZON B ANCORP AND S UBSIDIARIES
Notes to Consolidated Financial Statements
(Table dollars in thousands except for per share data)
Note 28 – Quarterly Results of Operations (Unaudited)
The following is a summary of the quarterly consolidated results of operations:
Three Months Ended 2016 | March 31 | June 30 | September 30 | December 31 | ||||||||||||
Interest income | $ | 23,528 | $ | 24,650 | $ | 28,962 | $ | 29,390 | ||||||||
Interest expense | 3,754 | 3,781 | 4,552 | 8,450 | ||||||||||||
|
|
|
|
|
|
|
| |||||||||
Net interest income | 19,774 | 20,869 | 24,410 | 20,940 | ||||||||||||
Provision for loan losses | 532 | 232 | 455 | 623 | ||||||||||||
Gain on sale of securities | 108 | 767 | - | 961 | ||||||||||||
Net income | 5,381 | 6,326 | 6,602 | 5,603 | ||||||||||||
Net income available to common shareholders | $ | 5,339 | $ | 6,326 | $ | 6,602 | $ | 5,603 | ||||||||
Earnings per share: | ||||||||||||||||
Basic | $ | 0.30 | $ | 0.35 | $ | 0.31 | $ | 0.25 | ||||||||
Diluted | 0.30 | 0.34 | 0.30 | 0.25 | ||||||||||||
Average shares outstanding: | ||||||||||||||||
Basic | 17,924,124 | 18,268,880 | 21,538,752 | 22,155,549 | ||||||||||||
Diluted | 18,012,726 | 18,364,167 | 21,651,953 | 22,283,722 | ||||||||||||
Three Months Ended 2015 | March 31 | June 30 | September 30 | December 31 | ||||||||||||
Interest income | $ | 20,093 | $ | 21,127 | $ | 23,578 | $ | 23,790 | ||||||||
Interest expense | 3,207 | 3,277 | 3,802 | 3,568 | ||||||||||||
|
|
|
|
|
|
|
| |||||||||
Net interest income | 16,886 | 17,850 | 19,776 | 20,222 | ||||||||||||
Provision for loan losses | 614 | 1,906 | 300 | 342 | ||||||||||||
Gain on sale of securities | 124 | - | - | 65 | ||||||||||||
Net income | 5,358 | 4,728 | 4,288 | 6,175 | ||||||||||||
Net income available to common shareholders | $ | 5,327 | $ | 4,697 | $ | 4,257 | $ | 6,144 | ||||||||
Earnings per share: | ||||||||||||||||
Basic | $ | 0.39 | $ | 0.34 | $ | 0.25 | $ | 0.34 | ||||||||
Diluted | 0.37 | 0.33 | 0.24 | 0.34 | ||||||||||||
Average shares outstanding: | ||||||||||||||||
Basic | 13,824,017 | 13,860,008 | 17,408,964 | 17,905,871 | ||||||||||||
Diluted | 14,414,259 | 14,456,379 | 17,839,881 | 18,020,615 | ||||||||||||
126

Report of Independent Registered Public Accounting Firm
Audit Committee, Board of Directors and Stockholders
Horizon Bancorp
Michigan City, Indiana
We have audited the accompanying consolidated balance sheets of Horizon Bancorp as of December 31, 2016 and 2015, and the related consolidated statements of income, comprehensive income, stockholders' equity and cash flows for each of the years in the three-year period ended December 31, 2016. The Company's management is responsible for these financial statements. Our responsibility is to express an opinion on these financial statements based on our audits.
We conducted our audits in accordance with the standards of the Public Company Accounting Oversight Board (United States). Those standards require that we plan and perform the audits to obtain reasonable assurance about whether the financial statements are free of material misstatement. Our audits included examining, on a test basis, evidence supporting the amounts and disclosures in the financial statements, assessing the accounting principles used and significant estimates made by management and evaluating the overall financial statement presentation. We believe that our audits provide a reasonable basis for our opinion.
In our opinion, the consolidated financial statements referred to above present fairly, in all material respects, the financial position of Horizon Bancorp as of December 31, 2016 and 2015, and the results of its operations and its cash flows for each of the years in the three-year period ended December 31, 2016 in conformity with accounting principles generally accepted in the United States of America.
We also have audited, in accordance with the standards of the Public Company Accounting Oversight Board (United States), Horizon Bancorp's internal control over financial reporting as of December 31, 2016, based on criteria established in Internal Control-Integrated Framework (2013) issued by the Committee of Sponsoring Organizations of the Treadway Commission (COSO) and our report dated February 28, 2017 expressed an unqualified opinion on the effectiveness of the Company's internal control over financial reporting.

Indianapolis, Indiana
February 28, 2017

127

Report of Independent Registered Public Accounting Firm
Audit Committee, Board of Directors and Stockholders
Horizon Bancorp
Michigan City, Indiana
We have audited Horizon Bancorp's internal control over financial reporting as of December 31, 2016, based on criteria established in Internal Control - Integrated Framework (2013) issued by the Committee of Sponsoring Organizations of the Treadway Commission (COSO). The Company's management is responsible for maintaining effective internal control over financial reporting and for its assessment of the effectiveness of internal control over financial reporting, included in the accompanying Management's Report on Financial Statement. Our responsibility is to express an opinion on the Company's internal control over financial reporting based on our audit.
We conducted our audit in accordance with the standards of the Public Company Accounting Oversight Board (United States). Those standards require that we plan and perform the audit to obtain reasonable assurance about whether effective internal control over financial reporting was maintained in all material respects. Our audit included obtaining an understanding of internal control over financial reporting, assessing the risk that a material weakness exists and testing and evaluating the design and operating effectiveness of internal control based on the assessed risk. Our audit also included performing such other procedures as we considered necessary in the circumstances. We believe that our audit provides a reasonable basis for our opinion.
A company's internal control over financial reporting is a process designed to provide reasonable assurance regarding the reliability of financial reporting and the preparation of financial statements for external purposes in accordance with generally accepted accounting principles. A company's internal control over financial reporting includes those policies and procedures that (1) pertain to the maintenance of records that, in reasonable detail, accurately and fairly reflect the transactions and dispositions of the assets of the company; (2) provide reasonable assurance that transactions are recorded as necessary to permit preparation of financial statements in accordance with generally accepted accounting principles, and that receipts and expenditures of the company are being made only in accordance with authorizations of management and directors of the company; and (3) provide reasonable assurance regarding prevention or timely detection of unauthorized acquisition, use or disposition of the company's assets that could have a material effect on the financial statements.
Because of its inherent limitations, internal control over financial reporting may not prevent or detect misstatements. Also, projections of any evaluation of effectiveness to future periods are subject to the risk that controls may become inadequate because of changes in conditions or that the degree of compliance with the policies or procedures may deteriorate.
In our opinion, Horizon Bancorp maintained, in all material respects, effective internal control over financial reporting as of December 31, 2016, based on criteria established in Internal Control - Integrated Framework (2013) issued by the Committee of Sponsoring Organizations of the Treadway Commission (COSO).
We have also audited, in accordance with the standards of the Public Company Accounting Oversight Board (United States), the consolidated financial statements of Horizon Bancorp and our report dated February 28, 2017, expressed an unqualified opinion thereon.

Indianapolis, Indiana
February 28, 2017
128
Horizon Bancorp
MANAGEMENT'S REPORT ON FINANCIAL STATEMENTS
Management is responsible for the preparation and presentation of the consolidated financial statements and related notes on the preceding pages. The statements have been prepared in conformity with accounting principles generally accepted in the United States of America appropriate in the circumstances and include amounts that are based on management's best estimates and judgments. Financial information elsewhere in the Annual Report is consistent with that in the consolidated financial statements.
In meeting its responsibility for the accuracy of the consolidated financial statements, management relies on Horizon's system of internal accounting controls. This system is designed to provide reasonable assurance that assets are safeguarded and transactions are properly recorded to permit the preparation of appropriate financial information. The system of internal controls is supplemented by a program of internal audits to independently evaluate the adequacy and application of financial and operating controls and compliance with Company policies and procedures.
The Audit Committee of the Board of Directors meets periodically with management, the independent accountants and the internal auditors to ensure that each is properly discharging its responsibilities with regard to the consolidated financial statements and internal accounting controls. The independent accountants have full and free access to the Audit Committee and meet with it to discuss auditing and financial reporting matters.
The consolidated financial statements in the Annual Report have been audited by BKD, LLP, independent registered public accounting firm, for 2016, 2015 and 2014. Their audits were conducted in accordance with the standards of the Public Company Accounting Oversight Board (United States) and included consideration of internal accounting controls, tests of accounting records and other audit procedures to the extent necessary to allow them to express their opinion on the fairness of the consolidated financial statements in conformity with accounting principles generally accepted in the United States of America.
129
Horizon Bancorp
Summary of Selected Financial Data
(Dollars in thousands except for per share data)
| 2016 | 2015 | 2014 | 2013 | 2012 | ||||||||||||||||
Earnings | ||||||||||||||||||||
Net interest income | $ | 85,992 | $ | 74,734 | $ | 62,983 | $ | 61,383 | $ | 58,206 | ||||||||||
Provision for loan losses | 1,842 | 3,162 | 3,058 | 1,920 | 3,524 | |||||||||||||||
Non-interest income | 37,974 | 30,402 | 26,277 | 25,906 | 27,331 | |||||||||||||||
Non-interest expenses | 89,411 | 74,193 | 61,946 | 58,445 | 54,024 | |||||||||||||||
Income tax expense | 8,801 | 7,232 | 6,155 | 7,048 | 8,446 | |||||||||||||||
|
|
|
|
|
|
|
|
|
| |||||||||||
Net income | 23,912 | 20,549 | 18,101 | 19,876 | 19,543 | |||||||||||||||
Preferred stock dividend | (42 | ) | (125 | ) | (133 | ) | (370 | ) | (481 | ) | ||||||||||
|
|
|
|
|
|
|
|
|
| |||||||||||
Net income available to common shareholders | $ | 23,870 | $ | 20,424 | $ | 17,968 | $ | 19,506 | $ | 19,062 | ||||||||||
|
|
|
|
|
|
|
|
|
| |||||||||||
Cash dividend declared | $ | 8,382 | $ | 6,216 | $ | 4,744 | $ | 3,655 | $ | 3,047 | ||||||||||
|
|
|
|
|
|
|
|
|
| |||||||||||
Per Share Data | ||||||||||||||||||||
Basic earnings per share (1) | $ | 1.19 | $ | 1.30 | $ | 1.32 | $ | 1.51 | $ | 1.59 | ||||||||||
Diluted earnings per share (1) | 1.19 | 1.26 | 1.27 | 1.45 | 1.54 | |||||||||||||||
Cash dividends declared per common share (1) | 0.41 | 0.39 | 0.34 | 0.28 | 0.25 | |||||||||||||||
Book value per common share (1) | 15.37 | 14.20 | 13.16 | 11.76 | 11.33 | |||||||||||||||
Weighted-average shares outstanding | ||||||||||||||||||||
Basic (1) | 19,987,728 | 15,765,444 | 13,591,053 | 12,928,995 | 11,961,362 | |||||||||||||||
Diluted (1) | 20,082,410 | 16,197,312 | 14,181,188 | 13,501,445 | 12,406,765 | |||||||||||||||
Period End Totals | ||||||||||||||||||||
Loans, net of deferred loan fees and unearned income | $ | 2,135,986 | $ | 1,749,131 | $ | 1,378,554 | $ | 1,068,828 | $ | 1,190,717 | ||||||||||
Allowance for loan losses | 14,837 | 14,534 | 16,501 | 15,992 | 18,270 | |||||||||||||||
Total assets | 3,141,156 | 2,652,401 | 2,076,922 | 1,758,276 | 1,848,227 | |||||||||||||||
Total deposits | 2,471,210 | 1,880,153 | 1,482,319 | 1,291,520 | 1,294,153 | |||||||||||||||
Total borrowings | 304,945 | 482,144 | 383,840 | 288,782 | 378,095 | |||||||||||||||
Ratios | ||||||||||||||||||||
Loan to deposit | 86.43 | % | 93.03 | % | 93.00 | % | 82.76 | % | 92.01 | % | ||||||||||
Loan to total funding | 76.94 | % | 74.04 | % | 73.87 | % | 67.63 | % | 71.20 | % | ||||||||||
Return on average assets | 0.81 | % | 0.87 | % | 0.93 | % | 1.13 | % | 1.19 | % | ||||||||||
Average stockholders' equity to average total assets | 10.22 | % | 9.30 | % | 9.33 | % | 9.34 | % | 8.63 | % | ||||||||||
Return on average stockholders' equity | 7.92 | % | 9.87 | % | 10.60 | % | 12.86 | % | 14.72 | % | ||||||||||
Dividend payout ratio (dividends divided by net income) | 34.33 | % | 29.85 | % | 25.72 | % | 18.56 | % | 15.90 | % | ||||||||||
Price to book value ratio | 182.13 | % | 131.26 | % | 132.39 | % | 143.59 | % | 115.61 | % | ||||||||||
Price to earnings ratio | 23.56 | 14.78 | 13.75 | 11.69 | 8.53 | |||||||||||||||
| (1) | Adjusted for 3:2 stock split on November 14, 2016. |
130
Horizon Bancorp
Horizon's Common Stock and Related Stockholders Matters
Horizon common stock is traded on the NASDAQ Global Select Market under the symbol "HBNC." The following table sets forth, for the periods indicated, the high and low prices per share. Also summarized below are the cash dividends declared by quarter for 2016 and 2015.
| 2016 | ||||||||||||
Common Stock Prices | Dividends Declared Per Share | |||||||||||
| High | Low | |||||||||||
First Quarter | $ | 18.59 | $ | 15.41 | $ | 0.10 | ||||||
Second Quarter | 16.76 | 15.87 | 0.10 | |||||||||
Third Quarter | 20.01 | 16.61 | 0.10 | |||||||||
Fourth Quarter | 28.41 | 17.84 | 0.11 | |||||||||
| 2015 | ||||||||||||
Common Stock Prices | Dividends Declared Per Share | |||||||||||
| High | Low | |||||||||||
First Quarter | $ | 17.24 | $ | 14.92 | $ | 0.09 | ||||||
Second Quarter | 17.35 | 15.23 | 0.09 | |||||||||
Third Quarter | 17.43 | 15.07 | 0.10 | |||||||||
Fourth Quarter | 18.77 | 15.72 | 0.10 | |||||||||
The approximate number of holders of record of Horizon's outstanding common stock as of December 31, 2016, was 1,364.
131
Horizon Bancorp
ITEM 9. CHANGES IN AND DISAGREEMENTS WITH ACCOUNTANTS ON ACCOUNTING AND FINANCIAL DISCLOSURE
None
ITEM 9A. CONTROLS AND PROCEDURES
Disclosure Controls and Procedures
Under the supervision of and with the participation of its management, including the Chief Executive Officer and Chief Financial Officer, Horizon has evaluated the effectiveness of the design and operation of its disclosure controls (as defined in Rule 13a-15(e) of the Securities Exchange Act of 1934 (the "Exchange Act")) as of the end of the period covered by this report. Based on such evaluation, such officers have concluded that, as of the evaluation date, Horizon's disclosure controls and procedures are effective to ensure that the information required to be disclosed by Horizon in the reports it files or submits under the Exchange Act is recorded, processed, summarized and reported within the time periods specified in Securities and Exchange Commission rules and forms and are designed to ensure that information required to be disclosed in those reports is accumulated and communicated to management as appropriate to allow timely decisions regarding disclosure.
Management's Report on Internal Control Over Financial Reporting
Management of Horizon Bancorp is responsible for establishing and maintaining effective internal control over financial reporting as defined in Rule 13a-15(f) under the Securities Exchange Act of 1934. Horizon's internal control over financial reporting is designed to provide reasonable assurance to the Company's management and Board of Directors regarding the preparation and fair presentation of published financial statements.
Management assessed the effectiveness of Horizon's internal control over financial reporting as of December 31, 2016. In making this assessment, management used the criteria set forth in Internal Control – Integrated Framework (2013) issued by the Committee of Sponsoring Organizations (COSO) of the Treadway Commission. Based on this assessment, management has determined that Horizon's internal control over financial reporting as of December 31, 2016 is effective based on the specified criteria.
Attestation Report of Registered Public Accounting Firm
BKD, LLP, independent registered public accounting firm, has issued an attestation report on management's assessment of Horizon's internal control over financial reporting. This report appears in Item 8, following BKD, LLP's audit report.
Changes in Internal Control Over Financial Reporting
Horizon's management, including its Chief Executive Officer and Chief Financial Officer, also have concluded that during the fiscal quarter ended December 31, 2016, there were no changes in Horizon's internal control over financial reporting that have materially affected, or are reasonably likely to materially affect, Horizon's internal control over financial reporting.
ITEM 9B. OTHER INFORMATION
Not applicable.
132
Horizon Bancorp
PART III
Certain information is omitted from this report pursuant to General Instruction G. (3) of Form 10-K as Horizon intends to file with the Commission its definitive Proxy Statement for its 2017 Annual Meeting of Shareholders (the "Proxy Statement") pursuant to Regulation 14A of the Securities Exchange Act of 1934, as amended, not later than 120 days after December 31, 2016.
ITEM 10. DIRECTORS, EXECUTIVE OFFICERS AND CORPORATE GOVERNANCE
The information relating to Horizon's directors required by this item is found in the Proxy Statement under "Proposal I - Election of Directors" and is incorporated into this report by reference. The information relating to the Audit Committee of the Board of Directors required by this item is found in the Proxy Statement under "Corporate Governance - Audit Committee" and is incorporated into this report by reference.
The information relating to Horizon's executive officers required by this item is included in Part I of this Form 10-K under "Special Item: Executive Officers of Registrant" and is incorporated into this Item by reference.
The information relating to certain filing obligations of directors and executive officers required by this item is found in the Proxy Statement under "Section 16(a) Beneficial Ownership Reporting Compliance" and is incorporated into this report by reference.
Horizon's "Code of Ethics for Officers and Directors" applies to its directors, chief executive officer and chief financial officer. The code is available on Horizon's website at http://www.horizonbank.com/ in the section headed "About Us – Investor Relations" under the caption "Corporate Information – Corporate Governance."
ITEM 11. EXECUTIVE COMPENSATION
The information on executive and director compensation and compensation committee matters required by this item can be found in the Proxy Statement under "Corporate Governance," "Compensation Committee Report," "Compensation Discussion and Analysis," "Executive Compensation" and "Compensation of Directors" and is incorporated into this report by reference.
133
Horizon Bancorp
ITEM 12. SECURITY OWNERSHIP OF CERTAIN BENEFICIAL OWNERS AND MANAGEMENT AND RELATED STOCKHOLDER MATTERS
Equity Compensation Plan Information
The following table presents information regarding grants under all equity compensation plans of Horizon through December 31, 2016.
Plan Category | Number of Securities to be Issued Upon Exercise of Outstanding Options, Warrants and Rights | Weighted-Average Exercise Price of Outstanding Options, Warrants and Rights | Number of Securities Remaining Available for Future Issuance Under Equity Compensation Plans (Excluding Securities Reflected in the First Column) | |||||||||
Equity compensation plans approved by security holders | 320,721 | $ | 14.15 | 691,482 | ||||||||
Equity compensation plans not approved by security holders | - | $ | - | - | ||||||||
|
|
|
| |||||||||
Total | 320,721 | $ | 14.15 | 691,482 | ||||||||
|
|
|
| |||||||||
The other information required by this item can be found in the Proxy Statement under "Common Share Ownership of Management and Certain Beneficial Owners" and is incorporated by reference into this report.
ITEM 13. CERTAIN RELATIONSHIPS AND RELATED TRANSACTIONS, AND DIRECTOR INDEPENDENCE
The information required by this item is found in the Proxy Statement under "Corporate Governance" and "Certain Business Relationships and Transactions" and is incorporated by reference into this report.
ITEM 14. PRINCIPAL ACCOUNTANT FEES AND SERVICES
The information required by this item is incorporated by reference from the Proxy Statement section captioned "Auditor Fees and Services."
PART IV
ITEM 15. EXHIBITS AND FINANCIAL STATEMENT SCHEDULES
(a) Documents Filed As Part of This Annual Report on Form 10-K:
| 1. | Financial Statements |
See the Financial Statements included in Item 8.
| 2. | Financial Statement Schedules |
Financial statement schedules are omitted for the reason that they are not required or are not applicable, or the required information is included in the financial statements.
| 3. | Exhibits |
The exhibits filed as part of this Annual Report on Form 10-K are identified in the Exhibit Index, which Exhibit Index specifically identifies those exhibits that describe or evidence all management contracts and compensation plans or arrangements required to be filed as exhibits to this Report. Such Exhibit Index is incorporated herein by reference.
134
SIGNATURES
Pursuant to the requirements of Section 13 or 15(d) of the Securities Exchange Act of 1934, the Registrant has duly caused this report to be signed on its behalf by the undersigned, thereunto duly authorized
Horizon Bancorp Registrant | ||||||
| Date: February 28, 2017 | By: | /s/ Craig M. Dwight | ||||
Craig M. Dwight Chairman, President and Chief Executive Officer (Principal Executive Officer) | ||||||
| Date: February 28, 2017 | By: | /s/ Mark E. Secor | ||||
Mark E. Secor Chief Financial Officer (Principal Financial Officer and Principal Accounting Officer) | ||||||
Pursuant to the requirements of the Securities Exchange Act of 1934, this report has been signed below by the following persons on behalf of the Registrant and in the capacities and on the dates indicated.
Date | Signature and Title | |||
| February 28, 2017 | /s/ Craig M. Dwight Craig M. Dwight, Chairman of the Board, President and Chief Executive Officer and Director | |||
| February 28, 2017 | /s/ Susan D. Aaron Susan D. Aaron, Director | |||
| February 28, 2017 | /s/ Lawrence E. Burnell Lawrence E. Burnell, Director | |||
| February 28, 2017 | /s/ James B. Dworkin James B. Dworkin, Director | |||
| February 28, 2017 | /s/ Daniel F. Hopp Daniel F. Hopp, Director | |||
| February 28, 2017 | /s/ Michele M. Magnuson Michele M. Magnuson, Director | |||
135
Date | Signature and Title | |||
| February 28, 2017 | /s/ Larry N. Middleton Larry N. Middleton, Director | |||
| February 28, 2017 | /s/ Peter L. Pairitz Peter L. Pairitz, Director | |||
| February 28, 2017 | /s/ Steven W. Reed Steven W. Reed, Director | |||
| February 28, 2017 | /s/ Robert E. Swinehart Robert E. Swinehart, Director | |||
| February 28, 2017 | /s/ Spero W. Valavanis Spero W. Valavanis, Director | |||
| February 28, 2017 | /s/ Maurice F. Winkler, III Maurice F. Winkler, III, Director | |||
136
EXHIBIT INDEX
The following exhibits are included in this Form 10-K or are incorporated by reference as noted in the following table:
Exhibit Number | Description | Incorporated by Reference/Attached | ||
| 2.1 | Agreement and Plan of Merger, dated as of March 10, 2016, between Horizon Bancorp and LaPorte Bancorp, Inc. | Incorporated by reference to Exhibit 2.1 to Registrant's Form 8-K filed March 11, 2016 | ||
| 3.1 | Articles of Incorporation of Horizon Bancorp, as amended and restated | Incorporated by reference to Exhibit 3.1 to Registrant's Form 8-K filed October 19,2016 | ||
| 3.2 | Amended and Restated Bylaws of Horizon Bancorp | Incorporated by reference to Exhibit 3.1 to Registrant's Form 8-K filed April 18, 2013 | ||
| 4.1 | Indenture, dated as of October 21, 2004, between Horizon Bancorp and Wilmington Trust Company related to the issuance of Trust Preferred Securities | Incorporated by reference to Exhibit 4.1 to Registrant's Form 10-K for the year ended December 31, 2009 (SEC File No. 000-10792, Film No. 10677545) | ||
| 4.2 | Amended and Restated Declaration of Trust of Horizon Bancorp Capital Trust II, dated as of October 21, 2004, related to the issuance of Trust Preferred Securities | Incorporated by reference to Exhibit 4.2 to Registrant's Form 10-K for the year ended December 31, 2009 (SEC File No. 000-10792, Film No. 10677545) | ||
| 4.3 | Junior Subordinated Indenture, dated as of December 15, 2006, between Horizon Bancorp and Wilmington Trust Company. | Incorporated by reference to Exhibit 4.1 to Registrant's Form 8-K filed December 21, 2006 (SEC File No. 000-10792, Film No. 061291739) | ||
| 4.4 | Amended and Restated Trust Agreement of Horizon Bancorp Capital Trust III, dated as of December 15, 2006 | Incorporated by reference to Exhibit 4.2 to Registrant's Form 8-K filed December 21, 2006 (SEC File No. 000-10792, Film No. 061291739) | ||
| 10.1* | Supplemental Executive Retirement Plan, as amended and restated as of January 1, 1997 | Incorporated by reference to Exhibit 10.1 to Registrant's Form 10-K for the year ended December 31, 2007 (SEC File No. 000-10792, Film No. 08689720) | ||
| 10.2* | Horizon Bancorp Amended 2003 Omnibus Equity Incentive Plan | Incorporated by reference to Appendix A to Registrant's definitive Proxy Statement for its 2010 Annual Meeting of Shareholders (SEC File No. 000-10792, Film No. 10693679) | ||
| 10.3* | Directors Deferred Compensation Plan | Incorporated by reference to Exhibit 10.5 to Registrant's Form 10-K for the year ended December 31, 2009 (SEC File No. 000-10792, Film No. 10677545) | ||
| 10.4* | Form of Change of Control Agreement for certain executive officers | Incorporated by reference to Exhibit 10.6 to Registrant's Form 10-K for the year ended December 31, 2009 (SEC File No. 000-10792, Film No. 10677545) | ||
| 10.5* | Form of Restricted Stock Award Agreement under 2003 Omnibus Equity Incentive Plan | Incorporated by reference to Exhibit 10.7 to Registrant's Form 10-K for the year ended December 31, 2009 (SEC File No. 000-10792, Film No. 10677545) | ||
137
Exhibit Number | Description | Incorporated by Reference/Attached | ||
| 10.6* | Form of Option Grant Agreement under 2003 Omnibus Equity Incentive Plan | Incorporated by reference to Exhibit 10.8 to Registrant's Form 10-K for the year ended December 31, 2009 (SEC File No. 000-10792, Film No. 10677545) | ||
| 10.7 | Guarantee Agreement of Horizon Bancorp, dated as of October 21, 2004, related to the issuance of Trust Preferred Securities | Incorporated by reference to Exhibit 10.10 to Registrant's Form 10-K for the year ended December 31, 2009 (SEC File No. 000-10792, Film No. 10677545) | ||
| 10.8* | Description of Executive Officer Bonus Plan | Attached | ||
| 10.9* | Horizon Bancorp 2005 Supplemental Executive Retirement Plan as amended | Incorporated by reference to Exhibit 10.14 to Registrant's Form 10-K for the year ended December 31, 2006 (SEC File No. 000-10792, Film No. 07714381) | ||
| 10.10* | Employment Agreement, dated December 1, 2006, among Horizon Bancorp, Horizon Bank, N.A. and Craig M. Dwight | Incorporated by reference to Exhibit 10.1 to Registrant's Form 8-K filed December 6, 2006 (SEC File No. 000-10792, Film No. 061259453) | ||
| 10.11* | Letter Agreement, dated December 1, 2006, between Horizon Bank, N.A. and Craig M. Dwight | Incorporated by reference to Exhibit 10.2 to Registrant's Form 8-K filed December 6, 2006 (SEC File No. 000-10792, Film No. 061259453) | ||
| 10.12* | Guarantee Agreement of Horizon Bancorp, dated as of December 15, 2006, related to the issuance of Trust Preferred Securities | Incorporated by reference to Exhibit 10.1 to Registrant's Form 8-K filed December 21, 2006 (SEC File No. 000-10792, Film No. 061291739) | ||
| 10.13* | Employment Agreement, dated July 16, 2007, among Horizon Bancorp, Horizon Bank, N.A. and Thomas H. Edwards | Incorporated by reference to Exhibit 10.1 to Registrant's Form 8-K filed July 19, 2007 (SEC File No. 000-10792, Film No. 07988114) | ||
| 10.14* | Agreement, dated August 28, 2007, between Horizon Bank, N.A., and Mark E. Secor | Incorporated by reference to Exhibit 10.18 to Registrant's Form 10-K for the year ended December 31, 2008 (SEC File No. 000-10792, Film No. 09694757) | ||
| 10.15* | First Amendment of the Agreement between Horizon Bank, N.A., and Mark E. Secor, dated January 1, 2009 | Incorporated by reference to Exhibit 10.19 to Registrant's Form 10-K for the year ended December 31, 2008 (SEC File No. 000-10792, Film No. 09694757) | ||
| 10.16* | Employment Agreement, dated December 14, 2011, by and among Horizon Bank, N.A., Horizon Bancorp and James D. Neff | Incorporated by reference to Exhibit 10.1 to Registrant's Form 8-K filed on December 14, 2011 (SEC File No. 000-10792, Film No. 111259976) | ||
| 10.17* | First Amendment to the Horizon Bancorp 2005 Supplemental Executive Retirement Plan | Incorporated by reference to Exhibit 10.1 to Registrant's Form 10-Q for the quarter ended March 31, 2012 | ||
| 10.18* | Second Amendment to the Horizon Bancorp 2005 Supplemental Executive Retirement Plan | Incorporated by reference to Exhibit 10.2 to Registrant's Form 10-Q for the quarter ended March 31, 2012 | ||
138
Exhibit Number | Description | Incorporated by Reference/Attached | ||
| 10.19* | Fifth Amendment to the Horizon Bancorp 1997 Supplemental Executive Retirement Plan | Incorporated by reference to Exhibit 10.3 to Registrant's Form 10-Q for the quarter ended March 31, 2012 | ||
| 10.20* | Horizon Bancorp 2013 Omnibus Equity Incentive Plan | Incorporated by reference to Appendix A to Registrant's definitive Proxy Statement for its 2014 Annual Meeting of Shareholders | ||
| 10.21* | Form of Nonqualified Stock Option Agreement | Incorporated by reference to Exhibit 10.1 to Registrant's Form 8-K filed on June 18, 2013 | ||
| 10.22* | Form of Nonqualified Stock Option Agreement (Restrictive Covenant) | Incorporated by reference to Exhibit 10.2 to Registrant's Form 8-K filed on June 18, 2013 | ||
| 10.23* | Form of Performance Share Award Agreement | Incorporated by reference to Exhibit 10.3 to Registrant's Form 8-K filed on June 18, 2013 | ||
| 10.24* | Form of Performance Share Award Agreement (Restrictive Covenant) | Incorporated by reference to Exhibit 10.4 to Registrant's Form 8-K filed on June 18, 2013 | ||
| 10.25* | Agreement dated September 21, 2016, between Horizon Bank, N.A. and Kathie A. DeRuiter | Incorporated by reference to Exhibit 10.1 to Registrant's Form 8-K filed on September 21, 2016 | ||
| 12 | Ratios of Earnings to Fixed Charges and Preferred Stock Dividends | Attached | ||
| 21 | Subsidiaries of Horizon | Attached | ||
| 23 | Consent of BKD, LLP | Attached | ||
| 31.1 | Certification of Craig M. Dwight pursuant to Section 302 of the Sarbanes-Oxley Act of 2002 | Attached | ||
| 31.2 | Certification of Mark E. Secor pursuant to Section 302 of the Sarbanes-Oxley Act of 2002 | Attached | ||
| 32.1 | Certification of Craig M. Dwight Pursuant to 18 U.S.C. Section 1350, as adopted pursuant to Section 906 of the Sarbanes-Oxley Act of 2002 | Attached | ||
| 32.2 | Certification of Mark E. Secor Pursuant to 18 U.S.C. Section 1350, as adopted pursuant to Section 906 of the Sarbanes-Oxley Act of 2002 | Attached | ||
| 101 | Interactive Data File | Attached | ||
| * | Indicates exhibits that describe or evidence management contracts or compensatory plans or arrangements required to be filed as exhibits to this Form 10-K. |
139