UNITED STATES SECURITIES AND EXCHANGE COMMISSION
Washington, D.C. 20549
Form 10-K
ANNUAL REPORT PURSUANT TO SECTION 13 OR 15(d)
OF THE SECURITIES EXCHANGE ACT OF 1934
For the fiscal year ended December 31, 2010 | Commission File Number: 001-14965 |
The Goldman Sachs Group,
Inc.
(Exact name of registrant as specified in its charter)
| Delaware | 13-4019460 | |
| (State or other jurisdiction
of incorporation or organization) | (I.R.S. Employer Identification No.) | |
| 200 West Street New York, N.Y. | 10282 (Zip Code) | |
| (Address of principal executive offices) |
(212) 902-1000
(Registrant's telephone number, including area code)
Securities registered pursuant to Section 12(b) of the Act:
| Title of each class: | Name of each exchange on
which registered: | |
Common stock, par value $.01 per share | New York Stock Exchange | |
| Depositary Shares, Each Representing 1/1,000th Interest in a Share of Floating Rate Non-Cumulative Preferred Stock, Series A | New York Stock Exchange | |
| Depositary Shares, Each Representing 1/1,000th Interest in a Share of 6.20% Non-Cumulative Preferred Stock, Series B | New York Stock Exchange | |
| Depositary Shares, Each Representing 1/1,000th Interest in a Share of Floating Rate Non-Cumulative Preferred Stock, Series C | New York Stock Exchange | |
| Depositary Shares, Each Representing 1/1,000th Interest in a Share of Floating Rate Non-Cumulative Preferred Stock, Series D | New York Stock Exchange | |
| 5.793% Fixed-to-Floating Rate Normal Automatic Preferred Enhanced Capital Securities of Goldman Sachs Capital II (and Registrant's guarantee with respect thereto) | New York Stock Exchange | |
| Floating Rate Normal Automatic Preferred Enhanced Capital Securities of Goldman Sachs Capital III (and Registrant's guarantee with respect thereto) | New York Stock Exchange | |
| Medium-Term Notes, Series B, Index-Linked Notes due February 2013; Index-Linked Notes due April 2013; Index-Linked Notes due May 2013; and Index-Linked Notes due 2011 | NYSE Amex | |
| Medium-Term Notes, Series B, Floating Rate Notes due 2011 | New York Stock Exchange | |
| Medium-Term Notes, Series A, Index-Linked Notes due 2037 of GS Finance Corp. (and Registrant's guarantee with respect thereto) | NYSE Arca | |
Medium-Term Notes, Series B, Index-Linked Notes due 2037 | NYSE Arca | |
Medium-Term Notes, Series D, 7.50% Notes due 2019 | New York Stock Exchange | |
6.125% Notes due 2060 | New York Stock Exchange |
Securities registered pursuant to Section 12(g) of the Act: None
Indicate by check mark if the registrant is a well-known seasoned issuer, as defined in Rule 405 of the Securities Act.
Yes x No o
Indicate by check mark if the registrant is not required to file reports pursuant to Section 13 or 15(d) of the Act.
Yes o No x
Indicate by check mark whether the registrant (1) has filed all reports required to be filed by Section 13 or 15(d) of the Securities Exchange Act of 1934 during the preceding 12 months (or for such shorter period that the registrant was required to file such reports), and (2) has been subject to such filing requirements for the past 90 days.
Yes x No o
Indicate by check mark whether the registrant has submitted electronically and posted on its corporate Web site, if any, every Interactive Data File required to be submitted and posted pursuant to Rule 405 of Regulation S-T during the preceding 12 months (or for such shorter period that the registrant was required to submit and post such files).
Yes x No o
Indicate by check mark if disclosure of delinquent filers pursuant to Item 405 of Regulation S-K is not contained herein, and will not be contained, to the best of registrant's knowledge, in definitive proxy or information statements incorporated by reference in Part III of the Annual Report on Form 10-K or any amendment to the Annual Report on Form 10-K. x
Indicate by check mark whether the registrant is a large accelerated filer, an accelerated filer, a non-accelerated filer, or a smaller reporting company. See the definitions of "large accelerated filer," "accelerated filer" and "smaller reporting company" in Rule 12b-2 of the Exchange Act.
Large accelerated filer x Accelerated filer o Non-accelerated filer (Do not check if a smaller reporting company) o Smaller reporting company o
Indicate by check mark whether the registrant is a shell company (as defined in Rule 12b-2 of the Exchange Act). Yes o No x
As of June 30, 2010, the aggregate market value of the common stock of the registrant held by non-affiliates of the registrant was approximately $66.7 billion.
As of February 11, 2011, there were 520,507,295 shares of the registrant's common stock outstanding.
Documents incorporated by reference: Portions of The Goldman Sachs Group, Inc.'s Proxy Statement for its 2011 Annual Meeting of Shareholders to be held on May 6, 2011 are incorporated by reference in the Annual Report on Form 10-K in response to Part III, Items 10, 11, 12, 13 and 14.
THE GOLDMAN SACHS GROUP, INC.
ANNUAL REPORT ON FORM 10-K FOR THE FISCAL YEAR ENDED DECEMBER 31, 2010
INDEX
| Form 10-K Item Number | Page No. | |||||||
PART I | 1 | |||||||
Item 1 | Business | 1 | ||||||
Introduction | 1 | |||||||
Our Business Segments and Segment Operating Results | 1 | |||||||
Investment Banking | 2 | |||||||
Institutional Client Services | 3 | |||||||
Investing & Lending | 5 | |||||||
Investment Management | 5 | |||||||
Business Continuity and Information Security | 6 | |||||||
Employees | 6 | |||||||
Competition | 7 | |||||||
Regulation | 8 | |||||||
Available Information | 17 | |||||||
Cautionary Statement Pursuant to the U.S. Private Securities Litigation Reform Act of 1995 | 17 | |||||||
Item 1A | Risk Factors | 18 | ||||||
Item 1B | Unresolved Staff Comments | 31 | ||||||
Item 2 | Properties | 31 | ||||||
Item 3 | Legal Proceedings | 31 | ||||||
Executive Officers of The Goldman Sachs Group, Inc. | 32 | |||||||
PART II | 34 | |||||||
Item 5 | Market for Registrant's Common Equity, Related Stockholder Matters and Issuer Purchases of Equity Securities | 34 | ||||||
Item 6 | Selected Financial Data | 34 | ||||||
Item 7 | Management's Discussion and Analysis of Financial Condition and Results of Operations | 35 | ||||||
Item 7A | Quantitative and Qualitative Disclosures About Market Risk | 96 | ||||||
Item 8 | Financial Statements and Supplementary Data | 97 | ||||||
Item 9 | Changes in and Disagreements with Accountants on Accounting and Financial Disclosure | 213 | ||||||
Item 9A | Controls and Procedures | 213 | ||||||
Item 9B | Other Information | 213 | ||||||
PART III | 213 | |||||||
Item 10 | Directors, Executive Officers and Corporate Governance | 213 | ||||||
Item 11 | Executive Compensation | 213 | ||||||
Item 12 | Security Ownership of Certain Beneficial Owners and Management and Related Stockholder Matters | 214 | ||||||
Item 13 | Certain Relationships and Related Transactions, and Director Independence | 214 | ||||||
Item 14 | Principal Accountant Fees and Services | 214 | ||||||
PART IV | 215 | |||||||
Item 15 | Exhibits and Financial Statement Schedules | 215 | ||||||
SIGNATURES | II-1 | |||||||
| EX-10.27: Form of Non-Employee Director RSU Award Agreement | ||||||||
| EX-10.28: Description of Independent Director Compensation | ||||||||
| EX-10.42: Form of One-Time RSU Award Agreement | ||||||||
| EX-10.45: Form of Signature Card for Equity Awards | ||||||||
| EX-10.46: Form of Signature Card for Equity Awards (employees in Asia Outside China) | ||||||||
| EX-10.47: Form of Signature Card for Equity Awards (employees in China) | ||||||||
| EX-10.48: Form of Year-End RSU Award Agreement (not fully vested) | ||||||||
| EX-10.49: Form of Year-End RSU Award Agreement (fully vested) | ||||||||
| EX-10.50: Form of Year-End RSU Award Agreement (Base and/or Supplemental) | ||||||||
| EX-10.51: Form of Year-End Short-Term RSU Award Agreement | ||||||||
| EX-10.52: Form of Year-End Restricted Stock Award Agreement (Base and/or Supplemental) | ||||||||
| EX-10.53: Form of Year-End Restricted Stock Award Agreement (fully vested) | ||||||||
| EX-10.54: Form of Year-End Short-Term Restricted Stock Award Agreement | ||||||||
| EX-12.1: Statement re: Computation of Ratios | ||||||||
| EX-21.1: List of Significant Subsidiaries of The Goldman Sachs Group, Inc. | ||||||||
| EX-23.1: Consent of Independent Registered Public Accounting Firm | ||||||||
| EX-31.1: Rule 13A-14(A) Certifications | ||||||||
| EX-32.1: Section 1350 Certifications | ||||||||
| EX-99.1: Report of Independent Registered Public Accounting Firm on Selected Financial Data | ||||||||
| EX-101 INSTANCE DOCUMENT | ||||||||
| EX-101 SCHEMA DOCUMENT | ||||||||
| EX-101 CALCULATION LINKBASE DOCUMENT | ||||||||
| EX-101 LABELS LINKBASE DOCUMENT | ||||||||
| EX-101 PRESENTATION LINKBASE DOCUMENT | ||||||||
| EX-101 DEFINITION LINKBASE DOCUMENT | ||||||||
PART I
| Item 1. | Business |
Introduction
Goldman Sachs is a leading global investment banking, securities and investment management firm that provides a wide range of financial services to a substantial and diversified client base that includes corporations, financial institutions, governments and high-net-worth individuals.
When we use the terms "Goldman Sachs," "the firm," "we," "us" and "our," we mean The Goldman Sachs Group, Inc. (Group Inc.), a Delaware corporation, and its consolidated subsidiaries. References to "this Form 10-K" are to our Annual Report on Form 10-K for the fiscal year ended December 31, 2010. All references to 2010, 2009 and 2008 refer to our fiscal years ended, or the dates, as the context requires, December 31, 2010, December 31, 2009 and November 28, 2008, respectively.
Group Inc. is a bank holding company and a financial holding company regulated by the Board of Governors of the Federal Reserve System (Federal Reserve Board). Our U.S. depository institution subsidiary, Goldman Sachs Bank USA (GS Bank USA), is a New York State-chartered bank.
As of December 2010, we had offices in over 30 countries and 44% of our total staff was based outside the Americas (which includes the countries in North and South America). Our clients are located worldwide, and we are an active participant in financial markets around the world. In 2010, we generated 45% of our net revenues outside the Americas. For more information on our geographic results, see Note 27 to the consolidated financial statements in Part II, Item 8 of this Form 10-K.
Our Business Segments and Segment Operating Results
We report our activities in four business segments: Investment Banking; Institutional Client Services; Investing & Lending; and Investment Management. The chart below presents our four business segments. Prior to the end of 2010, we reported our activities in three segments.

1
The table below presents our segment operating results.
| Year Ended 1 | % of 2010 | |||||||||||||||||||
| December | December | November | Net | |||||||||||||||||
| $ in millions | 2010 | 2009 | 2008 | Revenues | ||||||||||||||||
Investment Banking | Net revenues | $ | 4,810 | $ | 4,984 | $ | 5,453 | 12% | ||||||||||||
| Operating expenses | 3,511 | 3,482 | 3,269 | |||||||||||||||||
| Pre-tax earnings/(loss) | $ | 1,299 | $ | 1,502 | $ | 2,184 | ||||||||||||||
Institutional Client Services | Net revenues | $ | 21,796 | $ | 32,719 | $ | 22,345 | 56% | ||||||||||||
| Operating expenses | 14,291 | 13,691 | 10,294 | |||||||||||||||||
| Pre-tax earnings | $ | 7,505 | $ | 19,028 | $ | 12,051 | ||||||||||||||
Investing & Lending | Net revenues | $ | 7,541 | $ | 2,863 | $ | (10,821 | ) | 19% | |||||||||||
| Operating expenses | 3,361 | 3,523 | 2,719 | |||||||||||||||||
| Pre-tax earnings/(loss) | $ | 4,180 | $ | (660 | ) | $ | (13,540 | ) | ||||||||||||
Investment Management | Net revenues | $ | 5,014 | $ | 4,607 | $ | 5,245 | 13% | ||||||||||||
| Operating expenses | 4,051 | 3,673 | 3,528 | |||||||||||||||||
| Pre-tax earnings | $ | 963 | $ | 934 | $ | 1,717 | ||||||||||||||
Total | Net revenues | $ | 39,161 | $ | 45,173 | $ | 22,222 | |||||||||||||
| Operating expenses 2 | 26,269 | 25,344 | 19,886 | |||||||||||||||||
| Pre-tax earnings/(loss) | $ | 12,892 | $ | 19,829 | $ | 2,336 | ||||||||||||||
| 1. | Financial information concerning our business segments for 2010, 2009 and 2008 (with prior periods recast to reflect our new segment reporting) is included in "Management's Discussion and Analysis of Financial Condition and Results of Operations" and the "Financial Statements and Supplementary Data," which are in Part II, Items 7 and 8, respectively, of this Form 10-K. See Note 27 to the consolidated financial statements in Part II, Item 8 of this Form 10-K for a further breakdown of our net revenues. |
| 2. | Includes the following expenses that have not been allocated to our segments: (i) charitable contributions of $345 million and $810 million for the years ended December 2010 and December 2009, respectively; (ii) net provisions for a number of litigation and regulatory proceedings of $682 million, $104 million and $(4) million for the years ended December 2010, December 2009 and November 2008, respectively; and (iii) real estate-related exit costs of $28 million, $61 million and $80 million for the years ended December 2010, December 2009 and November 2008, respectively. |
Investment Banking
Investment Banking serves corporate and government clients around the world. We provide financial advisory services and help companies raise capital to strengthen and grow their businesses. We seek to develop and maintain long-term relationships with a diverse global group of institutional clients, including governments, states and municipalities. Our goal is to deliver to our clients the entire resources of the firm in a seamless fashion, with investment banking serving as the main initial point of contact with Goldman Sachs.
Financial Advisory. Financial Advisory includes strategic advisory assignments with respect to mergers and acquisitions, divestitures, corporate defense activities, risk management, restructurings and spin-offs. In particular, we help clients execute large, complex transactions for which we provide multiple services, including "one-stop" acquisition financing and cross-border structuring expertise.
We also assist our clients in managing their asset and liability exposures and their capital. In addition, we may provide lending commitments and bank loan and bridge loan facilities in connection with our advisory assignments.
2
Underwriting. The other core activity of Investment Banking is helping companies raise capital to fund their businesses. As a financial intermediary, our job is to match the capital of our investing clients - who aim to grow the savings of millions of people - with the needs of our corporate and government clients - who need financing to generate growth, create jobs and deliver products and services. Our underwriting activities include public offerings and private placements, including domestic and cross-border transactions, of a wide range of securities and other financial instruments. Underwriting also includes revenues from derivative transactions entered into with institutional clients in connection with our underwriting activities.
Equity Underwriting. We underwrite common and preferred stock and convertible and exchangeable securities. We regularly receive mandates for large, complex transactions and have held a leading position in worldwide public common stock offerings and worldwide initial public offerings for many years.
Debt Underwriting. We underwrite and originate various types of debt instruments, including investment-grade and high-yield debt, bank loans and bridge loans, and emerging and growth market debt, which may be issued by, among others, corporate, sovereign, municipal and agency issuers. In addition, we underwrite and originate structured securities, which include mortgage-related securities and other asset-backed securities.
Institutional Client Services
Institutional Client Services serves our clients who come to the firm to buy and sell financial products, raise funding and manage risk. We do this by acting as a market maker and offering market expertise on a global basis. Institutional Client Services makes markets and facilitates client transactions in fixed income, equity, currency and commodity products. In addition, we make markets in and clear client transactions on major stock, options and futures exchanges worldwide. Market makers provide liquidity and play a critical role in price discovery, which contributes to the overall efficiency of the capital markets. Our willingness to make markets, commit capital and take risk in a broad range of products is crucial to our client relationships.
Our clients are primarily institutions that are professional market participants, including investment entities whose ultimate customers include individual investors investing for their retirement, buying insurance or putting aside surplus cash in a deposit account.
Through our global sales force, we maintain relationships with our clients, receiving orders and distributing investment research, trading ideas, market information and analysis. As a market maker, we provide prices to clients globally across thousands of products in all major asset classes and markets. At times we take the other side of transactions ourselves if a buyer or seller is not readily available and at other times we connect our clients to other parties who want to transact. Much of this connectivity between the firm and its clients is maintained on technology platforms and operates globally wherever and whenever markets are open for trading.
Institutional Client Services and our other businesses are supported by our Global Investment Research division, which, as of December 2010, provided fundamental research on more than 3,300 companies worldwide and over 45 national economies, as well as on industries, currencies and commodities.
Institutional Client Services generates revenues in three ways:
| • | In large, highly liquid markets (such as markets for U.S. Treasury bills or large capitalization S&P 500 stocks), we execute a high volume of transactions for our clients for modest spreads and fees. |
| • | In less liquid markets (such as mid-cap corporate bonds and growth market currencies), we execute transactions for our clients for spreads and fees that are generally somewhat larger. |
| • | We also structure and execute transactions involving customized or tailor-made products that address our clients' risk exposures, investment objectives or other complex needs (such as a jet fuel hedge for an airline). |
Institutional Client Services activities are organized by asset class and include both "cash" and "derivative" instruments. "Cash" refers to trading the underlying instrument (such as a stock, bond or barrel of oil). "Derivative" refers to instruments that derive their value from underlying asset prices, indices, reference rates and other inputs, or a combination of these factors (such as an option, which is the right or obligation to buy or sell a certain bond or stock index on a specified date in the future at a certain price, or an interest rate swap, which is the right to convert a fixed rate of interest into a floating rate or vice versa).
3
Fixed Income, Currency and Commodities Client Execution. Includes interest rate products, credit products, mortgages, currencies and commodities.
| • | Interest Rate Products. Government bonds, money market instruments such as commercial paper, treasury bills, repurchase agreements and other highly liquid securities and instruments, as well as interest rate swaps, options and other derivatives. |
| • | Credit Products. Investment-grade corporate securities, high-yield securities, bank and secured loans, municipal securities, emerging market and distressed debt, and credit derivatives. |
| • | Mortgages. Commercial and residential mortgage-related securities and loan products, and other asset-backed and derivative instruments. |
| • | Currencies. Most currencies, including growth market currencies. |
| • | Commodities. Oil and natural gas, base, precious and other metals, electricity, coal, agricultural and other commodity products. |
Equities. Includes equity client execution, commissions and fees, and securities services.
Equities Client Execution. We make markets in equity securities and equity-related products, including convertible securities, options, futures and over-the-counter (OTC) derivative instruments, on a global basis. As a principal, we facilitate client transactions by providing liquidity to our clients with large blocks of stocks or options, requiring the commitment of our capital. In addition, we engage in insurance activities where we reinsure and purchase portfolios of insurance risk and acquire pension liabilities.
We also structure and execute derivatives on indices, industry groups, financial measures and individual company stocks. We develop strategies and provide information about portfolio hedging and restructuring and asset allocation transactions for our clients. We also work with our clients to create specially tailored instruments to enable sophisticated investors to establish or liquidate investment positions or undertake hedging strategies. We are one of the leading participants in the trading and development of equity derivative instruments.
Our exchange-based market-making activities include making markets in stocks and exchange-traded funds. In the United States, we are one of the leading Designated Market Makers (DMMs) for stocks traded on the NYSE. For ETFs, we are registered market makers on NYSE Arca. In listed options, we are registered as a primary or lead market maker or otherwise make markets on the International Securities Exchange, the Chicago Board Options Exchange, NYSE Arca, the Boston Options Exchange, the Philadelphia Stock Exchange and NYSE Amex. In futures and options on futures, we are market makers on the Chicago Mercantile Exchange and the Chicago Board of Trade.
Commissions and Fees. We generate commissions and fees from executing and clearing institutional client transactions on major stock, options and futures exchanges worldwide. We increasingly provide our clients with access to electronic "low-touch" equity trading platforms, and electronic trades account for the majority of our equity trading activity. However, a majority of our net revenues in these activities continue to be derived from our traditional "high-touch" handling of more complex trades. We expect both types of activity to remain important.
Securities Services. Includes financing, securities lending and other prime brokerage services.
| • | Financing Services. We provide financing to our clients for their securities trading activities through margin loans that are collateralized by securities, cash or other acceptable collateral. We earn a spread equal to the difference between the amount we pay for funds and the amount we receive from our client. |
| • | Securities Lending Services. We provide services that principally involve borrowing and lending securities to cover institutional clients' short sales and borrowing securities to cover our short sales and otherwise to make deliveries into the market. In addition, we are an active participant in broker-to-broker securities lending and third-party agency lending activities. |
| • | Other Prime Brokerage Services. We earn fees by providing clearing, custody and settlement services globally. In addition, we help our hedge fund and other clients maintain the infrastructure that supports their investing activity by providing a suite of services from the moment a client begins the process of establishing a new investing business. We provide a technology platform and reporting which enables clients to monitor their security portfolios, and manage risk exposures. |
4
Investing & Lending
Our investing and lending activities, which are typically longer-term, include the firm's investing and relationship lending activities across various asset classes, primarily including debt securities and loans, public and private equity securities, and real estate. These activities include investing directly in publicly and privately traded securities and also through certain investment funds that we manage. We also provide financing to our clients. We manage a diversified global portfolio of investments in equity and debt securities and other investments in privately negotiated transactions, leveraged buyouts, acquisitions and investments in funds managed by external parties.
ICBC. We have an investment in the ordinary shares of ICBC, the largest bank in China.
Equity Securities (excluding ICBC). We make corporate, real estate and infrastructure equity-related investments.
Debt Securities and Loans. We make corporate, real estate and infrastructure debt security-related investments. In addition, we provide credit to corporate clients through loan facilities and to high-net-worth individuals through secured loans.
Other. Our other investments primarily include our consolidated investment entities, which are entities we hold for investment purposes strictly for capital appreciation. These entities have a defined exit strategy and are engaged in activities that are not closely related to our principal businesses. We also invest directly in distressed assets, currencies, commodities and other assets, including power generation facilities.
Investment Management
Investment Management provides investment and wealth advisory services to help clients preserve and grow their financial assets. Our clients include institutions and high-net-worth individuals as well as retail investors, who access our products through a network of third-party distributors around the world.
We manage client assets across a broad range of asset classes and investment strategies, including equity, fixed income and alternative investments. Alternative investments primarily include hedge funds, private equity, real estate, currencies, commodities, and asset allocation strategies. Our investment offerings include those managed on a fiduciary basis by our portfolio managers as well as strategies managed by third-party managers. We offer our investments in a variety of structures, including separately managed
accounts, mutual funds, private partnerships and other commingled vehicles.
We also provide customized investment advisory solutions designed to address our clients' investment needs. These solutions begin with identifying clients' objectives and continue through portfolio construction, ongoing asset allocation and risk management and investment realization. We draw from a variety of third-party managers as well as our proprietary offerings to implement solutions for clients.
We supplement our investment advisory solutions for high-net-worth clients with wealth advisory services that include income and liability management, trust and estate planning, philanthropic giving and tax planning. We also use the firm's global securities and derivatives market-making capabilities to address clients' specific investment needs.
Management and Other Fees. The majority of revenues in management and other fees is comprised of asset-based management fees on client assets. The fees that we charge vary by asset class and are affected by investment performance as well as asset inflows and redemptions. Other fees we receive include financial counseling fees generated through our wealth advisory services and fees related to the administration of real estate assets.
Assets under management include only those client assets where we earn a fee for managing assets on a discretionary basis. This includes assets in our mutual funds, hedge funds, private equity funds and separately managed accounts for institutional and individual investors. Assets under management do not include the self-directed assets of our clients, including brokerage accounts, or interest-bearing deposits held through our bank depository institution subsidiaries.
Incentive Fees. In certain circumstances, we are also entitled to receive incentive fees based on a percentage of a fund's or a separately managed account's return, or when the return exceeds a specified benchmark or other performance targets. Such fees include overrides, which consist of the increased share of the income and gains derived primarily from our private equity and real estate funds when the return on a fund's investments over the life of the fund exceeds certain threshold returns. Incentive fees are recognized only when all material contingencies are resolved.
Transaction Revenues. We receive commissions and net spreads for facilitating transactional activity in high-net-worth client accounts. In addition, we earn net interest income primarily associated with client deposits and margin lending activity undertaken by such clients.
5
The tables below present assets under management by asset class and by distribution channel and client category.
| As of | ||||||||||||||
| December 31, | December 31, | November 30, | ||||||||||||
| in billions | 2010 | 2009 | 2008 | |||||||||||
Alternative investments | $ | 148 | $ | 146 | $ | 146 | ||||||||
Equity | 144 | 146 | 112 | |||||||||||
Fixed income | 340 | 315 | 248 | |||||||||||
Total non-money market assets | 632 | 607 | 506 | |||||||||||
Money markets | 208 | 264 | 273 | |||||||||||
Total assets under management | $ | 840 | $ | 871 | $ | 779 | ||||||||
| As of | ||||||||||||||
| December 31, | December 31, | November 30, | ||||||||||||
| in billions | 2010 | 2009 | 2008 | |||||||||||
Directly Distributed: | ||||||||||||||
Institutional | $ | 286 | $ | 297 | $ | 273 | ||||||||
High-net-worth individuals | 229 | 231 | 215 | |||||||||||
Third-Party Distributed: | ||||||||||||||
Institutional, high-net-worth individuals and retail | 325 | 343 | 291 | |||||||||||
Total | $ | 840 | $ | 871 | $ | 779 | ||||||||
Business Continuity and Information Security
Business continuity and information security are high priorities for Goldman Sachs. Our Business Continuity Program has been developed to provide reasonable assurance of business continuity in the event of disruptions at the firm's critical facilities and to comply with regulatory requirements, including those of FINRA. Because we are a bank holding company, our Business Continuity Program is also subject to review by the Federal Reserve Board. The key elements of the program are crisis management, people recovery facilities, business recovery, systems and data recovery, and process improvement. In the area of information security, we have developed and implemented a framework of principles, policies and technology to protect the information assets of the firm and our clients. Safeguards are applied to maintain the confidentiality, integrity and availability of information resources.
Employees
Management believes that a major strength and principal reason for the success of Goldman Sachs is the quality and dedication of our people and the shared sense of being part of a team. We strive to maintain a work environment that fosters professionalism, excellence, diversity, cooperation among our employees worldwide and high standards of business ethics.
Instilling the Goldman Sachs culture in all employees is a continuous process, in which training plays an important part. All employees are offered the opportunity to participate in education and periodic seminars that we sponsor at various locations throughout the world. Another important part of instilling the Goldman Sachs culture is our employee review process. Employees are reviewed by supervisors, co-workers and employees they supervise in a 360-degree review process that is integral to our team approach, and includes an evaluation of an employee's performance with respect to risk management, compliance and diversity.
As of December 2010, we had 35,700 total staff, excluding staff at consolidated entities held for investment purposes. See "Management's Discussion and Analysis of Financial Condition and Results of Operations - Results of Operations - Operating Expenses" in Part II, Item 7 of this Form 10-K for additional information on our consolidated entities held for investment purposes.
6
Competition
The financial services industry - and all of our businesses - are intensely competitive, and we expect them to remain so. Our competitors are other entities that provide investment banking, securities and investment management services, as well as those entities that make investments in securities, commodities, derivatives, real estate, loans and other financial assets. These entities include brokers and dealers, investment banking firms, commercial banks, insurance companies, investment advisers, mutual funds, hedge funds, private equity funds and merchant banks. We compete with some entities globally and with others on a regional, product or niche basis. Our competition is based on a number of factors, including transaction execution, our products and services, innovation, reputation and price.
We also face intense competition in attracting and retaining qualified employees. Our ability to continue to compete effectively will depend upon our ability to attract new employees, retain and motivate our existing employees and to continue to compensate employees competitively amid intense public and regulatory scrutiny on the compensation practices of large financial institutions. Our pay practices and those of our principal competitors are subject to review by, and the standards of, the Federal Reserve Board and regulators outside the United States, including the Financial Services Authority (FSA) in the United Kingdom. See "Regulation - Banking Regulation" and "Regulation - Compensation Practices" below and "Risk Factors - Our businesses may be adversely affected if we are unable to hire and retain qualified employees" in Part I, Item 1A of this Form 10-K for more information on the regulation of our compensation practices.
Over time, there has been substantial consolidation and convergence among companies in the financial services industry. This trend accelerated in recent years as the credit crisis caused numerous mergers and asset acquisitions among industry participants. Many commercial banks and other broad-based financial services firms have had the ability for some time to offer a wide range of products, from loans, deposit-taking and insurance to brokerage, asset management and investment banking services, which may enhance their competitive position. They also have had the ability to support investment banking and securities products with commercial banking, insurance and other financial services revenues in an effort to gain market share, which has resulted in pricing pressure in our investment banking and client execution
businesses and could result in pricing pressure in other of our businesses.
Moreover, we have faced, and expect to continue to face, pressure to retain market share by committing capital to businesses or transactions on terms that offer returns that may not be commensurate with their risks. In particular, corporate clients seek such commitments (such as agreements to participate in their commercial paper backstop or other loan facilities) from financial services firms in connection with investment banking and other assignments.
Consolidation and convergence have significantly increased the capital base and geographic reach of some of our competitors, and have also hastened the globalization of the securities and other financial services markets. As a result, we have had to commit capital to support our international operations and to execute large global transactions. To take advantage of some of our most significant challenges and opportunities, we will have to compete successfully with financial institutions that are larger and have more capital and that may have a stronger local presence and longer operating history outside the United States.
We have experienced intense price competition in some of our businesses in recent years. For example, over the past several years the increasing volume of trades executed electronically, through the internet and through alternative trading systems, has increased the pressure on trading commissions, in that commissions for "low-touch" electronic trading are generally lower than for "high-touch" non-electronic trading. It appears that this trend toward electronic and other "low-touch," low-commission trading will continue. In addition, we believe that we will continue to experience competitive pressures in these and other areas in the future as some of our competitors seek to obtain market share by further reducing prices.
The provisions of the U.S. Dodd-Frank Wall Street Reform and Consumer Protection Act (Dodd-Frank Act) and other financial regulation could affect our competitive position to the extent that limitations on activities, increased fees and compliance costs or other regulatory requirements do not apply, or do not apply equally, to all of our competitors. The impact of the Dodd-Frank Act on our competitive position will depend to a large extent on the details of the required rulemaking, as discussed further under "Regulation" below.
7
Regulation
As a participant in the banking, securities, futures and options and insurance industries, we are subject to extensive regulation worldwide. Regulatory bodies around the world are generally charged with safeguarding the integrity of the securities and other financial markets and with protecting the interests of the customers of market participants, including depositors in banking entities and the customers of broker-dealers. They are not, however, generally charged with protecting the interests of security holders.
The financial services industry has been the subject of intense regulatory scrutiny in recent years. Our businesses have been subject to increasing regulation in the United States and other countries, and we expect this trend to continue in the future. The Dodd-Frank Act, which was enacted in July 2010, significantly alters the framework within which we operate, including through the creation of a new systemic risk oversight body, the Financial Stability Oversight Council (FSOC). The FSOC will oversee and coordinate the efforts of the primary U.S. financial regulatory agencies (including the Federal Reserve Board, the SEC, the CFTC and the FDIC) in establishing regulations to address financial stability concerns. The Dodd-Frank Act directs the FSOC to make recommendations to the Federal Reserve Board as to supervisory requirements and prudential standards applicable to systemically important financial institutions, including risk-based capital, leverage, liquidity and risk-management requirements. The Dodd-Frank Act mandates that the requirements applicable to systemically important financial institutions be more stringent than those applicable to other financial companies. Although the criteria for treatment as a systemically important financial institution have not yet been determined, it is probable that they will apply to our firm.
The implications of the Dodd-Frank Act for our businesses will depend to a large extent on the provisions of required future rulemaking by the Federal Reserve, the FDIC, the SEC, the CFTC and other agencies, as well as the development of market practices and structures under the regime established by the legislation and the rules adopted pursuant to it, as discussed further throughout this section.
Banking Regulation
In September 2008, Group Inc. became a bank holding company under the Bank Holding Company Act of 1956 (BHC Act) and the Federal Reserve Board became the primary regulator of Group Inc., as a consolidated entity. In August 2009, Group Inc. became a financial holding company under amendments to the BHC Act effected by the U.S. Gramm-Leach-Bliley Act of 1999 (GLB Act).
Supervision and Regulation
As a bank holding company and a financial holding company under the BHC Act, Group Inc. is subject to supervision and examination by the Federal Reserve Board. Under the system of "functional regulation" established under the BHC Act, the Federal Reserve Board serves as the primary regulator of our consolidated organization, but generally defers to the primary regulators of our U.S. non-bank subsidiaries with respect to the activities of those subsidiaries. Such "functionally regulated" non-bank subsidiaries include broker-dealers registered with the SEC, such as our principal U.S. broker-dealer, Goldman, Sachs & Co. (GS&Co.), insurance companies regulated by state insurance authorities, investment advisers registered with the SEC with respect to their investment advisory activities and entities regulated by the CFTC with respect to certain futures-related activities.
Activities
The BHC Act generally restricts bank holding companies from engaging in business activities other than the business of banking and certain closely related activities. As a financial holding company, we may engage in a broader range of financial and related activities than are permissible for bank holding companies as long as we continue to meet the eligibility requirements for financial holding companies, including our U.S. depository institution subsidiaries (consisting of GS Bank USA and our national bank trust company subsidiary) maintaining their status as "well-capitalized" and "well-managed" as described under "- Prompt Corrective Action" below. These activities include underwriting, dealing and making markets in securities, insurance underwriting and making investments in nonfinancial companies. In addition, we are permitted under the GLB Act to continue to engage in certain commodities activities in the United States that would otherwise be impermissible for bank holding companies, so long as the assets held pursuant to these activities do not equal 5% or more of our consolidated assets.
8
Beginning in July 2011, our financial holding company status will also depend on Group Inc.'s maintaining its status as "well-capitalized" and "well-managed."
As a bank holding company, we are required to obtain prior Federal Reserve Board approval before directly or indirectly acquiring more than 5% of any class of voting shares of any unaffiliated depository institution. In addition, as a bank holding company, we may generally engage in banking and other financial activities abroad, including investing in and owning non-U.S. banks, if those activities and investments do not exceed certain limits and, in some cases, if we have obtained the prior approval of the Federal Reserve Board.
We expect to face additional limitations on our activities upon implementation of those provisions of the Dodd-Frank Act referred to as the "Volcker Rule," which will prohibit "proprietary trading" (other than for certain risk-mitigation activities) and limit the sponsorship of, and investment in, hedge funds and private equity funds by banking entities, including bank holding companies such as us. The extent of the additional limitations will depend on the details of agency rulemaking. The Volcker Rule provisions will take effect no later than July 2012, and companies will be required to come into compliance within two years after the effective date (subject to possible extensions).
Capital and Liquidity Requirements
As a bank holding company, we are subject to consolidated regulatory capital requirements administered by the Federal Reserve Board. GS Bank USA is subject to broadly similar capital requirements, as discussed below. Under the Federal Reserve Board's capital adequacy requirements and the regulatory framework for prompt corrective action that is applicable to GS Bank USA, Group Inc. and GS Bank USA must meet specific regulatory capital requirements that involve quantitative measures of assets, liabilities and certain off-balance-sheet items. The calculation of our capital levels and those of GS Bank USA, as well as GS Bank USA's prompt corrective action classification, are also subject to qualitative judgments by regulators.
Tier 1 Leverage and Basel I Capital Ratios. See Note 20 to the consolidated financial statements in Part II, Item 8 of this Form 10-K for information on our Tier 1 capital ratio, Tier 1 capital, total capital, risk-weighted assets and Tier 1 leverage ratio, and for a discussion of minimum required ratios.
Pending Changes in Capital Requirements. We are currently working to implement the requirements set out in the Federal Reserve Board's Capital Adequacy Guidelines for Bank Holding Companies: Internal Ratings-Based and Advanced Measurement Approaches, which are based on the advanced approaches under the Revised Framework for the International Convergence of Capital Measurement and Capital Standards issued by the Basel Committee on Banking Supervision (Basel Committee) as such requirements apply to us as a bank holding company (Basel 2). U.S. banking regulators have incorporated the Basel 2 framework into the existing risk-based capital requirements by requiring that internationally active banking organizations, such as us, transition to Basel 2 following the successful completion of a parallel run.
In addition, the Basel Committee has undertaken a program of substantial revisions to its capital guidelines. In particular, the changes in the "Basel 2.5" guidelines will result in increased capital requirements for market risk. Additionally, the Basel 3 guidelines issued by the Basel Committee in December 2010 revise the definition of Tier 1 capital, introduce Tier 1 common equity as a regulatory metric, set new minimum capital ratios (including a new "capital conservation buffer," which must be composed exclusively of Tier 1 common equity and will be in addition to the other capital ratios), introduce a Tier 1 leverage ratio within international guidelines for the first time, and make substantial revisions to the computation of risk-weighted assets for credit exposures. Implementation of the new requirements is expected to take place over an extended transition period, starting at the end of 2011 (for Basel 2.5) and end of 2012 (for Basel 3). Although the U.S. federal banking agencies have now issued proposed rules that are intended to implement certain aspects of the Basel 2.5 guidelines, they have not yet addressed all aspects of those guidelines or the Basel 3 changes. In addition, both the Basel Committee and U.S. banking regulators implementing the Dodd-Frank Act have indicated that they will impose more stringent capital standards on systemically important financial institutions. Therefore, the regulations ultimately applicable to us may be substantially different from those that have been published to date.
9
The Dodd-Frank Act will subject Goldman Sachs at a firmwide level to the same leverage and risk-based capital requirements that apply to depository institutions, and directs banking regulators to impose additional capital requirements, as discussed above. The Federal Reserve Board will be required to begin implementing the new leverage and risk-based capital regulation by January 2012. As a consequence of these changes, Tier 1 capital treatment for our junior subordinated debt issued to trusts and our cumulative preferred stock will be phased out over a three-year period beginning on January 1, 2013. The interaction between the Dodd-Frank Act and the Basel Committee's proposed changes adds further uncertainty to our future capital requirements. For example, regulations implementing provisions of the Dodd-Frank Act are expected to subject us to a continuing "floor" of the Federal Reserve Board's regulatory requirements currently applicable to bank holding companies (Basel 1), which are based on the Capital Accord of the Basel Committee, in cases where Basel 2 or Basel 3 would otherwise permit lower capital requirements.
Liquidity Ratios under Basel 3. Historically, regulation and monitoring of bank and bank holding company liquidity has been addressed as a supervisory matter, both in the U.S. and internationally, without required formulaic measures. Basel 3 will require banks and bank holding companies to measure their liquidity against two specific liquidity tests that, although similar in some respects to liquidity measures historically applied by banks and regulators for management and supervisory purposes, will be required by regulation. One test, referred to as the liquidity coverage ratio, is designed to ensure that the banking entity maintains an adequate level of unencumbered high-quality liquid assets equal to the entity's expected net cash outflow for a 30-day time horizon (or, if greater, 25% of its expected total cash outflow) under an acute liquidity stress scenario. The other, referred to as the net stable funding ratio, is designed to promote more medium- and long-term funding of the assets and activities of banking entities over a one-year time horizon. These requirements may incent banking entities to increase their holdings of U.S. Treasury securities and other sovereign debt as a component of assets and increase the use of long-term debt as a funding source. The liquidity coverage ratio would be implemented subject to an observation period beginning in 2011, but would not be introduced as a requirement until January 1, 2015, and the net stable funding ratio would not be introduced as a requirement until January 1, 2018. These new standards are subject to further rulemaking and their terms may change before implementation.
Payment of Dividends
Dividend payments by Group Inc. to its shareholders are subject to the oversight of the Federal Reserve Board. Under temporary guidance issued by the Federal Reserve Board in November 2010, the dividend policy of large bank holding companies, such as Goldman Sachs, is reviewed by the Federal Reserve Board based on capital plans and stress tests submitted by the bank holding company, and will be assessed against, among other things, the ability to achieve the Basel 3 capital ratio requirements referred to above as they are phased in by U.S. regulators and any potential impact of the Dodd-Frank Act on the company's risk profile, business strategy, corporate structure or capital adequacy. The Federal Reserve's current guidance provides that, for large bank holding companies like us, dividend payout ratios exceeding 30% of after-tax net income will receive particularly close scrutiny.
Federal and state law imposes limitations on the payment of dividends by our depository institution subsidiaries to Group Inc. In general, the amount of dividends that may be paid by GS Bank USA or our national bank trust company subsidiary is limited to the lesser of the amounts calculated under a "recent earnings" test and an "undivided profits" test. Under the recent earnings test, a dividend may not be paid if the total of all dividends declared by the entity in any calendar year is in excess of the current year's net income combined with the retained net income of the two preceding years, unless the entity obtains prior regulatory approval. Under the undivided profits test, a dividend may not be paid in excess of the entity's "undivided profits" (generally, accumulated net profits that have not been paid out as dividends or transferred to surplus). While GS Bank USA could have declared dividends of $4.63 billion to Group Inc. as of December 2010 in accordance with these limitations, the banking regulators have overriding authority to prohibit the payment of any dividends by GS Bank USA. In addition to the dividend restrictions described above, the banking regulators have authority to prohibit or to limit the payment of dividends by the banking organizations they supervise if, in the banking regulator's opinion, payment of a dividend would constitute an unsafe or unsound practice in light of the financial condition of the banking organization.
In addition, certain of Group Inc.'s non-bank subsidiaries are subject to separate regulatory limitations on dividends and distributions, including our broker-dealer and our insurance subsidiaries as described below.
10
Source of Strength
Federal Reserve Board policy historically has required bank holding companies to act as a source of strength to their bank subsidiaries and to commit capital and financial resources to support those subsidiaries. The Dodd-Frank Act codifies this policy as a statutory requirement. This support may be required by the Federal Reserve Board at times when we might otherwise determine not to provide it. Capital loans by a bank holding company to a subsidiary bank are subordinate in right of payment to deposits and to certain other indebtedness of the subsidiary bank. In the event of a bank holding company's bankruptcy, any commitment by the bank holding company to a federal bank regulator to maintain the capital of a subsidiary bank will be assumed by the bankruptcy trustee and entitled to priority payment.
However, because the BHC Act provides for functional regulation of bank holding company activities by various regulators, the BHC Act prohibits the Federal Reserve Board from requiring payment by a holding company or subsidiary to a depository institution if the functional regulator of the payor entity objects to such payment. In such a case, the Federal Reserve Board could instead require the divestiture of the depository institution and impose operating restrictions pending the divestiture.
Cross-guarantee Provisions
Each insured depository institution "controlled" (as defined in the BHC Act) by the same bank holding company can be held liable to the FDIC for any loss incurred, or reasonably expected to be incurred, by the FDIC due to the default of any other insured depository institution controlled by that holding company and for any assistance provided by the FDIC to any of those depository institutions that is in danger of default. Such a "cross-guarantee" claim against a depository institution is generally superior in right of payment to claims of the holding company and its affiliates against that depository institution. At this time, we control only one insured depository institution for this purpose, namely GS Bank USA. However, if, in the future, we were to control other insured depository institutions, the cross-guarantee would apply to all such insured depository institutions.
Compensation Practices
Our compensation practices are subject to oversight by the Federal Reserve Board and, with respect to some of our subsidiaries and employees, by other financial regulatory bodies worldwide. The scope and content of compensation regulation in the financial industry are continuing to develop, and we expect that these policies will evolve over a number of years.
The Dodd-Frank Act requires the U.S. financial regulators, including the Federal Reserve Board, to establish joint regulations or guidelines prohibiting incentive-based payment arrangements at specified regulated entities having at least $1 billion in total assets (which would include Group Inc. and some of its depositary institution, broker-dealer and investment advisor subsidiaries) that encourage inappropriate risks by providing an executive officer, employee, director or principal shareholder with excessive compensation, fees, or benefits or that could lead to material financial loss to the entity. In addition, these regulators must establish regulations or guidelines requiring enhanced disclosure to regulators of incentive-based compensation arrangements. The initial version of these regulations was proposed by the FDIC in February 2011 and the regulations may become effective before the end of 2011. If the regulations are adopted in the form initially proposed, they will impose limitations on the manner in which we may structure compensation for our executives.
In June 2010, the Federal Reserve Board and other financial regulators jointly issued guidance designed to ensure that incentive compensation arrangements at banking organizations take into account risk and are consistent with safe and sound practices. The guidance sets forth the following three key principles with respect to incentive compensation arrangements: the arrangements should provide employees incentives that appropriately balance risk and financial results in a manner that does not encourage employees to expose their organizations to imprudent risk; the arrangements should be compatible with effective controls and risk management; and the arrangements should be supported by strong corporate governance. These three principles are incorporated into the proposed joint compensation regulations under Dodd-Frank, discussed above. In addition, the Federal Reserve Board has conducted a review of the incentive compensation policies and practices of a number of large, complex banking organizations, including us. The June 2010 guidance provides that supervisory findings with respect to incentive compensation will be incorporated, as appropriate, into the organization's supervisory ratings, which can affect its ability to make acquisitions or perform other actions. The guidance also provides that enforcement actions may be taken against a banking organization if its incentive compensation arrangements or related risk management, control or governance processes pose a risk to the organization's safety and soundness.
11
The Financial Stability Board, established at the direction of the leaders of the Group of 20, has released standards for implementing certain compensation principles for banks and other financial companies designed to encourage sound compensation practices. These standards are to be implemented by local regulators. In July 2010, the European Parliament adopted amendments to the Capital Requirements Directive designed to implement the Financial Stability Board's compensation standards within the EU. Regulators in a number of countries, including the United Kingdom, France and Germany, have proposed or adopted compensation policies or regulations applicable to financial institutions pursuant to the Capital Requirements Directive. These are in addition to the proposals and guidance issued by U.S. financial regulators discussed above.
GS Bank USA
Our subsidiary, GS Bank USA, an FDIC-insured, New York State-chartered bank and a member of the Federal Reserve System and the FDIC, is regulated by the Federal Reserve Board and the New York State Banking Department and is subject to minimum capital requirements (described further below) that are calculated in a manner similar to those applicable to bank holding companies. A number of our activities are conducted partially or entirely through GS Bank USA and its subsidiaries, including: origination of and market making in bank loans; interest rate, credit, currency and other derivatives; leveraged finance; commercial and residential mortgage origination, trading and servicing; structured finance; and agency lending, custody and hedge fund administration services. These activities are subject to regulation by the Federal Reserve Board, the New York State Banking Department and the FDIC.
The Dodd-Frank Act contains "derivative push-out" provisions that, beginning in July 2012, will essentially prevent us from conducting certain swaps-related activities through GS Bank USA or another insured depository institution subsidiary, subject to exceptions for certain interest rate and currency swaps and for hedging or risk mitigation activities directly related to the bank's business. These precluded activities may be conducted elsewhere within the firm, subject to certain requirements.
Transactions with Affiliates
Transactions between GS Bank USA and Group Inc. and its subsidiaries and affiliates are regulated by the Federal Reserve Board. These regulations limit the types and amounts of transactions (including loans to and credit extensions from GS Bank USA) that may take place and generally require those transactions to be on an arm's-length basis. These regulations generally do not apply to transactions between GS Bank USA and its subsidiaries. The Dodd-Frank Act significantly expands the coverage and scope of the regulations that limit affiliate transactions within a banking organization, including coverage of the credit exposure on derivative transactions, repurchase and reverse repurchase agreements, securities borrowing and lending transactions, and transactions with sponsored hedge funds and private equity funds.
In November 2008, Group Inc. transferred assets and operations to GS Bank USA. In connection with this transfer, Group Inc. entered into a guarantee agreement with GS Bank USA whereby Group Inc. agreed to (i) purchase from GS Bank USA certain transferred assets (other than derivatives and mortgage servicing rights) or reimburse GS Bank USA for certain losses relating to those assets; (ii) reimburse GS Bank USA for credit-related losses from assets transferred to GS Bank USA; (iii) protect GS Bank USA or reimburse it for certain losses arising from derivatives and mortgage servicing rights transferred to GS Bank USA; and (iv) pledge collateral to GS Bank USA.
The Dodd-Frank Act will require us to prepare and provide to regulators a resolution plan (a so-called "living will") that must, among other things, ensure that our depository institution subsidiaries are adequately protected from risks arising from our other subsidiaries. The establishment and maintenance of this resolution plan may, as a practical matter, present additional constraints on our entity structure and transactions among our subsidiaries.
12
Deposit Insurance
GS Bank USA accepts deposits, and those deposits have the benefit of FDIC insurance up to the applicable limits. The FDIC's Deposit Insurance Fund is funded by assessments on insured depository institutions, such as GS Bank USA, and these assessments are currently based on the risk category of an institution and the amount of insured deposits that it holds. The FDIC required all insured depository institutions to prepay estimated assessments for all of 2010, 2011 and 2012 on December 30, 2009. The FDIC may increase or decrease the assessment rate schedule on a semi-annual basis. In accordance with the Dodd-Frank Act, the FDIC amended its regulations, effective April 1, 2011, to base insurance assessments on the average total consolidated assets less the average tangible equity of the insured depository institution during the assessment period.
Prompt Corrective Action
The U.S. Federal Deposit Insurance Corporation Improvement Act of 1991 (FDICIA), among other things, requires the federal banking agencies to take "prompt corrective action" in respect of depository institutions that do not meet specified capital requirements. FDICIA establishes five capital categories for FDIC-insured banks: well-capitalized, adequately capitalized, undercapitalized, significantly undercapitalized and critically undercapitalized.
A depository institution is generally deemed to be "well-capitalized," the highest category, if it has a Tier 1 capital ratio of at least 6%, a total capital ratio of at least 10% and a Tier 1 leverage ratio of at least 5%. In connection with the November 2008 asset transfer described under "Transactions with Affiliates" below, GS Bank USA agreed with the Federal Reserve Board to maintain minimum capital ratios in excess of these "well-capitalized" levels.
See Note 20 to the consolidated financial statements in Part II, Item 8 of this Form 10-K for information on the calculation of GS Bank USA's capital ratios under Basel 1 and for a discussion of minimum required ratios.
GS Bank USA computes its capital ratios in accordance with the regulatory capital requirements currently applicable to state member banks, which are based on Basel 1 as implemented by the Federal Reserve Board. An institution may be downgraded to, or deemed to be in, a capital category that is lower than is indicated by its capital ratios if it is determined to be in an unsafe or unsound condition or if it receives an unsatisfactory examination rating with respect to certain matters. FDICIA imposes progressively more restrictive constraints on operations, management and capital distributions, as the capital category of an institution
declines. Failure to meet the capital requirements could also subject a depository institution to capital raising requirements. Ultimately, critically undercapitalized institutions are subject to the appointment of a receiver or conservator.
The prompt corrective action regulations apply only to depository institutions and not to bank holding companies such as Group Inc. However, the Federal Reserve Board is authorized to take appropriate action at the holding company level, based upon the undercapitalized status of the holding company's depository institution subsidiaries. In certain instances relating to an undercapitalized depository institution subsidiary, the bank holding company would be required to guarantee the performance of the undercapitalized subsidiary's capital restoration plan and might be liable for civil money damages for failure to fulfill its commitments on that guarantee. Furthermore, in the event of the bankruptcy of the holding company, the guarantee would take priority over the holding company's general unsecured creditors.
Insolvency of an Insured Depository Institution or a Bank Holding Company
If the FDIC is appointed the conservator or receiver of an insured depository institution such as GS Bank USA, upon its insolvency or in certain other events, the FDIC has the power:
| • | to transfer any of the depository institution's assets and liabilities to a new obligor without the approval of the depository institution's creditors; |
| • | to enforce the terms of the depository institution's contracts pursuant to their terms; or |
| • | to repudiate or disaffirm any contract or lease to which the depository institution is a party, the performance of which is determined by the FDIC to be burdensome and the disaffirmance or repudiation of which is determined by the FDIC to promote the orderly administration of the depository institution. |
In addition, under federal law, the claims of holders of deposit liabilities and certain claims for administrative expenses against an insured depository institution would be afforded a priority over other general unsecured claims against such an institution, including claims of debt holders of the institution, in the "liquidation or other resolution" of such an institution by any receiver. As a result, whether or not the FDIC ever sought to repudiate any debt obligations of GS Bank USA, the debt holders would be treated differently from, and could receive, if anything, substantially less than, the depositors of the depository institution.
13
The Dodd-Frank Act creates a resolution regime for systemically important non-bank financial companies, including bank holding companies and their affiliates, under which the FDIC may be appointed receiver to liquidate the entity. This resolution authority was based on the FDIC resolution model for depository institutions, with certain modifications to reflect differences between depository institutions and non-bank financial companies and to reduce disparities between the treatment of creditors' claims under the U.S. Bankruptcy Code and in an orderly liquidation authority proceeding compared to those that would exist under the resolution model for depository institutions.
Trust Companies
Group Inc.'s two limited purpose trust company subsidiaries are not permitted to and do not accept deposits or make loans (other than as incidental to their trust activities) and, as a result, are not insured by the FDIC. The Goldman Sachs Trust Company, N.A., a national banking association that is limited to fiduciary activities, is regulated by the Office of the Comptroller of the Currency and is a member bank of the Federal Reserve System. The Goldman Sachs Trust Company of Delaware, a Delaware limited purpose trust company, is regulated by the Office of the Delaware State Bank Commissioner.
U.S. Securities and Commodities Regulation
Goldman Sachs' broker-dealer subsidiaries are subject to regulations that cover all aspects of the securities business, including sales methods, trade practices, use and safekeeping of clients' funds and securities, capital structure, recordkeeping, the financing of clients' purchases, and the conduct of directors, officers and employees. In the United States, the SEC is the federal agency responsible for the administration of the federal securities laws. GS&Co. is registered as a broker-dealer, a municipal advisor and an investment adviser with the SEC and as a broker-dealer in all 50 states and the District of Columbia. Self-regulatory organizations, such as FINRA and the NYSE, adopt rules that apply to, and examine, broker-dealers such as GS&Co.
In addition, state securities and other regulators also have regulatory or oversight authority over GS&Co. Similarly, our businesses are also subject to regulation by various non-U.S. governmental and regulatory bodies and self-regulatory authorities in virtually all countries where we have offices. Goldman Sachs Execution & Clearing, L.P. (GSEC) and one of its subsidiaries are registered U.S. broker-dealers and are
regulated by the SEC, the NYSE and FINRA. Goldman Sachs Financial Markets, L.P. is registered with the SEC as an OTC derivatives dealer and conducts certain OTC derivatives activities.
The commodity futures and commodity options industry in the United States is subject to regulation under the U.S. Commodity Exchange Act (CEA). The CFTC is the federal agency charged with the administration of the CEA. Several of Goldman Sachs' subsidiaries, including GS&Co. and GSEC, are registered with the CFTC and act as futures commission merchants, commodity pool operators or commodity trading advisors and are subject to CEA regulations. The rules and regulations of various self-regulatory organizations, such as the Chicago Board of Trade and the Chicago Mercantile Exchange, other futures exchanges and the National Futures Association, also govern the commodity futures and commodity options activities of these entities.
For a discussion of net capital requirements applicable to GS&Co. and GSEC, see Note 20 to the consolidated financial statements in Part II, Item 8 of this Form 10-K.
Our exchange-based market-making activities are subject to extensive regulation by a number of securities exchanges. As a DMM on the NYSE and as a market maker on other exchanges, we are required to maintain orderly markets in the securities to which we are assigned. Under the NYSE's DMM rules, this may require us to supply liquidity to these markets in certain circumstances.
J. Aron & Company is authorized by the U.S. Federal Energy Regulatory Commission (FERC) to sell wholesale physical power at market-based rates. As a FERC-authorized power marketer, J. Aron & Company is subject to regulation under the U.S. Federal Power Act and FERC regulations and to the oversight of FERC. As a result of our investing activities, GS&Co. is also an "exempt holding company" under the U.S. Public Utility Holding Company Act of 2005 and applicable FERC rules.
In addition, as a result of our power-related and commodities activities, we are subject to extensive and evolving energy, environmental and other governmental laws and regulations, as discussed under "Risk Factors - Our commodities activities, particularly our power generation interests and our physical commodities activities, subject us to extensive regulation, potential catastrophic events and environmental, reputational and other risks that may expose us to significant liabilities and costs" in Part I, Item 1A of this Form 10-K.
14
The Dodd-Frank Act will result in additional regulation of our broker-dealer and regulated subsidiaries in a number of respects. The legislation calls for the imposition of expanded standards of care by market participants in dealing with clients and customers, including by providing the SEC with authority to adopt rules establishing fiduciary duties for broker-dealers and directing the SEC to examine and improve sales practices and disclosure by broker-dealers and investment advisers. The Dodd-Frank Act also contains provisions designed to increase transparency in over-the-counter derivatives markets by requiring the registration of all swap dealers and security-based swap dealers, and the clearing and execution of "swaps" through regulated facilities (subject to limited exceptions, including swaps with non-financial end users and swaps that are not cleared by a clearing agency). Furthermore, federal banking agencies are required under the Dodd-Frank Act to develop rules whereby anyone who organizes or initiates an asset-backed security transaction must retain a portion (generally, at least five percent) of any credit risk that the person conveys to a third party.
Other Regulation in the United States
Our U.S. insurance subsidiaries are subject to state insurance regulation and oversight in the states in which they are domiciled and in the other states in which they are licensed, and Group Inc. is subject to oversight as an insurance holding company in states where our insurance subsidiaries are domiciled. State insurance regulations limit the ability of our insurance subsidiaries to pay dividends to Group Inc. in certain circumstances, and could require regulatory approval for any change in "control" of Group Inc., which may include control of 10% or more of our voting stock. In addition, a number of our other activities, including our lending and mortgage activities, require us to obtain licenses, adhere to applicable regulations and be subject to the oversight of various regulators in the states in which we conduct these activities.
The U.S. Bank Secrecy Act (BSA), as amended by the USA PATRIOT Act of 2001 (PATRIOT Act), contains anti-money laundering and financial transparency laws and mandated the implementation of various regulations applicable to all financial institutions, including standards for verifying client identification at account opening, and obligations to monitor client transactions and report suspicious activities. Through these and other provisions, the BSA and the PATRIOT Act seek to promote the identification of parties that may be involved in terrorism, money laundering or other suspicious activities. Anti-money laundering laws outside the United States contain some similar
provisions. The obligation of financial institutions, including Goldman Sachs, to identify their clients, to monitor for and report suspicious transactions, to respond to requests for information by regulatory authorities and law enforcement agencies, and to share information with other financial institutions, has required the implementation and maintenance of internal practices, procedures and controls that have increased, and may continue to increase, our costs, and any failure with respect to our programs in this area could subject us to substantial liability and regulatory fines.
Regulation Outside the United States
Goldman Sachs provides investment services in and from the United Kingdom under the regulation of the FSA. Goldman Sachs International (GSI), our regulated U.K. broker-dealer, is subject to the capital requirements imposed by the FSA. Other subsidiaries, including Goldman Sachs International Bank (GSIB), our regulated U.K. bank, are also regulated by the FSA. As of December 2010, GSI and GSIB were in compliance with the FSA capital requirements.
Goldman Sachs Bank (Europe) PLC (GS Bank Europe), our regulated Irish bank, is subject to minimum capital requirements imposed by the Central Bank of Ireland. As of December 2010, this bank was in compliance with all regulatory capital requirements. Group Inc. has issued a general guarantee of the obligations of this bank.
Various other Goldman Sachs entities are regulated by the banking, insurance and securities regulatory authorities of the European countries in which they operate, including, among others, the Federal Financial Supervisory Authority (BaFin) and the Bundesbank in Germany, the Autorité de Contrôle Prudentiel and the Autorité des Marchés Financiers in France, Banca d'Italia and the Commissione Nazionale per le Società e la Borsa (CONSOB) in Italy, the Federal Financial Markets Service and the Central Bank of the Russian Federation in Russia and the Swiss Financial Market Supervisory Authority. Certain Goldman Sachs entities are also regulated by the European securities, derivatives and commodities exchanges of which they are members.
15
The investment services that are subject to oversight by the FSA and other regulators within the European Union (EU) are regulated in accordance with national laws, many of which implement EU directives requiring, among other things, compliance with certain capital adequacy standards, customer protection requirements and market conduct and trade reporting rules. These standards, requirements and rules are generally implemented in a similar manner, under the same directives, throughout the EU.
The EU has adopted risk retention requirements applicable to asset-backed security offerings similar to those required under the Dodd-Frank Act, as well as enhanced disclosure requirements applicable to such offerings.
Goldman Sachs Japan Co., Ltd. (GSJCL), our regulated Japanese broker-dealer, is subject to the capital requirements imposed by Japan's Financial Services Agency. As of December 2010, GSJCL was in compliance with its capital adequacy requirements. GSJCL is also regulated by the Tokyo Stock Exchange, the Osaka Securities Exchange, the Tokyo Financial Exchange, the Japan Securities Dealers Association, the Tokyo Commodity Exchange and the Ministry of Economy, Trade and Industry in Japan.
Also in Asia, the Securities and Futures Commission in Hong Kong, the Monetary Authority of Singapore, the China Securities Regulatory Commission, the Korean Financial Supervisory Service, the Reserve Bank of India and the Securities and Exchange Board of India, among others, regulate various of our subsidiaries and also have capital standards and other requirements comparable to the rules of the SEC.
Various Goldman Sachs entities are regulated by the banking and regulatory authorities in countries in which Goldman Sachs operates, including, among others, Brazil and Dubai. In addition, certain of our insurance subsidiaries are regulated by the FSA and certain are regulated by the Bermuda Monetary Authority.
Regulations Applicable in and Outside the United States
The U.S. and non-U.S. government agencies, regulatory bodies and self-regulatory organizations, as well as state securities commissions and other state regulators in the United States, are empowered to conduct administrative proceedings that can result in censure, fine, the issuance of cease and desist orders, or the suspension or expulsion of a broker-dealer or its directors, officers or employees. From time to time, our subsidiaries have been subject to investigations and proceedings, and sanctions have been imposed for infractions of various regulations relating to our activities.
The SEC and FINRA have rules governing research analysts, including rules imposing restrictions on the interaction between equity research analysts and investment banking personnel at member securities firms. Various non-U.S. jurisdictions have imposed both substantive and disclosure-based requirements with respect to research and may impose additional regulations.
Our investment management business is subject to significant regulation in numerous jurisdictions around the world relating to, among other things, the safeguarding of client assets and our management of client funds.
As discussed above, many of our subsidiaries are subject to regulatory capital requirements in jurisdictions throughout the world. Subsidiaries not subject to separate regulation may hold capital to satisfy local tax guidelines, rating agency requirements or internal policies, including policies concerning the minimum amount of capital a subsidiary should hold based upon its underlying risk.
Certain of our businesses are subject to compliance with regulations enacted by U.S. federal and state governments, the EU or other jurisdictions and/or enacted by various regulatory organizations or exchanges relating to the privacy of the information of clients, employees or others, and any failure to comply with these regulations could expose us to liability and/or reputational damage.
16
Available Information
Our internet address is www.gs.com and the investor relations section of our web site is located at www.gs.com/shareholders . We make available free of charge through the investor relations section of our web site, annual reports on Form 10-K, quarterly reports on Form 10-Q and current reports on Form 8-K and amendments to those reports filed or furnished pursuant to Section 13(a) or 15(d) of the U.S. Securities Exchange Act of 1934 (Exchange Act), as well as proxy statements, as soon as reasonably practicable after we electronically file such material with, or furnish it to, the SEC. Also posted on our web site, and available in print upon request of any shareholder to our Investor Relations Department, are our certificate of incorporation and by-laws, charters for our Audit Committee, Risk Committee, Compensation Committee, and Corporate Governance and Nominating Committee, our Policy Regarding Director Independence Determinations, our Policy on Reporting of Concerns Regarding Accounting and Other Matters, our Corporate Governance Guidelines and our Code of Business Conduct and Ethics governing our directors, officers and employees. Within the time period required by the SEC, we will post on our web site any amendment to the Code of Business Conduct and Ethics and any waiver applicable to any executive officer, director or senior financial officer (as defined in the Code).
In addition, our web site includes information concerning purchases and sales of our equity securities by our executive officers and directors, as well as disclosure relating to certain non-GAAP financial measures (as defined in the SEC's Regulation G) that we may make public orally, telephonically, by webcast, by broadcast or by similar means from time to time.
Our Investor Relations Department can be contacted at The Goldman Sachs Group, Inc., 200 West Street, 29th Floor, New York, New York 10282, Attn: Investor Relations, telephone: 212-902-0300, e-mail: [email protected] .
Cautionary Statement Pursuant to the U.S. Private Securities Litigation Reform Act of 1995
We have included or incorporated by reference in this Form 10-K, and from time to time our management may make, statements that may constitute "forward-looking statements" within the meaning of the safe harbor provisions of the U.S. Private Securities Litigation Reform Act of 1995. Forward-looking statements are not historical facts, but instead represent only our
beliefs regarding future events, many of which, by their nature, are inherently uncertain and outside our control. These statements include statements other than historical information or statements of current condition and may relate to our future plans and objectives and results, among other things, and may also include our belief regarding the effect of changes to the capital and leverage rules applicable to bank holding companies, the impact of the Dodd-Frank Act on our businesses and operations, and various legal proceedings as set forth under "Legal Proceedings" in Note 30 to the consolidated financial statements in Part II, Item 8 of this Form 10-K, as well as statements about the objectives and effectiveness of our risk management and liquidity policies, statements about trends in or growth opportunities for our businesses, statements about our future status, activities or reporting under U.S. or non-U.S. banking and financial regulation, and statements about our investment banking transaction backlog.
By identifying these statements for you in this manner, we are alerting you to the possibility that our actual results and financial condition may differ, possibly materially, from the anticipated results and financial condition indicated in these forward-looking statements. Important factors that could cause our actual results and financial condition to differ from those indicated in the forward-looking statements include, among others, those discussed below and under "Risk Factors" in Part I, Item 1A of this Form 10-K.
In the case of statements about our investment banking transaction backlog, such statements are subject to the risk that the terms of these transactions may be modified or that they may not be completed at all; therefore, the net revenues, if any, that we actually earn from these transactions may differ, possibly materially, from those currently expected. Important factors that could result in a modification of the terms of a transaction or a transaction not being completed include, in the case of underwriting transactions, a decline or continued weakness in general economic conditions, outbreak of hostilities, volatility in the securities markets generally or an adverse development with respect to the issuer of the securities and, in the case of financial advisory transactions, a decline in the securities markets, an inability to obtain adequate financing, an adverse development with respect to a party to the transaction or a failure to obtain a required regulatory approval. For a discussion of other important factors that could adversely affect our investment banking transactions, see "Risk Factors" in Part I, Item 1A of this Form 10-K.
17
| Item 1A. | Risk Factors |
We face a variety of risks that are substantial and inherent in our businesses, including market, liquidity, credit, operational, legal, regulatory and reputational risks. The following are some of the more important factors that could affect our businesses.
Our businesses have been and may continue to be adversely affected by conditions in the global financial markets and economic conditions generally.
Our businesses, by their nature, do not produce predictable earnings, and all of our businesses are materially affected by conditions in the global financial markets and economic conditions generally. In the past several years, these conditions have changed suddenly and, for a period of time, very negatively. In 2008 and through early 2009, the financial services industry and the securities markets generally were materially and adversely affected by significant declines in the values of nearly all asset classes and by a serious lack of liquidity.
Since 2008, governments, regulators and central banks in the United States and worldwide have taken numerous steps to increase liquidity and to restore investor and public confidence. In addition, there are numerous legislative and regulatory actions that have been taken to deal with what regulators, politicians and others believe to be the root causes of the financial crisis, including laws and regulations relating to financial institution capital requirements and compensation practices, restrictions on the type of activities in which financial institutions are permitted to engage, and generally increased regulatory scrutiny. In some cases, additional taxes have been (or have been proposed to be) imposed on certain financial institutions. Many of the regulations that are required to implement recently adopted legislation (including the Dodd-Frank Act) are still being drafted or are not yet in effect; therefore, the exact impact that these regulations will have on our businesses, results of operations and cash flows is presently unclear.
Business activity across a wide range of industries and regions has been greatly reduced and many companies were, and some continue to be, in serious difficulty due to reduced consumer spending and low levels of liquidity in the credit markets. National and local governments are facing difficult financial conditions due to significant reductions in tax revenues, particularly from corporate and personal income taxes, as well as increased outlays for unemployment benefits due to high unemployment levels and the cost of stimulus programs.
Declines in asset values, the lack of liquidity, reduced volatility, general uncertainty about economic and market activities and a lack of consumer, investor and CEO confidence have negatively impacted many of our businesses.
Our financial performance is highly dependent on the environment in which our businesses operate. A favorable business environment is generally characterized by, among other factors, high global gross domestic product growth, transparent, liquid and efficient capital markets, low inflation, high business and investor confidence, stable geopolitical conditions, and strong business earnings. Unfavorable or uncertain economic and market conditions can be caused by: declines in economic growth, business activity or investor or business confidence; limitations on the availability or increases in the cost of credit and capital; increases in inflation, interest rates, exchange rate volatility, default rates or the price of basic commodities; outbreaks of hostilities or other geopolitical instability; corporate, political or other scandals that reduce investor confidence in capital markets; natural disasters or pandemics; or a combination of these or other factors.
The business environment continued to improve during 2010, although there were several periods of market disruption, but there can be no assurance that these conditions will continue in the near or long term. If they do not, our results of operations may be adversely affected.
18
Our businesses have been and may be adversely affected by declining asset values. This is particularly true for those businesses in which we have net "long" positions, receive fees based on the value of assets managed, or receive or post collateral.
Many of our businesses have net "long" positions in debt securities, loans, derivatives, mortgages, equities (including private equity and real estate) and most other asset classes. These include positions we take when we act as a principal to facilitate our clients' activities, including our exchange-based market-making activities, or commit large amounts of capital to maintain positions in interest rate and credit products, as well as through our currencies, commodities and equities activities. Because nearly all of these investing, lending and market-making positions are marked-to-market on a daily basis, declines in asset values directly and immediately impact our earnings, unless we have effectively "hedged" our exposures to such declines. In certain circumstances (particularly in the case of leveraged loans and private equities or other securities that are not freely tradable or lack established and liquid trading markets), it may not be possible or economic to hedge such exposures and to the extent that we do so the hedge may be ineffective or may greatly reduce our ability to profit from increases in the values of the assets. Sudden declines and significant volatility in the prices of assets may substantially curtail or eliminate the trading markets for certain assets, which may make it very difficult to sell, hedge or value such assets. The inability to sell or effectively hedge assets reduces our ability to limit losses in such positions and the difficulty in valuing assets may require us to maintain additional capital and increase our funding costs.
In our exchange-based market-making activities, we are obligated by stock exchange rules to maintain an orderly market, including by purchasing shares in a declining market. In markets where asset values are declining and in volatile markets, this results in losses and an increased need for liquidity.
We receive asset-based management fees based on the value of our clients' portfolios or investment in funds managed by us and, in some cases, we also receive incentive fees based on increases in the value of such investments. Declines in asset values reduce the value of our clients' portfolios or fund assets, which in turn reduce the fees we earn for managing such assets.
We post collateral to support our obligations and receive collateral to support the obligations of our clients and counterparties in connection with our client execution businesses. When the value of the assets posted as collateral declines, the party posting the collateral may need to provide additional collateral or, if possible, reduce its trading position. A classic example of such a situation is a "margin call" in connection with a brokerage account. Therefore, declines in the value of asset classes used as collateral mean that either the cost of funding positions is increased or the size of positions is decreased. If we are the party providing collateral, this can increase our costs and reduce our profitability and if we are the party receiving collateral, this can also reduce our profitability by reducing the level of business done with our clients and counterparties. In addition, volatile or less liquid markets increase the difficulty of valuing assets which can lead to costly and time-consuming disputes over asset values and the level of required collateral, as well as increased credit risk to the recipient of the collateral due to delays in receiving adequate collateral.
Our businesses have been and may be adversely affected by disruptions in the credit markets, including reduced access to credit and higher costs of obtaining credit.
Widening credit spreads, as well as significant declines in the availability of credit, have in the past adversely affected our ability to borrow on a secured and unsecured basis and may do so in the future. We fund ourselves on an unsecured basis by issuing long-term debt, promissory notes and commercial paper, by accepting deposits at our bank subsidiaries or by obtaining bank loans or lines of credit. We seek to finance many of our assets on a secured basis, including by entering into repurchase agreements. Any disruptions in the credit markets may make it harder and more expensive to obtain funding for our businesses. If our available funding is limited or we are forced to fund our operations at a higher cost, these conditions may require us to curtail our business activities and increase our cost of funding, both of which could reduce our profitability, particularly in our businesses that involve investing, lending and market making.
19
Our clients engaging in mergers and acquisitions often rely on access to the secured and unsecured credit markets to finance their transactions. A lack of available credit or an increased cost of credit can adversely affect the size, volume and timing of our clients' merger and acquisition transactions - particularly large transactions - and adversely affect our financial advisory and underwriting businesses.
In addition, we may incur significant unrealized gains or losses due solely to changes in our credit spreads or those of third parties, as these changes may affect the fair value of our derivative instruments and the debt securities that we hold or issue.
Our market-making activities have been and may be affected by changes in the levels of market volatility.
Certain of our market-making activities depend on market volatility to provide trading and arbitrage opportunities to our clients, and decreases in volatility may reduce these opportunities and adversely affect the results of these activities. On the other hand, increased volatility, while it can increase trading volumes and spreads, also increases risk as measured by Value-at-Risk (VaR) and may expose us to increased risks in connection with our market-making activities or cause us to reduce our market-making positions in order to avoid increasing our VaR. Limiting the size of our market-making positions can adversely affect our profitability, even though spreads are widening and we may earn more on each trade. In periods when volatility is increasing, but asset values are declining significantly, it may not be possible to sell assets at all or it may only be possible to do so at steep discounts. In such circumstances we may be forced to either take on additional risk or to incur losses in order to decrease our VaR. In addition, increases in volatility increase the level of our risk weighted assets and increase our capital requirements, both of which in turn increase our funding costs.
Our investment banking, client execution and investment management businesses have been adversely affected and may continue to be adversely affected by market uncertainty or lack of confidence among investors and CEOs due to general declines in economic activity and other unfavorable economic, geopolitical or market conditions.
Our investment banking business has been and may continue to be adversely affected by market conditions. Poor economic conditions and other adverse geopolitical conditions can adversely affect and have adversely affected investor and CEO confidence, resulting in significant industry-wide declines in the size and number of underwritings and of financial advisory transactions, which could have an adverse effect on our revenues and our profit margins. In particular, because a significant portion of our investment banking revenues is derived from our participation in large transactions, a decline in the number of large transactions would adversely affect our investment banking business.
In certain circumstances, market uncertainty or general declines in market or economic activity may affect our client execution businesses by decreasing levels of overall activity or by decreasing volatility, but at other times market uncertainty and even declining economic activity may result in higher trading volumes or higher spreads or both.
Market uncertainty, volatility and adverse economic conditions, as well as declines in asset values, may cause our clients to transfer their assets out of our funds or other products or their brokerage accounts and result in reduced net revenues, principally in our investment management business. To the extent that clients do not withdraw their funds, they may invest them in products that generate less fee income.
20
Our investment management business may be affected by the poor investment performance of our investment products.
Poor investment returns in our investment management business, due to either general market conditions or underperformance (relative to our competitors or to benchmarks) by funds or accounts that we manage or investment products that we design or sell, affects our ability to retain existing assets and to attract new clients or additional assets from existing clients. This could affect the management and incentive fees that we earn on assets under management or the commissions that we earn for selling other investment products, such as structured notes or derivatives.
We may incur losses as a result of ineffective risk management processes and strategies.
We seek to monitor and control our risk exposure through a risk and control framework encompassing a variety of separate but complementary financial, credit, operational, compliance and legal reporting systems, internal controls, management review processes and other mechanisms. Our risk management process seeks to balance our ability to profit from market-making, investing or lending positions with our exposure to potential losses. While we employ a broad and diversified set of risk monitoring and risk mitigation techniques, those techniques and the judgments that accompany their application cannot anticipate every economic and financial outcome or the specifics and timing of such outcomes. Thus, we may, in the course of our activities, incur losses. Market conditions in recent years have involved unprecedented dislocations and highlight the limitations inherent in using historical data to manage risk.
The models that we use to assess and control our risk exposures reflect assumptions about the degrees of correlation or lack thereof among prices of various asset classes or other market indicators. In times of market stress or other unforeseen circumstances, such as occurred during 2008 and early 2009, previously uncorrelated indicators may become correlated, or conversely previously correlated indicators may move in different directions. These types of market movements have at times limited the effectiveness of our hedging strategies and have caused us to incur significant losses, and they may do so in the future. These changes in correlation can be exacerbated where other market participants are using risk or trading models with assumptions or algorithms that are similar to ours. In these and other cases, it may be difficult to reduce our risk positions due to the activity of other market participants or widespread market
dislocations, including circumstances where asset values are declining significantly or no market exists for certain assets.
To the extent that we have positions through our market-making or origination activities or we make investments directly through our investing activities in securities, including private equity, that do not have an established liquid trading market or are otherwise subject to restrictions on sale or hedging, we may not be able to reduce our positions and therefore reduce our risk associated with such positions. In addition, we invest our own capital in private equity, debt, real estate and hedge funds that we manage and limitations on our ability to withdraw some or all of our investments in these funds, whether for legal, reputational or other reasons, may make it more difficult for us to control the risk exposures relating to these investments.
For a further discussion of our risk management policies and procedures, see "Management's Discussion and Analysis of Financial Condition and Results of Operations - Risk Management" in Part II, Item 7 of this Form 10-K.
Our liquidity, profitability and businesses may be adversely affected by an inability to access the debt capital markets or to sell assets or by a reduction in our credit ratings or by an increase in our credit spreads.
Liquidity is essential to our businesses. Our liquidity may be impaired by an inability to access secured and/or unsecured debt markets, an inability to access funds from our subsidiaries, an inability to sell assets or redeem our investments, or unforeseen outflows of cash or collateral. This situation may arise due to circumstances that we may be unable to control, such as a general market disruption or an operational problem that affects third parties or us, or even by the perception among market participants that we, or other market participants, are experiencing greater liquidity risk.
The financial instruments that we hold and the contracts to which we are a party are complex, as we employ structured products to benefit our clients and ourselves, and these complex structured products often do not have readily available markets to access in times of liquidity stress. Our investing and lending activities may lead to situations where the holdings from these activities represent a significant portion of specific markets, which could restrict liquidity for our positions.
21
Further, our ability to sell assets may be impaired if other market participants are seeking to sell similar assets at the same time, as is likely to occur in a liquidity or other market crisis. In addition, financial institutions with which we interact may exercise set-off rights or the right to require additional collateral, including in difficult market conditions, which could further impair our access to liquidity.
Our credit ratings are important to our liquidity. A reduction in our credit ratings could adversely affect our liquidity and competitive position, increase our borrowing costs, limit our access to the capital markets or trigger our obligations under certain provisions in some of our trading and collateralized financing contracts. Under these provisions, counterparties could be permitted to terminate contracts with Goldman Sachs or require us to post additional collateral. Termination of our trading and collateralized financing contracts could cause us to sustain losses and impair our liquidity by requiring us to find other sources of financing or to make significant cash payments or securities movements. Certain rating agencies have indicated that the Dodd-Frank Act could result in the rating agencies reducing their assumed level of government support and therefore result in ratings downgrades for certain large financial institutions, including Goldman Sachs.
Our cost of obtaining long-term unsecured funding is directly related to our credit spreads (the amount in excess of the interest rate of U.S. Treasury securities (or other benchmark securities) of the same maturity that we need to pay to our debt investors). Increases in our credit spreads can significantly increase our cost of this funding. Changes in credit spreads are continuous, market-driven, and subject at times to unpredictable and highly volatile movements. Credit spreads are influenced by market perceptions of our creditworthiness. In addition, our credit spreads may be influenced by movements in the costs to purchasers of credit default swaps referenced to our long-term debt. The market for credit default swaps, although very large, has proven to be extremely volatile and currently lacks a high degree of structure or transparency.
Conflicts of interest are increasing and a failure to appropriately identify and address conflicts of interest could adversely affect our businesses.
As we have expanded the scope of our businesses and our client base, we increasingly must address potential conflicts of interest, including situations where our services to a particular client or our own investments or other interests conflict, or are perceived to conflict, with the interests of another client, as well as situations where one or more of our businesses have access to material non-public information that may not be shared with other businesses within the firm and situations where we may be a creditor of an entity with which we also have an advisory or other relationship.
In addition, our status as a bank holding company subjects us to heightened regulation and increased regulatory scrutiny by the Federal Reserve Board with respect to transactions between GS Bank USA and entities that are or could be viewed as affiliates of ours.
We have extensive procedures and controls that are designed to identify and address conflicts of interest, including those designed to prevent the improper sharing of information among our businesses. However, appropriately identifying and dealing with conflicts of interest is complex and difficult, and our reputation, which is one of our most important assets, could be damaged and the willingness of clients to enter into transactions with us may be affected if we fail, or appear to fail, to identify, disclose and deal appropriately with conflicts of interest. In addition, potential or perceived conflicts could give rise to litigation or regulatory enforcement actions.
22
Group Inc. is a holding company and is dependent for liquidity on payments from its subsidiaries, many of which are subject to restrictions.
Group Inc. is a holding company and, therefore, depends on dividends, distributions and other payments from its subsidiaries to fund dividend payments and to fund all payments on its obligations, including debt obligations. Many of our subsidiaries, including our broker-dealer, bank and insurance subsidiaries, are subject to laws that restrict dividend payments or authorize regulatory bodies to block or reduce the flow of funds from those subsidiaries to Group Inc. In addition, our broker-dealer, bank and insurance subsidiaries are subject to restrictions on their ability to lend or transact with affiliates and to minimum regulatory capital requirements, as well as restrictions on their ability to use funds deposited with them in brokerage or bank accounts to fund their businesses. Additional restrictions on related-party transactions, increased capital requirements and additional limitations on the use of funds on deposit in bank or brokerage accounts, as well as lower earnings, can reduce the amount of funds available to meet the obligations of Group Inc. and even require Group Inc. to provide additional funding to such subsidiaries. Restrictions or regulatory action of that kind could impede access to funds that Group Inc. needs to make payments on its obligations, including debt obligations, or dividend payments. In addition, Group Inc.'s right to participate in a distribution of assets upon a subsidiary's liquidation or reorganization is subject to the prior claims of the subsidiary's creditors.
Furthermore, Group Inc. has guaranteed the payment obligations of certain of its subsidiaries, including GS&Co., GS Bank USA, GS Bank Europe and Goldman Sachs Execution & Clearing, L.P. subject to certain exceptions, and has pledged significant assets to GS Bank USA to support obligations to GS Bank USA. In addition, Group Inc. guarantees many of the obligations of its other consolidated subsidiaries on a transaction-by-transaction basis, as negotiated with counterparties. These guarantees may require Group Inc. to provide substantial funds or assets to its subsidiaries or their creditors or counterparties at a time when Group Inc. is in need of liquidity to fund its own obligations. See "Business - Regulation" in Part I, Item 1 of this Form 10-K for a further discussion of regulatory restrictions.
Our businesses, profitability and liquidity may be adversely affected by deterioration in the credit quality of, or defaults by, third parties who owe us money, securities or other assets or whose securities or obligations we hold.
We are exposed to the risk that third parties that owe us money, securities or other assets will not perform their obligations. These parties may default on their obligations to us due to bankruptcy, lack of liquidity, operational failure or other reasons. A failure of a significant market participant, or even concerns about a default by such an institution, could lead to significant liquidity problems, losses or defaults by other institutions, which in turn could adversely affect us.
We are also subject to the risk that our rights against third parties may not be enforceable in all circumstances. In addition, deterioration in the credit quality of third parties whose securities or obligations we hold could result in losses and/or adversely affect our ability to rehypothecate or otherwise use those securities or obligations for liquidity purposes. A significant downgrade in the credit ratings of our counterparties could also have a negative impact on our results. While in many cases we are permitted to require additional collateral from counterparties that experience financial difficulty, disputes may arise as to the amount of collateral we are entitled to receive and the value of pledged assets. The termination of contracts and the foreclosure on collateral may subject us to claims for the improper exercise of our rights. Default rates, downgrades and disputes with counterparties as to the valuation of collateral increase significantly in times of market stress and illiquidity.
As part of our clearing and prime brokerage activities, we finance our clients' positions, and we could be held responsible for the defaults or misconduct of our clients. Although we regularly review credit exposures to specific clients and counterparties and to specific industries, countries and regions that we believe may present credit concerns, default risk may arise from events or circumstances that are difficult to detect or foresee.
23
Concentration of risk increases the potential for significant losses in our market-making, underwriting, investing and lending activities.
Concentration of risk increases the potential for significant losses in our market-making, underwriting, investing and lending activities. The number and size of such transactions may affect our results of operations in a given period. Moreover, because of concentration of risk, we may suffer losses even when economic and market conditions are generally favorable for our competitors. Disruptions in the credit markets can make it difficult to hedge these credit exposures effectively or economically. In addition, we extend large commitments as part of our credit origination activities. The Dodd-Frank Act will require issuers of asset-backed securities and any person who organizes and initiates an asset-backed securities transaction to retain economic exposure to the asset, which could significantly increase the cost to us of engaging in securitization activities. Our inability to reduce our credit risk by selling, syndicating or securitizing these positions, including during periods of market stress, could negatively affect our results of operations due to a decrease in the fair value of the positions, including due to the insolvency or bankruptcy of the borrower, as well as the loss of revenues associated with selling such securities or loans.
In the ordinary course of business, we may be subject to a concentration of credit risk to a particular counterparty, borrower or issuer, including sovereign issuers, and a failure or downgrade of, or default by, such entity could negatively impact our businesses, perhaps materially, and the systems by which we set limits and monitor the level of our credit exposure to individual entities, industries and countries may not function as we have anticipated. While our activities expose us to many different industries and counterparties, we routinely execute a high volume of transactions with counterparties engaged in financial services activities, including brokers and dealers, commercial banks, clearing houses, exchanges and investment funds. This has resulted in significant credit concentration with respect to these counterparties. Provisions of the Dodd-Frank Act are expected to lead to increased centralization of trading activity through particular clearing houses, central agents or exchanges, which may increase our concentration of risk with respect to these entities.
The financial services industry is highly competitive.
The financial services industry and all of our businesses are intensely competitive, and we expect them to remain so. We compete on the basis of a number of factors, including transaction execution, our products and services, innovation, reputation, creditworthiness and price. Over time, there has been substantial consolidation and convergence among companies in the financial services industry. This trend accelerated over recent years as a result of numerous mergers and asset acquisitions among industry participants. This trend has also hastened the globalization of the securities and other financial services markets. As a result, we have had to commit capital to support our international operations and to execute large global transactions. To the extent we expand into new business areas and new geographic regions, we will face competitors with more experience and more established relationships with clients, regulators and industry participants in the relevant market, which could adversely affect our ability to expand. Governments and regulators have recently adopted regulations, imposed taxes or otherwise put forward various proposals that have or may impact our ability to conduct certain of our businesses in a cost-effective manner or at all in certain or all jurisdictions, including proposals relating to restrictions on the type of activities in which financial institutions are permitted to engage. These or other similar proposals, which may not apply to all our U.S. or non-U.S. competitors, could impact our ability to compete effectively.
Pricing and other competitive pressures in our businesses have continued to increase, particularly in situations where some of our competitors may seek to increase market share by reducing prices. For example, in connection with investment banking and other assignments, we have experienced pressure to extend and price credit at levels that may not always fully compensate us for the risks we take.
24
We face enhanced risks as new business initiatives lead us to transact with a broader array of clients and counterparties and expose us to new asset classes and new markets.
A number of our recent and planned business initiatives and expansions of existing businesses may bring us into contact, directly or indirectly, with individuals and entities that are not within our traditional client and counterparty base and expose us to new asset classes and new markets. For example, we are increasingly transacting business and investing in new regions, including a wider range of emerging and growth markets. Furthermore, in a number of our businesses, including where we make markets, invest and lend, we directly or indirectly own interests in, or otherwise become affiliated with the ownership and operation of public services, such as airports, toll roads and shipping ports, as well as power generation facilities, physical commodities and other commodities infrastructure components, both within and outside the United States. Recent market conditions may lead to an increase in opportunities to acquire distressed assets and we may determine opportunistically to increase our exposure to these types of assets.
These activities expose us to new and enhanced risks, including risks associated with dealing with governmental entities, reputational concerns arising from dealing with less sophisticated counterparties and investors, greater regulatory scrutiny of these activities, increased credit-related, sovereign and operational risks, risks arising from accidents or acts of terrorism, and reputational concerns with the manner in which these assets are being operated or held.
Derivative transactions and delayed settlements may expose us to unexpected risk and potential losses.
We are party to a large number of derivative transactions, including credit derivatives. Many of these derivative instruments are individually negotiated and non-standardized, which can make exiting, transferring or settling positions difficult. Many credit derivatives require that we deliver to the counterparty the underlying security, loan or other obligation in order to receive payment. In a number of cases, we do not hold the underlying security, loan or other obligation and may not be able to obtain the underlying security, loan or other obligation. This could cause us to forfeit the payments due to us under these contracts or result in settlement delays with the attendant credit and operational risk as well as increased costs to the firm. Derivative transactions may also involve the risk that they are not authorized or appropriate for a counterparty, that documentation has not been properly executed or that executed agreements may not be enforceable against the counterparty.
Derivative contracts and other transactions, including secondary bank loan purchases and sales, entered into with third parties are not always confirmed by the counterparties or settled on a timely basis. While the transaction remains unconfirmed or during any delay in settlement, we are subject to heightened credit and operational risk and in the event of a default may find it more difficult to enforce our rights. In addition, as new and more complex derivative products are created, covering a wider array of underlying credit and other instruments, disputes about the terms of the underlying contracts could arise, which could impair our ability to effectively manage our risk exposures from these products and subject us to increased costs. The provisions of the Dodd-Frank Act requiring central clearing of credit derivatives and other OTC derivatives, or a market shift toward standardized derivatives, could reduce the risk associated with such transactions, but under certain circumstances could also limit our ability to develop derivatives that best suit the needs of our clients and ourselves and adversely affect our profitability and increase our credit exposure to such platform.
25
Our businesses may be adversely affected if we are unable to hire and retain qualified employees.
Our performance is largely dependent on the talents and efforts of highly skilled individuals; therefore, our continued ability to compete effectively in our businesses, to manage our businesses effectively and to expand into new businesses and geographic areas depends on our ability to attract new talented and diverse employees and to retain and motivate our existing employees. Factors that affect our ability to attract and retain such employees include our compensation and benefits, and our reputation as a successful business with a culture of fairly hiring, training and promoting qualified employees.
Competition from within the financial services industry and from businesses outside the financial services industry for qualified employees has often been intense. This is particularly the case in emerging and growth markets, where we are often competing for qualified employees with entities that have a significantly greater presence or more extensive experience in the region.
As described further in "Business - Regulation - Banking Regulation" and "Regulation - Compensation Practices" in Part I, Item 1 of this Form 10-K, our compensation practices are subject to review by, and the standards of, the Federal Reserve Board. As a large financial and banking institution, we may be subject to limitations on compensation practices (which may or may not affect our competitors) by the Federal Reserve Board, the FSA, the FDIC or other regulators worldwide. These limitations, including any imposed by or as a result of future legislation or regulation, may require us to alter our compensation practices in ways that could adversely affect our ability to attract and retain talented employees. We may also be required to make additional disclosure with respect to the compensation of employees, including non-executive officers, in a manner that directly or indirectly results in the identity of such employees and their compensation being made public. Any such additional public disclosure of employee compensation may also make it difficult to attract and retain talented employees.
Our businesses and those of our clients are subject to extensive and pervasive regulation around the world.
As a participant in the financial services industry and a bank holding company, we are subject to extensive regulation in jurisdictions around the world. We face the risk of significant intervention by regulatory and taxing authorities in all jurisdictions in which we conduct our businesses. Among other things, as a result of regulators enforcing existing laws and regulations, we could be fined, prohibited from engaging in some of our business activities, subject to limitations or conditions on our business activities or subjected to new or substantially higher taxes or other governmental charges in connection with the conduct of our business or with respect to our employees.
There is also the risk that new laws or regulations or changes in enforcement of existing laws or regulations applicable to our businesses or those of our clients, including tax burdens and compensation restrictions, could be imposed on a limited subset of financial institutions (either based on size, activities, geography or other criteria), which may adversely affect our ability to compete effectively with other institutions that are not affected in the same way.
The impact of such developments could impact our profitability in the affected jurisdictions, or even make it uneconomic for us to continue to conduct all or certain of our businesses in such jurisdictions, or could cause us to incur significant costs associated with changing our business practices, restructuring our businesses, moving all or certain of our businesses and our employees to other locations or complying with applicable capital requirements, including liquidating assets or raising capital in a manner that adversely increases our funding costs or otherwise adversely affects our shareholders and creditors.
For a discussion of the extensive regulation to which our businesses are subject, see "Business - Regulation" in Part I, Item 1 of this Form 10-K.
26
We may be adversely affected by increased governmental and regulatory scrutiny or negative publicity.
Governmental scrutiny from regulators, legislative bodies and law enforcement agencies with respect to matters relating to compensation, our business practices, our past actions and other matters has increased dramatically in the past several years. The financial crisis and the current political and public sentiment regarding financial institutions has resulted in a significant amount of adverse press coverage, as well as adverse statements or charges by regulators or other government officials. Press coverage and other public statements that assert some form of wrongdoing often result in some type of investigation by regulators, legislators and law enforcement officials or in lawsuits. Responding to these investigations and lawsuits, regardless of the ultimate outcome of the proceeding, is time consuming and expensive and can divert the time and effort of our senior management from our business. Penalties and fines sought by regulatory authorities have increased substantially over the last several years, and certain regulators have been more likely in recent years to commence enforcement actions or to advance or support legislation targeted at the financial services industry. Adverse publicity, governmental scrutiny and legal and enforcement proceedings can also have a negative impact on our reputation and on the morale and performance of our employees, which could adversely affect our businesses and results of operations.
A failure in our operational systems or infrastructure, or those of third parties, could impair our liquidity, disrupt our businesses, result in the disclosure of confidential information, damage our reputation and cause losses.
Our businesses are highly dependent on our ability to process and monitor, on a daily basis, a very large number of transactions, many of which are highly complex, across numerous and diverse markets in many currencies. These transactions, as well as the information technology services we provide to clients, often must adhere to client-specific guidelines, as well as legal and regulatory standards.
As our client base and our geographical reach expands, developing and maintaining our operational systems and infrastructure becomes increasingly challenging. Our financial, accounting, data processing or other operating systems and facilities may fail to operate properly or become disabled as a result of events
that are wholly or partially beyond our control, such as a spike in transaction volume, adversely affecting our ability to process these transactions or provide these services. We must continuously update these systems to support our operations and growth and to respond to changes in regulations and markets. This updating entails significant costs and creates risks associated with implementing new systems and integrating them with existing ones.
In addition, we also face the risk of operational failure, termination or capacity constraints of any of the clearing agents, exchanges, clearing houses or other financial intermediaries we use to facilitate our securities transactions, and as our interconnectivity with our clients grows, we increasingly face the risk of operational failure with respect to our clients' systems.
In recent years, there has been significant consolidation among clearing agents, exchanges and clearing houses and an increasing number of derivative transactions are now or in the near future will be cleared on exchanges, which has increased our exposure to operational failure, termination or capacity constraints of the particular financial intermediaries that we use and could affect our ability to find adequate and cost-effective alternatives in the event of any such failure, termination or constraint. Industry consolidation, whether among market participants or financial intermediaries, increases the risk of operational failure as disparate complex systems need to be integrated, often on an accelerated basis.
Furthermore, the interconnectivity of multiple financial institutions with central agents, exchanges and clearing houses, and the increased centrality of these entities, increases the risk that an operational failure at one institution or entity may cause an industry-wide operational failure that could materially impact our ability to conduct business. Any such failure, termination or constraint could adversely affect our ability to effect transactions, service our clients, manage our exposure to risk or expand our businesses or result in financial loss or liability to our clients, impairment of our liquidity, disruption of our businesses, regulatory intervention or reputational damage.
27
Despite the resiliency plans and facilities we have in place, our ability to conduct business may be adversely impacted by a disruption in the infrastructure that supports our businesses and the communities in which we are located. This may include a disruption involving electrical, communications, internet, transportation or other services used by us or third parties with which we conduct business. These disruptions may occur as a result of events that affect only our buildings or systems or those of such third parties, or as a result of events with a broader impact globally, regionally or in the cities where those buildings or systems are located.
Nearly all of our employees in our primary locations, including the New York metropolitan area, London, Bangalore, Hong Kong, Tokyo and Salt Lake City, work in close proximity to one another, in one or more buildings. Notwithstanding our efforts to maintain business continuity, given that our headquarters and the largest concentration of our employees are in the New York metropolitan area, depending on the intensity and longevity of the event, a catastrophic event impacting our New York metropolitan area offices could very negatively affect our business. If a disruption occurs in one location and our employees in that location are unable to occupy our offices or communicate with or travel to other locations, our ability to service and interact with our clients may suffer, and we may not be able to successfully implement contingency plans that depend on communication or travel.
Our operations rely on the secure processing, storage and transmission of confidential and other information in our computer systems and networks. Although we take protective measures and endeavor to modify them as circumstances warrant, our computer systems, software and networks may be vulnerable to unauthorized access, misuse, computer viruses or other malicious code and other events that could have a security impact. If one or more of such events occur, this potentially could jeopardize our or our clients' or counterparties' confidential and other information processed and stored in, and transmitted through, our computer systems and networks, or otherwise cause interruptions or malfunctions in our, our clients', our counterparties' or third parties' operations, which could result in significant losses or reputational damage. We may be required to expend significant additional resources to modify our protective measures or to investigate and remediate vulnerabilities or other exposures, and we may be subject to litigation and financial losses that are either not insured against or not fully covered through any insurance maintained by us.
We routinely transmit and receive personal, confidential and proprietary information by email and other electronic means. We have discussed and worked with clients, vendors, service providers, counterparties and other third parties to develop secure transmission capabilities, but we do not have, and may be unable to put in place, secure capabilities with all of our clients, vendors, service providers, counterparties and other third parties and we may not be able to ensure that these third parties have appropriate controls in place to protect the confidentiality of the information. An interception, misuse or mishandling of personal, confidential or proprietary information being sent to or received from a client, vendor, service provider, counterparty or other third party could result in legal liability, regulatory action and reputational harm.
Substantial legal liability or significant regulatory action against us could have material adverse financial effects or cause us significant reputational harm, which in turn could seriously harm our business prospects.
We face significant legal risks in our businesses, and the volume of claims and amount of damages and penalties claimed in litigation and regulatory proceedings against financial institutions remain high. See "Legal Proceedings" in Part I, Item 3 of this Form 10-K for a discussion of certain legal proceedings in which we are involved. Our experience has been that legal claims by customers and clients increase in a market downturn and that employment-related claims increase in periods when we have reduced the total number of employees.
There have been a number of highly publicized cases, involving actual or alleged fraud or other misconduct by employees in the financial services industry in recent years, and we run the risk that employee misconduct could occur. This misconduct has included and may include in the future the theft of proprietary software. It is not always possible to deter or prevent employee misconduct and the precautions we take to prevent and detect this activity have not been and may not be effective in all cases.
28
The growth of electronic trading and the introduction of new trading technology may adversely affect our business and may increase competition.
Technology is fundamental to our business and our industry. The growth of electronic trading and the introduction of new technologies is changing our businesses and presenting us with new challenges. Securities, futures and options transactions are increasingly occurring electronically, both on our own systems and through other alternative trading systems, and it appears that the trend toward alternative trading systems will continue and probably accelerate. Some of these alternative trading systems compete with us, particularly our exchange-based market-making activities, and we may experience continued competitive pressures in these and other areas. In addition, the increased use by our clients of low-cost electronic trading systems and direct electronic access to trading markets could cause a reduction in commissions and spreads. As our clients increasingly use our systems to trade directly in the markets, we may incur liabilities as a result of their use of our order routing and execution infrastructure. We have invested significant resources into the development of electronic trading systems and expect to continue to do so, but there is no assurance that the revenues generated by these systems will yield an adequate return on our investment, particularly given the relatively lower commissions arising from electronic trades.
Our commodities activities, particularly our power generation interests and our physical commodities activities, subject us to extensive regulation, potential catastrophic events and environmental, reputational and other risks that may expose us to significant liabilities and costs.
We engage in, or invest in entities that engage in, the production, storage, transportation, marketing and trading of numerous commodities, including crude oil, oil products, natural gas, electric power, agricultural products, metals (base and precious), minerals (including uranium), emission credits, coal, freight, liquefied natural gas and related products and indices. These activities subject us to extensive and evolving federal, state and local energy, environmental and other governmental laws and regulations worldwide, including environmental laws and regulations relating to, among others, air quality, water quality, waste management, transportation of hazardous substances, natural resources, site remediation and health and safety. Additionally, rising climate change concerns may lead to additional regulation that could increase the operating costs and profitability of our investments.
We may incur substantial costs in complying with current or future laws and regulations relating to our commodities-related activities and investments, particularly electric power generation, transportation and storage of physical commodities and wholesale sales and trading of electricity and natural gas. Compliance with these laws and regulations could require us to commit significant capital toward environmental monitoring, installation of pollution control equipment, renovation of storage facilities or transport vessels, payment of emission fees and carbon or other taxes, and application for, and holding of, permits and licenses.
Our commodities-related activities are also subject to the risk of unforeseen or catastrophic events, many of which are outside of our control, including breakdown or failure of power generation equipment, transmission lines, transport vessels, storage facilities or other equipment or processes or other mechanical malfunctions, fires, leaks, spills or release of hazardous substances, performance below expected levels of output or efficiency, terrorist attacks, natural disasters or other hostile or catastrophic events. In addition, we rely on third-party suppliers or service providers to perform their contractual obligations and any failure on their part, including the failure to obtain raw materials at reasonable prices or to safely transport or store commodities, could adversely affect our activities. In addition, we may not be able to obtain insurance to cover some of these risks and the insurance that we have may be inadequate to cover our losses.
The occurrence of any of such events may prevent us from performing under our agreements with clients, may impair our operations or financial results and may result in litigation, regulatory action, negative publicity or other reputational harm.
29
In conducting our businesses around the world, we are subject to political, economic, legal, operational and other risks that are inherent in operating in many countries.
In conducting our businesses and maintaining and supporting our global operations, we are subject to risks of possible nationalization, expropriation, price controls, capital controls, exchange controls and other restrictive governmental actions, as well as the outbreak of hostilities or acts of terrorism. In many countries, the laws and regulations applicable to the securities and financial services industries and many of the transactions in which we are involved are uncertain and evolving, and it may be difficult for us to determine the exact requirements of local laws in every market. Any determination by local regulators that we have not acted in compliance with the application of local laws in a particular market or our failure to develop effective working relationships with local regulators could have a significant and negative effect not only on our businesses in that market but also on our reputation generally. We are also subject to the enhanced risk that transactions we structure might not be legally enforceable in all cases.
Our businesses and operations are increasingly expanding into new regions throughout the world, including emerging and growth markets, and we expect this trend to continue. Various emerging and growth market countries have experienced severe economic and financial disruptions, including significant devaluations of their currencies, defaults or threatened defaults on sovereign debt, capital and currency exchange controls, and low or negative growth rates in their economies, as well as military activity or acts of terrorism. The possible effects of any of these conditions include an adverse impact on our businesses and increased volatility in financial markets generally.
While business and other practices throughout the world differ, our principal legal entities are subject in their operations worldwide to rules and regulations relating to corrupt and illegal payments and money laundering, as well as laws relating to doing business with certain individuals, groups and countries, such as the U.S. Foreign Corrupt Practices Act, the USA PATRIOT Act and U.K. Bribery Act. While we have invested and continue to invest significant resources in training and in compliance monitoring, the geographical diversity of our operations, employees, clients and customers, as well as the vendors and other third parties that we deal with, greatly increases the risk that we may be found in violation of such rules or regulations and any such violation could subject us to significant penalties or adversely affect our reputation.
We may incur losses as a result of unforeseen or catastrophic events, including the emergence of a pandemic, terrorist attacks or natural disasters.
The occurrence of unforeseen or catastrophic events, including the emergence of a pandemic or other widespread health emergency (or concerns over the possibility of such an emergency), terrorist attacks or natural disasters, could create economic and financial disruptions, could lead to operational difficulties (including travel limitations) that could impair our ability to manage our businesses, and could expose our insurance activities to significant losses.
30
| Item 1B. | Unresolved Staff Comments |
There are no material unresolved written comments that were received from the SEC staff 180 days or more before the end of our fiscal year relating to our periodic or current reports under the Exchange Act.
| Item 2. | Properties |
Our principal executive offices are located at 200 West Street, New York, New York and comprise approximately 2.1 million gross square feet. The building is located on a parcel leased from Battery Park City Authority pursuant to a ground lease. Under the lease, Battery Park City Authority holds title to all improvements, including the office building, subject to Goldman Sachs' right of exclusive possession and use until June 2069, the expiration date of the lease. Under the terms of the ground lease, we made a lump sum ground rent payment in June 2007 of $161 million for rent through the term of the lease.
We have offices at 30 Hudson Street in Jersey City, New Jersey, which we own and which include approximately 1.6 million gross square feet of office space, and we own over 700,000 square feet of additional commercial space spread among four locations in New York and New Jersey. We lease approximately 2.1 million rentable square feet in the New York Metropolitan Area.
We have additional offices in the U.S. and elsewhere in the Americas, which together comprise approximately 3.0 million rentable square feet of leased space.
In Europe, the Middle East and Africa, we have offices that total approximately 2.1 million rentable square feet. Our European headquarters is located in London at Peterborough Court, pursuant to a lease expiring in 2026. In total, we lease approximately 1.6 million rentable square feet in London through various leases, relating to various properties.
In Asia (including India), we have offices that total approximately 1.7 million rentable square feet. Our headquarters in this region are in Tokyo, at the Roppongi Hills Mori Tower, and in Hong Kong, at the Cheung Kong Center. In Tokyo, we currently lease approximately 388,000 rentable square feet, the majority of which will expire in 2018. In Hong Kong, we currently lease approximately 320,000 rentable square feet under lease agreements, the majority of which will expire in 2017.
See "Management's Discussion and Analysis of Financial Condition and Results of Operations - Off-Balance-Sheet Arrangements and Contractual Obligations - Contractual Obligations" in Part II, Item 7 of this Form 10-K for a discussion of exit costs we may incur.
| Item 3. | Legal Proceedings |
We are involved in a number of judicial, regulatory and arbitration proceedings concerning matters arising in connection with the conduct of our businesses. Many of these proceedings are at preliminary stages, and many of these cases seek an indeterminate amount of damages. However, we believe, based on currently available information, that the results of such proceedings, in the aggregate, will not have a material adverse effect on our financial condition, but may be material to our operating results for any particular period, depending, in part, upon the operating results for such period. Given the range of litigation and investigations presently under way, our litigation expenses can be expected to remain high. See "Management's Discussion and Analysis of Financial Condition and Results of Operations - Use of Estimates" in Part II, Item 7 of this Form 10-K. See Note 30 to the consolidated financial statements in Part II, Item 8 of this Form 10-K for information on certain judicial, regulatory and legal proceedings.
31
Executive Officers of The Goldman Sachs Group, Inc.
Set forth below are the name, age, present title, principal occupation and certain biographical information as of February 1, 2011 for our executive officers. All of our executive officers have been appointed by and serve at the pleasure of our board of directors.
Lloyd C. Blankfein, 56
Mr. Blankfein has been our Chairman and Chief Executive Officer since June 2006, and a director since April 2003. Previously, he had been our President and Chief Operating Officer since January 2004. Prior to that, from April 2002 until January 2004, he was a Vice Chairman of Goldman Sachs, with management responsibility for Goldman Sachs' Fixed Income, Currency and Commodities Division (FICC) and Equities Division (Equities). Prior to becoming a Vice Chairman, he had served as co-head of FICC since its formation in 1997. From 1994 to 1997, he headed or co-headed the Currency and Commodities Division. Mr. Blankfein is not currently on the board of any public company other than Goldman Sachs. He is affiliated with certain non-profit organizations, including as a member of the Dean's Advisory Board at Harvard Law School, the Dean's Council at Harvard University and the Advisory Board of the Tsinghua University School of Economics and Management, an overseer of the Weill Medical College of Cornell University, and a member of the Board of Directors of the Partnership for New York City.
Alan M. Cohen, 60
Mr. Cohen has been an Executive Vice President of Goldman Sachs and our Global Head of Compliance since February 2004. From 1991 until January 2004, he was a partner in the law firm of O'Melveny & Myers LLP. He is affiliated with certain non-profit organizations, including as a board member of the New York Stem Cell Foundation.
Gary D. Cohn, 50
Mr. Cohn has been our President and Chief Operating Officer (or Co-Chief Operating Officer) and a director since June 2006. From December 2003 to June 2006, he was the co-head of our global Securities businesses, having been the co-head of FICC since September 2002. Prior to that, Mr. Cohn served as co-chief operating officer of FICC after having been responsible for Commodities and a number of other FICC businesses from 1999 to 2002. He was the head of Commodities from 1996 to 1999. Mr. Cohn is not currently on the board of any public company other than Goldman Sachs. He is affiliated with certain non-profit organizations, including NYU Hospital, NYU Medical School, the Harlem Children's Zone and American University.
J. Michael Evans, 53
Mr. Evans has been the global head of Growth Markets since January 2011, a Vice Chairman of Goldman Sachs since February 2008 and chairman of Goldman Sachs Asia since 2004. Prior to becoming a Vice Chairman, he had served as global co-head of Goldman Sachs' securities business since 2003. Previously, he had been co-head of the Equities Division since 2001. Mr. Evans is a board member of CASPER (Center for Advancement of Standards-based Physical Education Reform). He also serves as a trustee of the Bendheim Center for Finance at Princeton University.
Gregory K. Palm, 62
Mr. Palm has been an Executive Vice President of Goldman Sachs since May 1999, and our General Counsel and head or co-head of the Legal Department since May 1992.
Michael S. Sherwood, 45
Mr. Sherwood has been a Vice Chairman of Goldman Sachs since February 2008 and co-chief executive officer of Goldman Sachs International since 2005. Prior to becoming a Vice Chairman, he had served as global co-head of Goldman Sachs' securities business since 2003. Prior to that, he had been head of FICC Europe since 2001.
32
Esta E. Stecher, 53
Ms. Stecher has been an Executive Vice President of Goldman Sachs and our General Counsel and co-head of the Legal Department since December 2000. From 1994 to 2000, she was head of the firm's Tax Department, over which she continues to have senior oversight responsibility. She is also a trustee of Columbia University.
David A. Viniar, 55
Mr. Viniar has been an Executive Vice President of Goldman Sachs and our Chief Financial Officer since May 1999. He has been the head of Operations, Technology, Finance and Services Division since December 2002. He was head of the Finance Division and co-head of Credit Risk Management and Advisory and Firmwide Risk from December 2001 to December 2002. Mr. Viniar was co-head of Operations, Finance and Resources from March 1999 to December 2001. He was Chief Financial Officer of The Goldman Sachs Group, L.P. from March 1999 to May 1999. From July 1998 until March 1999, he was Deputy Chief Financial Officer and from 1994 until July 1998, he was head of Finance, with responsibility for Controllers and Treasury. From 1992 to 1994, he was head of Treasury and prior to that was in the Structured Finance Department of Investment Banking. He also serves on the Board of Trustees of Union College.
John S. Weinberg, 53
Mr. Weinberg has been a Vice Chairman of Goldman Sachs since June 2006. He has been co-head of Goldman Sachs' Investment Banking Division since December 2002. From January 2002 to December 2002, he was co-head of the Investment Banking Division in the Americas. Prior to that, he served as co-head of the Investment Banking Services Department since 1997. He is affiliated with certain non-profit organizations, including as a trustee of New York-Presbyterian Hospital and the Brunswick School, and as a member of the Board of Directors of The Steppingstone Foundation. Mr. Weinberg also serves on the Visiting Committee for Harvard Business School.
33
PART II
Item 5. Market for Registrant's Common Equity, Related Stockholder Matters and Issuer Purchases of Equity Securities
The principal market on which our common stock is traded is the NYSE. Information relating to the high and low sales prices per share of our common stock, as reported by the Consolidated Tape Association, for each full quarterly period during fiscal 2009 and 2010 is set forth under the heading "Supplemental Financial Information - Common Stock Price Range" in Part II, Item 8 of this Form 10-K. As of February 11, 2011, there were 12,165 holders of record of our common stock.
During fiscal 2009 and fiscal 2010, dividends of $0.35 per common share were declared on April 13, 2009, July 13, 2009, October 14, 2009, January 19, 2010, April 19, 2010, July 19, 2010 and October 18, 2010. The holders of our common stock share proportionately on a per share basis in all dividends and other distributions on common stock declared by the Board of Directors of Group Inc (Board).
The declaration of dividends by Goldman Sachs is subject to the discretion of our Board. Our Board will take into account such matters as general business conditions, our financial results, capital requirements, contractual, legal and regulatory restrictions on the payment of dividends by us to our shareholders or by our subsidiaries to us, the effect on our debt ratings and such other factors as our Board may deem relevant. See "Business - Regulation" in Part I, Item 1 of this Form 10-K for a discussion of potential regulatory limitations on our receipt of funds from our regulated subsidiaries and our payment of dividends to shareholders of Group Inc.
The table below sets forth the information with respect to purchases made by or on behalf of Group Inc. or any "affiliated purchaser" (as defined in Rule 10b-18(a)(3) under the Exchange Act), of our common stock during the fourth quarter of our fiscal year ended December 2010.
| Total Number of Shares | Maximum Number of | |||||||||||||||||
| Total Number of | Average Price | Purchased as Part of | Shares That May Yet Be | |||||||||||||||
| Shares | Paid per | Publicly Announced | Purchased Under the | |||||||||||||||
| Period | Purchased | Share | Plans or Programs 1 | Plans or Programs 1 | ||||||||||||||
| Month #1 (October 1, 2010 to October 31, 2010) | 1,200,000 | $ | 159.53 | 1,200,000 | 41,056,476 | |||||||||||||
| Month #2 (November 1, 2010 to November 30, 2010) | 3,225,100 | $ | 164.06 | 3,225,100 | 37,831,376 | |||||||||||||
| Month #3 (December 1, 2010 to December 31, 2010) | 2,275,000 | $ | 164.54 | 2,275,000 | 35,556,376 | |||||||||||||
| Total | 6,700,100 | 6,700,100 | ||||||||||||||||
| 1. | On March 21, 2000, we announced that our Board had approved a repurchase program, pursuant to which up to 15 million shares of our common stock may be repurchased. This repurchase program was increased by an aggregate of 280 million shares by resolutions of our Board adopted on June 18, 2001, March 18, 2002, November 20, 2002, January 30, 2004, January 25, 2005, September 16, 2005, September 11, 2006 and December 17, 2007. We use our share repurchase program to substantially offset increases in share count over time resulting from employee share-based compensation and to help maintain the appropriate level of common equity. |
| The repurchase program is effected primarily through regular open-market purchases, the amounts and timing of which are determined primarily by the firm's issuance of shares resulting from employee share-based compensation as well as its current and projected capital position (i.e., comparisons of our desired level of capital to our actual level of capital) but which may also be influenced by general market conditions, the prevailing price and trading volumes of our common stock. The total remaining authorization under the repurchase program was 32,156,376 shares as of February 11, 2011; the repurchase program has no set expiration or termination date. | |
| Any repurchase of our common stock requires approval by the Federal Reserve Board. |
Information relating to compensation plans under which our equity securities are authorized for issuance is presented in Part III, Item 12 of this Form 10-K.
| Item 6. | Selected Financial Data |
The Selected Financial Data table is set forth under Part II, Item 8 of this Form 10-K.
34
| Item 7. | Management's Discussion and Analysis of Financial Condition and Results of Operations |
INDEX
| Page No. | ||||||
Introduction | 36 | |||||
Executive Overview | 37 | |||||
Business Environment | 38 | |||||
Critical Accounting Policies | 40 | |||||
Use of Estimates | 44 | |||||
Results of Operations | 44 | |||||
Balance Sheet and Funding Sources | 60 | |||||
Equity Capital | 66 | |||||
Off-Balance-Sheet Arrangements and Contractual Obligations | 71 | |||||
Overview and Structure of Risk Management | 74 | |||||
Liquidity Risk | 78 | |||||
Market Risk Management | 84 | |||||
Credit Risk Management | 89 | |||||
Operational Risk | 94 | |||||
Recent Accounting Developments | 95 | |||||
Certain Risk Factors That May Affect Our Businesses | 95 | |||||
35
Introduction
The Goldman Sachs Group, Inc. (Group Inc.) is a leading global investment banking, securities and investment management firm that provides a wide range of financial services to a substantial and diversified client base that includes corporations, financial institutions, governments and high-net-worth individuals. Founded in 1869, the firm is headquartered in New York and maintains offices in all major financial centers around the world.
Over the past year, our Business Standards Committee performed an extensive review of our business and delivered recommendations designed to ensure that our business standards and practices are of the highest quality, that they meet or exceed the expectations of our clients, regulators and other stakeholders, and that they contribute to overall financial stability and economic opportunity. These recommendations have been approved by our senior management and the Board of Directors of Group Inc. (Board) and implementation has already begun. In the fourth quarter of 2010, consistent with management's view of the firm's activities and the recommendations of our Business Standards Committee, we reorganized our three previous business segments into four new business segments: Investment Banking, Institutional Client Services, Investing & Lending and Investment Management. Prior periods are presented on a comparable basis. See "Results of Operations" below for further information about our business segments.
When we use the terms "Goldman Sachs," "the firm," "we," "us" and "our," we mean Group Inc., a Delaware corporation, and its consolidated subsidiaries. References to "this Form 10-K" are to our Annual Report on Form 10-K for the fiscal year ended December 31, 2010.
All references to 2010, 2009 and 2008, unless specifically stated otherwise, refer to our fiscal years ended, or the dates, as the context requires, December 31, 2010, December 31, 2009 and November 28, 2008, respectively. Any reference to a future year refers to a fiscal year ending on
December 31 of that year. All references to December 2008, unless specifically stated otherwise, refer to our fiscal one month ended, or the date, as the context requires, December 26, 2008. Certain reclassifications have been made to previously reported amounts to conform to the current presentation.
In this discussion and analysis of our financial condition and results of operations, we have included information that may constitute "forward-looking statements" within the meaning of the safe harbor provisions of the U.S. Private Securities Litigation Reform Act of 1995. Forward-looking statements are not historical facts, but instead represent only our beliefs regarding future events, many of which, by their nature, are inherently uncertain and outside our control. This information includes statements other than historical information or statements of current condition and may relate to our future plans and objectives and results, among other things, and may also include statements about the objectives and effectiveness of our risk management and liquidity policies, statements about trends in or growth opportunities for our businesses, statements about our future status, activities or reporting under U.S. or non-U.S. banking and financial regulation, and statements about our investment banking transaction backlog. By identifying these statements for you in this manner, we are alerting you to the possibility that our actual results and financial condition may differ, possibly materially, from the anticipated results and financial condition indicated in these forward-looking statements. Important factors that could cause our actual results and financial condition to differ from those indicated in these forward-looking statements include, among others, those discussed below under "Certain Risk Factors That May Affect Our Businesses" as well as "Risk Factors" in Part I, Item 1A of this Form 10-K and "Cautionary Statement Pursuant to the U.S. Private Securities Litigation Reform Act of 1995" in Part I, Item 1 of this Form 10-K.
36
Executive Overview
Our diluted earnings per common share were $13.18 for the year ended December 2010, compared with $22.13 for the year ended December 2009. Return on average common shareholders' equity (ROE) 1 was 11.5% for 2010, compared with 22.5% for 2009. Excluding the impact of the $465 million U.K. bank payroll tax, the $550 million SEC settlement and the $305 million impairment of our New York Stock Exchange (NYSE) Designated Market Maker (DMM) rights, diluted earnings per common share were $15.22 2 and ROE was 13.1% 2 for 2010.
Book value per common share increased by approximately 10% to $128.72 and tangible book value per common share 3 increased by approximately 9% to $118.63 compared with the end of 2009. Under Basel 1, our Tier 1 capital ratio 4 was 16.0% and our Tier 1 common ratio 4 was 13.3% as of December 2010. Our total assets were $911 billion as of December 2010, 7% higher compared with the end of 2009.
The firm generated net revenues of $39.16 billion and net earnings of $8.35 billion for 2010, despite a challenging operating environment. These results reflected significantly lower net revenues in Institutional Client Services and slightly lower net revenues in Investment Banking compared with 2009. These decreases were partially offset by significantly higher net revenues in Investing & Lending and higher net revenues in Investment Management. The results of each of our business segments are discussed below.
Institutional Client Services
The decrease in Institutional Client Services reflected significantly lower net revenues in Fixed Income, Currency and Commodities Client Execution and, to a lesser extent, Equities. During 2010, Fixed Income, Currency and Commodities Client Execution operated in a challenging environment characterized by lower client activity levels, which reflected broad market concerns including European sovereign debt risk and uncertainty over regulatory reform, as well as tighter bid/offer spreads. The decrease in net revenues compared with a particularly strong 2009 primarily reflected significantly lower results in interest rate products, credit products, commodities and, to a lesser extent, currencies. These decreases were partially offset by higher net revenues in mortgages.
The decline in Equities compared with 2009 primarily reflected significantly lower net revenues in equities client execution, principally due to significantly lower results in derivatives and shares. Commissions and fees were also lower than 2009, primarily reflecting lower client activity levels. In addition, securities services net revenues were significantly lower compared with 2009, primarily reflecting tighter securities lending spreads, principally due to the impact of changes in the composition of customer balances, partially offset by the impact of higher average customer balances. During 2010, although equity markets were volatile during the first half of the year, equity prices generally improved and volatility levels declined in the second half of the year.
1. See "Results of Operations - Financial Overview" below for further information about our calculation of ROE.
2. We believe that presenting our results excluding the impact of the U.K. bank payroll tax, the SEC settlement and the NYSE DMM rights impairment is meaningful, as excluding these items increases the comparability of period-to-period results. See "Results of Operations - Financial Overview" below for further information about our calculation of diluted earnings per common share and ROE excluding the impact of these items.
3. We believe that tangible book value per common share is meaningful because it is one of the measures that we and investors use to assess capital adequacy. See "Equity Capital - Other Capital Metrics" below for further information about our calculation of tangible book value per common share.
4. See "Equity Capital - Consolidated Regulatory Capital Ratios" below for further information about our Tier 1 capital ratio and Tier 1 common ratio.
37
Investment Banking
The decrease in Investment Banking reflected lower net revenues in our Underwriting business, partially offset by higher net revenues in Financial Advisory. The decline in Underwriting reflected lower net revenues in equity underwriting, principally due to a decline in client activity in comparison to 2009, which included significant capital-raising activity by financial institution clients. Net revenues in debt underwriting were essentially unchanged compared with 2009. The increase in Financial Advisory primarily reflected an increase in client activity.
Investing & Lending
During 2010, an increase in global equity markets and tighter credit spreads provided a favorable backdrop for our Investing & Lending business. Results in Investing & Lending for 2010 primarily reflected a gain of $747 million from our investment in the ordinary shares of Industrial and Commercial Bank of China Limited (ICBC), a net gain of $2.69 billion from other equity securities and a net gain of $2.60 billion from debt securities and loans.
Investment Management
The increase in Investment Management primarily reflected higher incentive fees across our alternative investment products. Management and other fees also increased, reflecting favorable changes in the mix of assets under management, as well as the impact of appreciation in the value of client assets. During 2010, assets under management decreased 4% to $840 billion, primarily reflecting outflows in money market assets, consistent with industry trends.
Our business, by its nature, does not produce predictable earnings. Our results in any given period can be materially affected by conditions in global financial markets, economic conditions generally and other factors. For a further discussion of the factors that may affect our future operating results, see "Certain Risk Factors That May Affect Our Businesses" below as well as "Risk Factors" in Part I, Item 1A of this Form 10-K.
Business Environment
Global economic conditions generally improved in 2010, as real gross domestic product (GDP) grew in most major economies following declines in 2009, and growth in emerging markets was strong. However, certain unfavorable conditions emerged during the second quarter of 2010 that made the environment more challenging for our businesses, including broad market concerns over European sovereign debt risk and uncertainty regarding financial regulatory reform, sharply higher equity volatility levels, lower global equity prices and wider corporate credit spreads. During the second half of 2010, some of these conditions reversed, as equity volatility levels decreased, global equity prices generally recovered and corporate credit spreads narrowed. In addition, the U.S. Federal Reserve announced quantitative easing measures during the fourth quarter of 2010 in order to stimulate economic growth and protect against the risk of deflation. Industry-wide announced mergers and acquisitions volumes increased, while industry-wide debt offerings volumes decreased compared with 2009. A significant increase in initial public offerings volumes compared with 2009 offset declines in common stock follow-on offerings and convertible offerings volumes, as 2009 included significant capital-raising activity by financial institutions. For a further discussion of how market conditions affect our businesses, see "Certain Risk Factors That May Affect Our Businesses" below as well as "Risk Factors" in Part I, Item 1A of this Form 10-K.
Global
The global economy strengthened during 2010, as real GDP increased in most major economies and economic growth in emerging markets accelerated. The global recovery largely reflected an increase in business investment, following a significant decline in 2009. In addition, international trade grew strongly in 2010. Unemployment levels generally stabilized, although the rate of unemployment remained elevated in some economies. During 2010, the U.S. Federal Reserve, the European Central Bank and the Bank of England left interest rates unchanged, while the Bank of Japan reduced its target overnight call rate and the People's Bank of China increased its one-year benchmark lending rate. The price of crude oil increased significantly during 2010. The U.S. dollar strengthened against the Euro and the British pound, but weakened against the Japanese yen.
38
United States
In the United States, real GDP increased by an estimated 2.8% in 2010, compared with a decline of 2.6% in 2009. Growth was primarily supported by improved business investment spending, as well as an increase in federal government spending. In addition, consumer spending and business and consumer confidence improved during the year. However, residential investment remained weak. Measures of core inflation decreased during the year, reflecting high levels of unemployment and significant excess production capacity, which caused downward pressure on wages and prices. The U.S. Federal Reserve maintained its federal funds rate at a target range of zero to 0.25% during the year. In addition, the U.S. Federal Reserve announced quantitative easing measures during the fourth quarter of 2010, including its intention to purchase significant amounts of U.S. Treasury debt. The yield on the 10-year U.S. Treasury note fell by 55 basis points to 3.30% during 2010. The NASDAQ Composite Index, the S&P 500 Index and the Dow Jones Industrial Average ended the year higher by 17%, 13% and 11%, respectively.
Europe
Real GDP in the Eurozone economies increased by an estimated 1.7% in 2010, compared with a decline of 4.0% in 2009. Growth primarily reflected an increase in consumer and government expenditure, as well as the rebuilding of inventories. Exports and imports increased significantly, although the contribution from net trade was not significant. Business investment was weak for the year, but showed signs of recovery in the second half of the year, and surveys of business and consumer confidence improved. However, economic growth in certain Eurozone economies continued to be weighed down by fiscal challenges and banking sector concerns. In addition, concerns about sovereign debt risk in certain Eurozone economies intensified, contributing to higher volatility and funding pressures. The European Central Bank and certain governments in the Eurozone took a range of policy measures to address these issues. Measures of core inflation remained low and the European Central Bank maintained its main refinancing operations rate at 1.00% during the year. In the United Kingdom, real GDP increased by an estimated 1.3% for 2010, compared with a decrease of 4.9% in 2009. The Bank of England maintained its official bank rate at 0.50% during the year. Long-term government bond yields in both the Eurozone and the U.K. decreased during 2010. The Euro and British pound depreciated by 7% and 3%, respectively, against the U.S. dollar during 2010. The DAX
Index and the FTSE 100 Index increased by 16% and 9%, respectively, while the Euro Stoxx 50 Index and the CAC 40 Index declined by 6% and 3%, respectively, compared with the end of 2009.
Asia
In Japan, real GDP increased by an estimated 3.9% in 2010, compared with a decrease of 6.3% in 2009. Growth primarily reflected a significant increase in exports, as well as an increase in consumer spending. Measures of inflation remained negative during 2010. The Bank of Japan reduced its target overnight call rate from 0.10% to a range of zero to 0.10% and the yield on 10-year Japanese government bonds fell by 17 basis points to 1.13%. The Japanese yen appreciated by 13% against the U.S. dollar. The Nikkei 225 Index decreased 3% during the year. In China, real GDP growth was an estimated 10.3% in 2010, up from 9.2% in 2009. Economic growth was broad-based, with significant increases in exports, retail spending and business investment. Measures of inflation increased during 2010, reflecting continued growth in demand. The People's Bank of China raised its one-year benchmark lending rate by 50 basis points during the year to 5.81% and the Chinese yuan appreciated by 3% against the U.S. dollar. The Shanghai Composite Index decreased by 14% during 2010, partially due to concerns over the effect of tighter policy on economic growth. In India, real GDP growth was an estimated 8.5% in 2010, up from 7.5% in 2009. Growth primarily reflected an increase in domestic demand, partially offset by the impact of lower net exports. The rate of wholesale inflation increased during the year. The Indian rupee appreciated by 3% against the U.S. dollar. Equity markets in Hong Kong ended the year higher and equity markets in India and South Korea increased significantly during 2010.
Other Markets
In Brazil, real GDP increased by an estimated 7.6% in 2010, compared with a decline of 0.6% in 2009. The increase in real GDP primarily reflected an increase in domestic demand. The Brazilian real strengthened against the U.S. dollar. Brazilian equity prices ended the year slightly higher compared with the end of 2009. In Russia, real GDP increased by an estimated 4.0% in 2010, compared with a decline of 7.9% in 2009. Rising oil prices led to a significant improvement in investment growth, following a decline in 2009. The Russian ruble was essentially unchanged against the U.S. dollar and Russian equity prices ended the year significantly higher compared with 2009.
39
Critical Accounting Policies
Fair Value
Fair Value Hierarchy. Financial instruments owned, at fair value and Financial instruments sold, but not yet purchased, at fair value (i.e., inventory), as well as certain other financial assets and financial liabilities, are reflected in our consolidated statements of financial condition at fair value (i.e., marked-to-market), with related gains or losses generally recognized in our consolidated statements of earnings. The use of fair value to measure financial instruments is fundamental to our risk management practices and is our most critical accounting policy.
The fair value of a financial instrument is the amount that would be received to sell an asset or paid to transfer a liability in an orderly transaction between market participants at the measurement date. In determining fair value, the hierarchy under U.S. generally accepted accounting principles (U.S. GAAP) gives (i) the highest priority to unadjusted quoted prices in active markets for identical assets or liabilities (level 1 inputs), (ii) the next priority to inputs other than level 1 inputs that are observable either directly or indirectly (level 2 inputs), and (iii) the lowest priority to inputs that cannot be observed in market activity (level 3 inputs). Assets and liabilities are classified in their entirety based on the lowest level of input that is significant to their fair value measurement.
The fair values for substantially all of our financial assets and financial liabilities, including derivatives, are based on observable prices and inputs and are classified in levels 1 and 2 of the hierarchy. Certain level 2 financial instruments may require appropriate discounts (i.e., valuation adjustments) for factors such as:
| • | transfer restrictions; |
| • | the credit quality of a counterparty or the firm; and |
| • | other premiums and discounts that a market participant would require to arrive at fair value. |
Valuation adjustments are generally based on market evidence.
Instruments categorized within level 3 of the fair value hierarchy, which represent approximately 5% of the firm's total assets, require one or more significant inputs that are not observable. Absent evidence to the contrary, instruments classified within level 3 of the fair value hierarchy are initially valued at transaction price, which is considered to be the best initial estimate of fair value. Subsequent to the transaction date, we use other methodologies to determine fair value, which vary based on the type of instrument. Estimating the fair value of level 3 financial instruments may require judgments to be made. These judgments include:
| • | determining the appropriate valuation methodology and/or model for each type of level 3 financial instrument; |
| • | determining model inputs based on an evaluation of all relevant empirical market data, including prices evidenced by market transactions, interest rates, credit spreads, volatilities and correlations; and |
| • | determining appropriate valuation adjustments related to illiquidity or counterparty credit quality. |
Regardless of the methodology, valuation inputs and assumptions are only changed when corroborated by substantive evidence.
Controls Over Valuation of Financial Instruments. Our control infrastructure is independent of the revenue-producing units and is fundamental to ensuring that all of our financial instruments are appropriately valued at market-clearing levels. In particular, our independent price verification process is critical to ensuring that financial instruments are properly valued.
40
Price Verification. The objective of price verification is to have an informed and independent opinion with regard to the valuation of financial instruments under review. Instruments that have one or more significant inputs which cannot be corroborated by external market data are classified within level 3 of the fair value hierarchy.
In situations where there is a question about a valuation, the ultimate valuation is determined by senior managers in control and support functions that are independent of the revenue-producing units (independent control and support functions). Price verification strategies utilized by our independent control and support functions include:
| • | Trade Comparison. Analysis of trade data (both internal and external where available) is used to determine the most relevant pricing inputs and valuations. |
| • | External Price Comparison. Valuations and prices are compared to pricing data obtained from third parties (e.g., broker or dealers, MarkIt, Bloomberg, IDC, TRACE). Data obtained from various sources is compared to ensure consistency and validity. When broker or dealer quotations or third-party pricing vendors are used for valuation or price verification, greater priority is generally given to executable quotations. |
| • | Calibration to Market Comparables. Market-based transactions are used to corroborate the valuation of positions with similar characteristics, risks and components. |
| • | Relative Value Analyses. Market-based transactions are analyzed to determine the similarity, measured in terms of risk, liquidity and return, of one instrument relative to another, or for a given instrument, of one maturity relative to another. |
| • | Collateral Analyses. Margin disputes on derivatives are examined and investigated to determine the impact, if any, on our valuations. |
| • | Execution of trades. Where appropriate, trading desks are instructed to execute trades in order to provide evidence of market-clearing levels. |
| • | Backtesting. Valuations are corroborated by comparison to values realized upon sales. |
See Notes 5 through 8 to the consolidated financial statements in Part II, Item 8 of this Form 10-K for further information about fair value measurements.
Review of Net Revenues. Independent control and support functions ensure adherence to our pricing policy through a combination of daily procedures, one of which is the process of validating and understanding results by attributing and explaining net revenues by the underlying factors. Through this process we independently validate net revenues, identify and resolve potential fair value or trade booking issues on a timely basis and ensure that risks are being properly categorized and quantified.
Review of Valuation Models. Quantitative professionals within our Market Risk Management department (Market Risk Management) perform an independent model approval process. This process incorporates a review of a diverse set of model and trade parameters across a broad range of values (including extreme and/or improbable conditions) in order to critically evaluate:
| • | a model's suitability for valuation and risk management of a particular instrument type; |
| • | the model's accuracy in reflecting the characteristics of the related product and its significant risks; |
| • | the suitability and properties of the numerical algorithms incorporated in the model; |
| • | the model's consistency with models for similar products; and |
| • | the model's sensitivity to input parameters and assumptions. |
New or changed models are reviewed and approved. Models are evaluated and re-approved annually to assess the impact of any changes in the product or market and any market developments in pricing theories.
See "Market Risk Management" and "Credit Risk Management" for a further discussion of how we manage the risks inherent in our businesses.
41
Level 3 Financial Assets at Fair Value. The table below presents financial assets measured at fair value and the amount of such assets that are classified within level 3 of the fair value hierarchy.
Total level 3 assets were $45.38 billion and $46.48 billion as of December 2010 and December 2009, respectively. The decrease in level 3 assets during the year ended December 2010 primarily reflected (i) sales and transfers to level 2 of loans and securities backed by commercial real estate; and (ii) net
reductions in level 3 financial instruments as a result of the consolidations of certain variable interest entities (VIEs). This decrease was partially offset by an increase in derivatives primarily due to unrealized gains on credit derivatives, principally resulting from changes in level 2 inputs.
See Notes 5 through 8 to the consolidated financial statements in Part II, Item 8 of this Form 10-K for further information about fair value measurements.
| As of December 2010 | As of December 2009 | |||||||||||||||||
| Total at | Level 3 | Total at | Level 3 | |||||||||||||||
| in millions | Fair Value | Total | Fair Value | Total | ||||||||||||||
Commercial paper, certificates of deposit, time deposits and other money market instruments | $ | 11,262 | $ | - | $ | 9,111 | $ | - | ||||||||||
| U.S. government and federal agency obligations | 84,928 | - | 78,336 | - | ||||||||||||||
| Non-U.S. government obligations | 40,675 | - | 38,858 | - | ||||||||||||||
| Mortgage and other asset-backed loans and securities: | ||||||||||||||||||
Loans and securities backed by commercial real estate | 6,200 | 2,819 | 6,203 | 4,620 | ||||||||||||||
Loans and securities backed by residential real estate | 9,404 | 2,373 | 6,704 | 1,880 | ||||||||||||||
Loan portfolios 1 | 1,438 | 1,285 | 1,370 | 1,364 | ||||||||||||||
| Bank loans and bridge loans | 18,039 | 9,905 | 2 | 19,345 | 9,560 | 2 | ||||||||||||
| Corporate debt securities | 24,719 | 2,737 | 26,368 | 2,235 | ||||||||||||||
| State and municipal obligations | 2,792 | 754 | 2,759 | 1,114 | ||||||||||||||
| Other debt obligations | 3,232 | 1,274 | 2,914 | 2,235 | ||||||||||||||
| Equities and convertible debentures | 67,833 | 11,060 | 71,474 | 11,871 | ||||||||||||||
| Commodities | 13,138 | - | 3,707 | - | ||||||||||||||
| Total cash instruments | 283,660 | 32,207 | 267,149 | 34,879 | ||||||||||||||
| Derivatives | 73,293 | 12,772 | 75,253 | 11,596 | ||||||||||||||
| Financial instruments owned, at fair value | 356,953 | 44,979 | 342,402 | 46,475 | ||||||||||||||
| Securities segregated for regulatory and other purposes | 36,182 | - | 18,853 | - | ||||||||||||||
| Securities purchased under agreements to resell | 188,355 | 100 | 144,279 | - | ||||||||||||||
| Securities borrowed | 48,822 | - | 66,329 | - | ||||||||||||||
| Receivables from customers and counterparties | 7,202 | 298 | 1,925 | - | ||||||||||||||
| Total | $ | 637,514 | $ | 45,377 | $ | 573,788 | $ | 46,475 | ||||||||||
| 1. | Consists of acquired portfolios of distressed loans, primarily backed by commercial and residential real estate. |
| 2. | Includes certain mezzanine financing, leveraged loans arising from capital market transactions and other corporate bank debt. |
42
Goodwill and Identifiable Intangible Assets
Goodwill. Goodwill is the cost of acquired companies in excess of the fair value of net assets, including identifiable intangible assets, at the acquisition date. The reorganization of the firm's segments in 2010 resulted in the reallocation of assets, including goodwill, and liabilities across our reporting units. See Notes 13 and 27 to the consolidated financial statements in Part II, Item 8 of this Form 10-K for further information on segments.
We test the goodwill in each of our reporting units for impairment at least annually, by comparing the estimated fair value of each reporting unit with its estimated net book value. We derive the fair value based on valuation techniques we believe market participants would use (i.e., observable price-to-earnings multiples and price-to-book multiples). We derive the net book value by estimating the amount of shareholders' equity required to support the activities of each reporting unit. Estimating the fair value of our reporting units requires management to make judgments. Critical inputs include (i) projected earnings, (ii) estimated long-term growth rates and (iii) cost of equity. Our last annual impairment test was performed during our 2010 fourth quarter and no impairment was identified. See Note 13 to the consolidated financial statements in Part II, Item 8 of this Form 10-K for the carrying value of our goodwill by operating segment.
Identifiable Intangible Assets. We amortize our identifiable intangible assets over their estimated lives or, in the case of insurance contracts, in proportion to estimated gross profits or premium revenues. Identifiable intangible assets are tested for impairment whenever events or changes in circumstances suggest that an asset's or asset group's carrying value may not be fully recoverable.
An impairment loss, generally calculated as the difference between the estimated fair value and the carrying value of an asset or asset group, is recognized if the sum of the estimated undiscounted cash flows relating to the asset or asset group is less than the corresponding carrying value. See Note 13 to the consolidated financial statements in Part II, Item 8 of this Form 10-K for the carrying value and estimated remaining lives of our identifiable intangible assets by major asset class and the carrying value of our identifiable intangible assets by operating segment.
A prolonged period of market weakness could adversely impact our businesses and impair the value of our identifiable intangible assets. In addition, certain events could indicate a potential impairment of our identifiable intangible assets, including (i) changes in trading volumes or market structure that could adversely affect our NYSE DMM business (see discussion below), (ii) an adverse action or assessment by a regulator, (iii) adverse actual experience on the contracts in our variable annuity and life insurance business, (iv) decreases in cash receipts from television broadcast royalties or (v) decreases in revenues from commodity-related customer contracts and relationships. Management judgment is required to evaluate whether indications of potential impairment have occurred, and to test intangibles for impairment if required.
NYSE DMM Rights. During the fourth quarter of 2010, as a result of continuing weak operating results in our NYSE DMM business, we tested our NYSE DMM rights for impairment in accordance with Financial Accounting Standards Board Accounting Standards Codification (ASC) 360. Because the carrying value of our NYSE DMM rights exceeded the projected undiscounted cash flows over the estimated remaining useful life of our NYSE DMM rights, we determined that the rights were impaired. We recorded an impairment loss of $305 million, which was included in our Institutional Client Services segment in the fourth quarter of 2010. This impairment loss represented the excess of the carrying value of our NYSE DMM rights over their estimated fair value. We estimated this fair value, which is a level 3 measurement, using a relative value analysis which incorporated a comparison to another DMM portfolio that was transacted between third parties. As of December 2010, the carrying value of our NYSE DMM rights was $76 million.
43
Use of Estimates
The use of generally accepted accounting principles requires management to make certain estimates and assumptions. In addition to the estimates we make in connection with fair value measurements and the accounting for goodwill and identifiable intangible assets, the use of estimates and assumptions is also important in determining provisions for potential losses that may arise from litigation and regulatory proceedings and tax audits.
We estimate and provide for potential losses that may arise out of litigation and regulatory proceedings to the extent that such losses are probable and can be reasonably estimated. In accounting for income taxes, we estimate and provide for potential liabilities that may arise out of tax audits to the extent that uncertain tax positions fail to meet the recognition standard under ASC 740. See Note 26 to the consolidated financial statements in Part II, Item 8 of this Form 10-K for further information about accounting for income taxes.
Significant judgment is required in making these estimates and our final liabilities may ultimately be materially different. Our total estimated liability in respect of litigation and regulatory proceedings is determined on a case-by-case basis and represents an estimate of probable losses after considering, among other factors, the progress of each case or proceeding, our experience and the experience of others in similar cases or proceedings, and the opinions and views of legal counsel. See Note 30 to the consolidated financial statements in Part II, Item 8 of this Form 10-K for information on certain judicial, regulatory and legal proceedings.
Results of Operations
The composition of our net revenues has varied over time as financial markets and the scope of our operations have changed. The composition of net revenues can also vary over the shorter term due to fluctuations in U.S. and global economic and market conditions. See "Certain Risk Factors That May Affect Our Businesses" below and "Risk Factors" in Part I, Item 1A of this Form 10-K for a further discussion of the impact of economic and market conditions on our results of operations.
44
Financial Overview
The table below presents an overview of our financial results.
| Year Ended | One Month Ended | |||||||||||||||||
| December | December | November | December | |||||||||||||||
| $ in millions, except per share amounts | 2010 | 2009 | 2008 | 2008 | ||||||||||||||
Net revenues | $ | 39,161 | $ | 45,173 | $ | 22,222 | $ | 183 | ||||||||||
Pre-tax earnings/(loss) | 12,892 | 19,829 | 2,336 | (1,258 | ) | |||||||||||||
Net earnings/(loss) | 8,354 | 13,385 | 2,322 | (780 | ) | |||||||||||||
Net earnings/(loss) applicable to common shareholders | 7,713 | 12,192 | 2,041 | (1,028 | ) | |||||||||||||
Diluted earnings/(loss) per common share | 13.18 | 22.13 | 4.47 | (2.15 | ) | |||||||||||||
Return on average common shareholders' equity 1 | 11.5% | 22.5% | 4.9% | N.M. | ||||||||||||||
Diluted earnings per common share, excluding the impact of the U.K. bank payroll tax, the SEC settlement and the NYSE DMM rights impairment 2 | $ | 15.22 | N/A | N/A | N/A | |||||||||||||
Return on average common shareholders' equity, excluding the impact of the U.K. bank payroll tax, the SEC settlement and the NYSE DMM rights impairment 2 | 13.1% | N/A | N/A | N/A | ||||||||||||||
| 1. | ROE is computed by dividing net earnings applicable to common shareholders by average monthly common shareholders' equity. The table below presents our average common shareholders' equity. |
| Average for the | ||||||||||||||||||
| Year Ended | One Month Ended | |||||||||||||||||
| December | December | November | December | |||||||||||||||
| in millions | 2010 | 2009 | 2008 | 2008 | ||||||||||||||
Total shareholders' equity | $ | 74,257 | $ | 65,527 | $ | 47,167 | $ | 63,712 | ||||||||||
Preferred stock | (6,957 | ) | (11,363 | ) | (5,157 | ) | (16,477 | ) | ||||||||||
Common shareholders' equity | $ | 67,300 | $ | 54,164 | $ | 42,010 | $ | 47,235 | ||||||||||
| 2. | We believe that presenting our results excluding the impact of the U.K. bank payroll tax, the SEC settlement and the NYSE DMM rights impairment is meaningful, as excluding these items increases the comparability of period-to-period results. The tables below present the calculation of net earnings applicable to common shareholders, diluted earnings per common share and average common shareholders' equity excluding the impact of these amounts. |
| Year Ended | ||||||
| in millions, except per share amounts | December 2010 | |||||
Net earnings applicable to common shareholders | $ | 7,713 | ||||
Impact of the U.K. bank payroll tax | 465 | |||||
Pre-tax impact of the SEC settlement | 550 | |||||
Tax impact of the SEC settlement | (6 | ) | ||||
Pre-tax impact of the NYSE DMM rights impairment | 305 | |||||
Tax impact of the NYSE DMM rights impairment | (118 | ) | ||||
Net earnings applicable to common shareholders, excluding the impact of the U.K. bank payroll tax, the SEC settlement and the NYSE DMM rights impairment | $ | 8,909 | ||||
Divided by: average diluted common shares outstanding | 585.3 | |||||
Diluted earnings per common share, excluding the impact of the U.K. bank payroll tax, the SEC settlement and the NYSE DMM rights impairment | $ | 15.22 | ||||
| Average for the | ||||||
| Year Ended | ||||||
| in millions | December 2010 | |||||
Total shareholders' equity | $ | 74,257 | ||||
Preferred stock | (6,957 | ) | ||||
Common shareholders' equity | 67,300 | |||||
Impact of the U.K. bank payroll tax | 359 | |||||
Impact of the SEC settlement | 293 | |||||
Impact of the NYSE DMM rights impairment | 14 | |||||
Common shareholders' equity, excluding the impact of the U.K. bank payroll tax, the SEC settlement and the NYSE DMM rights impairment | $ | 67,966 | ||||
45
Net Revenues
2010 versus 2009. Net revenues were $39.16 billion for 2010, 13% lower than 2009, reflecting significantly lower net revenues in Institutional Client Services and slightly lower net revenues in Investment Banking. These decreases were partially offset by significantly higher net revenues in Investing & Lending and higher net revenues in Investment Management.
| • | Institutional Client Services. The decrease in Institutional Client Services reflected significantly lower net revenues in Fixed Income, Currency and Commodities Client Execution and, to a lesser extent, Equities. During 2010, Fixed Income, Currency and Commodities Client Execution operated in a challenging environment characterized by lower client activity levels, which reflected broad market concerns including European sovereign debt risk and uncertainty over regulatory reform, as well as tighter bid/offer spreads. The decrease in net revenues compared with a particularly strong 2009 primarily reflected significantly lower results in interest rate products, credit products, commodities and, to a lesser extent, currencies. These decreases were partially offset by higher net revenues in mortgages, as 2009 included approximately $1 billion of losses on commercial mortgage-related products. |
The decline in Equities compared with 2009 primarily reflected significantly lower net revenues in equities client execution, principally due to significantly lower results in derivatives and shares. Commissions and fees were also lower than 2009, primarily reflecting lower client activity levels. In addition, securities services net revenues were significantly lower compared with 2009, primarily reflecting tighter securities lending spreads, principally due to the impact of changes in the composition of customer balances, partially offset by the impact of higher average customer balances. During 2010, although equity markets were volatile during the first half of the year, equity prices generally improved and volatility levels declined in the second half of the year.
| • | Investment Banking. The decrease in Investment Banking reflected lower net revenues in our Underwriting business, partially offset by higher net revenues in Financial Advisory. The decline in Underwriting reflected lower net revenues in equity underwriting, principally due to a decline in client activity in comparison to 2009, which included significant capital-raising activity by financial institution clients. Net revenues in debt underwriting were essentially unchanged compared with 2009. The increase in Financial Advisory primarily reflected an increase in client activity. |
| • | Investing & Lending. During 2010, an increase in global equity markets and tighter credit spreads provided a favorable backdrop for our Investing & Lending business. Results in Investing & Lending for 2010 primarily reflected a gain of $747 million from our investment in the ordinary shares of ICBC, a net gain of $2.69 billion from other equity securities and a net gain of $2.60 billion from debt securities and loans. In 2009, results in Investing & Lending primarily reflected a gain of $1.58 billion from our investment in the ordinary shares of ICBC, a net gain of $1.05 billion from debt securities and loans, and a net loss of $596 million from other equity securities. |
| • | Investment Management. The increase in Investment Management primarily reflected higher incentive fees across our alternative investment products. Management and other fees also increased, reflecting favorable changes in the mix of assets under management, as well as the impact of appreciation in the value of client assets. During 2010, assets under management decreased 4% to $840 billion, primarily reflecting outflows in money market assets, consistent with industry trends. |
46
2009 versus 2008. Net revenues were $45.17 billion in 2009, more than double the amount in 2008, reflecting significantly improved results in Investing & Lending, as well as significantly higher net revenues in Institutional Client Services. These increases were partially offset by lower net revenues in Investment Management and Investment Banking.
| • | Investing & Lending. The increase in Investing & Lending primarily reflected net gains from debt securities and loans and from our investment in the ordinary shares of ICBC, compared with net losses in 2008, as well as lower net losses from other equity securities. In 2009, results in Investing & Lending primarily reflected a gain of $1.58 billion from our investment in the ordinary shares of ICBC, a net gain of $1.05 billion from debt securities and loans and a net loss of $596 million from other equity securities. During 2009, our Investing & Lending results reflected a recovery in global credit and equity markets following significant weakness during 2008. However, continued weakness in commercial real estate markets negatively impacted our results during 2009. In 2008, results in Investing & Lending primarily reflected a loss of $446 million from our investment in the ordinary shares of ICBC, a net loss of $6.33 billion from debt securities and loans and a net loss of $5.95 billion from other equity securities. |
| • | Institutional Client Services. The increase in Institutional Client Services reflected a very strong performance in Fixed Income, Currency and Commodities Client Execution. During 2009, Fixed Income, Currency and Commodities Client Execution operated in an environment characterized by strong client-driven activity, particularly in more liquid products. In addition, asset values generally improved and corporate credit spreads tightened significantly for most of the year. Net revenues in Fixed Income, Currency and Commodities Client Execution were significantly higher compared with 2008, reflecting particularly strong performances in credit products, mortgages and interest rate products, which were each significantly higher than 2008. Net revenues in commodities were also particularly strong and were higher than 2008, while net revenues in currencies were strong, but lower than a particularly strong 2008. During 2009, mortgages included approximately $1 billion of losses on commercial mortgage-related products. Fixed Income, Currency and Commodities Client Execution results in 2008 included a loss of approximately $3.1 billion (net of hedges) related to non-investment-grade credit origination activities. In addition, results in mortgages in 2008 included net losses of approximately |
| $900 million on residential mortgage-related products and approximately $600 million on commercial mortgage-related products. |
Net revenues in Equities for 2009 were lower compared with a particularly strong 2008, reflecting significant decreases in securities services and commissions and fees. The decrease in securities services primarily reflected the impact of lower customer balances, reflecting lower hedge fund industry assets and reduced leverage. The decrease in commissions and fees primarily reflected lower average market levels in Europe and Asia, as well as lower transaction volumes compared with 2008. These decreases were partially offset by strong results in equities client execution, primarily reflecting higher net revenues in derivatives and shares. During 2009, Equities operated in an environment characterized by a significant increase in global equity prices and a significant decline in volatility levels.
| • | Investment Management. The decrease in Investment Management primarily reflected the impact of changes in the composition of assets managed, principally due to equity market depreciation during the fourth quarter of 2008, as well as lower incentive fees. During 2009, assets under management increased $73 billion to $871 billion, due to $76 billion of market appreciation, primarily in fixed income and equity assets, partially offset by $3 billion of net outflows. Outflows in money market assets were offset by inflows in fixed income assets. |
| • | Investment Banking. The decrease in Investment Banking reflected significantly lower net revenues in Financial Advisory, partially offset by higher net revenues in our Underwriting business. The decrease in Financial Advisory reflected a decline in industry-wide completed mergers and acquisitions. The increase in Underwriting reflected higher net revenues in equity underwriting, primarily reflecting an increase in industry-wide equity and equity-related offerings, including significant capital-raising activity by financial institution clients during 2009. Net revenues in debt underwriting were lower than 2008, primarily reflecting significantly lower net revenues from leveraged finance activity, partially offset by significantly higher net revenues from investment-grade and municipal activity. |
47
One Month Ended December 2008. Net revenues were $183 million for the month of December 2008. These results reflected a continuation of the difficult operating environment experienced during our fiscal fourth quarter of 2008, particularly across global equity and credit markets.
| • | Investing & Lending. Investing & Lending recorded negative net revenues of $1.63 billion for the month of December 2008. During the month of December, continued weakness in global equity and credit markets negatively impacted results in our Investing & Lending business. Results for December 2008 primarily reflected net losses of $1.08 billion from equity securities (excluding ICBC) and $856 million from debt securities and loans, partially offset by a gain of $228 million from our investment in the ordinary shares of ICBC. |
| • | Institutional Client Services. Net revenues in Institutional Client Services were $1.33 billion for the month of December 2008. During the month of December, market opportunities were favorable for certain of our Fixed Income, Currency and Commodities Client Execution product areas, as interest rate products, commodities and currencies each produced strong results. However, the environment for Fixed Income, Currency and Commodities Client Execution also reflected continued weakness in the broader credit markets, as results in credit products included a loss of approximately $1 billion (net of hedges) related to non-investment-grade credit origination activities, primarily reflecting a writedown of approximately $850 million related to the bridge and bank loan facilities held in LyondellBasell Finance Company. In addition, results in mortgages included a loss of approximately $400 million on commercial mortgage-related products. |
Results in Equities reflected lower commission volumes, as well as lower client execution net revenues from derivatives compared with average monthly levels in 2008. Net revenues in securities services were also lower compared with average monthly levels in 2008, reflecting a decline in total average customer balances, partially offset by the impact of favorable changes in the composition of securities lending balances. During the month of December, Equities operated in an environment characterized by continued weakness in global equity markets and continued high levels of volatility.
| • | Investment Banking. Net revenues in Investment Banking were $138 million for the month of December 2008 and reflected very low levels of activity in industry-wide completed mergers and acquisitions, as well as continued challenging market conditions across equity and leveraged finance markets, which adversely affected our Underwriting business. |
| • | Investment Management. Net revenues in Investment Management were $343 million for the month of December 2008. During the calendar month of December, assets under management increased $19 billion to $798 billion, due to $13 billion of market appreciation, primarily in fixed income and equity assets, and $6 billion of net inflows. Net inflows reflected inflows in money market assets, partially offset by outflows in fixed income, equity and alternative investment assets. |
Net Interest Income
2010 versus 2009. Net revenues for 2010 included net interest income of $5.50 billion, 26% lower than 2009. The decrease compared with 2009 was primarily due to lower average fixed income assets, most notably U.S. federal agency obligations, higher interest expense related to our long-term borrowings and tighter securities lending spreads.
2009 versus 2008. Net revenues for 2009 included net interest income of $7.41 billion, 73% higher than 2008. The increase compared with 2008 was primarily due to lower interest expense on our long-term and short-term borrowings, partially offset by tighter spreads on collateralized financing activity, as well as lower average customer margin lending balances and financial instruments owned, at fair value.
One Month Ended December 2008. Net revenues included net interest income of $685 million for the month of December 2008. The increase compared with average monthly net interest income in 2008 was primarily due to higher average fixed income assets, most notably U.S. federal agency obligations.
Operating Expenses
Our operating expenses are primarily influenced by compensation, headcount and levels of business activity. Compensation and benefits includes salaries, discretionary compensation, amortization of equity awards and other items such as benefits. Discretionary compensation is significantly impacted by, among other factors, the level of net revenues, prevailing labor markets, business mix, the structure of our share-based compensation programs and the external environment.
48
The table below presents our operating expenses and total staff.
| Year Ended | One Month Ended | |||||||||||||||||
| December | December | November | December | |||||||||||||||
| $ in millions | 2010 | 2009 | 2008 | 2008 | ||||||||||||||
Compensation and benefits | $ | 15,376 | $ | 16,193 | $ | 10,934 | $ | 744 | ||||||||||
U.K. bank payroll tax | 465 | - | - | - | ||||||||||||||
Brokerage, clearing, exchange and distribution fees | 2,281 | 2,298 | 2,998 | 165 | ||||||||||||||
Market development | 530 | 342 | 485 | 16 | ||||||||||||||
Communications and technology | 758 | 709 | 759 | 62 | ||||||||||||||
Depreciation and amortization | 1,889 | 1,734 | 1,262 | 111 | ||||||||||||||
Occupancy | 1,086 | 950 | 960 | 82 | ||||||||||||||
Professional fees | 927 | 678 | 779 | 58 | ||||||||||||||
Other expenses | 2,957 | 2,440 | 1,709 | 203 | ||||||||||||||
Total non-compensation expenses | 10,428 | 9,151 | 8,952 | 697 | ||||||||||||||
Total operating expenses | $ | 26,269 | $ | 25,344 | $ | 19,886 | $ | 1,441 | ||||||||||
Total staff at period-end 1 | 35,700 | 32,500 | 34,500 | 33,300 | ||||||||||||||
Total staff at period-end including consolidated entities held for investment purposes 2 | 38,700 | 36,200 | 39,200 | 38,000 | ||||||||||||||
| 1. | Includes employees, consultants and temporary staff. |
| 2. | Compensation and benefits and non-compensation expenses related to consolidated entities held for investment purposes are included in their respective line items in the consolidated statements of earnings. Consolidated entities held for investment purposes are entities that are held strictly for capital appreciation, have a defined exit strategy and are engaged in activities that are not closely related to our principal businesses. |
2010 versus 2009. Operating expenses were $26.27 billion for 2010, 4% higher than 2009. Compensation and benefits expenses were $15.38 billion for 2010, a 5% decline compared with $16.19 billion for 2009, due to lower net revenues. The ratio of compensation and benefits to net revenues for 2010 was 39.3% 1 (which excludes the impact of the $465 million U.K. bank payroll tax), compared with 35.8% for 2009. Total staff increased 10% during 2010. Total staff including consolidated entities held for investment purposes increased 7% during 2010.
During 2010, the United Kingdom enacted legislation that imposed a non-deductible 50% tax on certain financial institutions in respect of discretionary bonuses in excess of £25,000 awarded under arrangements made between December 9, 2009 and April 5, 2010 to "relevant banking employees." Our operating expenses for 2010 included $465 million related to this tax.
| 1. | We believe that presenting our ratio of compensation and benefits to net revenues excluding the impact of the U.K. bank payroll tax is meaningful, as excluding this item increases the comparability of period-to-period results. |
| Year Ended | ||||||
| $ in millions | December 2010 | |||||
Compensation and benefits (which excludes the impact of the $465 million U.K. bank payroll tax) | $ | 15,376 | ||||
Ratio of compensation and benefits to net revenues | 39.3% | |||||
Compensation and benefits, including the impact of the $465 million U.K. bank payroll tax | $ | 15,841 | ||||
Ratio of compensation and benefits to net revenues, including the impact of the $465 million U.K. bank payroll tax | 40.5% | |||||
49
Non-compensation expenses were $10.43 billion for 2010, 14% higher than 2009. This increase was primarily attributable to the impact of net provisions for litigation and regulatory proceedings of $682 million, including $550 million related to the SEC settlement (see Note 30 to the consolidated financial statements in Part II, Item 8 of this Form 10-K for further information), and an impairment of our NYSE DMM rights of $305 million, each during 2010. The remainder of the increase compared with 2009 generally reflected higher professional fees, market development expenses and occupancy expenses. These increases were partially offset by the impact of significantly higher real estate impairment charges during 2009 related to our consolidated entities held for investment purposes, as well as higher charitable contributions during 2009. The real estate impairment charges, which were measured based on discounted cash flow analyses, are included in our Investing & Lending segment and reflected weakness in the commercial real estate markets. Charitable contributions were approximately $420 million during 2010, primarily including $25 million to The Goldman Sachs Foundation and $320 million to Goldman Sachs Gives, our donor-advised fund. Compensation was reduced to fund the charitable contribution to Goldman Sachs Gives. The firm asks its participating managing directors to make recommendations regarding potential charitable recipients for this contribution.
2009 versus 2008. Operating expenses were $25.34 billion for 2009, 27% higher than 2008. Compensation and benefits expenses of $16.19 billion were higher compared with 2008, due to higher net revenues. Our ratio of compensation and benefits to net revenues for 2009 was 35.8%, down from 48.0% (excluding severance costs of approximately $275 million in the fourth quarter of 2008) for 2008. Total staff decreased 2% during 2009. Total staff including consolidated entities held for investment purposes decreased 5% during 2009.
Non-compensation expenses were $9.15 billion for 2009, 2% higher than 2008. The increase compared with 2008 reflected the impact of charitable contributions of approximately $850 million during 2009, primarily including $310 million to The Goldman Sachs Foundation and $500 million to Goldman Sachs Gives. Compensation was reduced to fund the charitable contribution to Goldman Sachs Gives. The firm asks its participating managing directors to make recommendations regarding potential charitable recipients for this contribution. Depreciation and amortization expenses also increased compared with 2008 and included real estate impairment charges of approximately $600 million related to consolidated entities held for investment purposes during 2009. The real estate impairment charges, which were measured based on discounted cash flow analyses, are included in our Investing & Lending segment and reflected weakness in the commercial real estate markets, particularly in Asia. These increases were partially offset by the impact of lower brokerage, clearing, exchange and distribution fees, principally reflecting lower transaction volumes in Equities, and the impact of reduced staff levels and expense reduction initiatives during 2009.
One Month Ended December 2008. Operating expenses were $1.44 billion for the month of December 2008. Compensation and benefits expenses were $744 million. No discretionary compensation was accrued for the month of December. Total staff decreased 3% compared with the end of fiscal year 2008. Total staff including consolidated entities held for investment purposes decreased 3% compared with the end of fiscal year 2008.
Non-compensation expenses of $697 million for the month of December 2008 were generally lower than average monthly levels in 2008, primarily reflecting lower levels of business activity. Total non-compensation expenses included $68 million of net provisions for a number of litigation and regulatory proceedings.
50
Provision for Taxes
The effective income tax rate for 2010, excluding the impact of the $465 million U.K. bank payroll tax and the $550 million SEC settlement, substantially all of which is non-deductible, was 32.7% 1 , essentially unchanged from 2009. Including the impact of these amounts, the effective income tax rate was 35.2% for 2010.
The effective income tax rate for 2009 was 32.5%, compared with approximately 1% for 2008. The increase in the effective income tax rate for 2009 compared with 2008 was primarily due to changes in the geographic earnings mix and a decrease in permanent benefits as a percentage of higher earnings. The effective income tax rate for 2009 represented a return to a geographic earnings mix that is more in line with our historic earnings mix. During 2008, we incurred losses in various U.S. and
non-U.S. entities whose income/(losses) are subject to tax in the U.S. We also had profitable operations in certain non-U.S. entities that are taxed at their applicable local tax rates, which are generally lower than the U.S. rate.
The effective income tax rate for the month of December 2008 was 38.0%.
Effective January 1, 2010, the rules related to the deferral of U.S. tax on certain non-repatriated active financing income expired. During December 2010, the rules were extended retroactively through December 31, 2011. If these rules are not extended beyond December 2011, the expiration may materially increase our effective income tax rate beginning in 2012.
| 1. | We believe that presenting our effective income tax rate excluding the impact of the U.K. bank payroll tax and the SEC settlement, substantially all of which is non-deductible, is meaningful, as excluding these items increases the comparability of period-to-period results. The table below presents the calculation of the effective income tax rate excluding the impact of these amounts. |
| Year Ended December 2010 | ||||||||||||||
| Pre-tax | Provision | Effective income | ||||||||||||
| $ in millions | earnings | for taxes | tax rate | |||||||||||
As reported | $ | 12,892 | $ | 4,538 | 35.2% | |||||||||
Add back: | ||||||||||||||
Impact of the U.K. bank payroll tax | 465 | - | ||||||||||||
Impact of the SEC settlement | 550 | 6 | ||||||||||||
As adjusted | $ | 13,907 | $ | 4,544 | 32.7% | |||||||||
51
Segment Operating Results
The table below presents the net revenues, operating expenses and pre-tax earnings/(loss) of our segments.
| One Month | ||||||||||||||||||||
| Year Ended | Ended | |||||||||||||||||||
| December | December | November | December | |||||||||||||||||
| in millions | 2010 | 2009 | 2008 | 2008 | ||||||||||||||||
Investment Banking | Net revenues | $ | 4,810 | $ | 4,984 | $ | 5,453 | $ | 138 | |||||||||||
| Operating expenses | 3,511 | 3,482 | 3,269 | 170 | ||||||||||||||||
| Pre-tax earnings/(loss) | $ | 1,299 | $ | 1,502 | $ | 2,184 | $ | (32 | ) | |||||||||||
Institutional Client Services | Net revenues | $ | 21,796 | $ | 32,719 | $ | 22,345 | $ | 1,332 | |||||||||||
| Operating expenses | 14,291 | 13,691 | 10,294 | 736 | ||||||||||||||||
| Pre-tax earnings | $ | 7,505 | $ | 19,028 | $ | 12,051 | $ | 596 | ||||||||||||
Investing & Lending | Net revenues | $ | 7,541 | $ | 2,863 | $ | (10,821 | ) | $ | (1,630 | ) | |||||||||
| Operating expenses | 3,361 | 3,523 | 2,719 | 204 | ||||||||||||||||
| Pre-tax earnings/(loss) | $ | 4,180 | $ | (660 | ) | $ | (13,540 | ) | $ | (1,834 | ) | |||||||||
Investment Management | Net revenues | $ | 5,014 | $ | 4,607 | $ | 5,245 | $ | 343 | |||||||||||
| Operating expenses | 4,051 | 3,673 | 3,528 | 263 | ||||||||||||||||
| Pre-tax earnings | $ | 963 | $ | 934 | $ | 1,717 | $ | 80 | ||||||||||||
Total | Net revenues | $ | 39,161 | $ | 45,173 | $ | 22,222 | $ | 183 | |||||||||||
| Operating expenses 1 | 26,269 | 25,344 | 19,886 | 1,441 | ||||||||||||||||
| Pre-tax earnings/(loss) | $ | 12,892 | $ | 19,829 | $ | 2,336 | $ | (1,258 | ) | |||||||||||
| 1. | Includes the following expenses that have not been allocated to our segments: (i) charitable contributions of $345 million and $810 million for the years ended December 2010 and December 2009, respectively; (ii) net provisions for a number of litigation and regulatory proceedings of $682 million, $104 million, $(4) million and $68 million for the years ended December 2010, December 2009 and November 2008 and one month ended December 2008, respectively; and (iii) real estate-related exit costs of $28 million, $61 million and $80 million for the years ended December 2010, December 2009 and November 2008, respectively. |
Net revenues in our segments include allocations of interest income and interest expense to specific securities, commodities and other positions in relation to the cash generated by, or funding requirements of, such underlying positions. See Note 27 to the consolidated financial statements in Part II, Item 8 of this Form 10-K for further information about our business segments.
The cost drivers of Goldman Sachs taken as a whole - compensation, headcount and levels of business activity - are broadly similar in each of our business segments. Compensation and benefits expenses within our segments reflect, among other factors, the overall performance of Goldman Sachs as well as the performance of individual businesses. Consequently, pre-tax margins in one segment of our business may be significantly affected by the performance of our other business segments. A discussion of segment operating results follows.
52
Investment Banking
Our Investment Banking segment is comprised of:
Financial Advisory. Includes advisory assignments with respect to mergers and acquisitions, divestitures, corporate defense activities, risk management, restructurings and spin-offs.
Underwriting. Includes public offerings and private placements of a wide range of securities, loans and other financial instruments, and derivative transactions directly related to these client underwriting activities.
The table below presents the operating results of our Investment Banking segment.
| Year Ended | One Month Ended | |||||||||||||||||
| December | December | November | December | |||||||||||||||
| in millions | 2010 | 2009 | 2008 | 2008 | ||||||||||||||
Financial Advisory | $ | 2,062 | $ | 1,897 | $ | 2,663 | $ | 73 | ||||||||||
Equity underwriting | 1,462 | 1,797 | 1,415 | 19 | ||||||||||||||
Debt underwriting | 1,286 | 1,290 | 1,375 | 46 | ||||||||||||||
Total Underwriting | 2,748 | 3,087 | 2,790 | 65 | ||||||||||||||
Total net revenues | 4,810 | 4,984 | 5,453 | 138 | ||||||||||||||
Operating expenses | 3,511 | 3,482 | 3,269 | 170 | ||||||||||||||
Pre-tax earnings/(loss) | $ | 1,299 | $ | 1,502 | $ | 2,184 | $ | (32 | ) | |||||||||
The table below presents our financial advisory and underwriting transaction volumes. 1
| Year Ended | One Month Ended | |||||||||||||||||
| December | December | November | December | |||||||||||||||
| in billions | 2010 | 2009 | 2008 | 2008 | ||||||||||||||
Announced mergers and acquisitions | $ | 542 | $ | 533 | $ | 914 | $ | 18 | ||||||||||
Completed mergers and acquisitions | 425 | 591 | 874 | 12 | ||||||||||||||
Equity and equity-related offerings 2 | 66 | 83 | 64 | 2 | ||||||||||||||
Debt offerings 3 | 229 | 256 | 165 | 19 | ||||||||||||||
| 1. | Source: Thomson Reuters. Announced and completed mergers and acquisitions volumes are based on full credit to each of the advisors in a transaction. Equity and equity-related offerings and debt offerings are based on full credit for single book managers and equal credit for joint book managers. Transaction volumes may not be indicative of net revenues in a given period. In addition, transaction volumes for prior periods may vary from amounts previously reported due to the subsequent withdrawal or a change in the value of a transaction. |
| 2. | Includes Rule 144A and public common stock offerings, convertible offerings and rights offerings. |
| 3. | Includes non-convertible preferred stock, mortgage-backed securities, asset-backed securities and taxable municipal debt. Includes publicly registered and Rule 144A issues. Excludes leveraged loans. |
2010 versus 2009 . Net revenues in Investment Banking were $4.81 billion for 2010, 3% lower than 2009.
Net revenues in Financial Advisory were $2.06 billion, 9% higher than 2009, primarily reflecting an increase in client activity. Net revenues in our Underwriting business were $2.75 billion, 11% lower than 2009, reflecting lower net revenues in equity underwriting, principally due to a decline in client activity in comparison to 2009, which included significant capital-raising activity by financial institution clients. Net revenues in debt underwriting were essentially unchanged compared with 2009.
Our investment banking transaction backlog decreased compared with the end of 2009. Our investment banking transaction backlog represents an estimate of our future net revenues from investment banking transactions where we believe that future revenue realization is more likely than not. The decrease compared with the end of 2009 reflected a decline in estimated net revenues from potential debt and equity underwriting transactions, primarily related to client mandates to underwrite leveraged finance transactions and common stock offerings. This decrease was partially offset by an increase in estimated net revenues from potential advisory transactions.
Operating expenses were $3.51 billion for 2010, essentially unchanged from 2009. Pre-tax earnings were $1.30 billion in 2010, 14% lower than 2009.
53
2009 versus 2008 . Net revenues in Investment Banking were $4.98 billion for 2009, 9% lower than 2008.
Net revenues in Financial Advisory were $1.90 billion for 2009, 29% lower than 2008, reflecting a decline in industry-wide completed mergers and acquisitions. Net revenues in our Underwriting business were $3.09 billion, 11% higher than 2008, due to higher net revenues in equity underwriting, primarily reflecting an increase in industry-wide equity and equity-related offerings, including significant capital-raising activity by financial institution clients during 2009. Net revenues in debt underwriting were lower than 2008, primarily reflecting significantly lower net revenues from leveraged finance activity, partially offset by significantly higher net revenues from investment-grade and municipal activity.
Our investment banking transaction backlog increased significantly during the twelve months ended December 2009. The increase was primarily due to potential equity and debt underwriting transactions from client mandates to underwrite initial public offerings and, to a lesser extent, leveraged finance transactions, principally due to increased levels of client activity. The advisory backlog also increased, but was not a material contributor to the change.
Operating expenses were $3.48 billion for 2009, 7% higher than 2008, due to increased compensation and benefits expenses. Pre-tax earnings were $1.50 billion in 2009, 31% lower than 2008.
One Month Ended December 2008. Net revenues in Investment Banking were $138 million for the month of December 2008. Net revenues in Financial Advisory were $73 million, reflecting very low levels of industry-wide completed mergers and acquisitions activity. Net revenues in our Underwriting business were $65 million, reflecting continued challenging market conditions across equity and leveraged finance markets.
Our investment banking transaction backlog decreased during the one month ended December 2008. The decrease in backlog was primarily due to a decline in potential advisory transactions, principally due to a decline in client activity.
Operating expenses were $170 million for the month of December 2008. Pre-tax loss was $32 million for the month of December 2008.
Institutional Client Services
Our Institutional Client Services segment is comprised of:
Fixed Income, Currency and Commodities Client Execution. Includes client execution activities related to making markets in interest rate products, credit products, mortgages, currencies and commodities.
Equities. Includes client execution activities related to making markets in equity products, as well as commissions and fees from executing and clearing institutional client transactions on major stock, options and futures exchanges worldwide. Equities also includes our securities services business, which provides financing, securities lending and other prime brokerage services to institutional clients, including hedge funds, mutual funds, pension funds and foundations, and generates revenues primarily in the form of interest rate spreads or fees.
The table below presents the operating results of our Institutional Client Services segment.
| Year Ended | One Month Ended | |||||||||||||||||
| December | December | November | December | |||||||||||||||
| in millions | 2010 | 2009 | 2008 | 2008 | ||||||||||||||
Fixed Income, Currency and Commodities Client Execution | $ | 13,707 | $ | 21,883 | $ | 9,318 | $ | 446 | ||||||||||
Equities client execution | 3,231 | 5,237 | 4,950 | 420 | ||||||||||||||
Commissions and fees | 3,426 | 3,680 | 4,826 | 239 | ||||||||||||||
Securities services | 1,432 | 1,919 | 3,251 | 227 | ||||||||||||||
Total Equities | 8,089 | 10,836 | 13,027 | 886 | ||||||||||||||
Total net revenues | 21,796 | 32,719 | 22,345 | 1,332 | ||||||||||||||
Operating expenses | 14,291 | 13,691 | 10,294 | 736 | ||||||||||||||
Pre-tax earnings | $ | 7,505 | $ | 19,028 | $ | 12,051 | $ | 596 | ||||||||||
54
2010 versus 2009. Net revenues in Institutional Client Services were $21.80 billion for 2010, 33% lower than 2009.
Net revenues in Fixed Income, Currency and Commodities Client Execution were $13.71 billion for 2010, 37% lower than a particularly strong 2009. During 2010, Fixed Income, Currency and Commodities Client Execution operated in a challenging environment characterized by lower client activity levels, which reflected broad market concerns including European sovereign debt risk and uncertainty over regulatory reform, as well as tighter bid/offer spreads. The decrease in net revenues compared with 2009 primarily reflected significantly lower results in interest rate products, credit products, commodities and, to a lesser extent, currencies. These decreases were partially offset by higher net revenues in mortgages, as 2009 included approximately $1 billion of losses on commercial mortgage-related products.
Certain unfavorable conditions emerged during the second quarter of 2010 that made the environment more challenging for our businesses, resulting in lower client activity levels. These conditions included broad market concerns, such as European sovereign debt risk and uncertainty regarding financial regulatory reform, sharply higher equity volatility levels, lower global equity prices and wider corporate credit spreads. In addition, a more competitive environment drove tighter bid/offer spreads. During the second half of 2010, some of these conditions reversed as equity volatility levels decreased, global equity prices recovered and corporate credit spreads narrowed. However, lower client activity levels, reflecting broad market concerns, including European sovereign debt risk and uncertainty over regulatory reform, continued to negatively impact our results. If these concerns were to continue over the long term, net revenues in Fixed Income, Currency and Commodities Client Execution would likely continue to be negatively impacted.
Net revenues in Equities were $8.09 billion for 2010, 25% lower than 2009, primarily reflecting significantly lower net revenues in equities client execution, principally due to significantly lower results in derivatives and shares. Commissions and fees were also lower than 2009, primarily reflecting lower client activity levels. In addition, securities services net revenues were significantly lower compared with 2009, primarily reflecting tighter securities lending spreads, principally due to the impact of changes in the composition of customer balances, partially offset by the impact of higher average customer balances. During 2010, although equity markets were volatile during the first half of the year, equity prices generally improved and volatility levels declined in the second half of the year.
Operating expenses were $14.29 billion for 2010, 4% higher than 2009, due to the impact of the U.K. bank payroll tax, as well as an impairment of our NYSE DMM rights of $305 million. These increases were partially offset by lower compensation and benefits expenses, resulting from lower levels of discretionary compensation. Pre-tax earnings were $7.51 billion in 2010, 61% lower than 2009.
2009 versus 2008 . Net revenues in Institutional Client Services were $32.72 billion for 2009, 46% higher compared with 2008.
Net revenues in Fixed Income, Currency and Commodities Client Execution were $21.88 billion for 2009, significantly higher compared with 2008. During 2009, Fixed Income, Currency and Commodities Client Execution operated in an environment characterized by strong client-driven activity, particularly in more liquid products. In addition, asset values generally improved and corporate credit spreads tightened significantly for most of the year. The increase in net revenues compared with 2008 reflected particularly strong performances in credit products, mortgages and interest rate products, which were each significantly higher than 2008. Net revenues in commodities were also particularly strong and were higher than 2008, while net revenues in currencies were strong, but lower than a particularly strong 2008. During 2009, mortgages included approximately $1 billion of losses on commercial mortgage-related products. Fixed Income, Currency and Commodities Client Execution results in 2008 included a loss of approximately $3.1 billion (net of hedges) related to non-investment-grade credit origination activities. In addition, results in mortgages in 2008 included net losses of approximately $900 million on residential mortgage-related products and approximately $600 million on commercial mortgage-related products.
Net revenues in Equities were $10.84 billion for 2009, 17% lower than a particularly strong 2008, reflecting significant decreases in securities services and commissions and fees. The decrease in securities services primarily reflected the impact of lower customer balances, reflecting lower hedge fund industry assets and reduced leverage. The decrease in commissions and fees primarily reflected lower average market levels in Europe and Asia, as well as lower transaction volumes compared with 2008. These decreases were partially offset by strong results in equities client execution, primarily reflecting higher net revenues in derivatives and shares. During 2009, Equities operated in an environment characterized by a significant increase in global equity prices and a significant decline in volatility levels.
55
Operating expenses were $13.69 billion for 2009, 33% higher than 2008, due to increased compensation and benefits expenses, resulting from higher net revenues. This increase was partially offset by lower brokerage, clearing, exchange and distribution fees, principally reflecting lower transaction volumes in Equities. Pre-tax earnings were $19.03 billion in 2009, 58% higher than 2008.
One Month Ended December 2008. Institutional Client Services net revenues were $1.33 billion for the month of December 2008.
Fixed Income, Currency and Commodities Client Execution recorded net revenues of $446 million for the month of December 2008. During the month of December, market opportunities were favorable for certain of our Fixed Income, Currency and Commodities Client Execution product areas, as interest rate products, commodities and currencies each produced strong results. However, the environment for Fixed Income, Currency and Commodities Client Execution also reflected continued weakness in the broader credit markets, as results in credit products included a loss of approximately $1 billion (net of hedges) related to non-investment-grade credit origination activities, primarily reflecting a writedown of approximately $850 million related to the bridge and bank loan facilities held in LyondellBasell Finance Company. In addition, results in mortgages included a loss of approximately $400 million on commercial mortgage-related products.
Net revenues in Equities were $886 million for the month of December 2008. These results reflected lower commission volumes, as well as lower client execution net revenues from derivatives compared with average monthly levels in 2008. Net revenues in securities services were also lower compared with average monthly levels in 2008, reflecting a decline in total average customer balances, partially offset by the impact of favorable changes in the composition of securities lending balances. During the month of December, Equities operated in an environment characterized by continued weakness in global equity markets and continued high levels of volatility.
Operating expenses were $736 million for the month of December 2008. Pre-tax earnings were $596 million for the month of December 2008.
Investing & Lending
Investing & Lending includes our investing activities and the origination of loans to provide financing to clients. These investments and loans are typically longer-term in nature. We make investments, directly and indirectly through funds that we manage, in debt securities, loans, public and private equity securities, real estate, consolidated investment entities and power generation facilities.
The table below presents the operating results of our Investing & Lending segment.
| Year Ended | One Month Ended | |||||||||||||||||
| December | December | November | December | |||||||||||||||
| in millions | 2010 | 2009 | 2008 | 2008 | ||||||||||||||
ICBC | $ | 747 | $ | 1,582 | $ | (446 | ) | $ | 228 | |||||||||
Equity securities (excluding ICBC) | 2,692 | (596 | ) | (5,953 | ) | (1,076 | ) | |||||||||||
Debt securities and loans | 2,597 | 1,045 | (6,325 | ) | (856 | ) | ||||||||||||
Other 1 | 1,505 | 832 | 1,903 | 74 | ||||||||||||||
Total net revenues | 7,541 | 2,863 | (10,821 | ) | (1,630 | ) | ||||||||||||
Operating expenses | 3,361 | 3,523 | 2,719 | 204 | ||||||||||||||
Pre-tax earnings/(loss) | $ | 4,180 | $ | (660 | ) | $ | (13,540 | ) | $ | (1,834 | ) | |||||||
| 1. | Primarily includes results related to our consolidated entities held for investment purposes. |
2010 versus 2009 . Investing & Lending recorded net revenues of $7.54 billion for 2010. During 2010, an increase in global equity markets and tighter credit spreads provided a favorable backdrop for our Investing & Lending business. Results for 2010 primarily reflected a gain of $747 million from our investment in the ordinary shares of ICBC, a net gain of $2.69 billion from other equity securities and a net gain of $2.60 billion from debt securities and loans.
Operating expenses were $3.36 billion for 2010, 5% lower than 2009, due to the impact of significantly higher real estate impairment charges during 2009 related to consolidated entities held for investment purposes, as well as decreased compensation and benefits expenses, resulting from lower levels of discretionary compensation. Pre-tax earnings were $4.18 billion in 2010, compared with a pre-tax loss of $660 million for 2009.
56
2009 versus 2008. Investing & Lending recorded net revenues of $2.86 billion for 2009. These results primarily reflected a gain of $1.58 billion from our investment in the ordinary shares of ICBC, a net gain of $1.05 billion from debt securities and loans and a net loss of $596 million from other equity securities. During 2009, our Investing & Lending results reflected a recovery in global credit and equity markets following significant weakness during 2008. However, continued weakness in commercial real estate markets negatively impacted our results during 2009. In 2008, results in Investing & Lending primarily reflected a loss of $446 million from our investment in the ordinary shares of ICBC, a net loss of $6.33 billion from debt securities and loans and a net loss of $5.95 billion from other equity securities.
Operating expenses were $3.52 billion for 2009, 30% higher than 2008, due to increased compensation and benefits expenses, resulting from higher net revenues. Pre-tax loss was $660 million in 2009 compared with a pre-tax loss of $13.54 billion in 2008.
One Month Ended December 2008. Investing & Lending recorded negative net revenues of $1.63 billion for the month of December 2008. During the month of December, continued weakness in global equity and credit markets negatively impacted results in our Investing & Lending business. Results for December 2008 primarily reflected net losses of $1.08 billion from equity securities (excluding ICBC)
and $856 million from debt securities and loans, partially offset by a gain of $228 million from our investment in the ordinary shares of ICBC.
Operating expenses were $204 million for the month of December 2008. Pre-tax loss was $1.83 billion for the month of December 2008.
Investment Management
Investment Management provides investment management services and offers investment products (primarily through separately managed accounts and commingled vehicles, such as mutual funds and private investment funds) across all major asset classes to a diverse set of institutional and individual clients. Investment Management also offers wealth advisory services, including portfolio management and financial counseling, and brokerage and other transaction services to high-net-worth individuals and families.
Assets under management typically generate fees as a percentage of net asset value, which vary by asset class and are affected by investment performance as well as asset inflows and redemptions. In certain circumstances, we are also entitled to receive incentive fees based on a percentage of a fund's return or when the return exceeds a specified benchmark or other performance targets. Incentive fees are recognized when all material contingencies are resolved.
57
The table below presents the operating results of our Investment Management segment.
| Year Ended | One Month Ended | |||||||||||||||||
| December | December | November | December | |||||||||||||||
| in millions | 2010 | 2009 | 2008 | 2008 | ||||||||||||||
Management and other fees | $ | 3,956 | $ | 3,860 | $ | 4,346 | $ | 320 | ||||||||||
Incentive fees | 527 | 180 | 301 | 2 | ||||||||||||||
Transaction revenues | 531 | 567 | 598 | 21 | ||||||||||||||
Total net revenues | 5,014 | 4,607 | 5,245 | 343 | ||||||||||||||
Operating expenses | 4,051 | 3,673 | 3,528 | 263 | ||||||||||||||
Pre-tax earnings | $ | 963 | $ | 934 | $ | 1,717 | $ | 80 | ||||||||||
Assets under management include only those client assets where we earn a fee for managing assets on a discretionary basis. This includes assets in our mutual funds, hedge funds, private equity funds and separately managed accounts for institutional and individual investors. Assets under management do not include
the self-directed assets of our clients, including brokerage accounts, or interest-bearing deposits held through our bank depository institution subsidiaries.
The table below presents our assets under management by asset class.
| As of | ||||||||||||||
| December 31, | December 31, | November 30, | ||||||||||||
| in billions | 2010 | 2009 | 2008 | |||||||||||
Alternative investments 1 | $ | 148 | $ | 146 | $ | 146 | ||||||||
Equity | 144 | 146 | 112 | |||||||||||
Fixed income | 340 | 315 | 248 | |||||||||||
Total non-money market assets | 632 | 607 | 506 | |||||||||||
Money markets | 208 | 264 | 273 | |||||||||||
Total assets under management | $ | 840 | $ | 871 | $ | 779 | ||||||||
| 1. | Primarily includes hedge funds, private equity, real estate, currencies, commodities and asset allocation strategies. |
The table below presents a summary of the changes in our assets under management.
| Year Ended | ||||||||||||||
| December 31, | December 31, | November 30, | ||||||||||||
| in billions | 2010 | 2009 | 2008 | |||||||||||
Balance, beginning of year | $ | 871 | $ | 798 | 1 | $868 | ||||||||
Net inflows/(outflows) | ||||||||||||||
Alternative investments | (1 | ) | (5 | ) | 8 | |||||||||
Equity | (21 | ) | (2 | ) | (55 | ) | ||||||||
Fixed income | 7 | 26 | 14 | |||||||||||
Total non-money market net inflows/(outflows) | (15 | ) | 19 | (33 | ) | |||||||||
Money markets | (56 | ) | (22 | ) | 67 | |||||||||
Total net inflows/(outflows) | (71 | ) | (3 | ) | 34 | |||||||||
Net market appreciation/(depreciation) | 40 | 76 | (123 | ) | ||||||||||
Balance, end of year | $ | 840 | $ | 871 | $779 | |||||||||
| 1. | Includes market appreciation of $13 billion and net inflows of $6 billion during the calendar month of December 2008. |
2010 versus 2009. Net revenues in Investment Management were $5.01 billion for 2010, 9% higher than 2009, primarily reflecting higher incentive fees across our alternative investment products. Management and other fees also increased, reflecting favorable changes in the mix of assets under management, as well as the impact of appreciation in the value of client assets. During 2010, assets under management decreased 4% to $840 billion, primarily
reflecting outflows in money market assets, consistent with industry trends.
Operating expenses were $4.05 billion for 2010, 10% higher than 2009, primarily reflecting increased staff levels and the impact of growth initiatives. Pre-tax earnings were $963 million in 2010, 3% higher than 2009.
58
2009 versus 2008. Net revenues in Investment Management were $4.61 billion for 2009, 12% lower than 2008, primarily reflecting the impact of changes in the composition of assets managed, principally due to equity market depreciation during the fourth quarter of 2008, as well as lower incentive fees. During 2009, assets under management increased $73 billion to $871 billion, due to $76 billion of market appreciation, primarily in fixed income and equity assets, partially offset by $3 billion of net outflows. Outflows in money market assets were offset by inflows in fixed income assets.
Operating expenses were $3.67 billion for 2009, 4% higher than 2008, due to higher levels of discretionary compensation. Pre-tax earnings were $934 million in 2009, 46% lower than 2008.
One Month Ended December 2008. Net revenues in Investment Management were $343 million for the month of December 2008. During the calendar month of December, assets under management increased $19 billion to $798 billion, due to $13 billion of market appreciation, primarily in fixed income and equity assets, and $6 billion of net inflows. Net inflows reflected inflows in money market assets, partially offset by outflows in fixed income, equity and alternative investment assets.
Operating expenses were $263 million for the month of December 2008. Pre-tax earnings were $80 million for the month of December 2008 .
Geographic Data
See Note 27 to the consolidated financial statements in Part II, Item 8 of this Form 10-K for a summary of our total net revenues, pre-tax earnings and net earnings by geographic region.
Regulatory Reform
On July 21, 2010, the U.S. Dodd-Frank Wall Street Reform and Consumer Protection Act (Dodd-Frank Act) was enacted. The Dodd-Frank Act significantly restructures the financial regulatory regime under which we operate. The implications of the Dodd-Frank Act for our businesses will depend to a large extent on the provisions of required future rulemaking by the Board of Governors of the Federal Reserve System (Federal Reserve Board), the Federal Deposit Insurance Corporation (FDIC), the SEC, the U.S. Commodity Futures Trading Commission (CFTC) and other agencies, as well as the development of market practices and structures under the regime established by the legislation and the rules adopted
pursuant to it. However, we expect that there will be two principal areas of impact for us:
| • | the prohibition on "proprietary trading" and the limitation on the sponsorship of, and investment in, hedge funds and private equity funds by banking entities, including bank holding companies; and |
| • | increased regulation of and restrictions on over-the-counter (OTC) derivatives markets and transactions. |
In addition, the legislation creates a new systemic risk oversight body to oversee and coordinate the efforts of the primary U.S. financial regulatory agencies in establishing regulations to address financial stability concerns, including more stringent supervisory requirements and prudential standards applicable to systemically important financial institutions. Legal and regulatory changes under consideration in other jurisdictions could also have an impact on our activities in markets outside the United States. See "Business - Regulation" in Part I, Item 1 of this Form 10-K for more information.
In light of the Dodd-Frank Act, during 2010, we liquidated substantially all of the positions that had been held within Principal Strategies in our former Equities operating segment, as this was a proprietary trading business. In addition, during the first quarter of 2011, we commenced the liquidation of the positions that had been held by the global macro proprietary trading desk in our former Fixed Income, Currency and Commodities operating segment. Net revenues from Principal Strategies and our global macro proprietary trading desk were not material for the year ended December 2010. The full impact of the Dodd-Frank Act and other regulatory reforms on our businesses, our clients and the markets in which we operate will depend on the manner in which the relevant authorities develop and implement the required rules and the reaction of market participants to these regulatory developments over the next several years. We will continue to assess our business, risk management, and compliance practices to conform to developments in the regulatory environment.
59
Balance Sheet and Funding Sources
Balance Sheet Management
One of our most important risk management disciplines is our ability to manage the size and composition of our balance sheet. While our asset base changes due to client activity, market fluctuations and business opportunities, the size and composition of our balance sheet reflect (i) our overall risk tolerance, (ii) our ability to access stable funding sources and (iii) the amount of equity capital we hold.
Although our balance sheet fluctuates on a day-to-day basis, our total assets and adjusted assets at quarterly and year-end dates are generally not materially different from those occurring within our reporting periods.
In order to ensure appropriate risk management, we seek to maintain a liquid balance sheet and have processes in place to dynamically manage our assets and liabilities which include:
| • | quarterly planning; |
| • | business-specific limits; |
| • | monitoring of key metrics; and |
| • | scenario analyses. |
Quarterly Planning. We prepare a quarterly balance sheet plan that combines our projected total assets and composition of assets with our expected funding sources and capital levels for the upcoming quarter. The objectives of this quarterly planning process are:
| • | to develop our near-term balance sheet projections, taking into account the general state of the financial markets and expected client-driven and firm-driven activity levels; |
| • | to ensure that our projected assets are supported by an adequate level and tenor of funding and that our projected capital and liquidity metrics are within management guidelines; and |
| • | to allow business risk managers and managers from our independent control and support functions to objectively evaluate balance sheet limit requests from business managers in the context of the firm's overall balance sheet constraints. These constraints include the firm's liability profile and equity capital levels, maturities and plans for new debt and equity issuances, share repurchases, deposit trends and secured funding transactions. |
To prepare our quarterly balance sheet plan, business risk managers and managers from our independent control and support functions meet with business managers to review current and prior period metrics and discuss expectations for the upcoming quarter. The specific metrics reviewed include asset and liability size and composition, aged inventory, limit utilization, risk and performance measures and capital usage.
Our consolidated quarterly plan, including our balance sheet plans by business, funding and capital projections, and projected capital and liquidity metrics, is reviewed by the Finance Committee. See "Overview and Structure of Risk Management."
Business-Specific Limits. The Finance Committee sets asset and liability limits for each business and aged inventory limits for certain financial instruments as a disincentive to hold inventory over longer periods of time. These limits are set at levels which are close to actual operating levels in order to ensure prompt escalation and discussion among business managers and managers in our independent control and support functions on a routine basis. The Finance Committee reviews and approves balance sheet limits on a quarterly basis and may also approve changes in limits on an ad hoc basis in response to changing business needs or market conditions.
60
Monitoring of Key Metrics. We monitor key balance sheet metrics daily both by business and on a consolidated basis, including asset and liability size and composition, aged inventory, limit utilization, risk measures and capital usage. In our consolidated balance sheet, we allocate assets to businesses and review and analyze movements resulting from new business activity as well as market fluctuations.
Scenario Analyses. We conduct scenario analyses to determine how we would manage the size and composition of our balance sheet and maintain appropriate funding, liquidity and capital positions in a variety of situations:
| • | These scenarios cover one-year and two-year time horizons using various macro-economic and firm-specific assumptions. We use these analyses to assist us in developing longer-term funding plans, including the level of unsecured debt issuances, the size of our secured funding program and the amount and composition of our equity capital. We also consider any potential future constraints, such as limits on our ability to grow our asset base in the absence of appropriate funding. |
| • | Through our Internal Capital Adequacy Assessment Process (ICAAP) and our resolution and recovery planning, we further analyze how we would manage our balance sheet through the duration of a severe crisis and we develop plans for mitigating actions to access funding, generate liquidity, and/or redeploy equity capital, as appropriate. |
Balance Sheet Allocation
In addition to preparing our consolidated statement of financial condition in accordance with U.S. GAAP, we prepare a balance sheet that generally allocates assets to our businesses. We believe that presenting our assets on this basis is meaningful because it is consistent with the way management views and manages risks associated with the firm's assets and better enables investors to assess the liquidity of the firm's assets. The table below presents a summary of this balance sheet allocation.
| As of | ||||||
| in millions | December 2010 | |||||
Excess liquidity (Global Core Excess)
| $ | 174,776 | ||||
Other cash | 7,565 | |||||
Excess liquidity and cash | 182,341 | |||||
Secured client financing | 279,291 | |||||
Inventory | 260,406 | |||||
Secured financing agreements | 70,921 | |||||
Receivables | 32,396 | |||||
Institutional Client Services | 363,723 | |||||
ICBC | 7,589 | |||||
Equity (excluding ICBC) | 22,972 | |||||
Debt | 24,066 | |||||
Receivables and other | 3,291 | |||||
Investing & Lending | 57,918 | |||||
Total inventory and related assets | 421,641 | |||||
Other assets | 28,059 | |||||
Total assets | $ | 911,332 | ||||
61
The following is a description of the captions in the table above.
Excess Liquidity and Cash. We maintain substantial excess liquidity to meet a broad range of potential cash outflows and collateral needs in the event of a stressed environment. See "Liquidity Risk" below for details on the composition and sizing of our excess liquidity pool or "Global Core Excess" (GCE). In addition to our excess liquidity, we maintain other operating cash balances, primarily for use in specific currencies, entities, or jurisdictions where we do not have immediate access to parent company liquidity.
Secured Client Financing. We provide collateralized financing for client positions, including margin loans secured by client collateral, securities borrowed, and resale agreements primarily collateralized by government obligations. As a result of client activities, we are required to segregate cash and securities to satisfy regulatory requirements. Our secured client financing arrangements, which are generally short-term, are accounted for at fair value or at amounts that approximate fair value, and include daily margin requirements to mitigate counterparty credit risk.
Institutional Client Services. In Institutional Client Services, we maintain inventory positions to facilitate market-making in fixed income, equity, currency and commodity products. Additionally, as part of client market-making activities, we enter into resale or
securities borrowing arrangements to obtain securities which we can use to cover transactions in which we or our clients have sold securities that have not yet been purchased. The receivables in Institutional Client Services primarily relate to securities transactions.
Investing & Lending. In Investing & Lending, we make investments and originate loans to provide financing to clients. These investments and loans are typically longer-term in nature. We make investments, directly and indirectly through funds that we manage, in debt securities, loans, public and private equity securities, real estate and other investments.
Other Assets. Other assets are generally less liquid, non-financial assets, including property, leasehold improvements and equipment, goodwill and identifiable intangible assets, income tax-related receivables, equity-method investments and miscellaneous receivables.
The table below presents the reconciliation of this balance sheet allocation to our U.S. GAAP balance sheet. In the tables below, total assets for Institutional Client Services and Investing & Lending represent the inventory and related assets. These amounts differ from total assets by business segment disclosed in Note 27 to the consolidated financial statements in Part II, Item 8 of this Form 10-K because total assets disclosed in Note 27 include allocations of our excess liquidity and other cash, secured client financing and other assets.
| As of December 2010 | ||||||||||||||||||||||||||
| Excess | Secured | Institutional | ||||||||||||||||||||||||
| Liquidity | Client | Client | Investing & | Other | Total | |||||||||||||||||||||
| in millions | and Cash 1 | Financing | Services | Lending | Assets | Assets | ||||||||||||||||||||
Cash and cash equivalents | $ | 39,788 | $ | - | $ | - | $ | - | $ | - | $ | 39,788 | ||||||||||||||
Cash and securities segregated for regulatory and other purposes | - | 53,731 | - | - | - | 53,731 | ||||||||||||||||||||
Securities purchased under agreements to resell and federal funds sold | 62,854 | 102,537 | 22,866 | 98 | - | 188,355 | ||||||||||||||||||||
Securities borrowed | 37,938 | 80,313 | 48,055 | - | - | 166,306 | ||||||||||||||||||||
Receivables from brokers, dealers and clearing organizations | - | 3,702 | 6,698 | 37 | - | 10,437 | ||||||||||||||||||||
Receivables from customers and counterparties | - | 39,008 | 25,698 | 2,997 | - | 67,703 | ||||||||||||||||||||
Financial instruments owned, at fair value | 41,761 | - | 260,406 | 54,786 | - | 356,953 | ||||||||||||||||||||
Other assets | - | - | - | - | 28,059 | 28,059 | ||||||||||||||||||||
Total assets | $ | 182,341 | $ | 279,291 | $ | 363,723 | $ | 57,918 | $ | 28,059 | $ | 911,332 | ||||||||||||||
| 1. | Includes unencumbered cash, U.S. government obligations, U.S. agency obligations, highly liquid U.S. agency mortgage-backed obligations, and French, German, United Kingdom and Japanese government obligations. |
62
Less Liquid Inventory Composition. We seek to maintain a liquid balance sheet comprised of assets that can be readily funded on a secured basis. However, we do hold certain financial instruments that may be more difficult to fund on a secured basis, especially during times of market stress. We focus on funding these assets with longer contractual maturities to reduce the need to refinance in periods of market stress and generally hold higher levels of total capital for these assets than for more liquid types of financial instruments. The table below presents our aggregate holdings in these categories of financial instruments.
| As of December | ||||||||||
| in millions | 2010 | 2009 | ||||||||
Mortgage and other asset-backed loans and securities | $ | 17,042 | $ | 14,277 | ||||||
Bank loans and bridge loans 1 | 18,039 | 19,345 | ||||||||
Emerging market debt securities | 3,931 | 2,957 | ||||||||
High-yield and other debt obligations | 11,553 | 12,028 | ||||||||
Private equity investments and real estate fund investments 2 | 14,807 | 14,633 | ||||||||
Emerging market equity securities | 5,784 | 5,193 | ||||||||
ICBC ordinary shares 3 | 7,589 | 8,111 | ||||||||
SMFG convertible preferred stock 4 | - | 933 | ||||||||
Other restricted public equity securities | 116 | 203 | ||||||||
Other investments in funds 5 | 3,212 | 2,911 | ||||||||
| 1. | Includes funded commitments and inventory held in connection with our origination, investing and market-making activities. |
| 2. | Includes interests in funds that we manage. Such amounts exclude assets related to consolidated investment funds of $889 million and $919 million as of December 2010 and December 2009, respectively, for which Goldman Sachs does not bear economic exposure. Excludes $792 million as of December 2010, related to VIEs consolidated upon adoption of Accounting Standards Update No. 2009-17, "Consolidations (Topic 810) - Improvements to Financial Reporting by Enterprises Involved with Variable Interest Entities," for which Goldman Sachs does not bear economic exposure. |
| 3. | Includes interests of $4.73 billion and $5.13 billion as of December 2010 and December 2009, respectively, held by investment funds managed by Goldman Sachs. |
| 4. | During the first quarter of 2010, we converted our remaining Sumitomo Mitsui Financial Group, Inc. (SMFG) preferred stock investment into common stock and delivered the common stock to close out our remaining hedge position. |
| 5. | Includes interests in other investment funds that we manage. |
See Notes 4 through 6 to the consolidated financial statements in Part II, Item 8 of this Form 10-K for further information about the financial instruments we hold.
Balance Sheet Analysis and Metrics
As of December 2010, total assets on our consolidated statement of financial condition were $911.33 billion, an increase of $62.39 billion from December 2009. This increase is primarily due to (i) an increase in collateralized agreements of $20.44 billion and an increase in cash and securities segregated for regulatory and other purposes of $17.07 billion, both primarily due to an increase in client-driven activity, and (ii) an increase in financial instruments owned, at fair value of $14.55 billion, primarily due to increases in physical commodities and U.S. government and federal agency obligations.
As of December 2010, total liabilities on our consolidated statement of financial condition were $833.98 billion, an increase of $55.75 billion from December 2009. This increase is primarily due to (i) an increase in securities sold under agreements to repurchase of $33.99 billion, primarily due to an increase in secured funding of our financial instruments owned, at fair value, and an increase in client-driven activity, (ii) an increase in other secured financings of $14.24 billion, primarily due to client-driven activity and (iii) an increase in financial instruments sold, but not yet purchased, at fair value of $11.70 billion, primarily due to increases in non-U.S. government obligations and equities and convertible debentures.
As of December 2010, our total securities sold under agreements to repurchase, accounted for as collateralized financings, were $162.35 billion, which was 2% higher and 10% higher than the daily average amount of repurchase agreements during the quarter ended and year ended December 2010, respectively. As of December 2010, the increase in our repurchase agreements relative to the daily average during the quarter and year was due to an increase in client-driven activity at the end of the year and an increase in firm financing activities. As of December 2009 our total securities sold under agreements to repurchase, accounted for as collateralized financings, were $128.36 billion, which was 2% lower and 8% lower than the daily average amount of repurchase agreements during the quarter ended and year ended December 2009, respectively. The level of our repurchase agreements fluctuates between and within periods, primarily due to providing clients with access to highly liquid collateral, such as U.S. government, federal agency and investment-grade sovereign obligations through collateralized financing activities.
63
The table below presents information on our assets, shareholders' equity and leverage ratios.
| As of December | ||||||||||
| $ in millions, except per share amounts | 2010 | 2009 | ||||||||
Total assets | $ | 911,332 | $ | 848,942 | ||||||
Adjusted assets | 588,927 | 551,071 | ||||||||
Total shareholders' equity | 77,356 | 70,714 | ||||||||
Leverage ratio | 11.8x | 12.0x | ||||||||
Adjusted leverage ratio | 7.6x | 7.8x | ||||||||
Debt to equity ratio | 2.3x | 2.6x | ||||||||
Adjusted assets. Adjusted assets equals total assets less (i) low-risk collateralized assets generally associated with our secured client financing transactions and federal funds sold and (ii) cash and securities we segregate for regulatory and other purposes.
The table below presents the reconciliation of total assets to adjusted assets.
| As of December | ||||||||||||
| in millions | 2010 | 2009 | ||||||||||
Total assets | $ | 911,332 | $ | 848,942 | ||||||||
Deduct: | Securities borrowed | (166,306 | ) | (189,939 | ) | |||||||
Securities purchased under agreements to resell and federal funds sold | (188,355 | ) | (144,279 | ) | ||||||||
Add: | Financial instruments sold, but not yet purchased, at | |||||||||||
fair value | 140,717 | 129,019 | ||||||||||
Less derivative liabilities | (54,730 | ) | (56,009 | ) | ||||||||
Subtotal | 85,987 | 73,010 | ||||||||||
Deduct: | Cash and securities segregated for regulatory and other purposes | (53,731 | ) | (36,663 | ) | |||||||
Adjusted assets | $ | 588,927 | $ | 551,071 | ||||||||
Leverage ratio. The leverage ratio equals total assets divided by total shareholders' equity and measures the proportion of equity and debt the firm is using to finance assets. This ratio is different from the Tier 1 leverage ratio included in "Equity Capital - Consolidated Regulatory Capital Ratios" below, and further described in Note 20 to the consolidated financial statements in Part II, Item 8 of this Form 10-K.
Adjusted leverage ratio. The adjusted leverage ratio equals adjusted assets divided by total shareholders' equity. We believe that the adjusted leverage ratio is a more meaningful measure of our capital adequacy than the leverage ratio because it excludes certain low-risk collateralized assets that are generally supported with little or no capital.
Our adjusted leverage ratio decreased to 7.6x as of December 2010 from 7.8x as of December 2009 primarily because our total shareholders' equity grew at a higher rate than our adjusted assets. Although total assets increased by 7% during the period, this growth was principally comprised of increases in low-risk assets (primarily securities purchased under agreements to resell and cash and securities segregated for regulatory and other purposes), which do not impact our adjusted assets.
Debt to equity ratio. The debt to equity ratio equals unsecured long-term borrowings divided by total shareholders' equity.
Funding Sources
Our primary sources of funding are secured financings, unsecured long-term and short-term borrowings, and deposits. We seek to maintain broad and diversified funding sources globally.
We raise funding through a number of different products, including:
| • | collateralized financings, such as repurchase agreements, securities loaned and other secured financings; |
| • | long-term unsecured debt through syndicated U.S. registered offerings, U.S. registered and 144A medium-term note programs, offshore medium-term note offerings and other debt offerings; |
| • | short-term unsecured debt through U.S. and non-U.S. commercial paper and promissory note issuances and other methods; and |
| • | demand and savings deposits through cash sweep programs and time deposits through internal and third-party broker networks. |
We generally distribute our funding sources through our own sales force to a large, diverse creditor base in a variety of markets in the Americas, Europe and Asia. We believe that our relationships with our creditors are critical to our liquidity. Our creditors include banks, governments, securities lenders, pension funds, insurance companies, mutual funds and individuals. We have imposed various internal guidelines to monitor creditor concentration across our primary funding programs.
64
Secured Funding. We fund a significant amount of our inventory on a secured basis. We believe secured funding is more stable than unsecured financing because it is less sensitive to changes in our credit quality due to the nature of the collateral we post to our lenders. However, because the terms or availability of secured funding, particularly short-dated funding, can deteriorate rapidly in a difficult environment, we generally do not rely on short-dated secured funding unless it is collateralized with highly liquid securities such as government obligations.
Substantially all of our other secured funding is executed for tenors of one month or greater. Additionally, we monitor counterparty concentration and hold a portion of our GCE for refinancing risk associated with all secured funding transactions. We seek longer terms for secured funding collateralized by lower-quality assets because these funding transactions may pose greater refinancing risk.
The weighted average maturity of our secured funding, excluding funding collateralized by highly liquid securities eligible for inclusion in our GCE, exceeded 100 days as of December 2010.
A majority of our secured funding for securities not eligible for inclusion in the GCE is executed through term repurchase agreements and securities lending contracts. We also raise financing through other types of collateralized financings, such as secured loans and notes.
Unsecured Long-Term Borrowings. We issue unsecured long-term borrowings as a source of capital to meet our long-term financing requirements and to finance a portion of our GCE. We issue in different tenors, currencies, and products to maximize the diversification of our investor base. The table below presents our quarterly unsecured long-term borrowings maturity profile through 2016 as of December 2010.
Unsecured Long-Term Borrowings Maturity Profile
($ in millions)
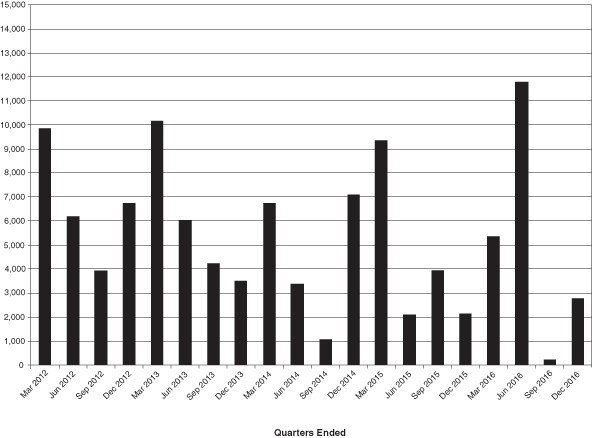
65
The weighted average maturity of our unsecured long-term borrowings as of December 2010 was approximately seven years. To mitigate refinancing risk, we seek to limit the principal amount of debt maturing on any one day or during any week or year. We enter into interest rate swaps to convert a substantial portion of our long-term borrowings into floating-rate obligations in order to minimize our exposure to interest rates.
Temporary Liquidity Guarantee Program (TLGP). As of December 2010, we had $19.01 billion of senior unsecured debt outstanding (comprised of $10.43 billion of short-term and $8.58 billion of long-term) guaranteed by the FDIC under the TLGP, all of which will mature on or prior to June 15, 2012. We have not issued long-term debt under the TLGP since March 2009 and the program has expired for new issuances.
Unsecured Short-Term Borrowings. A significant portion of our short-term borrowings were originally long-term debt that is scheduled to mature within one year of the reporting date. We use short-term borrowings to finance liquid assets and for other cash management purposes. We primarily issue commercial paper, promissory notes, and other hybrid instruments. We prefer issuing promissory notes, in which we do not make a market, over commercial paper, which we may repurchase prior to maturity through the ordinary course of business as a market maker.
As of December 2010, our unsecured short-term borrowings, including the current portion of unsecured long-term borrowings, were $47.84 billion. See Note 15 to the consolidated financial statements in Part II, Item 8 of this Form 10-K for further information about our unsecured short-term borrowings.
Deposits. As of December 2010, our bank depository institution subsidiaries had $38.57 billion in customer deposits, including $8.50 billion of certificates of deposit and other time deposits with a weighted average maturity of three years, and $30.07 billion of other deposits, substantially all of which were from cash sweep programs. We utilize deposits to finance lending activities in our bank subsidiaries and to support potential outflows, such as lending commitments.
Goldman Sachs Bank USA (GS Bank USA) has access to funding through the Federal Reserve Bank discount window. While we do not rely on this funding in our liquidity planning and stress testing, we maintain policies and procedures necessary to access this funding and test discount window borrowing procedures.
Equity Capital
The level and composition of our equity capital are determined by multiple factors including our consolidated regulatory capital requirements and ICAAP, and may also be influenced by other factors such as rating agency guidelines, subsidiary capital requirements, the business environment, conditions in the financial markets and assessments of potential future losses due to adverse changes in our business and market environments. In addition, we maintain a contingency capital plan which provides a framework for analyzing and responding to an actual or perceived capital shortfall.
Our consolidated regulatory capital requirements are determined by the Federal Reserve Board, as described below. Our ICAAP incorporates an internal risk-based capital assessment designed to identify and measure material risks associated with our business activities, including market risk, credit risk and operational risk, in a manner that is closely aligned with our risk management practices. Our internal risk-based capital assessment is supplemented with the results of stress tests.
As of December 2010, our total shareholders' equity was $77.36 billion (consisting of common shareholders' equity of $70.40 billion and preferred stock of $6.96 billion). As of December 2009, our total shareholders' equity was $70.71 billion (consisting of common shareholders' equity of $63.76 billion and preferred stock of $6.96 billion). In addition to total shareholders' equity, we consider our $5.00 billion of junior subordinated debt issued to trusts to be part of our equity capital, as it qualifies as capital for regulatory and certain rating agency purposes. See "- Consolidated Regulatory Capital Ratios" below for information regarding the impact of regulatory developments.
66
Consolidated Regulatory Capital
The Federal Reserve Board is the primary regulator of Group Inc., a bank holding company and a financial holding company under the U.S. Bank Holding Company Act of 1956. As a bank holding company, we are subject to consolidated regulatory capital requirements that are computed in accordance with the Federal Reserve Board's capital adequacy regulations currently applicable to bank holding companies (Basel 1). These capital requirements, which are based on the Capital Accord of the Basel Committee on Banking Supervision (Basel Committee), are expressed as capital ratios that compare measures of capital to risk-weighted assets (RWAs). See Note 20 to the consolidated financial statements in Part II, Item 8 of this Form 10-K for additional information regarding the firm's RWAs. The firm's capital levels are also subject to qualitative judgments by its regulators about components, risk weightings and other factors.
Federal Reserve Board regulations require bank holding companies to maintain a minimum Tier 1 capital ratio of 4% and a minimum total capital ratio of 8%. The required minimum Tier 1 capital ratio and total capital ratio in order to be considered a "well-capitalized" bank holding company under the Federal Reserve Board guidelines are 6% and 10%, respectively. Bank holding companies may be expected to maintain ratios well above the minimum levels, depending upon their particular condition, risk profile and growth plans. The minimum Tier 1 leverage ratio is 3% for bank holding companies that have received the highest supervisory rating under Federal Reserve Board guidelines or that have implemented the Federal Reserve Board's risk-based capital measure for market risk. Other bank holding companies must have a minimum Tier 1 leverage ratio of 4%.
Consolidated Regulatory Capital Ratios
The table below presents information about our regulatory capital ratios.
| As of December | ||||||||||
| $ in millions | 2010 | 2009 | ||||||||
Common shareholders' equity | $ | 70,399 | $ | 63,757 | ||||||
Less: Goodwill | (3,495 | ) | (3,543 | ) | ||||||
Less: Disallowable intangible assets | (2,027 | ) | (1,377 | ) | ||||||
Less: Other deductions 1 | (5,601 | ) | (6,152 | ) | ||||||
Tier 1 Common Capital | 59,276 | 52,685 | ||||||||
Preferred stock | 6,957 | 6,957 | ||||||||
Junior subordinated debt issued to trusts | 5,000 | 5,000 | ||||||||
Tier 1 Capital | 71,233 | 64,642 | ||||||||
Qualifying subordinated debt 2 | 13,880 | 14,004 | ||||||||
Less: Other deductions 1 | (220 | ) | (176 | ) | ||||||
Tier 2 Capital | 13,660 | 13,828 | ||||||||
Total Capital | $ | 84,893 | $ | 78,470 | ||||||
Risk-Weighted Assets 3 | $ | 444,290 | $ | 431,890 | ||||||
Tier 1 Capital Ratio | 16.0% | 15.0% | ||||||||
Total Capital Ratio | 19.1% | 18.2% | ||||||||
Tier 1 Leverage Ratio 3 | 8.0% | 7.6% | ||||||||
Tier 1 Common Ratio 4 | 13.3% | 12.2% | ||||||||
| 1. | Principally includes equity investments in non-financial companies and the cumulative change in the fair value of our unsecured borrowings attributable to the impact of changes in our own credit spreads, disallowed deferred tax assets, and investments in certain nonconsolidated entities. |
| 2. | Substantially all of our subordinated debt qualifies as Tier 2 capital for Basel 1 purposes. |
| 3. | See Note 20 to the consolidated financial statements in Part II, Item 8 of this Form 10-K for additional information about the firm's RWAs and Tier 1 leverage ratio. |
| 4. | The Tier 1 common ratio equals Tier 1 common capital divided by RWAs. We believe that the Tier 1 common ratio is meaningful because it is one of the measures that we and investors use to assess capital adequacy. |
Our Tier 1 capital ratio increased to 16.0% as of December 2010 from 15.0% as of December 2009. The growth in our Tier 1 capital during the year ended December 2010 was principally due to an increase in our shareholders' equity, which was partially offset by an increase in our RWAs. Our Tier 1 leverage ratio increased to 8.0% as of December 2010 from 7.6% as of December 2009, reflecting an increase in our Tier 1 capital, principally due to an increase in our shareholders' equity, which was partially offset by an increase in average adjusted total assets.
67
We are currently working to implement the requirements set out in the Federal Reserve Board's Capital Adequacy Guidelines for Bank Holding Companies: Internal Ratings-Based and Advanced Measurement Approaches, which are based on the advanced approaches under the Revised Framework for the International Convergence of Capital Measurement and Capital Standards issued by the Basel Committee as applicable to us as a bank holding company (Basel 2). U.S. banking regulators have incorporated the Basel 2 framework into the existing risk-based capital requirements by requiring that internationally active banking organizations, such as us, transition to Basel 2 following the successful completion of a parallel run.
In addition, the Basel Committee has undertaken a program of substantial revisions to its capital guidelines. In particular, the changes in the "Basel 2.5" guidelines will result in increased capital requirements for market risk; additionally, the Basel 3 guidelines issued by the Basel Committee in December 2010 revise the definition of Tier 1 capital, introduce Tier 1 common equity as a regulatory metric, set new minimum capital ratios (including a new "capital conservation buffer," which must be composed exclusively of Tier 1 common equity and will be in addition to the other capital ratios), introduce a Tier 1 leverage ratio within international guidelines for the first time, and make substantial revisions to the computation of RWAs for credit exposures. Implementation of the new requirements is expected to take place over an extended transition period, starting at the end of 2011 (for Basel 2.5) and end of 2012 (for Basel 3). Although the U.S. federal banking agencies have now issued proposed rules that are intended to implement certain aspects of the Basel 2.5 guidelines, they have not yet addressed all aspects of those guidelines or the Basel 3 changes. In addition, both the Basel Committee and U.S. banking regulators implementing the Dodd-Frank Act have indicated that they will impose more stringent capital standards on systemically important financial institutions. Although the criteria for treatment as a systemically important financial institution have not yet been determined, it is probable that they will apply to us. Therefore, the regulations ultimately applicable to us may be substantially different from those that have been published to date.
The Dodd-Frank Act will subject us at a firmwide level to the same leverage and risk-based capital requirements that apply to depository institutions and directs banking regulators to impose additional capital requirements as disclosed above. The Federal Reserve Board will be required to begin implementing the new leverage and risk-based capital regulation by January 2012. As a consequence of these changes, Tier 1 capital treatment for our junior subordinated debt issued to trusts and our cumulative preferred stock will be phased out over a three-year period beginning on January 1, 2013. The interaction between the Dodd-Frank Act and the Basel Committee's proposed changes adds further uncertainty to our future capital requirements.
A number of other governmental entities and regulators, including the U.S. Treasury, the European Union and the Financial Services Authority in the United Kingdom, have also proposed or announced changes which will result in increased capital requirements for financial institutions.
As a consequence of these developments, we expect minimum capital ratios required to be maintained under Federal Reserve Board regulations will be increased and changes in the prescribed calculation methodology are expected to result in higher RWAs and lower capital ratios than those currently computed.
See Note 20 to the consolidated financial statements in Part II, Item 8 of this Form 10-K for additional information about our regulatory capital ratios and the related regulatory requirements.
Internal Capital Adequacy Assessment Process
We perform an ICAAP with the objective of ensuring that the firm is appropriately capitalized relative to the risks in our business.
As part of our ICAAP, we perform an internal risk-based capital assessment. Our internal risk-based capital assessment incorporates market risk, credit risk and operational risk. Market risk is calculated by using Value-at-Risk (VaR) calculations supplemented by risk-based add-ons which include risks related to rare events (tail risks). Credit risk utilizes assumptions about our counterparties' probability of default, the size of our losses in the event of a default and the maturity of our counterparties' contractual obligations to us. Operational risk is calculated based on scenarios incorporating multiple types of operational failures. Backtesting is used to gauge the effectiveness of models at capturing and measuring relevant risks.
68
We evaluate capital adequacy based on the result of our internal risk-based capital assessment, supplemented with the results of stress tests which measure the firm's performance under various market conditions. Our goal is to hold sufficient capital, under our internal risk-based capital framework, to ensure we remain adequately capitalized after experiencing a severe stress event. Our assessment of capital adequacy is viewed in tandem with our assessment of liquidity adequacy and integrated into the overall risk management structure, governance and policy framework of the firm.
We attribute capital usage to each of our businesses based upon our internal risk-based capital and regulatory frameworks and manage the levels of usage based upon the balance sheet and risk limits established.
Rating Agency Guidelines
The credit rating agencies assign credit ratings to the obligations of Group Inc., which directly issues or guarantees substantially all of the firm's senior unsecured obligations. GS Bank USA has also been assigned long-term issuer ratings as well as ratings on its long-term and short-term bank deposits. In addition, credit rating agencies have assigned ratings to debt obligations of certain other subsidiaries of Group Inc.
The level and composition of our equity capital are among the many factors considered in determining our credit ratings. Each agency has its own definition of eligible capital and methodology for evaluating capital adequacy, and assessments are generally based on a combination of factors rather than a single calculation. See "Liquidity Risk - Credit Ratings" for further information about our credit ratings.
Subsidiary Capital Requirements
Many of our subsidiaries, including GS Bank USA and our broker-dealer subsidiaries, are subject to separate regulation and capital requirements in jurisdictions throughout the world. For purposes of assessing the adequacy of its capital, GS Bank USA has established an ICAAP which is similar to that used by Group Inc. GS Bank USA's capital levels and prompt corrective action classification are subject to qualitative judgments by its regulators about components, risk weightings and other factors.
We expect that the capital requirements of several of our subsidiaries will be impacted in the future by the various developments arising from the Basel Committee, the Dodd-Frank Act, and other governmental entities and regulators.
See Note 20 to the consolidated financial statements in Part II, Item 8 of this Form 10-K for information about GS Bank USA's capital ratios under Basel 1 as implemented by the Federal Reserve Board, and for further information about the capital requirements of our other regulated subsidiaries and the potential impact of regulatory reform.
Subsidiaries not subject to separate regulatory capital requirements may hold capital to satisfy local tax guidelines, rating agency requirements (for entities with assigned credit ratings) or internal policies, including policies concerning the minimum amount of capital a subsidiary should hold based on its underlying level of risk. In certain instances, Group Inc. may be limited in its ability to access capital held at certain subsidiaries as a result of regulatory, tax or other constraints. As of December 2010 and December 2009, Group Inc.'s equity investment in subsidiaries was $71.30 billion and $65.74 billion, respectively, compared with its total shareholders' equity of $77.36 billion and $70.71 billion, respectively.
Group Inc. has guaranteed the payment obligations of GS&Co., GS Bank USA, Goldman Sachs Bank (Europe) PLC and GSEC subject to certain exceptions. In November 2008, we contributed subsidiaries into GS Bank USA, and Group Inc. agreed to guarantee certain losses, including credit-related losses, relating to assets held by the contributed entities. In connection with this guarantee, Group Inc. also agreed to pledge to GS Bank USA certain collateral, including interests in subsidiaries and other illiquid assets.
Our capital invested in non-U.S. subsidiaries is generally exposed to foreign exchange risk, substantially all of which is managed through a combination of derivatives and non-U.S. denominated debt.
69
Preferred Stock. In October 2008, we issued to Berkshire Hathaway and certain affiliates 50,000 shares of 10% Cumulative Perpetual Preferred Stock, Series G (Series G Preferred Stock), and a five-year warrant to purchase up to 43.5 million shares of common stock at an exercise price of $115.00 per share, for aggregate proceeds of $5.00 billion. The allocated carrying values of the warrant and the Series G Preferred Stock (based on their relative fair values on the date of issuance) were $1.14 billion and $3.86 billion, respectively. The Series G Preferred Stock is redeemable at the firm's option, subject to the approval of the Federal Reserve Board, at a redemption value of $5.50 billion, plus accrued and unpaid dividends. Accordingly, upon a redemption in full at any time in the future of the Series G Preferred Stock, we would recognize a one-time preferred dividend of $1.64 billion (calculated as the difference between the carrying value and redemption value of the preferred stock), which would be recorded as a reduction to our earnings applicable to common shareholders and to our common shareholders' equity in the period of redemption. Based on our December 2010 average diluted common shares outstanding and basic shares outstanding, the estimated impact to earnings per common share and book value per common share would be a reduction of approximately $2.80 and $3.00, respectively, in the period in which the redemption occurs in the future.
Contingency Capital Plan
Our contingency capital plan outlines the appropriate communication procedures to follow during a crisis period, including internal dissemination of information as well as ensuring timely communication with external stakeholders. It also provides a framework for analyzing and responding to a perceived or actual capital deficiency, including, but not limited to, identification of drivers of a capital deficiency, as well as mitigants and potential actions.
Equity Capital Management
Our objective is to maintain a sufficient level and optimal composition of equity capital. We principally manage our capital through issuances and repurchases of our common stock. We may also, from time to time, issue or repurchase our preferred stock, junior subordinated debt issued to trusts and other subordinated debt as business conditions warrant and subject to any regulatory approvals. We manage our capital requirements principally by setting limits on balance sheet assets and/or limits on risk, in each case both at the consolidated and business levels. We attribute capital usage to each of our businesses based upon our internal risk-based capital and regulatory frameworks
and manage the levels of usage based upon the balance sheet and risk limits established.
Share Repurchase Program. We seek to use our share repurchase program to substantially offset increases in share count over time resulting from employee share-based compensation and to help maintain the appropriate level of common equity. The repurchase program is effected primarily through regular open-market purchases, the amounts and timing of which are determined primarily by our issuance of shares resulting from employee share-based compensation as well as our current and projected capital position (i.e., comparisons of our desired level of capital to our actual level of capital), but which may also be influenced by general market conditions and the prevailing price and trading volumes of our common stock.
As of December 2010, under the Board's existing share repurchase program, we can repurchase up to 35.6 million additional shares of common stock; however, any such repurchases are subject to the approval of the Federal Reserve Board. See "Market for Registrant's Common Equity, Related Stockholder Matters and Issuer Purchases of Equity Securities" in Part II, Item 5 and Note 19 to the consolidated financial statements in Part II, Item 8 of this Form 10-K for additional information on our repurchase program.
See Notes 16 and 19 to the consolidated financial statements in Part II, Item 8 of this Form 10-K for further information about our preferred stock, junior subordinated debt issued to trusts and other subordinated debt.
Other Capital Metrics
The table below presents information on our shareholders' equity and book value per common share.
| As of December | ||||||||||
| $ in millions, except per share amounts | 2010 | 2009 | ||||||||
Total shareholders' equity | $ | 77,356 | $ | 70,714 | ||||||
Common shareholders' equity | 70,399 | 63,757 | ||||||||
Tangible common shareholders' equity | 64,877 | 58,837 | ||||||||
Book value per common share | 128.72 | 117.48 | ||||||||
Tangible book value per common share | 118.63 | 108.42 | ||||||||
70
Tangible common shareholders' equity. Tangible common shareholders' equity equals total shareholders' equity less preferred stock, goodwill and identifiable intangible assets. Tangible book value per common share is computed by dividing tangible common shareholders' equity by the number of common shares outstanding, including restricted stock units (RSUs) granted to employees with no future service requirements. We believe that tangible common shareholders' equity and tangible book value per common share are meaningful because they are measures that we and investors use to assess capital adequacy.
The table below presents the reconciliation of total shareholders' equity to tangible common shareholders' equity.
| As of December | ||||||||||
| in millions | 2010 | 2009 | ||||||||
Total shareholders' equity | $ | 77,356 | $ | 70,714 | ||||||
Deduct: Preferred stock | (6,957 | ) | (6,957 | ) | ||||||
Common shareholders' equity | 70,399 | 63,757 | ||||||||
Deduct: Goodwill and identifiable intangible assets | (5,522 | ) | (4,920 | ) | ||||||
Tangible common shareholders' equity | $ | 64,877 | $ | 58,837 | ||||||
Book value and tangible book value per common share. Book value and tangible book value per common share are based on common shares outstanding, including RSUs granted to employees with no future service requirements, of 546.9 million and 542.7 million as of December 2010 and December 2009, respectively.
Off-Balance-Sheet Arrangements
and Contractual Obligations
Off-Balance-Sheet Arrangements
We have various types of off-balance-sheet arrangements that we enter into in the ordinary course of business. Our involvement in these arrangements can take many different forms, including:
| • | purchasing or retaining residual and other interests in special purpose entities such as mortgage-backed and other asset-backed securitization vehicles; |
| • | holding senior and subordinated debt, interests in limited and general partnerships, and preferred and common stock in other nonconsolidated vehicles; |
| • | entering into interest rate, foreign currency, equity, commodity and credit derivatives, including total return swaps; |
| • | entering into operating leases; and |
| • | providing guarantees, indemnifications, loan commitments, letters of credit and representations and warranties. |
We enter into these arrangements for a variety of business purposes, including securitizations. The securitization vehicles that purchase mortgages, corporate bonds, and other types of financial assets are critical to the functioning of several significant investor markets, including the mortgage-backed and other asset-backed securities markets, since they offer investors access to specific cash flows and risks created through the securitization process.
We also enter into these arrangements to underwrite client securitization transactions; provide secondary market liquidity; make investments in performing and nonperforming debt, equity, real estate and other assets; provide investors with credit-linked and asset-repackaged notes; and receive or provide letters of credit to satisfy margin requirements and to facilitate the clearance and settlement process.
Our financial interests in, and derivative transactions with, such nonconsolidated entities are accounted for at fair value, in the same manner as our other financial instruments, except in cases where we apply the equity method of accounting.
When we transfer a security that has very little, if any, default risk under an agreement to repurchase the security where the maturity date of the repurchase agreement matches the maturity date of the underlying security (such that we effectively no longer have a repurchase obligation) and we have relinquished control over the underlying security, we record such transactions as sales. These transactions are referred to as "repos to maturity." We had no such transactions outstanding as of December 2010 or December 2009.
71
The table below presents where a discussion of our various off-balance-sheet arrangements may be found in Part II, Items 7 and 8 of this Form 10-K. In addition, see Note 3 to the consolidated financial statements in
Part II, Item 8 of this Form 10-K for a discussion of our consolidation policies and recent accounting developments that affected these policies effective January 1, 2010.
| Type of Off-Balance-Sheet Arrangement | Disclosure in Form 10-K | |
| Variable interests and other obligations, including contingent obligations, arising from variable interests in nonconsolidated VIEs | See Note 11 to the consolidated financial statements in Part II, Item 8 of this Form 10-K. | |
| Leases, letters of credit, and lending and other commitments | See below and Note 18 to the consolidated financial statements in Part II, Item 8 of this Form 10-K. | |
| Guarantees | See below and Note 18 to the consolidated financial statements in Part II, Item 8 of this Form 10-K. | |
| Derivatives | See Notes 4, 5, 7 and 18 to the consolidated financial statements in Part II, Item 8 of this Form 10-K. | |
72
Contractual Obligations
We have certain contractual obligations which require us to make future cash payments. These contractual obligations include our unsecured long-term borrowings, secured long-term financings, time deposits, contractual interest payments and insurance agreements, all of which are included in our consolidated statement of financial condition. Our obligations to make future cash payments also
include certain off-balance-sheet contractual obligations such as purchase obligations, minimum rental payments under noncancelable leases and commitments and guarantees.
The table below presents our contractual obligations, commitments and guarantees as of December 2010.
| 2016- | ||||||||||||||||||||||
| in millions | 2011 | 2012-2013 | 2014-2015 | Thereafter | Total | |||||||||||||||||
Amounts related to on-balance-sheet obligations | ||||||||||||||||||||||
Time deposits 1 | $ | - | $ | 3,000 | $ | 1,292 | $ | 1,437 | $ | 5,729 | ||||||||||||
Secured long-term financings 2 | - | 8,994 | 2,791 | 2,063 | 13,848 | |||||||||||||||||
Unsecured long-term borrowings 3 | - | 49,922 | 35,061 | 89,416 | 174,399 | |||||||||||||||||
Contractual interest payments 4 | 6,807 | 12,287 | 9,107 | 30,115 | 58,316 | |||||||||||||||||
Insurance liabilities 5 | 634 | 1,105 | 993 | 8,226 | 10,958 | |||||||||||||||||
Subordinated liabilities issued by consolidated VIEs | 20 | 58 | 106 | 1,342 | 1,526 | |||||||||||||||||
Amounts related to off-balance-sheet arrangements | ||||||||||||||||||||||
Commitments to extend credit | 11,535 | 27,416 | 10,104 | 2,842 | 51,897 | |||||||||||||||||
Contingent and forward starting resale and securities borrowing agreements | 46,886 | - | - | - | 46,886 | |||||||||||||||||
Forward starting repurchase and securities lending agreements | 12,509 | - | - | - | 12,509 | |||||||||||||||||
Underwriting commitments | 835 | - | - | - | 835 | |||||||||||||||||
Letters of credit | 1,992 | 218 | - | - | 2,210 | |||||||||||||||||
Investment commitments | 2,583 | 5,877 | 1,860 | 773 | 11,093 | |||||||||||||||||
Minimum rental payments | 528 | 752 | 590 | 1,520 | 3,390 | |||||||||||||||||
Purchase obligations | 241 | 89 | 40 | 19 | 389 | |||||||||||||||||
Derivative guarantees | 278,204 | 262,222 | 42,063 | 57,413 | 639,902 | |||||||||||||||||
Securities lending indemnifications | 27,468 | - | - | - | 27,468 | |||||||||||||||||
Other financial guarantees | 415 | 1,372 | 299 | 788 | 2,874 | |||||||||||||||||
| 1. | Excludes $2.78 billion of time deposits maturing within one year of our financial statement date. |
| 2. | The aggregate contractual principal amount of secured long-term financings for which the fair value option was elected, primarily consisting of debt raised through our William Street credit extension program, transfers of financial assets accounted for as financings rather than sales and certain other nonrecourse financings, exceeded their related fair value by $352 million. |
| 3. | Includes an increase of $8.86 billion to the carrying amount of certain of our unsecured long-term borrowings related to fair value hedges. In addition, the aggregate contractual principal amount of unsecured long-term borrowings (principal and non-principal protected) for which the fair value option was elected exceeded the related fair value by $349 million. |
| 4. | Represents estimated future interest payments related to unsecured long-term borrowings, secured long-term financings and time deposits based on applicable interest rates as of December 2010. Includes stated coupons, if any, on structured notes. |
| 5. | Represents estimated undiscounted payments related to future benefits and unpaid claims arising from policies associated with our insurance activities, excluding separate accounts and estimated recoveries under reinsurance contracts. |
73
In the table above:
| • | Obligations maturing within one year of our financial statement date or redeemable within one year of our financial statement date at the option of the holder are excluded and are treated as short-term obligations. |
| • | Obligations that are repayable prior to maturity at the option of Goldman Sachs are reflected at their contractual maturity dates and obligations that are redeemable prior to maturity at the option of the holder are reflected at the dates such options become exercisable. |
| • | Amounts included in the table do not necessarily reflect the actual future cash flow requirements for these arrangements because commitments and guarantees represent notional amounts and may expire unused or be reduced or cancelled at the counterparty's request. |
| • | Due to the uncertainty of the timing and amounts that will ultimately be paid, our liability for unrecognized tax benefits has been excluded. See Note 26 to the consolidated financial statements in Part II, Item 8 of this Form 10-K for further information about our unrecognized tax benefits. |
See Notes 15 and 18 to the consolidated financial statements in Part II, Item 8 of this Form 10-K for further information about our short-term borrowings, and commitments and guarantees.
As of December 2010, our unsecured long-term borrowings were $174.40 billion, with maturities extending to 2060, and consisted principally of senior borrowings. See Note 16 to the consolidated financial statements in Part II, Item 8 of this Form 10-K for further information about our unsecured long-term borrowings.
As of December 2010, our future minimum rental payments net of minimum sublease rentals under noncancelable leases were $3.39 billion. These lease commitments, principally for office space, expire on various dates through 2069. Certain agreements are subject to periodic escalation provisions for increases in real estate taxes and other charges. See Note 18 to the consolidated financial statements in Part II, Item 8 of this Form 10-K for further information about our leases.
Our occupancy expenses include costs associated with office space held in excess of our current requirements. This excess space, the cost of which is charged to earnings as incurred, is being held for potential growth or to replace currently occupied space that we may exit in the future. We regularly evaluate our current and future space capacity in relation to current and projected staffing levels. For the year ended December 2010, total occupancy expenses for space
held in excess of our current requirements were $130 million, which includes costs related to the transition to our new headquarters in New York City. In addition, in 2010, we incurred exit costs of $28 million, related to our office space (included in "Occupancy" and "Depreciation and amortization" in the consolidated statements of earnings). We may incur exit costs in the future to the extent we (i) reduce our space capacity or (ii) commit to, or occupy, new properties in the locations in which we operate and, consequently, dispose of existing space that had been held for potential growth. These exit costs may be material to our results of operations in a given period.
Overview and Structure of Risk Management
Overview
We believe that effective risk management is of primary importance to the success of the firm. Accordingly, we have comprehensive risk management processes through which we monitor, evaluate and manage the risks we assume in conducting our activities. These include market, credit, liquidity, operational, legal, regulatory and reputational risk exposures. Our risk management framework is built around three core components: governance, processes and people.
Governance. Risk management governance starts with our Board, which plays an important role in reviewing and approving risk management policies and practices, both directly and through its Risk Committee, which consists of all of our independent directors. The Board also receives periodic updates on firmwide risks from our independent control and support functions. Next, at the most senior levels of the firm, our leaders are experienced risk managers, with a sophisticated and detailed understanding of the risks we take. Our senior managers lead and participate in risk-oriented committees, as do the leaders of our independent control and support functions - including those in internal audit, compliance, controllers, credit risk management, human capital management, legal, market risk management, operations, operational risk management, tax, technology and treasury.
The firm's governance structure provides the protocol and responsibility for decision-making on risk management issues and ensures implementation of those decisions. We make extensive use of risk-related committees that meet regularly and serve as an important means to facilitate and foster ongoing discussions to identify, manage and mitigate risks.
74
We maintain strong communication about risk and we have a culture of collaboration in decision-making among the revenue-producing units, independent control and support functions, committees and senior management. While we believe that the first line of defense in managing risk rests with the managers in our revenue-producing units, we dedicate extensive resources to independent control and support functions in order to ensure a strong oversight structure and an appropriate segregation of duties.
Processes. We maintain various processes and procedures that are critical components of our risk management. First and foremost is our daily discipline of marking substantially all of the firm's inventory to current market levels. Goldman Sachs carries its inventory at fair value, with changes in valuation reflected immediately in our risk management systems and in net revenues. We do so because we believe this discipline is one of the most effective tools for assessing and managing risk and that it provides transparent and realistic insight into our financial exposures.
We also apply a rigorous framework of limits to control risk across multiple transactions, products, businesses and markets. This includes setting credit and market risk limits at a variety of levels and monitoring these limits on a daily basis. Limits are typically set at levels that will be periodically exceeded, rather than at levels which reflect our maximum risk appetite. This fosters an ongoing dialogue on risk among revenue-producing units, independent control and support functions, committees and senior management, as well as rapid escalation of risk-related matters. See "Market Risk Management" and "Credit Risk Management" for further information on our risk limits.
Active management of our positions is another important process. Proactive mitigation of our market and credit exposures minimizes the risk that we will be required to take outsized actions during periods of stress.
We also focus on the rigor and effectiveness of the firm's risk systems. The goal of our risk management technology is to get the right information to the right people at the right time, which requires systems that are comprehensive, reliable and timely. We devote significant time and resources to our risk management technology to ensure that it consistently provides us with complete, accurate and timely information.
People. Even the best technology serves only as a tool for helping to make informed decisions in real time about the risks we are taking. Ultimately, effective risk management requires our people to make ongoing portfolio interpretations and adjustments. In both our revenue-producing units and our independent control and support functions, the experience of our professionals, and their understanding of the nuances and limitations of each risk measure, guide the firm in assessing exposures and maintaining them within prudent levels.
Structure
Ultimate oversight of risk is the responsibility of the firm's Board. The Board oversees risk both directly and through its Risk Committee. Within the firm, a series of committees with specific risk management mandates have oversight or decision-making responsibilities for risk management activities. Committee membership generally consists of senior managers from both our revenue-producing units and our independent control and support functions. We have established procedures for these committees to ensure that appropriate information barriers are in place. Our primary risk committees, most of which also have additional sub-committees or working groups, are described below. In addition to these committees, we have other risk-oriented committees which provide oversight for different businesses, activities, products, regions and legal entities.
Membership of the firm's risk committees is reviewed regularly and updated to reflect changes in the responsibilities of the committee members. Accordingly, the length of time that members serve on the respective committees varies as determined by the relevant committee charter or the committee chairs, and based on the responsibilities of the members within the firm.
In addition, independent control and support functions, which report to the chief financial officer, general counsels, chief administrative officer, or in the case of Internal Audit, to the Audit Committee of the Board, are responsible for day-to-day oversight of risk, as discussed in greater detail in the following sections.
75
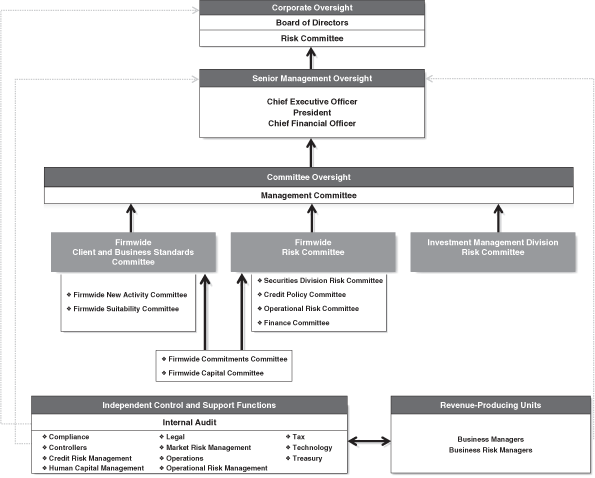
Management Committee. The Management Committee oversees the global activities of the firm, including all of the firm's independent control and support functions. It provides this oversight directly and through authority delegated to committees it has established. This committee is comprised of the most senior leaders of the firm, and is chaired by the firm's chief executive officer. The Management Committee has established various committees with delegated authority and appoints the chairpersons of these committees (the chairpersons then appoint the other members of the committees). All of these committees (and other committees established by such committees) report, directly or indirectly, to the Management Committee. Most members of the Management Committee are also members of other firmwide, divisional and regional committees. The following are the committees established by the Management Committee that are principally involved in firmwide risk management.
Firmwide Client and Business Standards Committee. The Firmwide Client and Business Standards Committee assesses and makes determinations regarding business standards and practices, reputational risk management, client relationships and client service, and is chaired by the firm's president and chief operating officer. This committee also has responsibility for overseeing the implementation of the recommendations of the Business Standards Committee. This committee has established the following two committees that report to it and is responsible for appointing the chairpersons of these committees and other committee members:
| • | Firmwide New Activity Committee. The Firmwide New Activity Committee is responsible for reviewing new activities and establishing a process to identify and review previously approved activities that are significant and that have changed in complexity and/or structure or present different reputational and suitability concerns over time to consider whether these activities remain appropriate. This committee is co-chaired by the firm's head of operations and the chief administrative officer of our Investment Management Division. |
76
| • | Firmwide Suitability Committee. The Firmwide Suitability Committee is responsible for setting standards and policies for product, transaction and client suitability and providing a forum for consistency across divisions, regions and products on suitability assessments. This committee also reviews suitability matters escalated from other firm committees. This committee is co-chaired by the firm's international general counsel and the chief operating officer of our Investment Management Division. |
Firmwide Risk Committee. The Firmwide Risk Committee is responsible for the ongoing monitoring and control of the firm's global financial risks. Through both direct and delegated authority, the Firmwide Risk Committee approves firmwide, product, divisional and business-level limits for both market and credit risks, approves sovereign credit risk limits and reviews results of stress tests and scenario analyses. This committee is co-chaired by the firm's chief financial officer and a senior managing director from the firm's executive office. The Firmwide Risk Committee has established the Securities Division Risk Committee, the Credit Policy Committee and the Operational Risk Committee and the Management Committee established the Firmwide Finance Committee. All four of these committees report to the Firmwide Risk Committee, which is responsible for appointing the chairperson of the four committees, who then appoints the other committee members:
| • | Securities Division Risk Committee. The Securities Division Risk Committee sets market risk limits, subject to overall firmwide risk limits, for our Fixed Income, Currency and Commodities Client Execution and Equities Client Execution businesses based on a number of risk measures, including VaR, stress tests, scenario analyses, and inventory levels. This committee is chaired by the chief risk officer of our Securities Division. |
| • | Credit Policy Committee. The Credit Policy Committee establishes and reviews broad credit policies and parameters that are implemented by our Credit Risk Management department (Credit Risk Management). This committee is chaired by the firm's chief credit officer. |
| • | Operational Risk Committee. The Operational Risk Committee provides oversight of the ongoing development and implementation of our operational risk policies, framework and methodologies, and monitors the effectiveness of operational risk management. This committee is chaired by the chief risk officer of GS Bank USA. |
| • | Finance Committee. The Finance Committee has oversight of firmwide liquidity, the size and composition of our balance sheet and capital base, and our credit ratings. This committee regularly reviews our liquidity, balance sheet, funding position and capitalization, and makes adjustments in light of current events, risks and exposures, and regulatory requirements. This committee is also responsible for reviewing and approving balance sheet limits and the size of our GCE. This committee is co-chaired by the firm's chief financial officer and the firm's global treasurer. |
The following committees report jointly to the Firmwide Risk Committee and the Firmwide Client and Business Standards Committee, which also appoint the chairpersons of these committees (who then appoint the members of the committees).
| • | Firmwide Capital Committee. The Firmwide Capital Committee provides approval and oversight of debt-related underwriting transactions, including related commitments of the firm's capital. This committee aims to ensure that business and reputational standards for underwritings and capital commitments are maintained on a global basis. This committee is chaired by the global head of the firm's Financing Group and head of the firm's independent control and support functions in Europe, Middle East and Africa. |
| • | Firmwide Commitments Committee. The Firmwide Commitments Committee reviews the firm's underwriting and distribution activities with respect to equity and equity-related product offerings, and sets and maintains policies and procedures designed to ensure that legal, reputational, regulatory and business standards are maintained on a global basis. In addition to reviewing specific transactions, this committee periodically conducts general strategic reviews of sectors and products and establishes policies in connection with transaction practices. This committee is co-chaired by the head of our Latin America Group and the head of the firm's independent control and support functions in Europe, Middle East and Africa. |
Investment Management Division Risk Committee. The Investment Management Division Risk Committee is responsible for the ongoing monitoring and control of global market, counterparty credit and liquidity risks associated with the activities of our investment management businesses. The head of Investment Management Division risk management is the chair of this committee and appoints the other members.
77
Liquidity Risk
Liquidity is of critical importance to financial institutions. Most of the recent failures of financial institutions have occurred in large part due to insufficient liquidity. Accordingly, the firm has in place a comprehensive and conservative set of liquidity and funding policies to address both firm-specific and broader industry or market liquidity events. Our principal objective is to be able to fund the firm and to enable our core businesses to continue to generate revenues, even under adverse circumstances.
We manage liquidity risk according to the following principles:
Excess Liquidity. We maintain substantial excess liquidity to meet a broad range of potential cash outflows and collateral needs in a stressed environment.
Asset-Liability Management. We assess anticipated holding periods for our assets and their potential illiquidity in a stressed environment. We manage the maturities and diversity of our funding across markets, products and counterparties; and seek to maintain liabilities of appropriate tenor relative to our asset base.
Contingency Funding Plan. We maintain a contingency funding plan to provide a framework for analyzing and responding to a liquidity crisis situation or periods of market stress. This framework sets forth the plan of action to fund normal business activity in emergency and stress situations. These principles are discussed in more detail below.
Excess Liquidity
Our most important liquidity policy is to pre-fund our estimated potential cash needs during a liquidity crisis and hold this excess liquidity in the form of unencumbered, highly liquid securities and cash instruments. We believe that this global core excess would be readily convertible to cash in a matter of days, through liquidation, by entering into repurchase agreements or from maturities of reverse repurchase agreements, and that this cash would allow us to meet immediate obligations without needing to sell other
assets or depend on additional funding from credit-sensitive markets.
As of December 2010 and December 2009, the fair value of the securities and certain overnight cash deposits included in our GCE totaled $174.78 billion and $170.69 billion, respectively. Based on the results of our internal liquidity risk model, discussed below, as well as our consideration of other factors including but not limited to a qualitative assessment of the condition of the financial markets and the firm, we believe our liquidity position as of December 2010 was appropriate.
Beginning with the fourth quarter of 2010, our GCE, which was previously reported at loan value, is now reported at fair value. The differences between the loan value and fair value were not material and prior periods are presented on a comparable basis.
The table below presents the fair value of the securities and certain overnight cash deposits that are included in our GCE.
| Average for the | ||||||||||
| Year Ended December | ||||||||||
| in millions | 2010 | 2009 | ||||||||
U.S. dollar-denominated | $ | 130,072 | $ | 122,083 | ||||||
Non-U.S. dollar-denominated | 37,942 | 45,987 | ||||||||
Total | $ | 168,014 | $ | 168,070 | ||||||
The U.S. dollar-denominated excess is composed of unencumbered U.S. government obligations, U.S. agency obligations and highly liquid U.S. agency mortgage-backed obligations, all of which are eligible as collateral in Federal Reserve open market operations and certain overnight U.S. dollar cash deposits. The non-U.S. dollar-denominated excess is composed of only unencumbered French, German, United Kingdom and Japanese government obligations and certain overnight cash deposits in highly liquid currencies. We strictly limit our excess liquidity to this narrowly defined list of securities and cash because they are highly liquid, even in a difficult funding environment. We do not include other potential sources of excess liquidity, such as lower-quality unencumbered securities or committed credit facilities, in our GCE.
78
The table below presents the fair value of our GCE by asset class.
| Average for the | ||||||||||
| Year Ended December | ||||||||||
| in millions | 2010 | 2009 | ||||||||
Overnight cash deposits | $ | 25,040 | $ | 21,341 | ||||||
Federal funds sold | 75 | 374 | ||||||||
U.S. government obligations | 102,937 | 87,121 | ||||||||
U.S. federal agency obligations and highly liquid U.S. federal agency mortgage-backed obligations | 3,194 | 14,797 | ||||||||
French, German, United Kingdom and Japanese government obligations | 36,768 | 44,437 | ||||||||
Total | $ | 168,014 | $ | 168,070 | ||||||
The GCE is held at Group Inc. and our major broker-dealer and bank subsidiaries, as presented in the table below.
| Average for the | ||||||||||
| Year Ended December | ||||||||||
| in millions | 2010 | 2009 | ||||||||
Group Inc. | $ | 53,757 | $ | 55,185 | ||||||
Major broker-dealer subsidiaries | 69,223 | 71,438 | ||||||||
Major bank subsidiaries | 45,034 | 41,447 | ||||||||
Total | $ | 168,014 | $ | 168,070 | ||||||
Our GCE reflects the following principles:
| • | The first days or weeks of a liquidity crisis are the most critical to a company's survival. |
| • | Focus must be maintained on all potential cash and collateral outflows, not just disruptions to financing flows. Our businesses are diverse, and our liquidity needs are determined by many factors, including market movements, collateral requirements and client commitments, all of which can change dramatically in a difficult funding environment. |
| • | During a liquidity crisis, credit-sensitive funding, including unsecured debt and some types of secured financing agreements, may be unavailable, and the terms (e.g., interest rates, collateral provisions and tenor) or availability of other types of secured financing may change. |
| • | As a result of our policy to pre-fund liquidity that we estimate may be needed in a crisis, we hold more unencumbered securities and have larger debt balances than our businesses would otherwise require. We believe that our liquidity is stronger with greater balances of highly liquid unencumbered securities, even though it increases our total assets and our funding costs. |
We believe that our GCE provides us with a resilient source of funds that would be available in advance of potential cash and collateral outflows and gives us significant flexibility in managing through a difficult funding environment.
In order to determine the appropriate size of our GCE, we use an internal liquidity model, referred to as the Modeled Liquidity Outflow, which captures and quantifies the firm's liquidity risks. We also consider other factors including but not limited to a qualitative assessment of the condition of the financial markets and the firm.
We distribute our GCE across subsidiaries, asset types, and clearing agents to provide us with sufficient operating liquidity to ensure timely settlement in all major markets, even in a difficult funding environment.
We maintain our GCE to enable us to meet current and potential liquidity requirements of our parent company, Group Inc., and our major broker-dealer and bank subsidiaries. The Modeled Liquidity Outflow incorporates a consolidated requirement as well as a standalone requirement for each of our major broker-dealer and bank subsidiaries. Liquidity held directly in each of these subsidiaries is intended for use only by that subsidiary to meet its liquidity requirements and is assumed not to be available to Group Inc. unless (i) legally provided for and (ii) there are no additional regulatory, tax or other restrictions. We hold a portion of our GCE directly at Group Inc. to support consolidated requirements not accounted for in the major subsidiaries. In addition to the GCE held at our major broker-dealer and bank subsidiaries, we maintain operating cash balances in several of our other operating entities, primarily for use in specific currencies, entities, or jurisdictions where we do not have immediate access to parent company liquidity.
In addition to our GCE, we have a significant amount of other unencumbered cash and financial instruments, including other government obligations, high-grade money market securities, corporate obligations, marginable equities, loans and cash deposits not included in our GCE. The fair value of these assets averaged $72.98 billion and $71.82 billion for the years ended December 2010 and December 2009, respectively. We do not consider these assets liquid enough to be eligible for our GCE liquidity pool and therefore conservatively do not assume we will generate liquidity from these assets in a short-term stress scenario.
79
Modeled Liquidity Outflow. Our Modeled Liquidity Outflow is based on a scenario that includes both a market-wide stress and a firm-specific stress, characterized by some or all of the following elements:
| • | Global recession, default by a medium-sized sovereign, low consumer and corporate confidence, and general financial instability. |
| • | Severely challenged market environment with material declines in equity markets and widening of credit spreads. |
| • | Damaging follow-on impacts to financial institutions leading to the failure of a large bank. |
| • | A firm-specific crisis potentially triggered by material losses, reputational damage, litigation, executive departure, and/or a ratings downgrade. |
The following are the critical modeling parameters of the Modeled Liquidity Outflow:
| • | Liquidity needs over a 30-day scenario. |
| • | A two-notch downgrade of the firm's long-term senior unsecured credit ratings. |
| • | No support from government funding facilities. Although we have access to various central bank funding programs, we do not assume reliance on them as a source of funding in a liquidity crisis. |
| • | A combination of contractual outflows, such as upcoming maturities of unsecured debt, and contingent outflows (e.g., actions though not contractually required, we may deem necessary in a crisis). We assume that most contingent outflows will occur within the initial days and weeks of a crisis. |
| • | No diversification benefit across liquidity risks. We assume that liquidity risks are additive. |
| • | Maintenance of our normal business levels. We do not assume asset liquidation, other than the GCE. |
The Modeled Liquidity Outflow is calculated and reported to senior management on a daily basis. We regularly refine our model to reflect changes in market or economic conditions and the firm's business mix.
The potential contractual and contingent cash and collateral outflows covered in our Modeled Liquidity Outflow include:
Unsecured Funding
| • | Contractual: All upcoming maturities of unsecured long-term debt, commercial paper, promissory notes and other unsecured funding products. We assume that we will be unable to issue new unsecured debt or rollover any maturing debt. |
| • | Contingent: Repurchases of our outstanding long-term debt, commercial paper and hybrid financial instruments in the ordinary course of business as a market maker. |
Deposits
| • | Contractual: All upcoming maturities of term deposits. We assume that we will be unable to raise new term deposits or rollover any maturing term deposits. |
| • | Contingent: Withdrawals of bank deposits that have no contractual maturity. The withdrawal assumptions reflect, among other factors, the type of deposit, whether the deposit is insured or uninsured, and the firm's relationship with the depositor. |
Secured Funding
| • | Contractual: A portion of upcoming contractual maturities of secured funding trades due to either the inability to refinance or the ability to refinance only at wider haircuts (i.e., on terms which require us to post additional collateral). Our assumptions reflect, among other factors, the quality of the underlying collateral and counterparty concentration. |
| • | Contingent: A decline in value of financial assets pledged as collateral for financing transactions, which would necessitate additional collateral postings under those transactions. |
OTC Derivatives
| • | Contingent: Collateral postings to counterparties due to adverse changes in the value of our OTC derivatives. |
| • | Contingent: Other outflows of cash or collateral related to OTC derivatives, including the impact of trade terminations, collateral substitutions, collateral disputes, collateral calls or termination payments required by a two-notch downgrade in our credit ratings, and collateral that has not been called by counterparties, but is available to them. |
Exchange-Traded Derivatives
| • | Contingent: Variation margin postings required due to adverse changes in the value of our outstanding exchange-traded derivatives. |
| • | Contingent: An increase in initial margin and guaranty fund requirements by derivative clearing houses. |
Customer Cash and Securities
| • | Contingent: Liquidity outflows associated with our prime brokerage business, including withdrawals of customer credit balances, and a reduction in customer short positions, which serve as a funding source for long positions. |
80
Unfunded Commitments
| • | Contingent: Draws on our unfunded commitments. Draw assumptions reflect, among other things, the type of commitment and counterparty. |
Other
| • | Other upcoming large cash outflows, such as tax payments. |
Asset-Liability Management
Our liquidity risk management policies are designed to ensure we have a sufficient amount of financing, even when funding markets experience persistent stress. We seek to maintain a long-dated and diversified funding profile, taking into consideration the characteristics and liquidity profile of our assets.
Our approach to asset-liability management includes:
| • | Conservatively managing the overall characteristics of our funding book, with a focus on maintaining long-term, diversified sources of funding in excess of our current requirements. See "Balance Sheet and Funding Sources - Funding Sources" for additional details. |
| • | Actively managing and monitoring our asset base, with particular focus on the liquidity, holding period and our ability to fund assets on a secured basis. This enables us to determine the most appropriate funding products and tenors. Less liquid assets are more difficult to fund and therefore require funding that has longer tenors with a greater proportion of unsecured debt. For more detail on our balance sheet management process, please see "Balance Sheet and Funding Sources - Balance Sheet Management." |
| • | Raising secured and unsecured financing that has a sufficiently longer term than the anticipated holding period of our assets. This reduces the risk that our liabilities will come due in advance of our ability to generate liquidity from the sale of our assets. Because we maintain a highly liquid balance sheet, the holding period of certain of our assets may be materially shorter than their contractual maturity dates. |
Our goal is to have sufficient total capital (unsecured long-term borrowings plus total shareholders' equity) so that we can avoid reliance on asset sales (other than our GCE). However, we recognize that orderly asset sales may be prudent or necessary in a severe or persistent liquidity crisis. The target amount of our total capital is based on an internal funding model which incorporates the following long-term financing requirements:
| • | The portion of financial instruments owned, at fair value that we believe could not be funded on a secured basis in periods of market stress, assuming stressed fair values. |
| • | Goodwill and identifiable intangible assets, property, leasehold improvements and equipment, and other illiquid assets. |
| • | Derivative and other margin and collateral requirements. |
| • | Anticipated draws on our unfunded loan commitments. |
| • | Regulatory requirements to hold capital or other forms of financing in excess of what we would otherwise hold in regulated subsidiaries. |
Subsidiary Funding Policies. The majority of our unsecured funding is raised by Group Inc. which lends the necessary funds to its subsidiaries, some of which are regulated, to meet their asset financing, liquidity and capital requirements. In addition, Group Inc. provides its regulated subsidiaries with the necessary capital to meet their regulatory requirements. The benefits of this approach to subsidiary funding are enhanced control and greater flexibility to meet the funding requirements of our subsidiaries. Funding is also raised at the subsidiary level through a variety of products, including secured funding, unsecured borrowings and deposits.
Our intercompany funding policies assume that, unless legally provided for, a subsidiary's funds or securities are not freely available to its parent company or other subsidiaries. In particular, many of our subsidiaries are subject to laws that authorize regulatory bodies to block or reduce the flow of funds from those subsidiaries to Group Inc. Regulatory action of that kind could impede access to funds that Group Inc. needs to make payments on its obligations. Accordingly, we assume that the capital provided to our regulated subsidiaries is not available to Group Inc. or other subsidiaries and any other financing provided to our regulated subsidiaries is not available until the maturity of such financing.
81