UNITED STATES
SECURITIES AND EXCHANGE COMMISSION
WASHINGTON, D.C. 20549
FORM 10-Q
QUARTERLY REPORT PURSUANT TO SECTION 13 OR 15(d) OF THE |
SECURITIES EXCHANGE ACT OF 1934 |
For the quarterly period ended September 30, 2016 |
|
OR |
|
TRANSITION REPORT PURSUANT TO SECTION 13 OR 15(d) OF THE |
SECURITIES EXCHANGE ACT OF 1934 |
For the transition period from ________________ to ________________ |
Commission file number: 1-35335
Groupon, Inc.
(Exact name of registrant as specified in its charter)
Delaware |
| 27-0903295 |
(State or other jurisdiction of |
| (I.R.S. Employer |
incorporation or organization) |
| Identification No.) |
|
|
|
600 West Chicago Avenue, Suite 400 Chicago, Illinois |
| 60654 |
(Address of principal executive offices) |
| (Zip Code) |
312-334-1579
(Registrant's telephone number, including area code)
Securities registered pursuant to Section 12(b) of the Act:
Indicate by check mark whether the registrant (1) has filed all reports required to be filed by Section 13 or 15(d) of the Securities Exchange Act of 1934 during the preceding 12 months (or for such shorter period that the registrant was required to file such reports), and (2) has been subject to such filing requirements for the past 90 days.
Yes x No
Indicate by check mark whether the registrant has submitted electronically and posted on its corporate Web site, if any, every Interactive Data File required to be submitted and posted pursuant to Rule 405 of Regulation S-T (§ 232.405 of this chapter) during the preceding 12 months (or for such shorter period that the registrant was required to submit and post such files).
Yes x No
Indicate by check mark whether the registrant is a large accelerated filer, an accelerated filer, a non-accelerated filer, or a smaller reporting company. See the definitions of "large accelerated filer," "accelerated filer" and "smaller reporting company" in Rule 12b-2 of the Exchange Act.
Large accelerated filer x Accelerated filer
Non-accelerated filer (Do not check if a smaller reporting company) Smaller reporting company
Indicate by check mark whether the registrant is a shell company (as defined in Rule 12b-2 of the Exchange Act).
Yes No x
As of October 24, 2016, there were 571,162,037 shares of the registrant's Class A Common Stock outstanding and 2,399,976 shares of the registrant's Class B Common Stock outstanding.
1
TABLE OF CONTENTS
PART I. Financial Information | Page |
Forward-Looking Statements | 3 |
Item 1. Financial Statements and Supplementary Data | 4 |
Condensed Consolidated Balance Sheets as of September 30, 2016 (unaudited) and December 31, 2015 | 4 |
Condensed Consolidated Statements of Operations for the three and nine months ended September 30, 2016 and 2015 (unaudited) | 5 |
Condensed Consolidated Statements of Comprehensive Income (Loss) for the three and nine months ended September 30, 2016 and 2015 (unaudited) | 6 |
Condensed Consolidated Statements of Stockholders' Equity for the nine months ended September 30, 2016 (unaudited) | 7 |
Condensed Consolidated Statements of Cash Flows for the nine months ended September 30, 2016 and 2015 (unaudited) | 8 |
Notes to Condensed Consolidated Financial Statements (unaudited) | 10 |
Item 2. Management's Discussion and Analysis of Financial Condition and Results of Operations | 36 |
Item 3. Quantitative and Qualitative Disclosure about Market Risk | 83 |
Item 4. Controls and Procedures | 84 |
PART II. Other Information |
|
Item 1. Legal Proceedings | 85 |
Item 1A. Risk Factors | 85 |
Item 2. Unregistered sales of equity securities and use of proceeds | 86 |
Item 5. Other Information | 87 |
Item 6. Exhibits | 87 |
Signatures | 88 |
Exhibits | 89 |
______________________________________________________
2
PART I
FORWARD LOOKING STATEMENTS
This Quarterly Report on Form 10-Q contains forward-looking statements within the meaning of Section 27A of the Securities Act of 1933, as amended, and Section 21E of the Securities Exchange Act of 1934, as amended, including statements regarding our future results of operations and financial position, business strategy and plans and our objectives for future operations. The words "may," "will," "should," "could," "expect," "anticipate," "believe," "estimate," "intend," "continue" and other similar expressions are intended to identify forward-looking statements. We have based these forward-looking statements largely on current expectations and projections about future events and financial trends that we believe may affect our financial condition, results of operations, business strategy, short-term and long-term business operations and objectives, and financial needs. These forward-looking statements involve risks and uncertainties that could cause our actual results to differ materially from those expressed or implied in our forward-looking statements. Such risks and uncertainties include, but are not limited to, volatility in our revenue and operating results; risks related to our business strategy, including our strategy to grow our local marketplaces, marketing strategy and spend and the productivity of those marketing investments and the impact of our shift away from lower-margin products in our Goods category; effectively dealing with challenges arising from our international operations, including fluctuations in currency exchange rates and any potential adverse impact from the United Kingdom's likely exit from the European Union; retaining existing customers and adding new customers, including as we increase our marketing spend and shift away from lower-margin products in our Goods category; retaining and adding high quality merchants; cyber security breaches; incurring expenses as we expand our business; competing successfully in our industry; maintaining favorable payment terms with our business partners; providing a strong mobile experience for our customers; delivery and routing of our emails; product liability claims; managing inventory and order fulfillment risks; integrating our technology platforms; litigation; managing refund risks; retaining, attracting and integrating members of our executive team; difficulties, delays or our inability to successfully complete all or part of the announced restructuring actions or to realize the operating efficiencies and other benefits of such restructuring actions; higher than anticipated restructuring charges or changes in the timing of such restructuring charges; completing and realizing the anticipated benefits from acquisitions, dispositions, joint ventures and strategic investments; tax liabilities; tax legislation; compliance with domestic and foreign laws and regulations, including the CARD Act and regulation of the Internet and e-commerce; classification of our independent contractors; maintaining our information technology infrastructure; protecting our intellectual property; maintaining a strong brand; seasonality; customer and merchant fraud; payment-related risks; our ability to raise capital if necessary and our outstanding indebtedness; global economic uncertainty; the impact of our ongoing strategic review and any potential strategic alternatives we may choose to pursue; our senior convertible notes; our ability to realize the anticipated benefits from the hedge and warrant transactions; and those risks and other factors discussed in Part I, "Item 1A: Risk Factors" of our 2015 Annual Report on Form 10-K for the year ended December 31, 2015 , and Part II, "Item 1A: Risk Factors" of our Quarterly Reports on Form 10-Q for the quarters ended March 31, 2016, June 30, 2016 and September 30, 2016 , as well as in our condensed consolidated financial statements, related notes, and the other financial information appearing elsewhere in this report and our other filings with the Securities and Exchange Commission, or the SEC. Moreover, we operate in a very competitive and rapidly changing environment. New risks emerge from time to time. It is not possible for our management to predict all risks, nor can we assess the impact of all factors on our business or the extent to which any factor, or combination of factors, may cause actual results to differ materially from those contained in any forward-looking statements we may make. We do not intend, and undertake no obligation, to update any of our forward-looking statements after the date of this report to reflect actual results or future events or circumstances. Given these risks and uncertainties, readers are cautioned not to place undue reliance on such forward-looking statements.
As used herein, "Groupon," "we," "our," and similar terms include Groupon, Inc. and its subsidiaries, unless the context indicates otherwise.
3
ITEM 1. FINANCIAL STATEMENTS
GROUPON, INC.
CONDENSED CONSOLIDATED BALANCE SHEETS
(in thousands, except share and per share amounts)
| September 30, 2016 |
| December 31, 2015 | ||||
| (unaudited) |
|
| ||||
Assets |
|
|
| ||||
Current assets: |
|
|
| ||||
Cash and cash equivalents | $ | 689,747 | |
| $ | 853,362 | |
Accounts receivable, net | 74,047 | |
| 68,175 | | ||
Prepaid expenses and other current assets | 145,280 | |
| 153,705 | | ||
Total current assets | 909,074 | |
| 1,075,242 | | ||
Property, equipment and software, net | 179,987 | |
| 198,897 | | ||
Goodwill | 289,856 | |
| 287,332 | | ||
Intangible assets, net | 25,475 | |
| 36,483 | | ||
Investments (including $150,532 and $163,675 at September 30, 2016 and December 31, 2015, respectively, at fair value) | 180,617 | |
| 178,236 | | ||
Deferred income taxes | 4,242 | |
| 3,454 | | ||
Other non-current assets | 24,290 | |
| 16,620 | | ||
Total Assets | $ | 1,613,541 | |
| $ | 1,796,264 | |
Liabilities and Equity |
|
|
| ||||
Current liabilities: |
|
|
| ||||
Accounts payable | $ | 21,833 | |
| $ | 24,590 | |
Accrued merchant and supplier payables | 608,939 | |
| 776,211 | | ||
Accrued expenses and other current liabilities | 353,696 | |
| 402,724 | | ||
Total current liabilities | 984,468 | |
| 1,203,525 | | ||
Convertible senior notes, net | 176,473 | |
| - | | ||
Deferred income taxes | 6,840 | |
| 8,612 | | ||
Other non-current liabilities | 113,604 | |
| 113,540 | | ||
Total Liabilities | 1,281,385 | |
| 1,325,677 | | ||
Commitments and contingencies (see Note 7) | |
| | ||||
Stockholders' Equity |
|
|
| ||||
Class A common stock, par value $0.0001 per share, 2,000,000,000 shares authorized, 730,849,600 shares issued and 571,551,487 shares outstanding at September 30, 2016 and 717,387,446 shares issued and 588,919,281 shares outstanding at December 31, 2015 | 73 | |
| 72 | | ||
Class B common stock, par value $0.0001 per share, 10,000,000 shares authorized, 2,399,976 shares issued and outstanding at September 30, 2016 and December 31, 2015 | - | |
| - | | ||
Common stock, par value $0.0001 per share, 2,010,000,000 shares authorized, no shares issued and outstanding at September 30, 2016 and December 31, 2015 | - | |
| - | | ||
Additional paid-in capital | 2,094,975 | |
| 1,964,453 | | ||
Treasury stock, at cost, 159,298,113 shares at September 30, 2016 and 128,468,165 shares at December 31, 2015 | (757,520 | ) |
| (645,041 | ) | ||
Accumulated deficit | (1,046,422 | ) |
| (901,292 | ) | ||
Accumulated other comprehensive income (loss) | 40,132 | |
| 51,206 | | ||
Total Groupon, Inc. Stockholders' Equity | 331,238 | |
| 469,398 | | ||
Noncontrolling interests | 918 | |
| 1,189 | | ||
Total Equity | 332,156 | |
| 470,587 | | ||
Total Liabilities and Equity | $ | 1,613,541 | |
| $ | 1,796,264 | |
See Notes to Condensed Consolidated Financial Statements.
4
GROUPON, INC.
CONDENSED CONSOLIDATED STATEMENTS OF OPERATIONS
(in thousands, except share and per share amounts)
(unaudited)
|
| Three Months Ended September 30, |
| Nine Months Ended September 30, | ||||||||||||
|
| 2016 |
| 2015 |
| 2016 |
| 2015 | ||||||||
Revenue: |
|
|
|
|
|
|
|
| ||||||||
Third party and other |
| $ | 309,836 | |
| $ | 326,306 | |
| $ | 962,533 | |
| $ | 1,027,273 | |
Direct |
| 410,632 | |
| 387,289 | |
| 1,245,936 | |
| 1,175,073 | | ||||
Total revenue |
| 720,468 | |
| 713,595 | |
| 2,208,469 | |
| 2,202,346 | | ||||
Cost of revenue: |
|
|
|
|
|
|
|
| ||||||||
Third party and other |
| 40,419 | |
| 46,050 | |
| 131,000 | |
| 145,292 | | ||||
Direct |
| 365,932 | |
| 338,633 | |
| 1,090,436 | |
| 1,043,729 | | ||||
Total cost of revenue |
| 406,351 | |
| 384,683 | |
| 1,221,436 | |
| 1,189,021 | | ||||
Gross profit |
| 314,117 | |
| 328,912 | |
| 987,033 | |
| 1,013,325 | | ||||
Operating expenses: |
|
|
|
|
|
|
|
| ||||||||
Marketing |
| 87,858 | |
| 61,587 | |
| 269,616 | |
| 171,127 | | ||||
Selling, general and administrative |
| 253,554 | |
| 326,248 | |
| 811,710 | |
| 904,816 | | ||||
Restructuring charges |
| 1,459 | |
| 24,146 | |
| 29,988 | |
| 24,146 | | ||||
Gains on business dispositions |
| (2,060 | ) |
| (13,710 | ) |
| (11,399 | ) |
| (13,710 | ) | ||||
Acquisition-related expense (benefit), net |
| (9 | ) |
| 1,064 | |
| 4,305 | |
| 1,300 | | ||||
Total operating expenses |
| 340,802 | |
| 399,335 | |
| 1,104,220 | |
| 1,087,679 | | ||||
Income (loss) from operations |
| (26,685 | ) |
| (70,423 | ) |
| (117,187 | ) |
| (74,354 | ) | ||||
Other income (expense), net |
| (7,028 | ) |
| (8,160 | ) |
| (14,303 | ) |
| (25,146 | ) | ||||
Income (loss) from continuing operations before provision (benefit) for income taxes |
| (33,713 | ) |
| (78,583 | ) |
| (131,490 | ) |
| (99,500 | ) | ||||
Provision (benefit) for income taxes |
| 2,079 | |
| (53,970 | ) |
| 1,629 | |
| (42,881 | ) | ||||
Income (loss) from continuing operations |
| (35,792 | ) |
| (24,613 | ) |
| (133,119 | ) |
| (56,619 | ) | ||||
Income (loss) from discontinued operations, net of tax |
| - | |
| - | |
| - | |
| 133,463 | | ||||
Net income (loss) |
| (35,792 | ) |
| (24,613 | ) |
| (133,119 | ) |
| 76,844 | | ||||
Net income attributable to noncontrolling interests |
| (2,184 | ) |
| (3,002 | ) |
| (8,880 | ) |
| (9,648 | ) | ||||
Net income (loss) attributable to Groupon, Inc. |
| $ | (37,976 | ) |
| $ | (27,615 | ) |
| $ | (141,999 | ) |
| $ | 67,196 | |
|
|
|
|
|
|
|
|
| ||||||||
Basic net income (loss) per share: |
|
|
|
|
|
|
|
| ||||||||
Continuing operations |
| $ | (0.07 | ) |
| $ | (0.04 | ) |
| $ | (0.25 | ) |
| $ | (0.10 | ) |
Discontinued operations |
| - | |
| - | |
| - | |
| 0.20 | | ||||
Basic net income (loss) per share |
| $ | (0.07 | ) |
| $ | (0.04 | ) |
| $ | (0.25 | ) |
| $ | 0.10 | |
|
|
|
|
|
|
|
|
| ||||||||
Diluted net income (loss) per share: |
|
|
|
|
|
|
|
| ||||||||
Continuing operations |
| $ | (0.07 | ) |
| $ | (0.04 | ) |
| $ | (0.25 | ) |
| $ | (0.10 | ) |
Discontinued operations |
| - | |
| - | |
| - | |
| 0.20 | | ||||
Diluted net income (loss) per share |
| $ | (0.07 | ) |
| $ | (0.04 | ) |
| $ | (0.25 | ) |
| $ | 0.10 | |
|
|
|
|
|
|
|
|
| ||||||||
Weighted average number of shares outstanding |
|
|
|
|
|
|
|
| ||||||||
Basic |
| 575,216,191 | |
| 644,894,785 | |
| 578,290,291 | |
| 664,302,630 | | ||||
Diluted |
| 575,216,191 | |
| 644,894,785 | |
| 578,290,291 | |
| 664,302,630 | | ||||
See Notes to Condensed Consolidated Financial Statements.
5
GROUPON, INC.
CONDENSED CONSOLIDATED STATEMENTS OF COMPREHENSIVE INCOME (LOSS)
(in thousands)
(unaudited)
|
| Three Months Ended September 30, |
| Nine Months Ended September 30, | ||||||||||||
|
| 2016 |
| 2015 |
| 2016 |
| 2015 | ||||||||
Income (loss) from continuing operations |
| $ | (35,792 | ) |
| $ | (24,613 | ) |
| $ | (133,119 | ) |
| $ | (56,619 | ) |
Other comprehensive income (loss) from continuing operations: |
|
|
|
|
|
|
|
| ||||||||
Foreign currency translation adjustments: |
|
|
|
|
|
|
|
| ||||||||
Net unrealized gain (loss) during the period |
| 612 | |
| (1,246 | ) |
| (3,183 | ) |
| 6,085 | | ||||
Reclassification adjustments included in income (loss) from continuing operations |
| 221 | |
| (906 | ) |
| (7,776 | ) |
| 3,495 | | ||||
Net change in unrealized gain (loss) |
| 833 | |
| (2,152 | ) |
| (10,959 | ) |
| 9,580 | | ||||
Amortization of pension net actuarial gain (loss) to earnings (net of tax effect of $(4) and $(5) for the three months ended September 30, 2016 and 2015, respectively, and $(13) and $(15) for the nine months ended September 30, 2016 and 2015, respectively) |
| 23 | |
| 26 | |
| 69 | |
| 79 | | ||||
Net change in unrealized gain (loss) on available-for-sale securities (net of tax effect of $10 and $116 for the three months ended September 30, 2016 and 2015, respectively, and $113 and $9 for the nine months ended September 30, 2016 and 2015, respectively) |
| (16 | ) |
| (193 | ) |
| (184 | ) |
| (17 | ) | ||||
Other comprehensive income (loss) from continuing operations |
| 840 | |
| (2,319 | ) |
| (11,074 | ) |
| 9,642 | | ||||
Comprehensive income (loss) from continuing operations |
| (34,952 | ) |
| (26,932 | ) |
| (144,193 | ) |
| (46,977 | ) | ||||
|
|
|
|
|
|
|
|
| ||||||||
Income (loss) from discontinued operations |
| - | |
| - | |
| - | |
| 133,463 | | ||||
Other comprehensive income (loss) from discontinued operations - Foreign currency translation adjustments: |
|
|
|
|
|
|
|
| ||||||||
Net unrealized gain (loss) during the period |
| - | |
| - | |
| - | |
| (4,349 | ) | ||||
Reclassification adjustment included in net income (loss) from discontinued operations |
| - | |
| - | |
| - | |
| 12,313 | | ||||
Net change in unrealized gain (loss) |
| - | |
| - | |
| - | |
| 7,964 | | ||||
Comprehensive income (loss) from discontinued operations |
| - | |
| - | |
| - | |
| 141,427 | | ||||
|
|
|
|
|
|
|
|
| ||||||||
Comprehensive income (loss) |
| (34,952 | ) |
| (26,932 | ) |
| (144,193 | ) |
| 94,450 | | ||||
Comprehensive income (loss) attributable to noncontrolling interests |
| (2,184 | ) |
| (3,002 | ) |
| (8,880 | ) |
| (9,648 | ) | ||||
Comprehensive income (loss) attributable to Groupon, Inc. |
| $ | (37,136 | ) |
| $ | (29,934 | ) |
| $ | (153,073 | ) |
| $ | 84,802 | |
See Notes to Condensed Consolidated Financial Statements.
6
GROUPON, INC.
CONDENSED CONSOLIDATED STATEMENTS OF STOCKHOLDERS' EQUITY
(in thousands, except share amounts)
(unaudited)
| Groupon, Inc. Stockholders' Equity |
|
|
|
| ||||||||||||||||||||||||||||||||
| Common Stock |
| Additional Paid-In Capital |
| Treasury Stock |
| Accumulated Deficit |
| Accumulated Other Comprehensive Income (Loss) |
| Total Groupon Inc. Stockholders' Equity |
| Non-controlling Interests |
| Total Equity | ||||||||||||||||||||||
| Shares |
| Amount | Shares |
| Amount |
| ||||||||||||||||||||||||||||||
Balance at December 31, 2015 | 719,787,422 | |
| $ | 72 | |
| $ | 1,964,453 | |
| (128,468,165 | ) |
| $ | (645,041 | ) |
| $ | (901,292 | ) |
| $ | 51,206 | |
| $ | 469,398 | |
| $ | 1,189 | |
| $ | 470,587 | |
Cumulative effect of change in accounting principle | - | |
| - | |
| - | |
| - | |
| - | |
| (3,131 | ) |
| - | |
| (3,131 | ) |
| - | |
| (3,131 | ) | ||||||||
Net income (loss) | - | |
| - | |
| - | |
| - | |
| - | |
| (141,999 | ) |
| - | |
| (141,999 | ) |
| 8,880 | |
| (133,119 | ) | ||||||||
Foreign currency translation | - | |
| - | |
| - | |
| - | |
| - | |
| - | |
| (10,959 | ) |
| (10,959 | ) |
| - | |
| (10,959 | ) | ||||||||
Amortization of pension net actuarial loss to earnings, net of tax | - | |
| - | |
| - | |
| - | |
| - | |
| - | |
| 69 | |
| 69 | |
| - | |
| 69 | | ||||||||
Unrealized gain (loss) on available-for-sale securities, net of tax | - | |
| - | |
| - | |
| - | |
| - | |
| - | |
| (184 | ) |
| (184 | ) |
| - | |
| (184 | ) | ||||||||
Forfeitures of unvested restricted stock | (196,968 | ) |
| - | |
| - | |
| - | |
| - | |
| - | |
| - | |
| - | |
| - | |
| - | | ||||||||
Exercise of stock options | 490,283 | |
| - | |
| 618 | |
| - | |
| - | |
| - | |
| - | |
| 618 | |
| - | |
| 618 | | ||||||||
Vesting of restricted stock units | 17,667,674 | |
| 2 | |
| (2 | ) |
| - | |
| - | |
| - | |
| - | |
| - | |
| - | |
| - | | ||||||||
Shares issued under employee stock purchase plan | 1,669,782 | |
| - | |
| 4,358 | |
| - | |
| - | |
| - | |
| - | |
| 4,358 | |
| - | |
| 4,358 | | ||||||||
Tax withholdings related to net share settlements of stock-based compensation awards | (6,168,617 | ) |
| (1 | ) |
| (23,829 | ) |
| - | |
| - | |
| - | |
| - | |
| (23,830 | ) |
| - | |
| (23,830 | ) | ||||||||
Stock-based compensation on equity-classified awards | - | |
| - | |
| 105,716 | |
| - | |
| - | |
| - | |
| - | |
| 105,716 | |
| - | |
| 105,716 | | ||||||||
Equity component of the convertible senior notes, net of tax and issuance costs | - | |
| - | |
| 67,329 | |
| - | |
| - | |
| - | |
| - | |
| 67,329 | |
| - | |
| 67,329 | | ||||||||
Purchase of convertible note hedges | - | |
| - | |
| (59,163 | ) |
| - | |
| - | |
| - | |
| - | |
| (59,163 | ) |
| - | |
| (59,163 | ) | ||||||||
Issuance of warrants | - | |
| - | |
| 35,495 | |
| - | |
| - | |
| - | |
| - | |
| 35,495 | |
| - | |
| 35,495 | | ||||||||
Purchases of treasury stock | - | |
| - | |
| - | |
| (30,829,948 | ) |
| (112,479 | ) |
| - | |
| - | |
| (112,479 | ) |
| - | |
| (112,479 | ) | ||||||||
Distributions to noncontrolling interest holders | - | |
| - | |
| - | |
| - | |
| - | |
| - | |
| - | |
| - | |
| (9,151 | ) |
| (9,151 | ) | ||||||||
Balance at September 30, 2016 | 733,249,576 | |
| $ | 73 | |
| $ | 2,094,975 | |
| (159,298,113 | ) |
| $ | (757,520 | ) |
| $ | (1,046,422 | ) |
| $ | 40,132 | |
| $ | 331,238 | |
| $ | 918 | |
| $ | 332,156 | |
See Notes to Condensed Consolidated Financial Statements.
7
GROUPON, INC.
CONDENSED CONSOLIDATED STATEMENTS OF CASH FLOWS
(in thousands)
(unaudited)
| Nine Months Ended September 30, | ||||||
| 2016 |
| 2015 | ||||
Operating activities |
|
|
| ||||
Net income (loss) | $ | (133,119 | ) |
| $ | 76,844 | |
Less: Income (loss) from discontinued operations, net of tax | - | |
| 133,463 | | ||
Income (loss) from continuing operations | (133,119 | ) |
| (56,619 | ) | ||
Adjustments to reconcile net income (loss) to net cash provided by operating activities: |
|
|
| ||||
Depreciation and amortization of property, equipment and software | 88,697 | |
| 84,241 | | ||
Amortization of acquired intangible assets | 13,643 | |
| 14,966 | | ||
Stock-based compensation | 94,750 | |
| 109,204 | | ||
Restructuring-related long-lived asset impairments | 45 | |
| 345 | | ||
Gains on business dispositions | (11,399 | ) |
| (13,710 | ) | ||
Deferred income taxes | (6,436 | ) |
| (15,252 | ) | ||
(Gain) loss, net from changes in fair value of contingent consideration | 4,130 | |
| (268 | ) | ||
(Gain) loss from changes in fair value of investments | 7,301 | |
| 2,114 | | ||
Amortization of debt discount on convertible senior notes | 4,854 | |
| - | | ||
Change in assets and liabilities, net of acquisitions: |
|
|
| ||||
Restricted cash | (332 | ) |
| 4,555 | | ||
Accounts receivable | (3,593 | ) |
| 6,353 | | ||
Prepaid expenses and other current assets | 10,738 | |
| (39,813 | ) | ||
Accounts payable | (4,326 | ) |
| (944 | ) | ||
Accrued merchant and supplier payables | (171,816 | ) |
| (101,852 | ) | ||
Accrued expenses and other current liabilities | (47,919 | ) |
| 57,214 | | ||
Other, net | (16,775 | ) |
| (1,242 | ) | ||
Net cash provided by (used in) operating activities from continuing operations | (171,557 | ) |
| 49,292 | | ||
Net cash provided by (used in) operating activities from discontinued operations | - | |
| (36,578 | ) | ||
Net cash provided by (used in) operating activities | (171,557 | ) |
| 12,714 | | ||
Investing activities |
|
|
| ||||
Purchases of property and equipment and capitalized software | (49,215 | ) |
| (68,481 | ) | ||
Cash derecognized upon dispositions of subsidiaries | (1,128 | ) |
| (1,404 | ) | ||
Acquisitions of businesses, net of acquired cash | (940 | ) |
| (70,130 | ) | ||
Purchases of investments | - | |
| (5,000 | ) | ||
Proceeds from sale of investment | 1,685 | |
| 1,231 | | ||
Settlement of liabilities related to purchase of additional interest in consolidated subsidiaries | - | |
| (1,072 | ) | ||
Acquisitions of intangible assets | (2,121 | ) |
| (1,156 | ) | ||
Net cash provided by (used in) investing activities from continuing operations | (51,719 | ) |
| (146,012 | ) | ||
Net cash provided by (used in) investing activities from discontinued operations | - | |
| 244,470 | | ||
Net cash provided by (used in) investing activities | (51,719 | ) |
| 98,458 | | ||
Financing activities |
|
|
| ||||
Proceeds from borrowings under revolving credit facility | - | |
| 195,000 | | ||
Proceeds from issuance of convertible senior notes | 250,000 | |
| - | | ||
Issuance costs for convertible senior notes and revolving credit agreement | (8,097 | ) |
| - | | ||
Purchase of convertible note hedges | (59,163 | ) |
| - | | ||
Proceeds from issuance of warrants | 35,495 | |
| - | | ||
Payments for purchases of treasury stock | (115,619 | ) |
| (329,378 | ) | ||
Taxes paid related to net share settlements of stock-based compensation awards | (23,327 | ) |
| (34,477 | ) | ||
Proceeds from stock option exercises and employee stock purchase plan | 4,976 | |
| 5,673 | | ||
Distributions to noncontrolling interest holders | (9,151 | ) |
| (10,954 | ) | ||
Payment of contingent consideration related to acquisitions | (285 | ) |
| (382 | ) | ||
Payments of capital lease obligations | (21,961 | ) |
| (17,670 | ) | ||
Net cash provided by (used in) financing activities | 52,868 | |
| (192,188 | ) | ||
Effect of exchange rate changes on cash and cash equivalents, including cash classified within current assets held for sale | 6,793 | |
| (27,338 | ) | ||
Net increase (decrease) in cash and cash equivalents, including cash classified within current assets held for sale | (163,615 | ) |
| (108,354 | ) | ||
Less: Net increase (decrease) in cash classified within current assets held for sale | - | |
| (55,279 | ) | ||
Net increase (decrease) in cash and cash equivalents | (163,615 | ) |
| (53,075 | ) | ||
Cash and cash equivalents, beginning of period | 853,362 | |
| 1,016,634 | | ||
Cash and cash equivalents, end of period | $ | 689,747 | |
| $ | 963,559 | |
8
Non-cash investing and financing activities |
|
|
| ||||
Continuing operations: |
|
|
| ||||
Equipment acquired under capital lease obligations | $ | 17,556 | |
| $ | 40,927 | |
Leasehold improvements funded by lessor | 4,990 | |
| - | | ||
Liability for purchases of treasury stock | 1,041 | |
| 5,059 | | ||
Contingent consideration liabilities incurred in connection with acquisitions | - | |
| 9,605 | | ||
Accounts payable and accrued expenses related to purchases of property and equipment and capitalized software | 2,250 | |
| 1,500 | | ||
Minority investment recognized in connection with disposition of Ticket Monster | - | |
| 122,075 | | ||
Minority investment recognized in connection with disposition of Groupon India | - | |
| 16,400 | | ||
Cost method investments acquired in connection with business dispositions | 11,050 | |
| - | | ||
See Notes to Condensed Consolidated Financial Statements.
9
GROUPON, INC.
NOTES TO CONDENSED CONSOLIDATED FINANCIAL STATEMENTS
(unaudited)
1. DESCRIPTION OF BUSINESS AND BASIS OF PRESENTATION
Company Information
Groupon, Inc. and subsidiaries (the "Company"), which commenced operations in October 2008, operates online local commerce marketplaces throughout the world that connect merchants to consumers by offering goods and services, generally at a discount. Consumers access those marketplaces through the Company's websites, primarily localized groupon.com sites in many countries, and its mobile applications.
The Company's operations are organized into three segments: North America, EMEA, which is comprised of Europe, Middle East and Africa, and the remainder of the Company's international operations ("Rest of World"). See Note 13, "Segment Information."
In May 2015, the Company sold a controlling stake in its subsidiary Ticket Monster, Inc. ("Ticket Monster"), an entity based in the Republic of Korea, that resulted in its deconsolidation. The financial results of Ticket Monster, including the gain on disposition and related income tax effects, are presented as discontinued operations in the accompanying condensed consolidated financial statements for the three and nine months ended September 30, 2015 . See Note 2, "Discontinued Operations and Other Dispositions," for additional information.
Unaudited Interim Financial Information
The Company has prepared the accompanying condensed consolidated financial statements pursuant to the rules and regulations of the Securities and Exchange Commission ("SEC") for interim financial reporting. These condensed consolidated financial statements are unaudited and, in the Company's opinion, include all adjustments, consisting of normal recurring adjustments and accruals, necessary for a fair presentation of the Company's condensed consolidated balance sheets, statements of operations, comprehensive income (loss), cash flows and stockholders' equity for the periods presented. Operating results for the periods presented are not necessarily indicative of the results to be expected for the full year ending December 31, 2016 . Certain information and disclosures normally included in financial statements prepared in accordance with U.S. generally accepted accounting principles ("U.S. GAAP") have been omitted in accordance with the rules and regulations of the SEC. These condensed consolidated financial statements should be read in conjunction with the audited consolidated financial statements and accompanying notes included in the Company's Annual Report on Form 10-K for the year ended December 31, 2015 , filed with the SEC on February 11, 2016, as amended by the Form 10-K/A for the year ended December 31, 2015 , filed with the SEC on March 30, 2016.
Principles of Consolidation
The condensed consolidated financial statements include the accounts of the Company and its subsidiaries. All intercompany accounts and transactions have been eliminated in consolidation. The Company's condensed consolidated financial statements were prepared in accordance with U.S. GAAP and include the assets, liabilities, revenue and expenses of all wholly-owned subsidiaries and majority-owned subsidiaries over which the Company exercises control and variable interest entities for which the Company has determined that it is the primary beneficiary. Outside stockholders' interests in subsidiaries are shown on the condensed consolidated financial statements as "Noncontrolling interests." Equity investments in entities in which the Company does not have a controlling financial interest are accounted for under the equity method, the cost method, the fair value option or as available-for-sale securities, as appropriate.
Adoption of New Accounting Standards
The Company adopted the guidance in Accounting Standards Update ("ASU") 2016-09, Compensation - Stock Compensation (Topic 718) - Improvements to Employee Share-Based Payment Accounting , on January 1, 2016. Under this ASU, entities are permitted to make an accounting policy election to either estimate forfeitures on share-based payment awards, as previously required, or to recognize forfeitures as they occur. The Company has elected to recognize forfeitures as they occur and
10
GROUPON, INC.
NOTES TO CONDENSED CONSOLIDATED FINANCIAL STATEMENTS (Continued)
(unaudited)
the impact of that change in accounting policy has been recorded as a $3.1 million cumulative effect adjustment to its accumulated deficit as of January 1, 2016. Additionally, ASU 2016-09 requires that all income tax effects related to settlements of share-based payment awards be reported in earnings as an increase or decrease to income tax expense (benefit), net. Previously, income tax benefits at settlement of an award were reported as an increase (or decrease) to additional paid-in capital to the extent that those benefits were greater than (or less than) the income tax benefits reported in earnings during the award's vesting period. The requirement to report those income tax effects in earnings has been applied on a prospective basis to settlements occurring on or after January 1, 2016 and the impact of applying that guidance was not material to the condensed consolidated financial statements for the three and nine months ended September 30, 2016 . ASU 2016-09 also requires that all income tax-related cash flows resulting from share-based payments be reported as operating activities in the statement of cash flows. Previously, income tax benefits at settlement of an award were reported as a reduction to operating cash flows and an increase to financing cash flows to the extent that those benefits exceeded the income tax benefits reported in earnings during the award's vesting period. The Company has elected to apply that change in cash flow classification on a retrospective basis, which has resulted in a $6.2 million increase to net cash provided by operating activities and a corresponding increase to net cash used in financing activities in the accompanying condensed consolidated statement of cash flows for the nine months ended September 30, 2015 , as compared to the amounts previously reported. The remaining provisions of ASU 2016-09 did not have a material impact on the accompanying condensed consolidated financial statements.
The Company adopted the guidance in ASU 2015-02, Consolidation (Topic 810) - Amendments to the Consolidation Analysis , on January 1, 2016. This ASU expands the variable interest entity ("VIE") criteria to specifically include limited partnerships in certain circumstances. The adoption of ASU 2015-02 did not have a material impact on the accompanying condensed consolidated financial statements. The Company determined that Monster Holdings LP ("Monster LP") is not a VIE under ASU 2015-02, which is consistent with its conclusion prior to adoption of the ASU. That investment is evaluated as a corporation, rather than a limited partnership, for purposes of making consolidation determinations because its governance structure is akin to a corporation. Under the terms of Monster LP's amended and restated agreement of limited partnership, all of the objectives and purposes of Monster LP are carried out by a board of directors, rather than a general partner.
Reclassifications
Certain reclassifications have been made to the condensed consolidated financial statements of prior periods and the accompanying notes to conform to the current period presentation.
Use of Estimates
The preparation of condensed consolidated financial statements in conformity with U.S. GAAP requires estimates and assumptions that affect the reported amounts and classifications of assets and liabilities, revenue and expenses, and the related disclosures of contingent liabilities in the condensed consolidated financial statements and accompanying notes. Estimates are utilized for, but not limited to, stock-based compensation, income taxes, valuation of acquired goodwill and intangible assets, investments, customer refunds, contingent liabilities and the useful lives of property, equipment and software and intangible assets. Actual results could differ materially from those estimates.
2. DISCONTINUED OPERATIONS AND OTHER DISPOSITIONS
Discontinued Operations
In May 2015, the Company sold a controlling stake in Ticket Monster to an investor group. The Company recognized a pre-tax gain on the disposition of $202.2 million ( $138.0 million net of tax), which represents the excess of (a) the $398.8 million in net consideration received, consisting of (i) $285.0 million in cash proceeds and (ii) the $122.1 million fair value of its retained minority investment, less (iii) $8.3 million in transaction costs, over (b) the sum of (i) the $184.3 million net book value of Ticket Monster upon the closing of the transaction and (ii) Ticket Monster's $12.3 million cumulative translation loss, which was reclassified to earnings. The financial results of Ticket Monster, the gain on disposition and the related income tax effects are reported within discontinued operations in the accompanying condensed consolidated financial statements.
The following table summarizes the major classes of line items included in income (loss) from discontinued operations, net of tax, for the nine months ended September 30, 2015 (in thousands):
11
GROUPON, INC.
NOTES TO CONDENSED CONSOLIDATED FINANCIAL STATEMENTS (Continued)
(unaudited)
|
| Nine Months Ended | ||
Third party and other revenue |
| $ | 28,145 | |
Direct revenue |
| 39,065 | | |
Third party and other cost of revenue |
| (13,958 | ) | |
Direct cost of revenue |
| (38,031 | ) | |
Marketing expense |
| (8,495 | ) | |
Selling, general and administrative expense |
| (38,102 | ) | |
Other income, net |
| 96 | | |
Loss from discontinued operations before gain on disposition and provision for income taxes |
| (31,280 | ) | |
Gain on disposition |
| 202,158 | | |
Provision for income taxes |
| (37,415 | ) | |
Income (loss) from discontinued operations, net of tax |
| $ | 133,463 | |
(1) | The income from discontinued operations, net of tax, for the nine months ended September 30, 2015 includes the results of Ticket Monster through the disposition date of May 27, 2015. |
The $37.4 million provision for income taxes for the nine months ended September 30, 2015 reflects (i) the $64.2 million current and deferred income tax effects of the Ticket Monster disposition during the second quarter of 2015, partially offset by (ii) a $26.8 million tax benefit that resulted from the recognition of a deferred tax asset related to the excess of the tax basis over the financial reporting basis of the Company's investment in Ticket Monster upon meeting the criteria for held-for-sale classification during the first quarter of 2015.
Other Dispositions
The gains from the transactions below are presented within "Gains on business dispositions" in the accompanying condensed consolidated statements of operations. The financial results of those entities are presented within income from continuing operations in the accompanying condensed consolidated financial statements through the their respective disposition dates. Those financial results were not material for the three and nine months ended September 30, 2016 and 2015 .
Groupon Russia
On April 12, 2016, the Company sold its subsidiary in Russia ("Groupon Russia"). The Company recognized a pre-tax gain on the disposition of $8.9 million , consisting of Groupon Russia's $1.6 million negative net book value upon the closing of the transaction and its $7.7 million cumulative translation gain, which was reclassified to earnings, less $0.4 million in transaction costs. The Company did not receive any proceeds in connection with the transaction.
Breadcrumb
On May 9, 2016, the Company sold its point of sale business ("Breadcrumb") in exchange for a minority investment in the acquirer. See Note 4, " Investments ," for information about this transaction. The Company recognized a pre-tax gain on the disposition of $0.4 million , which represents the excess of (a) $8.2 million in net consideration received, consisting of the $8.3 million fair value of the investment acquired, less $0.1 million in transaction costs, over (b) the $7.8 million net book value of Breadcrumb upon the closing of the transaction. The Company did not receive any cash proceeds in connection with the transaction.
Groupon Indonesia
On August 5, 2016, the Company sold its subsidiary in Indonesia ("Groupon Indonesia") in exchange for a minority investment in the acquirer. See Note 4, " Investments ," for information about this transaction. The Company recognized a pre-tax gain on the disposition of $2.1 million , which represents the excess of (a) the sum of (i) $2.4 million in net consideration received, consisting of the $2.7 million fair value of the investment acquired, less $0.3 million in transaction costs, and (ii) its $0.2 million cumulative translation loss, which was reclassified to earnings, over (b) the $0.1 million net book value of Groupon Indonesia upon closing of the transaction. The Company did not receive any cash proceeds in connection with the transaction.
12
GROUPON, INC.
NOTES TO CONDENSED CONSOLIDATED FINANCIAL STATEMENTS (Continued)
(unaudited)
Groupon India
On August 6, 2015, the Company's subsidiary in India ("Groupon India") completed an equity financing transaction with a third party investor that obtained a majority voting interest in the entity. See Note 5, " Investments ," for information about this transaction. The Company recognized a pre-tax gain on the disposition of $13.7 million , which represents the excess of (a) the sum of (i) $14.2 million in net consideration received, consisting of the $16.4 million fair value of its retained minority investment,
less $1.3 million in transaction costs and a $0.9 million guarantee liability and (ii) Groupon India's $0.9 million cumulative translation gain, which was reclassified to earnings, over (b) the $1.4 million net book value of Groupon India upon the closing of the transaction. The Company did not receive any cash proceeds in connection with the transaction.
3. GOODWILL AND OTHER INTANGIBLE ASSETS
The following table summarizes the Company's goodwill activity by segment for the nine months ended September 30, 2016 (in thousands):
|
| North America |
| EMEA |
| Rest of World |
| Consolidated | ||||||||
Balance as of December 31, 2015 |
| $ | 178,746 | |
| $ | 92,063 | |
| $ | 16,523 | |
| $ | 287,332 | |
Goodwill related to acquisition |
| 671 | |
| - | |
| - | |
| 671 | | ||||
Goodwill related to dispositions |
| (1,260 | ) |
| - | |
| (324 | ) |
| (1,584 | ) | ||||
Foreign currency translation |
| (1 | ) |
| 2,593 | |
| 845 | |
| 3,437 | | ||||
Balance as of September 30, 2016 |
| $ | 178,156 | |
| $ | 94,656 | |
| $ | 17,044 | |
| $ | 289,856 | |
|
| September 30, 2016 | ||||||||||
Asset Category |
| Gross Carrying Value |
| Accumulated Amortization |
| Net Carrying Value | ||||||
Subscriber relationships |
| $ | 53,402 | |
| $ | 48,177 | |
| $ | 5,225 | |
Merchant relationships |
| 9,776 | |
| 8,609 | |
| 1,167 | | |||
Trade names |
| 11,190 | |
| 8,331 | |
| 2,859 | | |||
Developed technology |
| 36,398 | |
| 29,188 | |
| 7,210 | | |||
Brand relationships |
| 7,960 | |
| 4,267 | |
| 3,693 | | |||
Other intangible assets |
| 23,097 | |
| 17,776 | |
| 5,321 | | |||
Total |
| $ | 141,823 | |
| $ | 116,348 | |
| $ | 25,475 | |
|
| December 31, 2015 | ||||||||||
Asset Category |
| Gross Carrying Value |
| Accumulated Amortization |
| Net Carrying Value | ||||||
Subscriber relationships |
| $ | 52,204 | |
| $ | 43,725 | |
| $ | 8,479 | |
Merchant relationships |
| 9,648 | |
| 8,064 | |
| 1,584 | | |||
Trade names |
| 11,013 | |
| 7,396 | |
| 3,617 | | |||
Developed technology |
| 37,103 | |
| 25,436 | |
| 11,667 | | |||
Brand relationships |
| 7,960 | |
| 3,073 | |
| 4,887 | | |||
Other intangible assets |
| 20,638 | |
| 14,389 | |
| 6,249 | | |||
Total |
| $ | 138,566 | |
| $ | 102,083 | |
| $ | 36,483 | |
13
GROUPON, INC.
NOTES TO CONDENSED CONSOLIDATED FINANCIAL STATEMENTS (Continued)
(unaudited)
Amortization of intangible assets is computed using the straight-line method over their estimated useful lives, which range from 1 to 5 years. Amortization expense related to intangible assets was $4.4 million and $5.2 million for the three months ended September 30, 2016 and 2015 , respectively, and $13.6 million and $15.0 million for the nine months ended September 30, 2016 and 2015 , respectively. As of September 30, 2016 , the Company's estimated future amortization expense related to intangible assets is as follows (in thousands):
Remaining amounts in 2016 |
| $ | 3,818 | |
2017 |
| 11,927 | | |
2018 |
| 8,057 | | |
2019 |
| 985 | | |
2020 |
| 608 | | |
Thereafter |
| 80 | | |
Total |
| $ | 25,475 | |
4. INVESTMENTS
The following table summarizes the Company's investments (dollars in thousands):
| September 30, 2016 |
| Percent Ownership of Voting Stock |
| December 31, 2015 |
| Percent Ownership of Voting Stock | ||||||||
Available-for-sale securities: |
|
|
|
|
|
|
| ||||||||
Convertible debt securities | $ | 9,931 | |
|
|
| $ | 10,116 | |
|
| ||||
Redeemable preferred shares | 17,177 | |
| 19% | to | 25% |
| 22,834 | |
| 17% | to | 25% | ||
Total available-for-sale securities | 27,108 | |
|
|
| 32,950 | |
|
| ||||||
Cost method investments | 30,085 | |
| 2% | to | 19% |
| 14,561 | |
| 2% | to | 10% | ||
Fair value option investments | 123,424 | |
| 41% | to | 45% |
| 130,725 | |
| 43% | to | 45% | ||
Total investments | $ | 180,617 | |
|
|
| $ | 178,236 | |
|
| ||||
The following table summarizes the amortized cost, gross unrealized gain, gross unrealized loss and fair value of the Company's available-for-sale securities as of September 30, 2016 and December 31, 2015 , respectively (in thousands):
| September 30, 2016 |
| December 31, 2015 | ||||||||||||||||||||||||||||
| Amortized Cost |
| Gross Unrealized Gain |
| Gross Unrealized Loss (1) |
| Fair Value |
| Amortized Cost |
| Gross Unrealized Gain |
| Gross Unrealized Loss (1) |
| Fair Value | ||||||||||||||||
Available-for-sale securities: |
|
|
|
|
|
|
|
|
|
|
|
|
|
|
| ||||||||||||||||
Convertible debt securities | $ | 8,263 | |
| $ | 1,704 | |
| $ | (36 | ) |
| $ | 9,931 | |
| $ | 9,234 | |
| $ | 882 | |
| $ | - | |
| $ | 10,116 | |
Redeemable preferred shares | 18,375 | |
| - | |
| (1,198 | ) |
| 17,177 | |
| 22,973 | |
| - | |
| (139 | ) |
| 22,834 | | ||||||||
Total available-for-sale securities | $ | 26,638 | |
| $ | 1,704 | |
| $ | (1,234 | ) |
| $ | 27,108 | |
| $ | 32,207 | |
| $ | 882 | |
| $ | (139 | ) |
| $ | 32,950 | |
(1) | Available-for-sale securities with an unrealized loss were in a loss position for less than 12 months. |
Fair Value Option Investments
In connection with the dispositions of Ticket Monster in May 2015 and the Company's subsidiary in India ("Groupon
14
GROUPON, INC.
NOTES TO CONDENSED CONSOLIDATED FINANCIAL STATEMENTS (Continued)
(unaudited)
India") in August 2015, the Company obtained a minority limited partner interest in Monster Holdings LP ("Monster LP") and a minority investment in GroupMax Pte Ltd. ("GroupMax"). The investments in Monster LP and GroupMax were measured at their fair values of $122.1 million and $16.4 million , respectively, as of their respective transaction dates.
The Company has made an irrevocable election to account for both of these investments at fair value with changes in fair value reported in earnings. The Company elected to apply fair value accounting to these investments because it believes that fair value is the most relevant measurement attribute for these investments, as well as to reduce operational and accounting complexity.
As of September 30, 2016 , the Company has measured the fair value of the Monster LP investment primarily using the discounted cash flow method, which is an income approach. Under that method, the first step in determining the fair value of the investment that the Company holds is to estimate the fair value of Monster LP in its entirety. The key inputs to determining the fair value are cash flow forecasts and discount rates. As of September 30, 2016 , the Company applied a discount rate of 21% in its discounted cash flow valuation of Monster LP. The Company also used a market approach valuation technique, which is based on market multiples of guideline companies, in determining the fair value of Monster LP as of September 30, 2016 . The discounted cash flow and market approach valuations are then evaluated and weighted to determine the amount that is most representative of the fair value of the investee. Once the Company has determined the fair value of Monster LP, it then determines the fair value of its specific investment in the entity. Monster LP has a complex capital structure, so the Company applies an option-pricing model that considers the liquidation preferences of the respective classes of ownership interests in Monster LP to determine the fair value of its ownership interest in the entity. The Company recognized gains of $2.3 million and $0.9 million from changes in the fair value of its investment in Monster LP for the three and nine months ended September 30, 2016 , respectively.
The following table summarizes the condensed financial information for Monster LP as of September 30, 2015 , for the three months ended September 30, 2015 and for the period from May 28, 2015 through September 30, 2015 (in thousands):
| Three Months Ended |
| Period from May 28, 2015 through September 30, 2015 (1) | ||||
Revenue | $ | 33,465 | |
| $ | 47,575 | |
Gross profit | (6,826 | ) |
| (2,488 | ) | ||
Loss before income taxes | (38,425 | ) |
| (46,764 | ) | ||
Net loss | (38,485 | ) |
| (46,764 | ) | ||
| September 30, 2015 | ||
Current assets | $ | 149,662 | |
Non-current assets | 483,108 | | |
Current liabilities | 223,667 | | |
Non-current liabilities | 7,038 | | |
(1) | The summarized financial information is presented for the period beginning May 28, 2015, after completion of the Ticket Monster disposition transaction that resulted in the Company obtaining its minority limited partner interest in Monster LP. |
As of September 30, 2016 , the Company has measured the fair value of the GroupMax investment primarily using the discounted cash flow method. The key inputs to determining the fair value are cash flow forecasts and discount rates. As of September 30, 2016 , the Company applied a discount rate of 20% in its discounted cash flow valuation of GroupMax. The Company also used a market approach valuation technique, which is based on market multiples of guideline companies, to determine the fair value of GroupMax as of September 30, 2016 . The discounted cash flow and market approach valuations are then evaluated and weighted to determine the amount that is most representative of the fair value of the investee. Once the Company has determined the fair value of GroupMax, it then determines the fair value of its specific investment in the entity. GroupMax has a complex capital structure, so the Company applies an option-pricing model that considers the liquidation preferences of the respective classes of ownership interests in GroupMax to determine the fair value of its ownership interest in the entity. The Company recognized losses of $3.9 million and $8.2 million from changes in the fair value of its investment in GroupMax for the three and nine months ended September 30, 2016 , respectively. As of September 30, 2016 , the Company has an outstanding receivable due from GroupMax with a carrying amount of $1.1 million .
15
GROUPON, INC.
NOTES TO CONDENSED CONSOLIDATED FINANCIAL STATEMENTS (Continued)
(unaudited)
Other Investments
On May 9, 2016, the Company acquired a 13% minority investment in the preferred stock of a restaurant software provider as consideration for the sale of Breadcrumb. The preferred stock was recorded at its $8.3 million acquisition date fair value and is accounted for as a cost method investment.
On August 5, 2016, the Company acquired a 7% minority investment in the preferred stock of a company that connects consumers with fitness, beauty and wellness businesses in Asia, as consideration for the sale of Groupon Indonesia. The preferred stock was recorded at its $2.7 million acquisition date fair value and is accounted for as a cost method investment.
5. SUPPLEMENTAL CONSOLIDATED BALANCE SHEETS AND STATEMENTS OF OPERATIONS INFORMATION
The following table summarizes the Company's other income (expense), net for the three and nine months ended September 30, 2016 and 2015 (in thousands):
|
| Three Months Ended September 30, |
| Nine Months Ended September 30, | ||||||||||||
|
| 2016 |
| 2015 |
| 2016 |
| 2015 | ||||||||
Interest income |
| $ | 593 | |
| $ | 331 | |
| $ | 1,449 | |
| $ | 888 | |
Interest expense |
| (5,778 | ) |
| (783 | ) |
| (11,759 | ) |
| (1,926 | ) | ||||
Gains (losses), net on changes in fair value of investments |
| (1,594 | ) |
| (2,564 | ) |
| (7,301 | ) |
| (2,114 | ) | ||||
Foreign currency gains (losses), net (1) |
| 234 | |
| (5,153 | ) |
| 5,362 | |
| (22,118 | ) | ||||
Other |
| (483 | ) |
| 9 | |
| (2,054 | ) |
| 124 | | ||||
Other income (expense), net |
| $ | (7,028 | ) |
| $ | (8,160 | ) |
| $ | (14,303 | ) |
| $ | (25,146 | ) |
(1) | Foreign currency gains (losses), net for the nine months ended September 30, 2016 includes $0.3 million of net cumulative translation gains that were reclassified to earnings as a result of the Company's exit from certain countries as part of its restructuring plan. Refer to Note 9, " Restructuring ," for additional information. Foreign currency gains (losses), net for the nine months ended September 30, 2015 includes a $4.4 million loss related to the cumulative translation adjustment from the Company's legacy business in the Republic of Korea that was reclassified to earnings as a result of the Ticket Monster disposition. |
The following table summarizes the Company's prepaid expenses and other current assets as of September 30, 2016 and December 31, 2015 (in thousands):
| September 30, 2016 |
| December 31, 2015 | ||||
Finished goods inventories | $ | 38,297 | |
| $ | 42,305 | |
Prepaid expenses | 63,352 | |
| 49,134 | | ||
Income taxes receivable | 21,967 | |
| 32,483 | | ||
VAT receivable | 10,100 | |
| 14,305 | | ||
Other | 11,564 | |
| 15,478 | | ||
Total prepaid expenses and other current assets | $ | 145,280 | |
| $ | 153,705 | |
The following table summarizes the Company's accrued merchant and supplier payables as of September 30, 2016 and December 31, 2015 (in thousands):
| September 30, 2016 |
| December 31, 2015 | ||||
Accrued merchant payables | $ | 403,779 | |
| $ | 471,607 | |
Accrued supplier payables (1) | 205,160 | |
| 304,604 | | ||
Total accrued merchant and supplier payables | $ | 608,939 | |
| $ | 776,211 | |
16
(1) | Amounts include payables to suppliers of inventories and providers of shipping and fulfillment services. |
The following table summarizes the Company's accrued expenses and other current liabilities as of September 30, 2016 and December 31, 2015 (in thousands):
| September 30, 2016 |
| December 31, 2015 | ||||
Refunds reserve | $ | 27,492 | |
| $ | 35,297 | |
Payroll and benefits | 62,904 | |
| 50,454 | | ||
Customer credits | 32,706 | |
| 32,293 | | ||
Restructuring-related liabilities | 11,200 | |
| 11,556 | | ||
Income taxes payable | 10,033 | |
| 13,885 | | ||
Deferred revenue | 35,873 | |
| 40,396 | | ||
Current portion of capital lease obligations | 30,435 | |
| 26,776 | | ||
Other (1) | 143,053 | |
| 192,067 | | ||
Total accrued expenses and other current liabilities | $ | 353,696 | |
| $ | 402,724 | |
(1) | As of December 31, 2015 , Other included a $45.0 million liability for the Company's securities litigation matter (see Note 7, "Commitments and Contingencies" ). Final court approval of the settlement for that matter was granted on July 13, 2016 and the Company's settlement obligation was satisfied during the three months ended September 30, 2016. |
The following table summarizes the Company's other non-current liabilities as of September 30, 2016 and December 31, 2015 (in thousands):
| September 30, 2016 |
| December 31, 2015 | ||||
Long-term tax liabilities | $ | 53,230 | |
| $ | 46,506 | |
Capital lease obligations | 23,240 | |
| 30,943 | | ||
Other | 37,134 | |
| 36,091 | | ||
Total other non-current liabilities | $ | 113,604 | |
| $ | 113,540 | |
The following table summarizes the components of accumulated other comprehensive income (loss) as of September 30, 2016 and December 31, 2015 (in thousands):
| Foreign currency translation adjustments |
| Unrealized gain (loss) on available-for-sale securities |
| Pension adjustments |
| Total | ||||||||
Balance as of December 31, 2015 | $ | 52,261 | |
| $ | 458 | |
| $ | (1,513 | ) |
| $ | 51,206 | |
Other comprehensive income (loss) before reclassification adjustments | (3,183 | ) |
| (184 | ) |
| 69 | |
| (3,298 | ) | ||||
Reclassification adjustments included in net income (loss) | (7,776 | ) |
| - | |
| - | |
| (7,776 | ) | ||||
Other comprehensive income (loss) | (10,959 | ) |
| (184 | ) |
| 69 | |
| (11,074 | ) | ||||
Balance as of September 30, 2016 | $ | 41,302 | |
| $ | 274 | |
| $ | (1,444 | ) |
| $ | 40,132 | |
6. FINANCING ARRANGEMENTS
Convertible Senior Notes
17
GROUPON, INC.
NOTES TO CONDENSED CONSOLIDATED FINANCIAL STATEMENTS (Continued)
(unaudited)
On April 4, 2016, the Company issued $250.0 million in aggregate principal amount of convertible senior notes (the "Notes") in a private placement to A-G Holdings, L.P. ("Atairos"). The net proceeds from this offering were $243.2 million after deducting issuance costs. The Notes bear interest at a rate of 3.25% per annum, payable annually in arrears on April 1 of each year, beginning on April 1, 2017. The Notes will mature on April 1, 2022, subject to earlier conversion or redemption.
Each $1,000 of principal amount of the Notes initially is convertible into 185.1852 shares of Class A common stock, or common stock, as applicable (the "Common Stock"), which is equivalent to an initial conversion price of $5.40 per share, subject to adjustment upon the occurrence of specified events. Upon conversion, the Company can elect to settle the conversion value in cash, shares of its Common Stock, or any combination of cash and shares of its Common Stock. Holders of the Notes may convert their Notes at their option at any time until the close of business on the scheduled trading day immediately preceding the maturity date. In addition, if specified corporate events occur prior to the maturity date, the Company may be required to increase the conversion rate for holders who elect to convert based on the effective date of such event and the applicable stock price attributable to the event, as set forth in a table contained in the indenture governing the Notes (the "Indenture").
With certain exceptions, upon a fundamental change (as defined in the Indenture), the holders of the Notes may require the Company to repurchase all or a portion of their Notes for cash at a purchase price equal to the principal amount plus accrued and unpaid interest. In addition, the Company may redeem the Notes, at its option, at a purchase price equal to the principal amount plus accrued and unpaid interest on or after April 1, 2020, if the closing sale price of the Common Stock exceeds 150% of the then-current conversion price for 20 or more trading days in the 30 consecutive trading day period preceding the Company's exercise of this redemption right.
The Notes are senior unsecured obligations of the Company that rank equal in right of payment to all senior unsecured indebtedness of the Company and rank senior in right of payment to any indebtedness that is contractually subordinated to the Notes.
The Indenture includes customary events of default. If an event of default, as defined in the Indenture, occurs and is continuing, the principal amount of the Notes and any accrued and unpaid interest may be declared immediately due and payable. In the case of bankruptcy or insolvency, the principal amount of the Notes and any accrued and unpaid interest would automatically become immediately due and payable.
The Company has separated the Notes into their liability and equity components in the accompanying condensed consolidated balance sheet. The carrying amount of the liability component was calculated by measuring the fair value of a similar liability that does not have an associated conversion feature. The carrying amount of the equity component, representing the conversion option, was determined by deducting the fair value of the liability component from the principal amount of the Notes. The difference between the principal amount of the Notes and the liability component (the "debt discount") is amortized to interest expense at an effective interest rate of 9.75% over the term of the Notes. The equity component of the Notes is included in additional paid-in capital in the condensed consolidated balance sheet and is not remeasured as long as it continues to meet the conditions for equity classification.
The Company incurred transaction costs of approximately $6.8 million related to the issuance of the Notes. Those transaction costs have been allocated to the liability and equity components in the same manner as the allocation of the proceeds from the Notes. Transaction costs attributable to the liability component of $4.8 million were recorded as a debt discount in the condensed consolidated balance sheet and are being amortized to interest expense over the term of the Notes. Transaction costs attributable to the equity component of $2.0 million were recorded in stockholders' equity as a reduction of the equity component.
The carrying amount of the Notes consisted of the following (in thousands):
| September 30, 2016 | ||
Liability component: |
| ||
Principal amount | $ | 250,000 | |
Less: debt discount | (73,527 | ) | |
Net carrying amount of liability component | $ | 176,473 | |
|
| ||
Net carrying amount of equity component | $ | 67,329 | |
18
GROUPON, INC.
NOTES TO CONDENSED CONSOLIDATED FINANCIAL STATEMENTS (Continued)
(unaudited)
The estimated fair value of the Notes as of September 30, 2016 was $298.0 million and was determined using a lattice model. The Company classified the fair value of the Notes as a Level 3 measurement due to the lack of observable market data over fair value inputs such as its stock price volatility over the term of the Notes and its cost of debt.
As of September 30, 2016 , the remaining term of the Notes is approximately 5 years, 6 months . During the three and nine months ended September 30, 2016 , the Company recognized interest expense on the Notes as follows (in thousands):
| Three Months Ended September 30, 2016 |
| Nine Months Ended September 30, 2016 | ||||
Contractual interest expense based on 3.25% of the principal amount per annum | $ | 2,032 | |
| $ | 4,063 | |
Amortization of debt discount | 2,458 | |
| 4,854 | | ||
Total interest expense | $ | 4,490 | |
| $ | 8,917 | |
Note Hedges and Warrants
On May 9, 2016, the Company purchased convertible note hedges with respect to its Common Stock for a cost of $59.1 million from certain bank counterparties. The convertible note hedges provide the Company with the right to purchase up to 46.3 million shares of the Company's Common Stock at an initial strike price of $5.40 per share, which corresponds to the initial conversion price of the Notes, and are exercisable by the Company upon conversion of the Notes. The convertible note hedges are intended to reduce the potential economic dilution upon conversion of the Notes. The convertible note hedges are separate transactions and are not part of the terms of the Notes. Holders of the Notes do not have any rights with respect to the convertible note hedges.
On May 9, 2016, the Company also sold warrants for total cash proceeds of $35.5 million to certain bank counterparties. The warrants provide the counterparties with the right to purchase up to 46.3 million shares of the Company's Common Stock at a strike price of $8.50 per share. The warrants expire on various dates between July 1, 2022 and August 26, 2022 and are exercisable on their expiration dates. The warrants are separate transactions and are not part of the terms of the Notes or convertible note hedges. Holders of the Notes and convertible note hedges do not have any rights with respect to the warrants.
The amounts paid and received for the convertible note hedges and warrants have been recorded in additional paid-in capital in the condensed consolidated balance sheet as of September 30, 2016 . The convertible note hedges and warrants are not remeasured as long as they continue to meet the conditions for equity classification. The amounts paid for the convertible note hedges are tax deductible over the term of the Notes, while the proceeds received from the warrants are not taxable.
Under the if-converted method, the shares of common stock underlying the conversion option in the Notes are included in the diluted earnings per share denominator and the interest expense on the Notes, net of tax, is added to the numerator. However, upon conversion, there will be no economic dilution from the Notes, as exercise of the convertible note hedges eliminates any dilution from the Notes that would have otherwise occurred when the price of the Company's Common Stock exceeds the conversion price. Taken together, the purchase of the convertible note hedges and sale of warrants are intended to offset any actual dilution from the conversion of these Notes and to effectively increase the overall conversion price from $5.40 to $8.50 per share. Based on the closing price of the Company's Common Stock of $5.15 on September 30, 2016 , the if-converted value of the Notes was less than the principal amount.
Revolving Credit Agreement
On June 29, 2016, the Company amended and restated its senior secured revolving credit agreement (the "Amended and Restated Credit Agreement") that provides for aggregate principal borrowings of up to $250.0 million and matures in June 2019. The Amended and Restated Credit Agreement replaced the Company's previous $250.0 million credit agreement that was scheduled to mature in August 2017 (the "Original Credit Agreement"). Borrowings under the Amended and Restated Credit Agreement bear interest, at the Company's option, at a rate per annum equal to the Alternate Base Rate or Adjusted LIBO Rate (each as defined in the Amended and Restated Credit Agreement) plus an additional margin ranging between 0.50% and 2.25% . The Company is required to pay quarterly commitment fees ranging from 0.25% to 0.40% per annum of the average daily amount of unused commitments available under the Amended and Restated Credit Agreement. The Amended and Restated Credit Agreement also provides for the issuance of up to $45.0 million in letters of credit, provided that the sum of outstanding borrowings and letters of credit do not exceed the maximum funding commitment of $250.0 million .
19
GROUPON, INC.
NOTES TO CONDENSED CONSOLIDATED FINANCIAL STATEMENTS (Continued)
(unaudited)
The Amended and Restated Credit Agreement is secured by substantially all of the Company's and its subsidiaries' tangible and intangible assets, including a pledge of 100% of the outstanding capital stock of substantially all of its direct and indirect domestic subsidiaries and 65% of the shares or equity interests of first-tier foreign subsidiaries and each U.S. entity whose assets substantially consist of capital stock and/or intercompany debt of one or more foreign subsidiaries, subject to certain exceptions. Certain of the Company's domestic subsidiaries are guarantors under the Amended and Restated Credit Agreement.
The Amended and Restated Credit Agreement contains various customary restrictive covenants that limit the Company's ability to, among other things: incur additional indebtedness; make dividend and other restricted payments, including share repurchases; enter into sale or leaseback transactions; make investments, loans or advances; grant or incur liens on assets; sell assets; engage in mergers, consolidations, liquidations or dissolutions; and engage in transactions with affiliates. The Amended and Restated Credit Agreement requires the Company to maintain compliance with specified financial covenants, comprised of a minimum fixed charge coverage ratio, a maximum leverage ratio, a maximum senior secured indebtedness ratio and a minimum liquidity ratio, each as set forth in the Amended and Restated Credit Agreement. The Company is also required to maintain, as of the last day of each fiscal quarter, unrestricted cash of at least $400.0 million , including $200.0 million in accounts held with lenders under the Amended and Restated Credit Agreement or their affiliates. Non-compliance with these covenants may result in termination of the commitments under the Amended and Restated Credit Agreement and any then outstanding borrowings may be declared due and payable immediately. The Company has the right to terminate the Amended and Restated Credit Agreement or reduce the available commitments at any time.
As of September 30, 2016 and December 31, 2015 , the Company had no borrowings under the Amended and Restated Credit Agreement or the Original Credit Agreement, respectively, and was in compliance with all covenants. As of September 30, 2016 and December 31, 2015 , the Company had outstanding letters of credit of $11.4 million and $11.6 million , respectively, under the Amended and Restated Credit Agreement and the Original Credit Agreement.
7. COMMITMENTS AND CONTINGENCIES
The Company's commitments as of September 30, 2016 did not materially change from the amounts set forth in the Company's 2015 Annual Report on Form 10-K.
Legal Matters and Other Contingencies
From time to time, the Company is party to various legal proceedings incident to the operation of its business. For example, the Company is currently involved in proceedings brought by former employees and merchants, intellectual property infringement suits and suits by customers (individually or as class actions) alleging, among other things, violations of the Credit Card Accountability, Responsibility and Disclosure Act and state laws governing gift cards, stored value cards and coupons. The following is a brief description of significant legal proceedings.
The Company was a defendant in a proceeding pursuant to which, on October 29, 2012, a consolidated amended class action complaint was filed against the Company, certain of its directors and officers, and the underwriters that participated in the initial public offering of the Company's Class A common stock. The case was pending before the United States District Court for the Northern District of Illinois: In re Groupon, Inc. Securities Litigation . In the first quarter of 2016, the parties entered into a term sheet to settle the litigation that provides for a settlement payment to the class of $45.0 million in cash, including plaintiff's attorneys' fees, in exchange for a full and final release and also includes a denial of liability or any wrongdoing by the Company and the other defendants. On April 7, 2016, the Court entered an order preliminarily approving the settlement. On April 21, 2016, a $45.0 million settlement payment was made into an escrow account. On July 13, 2016, the Court entered an order providing final approval of the settlement and final judgment, dismissing the action with prejudice. The Company derecognized its liability for the matter and its related asset for the amount previously funded into the escrow account at that time.
Federal and state purported stockholder derivative lawsuits have been filed against certain of the Company's current and former directors and officers. The federal purported stockholder derivative lawsuit was originally filed in April 2012, and a consolidated stockholder derivative complaint, filed on July 30, 2012, is currently pending in the United States District Court for the Northern District of Illinois: In re Groupon Derivative Litigation . The state derivative cases are currently pending before the Chancery Division of the Circuit Court of Cook County, Illinois: Orrego v. Lefkofsky, et al., was filed on April 5, 2012; and Kim v. Lefkofsky, et al., was filed on May 25, 2012. In the first quarter of 2016, the parties reached an agreement in principle to settle the litigation. The agreement, which is subject to court approval, provides that the Company will implement certain corporate reforms. On September 19, 2016, the parties participated in a mediation regarding a reasonable plaintiffs' attorneys' fee award to be paid as part of the settlement. The parties did not reach agreement and continue to negotiate that aspect of the settlement.
20
GROUPON, INC.
NOTES TO CONDENSED CONSOLIDATED FINANCIAL STATEMENTS (Continued)
(unaudited)
In 2010, the Company was named as a defendant in a series of class actions that were consolidated in the U.S. District Court for the Southern District of California. The consolidated actions are referred to as In re Groupon Marketing and Sales Practices Litigation . In July 2015, the parties reached an agreement in principle regarding a settlement involving a combination of cash and Groupon credits, worth a total of $8.5 million . On March 23, 2016, the district court granted final approval of the settlement over various objections posed by two individuals and entered judgment pursuant to the settlement. In April 2016, the two individuals who had objected filed notices of appeal with the Ninth Circuit Court of Appeals. One appeal challenged the district court's approval of the class action settlement; the other appeal challenged the district court's denial of the objector's request for an award of attorney's fees. The appeal challenging the approval of the settlement was dismissed on June 23, 2016, and the settlement became final and non-appealable as of that date. The case was dismissed with prejudice and settlement claims are being validated and processed. The Company was fully reserved for the settlement amount as of September 30, 2016 and December 31, 2015.
On March 2, 2016, International Business Machines Corporation ("IBM") filed a complaint in the United States District Court for the District of Delaware against the Company. In the complaint, IBM alleges that the Company has infringed and continues to willfully infringe certain IBM patents that IBM claims relate to the presentation of applications and advertising in an interactive service, preserving state information in online transactions and single sign-on processes in a computing environment and seeks unspecified damages (including a request that the amount of compensatory damages be trebled), injunctive relief and costs and reasonable attorneys' fees. On May 9, 2016, the Company filed a complaint in the United States District Court for the Northern District of Illinois against IBM. The Company alleges that IBM has infringed and continues to willfully infringe one of the Company's patents relating to location-based services. The Company intends to seek damages and injunctive relief for IBM's infringement of this patent. IBM filed a motion to dismiss this case, and the court has yet to rule on that motion. Further, the Company plans to vigorously defend against the claims filed by IBM.
In addition, other third parties have from time to time claimed, and others may claim in the future, that the Company has infringed their intellectual property rights. The Company is subject to intellectual property disputes, including patent infringement claims, and expects that it will increasingly be subject to intellectual property infringement claims as its services expand in scope and complexity. The Company has in the past litigated such claims, and the Company is presently involved in several patent infringement and other intellectual property-related claims, including pending litigation or trademark disputes, some of which could involve potentially substantial claims for damages. The Company may also become more vulnerable to third party claims as laws such as the Digital Millennium Copyright Act are interpreted by the courts, and as the Company becomes subject to laws in jurisdictions where the underlying laws with respect to the potential liability of online intermediaries are either unclear or less favorable. The Company believes that additional lawsuits alleging that it has violated patent, copyright or trademark laws will be filed against it. Intellectual property claims, whether meritorious or not, are time consuming and costly to resolve, could require expensive changes in the Company's methods of doing business, or could require it to enter into costly royalty or licensing agreements.
The Company is also subject to, or in the future may become subject to, a variety of regulatory inquiries across the jurisdictions where the Company conducts its business, including, for example, inquiries related to consumer protection, employment matters and/or hiring practices, marketing practices, tax, unclaimed property and privacy rules and regulations. Any regulatory actions against the Company, whether meritorious or not, could be time consuming, result in costly litigation, damage awards, injunctive relief or increased costs of doing business through adverse judgment or settlement, require the Company to change its business practices in expensive ways, require significant amounts of management time, result in the diversion of significant operational resources or otherwise harm the Company's business.
The Company establishes an accrued liability for loss contingencies related to legal and regulatory matters when the loss is both probable and estimable. These accruals represent management's best estimate of probable losses and, in such cases, there may be an exposure to loss in excess of the amounts accrued. For certain of the matters described above, there are inherent and significant uncertainties based on, among other factors, the stage of the proceedings, developments in the applicable facts of law, or the lack of a specific damage claim. However, the Company believes that the amount of reasonably possible losses in excess of the amounts accrued for these matters would not have a material adverse effect on its business, consolidated financial position, results of operations or cash flows. The Company's accrued liabilities for loss contingencies related to legal and regulatory matters may change in the future as a result of new developments, including, but not limited to, the occurrence of new legal matters, changes in the law or regulatory environment, adverse or favorable rulings, newly discovered facts relevant to the matter, or changes
21
GROUPON, INC.
NOTES TO CONDENSED CONSOLIDATED FINANCIAL STATEMENTS (Continued)
(unaudited)
in the strategy for the matter. Regardless of the outcome, litigation can have an adverse impact on the Company because of defense and settlement costs, diversion of management resources and other factors.
Indemnifications
In the normal course of business to facilitate transactions related to its operations, the Company indemnifies certain parties, including employees, lessors, service providers and merchants, with respect to various matters. The Company has agreed to hold certain parties harmless against losses arising from a breach of representations or covenants, or other claims made against those parties. These agreements may limit the time within which an indemnification claim can be made and the amount of the claim. The Company is also subject to increased exposure to various claims as a result of its acquisitions, particularly in cases where the Company is entering into new businesses in connection with such acquisitions. The Company may also become more vulnerable to claims as it expands the range and scope of its services and is subject to laws in jurisdictions where the underlying laws with respect to potential liability are either unclear or less favorable. In addition, the Company has entered into indemnification agreements with its officers, directors and underwriters, and the Company's bylaws contain similar indemnification obligations that cover officers, directors, employees and other agents.
It is not possible to determine the maximum potential amount under these indemnification agreements due to the limited history of prior indemnification claims and the unique facts and circumstances involved in each particular agreement. Historically, any payments that the Company has made under these agreements have not had a material impact on the operating results, financial position or cash flows of the Company.
8. STOCKHOLDERS' EQUITY AND COMPENSATION ARRANGEMENTS
Common Stock
The Company's certificate of incorporation, as amended and restated, authorizes three classes of common stock: Class A common stock, Class B common stock and common stock. No shares of common stock will be issued or outstanding until October 31, 2016, at which time all outstanding shares of Class A common stock and Class B common stock will automatically convert into shares of common stock. In addition, the Company's certificate of incorporation authorizes shares of undesignated preferred stock, the rights, preferences and privileges of which may be designated from time to time by the Board of Directors (the "Board").
Share Repurchase Program
The Board previously authorized the Company to repurchase up to $500.0 million of its Class A common stock through August 2017 under its current share repurchase program. In April 2016, the Board approved an increase of $200.0 million to its share repurchase program and an extension of the program through April 2018. During the three and nine months ended September 30, 2016 , the Company purchased 5,213,778 and 30,829,948 shares, respectively, for an aggregate purchase price of $24.6 million and $112.5 million (including fees and commissions) under that program. As of September 30, 2016 , up to $244.7 million of Class A common stock remained available for purchase under that program. The timing and amount of any share repurchases are determined based on market conditions, share price and other factors, and the program may be discontinued or suspended at any time.
Groupon, Inc. Stock Plans
The Groupon, Inc. Stock Plans (the "Plans") are administered by the Compensation Committee of the Board, which determines the number of awards to be issued, the corresponding vesting schedule and the exercise price for options. As of September 30, 2016 , 79,071,218 shares were available for future issuance under the Plans.
The Company recognized stock-based compensation expense from continuing operations of $26.4 million and $35.6 million for the three months ended September 30, 2016 and 2015 , respectively, and $94.8 million and $109.2 million for the nine months ended September 30, 2016 and 2015 , respectively, related to stock awards issued under the Plans and acquisition-related awards. The Company recognized stock-based compensation expense from discontinued operations of $5.3 million for the nine months ended September 30, 2015 . The Company also capitalized $2.3 million and $2.8 million of stock-based compensation for the three months ended September 30, 2016 and 2015 , respectively, and $7.3 million and $9.2 million of stock-based compensation for the nine months ended September 30, 2016 and 2015 , respectively, in connection with internally-developed software.
22
GROUPON, INC.
NOTES TO CONDENSED CONSOLIDATED FINANCIAL STATEMENTS (Continued)
(unaudited)
As of September 30, 2016 , a total of $124.8 million of unrecognized compensation costs related to unvested employee stock awards and unvested acquisition-related awards are expected to be recognized over a remaining weighted-average period of 1.00 year .
Employee Stock Purchase Plan
The Company is authorized to grant up to 10,000,000 shares of common stock under its employee stock purchase plan ("ESPP"). For the nine months ended September 30, 2016 and 2015 , 1,669,782 and 1,037,198 shares of common stock were issued under the ESPP, respectively.
Stock Options
The table below summarizes the stock option activity for the nine months ended September 30, 2016 :
|
| Options |
| Weighted- Average Exercise Price |
| Weighted- Average Remaining Contractual Term (in years) |
| Aggregate Intrinsic Value | |||||
Outstanding at December 31, 2015 |
| 1,584,832 | |
| $ | 0.95 | |
| 3.96 |
| $ | 3,360 | |
Exercised |
| (490,283 | ) |
| 1.26 | |
|
|
|
| |||
Forfeited |
| (100,977 | ) |
| 0.86 | |
|
|
|
| |||
Outstanding and exercisable at September 30, 2016 |
| 993,572 | |
| $ | 0.78 | |
| 3.09 |
| $ | 4,342 | |
(1) | The aggregate intrinsic value of options outstanding and exercisable represents the total pretax intrinsic value (the difference between the fair value of the Company's stock on the last day of each period and the exercise price, multiplied by the number of options where the fair value exceeds the exercise price) that would have been received by the option holders had all option holders exercised their options as of September 30, 2016 and December 31, 2015 , respectively. |
Restricted Stock Units
The restricted stock units granted under the Plans generally have vesting periods between one and four years. Restricted stock units are generally amortized on a straight-line basis over the requisite service period, except for restricted stock units with performance conditions and ratable vesting, which are amortized using the accelerated method. In May 2015, 575,744 restricted stock units previously granted to Ticket Monster employees were modified to permit continued vesting following the Company's sale of its controlling stake in Ticket Monster. These nonemployee restricted stock units, which require ongoing employment with Ticket Monster to vest, are remeasured to fair value each reporting period. As of September 30, 2016 , 194,522 nonemployee restricted stock units were outstanding.
The table below summarizes activity regarding unvested restricted stock units granted under the Plans for the nine months ended September 30, 2016 :
|
| Restricted Stock Units |
| Weighted- Average Grant Date Fair Value (per share) | |||
Unvested at December 31, 2015 |
| 39,143,509 | |
| $ | 6.53 | |
Granted |
| 17,163,910 | |
| $ | 3.73 | |
Vested |
| (17,667,674 | ) |
| $ | 6.02 | |
Forfeited |
| (9,681,219 | ) |
| $ | 6.53 | |
Unvested at September 30, 2016 |
| 28,958,526 | |
| $ | 5.19 | |
Restricted Stock Awards
The Company has granted restricted stock awards in connection with business combinations. Compensation expense on these awards is recognized on a straight-line basis over the requisite service periods, which extend through January 2018.
23
GROUPON, INC.
NOTES TO CONDENSED CONSOLIDATED FINANCIAL STATEMENTS (Continued)
(unaudited)
The table below summarizes activity regarding unvested restricted stock for the nine months ended September 30, 2016 :
|
| Restricted Stock Awards |
| Weighted- Average Grant Date Fair Value (per share) | |||
Unvested at December 31, 2015 |
| 1,908,408 | |
| $ | 5.72 | |
Granted |
| - | |
| $ | - | |
Vested |
| (492,422 | ) |
| $ | 7.42 | |
Forfeited |
| (196,968 | ) |
| $ | 7.42 | |
Unvested at September 30, 2016 |
| 1,219,018 | |
| $ | 4.76 | |
Performance Share Units
During the nine months ended September 30, 2016 , the Company granted 389,046 performance share units to certain key employees. The vesting of these awards into shares of the Company's Class A common stock is contingent upon the Company's achievement of specified financial and operational targets for the year ended December 31, 2016 and is subject to continued employment through the performance period. The weighted-average grant date fair value of the performance share units was $3.78 per share. There were no shares vested or forfeited during the nine months ended September 30, 2016 .
9. RESTRUCTURING
In September 2015, the Company commenced a restructuring plan relating primarily to workforce reductions in its international operations. The Company has also undertaken workforce reductions in its North America segment. In addition to workforce reductions in its ongoing markets, the Company has ceased operations in six countries within its Rest of World segment and 11 countries within its EMEA segment as part of the restructuring plan, including four countries within its EMEA segment that were exited during the nine months ended September 30, 2016 . The total revenue and net loss for the countries exited under the restructuring plan were $11.2 million and $2.2 million , respectively, for the three months ended September 30, 2015 . The total revenue and net loss for the countries exited under the restructuring plan were $39.5 million and $8.0 million , respectively, for the nine months ended September 30, 2015 . The total revenue and net loss for the countries exited under the restructuring plan for the nine months ended September 30, 2016 were not material. Costs related to the restructuring plan are classified as "Restructuring charges" on the condensed consolidated statements of operations.
From the inception of its restructuring plan in September 2015 through September 30, 2016 , the Company has incurred cumulative costs for employee severance and benefits and other exit costs of $52.2 million under the plan. In addition to those costs, the Company has incurred cumulative long-lived asset impairment charges of $7.3 million resulting from its restructuring activities. Management continues to explore potential further restructuring actions in connection with its efforts to optimize the Company's cost structure and global footprint.
The following table summarizes the costs incurred by segment related to the Company's restructuring plan for the three months ended September 30, 2016 (in thousands):
| | Three Months Ended September 30, 2016 | ||||||||||
| | Employee Severance and Benefit Costs (1) | | Other Exit Costs | | Total Restructuring Charges | ||||||
North America | | $ | 274 | | | $ | 695 | | | $ | 969 | |
EMEA | | (412 | ) | | 224 | | | (188 | ) | |||
Rest of World | | 580 | | | 98 | | | 678 | | |||
Consolidated | | $ | 442 | | | $ | 1,017 | | | $ | 1,459 | |
(1) | The employee severance and benefit costs for the three months ended September 30, 2016 relates to the termination of approximately 150 employees. Substantially all of the remaining cash payments for those costs are expected to be disbursed through June 30, 2017. |
24
GROUPON, INC.
NOTES TO CONDENSED CONSOLIDATED FINANCIAL STATEMENTS (Continued)
(unaudited)
The following table summarizes the costs incurred by segment related to the Company's restructuring plan for the nine months ended September 30, 2016 (in thousands):
|
| Nine Months Ended September 30, 2016 | ||||||||||||||
|
| Employee Severance and Benefit Costs (1) |
| Asset Impairments |
| Other Exit Costs |
| Total Restructuring Charges | ||||||||
North America |
| $ | 6,487 | |
| $ | 45 | |
| $ | 2,862 | |
| $ | 9,394 | |
EMEA |
| 15,417 | |
| - | |
| 553 | |
| 15,970 | | ||||
Rest of World |
| 4,301 | |
| - | |
| 323 | |
| 4,624 | | ||||
Consolidated |
| $ | 26,205 | |
| $ | 45 | |
| $ | 3,738 | |
| $ | 29,988 | |
(1) | The employee severance and benefit costs for the nine months ended September 30, 2016 relates to the termination of approximately 900 employees. Substantially all of the remaining cash payments for those costs are expected to be disbursed through December 31, 2017. |
The following table summarizes the costs incurred by segment related to the Company's restructuring plan for the three and nine months ended September 30, 2015 (in thousands):
|
| Three and Nine Months Ended September 30, 2015 | ||||||||||||||
|
| Employee Severance and Benefit Costs (1) |
| Asset Impairments |
| Other Exit Costs |
| Total Restructuring Charges | ||||||||
North America |
| $ | 890 | |
| $ | - | |
| $ | 511 | |
| $ | 1,401 | |
EMEA |
| 19,652 | |
| - | |
| 83 | |
| 19,735 | | ||||
Rest of World |
| 2,017 | |
| 345 | |
| 648 | |
| 3,010 | | ||||
Consolidated |
| $ | 22,559 | |
| $ | 345 | |
| $ | 1,242 | |
| $ | 24,146 | |
(1) | The employee severance and benefit costs for the three and nine months ended September 30, 2015 related to the termination of approximately 1,200 employees. |
The following table summarizes restructuring liability activity for the nine months ended September 30, 2016 (in thousands):
| | Employee Severance and Benefit Costs |
| Other Exit Costs |
| Total | ||||||
Balance as of December 31, 2015 | | $ | 9,017 | |
| $ | 2,539 | |
| $ | 11,556 | |
Charges payable in cash (1) | | 21,520 | |
| 3,739 | |
| 25,259 | | |||
Cash payments | | (20,268 | ) |
| (5,583 | ) |
| (25,851 | ) | |||
Foreign currency translation | | 223 | |
| 13 | |
| 236 | | |||
Balance as of September 30, 2016 | | $ | 10,492 | |
| $ | 708 | |
| $ | 11,200 | |
(1) | Excludes stock-based compensation of $4.7 million related to accelerated vesting of stock-based compensation awards for certain employees terminated as a result of the Company's restructuring activities for the nine months ended September 30, 2016 . |
10. INCOME TAXES
The Company's tax provision for interim periods is determined using an estimate of its annual effective tax rate, adjusted for discrete items.
For the three months ended September 30, 2016 , the Company recorded income tax expense from continuing operations of $2.1 million on a pre-tax loss from continuing operations of $33.7 million . For the three months ended September 30, 2015 , the Company recorded an income tax benefit from continuing operations of $54.0 million on a pre-tax loss from continuing operations of $78.6 million .
For the nine months ended September 30, 2016 , the Company recorded income tax expense from continuing operations of $1.6 million on a pre-tax loss from continuing operations of $131.5 million . For the nine months ended September 30, 2015 ,
25
GROUPON, INC.
NOTES TO CONDENSED CONSOLIDATED FINANCIAL STATEMENTS (Continued)
(unaudited)
the Company recorded an income tax benefit from continuing operations of $42.9 million on a pre-tax loss from continuing operations of $99.5 million .
The Company's U.S. statutory rate is 35% . The primary factor impacting the effective tax rate for the three and nine months ended September 30, 2016 was the pre-tax losses incurred by the Company's operations in jurisdictions that have valuation allowances against their net deferred tax assets, including the United States. Significant factors impacting the effective tax rate for the three and nine months ended September 30, 2015 included pre-tax losses incurred by the Company's operations in certain foreign jurisdictions that had valuation allowances against their net deferred tax assets, from continuing operations in jurisdictions that the Company was not able to benefit due to uncertainty as to the realization of those losses, amortization of the tax effects of intercompany sales of intellectual property, nondeductible stock-based compensation expense and decreases in liabilities for uncertain tax positions.
The Company expects that its consolidated effective tax rate in future periods will continue to differ significantly from the U.S. federal income tax rate as a result of its tax obligations in jurisdictions with profits and valuation allowances in jurisdictions with losses.
The Company is currently undergoing income tax audits in multiple jurisdictions. There are many factors, including factors outside of the Company's control, which influence the progress and completion of those audits. As of September 30, 2016 , the Company believes that it is reasonably possible that changes of up to $24.9 million in unrecognized tax benefits may occur within the next 12 months upon closing of income tax audits or the expiration of applicable statutes of limitations.
See Note 2, "Discontinued Operations and Other Dispositions," for discussion of the income tax benefit from discontinued operations for the nine months ended September 30, 2015 .
11. FAIR VALUE MEASUREMENTS
Fair value is defined under U.S. GAAP as the price that would be received to sell an asset or paid to transfer a liability in an orderly transaction between market participants at the measurement date. As such, fair value is a market-based measurement that is determined based on assumptions that market participants would use in pricing an asset or a liability.
To increase the comparability of fair value measures, the following hierarchy prioritizes the inputs in valuation methodologies used to measure fair value:
Level 1 - Measurements that reflect quoted prices (unadjusted) for identical assets or liabilities in active markets.
Level 2 - Measurements that include other inputs that are directly or indirectly observable in the marketplace.
Level 3 - Measurements derived from valuation techniques in which one or more significant inputs or significant value drivers are unobservable. These fair value measurements require significant judgment.
In determining fair value, the Company uses various valuation approaches within the fair value measurement framework. The valuation methodologies used for the Company's assets and liabilities measured at fair value and their classification in the valuation hierarchy are summarized below:
Cash equivalents - Cash equivalents primarily consist of AAA-rated money market funds. The Company classified cash equivalents as Level 1 due to the short-term nature of these instruments and measured the fair value based on quoted prices in active markets for identical assets.
Fair value option and available-for-sale securities investments - See Note 4, " Investments ," for discussion of the valuation methodologies used to measure the fair value of the Company's investments in Monster LP and GroupMax. The Company measures the fair value of those investments using the discounted cash flow method, which is an income approach, and the market approach. The Company also has investments in redeemable preferred shares and convertible debt securities issued by nonpublic entities. The Company measures the fair value of those available-for-sale securities using the discounted cash flow method.
26
GROUPON, INC.
NOTES TO CONDENSED CONSOLIDATED FINANCIAL STATEMENTS (Continued)
(unaudited)
The Company has classified its fair value option investments and its investments in available-for-sale securities as Level 3 due to the lack of observable market data over fair value inputs such as cash flow projections and discount rates. Increases in projected cash flows and decreases in discount rates contribute to increases in the estimated fair values of the fair value option investments and available-for-sale securities, whereas decreases in projected cash flows and increases in discount rates contribute to decreases in their fair values.
Contingent consideration - The Company has contingent obligations to transfer cash to the former owners of acquired businesses if specified financial results are met over future reporting periods (i.e., earn-outs). Liabilities for contingent consideration are measured at fair value each reporting period, with the acquisition-date fair value included as part of the consideration transferred and subsequent changes in fair value are recorded in earnings within "Acquisition-related expense (benefit), net" on the condensed consolidated statements of operations.
The Company uses an income approach to value contingent consideration obligations based on future financial performance, which is determined based on the present value of probability-weighted future cash flows. The Company has classified the contingent consideration liabilities as Level 3 due to the lack of relevant observable market data over fair value inputs such as probability-weighting of payment outcomes. Increases in the assessed likelihood of a higher payout under a contingent consideration arrangement contribute to increases in the fair value of the related liability. Conversely, decreases in the assessed likelihood of a higher payout under a contingent consideration arrangement contribute to decreases in the fair value of the related liability. Changes in assumptions could have an impact on the payout of contingent consideration arrangements with a maximum payout of $16.0 million .
The following tables summarize the Company's assets and liabilities that are measured at fair value on a recurring basis (in thousands):
|
|
| Fair Value Measurement at Reporting Date Using | ||||||||||||
Description | September 30, 2016 |
| Quoted Prices in Active Markets for |
| Significant Other |
| Significant | ||||||||
Assets: |
|
|
|
|
|
|
| ||||||||
Cash equivalents | $ | 237,070 | |
| $ | 237,070 | |
| $ | - | |
| $ | - | |
Fair value option investments | 123,424 | |
| - | |
| - | |
| 123,424 | | ||||
Available-for-sale securities: |
|
|
|
|
|
|
| ||||||||
Convertible debt securities | 9,931 | |
| - | |
| - | |
| 9,931 | | ||||
Redeemable preferred shares | 17,177 | |
| - | |
| - | |
| 17,177 | | ||||
|
|
|
|
|
|
|
| ||||||||
Liabilities: |
|
|
|
|
|
|
| ||||||||
Contingent consideration | 14,626 | |
| - | |
| - | |
| 14,626 | | ||||
|
|
| Fair Value Measurement at Reporting Date Using | ||||||||||||
Description | December 31, 2015 |
| Quoted Prices in Active Markets for |
| Significant Other |
| Significant | ||||||||
Assets: |
|
|
|
|
|
|
| ||||||||
Cash equivalents | $ | 305,179 | |
| $ | 305,179 | |
| $ | - | |
| $ | - | |
Fair value option investments | 130,725 | |
| - | |
| - | |
| 130,725 | | ||||
Available-for-sale securities: |
|
|
|
|
|
|
| ||||||||
Convertible debt securities | 10,116 | |
| - | |
| - | |
| 10,116 | | ||||
Redeemable preferred shares | 22,834 | |
| - | |
| - | |
| 22,834 | | ||||
|
|
|
|
|
|
|
| ||||||||
Liabilities: |
|
|
|
|
|
|
| ||||||||
Contingent consideration | 10,781 | |
| - | |
| - | |
| 10,781 | | ||||
27
GROUPON, INC.
NOTES TO CONDENSED CONSOLIDATED FINANCIAL STATEMENTS (Continued)
(unaudited)
The following table provides a roll-forward of the fair value of recurring Level 3 fair value measurements for the three and nine months ended September 30, 2016 and 2015 (in thousands):
|
| Three Months Ended September 30, |
| Nine Months Ended September 30, | ||||||||||||
|
| 2016 |
| 2015 |
| 2016 |
| 2015 | ||||||||
Assets |
|
|
|
|
|
|
|
| ||||||||
Fair value option investments: |
|
|
|
|
|
|
|
| ||||||||
Beginning Balance |
| $ | 125,018 | |
| $ | 122,525 | |
| $ | 130,725 | |
| $ | - | |
Acquisition of investments |
| - | |
| 16,400 | |
| - | |
| 138,475 | | ||||
Total gains (losses) included in earnings |
| (1,594 | ) |
| (2,564 | ) |
| (7,301 | ) |
| (2,114 | ) | ||||
Ending Balance |
| $ | 123,424 | |
| $ | 136,361 | |
| $ | 123,424 | |
| $ | 136,361 | |
Unrealized gains (losses) still held (1) |
| $ | (1,594 | ) |
| $ | (2,564 | ) |
| $ | (7,301 | ) |
| $ | (2,114 | ) |
Available-for-sale securities |
|
|
|
|
|
|
|
| ||||||||
Convertible debt securities: |
|
|
|
|
|
|
|
| ||||||||
Beginning Balance |
| $ | 10,573 | |
| $ | 8,026 | |
| $ | 10,116 | |
| $ | 2,527 | |
Purchase of convertible debt security |
| - | |
| - | |
| - | |
| 5,000 | | ||||
Sale of convertible debt security |
| (1,685 | ) |
| - | |
| (1,685 | ) |
| - | | ||||
Total gains (losses) included in other comprehensive income |
| 566 | |
| (362 | ) |
| 786 | |
| (50 | ) | ||||
Total gains (losses) included in other income (expense), net (2) |
| 477 | |
| 218 | |
| 714 | |
| 405 | | ||||
Ending Balance |
| $ | 9,931 | |
| $ | 7,882 | |
| $ | 9,931 | |
| $ | 7,882 | |
Unrealized gains (losses) still held (1) |
| $ | 1,043 | |
| $ | (144 | ) |
| $ | 1,500 | |
| $ | 355 | |
Redeemable preferred shares: |
|
|
|
|
|
|
|
| ||||||||
Beginning Balance |
| $ | 22,343 | |
| $ | 4,881 | |
| $ | 22,834 | |
| $ | 4,910 | |
Total gains (losses) included in other comprehensive income (loss) |
| (592 | ) |
| 53 | |
| (1,083 | ) |
| 24 | | ||||
Transfer to cost method investment classification upon elimination of redemption feature |
| (4,574 | ) |
| - | |
| (4,574 | ) |
| - | | ||||
Ending Balance |
| $ | 17,177 | |
| $ | 4,934 | |
| $ | 17,177 | |
| $ | 4,934 | |
Unrealized (losses) gains still held (1) |
| $ | (592 | ) |
| $ | 53 | |
| $ | (1,083 | ) |
| $ | 24 | |
|
|
|
|
|
|
|
|
| ||||||||
Liabilities |
|
|
|
|
|
|
|
| ||||||||
Contingent Consideration: |
|
|
|
|
|
|
|
| ||||||||
Beginning Balance |
| $ | 14,788 | |
| $ | 233 | |
| $ | 10,781 | |
| $ | 1,983 | |
Issuance of contingent consideration in connection with acquisitions |
| - | |
| 9,605 | |
| - | |
| 9,605 | | ||||
Settlements of contingent consideration liabilities |
| - | |
| - | |
| - | |
| (716 | ) | ||||
Reclass to non-fair value liabilities when no longer contingent |
| - | |
| - | |
| (285 | ) |
| (331 | ) | ||||
Total losses (gains) included in earnings (3) |
| (162 | ) |
| 435 | |
| 4,130 | |
| (268 | ) | ||||
Ending Balance |
| $ | 14,626 | |
| $ | 10,273 | |
| $ | 14,626 | |
| $ | 10,273 | |
Unrealized losses (gains) still held (1) |
| $ | (162 | ) |
| $ | 435 | |
| $ | 4,004 | |
| $ | (656 | ) |
(1) | Represents the unrealized losses or gains recorded in earnings and/or other comprehensive income (loss) during the period for assets and liabilities classified as Level 3 that are still held (or outstanding) at the end of the period. |
(2) | Represents accretion of interest income and changes in the fair value of an embedded derivative. |
(3) | Changes in the fair value of contingent consideration liabilities are classified within "Acquisition-related expense (benefit), net" on the condensed consolidated statements of operations. |
Assets and Liabilities Measured at Fair Value on a Nonrecurring Basis
Certain assets and liabilities are measured at fair value on a nonrecurring basis, including assets that are written down to fair value as a result of an impairment. The Company did not record any significant nonrecurring fair value measurements after initial recognition for the three and nine months ended September 30, 2016 and 2015 .
28
GROUPON, INC.
NOTES TO CONDENSED CONSOLIDATED FINANCIAL STATEMENTS (Continued)
(unaudited)
Estimated Fair Value of Financial Assets and Liabilities Not Measured at Fair Value
The following table presents the carrying amounts and fair values of financial instruments that are not carried at fair value in the consolidated financial statements (in thousands):
|
| September 30, 2016 |
| December 31, 2015 | ||||||||||||
|
| Carrying Amount |
| Fair Value |
| Carrying Amount |
| Fair Value | ||||||||
Cost method investments |
| $ | 30,085 | |
| $ | 32,632 | |
| $ | 14,561 | |
| $ | 15,922 | |
The fair values of the Company's cost method investments were determined using the market approach or the income approach, depending on the availability of fair value inputs such as financial projections for the investees and market multiples for comparable companies. The Company has classified the fair value measurements of its cost method investments as Level 3 measurements within the fair value hierarchy because they involve significant unobservable inputs such as cash flow projections and discount rates.
The Company's other financial instruments not carried at fair value consist primarily of accounts receivable, restricted cash, accounts payable, accrued merchant and supplier payables and accrued expenses. The carrying values of these assets and liabilities approximate their respective fair values as of September 30, 2016 and December 31, 2015 due to their short-term nature.
12. INCOME (LOSS) PER SHARE OF CLASS A AND CLASS B COMMON STOCK
The Company computes net income (loss) per share of Class A and Class B common stock using the two-class method. Basic net income (loss) per share is computed using the weighted-average number of common shares outstanding during the period. Diluted net income (loss) per share is computed using the weighted-average number of common shares and the effect of potentially dilutive securities outstanding during the period. Potentially dilutive securities consist of stock options, restricted stock units, unvested restricted stock awards, warrants, performance share units, ESPP shares and convertible senior notes. The dilutive effect of these securities is reflected in diluted net income (loss) per share by application of the treasury stock method or the if-converted method. The computation of the diluted net income (loss) per share of Class A common stock assumes the conversion of Class B common stock, if dilutive, while the diluted net income (loss) per share of Class B common stock does not assume the conversion of those shares.
The rights, including the liquidation and dividend rights, of the holders of Class A and Class B common stock are identical, except with respect to voting. Under the two-class method, the undistributed earnings for each period are allocated based on the contractual participation rights of the Class A and Class B common stock as if the earnings for the period had been distributed. As the liquidation and dividend rights are identical, the undistributed earnings are allocated on a proportionate basis. Further, as the Company assumes the conversion of Class B common stock, if dilutive, in the computation of the diluted net income (loss) per share of Class A common stock, the undistributed earnings are equal to net income (loss) for that computation.
The following table sets forth the computation of basic and diluted net income (loss) per share of Class A and Class B common stock for the three and nine months ended September 30, 2016 and 2015 (in thousands, except share amounts and per share amounts):
|
| Three Months Ended September 30, |
| Nine Months Ended September 30, | ||||||||||||||||||||||||||||
|
| 2016 |
| 2015 |
| 2016 |
| 2015 | ||||||||||||||||||||||||
|
| Class A |
| Class B |
| Class A |
| Class B |
| Class A |
| Class B |
| Class A |
| Class B | ||||||||||||||||
Basic net income (loss) per share: |
|
|
|
|
|
|
|
|
|
|
|
|
|
|
|
| ||||||||||||||||
Numerator |
|
|
|
|
|
|
|
|
|
|
|
|
|
|
|
| ||||||||||||||||
Allocation of net income (loss) - continuing operations |
| $ | (35,643 | ) |
| $ | (149 | ) |
| $ | (24,522 | ) |
| $ | (91 | ) |
| $ | (132,567 | ) |
| $ | (552 | ) |
| $ | (56,414 | ) |
| $ | (205 | ) |
Less: Allocation of net income (loss) attributable to noncontrolling interests |
| 2,175 | |
| 9 | |
| 2,991 | |
| 11 | |
| 8,843 | |
| 37 | |
| 9,613 | |
| 35 | | ||||||||
29
GROUPON, INC.
NOTES TO CONDENSED CONSOLIDATED FINANCIAL STATEMENTS (Continued)
(unaudited)
Allocation of net income (loss) attributable to common stockholders - continuing operations |
| $ | (37,818 | ) |
| $ | (158 | ) |
| $ | (27,513 | ) |
| $ | (102 | ) |
| $ | (141,410 | ) |
| $ | (589 | ) |
| $ | (66,027 | ) |
| $ | (240 | ) |
Allocation of net income (loss) attributable to common stockholders - discontinued operations |
| - | |
| - | |
| - | |
| - | |
| - | |
| - | |
| 132,966 | |
| 497 | | ||||||||
Allocation of net income (loss) attributable to common stockholders |
| $ | (37,818 | ) |
| $ | (158 | ) |
| $ | (27,513 | ) |
| $ | (102 | ) |
| $ | (141,410 | ) |
| $ | (589 | ) |
| $ | 66,939 | |
| $ | 257 | |
Denominator |
|
|
|
|
|
|
|
|
|
|
|
|
|
|
|
| ||||||||||||||||
Weighted-average common shares outstanding |
| 572,816,215 | |
| 2,399,976 | |
| 642,494,809 | |
| 2,399,976 | |
| 575,890,315 | |
| 2,399,976 | |
| 661,902,654 | |
| 2,399,976 | | ||||||||
Basic net income (loss) per share: |
|
|
|
|
|
|
|
|
|
|
|
|
|
|
|
| ||||||||||||||||
Continuing operations |
| $ | (0.07 | ) |
| $ | (0.07 | ) |
| $ | (0.04 | ) |
| $ | (0.04 | ) |
| $ | (0.25 | ) |
| $ | (0.25 | ) |
| $ | (0.10 | ) |
| $ | (0.10 | ) |
Discontinued operations |
| - | |
| - | |
| - | |
| - | |
| - | |
| - | |
| 0.20 | |
| 0.20 | | ||||||||
Basic net income (loss) per share |
| $ | (0.07 | ) |
| $ | (0.07 | ) |
| $ | (0.04 | ) |
| $ | (0.04 | ) |
| $ | (0.25 | ) |
| $ | (0.25 | ) |
| $ | 0.10 | |
| $ | 0.10 | |
|
|
|
|
|
|
|
|
|
|
|
|
|
|
|
|
| ||||||||||||||||
Diluted net income (loss) per share: |
|
|
|
|
|
|
|
|
|
|
|
|
|
|
|
| ||||||||||||||||
Numerator |
|
|
|
|
|
|
|
|
|
|
|
|
|
|
|
| ||||||||||||||||
Allocation of net income (loss) attributable to common stockholders for basic computation - continuing operations |
| $ | (37,818 | ) |
| $ | (158 | ) |
| $ | (27,513 | ) |
| $ | (102 | ) |
| $ | (141,410 | ) |
| $ | (589 | ) |
| $ | (66,027 | ) |
| $ | (240 | ) |
Reallocation of net income (loss) attributable to common stockholders as a result of conversion of Class B (1) |
| - | |
| - | |
| - | |
| - | |
| - | |
| - | |
| - | |
| - | | ||||||||
Plus: Interest expense on convertible senior notes, net of tax (1) |
| - | |
| - | |
| - | |
| - | |
| - | |
| - | |
| - | |
| - | | ||||||||
Allocation of net income (loss) attributable to common stockholders - continuing operations |
| $ | (37,818 | ) |
| $ | (158 | ) |
| $ | (27,513 | ) |
| $ | (102 | ) |
| $ | (141,410 | ) |
| $ | (589 | ) |
| $ | (66,027 | ) |
| $ | (240 | ) |
Allocation of net income (loss) attributable to common stockholders for basic computation - discontinued operations |
| $ | - | |
| $ | - | |
| $ | - | |
| $ | - | |
| $ | - | |
| $ | - | |
| $ | 132,966 | |
| $ | 497 | |
Reallocation of net income (loss) attributable to common stockholders as a result of conversion of Class B (1) |
| - | |
| - | |
| - | |
| - | |
| - | |
| - | |
| - | |
| - | | ||||||||
Allocation of net income (loss) attributable to common stockholders - discontinued operations |
| - | |
| - | |
| - | |
| - | |
| - | |
| - | |
| 132,966 | |
| 497 | | ||||||||
Allocation of net income (loss) attributable to common stockholders |
| $ | (37,818 | ) |
| $ | (158 | ) |
| $ | (27,513 | ) |
| $ | (102 | ) |
| $ | (141,410 | ) |
| $ | (589 | ) |
| $ | 66,939 | |
| $ | 257 | |
Denominator |
|
|
|
|
|
|
|
|
|
|
|
|
|
|
|
| ||||||||||||||||
Weighted-average common shares outstanding used in basic computation |
| 572,816,215 | |
| 2,399,976 | |
| 642,494,809 | |
| 2,399,976 | |
| 575,890,315 | |
| 2,399,976 | |
| 661,902,654 | |
| 2,399,976 | | ||||||||
Conversion of Class B and other dilutive items (1) |
| - | |
| - | |
| - | |
| - | |
| - | |
| - | |
| - | |
| - | | ||||||||
Weighted-average diluted shares outstanding (1) |
| 572,816,215 | |
| 2,399,976 | |
| 642,494,809 | |
| 2,399,976 | |
| 575,890,315 | |
| 2,399,976 | |
| 661,902,654 | |
| 2,399,976 | | ||||||||
Diluted net income (loss) per share: |
|
|
|
|
|
|
|
|
|
|
|
|
|
|
|
| ||||||||||||||||
Continuing operations |
| $ | (0.07 | ) |
| $ | (0.07 | ) |
| $ | (0.04 | ) |
| $ | (0.04 | ) |
| $ | (0.25 | ) |
| $ | (0.25 | ) |
| $ | (0.10 | ) |
| $ | (0.10 | ) |
30
GROUPON, INC.
NOTES TO CONDENSED CONSOLIDATED FINANCIAL STATEMENTS (Continued)
(unaudited)
Discontinued operations |
| - | |
| - | |
| - | |
| - | |
| - | |
| - | |
| 0.20 | |
| 0.20 | | ||||||||
Diluted net income (loss) per share |
| $ | (0.07 | ) |
| $ | (0.07 | ) |
| $ | (0.04 | ) |
| $ | (0.04 | ) |
| $ | (0.25 | ) |
| $ | (0.25 | ) |
| $ | 0.10 | |
| $ | 0.10 | |
(1) | Other dilutive items includes employee stock options, restricted shares, RSUs, convertible senior notes and warrants. The impact of the conversion of Class B common stock into Class A common stock, outstanding equity awards and outstanding convertible senior notes and warrants have not been reflected in the diluted income (loss) per share calculation for the three and nine months ended September 30, 2016 and 2015 because the effect on net income (loss) per share from continuing operations would be antidilutive. |
The following weighted-average outstanding equity awards are not included in the diluted net income (loss) per share calculations above because they would have had an antidilutive effect on the net income (loss) per share from continuing operations:
|
| Three Months Ended September 30, |
| Nine Months Ended September 30, | ||||||||
|
| 2016 |
| 2015 |
| 2016 |
| 2015 | ||||
Stock options |
| 1,085,188 | |
| 1,778,711 | |
| 1,263,796 | |
| 1,966,846 | |
Restricted stock units |
| 31,375,699 | |
| 41,788,616 | |
| 35,119,921 | |
| 41,004,715 | |
Restricted stock |
| 1,219,018 | |
| 1,740,104 | |
| 1,377,116 | |
| 1,108,814 | |
ESPP shares |
| 1,079,839 | |
| 1,100,701 | |
| 1,237,057 | |
| 853,020 | |
Convertible senior notes |
| 46,296,300 | |
| - | |
| 30,185,866 | |
| - | |
Warrants |
| 46,296,300 | |
| - | |
| 24,250,443 | |
| - | |
Total |
| 127,352,344 | |
| 46,408,132 | |
| 93,434,199 | |
| 44,933,395 | |
In addition to the antidilutive awards as set forth in the table above, the Company also granted 389,046 performance share units to certain key employees during the nine months ended September 30, 2016 . Contingently issuable shares are excluded from the computation of diluted earnings per share if, based on current period results, the shares would not be issuable if the end of the reporting period were the end of the contingency period. These outstanding performance share units have been excluded from the table above for the nine months ended September 30, 2016 as the performance conditions were not satisfied as of the end of the period.
13. SEGMENT INFORMATION
The Company organizes its operations into three segments: North America, EMEA and Rest of World. Segment operating results reflect earnings before stock-based compensation, acquisition-related expense (benefit), net, other income (expense), net and provision (benefit) for income taxes. Segment information reported in the tables below represents the operating segments of the Company organized in a manner consistent with which separate information is available and for which segment results are evaluated regularly by the Company's chief operating decision-maker in assessing performance and allocating resources.
31
GROUPON, INC.
NOTES TO CONDENSED CONSOLIDATED FINANCIAL STATEMENTS (Continued)
(unaudited)
Revenue and profit or loss information by reportable segment reconciled to consolidated net income (loss) for the three and nine months ended September 30, 2016 and 2015 were as follows (in thousands):
|
| Three Months Ended September 30, |
| Nine Months Ended September 30, | ||||||||||||
|
| 2016 |
| 2015 |
| 2016 |
| 2015 | ||||||||
North America |
|
|
|
|
|
|
|
| ||||||||
Revenue (1) |
| $ | 483,281 | |
| $ | 463,931 | |
| $ | 1,501,016 | |
| $ | 1,425,095 | |
Segment cost of revenue and operating expenses (3) (4) (5) |
| 483,036 | |
| 494,843 | |
| 1,510,731 | |
| 1,404,472 | | ||||
Segment operating income (loss) (3) |
| 245 | |
| (30,912 | ) |
| (9,715 | ) |
| 20,623 | | ||||
EMEA |
|
|
|
|
|
|
|
| ||||||||
Revenue (1) |
| 196,573 | |
| 199,287 | |
| 583,848 | |
| 619,554 | | ||||
Segment cost of revenue and operating expenses (3) (4) (6) |
| 192,692 | |
| 195,397 | |
| 570,294 | |
| 586,343 | | ||||
Segment operating income (loss) (3) |
| 3,881 | |
| 3,890 | |
| 13,554 | |
| 33,211 | | ||||
Rest of World |
|
|
|
|
|
|
|
| ||||||||
Revenue |
| 40,614 | |
| 50,377 | |
| 123,605 | |
| 157,697 | | ||||
Segment cost of revenue and operating expenses (3) (4) |
| 45,284 | |
| 57,282 | |
| 146,247 | |
| 175,542 | | ||||
Segment operating income (loss) (3) |
| (4,670 | ) |
| (6,905 | ) |
| (22,642 | ) |
| (17,845 | ) | ||||
Consolidated |
|
|
|
|
|
|
|
| ||||||||
Revenue |
| 720,468 | |
| 713,595 | |
| 2,208,469 | |
| 2,202,346 | | ||||
Segment cost of revenue and operating expenses (3) (4) |
| 721,012 | |
| 747,522 | |
| 2,227,272 | |
| 2,166,357 | | ||||
Segment operating income (loss) (3) |
| (544 | ) |
| (33,927 | ) |
| (18,803 | ) |
| 35,989 | | ||||
Stock-based compensation (2) |
| 26,150 | |
| 35,432 | |
| 94,079 | |
| 109,043 | | ||||
Acquisition-related expense (benefit), net |
| (9 | ) |
| 1,064 | |
| 4,305 | |
| 1,300 | | ||||
Income (loss) from operations |
| (26,685 | ) |
| (70,423 | ) |
| (117,187 | ) |
| (74,354 | ) | ||||
Other income (expense), net |
| (7,028 | ) |
| (8,160 | ) |
| (14,303 | ) |
| (25,146 | ) | ||||
Income (loss) from continuing operations before provision (benefit) for income taxes |
| (33,713 | ) |
| (78,583 | ) |
| (131,490 | ) |
| (99,500 | ) | ||||
Provision (benefit) for income taxes |
| 2,079 | |
| (53,970 | ) |
| 1,629 | |
| (42,881 | ) | ||||
Income (loss) from continuing operations |
| (35,792 | ) |
| (24,613 | ) |
| (133,119 | ) |
| (56,619 | ) | ||||
Income (loss) from discontinued operations, net of tax |
| - | |
| - | |
| - | |
| 133,463 | | ||||
Net income (loss) |
| $ | (35,792 | ) |
| $ | (24,613 | ) |
| $ | (133,119 | ) |
| $ | 76,844 | |
32
GROUPON, INC.
NOTES TO CONDENSED CONSOLIDATED FINANCIAL STATEMENTS (Continued)
(unaudited)
(1) | North America includes revenue from the United States of $476.3 million and $457.7 million for the three months ended September 30, 2016 and 2015 , respectively, and $1,477.7 million and $1,405.3 million for the nine months ended September 30, 2016 and 2015 , respectively. EMEA includes revenue from Switzerland of $130.6 million and $112.1 million for the three months ended September 30, 2016 and 2015 , respectively, and $374.1 million and $343.3 million for the nine months ended September 30, 2016 and 2015 , respectively. There were no other individual countries that represented more than 10% of consolidated total revenue for the three and nine months ended September 30, 2016 and 2015 . |
(2) | Includes stock-based compensation classified within cost of revenue, marketing expense, selling, general and administrative expense and restructuring charges. Other income (expense), net, includes $0.3 million and $0.7 million of additional stock-based compensation for the three and nine months ended September 30, 2016 and $0.1 million and $0.2 million for the three and nine months ended September 30, 2015 . |
(3) | Segment cost of revenue and operating expenses and segment operating income (loss) exclude stock-based compensation and acquisition-related (benefit) expense, net. This presentation corresponds to the measure of segment profit or loss that the Company's chief operating decision-maker uses in assessing segment performance and making resource allocation decisions. The following table summarizes the Company's stock-based compensation expense and acquisition-related expense (benefit), net by reportable segment for the three and nine months ended September 30, 2016 and 2015 (in thousands): |
|
| Three Months Ended September 30, |
| Nine Months Ended September 30, | ||||||||||||||||||||||||||||
|
| 2016 |
| 2015 |
| 2016 |
| 2015 | ||||||||||||||||||||||||
|
| Stock-based compensation |
| Acquisition-related |
| Stock-based compensation |
| Acquisition-related |
| Stock-based compensation |
| Acquisition-related |
| Stock-based compensation |
| Acquisition-related | ||||||||||||||||
North America |
| $ | 24,725 | |
| $ | (9 | ) |
| $ | 30,324 | |
| $ | 1,064 | |
| $ | 83,668 | |
| $ | 4,305 | |
| $ | 95,607 | |
| $ | 1,300 | |
EMEA |
| 298 | |
| - | |
| 3,441 | |
| - | |
| 6,153 | |
| - | |
| 8,881 | |
| - | | ||||||||
Rest of World |
| 1,419 | |
| - | |
| 1,810 | |
| - | |
| 4,929 | |
| - | |
| 4,716 | |
| - | | ||||||||
Consolidated |
| $ | 26,442 | |
| $ | (9 | ) |
| $ | 35,575 | |
| $ | 1,064 | |
| $ | 94,750 | |
| $ | 4,305 | |
| $ | 109,204 | |
| $ | 1,300 | |
(4) | Segment cost of revenue and operating expenses for the three months ended September 30, 2016 includes restructuring charges of $1.0 million in North America, $(0.2) million in EMEA and $0.7 million in Rest of World. Segment cost of revenue and operating expenses for the nine months ended September 30, 2016 includes restructuring charges of $6.8 million in North America (which excludes $2.6 million of stock-based compensation), $13.9 million in EMEA (which excludes $2.1 million of stock-based compensation) and $4.6 million in Rest of World (which excludes $0.02 million of stock-based compensation). Segment cost of revenue and operating expenses for the three and nine months ended September 30, 2015 includes restructuring charges of $1.4 million in North America, $19.7 million in EMEA and $3.0 million in Rest of World. See Note 9, " Restructuring ," for additional information. |
(5) | Segment cost of revenue and operating expenses for North America for the three and nine months ended September 30, 2015 includes a $37.5 million expense related to an increase in the Company's contingent liability for its securities litigation matter. See Note 7, "Commitments and Contingencies," for additional information. |
(6) | Segment cost of revenue and operating expenses for EMEA for the three and nine months ended September 30, 2015 includes a $6.7 million expense for the write-off of a prepaid asset related to a marketing program that was discontinued because the counterparty ceased operations. |
The following table summarizes the Company's total assets by reportable segment as of September 30, 2016 and December 31, 2015 (in thousands):
| September 30, 2016 |
| December 31, 2015 | ||||
North America (1) | $ | 977,064 | |
| $ | 1,063,595 | |
EMEA | 419,635 | |
| 508,353 | | ||
Rest of World | 216,842 | |
| 224,316 | | ||
Consolidated total assets | $ | 1,613,541 | |
| $ | 1,796,264 | |
(1) | North America contains assets from the United States of $925.5 million and $1,018.2 million as of September 30, 2016 and December 31, 2015 , respectively. There were no other individual countries that represented more than 10% of consolidated total assets as of September 30, 2016 and December 31, 2015 . |
33
GROUPON, INC.
NOTES TO CONDENSED CONSOLIDATED FINANCIAL STATEMENTS (Continued)
(unaudited)
Category Information
The Company offers goods and services through its online local commerce marketplaces in three primary categories: Local Deals ("Local"), Groupon Goods ("Goods") and Groupon Getaways ("Travel"). Collectively, Local and Travel comprise the Company's "Services" deal offerings and Goods, which it also refers to as "Shopping," reflects its product offerings. The Company also earns advertising revenue, payment processing revenue and commission revenue generated when customers make purchases with retailers using digital coupons accessed through the Company's websites and mobile applications. Revenue and gross profit from these other sources, which are primarily generated through the Company's relationships with local and national merchants, are included within the Local category in the tables below.
The following table summarizes the Company's third party and other and direct revenue from continuing operations by category for its three reportable segments for the three months ended September 30, 2016 and 2015 (in thousands):
| North America |
| EMEA |
| Rest of World |
| Consolidated | ||||||||||||||||||||||||
| Three Months Ended September 30, |
| Three Months Ended September 30, |
| Three Months Ended September 30, |
| Three Months Ended September 30, | ||||||||||||||||||||||||
| 2016 |
| 2015 |
| 2016 |
| 2015 |
| 2016 |
| 2015 |
| 2016 |
| 2015 | ||||||||||||||||
Local (1) : |
|
|
|
|
|
|
|
|
|
|
|
|
|
|
| ||||||||||||||||
Third party and other | $ | 176,220 | |
| $ | 163,786 | |
| $ | 58,581 | |
| $ | 70,781 | |
| $ | 21,876 | |
| $ | 26,372 | |
| $ | 256,677 | |
| $ | 260,939 | |
|
|
|
|
|
|
|
|
|
|
|
|
|
|
|
| ||||||||||||||||
Travel: |
|
|
|
|
|
|
|
|
|
|
|
|
|
|
| ||||||||||||||||
Third party | 21,241 | |
| 21,394 | |
| 12,866 | |
| 13,561 | |
| 5,075 | |
| 6,135 | |
| 39,182 | |
| 41,090 | | ||||||||
Total services | 197,461 | |
| 185,180 | |
| 71,447 | |
| 84,342 | |
| 26,951 | |
| 32,507 | |
| 295,859 | |
| 302,029 | | ||||||||
|
|
|
|
|
|
|
|
|
|
|
|
|
|
|
| ||||||||||||||||
Goods: |
|
|
|
|
|
|
|
|
|
|
|
|
|
|
| ||||||||||||||||
Third party | 1,965 | |
| 1,643 | |
| 4,789 | |
| 11,837 | |
| 7,223 | |
| 10,797 | |
| 13,977 | |
| 24,277 | | ||||||||
Direct | 283,855 | |
| 277,108 | |
| 120,337 | |
| 103,108 | |
| 6,440 | |
| 7,073 | |
| 410,632 | |
| 387,289 | | ||||||||
Total | 285,820 | |
| 278,751 | |
| 125,126 | |
| 114,945 | |
| 13,663 | |
| 17,870 | |
| 424,609 | |
| 411,566 | | ||||||||
|
|
|
|
|
|
|
|
|
|
|
|
|
|
|
| ||||||||||||||||
Total revenue | $ | 483,281 | |
| $ | 463,931 | |
| $ | 196,573 | |
| $ | 199,287 | |
| $ | 40,614 | |
| $ | 50,377 | |
| $ | 720,468 | |
| $ | 713,595 | |
(1) | Includes revenue from deals with local and national merchants and through local events. |
The following table summarizes the Company's third party and other and direct revenue from continuing operations by category for its three reportable segments for the nine months ended September 30, 2016 and 2015 (in thousands):
| North America |
| EMEA |
| Rest of World |
| Consolidated | ||||||||||||||||||||||||
| Nine Months Ended |
| Nine Months Ended |
| Nine Months Ended |
| Nine Months Ended | ||||||||||||||||||||||||
| 2016 |
| 2015 |
| 2016 |
| 2015 |
| 2016 |
| 2015 |
| 2016 |
| 2015 | ||||||||||||||||
Local (1) : |
|
|
|
|
|
|
|
|
|
|
|
|
|
|
| ||||||||||||||||
Third party and other | $ | 552,512 | |
| $ | 517,111 | |
| $ | 181,083 | |
| $ | 228,860 | |
| $ | 66,419 | |
| $ | 85,152 | |
| $ | 800,014 | |
| $ | 831,123 | |
|
|
|
|
|
|
|
|
|
|
|
|
|
|
|
| ||||||||||||||||
Travel: |
|
|
|
|
|
|
|
|
|
|
|
|
|
|
| ||||||||||||||||
Third party | 63,556 | |
| 63,341 | |
| 34,753 | |
| 41,378 | |
| 14,445 | |
| 18,993 | |
| 112,754 | |
| 123,712 | | ||||||||
Total services | 616,068 | |
| 580,452 | |
| 215,836 | |
| 270,238 | |
| 80,864 | |
| 104,145 | |
| 912,768 | |
| 954,835 | | ||||||||
|
|
|
|
|
|
|
|
|
|
|
|
|
|
|
| ||||||||||||||||
Goods: |
|
|
|
|
|
|
|
|
|
|
|
|
|
|
| ||||||||||||||||
Third party | 6,319 | |
| 3,962 | |
| 20,792 | |
| 33,517 | |
| 22,654 | |
| 34,959 | |
| 49,765 | |
| 72,438 | | ||||||||
Direct | 878,629 | |
| 840,681 | |
| 347,220 | |
| 315,799 | |
| 20,087 | |
| 18,593 | |
| 1,245,936 | |
| 1,175,073 | | ||||||||
Total | 884,948 | |
| 844,643 | |
| 368,012 | |
| 349,316 | |
| 42,741 | |
| 53,552 | |
| 1,295,701 | |
| 1,247,511 | | ||||||||
|
|
|
|
|
|
|
|
|
|
|
|
|
|
|
| ||||||||||||||||
Total revenue | $ | 1,501,016 | |
| $ | 1,425,095 | |
| $ | 583,848 | |
| $ | 619,554 | |
| $ | 123,605 | |
| $ | 157,697 | |
| $ | 2,208,469 | |
| $ | 2,202,346 | |
34
GROUPON, INC.
NOTES TO CONDENSED CONSOLIDATED FINANCIAL STATEMENTS (Continued)
(unaudited)
(1) | Includes revenue from deals with local and national merchants and through local events. |
The following table summarizes the Company's gross profit from continuing operations by category for its three reportable segments for the three months ended September 30, 2016 and 2015 (in thousands):
| North America |
| EMEA |
| Rest of World |
| Consolidated | ||||||||||||||||||||||||
| Three Months Ended September 30, |
| Three Months Ended September 30, |
| Three Months Ended September 30, |
| Three Months Ended September 30, | ||||||||||||||||||||||||
| 2016 |
| 2015 |
| 2016 |
| 2015 |
| 2016 |
| 2015 |
| 2016 |
| 2015 | ||||||||||||||||
Local (1) : |
|
|
|
|
|
|
|
|
|
|
|
|
|
|
| ||||||||||||||||
Third party and other | $ | 152,873 | |
| $ | 138,798 | |
| $ | 54,467 | |
| $ | 66,288 | |
| $ | 18,645 | |
| $ | 22,568 | |
| $ | 225,985 | |
| $ | 227,654 | |
|
|
|
|
|
|
|
|
|
|
|
|
|
|
|
| ||||||||||||||||
Travel: |
|
|
|
|
|
|
|
|
|
|
|
|
|
|
| ||||||||||||||||
Third party | 17,257 | |
| 17,644 | |
| 11,882 | |
| 12,323 | |
| 3,962 | |
| 4,859 | |
| 33,101 | |
| 34,826 | | ||||||||
Total services | 170,130 | |
| 156,442 | |
| 66,349 | |
| 78,611 | |
| 22,607 | |
| 27,427 | |
| 259,086 | |
| 262,480 | | ||||||||
|
|
|
|
|
|
|
|
|
|
|
|
|
|
|
| ||||||||||||||||
Goods: |
|
|
|
|
|
|
|
|
|
|
|
|
|
|
| ||||||||||||||||
Third party | 1,509 | |
| 1,359 | |
| 4,156 | |
| 10,025 | |
| 4,666 | |
| 6,392 | |
| 10,331 | |
| 17,776 | | ||||||||
Direct | 30,022 | |
| 33,442 | |
| 14,554 | |
| 14,880 | |
| 124 | |
| 334 | |
| 44,700 | |
| 48,656 | | ||||||||
Total | 31,531 | |
| 34,801 | |
| 18,710 | |
| 24,905 | |
| 4,790 | |
| 6,726 | |
| 55,031 | |
| 66,432 | | ||||||||
|
|
|
|
|
|
|
|
|
|
|
|
|
|
|
| ||||||||||||||||
Total gross profit | $ | 201,661 | |
| $ | 191,243 | |
| $ | 85,059 | |
| $ | 103,516 | |
| $ | 27,397 | |
| $ | 34,153 | |
| $ | 314,117 | |
| $ | 328,912 | |
(1) | Includes gross profit from deals with local and national merchants and through local events. |
The following table summarizes the Company's gross profit from continuing operations by category for its three reportable segments for the nine months ended September 30, 2016 and 2015 (in thousands):
| North America |
| EMEA |
| Rest of World |
| Consolidated | ||||||||||||||||||||||||
| Nine Months Ended |
| Nine Months Ended |
| Nine Months Ended |
| Nine Months Ended | ||||||||||||||||||||||||
| 2016 |
| 2015 |
| 2016 |
| 2015 |
| 2016 |
| 2015 |
| 2016 |
| 2015 | ||||||||||||||||
Local (1) : |
|
|
|
|
|
|
|
|
|
|
|
|
|
|
| ||||||||||||||||
Third party and other | $ | 475,703 | |
| $ | 441,148 | |
| $ | 169,579 | |
| $ | 213,914 | |
| $ | 56,155 | |
| $ | 73,296 | |
| $ | 701,437 | |
| $ | 728,358 | |
|
|
|
|
|
|
|
|
|
|
|
|
|
|
|
| ||||||||||||||||
Travel: |
|
|
|
|
|
|
|
|
|
|
|
|
|
|
| ||||||||||||||||
Third party | 49,303 | |
| 51,820 | |
| 31,881 | |
| 36,662 | |
| 11,199 | |
| 14,777 | |
| 92,383 | |
| 103,259 | | ||||||||
Total services | 525,006 | |
| 492,968 | |
| 201,460 | |
| 250,576 | |
| 67,354 | |
| 88,073 | |
| 793,820 | |
| 831,617 | | ||||||||
|
|
|
|
|
|
|
|
|
|
|
|
|
|
|
| ||||||||||||||||
Goods: |
|
|
|
|
|
|
|
|
|
|
|
|
|
|
| ||||||||||||||||
Third party | 5,201 | |
| 3,201 | |
| 18,027 | |
| 27,997 | |
| 14,485 | |
| 19,166 | |
| 37,713 | |
| 50,364 | | ||||||||
Direct | 104,571 | |
| 86,121 | |
| 50,620 | |
| 44,267 | |
| 309 | |
| 956 | |
| 155,500 | |
| 131,344 | | ||||||||
Total | 109,772 | |
| 89,322 | |
| 68,647 | |
| 72,264 | |
| 14,794 | |
| 20,122 | |
| 193,213 | |
| 181,708 | | ||||||||
|
|
|
|
|
|
|
|
|
|
|
|
|
|
|
| ||||||||||||||||
Total gross profit | $ | 634,778 | |
| $ | 582,290 | |
| $ | 270,107 | |
| $ | 322,840 | |
| $ | 82,148 | |
| $ | 108,195 | |
| $ | 987,033 | |
| $ | 1,013,325 | |
(1) | Includes gross profit from deals with local and national merchants and through local events. |
14. SUBSEQUENT EVENT
On October 24, 2016, the Company entered into an agreement to acquire all of the outstanding shares of LivingSocial, Inc. The acquisition is expected to close by early November 2016, subject to satisfaction of customary closing conditions. The acquisition consideration is not material.
35
ITEM 2. MANAGEMENT'S DISCUSSION AND ANALYSIS OF FINANCIAL CONDITION AND RESULTS OF OPERATIONS
The following discussion and analysis of our financial condition and results of operations should be read together with our condensed consolidated financial statements and related notes included under Part I, Item 1 of this Quarterly Report on Form 10-Q. This discussion contains forward-looking statements about our business and operations. Our actual results may differ materially from those we currently anticipate as a result of many factors, including those we describe under "Risk Factors" and elsewhere in this Quarterly Report.
Overview
Groupon operates online local commerce marketplaces throughout the world that connect merchants to consumers by offering goods and services, generally at a discount. Consumers access those marketplaces through our websites, primarily localized groupon.com sites in many countries, and our mobile applications. Traditionally, local merchants have tried to reach consumers and generate sales through a variety of methods, including online advertising, the yellow pages, direct mail, newspaper, radio, television, and promotions. By bringing the brick and mortar world of local commerce onto the Internet, Groupon is helping local merchants to attract customers and sell goods and services. We provide consumers with savings and help them discover what to do, eat, see and buy and where to travel.
Our operations are organized into three segments: North America, EMEA, which is comprised of Europe, Middle East and Africa, and the remainder of our international operations ("Rest of World"). See Note 13, " Segment Information, " for further information. For the three months ended September 30, 2016 , we derived 67.1% of our revenue from our North America segment, 27.3% of our revenue from our EMEA segment and 5.6% of our revenue from our Rest of World segment. For the nine months ended September 30, 2016 , we derived 68.0% of our revenue from our North America segment, 26.4% of our revenue from our EMEA segment and 5.6% of our revenue from our Rest of World segment.
We offer deals through our online local commerce marketplaces in three primary categories: Local Deals ("Local"), Groupon Goods ("Goods") and Groupon Getaways ("Travel"). Collectively, Local and Travel comprise our "Services" offerings, and Goods, which we also refer to as "Shopping," reflects our product offerings. In our Goods category, we often act as the merchant of record, particularly for product offerings in North America and in EMEA. Our revenue from deals where we act as a third party marketing agent is the purchase price paid by the customer for a Groupon voucher (a "Groupon") less an agreed upon portion of the purchase price paid to the featured merchants. Our direct revenue from deals where we act as the merchant of record is the purchase price paid by the customer. We generated revenue of $720.5 million during the three months ended September 30, 2016 , as compared to $713.6 million during the three months ended September 30, 2015 . We generated revenue of $2,208.5 million during the nine months ended September 30, 2016 , as compared to $2,202.3 million during the nine months ended September 30, 2015 .
In May 2015, the Company sold a controlling stake in Ticket Monster that resulted in its deconsolidation. The financial results of Ticket Monster, including the gain on disposition and related tax effects, are presented as discontinued operations for the three and nine months ended September 30, 2015 . See Note 2, "Discontinued Operations and Other Dispositions," for additional information. Unless otherwise stated, all amounts discussed below represent continuing operations.
In September 2015, we commenced a restructuring plan relating primarily to workforce reductions in our international operations. We have also undertaken workforce reductions in our North America segment. See Note 9, " Restructuring ," for additional information. We continue to explore further restructuring actions in connection with our efforts to optimize our cost structure and global footprint.
In November 2015, we announced a number of strategic changes in our business. We have significantly increased marketing expenses in connection with our efforts to accelerate customer growth. These increased expenditures have increased our operating losses and reduced our Adjusted EBITDA (as defined below) for the nine months ended September 30, 2016 . We have also de-emphasized lower margin product offerings in our Goods category. While this change in focus has generally contributed to improvements in the gross profit margins generated by that category, we believe that it has adversely impacted revenue growth in the current year. Additionally, we have ceased operations in six countries within our Rest of World segment and 11 countries within our EMEA segment as part of the restructuring plan discussed above.
We recently completed a strategic review of certain international markets in connection with our efforts to optimize our global footprint and focus on the markets that we believe to have the greatest potential to benefit our long-term financial performance. Based on that review, we have decided to focus our business on 15 core countries that are primarily based in North America and EMEA. We are pursuing strategic alternatives for the remaining 11 countries in which we currently operate, which are primarily
36
based in Asia and Latin America. Those countries for which we are pursuing strategic alternatives and other options to exit include most of the operations making up our Rest of World segment.
On October 31, 2016, each share of our Class A common stock and Class B common stock will convert automatically into a single class of common stock (the "Conversion") pursuant to the terms of our Sixth Amended and Restated Certificate of Incorporation, as amended. Holders of our Class A common stock are entitled to one vote per share and holders of our Class B common stock are entitled to 150 votes per share. We currently have 2,399,976 shares of Class B common stock issued and outstanding, all of which are held by our three founders. Following the Conversion, each share of common stock will be entitled to one vote per share and otherwise have the same designations, rights, powers and preferences as the Class A common stock prior to the Conversion. In addition, holders of the common stock will vote as a single class of stock on any matter that is submitted to a vote of stockholders.
On October 24, 2016, we entered into an agreement to acquire all of the outstanding shares of LivingSocial, Inc. The acquisition is expected to close by early November 2016, subject to satisfaction of customary closing conditions. The acquisition consideration is not material.
How We Measure Our Business
We measure our business with several financial and operating metrics. We use these metrics to assess the progress of our business, make decisions on where to allocate capital, time and technology investments and assess the long-term performance of our marketplaces. Certain of the financial metrics are reported in accordance with U.S. GAAP and certain of these metrics are considered non-GAAP financial measures. As our business evolves, we may make changes to our key financial and operating metrics used to measure our business in future periods. For further information and reconciliations to the most applicable financial measures under U.S. GAAP, refer to our discussion under Non-GAAP Financial Measures in the " Results of Operations " section.
Financial Metrics
• | Gross billings. This metric represents the total dollar value of customer purchases of goods and services, excluding applicable taxes and net of estimated refunds. For third party revenue transactions, gross billings differs from third party revenue reported in our consolidated statements of operations, which is presented net of the merchant's share of the transaction price. For direct revenue transactions, gross billings are equivalent to direct revenue reported in our consolidated statements of operations. We consider this metric to be an important indicator of our growth and business performance as it represents the dollar volume of transactions generated through our marketplaces. Tracking gross billings on third party revenue transactions also allows us to monitor the percentage of gross billings that we are able to retain after payments to our merchants. |
• | Revenue. Third party revenue, which is earned from transactions in which we act as a marketing agent, is reported on a net basis as the purchase price received from the customer for a voucher less an agreed upon portion of the purchase price paid to the featured merchant. Direct revenue, which is earned from sales of merchandise inventory directly to customers through our online marketplaces, is reported on a gross basis as the purchase price received from the customer. |
• | Gross profit. Gross profit reflects the net margin earned after deducting our cost of revenue from our revenue. Due to the lack of comparability between third party revenue, which is presented net of the merchant's share of the transaction price, and direct revenue, which is reported on a gross basis, we believe that gross profit is an important measure for evaluating our performance. |
• | Adjusted EBITDA. Adjusted EBITDA is a non-GAAP performance measure that we define as net income (loss) from continuing operations excluding income taxes, interest and non-operating items, depreciation and amortization, stock-based compensation, acquisition-related expense, net and items that are unusual in nature or infrequently occurring. For further information and a reconciliation to the most applicable financial measure under U.S. GAAP, refer to our discussion under Non-GAAP Financial Measures in the " Results of Operations " section. |
• | Free cash flow. Free cash flow is a non-GAAP liquidity measure that comprises net cash provided by (used in) operating activities from continuing operations less purchases of property and equipment and capitalized software from continuing operations. For further information and a reconciliation to the most applicable financial measure under U.S. GAAP, refer to our discussion under Non-GAAP Financial Measures in the " Results of Operations " section. |
37
The following table presents the above financial metrics for the three and nine months ended September 30, 2016 and 2015 (in thousands):
|
| Three Months Ended September 30, |
| Nine Months Ended September 30, | ||||||||||||
|
| 2016 |
| 2015 |
| 2016 |
| 2015 | ||||||||
Gross billings |
| $ | 1,432,155 | |
| $ | 1,467,534 | |
| $ | 4,397,047 | |
| $ | 4,548,548 | |
Revenue |
| 720,468 | |
| 713,595 | |
| 2,208,469 | |
| 2,202,346 | | ||||
Gross profit |
| 314,117 | |
| 328,912 | |
| 987,033 | |
| 1,013,325 | | ||||
Adjusted EBITDA |
| 32,134 | |
| 56,334 | |
| 97,443 | |
| 189,822 | | ||||
Free cash flow (1) |
| (53,690 | ) |
| (35,375 | ) |
| (220,772 | ) |
| (19,189 | ) | ||||
The most comparable U.S. GAAP performance measure for Adjusted EBITDA is "Income (loss) from continuing operations" and the most comparable U.S. GAAP liquidity measure for Free Cash Flow is "Net cash provided by (used in) operating activities from continuing operations." For further information and a reconciliation to the most applicable measure under U.S. GAAP, refer to our discussion under Non-GAAP Financial Measures in the " Results of Operations " section. The following table provides income (loss) from continuing operations and net cash provided by (used) in operating activities from continuing operations for the three and nine months ended September 30, 2016 and 2015 (in thousands):
|
| Three Months Ended September 30, |
| Nine Months Ended September 30, | ||||||||||||
|
| 2016 |
| 2015 (1) |
| 2016 |
| 2015 (1) | ||||||||
Income (loss) from continuing operations |
| $ | (35,792 | ) |
| $ | (24,613 | ) |
| $ | (133,119 | ) |
| $ | (56,619 | ) |
Net cash provided by (used in) operating activities from continuing operations |
| (40,822 | ) |
| (7,640 | ) |
| (171,557 | ) |
| 49,292 | | ||||
(1) | We adopted the guidance in ASU 2016-09 on January 1, 2016. ASU 2016-09 requires that all income tax-related cash flows resulting from share-based payments be reported as operating activities in the statement of cash flows. Previously, income tax benefits at settlement of an award were reported as a reduction to operating cash flows and an increase to financing cash flows to the extent that those benefits exceeded the income tax benefits reported in earnings during the award's vesting period. We elected to apply that change in cash flow classification on a retrospective basis, which has resulted in a decrease of $0.03 million to free cash flow and net cash provided by (used in) operating activities for the three months ended September 30, 2015 and an increase of $6.2 million to free cash flow and net cash provided by (used in) operating activities for the nine months ended September 30, 2015 , respectively. |
Operating Metrics
• | Active customers. We define active customers as unique user accounts that have purchased a voucher or product from us during the trailing twelve months. We consider this metric to be an important indicator of our business performance as it helps us to understand how the number of customers actively purchasing our deals is trending. Some customers could establish and make purchases from more than one account, so it is possible that our active customer metric may count certain customers more than once in a given period. |
• | Gross billings per average active customer. This metric represents the trailing twelve months gross billings generated per average active customer. This metric is calculated as the total gross billings generated in the trailing twelve months, divided by the average number of active customers in such time period. Although we believe that total gross billings, not gross billings per average active customer, is a better indication of the overall growth of our marketplaces over time, gross billings per average active customer provides us with information about average annual customer spend. |
• | Units . This metric represents the number of vouchers and products purchased from us by our customers, before refunds and cancellations. We consider unit growth to be an important indicator of the total volume of business conducted through our marketplaces. |
Our active customers and gross billings per average active customer for the trailing twelve months ("TTM") ended September 30, 2016 and 2015 were as follows:
38
|
| Trailing Twelve Months Ended September 30, | ||||||
|
| 2016 |
| 2015 | ||||
TTM Active customers (in thousands) |
| 50,753 | |
| 48,644 | | ||
TTM Gross billings per average active customer |
| $ | 122.82 | |
| $ | 131.72 | |
Our units for the three and nine months ended September 30, 2016 and 2015 were as follows:
|
| Three Months Ended September 30, |
| Nine Months Ended September 30, | ||||||||
|
| 2016 |
| 2015 |
| 2016 |
| 2015 | ||||
Units (in thousands) |
| 49,261 | |
| 51,862 | |
| 152,312 | |
| 158,580 | |
Factors Affecting Our Performance
Deal sourcing and quality. We consider our merchant relationships to be a vital part of our business model. We depend on our ability to attract and retain merchants that are prepared to offer products or services on compelling terms, particularly as we attempt to expand our product and service offerings in order to create more complete online marketplaces for local commerce. Our online marketplaces, which we sometimes refer to as "pull" marketplaces, enable customers to search and browse for deal offerings on our websites and mobile applications. In North America and many of our foreign markets, merchants often have a continuous presence on our websites and mobile applications by offering vouchers on an ongoing basis for an extended period of time. Currently, a substantial majority of our merchants in North America elect to offer deals in this manner, and we expect that trend to continue. However, merchants have the ability to withdraw their deal offerings, and we generally do not have noncancelable long-term arrangements to guarantee availability of deals. In order to attract merchants that may not have run deals on our platform or would have run deals on a competing platform, we have been willing to accept lower deal margins across all three of our segments and we expect that trend to continue. If new merchants do not find our marketing and promotional services effective, or if our existing merchants do not believe that utilizing our services provides them with a long-term increase in customers, revenue or profit, they may stop making offers through our marketplaces or they may only continue offering deals if we accept lower margins.
International operations. Operating a global business requires management attention and resources and requires us to localize our services to conform to a wide variety of local cultures, business practices, laws and regulations. The different commercial and regulatory environments in other countries makes it more difficult for us to successfully operate our business. In addition, many of the automation tools and technology enhancements that we have implemented in our North America segment are close to being fully implemented in most EMEA countries but have not been substantially rolled out to the countries in our Rest of World segment.
Our international operations have decreased as a percentage of our total revenue in the current year. For the three months ended September 30, 2016 and 2015 , 27.3% and 28.0% of our revenue was generated from our EMEA segment, respectively, and 5.6% and 7.0% of our revenue was generated from our Rest of World segment, respectively. For the nine months ended September 30, 2016 and 2015 , 26.4% and 28.1% of our revenue was generated from our EMEA segment, respectively, and 5.6% and 7.2% of our revenue was generated from our Rest of World segment, respectively. The increase in North America revenue as a percentage of total revenue was primarily due to the reduction in our international footprint as a result of our restructuring plan, the adverse impact of year-over-year changes in foreign exchange rates on our international revenue and an increase in direct revenue transactions from our Goods category in North America, as direct revenue is presented on a gross basis in our consolidated statements of operations.
Marketing activities. We must continue to acquire and retain customers in order to increase revenue and achieve profitability. If consumers do not perceive the offerings on our marketplaces to be attractive, or if we fail to introduce new or more relevant deals, we may not be able to acquire or retain customers. In addition, as we continue to build out more complete marketplaces, our success will depend on our ability to increase consumer awareness of offerings available through those marketplaces. We began to significantly increase our marketing spending late in 2015 and into 2016 and we plan to continue to increase marketing spending in future periods in connection with our efforts to accelerate customer growth. That incremental spending on customer acquisition marketing has initially been focused on our North America segment.
As discussed under " Results of Operations ," we consider order discounts, free shipping on qualifying merchandise sales and reducing margins on our deals to be marketing-related activities, even though these activities are not presented as marketing expenses in our consolidated statements of operations. We have increased our use of order discounts as a marketing tool in recent
39
periods because we believe that this is an effective method of driving transaction activity through our marketplaces. Additionally, we have, and expect to continue to, reduce our deal margins when we believe that by doing so we can offer our customers a product or service from a merchant who might not have otherwise been willing to conduct business through our marketplaces. We consider such margin reductions to be a marketing-related activity because we believe that offering compelling deals from top merchants on our marketplaces is an effective method of retaining or activating customers.
Investment in growth. We intend to continue to invest in our products and infrastructure to support our growth. We also have invested in business acquisitions to grow our merchant base and customer base, expand and advance our product and service offerings and enhance our technology capabilities. We anticipate that we will make substantial investments in the foreseeable future as we continue to increase deal coverage and improve the quality of active deals available through our marketplaces, broaden our customer base and develop our technology. Additionally, we believe that our efforts to automate our internal processes through investments in technology should allow us to continue to improve our cost structure over time, as we are able to more efficiently run our business and minimize manual processes.
Competitive pressure. We face competition from a variety of sources. Some of our competitors offer deals as an add-on to their core businesses, and others have adopted a business model similar to ours. In addition to such competitors, we expect to increasingly compete against other large Internet and technology-based businesses that have launched initiatives which are directly competitive to our core business. We also expect to compete against other Internet sites that are focused on specific communities or interests and offer coupons or discount arrangements related to such communities or interests. Further, as our business continues to evolve, we anticipate facing new competition. Increased competition in the future may adversely impact our gross billings, revenue and profit margins.
Growth of Groupon Goods. Our Goods category has experienced revenue growth in recent periods. This category has lower margins than our Local category, primarily as a result of shipping and fulfillment costs related to direct revenue transactions. The percentage of revenue generated from our Goods category was 58.9% and 57.7% for the three months ended September 30, 2016 and 2015 , respectively. The percentage of revenue generated from our Goods category was 58.7% and 56.6% for the nine months ended September 30, 2016 and 2015 , respectively. We are generally the merchant of record for transactions in our Goods category in North America and EMEA, and the resulting direct revenue from sales of merchandise inventory to customers through our marketplaces is reported on a gross basis in our consolidated statements of operations. Growth in direct revenue results in a smaller increase to income and cash flows than growth in third party revenue because direct revenue includes the entire amount of gross billings, before deducting the cost of the related inventory, while third party revenue is net of the merchant's share of the transaction price. Gross profit as a percentage of revenue on direct revenue transactions in our Goods category was 10.9% and 12.6% for the three months ended September 30, 2016 and 2015 , respectively. Gross profit as a percentage of revenue on direct revenue transactions in our Goods category was 12.5% and 11.2% for the nine months ended September 30, 2016 and 2015 , respectively. As direct revenue transactions in our Goods category have become a larger component of our overall business, the revenue growth generated by those transactions has not resulted in comparable growth in gross profit, operating income (loss) or cash flows.
Results of Operations
Gross Billings
Gross billings represents the total dollar value of customer purchases of goods and services, excluding applicable taxes and net of estimated refunds.
Three Months Ended September 30, 2016 and 2015 :
Gross billings for the three months ended September 30, 2016 and 2015 were as follows:
| Three Months Ended September 30, | |||||||||||||
| 2016 |
| 2015 |
| $ Change |
| % Change | |||||||
| (in thousands) | |||||||||||||
Gross billings: |
|
|
|
|
|
|
| |||||||
Third party | $ | 1,002,304 | |
| $ | 1,065,839 | |
| $ | (63,535 | ) |
| (6.0 | )% |
Direct | 410,632 | |
| 387,289 | |
| 23,343 | |
| 6.0 | | |||
Other | 19,219 | |
| 14,406 | |
| 4,813 | |
| 33.4 | | |||
Total gross billings | $ | 1,432,155 | |
| $ | 1,467,534 | |
| $ | (35,379 | ) |
| (2.4 | ) |
40
The effect on our gross billings for the three months ended September 30, 2016 from changes in exchange rates versus the U.S. dollar was as follows:
| Three Months Ended September 30, | ||||||||||
| At Avg. Q3 2015 Rates (1) |
| Exchange Rate Effect (2) |
| As Reported | ||||||
| (in thousands) | ||||||||||
Gross billings | $ | 1,442,311 | |
| $ | (10,156 | ) |
| $ | 1,432,155 | |
(1) | Represents the financial statement balance that would have resulted had exchange rates in the reporting period been the same as those in effect in the prior year period. |
(2) | Represents the increase or decrease in the reported amount resulting from changes in exchange rates from those in effect in the prior year period. |
The decrease in total gross billings for the three months ended September 30, 2016 was primarily attributable to the following:
• | a $35.5 million reduction related to countries that we operated in during the prior year period and have subsequently exited as part of our restructuring plan, dispositions of controlling stakes in our operations in India and Indonesia and the disposition of our operations in Russia; and |
• | a $10.2 million unfavorable impact from year-over-year changes in foreign currency exchange rates. |
The above drivers adversely impacted gross billings per average active customer, which were $122.82 for the trailing twelve months ended September 30, 2016 , as compared to $131.72 in the corresponding prior year period. Additionally, the total number of units sold decreased to 49.3 million units for the three months ended September 30, 2016 , as compared to 51.9 million units in the prior year period, driven by our country exits and dispositions. Order discounts increased by $11.8 million to $55.2 million for the three months ended September 30, 2016 , as compared to $43.4 million in the prior year period.
The decrease in total gross billings was attributable to our international operations and was partially offset by increases in the Local and Goods categories in our North America segment.
Gross Billings by Segment
Gross billings by segment for the three months ended September 30, 2016 and 2015 were as follows:
|
| Three Months Ended September 30, | |||||||||||||
|
| 2016 |
| 2015 |
| $ Change |
| % Change | |||||||
|
| (dollars in thousands) | |||||||||||||
North America: |
|
|
|
|
|
|
|
| |||||||
Third party and other |
| $ | 637,107 | |
| $ | 592,095 | |
| $ | 45,012 | |
| 7.6 | % |
Direct |
| 283,855 | |
| 277,108 | |
| 6,747 | |
| 2.4 | | |||
Total segment gross billings |
| 920,962 | |
| 869,203 | |
| 51,759 | |
| 6.0 | | |||
EMEA: |
|
|
|
|
|
|
|
| |||||||
Third party |
| 250,655 | |
| 311,374 | |
| (60,719 | ) |
| (19.5 | ) | |||
Direct |
| 120,337 | |
| 103,108 | |
| 17,229 | |
| 16.7 | | |||
Total segment gross billings |
| 370,992 | |
| 414,482 | |
| (43,490 | ) |
| (10.5 | ) | |||
Rest of World: |
|
|
|
|
|
|
|
| |||||||
Third party |
| 133,761 | |
| 176,776 | |
| (43,015 | ) |
| (24.3 | ) | |||
Direct |
| 6,440 | |
| 7,073 | |
| (633 | ) |
| (8.9 | ) | |||
Total segment gross billings |
| 140,201 | |
| 183,849 | |
| (43,648 | ) |
| (23.7 | ) | |||
Total gross billings |
| $ | 1,432,155 | |
| $ | 1,467,534 | |
| $ | (35,379 | ) |
| (2.4 | ) |
41
The percentages of gross billings by segment for the three months ended September 30, 2016 and 2015 were as follows:
Q3 2016 |
| Q3 2015 |

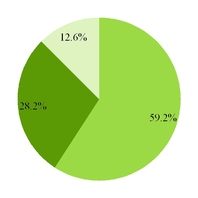
| North America |
|
| EMEA |
|
| Rest of World |
Gross billings by category and segment for the three months ended September 30, 2016 and 2015 were as follows:
| North America |
| EMEA |
| Rest of World |
| Consolidated | ||||||||||||||||||||||||
| Three Months Ended September 30, |
| Three Months Ended September 30, |
| Three Months Ended September 30, |
| Three Months Ended September 30, | ||||||||||||||||||||||||
| 2016 |
| 2015 |
| 2016 |
| 2015 |
| 2016 |
| 2015 |
| 2016 |
| 2015 | ||||||||||||||||
| (in thousands) | ||||||||||||||||||||||||||||||
Local (1) : |
|
|
|
|
|
|
|
|
|
|
|
|
|
|
| ||||||||||||||||
Third party and other | $ | 530,768 | |
| $ | 481,608 | |
| $ | 158,792 | |
| $ | 182,540 | |
| $ | 80,318 | |
| $ | 92,972 | |
| $ | 769,878 | |
| $ | 757,120 | |
|
|
|
|
|
|
|
|
|
|
|
|
|
|
|
| ||||||||||||||||
Travel: |
|
|
|
|
|
|
|
|
|
|
|
|
|
|
| ||||||||||||||||
Third party | 93,564 | |
| 101,801 | |
| 57,594 | |
| 64,916 | |
| 24,166 | |
| 30,709 | |
| 175,324 | |
| 197,426 | | ||||||||
Total services | 624,332 | |
| 583,409 | |
| 216,386 | |
| 247,456 | |
| 104,484 | |
| 123,681 | |
| 945,202 | |
| 954,546 | | ||||||||
|
|
|
|
|
|
|
|
|
|
|
|
|
|
|
| ||||||||||||||||
Goods: |
|
|
|
|
|
|
|
|
|
|
|
|
|
|
| ||||||||||||||||
Third party | 12,775 | |
| 8,686 | |
| 34,269 | |
| 63,918 | |
| 29,277 | |
| 53,095 | |
| 76,321 | |
| 125,699 | | ||||||||
Direct | 283,855 | |
| 277,108 | |
| 120,337 | |
| 103,108 | |
| 6,440 | |
| 7,073 | |
| 410,632 | |
| 387,289 | | ||||||||
Total | 296,630 | |
| 285,794 | |
| 154,606 | |
| 167,026 | |
| 35,717 | |
| 60,168 | |
| 486,953 | |
| 512,988 | | ||||||||
|
|
|
|
|
|
|
|
|
|
|
|
|
|
|
| ||||||||||||||||
Total gross billings | $ | 920,962 | |
| $ | 869,203 | |
| $ | 370,992 | |
| $ | 414,482 | |
| $ | 140,201 | |
| $ | 183,849 | |
| $ | 1,432,155 | |
| $ | 1,467,534 | |
(1) | Includes gross billings from deals with local and national merchants and through local events. |
North America
The overall increase in North America segment gross billings reflects increases in our Local and Goods categories. Those increases were primarily attributable to:
• | our significant incremental marketing spend to accelerate customer growth. North America marketing expense increased by $27.5 million , or 77.9% , for the three months ended September 30, 2016 , as compared to the prior year period, driving an increase from 27.9 million active customers at June 30, 2016 to 29.1 million active customers at September 30, 2016 ; and |
• | our focus on increasing deal coverage and improving the quality of active deals available through our marketplaces. |
These items resulted in increases to both active customers and units sold in North America. Those increases were partially offset by increased order discounts and lower gross billings per average active customer. Order discounts increased by $6.8 million b to $42.9 million for the three months ended September 30, 2016 , as compared to $36.1 million in the prior year period. Our new customer additions in recent quarterly periods contributed to lower gross billings per average active customer in North America
42
as those new customers do not yet have a full twelve months of purchasing history. The overall increase in North America segment gross billings was also partially offset by a decrease in gross billings in our Travel category.
Gross billings in our North America Goods category increased by 3.8% during the three months ended September 30, 2016 , as compared to the prior year period. This represents a lower rate of growth than our Goods category has historically generated, which we believe resulted, in part, from our strategic initiative to de-emphasize lower margin product offerings in that category.
EMEA
The overall decrease in EMEA segment gross billings reflects decreases across our Local, Travel, and Goods categories. The decrease in EMEA gross billings was primarily attributable to the following:
• | a reduction related to countries that we operated in during the prior year period and have subsequently exited as part of our restructuring plan and the disposition of our operations in Russia; and |
• | an $8.4 million unfavorable impact from year-over-year changes in foreign currency exchange rates. |
Additionally, EMEA active customers, units sold and gross billings per average active customer all decreased as compared to the prior year period, driven by the countries we exited as part of our restructuring plan. The overall decrease in EMEA segment gross billings was partially offset by an increase in direct revenue transactions in our Goods category.
The British pound sterling has declined significantly against the U.S. dollar following the U.K.'s non-binding "Brexit" referendum on June 23, 2016, whereby a majority of voters supported its withdrawal from the European Union. We expect that our EMEA segment gross billings will be adversely impacted during the fourth quarter of 2016 due to the increased strength of the U.S. dollar as compared to prior periods.
Rest of World
The overall decrease in Rest of World segment gross billings reflects decreases across our Local, Travel, and Goods categories. The decrease in Rest of World gross billings was primarily attributable to the following:
• | a $1.8 million unfavorable impact from year-over-year changes in foreign currency exchange rates; |
• | a reduction related to countries that we operated in during the prior year period and have subsequently exited as part of our restructuring plan and dispositions of controlling stakes in our operations in India and Indonesia; and |
• | in connection with our strategic initiative to de-emphasize lower margin product offerings, we substantially eliminated Goods deals from our marketplaces in Brazil and Japan. |
Rest of World active customers, units sold and gross billings per average active customer all decreased as compared to the prior year period, driven by the countries we exited as part of our restructuring plan and dispositions of controlling stakes in our operations in India and Indonesia.
Nine Months Ended September 30, 2016 and 2015 :
Gross billings for the nine months ended September 30, 2016 and 2015 were as follows:
| Nine Months Ended September 30, | |||||||||||||
| 2016 |
| 2015 |
| $ Change |
| % Change | |||||||
| (in thousands) | |||||||||||||
Gross billings: |
|
|
|
|
|
|
| |||||||
Third party | $ | 3,096,238 | |
| $ | 3,337,958 | |
| $ | (241,720 | ) |
| (7.2 | )% |
Direct | 1,245,936 | |
| 1,175,073 | |
| 70,863 | |
| 6.0 | | |||
Other | 54,873 | |
| 35,517 | |
| 19,356 | |
| 54.5 | | |||
Total gross billings | $ | 4,397,047 | |
| $ | 4,548,548 | |
| $ | (151,501 | ) |
| (3.3 | ) |
43
The effect on our gross billings for the nine months ended September 30, 2016 from changes in exchange rates versus the U.S. dollar was as follows:
| Nine Months Ended September 30, 2016 | ||||||||||
| At Avg. Q3 2015 YTD Rates (1) |
| Exchange Rate Effect (2) |
| As Reported | ||||||
| (in thousands) | ||||||||||
Gross billings | $ | 4,454,355 | |
| $ | (57,308 | ) |
| $ | 4,397,047 | |
(1) | Represents the financial statement balance that would have resulted had exchange rates in the reporting period been the same as those in effect in the prior year period. |
(2) | Represents the increase or decrease in the reported amount resulting from changes in exchange rates from those in effect in the prior year period. |
The decrease in total gross billings was primarily attributable to the following:
• | a $134.4 million reduction related to countries that we operated in during the prior year period and have subsequently exited as part of our restructuring plan, dispositions of controlling stakes in our operations in India and Indonesia and the disposition of our operations in Russia; and |
• | a $57.3 million unfavorable impact from year-over-year changes in foreign currency exchange rates. |
The above drivers adversely impacted gross billings per average active customer, which were $122.82 for the trailing twelve months ended September 30, 2016 , as compared to $131.72 in the corresponding prior year period. Additionally, the total number of units sold decreased to 152.3 million units for the nine months ended September 30, 2016 , as compared to 158.6 million units in the prior year period, driven by our country exits and dispositions. We also believe that our strategic initiative to de-emphasize lower margin product offerings adversely impacted gross billings in our Goods category. Order discounts increased by $32.5 million to $155.9 million for the nine months ended September 30, 2016 , as compared to $123.4 million in the prior year period.
The decrease in total gross billings was attributable to our international operations and was partially offset by increases across all categories in our North America segment.
Gross Billings by Segment
Gross billings by segment for the nine months ended September 30, 2016 and 2015 were as follows:
|
| Nine Months Ended September 30, | |||||||||||||
|
| 2016 |
| 2015 |
| $ Change |
| % Change | |||||||
|
| (dollars in thousands) | |||||||||||||
North America: |
|
|
|
|
|
|
|
| |||||||
Third party and other |
| $ | 1,945,661 | |
| $ | 1,818,755 | |
| $ | 126,906 | |
| 7.0 | % |
Direct |
| 878,629 | |
| 840,681 | |
| 37,948 | |
| 4.5 | | |||
Total segment gross billings |
| 2,824,290 | |
| 2,659,436 | |
| 164,854 | |
| 6.2 | | |||
EMEA: |
|
|
|
|
|
|
|
| |||||||
Third party |
| 797,308 | |
| 991,408 | |
| (194,100 | ) |
| (19.6 | ) | |||
Direct |
| 347,220 | |
| 315,799 | |
| 31,421 | |
| 9.9 | | |||
Total segment gross billings |
| 1,144,528 | |
| 1,307,207 | |
| (162,679 | ) |
| (12.4 | ) | |||
Rest of World: |
|
|
|
|
|
|
|
| |||||||
Third party |
| 408,142 | |
| 563,312 | |
| (155,170 | ) |
| (27.5 | ) | |||
Direct |
| 20,087 | |
| 18,593 | |
| 1,494 | |
| 8.0 | | |||
Total segment gross billings |
| 428,229 | |
| 581,905 | |
| (153,676 | ) |
| (26.4 | ) | |||
Total gross billings |
| $ | 4,397,047 | |
| $ | 4,548,548 | |
| $ | (151,501 | ) |
| (3.3 | ) |
44
The percentages of gross billings by segment for the nine months ended September 30, 2016 and 2015 were as follows:
Q3 2016 YTD |
| Q3 2015 YTD |
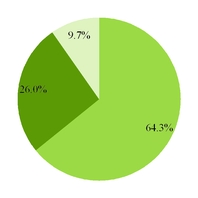
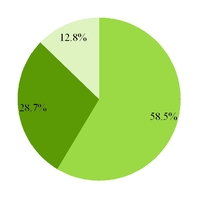
| North America |
|
| EMEA |
|
| Rest of World |
Gross billings by category and segment for the nine months ended September 30, 2016 and 2015 were as follows:
| North America |
| EMEA |
| Rest of World |
| Consolidated | ||||||||||||||||||||||||
| Nine Months Ended |
| Nine Months Ended |
| Nine Months Ended |
| Nine Months Ended | ||||||||||||||||||||||||
| 2016 |
| 2015 |
| 2016 |
| 2015 |
| 2016 |
| 2015 |
| 2016 |
| 2015 | ||||||||||||||||
| (in thousands) | ||||||||||||||||||||||||||||||
Local (1) : |
|
|
|
|
|
|
|
|
|
|
|
|
|
|
| ||||||||||||||||
Third party and other | $ | 1,612,830 | |
| $ | 1,493,544 | |
| $ | 498,115 | |
| $ | 598,691 | |
| $ | 240,193 | |
| $ | 293,110 | |
| $ | 2,351,138 | |
| $ | 2,385,345 | |
|
|
|
|
|
|
|
|
|
|
|
|
|
|
|
| ||||||||||||||||
Travel: |
|
|
|
|
|
|
|
|
|
|
|
|
|
|
| ||||||||||||||||
Third party | 302,342 | |
| 301,387 | |
| 167,675 | |
| 189,525 | |
| 70,394 | |
| 94,918 | |
| 540,411 | |
| 585,830 | | ||||||||
Total services | 1,915,172 | |
| 1,794,931 | |
| 665,790 | |
| 788,216 | |
| 310,587 | |
| 388,028 | |
| 2,891,549 | |
| 2,971,175 | | ||||||||
|
|
|
|
|
|
|
|
|
|
|
|
|
|
|
| ||||||||||||||||
Goods: |
|
|
|
|
|
|
|
|
|
|
|
|
|
|
| ||||||||||||||||
Third party | 30,489 | |
| 23,824 | |
| 131,518 | |
| 203,192 | |
| 97,555 | |
| 175,284 | |
| 259,562 | |
| 402,300 | | ||||||||
Direct | 878,629 | |
| 840,681 | |
| 347,220 | |
| 315,799 | |
| 20,087 | |
| 18,593 | |
| 1,245,936 | |
| 1,175,073 | | ||||||||
Total | 909,118 | |
| 864,505 | |
| 478,738 | |
| 518,991 | |
| 117,642 | |
| 193,877 | |
| 1,505,498 | |
| 1,577,373 | | ||||||||
|
|
|
|
|
|
|
|
|
|
|
|
|
|
|
| ||||||||||||||||
Total gross billings | $ | 2,824,290 | |
| $ | 2,659,436 | |
| $ | 1,144,528 | |
| $ | 1,307,207 | |
| $ | 428,229 | |
| $ | 581,905 | |
| $ | 4,397,047 | |
| $ | 4,548,548 | |
(1) | Includes gross billings from deals with local and national merchants and through local events. |
North America
The overall increase in North America segment gross billings reflects increases across our Local, Travel, and Goods categories. Those increases were primarily attributable to:
• | our significant incremental marketing spend to accelerate customer growth. North America marketing expense increased by $98.3 million , or 98.2% , for the nine months ended September 30, 2016 , as compared to the prior year period, driving an increase from 25.9 million active customers at December 31, 2015 to 29.1 million active customers at September 30, 2016 ; and |
• | our focus on increasing deal coverage and improving the quality of active deals available through our marketplaces. |
These items resulted in increases to both active customers and units sold in North America. Those increases were partially offset by increased order discounts and lower gross billings per average active customer. Order discounts increased by $23.2 million to $120.9 million for the nine months ended September 30, 2016 , as compared to $97.7 million in the prior year period. Our new customer additions in recent quarterly periods contributed to lower gross billings per average active customer in North America as those new customers do not yet have a full twelve months of purchasing history.
45
Gross billings in our North America Goods category increased by 5.2% during the nine months ended September 30, 2016 , as compared to the prior year period. This represents a lower rate of growth than our Goods category has historically generated, which we believe resulted, in part, from our strategic initiative to de-emphasize lower margin product offerings in that category.
EMEA
The overall decrease in EMEA segment gross billings reflects decreases across our Local, Travel, and Goods categories. The decrease in EMEA gross billings was primarily attributable to the following:
• | a reduction related to countries that we operated in during the prior year period and have subsequently exited as part of our restructuring plan and the disposition of our operations in Russia; and |
• | a $20.6 million unfavorable impact from year-over-year changes in foreign currency exchange rates. |
Additionally, EMEA active customers, units sold and gross billings per average active customer all decreased as compared to the prior year period, driven by the countries we exited as part of our restructuring plan. The overall decrease in EMEA segment gross billings was partially offset by an increase in direct revenue transactions in our Goods category.
Rest of World
The overall decrease in Rest of World segment gross billings reflects decreases across our Local, Travel, and Goods categories. The decrease in Rest of World gross billings was primarily attributable to the following:
• | a $35.6 million unfavorable impact from year-over-year changes in foreign currency exchange rates; |
• | a reduction related to countries that we operated in during the prior year period and have subsequently exited as part of our restructuring plan and the disposition of controlling stakes in our operations in India and Indonesia; and |
• | in connection with our strategic initiative to de-emphasize lower margin product offerings, we substantially eliminated Goods deals from our marketplaces in Brazil and Japan. |
Rest of World active customers, units sold and gross billings per average active customer all decreased as compared to the prior year period.
Revenue
Third party revenue arises from transactions in which we are acting as a marketing agent by selling vouchers through our online local commerce marketplaces that can be redeemed for goods or services with a third party merchant. Our third party revenue from those transactions is reported on a net basis as the purchase price received from the customer for the voucher, less an agreed upon portion of the purchase price paid to the merchant, excluding applicable taxes and net of estimated refunds for which the merchant's share is recoverable.
Direct revenue arises from transactions in our Goods category in which we sell merchandise inventory directly to customers through our online marketplaces. The direct revenue that we earn from those transactions is reported on a gross basis as the purchase price we receive from the customer, excluding applicable taxes and net of estimated refunds.
Other revenue primarily consists of commission revenue earned when customers make purchases with retailers using digital coupons accessed through our websites and mobile applications, payment processing revenue and advertising revenue.
46
Three Months Ended September 30, 2016 and 2015 :
Revenue for the three months ended September 30, 2016 and 2015 was as follows:
| Three Months Ended September 30, | |||||||||||||
| 2016 |
| 2015 |
| $ Change |
| % Change | |||||||
| (in thousands) | |||||||||||||
Revenue: |
|
|
|
|
|
|
| |||||||
Third party | $ | 290,617 | |
| $ | 311,900 | |
| $ | (21,283 | ) |
| (6.8 | )% |
Direct | 410,632 | |
| 387,289 | |
| 23,343 | |
| 6.0 | | |||
Other | 19,219 | |
| 14,406 | |
| 4,813 | |
| 33.4 | | |||
Total revenue | $ | 720,468 | |
| $ | 713,595 | |
| $ | 6,873 | |
| 1.0 | |
The effect on revenue for the three months ended September 30, 2016 from changes in exchange rates versus the U.S. dollar was as follows:
| Three Months Ended September 30, | ||||||||||
| At Avg. Q3 2015 Rates (1) |
| Exchange Rate Effect (2) |
| As Reported | ||||||
| (in thousands) | ||||||||||
Revenue | $ | 725,158 | |
| $ | (4,690 | ) |
| $ | 720,468 | |
(1) | Represents the financial statement balance that would have resulted had exchange rates in the reporting period been the same as those in effect in the prior year period. |
(2) | Represents the increase or decrease in the reported amount resulting from changes in exchange rates from those in effect in the prior year period. |
The increase in revenue was primarily attributable to an increase in direct revenue transactions in our Goods category and other revenue. The increase was partially offset by the following:
• | a $12.9 million reduction related to countries that we operated in during the prior year period and have subsequently exited as part of our restructuring plan, dispositions of controlling stakes in our operations in India and Indonesia and the disposition of our operations in Russia; and |
• | a $4.7 million unfavorable impact from year-over-year changes in foreign currency exchange rates. |
Revenue by Segment
Revenue by segment for the three months ended September 30, 2016 and 2015 was as follows:
|
| Three Months Ended September 30, | |||||||||||||
|
| 2016 |
| 2015 |
| $ Change |
| % Change | |||||||
|
| (dollars in thousands) | |||||||||||||
North America: |
|
|
|
|
|
|
|
| |||||||
Third party and other |
| $ | 199,426 | |
| $ | 186,823 | |
| $ | 12,603 | |
| 6.7 | % |
Direct |
| 283,855 | |
| 277,108 | |
| 6,747 | |
| 2.4 | | |||
Total segment revenue |
| 483,281 | |
| 463,931 | |
| 19,350 | |
| 4.2 | | |||
EMEA: |
|
|
|
|
|
|
|
| |||||||
Third party |
| 76,236 | |
| 96,179 | |
| (19,943 | ) |
| (20.7 | ) | |||
Direct |
| 120,337 | |
| 103,108 | |
| 17,229 | |
| 16.7 | | |||
Total segment revenue |
| 196,573 | |
| 199,287 | |
| (2,714 | ) |
| (1.4 | ) | |||
Rest of World: |
|
|
|
|
|
|
|
| |||||||
Third party |
| 34,174 | |
| 43,304 | |
| (9,130 | ) |
| (21.1 | ) | |||
Direct |
| 6,440 | |
| 7,073 | |
| (633 | ) |
| (8.9 | ) | |||
Total segment revenue |
| 40,614 | |
| 50,377 | |
| (9,763 | ) |
| (19.4 | ) | |||
Total revenue |
| $ | 720,468 | |
| $ | 713,595 | |
| $ | 6,873 | |
| 1.0 | |
47
The percentages of revenue by segment for the three months ended September 30, 2016 and 2015 were as follows:
Q3 2016 |
| Q3 2015 |
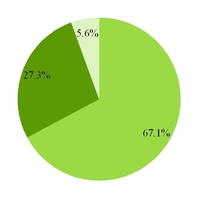
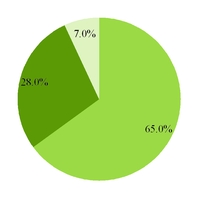
| North America |
|
| EMEA |
|
| Rest of World |
The percentages of third party and other gross billings that we retained after deducting the merchant's share for the three months ended September 30, 2016 and 2015 were as follows:
North America |
| EMEA |
| Rest of World |
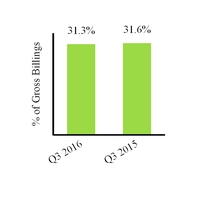
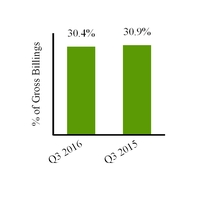
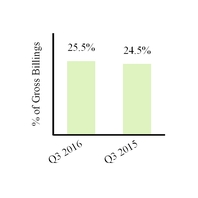
48
Revenue by category and segment for the three months ended September 30, 2016 and 2015 was as follows:
| North America |
| EMEA |
| Rest of World |
| Consolidated | ||||||||||||||||||||||||
| Three Months Ended September 30, |
| Three Months Ended September 30, |
| Three Months Ended September 30, |
| Three Months Ended September 30, | ||||||||||||||||||||||||
| 2016 |
| 2015 |
| 2016 |
| 2015 |
| 2016 |
| 2015 |
| 2016 |
| 2015 | ||||||||||||||||
| (in thousands) | ||||||||||||||||||||||||||||||
Local (1) : |
|
|
|
|
|
|
|
|
|
|
|
|
|
|
| ||||||||||||||||
Third party and other | $ | 176,220 | |
| $ | 163,786 | |
| $ | 58,581 | |
| $ | 70,781 | |
| $ | 21,876 | |
| $ | 26,372 | |
| $ | 256,677 | |
| $ | 260,939 | |
|
|
|
|
|
|
|
|
|
|
|
|
|
|
|
| ||||||||||||||||
Travel: |
|
|
|
|
|
|
|
|
|
|
|
|
|
|
| ||||||||||||||||
Third party | 21,241 | |
| 21,394 | |
| 12,866 | |
| 13,561 | |
| 5,075 | |
| 6,135 | |
| 39,182 | |
| 41,090 | | ||||||||
Total services | 197,461 | |
| 185,180 | |
| 71,447 | |
| 84,342 | |
| 26,951 | |
| 32,507 | |
| 295,859 | |
| 302,029 | | ||||||||
|
|
|
|
|
|
|
|
|
|
|
|
|
|
|
| ||||||||||||||||
Goods: |
|
|
|
|
|
|
|
|
|
|
|
|
|
|
| ||||||||||||||||
Third party | 1,965 | |
| 1,643 | |
| 4,789 | |
| 11,837 | |
| 7,223 | |
| 10,797 | |
| 13,977 | |
| 24,277 | | ||||||||
Direct revenue | 283,855 | |
| 277,108 | |
| 120,337 | |
| 103,108 | |
| 6,440 | |
| 7,073 | |
| 410,632 | |
| 387,289 | | ||||||||
Total | 285,820 | |
| 278,751 | |
| 125,126 | |
| 114,945 | |
| 13,663 | |
| 17,870 | |
| 424,609 | |
| 411,566 | | ||||||||
|
|
|
|
|
|
|
|
|
|
|
|
|
|
|
| ||||||||||||||||
Total revenue | $ | 483,281 | |
| $ | 463,931 | |
| $ | 196,573 | |
| $ | 199,287 | |
| $ | 40,614 | |
| $ | 50,377 | |
| $ | 720,468 | |
| $ | 713,595 | |
(1) | Includes revenue from deals with local and national merchants and through local events. |
North America
The increase in North America segment revenue reflects increases in our Local and Goods categories. Those revenue increases resulted from the increases in gross billings. As discussed above, those increases were primarily attributable to our significant incremental marketing spend to accelerate customer growth, as well as our focus on increasing deal coverage and improving the quality of active deals available through our marketplaces.
The percentage of gross billings that we retained after deducting the merchant's share on third party and other revenue transactions in our Local and Travel categories were 33.2% and 22.7% , respectively, for the three months ended September 30, 2016 , as compared to 34.0% and 21.0% in the prior year period. Increases and decreases in the percentage of gross billings that we retain on third party revenue transactions reflect the overall results of individual deal-by-deal negotiations with merchants and can vary significantly from period-to-period.
We continue to focus more of our efforts on sourcing local deal offerings in sub-categories that provide the best opportunities for high frequency customer purchase behavior. These "high frequency use cases" include food and drink (including take-out and delivery), health, beauty, and wellness and events and activities. In connection with these efforts, we may be willing to offer more attractive terms to merchants that could reduce our deal margins in future periods.
EMEA
The decrease in EMEA segment revenue reflects decreases in our Local and Travel categories, and from third party revenue transactions in our Goods category. Those revenue decreases were primarily attributable to the following:
• | the decreases in gross billings as discussed above; |
• | decreases in the percentage of gross billings that we retained after deducting the merchant's share for third party revenue transactions in our Local category. For the three months ended September 30, 2016 , that percentage decreased to 36.9% in our Local category, as compared to 38.8% in the prior year period. We have been willing to accept lower deal margins in order to improve the quality and increase the number of deals offered to our customers by offering more attractive terms to merchants; |
• | a $2.7 million unfavorable impact from year-over-year changes in foreign exchange rates; and |
• | a reduction related to countries that we operated in during the prior year period and have subsequently exited as part of our restructuring plan and the disposition of our operations in Russia. |
49
Those decreases were partially offset by an increase in direct revenue transactions in our Goods category, and an increase in the percentage of gross billings that we retained after deducting the merchant's share for third party revenue transactions in our Travel category. For the three months ended September 30, 2016 , that percentage increased to 22.3% as compared to 20.9% in the prior year period.
Rest of World
The decrease in Rest of World segment revenue reflects decreases across our Local, Travel, and Goods categories. The decrease in Rest of World revenue was primarily attributable to the following:
• | the decreases in gross billings as discussed above; |
• | a decrease in the percentage of gross billings that we retained after deducting the merchant's share in our Local category. For the three months ended September 30, 2016 , that percentage decreased to 27.2% as compared to 28.4% in the prior year period; |
• | a $2.0 million unfavorable impact from year-over-year changes in foreign exchange rates; and |
• | a reduction related to countries that we operated in during the prior year period and have subsequently exited as part of our restructuring plan and dispositions of controlling stakes in our operations in India and Indonesia. |
Those decreases were partially offset by an increase in the percentage of gross billings that we retained after deducting the merchant's share for third party revenue transactions in our Travel and Goods category. For the three months ended September 30, 2016 , those percentages increased to 21.0% in our Travel category and 24.7% in our Goods category, as compared to 20.0% and 20.3% , respectively, in the prior year period.
Nine Months Ended September 30, 2016 and 2015 :
Revenue for the nine months ended September 30, 2016 and 2015 was as follows:
| Nine Months Ended September 30, | |||||||||||||
| 2016 |
| 2015 |
| $ Change |
| % Change | |||||||
| (in thousands) | |||||||||||||
Revenue: |
|
|
|
|
|
|
| |||||||
Third party | $ | 907,660 | |
| $ | 991,756 | |
| $ | (84,096 | ) |
| (8.5 | )% |
Direct | 1,245,936 | |
| 1,175,073 | |
| 70,863 | |
| 6.0 | | |||
Other | 54,873 | |
| 35,517 | |
| 19,356 | |
| 54.5 | | |||
Total revenue | $ | 2,208,469 | |
| $ | 2,202,346 | |
| $ | 6,123 | |
| 0.3 | |
The effect on revenue for the nine months ended September 30, 2016 from changes in exchange rates versus the U.S. dollar was as follows:
| Nine Months Ended September 30, 2016 | ||||||||||
| At Avg. Q3 2015 YTD Rates (1) |
| Exchange Rate Effect (2) |
| As Reported | ||||||
| (in thousands) | ||||||||||
Revenue | $ | 2,230,931 | |
| $ | (22,462 | ) |
| $ | 2,208,469 | |
(1) | Represents the financial statement balance that would have resulted had exchange rates in the reporting period been the same as those in effect in the prior year period. |
(2) | Represents the increase or decrease in the reported amount resulting from changes in exchange rates from those in effect in the prior year period. |
Revenue was consistent with the prior year period, reflecting increases in direct revenue transactions in our Goods category and other revenue that were partially offset by the following:
• | a $44.4 million reduction related to countries that we operated in during the prior year period and have subsequently exited as part of our restructuring plan, dispositions of controlling stakes in our operations in India and Indonesia and the disposition of our operations in Russia; and |
• | a $22.5 million unfavorable impact from year-over-year changes in foreign currency exchange rates. |
50
Revenue by Segment
Revenue by segment for the nine months ended September 30, 2016 and 2015 was as follows:
|
| Nine Months Ended September 30, | |||||||||||||
|
| 2016 |
| 2015 |
| $ Change |
| % Change | |||||||
|
| (dollars in thousands) | |||||||||||||
North America: |
|
|
|
|
|
|
|
| |||||||
Third party and other |
| $ | 622,387 | |
| $ | 584,414 | |
| $ | 37,973 | |
| 6.5 | % |
Direct |
| 878,629 | |
| 840,681 | |
| 37,948 | |
| 4.5 | | |||
Total segment revenue |
| 1,501,016 | |
| 1,425,095 | |
| 75,921 | |
| 5.3 | | |||
EMEA: |
|
|
|
|
|
|
|
| |||||||
Third party |
| 236,628 | |
| 303,755 | |
| (67,127 | ) |
| (22.1 | ) | |||
Direct |
| 347,220 | |
| 315,799 | |
| 31,421 | |
| 9.9 | | |||
Total segment revenue |
| 583,848 | |
| 619,554 | |
| (35,706 | ) |
| (5.8 | ) | |||
Rest of World: |
|
|
|
|
|
|
|
| |||||||
Third party |
| 103,518 | |
| 139,104 | |
| (35,586 | ) |
| (25.6 | ) | |||
Direct |
| 20,087 | |
| 18,593 | |
| 1,494 | |
| 8.0 | | |||
Total segment revenue |
| 123,605 | |
| 157,697 | |
| (34,092 | ) |
| (21.6 | ) | |||
Total revenue |
| $ | 2,208,469 | |
| $ | 2,202,346 | |
| $ | 6,123 | |
| 0.3 | |
The percentages of revenue by segment for the nine months ended September 30, 2016 and 2015 were as follows:
Q3 2016 YTD |
| Q3 2015 YTD |
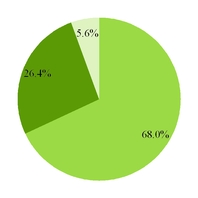
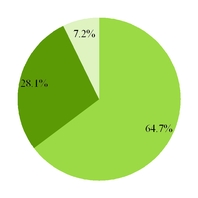
| North America |
|
| EMEA |
|
| Rest of World |
51
The percentages of third party and other gross billings that we retained after deducting the merchant's share for the nine months ended September 30, 2016 and 2015 were as follows:
North America |
| EMEA |
| Rest of World |
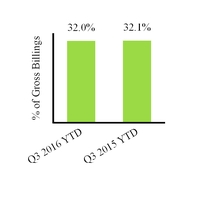
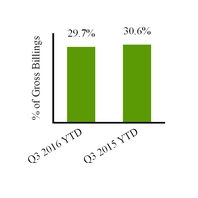
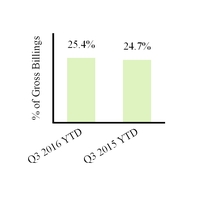
Revenue by category and segment for the nine months ended September 30, 2016 and 2015 was as follows:
| North America |
| EMEA |
| Rest of World |
| Consolidated | ||||||||||||||||||||||||
| Nine Months Ended |
| Nine Months Ended |
| Nine Months Ended |
| Nine Months Ended | ||||||||||||||||||||||||
| 2016 |
| 2015 |
| 2016 |
| 2015 |
| 2016 |
| 2015 |
| 2016 |
| 2015 | ||||||||||||||||
| (in thousands) | ||||||||||||||||||||||||||||||
Local (1) : |
|
|
|
|
|
|
|
|
|
|
|
|
|
|
| ||||||||||||||||
Third party and other | $ | 552,512 | |
| $ | 517,111 | |
| $ | 181,083 | |
| $ | 228,860 | |
| $ | 66,419 | |
| $ | 85,152 | |
| $ | 800,014 | |
| $ | 831,123 | |
|
|
|
|
|
|
|
|
|
|
|
|
|
|
|
| ||||||||||||||||
Travel: |
|
|
|
|
|
|
|
|
|
|
|
|
|
|
| ||||||||||||||||
Third party | 63,556 | |
| 63,341 | |
| 34,753 | |
| 41,378 | |
| 14,445 | |
| 18,993 | |
| 112,754 | |
| 123,712 | | ||||||||
Total services | 616,068 | |
| 580,452 | |
| 215,836 | |
| 270,238 | |
| 80,864 | |
| 104,145 | |
| 912,768 | |
| 954,835 | | ||||||||
|
|
|
|
|
|
|
|
|
|
|
|
|
|
|
| ||||||||||||||||
Goods: |
|
|
|
|
|
|
|
|
|
|
|
|
|
|
| ||||||||||||||||
Third party | 6,319 | |
| 3,962 | |
| 20,792 | |
| 33,517 | |
| 22,654 | |
| 34,959 | |
| 49,765 | |
| 72,438 | | ||||||||
Direct revenue | 878,629 | |
| 840,681 | |
| 347,220 | |
| 315,799 | |
| 20,087 | |
| 18,593 | |
| 1,245,936 | |
| 1,175,073 | | ||||||||
Total | 884,948 | |
| 844,643 | |
| 368,012 | |
| 349,316 | |
| 42,741 | |
| 53,552 | |
| 1,295,701 | |
| 1,247,511 | | ||||||||
|
|
|
|
|
|
|
|
|
|
|
|
|
|
|
| ||||||||||||||||
Total revenue | $ | 1,501,016 | |
| $ | 1,425,095 | |
| $ | 583,848 | |
| $ | 619,554 | |
| $ | 123,605 | |
| $ | 157,697 | |
| $ | 2,208,469 | |
| $ | 2,202,346 | |
(1) | Includes revenue from deals with local and national merchants and through local events. |
North America
The increase in North America segment revenue reflects increases in our Local and Goods categories. Those revenue increases were primarily attributable to the following:
• | the increases in gross billings as discussed above. Those increases were primarily attributable to our significant incremental marketing spend to accelerate customer growth, as well as our focus on increasing deal coverage and improving the quality of active deals available through our marketplaces; and |
• | an $ 18.7 million increase in other revenue, which includes commission revenue earned when customers make purchases with retailers using digital coupons accessed through our websites and mobile applications, payment processing revenue and advertising revenue. |
The percentages of gross billings that we retained after deducting the merchant's share on third party revenue transactions in our Local and Travel categories were substantially consistent with the prior year period.
52
EMEA
The decrease in EMEA segment revenue reflects decreases in our Local and Travel categories, and from third party revenue transactions in our Goods category. Those revenue decreases were primarily attributable to the following:
• | the decreases in gross billings as discussed above; |
• | decreases in the percentage of gross billings that we retained after deducting the merchant's share for third party revenue transactions in our Local and Travel categories. For the nine months ended September 30, 2016 , those percentages decreased to 36.4% in our Local category and 20.7% in our Travel category as compared to 38.2% and 21.8% , respectively, in the prior year period. We have been willing to accept lower deal margins in order to improve the quality and increase the number of deals offered to our customers by offering more attractive terms to merchants; |
• | a reduction related to countries that we operated in during the prior year period and have subsequently exited as part of our restructuring plan and the disposition of our operations in Russia; and |
• | a $7.6 million unfavorable impact from year-over-year changes in foreign exchange rates. |
Those decreases were partially offset by an increase in direct revenue transactions in our Goods category.
Rest of World
The decrease in Rest of World segment revenue reflects decreases in our Local and Travel categories, and from third party revenue transactions in our Goods category. The decrease in Rest of World revenue was primarily attributable to the following:
• | the decreases in gross billings as discussed above; |
• | decreases in the percentage of gross billings that we retained after deducting the merchant's share for third party revenue transactions in our Local category. For the nine months ended September 30, 2016 , that percentage decreased to 27.7% , as compared to 29.1% in the prior year period. We have been willing to accept lower deal margins in order to improve the quality and increase the number of deals offered to our customers by offering more attractive terms to merchants; |
• | a $14.6 million unfavorable impact from year-over-year changes in foreign exchange rates; and |
• | a reduction related to countries that we operated in during the prior year period and have subsequently exited as part of our restructuring plan and dispositions of controlling stakes in our operations in India and Indonesia. |
Those decreases were partially offset by an increase in direct revenue transactions in our Goods category and an increase in the percentage of gross billings that we retained after deducting the merchant's share for third party revenue transactions in our Travel and Goods category. For the nine months ended September 30, 2016 , those percentages increased to 20.5% in our Travel category and 23.2% in our Goods category, as compared to 20.0% and 19.9% , respectively, in the prior year period.
Cost of Revenue
Cost of revenue is comprised of direct and certain indirect costs incurred to generate revenue. For direct revenue transactions, cost of revenue includes the cost of inventory, shipping and fulfillment costs and inventory markdowns. Fulfillment costs are comprised of third party logistics provider costs, as well as rent, depreciation, personnel costs and other costs of operating our fulfillment center. For third party revenue transactions, cost of revenue includes estimated refunds for which the merchant's
share is not recoverable. Other costs incurred to generate revenue, which include credit card processing fees, editorial costs, certain technology costs, web hosting, and other processing fees, are attributed to cost of third party revenue, direct revenue and other revenue in proportion to gross billings during the period.
Technology costs within cost of revenue consist of compensation expense related to technology support personnel who are responsible for operating and maintaining the infrastructure of our websites. Technology costs within cost of revenue also include amortization expense from customer-facing internal-use software, primarily related to website development.
53
Three Months Ended September 30, 2016 and 2015 :
Cost of revenue on third party, direct revenue and other revenue for the three months ended September 30, 2016 and 2015 was as follows:
|
| Three Months Ended September 30, | |||||||||||||
|
| 2016 |
| 2015 |
| $ Change |
| % Change | |||||||
|
| (in thousands) | |||||||||||||
Cost of revenue: |
|
|
|
|
|
|
|
| |||||||
Third party |
| $ | 40,038 | |
| $ | 41,212 | |
| $ | (1,174 | ) |
| (2.8 | )% |
Direct |
| 365,932 | |
| 338,633 | |
| 27,299 | |
| 8.1 | | |||
Other |
| 381 | |
| 4,838 | |
| (4,457 | ) |
| (92.1 | ) | |||
Total cost of revenue |
| $ | 406,351 | |
| $ | 384,683 | |
| $ | 21,668 | |
| 5.6 | |
The effect on cost of revenue for the three months ended September 30, 2016 from changes in exchange rates versus the U.S. dollar was as follows:
| Three Months Ended September 30, | ||||||||||
| At Avg. Q3 2015 Rates (1) |
| Exchange Rate Effect (2) |
| As Reported | ||||||
| (in thousands) | ||||||||||
Cost of revenue | $ | 408,095 | |
| $ | (1,744 | ) |
| $ | 406,351 | |
(1) | Represents the financial statement balance that would have resulted had exchange rates in the reporting period been the same as those in effect in the prior year period. |
(2) | Represents the increase or decrease in the reported amount resulting from changes in exchange rates from those in effect in the prior year period. |
The increase in total cost of revenue was primarily attributable to the growth in direct revenue from our Goods category. The increase was partially offset by the following:
• | a $4.2 million reduction related to countries that we operated in during the prior year period and have subsequently exited as part of our restructuring plan, dispositions of controlling stakes in our operations in India and Indonesia and the disposition of our operations in Russia; and |
• | a $1.7 million favorable impact from year-over-year changes in foreign currency exchange rates. |
54
Cost of Revenue by Segment
Cost of revenue by segment for the three months ended September 30, 2016 and 2015 was as follows:
|
| Three Months Ended September 30, | |||||||||||||
|
| 2016 |
| 2015 |
| $ Change |
| % Change | |||||||
|
| (dollars in thousands) | |||||||||||||
North America: |
|
|
|
|
|
|
|
| |||||||
Third party and other |
| $ | 27,787 | |
| $ | 29,022 | |
| $ | (1,235 | ) |
| (4.3 | )% |
Direct |
| 253,833 | |
| 243,666 | |
| 10,167 | |
| 4.2 | | |||
Total segment cost of revenue |
| 281,620 | |
| 272,688 | |
| 8,932 | |
| 3.3 | | |||
EMEA: |
|
|
|
|
|
|
|
| |||||||
Third party |
| 5,731 | |
| 7,543 | |
| (1,812 | ) |
| (24.0 | ) | |||
Direct |
| 105,783 | |
| 88,228 | |
| 17,555 | |
| 19.9 | | |||
Total segment cost of revenue |
| 111,514 | |
| 95,771 | |
| 15,743 | |
| 16.4 | | |||
Rest of World: |
|
|
|
|
|
|
|
| |||||||
Third party |
| 6,901 | |
| 9,485 | |
| (2,584 | ) |
| (27.2 | ) | |||
Direct |
| 6,316 | |
| 6,739 | |
| (423 | ) |
| (6.3 | ) | |||
Total segment cost of revenue |
| 13,217 | |
| 16,224 | |
| (3,007 | ) |
| (18.5 | ) | |||
Total cost of revenue |
| $ | 406,351 | |
| $ | 384,683 | |
| $ | 21,668 | |
| 5.6 | |
The percentages of cost of revenue by segment for the three months ended September 30, 2016 and 2015 were as follows:
Q3 2016 |
| Q3 2015 |
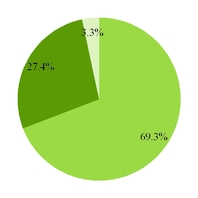
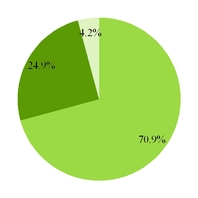
| North America |
|
| EMEA |
|
| Rest of World |
55
Cost of revenue by category and segment for the three months ended September 30, 2016 and 2015 was as follows:
| North America |
| EMEA |
| Rest of World |
| Consolidated | ||||||||||||||||||||||||
| Three Months Ended September 30, |
| Three Months Ended September 30, |
| Three Months Ended September 30, |
| Three Months Ended September 30, | ||||||||||||||||||||||||
| 2016 |
| 2015 |
| 2016 |
| 2015 |
| 2016 |
| 2015 |
| 2016 |
| 2015 | ||||||||||||||||
| (in thousands) | ||||||||||||||||||||||||||||||
Local (1) : |
|
|
|
|
|
|
|
|
|
|
|
|
|
|
| ||||||||||||||||
Third party and other | $ | 23,347 | |
| $ | 24,988 | |
| $ | 4,114 | |
| $ | 4,493 | |
| $ | 3,231 | |
| $ | 3,804 | |
| $ | 30,692 | |
| $ | 33,285 | |
|
|
|
|
|
|
|
|
|
|
|
|
|
|
|
| ||||||||||||||||
Travel: |
|
|
|
|
|
|
|
|
|
|
|
|
|
|
| ||||||||||||||||
Third party | 3,984 | |
| 3,750 | |
| 984 | |
| 1,238 | |
| 1,113 | |
| 1,276 | |
| 6,081 | |
| 6,264 | | ||||||||
Total services | 27,331 | |
| 28,738 | |
| 5,098 | |
| 5,731 | |
| 4,344 | |
| 5,080 | |
| 36,773 | |
| 39,549 | | ||||||||
|
|
|
|
|
|
|
|
|
|
|
|
|
|
|
| ||||||||||||||||
Goods: |
|
|
|
|
|
|
|
|
|
|
|
|
|
|
| ||||||||||||||||
Third party | 456 | |
| 284 | |
| 633 | |
| 1,812 | |
| 2,557 | |
| 4,405 | |
| 3,646 | |
| 6,501 | | ||||||||
Direct | 253,833 | |
| 243,666 | |
| 105,783 | |
| 88,228 | |
| 6,316 | |
| 6,739 | |
| 365,932 | |
| 338,633 | | ||||||||
Total | 254,289 | |
| 243,950 | |
| 106,416 | |
| 90,040 | |
| 8,873 | |
| 11,144 | |
| 369,578 | |
| 345,134 | | ||||||||
|
|
|
|
|
|
|
|
|
|
|
|
|
|
|
| ||||||||||||||||
Total cost of revenue | $ | 281,620 | |
| $ | 272,688 | |
| $ | 111,514 | |
| $ | 95,771 | |
| $ | 13,217 | |
| $ | 16,224 | |
| $ | 406,351 | |
| $ | 384,683 | |
(1) | Includes cost of revenue from deals with local and national merchants and through local events. |
North America
The increase in North America cost of revenue was primarily attributable to the growth in direct revenue from our Goods category.
EMEA
The increase in EMEA cost of revenue was primarily attributable to the growth in direct revenue from our Goods category. The increases were partially offset by a reduction related to countries that we operated in during the prior year period and have subsequently exited as part of our restructuring plan and the disposition of our operations in Russia.
Rest of World
The decrease in Rest of World cost of revenue was primarily attributable to the following:
• | a $1.7 million favorable impact from year-over-year changes in foreign currency exchange rates; and |
• | a reduction related to countries that we operated in during the prior year period and have subsequently exited as part of our restructuring plan and dispositions of controlling stakes in our operations in India and Indonesia. |
Nine Months Ended September 30, 2016 and 2015 :
Cost of revenue on third party, direct revenue and other revenue for the nine months ended September 30, 2016 and 2015 was as follows:
|
| Nine Months Ended September 30, | |||||||||||||
|
| 2016 |
| 2015 |
| $ Change |
| % Change | |||||||
|
| (in thousands) | |||||||||||||
Cost of revenue: |
|
|
|
|
|
|
|
| |||||||
Third party |
| $ | 124,234 | |
| $ | 129,644 | |
| $ | (5,410 | ) |
| (4.2 | )% |
Direct |
| 1,090,436 | |
| 1,043,729 | |
| 46,707 | |
| 4.5 | | |||
Other |
| 6,766 | |
| 15,648 | |
| (8,882 | ) |
| (56.8 | ) | |||
Total cost of revenue |
| $ | 1,221,436 | |
| $ | 1,189,021 | |
| $ | 32,415 | |
| 2.7 | |
56
The effect on cost of revenue for the nine months ended September 30, 2016 from changes in exchange rates versus the U.S. dollar was as follows:
| Nine Months Ended September 30, 2016 | ||||||||||
| At Avg. Q3 2015 YTD Rates (1) |
| Exchange Rate Effect (2) |
| As Reported | ||||||
| (in thousands) | ||||||||||
Cost of revenue | $ | 1,230,418 | |
| $ | (8,982 | ) |
| $ | 1,221,436 | |
(1) | Represents the financial statement balance that would have resulted had exchange rates in the reporting period been the same as those in effect in the prior year period. |
(2) | Represents the increase or decrease in the reported amount resulting from changes in exchange rates from those in effect in the prior year period. |
The increase in total cost of revenue was primarily attributable to the growth in direct revenue from our Goods category. The increase was partially offset by the following:
• | a $16.7 million reduction related to countries that we operated in during the prior year period and have subsequently exited as part of our restructuring plan, dispositions of controlling stakes in our operations in India and Indonesia and the disposition of our operations in Russia; and |
• | a $9.0 million favorable impact from year-over-year changes in foreign currency exchange rates. |
Cost of Revenue by Segment
Cost of revenue by segment for the nine months ended September 30, 2016 and 2015 was as follows:
|
| Nine Months Ended September 30, | |||||||||||||
|
| 2016 |
| 2015 |
| $ Change |
| % Change | |||||||
|
| (dollars in thousands) | |||||||||||||
North America: |
|
|
|
|
|
|
|
| |||||||
Third party and other |
| $ | 92,180 | |
| $ | 88,245 | |
| $ | 3,935 | |
| 4.5 | % |
Direct |
| 774,058 | |
| 754,560 | |
| 19,498 | |
| 2.6 | | |||
Total segment cost of revenue |
| 866,238 | |
| 842,805 | |
| 23,433 | |
| 2.8 | | |||
EMEA: |
|
|
|
|
|
|
|
| |||||||
Third party |
| 17,141 | |
| 25,182 | |
| (8,041 | ) |
| (31.9 | ) | |||
Direct |
| 296,600 | |
| 271,532 | |
| 25,068 | |
| 9.2 | | |||
Total segment cost of revenue |
| 313,741 | |
| 296,714 | |
| 17,027 | |
| 5.7 | | |||
Rest of World: |
|
|
|
|
|
|
|
| |||||||
Third party |
| 21,679 | |
| 31,865 | |
| (10,186 | ) |
| (32.0 | ) | |||
Direct |
| 19,778 | |
| 17,637 | |
| 2,141 | |
| 12.1 | | |||
Total segment cost of revenue |
| 41,457 | |
| 49,502 | |
| (8,045 | ) |
| (16.3 | ) | |||
Total cost of revenue |
| $ | 1,221,436 | |
| $ | 1,189,021 | |
| $ | 32,415 | |
| 2.7 | |
57
The percentages of cost of revenue by segment for the nine months ended September 30, 2016 and 2015 were as follows:
Q3 2016 YTD |
| Q3 2015 YTD |
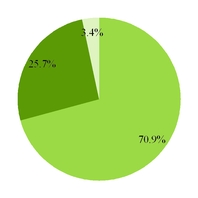

| North America |
|
| EMEA |
|
| Rest of World |
Cost of revenue by category and segment for the nine months ended September 30, 2016 and 2015 was as follows:
| North America |
| EMEA |
| Rest of World |
| Consolidated | ||||||||||||||||||||||||
| Nine Months Ended |
| Nine Months Ended |
| Nine Months Ended |
| Nine Months Ended | ||||||||||||||||||||||||
| 2016 |
| 2015 |
| 2016 |
| 2015 |
| 2016 |
| 2015 |
| 2016 |
| 2015 | ||||||||||||||||
| (in thousands) | ||||||||||||||||||||||||||||||
Local (1) : |
|
|
|
|
|
|
|
|
|
|
|
|
|
|
| ||||||||||||||||
Third party and other | $ | 76,809 | |
| $ | 75,963 | |
| $ | 11,504 | |
| $ | 14,946 | |
| $ | 10,264 | |
| $ | 11,856 | |
| $ | 98,577 | |
| $ | 102,765 | |
|
|
|
|
|
|
|
|
|
|
|
|
|
|
|
| ||||||||||||||||
Travel: |
|
|
|
|
|
|
|
|
|
|
|
|
|
|
| ||||||||||||||||
Third party | 14,253 | |
| 11,521 | |
| 2,872 | |
| 4,716 | |
| 3,246 | |
| 4,216 | |
| 20,371 | |
| 20,453 | | ||||||||
Total services | 91,062 | |
| 87,484 | |
| 14,376 | |
| 19,662 | |
| 13,510 | |
| 16,072 | |
| 118,948 | |
| 123,218 | | ||||||||
|
|
|
|
|
|
|
|
|
|
|
|
|
|
|
| ||||||||||||||||
Goods: |
|
|
|
|
|
|
|
|
|
|
|
|
|
|
| ||||||||||||||||
Third party | 1,118 | |
| 761 | |
| 2,765 | |
| 5,520 | |
| 8,169 | |
| 15,793 | |
| 12,052 | |
| 22,074 | | ||||||||
Direct | 774,058 | |
| 754,560 | |
| 296,600 | |
| 271,532 | |
| 19,778 | |
| 17,637 | |
| 1,090,436 | |
| 1,043,729 | | ||||||||
Total | 775,176 | |
| 755,321 | |
| 299,365 | |
| 277,052 | |
| 27,947 | |
| 33,430 | |
| 1,102,488 | |
| 1,065,803 | | ||||||||
|
|
|
|
|
|
|
|
|
|
|
|
|
|
|
| ||||||||||||||||
Total cost of revenue | $ | 866,238 | |
| $ | 842,805 | |
| $ | 313,741 | |
| $ | 296,714 | |
| $ | 41,457 | |
| $ | 49,502 | |
| $ | 1,221,436 | |
| $ | 1,189,021 | |
(1) | Includes cost of revenue from deals with local and national merchants and through local events. |
North America
The increase in North America cost of revenue was primarily attributable to the growth in direct revenue from our Goods category.
EMEA
The increase in EMEA cost of revenue was primarily attributable to the growth in direct revenue from our Goods category. The increase was partially offset by the following:
• | the improvement in gross profit margins on direct revenue transactions in our Goods category as discussed above; |
• | a reduction related to countries that we operated in during the prior year period and have subsequently exited as part of our restructuring plan and the disposition of our operations in Russia; and |
• | a $1.4 million favorable impact from year-over-year changes in foreign currency exchange rates. |
58
Rest of World
The decrease in Rest of World cost of revenue was primarily attributable to the following:
• | a $7.5 million favorable impact from year-over-year changes in foreign currency exchange rates; and |
• | a reduction related to countries that we operated in during the prior year period and have subsequently exited as part of our restructuring plan and dispositions of controlling stakes in our operations in India and Indonesia. |
Those decreases were partially offset by increases in cost of revenue on direct revenue transactions in our Goods category, primarily due to the direct revenue growth in that category.
Gross Profit
Three Months Ended September 30, 2016 and 2015 :
Gross profit for the three months ended September 30, 2016 and 2015 was as follows:
|
| Three Months Ended September 30, | |||||||||||||
|
| 2016 |
| 2015 |
| $ Change |
| % Change | |||||||
|
| (dollars in thousands) | |||||||||||||
Gross profit: |
|
|
|
|
|
|
|
| |||||||
Third party |
| $ | 250,579 | |
| $ | 270,688 | |
| $ | (20,109 | ) |
| (7.4 | )% |
Direct |
| 44,700 | |
| 48,656 | |
| (3,956 | ) |
| (8.1 | ) | |||
Other |
| 18,838 | |
| 9,568 | |
| 9,270 | |
| 96.9 | | |||
Total gross profit |
| $ | 314,117 | |
| $ | 328,912 | |
| $ | (14,795 | ) |
| (4.5 | ) |
The effect on gross profit for the three months ended September 30, 2016 from changes in exchange rates versus the U.S. dollar was as follows:
| Three Months Ended September 30, | ||||||||||
| At Avg. Q3 2015 Rates (1) |
| Exchange Rate Effect (2) |
| As Reported | ||||||
| (in thousands) | ||||||||||
Gross profit | $ | 317,063 | |
| $ | (2,946 | ) |
| $ | 314,117 | |
(1) | Represents the financial statement balance that would have resulted had exchange rates in the reporting period been the same as those in effect in the prior year period. |
(2) | Represents the increase or decrease in the reported amount resulting from changes in exchange rates from those in effect in the prior year period. |
The decrease in total gross profit was primarily attributable to the following:
• | decreases in third party and other revenue from our EMEA and Rest of World segments as discussed above; |
• | an $8.7 million reduction related to countries that we operated in during the prior year period and have subsequently exited as part of our restructuring plan, dispositions of controlling stakes in our operations in India and Indonesia and the disposition of our operations in Russia; and |
• | a $2.9 million unfavorable impact from year-over-year changes in foreign currency exchange rates. |
Those decreases were partially offset by a $6.0 million increase in gross profit from third party revenue transactions and an $8.1 million increase in gross profit from other revenue transactions in the Local category within our North America segment. The increase in gross profit from other revenue transactions was primarily attributable to commission revenue earned when customers make purchases with retailers using digital coupons accessed through our websites and mobile applications.
59
Gross Profit by Segment
Gross profit by segment for the three months ended September 30, 2016 and 2015 was as follows:
|
| Three Months Ended September 30, | |||||||||||||
|
| 2016 |
| 2015 |
| $ Change |
| % Change | |||||||
|
| (dollars in thousands) | |||||||||||||
North America: |
|
|
|
|
|
|
|
| |||||||
Third party and other |
| $ | 171,639 | |
| $ | 157,801 | |
| $ | 13,838 | |
| 8.8 | % |
% of gross billings |
| 26.9 | % |
| 26.7 | % |
|
|
|
| |||||
% of revenue |
| 86.1 | % |
| 84.5 | % |
|
|
|
| |||||
Direct |
| $ | 30,022 | |
| $ | 33,442 | |
| (3,420 | ) |
| (10.2 | ) | |
% of gross billings and revenue |
| 10.6 | % |
| 12.1 | % |
|
|
|
| |||||
|
|
|
|
|
|
|
|
| |||||||
EMEA: |
|
|
|
|
|
|
|
| |||||||
Third party |
| $ | 70,505 | |
| $ | 88,636 | |
| (18,131 | ) |
| (20.5 | ) | |
% of gross billings |
| 28.1 | % |
| 28.5 | % |
|
|
|
| |||||
% of revenue |
| 92.5 | % |
| 92.2 | % |
|
|
|
| |||||
Direct |
| $ | 14,554 | |
| $ | 14,880 | |
| (326 | ) |
| (2.2 | ) | |
% of gross billings and revenue |
| 12.1 | % |
| 14.4 | % |
|
|
|
| |||||
|
|
|
|
|
|
|
|
| |||||||
Rest of World: |
|
|
|
|
|
|
|
| |||||||
Third party |
| $ | 27,273 | |
| $ | 33,819 | |
| (6,546 | ) |
| (19.4 | ) | |
% of gross billings |
| 20.4 | % |
| 19.1 | % |
|
|
|
| |||||
% of revenue |
| 79.8 | % |
| 78.1 | % |
|
|
|
| |||||
Direct |
| $ | 124 | |
| $ | 334 | |
| (210 | ) |
| (62.9 | ) | |
% of gross billings and revenue |
| 1.9 | % |
| 4.7 | % |
|
|
|
| |||||
The percentages of gross profit by segment for the three months ended September 30, 2016 and 2015 were as follows:
Q3 2016 |
| Q3 2015 |
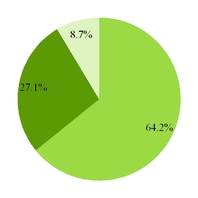
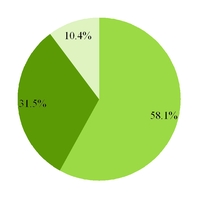
| North America |
|
| EMEA |
|
| Rest of World |
60
Gross profit by category and segment for the three months ended September 30, 2016 and 2015 was as follows:
| North America |
| EMEA |
| Rest of World |
| Consolidated | ||||||||||||||||||||||||
| Three Months Ended September 30, |
| Three Months Ended September 30, |
| Three Months Ended September 30, |
| Three Months Ended September 30, | ||||||||||||||||||||||||
| 2016 |
| 2015 |
| 2016 |
| 2015 |
| 2016 |
| 2015 |
| 2016 |
| 2015 | ||||||||||||||||
| (in thousands) | ||||||||||||||||||||||||||||||
Local (1) : |
|
|
|
|
|
|
|
|
|
|
|
|
|
|
| ||||||||||||||||
Third party and other | $ | 152,873 | |
| $ | 138,798 | |
| $ | 54,467 | |
| $ | 66,288 | |
| $ | 18,645 | |
| $ | 22,568 | |
| $ | 225,985 | |
| $ | 227,654 | |
|
|
|
|
|
|
|
|
|
|
|
|
|
|
|
| ||||||||||||||||
Travel: |
|
|
|
|
|
|
|
|
|
|
|
|
|
|
| ||||||||||||||||
Third party | 17,257 | |
| 17,644 | |
| 11,882 | |
| 12,323 | |
| 3,962 | |
| 4,859 | |
| 33,101 | |
| 34,826 | | ||||||||
Total services | 170,130 | |
| 156,442 | |
| 66,349 | |
| 78,611 | |
| 22,607 | |
| 27,427 | |
| 259,086 | |
| 262,480 | | ||||||||
|
|
|
|
|
|
|
|
|
|
|
|
|
|
|
| ||||||||||||||||
Goods: |
|
|
|
|
|
|
|
|
|
|
|
|
|
|
| ||||||||||||||||
Third party | 1,509 | |
| 1,359 | |
| 4,156 | |
| 10,025 | |
| 4,666 | |
| 6,392 | |
| 10,331 | |
| 17,776 | | ||||||||
Direct | 30,022 | |
| 33,442 | |
| 14,554 | |
| 14,880 | |
| 124 | |
| 334 | |
| 44,700 | |
| 48,656 | | ||||||||
Total | 31,531 | |
| 34,801 | |
| 18,710 | |
| 24,905 | |
| 4,790 | |
| 6,726 | |
| 55,031 | |
| 66,432 | | ||||||||
|
|
|
|
|
|
|
|
|
|
|
|
|
|
|
| ||||||||||||||||
Total gross profit | $ | 201,661 | |
| $ | 191,243 | |
| $ | 85,059 | |
| $ | 103,516 | |
| $ | 27,397 | |
| $ | 34,153 | |
| $ | 314,117 | |
| $ | 328,912 | |
(1) | Includes gross profit from deals with local and national merchants and through local events. |
North America
The increase in North America gross profit was attributable to a $6.0 million increase in gross profit from third party revenue transactions and an $8.1 million increase in gross profit from other revenue transactions in our Local category. The increase in gross profit from other revenue transactions in our Local category was primarily attributable to commission revenue earned when customers make purchases with retailers using digital coupons accessed through our websites and mobile applications. Those increases were partially offset by a decrease in gross profit from direct revenue transactions in our Goods category, which resulted from a decline in gross profit margin to 10.6% for the three months ended September 30, 2016, as compared to 12.1% in the prior year period. While we continue to focus our merchandising mix on higher margin product offerings, increased price discounting resulted in lower margins in the current quarterly period. We currently expect gross profit margins on direct revenue transactions in our Goods category to improve on a year-over-year basis in the fourth quarter.
EMEA
The decrease in EMEA gross profit was primarily attributable to the following:
• | the decreases in third party and other revenue across all three of our categories; |
• | a reduction related to countries that we operated in during the prior year period and have subsequently exited as part of our restructuring plan and the disposition of our operations in Russia; and |
• | a $2.7 million unfavorable impact from year-over-year changes in foreign currency exchange rates. |
Rest of World
The decrease in Rest of World gross profit was primarily attributable to the following:
• | the decreases in third party and other revenue across all three of our categories; |
• | a $0.3 million unfavorable impact from year-over-year changes in foreign currency exchange rates; and |
• | a reduction related to countries that we operated in during the prior year period and have subsequently exited as part of our restructuring plan and dispositions of controlling stakes in our operations in India and Indonesia. |
61
Nine Months Ended September 30, 2016 and 2015 :
Gross profit for the nine months ended September 30, 2016 and 2015 was as follows:
|
| Nine Months Ended September 30, | |||||||||||||
|
| 2016 |
| 2015 |
| $ Change |
| % Change | |||||||
|
| (dollars in thousands) | |||||||||||||
Gross profit: |
|
|
|
|
|
|
|
| |||||||
Third party |
| $ | 783,426 | |
| $ | 862,112 | |
| $ | (78,686 | ) |
| (9.1 | )% |
Direct |
| 155,500 | |
| 131,344 | |
| 24,156 | |
| 18.4 | | |||
Other |
| 48,107 | |
| 19,869 | |
| 28,238 | |
| 142.1 | | |||
Total gross profit |
| $ | 987,033 | |
| $ | 1,013,325 | |
| $ | (26,292 | ) |
| (2.6 | ) |
The effect on gross profit for the nine months ended September 30, 2016 from changes in exchange rates versus the U.S. dollar was as follows:
| Nine Months Ended September 30, 2016 | ||||||||||
| At Avg. Q3 2015 YTD Rates (1) |
| Exchange Rate Effect (2) |
| As Reported | ||||||
| (in thousands) | ||||||||||
Gross profit | $ | 1,000,513 | |
| $ | (13,480 | ) |
| $ | 987,033 | |
(1) | Represents the financial statement balance that would have resulted had exchange rates in the reporting period been the same as those in effect in the prior year period. |
(2) | Represents the increase or decrease in the reported amount resulting from changes in exchange rates from those in effect in the prior year period. |
The decrease in total gross profit was primarily attributable to the following:
• | the decreases in third party and other revenue from our EMEA and Rest of World segments as discussed above; |
• | a $27.7 million reduction related to countries that we operated in during the prior year period and have subsequently exited as part of our restructuring plan, dispositions of controlling stakes in our operations in India and Indonesia and the disposition of our operations in Russia; and |
• | a $13.5 million unfavorable impact from year-over-year changes in foreign currency exchange rates. |
Those decreases were partially offset by the following:
• | a $27.2 million increase in gross profit from other revenue transactions in the Local category within our North America segment, primarily driven by commission revenue earned when customers make purchases with retailers using digital coupons accessed through our websites and mobile applications; |
• | the improvement in gross profit margins on direct revenue transactions in our Goods category resulting from our strategic initiative to de-emphasize lower margin product offerings and our continued focus on reducing shipping and fulfillment costs; and |
• | a $7.4 million increase in gross profit from third party revenue transactions in the Local category within our North America segment. |
62
Gross Profit by Segment
Gross profit by segment for the nine months ended September 30, 2016 and 2015 was as follows:
|
| Nine Months Ended September 30, | |||||||||||||
|
| 2016 |
| 2015 |
| $ Change |
| % Change | |||||||
|
| (dollars in thousands) | |||||||||||||
North America: |
|
|
|
|
|
|
|
| |||||||
Third party and other |
| $ | 530,207 | |
| $ | 496,169 | |
| $ | 34,038 | |
| 6.9 | % |
% of gross billings |
| 27.3 | % |
| 27.3 | % |
|
|
|
| |||||
% of revenue |
| 85.2 | % |
| 84.9 | % |
|
|
|
| |||||
Direct |
| $ | 104,571 | |
| $ | 86,121 | |
| 18,450 | |
| 21.4 | | |
% of gross billings and revenue |
| 11.9 | % |
| 10.2 | % |
|
|
|
| |||||
|
|
|
|
|
|
|
|
| |||||||
EMEA: |
|
|
|
|
|
|
|
| |||||||
Third party |
| $ | 219,487 | |
| $ | 278,573 | |
| (59,086 | ) |
| (21.2 | ) | |
% of gross billings |
| 27.5 | % |
| 28.1 | % |
|
|
|
| |||||
% of revenue |
| 92.8 | % |
| 91.7 | % |
|
|
|
| |||||
Direct |
| $ | 50,620 | |
| $ | 44,267 | |
| 6,353 | |
| 14.4 | | |
% of gross billings and revenue |
| 14.6 | % |
| 14.0 | % |
|
|
|
| |||||
|
|
|
|
|
|
|
|
| |||||||
Rest of World: |
|
|
|
|
|
|
|
| |||||||
Third party |
| $ | 81,839 | |
| $ | 107,239 | |
| (25,400 | ) |
| (23.7 | ) | |
% of gross billings |
| 20.1 | % |
| 19.0 | % |
|
|
|
| |||||
% of revenue |
| 79.1 | % |
| 77.1 | % |
|
|
|
| |||||
Direct |
| $ | 309 | |
| $ | 956 | |
| (647 | ) |
| (67.7 | ) | |
% of gross billings and revenue |
| 1.5 | % |
| 5.1 | % |
|
|
|
| |||||
The percentages of gross profit by segment for the nine months ended September 30, 2016 and 2015 were as follows:
Q3 2016 YTD |
| Q3 2015 YTD |

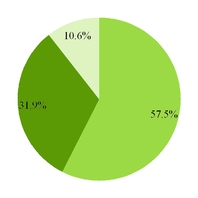
| North America |
|
| EMEA |
|
| Rest of World |
63
Gross profit by category and segment for the nine months ended September 30, 2016 and 2015 was as follows:
| North America |
| EMEA |
| Rest of World |
| Consolidated | ||||||||||||||||||||||||
| Nine Months Ended |
| Nine Months Ended |
| Nine Months Ended |
| Nine Months Ended | ||||||||||||||||||||||||
| 2016 |
| 2015 |
| 2016 |
| 2015 |
| 2016 |
| 2015 |
| 2016 |
| 2015 | ||||||||||||||||
| (in thousands) | ||||||||||||||||||||||||||||||
Local (1) : |
|
|
|
|
|
|
|
|
|
|
|
|
|
|
| ||||||||||||||||
Third party and other | $ | 475,703 | |
| $ | 441,148 | |
| $ | 169,579 | |
| $ | 213,914 | |
| $ | 56,155 | |
| $ | 73,296 | |
| $ | 701,437 | |
| $ | 728,358 | |
|
|
|
|
|
|
|
|
|
|
|
|
|
|
|
| ||||||||||||||||
Travel: |
|
|
|
|
|
|
|
|
|
|
|
|
|
|
| ||||||||||||||||
Third party | 49,303 | |
| 51,820 | |
| 31,881 | |
| 36,662 | |
| 11,199 | |
| 14,777 | |
| 92,383 | |
| 103,259 | | ||||||||
Total services | 525,006 | |
| 492,968 | |
| 201,460 | |
| 250,576 | |
| 67,354 | |
| 88,073 | |
| 793,820 | |
| 831,617 | | ||||||||
|
|
|
|
|
|
|
|
|
|
|
|
|
|
|
| ||||||||||||||||
Goods: |
|
|
|
|
|
|
|
|
|
|
|
|
|
|
| ||||||||||||||||
Third party | 5,201 | |
| 3,201 | |
| 18,027 | |
| 27,997 | |
| 14,485 | |
| 19,166 | |
| 37,713 | |
| 50,364 | | ||||||||
Direct | 104,571 | |
| 86,121 | |
| 50,620 | |
| 44,267 | |
| 309 | |
| 956 | |
| 155,500 | |
| 131,344 | | ||||||||
Total | 109,772 | |
| 89,322 | |
| 68,647 | |
| 72,264 | |
| 14,794 | |
| 20,122 | |
| 193,213 | |
| 181,708 | | ||||||||
|
|
|
|
|
|
|
|
|
|
|
|
|
|
|
| ||||||||||||||||
Total gross profit | $ | 634,778 | |
| $ | 582,290 | |
| $ | 270,107 | |
| $ | 322,840 | |
| $ | 82,148 | |
| $ | 108,195 | |
| $ | 987,033 | |
| $ | 1,013,325 | |
(1) | Includes gross profit from deals with local and national merchants and through local events. |
North America
The increase in North America gross profit was primarily attributable to the following:
• | the improvement in gross profit margins on direct revenue transactions in our Goods category as discussed above; |
• | an increase of $27.2 million in gross profit from other revenue transactions in our Local category, primarily attributable to commission revenue earned when customers make purchases with retailers using digital coupons accessed through our websites and mobile applications; and |
• | an increase of $7.4 million in gross profit from third party revenue transactions in our Local category. |
EMEA
The decrease in EMEA gross profit was primarily attributable to the following:
• | the decreases in third party and other revenue across all three of our categories; |
• | a reduction related to countries that we operated in during the prior year period and have subsequently exited as part of our restructuring plan and the disposition of our operations in Russia; and |
• | a $6.2 million unfavorable impact from year-over-year changes in foreign currency exchange rates. |
Rest of World
The decrease in Rest of World gross profit was primarily attributable to the following:
• | the decreases in third party and other revenue across all three of our categories; |
• | a $7.1 million unfavorable impact from year-over-year changes in foreign currency exchange rates; and |
• | a reduction related to countries that we operated in during the prior year period and have subsequently exited as part of our restructuring plan and dispositions of controlling stakes in our operations in India and Indonesia. |
Marketing
Marketing expense consists primarily of online marketing costs, such as search engine marketing, advertising on social networking sites and affiliate programs and, to a lesser extent, offline marketing costs such as television, radio and print advertising. Additionally, compensation expense for marketing employees is classified within marketing expense. We record these costs within "Marketing" on the consolidated statements of operations when incurred. From time to time, we offer deals with well-known national merchants for subscriber acquisition and customer activation purposes, for which the amount we owe the merchant for
64
each voucher sold exceeds the transaction price paid by the customer. Our gross billings from those transactions generate no third party revenue and our net cost (i.e., the excess of the amount owed to the merchant over the amount paid by the customer) is classified as marketing expense. We evaluate marketing expense as a percentage of gross billings and revenue because it gives us an indication of how well our marketing spend is driving gross billings and revenue growth.
Three Months Ended September 30, 2016 and 2015 :
Marketing expense by segment as a percentage of gross billings and as a percentage of segment revenue for the three months ended September 30, 2016 and 2015 was as follows:
|
| Three Months Ended September 30, | |||||||||||||||||||||||||
|
| 2016 |
| % of Gross Billings |
| % of Segment Revenue |
| 2015 |
| % of Gross Billings |
| % of Segment Revenue |
| $ Change |
| % Change | |||||||||||
|
| (dollars in thousands) | |||||||||||||||||||||||||
North America |
| $ | 62,861 | |
| 6.8 | % |
| 13.0 | % |
| $ | 35,336 | |
| 4.1 | % |
| 7.6 | % |
| $ | 27,525 | |
| 77.9 | % |
EMEA |
| 20,234 | |
| 5.5 | |
| 10.3 | |
| 21,690 | |
| 5.2 | |
| 10.9 | |
| (1,456 | ) |
| (6.7 | ) | |||
Rest of World |
| 4,763 | |
| 3.4 | |
| 11.7 | |
| 4,561 | |
| 2.5 | |
| 9.1 | |
| 202 | |
| 4.4 | | |||
Total marketing |
| $ | 87,858 | |
| 6.1 | |
| 12.2 | |
| $ | 61,587 | |
| 4.2 | |
| 8.6 | |
| $ | 26,271 | |
| 42.7 | |
The increase in total marketing expense resulted from our strategic initiative to invest in marketing to drive new customer acquisition. The incremental spending has primarily been focused on online marketing channels, such as search engine marketing, display and mobile advertising. In addition, we have increased our spend on offline activities such as radio and television advertising. We also increased our spending on affiliate programs that utilize third parties to promote our deals online.
For the full year 2016, we expect to incur between $130.0 million and $150.0 million of incremental marketing expense as compared to fiscal year 2015. We are currently focusing those incremental marketing investments primarily on our North America segment.
The percentages of marketing expense by segment for the three months ended September 30, 2016 and 2015 were as follows:
Q3 2016 |
| Q3 2015 |
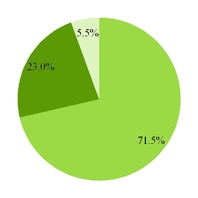
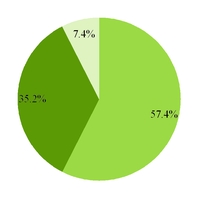
| North America |
|
| EMEA |
|
| Rest of World |
North America
The increase in North America marketing expense resulted from our strategic initiative to invest in marketing to drive new customer acquisition. In connection with this initiative, which commenced in November 2015, we have extended our return on investment thresholds for customer acquisition marketing spending to 12 - 18 months, as compared to approximately six months for prior periods. That incremental spending has primarily been focused on online marketing channels, such as search engine marketing, display and mobile advertising. In addition, we have increased our spend on offline activities such as radio advertising
65
and, beginning in the second quarter 2016, on television advertising. We also increased our spending on affiliate programs that utilize third parties to promote our deals online.
EMEA
The decrease in EMEA marketing expense resulted from a reduction related to countries that we operated in during the prior year period and have subsequently exited as part of our restructuring plan and the disposition of our operations in Russia. This decrease was also due to a $0.1 million favorable impact from year-over-year changes in foreign currency exchange rates.
Rest of World
The increase in Rest of World marketing expense was primarily attributable to a $0.1 million unfavorable impact from year-over-year changes in foreign currency exchange rates.
Nine Months Ended September 30, 2016 and 2015 :
Marketing expense by segment as a percentage of gross billings and as a percentage of segment revenue for the nine months ended September 30, 2016 and 2015 was as follows:
|
| Nine Months Ended September 30, | |||||||||||||||||||||||||
|
| 2016 |
| % of Gross Billings |
| % of Segment Revenue |
| 2015 |
| % of Gross Billings |
| % of Segment Revenue |
| $ Change |
| % Change | |||||||||||
|
| (dollars in thousands) | |||||||||||||||||||||||||
North America |
| $ | 198,423 | |
| 7.0 | % |
| 13.2 | % |
| $ | 100,095 | |
| 3.8 | % |
| 7.0 | % |
| $ | 98,328 | |
| 98.2 | % |
EMEA |
| 58,395 | |
| 5.1 | |
| 10.0 | |
| 54,537 | |
| 4.2 | |
| 8.8 | |
| 3,858 | |
| 7.1 | | |||
Rest of World |
| 12,798 | |
| 3.0 | |
| 10.4 | |
| 16,495 | |
| 2.8 | |
| 10.5 | |
| (3,697 | ) |
| (22.4 | ) | |||
Total marketing |
| $ | 269,616 | |
| 6.1 | |
| 12.2 | |
| $ | 171,127 | |
| 3.8 | |
| 7.8 | |
| $ | 98,489 | |
| 57.6 | |
The increase in total marketing expense resulted from our strategic initiative to invest in marketing to drive new customer acquisition. The incremental spending has primarily been focused on online marketing channels, such as search engine marketing, display and mobile advertising. In addition, we have increased our spend on offline activities such as radio advertising and, beginning in the second quarter 2016, on television advertising. We also increased our spending on affiliate programs that utilize third parties to promote our deals online.
The percentages of marketing expense by segment for the nine months ended September 30, 2016 and 2015 were as follows:
Q3 2016 YTD |
| Q3 2015 YTD |
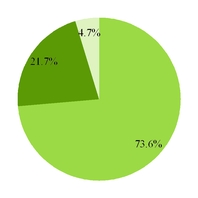
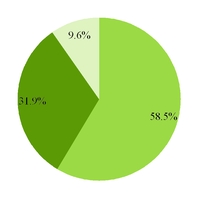
| North America |
|
| EMEA |
|
| Rest of World |
66
North America
The increase in North America marketing expense resulted from our strategic initiative to invest in marketing to drive new customer acquisition. In connection with this initiative, which commenced in November 2015, we have extended our return on investment thresholds for customer acquisition marketing spending to 12 - 18 months, as compared to approximately six months for prior periods. That incremental spending has primarily been focused on online marketing channels, such as search engine marketing, display and mobile advertising. In addition, we have increased our spend on offline activities such as radio advertising and, beginning in the second quarter 2016, on television advertising. We also increased our spending on affiliate programs that utilize third parties to promote our deals online.
EMEA
The increase in EMEA marketing expense resulted from our strategic initiative to invest in marketing to drive new customer acquisition. The incremental spending has primarily been focused on online marketing channels, such as search engine marketing, display and mobile advertising. The increase was partially offset by a reduction related to countries that we operated in during the prior year period and have subsequently exited as part of our restructuring plan, the disposition of our operations in Russia and a $0.4 million favorable impact from year-over-year changes in foreign currency exchange rates.
Rest of World
The decrease in Rest of World marketing expense was primarily attributable to a reduction related to countries that we operated in during the prior year period and have subsequently exited as part of our restructuring plan, dispositions of controlling stakes in our operations in India and Indonesia and a $0.5 million favorable impact from year-over-year changes in foreign currency exchange rates.
Selling, General and Administrative
Selling expenses reported within "Selling, general and administrative" on the consolidated statements of operations consist of sales commissions and other compensation expenses for sales representatives, as well as costs associated with supporting the sales function such as technology, telecommunications and travel. General and administrative expenses include compensation expense for employees involved in customer service, operations and technology and product development, as well as general corporate functions, such as finance, legal and human resources. Additional costs included in general and administrative include depreciation and amortization, rent, professional fees, litigation costs, travel and entertainment, recruiting, office supplies, maintenance, certain technology costs and other general corporate costs.
Selling, general and administrative expense ("SG&A") for the three months ended September 30, 2016 and 2015 was as follows:
Three Months Ended September 30, 2016 and 2015 :
|
| Three Months Ended September 30, | |||||||||||||
|
| 2016 |
| 2015 |
| $ Change |
| % Change | |||||||
|
| (dollars in thousands) | |||||||||||||
Selling, general and administrative |
| $ | 253,554 | |
| $ | 326,248 | |
| $ | (72,694 | ) |
| (22.3 | )% |
% of gross billings |
| 17.7 | % |
| 22.2 | % |
|
|
|
| |||||
% of revenue |
| 35.2 | % |
| 45.7 | % |
|
|
|
| |||||
The decrease in selling, general and administrative expense was primarily attributable to the following:
• | a $9.6 million reduction related to countries that we operated in during the prior year period and have subsequently exited as part of our restructuring plan, dispositions of controlling stakes in our operations in India and Indonesia and the disposition of our operations in Russia; |
• | a $21.1 million decrease in compensation-related costs in our ongoing markets due to headcount reductions as part of our restructuring plan; and |
• | a $37.5 million expense incurred in the prior year period relating to our securities litigation matter that has been subsequently settled. |
67
The favorable impact on selling, general and administrative expense due to year-over-year changes in foreign currency exchange rates was $2.4 million . SG&A as a percentage of gross billings and revenue for the three months ended September 30, 2016 decreased as compared to the prior year period.
We currently expect that SG&A costs will generally continue to decrease throughout the remainder of 2016 and during 2017 as a result of the cost savings from our restructuring program and other initiatives.
Nine Months Ended September 30, 2016 and 2015 :
SG&A for the nine months ended September 30, 2016 and 2015 was as follows:
|
| Nine Months Ended September 30, | |||||||||||||
|
| 2016 |
| 2015 |
| $ Change |
| % Change | |||||||
|
| (dollars in thousands) | |||||||||||||
Selling, general and administrative |
| $ | 811,710 | |
| $ | 904,816 | |
| $ | (93,106 | ) |
| (10.3 | )% |
% of gross billings |
| 18.5 | % |
| 19.9 | % |
|
|
|
| |||||
% of revenue |
| 36.8 | % |
| 41.1 | % |
|
|
|
| |||||
The decrease in selling, general and administrative expense was primarily attributable to the following:
• | a $32.6 million reduction related to countries that we operated in during the prior year period and have subsequently exited as part of our restructuring plan, dispositions of controlling stakes in our operations in India and Indonesia and the disposition of our operations in Russia; |
• | a $34.3 million decrease in compensation-related costs in our ongoing markets due to headcount reductions as part of our restructuring plan; and |
• | a $37.5 million expense incurred in the prior year period relating to our securities litigation matter. |
Those decreases were partially offset by increases in technology costs and facilities costs in our North America segment.
The favorable impact on selling, general and administrative expense due to year-over-year changes in foreign currency exchange rates was $11.3 million . SG&A as a percentage of gross billings and revenue for the nine months ended September 30, 2016 decreased as compared to the prior year period.
Gains on Business Dispositions
During the second quarter of 2016, we sold our subsidiary in Russia and our point of sale business in the U.S., resulting in gains of $8.9 million and $0.4 million , respectively. During the third quarter of 2016, we sold our subsidiary in Indonesia resulting in a gain of $2.1 million . See Note 2, "Discontinued Operations and Other Dispositions" for additional information.
Restructuring Charges
Restructuring charges represent severance and benefit costs for workforce reductions, impairments of long-lived assets and other exit costs resulting from our restructuring activities. See Note 9, "Restructuring," for information about our restructuring plan.
Income (Loss) from Operations
Three Months Ended September 30, 2016 and 2015 :
Income (loss) from operations for the three months ended September 30, 2016 and 2015 was as follows:
|
| Three Months Ended September 30, | |||||||||||||
|
| 2016 |
| 2015 |
| $ Change |
| % Change | |||||||
|
| (dollars in thousands) | |||||||||||||
Income (loss) from operations |
| $ | (26,685 | ) |
| $ | (70,423 | ) |
| $ | 43,738 | |
| 62.1 | % |
68
The decrease in our loss from operations was primarily attributable to the following:
• | a $72.7 million decrease in SG&A; and |
• | a $22.7 million decrease in restructuring charges. |
Those decreases were partially offset by the following:
• | a $26.3 million increase in marketing expense; |
• | a $14.8 million decrease in gross profit; and |
• | a reduction in gains on business dispositions of $11.7 million . |
Segment Operating Income
Segment operating income (loss) excludes stock-based compensation and acquisition-related expense (benefit), net. Segment operating income (loss) for the three months ended September 30, 2016 and 2015 was as follows:
|
| Three Months Ended September 30, | ||||||||||
|
| 2016 |
| 2015 |
| $ Change | ||||||
|
| (in thousands) | ||||||||||
North America (1) |
| $ | 245 | |
| $ | (30,912 | ) |
| $ | 31,157 | |
EMEA (1) |
| 3,881 | |
| 3,890 | |
| (9 | ) | |||
Rest of World (1) |
| (4,670 | ) |
| (6,905 | ) |
| 2,235 | | |||
(1) | Segment cost of revenue and operating expenses and segment operating income (loss) exclude stock-based compensation and acquisition-related (benefit) expense, net. This presentation corresponds to the measure of segment profit or loss that our chief operating decision-maker uses in assessing segment performance and making resource allocation decisions. The following table summarizes the our stock-based compensation expense and acquisition-related expense (benefit), net by reportable segment for the three months ended September 30, 2016 and 2015 (in thousands): |
|
| Three Months Ended September 30, | ||||||||||||||
|
| 2016 |
| 2015 | ||||||||||||
|
| Stock-based compensation |
| Acquisition-related |
| Stock-based compensation |
| Acquisition-related | ||||||||
North America |
| $ | 24,725 | |
| $ | (9 | ) |
| $ | 30,324 | |
| $ | 1,064 | |
EMEA |
| 298 | |
| - | |
| 3,441 | |
| - | | ||||
Rest of World |
| 1,419 | |
| - | |
| 1,810 | |
| - | | ||||
Consolidated |
| $ | 26,442 | |
| $ | (9 | ) |
| $ | 35,575 | |
| $ | 1,064 | |
The decrease in our North America segment operating loss was primarily due to a decrease in SG&A, which included a $37.5 million increase in the prior year period to the litigation accrual for our securities litigation matter that has subsequently been settled, partially offset by increased marketing expense. EMEA segment operating income (loss) was comparable to the prior year period. The decrease in our Rest of World segment operating loss was due to a gain from a business disposition. See Note 13, "Segment Information" for a reconciliation of segment operating income (loss) information by reportable segment to consolidated net income (loss) for the three months ended September 30, 2016 and 2015 .
69
Nine Months Ended September 30, 2016 and 2015 :
Income (loss) from operations for the nine months ended September 30, 2016 and 2015 was as follows:
|
| Nine Months Ended September 30, | |||||||||||||
|
| 2016 |
| 2015 |
| $ Change |
| % Change | |||||||
|
| (dollars in thousands) | |||||||||||||
Income (loss) from operations |
| $ | (117,187 | ) |
| $ | (74,354 | ) |
| $ | (42,833 | ) |
| (57.6 | )% |
The increase in our loss from operations was primarily attributable to the following:
• | a $98.5 million increase in marketing expense; |
• | a $26.3 million decrease in gross profit; |
• | a $5.8 million increase in restructuring charges; |
• | a $3.0 million increase in acquisition-related expense (benefit), net primarily relating to changes in the fair value of contingent consideration; and |
• | a reduction in gains on business dispositions of $2.3 million . |
Those increases were partially offset by a $93.1 million decrease in SG&A.
Segment Operating Income
Segment operating income (loss) excludes stock-based compensation and acquisition-related expense (benefit), net. Segment operating income (loss) for the nine months ended September 30, 2016 and 2015 was as follows:
|
| Nine Months Ended September 30, | ||||||||||
|
| 2016 |
| 2015 |
| $ Change | ||||||
|
| (in thousands) | ||||||||||
North America (1) |
| $ | (9,715 | ) |
| $ | 20,623 | |
| $ | (30,338 | ) |
EMEA (1) |
| 13,554 | |
| 33,211 | |
| (19,657 | ) | |||
Rest of World (1) |
| (22,642 | ) |
| (17,845 | ) |
| (4,797 | ) | |||
(1) | Segment cost of revenue and operating expenses and segment operating income (loss) exclude stock-based compensation and acquisition-related (benefit) expense, net. This presentation corresponds to the measure of segment profit or loss that our chief operating decision-maker uses in assessing segment performance and making resource allocation decisions. The following table summarizes the our stock-based compensation expense and acquisition-related expense (benefit), net by reportable segment for the nine months ended September 30, 2016 and 2015 (in thousands): |
|
| Nine Months Ended September 30, | ||||||||||||||
|
| 2016 |
| 2015 | ||||||||||||
|
| Stock-based compensation |
| Acquisition-related |
| Stock-based compensation |
| Acquisition-related | ||||||||
North America |
| $ | 83,668 | |
| $ | 4,305 | |
| $ | 95,607 | |
| $ | 1,300 | |
EMEA |
| 6,153 | |
| - | |
| 8,881 | |
| - | | ||||
Rest of World |
| 4,929 | |
| - | |
| 4,716 | |
| - | | ||||
Consolidated |
| $ | 94,750 | |
| $ | 4,305 | |
| $ | 109,204 | |
| $ | 1,300 | |
The decrease in our North America segment was primarily due to increased marketing expense, partially offset by a decrease in SG&A. In the prior year period, SG&A included a $37.5 million increase to the litigation accrual for our securities litigation matter that has subsequently been settled. The decreases in our EMEA and Rest of World segments were due to decreases in segment gross profit, partially offset by decreases in segment operating expenses and gains on business dispositions. See Note 13, "Segment Information" for a reconciliation of segment operating income (loss) information by reportable segment to consolidated net income (loss) for the nine months ended September 30, 2016 and 2015 .
70
Other Income (Expense), Net
Other income (expense), net includes interest income, interest expense, gains and losses on fair value option investments, impairments of investments, and foreign currency gains and losses, primarily resulting from intercompany balances with our subsidiaries that are denominated in foreign currencies.
Three Months Ended September 30, 2016 and 2015 :
Other income (expense), net for the three months ended September 30, 2016 and 2015 was as follows:
|
| Three Months Ended September 30, | |||||||||||||
|
| 2016 |
| 2015 |
| $ Change |
| % Change | |||||||
|
| (dollars in thousands) | |||||||||||||
Other income (expense), net |
| $ | (7,028 | ) |
| $ | (8,160 | ) |
| $ | 1,132 | |
| 13.9 | % |
Other income (expense), net for the three months ended September 30, 2016 included $5.8 million of interest expense and $1.6 million of losses on fair value option investments. Interest expense increased by $5.0 million for the three months ended September 30, 2016 , as compared to the prior year period, due to our issuance of convertible notes in April 2016 (See Note 6, " Financing Arrangements ").
Other income (expense), net for the three months ended September 30, 2015 included $5.2 million in foreign currency transaction losses and $2.6 million in losses on changes in the fair value of investments. The foreign currency transaction losses primarily resulted from intercompany balances with our subsidiaries that are denominated in foreign currencies.
Nine Months Ended September 30, 2016 and 2015 :
Other income (expense), net for the nine months ended September 30, 2016 and 2015 was as follows:
|
| Nine Months Ended September 30, | |||||||||||||
|
| 2016 |
| 2015 |
| $ Change |
| % Change | |||||||
|
| (dollars in thousands) | |||||||||||||
Other income (expense), net |
| $ | (14,303 | ) |
| $ | (25,146 | ) |
| $ | 10,843 | |
| 43.1 | % |
Other income (expense), net for the nine months ended September 30, 2016 included $11.8 million of interest expense and $7.3 million of losses on fair value option investments, partially offset by $5.1 million in foreign currency transaction gains and a $0.3 million net cumulative translation gain that was reclassified to earnings for countries that we exited as part of our restructuring plan. Interest expense increased by $9.8 million for the nine months ended September 30, 2016 , as compared to the prior year period, due to our issuance of convertible notes in April 2016 (see Note 6, " Financing Arrangements "). The foreign currency transaction gains primarily resulted from intercompany balances with our subsidiaries that are denominated in foreign currencies. The foreign currency gains on those intercompany balances were primarily driven by the appreciation of the Euro against the U.S. dollar from an exchange rate of 1.0913 on December 31, 2015 to 1.1175 on September 30, 2016 .
Other income (expense), net for the nine months ended September 30, 2015 included $17.7 million in foreign currency transaction losses and a $4.4 million loss related to the cumulative translation adjustment for our legacy business in the Republic of Korea that was reclassified to earnings as a result of the Ticket Monster disposition. The foreign currency transaction losses primarily resulted from intercompany balances with our subsidiaries that are denominated in foreign currencies. The foreign currency losses on those intercompany balances were primarily driven by the significant decline of the Euro against the U.S. dollar from an exchange rate of 1.2152 on December 31, 2014 to 1.1210 on September 30, 2015.
71
Provision (Benefit) for Income Taxes
Three Months Ended September 30, 2016 and 2015 :
Provision (benefit) for income taxes for the three months ended September 30, 2016 and 2015 was as follows:
|
| Three Months Ended September 30, | |||||||||||||
|
| 2016 |
| 2015 |
| $ Change |
| % Change | |||||||
|
| (dollars in thousands) | |||||||||||||
Provision (benefit) for income taxes |
| $ | 2,079 | |
| $ | (53,970 | ) |
| $ | 56,049 | |
| 103.9 | % |
Effective tax rate |
| (6.2 | )% |
| 68.7 | % |
|
|
|
| |||||
The pre-tax losses incurred by our operations in jurisdictions that have valuation allowances against their net deferred tax assets, including the United States, was the primary factor impacting our effective tax rate for the three months ended September 30, 2016 . Significant factors impacting our effective tax rate for the three months ended September 30, 2015 included pre-tax losses incurred by our operations in certain foreign jurisdictions that had valuation allowances against their net deferred tax assets and amortization of the tax effects of intercompany sales of intellectual property.
Nine Months Ended September 30, 2016 and 2015 :
Provision (benefit) for income taxes for the nine months ended September 30, 2016 and 2015 was as follows:
|
| Nine Months Ended September 30, | |||||||||||||
|
| 2016 |
| 2015 |
| $ Change |
| % Change | |||||||
|
| (dollars in thousands) | |||||||||||||
Provision (benefit) for income taxes |
| $ | 1,629 | |
| $ | (42,881 | ) |
| $ | 44,510 | |
| 103.8 | % |
Effective tax rate |
| (1.2 | )% |
| 43.1 | % |
|
|
|
| |||||
The pre-tax losses incurred by our operations in jurisdictions that have valuation allowances against their net deferred tax assets, including the United States, was the primary factor impacting our effective tax rate for the nine months ended September 30, 2016 . Significant factors impacting our effective tax rate for the nine months ended September 30, 2015 included pre-tax losses incurred by our operations in certain foreign jurisdictions that had valuation allowances against their net deferred tax assets and amortization of the tax effects of intercompany sales of intellectual property.
We expect that our consolidated effective tax rate in future periods will continue to differ significantly from the U.S. federal income tax rate as a result of our tax obligations in jurisdictions with profits and valuation allowances in jurisdictions with losses.
We are currently undergoing income tax audits in multiple jurisdictions. There are many factors, including factors outside of our control, which influence the progress and completion of these audits. As of September 30, 2016 , we believe that it is reasonably possible that changes of up to $24.9 million in unrecognized tax benefits may occur within the next 12 months.
Income (Loss) from Discontinued Operations
In May 2015, we sold a controlling stake in Ticket Monster and the results of that entity have been presented as discontinued operations for the three and nine months ended September 30, 2015 . See Note 2, "Discontinued Operations and Other Dispositions," for additional information.
72
Non-GAAP Financial Measures
In addition to financial results reported in accordance with U.S. GAAP, we have provided the following non-GAAP financial measures: Adjusted EBITDA, free cash flow and foreign exchange rate neutral operating results. These non-GAAP financial measures, which are presented on a continuing operations basis, are intended to aid investors in better understanding our current financial performance and prospects for the future as seen through the eyes of management. We believe that these non-GAAP financial measures facilitate comparisons with our historical results and with the results of peer companies who present similar measures (although other companies may define non-GAAP measures differently than we define them, even when similar terms are used to identify such measures). However, these non-GAAP financial measures are not intended to be a substitute for those reported in accordance with U.S. GAAP.
Adjusted EBITDA . Adjusted EBITDA is a non-GAAP performance measure that we define as net income (loss) from continuing operations excluding income taxes, interest and other non-operating items, depreciation and amortization, stock-based compensation, acquisition-related expense (benefit), net and items that are unusual in nature or infrequently occurring. Our definition of Adjusted EBITDA may differ from similar measures used by other companies, even when similar terms are used to identify such measures. Adjusted EBITDA is a key measure used by our management and Board of Directors to evaluate operating performance, generate future operating plans and make strategic decisions for the allocation of capital. Accordingly, we believe that Adjusted EBITDA provides useful information to investors and others in understanding and evaluating our operating results in the same manner as our management and Board of Directors.
We exclude stock-based compensation expense and depreciation and amortization because they are primarily non-cash in nature, and we believe that non-GAAP financial measures excluding these items provide meaningful supplemental information about our operating performance and liquidity. Acquisition-related expense (benefit), net is comprised of the change in the fair value of contingent consideration arrangements and external transaction costs related to business combinations, primarily consisting of legal and advisory fees. The composition of our contingent consideration arrangements and the impact of those arrangements on our operating results vary over time based on a number of factors, including the terms of our business combinations and the timing of those transactions. For the three and nine months ended September 30, 2016 and 2015, items that we believe to be unusual in nature or infrequently occurring included gains from business dispositions and charges related to our restructuring plan. For the three and nine months ended September 30, 2015, items that we believe to be unusual in nature or infrequently occurring also included the write-off of a prepaid asset related to a marketing program that was discontinued because the counterparty ceased operations and the expense related to a significant increase in the contingent liability for our securities litigation matter. We exclude items that are unusual in nature or infrequently occurring from Adjusted EBITDA because we believe that excluding those items provides meaningful supplemental information about our core operating performance and facilitates comparisons with our historical results.
The following is a reconciliation of Adjusted EBITDA to the most comparable U.S. GAAP financial measure, " Income (loss) from continuing operations " for the three and nine months ended September 30, 2016 and 2015 (in thousands):
|
| Three Months Ended September 30, |
| Nine Months Ended September 30, | ||||||||||||
|
| 2016 |
| 2015 |
| 2016 |
| 2015 | ||||||||
Income (loss) from continuing operations |
| $ | (35,792 | ) |
| $ | (24,613 | ) |
| $ | (133,119 | ) |
| $ | (56,619 | ) |
Adjustments: |
|
|
|
|
|
|
|
| ||||||||
Stock-based compensation (1) |
| 26,176 | |
| 35,432 | |
| 89,396 | |
| 109,043 | | ||||
Depreciation and amortization |
| 33,253 | |
| 35,635 | |
| 102,340 | |
| 99,207 | | ||||
Acquisition-related expense, net |
| (9 | ) |
| 1,064 | |
| 4,305 | |
| 1,300 | | ||||
Gains on business dispositions |
| (2,060 | ) |
| (13,710 | ) |
| (11,399 | ) |
| (13,710 | ) | ||||
Restructuring charges |
| 1,459 | |
| 24,146 | |
| 29,988 | |
| 24,146 | | ||||
Prepaid marketing write-off |
| - | |
| 6,690 | |
| - | |
| 6,690 | | ||||
Securities litigation expense |
| - | |
| 37,500 | |
| - | |
| 37,500 | | ||||
Other (income) expense, net |
| 7,028 | |
| 8,160 | |
| 14,303 | |
| 25,146 | | ||||
Provision (benefit) for income taxes |
| 2,079 | |
| (53,970 | ) |
| 1,629 | |
| (42,881 | ) | ||||
Total adjustments |
| 67,926 | |
| 80,947 | |
| 230,562 | |
| 246,441 | | ||||
Adjusted EBITDA |
| $ | 32,134 | |
| $ | 56,334 | |
| $ | 97,443 | |
| $ | 189,822 | |
73
(1) | Represents stock-based compensation expense recorded within "Selling, general and administrative," "Cost of revenue," and "Marketing." "Other (income) expense, net," includes $0.3 million of additional stock-based compensation for three months ended September 30, 2016 . "Restructuring charges" and "Other (income) expense, net," includes $4.7 million and $0.7 million of additional stock-based compensation for the nine months ended September 30, 2016 , respectively. "Other (income) expense, net," includes $0.1 million and $0.2 million of additional stock-based compensation for the three and nine months ended September 30, 2015 , respectively. |
Free cash flow. Free cash flow is a non-GAAP financial measure that comprises net cash provided by operating activities from continuing operations less purchases of property and equipment and capitalized software from continuing operations. We use free cash flow to conduct and evaluate our business because although it is similar to cash flow from continuing operations, we believe that it typically represents a more useful measure of cash flows because purchases of fixed assets, software developed for internal use and website development costs are necessary components of our ongoing operations. Due to the impact of seasonality on our cash flows, we also use trailing twelve months free cash flow to conduct and evaluate our business. Free cash flow is not intended to represent the total increase or decrease in our cash balance for the applicable period.
Free cash flow has limitations due to the fact that it does not represent the residual cash flow available for discretionary expenditures. For example, free cash flow does not include the cash payments for business acquisitions. In addition, free cash flow reflects the impact of the timing difference between when we are paid by customers and when we pay merchants and suppliers. Therefore, we believe it is important to view free cash flow as a complement to our entire condensed consolidated statements of cash flows.
The following is a reconciliation of free cash flow to the most comparable U.S. GAAP financial measure, " Net cash provided by (used in) operating activities from continuing operations," for the three and nine months ended September 30, 2016 and 2015 and trailing twelve months ended September 30, 2016 and 2015 (in thousands):
|
| Three Months Ended |
| Nine Months Ended |
| Trailing Twelve Months Ended September 30, | ||||||||||||||||||
|
| 2016 |
| 2015 (1) |
| 2016 |
| 2015 (1) |
| 2016 |
| 2015 (1) | ||||||||||||
Net cash provided by (used in) operating activities from continuing operations |
| $ | (40,822 | ) |
| $ | (7,640 | ) |
| $ | (171,557 | ) |
| $ | 49,292 | |
| $ | 78,898 | |
| $ | 325,971 | |
Purchases of property and equipment and capitalized software from continuing operations |
| (12,868 | ) |
| (27,735 | ) |
| (49,215 | ) |
| (68,481 | ) |
| (64,722 | ) |
| (88,598 | ) | ||||||
Free cash flow |
| $ | (53,690 | ) |
| $ | (35,375 | ) |
| $ | (220,772 | ) |
| $ | (19,189 | ) |
| $ | 14,176 | |
| $ | 237,373 | |
|
|
|
|
|
|
|
|
|
|
|
|
| ||||||||||||
Net cash provided by (used in) investing activities from continuing operations |
| $ | (12,088 | ) |
| $ | (98,028 | ) |
| $ | (51,719 | ) |
| $ | (146,012 | ) |
| $ | (82,957 | ) |
| $ | (181,187 | ) |
Net cash provided by (used in) financing activities |
| $ | (38,342 | ) |
| $ | (14,793 | ) |
| $ | 52,868 | |
| $ | (192,188 | ) |
| $ | (270,729 | ) |
| $ | (216,683 | ) |
(1) | We adopted the guidance in ASU 2016-09 on January 1, 2016. ASU 2016-09 requires that all income tax-related cash flows resulting from share-based payments be reported as operating activities in the statement of cash flows. Previously, income tax benefits at settlement of an award were reported as a reduction to operating cash flows and an increase to financing cash flows to the extent that those benefits exceeded the income tax benefits reported in earnings during the award's vesting period. We elected to apply that change in cash flow classification on a retrospective basis, which has resulted in a decrease to net cash provided by (used in) operating activities, net cash used in financing activities and free cash flow of $0.03 million for the three-month period ended September 30, 2015 , and increases to net cash provided by (used in) operating activities, net cash used in financing activities and free cash flow of $6.2 million and $9.6 million , for the nine -month and trailing twelve-month periods ended September 30, 2015 , respectively. |
Foreign exchange rate neutral operating results. Foreign exchange rate neutral operating results show current period operating results as if foreign currency exchange rates had remained the same as those in effect in the prior year period. These measures are intended to facilitate comparisons to our historical performance. For a reconciliation of foreign exchange rate neutral operating results to the most comparable U.S. GAAP financial measure, see " Results of Operations " above.
Liquidity and Capital Resources
As of September 30, 2016 , we had $689.7 million in cash and cash equivalents, which primarily consisted of cash and government money market funds.
74
Since our inception, we have funded our working capital requirements and expansion primarily with cash flows provided by operations and through public and private sales of common and preferred stock, which yielded aggregate net proceeds of approximately $1,857.1 million. In connection with our third party and direct revenue sales transactions, we collect cash from credit card payment processors shortly after a sale occurs and remit payment to merchants and inventory suppliers at a later date in accordance with the related contractual payment terms. We expect this favorable working capital cycle to continue for the foreseeable future. In April 2016, we issued 3.25% senior convertible notes due 2020 (the "Notes") with an aggregate principal amount of $250.0 million. See Note 6, "Financing Arrangements," for additional information.
Our merchant arrangements are structured as either a redemption payment model or a fixed payment model defined as follows:
Redemption payment model - We typically pay our merchants upon redemption for the majority of third party offerings available through our online marketplaces in our EMEA and Rest of World segments. Under our redemption merchant payment model, we collect payments at the time customers purchase vouchers and make payments to merchants at a subsequent date. Using this payment model, merchants are not paid until the customer redeems the voucher that has been purchased. If a customer does not redeem the voucher under this payment model, we retain all of the gross billings from the unredeemed voucher. The redemption model generally improves our overall cash flow because we do not pay our merchants until the customer redeems the voucher.
Fixed payment model - We typically pay merchants under the fixed payment model for a majority of offerings available through our online marketplace in North America. Under the fixed payment model, merchants are paid regardless of whether the voucher is redeemed. For third party revenue deals in which the merchant has a continuous presence on our websites and mobile applications by offering deals for an extended period of time, which currently represents a substantial majority of our third party offerings in North America, we remit payments to the merchant on an ongoing basis, generally bi-weekly, throughout the term of the offering. For product offerings in our Goods category, payment terms with inventory suppliers across our three segments typically range from net 30 days to net 60 days.
We experience fluctuations in accrued merchant and supplier payables associated with our revenue-generating activities, including both third party and direct revenue sales transactions, that can cause volatility in working capital levels and impact cash balances more or less than our operating income or loss would indicate. Revenue from our Goods category has grown in recent periods, both in absolute dollars and as a percentage of the Company's overall revenue. This category has lower margins than our Local category, primarily as a result of shipping and fulfillment costs on direct revenue transactions. As a result of those lower margins, the amount of cash that we ultimately retain from direct revenue transactions in our Goods category after paying the related inventory, shipping and fulfillment costs is less than the amount that we ultimately retain from third party revenue transactions in our Local category after paying the merchant's share. However, the impact of transactions in our Goods category on our operating cash flows varies from period to period. For example, the cash flows from transactions in that category are impacted by seasonality, with strong cash inflows typically generated during the fourth quarter holiday season followed by subsequent cash outflows in the following period when payments are made to suppliers of the merchandise.
We generally use our cash flows to fund our operations, make acquisitions, purchase capital assets, purchase stock under our share repurchase program and meet our other cash operating needs. Cash flow used in operations was $171.6 million for the nine months ended September 30, 2016 and cash flow provided by operations, including discontinued operations, was $12.7 million for the nine months ended September 30, 2015 . We expect that our cash flow from operations for fiscal 2016 will be significantly lower than in prior years due to the cash outflows resulting from our incremental marketing expenses, the impact of our restructuring actions (see Note 9, " Restructuring ") and the settlement of our securities litigation matter (see Note 7, " Commitments and Contingencies ").
We consider the undistributed earnings of our foreign subsidiaries as of September 30, 2016 to be indefinitely reinvested and, accordingly, no U.S. income taxes have been provided thereon. As of September 30, 2016 , the amount of cash and cash equivalents held in foreign jurisdictions was approximately $221.3 million . We have not, nor do we anticipate the need to, repatriate funds to the United States to satisfy domestic liquidity needs arising in the ordinary course of business.
In April 2016, we received net proceeds of $243.2 million from the issuance of the Notes. We will use the proceeds from the Notes for general corporate purposes, including repurchases of shares of our Class A common stock. Additionally, we entered into note hedge and warrant transactions with certain bank counterparties that are designed to offset, in part, the potential dilution from conversion of the Notes. See Note 6, "Financing Arrangements," for additional information.
In June 2016, we amended and restated our senior secured revolving credit agreement (the "Amended and Restated Credit Agreement") that provides for aggregate principal borrowings of up to $250.0 million and matures in June 2019. The Amended and Restated Credit Agreement replaced our previous $250.0 million credit agreement that was scheduled to mature in August
75
2017 (the "Original Credit Agreement"). As of September 30, 2016 and December 31, 2015 , we had no borrowings under the Amended and Restated Credit Agreement or the Original Credit Agreement, respectively, and were in compliance with all covenants. See Note 6, "Financing Arrangements," for additional information.
Although we can provide no assurances, we believe that our available cash and cash equivalents balance and cash generated from operations should be sufficient to meet our working capital requirements and other capital expenditures for at least the next twelve months.
Uses of Cash
In order to support our current and future expansion, we expect to continue to make significant investments in our technology platforms and business processes, as well as internal tools aimed at improving the efficiency of our operations. We will also continue to invest in sales and marketing as we seek to increase deal coverage, improve the quality of active deals and increase the volume of transactions through our marketplaces.
In April 2016, we deposited $39.5 million in an escrow account in connection with the preliminary court approval of the settlement for our securities litigation matter (See Note 7, "Commitments and Contingencies"). The $5.5 million remaining settlement amount for this matter was funded by our insurance carrier. Final court approval of the settlement was granted on July 13, 2016.
The Board previously authorized us to repurchase up to $500.0 million of our Class A common stock through August 2017 under our share repurchase program. On April 4, 2016, the Board approved an increase of $200.0 million to our share repurchase program and an extension of the program through April 2018. During the three and nine months ended September 30, 2016 , we purchased 5,213,778 and 30,829,948 shares of Class A common stock, respectively, for an aggregate purchase price of $24.6 million and $112.5 million (including fees and commissions), respectively, under the share repurchase program. As of September 30, 2016 , up to $244.7 million of Class A common stock remained available for purchase under that program. The timing and amount of any share repurchases are determined based on market conditions, share price and other factors, and the programs may be discontinued or suspended at any time. Repurchases will be made in compliance with SEC rules and other legal requirements and may be made, in part, under a Rule 10b5-1 plan, which permits share repurchases when the Company might otherwise be precluded from doing so.
We currently plan to use our cash and cash equivalents and cash flows generated from our operations to fund share repurchases, strategic minority investments, business acquisitions and other transactions and investments in technology and marketing. Additionally, we have the ability to borrow funds under our Amended and Restated Credit Agreement, as described above. We could also seek to raise additional financing, if available on terms that we believe are favorable, to increase the amount of liquid funds that we can access for share repurchases, future acquisitions or other strategic investment opportunities.
76
Cash Flow
Our net cash flows from operating, investing and financing activities for the nine months ended September 30, 2016 and 2015 were as follows:
|
| Nine Months Ended September 30, | ||||||||||
|
| 2016 |
| 2015 (1) |
| $ Change | ||||||
|
| (in thousands) | ||||||||||
Cash provided by (used in): |
|
|
|
|
|
| ||||||
Operating activities from continuing operations |
| $ | (171,557 | ) |
| $ | 49,292 | |
| $ | (220,849 | ) |
Operating activities from discontinued operations |
| - | |
| (36,578 | ) |
| 36,578 | | |||
Operating activities |
| (171,557 | ) |
| 12,714 | |
| (184,271 | ) | |||
Investing activities from continuing operations |
| (51,719 | ) |
| (146,012 | ) |
| 94,293 | | |||
Investing activities from discontinued operations |
| - | |
| 244,470 | |
| (244,470 | ) | |||
Investing activities |
| (51,719 | ) |
| 98,458 | |
| (150,177 | ) | |||
Financing activities |
| 52,868 | |
| (192,188 | ) |
| 245,056 | | |||
Effect of exchange rate changes on cash and cash equivalents, including cash classified within current assets held for sale |
| 6,793 | |
| (27,338 | ) |
| 34,131 | | |||
Net increase (decrease) in cash and cash equivalents, including cash classified within current assets held for sale |
| (163,615 | ) |
| (108,354 | ) |
| (55,261 | ) | |||
Less: Net increase (decrease) in cash classified within current assets held for sale |
| - | |
| (55,279 | ) |
| 55,279 | | |||
Net increase (decrease) in cash and cash equivalents |
| $ | (163,615 | ) |
| $ | (53,075 | ) |
| $ | (110,540 | ) |
(1) | We adopted the guidance in ASU 2016-09 on January 1, 2016. ASU 2016-09 requires that all income tax-related cash flows resulting from share-based payments be reported as operating activities in the statement of cash flows. Previously, income tax benefits at settlement of an award were reported as a reduction to operating cash flows and an increase to financing cash flows to the extent that those benefits exceeded the income tax benefits reported in earnings during the award's vesting period. We elected to apply that change in cash flow classification on a retrospective basis, which has resulted in an increase of $6.2 million to net cash provided by operating activities and net cash used in financing activities for the nine-month period ended September 30, 2015 . |
Cash Provided by (Used in) Operating Activities
Cash provided by (used in) operating activities primarily consists of our net loss adjusted for certain items, including depreciation and amortization, stock-based compensation, restructuring charges, deferred income taxes and the effect of changes in working capital and other items.
For the nine months ended September 30, 2016 , our net cash used in operating activities from continuing operations was $171.6 million , which resulted from the following:
• | a $234.0 million net decrease related to changes in working capital and other assets and liabilities. That net decrease primarily resulted from a $171.8 million decrease in accrued merchant and supplier payables due to the timing of payments to suppliers of merchandise and the seasonally high levels of Goods transactions in the fourth quarter of 2015. The net decrease was also impacted by a $39.5 million payment to fund our securities litigation settlement. |
• | a $133.1 million net loss from continuing operations, which included $30.0 million of restructuring charges. |
These items were partially offset by a $195.6 million net increase for certain non-cash items, primarily consisting of depreciation and amortization and stock-based compensation.
For the nine months ended September 30, 2015 , our net cash provided by operating activities from continuing operations was $49.3 million , which was driven by a $181.6 million net increase for certain non-cash items, primarily consisting of depreciation and amortization and stock-based compensation, partially offset by a $56.6 million net loss from continuing operations and a $75.7 million net decrease related to changes in working capital.
For the nine months ended September 30, 2015 net cash used in operating activities from discontinued operations was $36.6 million , which primarily consisted of a $166.6 million net decrease for certain non-cash items, partially offset by $133.5
77
million of net income from discontinued operations. Non-cash items primarily consisted of the pre-tax gain of $202.2 million on the disposition of Ticket Monster, partially offset by $23.6 million in deferred income taxes, $6.3 million of amortization expense related to acquired intangible assets and $5.3 million of stock-based compensation expense.
Cash Provided by (Used in) Investing Activities
Cash flows provided by (used in) investing activities primarily consists of capital expenditures, acquisitions and dispositions of businesses and minority investments.
For the nine months ended September 30, 2016 , our net cash used in investing activities from continuing operations of $51.7 million primarily consisted of $49.2 million in capital expenditures, including capitalized internally-developed software.
For the nine months ended September 30, 2015 , our net cash used in investing activities from continuing operations of $146.0 million primarily consisted of $70.1 million in net cash paid for acquisitions and $68.5 million in capital expenditures, including capitalized internally-developed software.
Cash Provided by (Used in) Financing Activities
Cash flows provided by (used in) financing activities primarily consists of proceeds from the issuance of convertible senior notes, payments for issuance costs related to the convertible senior notes and the amended and restated revolving credit agreement, payments for the purchase of convertible note hedges, proceeds from the issuance of warrants, payments for purchases of treasury stock, taxes paid related to net share settlements of stock-based compensation awards, proceeds from stock option exercises and our employee stock purchase plan, distributions to noncontrolling interest holders and payments of capital lease obligations.
For the nine months ended September 30, 2016 , our net cash provided by financing activities of $52.9 million was driven by the following:
• | proceeds from issuance of the Notes of $250.0 million ; |
• | payments for the purchase of convertible note hedges of $59.2 million ; |
• | proceeds from the issuance of warrants of $35.5 million ; |
• | purchases of Class A common stock under our share repurchase programs of $115.6 million ; |
• | payments of capital lease obligations of $22.0 million ; and |
• | taxes paid related to net share settlements of stock-based compensation awards of $23.3 million . |
For the nine months ended September 30, 2015 , our net cash used in financing activities of $192.2 million was driven primarily by the following:
• | purchases of Class A common stock under our share repurchase program of $329.4 million ; |
• | taxes paid related to net share settlements of stock-based compensation awards of $34.5 million ; and |
• | payments of capital lease obligations of $17.7 million . |
These payments were partially offset by $195.0 million of borrowings under our revolving credit facility.
Free Cash Flow
Free cash flow is a non-GAAP financial measure that comprises net cash provided by operating activities from continuing operations less purchases of property and equipment and capitalized software from continuing operations. Free cash flow for the six months and trailing twelve months ended September 30, 2016 and 2015 were as follows:
|
| Nine Months Ended September 30, | |||||||||||||
|
| 2016 |
| 2015 (1) |
| $ Change |
| % Change | |||||||
|
| (dollars in thousands) | |||||||||||||
Free cash flow |
| $ | (220,772 | ) |
| $ | (19,189 | ) |
| $ | (201,583 | ) |
| (1,050.5 | )% |
Free cash flow TTM |
| $ | 14,176 | |
| $ | 237,373 | |
| $ | (223,197 | ) |
| (94.0 | )% |
(1) | We adopted the guidance in ASU 2016-09 on January 1, 2016. ASU 2016-09 requires that all income tax-related cash flows resulting from share-based payments be reported as operating activities in the statement of cash flows. Previously, income tax benefits at settlement of an award were reported as a |
78
reduction to operating cash flows and an increase to financing cash flows to the extent that those benefits exceeded the income tax benefits reported in earnings during the award's vesting period. We elected to apply that change in cash flow classification on a retrospective basis, which has resulted in increases of $6.2 million and $9.6 million to free cash flow for the nine -month and trailing twelve-month periods ended September 30, 2015 , respectively.
The decrease in free cash flow for the nine months ended September 30, 2016 was primarily due to a $220.8 million decrease in our operating cash flows from continuing operations.
The decrease in free cash flow for the trailing twelve months ended September 30, 2016 was due to a $247.1 million decrease in our trailing twelve months operating cash flows from continuing operations.
For further information and a reconciliation to the most applicable financial measure under U.S. GAAP, refer to our discussion under " Non-GAAP Financial Measures " above.
79
Contractual Obligations and Commitments
Our contractual obligations and commitments as of September 30, 2016 did not materially change from the amounts set forth in our 2015 Annual Report on Form 10-K.
Off-Balance Sheet Arrangements
We did not have any off-balance sheet arrangements as of September 30, 2016 .
80
Critical Accounting Policies and Estimates
The preparation of consolidated financial statements requires management to make estimates and assumptions that affect the reported amounts and classifications of assets and liabilities, revenue and expenses, and related disclosures of contingent liabilities. Management bases its estimates on historical experience and on various other assumptions that are believed to be reasonable under the circumstances, the results of which form the basis for making judgments about the carrying values of assets and liabilities that are not readily apparent from other sources. Actual results may differ from these estimates under different assumptions or conditions.
Management's Discussion and Analysis of Financial Condition and Results of Operations is based upon our condensed consolidated financial statements, which have been prepared in accordance with U.S. GAAP. Our significant accounting policies are discussed in Note 2, " Summary of Significant Accounting Policies, " in the notes to the consolidated financial statements included in our 2015 Annual Report on Form 10-K for the year ended December 31, 2015 , as filed with the SEC on February 11, 2016. In addition, refer to the critical accounting policies and estimates under Part II, Item 7, "Management's Discussion and Analysis of Financial Condition and Results of Operations" in our 2015 Annual Report on Form 10-K for the year ended December 31, 2015 , and under Part II, Item 2, "Management's Discussion and Analysis of Financial Condition and Results of Operations" in our Quarterly Report on Form 10-Q for the quarterly period ended June 30, 2016. There have been no material changes to our critical accounting policies and estimates during the three months ended September 30, 2016.
Recently Issued Accounting Standards
In May 2014, the Financial Accounting Standards Board ("FASB") issued ASU 2014-09, Revenue from Contracts with Customers . This ASU is a comprehensive new revenue recognition model that requires a company to recognize revenue to depict the transfer of goods or services to a customer at an amount that reflects the consideration it expects to receive in exchange for those goods or services. In March 2016, the FASB issued ASU 2016-08, Revenue from Contracts with Customers: Principal versus Agent Considerations (Reporting Gross versus Net) , which is effective upon adoption of ASU 2014-09. This ASU clarifies the implementation guidance in ASU 2014-09 on principal versus agent considerations. These ASUs are effective for annual reporting periods beginning after December 15, 2017 and interim periods within those annual periods. For merchant payment arrangements that are structured under a redemption model, we expect that we will be required to estimate the incremental revenue from vouchers that will not ultimately be redeemed and recognize that amount as revenue at the time of sale under ASU 2014-09, rather than when our legal obligation expires. The potential impact of that change could increase or decrease our revenue in any given period as compared to our current policy depending on the relative amounts of the estimated incremental revenue from unredeemed vouchers on current transactions as compared to the actual incremental revenue from vouchers that expire unredeemed in that period. We are still evaluating these ASUs for other potential impacts on our condensed consolidated financial statements.
In July 2015, the FASB issued ASU 2015-11, Inventory (Topic 330) - Simplifying the Measurement of Inventory . This ASU requires inventory to be measured at the lower of cost or net realizable value, rather than the lower of cost or market. The ASU is effective for annual reporting periods beginning after December 31, 2016 and interim periods within those annual periods. While we are still assessing the impact of ASU 2015-11, it does not believe that the adoption of this guidance will have a material impact on our condensed consolidated financial statements.
In January 2016, the FASB issued ASU 2016-01, Financial Instruments (Topic 825-10) - Recognition and Measurement of Financial Assets and Financial Liabilities. This ASU requires equity securities to be measured at fair value with changes in fair value recognized through net income and will eliminate the cost method for equity securities without readily determinable fair values. The ASU is effective for annual reporting periods beginning after December 15, 2017, and interim periods within those annual periods. The impact of the ASU on our cost method investments will depend on changes in their fair values in periods after the adoption date. While we are still assessing the impact of ASU 2016-01, we do not expect that the adoption of this guidance will otherwise have a material impact on our condensed consolidated financial statements.
In February 2016, the FASB issued ASU 2016-02, Leases (Topic 842) . The ASU will require lessees to recognize assets and liabilities arising from leases, including operating leases, to be recognized on the balance sheet. The ASU is effective for annual reporting periods beginning after December 31, 2018 and interim periods within those annual periods. While we are still assessing the impact of ASU 2016-02, we do not expect that the adoption of this guidance will have a material impact on our condensed consolidated financial statements.
In October 2016, the FASB issued ASU 2016-16, Intra-Entity Transfers of Assets Other Than Inventory (Topic 740) . This ASU requires immediate recognition of the income tax consequences of intercompany asset transfers other than inventory. The ASU is effective for annual reporting periods beginning after December 15, 2017, and interim periods within those annual periods.
81
We currently expect to early adopt this guidance on January 1, 2017 and estimate that we would record a cumulative effect adjustment to increase our accumulated deficit by approximately $3.0 million as of that date.
There are no other accounting standards that have been issued but not yet adopted that we believe could have a material impact on our consolidated financial position or results of operations.
82
ITEM 3. QUANTITATIVE AND QUALITATIVE DISCLOSURES ABOUT MARKET RISK
We have operations both within the United States and internationally, and we are exposed to market risks in the ordinary course of our business, including the effect of foreign currency fluctuations, interest rate changes and inflation. Information relating to quantitative and qualitative disclosures about these market risks is set forth below.
Foreign Currency Exchange Risk
We transact business in various foreign currencies other than the U.S. dollar, principally the Euro, British pound sterling, Japanese yen, Swiss Franc and Brazilian real, which exposes us to foreign currency risk. For the three months ended September 30, 2016 , we derived approximately 27.3% and 5.6% of our revenue from our EMEA and Rest of World segments, respectively. For the nine months ended September 30, 2016 , we derived approximately 26.4% and 5.6% of our revenue from our EMEA and Rest of World segments, respectively. Revenue and related expenses generated from our international operations are generally denominated in the local currencies of the corresponding countries. The functional currencies of our subsidiaries that either operate or support these markets are generally the same as the corresponding local currencies. The results of operations of, and certain of our intercompany balances associated with, our international operations are exposed to foreign exchange rate fluctuations. Upon consolidation, as exchange rates vary, our revenue and other operating results may differ materially from expectations, and we may record significant gains or losses on the re-measurement of intercompany balances. The British pound sterling has declined significantly against the U.S. dollar following the U.K.'s non-binding "Brexit" referendum on June 23, 2016, whereby a majority of voters supported its withdrawal from the European Union. As a result of the decline in sterling, the gross billings and revenue from our U.K. operations will be adversely impacted and the expenses from our U.K. operations will be favorably impacted in future periods because our financial statements are reported in U.S. dollars.
We assess our foreign currency exchange risk based on hypothetical changes in rates utilizing a sensitivity analysis that measures the potential impact on working capital based on a 10% change (increase and decrease) in currency rates. We use a current market pricing model to assess the changes in the value of the U.S. dollar on foreign currency denominated monetary assets and liabilities. The primary assumption used in this model is a hypothetical 10% weakening or strengthening of the U.S. dollar against those currency exposures as of September 30, 2016 and December 31, 2015 .
As of September 30, 2016 , our net working capital deficit (defined as current assets less current liabilities) from subsidiaries that are subject to foreign currency translation risk was $17.8 million . The potential increase in this working capital deficit from a hypothetical 10% adverse change in quoted foreign currency exchange rates would be $1.8 million . This compares to a $32.4 million working capital deficit subject to foreign currency exposure as of December 31, 2015 , for which a 10% adverse change would have resulted in a potential increase in this working capital deficit of $3.2 million .
Interest Rate Risk
Our cash and cash equivalents primarily consist of cash and government money market funds. Our exposure to market risk for changes in interest rates is limited because our cash and cash equivalents have a short-term maturity and are used primarily for working capital purposes. In April 2016, we issued convertible notes with an aggregate principal amount of $250.0 million (see Note 6, "Financing Arrangements" ). The convertible notes bear interest at a fixed rate, so we have no financial statement impact from changes in interest rates. However, changes in market interest rates impact the fair value of the convertible notes along with other variables such as our credit spreads and the market price and volatility of our common stock. In June 2016, we entered into the Amended and Restated Credit Agreement that provides for aggregate principal borrowings of up to $250.0 million . The Amended and Restated Credit Agreement replaced our previous $250.0 million credit agreement that was scheduled to expire in August 2017. As of September 30, 2016 , there were no borrowings outstanding under the Amended and Restated Credit Agreement. Because our Amended and Restated Credit Agreement bears interest at a variable rate, we are exposed to market risk relating to changes in interest rates if we draw down under the Amended and Restated Credit Agreement. We also have $53.7 million of capital lease obligations, and investments in convertible debt securities issued by nonpublic entities that are classified as available-for-sale. We do not believe that the interest rate risk on the long-term capital lease obligations and investments is significant.
Impact of Inflation
We believe that our results of operations are not materially impacted by moderate changes in the inflation rate. Inflation and changing prices did not have a material effect on our business, financial condition or results of operations for the three and nine months ended September 30, 2016 .
83
ITEM 4. CONTROLS AND PROCEDURES
Evaluation of Disclosure Controls and Procedures
Our management, with the participation of our Chief Executive Officer and our Chief Financial Officer, has evaluated the effectiveness of the design and operation of our disclosure controls and procedures pursuant to Rule 13a-15(e) and 15d-15(e) under the Exchange Act of 1934, as amended (the Exchange Act), as of the end of the period covered by this Quarterly Report on Form 10-Q.
Based on this evaluation, our management concluded that, as of September 30, 2016 , our disclosure controls and procedures are effective to provide reasonable assurance that information we are required to disclose in reports that we file or submit under the Exchange Act is recorded, processed, summarized, and reported within the time periods specified in the Securities and Exchange Commission's rules and forms, and that such information is accumulated and communicated to our management, including our Chief Executive Officer and Chief Financial Officer, as appropriate, to allow timely decisions regarding required disclosure.
Changes in Internal Control over Financial Reporting
There was no change in our internal control over financial reporting identified in connection with the evaluation required by Rule 13a-15(d) and 15d-15(d) of the Exchange Act that occurred during the period covered by this Quarterly Report on Form 10-Q that has materially affected, or is reasonably likely to materially affect, our internal control over financial reporting.
Limitations on Effectiveness of Controls and Procedures
In designing and evaluating the disclosure controls and procedures, management recognizes that any controls and procedures, no matter how well designed and operated, can provide only reasonable assurance of achieving the desired control objectives. In addition, the design of disclosure controls and procedures must reflect the fact that there are resource constraints and that management is required to apply its judgment in evaluating the benefits of possible controls and procedures relative to their costs.
84
PART II. OTHER INFORMATION
ITEM 1. LEGAL PROCEEDINGS
For a description of our material pending legal proceedings, please see Note 7, " Commitments and Contingencies, " to our condensed consolidated financial statements included in Part I, Item 1 of this Quarterly Report on the Form 10-Q.
ITEM 1A. RISK FACTORS
There have been no material changes from the risk factors previously disclosed in Item 1A, "Risk Factors" in our Annual Report on Form 10-K for the year ended December 31, 2015 and Quarterly Reports on Form 10-Qs for the quarters ended March 31, 2016 and June 30, 2016.
85
ITEM 2. UNREGISTERED SALES OF EQUITY SECURITIES AND USE OF PROCEEDS
Recent Sales of Unregistered Securities
During the three months ended September 30, 2016 , we did not issue any unregistered securities.
Issuer Purchases of Equity Securities
During the three months ended September 30, 2016 , we purchased 5,213,778 shares of Class A common stock for an aggregate purchase price of $24.6 million (including fees and commissions) under our share repurchase program. A summary of our Class A common stock repurchases during the three months ended September 30, 2016 under our share repurchase program is set forth in the following table:
Date |
| Total Number of Shares Purchased |
| Average Price Paid Per Share |
| Total Number of Shares Purchased as Part of Publicly Announced Program |
| Maximum Number (or Approximate Dollar Value) of Shares that May Yet Be Purchased Under Program | ||||||
July 1-31, 2016 |
| 2,060,629 | |
| $ | 3.68 | |
| 2,060,629 | |
| $ | 261,719,831 | |
August 1-31, 2016 |
| 1,596,218 | |
| 5.54 | |
| 1,596,218 | |
| $ | 252,903,394 | | |
September 1-30, 2016 |
| 1,556,931 | |
| 5.27 | |
| 1,556,931 | |
| $ | 244,714,324 | | |
Total |
| 5,213,778 | |
| $ | 4.72 | |
| 5,213,778 | |
| $ | 244,714,324 | |
See Note 8, " Stockholders' Equity and Compensation Arrangements, " for discussion regarding our share repurchase programs.
The following table provides information about purchases of shares of our Class A common stock during the three months ended September 30, 2016 related to shares withheld upon vesting of restricted stock units for minimum tax withholding obligations:
Date |
| Total Number of Shares Purchased (1) |
| Average Price Paid Per Share |
| Total Number of Shares Purchased as Part of Publicly Announced Program |
| Maximum Number (or Approximate Dollar Value) of Shares that May Yet Be Purchased Under Program | ||||||
July 1-31, 2016 |
| 803,250 | |
| $ | 4.59 | |
| - | |
| $ | - | |
August 1-31, 2016 |
| 302,437 | |
| 5.62 | |
| - | |
| $ | - | | |
September 1-30, 2016 (1) |
| 463,003 | |
| 5.26 | |
| - | |
| $ | - | | |
Total |
| 1,568,690 | |
| $ | 4.99 | |
| - | |
| $ | - | |
(1) | Total number of shares delivered to us by employees to satisfy the mandatory tax withholding requirement upon vesting of stock-based compensation awards. |
86
ITEM 5. OTHER INFORMATION
On October 25, 2016, the Compensation Committee of the Company's Board of Directors approved an award of 1,207,827 restricted stock units ("RSUs") for Rich Williams, the Company's Chief Executive Officer, that will vest as follows: (i) 500,000 RSUs will vest quarterly in four equal installments beginning on March 15, 2017, (ii) 298,675 RSUs will vest on March 15, 2018, (iii) 232,109 RSUs will vest on March 15, 2019, and (iv) 177,043 RSUs will vest on March 15, 2020. As approved on October 25, 2016, Mr. Williams is also eligible to earn an additional aggregate target number of 292,173 performance stock units ("PSUs") over a three-year period beginning in 2017, consisting of a target number of (i) 74,669 PSUs in 2017, (ii) 99,475 PSUs in 2018, and (iii) 118,029 PSUs in 2019. The PSUs have a maximum payout capped at 200% of the target award for the applicable year. The actual number of PSUs earned in any period, if at all, will be determined based on the Company meeting specific performance objectives established by the Compensation Committee within the first 90 days of the applicable year. The vesting of the RSUs and issuance of the PSUs is subject to Mr. Williams' continued employment on the applicable vesting date or grant date and the awards are to be on the Company's standard terms.
ITEM 6. EXHIBITS
See the Exhibit Index immediately following the signature page of this Quarterly Report on Form 10-Q.
87
SIGNATURES
Pursuant to the requirements of Section 13 or 15(d) of the Securities Exchange Act of 1934, the registrant has duly caused this report to be signed on its behalf by the undersigned, thereunto duly authorized on this 26th day of October 2016.
GROUPON, INC. | ||||
By: |
| /s/ Michael Randolfi | ||
|
| Name: |
| Michael Randolfi |
|
| Title: |
| Chief Financial Officer |
88
EXHIBITS
Exhibit Number |
|
| Description |
31.1 |
|
| Certification of Chief Executive Officer pursuant to Exchange Act Rules 13a-14(a) and 15d-14(a), as adopted pursuant to Section 302 of the Sarbanes-Oxley Act of 2002 |
31.2 |
|
| Certification of Chief Financial Officer pursuant to Exchange Act Rules 13a-14(a) and 15d-14(a), as adopted pursuant to Section 302 of the Sarbanes-Oxley Act of 2002 |
32.1 |
|
| Certifications of Chief Executive Officer and Chief Financial Officer pursuant to 18 U.S.C. Section 1350, as adopted pursuant to Section 906 of the Sarbanes-Oxley Act of 2002 |
101 |
|
| Interactive data file |
89